Attached files
| file | filename |
|---|---|
| EX-32.2 - EX-32.2 - SANFILIPPO JOHN B & SON INC | d409800dex322.htm |
| EX-32.1 - EX-32.1 - SANFILIPPO JOHN B & SON INC | d409800dex321.htm |
| EX-31.2 - EX-31.2 - SANFILIPPO JOHN B & SON INC | d409800dex312.htm |
| EX-31.1 - EX-31.1 - SANFILIPPO JOHN B & SON INC | d409800dex311.htm |
| EX-23 - EX-23 - SANFILIPPO JOHN B & SON INC | d409800dex23.htm |
| EX-21 - EX-21 - SANFILIPPO JOHN B & SON INC | d409800dex21.htm |
| EX-10.19 - EX-10.19 - SANFILIPPO JOHN B & SON INC | d409800dex1019.htm |
UNITED STATES
SECURITIES AND EXCHANGE COMMISSION
WASHINGTON, D.C. 20549
FORM 10-K
(Mark One)
| ☒ | ANNUAL REPORT PURSUANT TO SECTION 13 OR 15(d) OF THE SECURITIES EXCHANGE ACT OF 1934 |
For the fiscal year ended June 29, 2017
| ☐ | TRANSITION REPORT PURSUANT TO SECTION 13 OR 15(d) OF THE SECURITIES EXCHANGE ACT OF 1934 |
For the transition period from to
Commission file number 0-19681
JOHN B. SANFILIPPO & SON, INC.
(Exact Name of Registrant as Specified in its Charter)
| Delaware | 36-2419677 | |
| (State or Other Jurisdiction of Incorporation or Organization) |
(I.R.S. Employer Identification Number) |
1703 North Randall Road
Elgin, Illinois 60123
(Address of Principal Executive Offices, Zip Code)
Registrant’s telephone number, including area code: (847) 289-1800
Securities registered pursuant to Section 12(b) of the Act:
| Title of Each Class |
Name of Each Exchange on Which Registered | |
| Common Stock, $.01 par value per share | The NASDAQ Stock Market LLC (NASDAQ Global Select Market) |
Securities registered pursuant to Section 12(g) of the Act: None
Indicate by check mark whether the registrant is a well-known seasoned issuer, as defined in Rule 405 of the Securities Act: Yes ☐ No ☒.
Indicate by check mark if the registrant is not required to file reports pursuant to Section 13 or Section 15(d) of the Act: Yes ☐ No ☒.
Indicate by check mark whether the registrant: (1) has filed all reports required to be filed by Section 13 or 15(d) of the Securities Exchange Act of 1934, as amended (the “Exchange Act”), during the preceding 12 months (or for such shorter period that the registrant was required to file such reports), and (2) has been subject to such filing requirements for the past 90 days. Yes ☒ No ☐.
Indicate by check mark whether the registrant has submitted electronically and posted on its corporate Web site, if any, every Interactive Data File required to be submitted and posted pursuant to Rule 405 of Regulation S-T (§ 232.405 of this chapter) during the preceding 12 months (or for such shorter period that the registrant was required to submit and post such files). Yes ☒ No ☐.
Indicate by check mark if disclosure of delinquent filers pursuant to Item 405 of Regulation S-K (229.405 of this chapter) is not contained herein, and will not be contained to the best of registrant’s knowledge, in definitive proxy or information statements incorporated by reference in Part III of this Form 10-K or any amendment to this Form 10-K. ☐.
Indicate by check mark whether the registrant is a large accelerated filer, an accelerated filer, a non-accelerated filer, or a smaller reporting company. See definitions of “large accelerated filer”, “accelerated filer” and “smaller reporting company” in Rule 12b-2 of the Exchange Act.
| Large accelerated filer | ☐ | Accelerated filer | ☒ | |||
| Non-accelerated filer | ☐ (Do not check if a smaller reporting company) | Smaller reporting company | ☐ | |||
Emerging growth company ☐
If an emerging growth company, indicate by check mark if the registrant has elected not to use the extended transition period for complying with any new or revised financial accounting standards provided pursuant to Section 13(a) of the Exchange Act. ☐
Indicate by check mark whether the registrant is a shell company (as defined in Rule 12b-2 of the Exchange Act). Yes ☐ No ☒.
The aggregate market value of the voting Common Stock held by non-affiliates was $593,573,553 as of December 29, 2016 (8,448,243 shares at $70.26 per share).
As of August 11, 2017, 8,699,983 shares of the registrant’s Common Stock, $.01 par value (“Common Stock”) and 2,597,426 shares of the registrant’s Class A Common Stock, $.01 par value (“Class A Stock”), were outstanding. The Class A Stock is convertible at the option of the holder at any time and from time to time (and, upon the occurrence of certain events specified in the Restated Certificate of Incorporation, automatically converts) into one share of Common Stock.
Documents Incorporated by Reference:
Portions of the registrant’s definitive Proxy Statement for its Annual Meeting of Stockholders to be held November 2, 2017 are incorporated by reference into Part III of this Form 10-K.
PART I
Item 1 — Business
a. General Development of Business
John B. Sanfilippo & Son, Inc. was formed as a corporation under the laws of the State of Delaware in 1979 as the successor by merger to an Illinois corporation that was incorporated in 1959. As used throughout this annual report on Form 10-K, unless the context otherwise indicates, the terms “we”, “us”, “our” or “Company” refer collectively to John B. Sanfilippo & Son, Inc. and its wholly-owned subsidiary, JBSS Ventures, LLC. Our fiscal year ends on the final Thursday of June each year, and typically consists of fifty-two weeks (four thirteen week quarters). However, the fiscal year ended June 30, 2016 consisted of fifty-three weeks with our fourth quarter containing fourteen weeks. Additional information on the comparability of the periods presented is as follows:
| • | References herein to fiscal 2018 are to the fiscal year ending June 28, 2018. |
| • | References herein to fiscal 2017, fiscal 2016 and fiscal 2015 are to the fiscal years ended June 29, 2017, June 30, 2016 and June 25, 2015, respectively. |
We are one of the leading processors and distributors of peanuts, pecans, cashews, walnuts, almonds and other nuts in the United States. These nuts are sold under a variety of private brands and under the Fisher, Orchard Valley Harvest and Sunshine Country brand names. We also market and distribute, and in most cases, manufacture or process, a diverse product line of food and snack products, including peanut butter, almond butter, cashew butter, candy and confections, snacks and trail mixes, snack bites, sunflower kernels, dried fruit, corn snacks, sesame sticks and other sesame snack products under private brands and brand names. Our website is accessible to the public at http://www.jbssinc.com. Information about us, including our code of ethics, annual reports on Form 10-K, quarterly reports on Form 10-Q, current reports on Form 8-K and any amendments to those reports are made available free of charge through our website as soon as reasonably practicable after such reports have been filed with the United States Securities and Exchange Commission (the “SEC”). Our materials filed with the SEC are also available on the SEC’s website at http://www.sec.gov. The public may read and copy any materials we file with the SEC at the SEC’s public reference room at 100 F St., NE, Washington, DC 20549. The public may obtain information about the reference room by calling the SEC at 1-800-SEC-0330. References to our website addressed in this Form 10-K are provided as a convenience and do not constitute, and should not be viewed as, an incorporation by reference of the information contained on, or available through, the website. Therefore, such information should not be considered part of this Form 10-K.
Our headquarters and executive offices are located at 1703 North Randall Road, Elgin, Illinois 60123, and our telephone number for investor relations is (847) 289-1800, extension 4612.
b. Segment Reporting
We have a single operating segment under which we report that consists of selling various nut and nut related products through three distribution channels. See Part II, Item 8 — “Financial Statements and Supplementary Data” for our net sales, net income and total assets.
c. Narrative Description of Business
(i) General
As stated above, we are one of the leading processors and distributors of tree nuts and peanuts in the United States. Through a deliberate strategy of focused capital expenditures and complementary acquisitions, we have built a generally vertically integrated nut processing operation that enables us to control almost every step of the process for pecans, peanuts and walnuts, including procurement from growers, shelling, processing, packaging and marketing. Vertical integration allows us to enhance product quality and, in most crop years, purchase inshell pecans, peanuts and walnuts at lower costs as opposed to purchasing these nut meats from other shellers. We believe that our generally vertically integrated business model typically works to our advantage in terms of cost savings and provides us with better insight into crop development. Our generally vertically integrated model, however, can under certain circumstances result in reduced earnings or losses. See Part I, Item 1A — “Risk Factors”.
Our products are sold through the major distribution channels to significant buyers of nuts, including food retailers, commercial ingredient users, and contract packaging customers. Selling through multiple distribution channels allows us to generate multiple revenue opportunities for the nuts we process. For example, pecan halves could be sold to food retailers, and pecan pieces could be sold to commercial ingredient users. We process and sell all major nut types consumed in the United States, including peanuts, pecans, cashews, walnuts and almonds (our major nut types) in a wide variety of packaging, thus offering our customers a complete nut product offering.
1
(ii) Principal Products
Our principal products are raw and processed nuts. These products accounted for approximately 82%, 83% and 84% of our gross sales for fiscal 2017, fiscal 2016 and fiscal 2015, respectively. The nut product line includes almonds, pecans, peanuts, black walnuts, English walnuts, cashews, macadamia nuts, pistachios, pine nuts, Brazil nuts, and filberts. Our nut products are sold in numerous package styles and sizes and we offer our nut products in a variety of different styles and seasonings. We sell our products domestically to retailers and wholesalers as well as to commercial ingredient and contract packaging customers. We also sell certain of our products to foreign customers in the retail, contract packaging and commercial ingredient markets. For more information about our revenues in our various distribution channels, see Part II, Item 8 — “Financial Statements and Supplementary Data”.
We acquire a substantial portion of our peanuts, pecans and walnuts directly from domestic growers. We purchase the balance of our raw nuts from importers, trading companies and domestic processors.
We manufacture and market peanut butter in several sizes and varieties. We also market and distribute, and in many cases process and manufacture, a wide assortment of other food and snack products. These other products include snack mixes, salad toppings, snacks, snack bites, trail mixes, dried fruit and chocolate and yogurt coated products sold to retailers and wholesalers; baking ingredients sold to retailers, wholesalers, and commercial ingredient customers; bulk food products sold to retail and commercial ingredient users; an assortment of sunflower kernels, pepitas, snack mixes, almond butter, cashew butter, candy and confections, corn snacks, sesame sticks and other sesame snack products sold to retail supermarkets, mass merchandisers and commercial ingredient users and a wide variety of toppings for ice cream and yogurt sold to commercial ingredient users.
(iii) Customers and Channels
We sell our products to approximately 500 customers through the consumer, commercial ingredient and contract packaging distribution channels. The consumer channel supplies nut-based products, including consumer-packaged and bulk products, to retailers including supermarket chains, wholesalers, supercenters, and other retail outlets, across the United States. We sell products through the consumer channel under our brand names, including the Fisher, Orchard Valley Harvest and Sunshine Country brands, as well as under our customers’ private brands. The commercial ingredient channel supplies nut-based products to other manufacturers to use as ingredients in their final food products such as bakery, confection, cereal and ice cream, and produces nut-based products that are customized to the specifications of chefs, national restaurant chains, food service distributors, fast food chains, institutions and hotel kitchens. We sell products through the commercial ingredient channel under our Fisher brand and our customers’ private brands. Our contract packaging channel produces and packages nut-based snacks for food manufacturers and marketers under their brand name.
We are dependent on a few significant customers for a majority of our total net sales, particularly in the consumer channel. Sales to our five largest customers represented approximately 60% of net sales in fiscal 2017, 62% of net sales in fiscal 2016 and 61% of net sales in fiscal 2015. Net sales to Wal-Mart Stores, Inc. accounted for approximately 28% of our net sales for fiscal 2017, 26% of our net sales in fiscal 2016 and 24% of our net sales for fiscal 2015. Net sales to Target Corporation accounted for approximately 14% of our net sales for all periods presented. Net sales to PepsiCo Inc. accounted for approximately 10% of our net sales for fiscal 2017. Net sales to The WhiteWave Foods Company accounted for approximately 10% of our net sales for fiscal 2016. No other customer accounted for more than 10% of net sales for any period presented.
(iv) Sales and Distribution
We market our products through our own sales department and through a network of approximately 60 independent brokers and various independent distributors and suppliers.
We distribute products from each of our principal facilities. The majority of our products are shipped from our facilities by contract and common carriers.
We operate a retail store at our Elgin headquarters. This store sells Fisher snack and baking products, Orchard Valley Harvest products, bulk foods and other products produced by us and other vendors.
2
(v) Marketing
Marketing strategies are developed for each distribution channel and focus primarily on branded products. Branded consumer efforts concentrate on building brand awareness, identifying and introducing new products, attracting new customers, increasing distribution and increasing consumption in the snack nut, recipe nut and produce categories. Private brand and commercial ingredient channel efforts are focused on category management, new product identification and introduction, brand awareness, and merchandising support.
A significant portion of our branded marketing efforts are focused on consumer promotional campaigns that include advertisements (e.g., social media, magazine, newspaper, internet and television), product sampling and coupon offers. Our integrated marketing efforts for the Fisher brand include sponsorships of celebrity chefs and professional sports franchises. Additionally, shipper display units are utilized in retail stores in an effort to gain additional temporary product placement and to drive sales volume. We work with third-party information agencies, such as Information Resources, Inc. (“IRi”), to monitor the effectiveness of our marketing and measure product growth, particularly in comparison to our competition and the product category.
Commercial ingredient trade promotion includes periodically attending regional and national trade shows, trade publication advertising and one-on-one marketing. These promotional efforts highlight our processing capabilities, broad product portfolio, product customization and packaging innovation.
Through participation in several trade associations, funding of industry research and sponsorship of educational programs, we support efforts to increase awareness of the health benefits, convenience and versatility of nuts as both a snack and a recipe ingredient among existing and future consumers of nuts.
(vi) Competition
Our nuts and other snack food products compete against products manufactured and sold by numerous other companies in the snack food industry, some of whom are substantially larger and have greater resources than us. In the nut industry, we compete with, among others, The Kraft Heinz Company (Planters brand), Treehouse Foods, Inc. and numerous regional snack food processors. We also compete with the Diamond and Emerald brands, among others. Competitive factors in our markets include price, product quality, customer service, breadth of product line, brand name awareness, method of distribution and sales promotion. The combination of our generally vertically integrated operating model with respect to pecans, peanuts and walnuts, our product quality, product offering, brand strength, innovation, distribution model and the fact that we focus on nut and nut related products generally enable us to compete in each of these categories, but there can be no guarantee that our products will continue to be competitive with many of our larger competitors. See Part I, Item 1A — “Risk Factors”.
(vii) Raw Materials and Supplies
We purchase nuts from domestic and foreign sources. In fiscal 2017, all of our walnuts, almonds and peanuts were purchased from domestic sources. We purchase our pecans from the southern United States and Mexico. Cashew nuts are imported from Vietnam, India, Brazil and certain West African countries. For fiscal 2017, approximately 41% of the dollar value of our total nut purchases was from foreign sources.
Competition in the nut shelling industry is driven by shellers’ ability to access and purchase raw nuts, to shell the nuts efficiently and to sell the nuts to processors. We shell all major domestic nut types, with the exception of almonds, and are among a few select shellers who further process, package and sell nuts to the end-user. Raw material pricing pressure and the high cost of equipment automation have previously contributed to a consolidation among shellers across all nut types, especially peanuts and pecans.
We are generally vertically integrated with respect to pecans, peanuts and walnuts and, unlike our major consumer distribution channel competitors who purchase nuts on the open market, we purchase a substantial portion of our pecans, peanuts and walnuts directly from growers. However, there are risks associated with vertical integration, such as susceptibility to market price volatility for pecans, peanuts and walnuts. See Part I, Item 1A — “Risk Factors”.
Due, in part, to the seasonal nature of the industry, we maintain significant inventories of peanuts, pecans and walnuts at certain times of the year, especially in the second and third quarters of our fiscal year. Fluctuations in the market price of pecans, peanuts and walnuts and other nuts may affect the value of our inventory and thus may also affect our gross profit and gross profit margin. See Part I, Item 1A — “Risk Factors”.
3
We have historically purchased some of our packaging and labels from a related party. We purchase other inventory items such as roasting oils, seasonings, plastic jars, labels, stand-up bags, composite and clear-plastic cans and other packaging materials from other third parties. Material costs, including tree nuts, peanuts, other commodities and other inventory items represented approximately 83% of our total cost of sales for fiscal 2017.
(viii) Trademarks and Patents
We market our products primarily under name brands, including the Fisher, Orchard Valley Harvest and Sunshine Country brand names. Fisher, Orchard Valley Harvest and Sunshine Country are registered as trademarks with the U.S. Patent and Trademark Office as well as in various other foreign jurisdictions. We do not own any trademarks for any private brands, which are owned by the respective private brand customer. Our trademarks are important as they provide our customers with information about the quality of our products. However, registration and use of our trademarks in foreign jurisdictions may be subject to certain risks in addition to other risks generally related to our intellectual property. See Part I, Item 1A — “Risk Factors”. We also own several patents of various durations. We expect to continue to renew for the foreseeable future those trademarks that are important to our business and expand registration of our trademarks into new jurisdictions. We intend to protect our intellectual property rights vigorously.
(ix) Employees
As of June 29, 2017, we had approximately 1,325 full-time employees, including approximately 240 corporate staff employees.
(x) Seasonality
Our business is seasonal. Demand for peanut and tree nut products is highest during the last four months of the calendar year. Peanuts, pecans and walnuts, three of our principal raw materials, are primarily purchased between September and February and are processed throughout the year until the following harvest. As a result of this seasonality, our personnel requirements rise during the last quarter of the calendar year. Our working capital requirements generally peak during the third quarter of our fiscal year.
(xi) Backlog
Because the time between order and shipment is usually less than three weeks, we believe that any backlog as of a particular date is not material to an understanding of our business as a whole.
(xii) Operating Hazards and Uninsured Risks
The sale of food products for human consumption involves the risk of injury to consumers as a result of product contamination or spoilage, including the presence of shell fragments, foreign objects, insects, foreign substances, pathogens, chemicals, aflatoxin and other agents, or residues introduced during the growing, storage, handling or transportation phases. We (i) maintain what we believe to be rigid quality control standards and food safety systems and are SQF 2000 Code Level 2 certified, (ii) generally inspect our nut and other food products by visual examination, metal detectors or electronic monitors at various stages of our shelling and processing operations, (iii) work with the United States Department of Agriculture (“USDA”) in its inspection of peanuts shipped to and from our peanut shelling facilities, (iv) maintain environmental pathogen programs, and (v) seek to comply with the Nutrition Labeling and Education Act by labeling each product that we sell with labels that disclose the nutritional value and content of each of our products; however, no assurance can be given that some nut or other food products sold by us may not contain or develop harmful substances. In order to mitigate this risk, we strive to select high-quality nut suppliers and currently maintain product liability and contaminated product insurance at amounts we believe are adequate in light of our operations.
4
Item 1A — Risk Factors
We face a number of significant risks and uncertainties, and therefore, an investment in our Common Stock is subject to risks and uncertainties. The factors described below could materially and adversely affect our business, results of operations and financial condition. While each risk is described separately, some of these risks are interrelated and it is possible that certain risks could trigger the applicability of other risks described below. Also, the risks and uncertainties described below are not the only ones that we face. Additional risks and uncertainties not presently known to us, or that we view as not rising to the level of being material, could also potentially impair our business, results of operations and financial condition. Investors should consider the following factors, in addition to the other information contained in this Annual Report on Form 10-K, including Part II, Item 7 — “Management’s Discussion and Analysis of Financial Condition and Results of Operations — Liquidity and Capital Resources” before deciding to purchase our Common Stock.
We Cannot Control the Availability or Cost of Raw Materials and this May Have a Material Adverse Effect on Our Results of Operations, Cash Flows and Financial Condition
The availability and cost of raw materials for the production of our products, including peanuts, pecans, almonds, cashews, walnuts and other nuts are subject to crop size and yield fluctuations caused by factors beyond our control, such as weather conditions, natural disasters (including floods, droughts, frosts, earthquakes and hurricanes), changing climate patterns, plant diseases, foreign currency fluctuations, trade agreements and embargos, import/export controls, political change and unrest, changes in global customer demand, changes in government agricultural programs and purchasing behavior of certain countries, including China and India. Additionally, any determination by the USDA or other government agencies that certain pesticides, herbicides or other chemicals used by growers have left harmful residues on portions of the crop or that any portion of the crop has been contaminated by aflatoxin or other agents, or any future product recalls for other reasons could reduce the supply of edible nuts and other raw materials used in our products and could cause our costs to increase significantly.
Because these raw materials are commodities, their prices are set by the market and can therefore fluctuate quickly and dramatically due to varied events, such as those described above. Furthermore, we are not able to hedge against changes in nut commodity prices because no appropriate futures, derivative or other risk-sharing market for these commodities exists. Consequently, in order to achieve or maintain profitability levels, we attempt to increase the prices of our products to reflect the increase in the costs of the raw materials that we use and sell. However, we may not be successful in passing along partial or full price increases to our customers, if at all. In addition, even if we are successful in passing across partial or full price increases, we may not be able to do so in a timely fashion. Our ability to raise prices and the timing of any price increases is often dependent upon the actions of our competitors, some of whom are significantly larger and more diversified than we are or own farms which produce the raw materials. Additionally, any such product price increase that we are able to pass along to our customers may ultimately reduce the demand for, and sales of, our products as customers reduce purchases or buy lower priced products. Alternatively, if the prices of any raw materials significantly decrease and we have inventories of such materials on hand, we may be unable to reduce product prices without impacting our gross margin. Any competitors who purchase such material on the open market or own the farms which produce the raw materials may be able to reduce prices in a more timely manner and we could lose market share to such competitors. Any one or more of the foregoing aspects may have a material adverse effect on our results of operations, cash flows and financial condition.
Moreover, fluctuations in the market prices of nuts may affect the value of our inventories and profitability. We maintain significant inventories of nuts, and our financial condition could be materially and adversely affected by any significant decrease in the market price of such raw materials. See Part II, Item 7 — “Management’s Discussion and Analysis of Financial Condition and Results of Operations — Liquidity and Capital Resources”.
Significant Private Brand Competitive Activity Could Materially and Adversely Affect Our Financial Condition and Results of Operations
Some customer buying decisions, including some of our largest customers, are based upon a periodic bidding process in which the single, successful bidder is assured the selling of the selected product to the food retailer, supercenter or mass merchandiser until the next bidding process to the exclusion of other bidders. Our sales volume may decrease significantly if our bids are too high and we lose the ability to sell products through these channels, even temporarily. Alternatively, we risk reducing our margins if our bids are successful but below our desired price points. In addition, margins could be further reduced if commodity prices subsequently rise and customers are unwilling or unable to accept price increases. Should any of our significant customers elect to introduce or expand their private brand programs and we do not participate in such programs or the programs directly compete against our branded products, our sales volume could be negatively impacted. Any of these outcomes may materially and adversely affect our financial condition and results of operations.
5
Our Inability to Manage Successfully the Price Gap Between our Private Brand Snack Nut Products and Those of our Branded Competitors May Materially and Adversely Affect Our Results of Operations
Although demand for private brand snack nut products (and our private brand snack nut products in particular) has increased, our competitors’ branded snack nut products have certain advantages over our private brand snack nut products primarily due to their advertising strategies, perceived product attributes, name recognition and pricing flexibility.
At the retail level, private brand snack nut products generally sell at a discount to those of branded competitors. If branded competitors reduce the price of their products, the price of branded snack nut products offered to consumers may approximate the prices of our private brand snack nut products. Further, promotional activities by branded competitors such as temporary price reductions, buy-one-get-one-free offerings and coupons, have the same general effect as price decreases. Price decreases initiated by branded competitors could result in a decline in the demand for our private brand snack nut products, which could negatively impact our sales volumes and overall profitability. Such sales volume and profitability decreases could materially and adversely affect our results of operations.
In addition, many of our competitors with significant branded operations have more diversified product offerings among a wider variety of food categories than we have. Such competitors could, as a result of their size or diversified offerings, be in a better position to decrease their prices or offer better promotions for their branded snack nut products. If competitors are able to exploit their size or diversification to make significant price reductions and offer better promotions, it could decrease our private brand snack nut sales, which could materially and adversely affect our results of operations.
Changing Consumer Preferences and Demand Could Materially and Adversely Affect Our Financial Condition and Results of Operations
Our financial performance depends in part on our ability to anticipate and offer products to our customers that appeal to their preferences. Consumer preferences, whether for branded products or private brand products or how consumers purchase such products, can quickly change based on a number of factors beyond our control. If we fail to anticipate, identify or react quickly to these changes and are unable to develop and market new and improved products to meet consumer preferences, demand for our products could suffer. In addition, demand for our products could be affected by consumer concerns regarding the health effects of nutrients or ingredients in any of our products. The development and introduction of new products requires substantial research and development, testing and marketing expenditures, which we may be unable to fully recover if the new products do not achieve the necessary commercial success. New product introduction also results in increased costs, including from the use of new manufacturing techniques, capital expenditures, new raw materials and ingredients, and additional marketing and trade spending. Consumers are also purchasing food products outside traditional retail supermarkets, including via the Internet. If we are unable to provide our customers with our products outside traditional retail supermarkets, demand for our products could suffer. Reduction in demand as a result of changing consumer preferences or inability to provide consumers with products they demand could materially and adversely affect our financial condition and results of operations.
Negative Consumer Perception About Our Branded Products Could Have a Material Adverse Effect on Our Financial Condition and Results of Operations
Our ability to develop, maintain and continually enhance the value of our branded products is critical to improving our operating and financial performance and implementing our Strategic Plan. The value of our branded products is based in large part on the degree to which consumers react and respond positively to these brands. Our brand value could diminish significantly due to a number of factors, including consumer perception that we have acted in an irresponsible or reckless manner, adverse publicity about our products (whether actual or fictitious), our failure to maintain the quality of our products, the failure of our products to deliver consistently positive consumer experiences, concerns about food safety or allergies, or our products becoming unavailable to consumers.
In addition, our success in enhancing the value of branded products depends on our ability to adapt to a rapidly changing media environment. We increasingly rely on social media and online advertising campaigns as well as advertising outside of traditional print and television channels. Negative posts or comments (whether actual or fictitious) about us or the type of products we produce, market or sell on online social networks, product review sites or similar online activity could seriously impact consumer demand for our products. We are subject to a variety of legal and regulatory restrictions on how we market and advertise our products. These restrictions may limit our ability to respond as the media and communications environment continues to evolve. If we do not react appropriately, then our product sales, financial condition and results of operations could be materially and adversely affected.
We Sometimes Enter Into Fixed Price Commitments without First Knowing Our Acquisition Costs, Which Could Have a Material Adverse Effect on Our Financial Condition and Results of Operations
We enter into fixed price commitments with a portion of our commercial ingredient sales customers and certain other customers. The commitments are for a fixed period of time, typically three months to twelve months, but may be extended if remaining balances exist. Such commitments with a term of six months or more represented approximately 9% of our annual net sales in fiscal 2017. Sometimes we enter into fixed price commitments with respect to certain of our nut products before fixing our acquisition costs in order to maintain customer relationships or when, in management’s judgment, market or crop harvest conditions so warrant. To the extent we do so and our fixed prices are not properly aligned with our acquisition costs, then these fixed price commitments may result in reduced or negative gross profit margins which could have a material adverse effect on our financial condition and results of operations.
6
Our Generally Vertically Integrated Model Could Materially and Adversely Affect Our Results of Operations
We have a generally vertically integrated nut processing operation that enables us to control almost every step of the process for pecans, peanuts and walnuts, including procurement from growers. Our generally vertically integrated model has in the past resulted, and may in the future result, in significant losses because we are subject to the various risks associated with purchasing a majority of our pecans, peanuts and walnuts directly from growers, including the risk of purchasing such products from growers at costs that later, due to altered market conditions, prove to be above prevailing market prices at time of sale. Accordingly, because we purchase a majority of our pecans, peanuts and walnuts directly from growers during harvest season and shell and process these nuts throughout our fiscal year, there is a possibility that, after we acquire these nuts, market conditions may change and we will be forced to sell these nuts at reduced prices relative to our acquisition costs, or even at a loss which could materially and adversely affect our results of operations.
We Operate in a Competitive Environment Which Could Materially and Adversely Affect our Financial Condition and Results of Operations
We operate in a highly competitive environment. The principal areas of competition are, among others, brand recognition, taste, flavor, quality, price, advertising, promotion, convenience and service. Our principal products compete against food and snack products manufactured and sold by numerous regional, national and international companies, some of which are substantially larger and have greater resources than us, such as The Kraft Heinz Company (Planters brand) and Treehouse Foods, Inc. Most of our competitors that sell and market the other top branded snack nut products have committed more financial, marketing and other resources to such brands when compared to the resources spent by us on our brands. Additionally, many retail customers have continued to emphasize their own private label offerings as a key part of their strategy and may develop or expand their own private label nut and nut product offerings, to the exclusion of our branded products. Many of our competitors buy their nuts on the open market and are thus not exposed to the risks of purchasing inshell pecans, peanuts and walnuts directly from growers at fixed prices that later, due to altered market conditions, may prove to be above prevailing market prices. We also compete with other shellers in the commercial ingredient market and with regional processors in the retail and wholesale markets. In order to maintain or increase our market share, we must continue to price our products competitively and spend on marketing, advertising, new product innovation and shelf placement and slotting fees, which may cause a decline in gross profit margin if we are unable to increase sales volume as well as reduce our costs, which could materially and adversely affect our financial condition and results of operations.
We are Dependent Upon Certain Significant Customers Which Could Materially and Adversely Affect Our Financial Condition, Cash Flows and Results of Operations
We are dependent on a few significant customers for a large portion of our total net sales, particularly in the consumer channel. Sales to our five largest customers represented approximately 60%, 62% and 61% of net sales in fiscal 2017, fiscal 2016 and fiscal 2015, respectively. There can be no assurance that all significant customers will continue to purchase our products in the same quantities, same product mix or on the same terms as in the past, particularly as increasingly powerful retailers may demand lower pricing, different packaging, larger marketing support, payments for retail space, establish private brands or request other terms of sale which negatively impact our profitability. A loss of one of our largest customers, a material decrease in purchases by one of our largest customers, the inability to collect a receivable from or a significant business interruption at one of our largest customers would result in decreased sales and would materially and adversely affect our results of operations, financial condition and cash flows.
We are Subject to Customer Pricing Pressures and Retail Consolidation Trends Which Could Materially and Adversely Affect Our Financial Condition and Results of Operations
As the retail grocery trade continues to consolidate and our retail customers grow larger, become more sophisticated and obtain more purchasing power, our retail customers are demanding lower pricing, especially private brand customers, and increased free or discounted promotional programs. Further, these retail customers may begin to place a greater emphasis on the lowest-cost supplier in making purchasing decisions, especially during periods of increased or variable raw material acquisition costs. An increased focus on the lowest-cost supplier could reduce the benefits of some of our competitive advantages, which include a focus on customer service, innovation, production capacity, category management and quality. As the retail environment consolidates, many customers are reducing inventories or focusing on a limited number of brands (often the number one or number two brand by market share) in making purchasing decisions. In addition, certain customers in the retail channel, such as dollar stores and other discount sellers, have become increasingly sophisticated and may demand similar pricing to retail grocery customers. As part of the retail consolidation trend, diversified companies with substantial Internet presences have increased their food offerings or purchased retail supermarkets to expand their grocery business, particularly as such companies focus on food delivery direct to consumers. Such companies have substantial pricing power and may focus on their products to the exclusion of our products. If we fail to respond to these trends, our sales volume growth could suffer, and it may become necessary to lower our prices and increase promotional support of our products, any of which would materially and adversely affect our gross profit and gross profit margin and could materially and adversely affect our financial condition and results of operations.
7
Food Safety, Allergy and Product Contamination Concerns Could Have a Material Adverse Effect on Our Financial Condition and Results of Operations
If consumers in our principal markets lose confidence in the health or safety of nut products, particularly with respect to peanut and tree nut allergies, food borne illnesses or other food safety matters, this could materially and adversely affect our financial condition and results of operations. Individuals with nut allergies may be at risk of serious illness or death resulting from the consumption of our nut products, including consumption of other companies’ products containing our products as an ingredient. Notwithstanding our existing food safety controls, we process peanuts and tree nuts on the same equipment, and there is no guarantee that our other products will not be cross-contaminated. Concerns generated by risks of peanut and tree nut cross-contamination and other food safety matters, including food borne illnesses, may discourage consumers from buying our products, cause production and delivery disruptions, or result in product recalls. Product safety issues (i) concerning products not manufactured, distributed or sold by us and (ii) concerning products we manufacture, distribute and sell, may materially and adversely affect demand for products in the nut industry as a whole, including products without actual safety problems. Decreases in demand for products in the industry generally could have a material adverse effect on our financial condition and results of operations. In addition, the cooling system at our Elgin, Illinois facility utilizes ammonia. If a leak in the system were to occur, there is a possibility that the inventory in cold storage at our Elgin, Illinois facility could be destroyed which could have a material adverse effect on our financial condition and results of operations.
The Risk Assessment Conducted by the U.S. Food and Drug Administration on the Risks of Tree Nuts May Have a Material Adverse Effect on Our Financial Condition, Results of Operations and Cash Flows
The U.S. Food and Drug Administration (“FDA”) is assessing the risks of Salmonella contamination associated with tree nuts. This assessment, which includes randomly sampling tree nuts in the marketplace, has resulted in product recalls in the nut industry. The results and impact of this risk assessment and recalls based on sampling could also lead to increased industry-specific regulation and/or additional risk-based preventive controls which may result in increased compliance costs, capital expenditures to meet FDA-imposed requirements and reputation risks to our branded and private brand products. Recalls or significant expenditures to satisfy FDA requirements could have a material adverse effect on our financial condition, results of operations and cash flows.
Product Liability, Product Recalls, Product Labeling and Product Advertising Claims May Have a Material Adverse Effect on Our Results of Operations and Cash Flows
We face risks associated with product liability claims, product recalls and other liabilities in the event: (i) our food safety and quality control procedures are ineffective or fail, (ii) we procure products from third parties that are or become subject to a recall, regardless of whether or not our food safety and quality control procedures are ineffective or fail, (iii) our products cause injury or become adulterated or misbranded, (iv) our products are determined to be promoted or labeled in a misleading fashion, (v) government authorities test our products and determine that they contain a contaminant or present a food safety risk, (vi) our products are tampered with, or (vii) one of our competitors is subject to claims, recalls or other liabilities involving products similar to ours. In recent years, the food industry has been a target of litigation over product labeling and advertising, including nut products. Such litigation results in significant costs to defend and resolve. In addition, we do not control the labeling of other companies’ products containing our products as an ingredient. A product recall of a sufficient quantity, a significant product liability judgment against us, a significant advertising-related liability or judgment against us or other safety concerns (whether actual or claimed) could cause our products to be unavailable for a period of time, could result in a loss of consumer confidence in our products and expose us to liabilities in excess of any insurance we maintain for such events. If these kinds of events were to occur, they would have a material adverse effect on the demand for our products and, consequently, our results of operations and cash flows.
We are Dependent on Certain Key Personnel and the Loss of Any of Their Services Could Have a Material Adverse Effect on Our Results of Operations
Our future success will be largely dependent on the personal efforts of our senior operating management team, including Jeffrey T. Sanfilippo, Chief Executive Officer, Michael J. Valentine, Chief Financial Officer, Group President and Secretary, James A. Valentine, Chief Information Officer and Jasper B. Sanfilippo, Jr., Chief Operating Officer, President and Assistant Secretary. We believe that the expertise and knowledge of these individuals in the industry, and in their respective fields, is a critical factor to our growth and success. Although some of our officers own significant amounts of our Class A Stock, these individuals have not entered into any employment or non-compete agreement with us, nor do we have key officer insurance coverage policies in effect. The departure of any of these individuals could have a material adverse effect on our business and prospects and that in turn would have a material adverse effect on our results of operations. Our success is also dependent upon our ability to attract and retain additional qualified personnel, and there can be no assurance that we will be able to do so.
8
We are Subject to Government Regulation Which Could Materially and Adversely Affect Our Results of Operations
We are subject to extensive regulation by the FDA, the USDA, the United States Environmental Protection Agency (“EPA”) and other state, local and foreign authorities in jurisdictions where our products are manufactured, processed or sold. Among other things, these regulations govern the manufacturing, importation, processing, packaging, storage, distribution, advertising and labeling of our products. Our manufacturing and processing facilities and products are subject to periodic compliance inspections by federal, state, local and foreign authorities. We are also subject to environmental regulations governing the discharge of air emissions, water and food waste, the usage and storage of pesticides, and the generation, handling, storage, transportation, treatment and disposal of waste materials. Amendments to existing statutes and regulations, adoption of new statutes and regulations, increased production at our existing facilities as well as our expansion into new operations and jurisdictions, may require us to obtain additional licenses and permits and could require us to adapt or alter methods of operations at costs that could be substantial. Compliance with applicable laws and regulations may be time-consuming, expensive or costly to us in different ways and could materially and adversely affect our results of operations. Failure to comply with applicable laws and regulations could subject us to civil remedies, including fines, injunctions, recalls or seizures, as well as possible criminal sanctions, which could materially and adversely affect our results of operations.
Specifically, governmental policies affecting the agricultural industry, such as taxes, tariffs, duties, subsidies, incentives, and import and export restrictions on agricultural commodities and commodity products, can influence the planting, location and size of certain crops, whether commodity products are traded, the volume and types of imports and exports, and the viability and volume of production of certain of our products. In addition, international trade disputes can adversely affect commodity trade flows by limiting or disrupting trade between countries or regions. Future government policies may adversely affect the supply of, demand for, and prices of our products, restrict our ability to do business in its existing and target markets, and negatively impact our revenues and operating results.
The Food Safety Modernization Act (“FSMA”) gives the FDA expanded authorities over the safety of the national food supply, including increased inspections and mandatory recalls, as well as stricter enforcement actions, each of which could result in additional compliance costs and civil remedies, including fines, injunctions, withdrawals, recalls or seizures and confiscations. The FSMA further instructed the FDA to develop new rules and regulations, including the performance of hazard analyses, implementation of preventive plans to control hazards, and foreign supplier verification provisions. We currently have “hazard analysis and critical control points” (“HACCP”) procedures in place that may appropriately address many of the existing or future concerns as a result of FSMA; however, the new FDA rules and regulations will likely require us to change certain of our operational processes and procedures, and implement new ones, and there could also be unforeseen issues, requirements and costs that arise from these new FDA rules and regulations. HACCP is a management system in which food safety is addressed through the analysis and control of hazards from raw material production, procurement and handling, to manufacturing, distribution and consumption of the finished product.
We are a publicly traded company and subject to changing rules and regulations of federal and state governments as well as other regulatory entities. These entities, including the Public Company Accounting Oversight Board, the SEC, the Department of Justice and the Nasdaq Global Select Market, have issued a significant number of new and increasingly complex requirements and regulations over the last several years and continue to develop additional regulations and requirements in response to laws enacted by Congress. Our efforts to comply with these requirements have resulted in, and are likely to continue to result in, an increase in expenses and a diversion of management’s time from other business activities. Failure to comply with any law or regulation could subject us to civil or criminal remedies, including fines and injunctions, which could materially and adversely affect our results of operations.
Operational, Legal, Economic, Political and Social Risks of Doing Business in Emerging Markets and Other Foreign Countries May Have a Material Adverse Effect on Our Results of Operations
Approximately 41% of the dollar value of our total nut purchases for fiscal 2017 were made from foreign countries. We purchase our cashews from Vietnam, India, Brazil and certain West African countries and some of our pecans from Mexico. To this extent, we are exposed to various risks inherent in emerging markets, including increased governmental ownership and regulation of the economy, greater likelihood of inflation and adverse economic conditions, governmental attempts to control inflation, such as setting interest rates and maintaining wage and price controls, supply reduction into the United States from increased demand in foreign countries, international competition, compliance with, and subjection to, foreign laws, including our ability to protect our intellectual property, such as our brands, compliance with U.S. laws and regulations related to conduct in foreign countries, such as the Foreign Corrupt Practices Act, currency exchange rates, potential for contractual defaults or forced renegotiations on purchase contracts with limited legal recourse, tariffs, quotas, duties, import and export restrictions and other barriers to trade that may reduce our profitability or sales and civil unrest, armed hostilities and significant political instability.
The existence of risks in emerging markets and other foreign countries could jeopardize or limit our ability to purchase sufficient supplies of cashews, pecans and other imported raw materials and limit our ability to make international sales, and may materially and adversely affect our results of operations by increasing the costs of doing business overseas.
9
The Way in Which We Measure Inventory May Have a Material Adverse Effect on Our Results of Operations
We acquire our inshell nut inventories of pecans, peanuts and walnuts from growers and farmers in large quantities at harvest times, which are primarily during the second and third quarters of our fiscal year, and receive nut shipments in bulk truckloads. The weights of these nuts are measured using truck scales at the time of receipt, and inventories are recorded on the basis of those measurements. The nuts are then stored in bulk in large warehouses to be shelled or processed throughout the year. Bulk-stored nut inventories are relieved on the basis of continuous high-speed bulk weighing systems as the nuts are shelled or processed or on the basis of calculations derived from the weight of the shelled nuts that are produced. While we perform various procedures periodically to confirm the accuracy of our bulk-stored nut inventories, these inventories are estimates that must be periodically adjusted to account for positive or negative variations in quantities and yields, and such adjustments directly affect earnings. The quantities of each crop year bulk-stored nut inventories are generally shelled out over a ten to fifteen-month period, at which time revisions to any estimates, which historically averaged less than 1.0% of inventory purchases, are also recorded. The precise amount of our bulk-stored nut inventories is not known until the entire quantity of the particular nut is depleted, which may not necessarily occur every year. Prior crop year inventories may still be on hand as the new crop year inventories are purchased. The majority of bulk-stored nut inventories at June 29, 2017 will be processed during the first quarter of fiscal 2018 and any adjustment to our bulk stored nut inventory quantity will be recorded at that time. There can be no assurance that any bulk stored nut inventory quantity adjustments will not have a material adverse effect on our results of operations in the future.
Certain of Our Stockholders Possess a Majority of Aggregate Voting Power in the Company and Members of The Sanfilippo Group Have Pledged a Substantial Amount of their Class A Stock, Which May Make a Takeover or Change in Control More or Less Difficult and Could Materially and Adversely Affect Our Financial Condition and Results of Operations
As of August 23, 2017, Jasper B. Sanfilippo Sr., Marian Sanfilippo, Jeffrey T. Sanfilippo, Jasper B. Sanfilippo, Jr., Lisa A. Sanfilippo, John E. Sanfilippo and James J. Sanfilippo (the “Sanfilippo Group”) own or control Common Stock (one vote per share) and Class A Stock (ten votes per share on all matters other than the election of Common Stock directors) representing approximately a 51.0% voting interest in the Company. As of August 23, 2017, Michael J. Valentine and Mathias A. Valentine (the “Valentine Group”) own or control Common Stock (one vote per share) and Class A Stock (ten votes per share on all matters other than the election of Common Stock directors) representing approximately a 24.0% voting interest in the Company. In addition, the Sanfilippo Group and the Valentine Group as holders of the Class A Stock are entitled to elect six Class A Directors which represents 67% of our entire Board of Directors. As a result, the Sanfilippo Group and the Valentine Group together are able to direct the election of a majority of the members to the Board of Directors. In addition, the Sanfilippo Group is able to exert certain influence on our business, or take certain actions, that cannot be counteracted by another stockholder or group of stockholders. The Sanfilippo Group is able to determine the outcome of nearly all matters submitted to a vote of our stockholders, including any amendments to our certificate of incorporation or bylaws. The Sanfilippo Group has the power to prevent or cause dividends, or a change in control or sale of the Company, which may or may not be in the best interests of other stockholders, and can take other actions that may be less favorable to other stockholders and more favorable to the Sanfilippo Group, subject to applicable legal limitations, which could materially and adversely affect our financial condition, results of operations and cash flows.
In addition, several members of the Sanfilippo Group that beneficially own a significant interest in our Company have pledged a substantial portion of the Company’s Class A Stock that they own to secure loans made to them by commercial banks. If a stockholder defaults on any of its obligations under these pledge agreements or the related loan documents, these banks may have the right to sell the pledged shares. Such a sale could cause our Company’s stock price to decline. Many of the occurrences that could result in a foreclosure of the pledged shares are out of our control and are unrelated to our operations. Because these shares are pledged to secure loans, the occurrence of an event of default could result in a sale of pledged shares that could cause a change of control of our Company, even when such a change may not be in the best interests of our stockholders, and it could also result in a default under certain material contracts to which we are a party, including an event of default under the Credit Agreement by and among the Company, Wells Fargo Capital Finance (f/k/a Wells Fargo Foothill, LLC), as the arranger and administrative agent and a syndicate of lenders, dated February 7, 2008 (as amended, the “Credit Facility”), which could materially and adversely affect our financial condition, results of operations and cash flows.
10
Essentially all of Our Real Property is Encumbered, Which Could Materially and Adversely Affect Our Ability to Obtain Additional Capital if Required Which Could Materially and Adversely Affect Our Financial Condition, Results of Operations and Cash Flows
Our financing arrangements include a mortgage facility, which is secured by essentially all of our owned real property located in Elgin, Illinois, Gustine, California and Garysburg, North Carolina. Because essentially all of our owned real property is encumbered, such properties are not available as a means of securing further capital in the event that additional capital is required because of unexpected events, losses or other circumstances, which could materially and adversely affect our financial condition, results of operations and cash flows.
General Economic Conditions and Increased Production Costs Could Materially and Adversely Affect Our Financial Condition and Results of Operations
General economic conditions and the effects of a recession, including uncertainty in economic conditions and an economic downturn, and political uncertainties, including political action or inaction having an impact on the economy, could have a material adverse effect on our cash flow from operations, results of operations and financial condition. These conditions may include, among other things, higher unemployment, increased commodity costs, increased raw material costs, increased packaging material prices, decreases or alterations in consumer demand, changes in buying patterns, adverse changes in tax rates, interest rate and capital market volatility, adverse changes in the purchasing power of the U.S. dollar and higher general water, energy, transportation and fuel costs. Maintaining the prices of our products, initiating price increases (including passing along price increases for commodities used in our products) and increasing the demand for our products (especially when prices for our products are decreasing due to commodity price decreases), all of which are important to our plans to increase profitability, may be materially and adversely affected by general economic conditions and increases in production costs. Among other considerations, nuts and our other products are not essential products and therefore demand and sales volume could decrease. In addition, a general economic downturn could cause one or more of our vendors, suppliers, distributors and customers to experience cash flow problems and, therefore, such vendors, suppliers, distributors and customers may be forced to reduce their output, shut down their operations or file for bankruptcy protection, which in some cases would make it difficult for us to continue production of certain products, could require us to reduce sales of our products or could result in uncollectable accounts receivable. Financial difficulties or solvency problems at these vendors, suppliers and distributors could materially adversely affect their ability to supply us with products or adequate products, which could disrupt our operations. It may be difficult to find a replacement for certain vendors, suppliers or distributors without significant delay or increase in cost. Any of the foregoing could materially and adversely affect our financial condition and results of operations.
Litigation Could Materially and Adversely Affect Our Financial Condition and Results of Operations
We have been the subject of litigation and investigations in the past, and we may become the subject of litigation and investigations in the future, which may include lawsuits or claims related to contracts, intellectual property, product recalls, product liability, the marketing and labeling of products, employment matters, wage and hour matters, environmental matters or other aspects of our business. Plaintiffs or regulatory bodies could seek recovery of very large or indeterminate amounts, and the magnitude of the potential loss relating to lawsuits and investigations is difficult to accurately estimate. Regardless of whether any claims against us are valid, or whether we are ultimately held liable, such litigation and investigations may be expensive to defend and may divert time, money and management attention away from our operations and negatively impact our financial performance. We maintain insurance in amounts we believe to be adequate based on our business operations. However, we may incur claims or liabilities for which we are not insured, that exceed the amount of our insurance coverage or that our insurers may raise various objections and exceptions to coverage. A judgment or settlement for significant monetary damages or requiring other significant changes to our business or assets could materially and adversely affect our financial condition and results of operations. Any adverse publicity resulting from allegations or investigations may also adversely affect our reputation and the reputation of our products, which in turn could materially and adversely affect our financial condition and results of operations.
Technology Disruptions, Failures or Breaches Could Materially and Adversely Affect Our Financial Condition and Results of Operations
We depend on information technology to maintain and streamline our operations, including, among other things, (i) interfacing with our locations, customers and suppliers, (ii) complying with financial reporting, legal and tax regulatory requirements, (iii) maintaining logistics, inventory control and monitoring systems and (iv) providing us with real-time feedback about our business. Like other companies, our information technology systems may be vulnerable to a variety of interruptions due to events beyond our control, including natural disasters, terrorist attacks, telecommunications failures, outages during replacement or upgrades, computer viruses, hardware failures, power outages, hackers, ransomware attacks, cyber risks and other security issues. We have technology security initiatives, cyber insurance and disaster recovery plans in place to mitigate our risk to these vulnerabilities, but these measures may not be adequate, particularly as the global dependence on technology increases. In addition, if we are unable to prevent security breaches or disclosure of non-public information, we may suffer financial and reputational damage, litigation or remediation costs or penalties because of the unauthorized disclosure of confidential information belonging to us or to our customers, consumers, or suppliers.
11
In addition, we have outsourced several information technology support services and administrative functions to third-party service providers, and may outsource other functions in the future to achieve cost savings and efficiencies. If the service providers to which we outsource these functions do not perform effectively, we may not be able to achieve the expected cost savings and may have to incur additional costs to correct errors made by such service providers. Depending on the function involved, such errors may also lead to business disruption, processing inefficiencies, the loss of or damage to intellectual property through security breach, the loss of sensitive data through security breach, or otherwise. While we or any third party service provider have not experienced any significant disruption, failure or breach impacting our information technology systems, any such disruption, failure or breach could adversely affect our financial condition and results of operations.
Our Products are Processed at a Limited Number of Production Facilities and any Significant Disruption at any of Our Production Facilities or Disruption with a Third Party Supplier Could Have a Material Adverse Effect on Our Financial Condition and Results of Operations
Our products are shelled, manufactured or otherwise processed at our five production facilities. However, certain nut and nut-related products, including the shelling of peanuts, walnuts and pecans and processing and packaging of certain other products, are conducted only at a single location. If any of these production facilities experiences a disruption for any reason, including a work stoppage, power failure, fire, pandemic, terrorism or weather related condition or natural disaster, this could result in a significant reduction or elimination of the availability of some of our products. In addition, a dispute with, or disruption at, a significant third party supplier, service provider or distributor may impact our ability to produce, package, market, transport and sell our products. If we were not able to obtain alternate production, shelling or processing capability in a timely manner or on satisfactory terms, this could have a material adverse effect on our financial condition and results of operations.
Inability to Protect Our Intellectual Property or Avoid Intellectual Property Disputes Could Materially and Adversely Affect Our Financial Condition and Results of Operations
We consider our intellectual property rights, particularly and most notably our brand trademarks (such as our Fisher, Orchard Valley Harvest and Sunshine Country trademarks), but also our patents, trade secrets, know-how copyrights and licensing agreements, to be a significant and valuable aspect of our business. We attempt to protect our intellectual property rights through a combination of patent, service mark, trademark, copyright and trade secret laws, as well as licensing agreements, third party nondisclosure and assignment agreements and policing of third party misuses of our intellectual property both domestically and internationally. Our failure to obtain or adequately protect our trademarks, products, new features of our products, or our trade secrets and technology, or any change in law or other changes that serve to lessen or remove the current legal protections of our intellectual property, may diminish our competitiveness and could materially and adversely affect our financial condition and results of operations.
In addition, we may be unaware of intellectual property rights of others that may cover some of our technology, brands or products. Any disputes regarding patents or other intellectual property could be costly and time-consuming and could divert the attention of our management and key personnel from our business operations. Third party claims of intellectual property infringement might also require us to enter into costly license agreements. We also may be subject to significant damages or injunctions against development and sale of certain products if found to be liable for infringing activity. Any such activities could materially and adversely affect our financial condition and results of operations.
Unsuccessful Implementation of Our Strategic Plan Could Materially and Adversely Affect Our Financial Condition and Results of Operations
We developed a strategic plan (the “Strategic Plan”), most recently updated in fiscal 2016, to help us achieve long-term profitable growth. As part of this Strategic Plan, we have taken a number of actions including, among other things, promotion of our branded and snack nut products, expanding distribution in traditional retail channels and alternative channels and other strategies related to increasing sales of non-branded business at existing key customers. We are taking these actions in order to increase sales in all of our distribution channels. There are no assurances that we will be successful in achieving any portion of our Strategic Plan, or any other efficiency measures.
In addition, we have in the past, as part of our Strategic Plan, engaged in strategic acquisitions and joint ventures. However, we may be unable to successfully manage completed acquisitions or joint ventures, identify additional acquisitions or joint ventures, or negotiate favorable financial or other terms with third parties which are attractive or advantageous to grow or otherwise supplement our existing business. In addition, the identification and completion of any acquisition or joint venture may divert management’s attention from ordinary business matters, require a number of one-time or ongoing advisory costs, result in the loss of employees or customers of our business or the acquired business, involve the assumption of unknown and potentially significant liabilities or result in impairment charges if the assumptions underlying the purchase are not satisfied. Due to various uncertainties inherent in such activities, we may be unable to achieve a substantial portion of any anticipated benefits or cost savings from previous acquisitions or joint ventures or other anticipated benefits in the timeframe we anticipate, or at all.
Any inability to realize the anticipated benefits from the Strategic Plan could materially and adversely affect our financial condition and results of operations.
12
Increases in Labor Costs or Work Stoppages or Strikes Could Materially and Adversely Affect Our Financial Condition and Results of Operations
As the number of our employees has grown, personnel costs, including the costs of medical and other employee health and welfare benefits, have increased. These costs can vary substantially as a result of an increase in the number, mix and experience of our employees and changes in health care and other employment-related laws. There are no assurances that we will succeed in reducing future increases in such costs, particularly if government regulations require us to change our health and welfare benefits, government regulations impose additional monitoring and compliance expenses or we need to attract and retain additional qualified personnel. Our inability to control such costs could materially and adversely affect our financial condition and results of operations.
Although we consider our labor relations to be good, if a significant number of our employees engaged in a work slowdown, or other type of labor unrest, it could in some cases impair our ability to supply our products to customers, which could result in reduced sales, and may distract our management from focusing on our business and strategic priorities. Any of these activities could materially and adversely affect our financial condition and results of operations.
We Cannot Guarantee the Timing, Amount or Payment of Dividends
Although the Board of Directors has adopted a dividend policy under which the Company intends to pay an annual cash dividend on its Common Stock and Class A Stock, whether any such subsequent dividend (or any special dividend) is declared and the timing and amount thereof is subject to the discretion of the Board of Directors. Decisions of the Board of Directors in respect of dividends will be based on a variety of factors, including the cash flows, earnings and financial position of the Company as well as the borrowing availability and other restrictions under our Credit Facility. The Board of Directors is not required to declare dividends and the number and amount of dividends is restricted under our Credit Facility and could be restricted under future financing or other arrangements. The Board of Directors will also regularly review and may modify or terminate our dividend policy. Accordingly, we cannot provide any assurances that our Company will pay annual or special cash dividends in the future, and if so, the amount or timing thereof. Any reduction in or elimination of our dividend policy or dividend payments could have a negative effect on the price of our Common Stock.
13
Item 1B — Unresolved Staff Comments
None.
Item 2 — Properties
We own or lease five principal production facilities. Our primary processing and distribution facility is located at our Elgin, Illinois site which also houses our primary manufacturing operations and corporate headquarters (the “Elgin Site”). The remaining principal production facilities are located in Bainbridge, Georgia; Garysburg, North Carolina; Selma, Texas and Gustine, California. In addition, we operate a retail store at the Elgin Site.
As described below in Part II, Item 7 — “Management’s Discussion and Analysis of Financial Condition and Results of Operations — Liquidity and Capital Resources”, the Mortgage Facility (as defined below) is secured by mortgages on essentially all of our owned real property located in Elgin, Illinois, Gustine, California and Garysburg, North Carolina.
We believe that our facilities are generally well maintained and in good operating condition.
a. Principal Facilities
The following table provides certain information regarding our principal facilities:
| Location |
Square Footage |
Type of Interest |
Description of Principal Use |
Date Company Constructed, Acquired or First Occupied |
||||||||
| Bainbridge, Georgia |
300,000 | Owned and Leased | Peanut shelling, purchasing, processing, packaging, warehousing and distribution |
1987 | ||||||||
| Garysburg, North Carolina |
160,000 | Owned | Peanut shelling, purchasing, processing, packaging, warehousing and distribution |
1994 | ||||||||
| Selma, Texas(1) |
300,000 | Leased | Pecan shelling, processing, bulk packaging, warehousing and distribution | 1992 | ||||||||
| Gustine, California |
215,000 | Owned | Walnut shelling, processing, packaging, warehousing and distribution | 1993 | ||||||||
| Elgin,
Illinois(2) |
400,000 | Owned | Rental property | 2005 | ||||||||
| Elgin, Illinois |
1,001,000 | Owned | Processing, packaging, warehousing, distribution and corporate offices | 2005 | ||||||||
| (1) | The sale and lease back of the Selma properties to related party partnerships was consummated in fiscal 2007. See Note 5- “Long-Term Debt” to the Consolidated Financial Statements. |
| (2) | The Elgin Office Building (part of the Elgin Site) was acquired in April 2005. Approximately 30% of the Elgin Office Building is currently being leased to unrelated third parties. The remaining portion of the office building may be leased to third parties; however, there can be no assurance that we will be able to lease the unoccupied space. Further capital expenditures will likely be necessary to lease all of the remaining space. |
14
b. Manufacturing Capability, Utilization, Technology and Engineering
Our principal production facilities are equipped with modern processing and packaging machinery and equipment.
The Elgin Site was designed to our specifications with what we believe to be state-of-the-art equipment. The layout is designed to efficiently move products from raw storage to processing to packaging to distribution. The Elgin Site was designed to minimize the risk of cross contamination between tree nuts and peanuts. As currently configured, the Elgin Site can accommodate an increase in production capacity of 20% to 35% of our current capacity.
The Selma facility contains our automated pecan shelling and bulk packaging operation. The facility’s pecan shelling production lines currently have the capacity to shell in excess of 90 million inshell pounds of pecans annually. During fiscal 2017, we processed approximately 32 million inshell pounds of pecans at the Selma facility.
The Bainbridge facility is located in the largest peanut producing region in the United States. This facility takes direct delivery of farmer stock peanuts and cleans, shells, sizes, inspects, blanches, roasts and packages them for sale to our customers. The production line at the Bainbridge facility is almost entirely automated and has the capacity to shell approximately 120 million inshell pounds of peanuts annually. During fiscal 2017, the Bainbridge facility shelled approximately 86 million inshell pounds of peanuts.
The Garysburg facility has the capacity to process approximately 60 million inshell pounds of farmer stock peanuts annually. During fiscal 2017, the Garysburg facility processed approximately 16 million inshell pounds of peanuts.
The Gustine facility is used for walnut shelling, processing, packaging, warehousing and distribution. This facility has the capacity to shell in excess of 60 million inshell pounds of walnuts annually. During fiscal 2017, the Gustine facility shelled approximately 39 million inshell pounds of walnuts.
The Bainbridge, Garysburg, Selma, and Gustine facilities are equipped to handle the processing, packaging, warehousing and distribution, and in the case of our Bainbridge and Garysburg facilities, the purchasing of nuts. Furthermore, at our Elgin Site, we process, package, warehouse and distribute nuts. We currently have more than sufficient capacity at our facilities to handle the aforementioned operations.
Item 3 — Legal Proceedings
We are a party to various lawsuits, proceedings and other matters arising out of the conduct of our business. Currently, it is management’s opinion that the ultimate resolution of these matters will not have a material adverse effect upon our business, financial condition, results of operation or cash flows.
We are subject to a class-action complaint for an employment related matter. Mediation for this matter occurred in June 2017, which for the first time we were provided with an initial monetary demand. In August 2017, we agreed in principle to a $1.2 million settlement for which we are fully reserved at June 29, 2017. The non-monetary components of the settlement are still being finalized.
For a discussion of our class-action complaint and legal proceedings, investigations, settlements and other contingencies, see Note 7 - “Commitments and Contingent Liabilities” in the Notes to Consolidated Financial Statements in Part II, Item 8 of this Form 10-K.
Item 4 — Mine Safety Disclosures
Not applicable.
15
EXECUTIVE OFFICERS OF THE REGISTRANT
Pursuant to General Instruction G(3) of Form 10-K and Instruction 3 to Item 401(b) of Regulation S-K, the following executive officer description information is included as an unnumbered item in Part I of this Report in lieu of being included in the Proxy Statement for our annual meeting of stockholders to be held on November 2, 2017. Below are our executive officers as of August 23, 2017:
Jeffrey T. Sanfilippo, Chief Executive Officer, age 54 — Mr. Sanfilippo has been employed by us since 1991 and in November 2006 was named our Chief Executive Officer. Mr. Sanfilippo served as our Executive Vice President Sales and Marketing from January 2001 to November 2006. He served as our Senior Vice President Sales and Marketing from August 1999 to January 2001. Mr. Sanfilippo has been a member of our Board of Directors since August 1999. He served as General Manager West Coast Operations from September 1991 to September 1993. He served as Vice President West Coast Operations and Sales from October 1993 to September 1995, and Mr. Sanfilippo served as Vice President Sales and Marketing from October 1995 to August 1999.
Michael J. Valentine, Chief Financial Officer, Group President and Secretary, age 58 — Mr. Valentine has been employed by us since 1987. In November 2006, Mr. Valentine was named our Chief Financial Officer and Group President and, in May 2007, Mr. Valentine was named our Secretary. Mr. Valentine served as our Executive Vice President Finance, Chief Financial Officer and Secretary from January 2001 to November 2006. Mr. Valentine served as our Senior Vice President and Secretary from August 1999 to January 2001. He has been a member of our Board of Directors since April 1997. Mr. Valentine served as our Vice President and Secretary from December 1995 to August 1999. He served as an Assistant Secretary and the General Manager of External Operations for us from June 1987 and 1990, respectively, to December 1995. Mr. Valentine’s responsibilities also include peanut, almond, imported nut, packaging and other ingredient procurement and our contract packaging business.
Jasper B. Sanfilippo, Jr., Chief Operating Officer, President and Assistant Secretary, age 49 — Mr. Sanfilippo has been employed by us since 1991. In November 2006, Mr. Sanfilippo was named our Chief Operating Officer and President and, in May 2007, Mr. Sanfilippo was named our Treasurer and held that position until January 2009. Mr. Sanfilippo served as our Executive Vice President Operations, retaining his position as Assistant Secretary, which he assumed in December 1995 from 2001 to November 2006. Mr. Sanfilippo became a member of our Board of Directors in December 2003. He became our Senior Vice President Operations in August 1999 and served as Vice President Operations from December 1995 to August 1999. Prior to that, Mr. Sanfilippo was the General Manager of our Gustine, California facility beginning in October 1995, and from June 1992 to October 1995 he served as Assistant Treasurer and worked in our Financial Relations Department. Mr. Sanfilippo is responsible for overseeing our plant operations, research and development, and product innovation.
James A. Valentine, Chief Information Officer, age 53 — Mr. Valentine has been employed by us since 1986 and in November 2006 was named our Chief Information Officer. He served as our Executive Vice President Information Technology from August 2001 to November 2006. Mr. Valentine served as Senior Vice President Information Technology from January 2000 to August 2001 and as Vice President of Management Information Systems from January 1995 to January 2000. Mr. Valentine is responsible for overseeing our information technology functions and managing cyber risks.
Thomas J. Fordonski, Senior Vice President, Human Resources, age 64 — Mr. Fordonski joined us in August 2007 as Vice President of Human Resources and was promoted to Senior Vice President of Human Resources in January 2010. Previously, he was Director of Human Resources for Continental AG, a German-based global manufacturer of electronic automotive equipment. Prior to that, Mr. Fordonski was at Motorola, Incorporated for 25 years, with his career culminating as the Director of Human Resources for the global supply chain in the messaging and cellular communications business. He is responsible for leading our human resources activities and functions.
Frank S. Pellegrino, Senior Vice President, Finance, Corporate Controller and Treasurer, age 43 — Mr. Pellegrino joined us in January 2007 as Director of Accounting and was appointed Corporate Controller in September 2007. In January 2009, he was named Vice President Finance and Corporate Controller. In August 2012, he was promoted to Senior Vice President, Finance. In August 2016, he was appointed Treasurer. Previously, Mr. Pellegrino was Internal Audit Manager at W.W. Grainger, a business-to-business distributor, from June 2003 to January 2007. Prior to that, he was a Manager in the Assurance Practice of PricewaterhouseCoopers LLP, where he was employed from 1996 to 2003. Mr. Pellegrino is responsible for our accounting and finance functions.
16
Christopher Gardier, Senior Vice President, Consumer Sales, age 57 — Mr. Gardier joined us in May 2010 as Vice President, Consumer Sales. In August 2012, Mr. Gardier was promoted to Senior Vice President, Consumer Sales. Previously, Mr. Gardier was the Vice President Sales for the Snacks Division at The Hain Celestial Group, where he led a national sales team of eight regional managers selling natural and organic salty snack brands. Prior to that, Mr. Gardier was a Customer Vice President, Central Region at Pepperidge Farm for six years, where he led a team of independent biscuit and bakery distributors covering 13 Midwestern states. Prior to that, Mr. Gardier was a Director of National Accounts at Frito Lay for almost five years, where he led a sales and operations team responsible for the mass merchandising channel. Mr. Gardier is responsible for leading our Consumer Sales efforts, including our Fisher and Orchard Valley Harvest brands.
Howard Brandeisky, Senior Vice President, Global Marketing and Customer Solutions, age 56 — Mr. Brandeisky joined us in April 2010 as Vice President, Marketing & Innovation. His role was expanded to include Customer Solutions in March 2011. In October 2013, he was promoted to Senior Vice President, Global Marketing and Customer Solutions. Previously, he was an independent consultant in the food industry for a year. Prior to that, Mr. Brandeisky was at Kraft Foods, Inc. for 24 years, with his career culminating as a Vice President of Marketing. He is responsible for leading the marketing, consumer insights, creative services, and customer solutions activities and functions.
Stephen C. Chester, Senior Vice President, Commercial Ingredients, age 57 — Mr. Chester joined us in June 2013 as Vice President of Commercial Ingredients and was promoted to Senior Vice President of Commercial Ingredients in August 2016. Previously he was Vice President of Marketing and R&D for Ventura Foods, a $2 billion food manufacturer selling to consumer, foodservice, and industrial channels. Prior to that, Mr. Chester has worked for other large consumer-focused food companies such a Frito Lay and Best Foods as well as mid-sized B-to-B focused food companies. He has functional experience in sales, marketing, R&D, and general management. Mr. Chester is also a U.S. Navy veteran. He is responsible for leading our Commercial Ingredients business which includes foodservice and industrial channels.
RELATIONSHIPS AMONG CERTAIN DIRECTORS AND EXECUTIVE OFFICERS
Mathias A. Valentine, a director of the Company, is (i) the father of Michael J. Valentine, an executive officer and director of the Company, and James A. Valentine, an executive officer of the Company and (ii) the uncle of Jasper B. Sanfilippo, Jr. and Jeffrey T. Sanfilippo, executive officers and directors of the Company, and James J. Sanfilippo, a director of the Company.
Michael J. Valentine, Chief Financial Officer, Group President and Secretary and a director of the Company, is (i) the son of Mathias A. Valentine, (ii) the brother of James A. Valentine and (iii) the cousin of Jasper B. Sanfilippo, Jr., Jeffrey T. Sanfilippo and James J. Sanfilippo.
Jeffrey T. Sanfilippo, Chief Executive Officer and a director of the Company, is (i) the brother of Jasper B. Sanfilippo, Jr. and James J. Sanfilippo, (ii) the nephew of Mathias A. Valentine and (iii) the cousin of Michael J. Valentine and James A. Valentine.
Jasper B. Sanfilippo, Jr., Chief Operating Officer, President and a director of the Company, is (i) the brother of Jeffrey T. Sanfilippo and James J. Sanfilippo, (ii) the nephew of Mathias A. Valentine and (iii) the cousin of Michael J. Valentine and James A. Valentine.
James J. Sanfilippo, a director of the Company, is (i) the brother of Jeffrey T. Sanfilippo and Jasper B. Sanfilippo, Jr., (ii) the nephew of Mathias A. Valentine and (iii) the cousin of Michael J. Valentine and James A. Valentine.
James A. Valentine, Chief Information Officer of the Company, is (i) the son of Mathias A. Valentine, (ii) the brother of Michael J. Valentine and (iii) the cousin of Jasper B. Sanfilippo, Jr., Jeffrey T. Sanfilippo and James J. Sanfilippo.
Timothy R. Donovan, a director of the Company, is (i) a nephew by marriage of Mathias A. Valentine and (ii) the first cousin by marriage of Jasper B. Sanfilippo, Jr., Jeffrey T. Sanfilippo, James J. Sanfilippo, Michael J. Valentine and James A. Valentine.
17
PART II
Item 5 — Market for Registrant’s Common Equity and Related Stockholder Matters
We have two classes of stock: Class A Stock and Common Stock. The holders of Common Stock are entitled to elect 25% of the total members of the Board of Directors, rounded up to the nearest whole number, and the holders of Class A Stock are entitled to elect the remaining directors. With respect to matters other than the election of directors or any matters for which class voting is required by law, the holders of Common Stock are entitled to one vote per share while the holders of Class A Stock are entitled to ten votes per share. Our Class A Stock is not registered under the Securities Act of 1933 and there is no established public trading market for the Class A Stock. However, each share of Class A Stock is convertible at the option of the holder at any time and from time to time (and, upon the occurrence of certain events specified in our Restated Certificate of Incorporation, automatically converts) into one share of Common Stock.
Our Common Stock is quoted on the NASDAQ Global Select Market and our trading symbol is “JBSS”. The following tables set forth, for the quarters indicated, the high and low reported sales prices for the Common Stock as reported on the NASDAQ Global Select Market.
| Price Range of Common Stock |
||||||||
| Year Ended June 29, 2017 |
High | Low | ||||||
| 4th Quarter |
$ | 74.69 | $ | 59.16 | ||||
| 3rd Quarter |
$ | 72.98 | $ | 56.95 | ||||
| 2nd Quarter |
$ | 72.24 | $ | 46.34 | ||||
| 1st Quarter |
$ | 54.18 | $ | 40.75 | ||||
| Price Range of Common Stock |
||||||||
| Year Ended June 30, 2016 |
High | Low | ||||||
| 4th Quarter |
$ | 72.84 | $ | 41.61 | ||||
| 3rd Quarter |
$ | 72.55 | $ | 47.85 | ||||
| 2nd Quarter |
$ | 66.29 | $ | 48.79 | ||||
| 1st Quarter |
$ | 57.23 | $ | 34.57 | ||||
18
The graph below compares our cumulative five-year total stockholder return on our Common Stock with the cumulative total returns of the Russell 2000 Consumer Staples Index and the Russell 2000 Index. The graph tracks the performance of a $100 investment in our Common Stock, in each index (with the reinvestment of all dividends) from June 29, 2012 to June 29, 2017.
COMPARISON OF 5 YEAR CUMULATIVE TOTAL RETURN*
Among John B. Sanfilippo & Son, Inc., the Russell 2000 Index,
and the Russell 2000 Consumer Staples Index
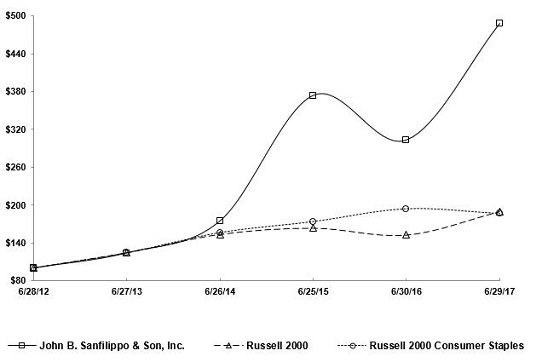
| * | $100 invested on June 29, 2012 in stock or index, including reinvestment of dividends. |
Indexes calculated on month-end basis.
The information contained in the preceding performance graph shall not be deemed to be “soliciting material” or to be “filed” with the SEC, nor shall such information be incorporated by reference into any future filing under the Securities Act of 1933 or the Securities Exchange Act of 1934, except to the extent that we specifically incorporate it by reference in such filing.
As of August 11, 2017 there were 44 holders and 17 holders of record of our Common Stock and Class A Stock, respectively.
Under our Restated Certificate of Incorporation, the Class A Stock and the Common Stock are entitled to share equally on a share for share basis in any dividends declared by the Board of Directors on our common equity. Our current financing agreements, as amended on July 7, 2017, allow us to make up to four cash dividends or distributions of our stock in any fiscal year in an amount not to exceed $60 million in the aggregate per fiscal year. See Part II, Item 7 — “Management’s Discussion and Analysis of Financial Condition and Results of Operations — Liquidity and Capital Resources — Financing Arrangements.”
On November 1, 2016 our Board of Directors declared a cash dividend of $2.50 that was paid to holders of Common Stock and Class A Stock on December 13, 2016. On July 7, 2016 our Board of Directors declared a cash dividend of $2.50 that was paid to holders of Common Stock and Class A Stock on August 4, 2016. On October 27, 2015 our Board of Directors declared a cash dividend of $2.00 that was paid to holders of Common Stock and Class A Stock on December 11, 2015.
On January 31, 2017, our Board of Directors adopted a dividend policy under which it intends to pay an annual cash dividend on our Common Stock and Class A Stock. The Board of Directors contemplated that the annual dividend would be declared around the conclusion of the Company’s fiscal year and paid in the first quarter of each fiscal year. One of the key factors that will be taken into account in determining the annual dividend amount (and whether any such dividend will be paid) will be the liquidity position of the Company, in particular the borrowing availability under our Credit Facility.
19
The Board of Directors will review the dividend policy regularly and any future annual or special dividends (whether such are paid and, if so, the amount and timing of payment) will be at the discretion of the Board of Directors, after taking into account a variety of factors, including cash flows, borrowing availability under our Credit Facility, and earnings and financial position of the Company. There can be no assurance that dividends will be declared or paid in the future. Pursuant to our Restated Certificate of Incorporation, any dividends paid on our Common Stock must be equivalent to the dividends paid on our Class A Stock.
Pursuant to the dividend policy, the Board of Directors declared an annual dividend of $0.50 per share that was paid to holders of our Common Stock and Class A Stock on August 15, 2017. In addition, the Board of Directors declared a special dividend of $2.00 per share that was paid to holders of our Common Stock and Class A Stock on August 15, 2017.
For purposes of the calculation of the aggregate market value of our voting stock held by non-affiliates as set forth on the cover page of this Report, we did not consider any of the siblings or spouses of Jasper B. Sanfilippo, Sr. (our former chairman of the board) or Mathias A. Valentine, or any of the lineal descendants of either Jasper B. Sanfilippo, Sr., Mathias A. Valentine or such siblings (other than those who are our executive officers, directors or who have formed a group within the meaning of Section 13(d)(3) of the Securities Exchange Act of 1934, as amended (the “Exchange Act”), with either Jasper B. Sanfilippo, Sr. or Mathias A. Valentine) as an affiliate. See “Review of Related Party Transactions” and “Security Ownership of Certain Beneficial Owners and Management” contained in our Proxy Statement for the 2017 Annual Meeting and “Relationships Among Certain Directors and Executive Officers” appearing immediately before Part II of this Report.
Securities Authorized under Equity Compensation Plans
The following table sets forth information as of June 29, 2017, with respect to equity securities authorized for issuance pursuant to equity compensation plans previously approved by our stockholders and equity compensation plans not previously approved by our stockholders.
Equity Compensation Plan Information
| Plan Category |
(a) Number of securities to be issued upon exercise of options, warrants and rights |
(b) Weighted average exercise price of outstanding options, warrants and rights |
(c) Number of securities remaining available for future issuance under equity compensation plans (excluding securities reflected in Column (a)) |
|||||||||
| Equity compensation plans approved by |
2,000 | $ | 10.24 | 820,539 | ||||||||
| Equity compensation plans approved by |
201,858 | — | 820,539 | |||||||||
| Equity compensation plans not approved by stockholders |
— | — | — | |||||||||
20
Item 6 — Selected Financial Data
The following historical consolidated financial data as of and for the years ended June 29, 2017, June 30, 2016, June 25, 2015, June 26, 2014 and June 27, 2013 was derived from our consolidated financial statements. The financial data should be read in conjunction with our audited consolidated financial statements and notes thereto, which are included elsewhere herein, and with Item 7 — “Management’s Discussion and Analysis of Financial Condition and Results of Operations”. The information below is not necessarily indicative of the results of future operations. The fiscal year ended June 30, 2016 contained an extra week compared to the other fiscal years presented.
Consolidated Statement of Comprehensive Income Data: (dollars in thousands, except per share data)
| Year Ended | ||||||||||||||||||||
| June 29, 2017 |
June 30, 2016 |
June 25, 2015 |
June 26, 2014 |
June 27, 2013 |
||||||||||||||||
| Net sales |
$ | 846,635 | $ | 952,059 | $ | 887,245 | $ | 778,622 | $ | 734,334 | ||||||||||
| Cost of sales |
704,712 | 814,591 | 755,189 | 655,757 | 614,372 | |||||||||||||||
|
|
|
|
|
|
|
|
|
|
|
|||||||||||
| Gross profit |
141,923 | 137,468 | 132,056 | 122,865 | 119,962 | |||||||||||||||
| Selling and administrative expenses |
83,579 | 86,156 | 80,177 | 77,510 | 78,343 | |||||||||||||||
| Gain on sale of assets held for sale, net |
— | — | — | (1,641 | ) | — | ||||||||||||||
|
|
|
|
|
|
|
|
|
|
|
|||||||||||
| Income from operations |
58,344 | 51,312 | 51,879 | 46,996 | 41,619 | |||||||||||||||
| Interest expense |
2,910 | 3,492 | 3,966 | 4,354 | 4,754 | |||||||||||||||
| Rental and miscellaneous expense, net |
1,296 | 1,358 | 3,049 | 2,810 | 1,569 | |||||||||||||||
|
|
|
|
|
|
|
|
|
|
|
|||||||||||
| Income before income taxes |
54,138 | 46,462 | 44,864 | 39,832 | 35,296 | |||||||||||||||
| Income tax expense |
18,013 | 16,067 | 15,559 | 13,545 | 13,536 | |||||||||||||||
|
|
|
|
|
|
|
|
|
|
|
|||||||||||
| Net income |
$ | 36,125 | $ | 30,395 | $ | 29,305 | $ | 26,287 | $ | 21,760 | ||||||||||
|
|
|
|
|
|
|
|
|
|
|
|||||||||||
| Basic earnings per common share |
$ | 3.19 | $ | 2.71 | $ | 2.63 | $ | 2.38 | $ | 2.00 | ||||||||||
| Diluted earnings per common share |
$ | 3.17 | $ | 2.68 | $ | 2.61 | $ | 2.36 | $ | 1.98 | ||||||||||
| Cash dividends declared per share |
$ | 5.00 | $ | 2.00 | $ | 1.50 | $ | 1.50 | $ | 1.00 | ||||||||||
Consolidated Balance Sheet Data: (dollars in thousands)
| June 29, 2017 |
June 30, 2016 |
June 25, 2015 |
June 26, 2014 |
June 27, 2013 |
||||||||||||||||
| Working capital (1) |
$ | 143,504 | $ | 158,979 | $ | 150,280 | $ | 137,228 | $ | 115,087 | ||||||||||
| Total assets (1) |
398,059 | 391,162 | 431,616 | 394,207 | 374,245 | |||||||||||||||
| Long-term debt, less current maturities (1) |
25,211 | 28,704 | 32,046 | 35,347 | 33,261 | |||||||||||||||
| Total debt (1) |
58,085 | 44,130 | 96,500 | 79,153 | 73,723 | |||||||||||||||
| Stockholders’ equity |
235,468 | 251,193 | 241,278 | 226,827 | 215,304 | |||||||||||||||
| (1) | Effective the first quarter of fiscal 2017 we adopted ASU No. 2015-03 which changes the presentation of debt issuance costs. Prior periods have been adjusted for this new accounting standard. |
21
Item 7 — Management’s Discussion and Analysis of Financial Condition and Results of Operations
The following discussion and analysis should be read in conjunction with the Consolidated Financial Statements and the Notes to Consolidated Financial Statements. Our fiscal year ends on the final Thursday of June each year, and typically consists of fifty-two weeks (four thirteen week quarters). However, the fiscal year ended June 30, 2016 consisted of fifty-three weeks with our fourth quarter containing fourteen weeks. Additional information on the comparability of the periods presented is as follows:
| • | References herein to fiscal 2018 are to the fiscal year ending June 28, 2018. |
| • | References herein to fiscal 2017, fiscal 2016 and fiscal 2015 are to the fiscal years ended June 29, 2017, June 30, 2016 and June 25, 2015, respectively. |
As used herein, unless the context otherwise indicates, the terms “we”, “us”, “our” or “Company” refer collectively to John B. Sanfilippo & Son, Inc. and our wholly-owned subsidiary JBSS Ventures, LLC. Our Credit Facility and Mortgage Facility, as defined below, are sometimes collectively referred to as “our financing arrangements.”
We are one of the leading processors and distributors of peanuts, pecans, cashews, walnuts, almonds and other nuts in the United States. These nuts are sold under a variety of private brands and under the Fisher, Orchard Valley Harvest and Sunshine Country brand names. We also market and distribute, and in most cases, manufacture or process, a diverse product line of food and snack products, including peanut butter, almond butter, cashew butter, candy and confections, snacks and trail mixes, snack bites, sunflower kernels, dried fruit, corn snacks, sesame sticks and other sesame snack products under private brands and brand names. We distribute our products in the consumer, commercial ingredients and contract packaging distribution channels.
The Company’s long-term objective to drive profitable growth, as identified in our strategic plan (the “Strategic Plan”), includes continuing to grow Fisher and Orchard Valley Harvest into leading nut brands by focusing on consumers demanding quality nuts in the snacking, recipe and produce categories and providing integrated nut solutions to grow non-branded business at existing key customers in each distribution channel. We executed on our Strategic Plan during fiscal 2017 by expanding our distribution and product offerings for our Fisher recipe nuts and Orchard Valley Harvest produce nuts and by expanding distribution of peanuts and trail mixes to contract packaging customers.
In the third quarter of fiscal 2017, our Board of Directors adopted a dividend policy under which it intends to pay an annual cash dividend on our Common Stock and Class A Stock of at least $0.50 per share. It is contemplated that this annual dividend would be declared around the conclusion of the Company’s fiscal year and paid in the first quarter of each fiscal year. One of the key factors that will be considered in determining the annual dividend amount (and whether any such dividend will be paid) will be the liquidity position of the Company, in particular the borrowing availability under our Credit Facility. The Board of Directors paid an annual dividend of $0.50 per share and a special dividend of $2.00 per share in August 2017.
We face a number of challenges in the future which include, among others, volatile commodity costs for certain tree nuts, especially cashews, and intensified competition for market share from both private brand and name brand nut products. Acquisition costs for almonds declined significantly during the second half of fiscal 2016, which has resulted in lower selling prices for products that contain almonds. Since sales of almonds comprise a significant percentage of our total net sales, we anticipate that lower selling prices will continue to result in a significant reduction in net sales in future comparisons until the impact of lower retail prices ultimately drives increased sales volume for almonds.
We will continue to focus on seeking profitable business opportunities to further utilize our additional production capacity at our Elgin Site. We expect to maintain our recent level of promotional and advertising activity for our Orchard Valley Harvest and Fisher brands. We continue to see domestic sales and volume growth in our Orchard Valley Harvest brand and expect to continue to focus on this portion of our branded business. We will continue to face the ongoing challenges specific to our business such as food safety and regulatory issues and the maintenance and growth of our customer base. See the information referenced in Part I, Item 1A — “Risk Factors” of this report for additional information about our risks, challenges and uncertainties.
22
Annual Highlights
| • | Our net sales for fiscal 2017 decreased by $105.4 million, or 11.1%, to $846.6 million compared to fiscal 2016. |
| • | Gross profit increased by $4.5 million, and our gross profit margin, as a percentage of net sales, increased to 16.8% in fiscal 2017 from 14.4% in fiscal 2016. |
| • | Total operating expenses for fiscal 2017 decreased by $2.6 million; however, our operating expenses, as a percentage of net sales, were 9.9% compared to 9.0% of net sales in fiscal 2016. |
| • | Diluted earnings per share increased approximately 18.3% compared to last fiscal year. |
| • | Our strong financial position allowed us to pay two special cash dividends with a combined total of $56.5 million. |
| • | The total value of inventories on hand at the end of fiscal 2017 increased by $25.8 million, or 16.5%, in comparison to the total value of inventories on hand at the end of fiscal 2016. |
We have seen a significant increase in acquisition cost for pecans in the 2016 crop year (which falls into our 2017 fiscal year), as well as an increase in cashew acquisition costs. Conversely, we have seen acquisition costs for domestic tree nuts such as almonds decrease in the 2016 crop year. While we completed our procurement of the current year crop of inshell walnuts during the second quarter of fiscal 2017, the total payments to our walnut growers were not determined until the third quarter of fiscal 2017, which is typical. The final prices paid to the walnut growers were based upon prevailing market prices and other factors, such as crop size and export demand. At June 29, 2017 there are no amounts due to walnut growers.
Results of Operations
The following table sets forth the percentage relationship of certain items to net sales for the periods indicated and the percentage increase or decrease of such items from fiscal 2017 to fiscal 2016 and from fiscal 2016 to fiscal 2015.
| Percentage of Net Sales | Percentage Change | |||||||||||||||||||
| Fiscal 2017 |
Fiscal 2016 |
Fiscal 2015 |
Fiscal 2017 vs. 2016 |
Fiscal 2016 vs. 2015 |
||||||||||||||||
| Net sales |
100.0 | % | 100.0 | % | 100.0 | % | (11.1 | )% | 7.3 | % | ||||||||||
| Gross profit |
16.8 | 14.4 | 14.9 | 3.2 | 4.1 | |||||||||||||||
| Selling expenses |
5.9 | 5.3 | 5.6 | (3.4 | ) | 3.0 | ||||||||||||||
| Administrative expenses |
4.0 | 3.7 | 3.4 | (2.4 | ) | 14.8 | ||||||||||||||
Fiscal 2017 Compared to Fiscal 2016
Net Sales
Our net sales decreased 11.1% to $846.6 million for fiscal 2017 from $952.1 million for fiscal 2016. Sales volume (measured as pounds sold to customers) decreased by 3.7% for fiscal 2017 in comparison to sales volume for fiscal 2016. The decrease in net sales was primarily due to a 7.6% decrease in the weighted average sales price per pound, which primarily occurred as a result of lower selling prices for almonds and walnuts.
The following summarizes sales by product type as a percentage of total gross sales. The information is based upon gross sales, rather than net sales, because certain adjustments from gross sales to net sales, such as promotional discounts, are not allocable to product type.
| Product Type |
Fiscal 2017 | Fiscal 2016 | ||||||
| Peanuts |
15.7 | % | 13.9 | % | ||||
| Pecans |
16.2 | 13.1 | ||||||
| Cashews & Mixed Nuts |
24.3 | 23.3 | ||||||
| Walnuts |
8.4 | 9.4 | ||||||
| Almonds |
16.3 | 23.0 | ||||||
| Trail & Snack Mixes |
13.9 | 12.4 | ||||||
| Other |
5.2 | 4.9 | ||||||
|
|
|
|
|
|||||
| Total |
100.0 | % | 100.0 | % | ||||
|
|
|
|
|
|||||
23
The following table shows a comparison of net sales by distribution channel (dollars in thousands):
| Distribution Channel |
Fiscal 2017 | Fiscal 2016 (2) | Change | Percent Change |
||||||||||||
| Consumer (1) |
$ | 530,366 | $ | 566,793 | $ | (36,427 | ) | (6.4 | )% | |||||||
| Commercial Ingredients |
164,732 | 244,240 | (79,508 | ) | (32.6 | ) | ||||||||||
| Contract Packaging |
151,537 | 141,026 | 10,511 | 7.5 | ||||||||||||
|
|
|
|
|
|
|
|
|
|||||||||
| Total |
$ | 846,635 | $ | 952,059 | $ | (105,424 | ) | (11.1 | )% | |||||||
|
|
|
|
|
|
|
|
|
|||||||||
| (1) | Sales of branded products were approximately 38% and 36% of total consumer channel sales during fiscal 2017 and 2016, respectively. Fisher branded products were approximately 85% and 87% of branded sales during fiscal 2017 and 2016 respectively, with branded produce products accounting for the remaining branded product sales. |
| (2) | Fiscal 2016 information has been revised to conform with the current year presentation. In fiscal 2017, we consolidated our bulk export business into our commercial ingredients channel and the remaining portion of our export business into our other sales channels. |
Net sales in the consumer distribution channel decreased by 6.4% in dollars, however, sales volume increased by 1.1% in fiscal 2017 compared to fiscal 2016. The decrease in net sales was primarily due to a 7.4% decrease in the weighted average sales price per pound, which primarily occurred as a result of lower selling prices for almonds and walnuts. IRi market data from June 2017 indicates that Fisher recipe nuts continue to be the branded market share leader in the overall recipe nut category. Fisher recipe nut sales volume increased 9.8% from fiscal 2016, primarily due to distribution gains with new customers, the introduction of larger package sizes for walnuts, and increased promotional activity. Partially offsetting the sales volume increase noted above, sales volume for Fisher snack nuts decreased 4.3%, primarily as a result of decreased promotional activity. An increase in the combined sales volume of 23.1% of Orchard Valley Harvest and Sunshine Country produce products, due to increased merchandising activity, also contributed to the sales volume increase. Private brand sales volume for fiscal 2017 was relatively unchanged compared to fiscal 2016.
Net sales in the commercial ingredients distribution channel decreased by 32.6% in dollars and 23.4% in sales volume compared to fiscal 2016. The sales volume decrease was primarily due to the loss of a bulk almond butter customer in the second quarter this year combined with decreased sales of bulk inshell walnuts due to lower walnut inventory quantities.
Net sales in the contract packaging distribution channel increased by 7.5% in dollars and 9.2% in sales volume in fiscal 2017 compared to fiscal 2016. The sales volume increase was primarily due to distribution gains and product line expansions implemented by several of our existing customers in this channel.
Gross Profit
Gross profit increased 3.2% to $141.9 million in fiscal 2017 from $137.5 million in fiscal 2016. Our gross profit margin, as a percentage of sales, increased to 16.8% for fiscal 2017 from 14.4% for fiscal 2016.
The increases in gross profit and gross profit margin were mainly attributable to lower acquisition costs for almonds and improved alignment of selling prices and acquisition costs for pecans and walnuts.
Operating Expenses
Total operating expenses for fiscal 2017 decreased by $2.6 million to $83.6 million. Operating expenses as a percent of net sales was 9.9% for fiscal 2017 and 9.0% for fiscal 2016. Operating expenses as a percent of net sales increased in fiscal 2017 as a result of a lower net sales base.
Selling expenses for fiscal 2017 were $49.4 million, a decrease of $1.7 million, or 3.4%, over the amount recorded for fiscal 2016. The decrease was driven primarily by a $1.5 million decrease in sampling and advertising expense, a $1.0 million decrease in sales commissions expense, and a $0.9 million decrease in compensation-related expenses. Partially offsetting the above was a $1.4 million increase in shipping expense due to an increase in delivered sales pounds.
Administrative expenses for fiscal 2017 were $34.2 million, a decrease of $0.9 million, or 2.4%, from the amount recorded for fiscal 2016 due primarily to a $1.4 million decrease in compensation-related expenses and a $0.5 million decrease in bad debt and miscellaneous expense, which were partially offset by a $0.8 million increase in net litigation settlements.
Income from Operations
Due to the factors discussed above, our income from our operations was $58.3 million, or 6.9% of net sales, for fiscal 2017, compared to $51.3 million, or 5.4% of net sales, for fiscal 2016.
24
Interest Expense
Interest expense was $2.9 million for fiscal 2017 compared to $3.5 million for fiscal 2016. The decrease in interest expense was due primarily to lower debt levels during the first half of the 2017 fiscal year.
Rental and Miscellaneous Expense, Net
Net rental and miscellaneous expense was $1.3 million for fiscal 2017 compared to $1.4 million for fiscal 2016.
Income Tax Expense
Income tax expense was $18.0 million, or 33.3% of income before income taxes (the “Effective Tax Rate”), for fiscal 2017 compared to $16.1 million, or 34.6% of income before income taxes, for fiscal 2016. The Effective Tax Rate was favorably impacted by approximately $0.9 million of excess tax benefits that reduced the Effective Tax Rate by 180 basis points. Prior to the adoption of ASU 2016-09, which occurred in the first quarter of fiscal 2017, excess tax benefits were recorded in Capital in excess of par value on the Consolidated Balance Sheets and Consolidated Statements of Stockholders’ Equity.
Net Income
Net income was $36.1 million, or $3.19 basic and $3.17 diluted per common share, for fiscal 2017, compared to $30.4 million, or $2.71 basic and $2.68 diluted per common share, for fiscal 2016, due to the factors discussed above.
Fiscal 2016 Compared to Fiscal 2015
Net Sales
Our net sales increased 7.3% to $952.1 million for fiscal 2016 from $887.2 million for fiscal 2015. Sales volume (measured as pounds sold to customers) increased by 6.6% for fiscal 2016 in comparison to sales volume for fiscal 2015. Sales volume increased for all major nut types except almonds and pecans.
The following summarizes sales by product type as a percentage of total gross sales. The information is based upon gross sales, rather than net sales, because certain adjustments from gross sales to net sales, such as promotional discounts, are not allocable to product type.
| Product Type |
Fiscal 2016 | Fiscal 2015 | ||||||
| Peanuts |
13.9 | % | 13.7 | % | ||||
| Pecans |
13.1 | 12.7 | ||||||
| Cashews & Mixed Nuts |
23.3 | 22.0 | ||||||
| Walnuts |
9.4 | 11.0 | ||||||
| Almonds |
23.0 | 23.4 | ||||||
| Trail & Snack Mixes |
12.4 | 12.0 | ||||||
| Other |
4.9 | 5.2 | ||||||
|
|
|
|
|
|||||
| Total |
100.0 | % | 100.0 | % | ||||
|
|
|
|
|
|||||
The following table shows a comparison of net sales by distribution channel (dollars in thousands):
| Distribution Channel |
Fiscal 2016 | Fiscal 2015 | Change | Percent Change |
||||||||||||
| Consumer (1) |
$ | 561,191 | $ | 529,076 | $ | 32,115 | 6.1 | % | ||||||||
| Commercial Ingredients |
222,535 | 207,370 | 15,165 | 7.3 | ||||||||||||
| Contract Packaging |
137,053 | 114,799 | 22,254 | 19.4 | ||||||||||||
| Export (2) |
31,280 | 36,000 | (4,720 | ) | (13.1 | ) | ||||||||||
|
|
|
|
|
|
|
|
|
|||||||||
| Total |
$ | 952,059 | $ | 887,245 | $ | 64,814 | 7.3 | % | ||||||||
|
|
|
|
|
|
|
|
|
|||||||||
| (1) | Sales of branded products were approximately 35% and 32% of total consumer channel sales during fiscal 2016 and 2015, respectively. Fisher branded products were approximately 87% and 90% of branded sales during fiscal 2016 and 2015 respectively, with branded produce products accounting for the remaining branded product sales. |
25
| (2) | Export sales consist primarily of bulk products and consumer branded and private brand products. Consumer branded and private brand products accounted for approximately 60% and 65% of total sales in the export channel during fiscal 2016 and fiscal 2015, respectively. In fiscal 2017 we consolidated our bulk export business into our commercial ingredients channel and the remaining portion of our export consumer products business into our other sales channels. |
Net sales in the consumer distribution channel increased by 6.1% in dollars and 4.5% in sales volume in fiscal 2016 compared to fiscal 2015. IRi market data from June 2016 indicates that Fisher recipe nuts continue to be the branded market share leader in the overall recipe nut category. Total Fisher brand sales volume increased by 12.0% in fiscal 2016 compared to fiscal 2015 due primarily to new distribution gains and increased promotional activity. Sales volume for Fisher snack nuts and peanut butter increased a combined 21.0%, primarily as a result of increased promotional activity and new distribution gains. Fisher recipe nut sales volume increased 5.8% from fiscal 2015, primarily as a result of increased distribution to existing customers. A 41.0% increase in combined sales volume of Orchard Valley Harvest and Sunshine Country produce products due to new distribution gains also contributed to the sales volume increase. Private brand sales volume increased by 1.4% in fiscal 2016 compared to fiscal 2015.
Net sales in the commercial ingredients distribution channel increased by 7.3% in dollars and 6.9% in sales volume compared to fiscal 2015. The sales volume increase was primarily due to an increase in sales of peanuts to peanut oil stock crushers and to other peanut shellers and increased sales of cashew products to an existing customer. In August 2016, we were notified by a significant customer in the commercial ingredients sales channel of its intent to move some or all of its almond butter requirements to a vertically integrated almond butter supplier during our second quarter of fiscal 2017. Almond butter sales to this customer in fiscal 2016 were approximately $90.0 million while the gross profit margin on this business was substantially lower than our total gross profit margin for fiscal 2016. Although demand for almond butter has increased considerably in recent years, net sales in our commercial ingredients sales channel in fiscal 2017 will likely decline if this lost sales volume cannot be replaced through organic growth or expansion of products at existing customers.
Net sales in the contract packaging distribution channel increased by 19.4% in dollars and 10.4% in sales volume in fiscal 2016 compared to fiscal 2015. The sales volume increase was primarily due to increased sales with existing customers due in large part to new item introductions and increased promotional activity implemented by customers in this channel.
Net sales in the export distribution channel decreased 13.1% in dollars for fiscal 2016, though sales volume increased 15.6% compared to fiscal 2015. The sales volume increase was primarily due to increased sales of bulk walnuts.
Gross Profit
Gross profit increased 4.1% to $137.5 million in fiscal 2016 from $132.1 million in fiscal 2015. Our gross profit margin decreased to 14.4% of net sales for fiscal 2016 from 14.9% for fiscal 2015.
The increase in gross profit resulted primarily from increased sales volume. The decline in gross profit margin was primarily attributable to a decline in gross profit on sales of walnuts in the third quarter.
Operating Expenses
Total operating expenses for fiscal 2016 increased by $6.0 million to $86.2 million. Operating expenses as a percent of net sales were 9.0% for both fiscal 2016 and fiscal 2015.
Selling expenses for fiscal 2016 were $51.1 million, an increase of $1.5 million, or 3.0%, over the amount recorded for fiscal 2015. The increase was driven primarily by a $2.3 million increase in compensation-related expenses and a $0.5 million increase in
marketing and advertising expense. Partially offsetting these increases was a $1.7 million decrease in shipping expense driven primarily by decreasing fuel costs and an increase in customers using their own freight carriers to pick up their orders.
Administrative expenses for fiscal 2016 were $35.0 million, an increase of $4.5 million, or 14.8%, from the amount recorded for fiscal 2015 due primarily to a $3.3 million combined increase in both incentive and ordinary compensation-related expenses.
Income from Operations
Due to the factors discussed above, our income from our operations was $51.3 million, or 5.4% of net sales, for fiscal 2016, compared to $51.9 million, or 5.8% of net sales, for fiscal 2015.
Interest Expense
Interest expense was $3.5 million for fiscal 2016 compared to $4.0 million for fiscal 2015. The decrease in interest expense was due primarily to lower debt levels.
26
Rental and Miscellaneous Expense, Net
Net rental and miscellaneous expense was $1.4 million for fiscal 2016 compared to $3.0 million for fiscal 2015. The decrease was primarily due to repairs to the exterior of our office building located at the Elgin Site being completed during fiscal 2015 while no such repair expenses were incurred in fiscal 2016.
Income Tax Expense
Income tax expense was $16.1 million, or 34.6% of income before income taxes, for fiscal 2016 compared to $15.6 million, or 34.7% of income before income taxes, for fiscal 2015.
Net Income
Net income was $30.4 million, or $2.71 basic and $2.68 diluted per common share, for fiscal 2016, compared to $29.3 million, or $2.63 basic and $2.61 diluted per common share, for fiscal 2015, due to the factors discussed above.
Liquidity and Capital Resources
General
The primary uses of cash are to fund our current operations, fulfill contractual obligations, pursue our Strategic Plan and repay indebtedness. Also, various uncertainties could result in additional uses of cash. The primary sources of cash are results of operations and availability under our Credit Agreement, dated February 7, 2008 and subsequently amended most recently in July 2017 (as amended, the “Credit Facility”), that provides a revolving loan commitment and letter of credit subfacility. We anticipate that expected net cash flow generated from operations and amounts available pursuant to the Credit Facility will be sufficient to fund our operations for the next twelve months. Our available credit under our Credit Facility has allowed us to consummate business acquisitions, devote more funds to promote our branded products (especially our Fisher and Orchard Valley Harvest brands), reinvest in the Company through capital expenditures, develop new products, pay a special cash dividend the past five years, and explore other growth strategies outlined in our Strategic Plan.
Cash flows from operating activities have historically been driven by net income but are also significantly influenced by inventory requirements, which can change based upon fluctuations in both quantities and market prices of the various nuts and nut products we buy and sell. Current market trends in nut prices and crop estimates also impact nut procurement.
The following table sets forth certain cash flow information for the last three fiscal years (dollars in thousands):
| June 29, 2017 |
June 30, 2016 |
2017 to 2016 $ Change |
June 25, 2015 |
|||||||||||||
| Operating activities |
$ | 52,668 | $ | 89,248 | $ | (36,580 | ) | $ | 13,933 | |||||||
| Investing activities |
(10,543 | ) | (14,925 | ) | 4,382 | (14,281 | ) | |||||||||
| Financing activities |
(42,390 | ) | (74,049 | ) | 31,659 | 410 | ||||||||||
|
|
|
|
|
|
|
|
|
|||||||||
| Total cash flow |
$ | (265 | ) | $ | 274 | $ | (539 | ) | $ | 62 | ||||||
|
|
|
|
|
|
|
|
|
|||||||||
Operating Activities. Net cash provided by operating activities was $52.7 million in fiscal 2017, a decrease of $36.6 million compared to fiscal 2016. This decrease in operating cash flow was due primarily to a larger use of working capital for inventory in fiscal 2017 compared to fiscal 2016. Inventories increased $25.8 million in fiscal 2017 compared to a $41.4 million decrease in inventories in fiscal 2016. Partially offsetting this use of cash was a decrease in accounts receivable of $13.3 million in fiscal 2017 compared to an increase in accounts receivable of $2.5 million in fiscal 2016.
Net accounts receivable were $64.8 million at June 29, 2017, a decrease of $13.3 million, or 17.0%, from the balance at June 30, 2016. The decrease in net accounts receivable from June 30, 2016 to June 29, 2017 is due primarily to lower dollar sales in June 2017 compared to June 2016.
Total inventories were $182.4 million at June 29, 2017, an increase of $25.8 million, or 16.5% from the inventory balance at June 30, 2016. The increase was primarily due to larger quantities of pecans, almonds and peanuts on hand combined with higher acquisition costs for pecans and peanuts compared to fiscal 2016. Increased quantities of finished goods and work-in-process inventories also contributed to the increase in total inventories.
The weighted average cost per pound of raw nut and dried fruit input stocks on hand at June 29, 2017 increased by 5.5% compared to June 30, 2016 mainly due to higher acquisition costs for peanuts and all major tree nuts except almonds.
27
Net cash provided by operating activities was $89.2 million in fiscal 2016, an increase of $75.3 million compared to fiscal 2015. This increase was due primarily to a reduced use of working capital for inventory and accounts receivable in fiscal 2016 compared to fiscal 2015.
Net accounts receivable were $78.1 million at June 30, 2016, a slight increase of $2.5 million, or 3.2%, from the balance at June 25, 2015. The increase in net accounts receivable was due primarily to higher dollar sales in the month of June 2016 than in the month of June 2015.
Total inventories were $156.6 million at June 30, 2016, a decrease of $41.4 million, or 20.9%, from the inventory balance at June 25, 2015. This decrease was primarily driven by the decrease in walnut acquisition costs and lower amounts of finished goods and work-in-process inventories on hand.
The weighted average cost per pound of raw nut and dried fruit input stocks on hand at June 30, 2016 decreased by 31.6% compared to June 25, 2015 mainly due to significantly lower acquisition costs for walnuts and to a lesser extent almonds. Pounds of raw nut input stocks on hand at the end of June 30, 2016 increased by 8.6 million pounds, or 20.0%, when compared to the quantity of raw nut input stocks on hand at June 25, 2015, due primarily to increased quantities of peanuts and inshell walnuts. The weighted average cost per pound of finished goods on hand at June 30, 2016 decreased by 11.0% over the weighted average cost per pound of finished goods on hand at June 25, 2015 primarily due to the above noted decreased acquisition costs.
Investing Activities. Cash used in investing activities was $10.5 million in fiscal 2017. Capital expenditures accounted for a $10.9 million use of cash in fiscal 2017.
Cash used in investing activities was $14.9 million in fiscal 2016. Capital expenditures accounted for a $15.0 million use of cash in fiscal 2016.
Cash used in investing activities was $14.3 million in fiscal 2015. Capital expenditures accounted for a $14.4 million use of cash in fiscal 2015.
We expect total capital expenditures for equipment purchases and upgrades, facility maintenance and food safety enhancements for fiscal 2018 to be approximately $14 million. Absent any material acquisitions or other significant investments, we believe that cash on hand, combined with cash provided by operations and borrowings available under the Credit Facility, will be sufficient to meet the cash requirements for capital expenditures.
Financing Activities. Cash used in financing activities was $42.4 million during fiscal 2017. We paid two special dividends in fiscal 2017 for a combined total of $56.5 million. We repaid $3.5 million of long-term debt during fiscal 2017, $3.0 million of which was related to the Mortgage Facility (as defined below). Partially offsetting these uses in cash was a net increase in borrowings outstanding under our Credit Facility of $17.4 million during fiscal 2017 which occurred, in part, as a result of the increase in inventory.
Cash used in financing activities was $74.0 million during fiscal 2016. We paid a $22.5 million special dividend in December 2015. We repaid $3.4 million of long-term debt during fiscal 2016, $3.0 million of which was related to the Mortgage Facility (as defined below). In addition to these uses of cash there was a net decrease in borrowings outstanding under our Credit Facility of $49.1 million during fiscal 2016 which occurred in part as a result of the decrease in inventory.
Cash provided by financing activities was $0.4 million during fiscal 2015. We paid a $16.8 million special dividend in December 2014. We repaid $3.3 million of long-term debt during fiscal 2015, $3.0 million of which was related to the Mortgage Facility (as defined below). Offsetting these uses of cash was a net increase in borrowings outstanding under our Credit Facility of $20.6 million during fiscal 2015 which occurred in part as a result of the increase in inventory.
28
Financing Arrangements
On February 7, 2008, we entered into the Credit Facility with a bank group (the “Bank Lenders”) providing a $117.5 million revolving loan commitment and letter of credit subfacility. Also on February 7, 2008, we entered into a Loan Agreement with an insurance company (the “Mortgage Lender”) providing us with two term loans, one in the amount of $36.0 million (“Tranche A”) and the other in the amount of $9.0 million (“Tranche B”), for an aggregate amount of $45.0 million (the “Mortgage Facility”).
Credit Facility
The Credit Facility is secured by substantially all of our assets other than machinery and equipment, real property, and fixtures. The Mortgage Facility is secured by mortgages on essentially all of our owned real property located in Elgin, Illinois, Gustine, California and Garysburg, North Carolina (the “Encumbered Properties”).
On September 30, 2014, we entered into the Sixth Amendment to the Credit Facility (the “Sixth Amendment”) which extended the maturity date of the Credit Facility from July 15, 2016 to July 15, 2019 and reduced the interest rates charged for loan advances and letter of credit borrowings. The aggregate revolving loan commitment amount did not change. In addition, the Sixth Amendment allows the Company to, without obtaining Bank Lender consent, (i) make up to two cash dividends or distributions on our stock each fiscal year, or (ii) purchase, acquire, redeem or retire stock in any fiscal year, in any case, in an amount not to exceed $25.0 million, individually or in the aggregate, as long as the excess availability under the Credit Facility remains over $30.0 million after giving effect to any such dividend, distribution, purchase or redemption. The Sixth Amendment also increased the amount of permitted acquisitions from $50.0 million to $100.0 million and removed the annual limit on capital expenditures.
On July 7, 2016, we entered into the Seventh Amendment to Credit Agreement (the “Seventh Amendment”) which extended the maturity date of the Credit Agreement from July 15, 2019 to July 7, 2021, and reduced by twenty-five basis points the interest rates charged for loan advances and letter of credit borrowings. The unused line fee was reduced to 0.25% per annum. The aggregate revolving loan commitment remained unchanged. In addition, the Seventh Amendment allows the Company to, without obtaining Bank Lender consent, (i) make up to one cash dividend or distribution on our stock per quarter, or (ii) purchase, acquire, redeem or retire stock in any fiscal quarter, in any case, in an amount not to exceed $60.0 million in the aggregate per fiscal year, as long as no default or event of default exists and the excess availability under the Credit Agreement remains over $30.0 million immediately before and after giving effect to any such dividend, distribution, purchase or redemption. The Seventh Amendment also permits an additional 5% of outstanding accounts receivable from a major customer to be included as eligible in the borrowing base calculation and reduced the amount available for letter of credit usage to $10.0 million.
As of June 29, 2017, the weighted average interest rate for the Credit Facility was 3.11%. The terms of the Credit Facility contain covenants that, among other things, require us to restrict investments, indebtedness, acquisitions, certain sales of assets, cash dividends, transactions with affiliates, redemptions of capital stock and prepayment of indebtedness (if such prepayment, among other things, is of a subordinate debt). If loan availability under the borrowing base calculation falls below $25.0 million, we will be required to maintain a specified fixed charge coverage ratio, tested on a monthly basis until loan availability equals or exceeds $25.0 million for three consecutive months. All cash received from customers is required to be applied against the Credit Facility. The Bank Lenders have the option to accelerate and demand immediate repayment of our obligations under the Credit Facility in the event of default on the payments required under the Credit Facility, a change in control in the ownership of the Company, non-compliance with the financial covenant or upon the occurrence of certain other defaults by us under the Credit Facility (including a default under the Mortgage Facility). As of June 29, 2017, we were in compliance with all covenants under the Credit Facility and we currently expect to be in compliance with the financial covenant in the Credit Facility for the foreseeable future. As of June 29, 2017, we had $84.4 million of available credit under the Credit Facility. We would still be in compliance with all restrictive covenants under the Credit Facility if this entire amount were borrowed.
After the conclusion of the 2017 fiscal year, on July 7, 2017, we entered into the Eighth Amendment to Credit Agreement (the “Eighth Amendment”) which eliminated the quarterly restriction on cash dividends and distributions and allows the Company to, without obtaining lender consent, make up to four cash dividends or distributions on its stock per fiscal year, or purchase, acquire, redeem or retire its stock in any fiscal year, in an amount not to exceed $60.0 million in the aggregate per fiscal year, as long as no default or event of default exists and the excess availability under the Credit Agreement remains over $30.0 million immediately before and after giving effect to any such dividend, distribution, purchase or redemption.
Mortgage Facility
We are subject to interest rate resets for each of Tranche A and Tranche B. Specifically, on March 1, 2018 (the “Tranche A Reset Date” and the “Tranche B Reset Date”) and every two years thereafter, the Mortgage Lender may reset the interest rates for each of Tranche A and Tranche B, respectively, in its sole and absolute discretion. If the reset interest rate for Tranche A is unacceptable to us and we (i) do not have sufficient funds to repay amounts due with respect to Tranche A on the Tranche A Reset Date, or (ii) are unable to refinance amounts due with respect to Tranche A on the Tranche A Reset Date on terms more favorable than the reset interest rates, then, depending on the extent of the changes in the reset interest rates, our interest expense would increase.
29
The Mortgage Facility matures on March 1, 2023. Tranche A under the Mortgage Facility accrues interest at a fixed interest rate of 7.63% per annum, payable monthly. As mentioned above, such interest rate may be reset by the Mortgage Lender on the Tranche A Reset Date. Monthly principal payments in the amount of $0.2 million commenced on June 1, 2008. Tranche B under the Mortgage Facility accrues interest, as reset on March 1, 2016, at a floating rate of the greater of (i) one month LIBOR plus 3.50% per annum or (ii) 4.25%, payable monthly (the “Floating Rate”). The margin on such Floating Rate may be reset by the Mortgage Lender on each Tranche B Reset Date; provided, however, that the Mortgage Lender may also change the underlying index on each Tranche B Reset Date occurring on or after March 1, 2018. Monthly principal payments in the amount of $0.1 million commenced on June 1, 2008. We do not currently anticipate that any change in the Floating Rate or the underlying index will have a material adverse effect upon our business, financial condition or results of operations.
The terms of the Mortgage Facility contain covenants that require us to maintain a specified net worth of $110.0 million and maintain the Encumbered Properties. The Mortgage Lender is entitled to require immediate repayment of our obligations under the Mortgage Facility in the event we default in the payments required under the Mortgage Facility, non-compliance with the covenants or upon the occurrence of certain other defaults by us under the Mortgage Facility. As of June 29, 2017, we were in compliance with all covenants under the Mortgage Facility.
Selma Property
In September 2006, we sold our Selma, Texas properties (the “Selma Properties”) to two related party partnerships for $14.3 million and are leasing them back. The selling price was determined by an independent appraiser to be the fair market value which also approximated our carrying value. The lease for the Selma Properties has a ten-year term at a fair market value rent with three five-year renewal options. Also, we currently have an option to purchase the Selma Properties from the partnerships at 95% (100% in certain circumstances) of the then fair market value, but not less than the original $14.3 million purchase price. The provisions of the arrangement are not eligible for sale-leaseback accounting and the $14.3 million was recorded as a debt obligation. No gain or loss was recorded on the Selma Properties transaction. As of June 29, 2017, $11.1 million of the debt obligation was outstanding.
In September 2015, we exercised two five-year renewal options which extended the Selma lease to September 18, 2026 (unless we purchase it before such date) and reduced the base monthly lease amount we pay on the Selma Properties during the second quarter of fiscal 2017.
30
Off-Balance Sheet Arrangements
As of June 29, 2017, we were not involved in any off-balance sheet arrangements, as defined in Item 303(a)(4)(ii) of Regulation S-K promulgated by the SEC.
Contractual Cash Obligations
At June 29, 2017, we had the following contractual cash obligations for long-term debt (including scheduled interest payments), operating leases, the Credit Facility, purchase obligations, retirement plans and other long-term liabilities (amounts in this subsection in thousands):
| Total | Less Than 1 Year |
1-3 Years |
3-5 Years |
More Than 5 Years |
||||||||||||||||
| Long-term debt obligations (1) |
$ | 38,947 | $ | 5,376 | $ | 10,128 | $ | 9,293 | $ | 14,150 | ||||||||||
| Minimum operating lease commitments |
2,138 | 969 | 950 | 213 | 6 | |||||||||||||||
| Revolving credit facility borrowings |
29,456 | 29,456 | — | — | — | |||||||||||||||
| Purchase obligations (2) |
177,842 | 177,842 | — | — | — | |||||||||||||||
| Retirement plans (3) |
22,105 | 745 | 1,438 | 1,597 | 18,325 | |||||||||||||||
|
|
|
|
|
|
|
|
|
|
|
|||||||||||
| Total contractual cash obligations |
$ | 270,488 | $ | 214,388 | $ | 12,516 | $ | 11,103 | $ | 32,481 | ||||||||||
|
|
|
|
|
|
|
|
|
|
|
|||||||||||
| (1) | Interest obligations on floating rate debt instruments are calculated using interest rates in effect at June 29, 2017. See Note 5 “Long-Term Debt” of the Notes to Consolidated Financial Statements for further detail on the Company’s long-term debt obligations. |
| (2) | The purchase obligations represent $177,842 of inventory purchase commitments; however, these amounts exclude purchase commitments under walnut purchase agreements due to the uncertainty of pricing and quantity. |
| (3) | Represents projected retirement obligations. See Note 11-“Employee Benefit Plans” and Note 12-“Retirement Plan” of the Notes to Consolidated Financial Statements for further details. |
31
Critical Accounting Policies and Estimates
Our financial statements are prepared in accordance with accounting principles generally accepted in the United States of America. The accounting policies as disclosed in the Notes to Consolidated Financial Statements are applied in the preparation of our financial statements and accounting for the underlying transactions and balances. The policies discussed below are considered by our management to be critical for an understanding of our financial statements because the application of these policies places the most significant demands on management’s judgment, with financial reporting results relying on estimation regarding the effect of matters that are inherently uncertain. Specific risks, if applicable, for these critical accounting policies are described in the following paragraphs. For a detailed discussion on the application of these and other accounting policies, see Note 1-“Significant Accounting Policies” of the Notes to Consolidated Financial Statements.
Preparation of this Annual Report on Form 10-K requires us to make estimates and assumptions that affect the reported amounts of assets and liabilities, disclosures of contingent assets and liabilities at the date of our financial statements, and the reported amounts of revenue and expenses during the reporting period. Actual results may differ from those estimates. See “Forward-Looking Statements” below.
Revenue Recognition
We recognize revenue when persuasive evidence of an arrangement exists, title has transferred (based upon terms of shipment), price is fixed, delivery occurs and collection is reasonably assured. We sell our products under some arrangements, which include customer contracts that fix the sales price for periods, which typically can be up to one year for some commercial ingredient customers, and through specific programs consisting of promotion allowances, volume and customer rebates and marketing allowances, among others, to consumer and some commercial ingredient users. Reserves for these programs are established based upon the terms of specific arrangements. Revenues are recorded net of rebates and promotion and marketing allowances. Revenues are also recorded net of expected customer deductions which are provided for based upon past experiences. While customers do have the right to return products, past experience has demonstrated that product returns have generally been insignificant. Provisions for returns are reflected as a reduction in net sales and are estimated based upon customer specific circumstances. Evaluating these estimates requires our management’s judgment, and changes in our assumptions could impact the amount recorded for our sales, cost of sales and net income.
Inventories
Inventories, which consist principally of inshell bulk-stored nuts, shelled nuts, dried fruit and processed and packaged nut products, are stated at the lower of cost (first-in, first-out) or market which approximates actual cost. Inventory costs are reviewed at least quarterly. Fluctuations in the market price of pecans, peanuts, walnuts, almonds and other nuts may affect the value of inventory and gross profit and gross profit margin. When expected market sales prices move below costs, we record adjustments to write down the carrying values of inventories to the lower of cost (first-in, first-out) or market which approximates actual cost. No such adjustments have been required in any of the periods presented. The results of our shelling process can also result in changes to our inventory costs based upon actual versus expected crop yields. We maintain significant inventories of bulk-stored inshell pecans, peanuts and walnuts. Quantities of inshell bulk-stored nuts are determined based upon our inventory systems and are subject to verification techniques including observation, weighing and other methods. The quantities of each crop year bulk-stored nut inventories are generally shelled out over a ten to fifteen-month period, at which time revisions to any estimates, which historically averaged less than 1.0% of inventory purchases, are also recorded.
We enter into walnut purchase agreements with growers typically in our first fiscal quarter, under which they deliver their walnut crop to us during the fall harvest season (which typically occurs in our first and second fiscal quarters), and pursuant to our walnut purchase agreements, we determine the final price for this inventory after receipt and typically by the end of our third fiscal quarter. Since the ultimate purchase price to be paid is determined subsequent to receiving the walnut crop, we typically estimate the final purchase price for our first and second quarter interim financial statements based on crop size, quality, current market prices and other factors. Any such changes in estimates, which could be significant, are accounted for in the period of change by adjusting inventory on hand or cost of goods sold if the inventory has been sold. Changes in estimates may affect the ending inventory balances, as well as gross profit. There were no significant adjustments recorded in any of the periods presented.
Impairment of Long-Lived Assets
We review held and used long-lived assets, including our rental investment property and amortizable identifiable intangible assets, to assess recoverability from projected undiscounted cash flows whenever events or changes in facts and circumstances indicate that the carrying value of the assets may not be recoverable. When such events occur, we compare the sum of the undiscounted cash flows expected to result from the use and eventual disposition of the asset or asset group to the carrying amount of the long-lived asset or asset group. The cash flows are based on our best estimate of future cash flows derived from the most recent business projections. If this comparison indicates there is an impairment, the carrying value of the asset is reduced to its estimated fair value. We did not record any impairment of long-lived assets in any of the last three fiscal years.
32
Income Taxes
We account for income taxes using an asset and liability approach that requires the recognition of deferred tax assets and liabilities for the expected future tax consequences of events that have been reported in our financial statements or tax returns. Such items give rise to differences in the financial reporting and tax basis of assets and liabilities. A valuation allowance is recorded to reduce the carrying amount of deferred tax assets if it is more likely than not that all or a portion of the asset will not be realized. In estimating future tax consequences, we consider all expected future events other than changes in tax law or rates.
We record liabilities for uncertain income tax positions based on a two-step process. The first step is recognition, where we evaluate whether an individual tax position has a likelihood of greater than 50% of being sustained upon examination based on the technical merits of the position, including resolution of any related appeals or litigation processes. For tax positions that are currently estimated to have a less than 50% likelihood of being sustained, no tax benefit is recorded. For tax positions that have met the recognition threshold in the first step, we perform the second step of measuring the benefit to be recorded. The actual benefits ultimately realized may differ from our estimates. In future periods, changes in facts, circumstances, and new information may require us to change the recognition and measurement estimates with regard to individual tax positions. Changes in recognition and measurement estimates are recorded in results of operations and financial position in the period in which such changes occur.
We recognize interest and penalties accrued related to unrecognized tax benefits in the Income tax expense caption in the Consolidated Statement of Comprehensive Income.
We evaluate the realization of deferred tax assets by considering our historical taxable income and future taxable income based upon the reversal of deferred tax liabilities. As of June 29, 2017, we believe that our deferred tax assets are fully realizable, except for $171 of net basis differences for which we have provided a valuation allowance.
Retirement Plan
In order to measure the annual expense and calculate the liability associated with our retirement plan, management must make a variety of estimates including, but not limited to, discount rates, compensation increases and anticipated mortality rates. The estimates used by management are based on our historical experience as well as current facts and circumstances. We use a third-party specialist to assist management in appropriately measuring the expense associated with this employment-related benefit. Different estimates used by management could result in us recognizing different amounts of expense over different periods of time.
We recognize net actuarial gains or losses in excess of 10% of the plan’s projected benefit obligation into current period expense over the average remaining expected service period of active participants.
One significant assumption for pension plan accounting is the discount rate. We select a discount rate each year (as of our fiscal year-end measurement date) for our plan based upon a hypothetical corporate bond portfolio for which the cash flows match the year-by-year projected benefit cash flows for our pension plan. The hypothetical bond portfolio is comprised of high-quality fixed income debt securities (usually Moody’s Aa3 or higher) available at the measurement date. Based on this information, the discount rate selected by us for determination of pension expense was 3.61% for fiscal 2017, 4.63% for fiscal 2016, and 4.37% for fiscal 2015. A 25-basis point increase or decrease in our discount rate assumption for fiscal 2017 would have resulted in an immaterial change in our pension expense for fiscal 2017. For our year-end pension obligation determination, we selected discount rates of 3.99% and 3.61% for fiscal years 2017 and 2016, respectively.
The rate of compensation increase is another significant assumption used in the development of accounting information for pension plans. We determine this assumption based on our long-term plans for compensation increases and current economic conditions. Based on this information, we selected 4.5% for both fiscal years 2017 and 2016 as the rate of compensation increase for determining our year-end pension obligation. We also used 4.5% for the rate of compensation increase for determination of pension expense for each of fiscal years 2017, 2016, and 2015.
The RP-2014 white collar fully generational mortality table with mortality improvement scale MP-2016 published by the Society of Actuaries Retirement Plan Experience Committee was utilized in the preparation of our pension obligation as of June 29, 2017.
33
Recent Accounting Pronouncements
Refer to Note 1 — “Significant Accounting Policies” of the Notes to Consolidated Financial Statements for a discussion of recently issued accounting pronouncements.
Forward-Looking Statements
The statements contained in this Annual Report on Form 10-K, and in the Chief Executive Officer’s letter to stockholders accompanying the Annual Report on Form 10-K delivered to stockholders, that are not historical (including statements concerning our expectations regarding market risk) are “forward-looking statements.” These forward-looking statements may be followed (and therefore identified) by a cross reference to Part I, Item 1A — “Risk Factors” or may be otherwise identified by the use of forward-looking words and phrases such as “will”, “anticipates”, “intends”, “may”, “believes”, “should” and “expects”, and they are based on our current expectations or beliefs concerning future events and involve risks and uncertainties. We undertake no obligation to update publicly or otherwise revise any forward-looking statements, whether as a result of new information, future events or other factors that affect the subject of these statements, except where expressly required to do so by law. We caution that such statements are qualified by important factors, including the factors described in Part I, Item 1A — “Risk Factors” and other factors, risks and uncertainties that are beyond our control, that could cause results to differ materially from our current expectations and/or those in the forward-looking statements, as well as the timing and occurrence (or nonoccurrence) of transactions and other factors, risk, uncertainties and events which may be subject to circumstances beyond our control. Consequently, results actually achieved may differ materially from the expected results included in these statements.
Item 7A — Quantitative and Qualitative Disclosures About Market Risk
We are exposed to the impact of changes in interest rates, commodity prices of raw material purchases and foreign exchange. We have not entered into any arrangements to hedge against changes in market interest rates, commodity prices or foreign currency fluctuations.
We are unable to engage in hedging activity related to commodity prices, because there are no established futures markets for nuts; therefore, we can only attempt to pass on the commodity cost increases in the form of price increases to our customers. A hypothetical 1% increase in material costs, without a corresponding price increase, would have decreased gross profit approximately $5.9 million for fiscal 2017. See Part I, Item 1A — “Risk Factors” for a further discussion of the risks and uncertainties related to commodity prices of raw materials and the impact thereof on our business.
Approximately 41% of the dollar value of our total nut purchases for fiscal 2017 were made from foreign countries, and while these purchases were payable in U.S. dollars, the underlying costs may fluctuate with changes in the value of the U.S. dollar relative to the currency in the foreign country from where the nuts are purchased, or to other major foreign currencies such as the euro.
We are exposed to interest rate risk on our Credit Facility, our only variable rate credit facility; because we have not entered into any hedging instruments which fix the floating rate or offset an increase in the floating rate. A hypothetical 10% adverse change in weighted-average interest rates would have had less than a $0.1 million impact on our net income and cash flows from operating activities for fiscal 2017. In addition, the fixed interest rate on our Mortgage Facility resets in our 2018 fiscal year and in the future as well.
34
Item 8 — Financial Statements and Supplementary Data
Report of Independent Registered Public Accounting Firm
To the Board of Directors and Stockholders of John B. Sanfilippo & Son, Inc.
In our opinion, the accompanying consolidated balance sheets and the related consolidated statements of comprehensive income, stockholders’ equity and cash flows present fairly, in all material respects, the financial position of John B. Sanfilippo & Son, Inc. and its subsidiaries as of June 29, 2017 and June 30, 2016, and the results of their operations and their cash flows for each of the three years in the period ended June 29, 2017 in conformity with accounting principles generally accepted in the United States of America. Also in our opinion, the Company maintained, in all material respects, effective internal control over financial reporting as of June 29, 2017, based on criteria established in Internal Control—Integrated Framework (2013) issued by the Committee of Sponsoring Organizations of the Treadway Commission (COSO). The Company’s management is responsible for these financial statements, for maintaining effective internal control over financial reporting and for its assessment of the effectiveness of internal control over financial reporting, included in Management’s Report on Internal Control over Financial Reporting appearing under Item 9A. Our responsibility is to express opinions on these financial statements and on the Company’s internal control over financial reporting based on our integrated audits. We conducted our audits in accordance with the standards of the Public Company Accounting Oversight Board (United States). Those standards require that we plan and perform the audits to obtain reasonable assurance about whether the financial statements are free of material misstatement and whether effective internal control over financial reporting was maintained in all material respects. Our audits of the financial statements included examining, on a test basis, evidence supporting the amounts and disclosures in the financial statements, assessing the accounting principles used and significant estimates made by management, and evaluating the overall financial statement presentation. Our audit of internal control over financial reporting included obtaining an understanding of internal control over financial reporting, assessing the risk that a material weakness exists, and testing and evaluating the design and operating effectiveness of internal control based on the assessed risk. Our audits also included performing such other procedures as we considered necessary in the circumstances. We believe that our audits provide a reasonable basis for our opinions.
As discussed in Note 1 to the consolidated financial statements, the Company changed the manner in which it accounts for stock-based compensation and the manner in which it accounts for debt issuance costs in 2017.
A company’s internal control over financial reporting is a process designed to provide reasonable assurance regarding the reliability of financial reporting and the preparation of financial statements for external purposes in accordance with generally accepted accounting principles. A company’s internal control over financial reporting includes those policies and procedures that (i) pertain to the maintenance of records that, in reasonable detail, accurately and fairly reflect the transactions and dispositions of the assets of the company; (ii) provide reasonable assurance that transactions are recorded as necessary to permit preparation of financial statements in accordance with generally accepted accounting principles, and that receipts and expenditures of the company are being made only in accordance with authorizations of management and directors of the company; and (iii) provide reasonable assurance regarding prevention or timely detection of unauthorized acquisition, use, or disposition of the company’s assets that could have a material effect on the financial statements.
Because of its inherent limitations, internal control over financial reporting may not prevent or detect misstatements. Also, projections of any evaluation of effectiveness to future periods are subject to the risk that controls may become inadequate because of changes in conditions, or that the degree of compliance with the policies or procedures may deteriorate.
/s/ PricewaterhouseCoopers LLP
Chicago, Illinois
August 23, 2017
35
JOHN B. SANFILIPPO & SON, INC.
CONSOLIDATED BALANCE SHEETS
June 29, 2017 and June 30, 2016
(dollars in thousands, except share and per share amounts)
| June 29, 2017 |
June 30, 2016 |
|||||||
| ASSETS |
||||||||
| CURRENT ASSETS: |
||||||||
| Cash |
$ | 1,955 | $ | 2,220 | ||||
| Accounts receivable, less allowance for doubtful accounts of $263 and $397, respectively |
64,830 | 78,088 | ||||||
| Inventories |
182,420 | 156,573 | ||||||
| Prepaid expenses and other current assets |
4,172 | 5,292 | ||||||
|
|
|
|
|
|||||
| TOTAL CURRENT ASSETS |
253,377 | 242,173 | ||||||
|
|
|
|
|
|||||
| PROPERTY, PLANT AND EQUIPMENT: |
||||||||
| Land |
9,285 | 9,285 | ||||||
| Buildings |
107,015 | 106,505 | ||||||
| Machinery and equipment |
194,099 | 188,748 | ||||||
| Furniture and leasehold improvements |
4,842 | 4,349 | ||||||
| Vehicles |
498 | 453 | ||||||
| Construction in progress |
1,075 | 832 | ||||||
|
|
|
|
|
|||||
| 316,814 | 310,172 | |||||||
| Less: Accumulated depreciation |
210,606 | 200,416 | ||||||
|
|
|
|
|
|||||
| 106,208 | 109,756 | |||||||
| Rental investment property, less accumulated depreciation of $9,639 and $8,847, respectively |
19,254 | 20,047 | ||||||
|
|
|
|
|
|||||
| TOTAL PROPERTY, PLANT AND EQUIPMENT |
125,462 | 129,803 | ||||||
|
|
|
|
|
|||||
| OTHER LONG TERM ASSETS: |
||||||||
| Cash surrender value of officers’ life insurance and other assets |
10,125 | 9,227 | ||||||
| Deferred income taxes |
9,095 | 8,590 | ||||||
| Intangible assets, net |
— | 1,369 | ||||||
|
|
|
|
|
|||||
| TOTAL ASSETS |
$ | 398,059 | $ | 391,162 | ||||
|
|
|
|
|
|||||
The accompanying notes are an integral part of these consolidated financial statements.
36
JOHN B. SANFILIPPO & SON, INC.
CONSOLIDATED BALANCE SHEETS
June 29, 2017 and June 30, 2016
(dollars in thousands, except share and per share amounts)
| June 29, 2017 |
June 30, 2016 |
|||||||
| LIABILITIES & STOCKHOLDERS’ EQUITY |
||||||||
| CURRENT LIABILITIES: |
||||||||
| Revolving credit facility borrowings |
$ | 29,456 | $ | 12,084 | ||||
| Current maturities of long-term debt, including related party debt of $474 and $407, respectively and net of unamortized debt issuance costs of $55 and $65, respectively |
3,418 | 3,342 | ||||||
| Accounts payable, including related party payables of $178 and $113, respectively |
50,047 | 43,719 | ||||||
| Bank overdraft |
932 | 811 | ||||||
| Accrued payroll and related benefits |
15,958 | 16,045 | ||||||
| Other accrued expenses |
10,062 | 7,193 | ||||||
|
|
|
|
|
|||||
| TOTAL CURRENT LIABILITIES |
109,873 | 83,194 | ||||||
|
|
|
|
|
|||||
| LONG-TERM LIABILITIES: |
||||||||
| Long-term debt, less current maturities, including related party debt of $10,584 and $11,133, respectively and net of unamortized debt issuance costs of $124 and $179, respectively |
25,211 | 28,704 | ||||||
| Retirement plan |
20,994 | 22,137 | ||||||
| Other |
6,513 | 5,934 | ||||||
|
|
|
|
|
|||||
| TOTAL LONG-TERM LIABILITIES |
52,718 | 56,775 | ||||||
|
|
|
|
|
|||||
| TOTAL LIABILITIES |
162,591 | 139,969 | ||||||
|
|
|
|
|
|||||
| COMMITMENTS AND CONTINGENCIES |
||||||||
| STOCKHOLDERS’ EQUITY: |
||||||||
| Class A Common Stock, convertible to Common Stock on a per share basis, cumulative voting rights of ten votes per share, $.01 par value; 10,000,000 shares authorized, 2,597,426 shares issued and outstanding |
26 | 26 | ||||||
| Common Stock, non-cumulative voting rights of one vote per share, $.01 par value; 17,000,000 shares authorized, 8,801,641 and 8,725,715 shares issued, respectively |
88 | 87 | ||||||
| Capital in excess of par value |
117,772 | 115,136 | ||||||
| Retained earnings |
123,190 | 143,573 | ||||||
| Accumulated other comprehensive loss |
(4,404 | ) | (6,425 | ) | ||||
| Treasury stock, at cost; 117,900 shares of Common Stock |
(1,204 | ) | (1,204 | ) | ||||
|
|
|
|
|
|||||
| TOTAL STOCKHOLDERS’ EQUITY |
235,468 | 251,193 | ||||||
|
|
|
|
|
|||||
| TOTAL LIABILITIES & STOCKHOLDERS’ EQUITY |
$ | 398,059 | $ | 391,162 | ||||
|
|
|
|
|
|||||
The accompanying notes are an integral part of these consolidated financial statements.
37
JOHN B. SANFILIPPO & SON, INC.
CONSOLIDATED STATEMENTS OF COMPREHENSIVE INCOME
For the years ended June 29, 2017, June 30, 2016 and June 25, 2015
(dollars in thousands, except share and per share amounts)
| Year Ended June 29, 2017 (52 Weeks) |
Year Ended June 30, 2016 (53 Weeks) |
Year Ended June 25, 2015 (52 Weeks) |
||||||||||
| Net sales |
$ | 846,635 | $ | 952,059 | $ | 887,245 | ||||||
| Cost of sales |
704,712 | 814,591 | 755,189 | |||||||||
|
|
|
|
|
|
|
|||||||
| Gross profit |
141,923 | 137,468 | 132,056 | |||||||||
|
|
|
|
|
|
|
|||||||
| Operating expenses: |
||||||||||||
| Selling expenses |
49,392 | 51,114 | 49,646 | |||||||||
| Administrative expenses |
34,187 | 35,042 | 30,531 | |||||||||
|
|
|
|
|
|
|
|||||||
| Total operating expenses |
83,579 | 86,156 | 80,177 | |||||||||
|
|
|
|
|
|
|
|||||||
| Income from operations |
58,344 | 51,312 | 51,879 | |||||||||
|
|
|
|
|
|
|
|||||||
| Other expense: |
||||||||||||
| Interest expense including $785, $1,081 and $1,110 to related parties, respectively |
2,910 | 3,492 | 3,966 | |||||||||
| Rental and miscellaneous expense, net |
1,296 | 1,358 | 3,049 | |||||||||
|
|
|
|
|
|
|
|||||||
| Total other expense, net |
4,206 | 4,850 | 7,015 | |||||||||
|
|
|
|
|
|
|
|||||||
| Income before income taxes |
54,138 | 46,462 | 44,864 | |||||||||
| Income tax expense |
18,013 | 16,067 | 15,559 | |||||||||
|
|
|
|
|
|
|
|||||||
| Net income |
36,125 | 30,395 | 29,305 | |||||||||
| Other comprehensive income (loss), net of tax: |
||||||||||||
| Amortization of prior service cost and actuarial gain included in net periodic pension cost |
820 | 624 | 584 | |||||||||
| Net actuarial gain (loss) arising during the period |
1,201 | (2,215 | ) | (1,915 | ) | |||||||
|
|
|
|
|
|
|
|||||||
| Other comprehensive income (loss), net of tax |
2,021 | (1,591 | ) | (1,331 | ) | |||||||
|
|
|
|
|
|
|
|||||||
| Comprehensive income |
$ | 38,146 | $ | 28,804 | $ | 27,974 | ||||||
|
|
|
|
|
|
|
|||||||
| Net income per common share — basic |
$ | 3.19 | $ | 2.71 | $ | 2.63 | ||||||
|
|
|
|
|
|
|
|||||||
| Net income per common share — diluted |
$ | 3.17 | $ | 2.68 | $ | 2.61 | ||||||
|
|
|
|
|
|
|
|||||||
| Cash dividends declared per share |
$ | 5.00 | $ | 2.00 | $ | 1.50 | ||||||
|
|
|
|
|
|
|
|||||||
| Weighted average shares outstanding — basic |
11,317,149 | 11,233,975 | 11,150,658 | |||||||||
|
|
|
|
|
|
|
|||||||
| Weighted average shares outstanding — diluted |
11,403,605 | 11,332,924 | 11,248,259 | |||||||||
|
|
|
|
|
|
|
|||||||
The accompanying notes are an integral part of these consolidated financial statements
38
JOHN B. SANFILIPPO & SON, INC.
CONSOLIDATED STATEMENTS OF STOCKHOLDERS’ EQUITY
For the years ended June 29, 2017, June 30, 2016 and June 25, 2015
(dollars in thousands, except per share amounts)
| Class A Common Stock |
Common Stock | Capital in Excess of Par Value |
Retained Earnings |
Accumulated Other Comprehensive Loss |
Treasury Stock |
Total | ||||||||||||||||||||||||||||||
| Shares | Amount | Shares | Amount | |||||||||||||||||||||||||||||||||
| Balance, June 26, 2014 |
2,597,426 | $ | 26 | 8,569,105 | $ | 85 | $ | 108,305 | $ | 123,118 | $ | (3,503 | ) | $ | (1,204 | ) | $ | 226,827 | ||||||||||||||||||
| Net income |
29,305 | 29,305 | ||||||||||||||||||||||||||||||||||
| Cash dividends ($1.50 per common share) |
(16,759 | ) | (16,759 | ) | ||||||||||||||||||||||||||||||||
| Pension liability amortization, net of income tax expense of $373 |
584 | 584 | ||||||||||||||||||||||||||||||||||
| Pension liability adjustment, net of income tax benefit of $1,224 |
(1,915 | ) | (1,915 | ) | ||||||||||||||||||||||||||||||||
| Equity award exercises |
94,375 | 1 | 1,283 | 1,284 | ||||||||||||||||||||||||||||||||
| Stock-based compensation expense |
1,952 | 1,952 | ||||||||||||||||||||||||||||||||||
|
|
|
|
|
|
|
|
|
|
|
|
|
|
|
|
|
|
|
|||||||||||||||||||
| Balance, June 25, 2015 |
2,597,426 | $ | 26 | 8,663,480 | $ | 86 | $ | 111,540 | $ | 135,664 | $ | (4,834 | ) | $ | (1,204 | ) | $ | 241,278 | ||||||||||||||||||
| Net income |
30,395 | 30,395 | ||||||||||||||||||||||||||||||||||
| Cash dividends ($2.00 per common share) |
(22,486 | ) | (22,486 | ) | ||||||||||||||||||||||||||||||||
| Pension liability amortization, net of income tax expense of $383 |
624 | 624 | ||||||||||||||||||||||||||||||||||
| Pension liability adjustment, net of income tax benefit of $1,358 |
(2,215 | ) | (2,215 | ) | ||||||||||||||||||||||||||||||||
| Equity award exercises |
62,235 | 1 | 1,107 | 1,108 | ||||||||||||||||||||||||||||||||
| Stock-based compensation expense |
2,489 | 2,489 | ||||||||||||||||||||||||||||||||||
|
|
|
|
|
|
|
|
|
|
|
|
|
|
|
|
|
|
|
|||||||||||||||||||
| Balance, June 30, 2016 |
2,597,426 | $ | 26 | 8,725,715 | $ | 87 | $ | 115,136 | $ | 143,573 | $ | (6,425 | ) | $ | (1,204 | ) | $ | 251,193 | ||||||||||||||||||
| Net income |
36,125 | 36,125 | ||||||||||||||||||||||||||||||||||
| Cash dividends ($5.00 per common share) |
(56,464 | ) | (56,464 | ) | ||||||||||||||||||||||||||||||||
| Pension liability amortization, net of income tax expense of $502 |
820 | 820 | ||||||||||||||||||||||||||||||||||
| Pension liability adjustment, net of income tax expense of $737 |
1,201 | 1,201 | ||||||||||||||||||||||||||||||||||
| Equity award exercises |
75,926 | 1 | 62 | 63 | ||||||||||||||||||||||||||||||||
| Stock-based compensation expense |
2,504 | 2,504 | ||||||||||||||||||||||||||||||||||
| Effect of adopting ASU 2016-09 |
70 | (44 | ) | 26 | ||||||||||||||||||||||||||||||||
|
|
|
|
|
|
|
|
|
|
|
|
|
|
|
|
|
|
|
|||||||||||||||||||
| Balance, June 29, 2017 |
2,597,426 | $ | 26 | 8,801,641 | $ | 88 | $ | 117,772 | $ | 123,190 | $ | (4,404 | ) | $ | (1,204 | ) | $ | 235,468 | ||||||||||||||||||
|
|
|
|
|
|
|
|
|
|
|
|
|
|
|
|
|
|
|
|||||||||||||||||||
The accompanying notes are an integral part of these consolidated financial statements.
39
JOHN B. SANFILIPPO & SON, INC.
CONSOLIDATED STATEMENTS OF CASH FLOWS
For the years ended June 29, 2017, June 30, 2016 and June 25, 2015
(dollars in thousands)
| Year Ended June 29, 2017 (52 Weeks) |
Year Ended June 30, 2016 (53 Weeks) |
Year Ended June 25, 2015 (52 Weeks) |
||||||||||
| CASH FLOWS FROM OPERATING ACTIVITIES: |
||||||||||||
| Net income |
$ | 36,125 | $ | 30,395 | $ | 29,305 | ||||||
| Depreciation and amortization |
15,559 | 16,585 | 16,284 | |||||||||
| Loss on disposition of properties, net |
71 | 392 | 100 | |||||||||
| Deferred income tax benefit |
(1,744 | ) | (170 | ) | (2,384 | ) | ||||||
| Stock-based compensation expense |
2,504 | 2,489 | 1,952 | |||||||||
| Change in assets and liabilities: |
||||||||||||
| Accounts receivable, net |
13,243 | (2,436 | ) | (19,862 | ) | |||||||
| Inventories |
(25,847 | ) | 41,424 | (15,167 | ) | |||||||
| Prepaid expenses and other current assets |
201 | (19 | ) | (1,587 | ) | |||||||
| Accounts payable |
6,384 | (1,126 | ) | 307 | ||||||||
| Accrued expenses |
1,484 | 421 | 1,798 | |||||||||
| Income taxes receivable/payable |
2,217 | (805 | ) | 2,495 | ||||||||
| Other long-term liabilities |
579 | (443 | ) | 862 | ||||||||
| Other long-term assets |
(266 | ) | 767 | (1,541 | ) | |||||||
| Other, net |
2,158 | 1,774 | 1,371 | |||||||||
|
|
|
|
|
|
|
|||||||
| Net cash provided by operating activities |
52,668 | 89,248 | 13,933 | |||||||||
|
|
|
|
|
|
|
|||||||
| CASH FLOWS FROM INVESTING ACTIVITIES: |
||||||||||||
| Purchases of property, plant and equipment |
(10,885 | ) | (15,018 | ) | (14,392 | ) | ||||||
| Proceeds from disposition of assets |
1 | 1 | 90 | |||||||||
| Other, net |
341 | 92 | 21 | |||||||||
|
|
|
|
|
|
|
|||||||
| Net cash used in investing activities |
(10,543 | ) | (14,925 | ) | (14,281 | ) | ||||||
|
|
|
|
|
|
|
|||||||
| CASH FLOWS FROM FINANCING ACTIVITIES: |
||||||||||||
| Borrowings under revolving credit facilities |
340,229 | 316,945 | 339,684 | |||||||||
| Repayments of revolving credit borrowings |
(322,857 | ) | (366,014 | ) | (319,073 | ) | ||||||
| Principal payments on long-term debt |
(3,482 | ) | (3,376 | ) | (3,349 | ) | ||||||
| Increase (decrease) in bank overdraft |
121 | (226 | ) | (1,377 | ) | |||||||
| Dividends paid |
(56,464 | ) | (22,486 | ) | (16,759 | ) | ||||||
| Proceeds from the exercise of stock options |
63 | 155 | 643 | |||||||||
| Tax benefit of equity award exercises |
— | 953 | 641 | |||||||||
|
|
|
|
|
|
|
|||||||
| Net cash (used in) provided by financing activities |
(42,390 | ) | (74,049 | ) | 410 | |||||||
|
|
|
|
|
|
|
|||||||
| NET (DECREASE) INCREASE IN CASH |
(265 | ) | 274 | 62 | ||||||||
| Cash, beginning of period |
2,220 | 1,946 | 1,884 | |||||||||
|
|
|
|
|
|
|
|||||||
| Cash, end of period |
$ | 1,955 | $ | 2,220 | $ | 1,946 | ||||||
|
|
|
|
|
|
|
|||||||
| Supplemental disclosures of cash flow information: |
||||||||||||
| Interest paid |
$ | 2,763 | $ | 3,326 | $ | 3,760 | ||||||
| Income taxes paid, excluding refunds of $232, $168, and $548, respectively |
17,635 | 16,526 | 15,288 | |||||||||
The accompanying notes are an integral part of these consolidated financial statements.
40
JOHN B. SANFILIPPO & SON, INC.
NOTES TO CONSOLIDATED FINANCIAL STATEMENTS
(dollars in thousands, except per share data)
NOTE 1 — SIGNIFICANT ACCOUNTING POLICIES
Basis of Presentation and Consolidation and Description of Business
Our consolidated financial statements include the accounts of John B. Sanfilippo & Son, Inc., and our wholly-owned subsidiary, JBSS Ventures, LLC. Our fiscal year ends on the last Thursday of June each year, and typically consists of fifty-two weeks (four thirteen week quarters). However, the fiscal year ended June 30, 2016 consisted of fifty-three weeks with our fourth quarter containing fourteen weeks. The accompanying consolidated financial statements and related footnotes are presented in accordance with accounting principles generally accepted in the United States of America (“GAAP”).
We are one of the leading processors and distributors of peanuts, pecans, cashews, walnuts, almonds and other nuts in the United States. These nuts are sold under a variety of private brands and under the Fisher, Orchard Valley Harvest and Sunshine Country brand names. We also market and distribute, and in most cases, manufacture or process, a diverse product line of food and snack products, including peanut butter, almond butter, cashew butter, candy and confections, snacks and trail mixes, snack bites, sunflower kernels, dried fruit, corn snacks, sesame sticks and other sesame snack products under private brands and brand names. Our products are sold through the major distribution channels to significant buyers of nuts, including food retailers, commercial ingredient users, and contract packaging customers.
Management Estimates
The preparation of financial statements in conformity with GAAP requires management to make estimates and assumptions that affect the reported amounts of assets and liabilities and disclosure of contingent assets and liabilities at the date of the financial statements and the reported amounts of revenues and expenses during the reporting period. Significant estimates include reserves for customer deductions, the quantity of bulk inventories, the evaluation of recoverability of long-lived assets, the assumptions used in estimating the retirement plan liability and pension expense, and the realizability of deferred tax assets. Actual results could differ from those estimates.
Accounts Receivable
Accounts receivable are stated at the amounts charged to customers, less allowances for doubtful accounts, and reserves for estimated cash discounts and customer deductions. The allowance for doubtful accounts is calculated by specifically identifying customers that are credit risks and estimating the extent that other non-specifically identified customers will become credit risks. Account balances are charged off against the allowance when we conclude that it is probable the receivable will not be recovered. The reserve for estimated cash discounts is based on historical experience. The reserve for customer deductions represents known customer short payments and an estimate of future credit memos that will be issued to customers related to rebates and allowances for marketing and promotions based on agreed upon programs and historical experience.
Inventories
Inventories, which consist principally of inshell bulk-stored nuts, shelled nuts, dried fruit and processed and packaged nut products, are stated at the lower of cost (first-in, first-out) or market which approximates actual cost. Inventory costs are reviewed at least quarterly. Fluctuations in the market price of pecans, peanuts, walnuts, almonds, cashews and other nuts may affect the value of inventory, gross profit and gross profit margin. When expected market sales prices move below costs, we record adjustments to write down the carrying values of inventories to the lower of cost (first-in, first-out) or market. The results of our shelling process can also result in changes to inventory costs, such as adjustments made pursuant to actual versus expected crop yields. We maintain significant inventories of bulk-stored inshell pecans, peanuts and walnuts. Quantities of inshell bulk-stored nuts are determined based on our inventory systems and are subject to quarterly physical verification techniques including observation, weighing and other methods. The quantities of each crop year bulk-stored nut inventories are generally shelled out over a ten to fifteen-month period, at which time revisions to any estimates are also recorded.
Property, Plant and Equipment
Property, plant and equipment are stated at cost. Major improvements that extend the useful life, add capacity or add functionality are capitalized and charged to expense through depreciation. Repairs and maintenance costs are charged to expense as incurred. The cost and accumulated depreciation of assets sold or retired are removed from the respective accounts, and any gain or loss is recognized currently in operating income.
41
Depreciation expense for the last three fiscal years is as follows:
| Year Ended June 29, 2017 |
Year Ended June 30, 2016 |
Year Ended June 25, 2015 |
||||||||||
| Depreciation expense |
$ | 14,190 | $ | 14,875 | $ | 14,117 | ||||||
|
|
|
|
|
|
|
|||||||
Cost is depreciated using the straight-line method over the following estimated useful lives:
| Classification |
Estimated Useful Lives | |
| Buildings |
10 to 40 years | |
| Machinery and equipment |
5 to 10 years | |
| Furniture and leasehold improvements |
5 to 10 years | |
| Vehicles |
3 to 5 years | |
| Computers and software |
3 to 5 years |
No interest costs were capitalized for the last three fiscal years due to the lack of any significant project requiring such capitalization.
Impairment of Long-Lived Assets
We review held and used long-lived assets, including our rental investment property and amortizable identifiable intangible assets, to assess recoverability from projected undiscounted cash flows whenever events or changes in facts and circumstances indicate that the carrying value of the assets may not be recoverable. When such events occur, we compare the sum of the undiscounted cash flows expected to result from the use and eventual disposition of the asset or asset group to the carrying amount of the long-lived asset or asset group. The cash flows are based on our best estimate of future cash flows derived from the most recent business projections. If this comparison indicates there is an impairment, the carrying value of the asset is reduced to its estimated fair value.
We did not record any impairment of long-lived assets for the last three fiscal years.
Facility Consolidation Project/Real Estate Transactions
In April 2005, we acquired property to be used for the Elgin Site. Two buildings are located on the Elgin Site, one of which is an office building. Approximately 75% of the office building has been built-out and 70% is currently vacant. The other building, a warehouse, was expanded and modified for use as our principal processing facility and headquarters. The allocation of the purchase price to the two buildings was determined through a third-party appraisal. The value assigned to the office building is included in rental investment property on the balance sheet. The value assigned to the warehouse building is included in “Property, plant and equipment”.
The net rental expense from the office building is included in the caption “Rental and miscellaneous expense, net”. Gross rental income and rental (expense), net for the last three fiscal years are as follows:
| Year ended June 29, 2017 |
Year ended June 30, 2016 |
Year ended June 25, 2015 |
||||||||||
| Gross rental income |
$ | 2,003 | $ | 1,898 | $ | 1,792 | ||||||
| Rental (expense), net |
(1,311 | ) | (1,371 | ) | (3,062 | ) | ||||||
Expected future gross rental income under operating leases within the office building is as follows for the fiscal years ending:
| June 28, 2018 |
$ | 1,961 | ||
| June 27, 2019 |
1,859 | |||
| June 25, 2020 |
1,765 | |||
| June 24, 2021 |
1,534 | |||
| June 30, 2022 |
1,314 | |||
| Thereafter |
3,096 | |||
|
|
|
|||
| $ | 11,529 | |||
|
|
|
42
Fair Value of Financial Instruments
Authoritative guidance issued by the Financial Accounting Standards Board (“FASB”) defines fair value as the price that would be received for an asset or paid to transfer a liability in an orderly transaction between market participants on the measurement date. The guidance establishes a fair value hierarchy that prioritizes observable and unobservable inputs used to measure fair value into three broad levels:
Level 1- Quoted prices in active markets that are accessible at the measurement date for identical assets and liabilities.
Level 2- Observable inputs other than quoted prices in active markets. For example, quoted prices for similar assets or liabilities in active markets or quoted prices for identical assets or liabilities in inactive markets.
Level 3- Unobservable inputs for which there is little or no market data available.
The carrying values of cash, trade accounts receivable and accounts payable approximate their fair values at June 29, 2017 and June 30, 2016 because of the short-term maturities and nature of these balances.
The carrying value of our Credit Facility (as defined in Note 4 – “Revolving Credit Facility” in the Notes to Consolidated Financial Statements “Revolving Credit Facility” below) borrowings approximates fair value at June 29, 2017 and June 30, 2016 because interest rates on this instrument approximate current market rates (Level 2 criteria), the short-term maturity and nature of this balance. In addition, there has been no significant change in our inherent credit risk.
The following table summarizes the carrying value and fair value estimate of our current and long-term debt, excluding unamortized debt issuance costs:
| June 29, 2017 |
June 30, 2016 |
|||||||
| Carrying value of long-term debt: |
$ | 28,808 | $ | 32,290 | ||||
| Fair value of long-term debt: |
29,316 | 35,479 | ||||||
The estimated fair value of long-term debt was determined using a market approach based upon Level 2 observable inputs, which estimates fair value based on interest rates currently offered on loans with similar terms to borrowers of similar credit quality or broker quotes. In addition, there have been no significant changes in the underlying assets securing our long-term debt.
Revenue Recognition
We recognize revenue when persuasive evidence of an arrangement exists, title has transferred (based upon terms of shipment), price is fixed, delivery occurred and collection is reasonably assured. We sell our products under some arrangements which include customer contracts which fix the sales price for periods, which typically can be up to one year, for some commercial ingredient customers and through specific programs consisting of promotion allowances, volume and customer rebates and marketing allowances, among others, to consumer customers and commercial ingredient users. Reserves for these programs are established based upon the terms of specific arrangements. Revenues are recorded net of rebates and promotion and marketing allowances. Revenues are also recorded net of expected customer deductions which are provided for based upon past experiences. While customers do have the right to return products, past experience has demonstrated that product returns have generally been insignificant. Provisions for returns are reflected as a reduction in net sales and are estimated based upon customer specific circumstances. Billings for shipping and handling costs are included in revenues.
Segment Reporting
We operate in a single reportable and operating segment that consists of selling various nut and nut related products through multiple distribution channels.
Significant Customers and Concentration of Credit Risk
The highly competitive nature of our business provides an environment for the loss of customers and the opportunity to gain new customers. We are subject to concentrations of credit risk, primarily in trade accounts receivable, and we attempt to mitigate this risk through our credit evaluation process, collection terms and through geographical dispersion of sales. Sales to three customers each exceeded 10% of net sales during fiscal 2017 and fiscal 2016. In fiscal 2015 two customers each exceeded 10% of net sales. Sales to these customers represented approximately 53%, 50% and 39% of our net sales in fiscal 2017, fiscal 2016 and fiscal 2015, respectively. Net accounts receivable from these customers were 56% and 51% of net accounts receivable at June 29, 2017 and June 30, 2016, respectively.
43
Promotion, Marketing and Advertising Costs
Promotions, allowances and customer rebates are recorded at the time revenue is recognized and are reflected as reductions in sales. Annual volume rebates are estimated based upon projected volumes for the year, while promotions and allowances are recorded based upon terms of the actual arrangements. Coupon incentive costs are accrued based on an estimate of redemptions to occur.
Marketing and advertising costs are incurred to promote and support branded products in the consumer distribution channel. These costs are generally expensed as incurred, recorded in selling expenses, and were as follows for the last three fiscal years:
| Year ended June 29, 2017 |
Year ended June 30, 2016 |
Year ended June 25, 2015 |
||||||||||
| Marketing and advertising expense |
$ | 10,064 | $ | 11,569 | $ | 11,069 | ||||||
|
|
|
|
|
|
|
|||||||
Shipping and Handling Costs
Shipping and handling costs, which include freight and other expenses to prepare finished goods for shipment, are included in selling expenses. Shipping and handling costs for the last three fiscal years were as follows:
| Year ended June 29, 2017 |
Year ended June 30, 2016 |
Year ended June 25, 2015 |
||||||||||
| Shipping and handling costs |
$ | 17,682 | $ | 16,686 | $ | 17,699 | ||||||
|
|
|
|
|
|
|
|||||||
Research and Development Expenses
Research and development expense represents the cost of our research and development personnel and their related expenses and is charged to selling expenses as incurred. Research and development expenses for the last three fiscal years were as follows:
| Year ended June 29, 2017 |
Year ended June 30, 2016 |
Year ended June 25, 2015 |
||||||||||
| Research and development expense |
$ | 658 | $ | 653 | $ | 979 | ||||||
|
|
|
|
|
|
|
|||||||
Stock-Based Compensation
We account for stock-based employee compensation arrangements in accordance with the provisions of ASC 718, as amended by Accounting Standard Update (“ASU”) 2016-09, by calculating compensation cost based on the grant date fair value. We then amortize compensation expense over the vesting period. We estimate the fair value of each stock option on the date of the grant using the Black-Scholes option pricing model (using the risk-free interest rate, expected term, expected volatility, and dividend yield variables). The grant date fair value of restricted stock units (“RSUs”) is generally determined based on the market price of our Common Stock on the date of grant. Beginning in fiscal 2017, forfeitures are recognized as they occur and excess tax benefits or tax deficiencies are recognized as a component of income tax expense.
Income Taxes
We account for income taxes using an asset and liability approach that requires the recognition of deferred tax assets and liabilities for the expected future tax consequences of events that have been reported in our financial statements or tax returns. Such items give rise to differences in the financial reporting and tax basis of assets and liabilities. A valuation allowance is recorded to reduce the carrying amount of deferred tax assets if it is more likely than not that all or a portion of the asset will not be realized. In estimating future tax consequences, we consider all expected future events other than changes in tax law or rates.
We record liabilities for uncertain income tax positions based on a two-step process. The first step is recognition, where we evaluate whether an individual tax position has a likelihood of greater than 50% of being sustained upon examination based on the technical merits of the position, including resolution of any related appeals or litigation processes. For tax positions that are currently estimated to have a less than 50% likelihood of being sustained, no tax benefit is recorded. For tax positions that have met the recognition threshold in the first step, we perform the second step of measuring the benefit to be recorded. The actual benefits ultimately realized may differ from our estimates. In future periods, changes in facts, circumstances, and new information may require us to change the recognition and measurement estimates with regard to individual tax positions. Changes in recognition and measurement estimates are recorded in results of operations and financial position in the period in which such changes occur.
We recognize interest and penalties accrued related to unrecognized tax benefits in the Income tax expense caption in the Consolidated Statement of Comprehensive Income.
44
We evaluate the realization of deferred tax assets by considering our historical taxable income and future taxable income based upon the reversal of deferred tax liabilities. As of June 29, 2017, we believe that our deferred tax assets are fully realizable, except for $171 of net basis differences for which we have provided a valuation allowance.
Earnings per Share
Basic earnings per common share are calculated using the weighted average number of shares of Common Stock and Class A Stock outstanding during the period. Diluted earnings per share reflects the potential dilution that could occur if securities or other contracts to issue Common Stock were exercised or converted into Common Stock or resulted in the issuance of Common Stock.
The following table presents the reconciliation of the weighted average shares outstanding used in computing basic and diluted earnings per share:
| Year ended June 29, 2017 |
Year ended June 30, 2016 |
Year ended June 25, 2015 |
||||||||||
| Weighted average number of shares outstanding — basic |
11,317,149 | 11,233,975 | 11,150,658 | |||||||||
| Effect of dilutive securities: |
||||||||||||
| Stock options and restricted stock units |
86,456 | 98,949 | 97,601 | |||||||||
|
|
|
|
|
|
|
|||||||
| Weighted average number of shares outstanding — diluted |
11,403,605 | 11,332,924 | 11,248,259 | |||||||||
|
|
|
|
|
|
|
|||||||
The following table presents a summary of anti-dilutive awards excluded from the computation of diluted earnings per share:
| Year ended June 29, 2017 |
Year ended June 30, 2016 |
Year ended June 25, 2015 |
||||||||||
| Weighted average number of anti-dilutive shares: |
1,068 | — | — | |||||||||
| Weighted average exercise price per share: |
$ | 65.35 | $ | — | $ | — | ||||||
Comprehensive Income
We account for comprehensive income in accordance with ASC Topic 220, Comprehensive Income. This topic establishes standards for reporting and displaying comprehensive income and its components in a full set of general-purpose financial statements. The topic requires that all components of comprehensive income be reported in a financial statement that is displayed with the same prominence as other financial statements. This topic also requires all non-owner changes in stockholders’ equity be presented in either a single continuous statement of comprehensive income or in two separate but consecutive statements. This guidance also requires presentation by the respective line items of net income, either on the face of the statement where net income is presented or in the notes and information about significant amounts required under U.S. GAAP to be reclassified out of accumulated other comprehensive income in their entirety. For amounts not required to be reclassified in their entirety to net income, we provide a cross-reference to other disclosures that offer additional details about those amounts.
Recent Accounting Pronouncements
45
The following recent accounting pronouncements were adopted in the current fiscal year:
In March 2016, the FASB issued ASU No. 2016-09 “Compensation-Stock Compensation (Topic 718)”. This ASU is part of the FASB’s simplification initiative. The areas for simplification in this update involve several aspects of the accounting for share-based payment transactions, including the income tax consequences, forfeitures, classification of awards as either equity or liabilities, statutory withholding requirements, and classification on the statement of cash flows. The Company early adopted this guidance during the first quarter of fiscal 2017. The cumulative adjustment for the impact of this change in accounting principle was immaterial. Cash flows related to excess tax benefits will be classified prospectively as operating activities in the Consolidated Statements of Cash Flows. Prior periods have not been adjusted. The Company anticipates increased volatility in income tax expense, mainly in the second quarter of each fiscal year, since historically most equity compensation granted in prior periods vests during that quarter.
In April 2015, the FASB issued ASU No. 2015-05 “Intangibles — Goodwill and Other — Internal-Use Software (Subtopic 350-40): Customer’s Accounting for Fees Paid in a Cloud Computing Arrangement”. This update provides guidance to customers about whether a cloud computing arrangement includes a software license or service contract. This update became effective for the Company beginning the first quarter of fiscal 2017. The adoption of ASU 2015-05 did not have a material impact to the Consolidated Financial Statements.
46
In April 2015, the FASB issued ASU No. 2015-03 “Interest-Imputation of Interest (Subtopic 835-30) Simplifying the Presentation of Debt Issuance Costs”. This update requires that debt issuance costs related to a recognized debt liability be presented in the balance sheet as a direct reduction from the carrying amount of that debt liability, consistent with debt discounts. ASU 2015-03 was effective for the Company beginning with the first quarter of fiscal 2017. The adoption of this standard required retrospective adjustment to our Consolidated Balance Sheets. As a result, Other assets decreased approximately $244 as of June 30, 2016 and this amount was allocated within Current maturities of long term debt and Long term debt. Adoption of ASU 2015-03 did not have an effect on the Company’s stockholders’ equity, results of operations or cash flows.
In February 2015, the FASB issued ASU No. 2015-02 “Consolidation (Topic 810): Amendments to the Consolidation Analysis”. This update focuses on a reporting company’s consolidation evaluation to determine whether it should consolidate certain legal entities. The guidance ASU 2015-02 became effective for the Company beginning with the first quarter of fiscal 2017. The adoption of ASU 2015-02 did not have any impact to the Consolidated Financial Statements.
In August 2014, the FASB issued ASU No. 2014-15 “Presentation of Financial Statements—Going Concern (Topic 205-40)”. The guidance requires management to perform interim and annual assessments of an entity’s ability to continue as a going concern within one year of the date the financial statements are issued. An entity must provide certain disclosures if conditions or events raise substantial doubt about the entity’s ability to continue as a going concern. ASU 2014-15 was effective for the Company beginning with the first quarter of fiscal 2017. The adoption of this guidance had no impact on our Consolidated Financial Statements.
The following recent accounting pronouncements have not yet been adopted:
In May 2017, the FASB issued ASU No. 2017-09 “Compensation—Stock Compensation (Topic 718): Scope of Modification Accounting”. The amendments in this update provide guidance about which changes to terms or conditions of a share-based payment award require an entity to apply modification accounting in Topic 718. ASU 2017-09 will be effective for the Company in fiscal 2019 and should be applied prospectively to an award modified on or after the adoption date. The Company does not expect ASU 2017-09 to have a material impact to the Consolidated Financial Statements.
In March 2017, the FASB issued ASU No. 2017-07 “Compensation—Retirement Benefits (Topic 715): Improving the Presentation of Net Periodic Pension Cost and Net Periodic Postretirement Benefit Cost”. The amendments in this update require the service cost component of pension expense to be disaggregated from the other components of net periodic benefit cost and be presented in the same line items as other employee compensation costs. All other components of net periodic benefit cost must be presented in the income statement separately from the service cost component and outside a subtotal of income from operations. This update is effective for public business entities for annual periods beginning after December 15, 2017, including interim periods within those annual periods. Early adoption is permitted as long as it is early adopted in the first interim period of an annual year and financial statements have not been issued or made available for issuance prior to adoption. The amendments in this update should be applied using a retrospective transition method, however, a practical expedient is offered with regard to the prior comparative periods. The Company plans to early adopt this update beginning in fiscal 2018 and does not expect the impact of this new guidance to have a significant impact on its financial position, results of operations and disclosures.
In October 2016, the FASB issued ASU No. 2016-17 “Consolidation (Topic 810): Interests Held Through Related Parties That Are Under Common Control”. This update is amending ASU 2015-02 and affects reporting entities that are required to evaluate whether they should consolidate a variable interest entity in certain situations involving entities under common control. ASU 2016-17 will be effective for the Company in fiscal 2018 and will require retrospective application. The Company does not expect ASU 2016-17 to have any impact to the Consolidated Financial Statements.
In August 2016, the FASB issued ASU No. 2016-15 “Statement of Cash Flows (Topic 230): Classification of Certain Cash Receipts and Cash Payments”. This update addresses eight specific cash flow issues with the objective of reducing the perceived diversity in practice. The amendments in this update are effective for public business entities for fiscal years beginning after December 15, 2017, and interim periods within those fiscal years. Early adoption is permitted, including adoption in an interim period. If an entity early adopts the amendments in an interim period, any adjustments should be reflected as of the beginning of the fiscal year that includes that interim period. An entity that elects early adoption must adopt all of the amendments in the same period. The amendments in this update should be applied using a retrospective transition method to each period presented. The Company does not expect a material impact to our statement of cash flows once ASU 2016-15 is adopted in fiscal 2019.
47
In June 2016, the FASB issued ASU No. 2016-13 “Financial Instruments—Credit Losses (Topic 326): Measurement of Credit Losses on Financial Instruments”. The main objective of this update is to provide financial statement users with more decision-useful information about the expected credit losses on financial instruments and other commitments to extend credit held by a reporting entity at each reporting date. The amendments in this update replace the incurred loss impairment methodology in current GAAP with a methodology that reflects expected credit losses and requires consideration of a broader range of reasonable and supportable information to inform credit loss estimates. The amendments in this update are effective for public business entities for fiscal years beginning after December 15, 2019, and interim periods within those fiscal years. A modified-retrospective approach is required in the first reporting period in which the guidance is effective through a cumulative-effect adjustment to retained earnings. We do not expect ASU 2013-13 will have a significant impact on the Consolidated Financial Statements once adopted in fiscal 2021.
In February 2016, the FASB issued ASU No. 2016-02 “Leases (Topic 842)”. The primary goal of this update is to require the lessee to recognize all lease commitments, both operating and finance, by initially recording a lease asset and liability on the balance sheet at the lease commencement date. Additionally, enhanced qualitative and quantitative disclosures will be required. ASU 2016-02 is effective for public business entities for annual periods, including interim periods within those annual periods, beginning after December 15, 2018. This new guidance will be effective for the Company beginning in fiscal year 2020 and we do not expect to early adopt. This guidance must be adopted using a modified retrospective approach. The Company expects this new guidance to have a significant impact on its total assets and total liabilities, and lead to increased financial statement disclosures.
In July 2015, the FASB issued ASU No. 2015-11 “Inventory (Topic 330) Simplifying the Measurement of Inventory”. This update applies to inventory measured using first-in, first-out or average cost and requires inventory be measured at the lower of cost and net realizable value. Net realizable value is defined as estimated selling prices in the ordinary course of business, less reasonably predictable costs of completion, disposal and transportation. This update will be effective for the Company beginning in fiscal year 2018 with prospective application required. The Company does not anticipate this guidance will have a material impact to its Consolidated Financial Statements.
In May 2014, the FASB issued ASU No. 2014-09 “Revenue from Contracts with Customers (Topic 606)” and created a new ASC Topic 606, Revenue from Contracts with Customers, and added ASC Subtopic 340-40, Other Assets and Deferred Costs — Contracts with Customers. The guidance in this update supersedes the revenue recognition requirements in ASC Topic 605, Revenue Recognition, and most industry-specific guidance throughout the industry topics of the codification. Under the new guidance, an entity should recognize revenue to depict the transfer of promised goods or services to customers in an amount that reflects the consideration to which the entity expects to be entitled in exchange for those goods or services. Several other amendments have been subsequently released, each of which provide additional narrow scope clarifications or improvements. In August 2015, the FASB issued ASU No. 2015-14 “Revenue from Contracts with Customers, Deferral of the Effective Date” which deferred the effective date of ASU 2014-09 for one year. Consequently, this new revenue recognition guidance will be effective for the Company beginning in fiscal year 2019, which is our anticipated adoption date. We have completed our initial analysis of this accounting standard update which included a review of all material customer contracts and currently do not anticipate any material changes to our revenue recognition compared to current GAAP. We are currently evaluating the method of adoption.
NOTE 2 — INVENTORIES
Inventories consist of the following:
| June 29, 2017 |
June 30, 2016 |
|||||||
| Raw material and supplies |
$ | 79,609 | $ | 56,005 | ||||
| Work-in-process and finished goods |
102,811 | 100,568 | ||||||
|
|
|
|
|
|||||
| $ | 182,420 | $ | 156,573 | |||||
|
|
|
|
|
|||||
NOTE 3 — INTANGIBLE ASSETS
Intangible assets subject to amortization consist of the following:
| June 29, 2017 |
June 30, 2016 |
|||||||
| Customer relationships |
$ | 10,600 | $ | 10,600 | ||||
| Brand names |
8,090 | 8,090 | ||||||
| Less accumulated amortization: |
||||||||
| Customer relationships |
(10,600 | ) | (9,231 | ) | ||||
| Brand names |
(8,090 | ) | (8,090 | ) | ||||
|
|
|
|
|
|||||
| Net intangible assets |
$ | — | $ | 1,369 | ||||
|
|
|
|
|
|||||
48
Customer relationships relate wholly to the Orchard Valley Harvest (“OVH”) acquisition completed in fiscal 2010 which became fully amortized in fiscal 2017. The brand name consists primarily of the Fisher brand name, which we acquired in a 1995 acquisition. The Fisher brand name became fully amortized in fiscal 2011. The remainder of the brand name relates to the OVH acquisition which became fully amortized in fiscal 2015.
Total amortization expense related to intangible assets, which is classified in administrative expense in the Consolidated Statement of Comprehensive Income, was as follows for the last three fiscal years:
| Year ended June 29, 2017 |
Year ended June 30, 2016 |
Year ended June 25, 2015 |
||||||||||
| Amortization of intangible assets |
$ | 1,369 | $ | 1,710 | $ | 2,167 | ||||||
|
|
|
|
|
|
|
|||||||
NOTE 4 — REVOLVING CREDIT FACILITY
On February 7, 2008, we entered into a Credit Agreement with a bank group (the “Bank Lenders”) providing a $117,500 revolving loan commitment and letter of credit subfacility (the “Credit Facility”). The Credit Facility is secured by substantially all our assets other than real property and fixtures.
At June 29, 2017 and June 30, 2016, the weighted average interest rate for the Credit Facility was 3.11% and 3.75%, respectively. The terms of the Credit Facility contain covenants that require us to restrict investments, indebtedness, acquisitions and certain sales of assets, cash dividends, redemptions of capital stock and prepayment of indebtedness (if such prepayment, among other things, is of a subordinate debt). If loan availability under the Borrowing Base Calculation falls below $25,000, we will be required to maintain a specified fixed charge coverage ratio, tested on a monthly basis. All cash received from customers is required to be applied against the Credit Facility. The Bank Lenders are entitled to require immediate repayment of our obligations under the Credit Facility in the event of default on the payments required under the Credit Facility, a change in control in the ownership of the Company, non-compliance with the financial covenant or upon the occurrence of certain other defaults by us under the Credit Facility (including a default under the Mortgage Facility). As of June 29, 2017, we were in compliance with the financial covenant under the Credit Facility and we currently expect to be in compliance with the financial covenant in the Credit Facility for the next twelve months. As of June 29, 2017, we had $84,369 of available credit under the Credit Facility which reflects borrowings of $29,456 and reduced availability as a result of $3,675 in outstanding letters of credit. We would still be in compliance with all restrictive covenants under the Credit Facility if this entire amount were borrowed.
On July 7, 2017, we entered into the Eighth Amendment to Credit Facility (the “Eighth Amendment”). See Note 18 – “Subsequent Events”.
NOTE 5 — LONG-TERM DEBT
Long-term debt consists of the following:
| June 29, 2017 |
June 30, 2016 |
|||||||
| Mortgage Facility (“Tranche A”), collateralized by real property, due in monthly principal installments of $200 plus interest at 7.63% per annum through February 2023 with a final principal payment of $600 on March 1, 2023 |
$ | 14,200 | $ | 16,600 | ||||
| Mortgage Facility (“Tranche B”), collateralized by real property, due in monthly principal installments of $50 plus interest at the greater of one month LIBOR plus 3.50% per annum or 4.25% through February 2023 with a final principal payment of $150 on March 1, 2023 |
3,550 | 4,150 | ||||||
| Selma, Texas facility financing obligation to related parties, due in monthly installments of $103 through September 1, 2031 |
11,058 | 11,540 | ||||||
| Unamortized debt issuance costs |
(179 | ) | (244 | ) | ||||
|
|
|
|
|
|||||
| 28,629 | 32,046 | |||||||
| Less: Current maturities, net of unamortized debt issuance costs |
(3,418 | ) | (3,342 | ) | ||||
|
|
|
|
|
|||||
| Total long-term debt, net of unamortized debt issuance costs |
$ | 25,211 | $ | 28,704 | ||||
|
|
|
|
|
|||||
49
On February 7, 2008, we entered into a Loan Agreement with an insurance company (the “Mortgage Lender”) providing us with two term loans, one in the amount of $36,000 (“Tranche A”) and the other in the amount of $9,000 (“Tranche B”), for an aggregate amount of $45,000 (the “Mortgage Facility”). The Mortgage Facility is secured by mortgages on essentially all of our owned real property located in Elgin, Illinois, Gustine, California and Garysburg, North Carolina (the “Encumbered Properties”).
Tranche A under the Mortgage Facility accrues interest at a fixed interest rate of 7.63% per annum, payable monthly. As mentioned above, such interest rate may be reset by the Mortgage Lender on the Tranche A Reset Date. Tranche B under the Mortgage Facility accrues interest, as reset on March 1, 2016, at a floating rate of the greater of (i) one month LIBOR plus 3.50% per annum or (ii) 4.25%, payable monthly (the “Floating Rate”). The margin on such floating rate may be reset by the Mortgage Lender on each Tranche B Reset Date; provided, however, that the Mortgage Lender may also change the underlying index on each Tranche B Reset Date occurring on or after March 1, 2018. We do not currently anticipate that any change in the floating rate or the underlying index will have a material adverse effect upon our business, financial condition or results of operations.
The terms of the Mortgage Facility contain covenants that require us to maintain a specified net worth of $110,000 and maintain the Encumbered Properties. The Mortgage Lender is entitled to require immediate repayment of our obligations under the Mortgage Facility in the event we default in the payments required under the Mortgage Facility, non-compliance with the covenants or upon the occurrence of certain other defaults by us under the Mortgage Facility. As of June 29, 2017, we were in compliance with all financial covenants under the Mortgage Facility. The carrying amount of assets pledged as collateral for the Mortgage Facility was approximately $73,427 at June 29, 2017.
In September 2006, we sold our Selma, Texas properties to two related party partnerships for $14,300 and are leasing them back. The selling price was determined by an independent appraiser to be the fair market value which also approximated our carrying value. The lease for the Selma, Texas properties has a ten-year term at a fair market value rent with three five-year renewal options. Also, we currently have the option to purchase the properties from the partnerships at 95% (100% in certain circumstances) of the then fair market value, but not to be less than the $14,300 purchase price. The financing obligation is being accounted for similar to the accounting for a capital lease, whereby the purchase price was recorded as a debt obligation, as the provisions of the arrangement are not eligible for sale-leaseback accounting. The balance of the debt obligation outstanding at June 29, 2017 was $11,058.
In September 2015, we signed a lease renewal which exercised two five-year renewal options and extended the term of our Selma lease to September 18, 2026 (unless we purchase it before such date). One five-year renewal option remains. Beginning in the second quarter of fiscal 2017, the base monthly lease amount decreased to $103.
Aggregate maturities of long-term debt are as follows for the fiscal years ending:
| June 28, 2018 |
$ | 3,473 | ||
| June 27, 2019 |
3,508 | |||
| June 25, 2020 |
3,545 | |||
| June 24, 2021 |
3,585 | |||
| June 30, 2022 |
3,627 | |||
| Thereafter |
11,070 | |||
|
|
|
|||
| $ | 28,808 | |||
|
|
|
50
NOTE 6 — INCOME TAXES
The provision for income taxes is based entirely on income before income taxes earned in the United States, and is as follows for the last three fiscal years:
| For the Year Ended: | ||||||||||||
| June 29, 2017 |
June 30, 2016 |
June 25, 2015 |
||||||||||
| Current: |
||||||||||||
| Federal |
$ | 17,013 | $ | 14,015 | $ | 15,916 | ||||||
| State |
2,744 | 2,222 | 2,027 | |||||||||
|
|
|
|
|
|
|
|||||||
| Total current expense |
19,757 | 16,237 | 17,943 | |||||||||
| Deferred: |
||||||||||||
| Deferred federal |
(1,698 | ) | (210 | ) | (2,589 | ) | ||||||
| Deferred state |
(46 | ) | 40 | 205 | ||||||||
|
|
|
|
|
|
|
|||||||
| Total deferred benefit |
(1,744 | ) | (170 | ) | (2,384 | ) | ||||||
|
|
|
|
|
|
|
|||||||
| Total income tax expense |
$ | 18,013 | $ | 16,067 | $ | 15,559 | ||||||
|
|
|
|
|
|
|
|||||||
The reconciliations of income taxes at the statutory federal income tax rate to income tax expense reported in the Consolidated Statements of Comprehensive Income for the last three fiscal years are as follows:
| June 29, 2017 |
June 30, 2016 |
June 25, 2015 |
||||||||||
| Federal statutory income tax rate |
35.0 | % | 35.0 | % | 35.0 | % | ||||||
| State income taxes, net of federal benefit |
3.3 | 3.2 | 3.4 | |||||||||
| Research and development tax credit |
(0.1 | ) | (0.1 | ) | (0.1 | ) | ||||||
| Domestic manufacturing deduction |
(3.1 | ) | (3.2 | ) | (3.4 | ) | ||||||
| Windfall tax benefits |
(1.8 | ) | — | — | ||||||||
| Uncertain tax positions |
0.1 | (0.6 | ) | 0.3 | ||||||||
| Other |
(0.1 | ) | 0.3 | (0.5 | ) | |||||||
|
|
|
|
|
|
|
|||||||
| Effective tax rate |
33.3 | % | 34.6 | % | 34.7 | % | ||||||
|
|
|
|
|
|
|
|||||||
After the adoption of ASU 2016-09 in fiscal 2017, windfall tax benefits are a permanent difference recognized as a component of income tax expense.
Deferred tax assets and liabilities are recognized for the expected future tax consequences of temporary differences between the financial statement basis and the tax basis of assets and liabilities using enacted statutory tax rates applicable to future years. Deferred tax assets and liabilities are comprised of the following:
| June 29, 2017 |
June 30, 2016 |
|||||||
| Deferred tax assets (liabilities): |
||||||||
| Accounts receivable |
$ | 423 | $ | 521 | ||||
| Employee compensation |
1,726 | 1,922 | ||||||
| Inventory |
345 | 353 | ||||||
| Depreciation and amortization |
(12,826 | ) | (13,315 | ) | ||||
| Capitalized leases |
1,508 | 1,440 | ||||||
| Goodwill and intangible assets |
4,939 | 5,046 | ||||||
| Retirement plan |
8,224 | 8,661 | ||||||
| Workers’ compensation |
2,365 | 2,251 | ||||||
| Share based compensation |
1,908 | 1,669 | ||||||
| Capital loss carryforward |
171 | 171 | ||||||
| Other |
483 | 42 | ||||||
| Less valuation allowance |
(171 | ) | (171 | ) | ||||
|
|
|
|
|
|||||
| Net deferred tax asset — long term |
$ | 9,095 | $ | 8,590 | ||||
|
|
|
|
|
|||||
51
In assessing the realizability of deferred tax assets, management considers whether it is more likely than not that some portion or all of the deferred tax assets will not be realized. The ultimate realization of deferred tax assets is dependent upon the generation of future taxable income of the character necessary during the periods in which those temporary differences become deductible. Management considers the scheduled reversal of deferred tax liabilities (including the impact of available carryback and carryforward periods), projected future taxable income, and tax-planning strategies in making this assessment. During fiscal 2017 the total valuation allowance did not change and in fiscal 2016 the net change in the total valuation allowance was a $4 decrease. If or when recognized, the tax benefits relating to any reversal of the valuation allowance will be recognized as a reduction of income tax expense.
For the years ending June 29, 2017 and June 30, 2016, unrecognized tax benefits and accrued interest and penalties were $173 and $62. Accrued interest and penalties related to uncertain tax positions are not material for any periods presented. Interest and penalties within income tax expense were not material for any period presented. The total gross amounts of unrecognized tax benefits were $174 and $24 at June 29, 2017 and June 30, 2016, respectively.
A reconciliation of the beginning and ending amount of gross unrecognized tax benefits is as follows:
| June 29, 2017 |
June 30, 2016 |
June 25, 2015 |
||||||||||
| Beginning balance |
$ | 24 | $ | 248 | $ | 247 | ||||||
| Gross increases — tax positions in prior year |
7 | 70 | 27 | |||||||||
| Gross decreases — tax positions in prior year |
— | (8 | ) | (91 | ) | |||||||
| Settlements |
— | (137 | ) | (18 | ) | |||||||
| Gross increases — tax positions in current year |
23 | 17 | 21 | |||||||||
| Lapse of statute of limitations |
120 | (166 | ) | 62 | ||||||||
|
|
|
|
|
|
|
|||||||
| Ending balance |
$ | 174 | $ | 24 | $ | 248 | ||||||
|
|
|
|
|
|
|
|||||||
Unrecognized tax benefits, that if recognized, would affect the annual effective tax rate on income from continuing operations, are as follows:
| June 29, 2017 |
June 30, 2016 |
June 25, 2015 |
||||||||||
| Unrecognized tax benefits that would affect annual effective tax rate |
$ | 136 | $ | 27 | $ | 261 | ||||||
During fiscal 2017, the change in unrecognized tax benefits due to statute expiration was not material. We do not anticipate that total unrecognized tax benefits will significantly change in the next twelve months.
There were certain changes in state tax laws during the period the impact of which was insignificant. We file income tax returns with federal and state tax authorities within the United States of America. Our federal and Illinois tax returns are open for audit for fiscal 2015 and 2016. Our California tax returns for fiscal 2013 and 2014 are under audit and fiscal 2015 and 2016 are open for audit. No other tax jurisdictions are material to us.
NOTE 7 — COMMITMENTS AND CONTINGENCIES
Operating Leases
We primarily lease certain office and material handling equipment pursuant to agreements accounted for as operating leases. Rent expense aggregated under these operating leases was as follows for the last three fiscal years:
| Year ended June 29, 2017 |
Year ended June 30, 2016 |
Year ended June 25, 2015 |
||||||||||
| Rent expense related to operating leases |
$ | 1,880 | $ | 1,775 | $ | 1,545 | ||||||
|
|
|
|
|
|
|
|||||||
Aggregate non-cancelable lease commitments under these operating leases with initial or remaining terms greater than one year are as follows:
| Fiscal year ending | ||||
| June 28, 2018 |
$ | 969 | ||
| June 27, 2019 |
558 | |||
| June 25, 2020 |
392 | |||
| June 24, 2021 |
142 | |||
| June 30, 2022 |
71 | |||
| Thereafter |
6 | |||
|
|
|
|||
| $2,138 | ||||
|
|
|
|||
52
Litigation
We are currently a party to various legal proceedings in the ordinary course of business. While management presently believes that the ultimate outcomes of these proceedings, individually and in the aggregate, will not materially affect our financial position, results of operations or cash flows, legal proceedings are subject to inherent uncertainties, and unfavorable outcomes could occur. Unfavorable outcomes could include substantial money damages in excess of any appropriate accruals which management has established. Were such unfavorable final outcomes to occur, there exists the possibility of a material adverse effect on our financial position, results of operations and cash flows.
We are subject to a class-action complaint for an employment related matter. Mediation for this matter occurred in June 2017, which for the first time we were provided with an initial monetary demand. In August 2017, we agreed in principle to a $1,200 settlement for which we are fully reserved at June 29, 2017. The non-monetary components of the settlement are still being finalized.
NOTE 8 — STOCKHOLDERS’ EQUITY
Our Class A Common Stock, $.01 par value (the “Class A Stock”), has cumulative voting rights with respect to the election of those directors which the holders of Class A Stock are entitled to elect, and 10 votes per share on all other matters on which holders of our Class A Stock and Common Stock are entitled to vote, with the exception of election of the directors for which the holders of Common Stock are eligible to elect. In addition, each share of Class A Stock is convertible at the option of the holder at any time into one share of Common Stock and automatically converts into one share of Common Stock upon any sale or transfer other than to related individuals or certain other events as set forth in our Restated Certificate of Incorporation. Each share of our Common Stock, $.01 par value (the “Common Stock”) has noncumulative voting rights of one vote per share. The Class A Stock and the Common Stock are entitled to share equally, on a share-for-share basis, in any cash dividends declared by the Board of Directors, and the holders of the Common Stock are entitled to elect 25%, rounded up to the nearest whole number, of the members comprising the Board of Directors. During fiscal 2017, our Board of Directors adopted a dividend policy under which it intends to pay an annual cash dividend on our Common Stock and Class A Stock of at least $0.50 per share during the first quarter of each fiscal year.
NOTE 9 — STOCK-BASED COMPENSATION PLANS
At our annual meeting of stockholders on October 29, 2014, our stockholders approved a new equity incentive plan (the “2014 Omnibus Plan”) under which awards of options and other stock-based awards may be made to employees, officers or non-employee directors of our Company. A total of 1,000,000 shares of Common Stock are authorized for grants of awards thereunder, which may be in the form of options, restricted stock, RSUs, stock appreciation rights (“SARs”), performance shares, performance units, Common Stock or dividends and dividend equivalents. As of June 29, 2017, there were 820,539 shares of Common Stock that remained authorized for future grants of awards, subject to the limitations set below. Under the terms of the Omnibus Plan, the total number of shares of Common Stock with respect to which options or SARs may be granted in any calendar year to any participant may not exceed 500,000 shares (this limit applies separately with respect to each type of award). Additionally, under the terms of the Omnibus Plan, for awards of restricted stock, RSUs, performance shares or other stock-based awards that are intended to qualify as performance-based compensation: (i) the total number of shares of Common Stock that may be granted in any calendar year to any participant may not exceed 250,000 shares (this limit applies separately to each type of award) and (ii) the maximum amount that may be paid to any participant for awards that are payable in cash or property other than Common Stock in any calendar year is $5,000. For fiscal 2017, the Board of Directors adopted an equity grant cap which further restricted the number of awards that could be made to any one participant or in the aggregate. The equity grant cap limited the number of awards to 250,000 awards to all participants and 20,000 awards to any one participant for the 2017 fiscal year. Except as set forth in the 2014 Omnibus Plan, RSUs have vesting periods of three years for awards to employees and one year for awards to non-employee members of the Board of Directors. Recipients of RSUs have the option to defer receipt of vested shares until a specified later date, typically soon after separation from the Company. The exercise price of stock options is determined as set forth in the 2014 Omnibus Plan by the Compensation Committee of our Board of Directors, and has to be at least the fair market value of the Common Stock on the date of grant. Except as set forth in the 2014 Omnibus Plan, stock options expire upon termination of employment or directorship, as applicable. Stock options granted under the 2014 Omnibus Plan are exercisable 25% annually commencing on the first anniversary date of grant and became fully exercisable on the fourth anniversary date of grant. Options generally will expire no later than ten years after the date on which they were granted. We issue new shares of Common Stock upon exercise of stock options.
We determine the fair value of stock option awards using the Black-Scholes option-pricing model; however, there were no options granted in fiscal 2017, fiscal 2016 or fiscal 2015.
53
The following is a summary of stock option activity for the year ended June 29, 2017:
| Shares | Weighted- Average Exercise Price |
Weighted- Average Remaining Contractual Term in Years |
Aggregate Intrinsic Value |
|||||||||||||
| Outstanding at June 30, 2016 |
9,500 | $ | 8.78 | |||||||||||||
| Granted |
— | — | ||||||||||||||
| Exercised |
(7,500 | ) | 8.40 | |||||||||||||
| Forfeited |
— | — | ||||||||||||||
|
|
|
|||||||||||||||
| Outstanding at June 29, 2017 |
2,000 | $ | 10.24 | 2.06 | $ | 105 | ||||||||||
|
|
|
|
|
|||||||||||||
| Exercisable at June 29, 2017 |
2,000 | $ | 10.24 | 2.06 | $ | 105 | ||||||||||
|
|
|
|
|
|||||||||||||
The following table summarizes the total intrinsic value of all options exercised and the total cash received from the exercise of options for the last three fiscal years:
| Year ended June 29, 2017 |
Year ended June 30, 2016 |
Year ended June 25, 2015 |
||||||||||
| Total intrinsic value of options exercised |
$ | 374 | $ | 792 | $ | 781 | ||||||
| Total cash received from exercise of options |
$ | 63 | $ | 155 | $ | 643 | ||||||
All options were fully vested as of June 30, 2016. Exercise prices for options outstanding as of June 29, 2017 ranged from $8.71 to $14.73.
The fair value of RSUs is generally determined based on the market price of our Common Stock on the date of grant. The fair value of RSUs granted for the years ended June 29, 2017, June 30, 2016 and June 25, 2015 was $2,773, $3,212 and $2,835, respectively.
The following is a summary of RSU activity for the year ended June 29, 2017:
| Restricted Stock Units |
Shares | Weighted- Average Grant- Date Fair Value |
||||||
| Outstanding at June 30, 2016 |
228,270 | $ | 32.33 | |||||
| Granted |
45,213 | 61.33 | ||||||
| Vested |
(68,426 | ) | 27.91 | |||||
| Forfeited |
(3,199 | ) | 30.23 | |||||
|
|
|
|
|
|||||
| Outstanding at June 29, 2017 |
201,858 | $ | 40.36 | |||||
|
|
|
|
|
|||||
At June 29, 2017 there were 68,673 RSUs outstanding that were vested but deferred. At June 30, 2016 there were 58,561 RSUs outstanding that were vested but deferred. The non-vested RSUs at June 29, 2017 will vest over a weighted-average period of 1.2 years. The fair value of RSUs that vested for the years ended June 29, 2017, June 30, 2016 and June 25, 2015 was $1,910, $928 and $615, respectively.
The following table summarizes compensation cost charged to earnings for all equity compensation plans and the total income tax benefit recognized for the last three fiscal years:
| Year ended June 29, 2017 |
Year ended June 30, 2016 |
Year ended June 25, 2015 |
||||||||||
| Compensation cost charged to earnings |
$ | 2,504 | $ | 2,489 | $ | 1,952 | ||||||
| Income tax benefit recognized |
951 | 962 | 814 | |||||||||
At June 29, 2017, there was $3,008 of total unrecognized compensation cost related to non-vested share-based compensation arrangements granted under our stock-based compensation plans. We expect to recognize that cost over a weighted-average period of 1.2 years.
54
NOTE 10 — SPECIAL CASH DIVIDENDS
Our Board of Directors declared the following special cash dividends payable in fiscal 2017 and fiscal 2016:
| Declaration Date |
Record Date |
Dividend Per Share |
Total Amount | Payment Date | ||||||||
| November 1, 2016 |
November 30, 2016 |
$ | 2.50 | $ | 28,314 | December 13, 2016 | ||||||
| July 7, 2016 |
July 21, 2016 |
$ | 2.50 | $ | 28,150 | August 4, 2016 | ||||||
| October 27, 2015 |
December 2, 2015 |
$ | 2.00 | $ | 22,486 | December 11, 2015 | ||||||
On July 11, 2017, our Board of Directors declared a special cash dividend of $2.00 per share and a regular annual cash dividend of $0.50 per share on all issued and outstanding shares of Common Stock and Class A Stock of the Company. Refer to Note 18 – “Subsequent Events” below.
NOTE 11 — EMPLOYEE BENEFIT PLANS
We maintain a contributory plan established pursuant to the provisions of section 401(k) of the Internal Revenue Code. The plan provides retirement benefits for all nonunion employees meeting minimum age and service requirements. We currently match 100% of the first three percent contributed by each employee and 50% of the next two percent contributed, up to certain maximums specified in the plan. Our expense for the 401(k) plan was as follows for the last three fiscal years:
| Year ended June 29, 2017 |
Year ended June 30, 2016 |
Year ended June 25, 2015 |
||||||||||
| 401(k) plan expense |
$ | 1,664 | $ | 1,604 | $ | 1,550 | ||||||
During the first quarter of fiscal 2009, we recorded a long-term liability of $868 for the withdrawal from the multiemployer plan (“Route pension”) for the step-van drivers that were employed for our store-door delivery system that was discontinued during fiscal 2008. Pursuant to terms of settlement with a labor union, we are making monthly payments of $8 (including interest) through April 2022.
The total Route pension liability was as follows for the last two fiscal years:
| June 29, 2017 |
June 30, 2016 |
|||||||
| Route pension liability |
$ | 397 | $ | 466 | ||||
Virtually all of our salaried employees participate in our Sanfilippo Value Added Plan (as amended, the “SVA Plan”) which is a cash incentive plan (an economic value added-based program) administered by our Compensation Committee. We accrue expense related to the SVA Plan in the annual period that the economic performance underlying such performance occurs. This method of expense recognition properly matches the expense associated with improved economic performance with the period the improved performance occurs on a systematic and rational basis. The SVA Plan payments are paid to participants in the first quarter of the following fiscal year.
NOTE 12 — RETIREMENT PLAN
The Supplemental Employee Retirement Plan (“SERP”) is an unfunded, non-qualified benefit plan that will provide eligible participants with monthly benefits upon retirement, disability or death, subject to certain conditions. Benefits paid to retirees are based on age at retirement, years of credited service, and average compensation. We use our fiscal year-end as the measurement date for the obligation calculation. Accounting guidance in ASC Topic 715, Compensation — Retirement Benefits requires the recognition of the funded status of the SERP on the Consolidated Balance Sheet. Actuarial gains or losses, prior service costs or credits and transition obligations that have not yet been recognized are recorded as a component of “Accumulated Other Comprehensive Loss” (“AOCL”).
The following table presents the changes in the projected benefit obligation for the fiscal years ended:
55
| June 29, 2017 |
June 30, 2016 |
|||||||
| Change in projected benefit obligation |
||||||||
| Projected benefit obligation at beginning of year |
$ | 22,791 | $ | 18,538 | ||||
| Service cost |
631 | 491 | ||||||
| Interest cost |
811 | 843 | ||||||
| Actuarial (gain) loss |
(1,938 | ) | 3,573 | |||||
| Benefits paid |
(654 | ) | (654 | ) | ||||
|
|
|
|
|
|||||
| Projected benefit obligation at end of year |
$ | 21,641 | $ | 22,791 | ||||
|
|
|
|
|
|||||
The accumulated benefit obligation, which represents benefits earned up to the measurement date, was $17,774 and $18,247 at June 29, 2017 and June 30, 2016, respectively.
Components of the actuarial (gain) loss portion of the change in projected benefit obligation are presented below for the fiscal years ended:
| June 29, 2017 |
June 30, 2016 |
June 25, 2015 |
||||||||||
| Actuarial Loss |
||||||||||||
| Change in assumed pay increases |
$ | 124 | $ | 68 | $ | 342 | ||||||
| Change in discount rate |
(1,402 | ) | 3,509 | (801 | ) | |||||||
| Change in mortality assumptions |
(193 | ) | (132 | ) | 2,150 | |||||||
| Change in bonus assumption |
— | — | 1,191 | |||||||||
| Other |
(467 | ) | 128 | 257 | ||||||||
|
|
|
|
|
|
|
|||||||
| Actuarial (gain) loss |
$ | (1,938 | ) | $ | 3,573 | $ | 3,139 | |||||
|
|
|
|
|
|
|
|||||||
The components of the net periodic pension cost are as follows for the fiscal years ended:
| June 29, 2017 |
June 30, 2016 |
June 25, 2015 |
||||||||||
| Service cost |
$ | 631 | $ | 491 | $ | 386 | ||||||
| Interest cost |
811 | 843 | 642 | |||||||||
| Recognized loss amortization |
365 | 50 | — | |||||||||
| Prior service cost amortization |
957 | 957 | 957 | |||||||||
|
|
|
|
|
|
|
|||||||
| Net periodic pension cost |
$ | 2,764 | $ | 2,341 | $ | 1,985 | ||||||
|
|
|
|
|
|
|
|||||||
Significant assumptions related to our SERP include the discount rate used to calculate the actuarial present value of benefit obligations to be paid in the future, the average rate of compensation expense increase by SERP participants, and anticipated mortality rates. The RP-2014 white collar fully generational mortality table with mortality improvement scale MP-2016 was utilized in the preparation of our pension obligation as of June 29, 2017.
We used the following assumptions to calculate the benefit obligation of our SERP as of the following dates:
| June 29, 2017 |
June 30, 2016 | |||
| Discount rate |
3.99% | 3.61% | ||
| Rate of compensation increases |
4.50% | 4.50% | ||
| Bonus payment |
60% - 85% of base, paid 4 of 5 years |
60% - 85% of base, paid 4 of 5 years |
We used the following assumptions to calculate the net periodic costs of our SERP as follows for the fiscal years ended:
56
| June 29, 2017 |
June 30, 2016 |
June 25, 2015 | ||||
| Discount rate |
3.61% | 4.63% | 4.37% | |||
| Rate of compensation increases |
4.50% | 4.50% | 4.50% | |||
| Mortality |
RP-2014 white collar with MP- 2015 scale |
RP-2014 white collar with MP- 2014 scale |
IRS 2014 (Unisex) | |||
| Bonus payment |
60% -85% of base, paid 4 of 5 years |
60% -85% of base, paid 4 of 5 years |
60% - 85% of base, paid 3 of 5 years |
The assumed discount rate is based, in part, upon a discount rate modeling process that considers both high quality long-term indices and the duration of the SERP plan relative to the durations implicit in the broader indices. The discount rate is utilized principally in calculating the actuarial present value of our obligation and periodic expense pursuant to the SERP. To the extent the discount rate increases or decreases, our SERP obligation is decreased or increased, respectively.
The following table presents the benefits expected to be paid in the next ten fiscal years:
| Fiscal year | ||||
| 2018 | $ | 647 | ||
| 2019 | 631 | |||
| 2020 | 612 | |||
| 2021 | 727 | |||
| 2022 | 699 | |||
| 2023 — 2027 | 4,635 | |||
At June 29, 2017 and June 30, 2016 the current portion of the SERP liability was $647 and $653, respectively, and recorded in Accrued payroll and related benefits on the Consolidated Balance Sheets.
The following table presents the components of AOCL that have not yet been recognized in net pension expense:
| June 29, 2017 |
June 30, 2016 |
|||||||
| Unrecognized net loss |
$ | (3,624 | ) | $ | (5,926 | ) | ||
| Unrecognized prior service cost |
(3,349 | ) | (4,306 | ) | ||||
| Tax effect |
2,569 | 3,807 | ||||||
|
|
|
|
|
|||||
| Net amount unrecognized |
$ | (4,404 | ) | $ | (6,425 | ) | ||
|
|
|
|
|
|||||
We expect to recognize $957 of the prior service cost and $162 of net loss into net periodic pension expense during the fiscal year ending June 28, 2018.
NOTE 13 — ACCUMULATED OTHER COMPREHENSIVE LOSS
The table below sets forth the changes to accumulated other comprehensive loss (“AOCL”) for the last two fiscal years. These changes are all related to our defined benefit pension plan.
| Changes to AOCL (a) | Year Ended June 29, 2017 |
Year Ended June 30, 2016 |
||||||
| Balance at beginning of period |
$ | (6,425 | ) | $ | (4,834 | ) | ||
| Other comprehensive income (loss) before reclassifications |
1,938 | (3,573 | ) | |||||
| Amounts reclassified from accumulated other comprehensive loss |
1,322 | 1,007 | ||||||
| Tax effect |
(1,239 | ) | 975 | |||||
|
|
|
|
|
|||||
| Net current-period other comprehensive income (loss) |
2,021 | (1,591 | ) | |||||
|
|
|
|
|
|||||
| Balance at end of period |
$ | (4,404 | ) | $ | (6,425 | ) | ||
|
|
|
|
|
|||||
| (a) | Amounts in parenthesis indicate debits/expense. |
The reclassifications out of accumulated other comprehensive loss for the last two fiscal years were as follows:
57
| Reclassifications from AOCL to earnings (b) | Year Ended June 29, 2017 |
Year Ended June 30, 2016 |
Affected line item in the Consolidated Statements of Comprehensive Income |
|||||||||
| Amortization of defined benefit pension items: |
||||||||||||
| Unrecognized prior service cost |
$ | (957 | ) | $ | (957 | ) | Administrative expenses | |||||
| Unrecognized net loss |
(365 | ) | (50 | ) | Administrative expenses | |||||||
|
|
|
|
|
|||||||||
| Total before tax |
(1,322 | ) | (1,007 | ) | ||||||||
| Tax effect |
502 | 383 | Income tax expense | |||||||||
|
|
|
|
|
|||||||||
| Amortization of defined pension items, net of tax |
$ | (820 | ) | $ | (624 | ) | ||||||
|
|
|
|
|
|||||||||
| (b) | Amounts in parenthesis indicate debits to expense. See Note 12 — “Retirement Plan” above for additional details. |
NOTE 14 — TRANSACTIONS WITH RELATED PARTIES
In addition to the related party transactions described in Note 5, we also purchased materials from a company that was formerly owned by three members of our Board of Directors, two of whom are also executive officers, and individuals directly related to them during the fiscal years listed below. Purchases from this related party aggregated to the following for the years ending:
| Year ended June 29, 2017 |
Year ended June 30, 2016 |
Year ended June 25, 2015 |
||||||||||
| Purchases from related party |
$ | 8,043 | $ | 7,138 | $ | 10,969 | ||||||
|
|
|
|
|
|
|
|||||||
Accounts payable to this related entity aggregated to the following for the fiscal years ending:
| June 29, 2017 |
$ | 178 | ||
| June 30, 2016 |
113 |
NOTE 15 — PRODUCT TYPE SALES MIX
The following summarizes sales by product type as a percentage of total gross sales. The information is based upon gross sales, rather than net sales, because certain adjustments, such as promotional discounts, are not allocable to product types, for the fiscal year ended:
| Product Type |
June 29, 2017 |
June 30, 2016 |
June 25, 2015 |
|||||||||
| Peanuts |
15.7 | % | 13.9 | % | 13.7 | % | ||||||
| Pecans |
16.2 | 13.1 | 12.7 | |||||||||
| Cashews & Mixed Nuts |
24.3 | 23.3 | 22.0 | |||||||||
| Walnuts |
8.4 | 9.4 | 11.0 | |||||||||
| Almonds |
16.3 | 23.0 | 23.4 | |||||||||
| Trail & Snack Mixes |
13.9 | 12.4 | 12.0 | |||||||||
| Other |
5.2 | 4.9 | 5.2 | |||||||||
|
|
|
|
|
|
|
|||||||
| 100.0 | % | 100.0 | % | 100.0 | % | |||||||
|
|
|
|
|
|
|
|||||||
58
NOTE 16 — VALUATION AND QUALIFYING ACCOUNTS AND RESERVES
The following table details the activity in various allowance and reserve accounts.
| Description |
Balance at Beginning of Period |
Additions | Deductions | Balance at End of Period |
||||||||||||
| June 29, 2017 |
||||||||||||||||
| Allowance for doubtful accounts |
$ | 397 | $ | 58 | $ | (192 | ) | $ | 263 | |||||||
| Reserve for cash discounts |
975 | 12,274 | (12,399 | ) | 850 | |||||||||||
| Reserve for customer deductions |
2,918 | 16,116 | (16,055 | ) | 2,979 | |||||||||||
| Deferred tax asset valuation allowance |
171 | — | — | 171 | ||||||||||||
|
|
|
|
|
|
|
|
|
|||||||||
| Total |
$ | 4,461 | $ | 28,448 | $ | (28,646 | ) | $ | 4,263 | |||||||
|
|
|
|
|
|
|
|
|
|||||||||
| June 30, 2016 |
||||||||||||||||
| Allowance for doubtful accounts |
$ | 235 | $ | 199 | $ | (37 | ) | $ | 397 | |||||||
| Reserve for cash discounts |
800 | 12,928 | (12,753 | ) | 975 | |||||||||||
| Reserve for customer deductions |
1,931 | 15,351 | (14,364 | ) | 2,918 | |||||||||||
| Deferred tax asset valuation allowance |
175 | — | (4 | ) | 171 | |||||||||||
|
|
|
|
|
|
|
|
|
|||||||||
| Total |
$ | 3,141 | $ | 28,478 | $ | (27,158 | ) | $ | 4,461 | |||||||
|
|
|
|
|
|
|
|
|
|||||||||
| June 25, 2015 |
||||||||||||||||
| Allowance for doubtful accounts |
$ | 209 | $ | 36 | $ | (10 | ) | $ | 235 | |||||||
| Reserve for cash discounts |
650 | 12,341 | (12,191 | ) | 800 | |||||||||||
| Reserve for customer deductions |
2,351 | 9,541 | (9,961 | ) | 1,931 | |||||||||||
| Deferred tax asset valuation allowance |
175 | — | — | 175 | ||||||||||||
|
|
|
|
|
|
|
|
|
|||||||||
| Total |
$ | 3,385 | $ | 21,918 | $ | (22,162 | ) | $ | 3,141 | |||||||
|
|
|
|
|
|
|
|
|
|||||||||
NOTE 17 — SUPPLEMENTARY QUARTERLY DATA (Unaudited)
The following unaudited quarterly consolidated financial data are presented for fiscal 2017 and fiscal 2016. Quarterly financial results necessarily rely on estimates and caution is required in drawing specific conclusions from quarterly consolidated results.
| First Quarter |
Second Quarter |
Third Quarter |
Fourth Quarter |
|||||||||||||
| Year Ended June 29, 2017: |
||||||||||||||||
| Net sales |
$ | 222,293 | $ | 249,375 | $ | 173,376 | $ | 201,591 | ||||||||
| Gross profit |
36,475 | 43,389 | 28,426 | 33,633 | ||||||||||||
| Income from operations |
16,556 | 19,742 | 10,430 | 11,616 | ||||||||||||
| Net income |
10,180 | 12,885 | 6,336 | 6,724 | ||||||||||||
| Basic earnings per common share |
$ | 0.90 | $ | 1.14 | $ | 0.56 | $ | 0.59 | ||||||||
| Diluted earnings per common share |
$ | 0.89 | $ | 1.13 | $ | 0.55 | $ | 0.59 | ||||||||
| Cash dividends declared per common share |
$ | 2.50 | $ | 2.50 | $ | — | $ | — | ||||||||
| First Quarter |
Second Quarter |
Third Quarter |
Fourth Quarter* |
|||||||||||||
| Year Ended June 30, 2016: |
||||||||||||||||
| Net sales |
$ | 225,777 | $ | 279,002 | $ | 215,742 | $ | 231,538 | ||||||||
| Gross profit |
33,205 | 45,011 | 25,588 | 33,664 | ||||||||||||
| Income from operations |
13,745 | 19,692 | 5,469 | 12,406 | ||||||||||||
| Net income |
7,990 | 12,050 | 3,078 | 7,277 | ||||||||||||
| Basic earnings per common share |
$ | 0.71 | $ | 1.07 | $ | 0.27 | $ | 0.65 | ||||||||
| Diluted earnings per common share |
$ | 0.71 | $ | 1.07 | $ | 0.27 | $ | 0.64 | ||||||||
| Cash dividends declared per common share |
$ | — | $ | 2.00 | $ | — | $ | — | ||||||||
| * | The fourth quarter of fiscal 2016 contained one additional week compared to fiscal 2017. |
59
NOTE 18 — SUBSEQUENT EVENTS
On July 7, 2017, we entered into the Eighth Amendment to Credit Agreement (the “Eighth Amendment”) which eliminated the quarterly restriction on cash dividends and distributions and allows the Company to, without obtaining lender consent, make up to four cash dividends or distributions on its stock per fiscal year, or purchase, acquire, redeem or retire its stock in any fiscal year, in an amount not to exceed $60,000 in the aggregate per fiscal year, as long as no default or event of default exists and the excess availability under the Credit Agreement remains over $30,000 immediately before and after giving effect to any such dividend, distribution, purchase or redemption.
On July 11, 2017, our Board of Directors declared a special cash dividend of $2.00 per share and a regular annual cash dividend of $0.50 per share on all issued and outstanding shares of Common Stock and Class A Stock of the Company (the “July 2017 Dividends”). The July 2017 Dividends of approximately $28,370 were paid on August 15, 2017 to stockholders of record as of the close of business on August 2, 2017.
60
Item 9 — Changes in and Disagreements with Accountants on Accounting and Financial Disclosure
None.
Item 9A — Controls and Procedures
Disclosure Controls and Procedures
Under the supervision and with the participation of our management, including our Chief Executive Officer (“CEO”) and Chief Financial Officer (“CFO”), we conducted an evaluation of the effectiveness of our disclosure controls and procedures, as such term is defined in Rules 13a-15(e) and 15d-15(e) promulgated under the Exchange Act, as of the end of the period covered by this Annual Report on Form 10-K. Based on this evaluation, our CEO and CFO concluded that, as of June 29, 2017, our disclosure controls and procedures were effective to provide reasonable assurance that information required to be disclosed by us in reports that we file or submit under the Exchange Act is recorded, processed, summarized and reported within the time periods specified in SEC rules and forms and is accumulated and reported to our management, including our CEO and CFO, as appropriate to allow timely decisions regarding required disclosure.
Management’s Report on Internal Control over Financial Reporting
Our management is responsible for establishing and maintaining adequate internal control over financial reporting, as such term is defined in Exchange Act Rule 13a-15(f) and 15d-15(f). Under the supervision and with the participation of our management, including our CEO and CFO, we carried out an evaluation of the effectiveness of our internal control over financial reporting as of June 29, 2017, based on the Internal Control-Integrated Framework (2013) issued by the Committee of Sponsoring Organizations of the Treadway Commission. Based on this evaluation, our management has concluded that our internal control over financial reporting was effective as of June 29, 2017.
The effectiveness of our internal control over financial reporting as of June 29, 2017 has been audited by PricewaterhouseCoopers LLP, an independent registered public accounting firm, as stated in their report contained in this Annual Report on Form 10-K.
Changes in Internal Control over Financial Reporting
There were no changes in internal control over financial reporting that occurred during the fourth fiscal quarter ended June 29, 2017 that have materially affected, or are reasonably likely to materially affect, our internal control over financial reporting.
Limitations on the Effectiveness of Controls
Our management, including our CEO and CFO, does not expect that the Disclosure Controls and Procedures or our Internal Control over Financial Reporting will prevent or detect all errors and all fraud. A control, no matter how well designed and operated, can provide only reasonable, not absolute, assurance that the control’s objectives will be met. Further, the design of a control must reflect the fact that there are resource constraints, and the benefits of controls must be considered relative to their costs. Because of the inherent limitations in all internal controls, no evaluation of controls can provide absolute assurance that all control issues and instances of fraud, if any, within the Company have been detected. These inherent limitations include the realities that judgments in decision-making can be faulty, and that breakdowns can occur because of simple error or mistake. Controls can also be circumvented by the individual acts of some persons, by collusion of two or more people, or by management override of the controls. The design of any control is based in part upon certain assumptions about the likelihood of future events, and there can be no assurance that any design will succeed in achieving its stated goals under all potential future conditions. Over time, controls may become inadequate because of changes in conditions or deterioration in the degree of compliance with associated policies or procedures. Because of the inherent limitations in a cost-effective control, misstatements due to error or fraud may occur and may not be detected.
Item 9B — Other Information
Not applicable
PART III
Item 10 — Directors, Executive Officers and Corporate Governance
The Sections entitled “Nominees for Election by The Holders of Common Stock,” “Nominees for Election by The Holders of Class A Stock”, “Section 16(a) Beneficial Ownership Reporting Compliance” and “Corporate Governance — Board Meetings and Committees — Audit Committee” and “Corporate Governance — Independence of the Audit Committee” of our Proxy Statement for the 2017 Annual Meeting and filed pursuant to Regulation 14A are incorporated herein by reference. Other certain information relating to the directors and executive officers of the Company is included immediately before Part II of this Report.
We have adopted a Code of Ethics applicable to the principal executive, financial and accounting officers (“Code of Ethics”) and a separate Code of Conduct applicable to all employees and directors generally (“Code of Conduct”). The Code of Ethics and Code of Conduct are available on our website at www.jbssinc.com.
61
Item 11 — Executive Compensation
The Sections entitled “Compensation of Directors and Executive Officers”, “Compensation Discussion and Analysis”, “Compensation Committee Interlocks and Insider Participation” and “Compensation Committee Report” of our Proxy Statement for the 2017 Annual Meeting are incorporated herein by reference.
Item 12 — Security Ownership of Certain Beneficial Owners and Management and Related Stockholder Matters
The Section entitled “Security Ownership of Certain Beneficial Owners and Management” of our Proxy Statement for the 2017 Annual Meeting is incorporated herein by reference. Other certain information relating to the directors and executive officers of the Company is included immediately before Part II of this Report.
Item 13 — Certain Relationships and Related Transactions, and Director Independence
The Sections entitled “Corporate Governance — Independence of the Board of Directors” and “Review of Related Party Transactions” of our Proxy Statement for the 2017 Annual Meeting are incorporated herein by reference. Other certain information relating to the directors and executive officers of the Company is included immediately before Part II of this Report.
Item 14 — Principal Accounting Fees and Services
The information under the proposal entitled “Ratify the Audit Committee’s Appointment of PricewaterhouseCoopers LLP as our Independent Registered Public Accounting Firm for the 2018 fiscal year” of our Proxy Statement for the 2017 Annual Meeting is incorporated herein by reference.
PART IV
Item 15 — Exhibits, Financial Statement Schedules
(a) (1) Financial Statements
The following financial statements are included in Part II, Item 8 — “Financial Statements and Supplementary Data”:
Report of Independent Registered Public Accounting Firm
Consolidated Statements of Comprehensive Income for the Year Ended June 29, 2017, the Year Ended June 30, 2016 and the Year Ended June 25, 2015
Consolidated Balance Sheets as of June 29, 2017 and June 30, 2016
Consolidated Statements of Stockholders’ Equity for the Year Ended June 29, 2017, the Year Ended June 30, 2016 and the Year Ended June 25, 2015
Consolidated Statements of Cash Flows for the Year Ended June 29, 2017, the Year Ended June 30, 2016 and the Year Ended June 25, 2015
Notes to Consolidated Financial Statements
(a) (2) Financial Statement Schedules
All schedules are omitted because they are not applicable or the required information is shown in the Consolidated Financial Statements or Notes thereto.
(a) (3) Exhibits
The exhibits required by Item 601 of Regulation S-K and filed herewith are listed in the Exhibit Index which follows the signature page and immediately precedes the exhibits filed.
(b) Exhibits
See Item 15(a)(3) above.
62
(c) Financial Statement Schedules
See Item 15(a)(2) above.
Item 16 — Form 10-K Summary
None
63
SIGNATURES
Pursuant to the requirements of Section 13 or 15(d) of the Securities Exchange Act of 1934, the Registrant has duly caused this report to be signed on its behalf by the undersigned, thereunto duly authorized.
| JOHN B. SANFILIPPO & SON, INC. | ||||||
| Date: August 23, 2017 | By: | /s/ Jeffrey T. Sanfilippo | ||||
| Jeffrey T. Sanfilippo | ||||||
| Chief Executive Officer | ||||||
Pursuant to the requirements of the Securities Exchange Act of 1934, this report has been signed below by the following persons on behalf of the Registrant in the capacities and on the dates indicated.
| Name |
Title |
Date | ||
| /s/ Jeffrey T. Sanfilippo Jeffrey T. Sanfilippo |
Chief Executive Officer and Director (Principal Executive Officer) |
August 23, 2017 | ||
| /s/ Michael J. Valentine Michael J. Valentine |
Chief Financial Officer, Group President, Secretary and Director (Principal Financial Officer) | August 23, 2017 | ||
| /s/ Frank S. Pellegrino Frank S. Pellegrino |
Senior Vice President, Finance, Corporate Controller and Treasurer (Principal Accounting Officer) |
August 23, 2017 | ||
| /s/ Mathias A. Valentine Mathias A. Valentine |
Director | August 23, 2017 | ||
| /s/ Jim Edgar Jim Edgar |
Director | August 23, 2017 | ||
| /s/ Timothy R. Donovan Timothy R. Donovan |
Director | August 23, 2017 | ||
| /s/ Jasper B. Sanfilippo, Jr. Jasper B. Sanfilippo, Jr. |
Director | August 23, 2017 | ||
| /s/ Daniel M. Wright Daniel M. Wright |
Director | August 23, 2017 | ||
| /s/ Ellen C. Taaffe Ellen C. Taaffe |
Director | August 23, 2017 | ||
| /s/ James J. Sanfilippo James J. Sanfilippo |
Director | August 23, 2017 | ||
64
EXHIBIT INDEX
(Pursuant to Item 601 of Regulation S-K)
| No. |
Description |
Location | ||||
| 3.1 | Restated Certificate of Incorporation of the Company | Exhibit 3.1 to the Form 10-Q for the quarter ended March 24, 2005 | ||||
| 3.2 | Amended and Restated Bylaws of the Company | Exhibit 3.2 to the Form 10-K for the fiscal year ended June 25, 2015 | ||||
| * | 10.1 | 1998 Equity Incentive Plan | Exhibit 10 to the Form 10-Q for the quarter ended September 24, 1998 | |||
| * | 10.2 | First Amendment to the 1998 Equity Incentive Plan | Exhibit 10.35 to the Form 10-Q for the quarter ended December 28, 2000 | |||
| * | 10.3 | Amended and Restated John B. Sanfilippo & Son, Inc. Split-Dollar Insurance Agreement Number Two among Michael J. Valentine, as trustee of the Valentine Life Insurance Trust, Mathias Valentine, Mary Valentine and the Company, dated December 31, 2003 | Exhibit 10.35 to the Form 10-Q for the quarter ended December 25, 2003 | |||
| * | 10.4 | Amendment, dated February 12, 2004, to Amended and Restated John B. Sanfilippo & Son, Inc. Split-Dollar Insurance Agreement Number Two among Michael J. Valentine, as trustee of the Valentine Life Insurance Trust, Mathias Valentine, Mary Valentine and the Company, dated December 31, 2003 | Exhibit 10.47 to the Form 10-Q for the quarter ended March 25, 2004 | |||
| * | 10.5 | Restated Supplemental Retirement Plan | Exhibit 10.16 to the Form 10-K for the fiscal year ended June 28, 2007 | |||
| * | 10.6 | 2008 Equity Incentive Plan, as amended | Exhibit 10.24 to the Form 10-K for the fiscal year ended June 28, 2012 | |||
| * | 10.7 | Form of Indemnification Agreement | Exhibit 10.01 to the Form 8-K filed on May 5, 2009 | |||
| * | 10.8 | 2014 Omnibus Incentive Plan | Exhibit 4.1 to the Registration Statement on Form S-8 filed on October 28, 2014 (File No. 333-199637) | |||
| * | 10.9 | Amendment No. 1 to the 2014 Omnibus Incentive Plan | Exhibit 10.12 to the Form 10-K for the year ended June 30, 2016 | |||
| * | 10.10 | Form of Non-Employee Director Restricted Stock Unit Award Agreement (non-deferral) under 2014 Omnibus Plan (fiscal 2016 and 2017 awards cycle) | Exhibit 10.38 to the Form 10-Q for the quarter ended December 24, 2015 | |||
65
| No. |
Description |
Location | ||||
| * | 10.11 | Form of Non-Employee Director Restricted Stock Unit Award Agreement (deferral) under 2014 Omnibus Plan (fiscal 2016 and 2017 awards cycle) | Exhibit 10.39 to the Form 10-Q for the quarter ended December 24, 2015 | |||
| * | 10.12 | Form of Employee Restricted Stock Unit Award Agreement under 2014 Omnibus Plan (fiscal 2016 awards cycle) | Exhibit 10.40 to the Form 10-Q for the quarter ended December 24, 2015 | |||
| * | 10.13 | Form of Employee Restricted Stock Unit Award Agreement under 2014 Omnibus Plan (fiscal 2017 awards cycle) | Exhibit 10.18 to the Form 10-Q for the quarter ended December 29, 2016 | |||
| * | 10.14 | Retirement Agreement and General Release with Walter “Bobby” Tankersley, effective August 25, 2016 | Exhibit 10.19 to the Form 10-K for the year ended June 30, 2016 | |||
| * | 10.15 | Amended and Restated Sanfilippo Value Added Plan, dated August 20, 2015 | Exhibit 10.11 to the Form 10-K for the year ended June 25, 2015 | |||
| 10.16 | Credit Agreement, dated as of February 7, 2008, by and among the Company, the financial institutions named therein as lenders, Wells Fargo Foothill, LLC (“WFF”), as the arranger and administrative agent for the lenders, and Wachovia Capital Finance Corporation (Central), in its capacity as documentation agent | Exhibit 10.1 to the Form 8-K filed on February 8, 2008 | ||||
| 10.17 | Security Agreement, dated as of February 7, 2008, by the Company in favor of WFF, as administrative agent for the lenders | Exhibit 10.2 to the Form 8-K filed on February 8, 2008 | ||||
| 10.18 | Loan Agreement, dated as of February 7, 2008, by and between the Company and Transamerica Financial Life Insurance Company (“TFLIC”) | Exhibit 10.3 to the Form 8-K filed on February 8, 2008 | ||||
| 10.19 | First Amendment to Credit Agreement, dated as of March 8, 2010, by and among the Company, Wells Fargo Capital Finance, LLC (f/k/a WFF), as a lender and administrative agent and Burdale Financial Limited, as a lender | Filed herewith | ||||
| 10.20 | Second Amendment to Credit Agreement, dated as of July 15, 2011, by and among the Company, Wells Fargo Capital Finance, LLC (f/k/a WFF), as a lender and administrative agent, and Southwest Georgia Farm Credit, ACA for itself and as agent/nominee for Southwest Georgia Farm Credit, FLCA, as a lender | Exhibit 10.1 to the Form 8-K filed on July 18, 2011 | ||||
| 10.21 | Third Amendment to Credit Agreement, dated as of October 31, 2011, by and among the Company, Wells Fargo Capital Finance, LLC (f/k/a WFF), as a lender and administrative agent, and Southwest Georgia Farm Credit, ACA, for itself and as agent/nominee for Southwest Georgia Farm Credit, FLCA, as a lender | Exhibit 10.34 to the Form 10-Q for the quarter ended September 29, 2011 | ||||
| 10.22 | Consent and Fourth Amendment to Credit Agreement, dated as of January 22, 2013, by and among the Company, Wells Fargo Capital Finance, LLC (f/k/a WFF), as a lender and administrative agent, and Southwest Georgia Farm Credit, ACA, for itself and as agent/nominee for Southwest Georgia Farm Credit, FLCA, as a lender | Exhibit 99.1 to the Form 8-K filed on February 4, 2013 | ||||
| 10.23 | Consent and Fifth Amendment to Credit Agreement, dated as of December 16, 2013, by and among the Company, Wells Fargo Capital Finance, LLC (f/k/a WFF), as a lender and administrative agent, and Southwest Georgia Farm Credit, ACA, for itself and as agent/nominee for Southwest Georgia Farm Credit, FLCA, as a lender | Exhibit 99.1 to the Form 8-K filed on December 17, 2013 | ||||
66
| No. |
Description |
Location | ||
| 10.24 | Sixth Amendment to Credit Agreement, dated as of September 30, 2014, by and among the Company, Wells Fargo Capital Finance, LLC (f/k/a WFF), as a lender and administrative agent, and Southwest Georgia Farm Credit, ACA, as lender. | Exhibit 10.1 to the Form 8-K filed on October 3, 2014 | ||
| 10.25 | Seventh Amendment to Credit Agreement, dated as of July 7, 2016, by and among John B. Sanfilippo & Son, Inc., Wells Fargo Capital Finance, LLC (f/k/a WFF), as a lender and the administrative agent, and Southwest Georgia Farm Credit, ACA, as a lender. | Exhibit 99.2 to the Form 8-K filed on July 7, 2016 | ||
| 10.26 | Eighth Amendment to Credit Agreement, dated as of July 7, 2017, by and among John B. Sanfilippo & Son, Inc., Wells Fargo Capital Finance, LLC (f/k/a WFF), as a lender and the administrative agent, and Southwest Georgia Farm Credit, ACA, as a lender. | Exhibit 99.1 to the Form 8-K filed on July 11, 2017 | ||
| 10.27 | First Amendment to Security Agreement, dated as of September 30, 2014, by the Company in favor of Wells Fargo Capital Finance, LLC (f/k/a WFF), as administrative agent for the lenders | Exhibit 10.2 to the Form 8-K filed on October 3, 2014 | ||
| 14 | Code of Ethics, as amended | Exhibit 14 to the Form 10-K for the fiscal year ended June 25, 2015 | ||
| 21 | Subsidiaries of the Company | Filed herewith | ||
| 23 | Consent of PricewaterhouseCoopers LLP | Filed herewith | ||
| 31.1 | Certification of Jeffrey T. Sanfilippo pursuant to Section 302 of the Sarbanes-Oxley Act of 2002, as amended | Filed herewith | ||
| 31.2 | Certification of Michael J. Valentine pursuant to Section 302 of the Sarbanes-Oxley Act of 2002, as amended | Filed herewith | ||
| 32.1 | Certification of Jeffrey T. Sanfilippo pursuant to 18 U.S.C. Section 1350, as adopted pursuant to Section 906 of the Sarbanes-Oxley Act of 2002, as amended | Furnished herewith | ||
| 32.2 | Certification of Michael J. Valentine pursuant to 18 U.S.C. Section 1350, as adopted pursuant to Section 906 of the Sarbanes-Oxley Act of 2002, as amended | Furnished herewith | ||
| 101.INS | XBRL Instance Document | Filed herewith | ||
| 101.SCH | XBRL Taxonomy Extension Schema Document | Filed herewith | ||
| 101.CAL | XBRL Taxonomy Extension Calculation Linkbase Document | Filed herewith | ||
| 101.DEF | XBRL Taxonomy Extension Definition Linkbase Document | Filed herewith | ||
| 101.LAB | XBRL Taxonomy Extension Label Linkbase Document | Filed herewith | ||
| 101.PRE | XBRL Taxonomy Extension Presentation Linkbase Document | Filed herewith | ||
| * | Indicates a management contract or compensatory plan or arrangement. |
67