Attached files
| file | filename |
|---|---|
| 8-K - 8-K - US BANCORP \DE\ | d54460d8k.htm |
| EX-99.1 - EX-99.1 - US BANCORP \DE\ | d54460dex991.htm |
 U.S.
Bancorp 3Q15 Earnings
Conference Call Richard K. Davis Chairman, President and CEO October 15, 2015 Kathy Rogers Vice Chairman and CFO Exhibit 99.2 |
| 2 U.S. BANCORP | Forward-looking Statements and Additional Information The following information appears in accordance with the Private Securities Litigation Reform Act of 1995: This presentation contains forward-looking statements about U.S. Bancorp. Statements that are not historical or current facts, including statements about beliefs and expectations, are forward-looking statements and are based on the information available to, and assumptions and estimates made by, management as of the date made. These forward-looking statements cover, among other things, anticipated future revenue and expenses and the future plans and prospects of U.S. Bancorp. Forward-looking statements involve inherent risks and uncertainties, and important factors could cause actual results to differ materially from those anticipated. A reversal or slowing of the current economic recovery or another severe contraction could adversely affect U.S. Bancorp’s revenues and the values of its assets and liabilities. Global financial markets could experience a recurrence of significant turbulence, which could reduce the availability of funding to certain financial institutions and lead to a tightening of credit, a reduction of business activity, and increased market volatility. Stress in the commercial real estate markets, as well as a downturn in the residential real estate markets, could cause credit losses and deterioration in asset values. In addition, U.S. Bancorp’s business and financial performance is likely to be negatively impacted by recently enacted and future legislation and regulation. U.S. Bancorp’s results could also be adversely affected by deterioration in general business and economic conditions; changes in interest rates; deterioration in the credit quality of its loan portfolios or in the value of the collateral securing those loans; deterioration in the value of securities held in its investment securities portfolio; legal and regulatory developments; litigation; increased competition from both banks and non-banks; changes in customer behavior and preferences; breaches in data security; effects of mergers and acquisitions and related integration; effects of critical accounting policies and judgments; and management’s ability to effectively manage credit risk, residual value risk, market risk, operational risk, compliance risk, strategic risk, interest rate risk, liquidity risk and reputational risk.
For discussion of these and other risks that may cause actual results to differ from
expectations, refer to U.S. Bancorp’s Annual Report on Form 10-K for the year ended December 31, 2014, on file with the Securities and Exchange Commission, including the sections entitled “Risk Factors” and “Corporate Risk Profile” contained in Exhibit 13, and all subsequent filings with the Securities and Exchange Commission under Sections 13(a), 13(c), 14 or 15(d) of the Securities Exchange Act of 1934. Forward-looking statements speak only as of the date they are made, and U.S. Bancorp undertakes no obligation to update them in light of new information or future events. This presentation includes non-GAAP financial measures to describe U.S. Bancorp’s performance. The calculations of these measures are provided within or in the appendix of the presentation. These disclosures should not be viewed as a substitute for operating results determined in accordance with GAAP, nor are they necessarily comparable to non-GAAP performance measures that may be presented by other companies. |
| 3 U.S. BANCORP | 3Q15 Highlights • Net income of $1.5 billion; record $0.81 per diluted common share • Average loan growth* of 1.3% vs. 2Q15 and 3.8% vs. 3Q14 • Average deposit growth of 1.4% vs. 2Q15 and 6.9% vs. 3Q14 • Positive trends in payments-related fee revenue – Credit and debit card revenue increased 7.2% vs. 3Q14 – Merchant processing services increased 8.5% vs. 3Q14 (excluding the impact of foreign currency rate changes) • Net charge-offs declined 13.1% vs. 3Q14 and 1.4% vs. 2Q15 • Nonperforming assets continue to improve (declined 18.5% vs. 3Q14) • Capital generation continues to reinforce capital position – Common equity tier 1 capital ratio of 9.2% estimated for the Basel III fully implemented standardized approach • Returned 80% of earnings to shareholders in 3Q15 * Loan growth excludes student loans which were transferred to held for sale at the end of 1Q15 and returned to held for investment during
3Q15 |
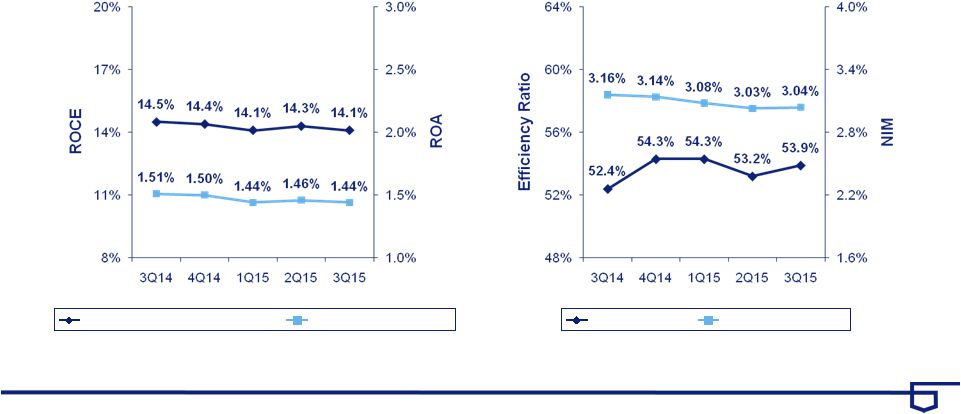 4 U.S. BANCORP | Performance Ratios Return on Average Common Equity and Return on Average Assets Efficiency Ratio and Net Interest Margin Return on Avg Common Equity Return on Avg Assets Efficiency Ratio Net Interest Margin Efficiency ratio computed as noninterest expense divided by the sum of net interest income on a taxable-equivalent basis and noninterest
income excluding net securities gains (losses)
|
 5 U.S. BANCORP | 3Q15 Notable Impacts to 3Q15 Earnings • Student Loan Market Adjustment ($58) million • Elevated 3Q15 Expenses ($60) million (not expected to repeat in 4Q15) – Mortgage-related Compliance – Talent Upgrade • Visa Gain $135 million Total Impact Relatively Neutral |
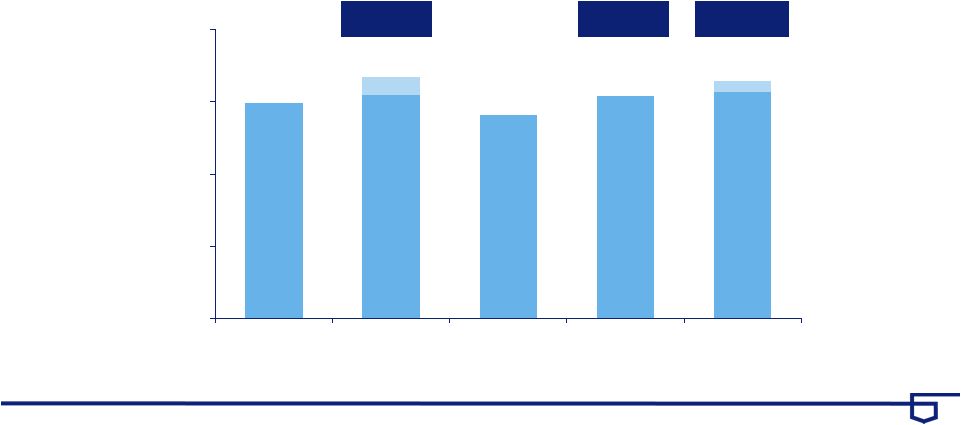 6 U.S. BANCORP | Revenue Growth Notable items: 2Q14 Visa gain $214 million; 4Q14 Nuveen gain $124 million; 3Q15 VISA gain $135 million, student loan market value adjustment
($58) million Taxable-equivalent basis
Year-Over-Year Change
2.0% 5.7% 1.9% (2.8%) 3.1% $ in millions $4,990 $5,169 $4,906 $5,042 $5,147 $124 $77 3,500 4,000 4,500 5,000 5,500 3Q14 4Q14 1Q15 2Q15 3Q15 3.2% excluding 4Q14 notable 1.6% excluding 3Q15 notable 1.4% excluding 2Q14 notable |
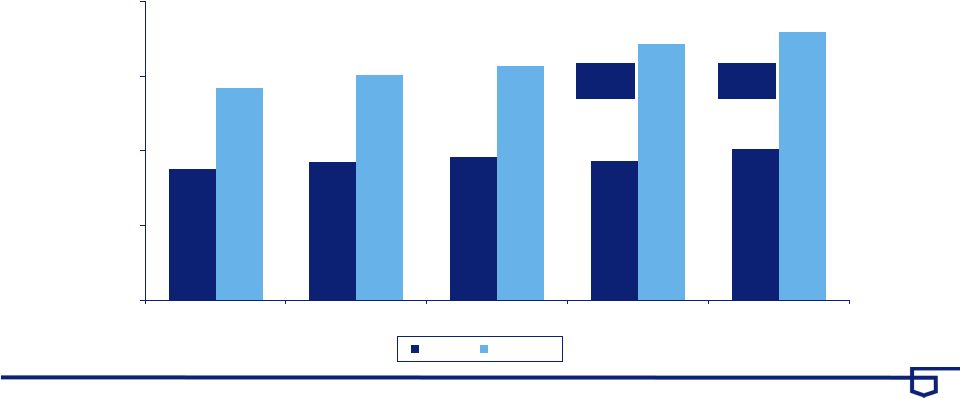 7 U.S. BANCORP | Loan and Deposit Growth Year-Over-Year Growth Average Balances 200 225 250 275 300 3Q14 4Q14 1Q15 2Q15 3Q15 Loans Deposits 5.1% $248.0 2.5% $246.6 2.7% $250.5 6.3% $243.9 5.9% $246.4 8.1% $278.5 8.9% $285.7 6.9% $289.7 7.4% $271.0 7.2% $275.5 $ in billions * Excluding student loans which were transferred to held for sale at the end of 1Q15 and returned to held for investment during 3Q15
3.8% adjusted* 4.0% adjusted* |
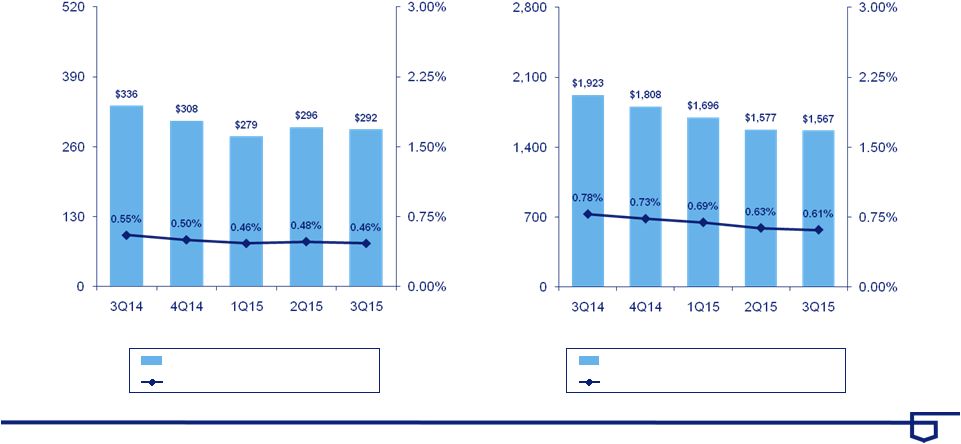 8 U.S. BANCORP | Credit Quality Net Charge-offs Nonperforming Assets Net Charge-offs (Left Scale) NCOs to Avg Loans (Right Scale) Nonperforming Assets (Left Scale) NPAs to Loans plus ORE (Right Scale) $ in millions |
 9 U.S. BANCORP | Earnings Summary Taxable-equivalent basis $ and shares in millions, except per-share data YTD YTD 3Q15 2Q15 3Q14 vs 2Q15 vs 3Q14 2015 2014 %B/(W) Net Interest Income 2,821 $ 2,770 $ 2,748 $ 1.8 2.7 8,343 $ 8,198 $ 1.8 Noninterest Income 2,326 2,272 2,242 2.4 3.7 6,752 6,794 (0.6) Net Revenue 5,147 5,042 4,990 2.1 3.1 15,095 14,992 0.7 Noninterest Expense 2,775 2,682 2,614 (3.5) (6.2) 8,122 7,911 (2.7) Operating Income 2,372 2,360 2,376 0.5 (0.2) 6,973 7,081 (1.5) Net Charge-offs 292 296 336 1.4 13.1 867 1,026 15.5 Excess Provision (10) (15) (25) (33.3) (60.0) (40) (85) (52.9) Income before Taxes 2,090 2,079 2,065 0.5 1.2 6,146 6,140 0.1 Applicable Income Taxes 587 582 579 (0.9) (1.4) 1,702 1,733 1.8 Noncontrolling Interests (14) (14) (15) - 6.7 (41) (44) 6.8 Net Income 1,489 1,483 1,471 0.4 1.2 4,403 4,363 0.9 Preferred Dividends/Other 67 66 66 (1.5) (1.5) 199 200 0.5 NI to Common 1,422 $ 1,417 $ 1,405 $ 0.4 1.2 4,204 $ 4,163 $ 1.0 Diluted EPS 0.81 $ 0.80 $ 0.78 $ 1.3 3.8 2.36 $ 2.29 $ 3.1 Average Diluted Shares 1,766 1,779 1,807 0.7 2.3 1,778 1,819 2.3 % B/(W) |
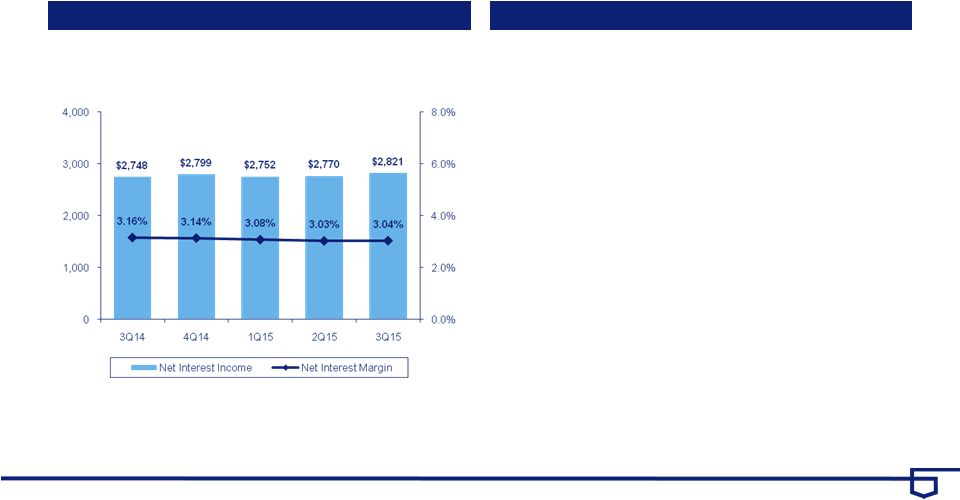 10 U.S. BANCORP | Net Interest Income Net Interest Income Key Points vs. 3Q14 • Average earning assets grew $22.8 billion, or 6.6% • Net interest margin lower 12 bps (3.04% vs. 3.16%) – Change in loan portfolio mix, as well as growth in the investment portfolio at lower average rates and lower reinvestment rates on investment securities vs. 2Q15 • Average earning assets grew $2.8 billion, or 0.8% • Net interest margin higher 1 bp (3.04% vs. 3.03%) – Principally due to earning assets growth and continued deposit growth – Partially offset by growth in lower rate investment securities along with lower investment portfolio reinvestment rates Year-Over-Year Change 1.3% 2.4% 1.7% 0.9% 2.7% $ in millions Taxable-equivalent basis |
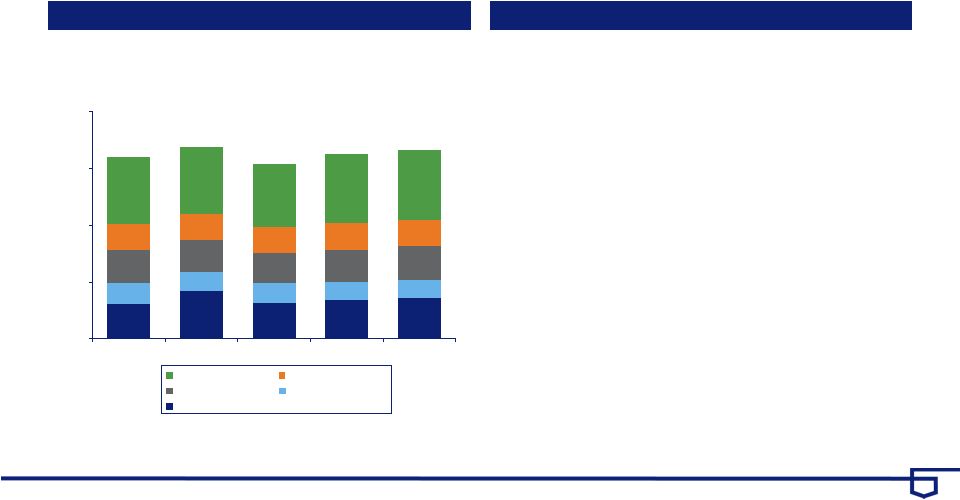 11 U.S. BANCORP | Noninterest Income $432 $587 $446 $472 $505 $260 $235 $240 $231 $224 $402 $396 $376 $396 $409 $315 $322 $322 $334 $329 $833 $830 $770 $839 $859 0 700 1,400 2,100 2,800 3Q14 4Q14 1Q15 2Q15 3Q15 Noninterest Income Key Points vs. 3Q14 • Noninterest income increased $84 million, or 3.7% – Higher other income, principally due to the Visa sale, partially offset by the student loan market valuation adjustment – Higher credit and debit card revenue (7.2% increase) due to higher transaction volumes and higher merchant processing services revenue (3.4% increase) due to higher transaction volumes, account growth and equipment sales to merchants – Higher trust and investment management fees (4.4% increase) – Higher commercial products revenue (10.5% increase) due to higher volume of tax-advantaged project fees and an increase in bond underwriting fees – Lower mortgage banking revenue primarily due to an unfavorable change in the valuation of MSRs, net of hedging activities vs. 2Q15 • Noninterest income increased $54 million, or 2.4% – Higher other income, primarily driven by changes in equity investment income including the Visa sale, partially offset by the student loan market valuation adjustment and a decrease in trading revenue – Higher commercial products revenue (7.9% increase) due to higher wholesale transaction activity – Higher corporate payment products revenue (6.7% increase) and deposit service charges (6.3% increase) due to seasonally higher transaction volumes Year-Over-Year Change 3.0% 9.9% 2.2% (7.0%) 3.7% $2,326 $2,242 $2,370 $2,154 $2,272 All Other Mortgage Service Charges Trust and Inv Mgmt Payments Notable items: 4Q14 Nuveen gain $124 million; 3Q15 Visa gain $135 million, student loan market value adjustment ($58) million
Payments = credit and debit card, corporate payment products and merchant
processing Service charges = deposit service charges, treasury management
and ATM processing $ in millions |
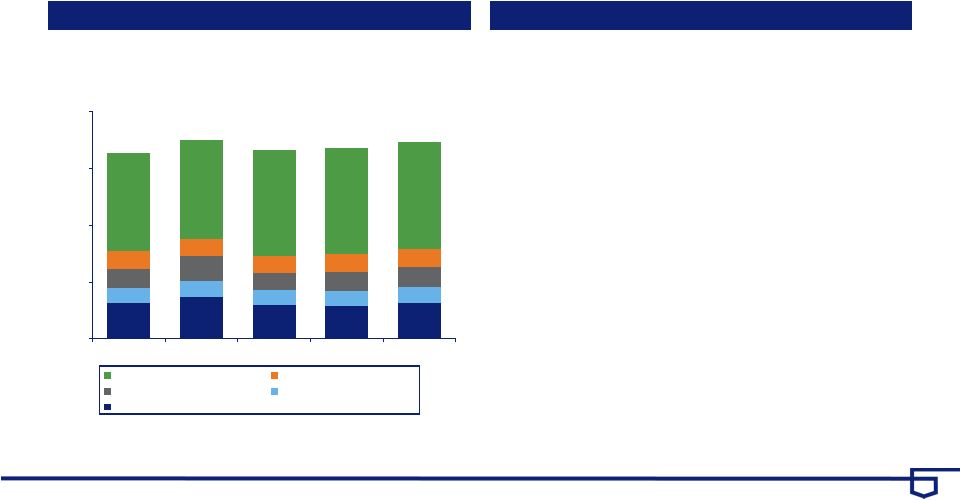 12 U.S. BANCORP | Noninterest Expense $503 $594 $479 $459 $501 $219 $219 $214 $221 $222 $261 $347 $229 $266 $291 $249 $248 $247 $247 $251 $1,382 $1,396 $1,496 $1,489 $1,510 0 800 1,600 2,400 3,200 3Q14 4Q14 1Q15 2Q15 3Q15 Noninterest Expense Key Points vs. 3Q14 • Noninterest expense increased $161 million, or 6.2% – Higher compensation (8.2% increase) reflecting the impact of merit increases and higher staffing for risk and compliance activities – Higher employee benefits expense (14.0% increase) primarily due to higher pension costs – Higher marketing and business development expense (26.9% increase) primarily due to various marketing programs within credit card and retail lending divisions vs. 2Q15 • Noninterest expense increased $93 million, or 3.5% – Higher other expense (10.3% increase) due primarily to mortgage servicing and talent upgrade costs – Higher compensation expense (2.4% increase) reflecting the impact of an additional day in 3Q15 and increases in variable compensation – Higher postage, printing and supplies expense (20.3% increase) primarily due to a 2Q15 reimbursement from a business partner Year-Over-Year Change 1.9% 4.5% 4.8% (2.6%) 6.2% $2,775 $2,614 $2,804 $2,665 $2,682 All Other Tech and Communications Prof Svcs, Marketing and PPS Occupancy and Equipment Compensation and Benefits Notable items: 4Q14 charitable contributions and accruals for legal matters $88 million; 3Q15 elevated expenses related to mortgage-related
compliance and the company wide talent update costs $60
million $ in millions |
 13 U.S. BANCORP | Capital Position * RWA = risk-weighted assets $ in billions 3Q15 2Q15 1Q15 4Q14 3Q14 Total U.S. Bancorp shareholders' equity 45.1 $ 44.5 $ 44.3 $ 43.5 $ 43.1 $ Standardized Approach Basel III transitional standardized approach Common equity tier 1 capital ratio 9.6% 9.5% 9.6% 9.7% 9.7% Tier 1 capital ratio 11.1% 11.0% 11.1% 11.3% 11.3% Total risk-based capital ratio 13.1% 13.1% 13.3% 13.6% 13.6% Leverage ratio 9.3% 9.2% 9.3% 9.3% 9.4% Common equity tier 1 capital to RWA* estimated for the Basel III fully implemented standardized approach 9.2% 9.2% 9.2% 9.0% 9.0% Advanced Approaches Common equity tier 1 capital to RWA for the Basel III transitional advanced approaches 13.0% 12.9% 12.3% 12.4% 12.4% Common equity tier 1 capital to RWA estimated for the Basel III fully implemented advanced approaches 12.4% 12.4% 11.8% 11.8% 11.8% Tangible common equity ratio 7.7% 7.5% 7.6% 7.5% 7.6% Tangible common equity as a % of RWA 9.3% 9.2% 9.3% 9.3% 9.3% |
 14 U.S. BANCORP | Appendix |
 15 U.S. BANCORP | Average Loans 13.6% 15.5% 15.1% 11.0% 9.5% 6.1% 4.2% 6.5% 4.8% 3.6% 5.8% 2.2% (0.3%) (1.4%) (0.3%) 4.9% 3.6% 2.4% 1.3% 1.1% 3.6% 3.6% 3.5% (1.8%) 5.7%* 0.3% 5.6%* 0 70 140 210 280 3Q14 4Q14 1Q15 2Q15 3Q15 Average Loans Key Points vs. 3Q14 • Average total loans increased by $6.7 billion, or 2.7% (3.8% excluding student loans which were reclassified back to held for investment during 3Q15) • Average total commercial loans increased $7.4 billion, or 9.5% vs. 2Q15 • Average total loans increased by $4.0 billion, or 1.6% (1.3% increase excluding student loans which were reclassified back to held for investment during 3Q15) • Average total commercial loans increased $1.5 billion, or 1.7% Year-Over-Year Growth 6.3% 5.9% 5.1% 2.5% 2.7% Covered Commercial CRE Res Mtg Retail Credit Card $250.5 $243.9 $246.4 $248.0 $246.6 4.0%* $ in billions * Excluding student loans which were transferred to held for sale at the end of 1Q15 and returned to held for investment during 3Q15
3.8%* |
 16 U.S. BANCORP | Average Deposits (13.1%) (4.9%) (8.2%) (14.1%) (18.1%) 18.3% 19.7% 24.7% 30.2% 21.3% 10.9% 8.3% 7.3% 6.1% 5.9% 8.6% 3.3% 5.2% 7.7% 9.2% 0 80 160 240 320 3Q14 4Q14 1Q15 2Q15 3Q15 Average Deposits Key Points vs. 3Q14 • Average total deposits increased by $18.7 billion, or 6.9% • Average low-cost deposits (NIB, interest checking, money market and savings) increased by $26.2 billion, or 11.4% vs. 2Q15 • Average total deposits increased by $3.9 billion, or 1.4% • Average low-cost deposits increased by $6.1 billion, or 2.5% Year-Over-Year Growth 7.4% 7.2% 8.1% 8.9% 6.9% Time Money Market Checking and Savings Noninterest-bearing $271.0 $275.5 $278.5 $285.7 $289.7 $ in billions |
 17 U.S. BANCORP | Credit Quality – Commercial Loans Average Loans and Net Charge-offs Ratios Key Statistics Key Points • Average quarter-over-quarter loan growth of 2% and year-over-year loan growth of 10% demonstrates continued
momentum with clients • Net charge-offs increased but remained near historically low levels • Nonperforming loans and delinquencies remained modest 3Q14 2Q15 3Q15 Average Loans $72,190 $77,932 $79,486 30-89 Delinquencies 0.23% 0.19% 0.20% 90+ Delinquencies 0.05% 0.05% 0.05% Nonperforming Loans 0.22% 0.10% 0.20% $72,190 $74,333 $76,183 $77,932 $79,486 0.29% 0.26% 0.21% 0.20% 0.34% 0.0% 0.5% 1.0% 1.5% 2.0% 0 25,000 50,000 75,000 100,000 3Q14 4Q14 1Q15 2Q15 3Q15 Average Loans Net Charge-offs Ratio $ in millions |
 18 U.S. BANCORP | Credit Quality – Commercial Leases Average Loans and Net Charge-offs Ratios Key Statistics Key Points • Average loan levels were in-line with recent quarters and were up 1% year-over-year
• Net charge-offs, nonperforming loans and delinquencies continued at historically low levels
3Q14 2Q15 3Q15 Average Loans $5,155 $5,321 $5,218 30-89 Delinquencies 0.83% 0.81% 0.88% 90+ Delinquencies 0.00% 0.00% 0.00% Nonperforming Loans 0.23% 0.23% 0.23% $5,155 $5,292 $5,325 $5,321 $5,218 0.46% -0.15% 0.23% 0.23% 0.23% -0.7% 0.0% 0.7% 1.4% 2.1% -3,000 0 3,000 6,000 9,000 3Q14 4Q14 1Q15 2Q15 3Q15 Average Loans Net Charge-offs Ratio $ in millions Small Ticket $3,195 Equipment Finance $2,023 Commercial Leases |
 19 U.S. BANCORP | CRE Construction A&D Construction $673 Credit Quality – Commercial Real Estate Average Loans and Net Charge-offs Ratios Key Statistics Key Points • Year-over-year average loans increased 3.6% • Historically low nonperforming loan levels improved on a quarter-over-quarter and year-over-year basis
• Strong recovery performance within CRE portfolio 3Q14 2Q15 3Q15 Average Loans $40,839 $42,446 $42,316 30-89 Delinquencies 0.12% 0.12% 0.15% 90+ Delinquencies 0.03% 0.05% 0.05% Nonperforming Loans 0.59% 0.41% 0.34% Performing TDRs* $284 $240 $218 $ in millions CRE Mortgage Investor $20,919 Owner Occupied $11,164 Multi-family $3,287 Retail $849 Residential Construction $2,167 Office $1,101 Other $2,156 * TDR = troubled debt restructuring |
 20 U.S. BANCORP | Credit Quality – Residential Mortgage Average Loans and Net Charge-offs Ratios Key Statistics Key Points • Originations are of high credit quality (weighted average FICO 757, weighted average LTV 70%)
• 85% of the balances have been originated since the beginning of 2009; the origination quality metrics and
performance to date have significantly outperformed prior vintages with similar
seasoning $ in millions
3Q14 2Q15 3Q15 Average Loans $51,994 $51,114 $51,831 30-89 Delinquencies 0.46% 0.38% 0.35% 90+ Delinquencies 0.41% 0.30% 0.33% Nonperforming Loans 1.62% 1.50% 1.40% $1,899 $1,866 $1,851 $1,931 $1,903 0 1,000 2,000 3,000 4,000 3Q14 4Q14 1Q15 2Q15 3Q15 Residential Mortgage Performing TDRs* *Excludes GNMA loans, whose repayments are insured by the FHA or guaranteed by the Department of VA ($2,000 million in 3Q15)
|
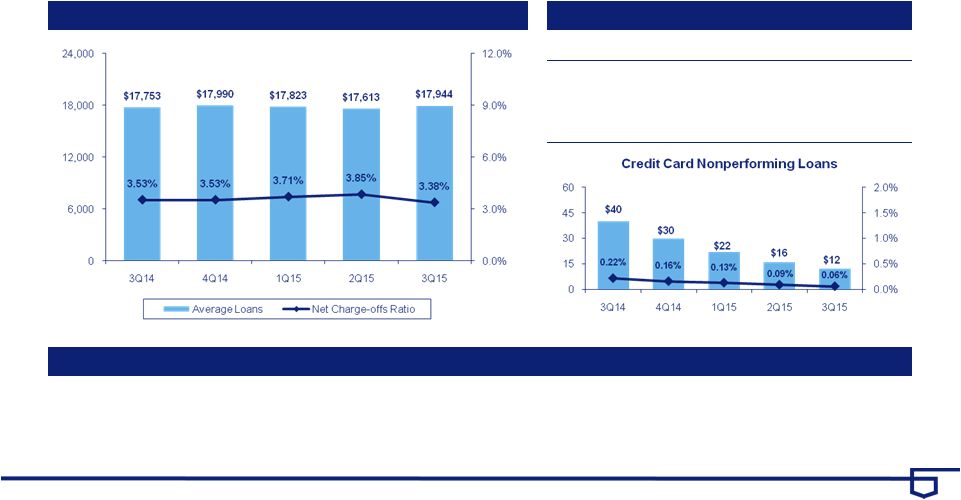 21 U.S. BANCORP | Credit Quality – Credit Card Average Loans and Net Charge-offs Ratios Key Statistics Key Points • Average loans increased 1% year-over-year driven by high-quality originations
(commitment weighted average FICO 756)
• Delinquencies increased seasonally while nonperforming loans continued to decline
$ in millions 3Q14 2Q15 3Q15 Average Loans $17,753 $17,613 $17,944 30-89 Delinquencies 1.23% 1.16% 1.27% 90+ Delinquencies 1.10% 1.03% 1.10% Nonperforming Loans 0.22% 0.09% 0.06% |
 22 U.S. BANCORP | Credit Quality – Home Equity Average Loans and Net Charge-offs Ratios Key Statistics Key Points • High-quality originations (weighted average FICO on commitments was 766, weighted average CLTV 71%)
originated primarily through the retail branch network to existing bank customers on
their primary residences •
Net charge-offs ratio declined on a linked quarter and year-over-year
basis $ in millions
3Q14 2Q15 3Q15 Average Loans $15,704 $15,958 $16,083 30-89 Delinquencies 0.51% 0.36% 0.36% 90+ Delinquencies 0.26% 0.25% 0.25% Nonperforming Loans 1.05% 0.98% 0.91% Home Equity Subprime: 1% Wtd Avg LTV*: 89% NCO: 1.92% Prime: 96% Wtd Avg LTV*: 72% NCO: 0.13% Other: 3% Wtd Avg LTV*: 71% NCO: 0.89% *LTV at origination |
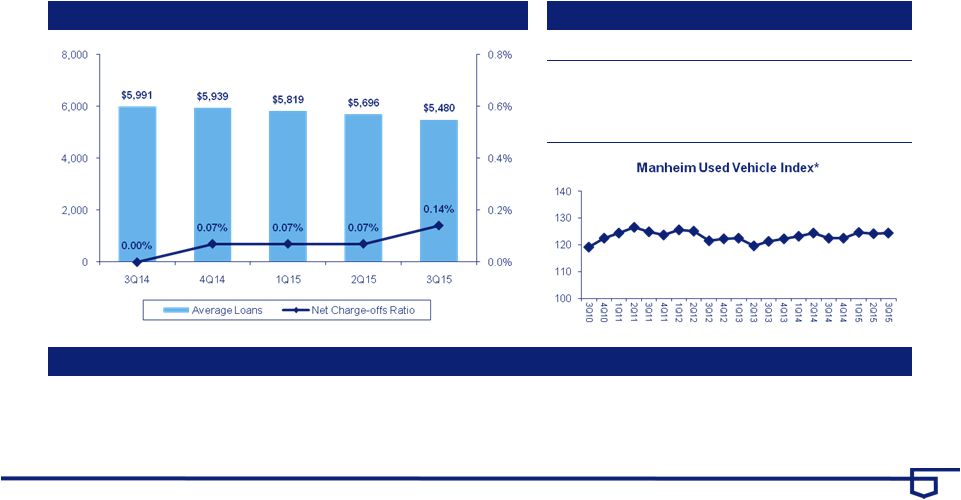 23 U.S. BANCORP | Credit Quality – Retail Leasing Average Loans and Net Charge-offs Ratios Key Statistics Key Points • Continued high-quality originations (weighted average FICO 785) support the portfolio’s stable credit profile
• Delinquencies remained at very low levels • Strong used auto values continued to contribute to historically low net charge-offs
$ in millions 3Q14 2Q15 3Q15 Average Loans $5,991 $5,696 $5,480 30-89 Delinquencies 0.14% 0.17% 0.18% 90+ Delinquencies 0.02% 0.00% 0.02% Nonperforming Loans 0.02% 0.04% 0.04% * Manheim Used Vehicle Value Index source: www.manheimconsulting.com, January 1995 = 100, quarter value = average monthly ending
values |
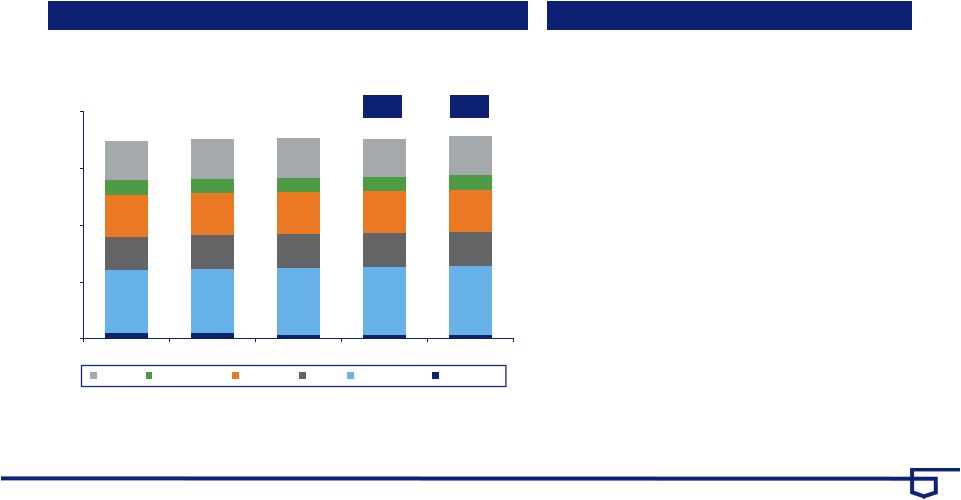
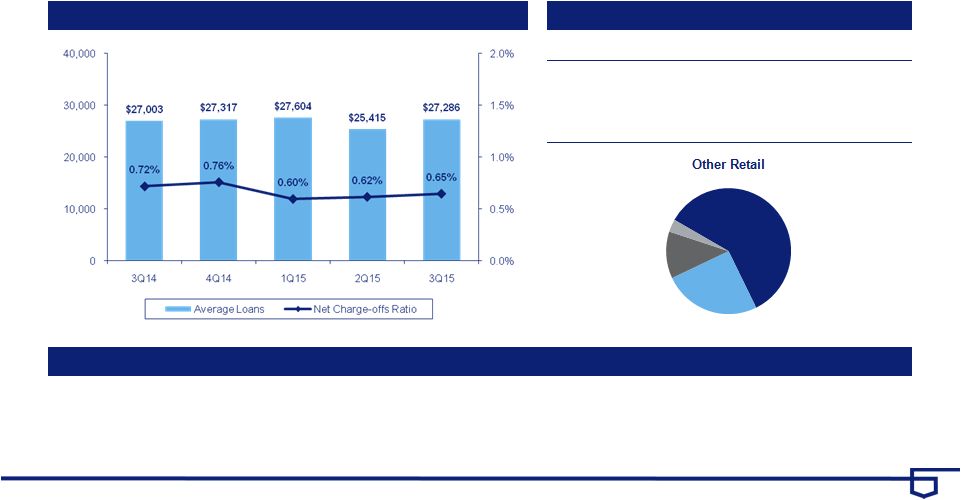 24 U.S. BANCORP | Credit Quality – Other Retail Average Loans and Net Charge-offs Ratios Key Statistics Key Points • Student loan balances were returned from held for sale during 3Q15 • Overall growth continues to be driven by auto loans, which were up 12.6% year-over-year
• Delinquency rates and net charge-off rates remain low $ in millions 3Q14 2Q15 3Q15 Average Loans $27,003 $25,415 $27,286 30-89 Delinquencies 0.49% 0.48% 0.46% 90+ Delinquencies 0.13% 0.10% 0.10% Nonperforming Loans 0.06% 0.07% 0.07% Installment $6,865 Auto Loans $16,220 Revolving Credit $3,312 Student Loans $889 |
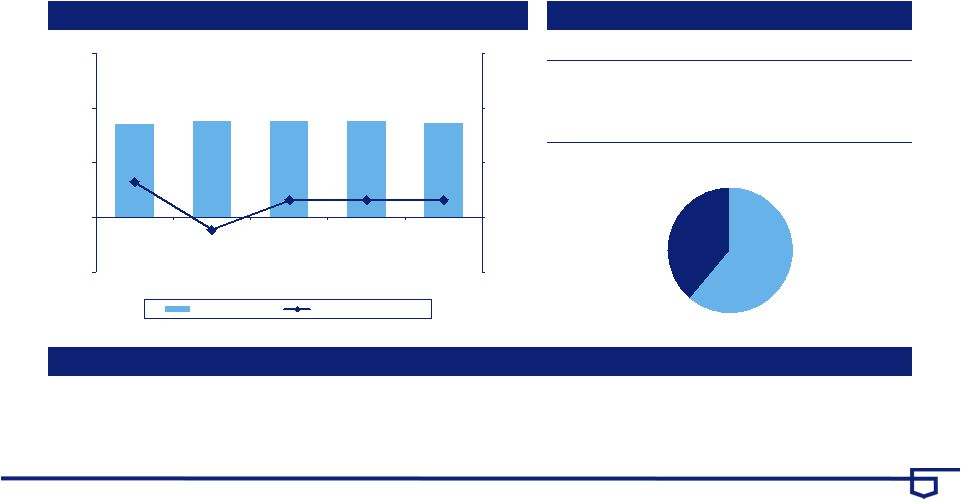
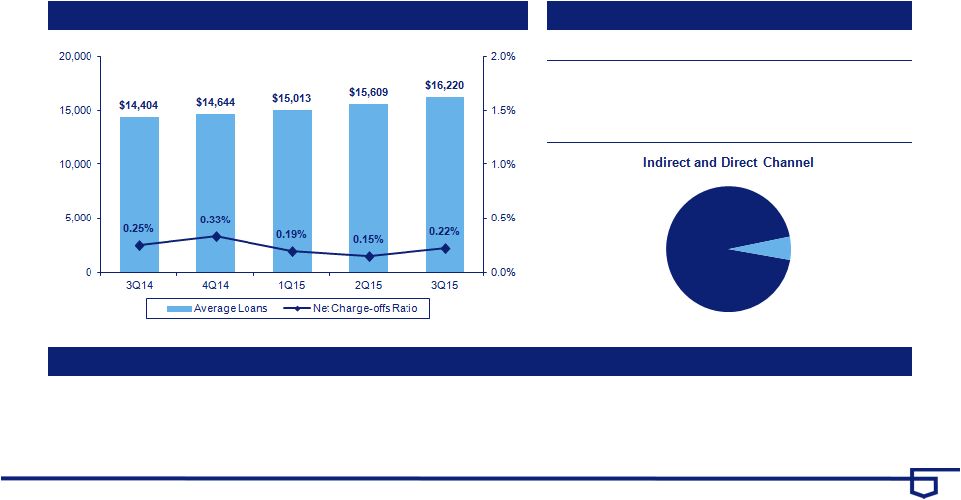 25 U.S. BANCORP | Credit Quality – Auto Loans Average Loans and Net Charge-offs Ratios Key Statistics Key Points • Continued growth (12.6% year-over-year) in auto loans driven by high-quality originations in the indirect channel
(weighted average FICO 768)
• Net charge-offs were up on a linked quarter basis due primarily to seasonal factors and flat year-over-year
$ in millions 3Q14 2Q15 3Q15 Average Loans $14,404 $15,609 $16,220 30-89 Delinquencies 0.41% 0.35% 0.40% 90+ Delinquencies 0.05% 0.02% 0.02% Nonperforming Loans 0.03% 0.04% 0.05% Direct: 6% Wtd Avg FICO: 748 NCO: 0.03% Indirect: 94% Wtd Avg FICO: 764 NCO: 0.23% Auto loans are included in Other Retail category |
 26 U.S. BANCORP | Non-GAAP Financial Measures Preliminary data. Subject to change prior to filings with applicable regulatory agencies.
(1) Includes goodwill related to certain investments in unconsolidated financial
institutions per prescribed regulatory requirements. (2) Includes net
losses on cash flow hedges included in accumulated other comprehensive income (loss) and other adjustments. (3) Includes higher risk-weighting for unfunded loan commitments, investment securities, residential mortgages, mortgage servicing rights and other adjustments. (4) Primarily reflects higher risk-weighting for mortgage servicing rights. September 30, June 30, March 31, December 31, September 30, (Dollars in Millions, Unaudited) 2015 2015 2015 2014 2014 Total equity $45,767 $45,231 $44,965 $44,168 $43,829 Preferred stock (4,756) (4,756) (4,756) (4,756) (4,756) Noncontrolling interests (692) (694) (688) (689) (688) Goodwill (net of deferred tax liability) (1) (8,324) (8,350) (8,360) (8,403) (8,503) Intangible assets, other than mortgage servicing rights (779) (744) (783) (824) (877) Tangible common equity (a) 31,216 30,687 30,378 29,496 29,005 Tangible common equity (as calculated above) 31,216 30,687 30,378 29,496 29,005 Adjustments (2) 118 125 158 172 187 Common equity tier 1 capital estimated for the Basel III fully implemented standardized and advanced approaches (b) 31,334 30,812 30,536 29,668 29,192 Total assets 415,943 419,075 410,233 402,529 391,284 Goodwill (net of deferred tax liability) (1) (8,324) (8,350) (8,360) (8,403) (8,503) Intangible assets, other than mortgage servicing rights (779) (744) (783) (824) (877) Tangible assets (c) 406,840 409,981 401,090 393,302 381,904 Risk-weighted assets, determined in accordance with prescribed transitional standardized approach regulatory requirements (d) 336,227 * 333,177 327,709 317,398 311,914 Adjustments (3) 3,532 * 3,532 3,153 11,110 12,837 Risk-weighted assets estimated for the Basel III fully implemented
standardized approach (e)
339,759 * 336,709 330,862 328,508 324,751 Risk-weighted assets, determined in accordance with prescribed transitional advanced approaches regulatory requirements 248,048 * 245,038 254,892 248,596 243,909 Adjustments (4) 3,723 * 3,721 3,321 3,270 3,443 Risk-weighted assets estimated for the Basel III fully implemented
advanced approaches (f)
251,771 * 248,759 258,213 251,866 247,352 Ratios * Tangible common equity to tangible assets (a)/(c) 7.7 % 7.5 % 7.6 % 7.5 % 7.6 % Tangible common equity to risk-weighted assets (a)/(d) 9.3 9.2 9.3 9.3 9.3 Common equity tier 1 capital to risk-weighted assets estimated for the Basel III fully implemented standardized approach (b)/(e) 9.2 9.2 9.2 9.0 9.0 Common equity tier 1 capital to risk-weighted assets estimated for the Basel III fully implemented advanced approaches (b)/(f) 12.4 12.4 11.8 11.8 11.8 |
 U.S.
Bancorp 3Q15 Earnings
Conference Call October 15, 2015 |