Attached files
| file | filename |
|---|---|
| 8-K - 8-K - Matson, Inc. | a15-20782_18k.htm |
Exhibit 99.1
|
|
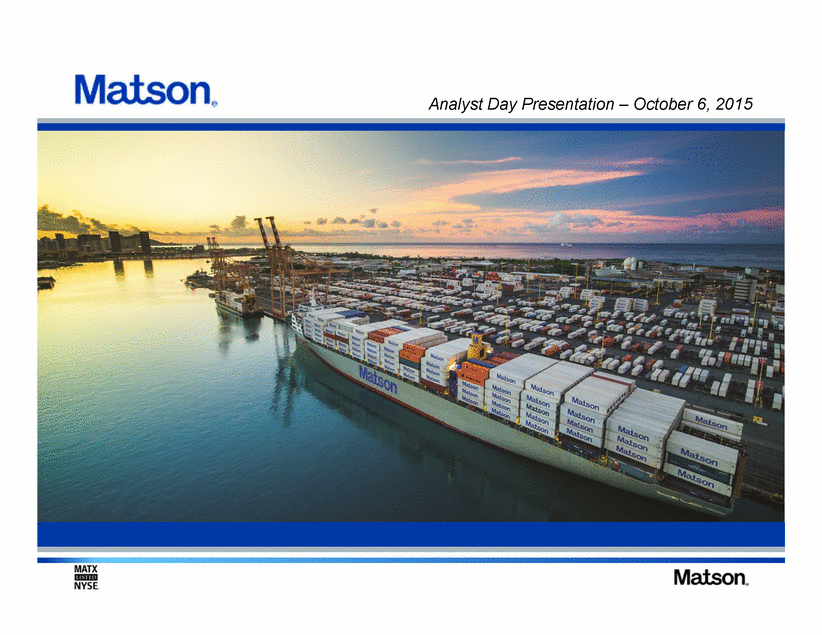
Maison Analyst Day Presentation-October 6, 2015 M.A,TX. NYSE. Matson. |
|
|
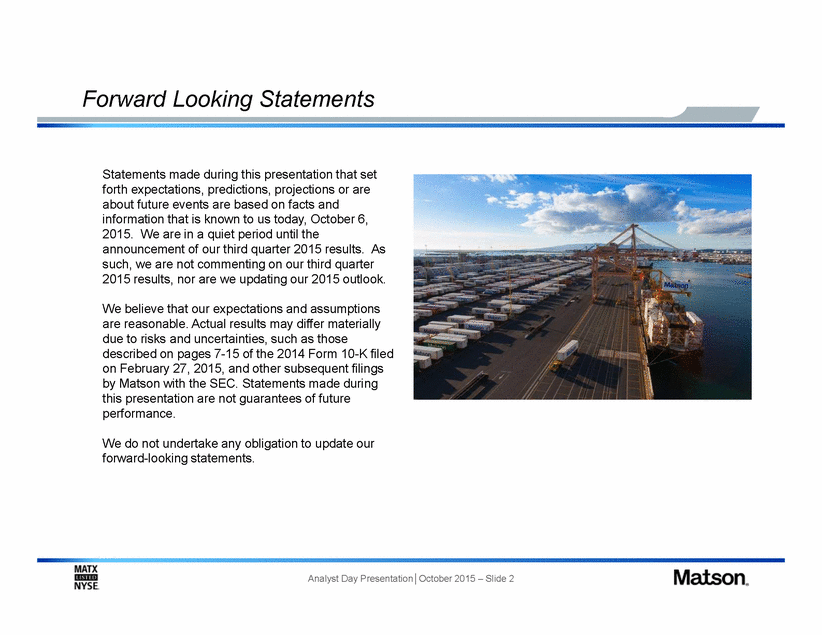
Forward Looking Statements Statements made during this presentation that set forth expectations, predictions, projections or are about future events are based on facts and information that is known to us today, October 6, 2015. We are in a quiet period until the announcement of our third quarter 2015 results. As such, we are not commenting on our third quarter 2015 results, nor are we updating our 2015 outlook. We believe that our expectations and assumptions are reasonable. Actual results may differ materially due to risks and uncertainties, such as those described on pages 7-15 of the 2014 Form 10-K filed on February 27, 2015, and other subsequent filings by Matson with the SEC. Statements made during this presentation are not guarantees of future performance. We do not undertake any obligation to update our forward-looking statements. Analyst Day Presentation│October 2015 – Slide 2 |
|
|
Agenda 1. 2. 3. 4. 5. 6. Introduction and Strategic Financial Information Operations Ocean Services Pacific Alaska Update Matt Cox, President and CEO Joel Wine, SVP and CFO Ron Forest, SVP Operations John Lauer, SVP Ocean Services Vic Angoco, SVP Pacific Kenny Gill, VP Alaska Analyst Day Presentation│October 2015 – Slide 3 |
|
|
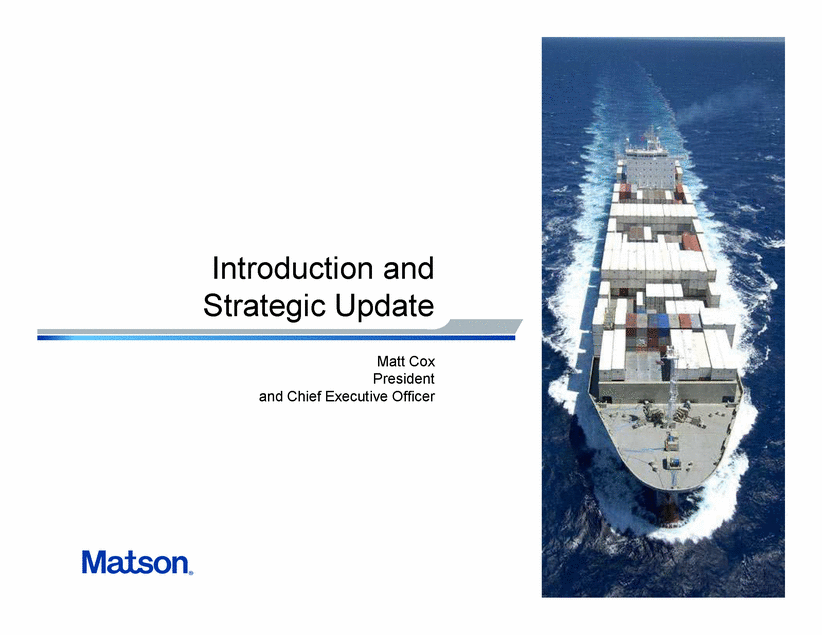
Introduction and Strategic Update Matt Cox President and Chief Executive Officer Analyst Day Presentation│October 2015 – Slide 4 |
|
|
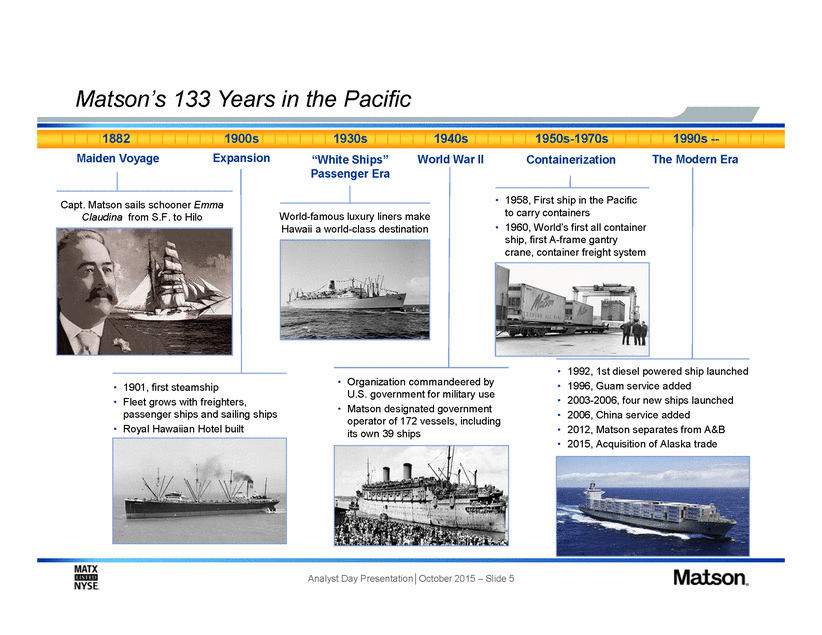
Matson’s 133 Years in the Pacific 1882 Maiden Voyage 1900s Expansion 1930s “White Ships” Passenger Era 1940s World War II 1950s-1970s Containerization 1990s --The Modern Era • 1958, First ship in the Pacific to carry containers 1960, World’s first all container ship, first A-frame gantry crane, container freight system Capt. Matson sails schooner Emma Claudina from S.F. to Hilo World-famous luxury liners make Hawaii a world-class destination • • • • • • • 1992, 1st diesel powered ship launched 1996, Guam service added 2003-2006, four new ships launched 2006, China service added 2012, Matson separates from A&B 2015, Acquisition of Alaska trade • Organization commandeered by U.S. government for military use Matson designated government operator of 172 vessels, including its own 39 ships • • 1901, first steamship Fleet grows with freighters, passenger ships and sailing ships Royal Hawaiian Hotel built • • Analyst Day Presentation│October 2015 – Slide 5 |
|
|
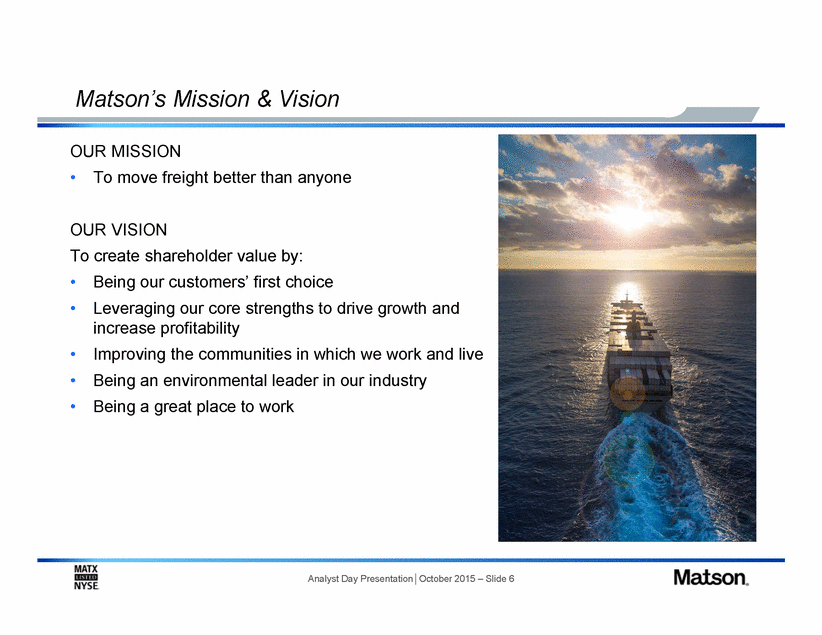
Matson’s Mission & Vision OUR MISSION • To move freight better than anyone OUR VISION To create shareholder value by: • • Being our customers’ first choice Leveraging our core strengths to drive growth and increase profitability Improving the communities in which we work and live Being an environmental leader in our industry Being a great place to work • • • Analyst Day Presentation│October 2015 – Slide 6 |
|
|
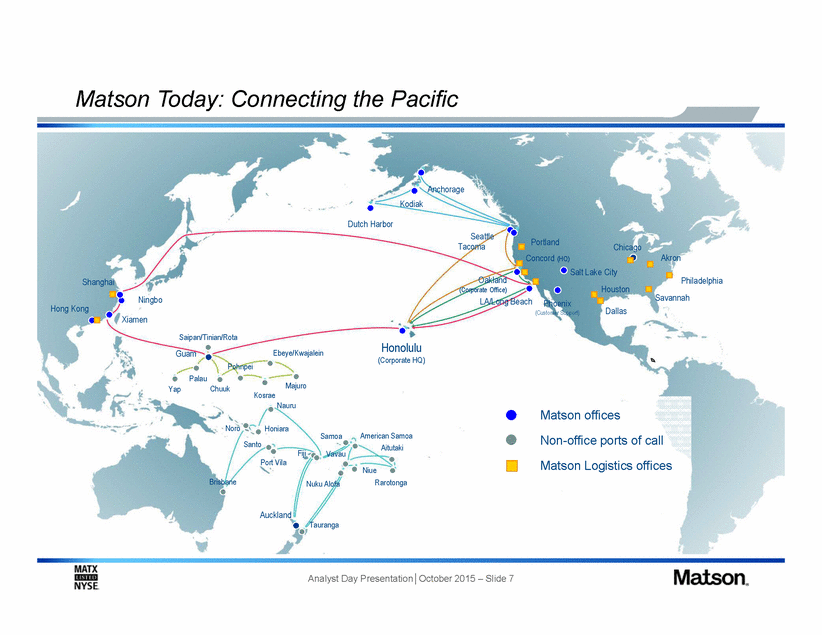
Matson Today: Connecting the Pacific Anchorage Kodiak Dutch Harbor Seattle Tacoma Portland Concord (HQ) Chicago Akron Salt Lake City Oakland (Corporate Office) Philadelphia Shanghai Houston Savannah Ningbo LA/Long Beach Phoenix (Customer Support) Hong Kong Dallas Xiamen Saipan/Tinian/Rota Guam Honolulu (Corporate HQ) Ebeye/Kwajalein Pohnpei Palau Majuro Yap Chuuk Kosrae Nauru Matson offices Noro Honiara American Samoa Aitutaki Samoa Vavau Non-office ports of call Matson Logistics offices Santo Fiji Port Vila Niue Brisbane Rarotonga Nuku Alofa Auckland Tauranga Analyst Day Presentation│October 2015 – Slide 7 |
|
|
Investment Highlights • Leading U.S. carrier in the Pacific providing lifeline to economies of Hawaii, Alaska and Guam Leading market share in attractive niche markets with multi-decade customer relationships Dual head-haul economics on China service • • • • Well maintained fleet with leading on-time vessel arrivals Fastest transit and cargo availability creates 5 to 10 day advantage and premium rates for China service Dedicated terminals with best in class truck turns Varied and ample equipment fleet across locations to meet customer needs • • • Financial strength to pay down debt, invest in fleet renewal, pursue strategic opportunities and return capital to shareholders • Investment grade credit metrics Analyst Day Presentation│October 2015 – Slide 8 Leveraging the Matson brand and network into growth opportunities Strong balance sheet Significant cash flow generation World class operator and premium service provider Unique network connecting the Pacific |
|
|
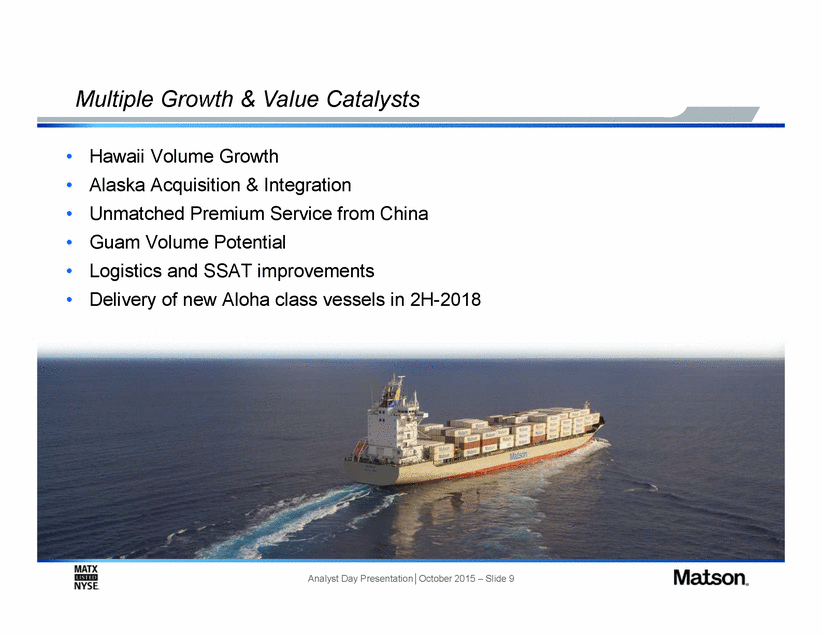
Multiple Growth & Value Catalysts • • • • • • Hawaii Volume Growth Alaska Acquisition & Integration Unmatched Premium Service from China Guam Volume Potential Logistics and SSAT improvements Delivery of new Aloha class vessels in 2H-2018 Analyst Day Presentation│October 2015 – Slide 9 |
|
|
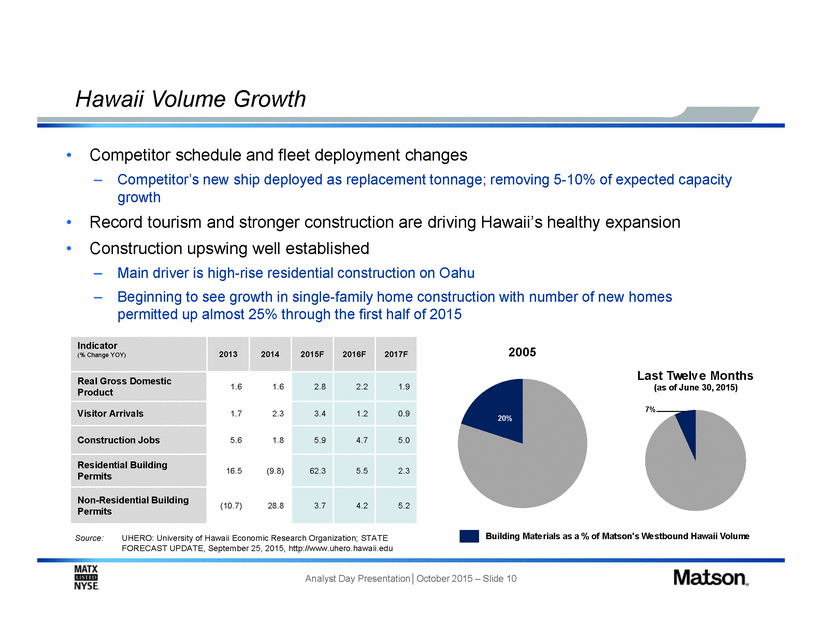
Hawaii Volume Growth • Competitor schedule and fleet deployment changes – Competitor’s new ship deployed as replacement tonnage; removing 5-10% of expected capacity growth • • Record tourism and stronger construction are driving Hawaii’s healthy expansion Construction upswing well established – – Main driver is high-rise residential construction on Oahu Beginning to see growth in single-family home construction with number of new homes permitted up almost 25% through the first half of 2015 2005 Last Twelve Months (as of June 30, 2015) 7% 20% Building Materials as a % of Matson's Westbound Hawaii Volume Source: UHERO: University of Hawaii Economic Research Organization; STATE FORECAST UPDATE, September 25, 2015, http://www.uhero.hawaii.edu Analyst Day Presentation│October 2015 – Slide 10 Indicator (% Change YOY) 2013 2014 2015F 2016F 2017F Real Gross Domestic Product 1.6 1.6 2.8 2.2 1.9 Visitor Arrivals 1.7 2.3 3.4 1.2 0.9 Construction Jobs 5.6 1.8 5.9 4.7 5.0 Residential Building Permits 16.5 (9.8) 62.3 5.5 2.3 Non-Residential Building Permits (10.7) 28.8 3.7 4.2 5.2 |
|
|
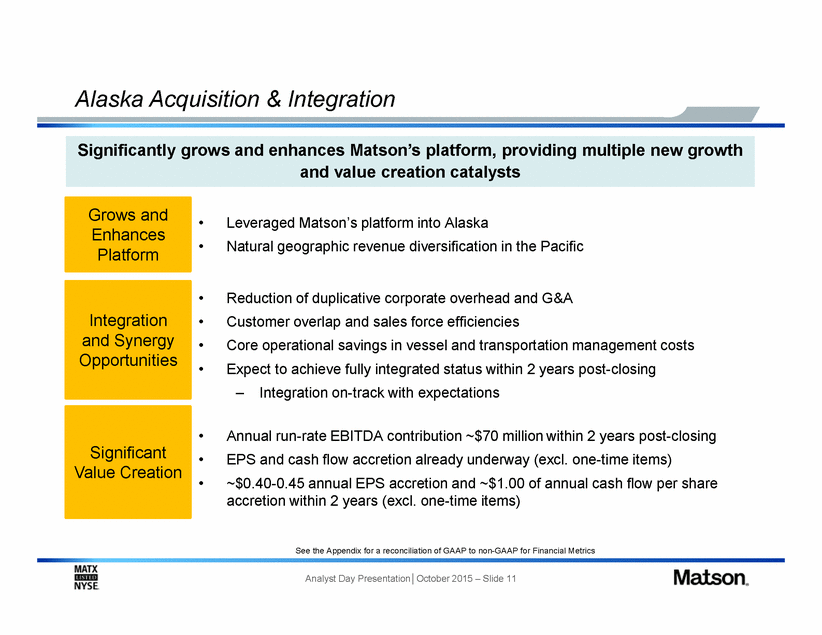
Alaska Acquisition & Integration • • Leveraged Matson’s platform into Alaska Natural geographic revenue diversification in the Pacific • • • • Reduction of duplicative corporate overhead and G&A Customer overlap and sales force efficiencies Core operational savings in vessel and transportation management costs Expect to achieve fully integrated status within 2 years post-closing – Integration on-track with expectations • • • Annual run-rate EBITDA contribution ~$70 million within 2 years post-closing EPS and cash flow accretion already underway (excl. one-time items) ~$0.40-0.45 annual EPS accretion and ~$1.00 of annual cash flow per share accretion within 2 years (excl. one-time items) See the Appendix for a reconciliation of GAAP to non-GAAP for Financial Metrics Analyst Day Presentation│October 2015 – Slide 11 Significant Value Creation Integration and Synergy Opportunities Grows and Enhances Platform Significantly grows and enhances Matson’s platform, providing multiple new growth and value creation catalysts |
|
|
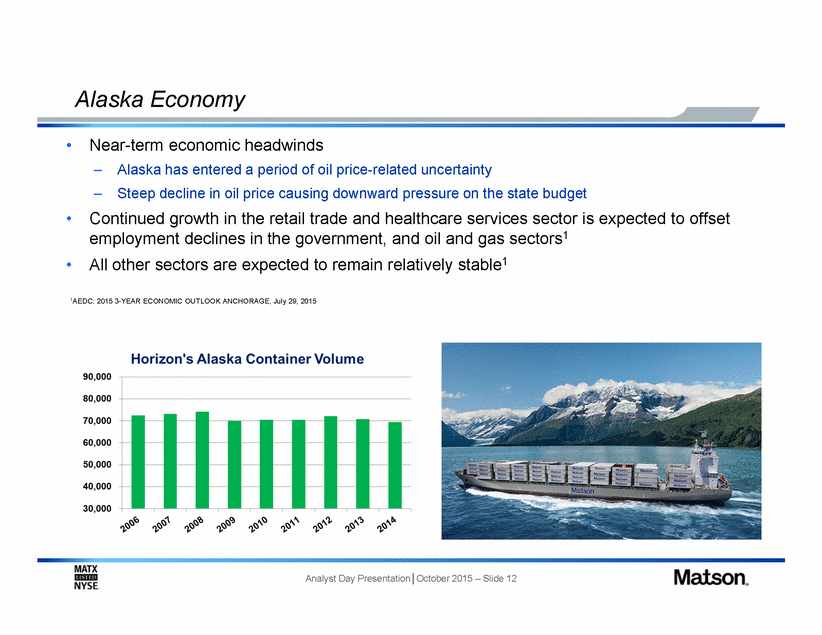
Alaska Economy • Near-term economic headwinds – – Alaska has entered a period of oil price-related uncertainty Steep decline in oil price causing downward pressure on the state budget • Continued growth in the retail trade and healthcare services sector is expected to offset employment declines in the government, and oil and gas sectors1 All other sectors are expected to remain relatively stable1 • 1AEDC: 2015 3-YEAR ECONOMIC OUTLOOK ANCHORAGE, July 29, 2015 Analyst Day Presentation│October 2015 – Slide 12 |
|
|
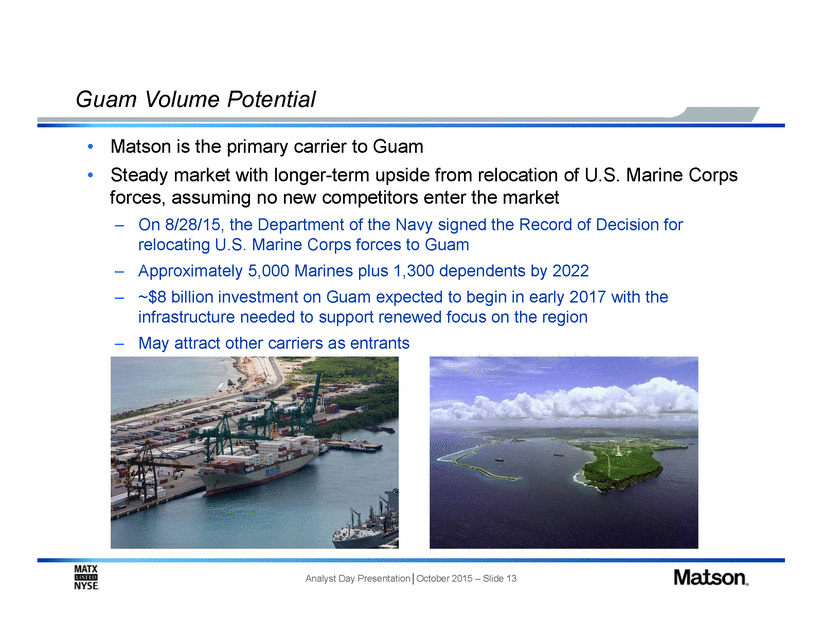
Guam Volume Potential • • Matson is the primary carrier to Guam Steady market with longer-term upside from relocation of U.S. Marine forces, assuming no new competitors enter the market Corps – On 8/28/15, the Department of the Navy signed the Record of Decision for relocating U.S. Marine Corps forces to Guam Approximately 5,000 Marines plus 1,300 dependents by 2022 ~$8 billion investment on Guam expected to begin in early 2017 with the infrastructure needed to support renewed focus on the region May attract other carriers as entrants – – – Analyst Day Presentation│October 2015 – Slide 13 |
|
|
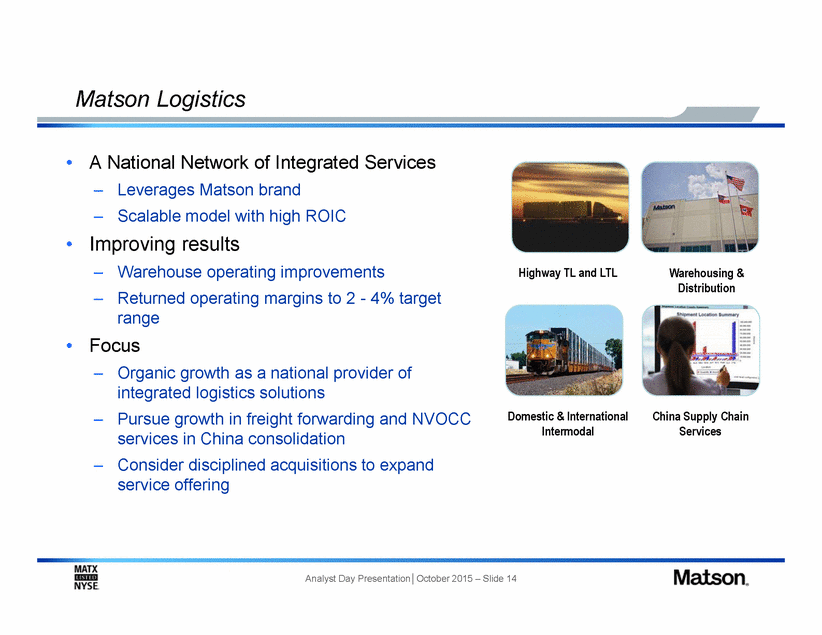
Matson Logistics • A National Network of Integrated Services – – Leverages Matson brand Scalable model with high ROIC • Improving results – – Warehouse operating improvements Returned operating margins to 2 - 4% target range Highway TL and LTL Warehousing & Distribution • Focus – Organic growth as a national provider of integrated logistics solutions Pursue growth in freight forwarding and NVOCC services in China consolidation Consider disciplined acquisitions to expand service offering – Domestic & International Intermodal China Supply Chain Services – Analyst Day Presentation│October 2015 – Slide 14 |
|
|
Financial Information Joel Wine Senior Vice President and Chief Financial Officer Analyst Day Presentation│October 2015 – Slide 15 |
|
|
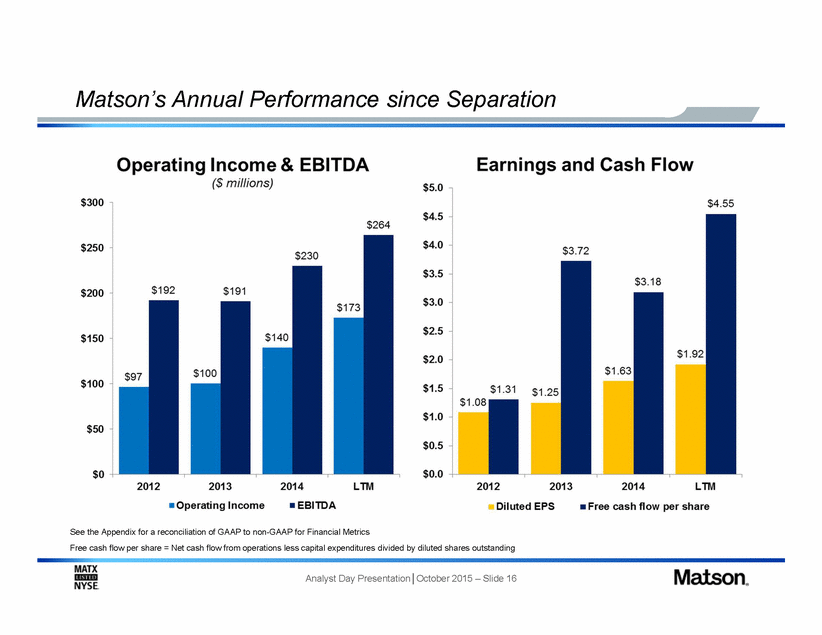
Matson's Annual Petformance since Separation Operating Income & ($ millions) EBITDA Earnings and Cash Flow $5.0 $300 $4.55 $4.5 $264 $4.0 $250 $3.5 $200 $3.0 $2.5 $150 $2.0 $100 $1.5 $1.0 $50 $0.5 $0 $0.0 LTM LTM 2012 2013 •Operating Income 2014 • EBITDA 2012 2013 2014 Diluted EPS •Free cash flow per share See the Appendix for a reconciliation of GAAP to non-GAAP for Financial Metrics Free cash flow per share= Net cash flow from operations less capital expenditures divided by diluted shares outstanding M.A,TX. Matson. Analyst Day Presentation IOctober 2015 - Slide 16 NYSE. |
|
|
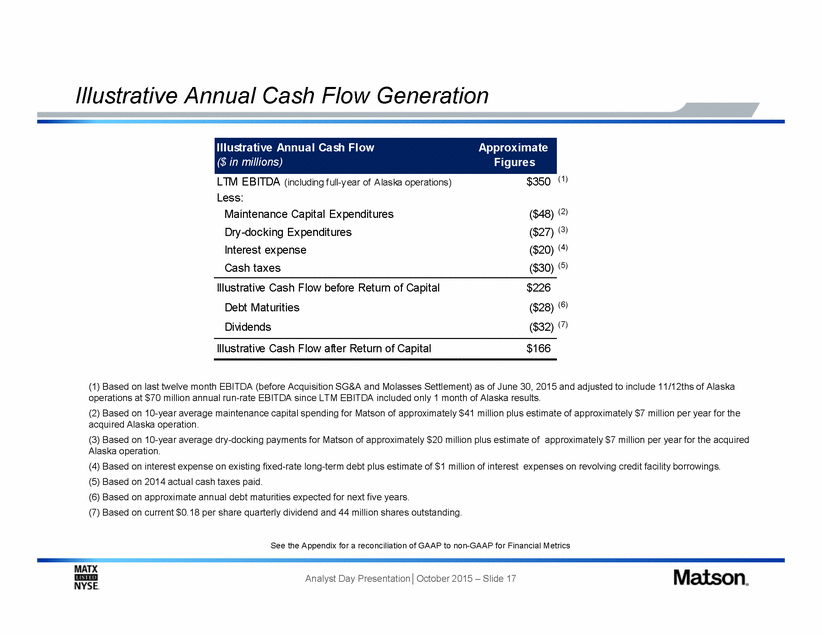
Illustrative Annual Cash Flow Generation (1) LTM EBITDA (including f ull-year of Alaska operations) Less: Maintenance Capital Expenditures Dry-docking Expenditures Interest expense Cash taxes $350 ($48) (2) ($27) (3) ($20) (4) ($30) (5) Illustrative Cash Flow before Return of Capital Debt Maturities Dividends $226 ($28) (6) ($32) (7) Illustrative Cash Flow after Return of Capital $166 (1) Based on last twelve month EBITDA (before Acquisition SG&A and Molasses Settlement) as of June 30, 2015 and adjusted to include 11/12ths of Alaska operations at $70 million annual run-rate EBITDA since LTM EBITDA included only 1 month of Alaska results. (2) Based on 10-year average maintenance capital spending for Matson of approximately $41 million plus estimate of approximately $7 million per year for the acquired Alaska operation. (3) Based on 10-year average dry-docking payments for Matson of approximately $20 million plus estimate of approximately $7 million per year for the acquired Alaska operation. (4) Based on interest expense on existing fixed-rate long-term debt plus estimate of $1 million of interest expenses on revolving credit facility borrowings. (5) Based on 2014 actual cash taxes paid. (6) Based on approximate annual debt maturities expected for next five years. (7) Based on current $0.18 per share quarterly dividend and 44 million shares outstanding. See the Appendix for a reconciliation of GAAP to non-GAAP for Financial Metrics Analyst Day Presentation│October 2015 – Slide 17 Illustrative Annual Cash Flow Approximate ($ in millions) Figures |
|
|
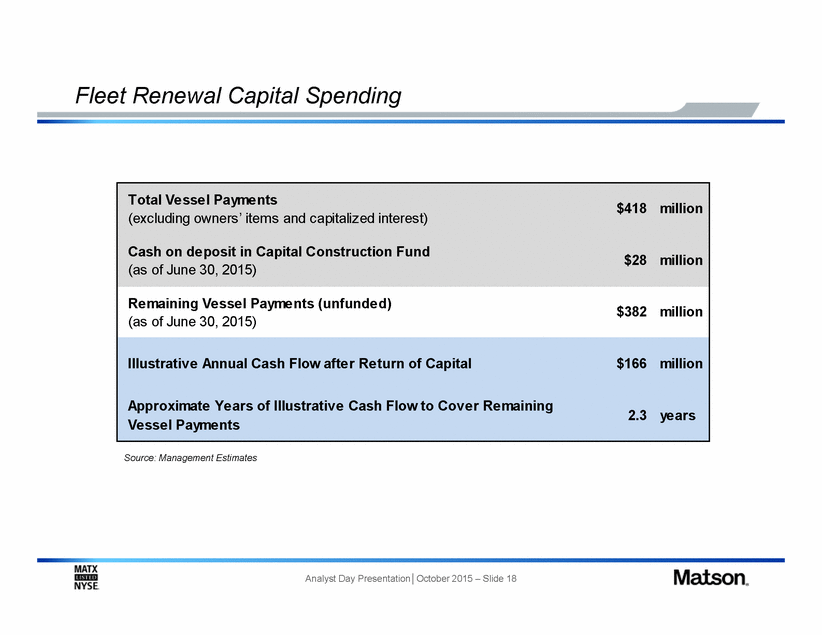
Fleet Renewal Capital Spending (excluding owners’ items and capitalized interest) (as of June 30, 2015) (as of June 30, 2015) Vessel Payments Source: Management Estimates Analyst Day Presentation│October 2015 – Slide 18 Total Vessel Payments$418million Cash on deposit in Capital Construction Fund$28million Remaining Vessel Payments (unfunded)$382million Illustrative Annual Cash Flow after Return of Capital$166million Approximate Years of Illustrative Cash Flow to Cover Remaining2.3years |
|
|
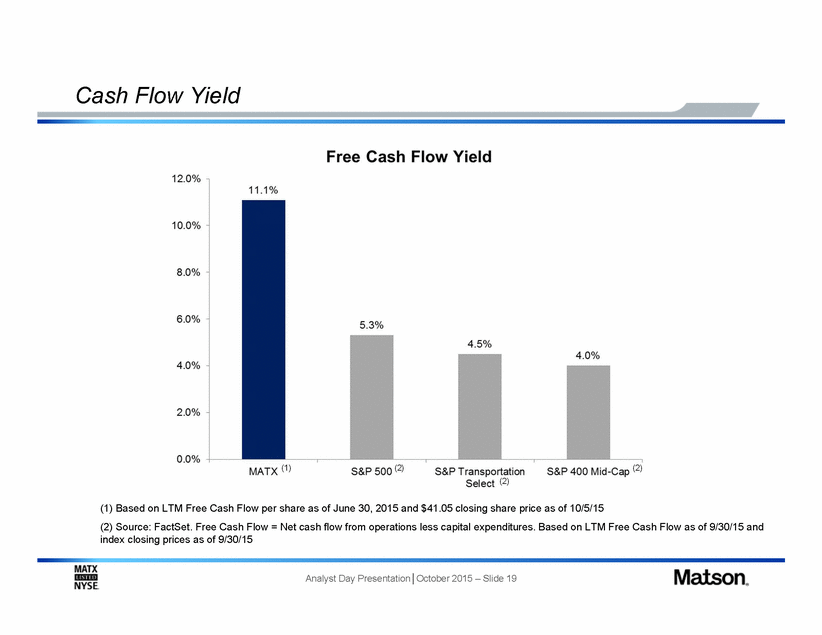
Cash Flow Yield (1) (2) (2) (2) (1) Based on LTM Free Cash Flow per share as of June 30, 2015 and $41.05 closing share price as of 10/5/15 (2) Source: FactSet. Free Cash Flow = Net cash flow from operations less capital expenditures. Based on LTM Free Cash Flow as of 9/30/15 and index closing prices as of 9/30/15 Analyst Day Presentation│October 2015 – Slide 19 |
|
|
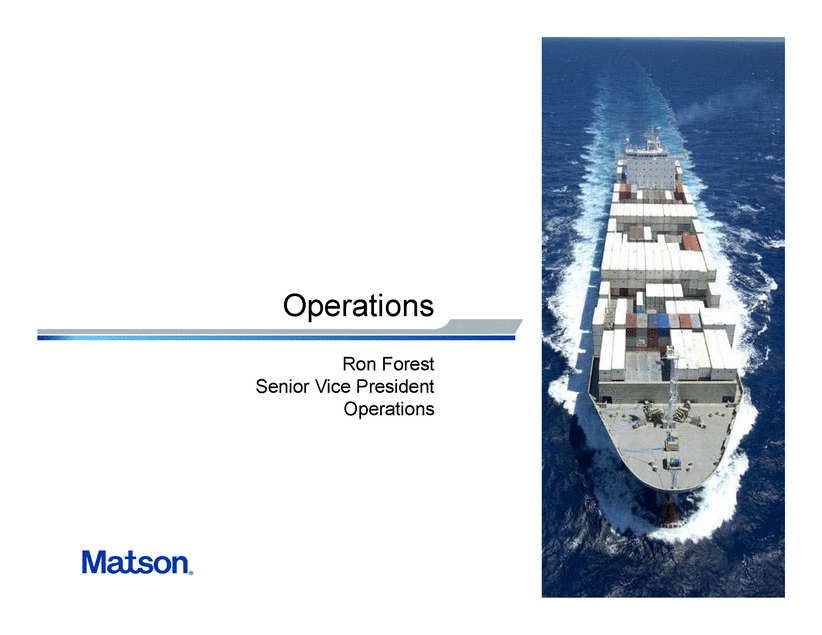
Operations Ron Forest Senior Vice President Operations |
|
|
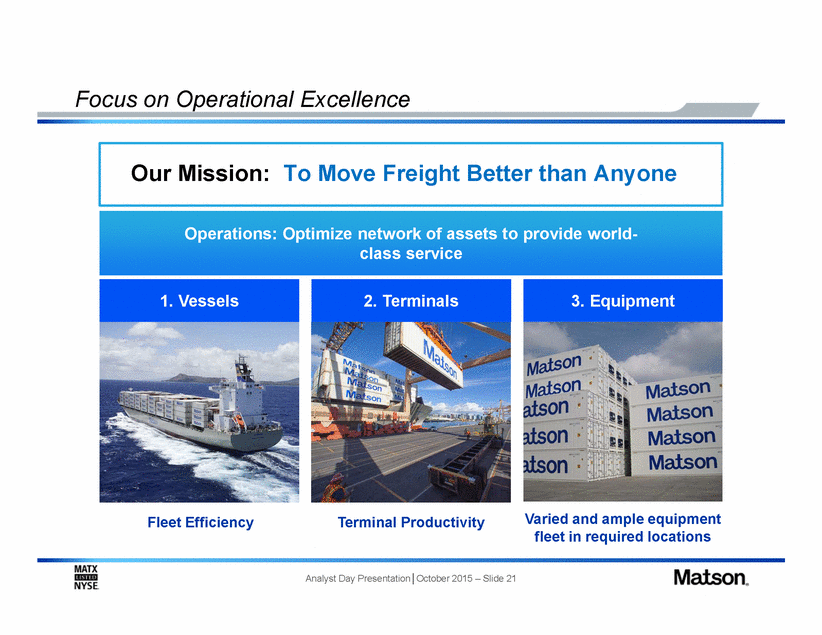
Focus on Operational Excellence Our Mission: To Move Freight Better than Anyone Varied and ample equipment fleet in required locations Fleet Efficiency Terminal Productivity Analyst Day Presentation│October 2015 – Slide 21 3. Equipment 2. Terminals 1. Vessels |
|
|
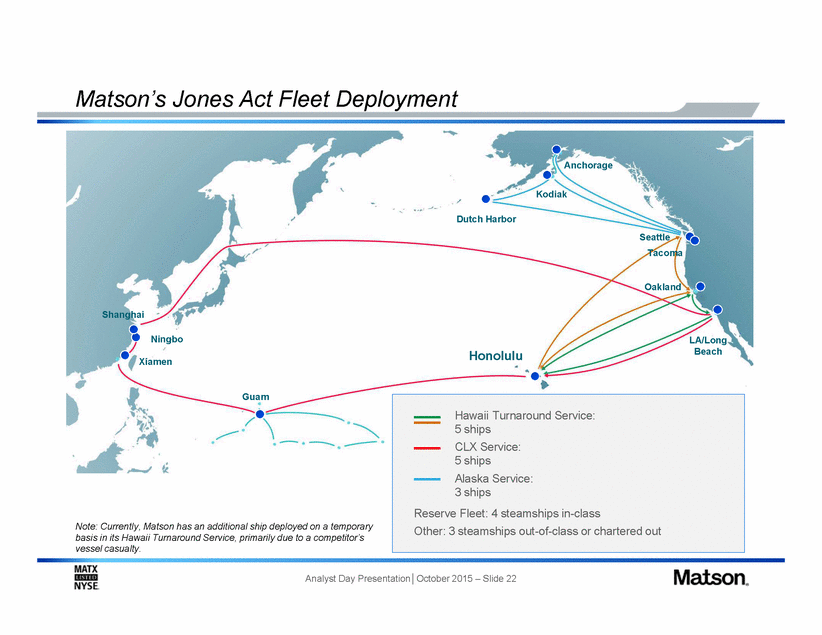
Matson’s Jones Act Fleet Deployment Anchorage Kodiak Dutch Harbor Seattle Tacoma Oakland Shanghai Ningbo LA/Long Beach Honolulu Xiamen Guam Note: Currently, Matson has an additional ship deployed on a temporary basis in its Hawaii Turnaround Service, primarily due to a competitor’s vessel casualty. Analyst Day Presentation│October 2015 – Slide 22 Hawaii Turnaround Service: 5 ships CLX Service: 5 ships Alaska Service: 3 ships Reserve Fleet: 4 steamships in-class Other: 3 steamships out-of-class or chartered out |
|
|
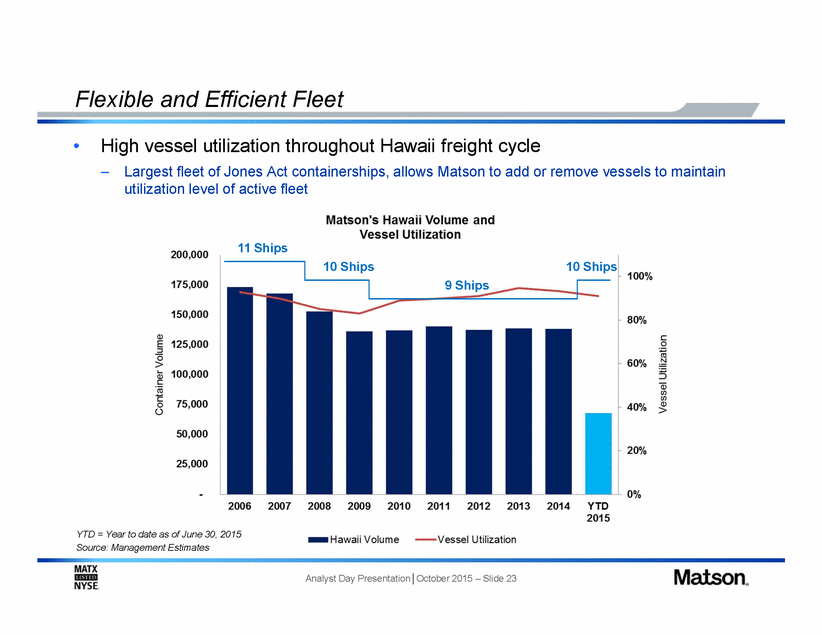
Flexible and Efficient Fleet • High vessel utilization throughout Hawaii freight cycle – Largest fleet of Jones Act containerships, allows Matson to add or remove vessels to maintain utilization level of active fleet 11 Ships 10 Ships 10 Ships 9 Ships YTD = Year to date as of June 30, 2015 Source: Management Estimates Analyst Day Presentation│October 2015 – Slide 23 |
|
|
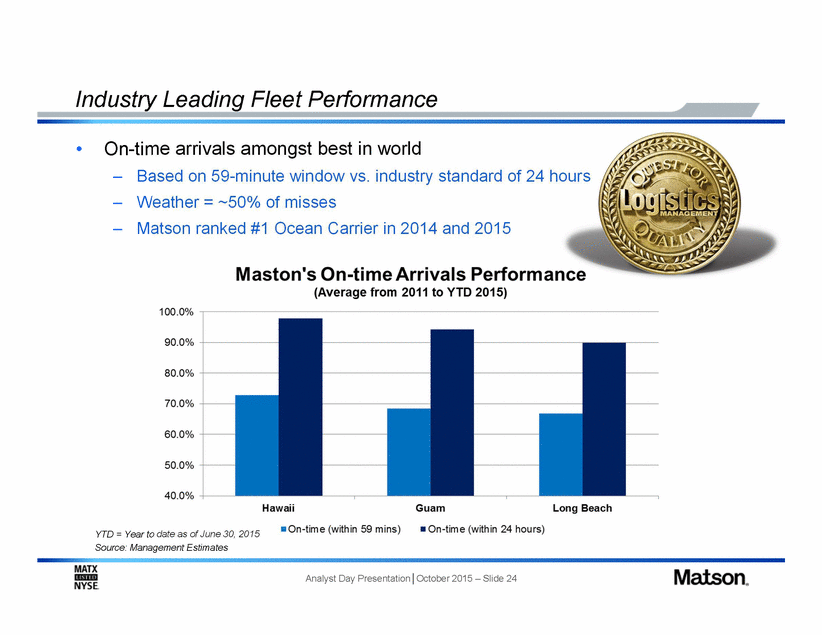
Industry Leading Fleet Performance • On-time arrivals amongst best in world – – – Based on 59-minute window vs. industry standard of 24 hours Weather = ~50% of misses Matson ranked #1 Ocean Carrier in 2014 and 2015 YTD = Year to date as of June 30, 2015 Source: Management Estimates Analyst Day Presentation│October 2015 – Slide 24 |
|
|
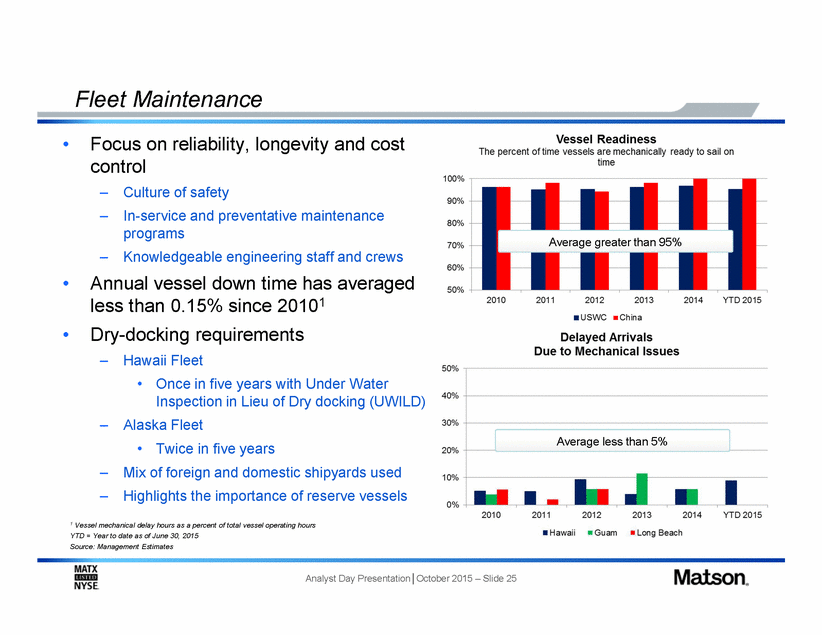
Fleet Maintenance • Focus on reliability, longevity and cost control – – Culture of safety In-service and preventative maintenance programs Knowledgeable engineering staff and crews Average greater than 95% – • Annual vessel down time has averaged less than 0.15% since 20101 Dry-docking requirements • – Hawaii Fleet • Once in five years with Under Water Inspection in Lieu of Dry docking (UWILD) – Alaska Fleet Average less than 5% • Twice in five years – – Mix of foreign and domestic shipyards used Highlights the importance of reserve vessels 1 Vessel mechanical delay hours as a percent of total vessel operating hours YTD = Year to date as of June 30, 2015 Source: Management Estimates Analyst Day Presentation│October 2015 – Slide 25 |
|
|
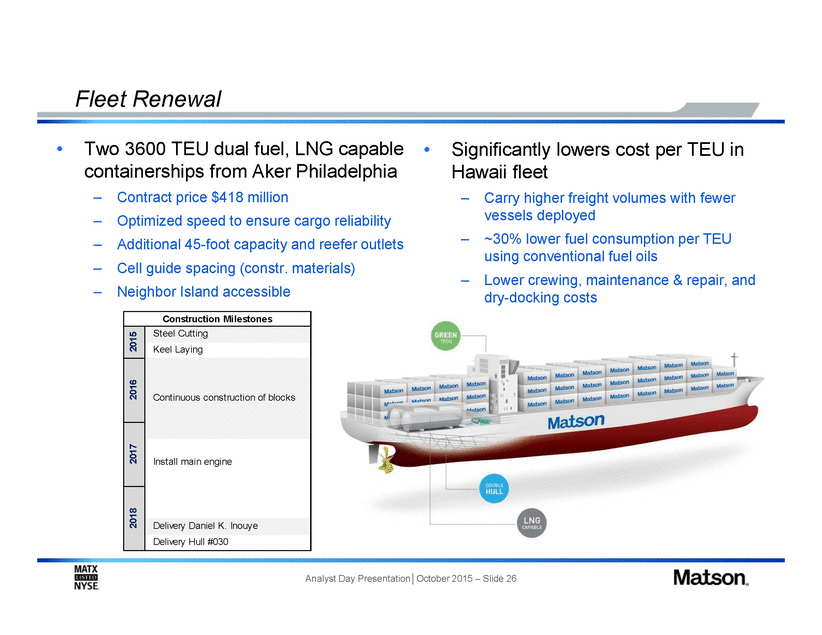
Fleet Renewal • Two 3600 TEU dual fuel, LNG capable containerships from Aker Philadelphia • Significantly lowers cost per TEU in Hawaii fleet – – – – – Contract price $418 million Optimized speed to ensure cargo reliability Additional 45-foot capacity and reefer outlets Cell guide spacing (constr. materials) Neighbor Island accessible – Carry higher freight volumes with fewer vessels deployed ~30% lower fuel consumption per TEU using conventional fuel oils Lower crewing, maintenance & repair, and dry-docking costs – – Analyst Day Presentation│October 2015 – Slide 26 15 Construction Milestones Steel Cutting 20 Keel Laying 2016 Continuous construction of blocks 2017 Install main engine 2018 Delivery Daniel K. Inouye Delivery Hull #030 |
|
|
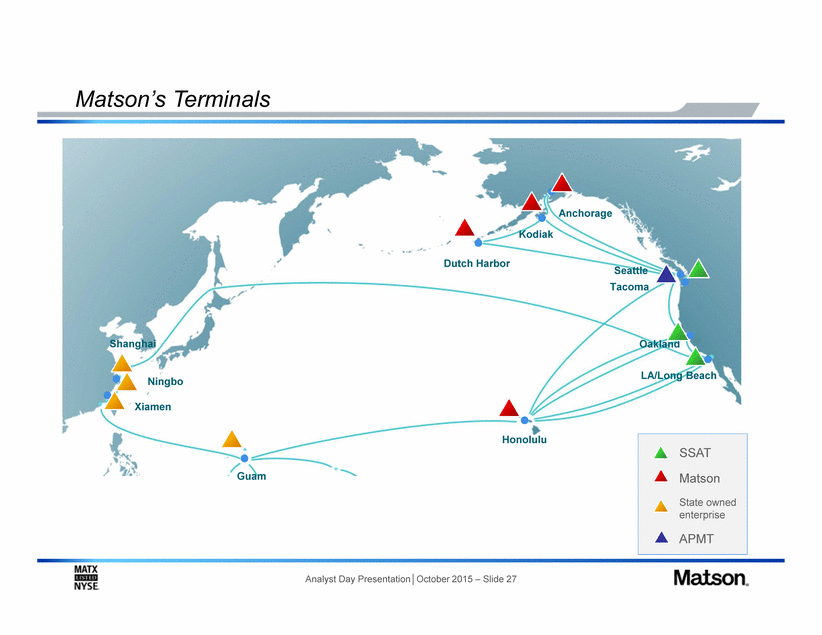
Matson’s Terminals Anchorage Kodiak Dutch Harbor Seattle Tacoma Shanghai Oakland LA/Long Beach Ningbo Xiamen Honolulu Guam Analyst Day Presentation│October 2015 – Slide 27 SSAT Matson State owned enterprise APMT |
|
|
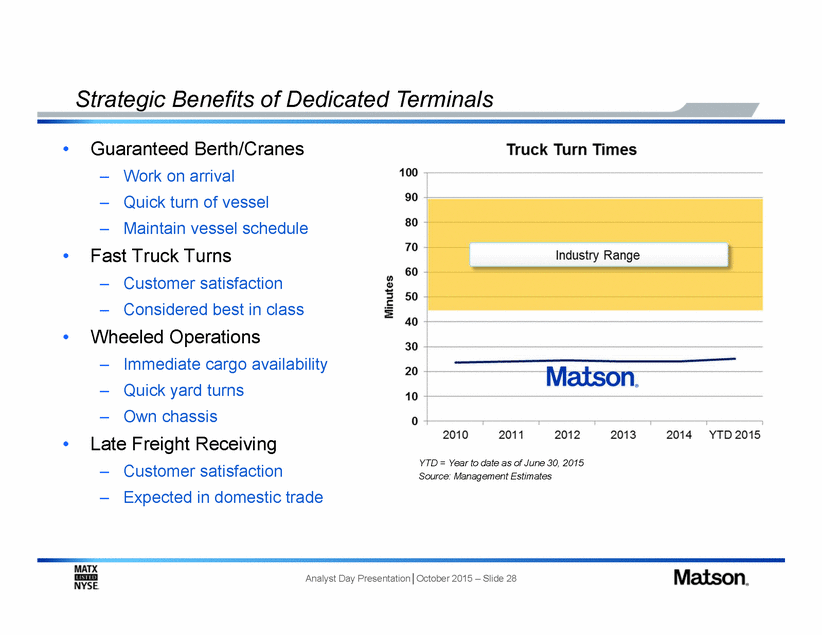
Strategic Benefits of Dedicated Terminals • Guaranteed Berth/Cranes – – – Work on arrival Quick turn of vessel Maintain vessel schedule • Fast Truck Turns – – Customer satisfaction Considered best in class • Wheeled Operations – – – Immediate cargo availability Quick yard turns Own chassis • Late Freight Receiving YTD = Year to date as of June 30, 2015 Source: Management Estimates – – Customer satisfaction Expected in domestic trade Analyst Day Presentation│October 2015 – Slide 28 |
|
|
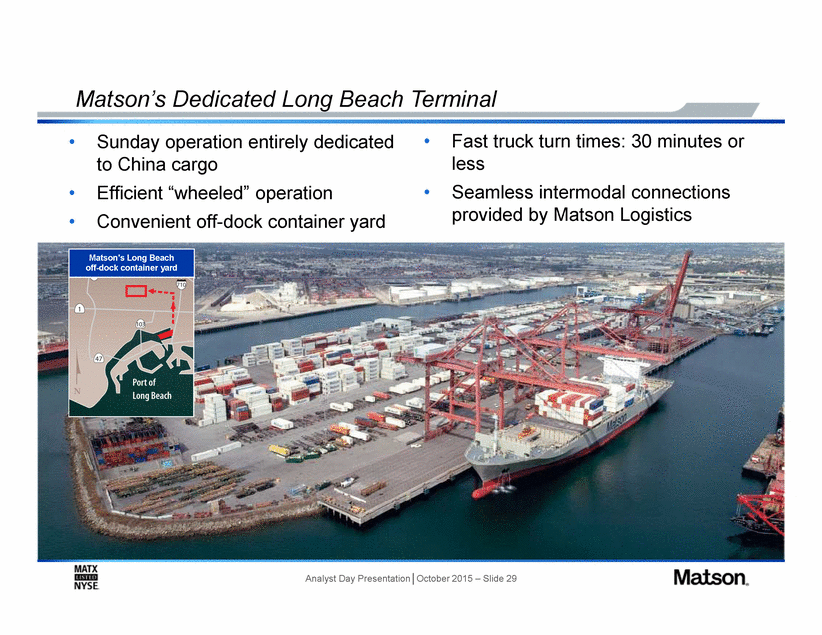
Matson’s Dedicated Long Beach Terminal • Fast truck turn times: 30 minutes or less Seamless intermodal connections • Sunday operation entirely dedicated to China cargo Efficient “wheeled” operation • • • provided by Matson Logistics Convenient off-dock container yard Analyst Day Presentation│October 2015 – Slide 29 |
|
|
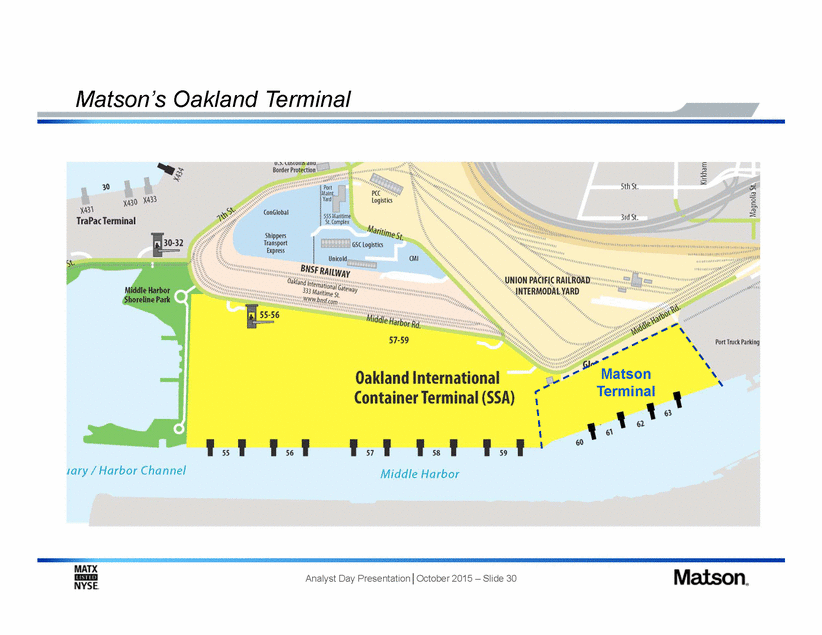
Matson’s Oakland Terminal Matson Terminal Analyst Day Presentation│October 2015 – Slide 30 |
|
|
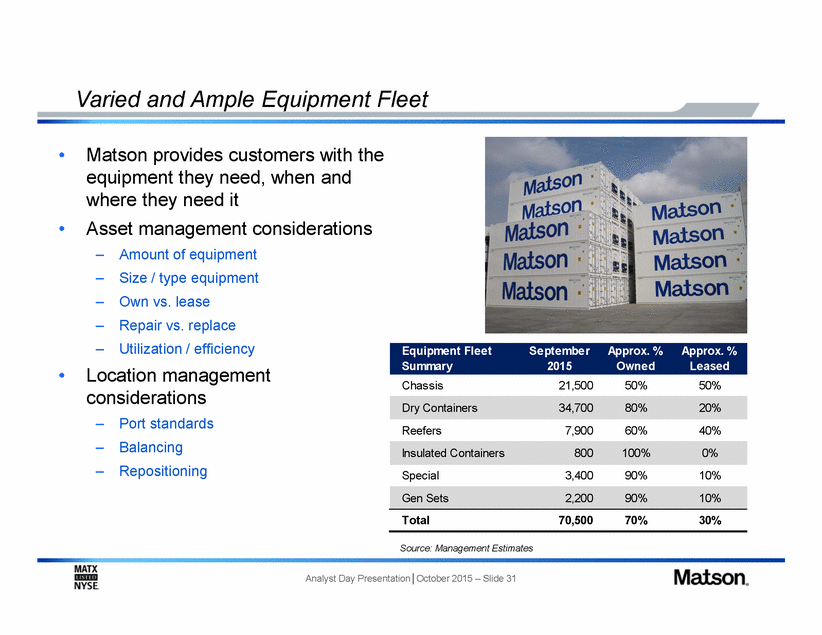
Varied and Ample Equipment Fleet • Matson provides customers with the equipment they need, when and where they need it Asset management considerations • – – – – – Amount of equipment Size / type equipment Own vs. lease Repair vs. replace Utilization / efficiency • Location management considerations Chassis 21,500 50% 50% – – – Port standards Balancing Repositioning Reefers 7,900 60% 40% Insulated Containers 800 100% 0% Special 3,400 90% 10% Total 70,500 70% 30% Source: Management Estimates Analyst Day Presentation│October 2015 – Slide 31 Gen Sets 2,200 90% 10% Dry Containers 34,700 80% 20% Equipment Fleet September Approx. % Approx. % Summary 2015 Owned Leased |
|
|
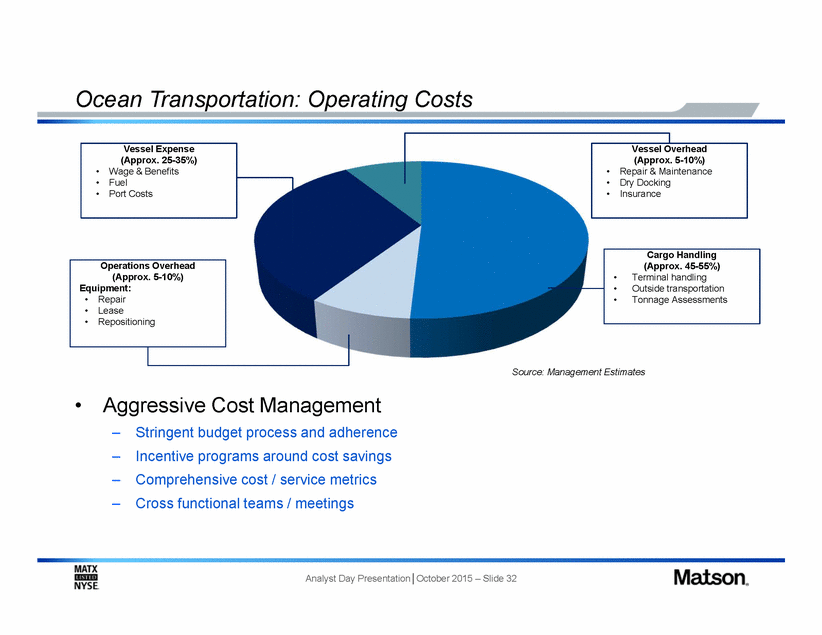
Ocean Transportation: Operating Costs Source: Management Estimates • Aggressive Cost Management – – – – Stringent budget process and adherence Incentive programs around cost savings Comprehensive cost / service metrics Cross functional teams / meetings Analyst Day Presentation│October 2015 – Slide 32 Operations Overhead (Approx. 5-10%) Equipment: • Repair • Lease • Repositioning Cargo Handling (Approx. 45-55%) •Terminal handling •Outside transportation •Tonnage Assessments Vessel Overhead (Approx. 5-10%) • Repair & Maintenance • Dry Docking • Insurance Vessel Expense (Approx. 25-35%) • Wage & Benefits • Fuel • Port Costs |
|
|
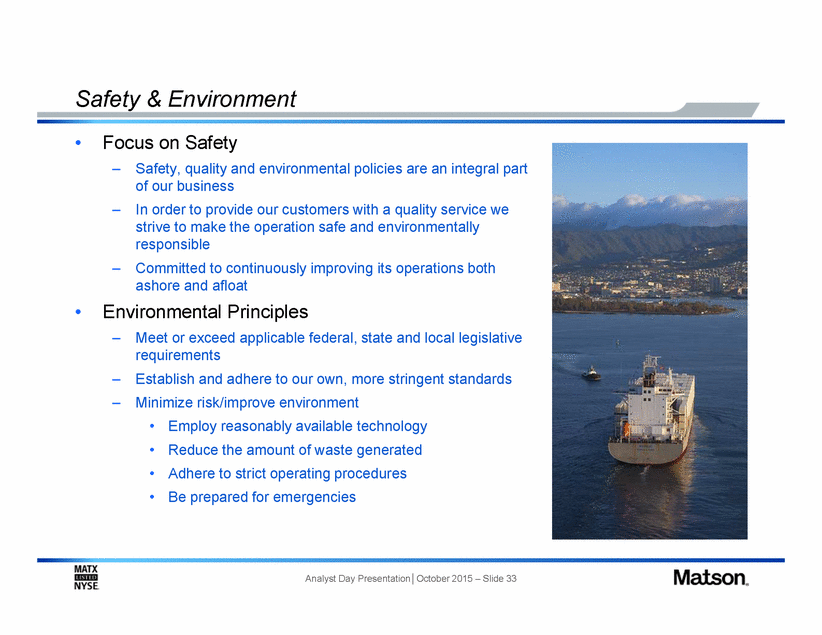
Safety & Environment • Focus on Safety – Safety, quality and environmental policies are an integral part of our business In order to provide our customers with a quality service we strive to make the operation safe and environmentally responsible Committed to continuously improving its operations both ashore and afloat – – • Environmental Principles – Meet or exceed applicable federal, state and local legislative requirements Establish and adhere to our own, more stringent standards Minimize risk/improve environment – – • • • • Employ reasonably available technology Reduce the amount of waste generated Adhere to strict operating procedures Be prepared for emergencies Analyst Day Presentation│October 2015 – Slide 33 |
|
|
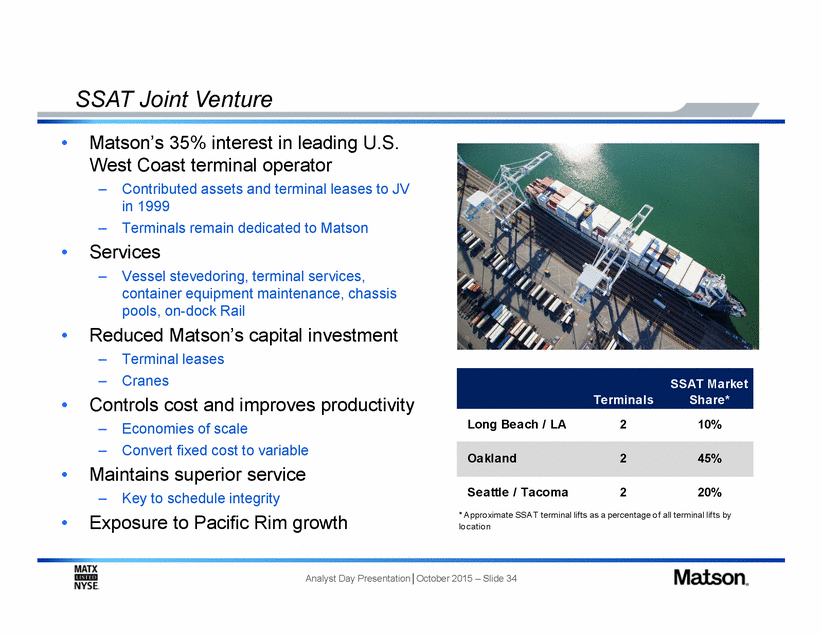
SSAT Joint Venture Matson’s 35% interest in leading U.S. West Coast terminal operator • – Contributed assets and terminal leases to JV in 1999 Terminals remain dedicated to Matson – • Services – Vessel stevedoring, terminal services, container equipment maintenance, chassis pools, on-dock Rail • Reduced Matson’s capital investment – – Terminal leases Cranes • Controls cost and improves productivity Long Beach / LA 2 10% – – Economies of scale Convert fixed cost to variable • Maintains superior service Seattle / Tacoma 2 20% – Key to schedule integrity * A ppro ximate SSA T terminal lifts as a percentage o f all terminal lifts by lo catio n • Exposure to Pacific Rim growth Analyst Day Presentation│October 2015 – Slide 34 Oakland 2 45% SSAT Market Terminals Share* |
|
|
Ocean Services John Lauer Senior Vice President Ocean Services Analyst Day Presentation│October 2015 – Slide 35 |
|
|
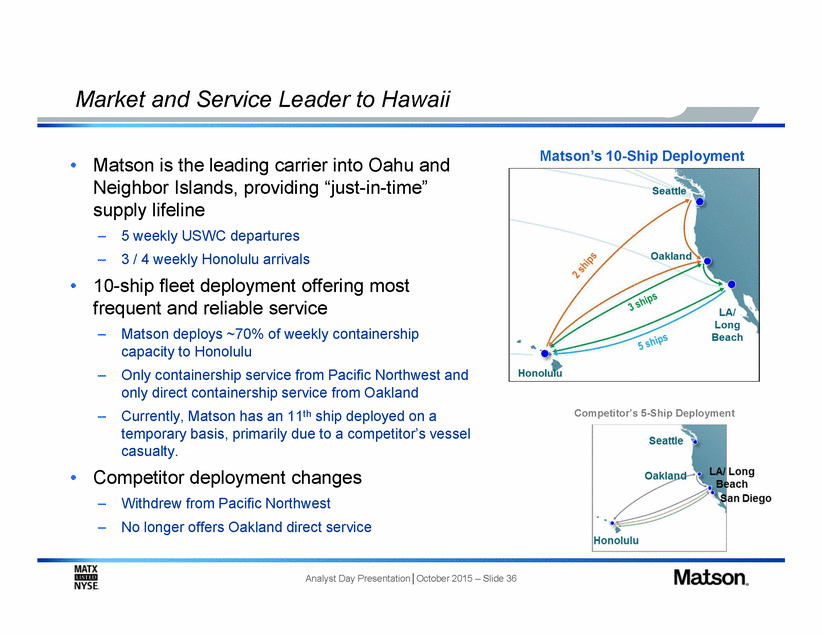
Market and Service Leader to Hawaii Matson’s 10-Ship Deployment • Matson is the leading carrier into Oahu and Neighbor Islands, providing “just-in-time” supply lifeline – – 5 weekly USWC departures 3 / 4 weekly Honolulu arrivals • 10-ship fleet deployment offering most frequent and reliable service – Matson deploys ~70% of weekly containership capacity to Honolulu Only containership service from Pacific Northwest and only direct containership service from Oakland Currently, Matson has an 11th ship deployed on a temporary basis, primarily due to a competitor’s vessel casualty. – Competitor’s 5-Ship Deployment – • Competitor deployment changes – – Withdrew from Pacific Northwest No longer offers Oakland direct service Analyst Day Presentation│October 2015 – Slide 36 |
|
|
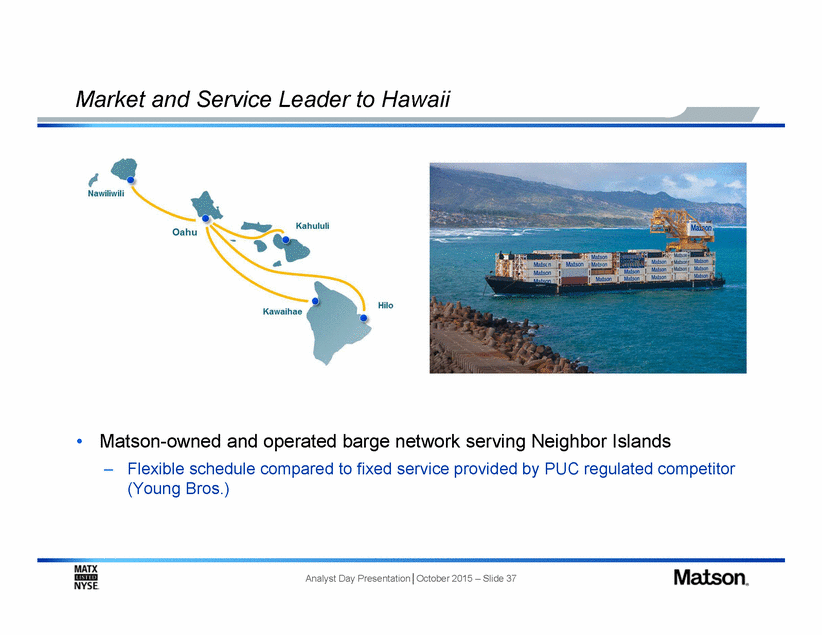
Market and Service Leader to Hawaii • Matson-owned and operated barge network serving Neighbor Islands – Flexible schedule compared to fixed service provided by PUC regulated competitor (Young Bros.) Analyst Day Presentation│October 2015 – Slide 37 |
|
|
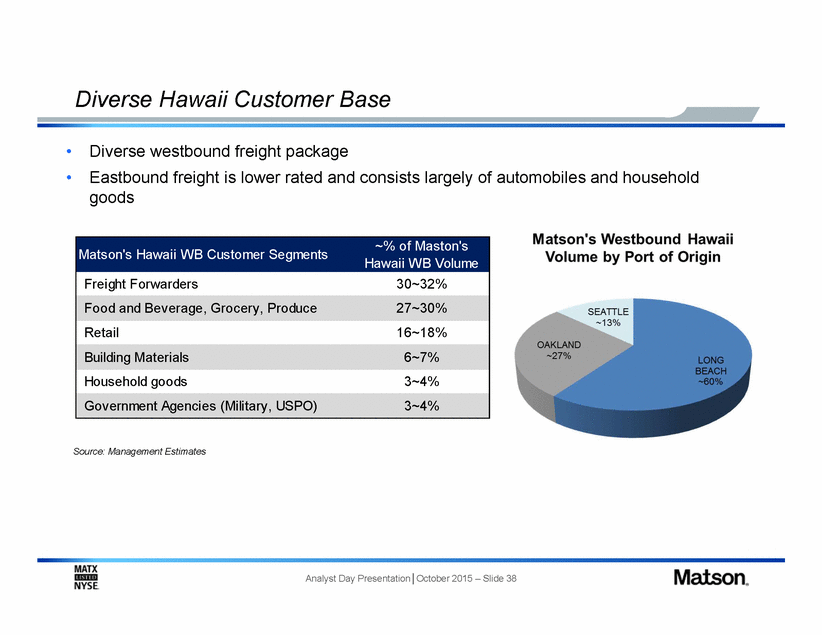
Diverse Hawaii Customer Base • • Diverse westbound freight package Eastbound freight is lower rated and consists largely of automobiles and household goods Hawaii WB Volume Source: Management Estimates Analyst Day Presentation│October 2015 – Slide 38 Matson's Hawaii WB Customer Segments~% of Maston's Freight Forwarders30~32% Food and Beverage, Grocery, Produce27~30% Retail16~18% Building Materials6~7% Household goods3~4% Government Agencies (Military, USPO)3~4% |
|
|
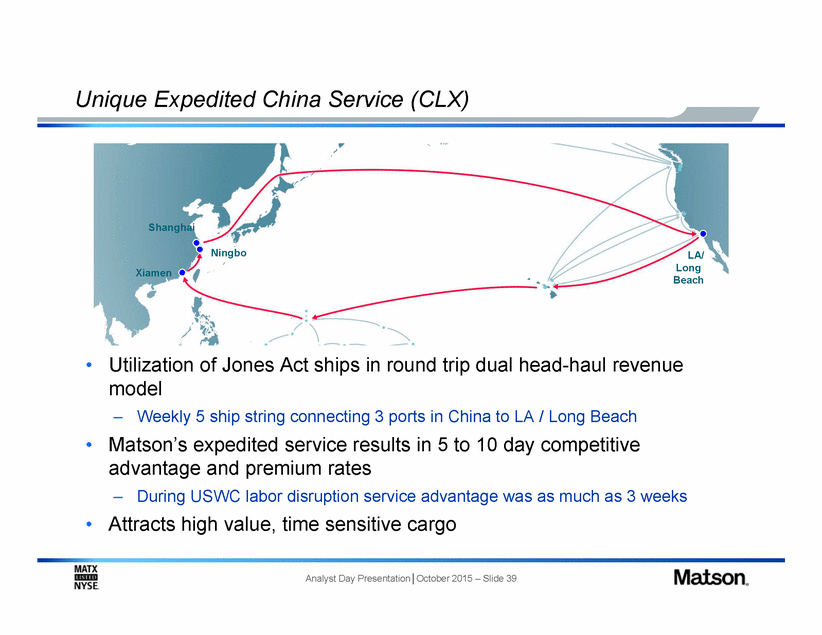
Unique Expedited China Service (CLX) Shanghai Ningbo LA/ Long Beach Xiamen • Utilization of Jones model Act ships in round trip dual head-haul revenue – Weekly 5 ship string connecting 3 ports in China to LA / Long Beach • Matson’s expedited service results in 5 to 10 day competitive advantage and premium rates – During USWC labor disruption service advantage was as much as 3 weeks • Attracts high value, time sensitive cargo Analyst Day Presentation│October 2015 – Slide 39 |
|
|
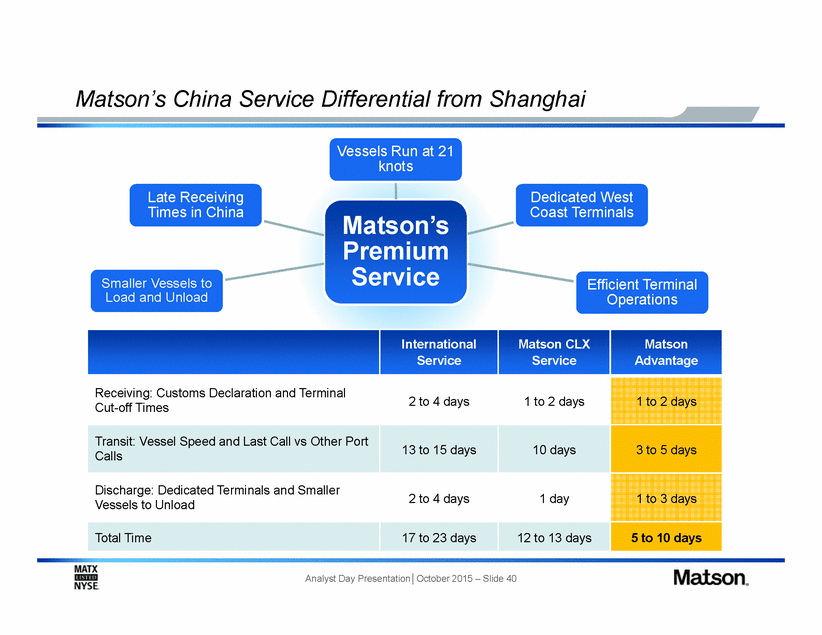
Matson’s China Service Differential from Shanghai Analyst Day Presentation│October 2015 – Slide 40 Internationa Receiving: Customs Declaration and Terminal Cut-off Times 2 to 4 days 1 to 2 days 1 to 2 days Transit: Vessel Speed and Last Call vs Other Port Calls 13 to 15 days 10 days 3 to 5 days Discharge: Dedicated Terminals and Smaller Vessels to Unload 2 to 4 days 1 day 1 to 3 days Total Time 17 to 23 days 12 to 13 days 5 to 10 days |
|
|
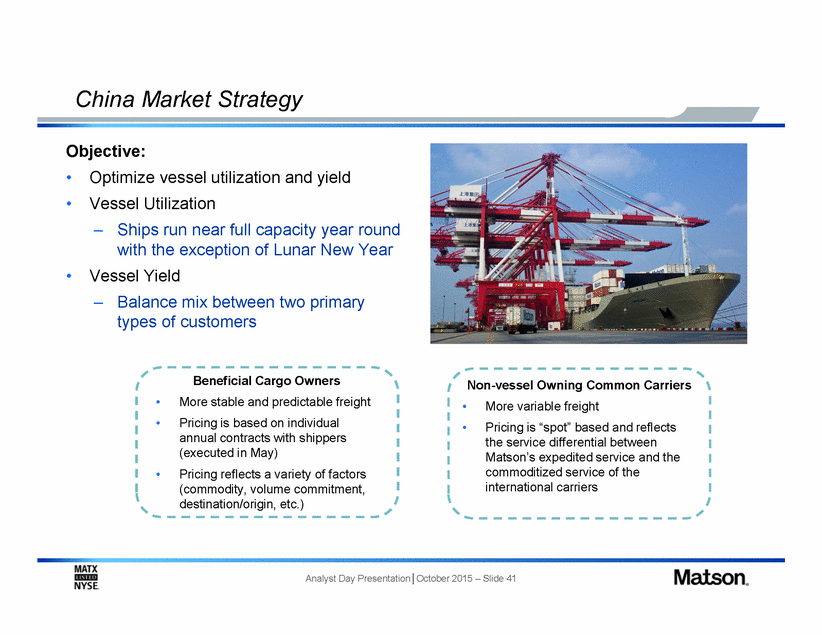
China Market Strategy Objective: • • Optimize vessel utilization and yield Vessel Utilization – Ships run near full capacity year round with the exception of Lunar New Year • Vessel Yield – Balance mix between two primary types of customers Beneficial Cargo Owners More stable and predictable freight Pricing is based on individual annual contracts with shippers (executed in May) Pricing reflects a variety of factors (commodity, volume commitment, destination/origin, etc.) Non-vessel Owning Common Carriers More variable freight Pricing is “spot” based and reflects the service differential between Matson’s expedited service and the commoditized service of the international carriers • • • • • Analyst Day Presentation│October 2015 – Slide 41 |
|
|
Guam, Micronesia and South Pacific Vic Angoco Senior Vice President Pacific Analyst Day Presentation│October 2015 – Slide 42 |
|
|
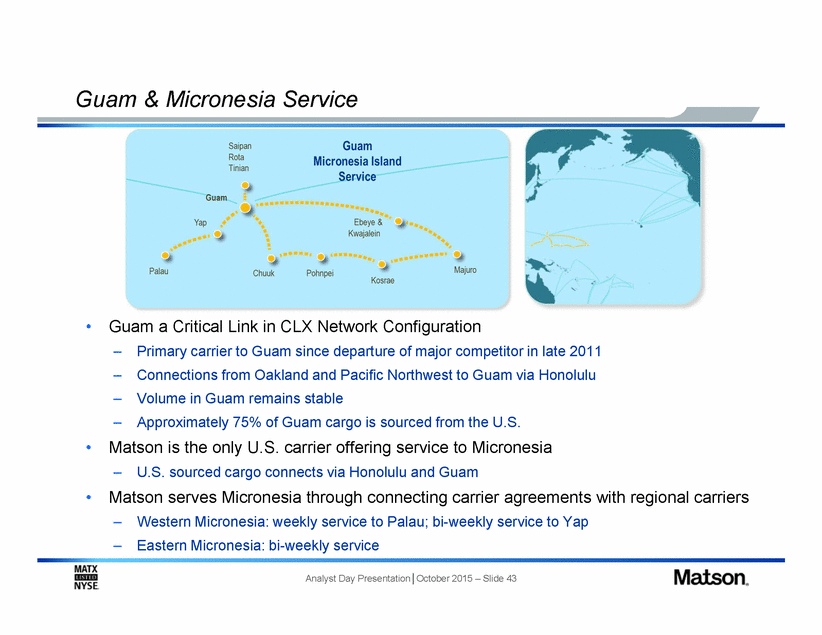
Guam & Micronesia Service • Guam a Critical Link in CLX Network Configuration – – – – Primary carrier to Guam since departure of major competitor in late 2011 Connections from Oakland and Pacific Northwest to Guam via Honolulu Volume in Guam remains stable Approximately 75% of Guam cargo is sourced from the U.S. • Matson is the only U.S. carrier offering service to Micronesia – U.S. sourced cargo connects via Honolulu and Guam • Matson serves Micronesia through connecting carrier agreements with regional carriers – – Western Micronesia: weekly service to Palau; bi-weekly service to Yap Eastern Micronesia: bi-weekly service Analyst Day Presentation│October 2015 – Slide 43 |
|
|
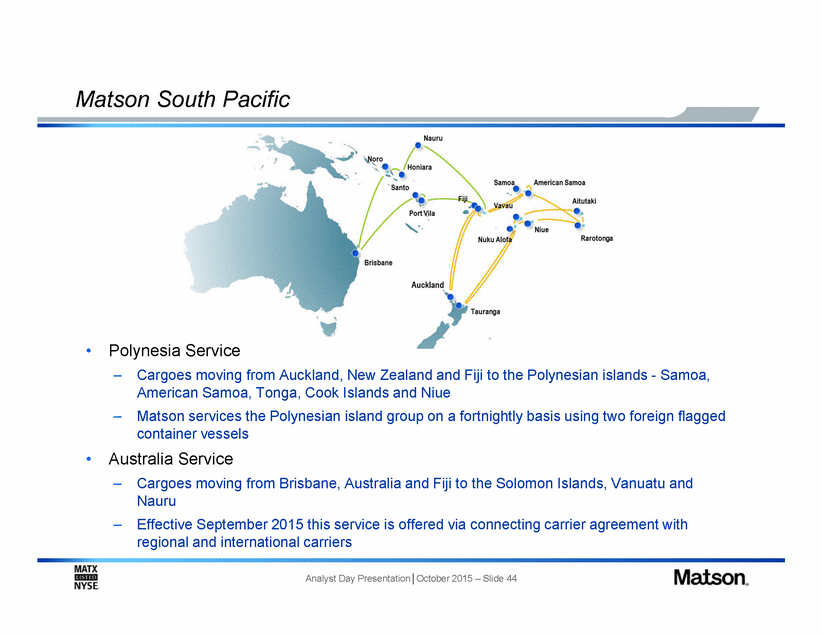
Matson South Pacific • Polynesia Service – Cargoes moving from Auckland, New Zealand and Fiji to the Polynesian islands - Samoa, American Samoa, Tonga, Cook Islands and Niue Matson services the Polynesian island group on a fortnightly basis using two foreign flagged container vessels – • Australia Service – Cargoes moving from Brisbane, Australia and Fiji to the Solomon Islands, Vanuatu and Nauru Effective September 2015 this service is offered via connecting carrier agreement with regional and international carriers – Analyst Day Presentation│October 2015 – Slide 44 |
|
|
Alaska Kenny Gill Vice President Alaska Analyst Day Presentation│October 2015 – Slide 45 |
|
|
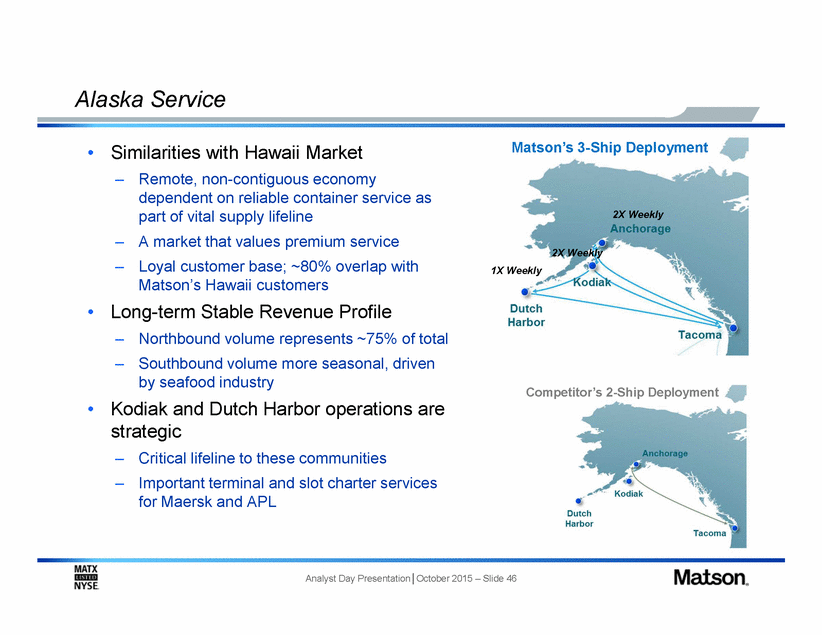
Alaska Service Matson’s 3-Ship Deployment • Similarities with Hawaii Market – Remote, non-contiguous economy dependent on reliable container service as part of vital supply lifeline A market that values premium service Loyal customer base; ~80% overlap with Matson’s Hawaii customers 2X Weekly – – 2X Weekly 1X Weekly • Long-term Stable Revenue Profile – – Northbound volume represents ~75% of total Southbound volume more seasonal, driven by seafood industry Competitor’s 2-Ship Deployment • Kodiak and Dutch Harbor operations are strategic – – Critical lifeline to these communities Important terminal and slot charter services for Maersk and APL Analyst Day Presentation│October 2015 – Slide 46 |
|
|
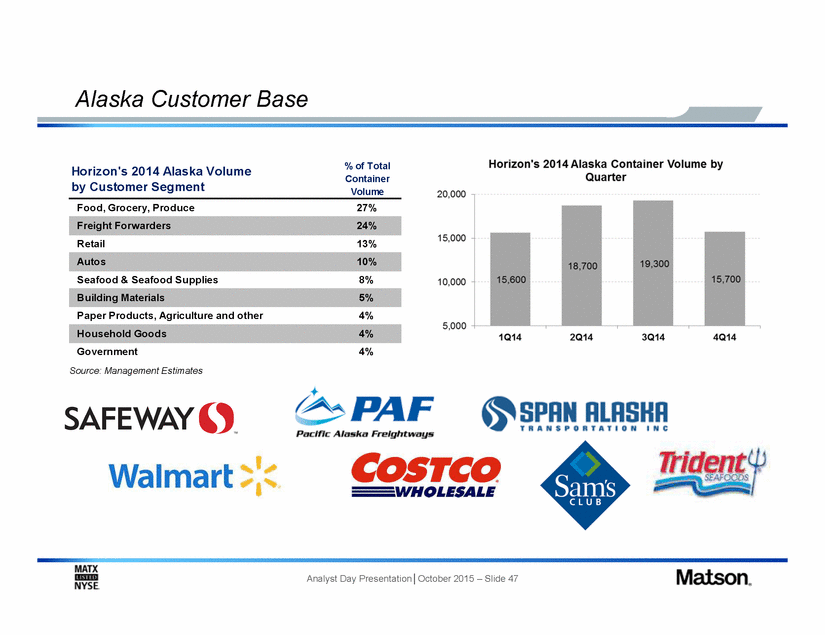
Alaska Customer Base % of Total Container Volume Horizon's 2014 Alaska Volume by Customer Segment Food, Grocery, Produce 27% Retail 13% Seafood & Seafood Supplies 8% Paper Products, Agriculture and other 4% Government Source: Management Estimates 4% Analyst Day Presentation│October 2015 – Slide 47 Household Goods4% Building Materials5% Autos10% Freight Forwarders24% |
|
|
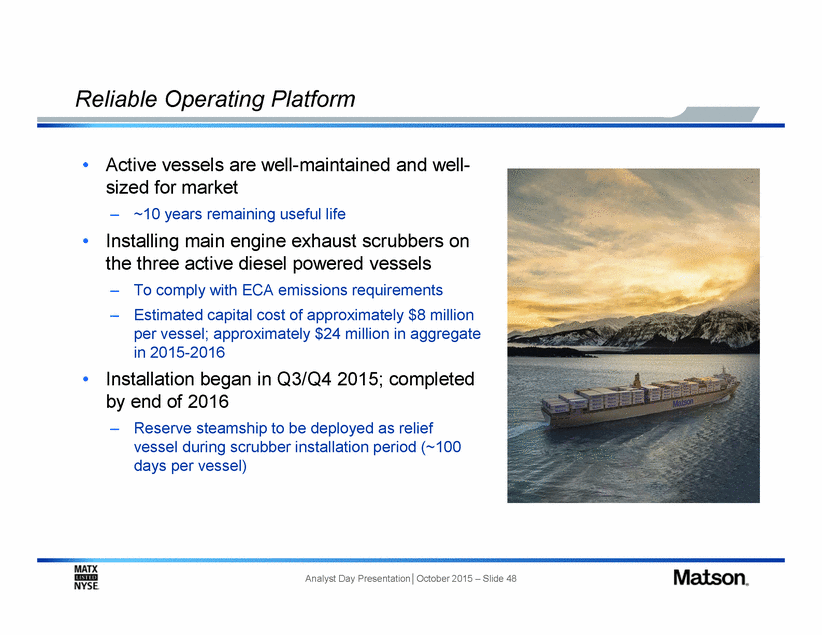
Reliable Operating Platform • Active vessels are well-maintained and well-sized for market – ~10 years remaining useful life • Installing main engine exhaust scrubbers on the three active diesel powered vessels – – To comply with ECA emissions requirements Estimated capital cost of approximately $8 million per vessel; approximately $24 million in aggregate in 2015-2016 • Installation began in Q3/Q4 2015; completed by end of 2016 – Reserve steamship to be deployed as relief vessel during scrubber installation period (~100 days per vessel) Analyst Day Presentation│October 2015 – Slide 48 |
|
|
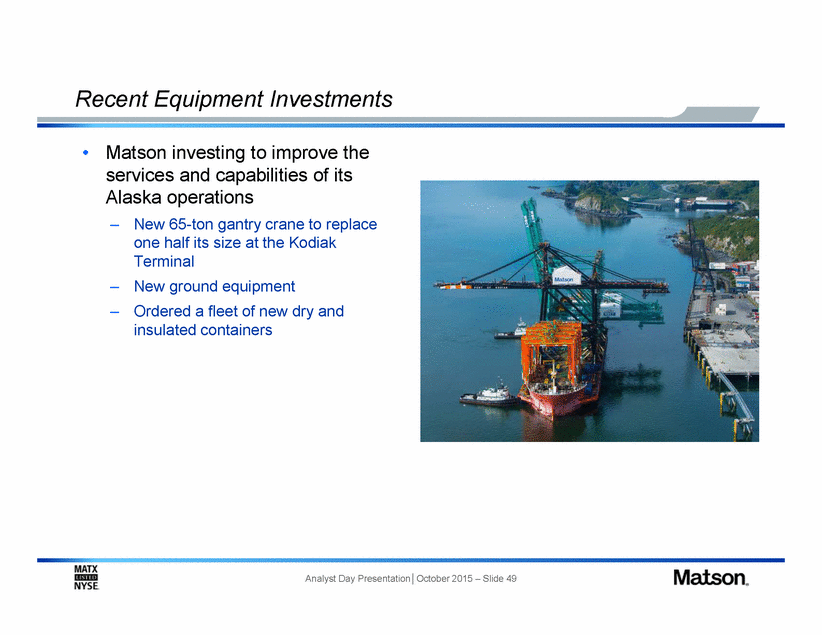
Recent Equipment Investments • Matson investing to improve the services and capabilities of its Alaska operations – New 65-ton gantry crane to replace one half its size at the Kodiak Terminal New ground equipment Ordered a fleet of new dry and insulated containers – – Analyst Day Presentation│October 2015 – Slide 49 |
|
|
Appendix 50 Analyst Day Presentation│October 2015 – Slide 50 |
|
|
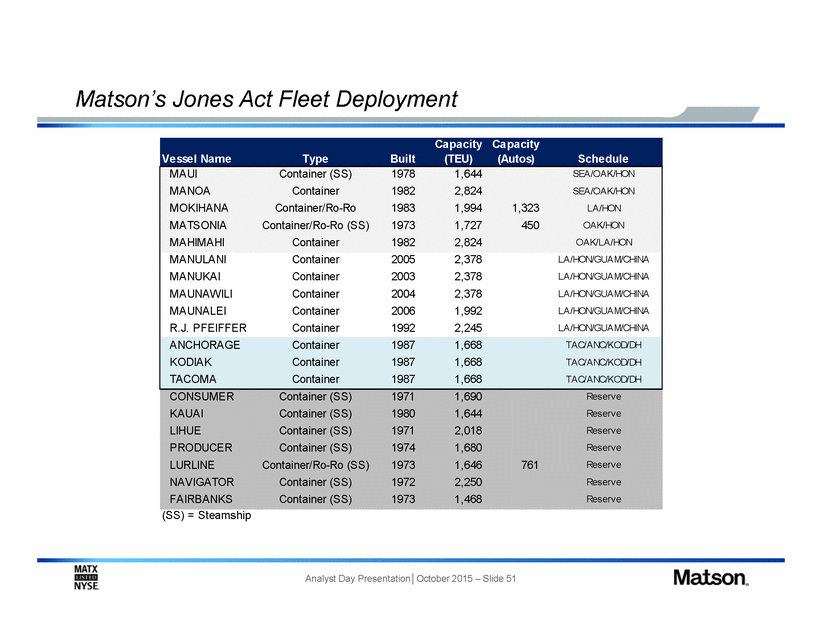
Matson’s Jones Act Fleet Deployment (SS) = Steamship Analyst Day Presentation│October 2015 – Slide 51 Capacity Capacity Vessel Name Type Built (TEU) (Autos) Schedule MAUI Container (SS) 1978 1,644 SEA/OAK/HON MANOA Container 1982 2,824 SEA/OAK/HON MOKIHANA Container/Ro-Ro 1983 1,994 1,323 LA/HON MATSONIA Container/Ro-Ro (SS) 1973 1,727 450 OAK/HON MAHIMAHI Container 1982 2,824 OAK/LA/HON MANULANI Container 2005 2,378 LA/HON/GUAM/CHINA MANUKAI Container 2003 2,378 LA/HON/GUAM/CHINA MAUNAWILI Container 2004 2,378 LA/HON/GUAM/CHINA MAUNALEI Container 2006 1,992 LA/HON/GUAM/CHINA R.J. PFEIFFER Container 1992 2,245 LA/HON/GUAM/CHINA ANCHORAGE Container 1987 1,668 TAC/ANC/KOD/DH KODIAK Container 1987 1,668 TAC/ANC/KOD/DH TACOMA Container 1987 1,668 TAC/ANC/KOD/DH CONSUMER Container (SS) 1971 1,690 Reserve KAUAI Container (SS) 1980 1,644 Reserve LIHUE Container (SS) 1971 2,018 Reserve PRODUCER Container (SS) 1974 1,680 Reserve LURLINE Container/Ro-Ro (SS) 1973 1,646 761 Reserve NAVIGATOR Container (SS) 1972 2,250 Reserve FAIRBANKS Container (SS) 1973 1,468 Reserve |
|
|
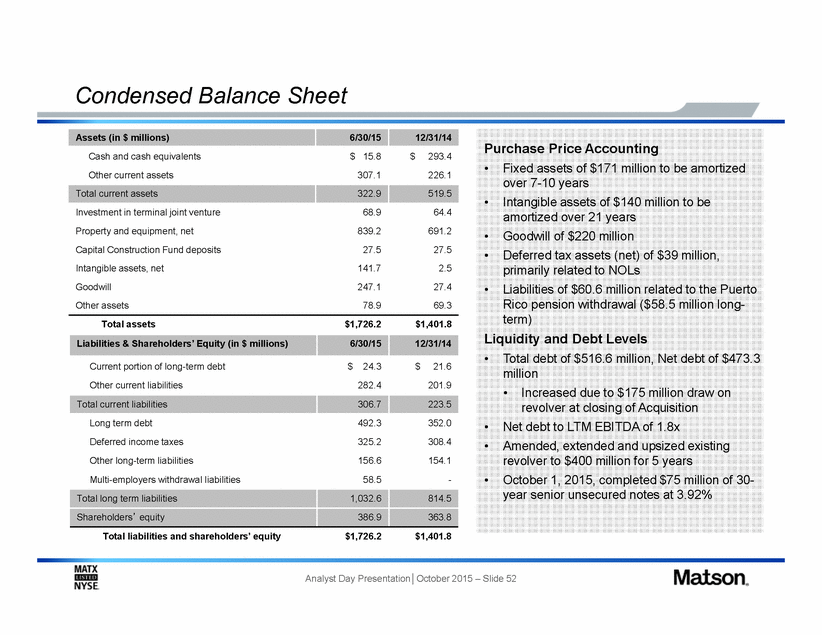
Condensed Balance Sheet Purchase Price Accounting • Fixed assets of $171 million to be amortized over 7-10 years Intangible assets of $140 million to be amortized over 21 years Goodwill of $220 million Deferred tax assets (net) of $39 million, primarily related to NOLs Liabilities of $60.6 million related to the Puerto Rico pension withdrawal ($58.5 million long-term) • • • • Liquidity and Debt Levels • Total debt of $516.6 million, Net debt of $473.3 million • Increased due to $175 million draw on revolver at closing of Acquisition • • Net debt to LTM EBITDA of 1.8x Amended, extended and upsized existing revolver to $400 million for 5 years October 1, 2015, completed $75 million of 30-year senior unsecured notes at 3.92% • Analyst Day Presentation│October 2015 – Slide 52 Assets (in $ millions)6/30/1512/31/14 Cash and cash equivalents$ 15.8$293.4 Other current assets307.1226.1 Total current assets322.9519.5 Investment in terminal joint venture68.964.4 Property and equipment, net839.2691.2 Capital Construction Fund deposits27.527.5 Intangible assets, net141.72.5 Goodwill247.127.4 Other assets78.969.3 Total assets$1,726.2$1,401.8 Liabilities & Shareholders’ Equity (in $ millions)6/30/1512/31/14 Current portion of long-term debt$24.3$21.6 Other current liabilities282.4201.9 Total current liabilities306.7223.5 Long term debt492.3352.0 Deferred income taxes325.2308.4 Other long-term liabilities156.6154.1 Multi-employers withdrawal liabilities58.5-Total long term liabilities1,032.6814.5 Shareholders’ equity386.9363.8 Total liabilities and shareholders’ equity$1,726.2$1,401.8 |
|
|
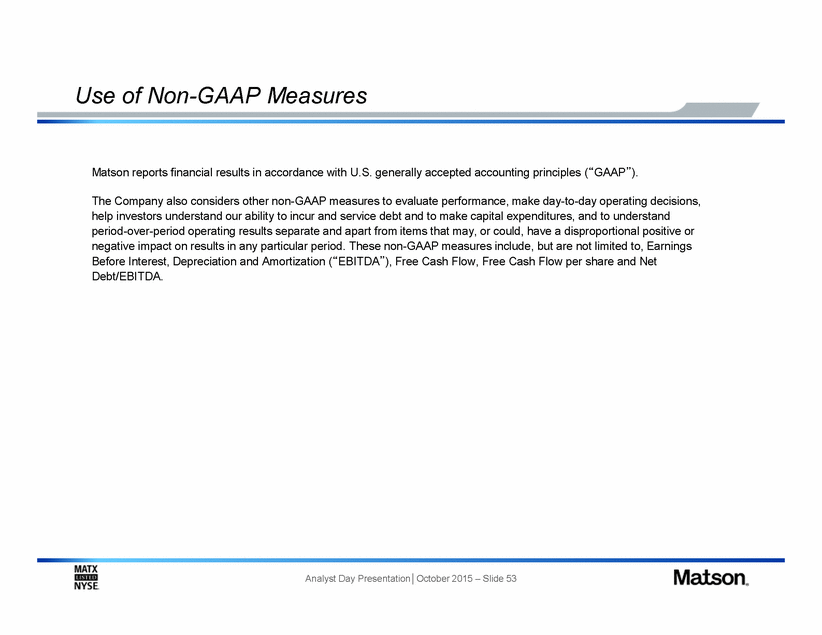
Use of Non-GAAP Measures Matson reports financial results in accordance with U.S. generally accepted accounting principles (“GAAP”). The Company also considers other non-GAAP measures to evaluate performance, make day-to-day operating decisions, help investors understand our ability to incur and service debt and to make capital expenditures, and to understand period-over-period operating results separate and apart from items that may, or could, have a disproportional positive or negative impact on results in any particular period. These non-GAAP measures include, but are not limited to, Earnings Before Interest, Depreciation and Amortization (“EBITDA”), Free Cash Flow, Free Cash Flow per share and Net Debt/EBITDA. Analyst Day Presentation│October 2015 – Slide 53 |
|
|
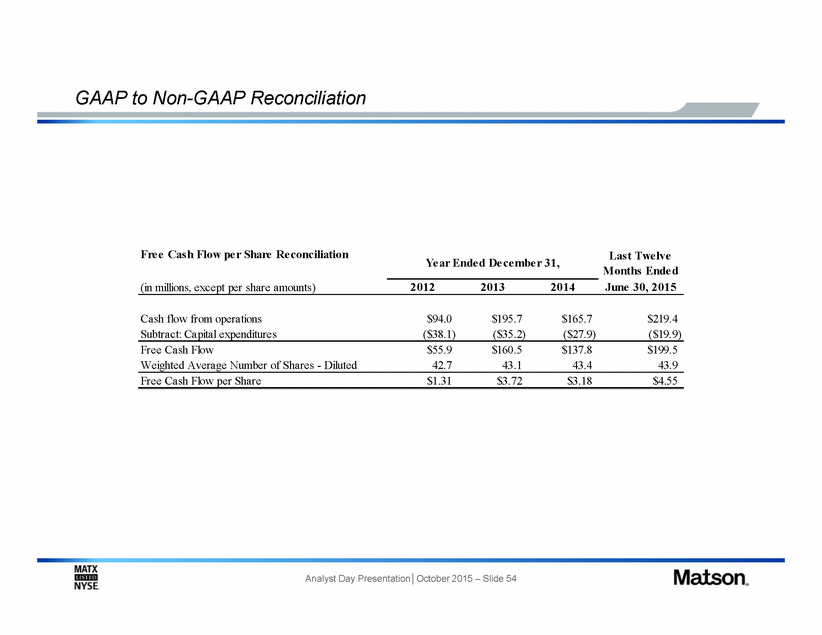
GAAP to Non-GAAP Reconciliation Fre e Cas h Flow pe r Share Re conciliation Las t Twe lve Months Ende d June 30, 2015 Ye ar Ende d De ce mbe r 31, 2012 2013 2014 (in millions, except per share amounts) Cash flow from operations Subtract: Capital expenditures $94.0 ($38.1) $195.7 ($35.2) $165.7 ($27.9) $219.4 ($19.9) Free Cash Flow Weighted Average Number of Shares - Diluted $55.9 42.7 $160.5 43.1 $137.8 43.4 $199.5 43.9 Free Cash Flow per Share $1.31 $3.72 $3.18 $4.55 Analyst Day Presentation│October 2015 – Slide 54 |
|
|
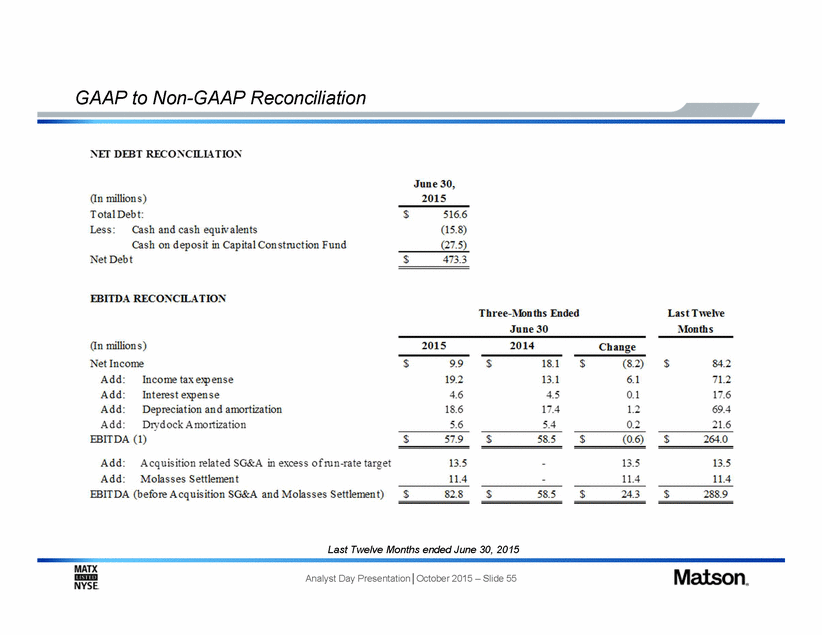
GAAP to Non-GAAP Reconciliation ::\TI DEBT RECO Cll...l<\ TIO June30, 2015 (In millions) Total Deb t: $ 516.6 (15.8) (27.5) Less: Cash and cash equivalents Cash on deposit in Capital Construction Fund Net Debt $ 473.3 EBITDA RECO Cn.ATIO Three-Mooths Ended June 30 Last Twelve Months (In millions) Net Income 2015 2014 Change 9.9 19.2 4.6 18.6 5.6 18.1 13.1 4.5 17.4 5.4 (8.2) 6.1 0.1 L2 0.2 84.2 71.2 1 _6 69.4 21.6 $ $ $ $ Add: Add: Add: Add: Income tax e>q> ense Interest expense Depreciation and amortization Dtyd ock Amortization EBITDA (1) $ 57.9 $ 58.5 $ (0.6) 264.0 $ Add: Add: Acquis ition related SG&A in excess of run-rate target Molasses Settlement 13.5 11.4 13.5 11.4 13.5 11.4 EBITDA (before Acquisition SG&A and Molasses Settlement) $ 82.8 $ 58.5 $ 24.3 288.9 $ Last Twelve Months ended June 30, 2015 M.A,TX. Matson. Analyst Day Presentation IOctober 2015 - Slide 55 NYSE. |

