Attached files
| file | filename |
|---|---|
| 8-K - 8-K - ASHFORD HOSPITALITY TRUST INC | ahtinvestorpresentation8-k.htm |

Company Presentation - October 2015
2 Safe Harbor In keeping with the SEC's "Safe Harbor" guidelines, certain statements made during this presentation could be considered forward-looking and subject to certain risks and uncertainties that could cause results to differ materially from those projected. When we use the words "will likely result," "may," "anticipate," "estimate," "should," "expect," "believe," "intend," or similar expressions, we intend to identify forward- looking statements. Such forward-looking statements include, but are not limited to, our business and investment strategy, our understanding of our competition, current market trends and opportunities, projected operating results, and projected capital expenditures. These forward-looking statements are subject to known and unknown risks and uncertainties, which could cause actual results to differ materially from those anticipated including, without limitation: general volatility of the capital markets and the market price of our common stock; changes in our business or investment strategy; availability, terms and deployment of capital; availability of qualified personnel; changes in our industry and the market in which we operate, interest rates or the general economy, and the degree and nature of our competition. These and other risk factors are more fully discussed in the Company's filings with the Securities and Exchange Commission. Historical results are not indicative of future performance. EBITDA is defined as net income before interest, taxes, depreciation and amortization. EBITDA yield is defined as trailing twelve month EBITDA divided by the purchase price. A capitalization rate is determined by dividing the property's net operating income by the purchase price. Net operating income is the property's funds from operations minus a capital expense reserve of either 4% or 5% of gross revenues. Hotel EBITDA flow-through is the change in Hotel EBITDA divided by the change in total revenues. EBITDA, FFO, AFFO, CAD and other terms are non-GAAP measures, reconciliations of which have been provided in prior earnings releases and filings with the SEC. This overview is for informational purposes only and is not an offer to sell, or a solicitation of an offer to buy or sell, any securities of Ashford Hospitality Trust, Inc. or any of its respective affiliates, and may not be relied upon in connection with the purchase or sale of any such security.

Compelling Opportunity 3
4 Opportunistic Strategy Predominantly focused on opportunities to invest in upper upscale, full- service hotels in all market locations with the following characteristics: Accretive, value-add opportunities Strong yields and outsized growth prospects Markets with favorable supply/demand dynamics Ability to install Remington as property manager to drive improved operating performance Highly-aligned management team with proven track record of long-term value creation Leveraged way to invest in hotel cycle Industry leading dividend yield
5 Compelling Opportunity Attractive industry fundamentals with demand growth exceeding supply growth Several attractive acquisitions completed year-to-date Affiliated property manager results in strong operating results and flow- throughs Upcoming refinancings with potential for significant excess proceeds Net working capital of $558 million at 6/30/15 Announced planned sale of 24 select-service hotels Very competitive dividend yield as compared with peers Proactively engaging with the investment community and responsive to shareholders
6 Recent Announcements Announced the planned sale of 24 select-service hotels with a total of 4,410 keys, $45.0 million in TTM NOI, and encumbered by approximately $190 million of fixed rate debt and $194 million of maturing or floating rate debt. Other strategic initiatives announced include: The Company is not planning nor does it expect any future platform spinoffs Continue to target cash and cash equivalents equal to 25%-35% of total equity market capitalization Continue to target net debt to gross assets of 55%–60%
7 Strong Track Record & Performance
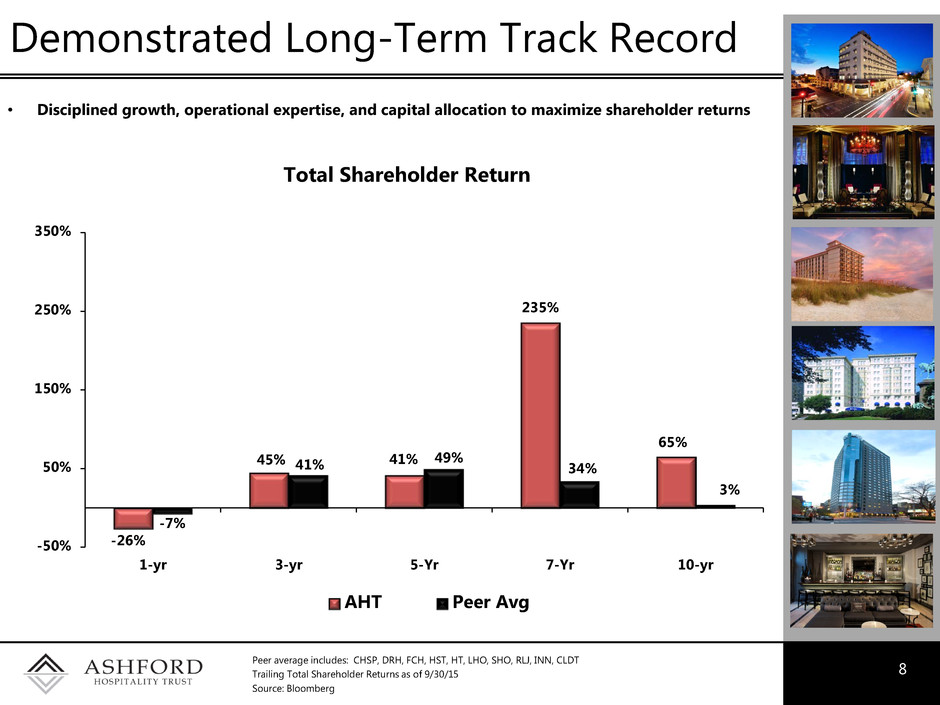
Demonstrated Long-Term Track Record 8 • Disciplined growth, operational expertise, and capital allocation to maximize shareholder returns Peer average includes: CHSP, DRH, FCH, HST, HT, LHO, SHO, RLJ, INN, CLDT Trailing Total Shareholder Returns as of 9/30/15 Source: Bloomberg Total Shareholder Return -26% 45% 41% 235% 65% -7% 41% 49% 34% 3% -50% 50% 150% 250% 350% 1-yr 3-yr 5-Yr 7-Yr 10-yr AHT Peer Avg
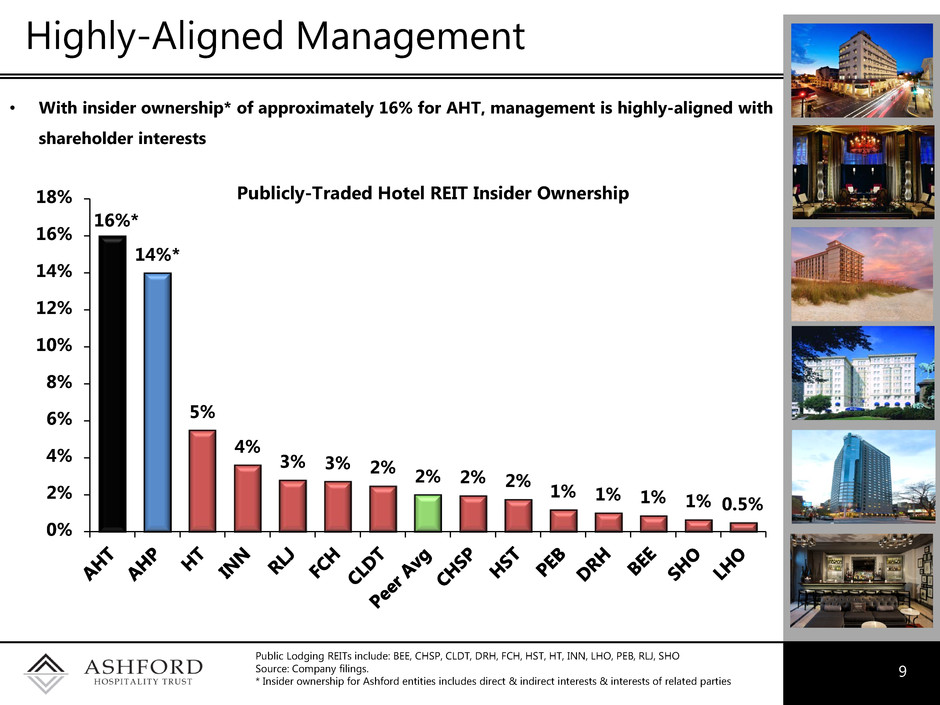
Highly-Aligned Management 9 • With insider ownership* of approximately 16% for AHT, management is highly-aligned with shareholder interests Publicly-Traded Hotel REIT Insider Ownership Public Lodging REITs include: BEE, CHSP, CLDT, DRH, FCH, HST, HT, INN, LHO, PEB, RLJ, SHO Source: Company filings. * Insider ownership for Ashford entities includes direct & indirect interests & interests of related parties 16%* 14%* 5% 4% 3% 3% 2% 2% 2% 2% 1% 1% 1% 1% 0.5% 0% 2% 4% 6% 8% 10% 12% 14% 16% 18%
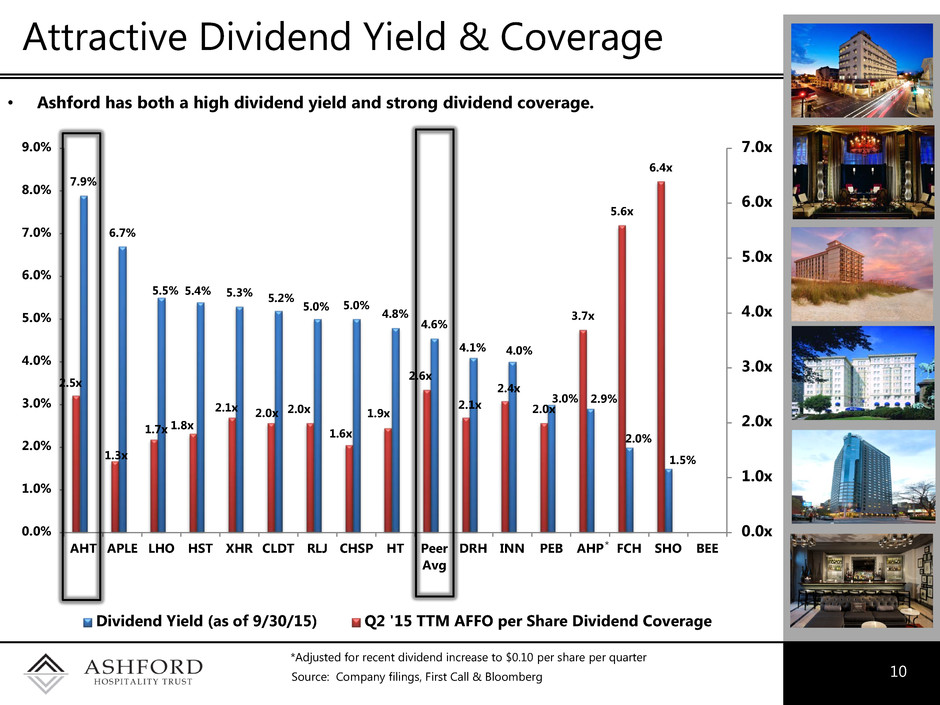
10 Attractive Dividend Yield & Coverage • Ashford has both a high dividend yield and strong dividend coverage. 7.9% 6.7% 5.5% 5.4% 5.3% 5.2% 5.0% 5.0% 4.8% 4.6% 4.1% 4.0% 3.0% 2.9% 2.0% 1.5% 2.5x 1.3x 1.7x 1.8x 2.1x 2.0x 2.0x 1.6x 1.9x 2.6x 2.1x 2.4x 2.0x 3.7x 5.6x 6.4x 0.0x 1.0x 2.0x 3.0x 4.0x 5.0x 6.0x 7.0x 0.0% 1.0% 2.0% 3.0% 4.0% 5.0% 6.0% 7.0% 8.0% 9.0% AHT APLE LHO HST XHR CLDT RLJ CHSP HT Peer Avg DRH INN PEB AHP FCH SHO BEE Dividend Yield (as of 9/30/15) Q2 '15 TTM AFFO per Share Dividend Coverage Source: Company filings, First Call & Bloomberg * *Adjusted for recent dividend increase to $0.10 per share per quarter
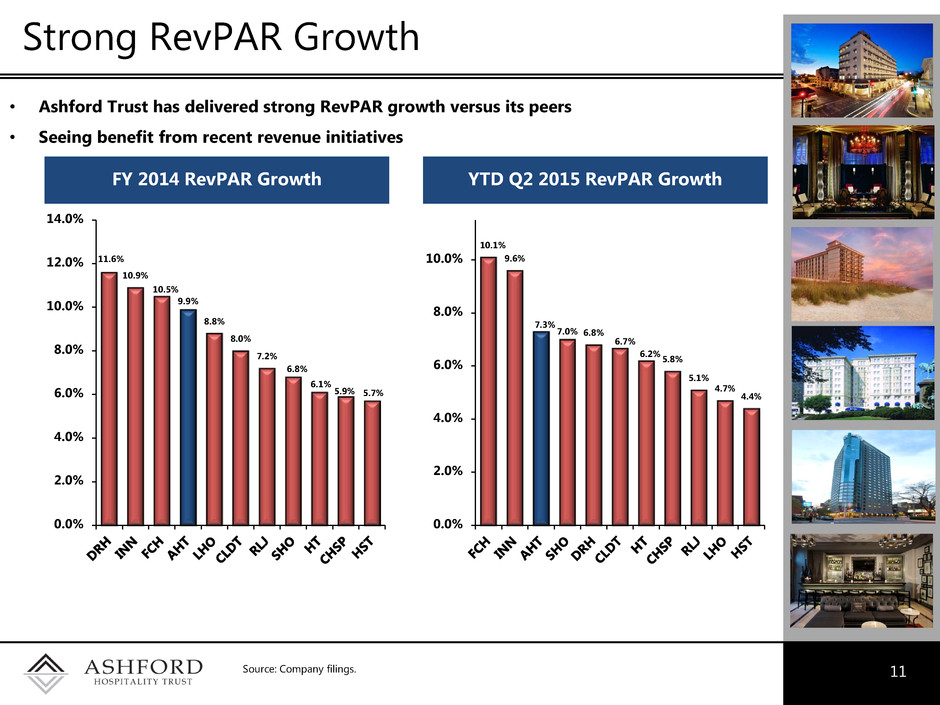
11 Strong RevPAR Growth FY 2014 RevPAR Growth Source: Company filings. • Ashford Trust has delivered strong RevPAR growth versus its peers • Seeing benefit from recent revenue initiatives 11.6% 10.9% 10.5% 9.9% 8.8% 8.0% 7.2% 6.8% 6.1% 5.9% 5.7% 0.0% 2.0% 4.0% 6.0% 8.0% 10.0% 12.0% 14.0% YTD Q2 2015 RevPAR Growth 10.1% 9.6% 7.3% 7.0% 6.8% 6.7% 6.2% 5.8% 5.1% 4.7% 4.4% 0.0% 2.0% 4.0% 6.0% 8.0% 10.0%
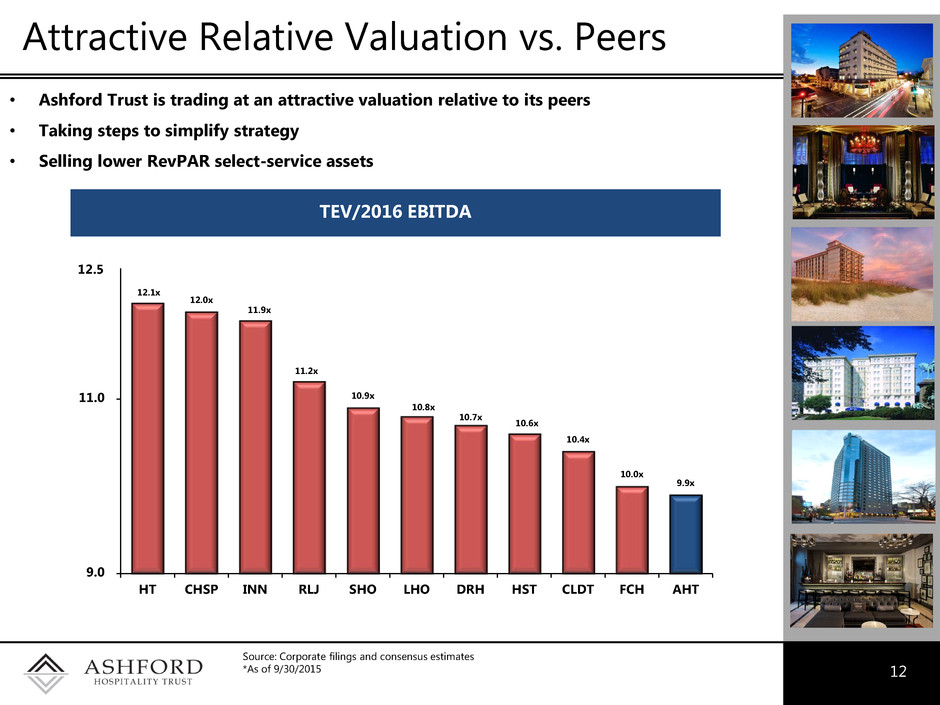
12 Attractive Relative Valuation vs. Peers Source: Corporate filings and consensus estimates *As of 9/30/2015 • Ashford Trust is trading at an attractive valuation relative to its peers • Taking steps to simplify strategy • Selling lower RevPAR select-service assets TEV/2016 EBITDA 12.1x 12.0x 11.9x 11.2x 10.9x 10.8x 10.7x 10.6x 10.4x 10.0x 9.9x 9.0 11.0 HT CHSP INN RLJ SHO LHO DRH HST CLDT FCH AHT 12.5
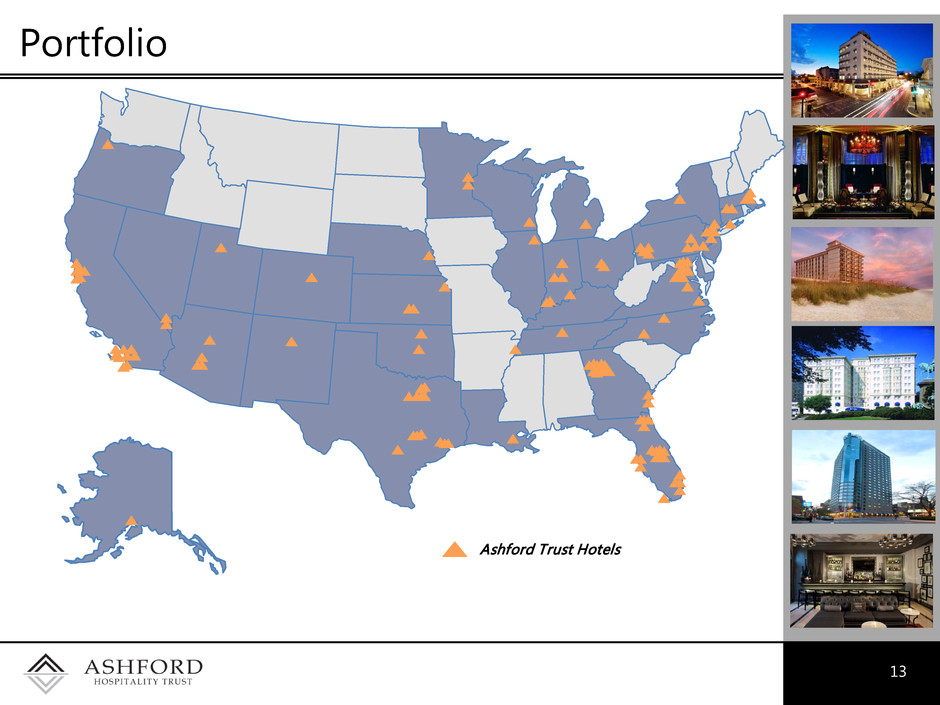
13 Portfolio Ashford Trust Hotels
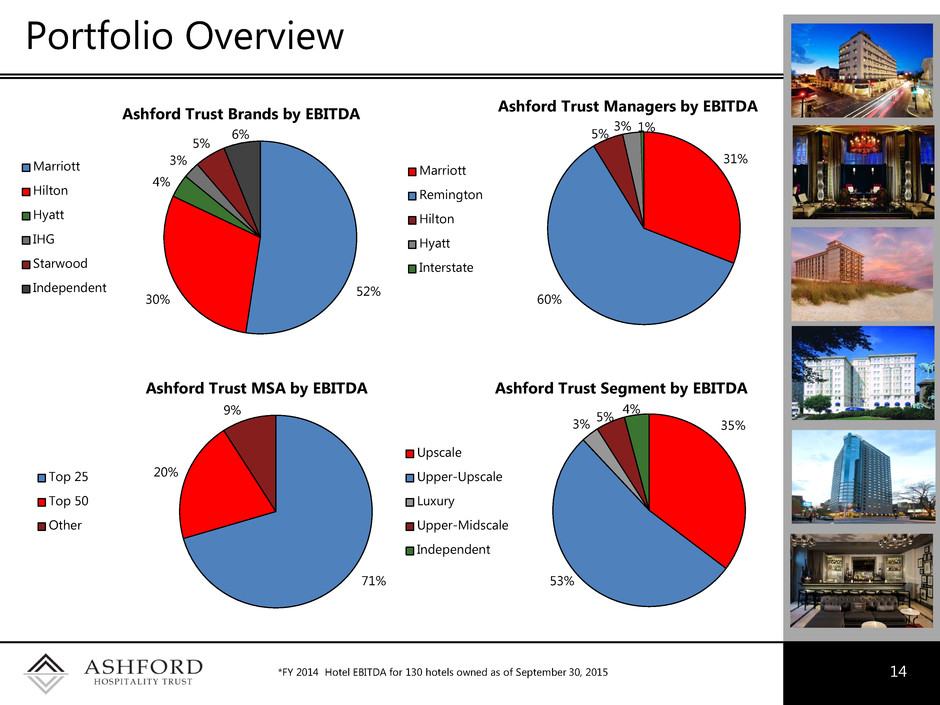
Portfolio Overview 14 52% 30% 4% 3% 5% 6% Ashford Trust Brands by EBITDA Marriott Hilton Hyatt IHG Starwood Independent 31% 60% 5% 3% 1% Ashford Trust Managers by EBITDA Marriott Remington Hilton Hyatt Interstate 71% 20% 9% Ashford Trust MSA by EBITDA Top 25 Top 50 Other 35% 53% 3% 5% 4% Ashford Trust Segment by EBITDA Upscale Upper-Upscale Luxury Upper-Midscale Independent *FY 2014 Hotel EBITDA for 130 hotels owned as of September 30, 2015
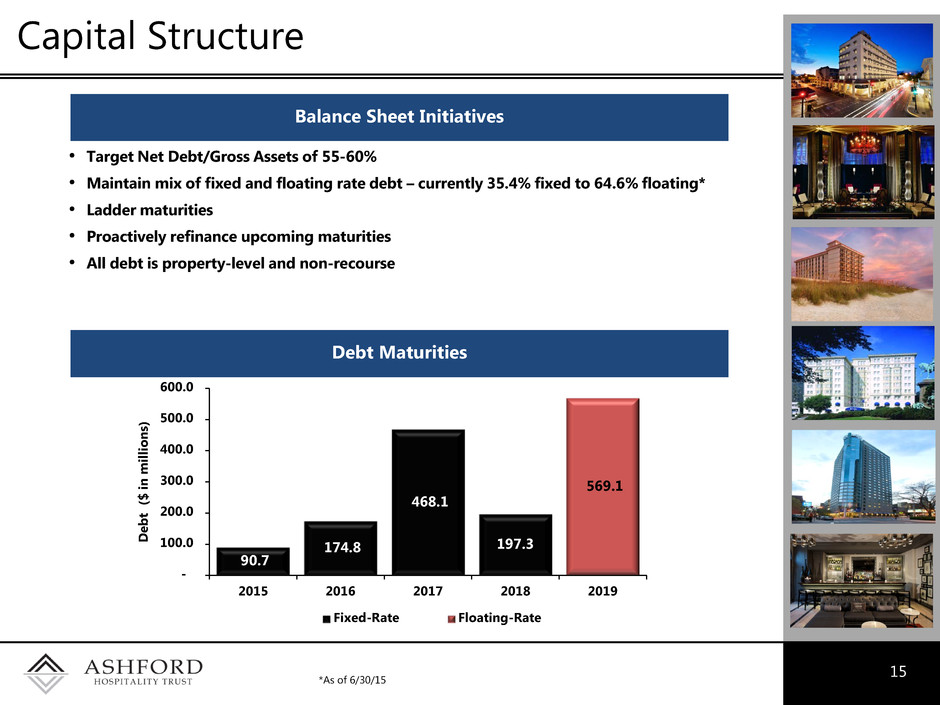
Capital Structure 15 • Target Net Debt/Gross Assets of 55-60% • Maintain mix of fixed and floating rate debt – currently 35.4% fixed to 64.6% floating* • Ladder maturities • Proactively refinance upcoming maturities • All debt is property-level and non-recourse Balance Sheet Initiatives Debt Maturities 90.7 174.8 468.1 197.3 569.1 - 100.0 200.0 300.0 400.0 500.0 600.0 2015 2016 2017 2018 2019 D eb t ( $ in m ill io n s) Fixed-Rate Floating-Rate *As of 6/30/15
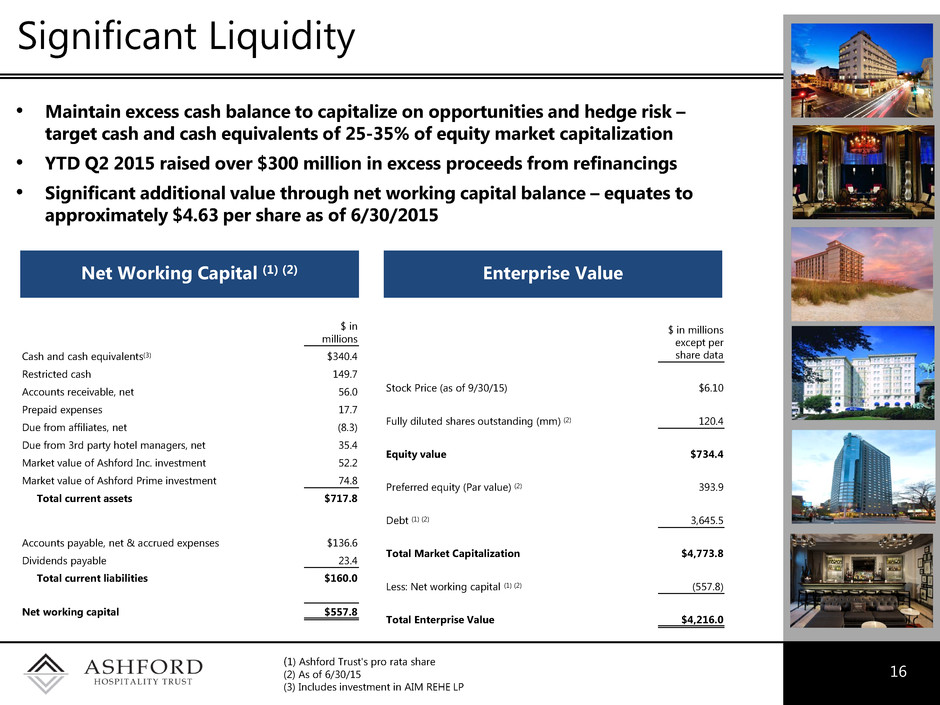
Significant Liquidity 16 • Maintain excess cash balance to capitalize on opportunities and hedge risk – target cash and cash equivalents of 25-35% of equity market capitalization • YTD Q2 2015 raised over $300 million in excess proceeds from refinancings • Significant additional value through net working capital balance – equates to approximately $4.63 per share as of 6/30/2015 Net Working Capital (1) (2) Enterprise Value (1) Ashford Trust's pro rata share (2) As of 6/30/15 (3) Includes investment in AIM REHE LP $ in millions Cash and cash equivalents(3) $340.4 Restricted cash 149.7 Accounts receivable, net 56.0 Prepaid expenses 17.7 Due from affiliates, net (8.3) Due from 3rd party hotel managers, net 35.4 Market value of Ashford Inc. investment 52.2 Market value of Ashford Prime investment 74.8 Total current assets $717.8 Accounts payable, net & accrued expenses $136.6 Dividends payable 23.4 Total current liabilities $160.0 Net working capital $557.8 $ in millions except per share data Stock Price (as of 9/30/15) $6.10 Fully diluted shares outstanding (mm) (2) 120.4 Equity value $734.4 Preferred equity (Par value) (2) 393.9 Debt (1) (2) 3,645.5 Total Market Capitalization $4,773.8 Less: Net working capital (1) (2) (557.8) Total Enterprise Value $4,216.0

Attractive Industry Fundamentals 17
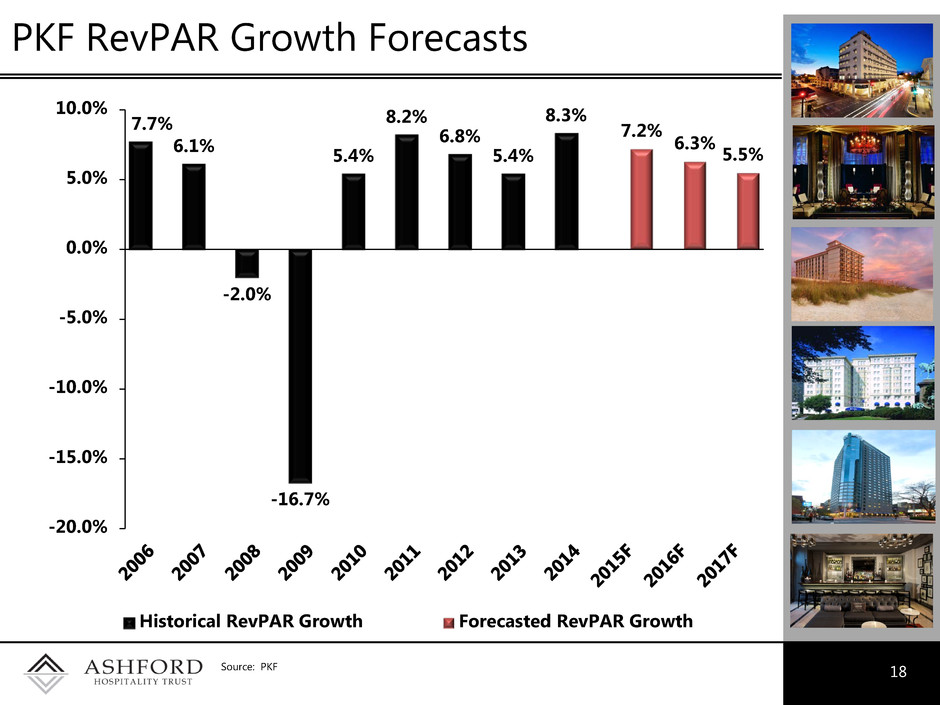
PKF RevPAR Growth Forecasts 18 Source: PKF 7.7% 6.1% -2.0% -16.7% 5.4% 8.2% 6.8% 5.4% 8.3% 7.2% 6.3% 5.5% -20.0% -15.0% -10.0% -5.0% 0.0% 5.0% 10.0% Historical RevPAR Growth Forecasted RevPAR Growth
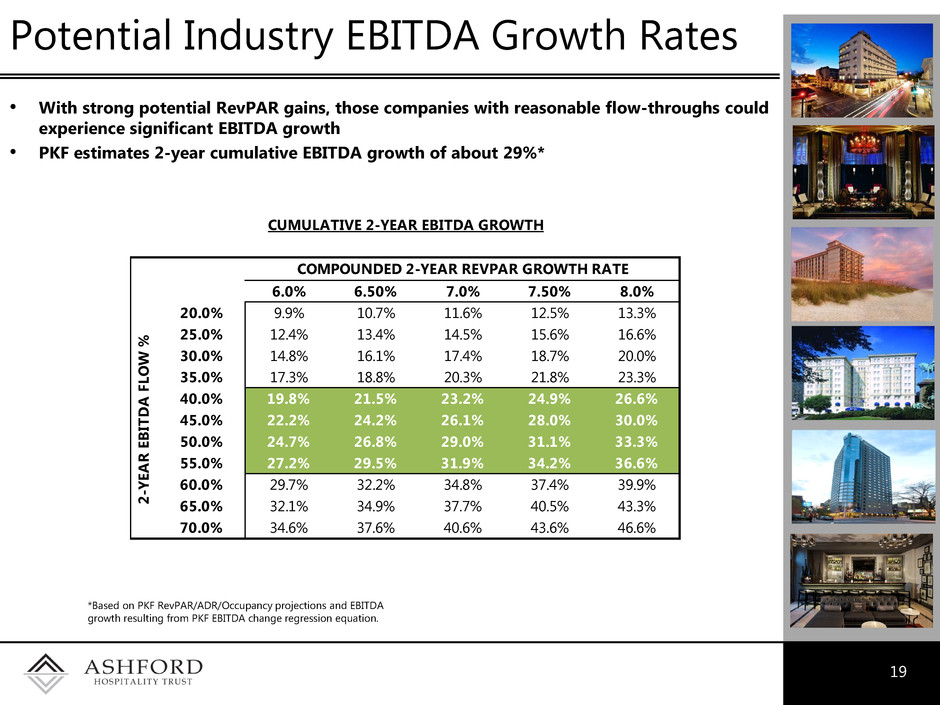
19 Potential Industry EBITDA Growth Rates *Based on PKF RevPAR/ADR/Occupancy projections and EBITDA growth resulting from PKF EBITDA change regression equation. • With strong potential RevPAR gains, those companies with reasonable flow-throughs could experience significant EBITDA growth • PKF estimates 2-year cumulative EBITDA growth of about 29%* COMPOUNDED 2-YEAR REVPAR GROWTH RATE 27.9% 6.0% 6.50% 7.0% 7.50% 8.0% 20.0% 9.9% 10.7% 11.6% 12.5% 13.3% 25.0% 12.4% 13.4% 14.5% 15.6% 16.6% 30.0% 14.8% 16.1% 17.4% 18.7% 20.0% 35.0% 17.3% 18.8% 20.3% 21.8% 23.3% 40.0% 19.8% 21.5% 23.2% 24.9% 26.6% 45.0% 22.2% 24.2% 26.1% 28.0% 30.0% 50.0% 24.7% 26.8% 29.0% 31.1% 33.3% 55.0% 27.2% 29.5% 31.9% 34.2% 36.6% 60.0% 29.7% 32.2% 34.8% 37.4% 39.9% 65.0% 32.1% 34.9% 37.7% 40.5% 43.3% 70.0% 34.6% 37.6% 40.6% 43.6% 46.6% 2- YE A R E B IT D A F LO W % CUMULATIVE 2-YEAR EBITDA GROWTH
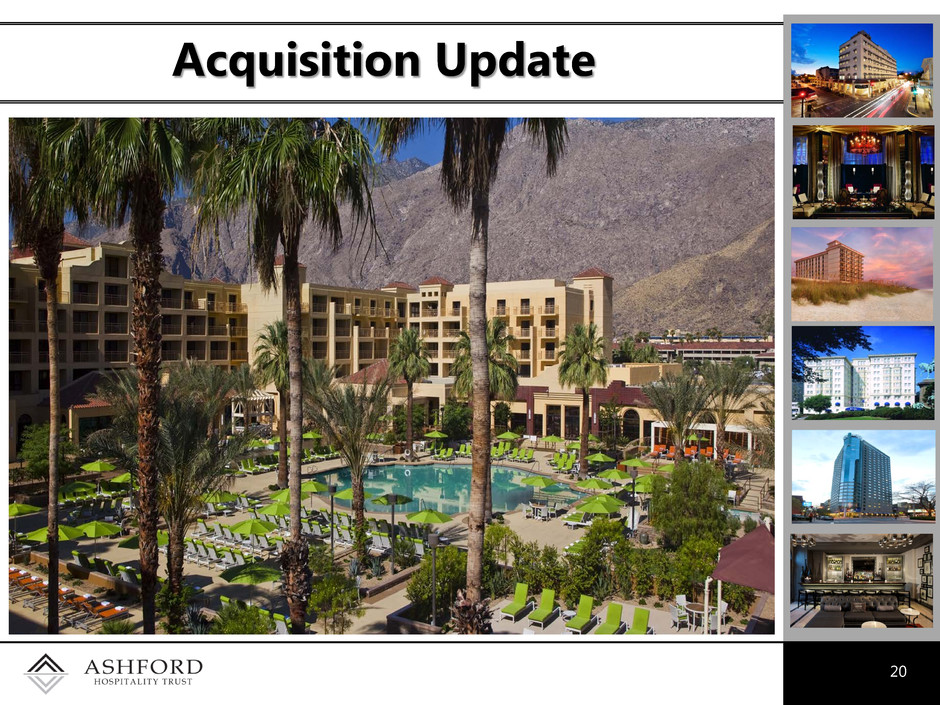
Acquisition Update 20
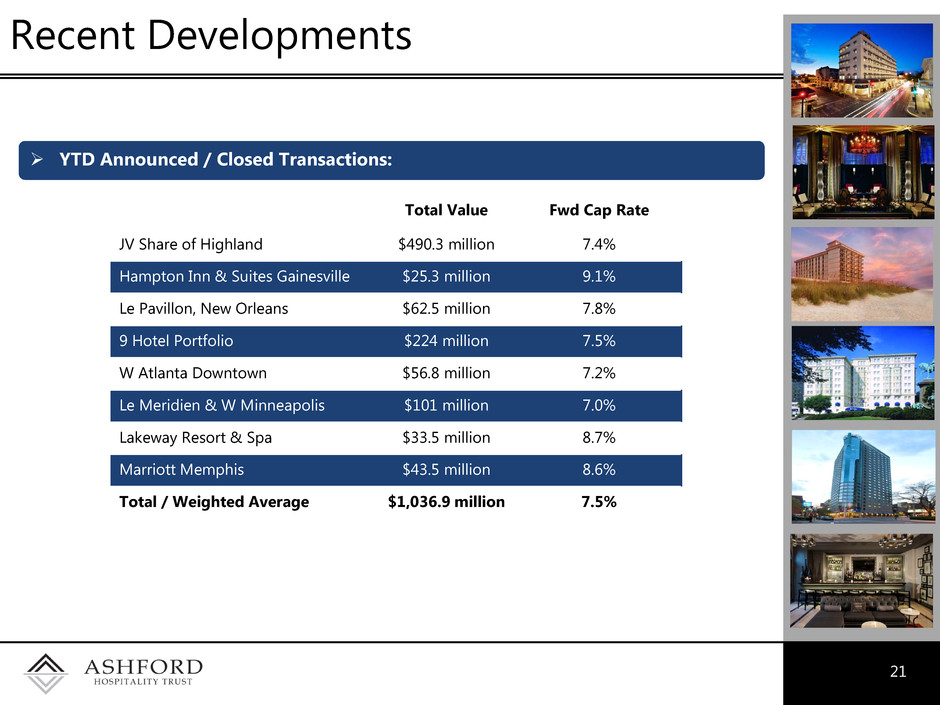
21 Recent Developments YTD Announced / Closed Transactions: Total Value Fwd Cap Rate JV Share of Highland $490.3 million 7.4% Hampton Inn & Suites Gainesville $25.3 million 9.1% Le Pavillon, New Orleans $62.5 million 7.8% 9 Hotel Portfolio $224 million 7.5% W Atlanta Downtown $56.8 million 7.2% Le Meridien & W Minneapolis $101 million 7.0% Lakeway Resort & Spa $33.5 million 8.7% Marriott Memphis $43.5 million 8.6% Total / Weighted Average $1,036.9 million 7.5%
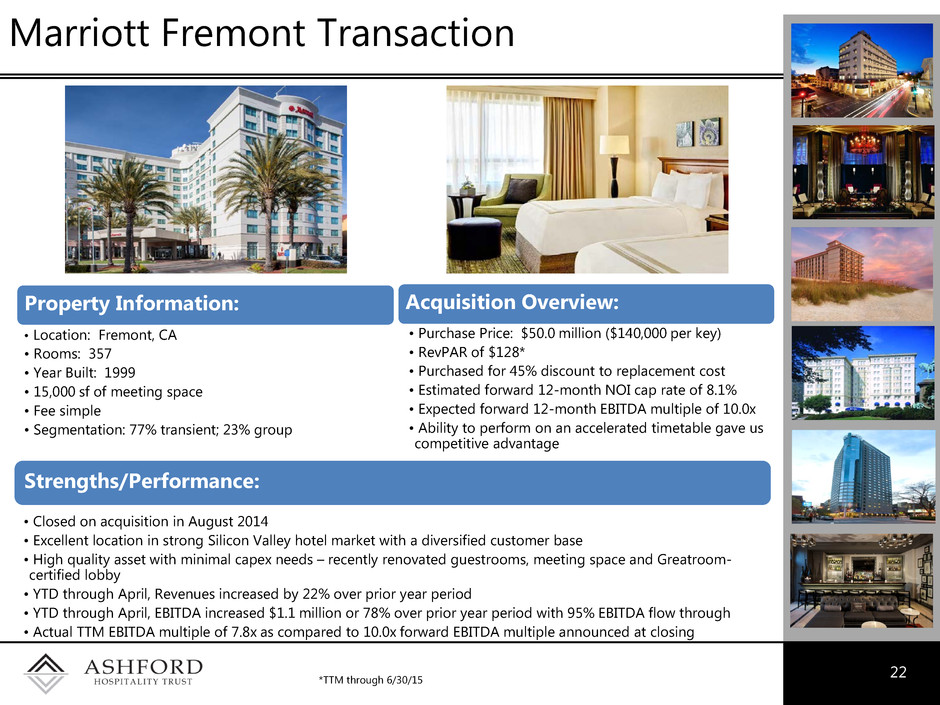
22 Marriott Fremont Transaction *TTM through 6/30/15 Strengths/Performance: • Closed on acquisition in August 2014 • Excellent location in strong Silicon Valley hotel market with a diversified customer base • High quality asset with minimal capex needs – recently renovated guestrooms, meeting space and Greatroom- certified lobby • YTD through April, Revenues increased by 22% over prior year period • YTD through April, EBITDA increased $1.1 million or 78% over prior year period with 95% EBITDA flow through • Actual TTM EBITDA multiple of 7.8x as compared to 10.0x forward EBITDA multiple announced at closing Acquisition Overview: • Purchase Price: $50.0 million ($140,000 per key) • RevPAR of $128* • Purchased for 45% discount to replacement cost • Estimated forward 12-month NOI cap rate of 8.1% • Expected forward 12-month EBITDA multiple of 10.0x • Ability to perform on an accelerated timetable gave us competitive advantage • Location: Fremont, CA • Rooms: 357 • Year Built: 1999 • 15,000 sf of meeting space • Fee simple • Segmentation: 77% transient; 23% group Property Information:
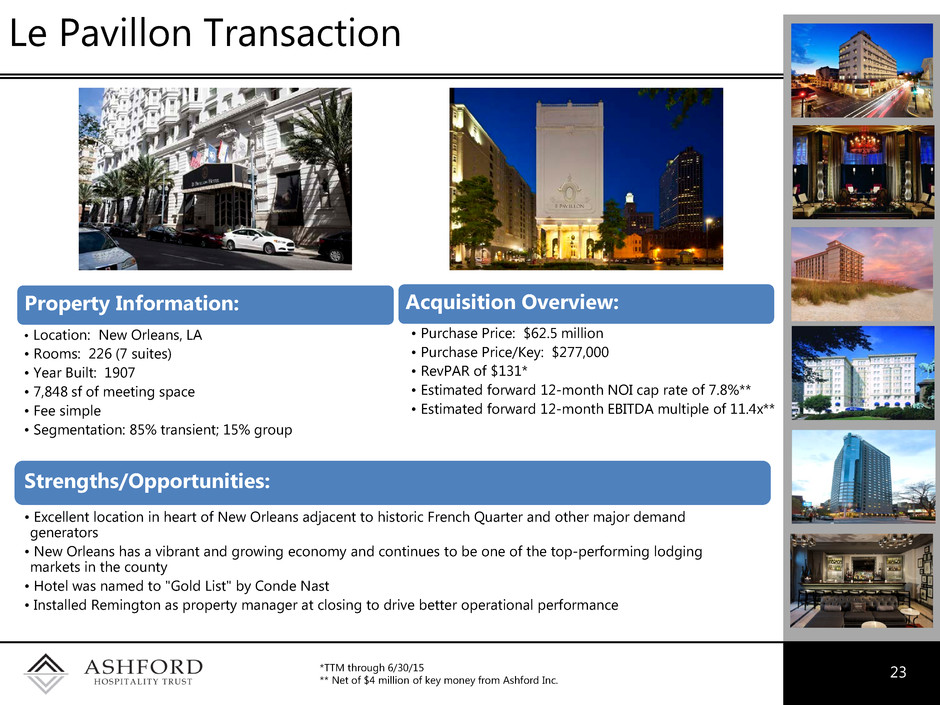
23 Le Pavillon Transaction *TTM through 6/30/15 ** Net of $4 million of key money from Ashford Inc. Strengths/Opportunities: • Excellent location in heart of New Orleans adjacent to historic French Quarter and other major demand generators • New Orleans has a vibrant and growing economy and continues to be one of the top-performing lodging markets in the county • Hotel was named to "Gold List" by Conde Nast • Installed Remington as property manager at closing to drive better operational performance Acquisition Overview: • Purchase Price: $62.5 million • Purchase Price/Key: $277,000 • RevPAR of $131* • Estimated forward 12-month NOI cap rate of 7.8%** • Estimated forward 12-month EBITDA multiple of 11.4x** • Location: New Orleans, LA • Rooms: 226 (7 suites) • Year Built: 1907 • 7,848 sf of meeting space • Fee simple • Segmentation: 85% transient; 15% group Property Information:
24 Responsive to Shareholders The board of directors continues to review additional enhancements to the Company's corporate governance policies to more firmly align the Company with the interests of its shareholders Recent announcement of planned sale of select-service hotels Strategy refinements Recent corporate governance enhancements: Amendment to bylaws providing for a majority voting standard in the election of directors in uncontested elections Amendment to bylaws to permit shareholders to amend the bylaws Amendment to bylaws to reduce threshold to call a special meeting of shareholders from 50% to 35% of outstanding common stock Implemented policy requiring director resignation in the event a director does not receive a majority of votes cast at election

Company Presentation - October 2015
