Attached files
| file | filename |
|---|---|
| 8-K - 8-K - Innoviva, Inc. | a15-20183_18k.htm |
| EX-99.3 - EX-99.3 - Innoviva, Inc. | a15-20183_1ex99d3.htm |
| EX-99.2 - EX-99.2 - Innoviva, Inc. | a15-20183_1ex99d2.htm |
Exhibit 99.1
|
|
Effect of Umeclidinium/Vilanterol (UMEC/VI) on Inspiratory Capacity/Total Lung Capacity Ratio in Hyperinflated COPD Patients |
|
Poster No. PA1493
Singh S(1), Maltais F(2), Tombs L(3), Church A(4), Iqbal A(4), Riley JH(5)
(1) Centre for Exercise and Rehabilitation Science, University Hospital of Leicester NHS Trust, Glenfield Hospital, Leicester, UK; (2)Centre de Pneumologie, Institut Universitaire de Cardiologie et de Pneumologie de Québec, Université Laval, Québec, Canada; (3)Precise Approach LTD, Contingent worker who is working on assignment at GlaxoSmithKline, Stockley Park, Uxbridge, UK; (4) Former employee of GSK, Research Triangle Park, NC, USA; (5)GSK, Stockley Park, Uxbridge, UK
Aims
· Lung hyperinflation in patients with chronic obstructive pulmonary disease (COPD) is strongly associated with poor patient outcomes including increased breathlessness, reduced exercise tolerance, reduced quality of life and increased mortality.(1),(2)
· There are several measures of hyperinflation that are important in predicting COPD outcomes:
· The ratio of inspiratory capacity (IC) to total lung capacity (TLC) has been shown to be an independent predictor of mortality in patients with COPD; studies show a 1% decrease in IC/TLC increased the mortality risk by 5%.(1)
· The ratio of residual volume (RV) to TLC has been shown to be a predictor of improvement in forced vital capacity (FVC) following lung volume reduction surgery. A minimal clinically important difference has been determined in patients with severe COPD who are undergoing bronchoscopic lung volume reduction surgery (-2.8 to -4.0% change from baseline).(3)
· IC is also presented as it can be more readily assessed by spirometry rather than plethysmography.
· The long-acting muscarinic receptor antagonist umeclidinium (UMEC; 62.5 mcg/day) and the combination of UMEC with the long-acting β2 agonist (LABA), vilanterol (UMEC/VI; 62.5/25 mcg/day) are approved once-daily maintenance treatments for COPD in the EU, US, Canada, and several other countries.(4)-(8)
· The aim of this post hoc analysis of two studies was to investigate whether UMEC/VI, UMEC or VI treatment could improve IC/TLC, RV/TLC and IC versus placebo in hyperinflated patients with COPD.
Methods
Study design
· Pooled data from two cross-over studies (DB2114417, NCT01328444; DB2114418, NCT01323660) in patients with COPD classified as hyperinflated (resting functional residual capacity [FRC]>120% predicted) were analysed.(9)
· Eligible patients were randomised to one of 26 treatment sequences consisting of two of the following treatments: UMEC/VI 125/25 mcg (delivered dose 113/22 mcg), UMEC/VI 62.5/25 mcg (delivered dose 55/22 mcg), UMEC 125 mcg (delivered dose 113 mcg), UMEC 62.5 mcg (delivered dose 55 mcg), VI 25 mcg (delivered dose 22 mcg) or placebo once-daily via an ELLIPTA® dry power inhaler. Each treatment period was 12 weeks with three clinic visits per treatment period.(9) Further details of the study design have been previously published.(9)
Patients
· Current and former smokers >40 years of age with a smoking history of >10 pack-years and a clinical diagnosis of moderate-severe stable COPD (post-bronchodilator forced expiratory volume in 1 second [FEV1]/FVC <70% and FEV1 >35% and <70% predicted). The presence of co-morbid respiratory conditions or a diagnosis of asthma was exclusionary.(9) Stable doses of inhaled corticosteroids (ICS) were permitted throughout the study.
Endpoints
· Analyses of IC/TLC, RV/TLC and IC were pre-specified for each study. This post hoc analysis combined data from both studies (GSK study no. for post hoc analysis: 203170).
· Plethysmography assessments were conducted at screening and each clinic visit according to American Thoracic Society/European Respiratory Society guidelines.(10) All data were included in the analyses. However, only data from UMEC/VI 62.5/25 mcg, UMEC 62.5 mcg, VI 25 mcg and placebo treatments are reported here; data from the UMEC 125 mcg and UMEC/VI 125/25 mcg treatments have not been included in this poster as they are not approved treatments.
· Safety endpoints included collection of adverse events (AEs), and serious AEs (SAEs).
Results
Demographics and baseline characteristics
· Demographics were characteristic of patients with COPD with hyperinflation and were similar between the studies and treatments (data not shown).(9) Baseline hyperinflation measures are shown in Table 1.
Table 1. Baseline Hyperinflation Measures (ITT population)
|
|
|
UMEC/VI |
|
UMEC |
|
VI |
|
Placebo |
|
|
IC (L), mean (SD) |
|
2.24 (0.73) |
|
2.21 (0.54) |
|
2.26 (0.68) |
|
2.21 (0.64) |
|
|
Min, max |
|
0.78-4.44 |
|
0.82-3.82 |
|
0.97-4.07 |
|
0.67-4.55 |
|
|
IC/TLC %, mean (SD) |
|
32 (8) |
|
32 (6) |
|
33 (7) |
|
32 (7) |
|
|
Min, max |
|
10-52 |
|
18-47 |
|
16-48 |
|
13-53 |
|
|
RV/TLC, mean (SD) |
|
0.57 (0.10) |
|
0.56 (0.09) |
|
0.57 (0.09) |
|
0.57 (0.09) |
|
|
Min, max |
|
0.27-0.88 |
|
0.31-0.78 |
|
0.35-0.77 |
|
0.32-0.84 |
|
Measures of hyperinflation - IC/TLC ratio
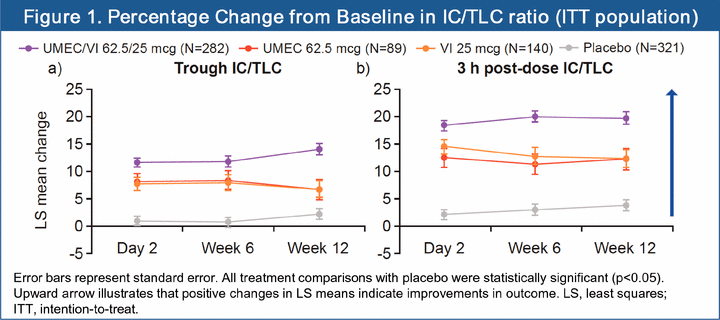
· At 12 weeks, statistically significant improvements in the change from baseline trough IC/TLC ratio as a percentage versus placebo were shown for UMEC/VI (3.2%; 95% confidence interval [CI]: 2.5, 3.9; p<0.001), UMEC (1.3%; 95% CI: 0.4, 2.2; p<0.05) and VI (1.4%; 95% CI: 0.3, 2.4; p<0.05).
· At 12 weeks, statistically significant improvements in percentage change from baseline trough IC/TLC ratios versus placebo were shown for UMEC/VI (11.7%; 95% CI: 9.0, 14.5; p<0.001), UMEC (4.4%; 95% CI: 0.4, 8.3; p=0.032) and VI (4.5%; 95% CI: 1.0, 7.9; p=0.011; Figure 1a). UMEC/VI showed a statistically significant improvement in trough IC/TLC ratio compared with UMEC or VI (both p<0.001).
· When 3 h post-dose IC/TLC ratio was assessed, statistically significant improvements in percentage change from baseline IC/TLC ratio versus placebo were shown at 12 weeks for UMEC/VI (15.7%; 95% CI: 12.8, 18.6), UMEC (8.4%; 95% CI: 4.2, 12.5) and VI (8.5%; 95% CI: 4.8, 12.1; all p<0.001; Figure 1b). UMEC/VI showed a statistically significant improvement in 3 h post-dose IC/TLC ratio compared with UMEC or VI (both p<0.001).

Measures of hyperinflation – RV/TLC ratio
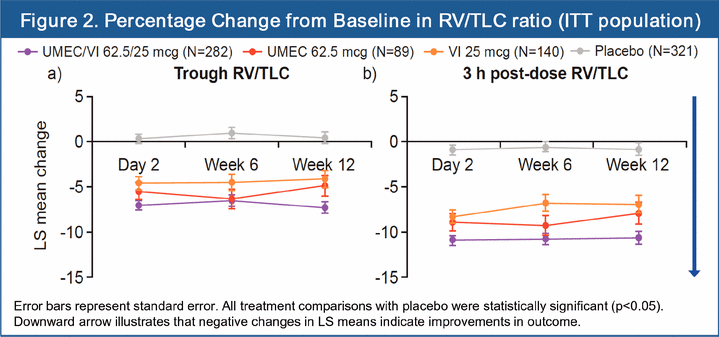
· At 12 weeks, percentage change from baseline of trough RV/TLC ratios versus placebo was significant for UMEC/VI (-7.7%; 95% CI: -9.4, -6.0), UMEC (-5.3%; 95% CI: -7.8, -2.8) and VI (-4.5%; 95% CI: -6.7, -2.4) (all p<0.001; Figure 2a). UMEC/VI showed a statistically significant improvement in trough RV/TLC ratio compared with VI (p=0.005) but not UMEC (p=0.064).
· Significant improvements in percentage change from baseline of 3 h post-dose RV/TLC ratios versus placebo were shown at 12 weeks for UMEC/VI (-9.8%; 95% CI: -11.6, -8.0), UMEC (-7.1%; 95% CI: -9.7, -4.5) and VI (-6.1%; 95% CI: -8.3, -3.8; all p<0.001; Figure 2b). UMEC/VI showed a statistically significant improvement in 3 h post-dose RV/TLC ratio compared with UMEC (p=0.042) and VI (p=0.001).

Measures of hyperinflation – IC
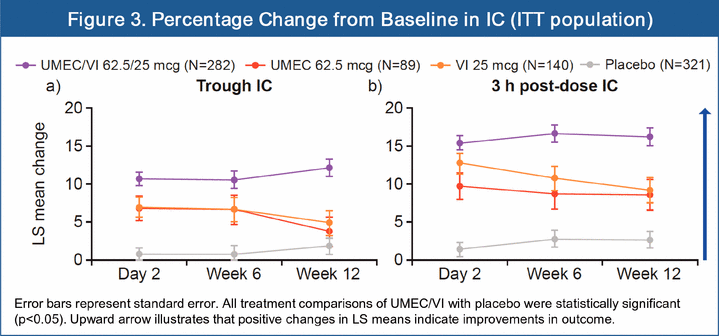
· At 12 weeks, statistically significant improvements in percentage change from baseline of trough IC versus placebo were shown for UMEC/VI (10.3%; 95% CI: 7.3, 13.2; p<0.001). The percentage change from baseline versus placebo for UMEC was 1.8% (95% CI:-2.5, 6.1; p=0.399) and VI was 3.0% (95% CI: -0.7, 6.7; p=0.113; Figure 3a). UMEC/VI showed a statistically significant improvement in trough IC compared with UMEC or VI (both p<0.001).
· Statistically significant improvements in percentage change from baseline of 3 h post-dose IC versus placebo were seen at 12 weeks for UMEC/VI (13.5%; 95% CI: 10.5, 16.5: p<0.001) UMEC (5.9%; 95% CI: 1.6, 10.3; p=0.008) and VI (6.5%; 95% CI: 2.7, 10.2; p<0.001; Figure 3b). UMEC/VI showed a statistically significant improvement in 3 h post-dose IC compared with UMEC or VI (both p<0.001).

Safety
· The incidence of AEs was similar between all treatments within each study (including placebo).(9) The most common AEs in both studies were headache and nasopharyngitis.
Conclusions
· Improvements in measures of hyperinflation were observed (both trough and 3 h post-dose) at Day 2 with UMEC/VI and maintained over 12 weeks. At 12 weeks, dual therapy provided statistically significant improvements over placebo in IC/TLC, RV/TLC and IC.
· Dual therapy with UMEC/VI provided statistically significant greater improvements in hyperinflation measures at 12 weeks than either monocomponent alone with the exception of trough RV/TLC versus UMEC.
· Treatment with UMEC/VI provided percentage changes in RV/TLC ratio that are similar to those shown to be clinically important post lung volume reduction surgery.(3)
· Longer term clinical studies are required to determine if the positive effect of UMEC/VI on IC/TLC ratio is associated with reductions in future mortality risk in COPD.
References
1. Casanova C, et al. Am J Respir Crit Care Med 2005;171:591–7; 2. O’Donnell DE, et al. Eur Respir J 2004;23:832–40; 3. Hartman JE, et al. Eur Respir J 2012;40:1137–41; 4. GSK ANORO™ ELLIPTA® prescribing information, https://www.gsksource.com/gskprm/htdocs/documents/ANORO-ELLIPTA-PI-MG.PDF [accessed June 2015]. 5. GSK ANORO™ ELLIPTA® summary of product characteristics. http://www.medicines.org.uk/emc/medicine/28949#INDICATIONS [accessed June 2015]; 6. GSK INCRUSE™ ELLIPTA® prescribing information, http://www.gsksource.com/gskprm/htdocs/documents/INCRUSE-ELLIPTA-PI-PIL.PDF [accessed June 2015]; 7. GSK INCRUSE™ ELLIPTA® summary of product characteristics http://www.medicines.org.uk/emc/medicine/29394 [accessed June 2015]; 8. Blair HA, Deeks ED. Drugs 2015;75:61–74; 9. Maltais F, et al. Ther Adv Respir Dis 2014;8:169–81; 10. Wanger J, et al. Eur Respir J 2005;26:511–522.
Acknowledgements
The authors declare the following real or perceived conflicts of interest during the last 3 years in relation to this presentation: SS has served on advisory boards for GSK, Novartis and Pfizer; FM has received fees for speaking at conferences sponsored by Boehringer Ingelheim (BI), Pfizer, GSK and Grifols, and has served on advisory boards for GSK and BI. He has also received research grants from GSK, BI, Altana Pharma, Merck, AstraZeneca, Nycomed and Novartis, and has received an unrestricted research grant from BI and GSK.; LT is contracted to work for GSK; §AI was an employee of GSK at the time the analyses were completed and the abstract submitted and holds GSK stock/shares; AC and JHR are employees of GSK and hold stock options in the company.
This study was funded by GSK (DB2114417, clinicaltrials.gov ID NCT01328444; DB2114418, clinicaltrials.gov ID NCT01328444; GSK study no. for combined post hoc analysis: 203170).
Editorial support in the form of poster layout, incorporation of author comments, grammatical editing and referencing was provided by Susan Parker, PhD of Fishawack Indicia Ltd, UK and was funded by GSK.
|
|
ELLIPTA® is a registered trademark of the GSK group of companies
Presented at the European Respiratory Society International Congress, Amsterdam, |
|


