Attached files
| file | filename |
|---|---|
| EX-10.11 - OFFER LETTER TO THORSTEN FREITAG - INFOBLOX INC | exhibit1011-thorstenfreita.htm |
| EX-31.2 - CERTIFICATION OF REGISTRANT'S CFO, AS REQUIRED BY SECTION 302 - INFOBLOX INC | exhibit312-cfocertificatio.htm |
| EX-31.1 - CERTIFICATION OF REGISTRANT'S CEO, AS REQUIRED BY SECTION 302 - INFOBLOX INC | exhibit311-ceocertificatio.htm |
| EX-10.04 - FORM OF MSU AGREEMENT - INFOBLOX INC | exhibit1004-marketstockuni.htm |
| EX-32.2 - CERTIFICATION OF REGISTRANT'S CFO, AS REQUIRED BY SECTION 906 - INFOBLOX INC | exhibit322-cfocertificatio.htm |
| EX-23.1 - CONSENT OF INDEPENDENT REGISTERED PUBLIC ACCOUNTING FIRM - INFOBLOX INC | exhibit231consentofindepen.htm |
| EX-32.1 - CERTIFICATION OF REGISTRANT'S CEO, AS REQUIRED BY SECTION 906 - INFOBLOX INC | exhibit321-ceocertificatio.htm |
UNITED STATES
SECURITIES AND EXCHANGE COMMISSION
Washington, D.C. 20549
Form 10-K
(Mark One)
x | ANNUAL REPORT PURSUANT TO SECTION 13 OR 15(d) OF THE SECURITIES EXCHANGE ACT OF 1934 |
For the fiscal year ended July 31, 2015
Or
¨ | TRANSITION REPORT PURSUANT TO SECTION 13 OR 15(d) OF THE SECURITIES EXCHANGE ACT OF 1934 |
For the transition period from to .
Commission file number: 001-35507
INFOBLOX INC.
(Exact name of registrant as specified in its charter)
Delaware | 20-0062867 | |
(State or other jurisdiction of incorporation or organization) | (I.R.S. Employer Identification No.) | |
3111 Coronado Drive
Santa Clara, California 95054
(Address of principal executive offices and zip code)
(408) 986-4000
Registrant’s telephone number, including area code
Securities registered pursuant to Section 12(b) of the Act:
Title of Each Class | Name of Each Exchange on Which Registered | |
Common Stock, $0.0001 par value per share | New York Stock Exchange | |
Securities registered pursuant to Section 12(g) of the Act:
None
Indicate by check mark if the registrant is a well-known seasoned issuer, as defined in Rule 405 of the Securities Act. x Yes ¨ No
Indicate by check mark if the registrant is not required to file reports pursuant to Section 13 or Section 15(d) of the Act. ¨ Yes x No
Indicate by check mark whether the registrant (1) has filed all reports required to be filed by Section 13 or 15(d) of the Securities Exchange Act of 1934 during the preceding 12 months (or for such shorter period that the registrant was required to file such reports), and (2) has been subject to such filing requirements for the past 90 days. x Yes ¨ No
Indicate by check mark whether the registrant has submitted electronically and posted on its corporate Website, if any, every Interactive Data File required to be submitted and posted pursuant to Rule 405 of Regulation S-T during the preceding 12 months ( or for such shorter period that the registrant was required to submit and post such files). x Yes ¨ No
Indicate by check mark if disclosure of delinquent filers pursuant to Item 405 of Regulation S-K is not contained herein, and will not be contained, to the best of registrant’s knowledge, in definitive proxy or information statements incorporated by reference in Part III of this Form 10-K or any amendment to this Form 10-K. x
Indicate by check mark whether the registrant is a large accelerated filer, an accelerated filer, a non-accelerated filer, or a smaller reporting company. See the definitions of “larger accelerated filer,” “accelerated filer,” and “smaller reporting company” in Rule 12b-2 of the Exchange Act. (Check one):
Large accelerated filer x Accelerated filer ¨
Non-accelerated filer ¨ (Do not check if a smaller reporting company) Smaller reporting company ¨
Indicate by check mark whether the registrant is a shell company (as defined in Rule 12b-2 of the Act). ¨ Yes x No
The aggregate market value of the registrant's common stock held by non-affiliates of the registrant as of January 31, 2015 (the last business day of the registrant's most recently completed second fiscal quarter) was approximately $678 million, based upon the closing sale price of such stock on the New York Stock Exchange reported on January 31, 2015. For purposes of this disclosure, shares of common stock held or controlled by executive officers and directors of the registrant and by persons who hold more than 5% of the outstanding shares of common stock have been treated as shares held by affiliates. However, such treatment should not be construed as an admission that any such person is an “affiliate” of the registrant. The registrant has no non-voting common equity.
As of August 31, 2015, 58,915,648 shares of the registrant’s common stock were outstanding.
DOCUMENTS INCORPORATED BY REFERENCE
Portions of the Definitive Proxy Statement for the registrant's 2015 Annual Meeting of Stockholders to be filed subsequent to the date hereof are incorporated by reference in Items 10 - 14 of Part III of this Form 10-K. The Definitive Proxy Statement will be filed with the Securities and Exchange Commission, or SEC, within 120 days after the end of the registrant's fiscal year ended July 31, 2015. Except with respect to information specifically incorporated by reference in this Form 10-K, the Definitive Proxy Statement is not deemed to be filed as part of this Form 10-K.
TABLE OF CONTENTS
Page | |||
PART I | |||
Item 1 | |||
Item 1A | |||
Item 1B | |||
Item 2 | |||
Item 3 | |||
Item 4 | |||
PART II | |||
Item 5 | |||
Item 6 | |||
Item 7 | |||
Item 7A | |||
Item 8 | |||
Item 9 | |||
Item 9A | |||
Item 9B | |||
PART III | |||
Item 10 | |||
Item 11 | |||
Item 12 | |||
Item 13 | |||
Item 14 | |||
PART IV | |||
Item 15 | |||
1
FORWARD-LOOKING STATEMENTS
This Annual Report on Form 10-K (“Report”), including the “Management's Discussion and Analysis of Financial Condition and Results of Operations,” contains forward-looking statements regarding future events and our future results that are based on our current expectations, estimates, forecasts, and projections about our business, our results of operations, the industry in which we operate and the beliefs and assumptions of our management. Words such as “expects,” “anticipates,” “targets,” “goals,” “projects,” “would,” “could,” “intends,” “plans,” “believes,” “seeks” and “estimates,” variations of these words, and similar expressions are intended to identify those forward-looking statements. These forward-looking statements are only predictions and are subject to risks, uncertainties and assumptions that are difficult to predict. Therefore, actual results may differ materially and adversely from those expressed in any forward-looking statements. Factors that might cause or contribute to such differences include, but are not limited to, those discussed in this Report under the section entitled “Risk Factors” in Item 1A of Part I and elsewhere herein, and in other reports we file with the SEC. While forward-looking statements are based on reasonable expectations of our management at the time that they are made, you should not rely on them. We undertake no obligation to revise or update publicly any forward-looking statements for any reason, whether as a result of new information, future events or otherwise, except as may be required by law.
2
PART I
ITEM 1. | BUSINESS |
General
Infoblox Inc. (together with its subsidiaries, “we” or “our”) is a leader in network control, network automation and domain name system, or DNS, security through appliance-based solutions that enable and secure dynamic networks and next-generation data centers. Our solutions combine real-time IP address management, automation of key network control, change and configuration management processes and DNS based infrastructure security in purpose-built physical and virtual appliances. It is based on our proprietary software that is highly scalable and automates vital network functions, such as IP address management, device configuration, compliance, network discovery, policy implementation, security and monitoring. In addition, our solutions use our real-time distributed network database to provide “always-on” access to network control data through a scalable, redundant and reliable architecture.
We were originally incorporated in Illinois in February 1999 and reincorporated in Delaware in May 2003.
Our corporate headquarters are located at 3111 Coronado Drive, Santa Clara, California 95054, and our main telephone number is (408) 986-4000. We maintain a website at www.infoblox.com. The contents of our website are not incorporated into, or otherwise to be regarded as part of, this Report.
Our Products
We offer integrated solutions that enable information technology, or IT, organizations to automate tasks and control critical functions in their networks. These functions include delivering critical network protocol services such as DNS, dynamic host configuration protocol, or DHCP, IP Address Management, or IPAM; Network Change and Configuration Management, and network infrastructure security. Infoblox solutions run on a range of purpose-built physical and virtual servers, or appliances, that provide varying levels of performance suitable for different customer needs. Our appliances can be deployed on a stand-alone basis or in combination and by utilizing our patented Grid architecture - these appliances can all be managed as one system, with a single data repository and unified management console. Our virtual appliances can either run on proprietary third party hardware platforms (certain models of Cisco Systems, Inc. and Riverbed Technology, Inc.) or operate on virtual machine platforms including VMware ESXi, Microsoft Hyper-V, Redhat KVM and Citrix XenServer. Infoblox virtual appliances are designed to approximate their physical counterparts in functionality, scalability and performance.
We offer four product families: (1) Core Network Services, (2) Infrastructure Security, (3) Cloud Network Automation, and (4) Network Change and Configuration Management.
3
Core Network Services
The Core Network Services product family enables automated layer-2 layer-3 network discovery and real time protocol delivery including: DNS, DHCP, and IPAM, which we refer to as "DDI." These services are critical to modern networks and our solutions make these services centrally manageable, with high-performance and high resiliency making them suitable for enterprise customer needs.
The components of our Core Network Services product family, which can be purchased separately from each other, are Trinzic DDI, Network Insight, IPAM for Microsoft, Trinzic Reporting, and DNS Traffic Control.
Trinzic DDI. Our Trinzic DDI product is an appliance that is designed to ensure the continuous secure operation of critical network services. Trinzic DDI uses our proprietary software, which automates the routine, repetitive and time-consuming manual tasks associated with deploying and managing DNS, DHCP and IP address management and thus facilitates continuous and dynamic network availability for mission-critical business processes. A Trinzic DDI appliance can be used in a standalone configuration or combined with other appliances using our Grid technology to view and manage through a web-based management interface to support complex networks that can scale to thousands of Trinzic appliances and millions of IP addresses.
Network Insight. Network Insight delivers visibility and control to network administrators. Network Insight automatically and continuously discovers all networks and devices on those networks and stores that information in a central repository. In addition to automated discovery, Network Insight delivers switch port inventory and control, enabling network administrators to provision and control switch port resources and monitor all IP resources under management. This tool saves time and reduces errors associated with manual entry of data.
IPAM for Microsoft. IPAM for Microsoft provides a single, web-based management interface for the centralized management of Microsoft DNS, DHCP and multiple IP address pools without any installation of software on Microsoft servers. When implemented together with our Trinzic DDI product, IPAM for Microsoft permits network-wide management of Infoblox DDI appliances and Microsoft servers from a single point of control.
Trinzic Reporting. Trinzic Reporting integrates into the Infoblox Grid and works directly with other Infoblox appliances, providing visibility through reporting, trending analysis, and tracking of near real-time network data. Users can report on system utilization, isolate performance problems, implement DHCP and DNS capacity planning and identify and report on malware and security threat activity. Trinzic Reporting automates time-consuming manual tasks associated with collecting, tabulating and correlating data through our single point of control. All of the data collection and processing is performed on a separate reporting appliance, eliminating load and performance impact on the protocol serving DDI appliances.
DNS Traffic Control. This offering combines global server load balancing, or GSLB, functionality with the Infoblox DNS server functionality, enabling networking teams to obtain DNS and GSLB functionality in one integrated solution. Acting as the authoritative DNS appliance, Infoblox DNS Traffic Control uses the DNS query/response mechanism to automatically return the IP address of the server that is best suited to fulfill the user’s request. Traffic is intelligently directed based on server "health," availability and geo-location. Network administrators can also pre-define customized load balancing rules based on factors such as ratio, round robin and network topology.
4
Infrastructure Security
The Infrastructure Security product family includes External DNS Security, Internal DNS Security and DNS Firewall which enable customers to protect their DNS infrastructure from cyber-attacks and detect and block DNS queries to botnet and malware domains respectively.
External DNS Security. External DNS Security is an appliance that is designed to protect the customer network from cyber attacks by using threat intelligence to distinguish malicious DNS traffic (attack traffic) from legitimate DNS traffic and to block the malicious queries while responding to legitimate queries. This helps to prevent the appliance from being overwhelmed by attack traffic and enables the organization to continue to deliver network services while under attack. Reporting provides real-time information about the attack giving security teams information they can use to remediate the attack. A real-time threat intelligence feed keeps the appliance updated on the latest DNS attack patterns so the protection evolves as the threat patterns change.
Internal DNS Security. Internal DNS Security is intended to serve inside an organization’s IT network to provide security functionality to internal DNS servers. This product can analyze outbound queries from inside the network and determine if they are attempting to contact known malicious domain destinations. Upon detection of such queries, Internal DNS Security blocks the query from resolving, thereby disrupting malware communications. In addition to malware protection, Internal DNS Security is able to intelligently detect and defend against DNS infrastructure attacks that are initiated from inside the network, such as internal DNS DDoS (Distributed Denial of Service) attacks.
DNS Firewall. The DNS Firewall helps organizations detect and protect themselves from malware and Advanced Persistent Threat, or APT, security threats that might reside inside the customer network. This product uses a live reputational feed of latest known malware domains enabling the DNS server to create a “black list” of malicious domains and block queries to those domains. This prevents malware and APT “call backs” to botnet controllers and helps IT security teams to identify the infected end-points that made the query request. DNS Firewall is fully integrated with the Infoblox DDI product and can be managed from the same interface.
Cloud Network Automation
The Cloud Network Automation product family enables integration with popular cloud orchestration technologies, such as VMware vRealize Automation, Microsoft System Center Orchestrator, OpenStack and BMC Atrium Orchestrator. This solution, alongside our new Infoblox Cloud Platform Appliances enable our customers to automate key network provisioning and control functions in private, hybrid and public cloud deployments, which otherwise would require significant human resources and time.
When Infoblox Cloud Network Automation is in place, the solution automatically detects the new virtual machines when they are created and then in real-time assigns IP addresses to them and automatically creates appropriate DNS entries. As the virtual machines are de-provisioned, the Infoblox solutions automatically de-provision the IP addresses and update the DNS records. This automation saves time and reduces errors associated with manual entry of data. Several vendors have created their own integrations with the Infoblox solution including CA Technologies, Inc., Hewlett-Packard Company, Cisco Systems, Inc., BMC Software, Inc., and Elastic Box, Inc.
Infoblox DDI for Amazon Web Services, or AWS. This offering extends our DNS and DHCP functionality to the Amazon Web Services cloud networking environment, enabling users to have one unified solution to run DDI in a consistent manner. Customers can build part or all of their Infoblox Grids on the Amazon cloud, and networking teams can get visibility to AWS virtual machines as they are provisioned and removed. This automation significantly reduces the time needed to set up cloud infrastructures in Amazon and provides greater visibility to the networking administrators.
5
Network Change and Configuration Management
The Network Change and Configuration Management product family includes NetMRI and Automation Change Manager and Security Device Controller which automate the process handling complex network configuration management. Our solutions discover network devices, capture all configuration information in a centralized repository and enable automated change management including change tracking, change deployment and roll-backs, and compliance validation.
The components of this family, which can be purchased independently, are NetMRI and Automation Change Manager.
NetMRI. Our NetMRI product automates network change and configuration management processes. NetMRI enables IT organizations to automate time-sensitive network changes, gain visibility into the impact of changes occurring on the network, manage network configurations and meet a variety of compliance requirements for both physical and virtual machines.
Automation Change Manager. Automation Change Manager automates network configuration functions so that end customers can make network changes without manual intervention and in real-time. Automation Change Manager may be sold with our Trinzic DDI product at the time of initial deployment or thereafter.
All of the above solutions are designed with manageability and ease of use in mind - to reduce human labor and streamline operations, helping deliver reliable, dynamic, and secure networks that are cost-effective to manage and easy to use.
Our Customer Support and Services
Maintenance and Support
Our support organization provides tiered support to our channel partners and end customers 24 hours a day, by email, telephone and the Internet. We provide support through our technical support engineers and through our network of authorized and certified channel partners. We maintain technical support assistance centers in the United States, Belgium, India, Japan and Malaysia. These technical assistance centers provide help desk assistance on product configuration, usage, software maintenance, and problem isolation and resolution. We also provide hardware replacement support via logistics centers in 22 locations globally. End customers and channel partners have access to our knowledge management, online case management and self-help portal to track and manage their support requests efficiently. End customers that purchase our products must also purchase maintenance and support contracts, which they may, and typically do, elect to renew in subsequent years. In addition, we provide certain services in connection with our security products that are delivered on a subscription basis.
Consulting
Our consulting services assist end customers in planning, designing, implementing, operating and optimizing our solution for their networks. Our consulting engineers work closely with end customers during the planning cycle to bring strategic insight to the development of a solution that is tailored to the end customer's specific requirements. Our consulting engineers assist end customers in making rapid migrations to our solution, identifying and adopting best practices for real-time network infrastructure architecture and instituting processes that can result in faster deployment of applications, servers, network devices and network endpoints. These services include network control architecture consulting, migration planning, implementation, best practice audits, IPv6 and DNS security readiness and compliance policy development.
6
Training
We provide training services to educate our end customers and channel partners on the implementation, use, functionality and ongoing maintenance of our products. We offer these services through our training organization and also through a global network of authorized and certified training companies. We also have training programs that provide multiple certification tracks for network administrators, engineers, trainers and channel partner personnel.
Technology
Our proprietary technology and approach to system architecture are key differentiators of our solutions. These include the Infoblox Grid technology, Secure DNS, and Cloud Network Automation. The Grid technology delivers single point of management and a single consolidation for critical network data including layer-2 layer-3 network device information, IPAM data and protocol data (DNS, DHCP). This data resides in our real-time distributed network database.
Our solutions provide dynamic templates and a library of network device configurations and rules that enable organizations to automate network control and reduce data entry tasks for network control. In addition, our solution allows end customers to collect, record and maintain information about their networks and use that information to automate the configuration of their network infrastructure.
Technology Partners
We work with a variety of technology alliance partners to engineer and integrate our solutions. This enables us to better support our customers’ multi-vendor environments and deliver useful functionality. Our current technology partners include, but are not limited to, Cisco Systems, Inc., FireEye, Inc., Microsoft Corporation, Riverbed Technology, Inc., and VMware, Inc. From time to time, we also engage these partners in joint go-to-market activities.
Customers
We sell our network control solution primarily through channel partners to end customers of various sizes-from small businesses to large enterprises-and across a broad range of industries, including financial services, government, healthcare, manufacturing, retail, technology and telecommunications. As of July 31, 2015, we had shipped appliances for deployment to approximately 8,300 end customers worldwide. For the years ended July 31, 2015, 2014 and 2013, Exclusive Networks, a distributor, accounted for 10.8%, 10.5% and 11.5% of our total net revenue. No other distributor or end customer accounted for more than 10% of our net revenue in fiscal years 2015, 2014 and 2013.
Sales and Marketing
We sell our products and services primarily through our channel partners, including distributors, integrators, managed service providers and value-added resellers, or VARs, in the United States and internationally; however, sales to large service providers in North America are made directly by our field sales force. Our channel sales model allows us to leverage our field sales force. Our VARs, distributors and system integrators perform product and service fulfillment. Channel partners also provide various levels of support services required by our end customers. In some cases, we coordinate our marketing efforts and spending with VARs.
Our marketing activities consist primarily of advertising, web marketing, technology conferences, trade shows, seminars and events, public relations, demand generation and direct marketing to build our brand, increase end customer awareness, communicate our product advantages and generate qualified leads for our field sales force and channel partners.
7
Research and Development
We believe our future success depends on our ability to develop new products and features that address the rapidly changing technology needs of our markets. We operate a flexible research and development model that relies upon a combination of in-house staff and offshore contractors to develop and enhance our products cost-effectively. Our in-house and outsourced engineering personnel are responsible for the research, design, development, quality, documentation, support and release of our products. Our primary engineering center is located in Santa Clara, California, with additional groups located in Annapolis, Maryland; Burnaby, Canada; and Paris, France. Our research and development expenses were $65.1 million, $49.3 million and $43.1 million in 2015, 2014 and 2013.
Manufacturing
We design our products and develop our software internally. We subcontract the manufacturing of substantial majority of our appliance models to Flextronics Telecom Systems, Ltd., an affiliate of Flextronics International Ltd., which purchases components from our approved list of suppliers and builds hardware appliances according to our specifications. Our outsourcing activity extends from prototypes to full production and includes activities such as material procurement, installation of our software, and final assembly and testing. Once the completed products are manufactured and tested, our third-party manufacturers ship them either to our channel partners for delivery and installation or to our end customers for installation.
Although there are multiple sources for most of the component parts of our appliances, our third-party manufacturers currently purchase most components from a single source or, in some cases, limited sources. Generally, neither our third-party manufacturers nor we have a written agreement with any of these component providers to guarantee the supply of the key components used in our products. However, we regularly monitor the supply of components and the availability of qualified and approved alternative sources. We provide forecasts to our third-party manufacturers so that they can purchase key components in advance of their anticipated use, with the objective of maintaining an adequate supply of those components.
Competition
The markets in which we compete are highly competitive and characterized by rapidly changing technology, changing end customer needs, evolving industry standards and frequent introductions of new products and services. We expect competition in these markets to intensify in the future as they expand and as existing competitors and new market entrants introduce new products or enhance existing products.
We compete primarily with large technology companies, such as BMC Software, Inc., EMC Corporation, Hewlett-Packard Company, International Business Machines Corporation, Microsoft Corporation, F5 Corporation and Palo Alto Networks, legacy telecommunication equipment providers, such as Alcatel-Lucent and British Telecom, and specialized technology providers, such as BlueCat Networks, Inc., Efficient IP, Inc. and Nominum, Inc. We could also face competition from new market entrants, some of which might be our current technology partners. In addition, we seek to replace legacy network control tools and processes in which end customers have made significant investments. These tools and processes may have been purchased or internally-developed based on open source software or other technology, and end customers may be reluctant to adopt a new solution that replaces or changes their existing tools and processes.
8
The principal competitive factors applicable to our products include:
• | breadth of product offerings and features; |
• | reliability; |
• | product quality; |
• | ease of use; |
• | total cost of ownership; |
• | performance; |
• | scalability; |
• | security; |
• | flexibility and scalability of deployment; |
• | interoperability with other products; |
• | ability to be bundled with other vendor offerings; and |
• | quality of service, support and fulfillment. |
We believe our products compete favorably with respect to these factors.
Intellectual Property
Our success and ability to compete are substantially dependent upon our core technology and intellectual property. We rely on patent, trademark and copyright laws, trade secret protection and confidentiality or license agreements with our employees, end customers, VARs, distributors, system integrators and others to protect our intellectual property rights. As of July 31, 2015, we had 56 patents issued in the United States, or U.S., and 7 patents issued in foreign jurisdictions. The duration of our issued patents is determined by the laws of the country of issuance and for the U.S. is typically 17 years from the date of issuance of the patent or 20 years from the date of filing of the patent application resulting in the patent. We also had 22 patent applications pending for examination in the U.S. and 3 patent applications pending for examination in foreign jurisdictions, all of which are related to U.S. applications.
We also incorporate generally available third-party software in our products pursuant to licenses with third parties. Termination of certain third-party software licenses would require redesign of our products and incorporation of alternative third-party software and technology.
The steps we have taken to protect our intellectual property rights may not be adequate. Third parties may infringe or misappropriate our intellectual property rights and may challenge our issued patents. In addition, other parties may independently develop similar or competing technologies designed around any patents that may be issued to us. We may initiate claims against third parties that we believe are infringing our intellectual property rights if we are unable to resolve matters satisfactorily through negotiation. If we fail to protect our intellectual property rights adequately, our competitors could offer similar products, potentially harming our business.
Financial Information about Segments and Geographic Areas
We manage our operations and allocate resources as a single reporting segment. Financial information about our segment and geographic areas is incorporated herein by reference to Note 12 of Notes to Consolidated Financial Statements under Part II, Item 8. In addition, financial information regarding our operations, assets and liabilities, including our total net revenue and net loss for the years ended July 31, 2015, 2014 and 2013 and our total assets as of July 31, 2015 and 2014, is included in our Consolidated Financial Statements in Part II, Item 8 of this Report.
9
Employees
As of July 31, 2015, we employed 772 people, including 179 in research and development and manufacturing operations, 483 in sales and marketing and customer support, and 110 in general and administrative functions. None of our domestic employees are represented by a labor union. In several foreign jurisdictions, including Canada, France, Belgium, Italy and Spain, our employees may be subject to certain national collective bargaining agreements that set minimum salaries, benefits, working conditions and/or termination requirements. We also use a significant number of contractors in Belarus, India and Thailand to assist us with product engineering and support. We have not experienced any work stoppages, and we consider our relations with our employees and other personnel to be good.
Executive Officers of the Registrant
The following sets forth certain information with regard to our executive officers as of July 31, 2015:
Name | Age | Position | ||
Jesper Andersen | 52 | President, Chief Executive Officer and Director | ||
Remo E. Canessa | 57 | Chief Financial Officer | ||
Thorsten Freitag | 48 | Executive Vice President, Worldwide Field Operations | ||
Scott J. Fulton | 46 | Executive Vice President, Products | ||
David N. Gee | 47 | Executive Vice President, Marketing | ||
Sohail M. Parekh | 52 | Executive Vice President, Engineering | ||
Jesper Andersen has served as our president and chief executive officer and as a member of our board of directors since December 2014. Prior to joining our company, he served in a number of roles at Cisco Systems, Inc., a provider of networking products, from September 2008 to November 2013, including as senior vice president for network management during his first three years at the company and most recently as senior vice president and general manager of Cisco’s service provider video business unit from October 2011 to November 2013. From February 2005 to August 2008, Mr. Andersen served as senior vice president of application strategy at Oracle Corporation, an enterprise products and services company. Previously, he served as general manager and group vice president for tools and technology at PeopleSoft Inc. from 2003 until it was acquired by Oracle in February 2005.Mr. Andersen holds a master’s degree in computer science from Aalborg University.
Remo E. Canessa has served as our chief financial officer since October 2004. Prior to joining our Company, he served as chief financial officer and corporate secretary of NetScreen Technologies, Inc. from July 2001 to April 2004, when it was acquired by Juniper Networks, Inc. From December 1998 to July 2001, Mr. Canessa served as vice president of finance, chief financial officer and treasurer of Bell Microproducts, Inc., a computer equipment distribution company, where he had previously served for five years in various financial capacities. Since September 2013, Mr. Canessa has served as the chairman of the audit committee of the board of directors of Aerohive Networks, Inc., a cloud-managed mobile networking platform provider. He holds a B.A. in economics from the University of California, Berkeley and an M.B.A. from Santa Clara University and is a certified public accountant.
Thorsten Freitag has served as our executive vice president, worldwide field operations since October 2014, and as senior vice president, global sales, from March 2014 to September 2014. From January 2009 to March 2014, Mr. Freitag served as senior vice president for Europe, Middle East and Africa at F5 Networks, Inc., a provider of application delivery networking products. From July 2007 to December 2008, Mr. Freitag served as senior vice president, global partner and channel sales for Siemens Enterprise Communications, a provider of telecommunications networking products. From November 2004 to June 2007, he served as managing director at the Business Acceleration Group, a global financial services and business accelerator for technology companies. From June 1995 to October 2004, Mr. Freitag held senior sales management positions at Cisco Systems, Inc. in Germany, South Korea, and South Africa. He holds a B.Sc. in information technologies and business administration from University Laar, Germany.
10
Scott J. Fulton has served as our executive vice president, products since March 2014. From November 2007 to October 2013, he served as the vice president and general manager of the cloud management business at BMC Software, Inc., a provider of IT management solutions. From August 1996 to November 2007, he worked at Hewlett-Packard Company, a computer software and information technology company, in its software business, most recently serving as senior director with general management responsibilities for the IT operations product lines and the India R&D Center. He holds a B.A. in economics from University of Michigan and an M.B.A. from UC Davis.
David N. Gee has served as our executive vice president, marketing since March 2012. Prior to joining our company, Mr. Gee worked at Hewlett-Packard, serving as vice president of the marketing and enterprise for the webOS business unit from February 2011 to March 2012, vice president of world-wide marketing for Hewlett-Packard enterprise services from February 2009 to February 2011 and vice president of world-wide marketing for Hewlett-Packard software from September 2003 to February 2009. From 2001 to 2003, he served as vice president of portal solutions at Yahoo! Inc., an internet company. From 1999 to 2001, Mr. Gee served as vice president of global iforce programs for Sun Microsystems, Inc., a computer hardware and software company. From 1995 to 1999, he served as director of netgen sales and marketing for IBM, an information technology solutions company. He holds a B.S. in marketing from Lancaster University and an M.B.A. from Georgetown University.
Sohail M. Parekh has served as our executive vice president, engineering since January 2010 and served as our vice president, engineering from August 2007 to January 2010. Prior to joining our company, he served as vice president of engineering of Vernier Networks, Inc., a network access control products company, from October 2003 to July 2007, and vice president of engineering of Syndeo Corporation, a communications software company, from 1999 to 2003. From 1999 to 2000, he served as senior development manager at Cisco Systems, Inc. He holds a B.S. in electrical engineering from the University of Houston.
Our executive officers are elected by, and serve at the discretion of, our board of directors. There are no familial relationships among our directors and officers.
Available Information
We make available our Annual Reports on Form 10-K, Quarterly Reports on Form 10-Q, Current Reports on Form 8-K and amendments to those reports filed or furnished pursuant to Section 13(a) or Section 15(d) of the Securities Exchange Act of 1934, as amended, free of charge on our website at www.infoblox.com, as soon as reasonably practicable after they are electronically filed with or furnished to the SEC. Additionally, copies of materials filed by us with the SEC may be accessed at the SEC's Public Reference Room at 100 F Street, N.E., Washington, D.C. 20549 or at www.sec.gov. For information about the SEC's Public Reference Room, contact 1-800-SEC-0330.
11
ITEM 1A. | RISK FACTORS |
An investment in our common stock involves a high degree of risk. You should carefully consider the risks and uncertainties described below and all other information contained in this Annual Report on Form 10-K, including our consolidated financial statements and the related notes, before making a decision to invest in our common stock. Our business, operating results, financial condition or prospects could be materially and adversely affected by any of these risks and uncertainties. In that case, the trading price of our common stock could decline and you might lose all or part of your investment. In addition, the risks and uncertainties discussed below are not the only ones we face. Our business, operating results, financial performance or prospects could also be harmed by risks and uncertainties not currently known to us or that we currently do not believe are material. In assessing the risks and uncertainties described below, you should also refer to the other information contained in this Form 10-K before making a decision to invest in our common stock.
Risks Related to Our Business and Industry
We have a history of losses, and we may not become profitable or maintain profitability.
Since our inception in 1999, we have incurred a net loss in each fiscal year except 2010. During 2015, we incurred a net loss of $27.1 million. As a result, we had an accumulated deficit of $163.5 million at July 31, 2015. We may not become profitable in the future or may be unable to maintain any profitability achieved if we fail to increase our net revenue and manage our expenses or if we incur unanticipated liabilities. Revenue growth may slow or revenue may decline for a number of reasons, including slowing demand for our products or services, increasing competition, the timing of revenue recognition, lengthening sales cycles, decelerating growth of, or declines in, our overall market, or our failure to capitalize on growth opportunities or to introduce new products and services. In addition, we expect that our operating expenses, including stock-based compensation, will continue to increase in all areas as we seek to grow our business and expand our supporting infrastructure and personnel globally. Any failure by us to achieve and maintain profitability could cause the price of our common stock to decline significantly.
Our recent growth rates may not be indicative of our future growth, and we may not continue to grow at our recent pace or at all.
Our continued business and revenue growth will depend, in part, on our ability to continue to sell our products to new end customers, sell additional products to our existing end customers, introduce new products or enhancements and increase our share of and compete successfully in new, growing markets, and we may fail to do so. Accordingly, you should not consider our recent growth rate in net revenue as indicative of our future growth.
12
Our net revenue and operating results could vary significantly from period to period and be unpredictable, which could cause the market price of our common stock to decline.
The sale and licensing of our products generates a significant portion of our net revenue. The timing of sales and licensing of products can be difficult to predict and can result in significant fluctuations in our net revenue from period to period. Our operating results have fluctuated significantly in the past, and may continue to fluctuate in the future, as a result of a variety of factors, many of which are outside of our control. As a result, comparing our net revenue and operating results on a period-to-period basis may not be meaningful, and you should not rely on our past results as an indication of our future performance.
We have based our current and projected future expense levels on our operating plans and sales forecasts, and our operating costs are relatively fixed in the short term. As a result, we may not be able to reduce our costs sufficiently to compensate for an unexpected shortfall in net revenue, and even a small shortfall in net revenue could disproportionately and adversely affect our financial results for a given quarter.
It is possible that our operating results in some periods may be below market expectations. This would likely cause the market price of our common stock to decline. In addition to the other risk factors listed in this section, our operating results may be affected by a number of factors, including:
▪the timing of sales of our products and services;
▪ | the inherent complexity, length and associated unpredictability of our sales cycles, including the varying budgetary cycles and purchasing priorities of our end customers; |
▪ | the timing of revenue recognition as a result of guidance under accounting principles generally accepted in the United States; |
▪ | the loss or delay of any anticipated large sales in a given quarterly period. |
• | fluctuations in demand for our products and services, including seasonal variations; |
• | the timing of and rate and discounts at which customers replace older generations of products; |
• | the mix of products, services and product solution configurations sold during the period; |
• | the timing of the resale of our products sold to distributors, for which we generally recognize revenue upon reported sell-through; |
▪ | the mix of distribution channels through which our products and services are sold; |
▪ | the timing and success of changes in our product offerings or those of our competitors; |
▪ | changes in our or our competitors' pricing policies or sales terms; |
▪ | the mix of products with subscription based pricing for which revenue is recognized ratably over multiple quarters as opposed to being recognized in the quarter of sale; |
▪ | the amount and timing of operating expenses related to the maintenance and expansion of our business, operations and infrastructure; |
▪ | our ability to control costs, including the costs of our third-party manufacturers; |
▪ | the ability to obtain sufficient supplies of components at acceptable prices, or at all; |
▪ | the timing of costs related to the development or acquisition of technologies or businesses; |
▪ | our inability to complete or integrate efficiently any acquisitions that we may undertake; |
▪ | changes in the regulatory environment for our products domestically and internationally; |
▪ | claims of intellectual property infringement against us and any resulting temporary or permanent injunction prohibiting us from selling our products or requirement to pay damages or expenses associated with any of those claims; and |
▪ | general economic conditions in our domestic and international markets. |
Further, end customer buying patterns and sales cycles can vary significantly from quarter to quarter and are not subject to an established pattern over the course of a quarter. Accordingly, at the beginning of a quarter, we have limited visibility into the level of sales that will be made in that quarter. If expected net revenue at the end of any quarter is reduced or delayed for any reason, including, among other things, the failure of anticipated purchase orders to materialize, our inability to deliver products prior to quarter-end to fulfill purchase orders received near the end of the quarter, our failure to manage inventory properly in a way to meet demand, or our inability to release new products on schedule, our net revenue and operating results for that quarter could be materially and adversely affected.
13
As a result of the foregoing factors, our operating results in one or more future periods may fail to meet or exceed our projections or the expectations of securities analysts or investors. In that event, the trading price of our common stock would likely decline.
Since large sales may have a significant impact on our results from time to time, our quarterly results are subject to wide fluctuations.
We expect that any relatively large sales that we may receive from time to time in the future would have a significant impact on our product and licenses revenues in the quarter in which we recognize revenues from these sales. Large sales make our net revenues and operating results more likely to vary from quarter to quarter because the number of large sales is expected to vary from period to period. The loss of any particular large sale in any period could be significant. As a result, our operating results could suffer if any large sales are delayed or cancelled in any future period.
If we are unable to introduce new products successfully and to make enhancements to existing products, our growth rates would likely decline and our business, results of operations and competitive position could suffer.
We invest substantial amounts of time and resources in researching and developing new products and enhancing existing products by incorporating additional features, improving functionality and adding other improvements to meet end customers' rapidly evolving demands in our highly competitive industry. For example, we introduced our Infoblox Internal DNS Security solution in May 2015. From time to time, we also invest in the acquisition of businesses, products or technologies to expand our offerings and help us enter into new growing markets. We typically make these investments without being certain that they will result in products or enhancements that the market will accept or that they will expand our share of those markets. The sizes of the markets currently addressed by our products are not certain, and our ability to grow our business in the future may depend upon our ability to introduce new products or enhance and improve our existing products for those markets or entry into new markets. Our growth would likely be adversely affected if we fail to introduce these new products or enhancements, fail to successfully manage the transition to new products from the products they are replacing or do not invest our development efforts in appropriate products or enhancements for significant new markets, or if these new products or enhancements do not attain market acceptance.
Our new products or enhancements could fail to attain sufficient market acceptance for many reasons, including:
• | the timeliness of the introduction and delivery of our products or enhancements; |
• | our failure or inability to predict changes in our industry or end customers' demands or to design products or enhancements that meet end customers' increasing demands; |
• | defects, errors or failures in any of our products or enhancements; |
• | the inability of our products and enhancements to interoperate effectively with products from other vendors or to operate successfully in the networks of prospective end customers; |
• | negative publicity about the performance or effectiveness of our products or enhancements; |
• | reluctance of end customers to purchase products that incorporate elements of open source software; |
• | failure of our channel partners to market, support or distribute our products or enhancements effectively; and |
• | changes in government or industry standards and criteria. |
Our products or enhancements may have limited value to us if they fail to achieve market acceptance, and there can be no assurance that our sales efforts will be effective or that we will realize a positive return on any of these investments, even if the resultant products or enhancements achieve market acceptance.
14
Our end customers expect timely introduction of new products and enhancements to respond to new feature requests. Since developing new products or new versions of, or add-ons to, our existing products is complex, the timetable for their commercial release is difficult to predict and may vary from historical experience, which could result in delays in their introduction from anticipated or announced release dates. We may not offer updates as rapidly as our end customers require or expect. If we do not respond to the rapidly changing needs of our end customers by developing and introducing new and effective products on a timely basis, features, upgrades and services that can respond adequately to their needs, our competitive position, business and growth prospects will be harmed.
Sales of our Trinzic DDI family of products generate most of our products and licenses revenue, and if we are unable to continue to grow sales of these products, our operating results and profitability will suffer.
Historically, we have derived the substantial majority of our products and licenses revenue from sales of products in our Trinzic DDI family and their predecessors, and we expect sales of our Trinzic DDI family of products to have a similar contribution to product and licenses revenue for the foreseeable future. A decline in the price of these products and related services, whether due to competition or otherwise, or our inability to increase sales of these products, would harm our business and operating results more seriously than it would if we derived significant revenue from a variety of product lines and services. Our future financial performance will also depend upon successfully developing and selling enhanced versions of our Trinzic DDI family of products. Since the second quarter of fiscal year 2015, our net revenue has benefited from product sales to existing customers who upgraded from our prior generation of appliances approaching their end of support to current Trinzic DDI appliances and the benefit from this upgrade cycle will inevitably lessen in future periods. If we fail to deliver product enhancements, new releases or new products that meet the needs of our end customers, it will be more difficult for us to succeed. Moreover, our strategy depends upon our products being able to solve critical network management problems for our end customers. If our Trinzic DDI family of products is unable to solve these problems for our end customers or if we are unable to sustain the high levels of innovation in our Trinzic DDI product feature set needed to maintain leadership in what will continue to be a competitive market environment, our business and results of operations will be harmed.
The demand for our network control solution and related services may not grow as we expect.
The demand for network control depends upon the increasing size and complexity of networks, which may be driven by the rapid growth of new network-connected devices and applications, the adoption of IPv6 and the proliferation of virtualization and cloud computing. The market for network control products has increased in recent years as organizations have deployed more devices and applications on their networks and increased the number of virtual machines in use. Our business plan assumes that the demand for network control will increase based on the foregoing factors. Ultimately, however, the factors driving demand for network control may not develop as quickly as we anticipate, or at all, and the growth of our business and results of operations may be adversely affected.
15
If we are unable to attract new end customers or to sell additional products to our existing end customers, our revenue growth will be adversely affected and our net revenue could decrease.
To increase our net revenue, we must continually add new end customers and sell additional products to existing end customers. In recent periods, we have hired new personnel and added other resources to our sales function as we focus on growing our business, entering new markets and increasing our market share, and we expect to incur significant additional expenses in expanding our sales and channel development personnel and our international operations in order to achieve revenue growth. In addition, we expect our sales and marketing expenses to increase in absolute dollars as we expand our sales and marketing efforts worldwide and expand our marketing programs and relationships with current and future channel partners and end customers. The return on these and future investments may be lower, or may be realized more slowly, than we expect. For example, despite these investments into the growth of our sales function, since the first quarter of fiscal year 2015, we have experienced higher turnover in sales personnel than in the past, which will likely reduce some of the benefits we expected from such investments and could make it more difficult for us to implement our sales execution strategies and otherwise attract new end customers or expand sales among our existing end customers. If we do not achieve the benefits anticipated from our investments, or if the achievement of these benefits is delayed, our growth rates will decline and our operating results would likely be adversely affected.
We compete in rapidly evolving markets, and our failure to respond quickly and effectively to changing market requirements could cause our business and key operating metrics to decline.
The network control market is characterized by rapidly changing technology, changing customer needs, evolving industry standards and frequent introductions of new products and services. For example, in order to be competitive, our solution must be capable of operating with and managing an ever increasing array of network devices and an increasingly complex network environment. In some cases, the ability of our solution to interoperate with and manage third-party devices may require licenses from the device manufacturers or other third parties, and we may not be able to obtain necessary licenses on acceptable terms or at all. In addition, our solution must be compatible with industry standards for networks. As new networking devices are introduced and standards in the networking market evolve, we may be required to modify our products and services to make them compatible with these new devices and standards. Likewise, if our competitors introduce new products and services that compete with ours, or offer solutions which incorporate functionality we offer, we may be required to reposition our product and service offerings or to introduce new products and services in response to that competitive pressure. We may not be successful in modifying our current products or introducing new ones in a timely or appropriately responsive manner, or at all. If we fail to address these shifts in the competitive landscape successfully, our business and operating results could be materially harmed.
16
Our sales cycles can be long and unpredictable, and our sales efforts require considerable time and expense. As a result, our sales and revenue are difficult to predict and may vary substantially from period to period, which may cause our operating results to fluctuate significantly.
The timing of our sales and revenue recognition is difficult to predict because of the length and unpredictability of our products’ sales cycles. A sales cycle is the period between initial contact with a prospective end customer and any sale of our products. End customer orders often involve the purchase of multiple products. These orders are complex and difficult to complete because prospective end customers generally consider a number of factors over an extended period of time before committing to purchase network control products, such as the solution we sell. End customers often view the purchase of our products as a significant and strategic decision and require considerable time to evaluate, test and qualify our products prior to making a purchase decision and placing an order. The length of time that end customers devote to their evaluation, contract negotiation and budgeting processes varies significantly. The length of our products’ sales cycles typically ranges from three to twelve months but can be more than eighteen months. During the sales cycle, we expend significant time and money on sales and marketing activities and make investments in evaluation equipment, all of which lower our operating margins, particularly if no sale occurs. Moreover, we are subject to the risk that turnover in our sales personnel reduces the efficiency and effectiveness of our sales execution, which could lengthen our sales cycle, lower our operating margins and increase the likelihood that no sale occurs. Even if an end customer makes a decision to purchase our products, there are many factors affecting the timing of our recognition of revenue, which makes our revenue difficult to forecast. For example, there may be unexpected delays in an end customer’s internal procurement processes, particularly for some of our larger end customers for which our products represent a very small percentage of their total procurement activity. There are many other factors specific to end customers that contribute to the timing of their purchases and the variability of our revenue recognition, including the strategic importance of a particular project to an end customer, budgetary constraints and changes in their personnel. Even after an end customer makes a purchase, there may in some cases be circumstances or terms relating to the purchase that delay our ability to recognize revenue from that purchase. In addition, the significance and timing of our product enhancements, and the introduction of new products by our competitors, may also affect end customers’ purchases. For all of these reasons, it is difficult to predict whether a sale will be completed, the particular fiscal period in which a sale will be completed or the period in which revenue from a sale will be recognized. If our sales cycles lengthen, our net revenue could be lower than expected, which would have an adverse impact on our operating results and could cause our stock price to decline.
We compete in highly competitive markets, and competitive pressures from existing and new companies may adversely impact our business and operating results.
The markets in which we compete are highly competitive. We expect competition to intensify in the future as existing competitors and new market entrants introduce new products into our markets. This competition could result in increased pricing pressure, reduced profit margins, increased sales and marketing expenses and our failure to increase, or the loss of, market share, any of which would likely seriously harm our business, operating results and financial condition. If we do not keep pace with product and technology advances and otherwise keep our product offerings competitive, there could be a material and adverse effect on our competitive position, revenue and prospects for growth.
We compete primarily with large technology companies, such as BMC Software, Inc., EMC Corporation, F5 Corporation, Hewlett-Packard Company, International Business Machines Corporation, Microsoft Corporation and Palo Alto Networks, telecommunication equipment providers, such as Alcatel-Lucent and BT Group plc, and specialized technology providers, such as BlueCat Networks, Inc., EfficientIP SAS and Nominum, Inc. We also seek to replace network control tools and processes in which end customers have made significant investments. These tools and processes may have been purchased or internally-developed based on open source software or other technology, and end customers may be reluctant to adopt a new solution that replaces or changes their existing tools and processes.
17
Many of our competitors are substantially larger and have greater financial, technical, research and development, sales and marketing, manufacturing, distribution and other resources and greater name recognition. We could also face competition from new market entrants, some of which might be our current technology partners. Many of our existing and potential competitors enjoy substantial competitive advantages, such as:
• | longer operating histories; |
• | the capacity to leverage their sales efforts and marketing expenditures across a broader portfolio of products; |
• | broader distribution and established relationships with channel partners; |
• | access to larger end customer bases; |
• | greater end customer support; |
• | greater resources to make acquisitions; |
• | larger intellectual property portfolios; |
• | the ability to bundle competitive offerings with other products and services; |
• | less stringent accounting requirements, resulting in greater flexibility in pricing and terms; and |
• | lower labor and development costs. |
As a result, increased competition could result in fewer end customer orders, price reductions, reduced operating margins and loss of market share. Our competitors also may be able to provide end customers with capabilities or benefits different from or greater than those we can provide in areas such as product functionality, technical qualifications or geographic presence, or to provide end customers a broader range of products, services and prices. In addition, large competitors may have more extensive relationships within existing and potential end customers that provide them with an advantage in competing for business with those end customers. Our ability to compete will depend upon our ability to provide a better solution than our competitors at a competitive price. We may be required to make substantial additional investments in research, development, marketing and sales in order to respond to competition, and there is no assurance that these investments will achieve any returns for us or that we will be able to compete successfully in the future.
We also expect increased competition if our market continues to expand. Conditions in our market could change rapidly and significantly as a result of technological advancements or other factors. In addition, current or potential competitors may be acquired by third parties that have greater resources available. As a result of these acquisitions, our current or potential competitors might take advantage of the greater resources of the larger organization to compete more vigorously or broadly with us. In addition, continued industry consolidation might adversely impact end customers’ perceptions of the viability of smaller and even medium-sized networking companies and, consequently, end customers’ willingness to purchase from those companies.
Acquisitions and investments could result in operating difficulties, dilution and other harmful consequences.
We expect to continue to evaluate and enter into discussions regarding potential strategic transactions. These transactions could be material to our financial condition and results of operations. The process of integrating businesses and technology can create unforeseen operating difficulties and expenditures as could the integration of any future acquisitions. The areas where we face risks include:
• | implementation or remediation of controls, procedures and policies at the acquired company; |
• | diversion of management time and focus from operating our business to addressing acquisition integration challenges; |
• | coordination of product, engineering and sales and marketing functions; |
• | transition of the acquired company’s operations, users and end customers onto our existing platforms; |
• | retention of employees from the acquired company; |
• | cultural challenges associated with integrating employees from the acquired company into our organization; |
• | integration of the acquired company's accounting, management information, human resources and other administrative systems; |
18
• | liability for activities of the acquired company before the acquisition, including patent and trademark infringement claims, violations of laws, commercial disputes, tax liabilities and other known and unknown liabilities; |
• | litigation or other claims in connection with the acquired company, including claims from terminated employees, end customers, former stockholders or other third parties; |
• | in the case of foreign acquisitions, the need to integrate operations across different cultures and languages and to address the particular economic, currency, political and regulatory risks associated with specific countries; |
• | diversion of engineering resources away from development of our core products; and |
• | failure to continue to develop the acquired technology successfully. |
Our failure to address these risks or other problems encountered in connection with our past or future acquisitions and investments could cause us to fail to realize the anticipated benefits of these acquisitions or investments, cause us to incur unanticipated liabilities and harm our business generally. Future acquisitions could also result in the use of substantial amounts of our cash and cash equivalents, dilutive issuances of our equity securities, the incurrence of debt, contingent liabilities, amortization expenses or the write-off of goodwill, any of which could harm our financial condition. Also, the anticipated benefits of any acquisitions may not materialize, may be less beneficial, or may develop more slowly, than we expect. If we do not receive the benefits anticipated from these acquisitions and investments, or if the achievement of these benefits is delayed, our operating results may be adversely affected.
The developing and rapidly evolving nature of our business and the markets in which we operate may make it difficult to evaluate our business.
Since our inception in 1999 we have been creating products for the developing and rapidly evolving market for network control. Our initial products were appliances that supported reliable connectivity to networks. We have expanded our product focus through internal development and acquisitions of products and technologies. Acquisitions of this kind may cause uncertainties related to their integration into our business and there can be no assurance that we will realize the anticipated benefits of these acquisitions. In addition, we may have difficulty in our business and financial planning because of the developing nature of the markets in which we operate and the evolving nature of our business. Because we depend in part on market acceptance of our products, it is difficult to evaluate trends that may affect our business and whether our expansion will be profitable. Thus, any predictions about our future revenue and expenses may not be as accurate as they would be if our business and market were more mature and stable.
19
Adverse economic conditions may adversely impact our business.
Our business depends on the overall demand for IT and on the economic health of our current and prospective end customers. In addition, the purchase of our products is often discretionary and may involve a significant commitment of capital and other resources. General worldwide economic conditions have experienced significant instability in recent years, impacting availability of credit and business confidence and activity and causing other difficulties that may affect one or more of the industries to which we sell our products and services. If economic conditions in the United States, Europe and other key markets for our products deteriorate or do not continue to improve, many end customers may delay or reduce their IT spending. This could result in reductions in sales of our products and services, longer sales cycles, slower adoption of new technologies and increased price competition. Any of these events would likely harm our business, operating results and financial condition. In addition, there can be no assurance that IT spending levels will increase following any recovery.
We base our inventory purchasing decisions on our forecasts of end customer demand, and if our forecasts are inaccurate, our operating results could be materially harmed.
We place orders with our third-party manufacturers based on our forecasts of our end customers’ requirements and forecasts provided by our channel partners. These forecasts are based on multiple assumptions, each of which might cause our estimates to be inaccurate, affecting our ability to provide products to our customers. When demand for our products increases significantly, we may not be able to meet it on a timely basis, and we may need to expend a significant amount of time working with our customers to allocate limited supply and maintain positive customer relations, or we may incur additional costs to rush the manufacture and delivery of additional products. If we or our channel partners underestimate end customer demand, we may forego revenue opportunities, lose market share and damage our end customer relationships. Conversely, if we overestimate end customer demand, we may maintain more finished goods or raw materials inventory than we are able to sell when we expect to or at all. If our channel partners overestimate end customer demand, our channel partners may accumulate excess inventory, which could cause a reduction of purchases from us in future quarters. As a result, we could have excess or obsolete inventory, resulting in a decline in its value, which would increase our cost of revenue and reduce our liquidity. Our failure to manage inventory accurately relative to demand would adversely affect our operating results.
20
We rely on our channel partners, including distributors, integrators, managed service providers and value-added resellers. A decrease in their sales of our products would materially and adversely affect our operating results.
A significant majority of our net revenue is generated from sales through our channel partners, including third-party distributors, integrators, managed service providers and VARs, that market or sell networking equipment, software and other products and services to end customers. We expect these channel partners to continue to have a similar impact on our net revenue for the foreseeable future, as we invest in and expand our channel relationships, particularly those with large managed service providers. Accordingly, our future growth will depend in part on our channel partners’ ability to market and sell our products and services. In general, our contracts with our channel partners do not contain minimum purchase commitments and allow them to exercise significant discretion regarding the promotion of our products and services, meaning our channel partners could cease to sell our products and services, choose to market, sell and support products and services that are competitive with ours or choose to devote more resources to the marketing, sales and support of those competitive products. As a result, our net revenue would decrease if our competitors were effective in providing incentives to existing and potential channel partners to favor their products over ours or to prevent or reduce sales of our products. Our net revenue might also be negatively affected by our failure to hire and retain sufficient qualified sales personnel internally since our channel partners depend on significant support from our internal sales personnel. Even if our channel partners actively and effectively promote our products and services, there can be no assurance that their efforts will result in growth of our net revenue. In addition, to the extent we fail to attract, train and maintain a sufficient number of high-quality channel partners, our business, operating results and financial condition could be materially and adversely affected. Recruiting and retaining qualified channel partners, particularly large managed service providers, is difficult. Training new channel partners regarding our technology and products requires significant time and resources, and it may take several months or more to achieve significant sales from new channel partners. We may also change our channel distribution model in one or more regions, such as by adding a distribution tier to our sales channel in North America to support our VARs, such change might not improve our channel partners’ effectiveness and could result in decreases to our gross margins and declining profitability. In order to develop and expand our distribution channels, we must continue to scale and improve our processes and procedures that support these channels, including investment in systems and training, and those processes and procedures may become increasingly complex and difficult to manage.
By relying on channel partners, we may in some cases have little contact with the end customers of our products, thereby making it more difficult for us to ensure proper delivery, installation and support of our products, service ongoing end customer requirements and respond to evolving end customer needs. In addition, our use of channel partners could subject us to lawsuits, potential liability, reputational harm and other negative consequences if, for example, a sales channel partner misrepresents the functionality of our products or services to end customers or violates laws or our corporate policies.
In particular, violations of laws or key control policies by our channel partners, despite our efforts to prevent them, could result in delays in revenue recognition, financial reporting misstatements, fines, penalties, or the prohibition of the importation or exportation of our products and services and could have a material adverse effect on our business and results of operations. Accordingly, if we fail to manage our channel partners effectively, our business would be seriously harmed.
We are exposed to the credit risk of our channel partners and end customers, which could result in material losses and negatively impact our operating results.
Most of our sales are on an open credit basis, with typical payment terms of 30 days. Because of local customs or conditions, payment terms may be longer in some circumstances and markets. If any of the channel partners or end customers responsible for a significant portion of our net revenue becomes insolvent or suffers a deterioration in its financial or business condition and is unable to pay for our products, our results of operations could be harmed.
21
Our business depends on end customers renewing their maintenance and support contracts. Any decline in maintenance renewals could harm our future operating results.
We typically sell our products with maintenance and support as part of the initial purchase, and a substantial portion of our annual net revenue comes from renewals of maintenance and support contracts. Our end customers have no obligation to renew their maintenance and support contracts after the expiration of the initial period, and they may elect not to renew their maintenance and support contracts, to renew their maintenance and support contracts at lower prices through alternative channel partners or to reduce the product quantity under their maintenance and support contracts, thereby reducing our future net revenue from maintenance and support contracts. If our end customers do not renew their maintenance and support contracts or if they renew them on terms that are less favorable to us, our net revenue may decline and our business will suffer.
Our ability to sell our products is highly dependent on the quality of our support and services offerings, and our failure to offer high-quality support and services could have a material and adverse effect on our business and results of operations.
Once our products are deployed within our end customers’ networks, our end customers depend on our support organization and our channel partners to resolve any issues relating to our products. High-quality support is critical for the successful marketing and sale of our products. If we or our channel partners do not assist our end customers in deploying our products effectively, succeed in helping our customers resolve post-deployment issues quickly, or provide ongoing support, it could adversely affect our ability to sell our products to existing end customers and could harm our reputation with potential end customers. In addition, as we expand our operations internationally, our support organization will face additional challenges, including those associated with delivering support, training and documentation in languages other than English. Our failure or the failure of our channel partners to maintain high-quality support and services could have a material and adverse effect on our business and operating results.
Claims by others that we infringe their intellectual property rights could harm our business.
Our industry is characterized by vigorous pursuit and protection of intellectual property rights, which has resulted in protracted and expensive litigation for many companies. Third parties have asserted and may in the future assert claims of misappropriation of trade secrets or infringement of intellectual property rights against us or against our end customers or channel partners for which we may be liable.
As our business expands, the number of products and competitors in our markets increases and product overlaps occur, infringement claims may increase in number and significance. In this regard, we have been sued by Versata Software, Inc. for alleged infringement of four of Versata's patents. Intellectual property lawsuits are subject to inherent uncertainties due to the complexity of the technical issues involved, and we cannot be certain that we will be successful in defending ourselves against intellectual property claims. In addition, we currently have a more limited portfolio of issued patents than our major competitors, and therefore may not be able to utilize our intellectual property portfolio effectively to assert defenses or counterclaims in response to patent infringement claims or litigation brought against us by third parties. Further, litigation may involve patent holding companies or other adverse patent owners that have no relevant product revenue and against which our potential patents may provide little or no deterrence. In addition, many potential litigants have the capability to dedicate substantially greater resources than we can to enforce their intellectual property rights and to defend claims that may be brought against them. Furthermore, a successful claimant could secure a judgment that requires us to pay substantial damages or prevents us from distributing products or performing certain services. We could also be required to seek a license for the use of that intellectual property, which might not be available on commercially acceptable terms or at all. Alternatively, we might be required to develop non-infringing technology, which could require significant effort and expense and might ultimately not be successful.
22
Failure to protect our intellectual property rights could adversely affect our business.
Our success depends, in part, on our ability to protect proprietary methods and technologies that we develop under patent and other intellectual property laws of the United States and foreign jurisdictions so that we can prevent others from using our inventions and proprietary information. If we fail to protect our intellectual property rights adequately, our competitors might gain access to our technology and our business might be harmed. In addition, we might incur significant expenses in defending our intellectual property rights. Any of our patents, copyrights, trademarks or other intellectual property rights could be challenged by others or invalidated through administrative process or litigation.
We could be required to spend significant resources to monitor and protect our intellectual property rights. In this regard, we have in the past initiated and may in the future initiate claims or litigation against third parties for infringement of our proprietary rights or to establish the validity of our proprietary rights. Any litigation, whether or not resolved in our favor, could result in significant expense to us and divert the efforts of our management and technical personnel, which might adversely affect our business, operating results and financial condition.
Indemnity provisions in various agreements potentially expose us to substantial liability for intellectual property infringement and other losses.
Our agreements with customers and commercial partners include indemnification provisions, under which we agree to indemnify them for losses suffered or incurred as a result of claims of intellectual property infringement and, in some cases, for damages caused by us to property or persons or other third-party claims. The term of these indemnity provisions is generally perpetual after execution of the corresponding product sale agreement. Large indemnity payments could harm our business, operating results and financial condition.
We depend on third-party manufacturers for the supply and quality of our products.
We outsource the manufacturing of the substantial majority of our products to Flextronics Telecom Systems, Ltd., an affiliate of Flextronics International Ltd. These standard contract manufacturer arrangements subject us to the risk that the manufacturer does not provide our customers with the quality and performance that they expect or that the manufacturer does not provide us with an adequate supply of products. Our orders typically represent a relatively small percentage of the overall orders received by these manufacturers from their customers. As a result, fulfilling our orders may not be considered a priority in the event our manufacturer is constrained in its ability to fulfill all of its customer obligations in a timely manner. We must also accurately predict the number of products that we will require. If we overestimate our requirements, we may incur liabilities for excess inventory, which could negatively affect our gross margins. Conversely, if we underestimate our requirements, our manufacturer and suppliers may have inadequate supplies of the materials and components required to produce our products. In addition, we acquire some of our other products and components from sole-source suppliers. This could result in an interruption of the manufacturing of our products, delays in shipments and deferral or loss of revenue. Quality or performance failures of our products or changes in our manufacturers' financial or business condition could disrupt our ability to supply quality products to our customers and thereby have a material and adverse effect on our business and operating results.
23
Some of the components and technologies used in our products are purchased and licensed from a single source or a limited number of sources. The loss of any of these suppliers might cause us to incur additional transition costs, result in delays in the manufacturing and delivery of our products, or cause us to carry excess or obsolete inventory and could require us to redesign our products.
Although supplies of our components are generally available from a variety of sources, we currently depend on a single source or a limited number of sources for most components included in our products. For example, the chipsets and motherboards that we use in the products manufactured by Flextronics are currently available only from a limited number of sources, and neither we nor, to our knowledge, this manufacturer have entered into supply agreements with these sources. We have also entered into license agreements with some of our suppliers for technologies that are used in our products.
As there are no other sources for identical components and technologies, if we lost any of these suppliers, we might not be able to sell our products for a significant period of time, and we could incur significant costs to redesign our hardware and software to incorporate components or technologies from alternative sources or to qualify alternative suppliers. Our reliance on a single source or a limited number of suppliers involves a number of additional risks, including risks related to:
• | supplier capacity constraints; |
• | price increases; |
• | timely delivery; |
• | component quality; and |
• | natural disasters. |
In addition, for certain components for which there are multiple sources, we are subject to potential price increases and limited availability as a result of market demand for these components. In the past, unexpected demand for computer and network products has caused worldwide shortages of certain electronic parts. If similar shortages occur in the future, our business would be adversely affected. We carry very little inventory of our products, and we and our manufacturer rely on our suppliers to deliver necessary components in a timely manner. We and our manufacturer rely on purchase orders rather than long-term contracts with these suppliers, and as a result we or our manufacturer might not be able to secure sufficient components, even if they were available, at reasonable prices or of acceptable quality to build products in a timely manner and, therefore, might not be able to meet customer demands for our products, which would have a material and adverse effect on our business, operating results and financial condition.
We rely on the availability of third-party licenses and, in the future, if these licenses are available to us only on less favorable terms or not available at all, our business and operating results would be harmed.
Our products include software and other technology licensed from third parties. It may be necessary in the future to renew licenses relating to various aspects of these products or to seek additional licenses for existing or new products. There can be no assurance that the necessary licenses would be available on acceptable terms or at all. The inability to obtain certain licenses or other rights or to obtain those licenses or rights on favorable terms, or the need to engage in litigation regarding these matters, could result in delays in product releases until such time, if ever, as equivalent technology could be identified, licensed or developed and integrated into our products and might have a material adverse effect on our business, operating results and financial condition.
24
If we are unable to hire, retain and motivate qualified personnel, our business would suffer.
Our future success depends, in part, on our ability to attract and retain highly skilled personnel. The loss of the services of any of our key personnel, the inability to attract and retain additional qualified personnel or delays in hiring required personnel, particularly in engineering and sales, could seriously harm our business, financial condition and results of operations. Any of our employees may terminate their employment at any time. Competition for highly skilled personnel is frequently intense, especially in the San Francisco Bay Area, where we have a substantial presence and need for highly skilled personnel. For example, since the first quarter of fiscal year 2015, we have experienced higher turnover in sales personnel than in the past. In addition, employees who are substantially vested in significant stock options and restricted stock units could exercise those options and sell their stock, which might result in a higher than normal turnover rate. Also, to the extent we hire personnel from competitors, we may be subject to allegations that they have been improperly solicited or divulged proprietary or other confidential information to us.
We are dependent on the continued services and performance of our senior management and other key employees, the loss of any of whom could adversely affect our business, operating results and financial condition.
Our future performance depends on the continued services and continuing contributions of our senior management and other key employees to execute on our business plan, and to identify and pursue new opportunities and product innovations. The loss of the services of senior management or other key employees could significantly delay or prevent the achievement of our development and strategic objectives and could adversely affect our business, financial condition and results of operations.
Replacing departing executive officers and key employees can involve organizational disruption, including employee departures. We have experienced transitions among our executive officers, including the appointment of our president and chief executive officer in December 2014 and the appointment of our executive vice president, worldwide field operations effective October 2014. In September 2015, we also announced that our chief financial officer intends to step down from his role upon his successor being appointed. If we fail to manage these transitions successfully, we could experience significant delays or difficulty in the achievement of our development and strategic objectives and our business, financial condition and results of operations could be materially and adversely harmed.
25
Our international sales and operations subject us to additional risks that may materially and adversely affect our business and operating results.
During fiscal years 2015, 2014 and 2013, 36.8%, 38.1% and 38.3% of our net revenue were derived from customers outside of the United States. During fiscal year 2015, revenue from customers in the United States grew 24.9% year-over-year while revenue generated internationally grew 18.0% year-over-year. There can be no assurance that these trends will continue in the foreseeable future. Sales to our international customers have typically been denominated in U.S. dollars. Fluctuations in currency exchange rates could cause our products to become relatively more expensive to end customers in a particular country, leading to a reduction in sales or profitability in that country. We are also exposed to movements in foreign currency exchange rates relating to operating expenses associated with our operations and personnel outside the United States. We have research and development personnel in Canada and France, engage contractors in Belarus, India and Malaysia, and we expect to expand our offshore development efforts. We also have testing and support personnel in India and sales and support personnel in numerous countries worldwide. We expect to continue to hire personnel in additional countries. Our international operations subject us to a variety of risks, including:
• | the difficulty of managing and staffing international offices and the increased travel, infrastructure and legal compliance costs associated with numerous international locations; |
• | reduced demand for technology products outside the United States; |
• | difficulties in enforcing contracts and collecting accounts receivable, and longer payment cycles, especially in emerging markets; |
• | tariffs and trade barriers, export regulations and other regulatory or contractual limitations on our ability to sell or develop our products in certain foreign markets; |
• | increased exposure to currency exchange rate risk; |
• | heightened exposure to political instability, war and terrorism; |
• | added legal compliance obligations and complexity; |
• | reduced protection for intellectual property rights in some countries; |
• | multiple conflicting tax laws and regulations; |
• | the need to localize our products for international end customers; and |
• | the increased cost of terminating employees in some countries. |
As we continue to expand our business globally, our success will depend, in large part, on our ability to anticipate and manage effectively these and other risks associated with our international operations. Our failure to manage any of these risks successfully could harm our international operations and reduce our international sales, adversely affecting our business, operating results and financial condition.
In addition, we may be subject to increasing international environmental laws and regulations such as laws governing the hazardous material content of our products and laws relating to the recycling of electrical and electronic equipment. The laws and regulations to which we are currently subject include the EU Regulation of Hazardous Substances Directive and the EU Waste Electrical and Electronic Equipment Directive (the “Environmental Directives”) as well as the legislation of the EU member states implementing the Environmental Directives. Similar laws and regulations have been passed or are pending in China, South Korea, Norway and Japan and may be enacted in other regions, including in the United States, and we are, or may in the future be, subject to these laws and regulations. We have incurred costs to comply with the Environmental Directives in the past, and we may be required to incur additional costs in the future to comply with similar laws and regulations as they are introduced in other countries and could disrupt our operations or logistics if we do not have sufficient time to adjust our products and processes. Our failure to comply with such environmental rules and regulations could result in reduced sales of our products, increased costs, substantial product inventory write-offs, reputational damage, penalties and other sanctions.
26
We are subject to governmental export and import controls that could subject us to liability or impair our ability to compete in international markets.
Because we incorporate encryption technology into our products, certain of our products are subject to U.S. export controls and may be exported outside the United States only with the required export license or through an export license exception. If we continue to develop and expand our security related products and services, some or all of these products may be subject to more restrictive export and import requirements than our historic products, which would require additional administration and could result in limiting our ability to offer our products and services in some countries or to some end customers. If we were to fail to comply with United States export licensing, United States Customs regulations and import regulations, United States economic sanctions and other countries' import and export laws, we could be subject to substantial civil and criminal penalties, including fines against us and incarceration for responsible employees and managers, and the possible loss of export or import privileges. In addition, if our channel partners fail to obtain appropriate import, export or re-export licenses or permits, we may also be adversely affected through reputational harm and penalties. Obtaining the necessary export license for a particular sale may be time-consuming and may result in the delay of product launches. In addition, various countries regulate the import of certain encryption technology, including import permitting/licensing requirements, and have enacted laws that could limit our ability to distribute our products or could limit our end customers' ability to implement our products in those countries. Changes in our products or changes in export and import regulations may create delays in the introduction of our products in international markets, prevent our end customers with international operations from deploying our products globally or, in some cases, prevent the export or import of our products to certain countries, governments or persons altogether. Changes in our products or changes in export or import regulations, economic sanctions or related legislation, shift in the enforcement or scope of existing regulations, or change in the countries, governments, persons or technologies targeted by such regulations could result in decreased use of our products by, or in our decreased ability to export or sell our products to, existing or potential end customers with international operations. Any decreased use of our products or limitation on our ability to export or sell our products would likely adversely affect our business, financial condition and results of operations.
Our use of and reliance on research and development resources in foreign countries may expose us to unanticipated costs or events.
We have significant research and development centers in Canada and France and have significant numbers of contractors in Belarus and India. There can be no assurance that our reliance upon research and development resources in foreign countries will enable us to achieve meaningful cost reductions or greater resource efficiency. Further, our research and development efforts and other operations in foreign countries involve significant risks, including:
• | difficulty hiring and retaining appropriate engineering personnel because of intense competition for engineers and resulting wage inflation; |
• | difficulties regarding the transfer of knowledge related to our technology and resulting exposure to misappropriation of intellectual property or information that is proprietary to us, our end customers and other third parties; |
• | heightened exposure to change in the economic, security and political conditions in developing countries; |
• | fluctuations in currency exchange rates and difficulties of regulatory compliance in foreign countries; and |
• | interruptions to our operations in India or Thailand as a result of typhoons, floods and other natural catastrophic events, as well as man-made problems such as power disruptions or terrorism. |
Difficulties resulting from the factors above and other risks related to our operations in foreign countries could expose us to increased expense, impair our development efforts and harm our competitive position.
27
If we fail to manage future growth effectively, our business would be harmed.
We operate in emerging markets and have experienced, and may continue to experience, significant expansion of our operations. This growth has placed, and any future growth would continue to place, a strain on our employees, management systems and other resources. Managing our growth will require significant expenditures and allocation of valuable management resources. Further international expansion may be required for our continued business growth, and managing any international expansion would require additional resources and controls. If we fail to achieve the necessary level of efficiency in our organization as it grows, our business, operating results and financial condition would be harmed.
We expect our gross margin to vary over time, and our current level of gross margin may not be sustainable.
Our level of gross margin may not be sustainable and may be adversely affected by numerous factors, including:
• | increased price competition; |
• | changes in end customer or product and service mix; |
• | increased inbound shipping charges; |
• | our inability to maintain or reduce the amount we pay our third-party manufacturers; |
• | increases in material or labor costs; |
• | increased costs of licensing third-party technologies that are used in our products; |
• | carrying costs of excess inventory, inventory holding charges and obsolescence charges that may be passed through to us by our third-party manufacturers; |
• | changes in our distribution channels or our arrangements with our distributors and VARs; |
• | increased warranty and repair costs; and |
• | the introduction of new appliance models, which may have lower margins than our existing products. |
Depending on the overall mix of product models in any given quarter, gross margins could be lower which would impact our operating results.
If we are not able to maintain and enhance our brand and reputation, our business and operating results may be harmed in tangible or intangible ways.
We believe that maintaining and enhancing our brand and reputation are critical to our relationships with, and our ability to attract, new end customers, technology partners and employees. The successful promotion of our brand will depend largely upon our ability to continue to develop, offer and maintain high-quality products and services, our marketing and public relations efforts, and our ability to differentiate our products and services successfully from those of our competitors. Our brand promotion activities could involve significant expenditures and may not be successful and may not yield increased revenue. In addition, extension of our brand to products and uses different from our traditional products and services may dilute our brand, particularly if we fail to maintain the quality of products and services in these new areas. If we do not successfully maintain and enhance our brand and reputation, our growth rate may decline, we may have reduced pricing power relative to competitors with stronger brands or reputations, and we could lose end customers or technology partners, all of which would harm our business, operating results and financial condition.
In addition, from time to time independent industry analysts may provide reviews of our products and services, as well as those of our competitors, and perception of our products in the marketplace may be significantly influenced by these reviews. We have no control over what these industry analysts report, and because industry analysts may influence current and potential end customers, our brand could be harmed if industry analysts do not provide positive reviews of our products or identify them as market leaders.
28
Seasonality may cause fluctuations in our net revenue and operating results.
We operate on a July 31 fiscal year-end and believe that there are significant seasonal factors which may cause the second and fourth quarters of our fiscal year to have greater product revenue than our first and third fiscal quarters. We believe that this seasonality results from a number of factors, including:
• | end customer procurement, budget and deployment cycles in the government and education sectors, which potentially result in stronger order flow in our second fiscal quarter; |
• | one or more of our larger end customers with a December 31 fiscal year-end choosing to spend remaining budgets before their year-end, which potentially results in a positive impact on our product revenue in the second quarter of our fiscal year; |
• | the timing of our annual training for the entire sales force in our first fiscal quarter, which, combined with fourth quarter sales, can potentially cause our first fiscal quarter to be seasonally weak, and |
• | seasonal reductions in business activity during August in the United States, Europe and certain regions, which have a negative impact on our first fiscal quarter revenue. |
Our rapid historical growth may have reduced the impact of seasonal or cyclical factors that might have influenced our business to date. As our increasing size causes our growth rate to slow, seasonal or cyclical variations in our operations may become more pronounced over time and may materially affect our results of operations.
If our products contain undetected software, hardware or data errors, we could incur significant unexpected expenses and lost sales and revenue and we could be subject to product liability claims.
Products such as ours frequently contain undetected software, hardware or data errors, many of which are identified only when our products are first introduced or as new versions, updates or enhancements are released. We have experienced errors in the past in connection with our products. We expect that errors will be found from time to time in new or enhanced products after commencement of commercial shipments. Since our products contain software, hardware or data components that we purchase or license from third parties, we also expect our products to contain latent defects and errors from time to time related to those third-party components. These problems may cause us to incur significant warranty and repair costs, process management costs, and costs associated with remanufacturing our inventory. In addition, regardless of the party at fault, errors of these kinds divert the attention of our engineering personnel from our product development efforts, damage our reputation and the reputation of our products, cause significant customer relations problems and can result in product liability claims. The occurrence of these problems could result in the delay or loss of market acceptance of our products and could adversely impact our business, operating results and financial condition.
Our business is subject to the risks of warranty claims, product returns, product liability and product defects.
Real or perceived errors, failures or bugs in our products could result in claims by customers for losses that they sustain. If customers make these types of claims, we may be required, or may choose, for customer relations or other reasons, to expend additional resources in order to help correct the problem or resolve matters with customers. Liability provisions in our standard terms and conditions of sale, and those of our resellers and distributors, may not be enforceable under some circumstances or may not fully or effectively protect us from customer claims and related liabilities and costs, including indemnification obligations under our agreements with resellers and distributors. The sale and support of our products also entail the risk of product liability claims. We maintain insurance to protect against certain types of claims associated with the use of our products, but our insurance coverage may not adequately cover any such claims. In addition, even claims that ultimately are unsuccessful could result in expenditures of funds in connection with litigation and divert management’s time and other resources.
29
We depend on the U.S. government for a portion of our sales, which are facilitated through resellers on which we also depend for these sales. Any reductions in sales to the U.S. government, as a result of the loss of reseller relationships or any other reason, could harm our growth.
A significant portion of our sales is made to certain departments of the U.S. government. Nearly all of these sales are made through resellers. Any factors that cause a decline in government expenditures generally or government IT expenditures in particular could cause our net revenue to grow less rapidly or even to decline. The timing of fulfillment under government contracts can also be uncertain. In addition, since in most cases we are unable to fulfill orders from the U.S. government directly, the loss of key reseller relationships could adversely affect our ability to fulfill certain orders from the government until we are able to find and qualify a suitable alternative. This, in turn, would cause revenue to be delayed and could cause sales to be lost.
Our net revenue may decline as a result of reductions in public funding of educational institutions.
We regard sales to universities, colleges and other educational institutions as an important source of net revenue. Many of these institutions receive funding from local tax revenues and from state and federal governments through a variety of programs. Federal, state or local funding of public education may be reduced for a variety of reasons, including budget-driven austerity measures, legislative changes or fluctuations in tax revenues because of changing economic conditions. If funding of public education declines for these or any other reason, our sales to educational institutions might be negatively impacted. Any reduction in spending on IT systems by educational institutions would likely materially and adversely affect our business and results of operations.
If we fail to maintain proper and effective internal controls, our ability to produce accurate financial statements on a timely basis could be impaired, which could result in a loss of investor confidence in our financial reports and have an adverse effect on our stock price.
Our management is responsible for establishing and maintaining adequate internal control over financial reporting to provide reasonable assurance regarding the reliability of our financial reporting and the preparation of financial statements for external purposes in accordance with U.S. generally accepted accounting principles. If we are unable to maintain adequate internal control over financial reporting, we might be unable to report our financial information on a timely basis and might suffer adverse regulatory consequences or violate New York Stock Exchange, or NYSE, listing standards. There could also be a negative reaction in the financial markets due to a loss of investor confidence in us and the reliability of our financial statements. We may in the future discover areas of our internal financial and accounting controls and procedures that need improvement. Our internal control over financial reporting will not prevent or detect all error and all fraud. A control system, no matter how well conceived and operated, can provide only reasonable, not absolute, assurance that the objectives of the control system will be met. Because of the inherent limitations in all control systems, no evaluation of controls can provide absolute assurance that all control issues and instances of fraud, if any, within our company will be detected. If we are unable to maintain proper and effective internal controls, we may not be able to produce accurate financial statements on a timely basis, which could adversely affect our ability to operate our business and could result in regulatory action, and could require us to restate our financial statements. Any such restatement could result in a loss of public confidence in the reliability of our financial statements and sanctions imposed on us by the SEC.
30
We rely on third parties for the fulfillment of our end customer orders and replacements, and the failure of these third parties to perform could have an adverse effect upon our reputation and our ability to distribute our products, which could cause a material reduction in our net revenue.
We rely on our third-party manufacturers to build and inventory sufficient quantities of our products to fulfill end customer orders, and we also use third parties to transport our products, hold our inventory in local depots in foreign countries and fulfill our end customer replacement requirements. If our third-party agents fail to perform, our ability to deliver our products and to generate revenue would be adversely affected. The failure of our third-party manufacturers and other third-party logistics providers to deliver products in a timely manner could lead to the dissatisfaction of our channel partners and end customers and damage our reputation, which might cause our channel partners or end customers to cancel existing agreements with us and to stop transacting business with us. In addition, this reliance on our third-party manufacturers and third-party logistics providers may impact the timing of our revenue recognition if our providers fail to deliver orders during the prescribed time period. In the event we were unexpectedly forced to change providers, we could experience short-term disruptions in our delivery and fulfillment process that could adversely affect our business.
Our use of open source software could impose limitations on our ability to commercialize our products.
Our products contain software modules licensed for use from third-party authors under open source licenses, including the GNU Public License, the GNU Lesser Public License and the Apache License. Use and distribution of open source software may entail greater risks than use of third-party commercial software, as open source licensors generally do not provide warranties or other contractual protections regarding infringement claims or the quality of the code. Some open source licenses contain requirements that we make available source code for modifications or derivative works that we create based upon the type of open source software we use. If we combine our proprietary software with open source software in a certain manner, we could, under certain of the open source licenses, be required to release the source code of our proprietary software to the public. This could allow our competitors to create similar products with lower development effort and time and ultimately could result in a loss of product sales for us.
The terms of many open source licenses have not been interpreted by U.S. courts, and there is a risk that these licenses could be construed in a manner that could impose unanticipated conditions or restrictions on our ability to commercialize our products. In such event, we could be required to seek licenses from third parties in order to continue offering our products and to re-engineer our products or to discontinue the sale of our products in the event re-engineering cannot be accomplished on a timely basis, any of which could materially and adversely affect our business and operating results.
Confidentiality agreements with employees and others may not adequately prevent disclosure of our trade secrets and other proprietary information.
In order to protect our proprietary technology, processes and methods, we rely in part on confidentiality agreements with our technology partners, employees, consultants, advisors and others. These agreements may not effectively prevent disclosure of our confidential information and may not provide an adequate remedy in the event of unauthorized disclosure of our confidential information. In addition, others may independently discover our trade secrets and proprietary information, and in these cases we would not be able to assert any trade secret rights against those parties. Costly and time-consuming litigation could be necessary to enforce and determine the scope of our proprietary rights, and failure to obtain or maintain trade secret protection could adversely affect our competitive business position.
31
Our reported financial results may be adversely affected by changes in accounting principles applicable to us.
Generally accepted accounting principles in the United States, or U.S. GAAP, are subject to interpretation by the Financial Accounting Standards Board, or FASB, the SEC, and other bodies formed to promulgate and interpret appropriate accounting principles. For example, in May 2014, the FASB issued ASU No. 2014-09, Revenue from Contracts with Customers, which supersedes nearly all existing revenue recognition guidance under U.S. GAAP. Changes in accounting principles or interpretations could have a significant effect on our reported financial results and could affect the reporting of transactions completed before the announcement of a change. Any difficulties in the implementation of new or changed accounting standards could cause us to fail to meet our financial reporting obligations, which could result in regulatory discipline. In addition, the SEC has announced a multi-year plan that could ultimately lead to the use of International Financial Reporting Standards by U.S. issuers in their SEC filings. Any such change could have a significant effect on our reported financial results.
If our estimates relating to our critical accounting policies are based on assumptions or judgments that change or prove to be incorrect, our operating results could fall below expectations of securities analysts and investors, resulting in a decline in our stock price.
The preparation of financial statements in conformity with generally accepted accounting principles requires our management to make estimates, assumptions and judgments that affect the amounts reported in our consolidated financial statements and accompanying notes. We base our estimates on historical experience and on various other assumptions, the results of which form the basis for making judgments about the carrying values of assets and liabilities that are not readily apparent from other sources. If our assumptions change or if actual circumstances differ from those in our assumptions, our operating results may be adversely affected, which could cause our operating results to fall below market expectations and our stock price to decline. Significant estimates, assumptions and judgments used in preparing our consolidated financial statements include those related to revenue recognition, determination of fair value of stock-based awards, valuation of goodwill and intangible assets acquired, impairment of goodwill and other long-lived assets, amortization of intangible assets, contingencies and litigation, accounting for income taxes, including the valuation reserve on deferred tax assets and uncertain tax positions, allowances for doubtful accounts and sales returns and valuation of inventory.
Our ability to use net operating losses to offset future taxable income may be subject to certain limitations.
In general, under Section 382 of the U.S. Internal Revenue Code of 1986, or the Code, a corporation that undergoes an “ownership change” is subject to limitations on its ability to utilize its pre-change net operating losses, or NOLs, to offset future taxable income. Our existing NOLs may be subject to limitations arising from previous ownership changes and, if we undergo an ownership change in the future, our ability to utilize our NOLs could be further limited by Section 382 of the Code. Future changes in our stock ownership, many of which are outside of our control, could result in an ownership change under Section 382 of the Code. Our net operating losses could also be impaired under state law. As a result, we might not be able to utilize a material portion of our NOLs.
32
Our future capital needs are uncertain, and we may need to raise additional funds in the future.
We believe that our existing cash and cash equivalents will be sufficient to meet our anticipated cash requirements for at least the next 12 months. We may, however, need to raise substantial additional capital to:
• | fund our operations; |
• | continue our research and development |
• | commercialize new products; or |
• | acquire companies, in-licensed products or intellectual property. |
Our future funding requirements will depend on many factors, including:
• | market acceptance of our products and services; |
• | the cost of our research and development activities; |
• | the cost of defending, in litigation or otherwise, claims that we infringe third-party patents or violate other intellectual property rights; |
• | the cost and timing of establishing additional sales, marketing and distribution capabilities; |
• | the cost and timing of establishing additional technical support capabilities; |
• | the effect of competing technological and market developments; and |
• | the market for different types of funding and overall economic conditions. |
If we require additional funds in the future, those funds may not be available on acceptable terms, or at all.
We may require additional funds in the future, and we may not be able to obtain those funds on acceptable terms, or at all. If we raise additional funds by issuing equity securities, our stockholders may experience dilution. Debt financing, if available, may involve covenants restricting our operations or our ability to incur additional debt. Any debt or additional equity financing that we raise may contain terms that are not favorable to us or our stockholders. If we do not have, or are not able to obtain, sufficient funds, we may have to delay development or commercialization of our products or license to third parties the rights to commercialize products or technologies that we would otherwise seek to commercialize. If we raise additional funds through collaboration and licensing arrangements with third parties, it may be necessary to relinquish some rights to our technologies or our products, or to grant licenses on terms that are not favorable to us. If we are unable to raise adequate funds, we may have to liquidate some or all of our assets, or delay, reduce the scope of or eliminate some or all of our development programs. We also may have to reduce marketing, customer support or other resources devoted to our products or cease operations. Any of these actions could harm our operating results.
Changes in our provision for income taxes or adverse outcomes resulting from examination of our income tax returns could adversely affect our results.
Our provision for income taxes is subject to volatility and could be adversely affected by the following:
• | changes in the valuation of our deferred tax assets; |
• | foreign or domestic income tax assessments and any related tax interest or penalties; |
• | expiration of, or lapses in, the research and development tax credit laws; |
• | tax effects of nondeductible compensation; |
• | adjustments to the pricing of intercompany transactions and transfers of intellectual property or other assets; |
• | changes in accounting principles; or |
• | changes in tax laws and regulations, including changes in taxation of the services provided by our foreign subsidiaries. |
33
Significant judgment is required to determine the recognition and measurement attributes prescribed in the accounting guidance for uncertainty in income taxes. The accounting guidance for uncertainty in income taxes applies to all income tax positions, including the potential recovery of previously paid taxes, that if settled unfavorably could adversely impact our provision for income taxes or additional paid-in capital. In addition, we are subject to the examination of our income tax returns by the U.S. Internal Revenue Service and other tax authorities. We regularly assess the likelihood of adverse outcomes resulting from these examinations to determine the adequacy of our provision for income taxes. The outcomes from these examinations might have a material and adverse effect on our operating results and financial condition.
Our business is subject to the risks of earthquakes, fire, floods and other natural catastrophic events, and to interruption by man-made problems such as power disruptions or terrorism.
Our corporate headquarters is located in the San Francisco Bay Area, a region known for seismic activity. We also have significant testing and support facilities in India, a region known for typhoons, floods and other natural disasters. A significant natural disaster, such as an earthquake, fire or a flood, occurring at our headquarters, at one of our other facilities or where a channel partner or supplier is located could have a material adverse impact on our business, operating results and financial condition. In addition, natural disasters and acts of terrorism could cause disruptions in our or our customers’ businesses, national economies or the world economy as a whole. We also rely on IT systems to communicate among our workforce located worldwide and, in particular, our research and development activities that are coordinated between our corporate headquarters in the San Francisco Bay Area and our operations in other states and countries. Any disruption to our internal communications, whether caused by a natural disaster or by man-made problems, such as power disruptions or terrorism, could delay our research and development efforts. To the extent that these disruptions result in delays or cancellations of customer orders or delays in our research and development efforts or the deployment of our products, our business and operating results would be materially and adversely affected.
System security risks, data protection breaches, cyber-attacks and systems integration issues could disrupt our internal operations and effectiveness of our products, and any such disruption could reduce our expected revenue, increase our expenses, damage our reputation and adversely affect our stock price.
Experienced computer programmers and hackers may be able to penetrate our network security and misappropriate or compromise our confidential and proprietary information, create system disruptions or cause shutdowns. Computer programmers and hackers also may be able to develop and deploy viruses, worms, and other malicious software programs that attack our products or otherwise exploit any security vulnerabilities of our products. The costs to us to eliminate or alleviate cyber or other security problems, bugs, viruses, worms, malicious software programs and security vulnerabilities could be significant, and our efforts to address these problems may not be successful, could result in interruptions and delays that could impede our sales, manufacturing, distribution or other critical functions and could cause our products to not perform as intended, which could cause prospective end customers not to purchase such products.
We manage and store various proprietary information and sensitive or confidential data relating to our business in the “cloud.” Breaches of our security measures or the accidental loss, inadvertent disclosure or unapproved dissemination of proprietary information or sensitive or confidential data about us, including the potential loss or disclosure of that information or data as a result of fraud, trickery or other forms of deception, could expose us to a risk of loss or misuse of this information, result in litigation and potential liability for us, damage our brand and reputation or otherwise harm our business. In addition, the cost and operational consequences of implementing further data protection measures could be significant.
34
Portions of our IT infrastructure also may experience interruptions, delays or cessations of service or produce errors in connection with systems integration or migration work that takes place from time to time. We may not be successful in implementing new systems and transitioning data, which could cause business disruptions and be more expensive, time consuming, disruptive and resource-intensive. Any disruptions could adversely impact our ability to fulfill orders and interrupt other processes. Delayed sales, lower margins or lost customers resulting from these disruptions have adversely affected us in the past, and in the future could adversely affect our financial results, stock price and reputation.
Risks Related to Ownership of Our Common Stock
Our actual operating results may differ significantly from our guidance.
From time to time, we have released, and may continue to release guidance in our quarterly earnings releases, quarterly earnings conference call, or otherwise, regarding our future performance that represents our management’s estimates as of the date of release. This guidance, which includes forward-looking statements, has been and will be based on projections prepared by our management. These projections are not prepared with a view toward compliance with published guidelines of the American Institute of Certified Public Accountants, and neither our registered public accountants nor any other independent expert or outside party compiles or examines the projections. Accordingly, no such person expresses any opinion or any other form of assurance with respect to the projections.
Projections are based upon a number of assumptions and estimates that, while presented with numerical specificity, are inherently subject to significant business, economic and competitive uncertainties and contingencies, many of which are beyond our control and are based upon specific assumptions with respect to future business decisions, some of which will change. We intend to state possible outcomes as high and low ranges which are intended to provide a sensitivity analysis as variables are changed but are not intended to imply that actual results could not fall outside of the suggested ranges. The principal reason that we release guidance is to provide a basis for our management to discuss our business outlook with analysts and investors. We do not accept any responsibility for any projections or reports published by any such persons.
Guidance is necessarily speculative in nature, and it can be expected that some or all of the assumptions underlying the guidance furnished by us will not materialize or will vary significantly from actual results. Accordingly, our guidance is only an estimate of what management believes is realizable as of the date of release. Actual results will vary from our guidance and the variations may be material. In light of the foregoing, investors are urged not to rely upon our guidance in making an investment decision regarding our common stock.
Any failure to successfully implement our operating strategy or the occurrence of any of the events or circumstances set forth in this “Risk Factors” section in this annual report could result in the actual operating results being different from our guidance, and the differences may be adverse and material.
The price of our common stock may be volatile, and you could lose all or part of your investment.
In the recent past, stocks generally, and technology stocks in particular, have experienced high levels of volatility. The trading price of our common stock may fluctuate substantially. The trading price of our common stock will depend on a number of factors, including those described in this “Risk Factors” section, many of which are beyond our control and may not be related to our operating performance. These fluctuations could cause you to lose all or part of your investment in our common stock since you might be unable to sell your shares at or above the price you paid. Factors that could cause fluctuations in the trading price of our common stock include the following:
• | price and volume fluctuations in the overall stock market from time to time; |
• | volatility in the market prices and trading volumes of high technology stocks; |
• | changes in operating performance and stock market valuations of other technology companies generally, or those in our industry in particular; |
• | sales of shares of our common stock by us or our stockholders; |
35
• | failure of securities analysts to maintain coverage of us, changes in financial estimates by any securities analysts who follow our company, or our failure to meet these estimates or the expectations of investors; |
• | the financial projections we may provide to the public, any changes in those projections or our failure to meet those projections; |
• | announcements by us or our competitors of new products or new or terminated significant contracts, commercial relationships or capital commitments. |
• | the public's reaction to our press releases, other public announcements and filings with the SEC; |
• | rumors and market speculation involving us or other companies in our industry; |
• | actual or anticipated changes in our results of operations or fluctuations in our operating results; |
• | actual or anticipated developments in our business or our competitors' businesses or the competitive landscape generally; |
• | litigation involving us, our industry or both or investigations by regulators into our operations or those of our competitors; |
• | developments or disputes concerning our intellectual property or other proprietary rights; |
• | announced or completed acquisitions of businesses or technologies by us or our competitors; |
• | new laws or regulations or new interpretations of existing laws or regulations applicable to our business; |
• | changes in accounting standards, policies, guidelines, interpretations or principles; |
• | any major change in our management; |
• | general economic conditions and slow or negative growth of our markets; and |
• | other events or factors, including those resulting from war, incidents of terrorism or responses to these events. |
In addition, the stock market in general, and the market for technology companies in particular, have experienced extreme price and volume fluctuations that have often been unrelated or disproportionate to the operating performance of those companies. Broad market and industry factors may seriously affect the market price of our common stock, regardless of our actual operating performance. In addition, in the past, following periods of volatility in the overall market and the market prices of particular companies’ securities, securities class action litigations have often been instituted against these companies. For example, following the volatility in the trading price of our common stock in fiscal year 2014, class actions were filed beginning in May 2014 against us and two of our officers and a stockholder derivative suit was filed in November 2014 against several of our current directors and one former director. Although the plaintiffs voluntarily dismissed these lawsuits without prejudice, we may be the target of these types of litigation in the future. The outcome of securities class actions and stockholder derivative lawsuits is difficult to predict. Plaintiffs in these matters may seek recovery of very large or indeterminate amounts. The monetary and other impact of these actions may remain unknown for substantial periods of time. Accordingly, litigation of these types against us could result in substantial costs to defend or settle these matters and divert our management’s attention and resources, which could seriously harm our business.
If securities or industry analysts issue an adverse or misleading opinion regarding our stock or do not publish research or reports about our business, our stock price and trading volume could decline.
The trading market for our common stock will rely in part on the research and reports that equity research and other analysts publish about us and our business. We do not control these analysts or the content and opinions included in their reports. The price of our common stock could decline if one or more analysts were to downgrade our common stock or if they were to issue other unfavorable commentary or cease publishing reports about us or our business. If one or more analysts were to cease coverage of our company, we could lose visibility in the market, which in turn could cause our stock price to decline. Further, analysts may elect not to provide research coverage of our common stock, and lack of research coverage would likely adversely affect the market price of our common stock.
36
We do not intend to pay dividends for the foreseeable future.
We have never declared or paid any cash dividends on our capital stock. We intend to retain any earnings to finance the operation and expansion of our business, and we do not anticipate paying any cash dividends in the foreseeable future. As a result, you will likely receive a return on your investment in our common stock only if the market price of our common stock increases.
Our charter documents and Delaware law could discourage, delay or prevent a takeover that stockholders consider favorable and could also reduce the market price of our stock.
Our restated certificate of incorporation and our restated bylaws contain provisions that could delay or prevent a change in control of our company. These provisions could also make it more difficult for stockholders to nominate directors for election to our board of directors and take other corporate actions. These provisions, among other things:
• | provide for non-cumulative voting in the election of directors; |
• | provide for a classified board of directors; |
• | authorize our board of directors, without stockholder approval, to issue preferred stock with terms determined by our board of directors and to issue additional shares of our common stock; |
• | provide that only our board of directors may set the number of directors constituting our board of directors or fill vacant directorships; |
• | provide that stockholders may remove directors only for cause; |
• | prohibit stockholder action by written consent and limit who may call a special meeting of stockholders; and |
• | require advance notification of stockholder nominations for election to our board of directors and of stockholder proposals. |
These and other provisions in our restated certificate of incorporation and our restated bylaws, as well as provisions under Delaware law, could discourage potential takeover attempts, reduce the price that investors might be willing to pay in the future for shares of our common stock and result in the trading price of our common stock being lower than it otherwise would be.
ITEM 1B. | UNRESOLVED STAFF COMMENTS |
None.
37
ITEM 2. | PROPERTIES |
We maintain our principal office, consisting of 127,000 square feet, in Santa Clara, California, under a lease that expires January 31, 2021.
We also lease approximately 15,000 square feet of space for development activities in Annapolis, Maryland under a lease that expires in June 2017. We lease additional facilities for development activities in Canada and France and marketing and sales support offices in Belgium, India, Japan, Netherlands and United Kingdom.
We believe that our existing facilities are adequate to meet our current needs, and we intend to add or change facilities as needs require. We believe that, if required, suitable additional or substitute space would be available to accommodate expansion of our operations.
ITEM 3. | LEGAL PROCEEDINGS |
The information set forth under the heading “Loss Contingencies and Legal Proceedings” in Note 8, Commitments and Contingencies, in the Notes to Consolidated Financial Statements in Item 8 of Part II of this Report, is incorporated herein by reference.
ITEM 4. | MINE SAFETY DISCLOSURES |
Not applicable.
38
PART II
ITEM 5. | MARKET FOR REGISTRANT’S COMMON EQUITY, RELATED STOCKHOLDER MATTERS AND ISSUER PURCHASES OF EQUITY SECURITIES |
Market Information
Our common stock is listed on the NYSE under the trading symbol “BLOX”.
The following table sets forth the high and low per share prices for our common stock as reported on the NYSE:
Fiscal 2015 | Fiscal 2014 | ||||||||||||||
Low | High | Low | High | ||||||||||||
Fourth quarter | $ | 22.95 | $ | 27.94 | $ | 11.91 | $ | 20.58 | |||||||
Third quarter | $ | 18.75 | $ | 25.02 | $ | 17.19 | $ | 33.54 | |||||||
Second quarter | $ | 15.86 | $ | 20.93 | $ | 29.29 | $ | 45.50 | |||||||
First quarter | $ | 11.92 | $ | 16.14 | $ | 31.86 | $ | 48.07 | |||||||
Holders of Common Equity
As of August 31, 2015, there were approximately 180 holders of record of our common stock. As many of our shares of common stock are held by brokers and other institutions on behalf of shareholders, we are unable to estimate the total number of beneficial holders of our common stock represented by these record holders.
Dividend Policy
We have never declared or paid any cash dividends on our capital stock. We currently intend to retain any future earnings and do not expect to pay any cash dividends on our common stock for the foreseeable future. Any determination to pay dividends in the future will be at the discretion of our board of directors and will be dependent on a number of factors, including our earnings, capital requirements and overall financial condition.
39
Performance Measurement Comparison of Shareholder Return
The following graph shows a quarterly comparison from fiscal year 2013 through fiscal year 2015 of the cumulative total return assuming an investment of $100 on July 31, 2012, in our common stock (and the reinvestment of dividends), in each of the NYSE Composite Index and the NYSE Technology, Media and Communications (NYSE TMT) Index. Such returns are based on historical results and are not indicative of, or intended to forecast, future performance of our common stock.
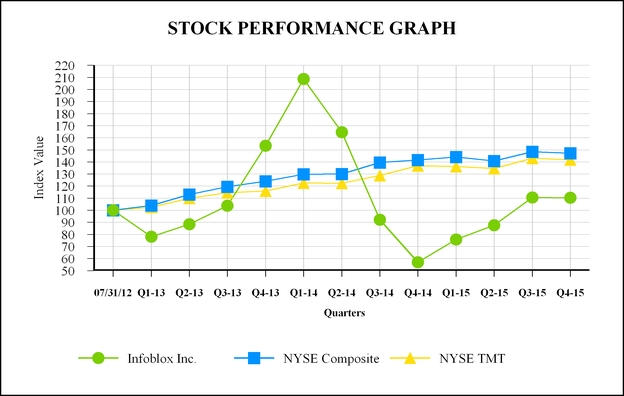
Q1-13 | Q1-13 | Q2-13 | Q3-13 | Q4-13 | Q1-14 | Q2-14 | Q3-14 | Q4-14 | Q1-15 | Q2-15 | Q3-15 | Q4-15 | |||||||||||||||||||||||||||
Infoblox Inc. | $ | 100.00 | $ | 77.98 | $ | 88.50 | $ | 103.80 | $ | 153.52 | $ | 208.69 | $ | 164.69 | $ | 92.11 | $ | 56.90 | $ | 75.77 | $ | 87.65 | $ | 110.61 | $ | 110.33 | |||||||||||||
NYSE Composite | $ | 100.00 | $ | 103.95 | $ | 113.03 | $ | 119.47 | $ | 123.94 | $ | 129.85 | $ | 129.99 | $ | 139.46 | $ | 141.71 | 144..07 | $ | 140.74 | $ | 148.52 | $ | 147.20 | ||||||||||||||
NYSE TMT | $ | 100.00 | $ | 102.60 | $ | 109.95 | $ | 114.48 | $ | 115.91 | $ | 122.63 | $ | 122.37 | $ | 128.81 | $ | 136.76 | $ | 136.20 | $ | 134.55 | $ | 143.09 | $ | 141.92 | |||||||||||||
The information on the above graph shall not be deemed to be “filed” for purposes of Section 18 of the Securities Exchange Act of 1934, as amended, or otherwise subject to the liabilities of that section or Sections 11 and 12(a)(2) of the Securities Act of 1933, as amended, and shall not be incorporated by reference into any registration statement or other document filed by us with the SEC, whether made before or after the date of this Report, regardless of any general incorporation language in such filing, except as shall be expressly set forth by specific reference in such filing.
Purchases of Equity Securities by the Issuer and Affiliated Purchasers
No shares of our common stock were repurchased during the fourth quarter of 2015.
40
ITEM 6. | SELECTED FINANCIAL DATA |
The following selected consolidated financial data should be read in conjunction with Item 7, “Management's Discussion and Analysis of Financial Condition and Results of Operations,” and the Consolidated Financial Statements and the notes thereto in Item 8, “Financial Statements and Supplementary Data,” of this Report, which are incorporated herein by reference.
The information presented below reflects the impact of certain significant transactions, which makes a direct comparison difficult between each of the last five fiscal years. For a complete description of matters affecting the results in the tables below during the three years ended July 31, 2015, see “Notes to Consolidated Financial Statements” in Item 8 of Part II of this Report.
Consolidated Statements of Operations Data
Year Ended July 31, | |||||||||||||||||||
2015 (1) | 2014 (2) | 2013 (3) | 2012 (4) | 2011 (5) | |||||||||||||||
(In thousands, except per-share amounts) | |||||||||||||||||||
Net revenue | $ | 306,125 | $ | 250,340 | $ | 225,044 | $ | 169,246 | $ | 132,835 | |||||||||
Cost of revenue | $ | 67,131 | $ | 55,798 | $ | 48,253 | $ | 37,120 | $ | 28,839 | |||||||||
Gross profit | $ | 238,994 | $ | 194,542 | $ | 176,791 | $ | 132,126 | $ | 103,996 | |||||||||
Operating expenses | $ | 264,419 | $ | 217,522 | $ | 179,929 | $ | 138,646 | $ | 107,826 | |||||||||
Loss from operations | $ | (25,425 | ) | $ | (22,980 | ) | $ | (3,138 | ) | $ | (6,520 | ) | $ | (3,830 | ) | ||||
Loss before provision for income taxes | $ | (26,076 | ) | $ | (22,998 | ) | $ | (3,756 | ) | $ | (7,466 | ) | $ | (4,520 | ) | ||||
Provision for income taxes | $ | 1,007 | $ | 919 | $ | 650 | $ | 744 | $ | 802 | |||||||||
Net loss | $ | (27,083 | ) | $ | (23,917 | ) | $ | (4,406 | ) | $ | (8,210 | ) | $ | (5,322 | ) | ||||
Net loss per share - basic and diluted (6): | $ | (0.48 | ) | $ | (0.45 | ) | $ | (0.09 | ) | $ | (0.40 | ) | $ | (0.54 | ) | ||||
Weighted-average shares used in computing net loss per-share - basic and diluted (6): | 56,626 | 53,581 | 48,494 | 20,563 | 9,933 | ||||||||||||||
(1) Includes certain significant pre-tax items, such as stock-based compensation of $47.6 million, and intangible asset amortization expense of $2.2 million.
(2) Includes certain significant pre-tax items, such as stock-based compensation of $41.0 million, and intangible asset amortization expense of $2.4 million.
(3) Includes certain significant pre-tax items, such as stock-based compensation of $22.1 million, and intangible asset amortization expense of $2.3 million.
(4) Includes certain significant pre-tax items, such as stock-based compensation of $10.7 million, and intangible asset amortization expense of $2.9 million.
(5) Includes certain significant pre-tax items, such as stock-based compensation of $5.1 million, and intangible asset amortization expense of $3.3 million.
(6) Please see Note 2 of the Notes to Consolidated Financial Statements in Item 8 of Part II of this Annual Report on Form 10-K for the explanation of the calculations of our basic and diluted net loss per share.
Consolidated Balance Sheet Data
As of July 31 | ||||||||||||||||||||
2015 | 2014 | 2013 | 2012 | 2011 | ||||||||||||||||
(In thousands) | ||||||||||||||||||||
Cash and cash equivalents | $ | 103,124 | $ | 78,535 | $ | 69,828 | $ | 156,613 | $ | 42,207 | ||||||||||
Short-term investments | $ | 227,712 | $ | 191,316 | $ | 139,508 | $ | — | $ | — | ||||||||||
Working capital | $ | 258,567 | $ | 209,313 | $ | 166,581 | $ | 113,642 | $ | 9,256 | ||||||||||
Total assets | $ | 459,267 | $ | 380,568 | $ | 320,460 | $ | 242,983 | $ | 120,017 | ||||||||||
Deferred revenue, net - current and long-term | $ | 136,847 | $ | 116,113 | $ | 98,172 | $ | 76,667 | $ | 61,999 | ||||||||||
Convertible preferred stock | $ | — | $ | — | $ | — | $ | — | $ | 107,506 | ||||||||||
Stockholders’ equity (deficit) | $ | 275,152 | $ | 229,296 | $ | 189,553 | $ | 142,075 | $ | (69,032 | ) | |||||||||
41
ITEM 7. | MANAGEMENT’S DISCUSSION AND ANALYSIS OF FINANCIAL CONDITION AND RESULTS OF OPERATIONS |
This Annual Report on Form 10-K, including the “Management's Discussion and Analysis of Financial Condition and Results of Operations,” contains forward-looking statements regarding future events and our future results that are based on our current expectations, estimates, forecasts, and projections about our business, our results of operations, the industry in which we operate and the beliefs and assumptions of our management. Words such as “expects,” “anticipates,” “targets,” “goals,” “projects,” “would,” “could,” “intends,” “plans,” “believes,” “seeks” and “estimates,” variations of these words, and similar expressions are intended to identify those forward-looking statements. These forward-looking statements are only predictions and are subject to risks, uncertainties and assumptions that are difficult to predict. Therefore, actual results may differ materially and adversely from those expressed in any forward-looking statements. Factors that might cause or contribute to such differences include, but are not limited to, those discussed in this Report under the section entitled “Risk Factors” in Item 1A of Part I and elsewhere herein, and in other reports we file with the SEC. While forward-looking statements are based on reasonable expectations of our management at the time that they are made, you should not rely on them. We undertake no obligation to revise or update publicly any forward-looking statements for any reason, whether as a result of new information, future events or otherwise, except as may be required by law.
The following discussion is based upon our Consolidated Financial Statements included elsewhere in this Report, which have been prepared in accordance with U.S. GAAP. In the course of operating our business, we routinely make decisions as to the timing of the payment of invoices, the collection of receivables, the manufacturing and shipment of products, the fulfillment of orders, the purchase of supplies, and the building of inventory and spare parts, among other matters. Each of these decisions has some impact on the financial results for any given period. In making these decisions, we consider various factors including contractual obligations, customer satisfaction, competition, internal and external financial targets and expectations, and financial planning objectives. The preparation of these financial statements requires us to make estimates and judgments that affect the reported amounts of assets, liabilities, revenues, expenses, and related disclosure of contingencies. On an ongoing basis, we evaluate our estimates, including those related to sales returns, pricing credits, warranty costs, allowance for doubtful accounts, impairment of long-term assets, especially goodwill and intangible assets, contract manufacturer exposures for carrying and obsolete material charges, assumptions used in the valuation of stock-based compensation, and litigation. We base our estimates on historical experience and on various other assumptions that we believe to be reasonable under the circumstances, the results of which form the basis for making judgments about the carrying values of assets and liabilities that are not readily apparent from other sources. For further information about our critical accounting policies and estimates, see Note 1, Description of the Business and Summary of Significant Accounting Policies, in the Notes to Consolidated Financial Statements in Item 8 of Part II of this Report, and our “Critical Accounting Policies and Estimates” section included in this “Management's Discussion and Analysis of Financial Condition and Results of Operations.” Actual results may differ from these estimates under different assumptions or conditions.
42
Business Overview
Infoblox Inc. (together with its subsidiaries, “we” or “our”) is a leader in network control, network automation and domain name system (DNS) security through appliance-based solutions that enable and secure dynamic networks and next-generation data centers. Our solutions combine real-time IP address management, automation of key network control, change and configuration management processes and DNS based infrastructure security in purpose-built physical and virtual appliances. It is based on our proprietary software that is highly scalable and automates vital network functions, such as IP address management, device configuration, compliance, network discovery, policy implementation, security and monitoring. In addition, our solutions use our real-time distributed network database to provide “always-on” access to network control data through a scalable, redundant and reliable architecture.
We derive revenue from sales and licensing of our products and sales of our services. We generate product licenses revenue primarily from sales of perpetual licenses of our software installed on our physical appliances and from sales of perpetual licenses of our software that run on third party virtual appliances. We generate services revenue primarily from sales of maintenance and support and, to a lesser extent, from sales of subscription services and training and consulting services. End customers typically purchase maintenance and support in conjunction with purchases of our products, and generally renew their maintenance and support contracts upon expiration. Maintenance and support provide a significant source of recurring revenue for us. In 2015, 2014 and 2013, services revenue was 48.9%, 47.9% and 43.0% of our net revenue in the respective years.
We sell our products and services to enterprises and government entities primarily through our channel partners, including distributors, systems integrators, managed service providers and value-added resellers in the United States and internationally. We also have a direct field sales force that sells our solutions directly to certain end customers, and typically works closely with our channel partners in all phases of initial sales of our products and services.
Our results of operations have benefited from the increasing complexity of networks, including increasing numbers of connected devices and applications, expanding use of technologies such as virtualization, cloud computing and adoption of IPv6, which we believe is straining legacy network control approaches and driving organizations to replace their legacy platforms with more automated solutions. In addition, we believe the cyber-threat landscape and new attacks on DNS and exfiltration of data via DNS have created a significant security opportunity and a greater need for our products. Accordingly, we expect that our future business and operating results will be significantly affected by the speed with which organizations transition to network control solutions. Our future business and operating results will depend both on our ability to add new end customers continually and to continue to sell additional products and services to our growing base of existing customers directly and through our channel partners. Since our prior results have benefitted from our success at selling more complex and higher performance configurations of our product solutions, which generally result in higher value per product sold, we expect that our ability to sell more robust product configurations will be an important factor in sustaining our revenue growth rates and our operating results in any quarter. To achieve these growth objectives, we intend to continue to invest for long-term growth by, among other things, expanding our field sales force, our channel and technology partnerships and our programs to market our solutions. In addition, we expect to continue to invest in research and development and selective acquisitions in order to expand the capabilities of our solutions. We expect that our operating results will be impacted by the timing and size of these investments over the next few quarters.
43
Financial Highlights
We saw continued year-over-year growth in total net revenue. We had total net revenue of $306.1 million in fiscal year 2015, an increase of 22.3% compared to prior year. Products and licenses net revenue during fiscal year 2015 was $156.5 million, an increase of 20.1% compared to prior year. Services revenue during fiscal year 2015 was $149.6 million, which increased by 24.7% compared to prior year. Americas and EMEA revenue during fiscal year 2015 grew by 25.0% and 26.0% compared to prior year, while APAC revenue was flat year-over-year.
During fiscal year 2015, we generated $48.0 million in cash flows from operating activities and exited the year with $330.8 million in cash, cash equivalents and short term investments and $136.8 million of total deferred net revenue.
We continued to invest in our organization to achieve our profitability goals, incurring additional expenses to expand our sales, support, marketing, development, and general and administrative capabilities to grow our business. Personnel-related costs, including stock-based compensation, are the most significant component of our operating expenses. During fiscal year 2015, total operating expenses increased by 21.6% compared to prior year. As of July 31, 2015, our employee count was 772 representing an increase of 11.7% from July 31, 2014 and was the most significant driver of the increase in costs and operating expenses.
Stock-based compensation expense amounted to $47.6 million, $41.0 million and $22.1 million during fiscal years 2015, 2014 and 2013. We expect to continue to incur significant stock-based compensation expense and anticipate further growth in stock-based compensation expense as our employee base grows because we expect stock-based compensation to continue to play an important part in the overall compensation structure for our employees.
Key Metrics of Our Business
We monitor a variety of key financial metrics to help us evaluate growth trends, establish budgets, measure the effectiveness of our sales and marketing efforts and assess operational efficiencies. These key financial metrics include the following:
Year Ended July 31, | ||||||||||||
2015 | 2014 | 2013 | ||||||||||
(Dollars in thousands) | ||||||||||||
Net revenue | $ | 306,125 | $ | 250,340 | $ | 225,044 | ||||||
Deferred revenue, net (end of year) | $ | 136,847 | $ | 116,113 | $ | 98,172 | ||||||
Change in deferred revenue, net | $ | 20,734 | $ | 17,941 | $ | 21,505 | ||||||
Gross margin | 78.1 | % | 77.7 | % | 78.6 | % | ||||||
Loss from operations | $ | (25,425 | ) | $ | (22,980 | ) | $ | (3,138 | ) | |||
Operating margin | (8.3 | %) | (9.2 | %) | (1.4 | %) | ||||||
Net cash provided by operating activities | $ | 48,011 | $ | 46,308 | $ | 39,614 | ||||||
Net Revenue. We monitor our net revenue to assess the acceptance of our products by our end customers and our growth in the markets we serve. We discuss our net revenue further below under “—Results of Operations.”
Deferred Revenue, Net. Our deferred revenue, net consists of amounts that have been invoiced but that have not yet been recognized as revenue, less the related cost of revenue. The majority of our deferred revenue balance consists of the unamortized portion of services revenue from maintenance and support contracts. We also generally defer revenue on sales of products to a distributor until that distributor reports to us that it has sold the product to an end customer. We monitor our deferred revenue balance because it represents a significant portion of the revenue that we will recognize in future periods. We also assess the change in our deferred revenue balance, which taken together with net revenue is an indication of sales activity in a given period.
44
Gross Margin. We monitor our gross margin to assess the impact on our current and forecasted financial results of any changes to the pricing and mix of products that we are selling to our end customers. We discuss our gross margin further below under “—Results of Operations.”
Income (Loss) From Operations and Operating Margin. We monitor our income (loss) from operations and operating margin to assess how effectively we are conducting our operations as well as controlling our operating expenses, which are primarily driven by headcount. We discuss our operating expenses further below under “—Results of Operations.”
Net Cash Provided By Operating Activities. We monitor cash flow provided by operations as a measure of our overall business performance. Our cash provided by operating activities is driven primarily by sales of our products and licenses and, to a lesser extent, by up-front payments from end customers under maintenance and support contracts. Our primary uses of cash in operating activities are for personnel-related expenditures, costs of acquiring the hardware for our appliances, marketing and promotional expenses and costs related to our facilities. Monitoring cash provided by operating activities enables us to analyze our financial performance without the effects of certain non-cash items such as depreciation and amortization and stock-based compensation, thereby allowing us to better understand and manage the cash needs of our business. We discuss the components of cash provided by operating activities further below under “—Liquidity and Capital Resources.”
Non-GAAP Financial Measures
To supplement our consolidated financial statements presented in accordance with GAAP, we consider certain financial measures that are not prepared in accordance with GAAP, including non-GAAP gross profit and gross margin, non-GAAP income from operations and operating margin and non-GAAP net income and non-GAAP diluted net income per share. These non-GAAP financial measures are not based on any standardized methodology prescribed by GAAP and are not necessarily comparable to similar measures presented by other companies.
Our non-GAAP financial measures are described as follows:
Non-GAAP gross profit and gross margin. Non-GAAP gross profit is gross profit as reported on our consolidated statements of operations, excluding the impact of stock-based compensation and intangible asset amortization expense. Non-GAAP gross margin is non-GAAP gross profit divided by net revenue.
Non-GAAP income from operations and operating margin. Non-GAAP income from operations is income (loss) from operations as reported on our consolidated statements of operations, excluding the impact of stock-based compensation, intangible asset amortization expense and acquisition related expenses. Non-GAAP operating margin is non-GAAP operating income divided by net revenue.
Non-GAAP net income and earnings per share ("EPS"). Non-GAAP net income is net income (loss) as reported on our consolidated statements of operations, excluding the impact of stock-based compensation, intangible asset amortization expense and acquisition related expenses with income taxes adjusted to reflect our estimated long-term effective tax rate on a non-GAAP basis. Non-GAAP EPS is non-GAAP net income divided by non-GAAP diluted weighted average shares outstanding.
45
The following table reconciles GAAP gross profit and margin and GAAP income (loss) from operations and operating margin as reported on our consolidated statements of operations to non-GAAP gross profit and margin and non-GAAP income from operations and operating margin.
Year Ended July 31, | ||||||||||||
2015 | 2014 | 2013 | ||||||||||
(Dollars in thousands) | ||||||||||||
Gross Profit Reconciliation: | ||||||||||||
GAAP gross profit | $ | 238,994 | $ | 194,542 | $ | 176,791 | ||||||
Stock-based compensation | 4,450 | 3,619 | 1,606 | |||||||||
Intangible asset amortization expense | 1,160 | 1,110 | 1,015 | |||||||||
Non-GAAP gross profit | $ | 244,604 | $ | 199,271 | $ | 179,412 | ||||||
Gross Margin Reconciliation: | ||||||||||||
GAAP gross margin | 78.1 | % | 77.7 | % | 78.6 | % | ||||||
Stock-based compensation | 1.5 | 1.4 | 0.7 | |||||||||
Intangible asset amortization expense | 0.4 | 0.4 | 0.4 | |||||||||
Non-GAAP gross margin | 80.0 | % | 79.5 | % | 79.7 | % | ||||||
Income from Operations Reconciliation: | ||||||||||||
GAAP loss from operations | $ | (25,425 | ) | $ | (22,980 | ) | $ | (3,138 | ) | |||
Stock-based compensation | 47,623 | 40,971 | 22,064 | |||||||||
Amortization of intangible assets | 2,173 | 2,418 | 2,323 | |||||||||
Non-GAAP income from operations | $ | 24,371 | $ | 20,409 | $ | 21,249 | ||||||
Operating Margin Reconciliation: | ||||||||||||
GAAP operating margin | (8.3 | )% | (9.2 | %) | (1.4 | %) | ||||||
Stock based compensation | 15.6 | 16.4 | 9.8 | |||||||||
Intangible asset amortization expense | 0.7 | 0.9 | 1.0 | |||||||||
Non-GAAP operating margin | 8.0 | % | 8.1 | % | 9.4 | % | ||||||
46
The following table reconciles GAAP net loss and weighted-average shares outstanding used in calculating GAAP net loss per share to non-GAAP net income and weighted-average shares outstanding used in calculating non-GAAP diluted EPS.
Year Ended July 31, | ||||||||||||
2015 | 2014 | 2013 | ||||||||||
(In thousands, except per share amounts) | ||||||||||||
Net Income Reconciliation: | ||||||||||||
GAAP net loss | $ | (27,083 | ) | $ | (23,917 | ) | $ | (4,406 | ) | |||
Stock-based compensation | 47,623 | 40,971 | 22,064 | |||||||||
Intangible asset amortization expense | 2,173 | 2,418 | 2,323 | |||||||||
Non-GAAP net income | $ | 22,713 | $ | 19,472 | $ | 19,981 | ||||||
Non-GAAP EPS | $ | 0.38 | $ | 0.34 | $ | 0.37 | ||||||
Shares used in Calculating non-GAAP Diluted Net Income per Share Reconciliation: | ||||||||||||
Weighted-average shares outstanding used in calculating GAAP diluted net loss per share | 56,626 | 53,581 | 48,494 | |||||||||
Additional dilutive securities for non-GAAP income | 2,657 | 4,057 | 5,477 | |||||||||
Weighted-average shares outstanding used in calculating non-GAAP EPS | 59,283 | 57,638 | 53,971 | |||||||||
We use these non-GAAP financial measures internally in analyzing our financial results and believe they are useful to investors, as a supplement to GAAP measures, in evaluating our ongoing operational performance and enhancing an overall understanding of our past financial performance, as they help illustrate underlying trends in our business that could otherwise be masked by the effect of the expenses that we exclude in these non-GAAP financial measures. Furthermore, we use these measures to establish budgets and operational goals for managing our business and evaluating our performance. We also believe that these non-GAAP financial measures provide an additional tool for investors to use in comparing our recurring core business operating results over multiple periods with other companies in our industry, many of which present similar non-GAAP financial measures to investors.
These non-GAAP financial measures should not be considered in isolation from, or as a substitute for, financial information prepared in accordance with GAAP. There are a number of limitations related to the use of these non-GAAP financial measures rather than the nearest GAAP equivalent of these financial measures. First, these non-GAAP financial measures exclude certain recurring, non-cash charges such as stock-based compensation and intangible asset amortization expense. Stock-based compensation has been, and will continue to be for the foreseeable future, a significant recurring expense in our business and is an important part of our employees’ compensation that affects their performance. Second, the expenses that we exclude in our calculation of these non-GAAP financial measures may differ from the expenses, if any, that our peer companies may exclude when they report their results of operations. We compensate for these limitations by providing the nearest GAAP equivalents of these non-GAAP financial measures and describing these GAAP equivalents under “—Results of Operations” below.
47
Basis of Presentation
Net Revenue
We derive our net revenue from sales and licensing of our products and sales of our services. Our net revenue is comprised of the following:
Products and Licenses Revenue. We generate products and licenses revenue primarily from sales of perpetual licenses of our software installed on our physical appliances and from sales of perpetual licenses of our software that run on third party appliances. As a percentage of net revenue, we expect our products and licenses revenue may vary from quarter to quarter based on, among other things, the timing of orders and delivery of products, seasonal and cyclical factors and the impact of significant transactions with unique terms and conditions that may require deferral of revenue. In addition, a significant portion of our product sales is to distributors where revenue recognition is generally determined upon their sell-through to resellers or, if there is no reseller, end customers.
Services Revenue. We generate services revenue primarily from sales of maintenance and support and, to a lesser extent, from sales of subscription services and training and consulting services. We generate maintenance and support revenue from sales of technical support services contracts, which are bundled with sales of appliances and add-on software modules, and subsequent renewals of those contracts. We offer maintenance and support services under renewable, fee-based contracts, which include 24-hour technical support, hardware repair and replacement parts, bug fixes, patches and unspecified upgrades on a when-and-if-available basis. We recognize maintenance and support and subscription revenue over the duration of the contract; as a result, the impact on services revenue will lag any shift in products and licenses revenue. Subscription revenue consists of fees that we earn from services provided in connection with our security products. Training revenue consists of fees that we earn from training end customers and channel partners on the use of our products. Consulting revenue consists of fees that we earn related to installation, implementation, data migration and other services we provide to our end customers in conjunction with the deployment of our products. In absolute dollars, we expect our services revenue to increase as we renew existing maintenance and support contracts and expand our end customer base.
Cost of Revenue
Our cost of revenue is comprised of the following:
Cost of Products and Licenses Revenue. Cost of products and licenses revenue is comprised primarily of the cost of third-party hardware manufacturing services. Our cost of products and licenses revenue also includes personnel costs, shipping costs, an allocated portion of facility and IT costs, royalty fees, intangible asset amortization expense and warranty expenses. Cost of products and licenses revenue as a percentage of net revenue has been and will continue to be affected by a variety of factors, including the sales prices of our products, manufacturing costs, the mix of products sold and any excess inventory write-offs. We expect our product gross margin in fiscal year 2016 to be relatively flat compared to fiscal year 2015.
Cost of Services Revenue. Cost of services revenue is comprised primarily of personnel costs for our technical support, training and consulting teams. Cost of services revenue also includes the costs of refurbished inventory used to provide hardware replacements to end customers under maintenance and support contracts and an allocated portion of facility and IT costs. We expect cost of services revenue to increase in absolute dollars as we increase our headcount in order to support our growing end customer base.
48
Operating Expenses
Our operating expenses consist of research and development, sales and marketing and general and administrative expenses. The largest component of our operating expenses is personnel costs. Personnel costs consist of wages, benefits, bonuses, and, with respect to sales and marketing expenses, sales commissions. Personnel costs also include stock-based compensation and travel expenses. We expect personnel costs to continue to increase in absolute dollars as we hire new employees to continue to grow our business globally and due to the increase in stock-based compensation as a result of new employee grants. We also expect our operating expenses to increase in absolute dollars.
Research and Development Expenses. Our research and development efforts are focused on maintaining and developing additional functionality for our existing products and on new product development. A majority of our research and development expenses are comprised of personnel costs, with the remainder being third-party engineering and development support costs, an allocated portion of facility and IT costs and depreciation. We expense research and development costs as incurred. We expect our research and development expenses to increase in absolute dollars as we continue to enhance our existing products and develop new products.
Sales and Marketing Expenses. Sales and marketing expenses are the largest component of our operating expenses and consist primarily of personnel costs, including commissions and travel expenses. Sales and marketing expenses also include costs related to marketing and promotional activities, with the remainder being an allocated portion of facility and IT costs and depreciation and intangible asset amortization expense. We expect our sales and marketing expenses to increase in absolute dollars as we expand our sales and marketing efforts worldwide and expand our marketing programs and relationships with current and future channel partners and end customers.
General and Administrative Expenses. General and administrative expenses consist primarily of personnel costs and, to a lesser extent, professional fees, board of director's fees and directors and officers insurance, an allocated portion of facility and IT costs and depreciation. General and administrative personnel costs include those for our executive, finance, IT, human resources and legal functions. Our professional fees consist primarily of accounting, external legal and IT and other consulting costs. We expect our general and administrative expenses to increase in absolute dollars to support our growing infrastructure needs as we continue to expand our business.
Other Expense, Net
Other expense, net is comprised of the following items:
Interest Income, Net. Interest income, net consists primarily of interest income earned on our cash, cash equivalents and available-for-sale investments. It also includes amortization of premiums and accretion of discount related to our available-for-sale investments. Interest income varies each reporting period based on our average balance of cash, cash equivalents and available-for-sale investments during the period and market interest rates.
Other Expense, Net. Other expense, net consists primarily of foreign currency exchange gains and losses. Our foreign currency exchange gains and losses relate to transactions and monetary asset and liability balances denominated in currencies other than the U.S. dollar. We expect our foreign currency gains and losses to continue to fluctuate in the future due to changes in foreign currency exchange rates.
49
Provision for Income Taxes
We operate in a number of tax jurisdictions and are subject to taxes in each country or jurisdiction in which we conduct business. Earnings from our non-U.S. activities are subject to local country income tax and may be subject to U.S. income tax. Our tax expense to date is primarily comprised of current state taxes and foreign income taxes.
We recognize deferred tax assets and liabilities for the expected tax consequences of temporary differences between the tax bases of assets and liabilities and their reported amounts using enacted tax rates in effect for the year in which we expect the differences to reverse. We record a valuation allowance to reduce the deferred tax assets to the amount that we are more-likely-than-not to realize.
U.S. tax has not been provided for certain undistributed foreign earnings because we plan to reinvest those earnings indefinitely outside the United States.
RESULTS OF OPERATIONS
The following tables provide consolidated statements of operations data in dollars and as a percentage of our net revenue. We have derived the data for our years ended July 31, 2015, 2014 and 2013 from our audited consolidated financial statements and related notes included elsewhere in this report.
Consolidated Statements of Operations Data: | |||||||||||
Year Ended July 31, | |||||||||||
2015 | 2014 | 2013 | |||||||||
(In thousands) | |||||||||||
Net revenue: | |||||||||||
Products and licenses | $ | 156,510 | $ | 130,348 | $ | 128,203 | |||||
Services | 149,615 | 119,992 | 96,841 | ||||||||
Total net revenue | 306,125 | 250,340 | 225,044 | ||||||||
Cost of revenue (1): | |||||||||||
Products and licenses (2) | 35,362 | 29,327 | 29,228 | ||||||||
Services | 31,769 | 26,471 | 19,025 | ||||||||
Total cost of revenue | 67,131 | 55,798 | 48,253 | ||||||||
Gross profit | 238,994 | 194,542 | 176,791 | ||||||||
Operating expenses: | |||||||||||
Research and development (1) | 65,092 | 49,289 | 43,056 | ||||||||
Sales and marketing (1)(2) | 162,217 | 138,612 | 112,385 | ||||||||
General and administrative (1) | 37,110 | 29,621 | 24,488 | ||||||||
Total operating expenses | 264,419 | 217,522 | 179,929 | ||||||||
Loss from operations | (25,425 | ) | (22,980 | ) | (3,138 | ) | |||||
Other expense, net | (651 | ) | (18 | ) | (618 | ) | |||||
Loss before provision for income taxes | (26,076 | ) | (22,998 | ) | (3,756 | ) | |||||
Provision for income taxes | 1,007 | 919 | 650 | ||||||||
Net loss | $ | (27,083 | ) | $ | (23,917 | ) | $ | (4,406 | ) | ||
50
Consolidated Statements of Operations Data: | ||||||||
Year Ended July 31, | ||||||||
2015 | 2014 | 2013 | ||||||
(As a % of net revenue) | ||||||||
Net revenue: | ||||||||
Products and licenses | 51.1 | % | 52.1 | % | 57.0 | % | ||
Services | 48.9 | 47.9 | 43.0 | |||||
Total net revenue | 100.0 | 100.0 | 100.0 | |||||
Cost of revenue (1): | ||||||||
Products and licenses (2) | 11.5 | 11.7 | 13.0 | |||||
Services | 10.4 | 10.6 | 8.4 | |||||
Total cost of revenue | 21.9 | 22.3 | 21.4 | |||||
Gross profit | 78.1 | 77.7 | 78.6 | |||||
Operating expenses: | ||||||||
Research and development (1) | 21.3 | 19.7 | 19.1 | |||||
Sales and marketing (1)(2) | 53.0 | 55.4 | 50.0 | |||||
General and administrative (1) | 12.1 | 11.8 | 10.9 | |||||
Total operating expenses | 86.4 | 86.9 | 80.0 | |||||
Loss from operations | (8.3 | ) | (9.2 | ) | (1.4 | ) | ||
Other expense, net | (0.2 | ) | — | (0.3 | ) | |||
Loss before provision for income taxes | (8.5 | ) | (9.2 | ) | (1.7 | ) | ||
Provision for income taxes | 0.3 | 0.4 | 0.3 | |||||
Net loss | (8.8 | %) | (9.6 | %) | (2.0 | %) | ||
(1) Results above include stock-based compensation as follows:
Year Ended July 31, | |||||||||||
2015 | 2014 | 2013 | |||||||||
(In thousands) | |||||||||||
Cost of revenue | $ | 4,450 | $ | 3,619 | $ | 1,606 | |||||
Research and development | 10,828 | 7,375 | 4,659 | ||||||||
Sales and marketing | 23,687 | 22,919 | 11,721 | ||||||||
General and administrative | 8,658 | 7,058 | 4,078 | ||||||||
Total stock-based compensation | $ | 47,623 | $ | 40,971 | $ | 22,064 | |||||
(2) Results above include intangible asset amortization expense as follows:
Year Ended July 31, | |||||||||||
2015 | 2014 | 2013 | |||||||||
(In thousands) | |||||||||||
Cost of products and licenses revenue | $ | 1,160 | $ | 1,110 | $ | 1,015 | |||||
Sales and marketing | 1,013 | 1,308 | 1,308 | ||||||||
Total intangible asset amortization expense | $ | 2,173 | $ | 2,418 | $ | 2,323 | |||||
51
Results of Operations for the Years Ended July 31, 2015, 2014 and 2013
Net Revenue
The following table presents our net revenue for the years indicated and related changes from the prior years:
Year Ended July 31, | Change in | Year Ended July 31, | Change in | ||||||||||||||||||||||||||
2015 | 2014 | $ | % | 2014 | 2013 | $ | % | ||||||||||||||||||||||
(Dollars in thousands) | |||||||||||||||||||||||||||||
Products and licenses | $ | 156,510 | $ | 130,348 | $ | 26,162 | 20.1 | % | $ | 130,348 | $ | 128,203 | $ | 2,145 | 1.7 | % | |||||||||||||
Services | 149,615 | 119,992 | 29,623 | 24.7 | % | 119,992 | 96,841 | 23,151 | 23.9 | % | |||||||||||||||||||
Total net revenue | $ | 306,125 | $ | 250,340 | $ | 55,785 | 22.3 | % | $ | 250,340 | $ | 225,044 | $ | 25,296 | 11.2 | % | |||||||||||||
2015 Compared to 2014. Our net revenue increased by $55.8 million, or 22.3%, to $306.1 million in fiscal year 2015 from $250.3 million in in fiscal year 2014.
Products and licenses revenue increased by $26.2 million, or 20.1%, to $156.5 million in fiscal year 2015 from $130.3 million in fiscal year 2014 primarily due to increases in unit sales driven by sales of products to replace older generations of products and sales of our security solutions.
Services revenue increased by $29.6 million, or 24.7%, to $149.6 million in fiscal year 2015 from $120.0 million in fiscal year 2014. The change was primarily attributable to the growth of our established base of customers with maintenance and support contracts for which revenue is recognized ratably over the service period, and to a lesser extent an increase in subscription revenue.
2014 Compared to 2013. Our net revenue increased by $25.3 million, or 11.2%, to $250.3 million in fiscal year 2014 from $225.0 million in fiscal year 2013.
Products and licenses revenue slightly increased by $2.1 million, or 1.7%, to $130.3 million in fiscal year 2014 from $128.2 million in fiscal year 2013.
Services revenue increased by $23.2 million, or 23.9%, to $120.0 million in fiscal year 2014 from $96.8 million in fiscal year 2013. The change was primarily attributable to the growth of our established base of end customers with maintenance and support contracts that are amortized over the service period. Since end customers that purchase our products typically purchase maintenance and support contracts, which they may elect to renew in subsequent years, we expect our revenue generated from maintenance and support services to increase as our end customer base grows.
52
Gross Profit
Year Ended July 31, | Change in | Year Ended July 31, | Change in | |||||||||||||||||||||||||||
2015 | 2014 | $ | % | 2014 | 2013 | $ | % | |||||||||||||||||||||||
(Dollars in thousands) | ||||||||||||||||||||||||||||||
Products and licenses gross profit | $ | 121,148 | $ | 101,021 | $ | 20,127 | $ | 101,021 | $ | 98,975 | $ | 2,046 | ||||||||||||||||||
Products and licenses gross margin | 77.4 | % | 77.5 | % | (0.1 | ) | 77.5 | % | 77.2 | % | 0.3 | |||||||||||||||||||
Services gross profit | $ | 117,846 | $ | 93,521 | $ | 24,325 | $ | 93,521 | $ | 77,816 | $ | 15,705 | ||||||||||||||||||
Services gross margin | 78.8 | % | 77.9 | % | 0.9 | 77.9 | % | 80.4 | % | (2.5 | ) | |||||||||||||||||||
Total gross profit | $ | 238,994 | $ | 194,542 | $ | 44,452 | $ | 194,542 | $ | 176,791 | $ | 17,751 | ||||||||||||||||||
Total gross margin | 78.1 | % | 77.7 | % | 0.4 | 77.7 | % | 78.6 | % | (0.9 | ) | |||||||||||||||||||
2015 Compared to 2014. Total gross margin increased by 0.4 percentage point to 78.1% in fiscal year 2015 from 77.7% in fiscal year 2014, which was primarily driven by the increase in our services gross margin. Products and licenses gross margin in fiscal year 2015 was relatively consistent compared to fiscal year 2014 due to consistency in our product material and manufacturing costs. Services gross margin increased by 0.9 percentage point from 77.9% in fiscal year 2014 to 78.8% in fiscal year 2015. The change was principally the result of services revenue growing at a faster rate than personnel costs.
2014 Compared to 2013. Total gross margin decreased by 0.9 percentage point to 77.7% in fiscal year 2014 from 78.6% in fiscal year 2013, which was primarily driven by the decrease in our services gross margin. Products and licenses gross margin in fiscal year 2014 was relatively consistent compared to fiscal year 2013 due to consistency in our product material and manufacturing costs. Services gross margin decreased by 2.5 percentage points from 80.4% in fiscal year 2013 to 77.9% in fiscal year 2014. The change was principally the result of personnel costs growing at a faster rate than services revenue.
53
Operating Expenses
Year Ended July 31, | Change in | Year Ended July 31, | Change in | |||||||||||||||||||||||||||
2015 | 2014 | $ | % | 2014 | 2013 | $ | % | |||||||||||||||||||||||
(Dollars in thousands) | ||||||||||||||||||||||||||||||
Research and development | $ | 65,092 | $ | 49,289 | $ | 15,803 | 32.1 | % | $ | 49,289 | $ | 43,056 | $ | 6,233 | 14.5 | % | ||||||||||||||
Sales and marketing | 162,217 | 138,612 | 23,605 | 17.0 | % | 138,612 | 112,385 | 26,227 | 23.3 | % | ||||||||||||||||||||
General and administrative | 37,110 | 29,621 | 7,489 | 25.3 | % | 29,621 | 24,488 | 5,133 | 21.0 | % | ||||||||||||||||||||
Total operating expenses | $ | 264,419 | $ | 217,522 | $ | 46,897 | 21.6 | % | $ | 217,522 | $ | 179,929 | $ | 37,593 | 20.9 | % | ||||||||||||||
2015 Compared to 2014.
Research and Development Expenses
Research and development expenses increased by $15.8 million, or 32.1%, to $65.1 million in fiscal year 2015 from $49.3 million in fiscal year 2014. The change was primarily attributable to a $10.8 million increase in personnel costs related to increased headcount, which includes a $3.5 million increase in stock-based compensation associated with our equity compensation programs. The change was also due to a $2.7 million increase in facility and information and technology related expenses and a $1.8 million increase in the cost of third-party engineering and development services.
Sales and Marketing Expenses
Sales and marketing expenses increased by $23.6 million, or 17.0%, to $162.2 million in fiscal year 2015 from $138.6 million in fiscal year 2014. The change was primarily related to a $18.5 million increase in personnel costs due to increased headcount and higher sales commissions. This increase in personnel costs includes a $0.8 million increase in stock-based compensation related to our equity compensation programs and a $0.7 million increase in travel-related costs. The change in total sales and marketing expenses was also attributable to a $3.0 million increase in facility and information and technology related expenses, a $1.4 million increase in the cost of third-party sales and marketing consulting services and a $0.8 million increase in marketing expenses related to increased marketing programs and increased participation in marketing events with channel and technology partners.
General and Administrative Expenses
General and administrative expenses increased by $7.5 million, or 25.3%, to $37.1 million in fiscal year 2015 from $29.6 million in fiscal year 2014. The change was principally attributable to a $5.3 million increase in personnel costs associated with increased headcount, which includes a $1.6 million increase in stock-based compensation related to our equity compensation programs. The change in total general and administrative expenses was also attributable to a $1.3 million increase in facility and information and technology related expenses and a $0.8 million increase in consulting, contractor, accounting and audit services fees.
54
2014 Compared to 2013.
Research and Development Expenses
Research and development expenses increased by $6.2 million, or14.5%, to $49.3 million in fiscal year 2014 from $43.1 million in fiscal year 2013. The change was primarily attributable to a $2.9 million increase in personnel costs, which includes a $2.7 million increase in stock-based compensation associated with our equity compensation programs. The change was also due to a $1.6 million increase in the cost of third-party engineering and development services, a $1.0 million increase in facility and information and technology related expenses and $0.4 million increase in depreciation expense for R&D related fixed assets.
Sales and Marketing Expenses
Sales and marketing expenses increased by $26.2 million, or 23.3%, to $138.6 million in fiscal year 2014 from $112.4 million in fiscal year 2013. The change was primarily related to a $21.5 million increase in personnel costs due to increased headcount. This increase in personnel costs includes a $11.2 million increase in stock-based compensation related to our equity compensation programs and a $1.3 million increase in travel-related costs. The change in total sales and marketing expenses was also attributable to a $2.6 million increase in facility and information and technology related expenses, a $0.8 million increase in marketing expenses related to increased marketing programs and participation in marketing events with channel and technology partners and a $0.6 million increase in the cost of third-party sales and marketing consulting services.
General and Administrative Expenses
General and administrative expenses increased by $5.1 million, or 21.0%, to $29.6 million in fiscal year 2014 from $24.5 million in fiscal year 2013. The change was principally attributable to a $4.6 million increase in personnel costs associated with increased headcount, which includes a $3.0 million increase in stock-based compensation related to our equity compensation programs. The change in total general and administrative expenses was also attributable to a $1.2 million increase in facility and information and technology related expenses. These increases were partially offset by the $0.8 million professional, legal, accounting and advisory services fees that we incurred in connection with the secondary offering by certain of our stockholders during the first quarter of fiscal 2013 which did not recur.
Other Expense, Net
Year Ended July 31, | Change in | Year Ended July 31, | Change in | |||||||||||||||||||||||||||
2015 | 2014 | $ | % | 2014 | 2013 | $ | % | |||||||||||||||||||||||
(Dollars in thousands) | ||||||||||||||||||||||||||||||
Other expense, net | $ | (651 | ) | $ | (18 | ) | $ | (633 | ) | 3,516.7 | % | $ | (18 | ) | $ | (618 | ) | $ | 600 | (97.1 | %) | |||||||||
2015 Compared to 2014. Other expense, net increased by $0.6 million from fiscal year 2014 to fiscal year 2015 primarily due to a $0.9 million increase in foreign currency exchange losses due to the strengthening of the U.S. dollar against certain major foreign currencies, partially offset by a $0.3 million net increase in interest income and other.
2014 Compared to 2013. Other expense, net decreased by $0.6 million from fiscal year 2013 to fiscal year 2014 primarily due to a $0.4 million decrease in foreign currency exchange losses due to the weakening of the U.S. dollar against certain major foreign currencies and a $0.2 million net increase in interest income and other.
55
Provision for income taxes
Year Ended July 31, | Change in | Year Ended July 31, | Change in | |||||||||||||||||||||||||||
2015 | 2014 | $ | % | 2014 | 2013 | $ | % | |||||||||||||||||||||||
(Dollars in thousands) | ||||||||||||||||||||||||||||||
Provision for income taxes | $ | 1,007 | $ | 919 | $ | 88 | 9.6 | % | $ | 919 | $ | 650 | $ | 269 | 41.4 | % | ||||||||||||||
2015 Compared to 2014. Due to the full valuation allowance recorded against federal, state, and Canada deferred tax assets, our provision for income taxes in fiscal year 2015 consisted primarily of current tax provisions for state and foreign taxes. Our effective tax rates for fiscal years 2015 and 2014 were (3.9%) and (4.0%).
2014 Compared to 2013. Due to the full valuation allowance recorded against federal and state deferred tax assets, our provision for income taxes in 2014 consisted primarily of current tax provision for state and current and deferred provisions for foreign taxes. Our effective tax rates for fiscal years 2014 and 2013 were (4.0%) and (17.3%). The increase in both our provision for income taxes and our effective tax rate from fiscal year 2013 to fiscal year 2014 were principally attributable to the higher foreign tax provision due to increase in pre-tax income and the recognition of valuation allowance against the foreign R&D credits, offset by lower US state taxes due to lower taxable income in fiscal year 2014 compared to fiscal year 2013.
56
LIQUIDITY AND CAPITAL RESOURCES
Capital Resources
The following table shows our capital resources:
July 31, 2015 | July 31, 2014 | $ Change | % Change | |||||||||||
(In thousands) | ||||||||||||||
Cash and cash equivalents | $ | 103,124 | $ | 78,535 | $ | 24,589 | 31.3 | % | ||||||
Short-term investments | 227,712 | 191,316 | 36,396 | 19.0 | % | |||||||||
Total cash, cash equivalents and short-term investments | $ | 330,836 | $ | 269,851 | $ | 60,985 | 22.6 | % | ||||||
Working capital | $ | 258,567 | $ | 209,313 | $ | 49,254 | 23.5 | % | ||||||
Our principal sources of liquidity as of July 31, 2015 consisted of cash and cash equivalents of $103.1 million, including $11.0 million held by our foreign subsidiaries, and short-term investments of $227.7 million. Cash and cash equivalents exclude $3.4 million of U.S. Treasury securities and $0.1 million in time deposits maintained in connection with various letters of credit, which are classified as restricted cash. Cash, cash equivalents and short-term investments consist of cash, money market funds, U.S. Treasury securities, U.S. government agency securities and FDIC-backed certificates of deposit. We intend to permanently reinvest our earnings from foreign operations, and do not anticipate that we will need funds generated from foreign operations to fund our domestic operations. In the event funds from foreign operations are needed to fund operations in the United States and if U.S. tax has not already been previously provided, we would be required to accrue and pay additional U.S. taxes in order to repatriate these funds.
We have incurred operating losses in each of the last three fiscal years of our operations, and, as of July 31, 2015, we had working capital of $258.6 million (which was reduced by $95.1 million of current deferred revenue, net), and an accumulated deficit of $163.5 million. Our cash provided by operating activities can vary from period to period, particularly as a result of timing differences between billing and collection of receivables. Our cash used in investing activities principally relates to our capital expenditures. Our cash provided by financing activities principally relates to net proceeds from issuances of our common stock under our employee stock plans.
We believe that our existing cash, cash equivalents and short-term investments will be sufficient to meet our anticipated cash needs for at least the next 12 months. Our future capital requirements will depend on many factors, including our growth rate, the timing and extent of our spending to support research and development activities, the timing and cost of establishing additional sales, marketing and distribution capabilities, the introduction of new and enhanced products and services offerings and our costs to ensure access to adequate manufacturing capacity. In the event that we require additional financing from outside sources, we may not be able to raise it on terms acceptable to us or at all. If we are unable to raise additional capital when desired, our business, operating results and financial condition would be adversely affected.
57
Summary of Cash Flows
We derived the following summary of our cash flows for the years indicated from our audited consolidated financial statements included elsewhere in this annual report:
Year Ended July 31, | ||||||||||||
2015 | 2014 | 2013 | ||||||||||
(In thousands) | ||||||||||||
Net cash provided by operating activities | $ | 48,011 | $ | 46,308 | $ | 39,614 | ||||||
Net cash used in investing activities | $ | (47,149 | ) | $ | (59,764 | ) | $ | (155,796 | ) | |||
Net cash provided by financing activities | $ | 25,246 | $ | 22,163 | $ | 29,397 | ||||||
Cash Flows from Operating Activities
Our cash provided by operating activities is driven primarily by sales and licenses of our products and, to a lesser extent, by up-front payments from end customers under maintenance and support contracts. Our primary uses of cash from operating activities have been for personnel-related expenditures, manufacturing costs, marketing and promotional expenses and costs related to our facilities. Our cash flows from operating activities will continue to be affected principally by our working capital requirements and the extent to which we increase spending on personnel and sales and marketing activities as our business grows.
Cash provided by operating activities of $48.0 million during fiscal year 2015 was attributable to a net loss of $27.1 million, which was more than offset by a $16.7 million cash inflow from the change in our net operating assets and liabilities and non-cash charges of $47.6 million for stock-based compensation and $8.9 million for depreciation and amortization. The $16.7 million change in our net operating assets and liabilities was primarily due to a $20.7 million increase in deferred revenue primarily attributable to an increase in our established base of maintenance and support contracts and to a lesser extent, an increase in subscription arrangements, a $9.7 million increase in accrued compensation due to higher personnel related cost and a $2.8 million increase in accounts payable and accrued liabilities, which was primarily driven by the timing of payments and invoicing. These movements with positive operating cash flow impact were partially offset by a $9.5 million increase in net accounts receivable due to increased billings and timing of invoicing, a $3.6 million increase in prepaid expenses, other current assets and other assets and a $2.6 million increase in inventory primarily due to a non-recurring purchase of certain components for our hardware products. Our “days sales outstanding,” or “DSO,” in accounts receivable slightly increased from 52 days at July 31, 2014 to 54 days at July 31, 2015.
Cash provided by operating activities of $46.3 million during fiscal year 2014 was attributable to a net loss of$23.9 million, which was more than offset by a $19.9 million cash inflow from the change in our net operating assets and liabilities and non-cash charges of $41.0 million for stock-based compensation and $8.7 million for depreciation and amortization. The $19.9 million change in our net operating assets and liabilities was primarily due to a $17.9 million increase in net deferred revenue from growth in our established base of maintenance, a $3.1 million increase in accounts payable and accrued liabilities, which was primarily driven by the timing of payments and invoicing, and a $2.3 million decrease in net accounts receivable primarily due to increased collections. Our “days sales outstanding,” or “DSO,” in accounts receivable improved from 63 days at July 31, 2013 to 52 days at July 31, 2014. These movements with positive operating cash flow impact were partially offset by a $1.9 million increase in inventory and a$1.5 million increase in prepaid expenses, other current assets and other assets. The increase in inventory was mainly due to the increase in inventory at our international depots and to a lesser extent, due to the finished goods we purchased from smaller former independent contract manufacturers.
58
Cash provided by operating activities of $39.6 million during fiscal year 2013 was attributable to a net loss of $4.4 million, which was more than offset by a $15.4 million cash inflow from the change in our net operating assets and liabilities and non-cash charges of $22.1 million for stock-based compensation and $6.7 million for depreciation and amortization. The $15.4 million change in our net operating assets and liabilities was primarily due to an increase of $21.5 million in net deferred revenue from growth in our established base of maintenance and support contracts, a $5.9 million increase in other liabilities primarily driven by the collection of leasehold improvement incentives related to our new corporate headquarters, a $2.2 million increase in accrued compensation primarily due to increased headcount and higher accrued bonuses and sales commissions, and a $1.8 million increase in accounts payable and accrued liabilities. These increases were partially offset by an increase in net accounts receivable of $11.9 million due to increased revenue and timing of invoicing, a $2.2 million increase in prepaid expenses, other current assets and other assets and a $1.9 million increase in inventory mainly due to inventory build-up in preparation for next quarter's shipments. Our “days sales outstanding,” or “DSO,” in accounts receivable increased from 58 days at July 31, 2012 to 63 days at July 31, 2013 primarily due to a relatively higher amount of billings later in the quarter ended July 31, 2013.
Cash Flows from Investing Activities
In fiscal year 2015, cash used in investing activities was $47.1 million, consisting of $147.1 million for purchases of short-term investments and $10.3 million for purchases of certain fixed assets, such as computer equipment and software and certain leasehold improvements, partially offset by $109.3 million and $1.0 million proceeds from maturities and sales of short-term investments.
In fiscal year 2014, cash used in investing activities was $59.8 million, consisting of $186.3 million for purchases of short-term investments, $6.4 million for purchases of certain fixed assets, such as computer equipment and software and certain leasehold improvements and $1.0 million cash used in a business acquisition, partially offset by$86.7 million and $47.2 million proceeds from maturities and sales of short-term investments.
In fiscal year 2013, cash used in investing activities was $155.8 million, consisting of $174.5 million for purchases of short-term investments, $16.5 million for purchases of leasehold improvements for our new corporate headquarters and computer equipment and software, partially offset by $34.6 million proceeds from maturities of short-term investments and a $0.6 million decrease in restricted cash.
Cash Flows from Financing Activities
In fiscal year 2015, cash provided by financing activities was $25.2 million, which was primarily related to proceeds from the issuance of common stock under our employee stock plans.
In fiscal year 2014, cash provided by financing activities was $22.2 million, which was primarily related to proceeds from the issuance of common stock under our employee stock plans.
In fiscal year 2013, cash provided by financing activities was $29.4 million, which was primarily related to net proceeds from the issuance of common stock under our employee stock plans.
59
Contractual Obligations
Our contractual commitments will have an impact on our future liquidity. The following table summarizes our contractual obligations that represent material expected or contractually committed future obligations, as of July 31, 2015. We believe that we will be able to fund these obligations through cash generated from operations and from our existing cash and cash equivalents balances.
Payments Due by Period | |||||||||||||||||||||||||||
Total | 2016 | 2017 | 2018 | 2019 | 2020 | 2021 and Thereafter | |||||||||||||||||||||
(In thousands) | |||||||||||||||||||||||||||
Contractual Obligations(1): | |||||||||||||||||||||||||||
Operating lease obligations(2) | $ | 24,576 | $ | 5,800 | $ | 4,813 | $ | 4,031 | $ | 3,986 | $ | 3,941 | $ | 2,005 | |||||||||||||
Purchase commitments(3) | 5,232 | 5,232 | — | — | — | — | — | ||||||||||||||||||||
Total | $ | 29,808 | $ | 11,032 | $ | 4,813 | $ | 4,031 | $ | 3,986 | $ | 3,941 | $ | 2,005 | |||||||||||||
(1) | The contractual obligations table excludes tax liabilities of $3.4 million related to uncertain tax positions because we are unable to make a reasonably reliable estimate of the timing of settlement, if any, of these future payments. |
(2) | Operating lease obligations represent our obligations to make payments under non-cancelable lease agreements for our facilities. |
(3) | Purchase commitments are contractual obligations to purchase inventory from our third-party contract manufacturers and suppliers in advance of anticipated sales. |
Off-Balance Sheet Arrangements
As of July 31, 2015, we did not have any relationships with unconsolidated entities or financial partnerships, such as entities often referred to as structured finance or special purpose entities that would have been established for the purpose of facilitating off-balance sheet arrangements or other contractually narrow or limited purposes.
60
Critical Accounting Policies
Our consolidated financial statements are prepared in accordance with generally accepted accounting principles in the United States and include our accounts and the accounts of our wholly-owned subsidiaries. The preparation of these consolidated financial statements requires our management to make estimates, assumptions and judgments that affect the reported amounts of assets and liabilities and disclosure of contingent assets and liabilities at the date of the financial statements, and the reported amounts of revenue and expenses during the applicable periods. We base our estimates, assumptions and judgments on historical experience and on various other factors that we believe to be reasonable under the circumstances. Different assumptions and judgments would change the estimates used in the preparation of our consolidated financial statements, which, in turn, could change the results from those reported. We evaluate our estimates, assumptions and judgments on an ongoing basis.
The critical accounting estimates, assumptions and judgments that we believe have the most significant impact on our consolidated financial statements are described below.
Revenue Recognition
We generate revenue from the sales or licensing of hardware and software products, support and maintenance, and other services through a direct sales force and indirect relationships with our partners. Revenue is recognized when all of the following criteria are met:
Persuasive evidence of an arrangement exists. Evidence of an arrangement generally consists of a purchase order issued pursuant to the terms and conditions of a distributor or value-added reseller agreement or, in limited cases, an end-user agreement.
Delivery or performance has occurred. We use shipping and related documents, distributor sell-through reports, or written evidence of customer acceptance, when applicable, to verify delivery or performance. We do not recognize product revenue until transfer of title and risk of loss, which generally is upon shipment to value-added resellers or end-users.
The sales price is fixed or determinable. We assess whether the sales price is fixed or determinable based on payment terms and whether the sales price is subject to refund or adjustment.
Collection is probable. We assess probability of collection on a customer-by-customer basis. We subject our customers to a credit review process that evaluates their financial condition and ability to pay for our products and services. If we conclude that collection is not probable, we do not recognize revenue until cash is received.
We recognize products and licenses revenue at the time of shipment provided that all other revenue recognition criteria have been met. Services revenue includes maintenance and support, training and consulting, and subscription services revenue. Maintenance and support revenue includes arrangements for software maintenance and technical support for our products and licenses. Maintenance is offered under renewable, fee-based contracts, which include 24-hour technical support, hardware repair and replacement parts, bug fixes, patches and unspecified upgrades on a when-and-if-available basis. Revenue from customer maintenance and support contracts and subscription services is deferred and recognized ratably over the contractual period, generally one to three years. Revenue from consulting and training is recognized as the services are completed. Revenues are reported net of sales taxes.
61
We operate a multiple tier channel distribution model that includes distributors, value-added resellers and direct sales to end-users. Revenue is generally recognized upon shipment based on general revenue recognition accounting guidance once all other revenue recognition criteria have been met. We record reductions to revenue for estimated product returns and pricing adjustments in the same period that the related revenue is recorded. The amount of these reductions is based on historical sales returns and price adjustments, specific provisions for returns, price protection or rebates in agreements, and other factors known at the time. Should actual product returns or pricing adjustments differ from estimates, additional reductions to revenue may be required. Revenue from sales to certain distributors may be subject to agreements that allow pricing credits, price protection, rebates and rights of return or involve international jurisdictions where the risk of returns or credits is considered to be high even though distributors do not have these contractual rights. As reliable estimates of these credits or returns cannot be made, product revenue on sales made through these distributors is recognized upon sell-through as reported by the distributors.
Multiple Element Arrangements
We enter into multiple element revenue arrangements in which a customer may purchase a combination of hardware, software, software upgrades, hardware and software maintenance and support, training and consulting, and subscription services. We account for multiple agreements with a single customer as one arrangement if the contractual terms and/or substance of those agreements indicate that they may be so closely related that they are, in effect, parts of a single arrangement.
Most of our products are hardware appliances containing software components that operate together to provide the essential functionality of the product. Therefore, the software sold with our hardware appliances are considered non-software deliverables and are not accounted for under the industry-specific software revenue recognition guidance.
Our products and licenses revenue also includes stand-alone software products. Stand-alone software may operate on our hardware appliances, but is not considered essential to the functionality of the hardware and continues to be subject to the industry-specific software revenue recognition guidance. The industry-specific software revenue recognition guidance includes the use of the residual method under which the amount of revenue allocated to delivered elements equals the total arrangement consideration less the aggregate fair value of any undelivered elements. If VSOE of fair value of one or more undelivered items does not exist, revenue from the entire arrangement is deferred and recognized at the earlier of: (i) delivery of those elements or (ii) when fair value can be established unless support and maintenance is the only undelivered element, in which case, the entire arrangement fee is recognized ratably over the contractual service period.
We provide unspecified software upgrades for most of our products, on a when-and-if available basis, through maintenance and support contracts. To the extent that the software being supported does not function together with the hardware to deliver the hardware’s essential functionality, these support arrangements would continue to be subject to the industry-specific software revenue recognition guidance.
62
We allocate the arrangement fee to each element based upon the relative selling price of that element and, if software and software-related (e.g., maintenance for the software element) elements are also included in the arrangement, we allocate the arrangement fee to each of those software and software-related elements as a group based on the relative selling price for those elements. After such allocations are made, the amount of the arrangement fee allocated to the software and software-related elements is accounted for using the residual method. When applying the relative selling price method, we determine the selling price for each element using vendor-specific objective evidence, or VSOE, of selling price, if it exists, or if not, third-party evidence, or TPE, of selling price, if it exists. If neither VSOE nor TPE of selling price exist for an element, we use our best estimate of selling price, or BESP, for that element. The revenue allocated to each element is then recognized when the basic revenue recognition criteria are met for that element. We limit the amount of revenue recognized for delivered elements to an amount that is not contingent upon future delivery of additional products or services or meeting of any specified performance conditions.
Whenever possible, we determine VSOE for each element based on historical stand-alone sales to third parties. For maintenance and support, training and consulting, and subscription services, we determine the VSOE of fair value based on our history of stand-alone sales demonstrating that a substantial majority of transactions fall within a narrow range for each service offering.
We historically have not been able to determine TPE for our products, maintenance and support, training or consulting services. TPE is determined based on competitor prices for similar elements when sold separately. Generally, our offerings contain a significant level of differentiation such that the comparable pricing of products with similar functionality cannot be obtained. Furthermore, our go-to-market strategy differs from that of our peers and we are unable to reliably determine what similar competitor products' selling prices are on a stand-alone basis.
When we are unable to establish the selling price of an element using VSOE or TPE, we use BESP in our allocation of consideration to various elements under the arrangement. The objective of BESP is to determine the price at which we would transact a sale if the product or service were sold on a stand-alone basis. The BESP is established based on internal and external factors, including pricing practices such as discounting, cost of products, the geographies in which we offer our products and services, and customer classes and distribution channels (e.g. distributor, value-added reseller and direct end-user). The determination of BESP is made through consultation with and approval by our management, taking into consideration our pricing model and go-to-market strategy.
For our non-software deliverables, we generally determine relative selling price based on BESP. However, for our maintenance and support, training and consulting, and subscription services, we generally use VSOE to determine relative selling price. When we are unable to establish selling price using VSOE for our maintenance and support, training and consulting, and subscription services, we use BESP in our allocation of arrangement consideration.
We regularly review VSOE and BESP data provided by actual transactions to update these estimates and the relative selling prices allocated to each element.
Stock-Based Compensation
We recognize stock-based compensation expense for all share-based payment awards including employee stock options, restricted stock units, or RSUs, and purchases under our Employee Stock Purchase Plan, or ESPP based on each award's fair value on the grant date. We utilize the Black-Scholes-Merton (“BSM”) option pricing model in order to determine the fair value of stock options and ESPP. The BSM option pricing model requires various highly judgmental assumptions including expected volatility and expected term. If any of the assumptions used in the BSM option pricing model changes significantly, stock-based compensation expense may differ materially in the future from that recorded in the current period. In addition, we are required to estimate the expected forfeiture rate and only recognize expense for those shares expected to vest. We estimate the forfeiture rate based on historical experience and our expectations regarding future pre-vesting termination behavior of employees. To the extent our actual forfeiture rate is different from our estimate, stock-based compensation expense is adjusted accordingly.
63
Goodwill, Intangible Assets and Other Long-Lived Assets
We make significant estimates, assumptions, and judgments when valuing goodwill and other intangible assets in connection with the initial purchase price allocation of an acquired entity, as well as when evaluating impairment of goodwill and other intangible assets on an ongoing basis. These estimates are based upon a number of factors, including historical experience, market conditions, and information obtained from the management of the acquired company. Critical estimates in valuing certain intangible assets include, but are not limited to, historical and projected customer retention rates, anticipated growth in revenue from the acquired customer and product base, and the expected use of the acquired assets. These factors are also considered in determining the useful life of the acquired intangible assets. The amounts and useful lives assigned to identified intangible assets impacts the amount and timing of future amortization expense.
The value of our goodwill and intangible assets could be impacted by future adverse changes such as, but not limited to: (a) a significant adverse change in legal factors or in the business climate; (b) a substantial decline in our market capitalization, (c) an adverse action or assessment by a regulator; (d) unanticipated competition; (e) loss of key personnel; (f) a more likely-than-not expectation of sale or disposal of a reporting unit or a significant portion thereof; (g) a realignment of our resources or restructuring of our existing businesses in response to changes to industry and market conditions; (h) testing for recoverability of a significant asset group within the reporting unit; or (i) higher discount rate used in the impairment analysis as impacted by an increase in interest rates.
We evaluate goodwill for impairment on an annual basis as of May 1st or more frequently if we believe impairment indicators exist. Goodwill is tested for impairment by comparing the reporting unit's carrying value, including goodwill, to the fair value of the reporting unit. We operate under one reporting unit and for our annual goodwill impairment test, we determine the fair value of our reporting unit based on our enterprise value.
Long-lived assets, such as property and equipment and intangible assets subject to depreciation and amortization, are evaluated for impairment whenever events or changes in circumstances indicate that their carrying amount may not be recoverable. Among the factors and circumstances we considered in determining recoverability are: (i) a significant decrease in the market price of a long-lived asset; (ii) a significant adverse change in the extent or manner in which a long-lived asset is being used or in its physical condition; (iii) a significant adverse change in the business climate that could affect the value of a long-lived asset, including an adverse action or assessment by a regulator; (iv) an accumulation of costs significantly in excess of the amount originally expected for the acquisition; and (v) current-period operating or cash flow loss combined with a history of operating or cash flow losses or a projection or forecast that demonstrates continuing losses associated with the use of a long-lived asset. Recoverability of assets to be held and used is measured by a comparison of the carrying amount of an asset to the estimated undiscounted future cash flows expected to be generated by the asset. If the carrying amount of an asset exceeds its estimated future cash flows, an impairment charge is recognized in the amount by which the carrying amount of the asset exceeds the fair value of the asset.
There have been no indicators of impairment of goodwill, intangible assets and other long-lived assets, and we did not record any impairment losses during the years ended July 31, 2015, 2014 and 2013.
64
Income Taxes
We account for income taxes under an asset and liability approach for deferred income taxes, which requires recognition of deferred income tax assets and liabilities for the expected future tax consequences of events that have been recognized in our consolidated financial statements, but have not been reflected in our taxable income. Estimates and judgments occur in the calculation of certain tax liabilities and in the determination of the recoverability of certain deferred income tax assets, which arise from temporary differences and carryforwards. Deferred income tax assets and liabilities are measured using the currently enacted tax rates that apply to taxable income in effect for the years in which those tax assets and liabilities are expected to be realized or settled. We regularly assess the likelihood that our deferred income tax assets will be realized based on the realization guidance available. To the extent that we believe any amounts are not more-likely-than-not to be realized, we record a valuation allowance to reduce the deferred income tax assets. We regularly assess the need for the valuation allowance on our deferred tax assets, and to the extent that we determine that an adjustment is needed, that adjustment will be recorded in the period that the determination is made.
We have considered future market growth, forecasted earnings, future taxable income, the mix of earnings in the jurisdictions in which we operate and prudent and feasible tax planning strategies in determining the need for a valuation allowance. Based on these factors, we have determined it is appropriate to record a full valuation allowance against our US and material foreign net deferred tax assets. In the event we were to determine that we are able to realize all or part of these net deferred tax assets in the future, we would generally decrease the valuation allowance and record a corresponding benefit to earnings in the period in which we make that determination. In order for us to realize our deferred tax assets, we must be able to generate sufficient taxable income in the tax jurisdictions in which the deferred tax assets are located.
We are subject to income tax audits in the United States and the foreign jurisdictions in which we operate. Our income tax expense includes amounts intended to satisfy income tax assessments that would result from potential challenges. Determining the income tax expense for these potential assessments and recording the related assets and liabilities require management judgments and estimates. We evaluate our uncertain tax positions in accordance with the guidance for accounting for uncertainty in income taxes. We believe that our reserve for uncertain tax positions is adequate. The amounts ultimately paid upon resolution of audits could be materially different from the amounts previously included in our income tax expense and therefore could have a material impact on our tax provision, net income and cash flows.
We regularly review our tax positions and benefits to be realized. We recognize tax liabilities based upon our estimate of whether, and the extent to which, additional taxes will be due when those estimates are more-likely-than-not to be sustained. An uncertain income tax position will not be recognized if it has less than a 50% likelihood of being sustained. We recognize interest and penalties related to income tax matters as income tax expense. For the years ended July 31, 2015, 2014 and 2013, we did not incur any interest or penalties associated with unrecognized tax benefits.
Loss Contingencies
We use significant judgment and assumptions to estimate the likelihood of loss or impairment of an asset, or the incurrence of a liability, in determining loss contingencies. An estimated loss contingency is accrued when it is probable that an asset has been impaired or a liability has been incurred and the amount of loss can be reasonably estimated. We record a charge equal to the minimum estimated liability for litigation costs or a loss contingency only when both of the following conditions are met: (i) information available prior to issuance of our consolidated financial statements indicates that it is probable that an asset had been impaired or a liability had been incurred at the date of the financial statements and (ii) the range of loss can be reasonably estimated. We regularly evaluate current information available to us to determine whether such accruals should be adjusted and whether new accruals are required.
65
Recent Accounting Pronouncements
Please refer to Note 1 of the Notes to Consolidated Financial Statements under Part II, Item 8 for recent accounting pronouncements.
ITEM 7A. | QUANTITATIVE AND QUALITATIVE DISCLOSURES ABOUT MARKET RISK |
We are exposed to market risk in the ordinary course of our business. Market risk represents the risk of loss that may impact our financial position due to adverse changes in financial market prices and rates. Our market risk exposure is primarily a result of fluctuations in foreign currency exchange rates and interest rates. We do not hold or issue financial instruments for trading purposes.
Foreign Currency Risk
Our functional currency is the U.S. dollar. Most of our sales are denominated in U.S. dollars, and therefore our net revenue is not currently subject to significant foreign currency risk. Our operating expenses are denominated in the currencies of the countries in which our operations are located, which are primarily in North America, Europe and the Asia-Pacific region. Our consolidated results of operations and cash flows are, therefore, subject to fluctuations due to changes in foreign currency exchange rates and may be adversely affected in the future due to changes in foreign exchange rates. To date, we have not entered into any hedging arrangements with respect to foreign currency risk or other derivative financial instruments. During fiscal 2015, the effect of a hypothetical 100 basis point shift in foreign currency exchange rates applicable to our business would not have had a material impact on our consolidated financial statements.
Interest Rate Sensitivity
We had cash and cash equivalents of $103.1 million and short-term investments of $227.7 million as of July 31, 2015. We hold our cash and cash equivalents and short-term investments for working capital purposes. Our cash and cash equivalents are held in cash deposits and money market funds. Our short-term investments are held in U.S. treasury securities, U.S. government agency securities and FDIC-backed certificates of deposit. Due to the short-term nature of these instruments, we believe that we do not have any material exposure to changes in the fair value of our investment portfolio as a result of changes in interest rates. Declines in interest rates, however, would reduce future interest income. During fiscal 2015, the effect of a hypothetical 100 basis point shift in overall interest rates would not have had a material impact on our interest income.
66
ITEM 8. | FINANCIAL STATEMENTS AND SUPPLEMENTARY DATA |
INDEX TO CONSOLIDATED FINANCIAL STATEMENTS
Page | |
67
Report of Independent Registered Public Accounting Firm
The Board of Directors and Stockholders of
Infoblox Inc.
We have audited the accompanying consolidated balance sheets of Infoblox Inc. as of July 31, 2015 and 2014, and the related consolidated statements of operations, comprehensive loss, changes in stockholders' equity, and cash flows for each of the three years in the period ended July 31, 2015. These financial statements are the responsibility of the Company's management. Our responsibility is to express an opinion on these financial statements based on our audits.
We conducted our audits in accordance with the standards of the Public Company Accounting Oversight Board (United States). Those standards require that we plan and perform the audit to obtain reasonable assurance about whether the financial statements are free of material misstatement. An audit includes examining, on a test basis, evidence supporting the amounts and disclosures in the financial statements. An audit also includes assessing the accounting principles used and significant estimates made by management, as well as evaluating the overall financial statement presentation. We believe that our audits provide a reasonable basis for our opinion.
In our opinion, the financial statements referred to above present fairly, in all material respects, the consolidated financial position of Infoblox Inc. at July 31, 2015 and 2014, and the consolidated results of its operations and its cash flows for each of the three years in the period ended July 31, 2015, in conformity with U.S. generally accepted accounting principles.
We also have audited, in accordance with the standards of the Public Company Accounting Oversight Board (United States), Infoblox Inc.'s internal control over financial reporting as of July 31, 2015, based on criteria established in Internal Control-Integrated Framework issued by the Committee of Sponsoring Organizations of the Treadway Commission (2013 framework) and our report dated September 24, 2015 expressed an unqualified opinion thereon.
/s/ Ernst & Young LLP | ||
San Jose, California | ||
September 24, 2015 | ||
68
Report of Independent Registered Public Accounting Firm
The Board of Directors and Stockholders of
Infoblox Inc.
We have audited Infoblox Inc.'s internal control over financial reporting as of July 31, 2015, based on criteria established in Internal Control-Integrated Framework issued by the Committee of Sponsoring Organizations of the Treadway Commission (2013 framework) (the COSO criteria). Infoblox Inc.'s management is responsible for maintaining effective internal control over financial reporting, and for its assessment of the effectiveness of internal control over financial reporting included in the accompanying Management's Report on Internal Control Over Financial Reporting. Our responsibility is to express an opinion on the company's internal control over financial reporting based on our audit.
We conducted our audit in accordance with the standards of the Public Company Accounting Oversight Board (United States). Those standards require that we plan and perform the audit to obtain reasonable assurance about whether effective internal control over financial reporting was maintained in all material respects. Our audit included obtaining an understanding of internal control over financial reporting, assessing the risk that a material weakness exists, testing and evaluating the design and operating effectiveness of internal control based on the assessed risk, and performing such other procedures as we considered necessary in the circumstances. We believe that our audit provides a reasonable basis for our opinion.
A company's internal control over financial reporting is a process designed to provide reasonable assurance regarding the reliability of financial reporting and the preparation of financial statements for external purposes in accordance with generally accepted accounting principles. A company's internal control over financial reporting includes those policies and procedures that (1) pertain to the maintenance of records that, in reasonable detail, accurately and fairly reflect the transactions and dispositions of the assets of the company; (2) provide reasonable assurance that transactions are recorded as necessary to permit preparation of financial statements in accordance with generally accepted accounting principles, and that receipts and expenditures of the company are being made only in accordance with authorizations of management and directors of the company; and (3) provide reasonable assurance regarding prevention or timely detection of unauthorized acquisition, use, or disposition of the company's assets that could have a material effect on the financial statements.
Because of its inherent limitations, internal control over financial reporting may not prevent or detect misstatements. Also, projections of any evaluation of effectiveness to future periods are subject to the risk that controls may become inadequate because of changes in conditions, or that the degree of compliance with the policies or procedures may deteriorate.
In our opinion, Infoblox Inc. maintained, in all material respects, effective internal control over financial reporting as of July 31, 2015, based on the COSO criteria.
We also have audited, in accordance with the standards of the Public Company Accounting Oversight Board (United States), the consolidated balance sheets of Infoblox Inc. as of July 31, 2015 and 2014, and the related consolidated statements of operations, comprehensive loss, changes in stockholders' equity, and cash flows for each of the three years in the period ended July 31, 2015 of Infoblox Inc. and our report dated September 24, 2015 expressed an unqualified opinion thereon.
/s/ Ernst & Young LLP | ||
San Jose, California | ||
September 24, 2015 | ||
69
Management's Report on Internal Control Over Financial Reporting
The management of Infoblox Inc. (the “Company”) is responsible for establishing and maintaining adequate internal control over financial reporting for the Company, as defined in Rule 13a-15(f) and 15d-15(f) under the Securities Exchange Act of 1934, as amended. Management conducted an evaluation of the effectiveness of the Company's internal control over financial reporting as of July 31, 2015, based on the framework set forth by the Committee of Sponsoring Organizations of the Treadway Commission in Internal Control - Integrated Framework (2013 framework). Based on that assessment, management concluded that, as of July 31, 2015, the Company's internal control over financial reporting was effective. The effectiveness of the Company's internal control over financial reporting as of July 31, 2015, has been audited by Ernst & Young LLP, the independent registered public accounting firm that audits the Company's consolidated financial statements, as stated in their report preceding this report, which expresses an unqualified opinion on the effectiveness of the company's internal control over financial reporting as of July 31, 2015.
The Company's internal control over financial reporting is a process designed under the supervision of the Company's principal executive and principal financial officers to provide reasonable assurance regarding the reliability of financial reporting and the preparation of the Company's financial statements for external purposes in accordance with U.S. generally accepted accounting principles. The Company's internal control over financial reporting includes those policies and procedures that: (i) pertain to the maintenance of records that, in reasonable detail, accurately and fairly reflect the transactions and dispositions of the assets of the Company; (ii) provide reasonable assurance that transactions are recorded as necessary to permit preparation of financial statements in accordance with U.S. generally accepted accounting principles, and that receipts and expenditures of the Company are being made only in accordance with authorizations of management and directors of the Company; and (iii) provide reasonable assurance regarding prevention or timely detection of unauthorized acquisition, use, or disposition of the Company's assets that could have a material effect on the consolidated financial statements.
/s/ Jesper Andersen | /s/ Remo E. Canessa | |
Jesper Andersen | Remo E. Canessa | |
President and Chief Executive Officer (Principal Executive Officer) | Chief Financial Officer (Principal Financial Officer) | |
September 24, 2015 | September 24, 2015 | |
70
INFOBLOX INC.
CONSOLIDATED BALANCE SHEETS
(In thousands, except per share data)
As of July 31, | |||||||
2015 | 2014 | ||||||
ASSETS | |||||||
CURRENT ASSETS: | |||||||
Cash and cash equivalents | $ | 103,124 | $ | 78,535 | |||
Short-term investments | 227,712 | 191,316 | |||||
Accounts receivable, net of allowances of $446 at July 31, 2015 and $464 at July 31, 2014 | 45,881 | 36,420 | |||||
Inventory | 8,588 | 6,345 | |||||
Prepaid expenses and other current assets | 10,459 | 7,506 | |||||
Total current assets | 395,764 | 320,122 | |||||
Property and equipment, net | 23,225 | 18,785 | |||||
Restricted cash | 3,515 | 3,516 | |||||
Intangible assets, net | 1,923 | 4,096 | |||||
Goodwill | 33,293 | 33,293 | |||||
Other assets | 1,547 | 756 | |||||
TOTAL ASSETS | $ | 459,267 | $ | 380,568 | |||
LIABILITIES AND STOCKHOLDERS' EQUITY | |||||||
CURRENT LIABILITIES: | |||||||
Accounts payable and accrued liabilities | $ | 19,136 | $ | 15,648 | |||
Accrued compensation | 22,931 | 13,197 | |||||
Deferred revenue, net | 95,130 | 81,964 | |||||
Total current liabilities | 137,197 | 110,809 | |||||
Deferred revenue, net | 41,717 | 34,149 | |||||
Other liabilities | 5,201 | 6,314 | |||||
TOTAL LIABILITIES | 184,115 | 151,272 | |||||
Commitments and contingencies (Note 8) | |||||||
STOCKHOLDERS' EQUITY: | |||||||
Convertible preferred stock, $0.0001 par value per share—5,000 shares authorized; no shares issued or outstanding | — | — | |||||
Common stock, $0.0001 par value per share—100,000 shares authorized; 58,836 shares and 55,065 shares issued and outstanding as of July 31, 2015 and July 31, 2014 | 6 | 6 | |||||
Additional paid-in capital | 438,725 | 365,833 | |||||
Accumulated other comprehensive loss | (37 | ) | (84 | ) | |||
Accumulated deficit | (163,542 | ) | (136,459 | ) | |||
TOTAL STOCKHOLDERS' EQUITY | 275,152 | 229,296 | |||||
TOTAL LIABILITIES AND STOCKHOLDERS' EQUITY | $ | 459,267 | $ | 380,568 | |||
The accompanying notes are an integral part of these consolidated financial statements.
71
INFOBLOX INC
CONSOLIDATED STATEMENTS OF OPERATIONS
(In thousands, except per share data)
Year Ended July 31, | |||||||||||
2015 | 2014 | 2013 | |||||||||
Net revenue: | |||||||||||
Products and licenses | $ | 156,510 | $ | 130,348 | $ | 128,203 | |||||
Services | 149,615 | 119,992 | 96,841 | ||||||||
Total net revenue | 306,125 | 250,340 | 225,044 | ||||||||
Cost of revenue: | |||||||||||
Products and licenses | 35,362 | 29,327 | 29,228 | ||||||||
Services | 31,769 | 26,471 | 19,025 | ||||||||
Total cost of revenue | 67,131 | 55,798 | 48,253 | ||||||||
Gross profit | 238,994 | 194,542 | 176,791 | ||||||||
Operating expenses: | |||||||||||
Research and development | 65,092 | 49,289 | 43,056 | ||||||||
Sales and marketing | 162,217 | 138,612 | 112,385 | ||||||||
General and administrative | 37,110 | 29,621 | 24,488 | ||||||||
Total operating expenses | 264,419 | 217,522 | 179,929 | ||||||||
Loss from operations | (25,425 | ) | (22,980 | ) | (3,138 | ) | |||||
Other expense, net | (651 | ) | (18 | ) | (618 | ) | |||||
Loss before provision for income taxes | (26,076 | ) | (22,998 | ) | (3,756 | ) | |||||
Provision for income taxes | 1,007 | 919 | 650 | ||||||||
Net loss | $ | (27,083 | ) | $ | (23,917 | ) | $ | (4,406 | ) | ||
Net loss per share - basic and diluted | $ | (0.48 | ) | $ | (0.45 | ) | $ | (0.09 | ) | ||
Weighted-average shares used in computing net loss per share - basic and diluted | 56,626 | 53,581 | 48,494 | ||||||||
The accompanying notes are an integral part of these consolidated financial statements.
72
INFOBLOX INC.
CONSOLIDATED STATEMENTS OF COMPREHENSIVE LOSS
(In thousands)
Year Ended July 31, | ||||||||||||
2015 | 2014 | 2013 | ||||||||||
Net loss | $ | (27,083 | ) | $ | (23,917 | ) | $ | (4,406 | ) | |||
Other comprehensive gain (loss) | ||||||||||||
Unrealized holding gain (loss) on short-term investments, net | 47 | (73 | ) | (11 | ) | |||||||
Comprehensive loss | $ | (27,036 | ) | $ | (23,990 | ) | $ | (4,417 | ) | |||
The accompanying notes are an integral part of these consolidated financial statements.
73
INFOBLOX INC.
CONSOLIDATED STATEMENTS OF CHANGES IN STOCKHOLDERS’ EQUITY
(In thousands)
Common Stock | |||||||||||||||||||||||
Shares | Amount | Additional Paid-in Capital | Accumulated other Comprehensive Loss | Accumulated Deficit | Total Stockholders’ Equity | ||||||||||||||||||
Balance at July 31, 2012 | 45,738 | $ | 5 | $ | 250,206 | $ | — | $ | (108,136 | ) | $ | 142,075 | |||||||||||
Stock-based compensation | — | — | 21,983 | — | — | 21,983 | |||||||||||||||||
Issuance of common stock upon exercise of stock options | 5,320 | — | 21,392 | — | — | 21,392 | |||||||||||||||||
Issuance of common stock in connection with the employee stock purchase plan | 571 | — | 7,887 | — | — | 7,887 | |||||||||||||||||
Excess tax benefit from employee stock plans | — | — | 409 | — | — | 409 | |||||||||||||||||
Vesting of early exercised stock options | — | — | 224 | — | — | 224 | |||||||||||||||||
Issuance of common stock upon vesting of restricted stock units | 25 | — | — | — | — | — | |||||||||||||||||
Other | 16 | — | — | — | — | — | |||||||||||||||||
Net unrealized holding loss on short-term investments | — | — | — | (11 | ) | — | (11 | ) | |||||||||||||||
Net loss | — | — | — | — | (4,406 | ) | (4,406 | ) | |||||||||||||||
Balance at July 31, 2013 | 51,670 | $ | 5 | $ | 302,101 | $ | (11 | ) | $ | (112,542 | ) | $ | 189,553 | ||||||||||
Stock-based compensation | — | — | 40,934 | — | — | 40,934 | |||||||||||||||||
Issuance of common stock upon exercise of stock options | 2,052 | 1 | 13,834 | — | — | 13,835 | |||||||||||||||||
Issuance of common stock in connection with the ESPP | 644 | 8,161 | — | — | 8,161 | ||||||||||||||||||
Restricted stock units issued in connection with business acquisition | 18 | — | 573 | — | — | 573 | |||||||||||||||||
Excess tax benefit from employee stock plans | — | — | 170 | — | — | 170 | |||||||||||||||||
Vesting of early exercised common stock options | — | — | 60 | — | — | 60 | |||||||||||||||||
Issuance of common stock upon vesting of restricted stock units | 681 | — | — | — | — | — | |||||||||||||||||
Net unrealized holding loss on short-term investments | — | — | — | (73 | ) | — | (73 | ) | |||||||||||||||
Net loss | — | — | — | — | (23,917 | ) | (23,917 | ) | |||||||||||||||
Balance at July 31, 2014 | 55,065 | $ | 6 | $ | 365,833 | $ | (84 | ) | $ | (136,459 | ) | $ | 229,296 | ||||||||||
Stock-based compensation | 47,597 | 47,597 | |||||||||||||||||||||
Issuance of common stock upon exercise of stock options | 1,919 | — | 16,629 | — | — | 16,629 | |||||||||||||||||
Issuance of common stock in connection with the ESPP | 745 | — | 8,435 | — | — | 8,435 | |||||||||||||||||
Issuance of common stock upon vesting of restricted stock units | 1,107 | — | — | — | — | — | |||||||||||||||||
Excess tax benefit from employee stock plans | — | — | 207 | — | — | 207 | |||||||||||||||||
Vesting of early exercised common stock options | — | — | 24 | — | — | 24 | |||||||||||||||||
Net unrealized holding gain on short-term investments | — | — | — | 47 | — | 47 | |||||||||||||||||
Net loss | — | — | — | — | (27,083 | ) | (27,083 | ) | |||||||||||||||
Balance at July 31, 2015 | 58,836 | $ | 6 | $ | 438,725 | $ | (37 | ) | $ | (163,542 | ) | $ | 275,152 | ||||||||||
The accompanying notes are an integral part of these consolidated financial statements.
74
INFOBLOX INC.
CONSOLIDATED STATEMENTS OF CASH FLOWS
(In thousands)
Year Ended July 31, | |||||||||||
2015 | 2014 | 2013 | |||||||||
CASH FLOWS FROM OPERATING ACTIVITIES: | |||||||||||
Net loss | $ | (27,083 | ) | $ | (23,917 | ) | $ | (4,406 | ) | ||
Adjustments to reconcile net loss to net cash provided by operating activities: | |||||||||||
Stock-based compensation | 47,623 | 40,971 | 22,064 | ||||||||
Depreciation and amortization | 8,888 | 8,735 | 6,670 | ||||||||
Excess tax benefits from employee stock plans | (207 | ) | (170 | ) | (409 | ) | |||||
Other | 2,096 | 827 | 344 | ||||||||
Changes in operating assets and liabilities: | |||||||||||
Accounts receivable, net | (9,461 | ) | 2,308 | (11,909 | ) | ||||||
Inventory | (2,615 | ) | (1,867 | ) | (1,918 | ) | |||||
Prepaid expenses, other current assets and other assets | (3,629 | ) | (1,500 | ) | (2,170 | ) | |||||
Accounts payable and accrued liabilities | 2,833 | 3,061 | 1,762 | ||||||||
Accrued compensation | 9,734 | 725 | 2,177 | ||||||||
Deferred revenue, net | 20,734 | 17,927 | 21,505 | ||||||||
Other liabilities | (902 | ) | (792 | ) | 5,904 | ||||||
Net cash provided by operating activities | 48,011 | 46,308 | 39,614 | ||||||||
CASH FLOWS FROM INVESTING ACTIVITIES: | |||||||||||
Purchases of short-term investments | (147,137 | ) | (186,322 | ) | (174,478 | ) | |||||
Proceeds from maturities of short-term investments | 109,290 | 86,730 | 34,572 | ||||||||
Proceeds from sales of short-term investments | 1,001 | 47,180 | — | ||||||||
Purchases of property and equipment | (10,303 | ) | (6,352 | ) | (16,515 | ) | |||||
Business acquisition | — | (1,000 | ) | — | |||||||
Change in restricted cash | — | — | 625 | ||||||||
Net cash used in investing activities | (47,149 | ) | (59,764 | ) | (155,796 | ) | |||||
CASH FLOWS FROM FINANCING ACTIVITIES: | |||||||||||
Proceeds from issuance of common stock under the employee stock plans | 25,039 | 21,993 | 29,223 | ||||||||
Excess tax benefits from employee stock plans | 207 | 170 | 409 | ||||||||
Payment of remaining unpaid initial public offering costs | — | — | (235 | ) | |||||||
Net cash provided by financing activities | 25,246 | 22,163 | 29,397 | ||||||||
Effect of foreign exchange rate changes on cash and cash equivalents | (1,519 | ) | — | — | |||||||
NET INCREASE (DECREASE) IN CASH AND CASH EQUIVALENTS | 24,589 | 8,707 | (86,785 | ) | |||||||
CASH AND CASH EQUIVALENTS - Beginning of year | 78,535 | 69,828 | 156,613 | ||||||||
CASH AND CASH EQUIVALENTS - End of year | $ | 103,124 | $ | 78,535 | $ | 69,828 | |||||
SUPPLEMENTAL DISCLOSURES OF CASH FLOW INFORMATION: | |||||||||||
Purchases of property and equipment not yet paid | $ | 1,341 | $ | 484 | $ | 164 | |||||
Cash paid for income taxes, net | $ | 483 | $ | 489 | $ | 1,120 | |||||
Restricted stock units released in connection with business acquisition | $ | — | $ | 573 | $ | — | |||||
The accompanying notes are an integral part of these consolidated financial statements.
75
INFOBLOX INC.
NOTES TO CONSOLIDATED FINANCIAL STATEMENTS
NOTE 1. | DESCRIPTION OF THE BUSINESS AND SUMMARY OF SIGNIFICANT ACCOUNTING POLICIES |
Business
Infoblox Inc. (together with its subsidiaries, “we” or “our”) was originally incorporated in the State of Illinois in February 1999 and was reincorporated in the State of Delaware in May 2003. We are headquartered in Santa Clara, California and have subsidiaries and representative offices located throughout the world. We provide a broad family of enterprise and service provider-class solutions to automate management of the critical network infrastructure services needed for secure, scalable and fault-tolerant connections between applications, devices and users.
Basis of Presentation
The accompanying consolidated financial statements have been prepared in accordance with U.S. generally accepted accounting principles (“GAAP”) and include all adjustments necessary for the fair presentation of our consolidated financial position, results of operations and cash flows for the periods presented. The accompanying consolidated financial statements include the accounts of Infoblox Inc. and our wholly-owned subsidiaries. All intercompany accounts and transactions have been eliminated in consolidation.
Use of Estimates
The preparation of the accompanying consolidated financial statements in conformity with GAAP requires us to make estimates and assumptions that affect the amounts reported in the consolidated financial statements and accompanying notes. Those management estimates and assumptions affect revenue recognition, allowances for doubtful accounts and sales returns, valuation of our cash equivalents, restricted cash and available-for-sale investments, valuation of inventory, determination of fair value of stock-based awards, valuation of goodwill and intangible assets acquired, impairment of goodwill and other intangible assets, amortization of intangible assets, contingencies and litigation and accounting for income taxes, including the valuation reserve on deferred tax assets and uncertain tax positions. We evaluate our estimates and assumptions on an ongoing basis using historical experience and other factors and adjust those estimates and assumptions when facts and circumstances dictate. As future events and their effects cannot be determined with precision, actual results could differ from these estimates and assumptions, and those differences could be material to the consolidated financial statements.
Concentration of Supply Risk with Contract Manufacturer
We outsource the substantial majority of our manufacturing, repair and supply chain management operations to one independent contract manufacturer. The inability of the manufacturer to fulfill our supply requirements could have a material and adverse effect on our business and consolidated financial statements.
In addition, our independent contract manufacturer procures components and manufactures our products based on our demand forecasts. These forecasts are based on our estimates of future demand for our products, which are in turn based on historical trends and an analysis from our sales and marketing organizations, adjusted for overall market conditions. We may be subject to the requirement to purchase inventory or to pay additional fees to the contract manufacturer if there is a significant difference in scheduled shipments or if the contract manufacturer holds inventory longer than a specified period.
76
Concentrations of Credit Risk
Financial instruments that potentially subject us to concentrations of credit risk consist of cash, cash equivalents, restricted cash, available-for-sale investments and accounts receivable. Our cash, cash equivalents and restricted cash are invested in high-credit quality financial instruments held mainly in two US banks. Such deposits may be in excess of insured limits provided on such deposits. Our investments consist of a diversified portfolio of highly liquid securities that have maturities of less than two years.
We mitigate credit risk in respect to accounts receivable by performing ongoing credit evaluations of our customers and maintaining a reserve for potential credit losses. In addition, we generally require our customers to prepay for maintenance and support services to mitigate the risk of uncollectible accounts receivable.
Cash and Cash Equivalents
All highly liquid investments purchased with an original maturity of three months or less are classified as cash and cash equivalents. Cash and cash equivalents consist of cash on hand, demand deposits with banks, highly liquid investments in money market funds, U.S. Treasury securities and certificates of deposit which are readily convertible into cash.
Restricted Cash
Under our facility lease arrangements, we are required to maintain letters of credit from a U.S. bank as security for performance under these agreements. The letters of credit are generally invested in U.S. Treasury securities or money market funds or interest-bearing accounts in amounts equal to the letters of credit, which are classified as restricted cash on the consolidated balance sheets. Restricted cash, which is shown under non-current assets in the consolidated balance sheets, amounted to $3.5 million as of July 31, 2015 and 2014.
Short-term Investments
Investments with original maturities at purchase of greater than three months are classified as short-term or long-term investments. Management determines the appropriate classification of securities at the time of purchase and re-evaluates such classification as of each balance sheet date.
Our investments in publicly-traded debt securities are classified as available-for-sale. Available-for-sale investments are initially recorded at cost and periodically adjusted to fair value in the consolidated balance sheets. Unrealized gains and losses on these investments are reported as a separate component of accumulated other comprehensive income (loss). Realized gains and losses are determined based on the specific identification method and are reported in the consolidated statements of operations. The investments are adjusted for amortization of premiums and discounts to maturity and such amortization is included in other expense, net.
We recognize an impairment charge for available-for-sale investments when a decline in the fair value of our investments below the cost basis is determined to be other than temporary. We consider various factors in determining whether to recognize an impairment charge, including the length of time the investment has been in a loss position, the extent to which the fair value has been less than the cost basis, the investment's financial condition and near-term prospects, and our intent to sell, or whether it is more likely than not we will be required to sell, the investment before recovery of the investment's amortized cost basis. If we determine that the decline in an investment's fair value is other than temporary, the difference is recognized as an impairment loss in our consolidated statements of operations. During the year ended July 31, 2015, we did not consider any of our investments to be other-than-temporarily impaired.
77
Fair Value
Fair value is defined as the price that would be received upon sale of an asset or paid to transfer a liability in an orderly transaction between market participants at the measurement date. When determining fair value, we consider the principal or most advantageous market in which we transact, and consider assumptions that market participants would use when pricing the asset or liability. We apply the following fair value hierarchy, which prioritizes the inputs used to measure fair value into three levels and bases the categorization within the hierarchy upon the lowest level of input that is available and significant to the fair value measurement:
Level I - Quoted prices in active markets for identical assets or liabilities.
Level II - Quoted prices for similar assets and liabilities in active markets or inputs that are observable for the asset or liability, either directly or indirectly through market corroboration, for substantially the full term of the financial instrument. These inputs are valued using market based approaches.
Level III - Inputs are unobservable inputs based on management assumptions. These inputs, if any, are valued using internal financial models.
Inventory
Inventories are stated at the lower of standard cost, which approximates actual cost (first-in, first-out), or market value (estimated net realizable value). The valuation of inventories at the lower of cost or market value requires the use of estimates regarding the amount of inventory that will be sold and the prices at which current inventory will be sold. These estimates are dependent on our assessment of current and expected orders from our customers. If actual market conditions are less favorable than those projected by management, inventory write-downs may be required. Our finished goods mainly consist of appliances that are used for the replacement of failed units under maintenance and support agreements and finished goods needed for our expanded depot requirements. We write down refurbished inventory based on the age of the units and number of hardware failures.
Property and Equipment, Net
Property and equipment, including leasehold improvements, are stated at cost, less accumulated depreciation and amortization. Depreciation is computed using the straight-line method over the estimated useful lives of the related assets, which are two to seven years. Leasehold improvements are amortized on a straight-line basis over the shorter of the estimated useful lives of the assets or the remaining lease term. Upon the retirement or disposition of property and equipment, the related costs and accumulated depreciation are removed from, and the resulting gain or loss is included in, the consolidated statements of operations. Repair and maintenance costs that do not extend the life or improve an asset are charged to expense as incurred.
78
Goodwill, Intangible Assets and Other Long-Lived Assets
Goodwill represents the future economic benefits arising from other assets acquired in a business combination or an acquisition that are not individually identified and separately recorded. The excess of the purchase price over the estimated fair value of net assets of businesses acquired in a business combination is recognized as goodwill.
Intangible assets consist of identifiable intangible assets, including developed technology, customer relationships, non-compete agreements, trademarks and patents, resulting from our acquisitions. Intangible assets are recorded at fair value, net of accumulated amortization. Intangible assets are amortized on a straight-line basis over their estimated useful lives. Amortization expense is included as a component of cost of products and licenses revenue and sales and marketing expense in the accompanying consolidated statements of operations. Amounts included in sales and marketing expense relate to amortization of intangible asset attributed to customer relationships.
Goodwill and other intangible assets acquired in a business combination and determined to have an indefinite useful life are not amortized, but instead tested for impairment at least annually during the fourth quarter. Such goodwill and other intangible assets may also be tested for impairment between annual tests in the presence of impairment indicators such as, but not limited to: (a) a significant adverse change in legal factors or in the business climate; (b) a substantial decline in our market capitalization, (c) an adverse action or assessment by a regulator; (d) unanticipated competition; (e) loss of key personnel; (f) a more likely-than-not expectation of sale or disposal of a reporting unit or a significant portion thereof; (g) a realignment of our resources or restructuring of our existing businesses in response to changes to industry and market conditions; (h) testing for recoverability of a significant asset group within a reporting unit; or (i) higher discount rate used in the impairment analysis as impacted by an increase in interest rates.
We evaluate goodwill for impairment on an annual basis as of May 1st or more frequently if we believe impairment indicators exist. Goodwill is tested for impairment by comparing the reporting unit's carrying value, including goodwill, to the fair value of the reporting unit. We operate under one reporting unit and for our annual goodwill impairment test, we determine the fair value of our reporting unit based on the Company's enterprise value.
Long-lived assets, such as property and equipment and intangible assets subject to depreciation and amortization, are evaluated for impairment whenever events or changes in circumstances indicate that their carrying amount may not be recoverable. Among the factors and circumstances we considered in determining recoverability are: (i) a significant decrease in the market price of a long-lived asset; (ii) a significant adverse change in the extent or manner in which a long-lived asset is being used or in its physical condition; (iii) a significant adverse change in legal factors or in the business climate that could affect the value of a long-lived asset, including an adverse action or assessment by a regulator; (iv) an accumulation of costs significantly in excess of the amount originally expected for the acquisition and (v) current-period operating or cash flow loss combined with a history of operating or cash flow losses or a projection or forecast that demonstrates continuing losses associated with the use of a long-lived asset. Recoverability of assets to be held and used is measured by a comparison of the carrying amount of an asset to the estimated undiscounted future cash flows expected to be generated by the asset. If the carrying amount of an asset exceeds its estimated future cash flows, an impairment charge is recognized in the amount by which the carrying amount of the asset exceeds the fair value of the asset.
There have been no indicators of impairment of goodwill, intangible assets and other long-lived assets, and we did not record any impairment losses during fiscal years 2015, 2014 and 2013.
79
Revenue Recognition
We generate revenue from the sales or licensing of hardware and software products, support and maintenance, and other services through a direct sales force and indirect relationships with our partners. Revenue is recognized when all of the following criteria are met:
Persuasive evidence of an arrangement exists. Evidence of an arrangement generally consists of a purchase order issued pursuant to the terms and conditions of a distributor or value-added reseller agreement or, in limited cases, an end-user agreement.
Delivery or performance has occurred. We use shipping and related documents, distributor sell-through reports, or written evidence of customer acceptance, when applicable, to verify delivery or performance. We do not recognize product revenue until transfer of title and risk of loss, which generally is upon shipment to value-added resellers or end-users.
The sales price is fixed or determinable. We assess whether the sales price is fixed or determinable based on payment terms and whether the sales price is subject to refund or adjustment.
Collection is probable. We assess probability of collection on a customer-by-customer basis. We subject our customers to a credit review process that evaluates their financial condition and ability to pay for our products and services. If we conclude that collection is not probable, we do not recognize revenue until cash is received.
We recognize product revenue at the time of shipment provided that all other revenue recognition criteria have been met. Services revenue includes maintenance and support, training and consulting, and subscription services revenue. Maintenance and support revenue includes arrangements for software maintenance and technical support for our products and licenses. Maintenance is offered under renewable, fee-based contracts, which include 24-hour technical support, hardware repair and replacement parts, bug fixes, patches and unspecified upgrades on a when-and-if-available basis. Revenue from customer maintenance and support contracts and subscription services is deferred and recognized ratably over the contractual period, generally one to three years. Revenue from consulting and training is recognized as the services are completed. Revenues are reported net of sales taxes.
We operate a multiple tier channel distribution model that includes distributors, value-added resellers and direct sales to end-users. Revenue is generally recognized upon shipment based on general revenue recognition accounting guidance once all other revenue recognition criteria have been met. We record reductions to revenue for estimated product returns and pricing adjustments in the same period that the related revenue is recorded. The amount of these reductions is based on historical sales returns and price adjustments, specific provisions for returns, price protection or rebates in agreements, and other factors known at the time. Should actual product returns or pricing adjustments differ from estimates, additional reductions to revenue may be required. Revenue from sales to certain distributors may be subject to agreements that allow pricing credits, price protection, rebates and rights of return or involve international jurisdictions where the risk of returns or credits is considered to be high even though distributors do not have these contractual rights. As reliable estimates of these credits or returns cannot be made, product revenue on sales made through these distributors is recognized upon sell-through as reported by the distributors.
80
Multiple Element Arrangements
We enter into multiple element revenue arrangements in which a customer may purchase a combination of hardware, software, software upgrades, hardware and software maintenance and support, training and consulting, and subscription services. We account for multiple agreements with a single customer as one arrangement if the contractual terms and/or substance of those agreements indicate that they may be so closely related that they are, in effect, parts of a single arrangement.
Most of our products are hardware appliances containing software components that operate together to provide the essential functionality of the product. Therefore, the software sold with our hardware appliances are considered non-software deliverables and are not accounted for under the industry-specific software revenue recognition guidance.
Our products and licenses revenue also includes stand-alone software products. Stand-alone software may operate on our hardware appliances, but is not considered essential to the functionality of the hardware and continues to be subject to the industry-specific software revenue recognition guidance. The industry-specific software revenue recognition guidance includes the use of the residual method under which the amount of revenue allocated to delivered elements equals the total arrangement consideration less the aggregate fair value of any undelivered elements. If VSOE of fair value of one or more undelivered items does not exist, revenue from the entire arrangement is deferred and recognized at the earlier of: (i) delivery of those elements or (ii) when fair value can be established unless support and maintenance is the only undelivered element, in which case, the entire arrangement fee is recognized ratably over the contractual service period.
We provide unspecified software upgrades for most of our products, on a when-and-if available basis, through maintenance and support contracts. To the extent that the software being supported does not function together with the hardware to deliver the hardware’s essential functionality, these support arrangements would continue to be subject to the industry-specific software revenue recognition guidance.
We allocate the arrangement fee to each element based upon the relative selling price of that element and, if software and software-related (e.g., maintenance for the software element) elements are also included in the arrangement, we allocate the arrangement fee to each of those software and software-related elements as a group based on the relative selling price for those elements. After such allocations are made, the amount of the arrangement fee allocated to the software and software-related elements is accounted for using the residual method. When applying the relative selling price method, we determine the selling price for each element using vendor-specific objective evidence, or VSOE, of selling price, if it exists, or if not, third-party evidence, or TPE, of selling price, if it exists. If neither VSOE nor TPE of selling price exist for an element, we use our best estimate of selling price, or BESP, for that element. The revenue allocated to each element is then recognized when the basic revenue recognition criteria are met for that element. We limit the amount of revenue recognized for delivered elements to an amount that is not contingent upon future delivery of additional products or services or meeting of any specified performance conditions.
Whenever possible, we determine VSOE for each element based on historical stand-alone sales to third parties. For maintenance and support, training and consulting, and subscription services, we determine the VSOE of fair value based on our history of stand-alone sales demonstrating that a substantial majority of transactions fall within a narrow range for each service offering.
We historically have not been able to determine TPE for our products, maintenance and support, training or consulting services. TPE is determined based on competitor prices for similar elements when sold separately. Generally, our offerings contain a significant level of differentiation such that the comparable pricing of products with similar functionality cannot be obtained. Furthermore, our go-to-market strategy differs from that of our peers and we are unable to reliably determine what similar competitor products' selling prices are on a stand-alone basis.
81
When we are unable to establish the selling price of an element using VSOE or TPE, we use BESP in our allocation of consideration to various elements under the arrangement. The objective of BESP is to determine the price at which we would transact a sale if the product or service were sold on a stand-alone basis. The BESP is established based on internal and external factors, including pricing practices such as discounting, cost of products, the geographies in which we offer our products and services, and customer classes and distribution channels (e.g. distributor, value-added reseller and direct end-user). The determination of BESP is made through consultation with and approval by our management, taking into consideration our pricing model and go-to-market strategy.
For our non-software deliverables, we generally determine relative selling price based on BESP. However, for our maintenance and support, training and consulting, and subscription services, we generally use VSOE to determine relative selling price. When we are unable to establish selling price using VSOE for our maintenance and support, training and consulting, and subscription services, we use BESP in our allocation of arrangement consideration.
We regularly review VSOE and BESP data provided by actual transactions to update these estimates and the relative selling prices allocated to each element.
Deferred Revenue, Net
Deferred revenue, net represents amounts invoiced to customers, less related cost of revenue, for which the related revenue has not been recognized because one or more of the revenue recognition criteria have not been met. The current portion of deferred revenue represents the amounts that are expected to be recognized as revenue within one year of the consolidated balance sheet date.
Accounts Receivable and Allowance for Doubtful Accounts
Accounts receivable are recorded at invoiced amounts, net of allowances for doubtful accounts if applicable, and do not bear interest.
We evaluate the collectability of our accounts receivable based on known collection risks and historical experience. In circumstances where we are aware of a specific customer's inability to meet its financial obligations to us (e.g., bankruptcy filings or substantial downgrading of credit ratings), we record a specific reserve for bad debts against amounts due to reduce the net recognized receivable to the amount we reasonably believe will be collected. For all other customers, we record reserves for bad debts based on the length of time the receivables are past due and our historical experience of collections and write-offs. If circumstances change, such as higher-than-expected defaults or an unexpected material adverse change in a major customer's ability to meet its financial obligations, our estimate of the recoverability of the amounts due could be reduced by a material amount.
Concentration of Revenue and Accounts Receivable
Significant customers are those which represent more than 10% of our total net revenue or gross accounts receivable balance at each respective balance sheet date. Exclusive Networks, a distributor, accounted for 10.8%, 10.5% and 11.5% of our total net revenue for fiscal years 2015, 2014 and 2013. As of July 31, 2015 and 2014, Exclusive Networks accounted 12.1% and12.8% of our total gross accounts receivable.
Shipping and Handling
Shipping charges billed to customers are included in revenue and the related shipping costs are included in cost of revenue.
82
Research and Development Costs
Software development costs incurred in the research and development of new products and enhancements to existing products are charged to expense as incurred. Software development costs are capitalized after technological feasibility has been established. The period between achievement of technological feasibility, which we define as the establishment of a working model, and the general availability of such software to customers has been short, resulting in software development costs qualifying for capitalization being insignificant. Accordingly, we did not capitalize any software development costs during the years ended July 31, 2015, 2014 and 2013.
Stock-Based Compensation
We recognize share-based compensation expense for all share-based payment awards including employee stock options, RSUs, and purchases under our ESPP based on each award's fair value on the grant date. We utilize the BSM option pricing model in order to determine the fair value of stock options and ESPP. The BSM option pricing model requires various highly subjective assumptions including volatility, expected award life, and risk-free interest rate. Since the trading history of our common stock is substantially shorter than the expected award life, we use a blended volatility to estimate expected volatility. The blended volatility includes a weighting of our historical volatility from the date of our IPO to the respective grant date and the average historical stock volatilities of several unrelated public companies within our industry that we consider to be comparable to our business over a period equivalent to the estimated life of our stock options. The expected life of an award is based on historical experience, the terms and conditions of the stock awards granted to employees, and the potential effect from options that have not been exercised. The fair value of the RSUs is determined using the closing price of our common stock on the date of the grant. Compensation is recognized on a straight-line basis over the requisite service period of each grant adjusted for estimated forfeitures. In addition, we are required to estimate the expected forfeiture rate and only recognize expense for those shares expected to vest. We estimate the forfeiture rate based on historical experience and our expectations regarding future pre-vesting termination behavior of employees.
Advertising Costs
Advertising costs are charged to sales and marketing expenses as incurred in the consolidated statements of operations. Advertising expense during fiscal years 2015, 2014 and 2013 was $1.4 million, $1.3 million and $1.0 million.
Foreign Currency
The functional currency of our foreign subsidiaries is the U.S. dollar. Transactions denominated in currencies other than the functional currency are remeasured at the average exchange rate in effect during the period. At the end of each reporting period, our subsidiaries' monetary assets and liabilities are remeasured to the functional currency using exchange rates in effect at the end of the reporting period. Non-monetary assets and liabilities are remeasured at historical exchange rates. Gains and losses related to remeasurement are recorded in other expense, net in the consolidated statements of operations. Foreign currency exchange losses included in other expense, net during fiscal years 2015, 2014 and 2013 were $1.4 million, $0.5 million and $0.8 million.
83
Income Taxes
We account for income taxes under an asset and liability approach for deferred income taxes, which requires recognition of deferred income tax assets and liabilities for the expected future tax consequences of events that have been recognized in our consolidated financial statements, but have not been reflected in our taxable income. Estimates and judgments occur in the calculation of certain tax liabilities and in the determination of the recoverability of certain deferred income tax assets, which arise from temporary differences and carryforwards. Deferred income tax assets and liabilities are measured using the currently enacted tax rates that apply to taxable income in effect for the years in which those tax assets are expected to be realized or settled. We regularly assess the likelihood that our deferred income tax assets will be realized based on the realization guidance available. To the extent that we believe any amounts are not more-likely-than-not to be realized, we record a valuation allowance to reduce the deferred income tax assets. We regularly assess the need for the valuation allowance on our deferred tax assets, and to the extent that we determine that an adjustment is needed, such adjustment will be recorded in the period that the determination is made.
We regularly review our tax positions and benefits to be realized. We recognize tax liabilities based upon our estimate of whether, and the extent to which, additional taxes will be due when such estimates are more-likely-than-not to be sustained. An uncertain income tax position will not be recognized if it has less than a 50% likelihood of being sustained. We recognize interest and penalties related to income tax matters as income tax expense. For fiscal years 2015, 2014 and 2013, we did not incur any interest or penalties associated with unrecognized tax benefits.
Segment Information
Operating segments are components of an enterprise for which separate financial information is available and is evaluated regularly by our chief operating decision maker in deciding how to allocate resources and assessing performance. Our chief operating decision maker is our Chief Executive Officer.
Our Chief Executive Officer reviews financial information presented on a consolidated basis, for purposes of allocating resources and evaluating financial performance. We have one business activity and there are no segment managers who are held accountable for operations, operating results beyond revenue goals or gross margins, or plans for levels or components below the consolidated unit level. Accordingly, we have a single reporting segment.
84
Recently Issued Accounting Pronouncements
In July 2015, the Financial Accounting Standards Board (FASB) issued Accounting Standards Update (ASU) 2015-11—Inventory—Simplifying the Measurement of Inventory (Topic 330) (“ASU 2015-11”). ASU 2015-11 changes the measurement principle for inventory from the lower of cost or market to lower of cost and net realizable value. It applies to entities that measure inventory using a method other than last-in, first-out or the retail inventory method. The amendments apply to all other inventory, which includes inventory that is measured using first-in, first-out (FIFO) or average cost. ASU 2015-11 will be effective for us in fiscal year 2018. We are currently evaluating the impact that this updated standard will have on our consolidated financial statements.
In April 2015, the FASB issued ASU No. 2015-05, Intangibles-Goodwill and Other-Internal-Use Software: Customer’s Accounting for Fees Paid in a Cloud Computing Arrangement (ASU 2015-05), which provides guidance on determining whether a cloud computing arrangement contains a software license. If a cloud computing arrangement includes a software license, then the customer should account for the software license element of the arrangement consistent with the acquisition of other software licenses. If a cloud computing arrangement does not include a software license, the customer should account for the arrangement as a service contract. The new standard is effective for us in fiscal year 2016. We are currently assessing the impact that this updated standard will have on our consolidated financial statements.
In May 2014, the FASB issued ASU No. 2014-09, Revenue from Contracts with Customers (Topic 606), which supersedes the revenue recognition requirements in Accounting Standards Codification (ASC) 605, Revenue Recognition. This ASU is based on the principle that revenue is recognized to depict the transfer of goods or services to customers in an amount that reflects the consideration to which the entity expects to be entitled in exchange for those goods or services. The ASU also requires additional disclosure about the nature, amount, timing and uncertainty of revenue and cash flows arising from customer contracts, including significant judgments and changes in judgments and assets recognized from costs incurred to obtain or fulfill a contract. The guidance is effective for us in the first quarter of our fiscal 2018 using either of two methods: (i) retrospective to each prior reporting period presented with the option to elect certain practical expedients as defined within the guidance; or (ii) retrospective with the cumulative effect of initially applying the guidance recognized at the date of initial application and providing certain additional disclosures as defined per the guidance. In July 2015, the FASB decided to delay the effective date of the new revenue standard by one year. As such, ASU 2014-09 will be effective for us in fiscal year 2019, with the option to adopt earlier in fiscal year 2018. We are currently evaluating adoption methods and whether this standard will have a material impact on our consolidated financial statements.
85
NOTE 2. | NET INCOME (LOSS) PER SHARE |
We compute basic net income (loss) per share using the weighted average number of common shares outstanding during the period. We compute diluted net income per share using the weighted average number of common shares and dilutive potential common shares outstanding during the period. Dilutive potential common shares include shares issuable upon the exercise of stock options and upon the vesting of restricted stock units, or RSUs, and each purchase under our employee stock purchase plan, or ESPP, under the treasury stock method.
In loss periods, basic net loss per share and diluted net loss per share are the same since the effect of potential common shares is anti-dilutive and therefore excluded.
The following weighted-average shares of common stock equivalents were excluded from the computation of diluted net loss per share for the years presented because including them would have been antidilutive:
Year Ended July 31, | ||||||||
2015 | 2014 | 2013 | ||||||
(In thousands) | ||||||||
Stock options to purchase common stock | 3,155 | 3,629 | 6,123 | |||||
Restricted stock units | 2,077 | 1,745 | 225 | |||||
Employee stock purchase plan | 139 | 380 | 110 | |||||
NOTE 3. | CASH EQUIVALENTS, SHORT-TERM INVESTMENTS, RESTRICTED CASH AND FAIR VALUE MEASUREMENTS |
Cash Equivalents, Short-term Investments and Restricted Cash
The following table summarizes our cash equivalents, short-term investments and restricted cash as of July 31, 2015:
Amortized Cost | Unrealized Gains | Unrealized Losses | Estimated Fair Value | |||||||||||||
(In thousands) | ||||||||||||||||
Cash equivalents: | ||||||||||||||||
Money market funds | $ | 5,695 | $ | — | $ | — | $ | 5,695 | ||||||||
Short-term investments: | ||||||||||||||||
U.S. Treasury securities | 162,718 | 50 | (58 | ) | 162,710 | |||||||||||
U.S. government agency securities | 42,468 | 9 | (10 | ) | 42,467 | |||||||||||
FDIC-backed certificates of deposit | 22,560 | 7 | (32 | ) | 22,535 | |||||||||||
Total short-term investments | 227,746 | 66 | (100 | ) | 227,712 | |||||||||||
Restricted cash: | ||||||||||||||||
U.S. Treasury securities | 3,416 | 1 | (4 | ) | 3,413 | |||||||||||
Total cash equivalents, short-term investments and restricted cash | $ | 236,857 | $ | 67 | $ | (104 | ) | $ | 236,820 | |||||||
86
The following table presents the maturities of our short-term investments which are classified as available-for-sale securities as of July 31, 2015:
Amortized Cost | Estimated Fair Value | |||||||
(In thousands) | ||||||||
Due within one year | $ | 107,287 | $ | 107,293 | ||||
Due after one year through two years | 120,459 | 120,419 | ||||||
Total | $ | 227,746 | $ | 227,712 | ||||
We classify our available-for-sale investments as short-term investments in our consolidated balance sheets based on the availability of the funds for use in operations or strategic investments rather than the actual maturity dates.
The following table summarizes our cash equivalents, short-term investments and restricted cash as of July 31, 2014:
Amortized Cost | Unrealized Gains | Unrealized Losses | Estimated Fair Value | |||||||||||||
(In thousands) | ||||||||||||||||
Cash equivalents: | ||||||||||||||||
Money market funds | $ | 7,550 | $ | — | $ | — | $ | 7,550 | ||||||||
U.S. Treasury securities | 2,000 | — | — | 2,000 | ||||||||||||
Total cash equivalents | 9,550 | — | — | 9,550 | ||||||||||||
Short-term investments: | ||||||||||||||||
U.S. Treasury securities | 136,729 | 37 | (65 | ) | 136,701 | |||||||||||
U.S. government agency securities | 37,433 | 3 | (53 | ) | 37,383 | |||||||||||
FDIC-backed certificates of deposit | 17,240 | 4 | (12 | ) | 17,232 | |||||||||||
Total short-term investments | 191,402 | 44 | (130 | ) | 191,316 | |||||||||||
Restricted cash: | ||||||||||||||||
U.S. Treasury securities | 3,413 | 2 | — | 3,415 | ||||||||||||
Total cash equivalents, short-term investments and restricted cash | $ | 204,365 | $ | 46 | $ | (130 | ) | $ | 204,281 | |||||||
87
Fair Value Measurements
The following table sets forth the fair value of our financial assets by level within the fair value hierarchy:
Fair Value Measurements at July 31, 2015 Using: | ||||||||||||||||
Quoted Prices in Active Markets For Identical Assets | Significant Other Observable Remaining Inputs | Significant Other Unobservable Remaining Inputs | ||||||||||||||
(Level I) | (Level II) | (Level III) | Total | |||||||||||||
(In thousands) | ||||||||||||||||
Financial Assets | ||||||||||||||||
Reported as cash equivalents: | ||||||||||||||||
Money market funds | $ | 5,695 | $ | — | $ | — | $ | 5,695 | ||||||||
Reported as short-term investments: | ||||||||||||||||
U.S. Treasury securities | 162,710 | — | — | 162,710 | ||||||||||||
U.S. government agency securities | — | 42,467 | — | 42,467 | ||||||||||||
FDIC-backed certificates of deposit | — | 22,535 | — | 22,535 | ||||||||||||
Total short-term investments | 162,710 | 65,002 | — | 227,712 | ||||||||||||
Reported as restricted cash: | ||||||||||||||||
U.S. Treasury securities | 3,413 | — | — | 3,413 | ||||||||||||
Total financial assets | $ | 171,818 | $ | 65,002 | $ | — | $ | 236,820 | ||||||||
88
Fair Value Measurements at July 31, 2014 Using: | ||||||||||||||||
Quoted Prices in Active Markets For Identical Assets | Significant Other Observable Remaining Inputs | Significant Other Unobservable Remaining Inputs | ||||||||||||||
(Level I) | (Level II) | (Level III) | Total | |||||||||||||
(In thousands) | ||||||||||||||||
Financial Assets | ||||||||||||||||
Reported as cash equivalents: | ||||||||||||||||
Money market funds | $ | 7,550 | $ | — | $ | — | $ | 7,550 | ||||||||
U.S. Treasury securities | 2,000 | — | — | 2,000 | ||||||||||||
Total cash equivalents | $ | 9,550 | $ | — | $ | — | $ | 9,550 | ||||||||
Reported as short-term investments: | ||||||||||||||||
U.S. Treasury securities | 136,701 | — | — | 136,701 | ||||||||||||
U.S. government agency securities | — | 37,383 | — | 37,383 | ||||||||||||
FDIC-backed certificates of deposit | — | 17,232 | — | 17,232 | ||||||||||||
Total short-term investments | 136,701 | 54,615 | — | 191,316 | ||||||||||||
Reported as restricted cash: | ||||||||||||||||
U.S. Treasury securities | 3,415 | — | — | 3,415 | ||||||||||||
Total financial assets | $ | 149,666 | $ | 54,615 | $ | — | $ | 204,281 | ||||||||
We value our Level I assets, consisting primarily of money market funds and U.S. Treasury securities, using quoted prices in active markets for identical instruments. Financial assets whose fair values we measure on a recurring basis using Level II inputs consist of U.S. government agency securities and Federal Deposit Insurance Corporation, or FDIC-backed certificates of deposit. We measure the fair values of these assets with the help of a pricing service that either provides quoted market prices in active markets for identical or similar securities or uses observable inputs for their pricing without applying significant adjustments because the inputs used in the valuation model, such as interest rates and volatility, can be corroborated by readily observable market data for substantially the full term of the financial assets.
There were no transfers between Level I, Level II and Level III fair value hierarchies during fiscal years 2015 and 2014.
89
NOTE 4. | BALANCE SHEET COMPONENTS |
Allowance for Doubtful Accounts and Sales Returns Reserve
The allowances for doubtful accounts and sales returns consist of the following activity:
Balance at Beginning of Year | Charged to (Reversed From) Cost and Expenses | Deductions | Balance at End of Year | ||||||||||||
(In thousands) | |||||||||||||||
Year Ended July 31, 2013 | |||||||||||||||
Allowance for doubtful accounts | $ | 357 | $ | 177 | $ | (178 | ) | $ | 356 | ||||||
Sales returns reserve | 187 | 197 | (159 | ) | 225 | ||||||||||
Total allowance for doubtful accounts and sales returns reserve | $ | 544 | $ | 374 | $ | (337 | ) | $ | 581 | ||||||
Year Ended July 31, 2014 | |||||||||||||||
Allowance for doubtful accounts | $ | 356 | $ | 72 | $ | (89 | ) | $ | 339 | ||||||
Sales returns reserve | 225 | (73 | ) | (27 | ) | 125 | |||||||||
Total allowance for doubtful accounts and sales returns reserve | $ | 581 | $ | (1 | ) | $ | (116 | ) | $ | 464 | |||||
Year Ended July 31, 2015 | |||||||||||||||
Allowance for doubtful accounts | $ | 339 | $ | 85 | $ | (108 | ) | $ | 316 | ||||||
Sales returns reserve | 125 | 32 | (27 | ) | 130 | ||||||||||
Total allowance for doubtful accounts and sales returns reserve | $ | 464 | $ | 117 | $ | (135 | ) | $ | 446 | ||||||
Inventory
Inventory consists of the following:
As of July 31, | |||||||
2015 | 2014 | ||||||
(In thousands) | |||||||
Raw materials | $ | 2,224 | $ | 474 | |||
Finished goods | 6,364 | 5,871 | |||||
Total inventory | $ | 8,588 | $ | 6,345 | |||
90
Prepaid Expenses and Other Current Assets
Prepaid expenses and other current assets consist of the following:
As of July 31, | |||||||
2015 | 2014 | ||||||
(In thousands) | |||||||
Prepaid expenses | $ | 8,742 | $ | 6,002 | |||
Other current assets | 1,717 | 1,504 | |||||
Total prepaid expenses and other current assets | $ | 10,459 | $ | 7,506 | |||
Property and Equipment, Net
Property and equipment, net consists of the following:
As of July 31, | |||||||
2015 | 2014 | ||||||
(In thousands) | |||||||
Computer equipment and software | $ | 28,073 | $ | 19,660 | |||
Furniture and fixtures | 4,666 | 4,588 | |||||
Leasehold improvements | 11,370 | 10,604 | |||||
Total property and equipment, gross | 44,109 | 34,852 | |||||
Less accumulated depreciation and amortization | (20,884 | ) | (16,067 | ) | |||
Total property and equipment, net | $ | 23,225 | $ | 18,785 | |||
Depreciation and amortization expense was $6.7 million, $6.3 million and $4.3 million in fiscal years 2015, 2014 and 2013.
Accounts Payable and Accrued Liabilities
Accounts payable and accrued liabilities consist of the following:
As of July 31, | |||||||
2015 | 2014 | ||||||
(In thousands) | |||||||
Accounts payable | $ | 10,041 | $ | 8,064 | |||
Other | 9,095 | 7,584 | |||||
Total accounts payable and other current liabilities | $ | 19,136 | $ | 15,648 | |||
91
Deferred Revenue, Net
Deferred revenue, net consists of the following:
As of July 31, | |||||||
2015 | 2014 | ||||||
(In thousands) | |||||||
Deferred revenue: | |||||||
Products and licenses | $ | 6,255 | $ | 5,120 | |||
Services | 133,834 | 112,642 | |||||
Total deferred revenue | 140,089 | 117,762 | |||||
Deferred cost of revenue: | |||||||
Products and licenses | 567 | 449 | |||||
Services | 2,675 | 1,200 | |||||
Total deferred cost of revenue | 3,242 | 1,649 | |||||
Total deferred revenue, net | 136,847 | 116,113 | |||||
Less current portion | 95,130 | 81,964 | |||||
Non-current portion | $ | 41,717 | $ | 34,149 | |||
NOTE 5. OTHER EXPENSE, NET
Other expense, net is comprised of the following:
Year Ended July 31, | ||||||||||||
2015 | 2014 | 2013 | ||||||||||
(In thousands) | ||||||||||||
Interest income and other, net | $ | 751 | $ | 435 | $ | 195 | ||||||
Foreign currency exchange losses | (1,402 | ) | (453 | ) | (813 | ) | ||||||
Total other expense, net | $ | (651 | ) | $ | (18 | ) | $ | (618 | ) | |||
NOTE 6. | ACQUISITION |
In December 2013, we acquired substantially all of the assets of Internet Associates LLC, or IA, a small privately held software company that specialized in the automation of IP address management and IPv6, for a total consideration of $1.6 million. Of this amount, $1.0 million was paid in cash and $0.6 million represented the fair value of fully vested RSUs issued to former IA employees hired by us in connection with the acquisition. Of the total purchase price of $1.6 million, $1.0 million was allocated to the fair value of the core/developed technology and $0.6 million was allocated to the fair value of goodwill. We are amortizing the developed technology on a straight-line basis over an estimated useful life of 7 years. Amortization expense for this intangible asset was insignificant for fiscal years 2015 and 2014.
92
NOTE 7. | GOODWILL AND INTANGIBLE ASSETS |
Goodwill
Goodwill is generally not deductible for tax purposes in stock for stock transactions. The balance of goodwill as of July 31, 2015 and 2014 was $33.3 million. There were no changes in the carrying value of goodwill during fiscal year 2015. The change in the carrying amount of goodwill for fiscal year 2014 was as follows:
Amount in Thousands | ||||
Balance as of July 31, 2013 | $ | 32,726 | ||
Acquisition | 567 | |||
Balance as of July 31, 2014 | $ | 33,293 | ||
Intangible Assets
The gross carrying amount and accumulated amortization of our intangible assets other than goodwill were as follows:
As of July 31, 2015 | Amortization Period | Gross Value | Accumulated Amortization | Net Carrying Value | Weighted-Average Remaining Amortization Period | ||||||||||
(Dollars in thousands) | |||||||||||||||
Developed technology | 5 to 7 years | $ | 7,305 | $ | (5,908 | ) | $ | 1,397 | 3.30 years | ||||||
Customer relationships | 2 to 7 years | 6,574 | (6,323 | ) | 251 | 2.67 years | |||||||||
Trademarks | 6 years | 200 | (175 | ) | 25 | 0.75 years | |||||||||
Patents | 6 years | 1,000 | (750 | ) | 250 | 1.50 years | |||||||||
Total | $ | 15,079 | $ | (13,156 | ) | $ | 1,923 | ||||||||
As of July 31, 2014 | Amortization Period | Gross Value | Accumulated Amortization | Net Carrying Value | Weighted-Average Remaining Amortization Period | ||||||||||
(Dollars in thousands) | |||||||||||||||
Developed technology | 5 to 6 years | $ | 7,305 | $ | (4,915 | ) | $ | 2,390 | 3.51 years | ||||||
Customer relationships | 2 to 7 years | 6,574 | (5,343 | ) | 1,231 | 1.57 years | |||||||||
Trademarks | 6 years | 200 | (142 | ) | 58 | 1.75 years | |||||||||
Patents | 6 years | 1,000 | (583 | ) | 417 | 2.50 years | |||||||||
Total | $ | 15,079 | $ | (10,983 | ) | $ | 4,096 | ||||||||
93
We recognized intangible asset amortization expense in the consolidated statements of operations as follows:
Year Ended July 31, | |||||||||||
2015 | 2014 | 2013 | |||||||||
(In thousands) | |||||||||||
Cost of products and licenses revenue | $ | 1,160 | $ | 1,110 | $ | 1,015 | |||||
Sales and marketing | 1,013 | 1,308 | 1,308 | ||||||||
Total intangible asset amortization expense | $ | 2,173 | $ | 2,418 | $ | 2,323 | |||||
As of July 31, 2015, estimated amortization expense related to our identifiable acquisition-related intangible assets in future periods is as follows:
Fiscal Year Ending July 31, | Estimated Amortization Expense | |||
(In thousands) | ||||
2016 | $ | 1,048 | ||
2017 | 323 | |||
2018 | 208 | |||
2019 | 145 | |||
Thereafter | 199 | |||
Total | $ | 1,923 | ||
94
NOTE 8. | COMMITMENTS AND CONTINGENCIES |
Operating Leases
We have entered into non-cancelable operating leases for facilities that expire at various dates through January 31, 2021. Rent under the agreements is expensed to operations on a straight-line basis over the terms of the leases. The aggregate future non-cancelable minimum lease payments for our operating leases as of July 31, 2015 consist of the following:
Fiscal Year Ending July 31, | Operating Leases | |||
(In thousands) | ||||
2016 | $ | 5,800 | ||
2017 | 4,813 | |||
2018 | 4,031 | |||
2019 | 3,986 | |||
2020 | 3,941 | |||
Thereafter | 2,005 | |||
Total | $ | 24,576 | ||
Rent expense for all operating leases amounted to $5.1 million, $4.7 million and $4.6 million during fiscal years 2015, 2014 and 2013.
In May 2012, we entered into an agreement for the lease of an office building located in Santa Clara, California consisting of 127,000 square feet for an initial term of eight years which commenced in February 2013. This office building houses our corporate headquarters that we started occupying in March 2013. The annual base rent for this office lease ranges from approximately $3.2 million to $3.9 million over the term of the lease and we are also responsible for the payment of certain operating expenses, including utilities and real estate taxes. Pursuant to the terms of the lease agreement, we were obligated to provide a standby letter of credit in the amount of approximately $3.2 million as collateral for our full performance. In connection with this office lease, we received from the landlord leasehold incentives of approximately $6.0 million to make leasehold improvements to the leased office space. The leasehold incentive was recorded as leasehold improvements within property and equipment, net and as deferred rent within other liabilities in the consolidated balance sheets. The deferred rent liability is being amortized against rent expense over the term of the lease on a straight-line basis. The leasehold improvements are being amortized to expense over the shorter of the period from when the improvements were placed into service until the end of their respective useful lives or the lease term. As of July 31, 2015, $3.9 million lease incentives remained unamortized, of which $3.2 million was included in other liabilities and $0.7 million was included in accounts payable and accrued liabilities in the consolidated balance sheet.
Contract Manufacturer Commitments
The third-party contract manufacturer that provides the substantial majority of our manufacturing, repair and supply chain operations procures components and builds our products based on our forecasts. These forecasts are based on estimates of future demand for our products, which are in turn based on historical trends and an analysis from our sales and marketing organizations, adjusted for overall market conditions. In order to reduce manufacturing lead times and plan for adequate component supply, we may issue purchase orders to this contract manufacturer which may not be cancelable. In addition, we also have purchase commitments with other third-party contract manufacturers and suppliers. As of July 31, 2015, we had $5.2 million in purchase commitments with our contract manufacturers and suppliers, of which $4.9 million relates to open purchase orders with our primary contract manufacturer.
95
Guarantees
We have entered into agreements with some of our customers that contain indemnification provisions relating to potential situations where claims could be alleged that our products infringe the intellectual property rights of a third party. We have at our option and expense the ability to repair any infringement, replace product with a non-infringing equivalent-in-function product, or refund our customers the unamortized value of the product based on its estimated useful life, typically five years. Other guarantees or indemnification arrangements include guarantees of product and service performance and standby letters of credit for lease facilities and corporate credit cards. We have not recorded a liability related to these indemnification and guarantee provisions, and our guarantees and indemnification arrangements have not had any significant impact on our consolidated financial statements to date.
Loss Contingencies and Legal Proceedings
We are subject to the possibility of various loss contingencies arising in the ordinary course of business. An estimated loss contingency is accrued when it is probable that an asset has been impaired or a liability has been incurred and the range of loss can be reasonably estimated. However, the actual loss in any such contingency may be materially different from our estimates, which could result in the need to record additional expenses. If the amount of liability is not probable or the amount cannot be reasonably estimated, no accruals have been made. We regularly evaluate current information available to management to determine whether such accruals should be adjusted and whether new accruals are required in the periods presented.
From time to time, we are subject to various legal proceedings, claims and litigation arising in the ordinary course of business. Other than the litigation matter described below, as to which we are unable to make a materiality determination, we do not believe we are party to any currently pending legal proceedings, the outcome of which would have a material adverse effect on our financial position, results of operations or cash flows. There can be no assurance that existing or future legal proceedings arising in the ordinary course of business or otherwise will not have a material adverse effect on our financial position, results of operations or cash flows.
On April 16, 2013, Versata Software, Inc., or Versata, filed suit against us in the United States District Court for the District of Delaware in an action captioned Versata Software, Inc. F/K/A Trilogy Software, Inc.; and Versata Development Group, Inc. F/K/A Trilogy Development Group, Inc. v. Infoblox, Inc., Case No 1:13-cv-00678-UNA (D.Del.) (the “Action”). In the Action, Versata alleges that we directly and/or indirectly infringed U.S. Patent Nos. 6,834,282; 6,907,414; 7,363,593 and 7,426,481 by making, using, licensing, selling and offering for sale software products and related services including but not limited to Infoblox IP Address Management. In December 2013, we filed a motion to dismiss the Action. A hearing was held on the motion in August 2014 and the parties are awaiting the ruling on the motion. We continue to believe we have meritorious defenses to the claims asserted in the Action and intend to defend vigorously against them.
On June 9, 2015, Stacey Greenfield, who claims to be a stockholder of the Company, filed suit in the United States District Court for the Southern District of New York under Section 16(b) of the Securities Exchange Act of 1934 (“Section 16”) against Cadian Capital Management, LP, and certain persons and entities allegedly affiliated with it (collectively, the “Cadian Defendants”) in an action captioned Greenfield v. Cadian Capital Management, L.P., et al., Case No. 15-civ-04478. We are named as a nominal defendant. Plaintiff alleges that the Cadian Defendants engaged in transactions in our securities that resulted in “short-swing” profits within the scope of Section 16, and seeks disgorgement from the Cadian Defendants of those alleged “short-swing” profits on our behalf. On September 3, 2015, the Cadian Defendants filed a motion to dismiss the complaint. The parties had previously agreed that we (as a nominal defendant) should not be required to file any responsive pleading until after the Cadian Defendants’ motion to dismiss is decided. On September 11, 2015, Plaintiff informed the Court that, rather than oppose the motion to dismiss, Plaintiff intends to file an amended complaint, and will do so by October 7, 2015.
We believe at this time that liabilities associated with these cases, while possible, are not probable, and therefore we have not recorded any accrual for them as of July 31, 2015 and July 31, 2014. Further, any possible range of loss cannot be reasonably estimated at this time.
96
NOTE 9. | COMMON STOCK RESERVED FOR ISSUANCE |
We had reserved shares of common stock for future issuance as follows:
As of July 31, | |||||
2015 | 2014 | ||||
(In thousands) | |||||
Outstanding restricted stock units | 4,406 | 3,442 | |||
Shares reserved for future grants | 3,963 | 4,144 | |||
Outstanding stock options | 3,357 | 4,914 | |||
Shares reserved for employee stock purchase plan | 1,120 | 1,302 | |||
12,846 | 13,802 | ||||
NOTE 10. | EMPLOYEE BENEFIT PLANS |
Stock-based Compensation Plans
Our stock-based compensation plans include the 2012 Equity Incentive Plan (the “2012 Plan”), the 2005 Stock Plan (the “2005 Plan”), the 2003 Stock Plan (the “2003 Plan”), (collectively the “Plans”) and the 2012 Employee Stock Purchase Plan (the "ESPP"). Under the Plans, we have granted (or in the case of acquired plans, assumed) stock options and RSUs. We have issued common stock under the ESPP.
2012 Equity Incentive Plan
In April 2012, our board of directors approved and we adopted the 2012 Plan. It was subsequently amended in December 2012. Under the 2012 Plan, we have the ability to issue incentive stock options (“ISOs”), nonstatutory stock options (“NSOs”), restricted stock units, restricted stock awards (“RSAs”), stock appreciation rights (“SARs”), stock bonus awards or performance awards. ISOs may be granted to employees with exercise prices not less than the fair value of the common stock on the grant date as determined by the board of directors, and NSOs may be granted to employees, directors or consultants at exercise prices not less than 85% of the fair value of the common stock on the grant date as determined by the board of directors. If, at the time we grant an option, the optionee directly or by attribution owns stock possessing more than 10% of the total combined voting power of all classes of our stock, the exercise price must be at least 110% of the fair value of the common stock on the grant date as determined by the board of directors. Options, RSUs, RSAs, SARs, stock bonus awards and performance awards may be granted with vesting terms as determined by the board of directors and expire no more than ten years after the date of grant or earlier if employment or service is terminated. As of July 31, 2015, 4.0 million shares were available for grant under the 2012 Plan.
2003 Stock Plan
In March 2003, our board of directors approved and we adopted the 2003 Plan. As of April 20, 2012, no shares were available for grant under the 2003 Plan and all outstanding options would continue to be governed and remain outstanding in accordance with their existing terms. In addition, any shares subject to outstanding awards under the 2003 Plan that are issuable upon the exercise of options that expire or become unexercisable for any reason without having been exercised in full will be available for future grant and issuance under the 2012 Plan.
97
Employee Stock Purchase Plan
Concurrent with the effectiveness of our registration statement on Form S-1 on April 19, 2012, the ESPP became effective. It was subsequently amended in December 2012 and February 2014. The ESPP allows eligible employees to purchase shares of the Company’s common stock at a discount through payroll deductions of up to 15% of their eligible compensation, subject to plan limitations. The ESPP provides for a 24-month offering period comprised of four purchase periods of approximately six months. Employees are able to purchase shares at 85% of the lower of the fair market value of the Company’s common stock (i) at the date of commencement of the offering period or (ii) at the last day of the purchase period. Employees purchased approximately 0.7 million shares at an average price per share of $11.32, 0.6 million shares at an average price per share of $12.7 and 0.6 million shares at an average price per share of $13.80 under our ESPP during fiscal years 2015, 2014 and 2013. As of July 31, 2015, 1.1 million shares were available for future issuance under the ESPP.
The following table summarizes the stock-based compensation expense by line item in the Consolidated Statements of Operations:
Year Ended July 31, | |||||||||||
2015 | 2014 | 2013 | |||||||||
(In thousands) | |||||||||||
Cost of revenue | $ | 4,450 | $ | 3,619 | $ | 1,606 | |||||
Research and development | 10,828 | 7,375 | 4,659 | ||||||||
Sales and marketing | 23,687 | 22,919 | 11,721 | ||||||||
General and administrative | 8,658 | 7,058 | 4,078 | ||||||||
Total stock-based compensation | $ | 47,623 | $ | 40,971 | $ | 22,064 | |||||
The following table summarizes the stock-based compensation expense by award type:
Year Ended July 31, | |||||||||||
2015 | 2014 | 2013 | |||||||||
(In thousands) | |||||||||||
RSUs | $ | 31,952 | $ | 24,359 | $ | 6,084 | |||||
Stock options | 8,860 | 12,252 | 10,061 | ||||||||
ESPP | 6,811 | 4,360 | 5,919 | ||||||||
Total stock-based compensation | $ | 47,623 | $ | 40,971 | $ | 22,064 | |||||
The following table summarizes the unrecognized stock-based compensation balance, net of estimated forfeitures, by type of awards as of July 31, 2015:
As of July 31, 2015 | Weighted-Average Amortization Period | |||||
(In thousands) | (In years) | |||||
Restricted stock units | $ | 64,247 | 2.37 | |||
Stock options | 10,895 | 2.37 | ||||
ESPP | 3,873 | 0.96 | ||||
Total unrecognized stock-based compensation balance | $ | 79,015 | 2.30 | |||
98
Determination of Fair Value
The estimated grant date fair value of our stock options and ESPP awards was calculated using the BSM option-pricing model, based on the following assumptions:
Year Ended July 31, | |||||||||||
2015 | 2014 | 2013 | |||||||||
Employee Stock Options: | |||||||||||
Expected term (in years) | 6.08 | 6.08 | 6.08 | ||||||||
Risk-free interest rate | 1.81 | % | 1.86 | % | 1.04 | % | |||||
Expected volatility | 55 | % | 55 | % | 54 | % | |||||
Dividend rate | — | % | — | % | — | % | |||||
Weighted average fair value per share | $ | 9.49 | $ | 16.75 | $ | 10.49 | |||||
ESPP: | |||||||||||
Expected term (in years) | 0.50 - 2.00 | 0.50 - 2.00 | 0.50 - 2.00 | ||||||||
Risk-free interest rate | 0.08% - 0.71% | 0.06% - 0.48% | 0.09% - 0.38% | ||||||||
Expected volatility | 67% - 71% | 55% - 77% | 47% - 58% | ||||||||
Dividend rate | — | % | — | % | — | % | |||||
Weighted average fair value per share | $7.02 - $14.02 | $6.12 - $12.87 | $7.07 - $10.77 | ||||||||
Determination of Fair Value
The exercise price per share of our options to purchase common stock is the closing sale price per share of our common stock as quoted on the NYSE on the date of grant.
The fair value of each grant of stock options was determined using the BSM option pricing model and assumptions discussed below. Each of the fair value inputs is subjective and generally requires significant judgment to determine.
Expected Term-The expected term represents the period that our stock-based awards are expected to be outstanding. For option grants that are considered to be “plain vanilla,” we determine the expected term using the simplified method as provided by the SEC. The simplified method deems the term to be the average of the time-to-vesting and the contractual life of the options. For other option grants, we estimate expected term using historical data on employee exercises and post-vesting employment termination behavior taking into account the contractual life of the award. The expected term for the ESPP is based on the term of the purchase period.
Risk-Free Interest Rate-The risk-free interest rate is based on the U.S. Treasury yield curve in effect at the time of grant for zero coupon U.S. Treasury notes with maturities approximately equal to the option's expected term.
Expected Volatility-Since we only have a short trading history of our common stock, we use a blended volatility to estimate expected volatility. The blended volatility includes a weighting of our historical volatility from the date of our IPO to the respective grant date and the average historical stock volatilities of several unrelated public companies within our industry that we consider to be comparable to our business over a period equivalent to the expected term of the stock option grants.
Dividend Rate-The expected dividend is based on our history and expected dividend payouts. The expected dividend yield is zero as the Company has historically paid no dividends and does not anticipate dividends to be paid in the future.
99
Forfeiture Rate-We estimate our forfeiture rate based on an analysis of our actual forfeitures and will continue to evaluate the adequacy of the forfeiture rate based on actual forfeiture experience, analysis of employee turnover behavior and other factors. The impact from any forfeiture rate adjustment would be recognized in full in the period of adjustment, and if the actual number of future forfeitures differs from our estimates, we might be required to record adjustments to stock-based compensation in future periods.
Stock Option Activity
The following table summarizes the stock option activity and related information as of and for the three years ended July 31, 2015 under our Plans:
Options Outstanding | ||||||||||||
Number of Shares Underlying Outstanding Options | Weighted-Average Exercise Price | Weighted-Average Remaining Contractual Term | Aggregate Intrinsic Value | |||||||||
(In thousands) | (In years) | (In thousands) | ||||||||||
Outstanding as of July 31, 2012 | 11,847 | $ | 6.16 | 7.30 | $ | 176,037 | ||||||
Options granted | 841 | 20.62 | ||||||||||
Options exercised | (5,320 | ) | 4.02 | |||||||||
Options forfeited/expired | (705 | ) | 9.39 | |||||||||
Outstanding as of July 31, 2013 | 6,663 | $ | 9.35 | 7.47 | $ | 155,580 | ||||||
Options granted | 523 | 31.83 | ||||||||||
Options exercised | (2,052 | ) | 6.74 | |||||||||
Options forfeited/expired | (220 | ) | 16.17 | |||||||||
Outstanding as of July 31, 2014 | 4,914 | $ | 12.52 | 6.67 | $ | 14,980 | ||||||
Options granted | 875 | 17.94 | ||||||||||
Options exercised | (1,919 | ) | 8.66 | |||||||||
Options forfeited/expired | (513 | ) | 17.1 | |||||||||
Outstanding as of July 31, 2015 | 3,357 | $ | 15.45 | 6.67 | $ | 32,040 | ||||||
Vested and expected to vest - July 31, 2015 | 3,229 | $ | 15.23 | 6.58 | $ | 31,416 | ||||||
Exercisable - July 31, 2015 | 1,993 | $ | 12.88 | 5.36 | $ | 23,877 | ||||||
The aggregate intrinsic value represents the difference between the Company's closing stock price on the last trading day of the period and the exercise price multiplied by the number of the related options. The pre-tax intrinsic value of options exercised, representing the difference between the fair market value of the Company's common stock on the date of the exercise and the exercise price of each option, was $27.4 million and $57.0 million and $93.6 million for fiscal years 2015, 2014 and 2013. Total grant date fair value of options vested during fiscal years 2015, 2014 and 2013 was $10.6 million, $12.7 million and $10.2 million.
100
Restricted Stock Unit Activity
RSUs generally vest ratably over a period of four years from the date of grant subject to the employee’s continuing service to the Company over that period. Until vested, RSUs do not have the voting and dividend participation rights of common stock and the shares underlying the awards are not considered issued and outstanding. RSUs are converted into shares of the Company’s common stock upon vesting on a one-for-one basis. The cost of the RSUs is determined using the fair value of the Company’s common stock on the date of the grant. Compensation is recognized on a straight-line basis over the requisite service period of each grant adjusted for estimated forfeitures.
A summary of the restricted stock unit activity during the three years ended July 31, 2015 is presented below:
Number of Units | Weighted-Average Grant Date Fair Value Per Share | ||||||
(In thousands) | |||||||
Outstanding as of July 31, 2012 | 36 | $ | 18.68 | ||||
Granted | 2,107 | $ | 21.44 | ||||
Vested | (25 | ) | $ | 20.36 | |||
Cancellations due to forfeitures | (132 | ) | $ | 19.86 | |||
Outstanding as of July 31, 2013 | 1,986 | $ | 21.15 | ||||
Granted | 2,432 | $ | 29.72 | ||||
Vested | (699 | ) | $ | 22.37 | |||
Cancellations due to forfeitures | (277 | ) | $ | 29.90 | |||
Outstanding as of July 31, 2014 | 3,442 | $ | 26.47 | ||||
Granted | 2,889 | $ | 17.85 | ||||
Vested | (1,107 | ) | $ | 27.99 | |||
Cancellations due to forfeitures | (818 | ) | $ | 23.26 | |||
Outstanding as of July 31, 2015 | 4,406 | $ | 21.03 | ||||
Shares Available for Grant
The following table presents the stock grant activity and the total number of shares available for grant under the 2012 Plan as of July 31, 2015:
2012 Plan | ||
(In thousands) | ||
Balance at July 31, 2014 | 4,144 | |
Additional shares authorized for issuance | 2,252 | |
Options granted | (875 | ) |
RSUs granted | (2,889 | ) |
Options forfeited/expired(1) | 513 | |
RSUs forfeited/expired | 818 | |
Balance at July 31, 2015 | 3,963 | |
(1) | Includes forfeited or expired options under the 2003 Plan that forfeited or expired unexercised which became available for grant under the 2012 Plan according to its terms. Any shares subject to outstanding awards under the 2003 Plan that are issuable upon the exercise of options that expire or become unexercisable for any reason without having been exercised in full will be available for future grant and issuance under the 2012 Plan. |
101
Employee 401(k) Plan
We have a qualified contributory savings plan under Section 401(k) of the Internal Revenue Code covering substantially all of our United States employees. Each participant in the plan may elect to contribute up to $18,000 of his or her annual compensation to the plan for the calendar year 2015 and up to $17,500 for 2014 and 2013. Individuals who were 50 or older may contribute up to $24,000 of their annual income. Starting in the second quarter of fiscal 2015, we began matching eligible employee contributions on a service based tiered formula. We match $0.50 of each $1.00 of contributions per pay period to the maximum allowable amount ranging from 2% to 8% of eligible earnings depending on length of service. These contributions vest immediately. Our matching contributions to the 401(k) plan during fiscal year 2015 were $0.7 million. Prior to fiscal year 2015, we did not make any matching contributions to the 401(k) plan.
NOTE 11. | INCOME TAXES |
The geographical breakdown of our income (loss) before provision for income taxes for fiscal years 2015, 2014 and 2013 is as follows:
Year Ended July 31, | |||||||||||
2015 | 2014 | 2013 | |||||||||
(In thousands) | |||||||||||
Domestic | $ | (28,113 | ) | $ | (24,964 | ) | $ | (5,501 | ) | ||
International | 2,037 | 1,966 | 1,745 | ||||||||
Loss before provision for income taxes | $ | (26,076 | ) | $ | (22,998 | ) | $ | (3,756 | ) | ||
The components of the provision for income taxes are as follows:
Year Ended July 31, | |||||||||||
2015 | 2014 | 2013 | |||||||||
(In thousands) | |||||||||||
Current: | |||||||||||
State | $ | 355 | $ | 209 | $ | 539 | |||||
Foreign | 578 | 416 | 328 | ||||||||
Total current | 933 | 625 | 867 | ||||||||
Deferred: | |||||||||||
Federal | 74 | — | — | ||||||||
Foreign | — | 294 | (217 | ) | |||||||
Total deferred | 74 | 294 | (217 | ) | |||||||
Provision for income taxes | $ | 1,007 | $ | 919 | $ | 650 | |||||
102
The reconciliation of the statutory federal income tax and our effective income tax is as follows:
Year Ended July 31, | |||||||||||
2015 | 2014 | 2013 | |||||||||
(In thousands) | |||||||||||
Tax at statutory federal rate | $ | (9,127 | ) | $ | (8,049 | ) | $ | (1,314 | ) | ||
Change in valuation allowance | 6,021 | 5,663 | 515 | ||||||||
Stock-based compensation and other permanent items | 4,555 | 3,696 | 2,765 | ||||||||
R&D credit | (664 | ) | (528 | ) | (958 | ) | |||||
State tax—net of federal benefit | 283 | 158 | 477 | ||||||||
Foreign rate differential | (135 | ) | 23 | (500 | ) | ||||||
Foreign tax credit | (52 | ) | (6 | ) | (308 | ) | |||||
Other | 126 | (38 | ) | (27 | ) | ||||||
Provision for income taxes | $ | 1,007 | $ | 919 | $ | 650 | |||||
The components of the deferred tax assets, net are as follows:
As of July 31, | |||||||
2015 | 2014 | ||||||
(In thousands) | |||||||
Deferred tax assets: | |||||||
Net operating loss carryforwards | $ | 10,469 | $ | 13,814 | |||
Deferred revenue | 12,995 | 11,259 | |||||
Stock-based compensation | 9,269 | 8,800 | |||||
Tax credit carryforwards | 8,584 | 7,195 | |||||
Accruals, reserves and other | 8,330 | 7,193 | |||||
Fixed assets depreciation and other | 921 | 393 | |||||
Identified intangibles and other | 212 | — | |||||
Gross deferred tax asset | 50,780 | 48,654 | |||||
Valuation allowance | (50,772 | ) | (48,136 | ) | |||
Total deferred tax asset | 8 | 518 | |||||
Deferred tax liability: | |||||||
Identified intangibles and other | (74 | ) | (510 | ) | |||
Net deferred tax assets (liability) | $ | (66 | ) | $ | 8 | ||
Recognition of deferred tax assets is appropriate when realization of these assets is more-likely-than-not. Based upon the weight of available evidence, which includes our historical operating performance and our ability to generate sufficient taxable income in the future, we recorded a full valuation allowance of $50.4 million and $47.8 million against the net U.S. deferred tax assets as of July 31, 2015 and 2014.We also recorded a $0.4 million and $0.3 million valuation allowance against all Canadian deferred tax assets as of July 31, 2015 and 2014 based upon the same above-mentioned criteria. The net valuation allowance increased by $2.7 million during the year ended July 31, 2015. The need for valuation allowance is subject to adjustment in future periods if sufficient positive evidence exists to support reversal.
103
As of July 31, 2015, we had U.S. federal net operating loss carryforwards of $159.4 million and California net operating loss carryforwards of $53.9 million. The federal net operating loss carryforwards will expire at various dates beginning in the year ending July 31, 2021 if not utilized. The California net operating loss carryforwards will expire at various dates beginning in the year ending July 31, 2018 if not utilized. Additionally, as of July 31, 2015, we had U.S. federal and California research and development credit carryforwards of $6.3 million and $6.0 million. The federal credit carryforwards will begin to expire at various dates beginning in 2023 while the California credit carryforwards are not subject to expiration. As of July 31, 2015, we also had Canadian scientific research and development credit carryforwards of $0.7 million which will expire beginning in 2034.
Net operating losses of approximately $135.5 million have not been included in the deferred tax asset table above as these net operating losses are attributable to excess tax benefits associated with equity related settlements. These benefits will not be recognized in the financial statements until they result in a reduction in taxes payable. When recognized in the financial statements, the tax benefit will be recorded to stockholders' equity. During fiscal year 2015, we recognized approximately $0.2 million of excess tax benefits which resulted in a credit to stockholders' equity.
Utilization of our net operating loss and credit carryforwards may be subject to a substantial annual limitation provided for in the Internal Revenue Code and similar state codes. Such annual limitation could result in the expiration of net operating loss and credit carryforwards before utilization. We do not believe that such limitation rules will have a material impact on the financial statements.
Our policy with respect to our undistributed foreign subsidiaries' earnings is to consider those earnings to be indefinitely reinvested and, accordingly, no related provision for U.S. federal or state income tax has been provided. Upon distribution of those earnings in the form of dividends or otherwise, we may be subject to both U.S. income taxes (subject to an adjustment for foreign tax credits) and withholding taxes in the various countries. At July 31, 2015, the undistributed earnings approximated $3.7 million and the unrecorded deferred tax liability is estimated to be approximately $1.3 million.
104
Uncertain Tax Positions
As of July 31, 2015, 2014 and 2013, we had gross unrecognized tax benefits of $3.4 million, $2.9 million and $2.3 million. The balance of gross unrecognized tax benefits at July 31, 2015 relates to deferred tax assets with a corresponding valuation allowance. If recognized, the impact on our effective tax rate would not be material due to the full valuation allowance. We have not accrued interest and penalties related to unrecognized tax benefits reflected in the consolidated financial statements during fiscal years 2015, 2014 and 2013. Our policy for classifying interest and penalties associated with unrecognized income tax benefits is to include such items in income tax expense.
The following table summarizes the activity related to the unrecognized tax benefits:
Year Ended July 31, | |||||||||||
2015 | 2014 | 2013 | |||||||||
(In thousands) | |||||||||||
Gross unrecognized tax benefits beginning balance | $ | 2,863 | $ | 2,268 | $ | 1,342 | |||||
Increases related to tax positions taken during current year | 457 | 612 | 762 | ||||||||
Increases (Decreases) related to tax positions from prior years | 94 | (17 | ) | 164 | |||||||
Gross unrecognized tax benefits | $ | 3,414 | $ | 2,863 | $ | 2,268 | |||||
We believe that the change to our unrecognized tax benefits in the next 12 months will not be material to our consolidated financial statements.
We are subject to taxation in the United States, various states and several foreign jurisdictions. We are not currently under examination in any major jurisdiction. All years for U.S. federal and state jurisdictions and fiscal years 2010 through 2015 for our major foreign jurisdictions remain subject to examination for income tax purposes.
105
NOTE 12. | SEGMENT INFORMATION |
We operate in one single segment. The following table represents net revenue based on the customer’s location, as determined by the customer’s shipping address:
Year Ended July 31, | |||||||||||
2015 | 2014 | 2013 | |||||||||
(In thousands) | |||||||||||
Americas | $ | 205,349 | $ | 164,323 | $ | 147,017 | |||||
Europe, Middle East and Africa | 73,773 | 58,570 | 54,378 | ||||||||
Asia Pacific | 27,003 | 27,447 | 23,649 | ||||||||
Total net revenue | $ | 306,125 | $ | 250,340 | $ | 225,044 | |||||
Included within the Americas total in the above table was revenue from sales in the U.S. of $193.5 million, $154.9 million and $138.9 million during fiscal years 2015, 2014 and 2013. Aside from the U.S., no other country comprised 10% of our net revenue for fiscal years 2015, 2014, or 2013.
Our property and equipment, net by location is summarized as follows:
As of July 31, | |||||||
2015 | 2014 | ||||||
(In thousands) | |||||||
Americas | $ | 21,807 | $ | 17,882 | |||
Asia Pacific | 706 | 234 | |||||
Europe, Middle East and Africa | 712 | 669 | |||||
$ | 23,225 | $ | 18,785 | ||||
Included within the Americas total in the above table was property and equipment, net in the U.S. of $21.8 million and $17.8 million as of July 31, 2015 and 2014. Aside from the U.S., no other country comprised 10% of our fixed assets as of July 31, 2015 and 2014.
106
NOTE 13. UNAUDITED QUARTERLY FINANCIAL DATA
The following tables set forth our unaudited quarterly consolidated statement of operations data for each of the last eight quarters in the period ended July 31, 2015. The unaudited quarterly consolidated statement of operations data below have been prepared on the same basis as the audited consolidated financial statements included elsewhere in this Annual Report on Form 10-K and reflect all necessary adjustments, consisting only of normal recurring adjustments, that we believe are necessary for a fair statement of this information. The results of historical quarters are not necessarily indicative of the results of operations for a full year or any future period.
Fiscal 2015
Three Months Ended | ||||||||||||||||
October 31, | January 31, | April 30, | July 31, | |||||||||||||
2014 | 2015 | 2015 | 2015 | |||||||||||||
(In thousands, except per share amounts) | ||||||||||||||||
Net revenue: | ||||||||||||||||
Products and licenses | $ | 31,508 | $ | 37,917 | $ | 40,737 | $ | 46,348 | ||||||||
Services | 35,211 | 36,387 | 37,366 | 40,651 | ||||||||||||
Total net revenue | 66,719 | 74,304 | 78,103 | 86,999 | ||||||||||||
Cost of revenue: | ||||||||||||||||
Products and licenses | 7,467 | 8,787 | 9,069 | 10,039 | ||||||||||||
Services | 7,467 | 7,491 | 8,257 | 8,554 | ||||||||||||
Total cost of revenue | 14,934 | 16,278 | 17,326 | 18,593 | ||||||||||||
Gross profit | 51,785 | 58,026 | 60,777 | 68,406 | ||||||||||||
Operating expenses: | ||||||||||||||||
Research and development | 14,570 | 15,504 | 16,709 | 18,309 | ||||||||||||
Sales and marketing | 38,455 | 39,788 | 39,536 | 44,438 | ||||||||||||
General and administrative | 7,960 | 9,355 | 9,740 | 10,055 | ||||||||||||
Total operating expenses | 60,985 | 64,647 | 65,985 | 72,802 | ||||||||||||
Loss from operations | (9,200 | ) | (6,621 | ) | (5,208 | ) | (4,396 | ) | ||||||||
Other income (expense), net | (190 | ) | (590 | ) | 206 | (77 | ) | |||||||||
Loss before provision for (benefit from) income taxes | (9,390 | ) | (7,211 | ) | (5,002 | ) | (4,473 | ) | ||||||||
Provision for (benefit from) income taxes | 820 | (200 | ) | 134 | 253 | |||||||||||
Net loss | $ | (10,210 | ) | $ | (7,011 | ) | $ | (5,136 | ) | $ | (4,726 | ) | ||||
Net loss per share - basic and diluted | $ | (0.18 | ) | $ | (0.13 | ) | $ | (0.09 | ) | $ | (0.08 | ) | ||||
107
Fiscal 2014
Three Months Ended | ||||||||||||||||
October 31, | January 31, | April 30, | July 31, | |||||||||||||
2013 | 2014 | 2014 | 2014 | |||||||||||||
(In thousands, except per share amounts) | ||||||||||||||||
Net revenue: | ||||||||||||||||
Products and licenses | $ | 35,962 | $ | 31,565 | $ | 30,799 | $ | 32,022 | ||||||||
Services | 27,559 | 29,317 | 30,223 | 32,893 | ||||||||||||
Total net revenue | 63,521 | 60,882 | 61,022 | 64,915 | ||||||||||||
Cost of revenue: | ||||||||||||||||
Products and licenses | 7,887 | 7,086 | 7,119 | 7,235 | ||||||||||||
Services | 5,821 | 6,633 | 6,665 | 7,352 | ||||||||||||
Total cost of revenue | 13,708 | 13,719 | 13,784 | 14,587 | ||||||||||||
Gross profit | 49,813 | 47,163 | 47,238 | 50,328 | ||||||||||||
Operating expenses: | ||||||||||||||||
Research and development | 11,600 | 11,844 | 12,175 | 13,670 | ||||||||||||
Sales and marketing | 33,131 | 32,854 | 34,589 | 38,038 | ||||||||||||
General and administrative | 6,986 | 6,848 | 7,839 | 7,948 | ||||||||||||
Total operating expenses | 51,717 | 51,546 | 54,603 | 59,656 | ||||||||||||
Loss from operations | (1,904 | ) | (4,383 | ) | (7,365 | ) | (9,328 | ) | ||||||||
Other income (expense), net | (101 | ) | (103 | ) | 124 | 62 | ||||||||||
Loss before provision for (benefit from) income taxes | (2,005 | ) | (4,486 | ) | (7,241 | ) | (9,266 | ) | ||||||||
Provision for (benefit from) income taxes | 544 | (92 | ) | 201 | 266 | |||||||||||
Net loss | $ | (2,549 | ) | $ | (4,394 | ) | $ | (7,442 | ) | $ | (9,532 | ) | ||||
Net loss per share - basic and diluted | $ | (0.05 | ) | $ | (0.08 | ) | $ | (0.14 | ) | $ | (0.17 | ) | ||||
Basic and diluted earnings per share are computed independently for each of the quarters presented. Therefore, the sum of quarterly basic and diluted per share information may not equal annual basic and diluted loss per share.
108
ITEM 9. | CHANGES IN AND DISAGREEMENTS WITH ACCOUNTANTS ON ACCOUNTING AND FINANCIAL DISCLOSURES |
None.
ITEM 9A. | CONTROLS AND PROCEDURES |
Evaluation of Disclosure Controls and Procedures
As exhibits to this Report, attached are certifications of our principal executive officer and principal financial officer, which are required in accordance with Rule 13a-14 of the Securities Exchange Act of 1934, as amended (the “Exchange Act”). This “Controls and Procedures” section includes information concerning the controls and related evaluations referred to in the certifications and it should be read in conjunction with the certifications for a more complete understanding of the topics presented.
We carried out an evaluation, under the supervision and with the participation of our management, including our principal executive officer and principal financial officer, of the effectiveness of the design and operation of our disclosure controls and procedures, as defined in Rules 13a-15(e) and 15d-15(e) under the Exchange Act. Based upon that evaluation, our principal executive officer and principal financial officer concluded that, as of the end of the period covered in this report, our disclosure controls and procedures were effective to ensure that information required to be disclosed by us in reports that we file or submit under the Exchange Act is recorded, processed, summarized, and reported within the time periods specified in SEC rules and forms and is accumulated and communicated to our management, including our principal executive officer and principal financial officer, as appropriate to allow timely decisions regarding required disclosure.
Management's Report on Internal Control over Financial Reporting
Our management is responsible for establishing and maintaining adequate internal control over financial reporting (as defined in Rules 13a-15(f) and 15d-15(f) of the Exchange Act) for Infoblox, Inc. See "Management's Annual Report on Internal Control over Financial Reporting" under Item 8 of Part II of this Report, which report is incorporated herein by reference.
Our independent registered public accounting firm has issued an attestation report regarding its assessment of our internal control over financial reporting as of July 31, 2015, which is included in Item 8 of Part II of this Report.
Changes in Internal Control over Financial Reporting
There were no changes in our internal control over financial reporting that occurred during the fourth quarter of fiscal 2015 that have materially affected, or are reasonably likely to materially affect, our internal control over financial reporting (as defined in Rules 13a-15(f) and 15d-15(f) under the Exchange Act). Internal control over financial reporting means a process designed to provide reasonable assurance regarding the reliability of financial reporting and the preparation of financial statements for external purposes in accordance with generally accepted accounting principles.
109
Inherent Limitations on Effectiveness of Controls
Our management, including the Chief Executive Officer (“CEO”) and Chief Financial Officer (“CFO”), does not expect that our disclosure controls or our internal control over financial reporting will prevent or detect all error and all fraud. A control system, no matter how well designed and operated, can provide only reasonable, not absolute, assurance that the control system’s objectives will be met. Our controls and procedures are designed to provide reasonable assurance that our control system’s objective will be met and our CEO and CFO have concluded that our disclosure controls and procedures are effective at the reasonable assurance level. The design of a control system must reflect the fact that there are resource constraints, and the benefits of controls must be considered relative to their costs. Further, because of the inherent limitations in all control systems, no evaluation of controls can provide absolute assurance that misstatements due to error or fraud will not occur or that all control issues and instances of fraud, if any, within the Company have been detected. These inherent limitations include the realities that judgments in decision-making can be faulty and that breakdowns can occur because of simple error or mistake. Controls can also be circumvented by the individual acts of some persons, by collusion of two or more people, or by management override of these controls. The design of any system of controls is based in part on certain assumptions about the likelihood of future events. Projections of any evaluation of controls effectiveness to future periods are subject to risks. Over time, controls may become inadequate because of changes in conditions or deterioration in the degree of compliance with policies or procedures.
ITEM 9B. | OTHER INFORMATION |
None.
110
PART III
ITEM 10. | DIRECTORS, EXECUTIVE OFFICERS AND CORPORATE GOVERNANCE |
The information required by this Item is incorporated by reference from our proxy statement for our 2015 Annual Meeting of Stockholders to be filed with the SEC within 120 days after the end of the year ended July 31, 2015.
ITEM 11. | EXECUTIVE COMPENSATION |
The information required by this Item is incorporated by reference from our proxy statement for our 2015 Annual Meeting of Stockholders to be filed with the SEC within 120 days after the end of the year ended July 31, 2015.
ITEM 12. | SECURITY OWNERSHIP OF CERTAIN BENEFICIAL OWNERS AND MANAGEMENT AND RELATED STOCKHOLDER MATTERS |
The information required by this Item is incorporated by reference from our proxy statement for our 2015 Annual Meeting of Stockholders to be filed with the SEC within 120 days after the end of the year ended July 31, 2015.
ITEM 13. | CERTAIN RELATIONSHIPS AND RELATED TRANSACTIONS AND DIRECTOR INDEPENDENCE |
The information required by this Item is incorporated by reference from our proxy statement for our 2015 Annual Meeting of Stockholders to be filed with the SEC within 120 days after the end of the year ended July 31, 2015.
ITEM 14. | PRINCIPAL ACCOUNTING FEES AND SERVICES |
The information required by this Item is incorporated by reference from our proxy statement for our 2015 Annual Meeting of Stockholders to be filed with the SEC within 120 days after the end of the year ended July 31, 2015.
111
PART IV
ITEM 15. | EXHIBITS AND FINANCIAL STATEMENT SCHEDULE |
(a)The following documents are filed as a part of this Annual Report on Form 10-K:
1.Financial Statements:
2.Financial Statement Schedule:
All schedules are omitted as the required information is inapplicable or the information is presented in the Consolidated Financial Statements or Notes to Consolidated Financial Statements under Item 8.
3.Exhibits:
See Exhibit Index following the signature page of this report.
112
SIGNATURES
Pursuant to the requirements of Section 13 or 15(d) of the Securities Exchange Act of 1934, the registrant has duly caused this report to be signed on its behalf by the undersigned, thereto duly authorized.
INFOBLOX INC. | ||||
Dated: September 24, 2015 | By: | /S/ Remo E. Canessa | ||
Remo E. Canessa Chief Financial Officer | ||||
POWER OF ATTORNEY
KNOW ALL PERSONS BY THESE PRESENTS, that each person whose signature appears below constitutes and appoints Jesper Andersen and Remo E. Canessa, jointly and severally, his attorneys-in-fact, each with the power of substitution, for him in any and all capacities, to sign any amendments to this report, and to file the same, with exhibits thereto and other documents in connection therewith, with the Securities and Exchange Commission, hereby ratifying and confirming all that each of said attorneys-in-fact, or his substitute or substitutes, may do or cause to be done by virtue hereof.
Pursuant to the requirements of the Securities Exchange Act of 1934, this report has been signed by the following persons on behalf of the registrant and in the capacities and on the dates indicated.
Signature | Title | Date | ||
/S/ Jesper Andersen | President, Chief Executive Officer and Director (Principal Executive Officer) | September 24, 2015 | ||
Jesper Andersen | ||||
/S/ Remo E. Canessa | Chief Financial Officer (Principal Financial and Accounting Officer) | September 24, 2015 | ||
Remo E. Canessa | ||||
/S/ Richard E. Belluzzo | Director | September 24, 2015 | ||
Richard E. Belluzzo | ||||
/S/ Laura C. Conigliaro | Director | September 24, 2015 | ||
Laura C. Conigliaro | ||||
/S/ Philip Fasano | Director | September 24, 2015 | ||
Philip Fasano | ||||
/S/ Fred M. Gerson | Director | September 24, 2015 | ||
Fred M. Gerson | ||||
/S/ Michael L. Goguen | Director | September 24, 2015 | ||
Michael L. Goguen | ||||
/S/ Daniel J. Phelps | Director | September 24, 2015 | ||
Daniel J. Phelps | ||||
113
Exhibit Index
Exhibit Number | Exhibit Title | Incorporated by Reference | ||||
Form | File No. | Exhibit No. | Filing Date | |||
3.01 | Form of Restated Certificate of Incorporation of the Registrant. | S-1 | 333-178925 | 3.02 | April 9, 2012 | |
3.02 | Form of Restated Bylaws of the Registrant. | S-1 | 333-178925 | 3.04 | April 9, 2012 | |
4.01 | Form of Registrant's Common Stock Certificate. | S-1 | 333-178925 | 4.01 | April 9, 2012 | |
4.02 | Third Amended and Restated Investors' Rights Agreement by and among the Registrant and the Preferred Stockholders of the Registrant dated May 1, 2010. | S-1 | 333-178925 | 4.02 | January 6, 2012 | |
10.01† | 2012 Employee Stock Purchase Plan, As Amended on February 25, 2014 | 10-Q | 001-35507 | 10.01 | March 7, 2014 | |
10.02† | 2012 Equity Incentive Plan | 10-Q | 001-35507 | 10.02 | March 5, 2013 | |
10.03† | Forms of Equity Award Agreements under 2012 Equity Incentive Plan | S-8 | 333-180840 | 99.4 | April 20, 2012 | |
10.04†* | Form of Market Stock Units Award Agreement under the 2012 Equity Incentive Plan | |||||
10.05† | Form of Indemnity Agreement. | S-1 | 333-178925 | 10.01 | April 9, 2012 | |
10.06† | 2003 Stock Plan and Form of Option Grant | S-8 | 333-178925 | 10.02 | January 6, 2012 | |
10.07† | 2005 Stock Plan. | S-1 | 333-178925 | 10.03 | January 6, 2012 | |
10.08† | Description of Infoblox Fiscal Year 2016 Bonus Plan | 8-K | 001-35507 | 5.02 | September 4, 2015 | |
10.09† | Offer Letter to Jesper Andersen from the Registrant, dated November 15, 2014 | 8-K | 001-35507 | 10.01 | November 25, 2014 | |
10.10† | Offer Letter to Remo E. Canessa from the Registrant, dated October 7, 2004, as amended on December 5, 2008. | S-1 | 333-178925 | 10.10 | January 6, 2012 | |
10.11†* | Offer Letter to Thorsten Freitag from the Registrant, dated September 18, 2014 | |||||
10.12† | Offer Letter to Scott J. Fulton from the Registrant, dated February 28, 2014 | 10-K | 001-35507 | 10.04 | September 25, 2015 | |
10.13† | Form of Change in Control Severance Agreement by and between Jesper Andersen and the Registrant. | 10-Q | 001-35507 | 10.03 | March 6, 2015 | |
10.14† | Form of 2015 Executive VP Tier Change in Control Severance Agreement | 10-Q | 001-35507 | 10.04 | March 6, 2015 | |
10.15 | Lease Agreement between Registrant and 3111-3141 Coronado Drive Associates, LLC, dated May 25, 2012. | 10-Q | 001-35507 | 10.04 | June 1, 2012 | |
23.01* | Consent of Independent Registered Public Accounting Firm | |||||
24.01* | Power of Attorney (included on Page 113) | |||||
31.01* | Certification of Jesper Andersen, Chief Executive Officer, pursuant to Rule 13a-14(a)/15d-14(a), as adopted pursuant to Section 302 of the Sarbanes-Oxley Act of 2002. | |||||
31.02* | Certification of Remo E. Canessa, Chief Financial Officer, pursuant to Rule 13a-14(a)/15d-14(a), as adopted pursuant to Section 302 of the Sarbanes-Oxley Act of 2002. | |||||
32.01* | Certification of Jesper Andersen, Chief Executive Officer, pursuant to 18 U.S.C. Section 1350, as adopted pursuant to Section 906 of the Sarbanes-Oxley Act of 2002. | |||||
32.02* | Certification of Remo E. Canessa, Chief Financial Officer, pursuant to 18 U.S.C. Section 1350, as adopted pursuant to Section 906 of the Sarbanes-Oxley Act of 2002. | |||||
101.INS†† | XBRL Instance Document | |||||
101.SCH†† | XBRL Taxonomy Schema Linkbase Document | |||||
101.CAL†† | XBRL Taxonomy Calculation Linkbase Document | |||||
101.DEF†† | XBRL Taxonomy Definition Linkbase Document | |||||
101.LAB†† | XBRL Taxonomy Labels Linkbase Document | |||||
101.PRE†† | XBRL Taxonomy Presentation Linkbase Document | |||||
* | Filed herewith. | |||||
† | Indicates a management contract, compensatory plan or arrangement | |||||
†† | Pursuant to applicable securities laws and regulations, the Registrant is deemed to have complied with the reporting obligation relating to the submission of interactive data files in such exhibits and is not subject to liability under any anti-fraud provisions of the federal securities laws as long as the Registrant has made a good faith attempt to comply with the submission requirements and promptly amends the interactive data files after becoming aware that the interactive data files fail to comply with the submission requirements. In accordance with Rule 406T of Regulation S-T, the information in these exhibits is furnished and deemed not filed or part of a registration statement or the Prospectus for purposes of sections 11 or 12 of the Securities Act of 1933, as amended, is deemed not filed for purposes of section 18 of the Exchange Act of 1934, and otherwise is not subject to liability under these sections. | |||||
114