Attached files
| file | filename |
|---|---|
| 8-K - FORM 8-K - KEYCORP /NEW/ | d95721d8k.htm |
| KeyCorp Barclays 2015 Global Financial Services Conference September 18, 2015 Don Kimble Chief Financial Officer Chris Gorman President, Key Corporate Bank Exhibit 99.1 |
| 2 FORWARD-LOOKING STATEMENTS AND ADDITIONAL INFORMATION DISCLOSURE This presentation contains forward-looking statements within the meaning of the Private Securities Litigation Reform Act of 1995. These
statements do not relate strictly to historical or current facts.
Forward-looking statements usually can be identified by the use of words such as “goal,” “objective,” “plan,” “expect,” “assume,” “anticipate,” “intend,” “project,” “believe,”
“estimate,” or other words of similar meaning. Forward-looking statements provide management’s current expectations or forecasts of future events, circumstances, results or aspirations. Forward-looking
statements, by their nature, are subject to assumptions, risks, and
uncertainties, many of which are outside of our control. Our actual results may differ materially from those set forth in our forward-looking statements. There is no assurance that any list of risks and uncertainties or risk factors is complete. Factors that could cause actual results to
differ from those described in forward-looking statements include,
but are not limited to: (1) deterioration of commercial real estate market fundamentals; (2) declining asset prices; (3) adverse changes in credit quality trends; (4) our concentrated credit exposure in commercial, financial, and agricultural
loans; (5) defaults by our loan counterparties or clients; (6) the
extensive and increasing regulation of the U.S. financial services industry; (7) changes in accounting policies, standards, and interpretations; (8) increasing capital and liquidity standards under applicable regulatory rules; (9)
unanticipated changes in our liquidity position, including but not
limited to, changes in the cost of liquidity, our ability to enter the financial markets and to secure alternative funding sources; (10) our ability to receive dividends from our subsidiary, KeyBank; (11) downgrades in our credit ratings or those
of KeyBank; (12) operational or risk management failures by us or
critical third-parties; (13) breaches of security or failures of our technology systems due to technological or other factors and cybersecurity threats; (14) negative outcomes from claims or litigation; (15) the occurrence of natural
or man-made disasters or conflicts or terrorist attacks; (16) a
reversal of the U.S. economic recovery due to financial, political or other shocks; (17) our ability to anticipate interest rate changes and manage interest rate risk; (18) deterioration of economic conditions in the geographic regions
where we operate; (19) the soundness of other financial institutions;
(20) our ability to attract and retain talented executives and employees and to manage our reputational risks; (21) our ability to timely and effectively implement our strategic initiatives; (22) increased competitive pressure due to
industry consolidation; (23) unanticipated adverse effects of strategic
partnerships or acquisitions and dispositions of assets or businesses; and (24) our ability to develop and effectively use the quantitative models we rely upon in our business planning.
We provide greater detail regarding these factors in our 2014 Form 10-K and
subsequent filings, which are available online at www.key.com/ir and
www.sec.gov. Any forward-looking statements made by us or on our behalf speak only
as of the date they are made, and Key does not undertake any obligation
to update any forward-looking statement to reflect the impact of subsequent events or circumstances. This presentation also includes certain non-GAAP financial measures related to “tangible common equity,” “Common Equity Tier
1,” “Tier 1 common equity,” “pre-provision net
revenue,” and “cash efficiency ratio.” Management believes these ratios may assist investors, analysts and regulators in analyzing Key’s financials. Although Key has procedures in place to ensure that these measures are calculated using the appropriate GAAP or
regulatory components, they have limitations as analytical tools and
should not be considered in isolation, or as a substitute for analysis of results under GAAP. For more information on these calculations and to view the reconciliations to the most comparable GAAP measures, please refer to the
appendix of this presentation or our most recent earnings press release.
|
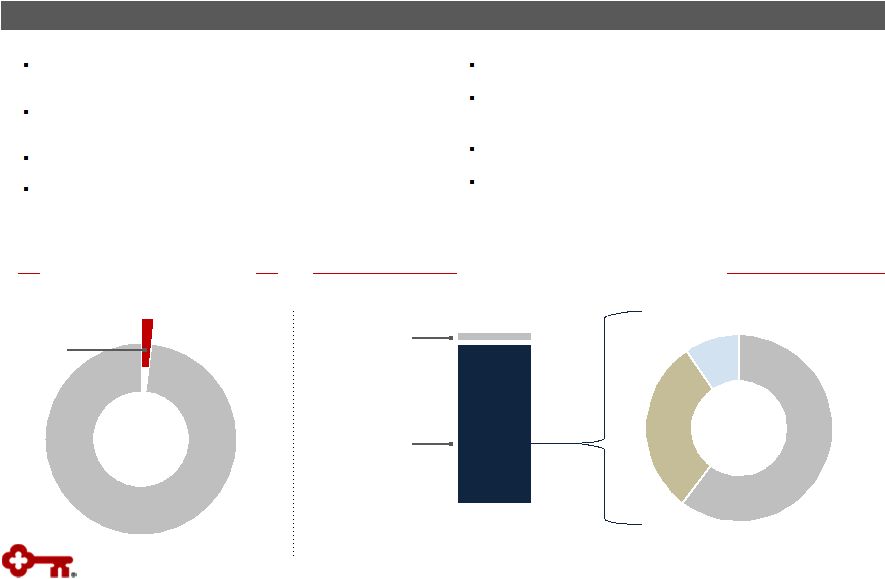
 3 Progress Made in 2015 • Client growth: new and expanded relationships
• Improved performance in core businesses • Positive operating leverage • Business investments Key continues to execute and deliver on commitments Driving Positive Operating Leverage Maintaining a Moderate Risk Profile Remaining Disciplined with Capital Management • Strong asset quality • NCOs below targeted range • Remaining disciplined with structure and relationship focus Note: not all graphs not to scale (a) Payout ratio calculations based upon CCAR submissions and generally available industry data
(b) Capital return includes cash dividends paid and common share repurchases; common share repurchase amount includes repurchases to offset
issuances of common shares under our employee compensation
plans 1H14
1H15 1H15 net charge-offs to average loans .22% - .40% .60% 1.00% Targeted range • Shareholder payout among the highest in peer group (a) : 82% of FY14 net income returned to shareholders • Increased common share dividend by 15% in 2Q15 • Continued execution of share repurchases: over $300 million in 1H15 1H14 1H15 PPNR up 4% Capital return up 28% (b) Cash dividends paid Common share repurchases |
 4 Focused Forward: Driving Positive Operating Leverage
Executing action plans across our organization to improve productivity and
efficiency Revenue Growth
Revenue Growth Expense Savings Expense Savings Acquiring and expanding relationships to grow our businesses • New vertical and expertise:
technology • New product launches: Hassle-Free,
purchase card and prepaid card
• Leveraging strategic partnerships • Adding bankers • Enhanced sales management process Improving Productivity Strengthening Products and Capabilities Continuous improvement efforts enable identification and execution of expense savings Occupancy Right-sizing Operational Efficiencies • Optimizing branch count: continued net reduction • Reducing non-branch square
footage: plans to reduce 15% of
non-branch
square footage by 2016
• FTE remixing: support, sales and
service •
Business realignment: exit of Victory and international leasing, reduction of fixed income trading platform • Lean Six Sigma: end-to-end process
improvements Total FTE:
13% 2Q12 2Q15 Core Business Growth • Investing in our core, relationship-based businesses • Aligning resources with opportunity LTM Investment Banking & Debt Placement Fees: 20% 2Q14 LTM 2Q15 LTM Note: Graphs not to scale; LTM denotes the ‘last twelve months’ |
 5 Focused Forward: Moderate Risk Profile
Enterprise-wide risk management approach
Targeted, Relationship-based Approach
Targeted, Relationship-based Approach
Strong Asset Quality, Below Targeted Range
Strong Asset Quality, Below Targeted Range
• Target specific segments and sectors where we have expertise • Execute rigorous and disciplined sales approach • Clearly defined and well understood risk appetite and tolerances • Risk management principles applied actively 0.00% 0.20% 0.40% 0.60% 0.80% 1.00% 2Q12 4Q12 2Q13 4Q13 2Q14 4Q14 2Q15 Targeted range: .40% – .60% Net Charge-offs to Average Loans 6/30/12 6/30/13 6/30/14 6/30/15 Nonperforming Loans to Period-End Loans (45)% Allowance to Nonperforming Loans Continuing operations 135% 134% 206% 190% 6/30/12 6/30/13 6/30/14 6/30/15 |
 6 Focused Forward: Disciplined Capital Management
Allows Key to execute on strategic priorities and maximize shareholder value
Strong Capital Position
Strong Capital Position
Disciplined Management
Disciplined Management
Maximizing Shareholder Value
Maximizing Shareholder Value
1. Organic growth 2. Dividends 3. Share repurchases 4. Opportunistic growth 2014 Total Shareholder Payout (a) Peers Note: Tangible book value and common share dividend reflect data at period-end
(a) Dividends and share repurchases as a percent of net income; source: peer SEC filings; peers include: BBT, CMA, FITB, HBAN, MTB, PNC, RF, STI,
USB, and ZION
2Q12 2Q13 2Q14 2Q15 Tangible Book Value per Share +16% 2Q12 2Q13 2Q14 2Q15 +50% Common Share Dividend 10.7% 9.9% Common Equity Tier 1 Ratio, 6/30/15 Tangible Common Equity to Tangible Assets, 6/30/15 |
 Outlook and
Expectations Average Loans
• Mid-single digit growth vs. FY 2014 Net Interest Income • Up low single-digits without the benefit of higher rates • NIM: down from FY 2014, reflecting continued elevated levels of liquidity; relatively
stable with 2Q15 reported level
Noninterest Income • Mid-single digit growth compared to 2014 Expense • Relatively stable with 2014 Efficiency / Productivity • Positive operating leverage Asset Quality • Net charge-offs to average loans below targeted range of 40 – 60 bps • Provision expected to approximate net charge-offs Capital • Disciplined management of capital including dividends and share repurchases 7 Guidance ranges: relatively stable: +/- 2%; low single-digit: <5%; mid-single digit: 4% - 6%; low double-digit: 10% - 13% FY 2015 FY 2015 |
       40% 54% 6% Corporate Bank Key’s Corporate Bank Key’s Corporate Bank Key 2014 Revenue Key 2014 Revenue Business Business Description Description Community Bank Other Corporate Bank Real Estate Capital KeyBanc Capital Markets Equipment Finance Provides leading commercial real estate finance services, including construction and interim finance, permanent mortgages, commercial real estate loan servicing, agency financing solutions, and commercial payments Offers a complete suite of corporate and investment banking services to clients, including loans, M&A advisory, equity and debt underwriting, syndicated finance, research, trading, derivatives, foreign exchange, and commercial payments Provides tailored equipment lease and finance solutions to meet client needs 8 A full-service corporate and investment bank serving middle market clients in targeted industry verticals |
 Regional
Banks Regional Banks
Bulge Bracket Bulge Bracket Capability / Model Capability / Model Middle Market Focus Industry-driven Model Investment Banking Commercial Banking Boutiques Boutiques Note: Operating model and capabilities comparison data are illustrative and represent a typical firm within each category; some exceptions will apply Differentiated Operating Model Most regional banks align by geography. Key competes nationally based on industry expertise a significant competitive advantage 9 Our middle market focus, industry-driven operating model and broad corporate &
investment banking capability set are unique… and drive results
Focused Franchise Focused Franchise Deep Industry Knowledge Deep Industry Knowledge Case Study: Industrial (Metals & Mining Practice) Case Study: Industrial (Metals & Mining Practice) • Four dedicated metals & mining coverage bankers with aligned M&A, syndications and capital markets professionals • Leading M&A advisory practice • Strong presence across industry events • Highly-rated equity research franchise (two analysts covering 38 companies) • $1B in capital committed to sector • > 40 clients and 150 prospects |
 Delivering
the Distinctive Platform Our ability to lead transactions across markets
allows us to match client needs with market conditions and deliver best
execution •
Key Corporate Bank completed > 1,000 transactions raising nearly $60B in capital
for our clients, ~20% of which went to our balance sheet (LTM
2Q15) Healthcare
Energy Consumer Industrial Public Sector Real Estate Key’s Balance Sheet Equity Capital Markets Syndicated Loans Real Estate Capital Markets Debt Capital Markets (IG/HY/Public Fin.) Industry Verticals Industry Verticals Capital Placement ($B) Capital Placement ($B) Key’s Capital Solutions Key’s Capital Solutions Credit facility (bank or institutional) Bridge loan Direct placement (debt or equity) Equity offerings (IPOs / FOs / converts) Commercial mortgage Investment grade & high-yield debt Mezzanine capital placement Tax-exempt securities $11 $32 $7 $7 $2 Additional value is created as Key delivers non-capital solutions (e.g., payments, derivatives, foreign exchange, financial advisory) to clients Note: Capital placement $ are LTM 2Q15 and include: in transactions where Key served as bookrunner (or equivalent) -- 100% of capital raised; in transactions where Key served as co-manager -- the proportion of capital corresponding to Key’s transaction economics (e.g., $20MM if Key were a 10% co-manager on a $200MM equity offering); balance sheet figures represent loan commitments; data excludes equipment finance and syndicated loan
participations Technology
10 |
 Solid
progress in growing both loans and investment banking & debt placement
fees -- demonstrating the power of our model • Since 1Q09, investment banking and debt placement fees have increased substantially as we
focused on a more targeted client base
• Loan balances up $9B (+53%) vs. 2Q11 trough Consistent Progress Corporate Bank loan balances Corporate Bank LTM investment banking & debt placement fees Loan Balances ($B) & LTM Investment Banking & Debt Placement Fees ($MM) Loan Balances ($B) & LTM Investment Banking & Debt Placement Fees ($MM) Note: Chart depicts period-end loan balances and investment banking and debt placement fees for Key Corporate Bank only; LTM denotes the ‘last
twelve months’ 11 |
 5.7% 5.3% 4.6% 4.0% 4.0% 3.9% 3.5% 3.2% Strong Relative Performance Results compare favorably to external benchmarks we are gaining loan share with higher asset productivity Commercial and Industrial Loan Growth Commercial and Industrial Loan Growth Asset Productivity Asset Productivity Since our portfolio troughed in 2Q11, Key Corporate Bank has taken C&I loan share… …while our broad product capabilities generate peer-leading asset productivity Revenue / Assets (1H15 Annualized) Peers Key Corporate Bank U.S. commercial banks Commercial and Industrial Loans % change vs. 2Q11: Source: Loans and leases; Federal Reserve H8 report dated September 1, 2015; Peer data from SEC filings and earnings releases; Peer data
for Corporate Bank equivalent segments of peer financial institutions
(e.g., PNC Corporate & Institutional Banking segment). Peer banks include BAC, CMA, JPM, PNC, STI, USB, WFC. Revenue / assets calculation equals 1H15 annualized revenue divided by 1H15 average assets for Key Corporate Bank and peers.
Commercial and Industrial
Loan Growth 12 |
 42% 58% Credit Fee New Client Profile: Product New Client Profile: Product New Client Profile: Revenue New Client Profile: Revenue ~200 clients Of clients acquired in 2015, only 29% are credit only… …and fee revenue represents 58% of total new client revenue ~$60 million Note: Revenue figures are total realized revenue through June YTD 2015 Fee Clients Fee Revenue Key Corporate Bank’s new clients have a stronger risk profile than our existing portfolio average 13 Growing Our Franchise: New Client Impact Key Corporate Bank has acquired nearly 200 new client relationships through the first half of 2015, driving significant franchise value while maintaining a moderate
risk profile 29% 18% 53% Credit Only Credit + Fee Fee Only |
 We are
focused on expanding our commercial payments franchise, an attractive
annuity-based business that allows Key to deepen client relationships
Commercial Payments: Core Momentum
Key’s Actions Key’s Actions • Leadership changes new players and new roles • New talent ~20% of team new to commercial payments or Key • Vertical focus tailor industry-specific solutions aligned to Key’s verticals • Product enhancements investments to strengthen capabilities – Commercial card – Core treasury – Specialized solutions • Strategic partnerships leveraging third- party providers to deliver differentiated, specialized client solutions 14 Impact Impact Revenue YTD15 YTD14 Cards & Payments Revenue YTD15 YTD14 Production YTD15 YTD14 Average Deal Size YTD15 YTD14 +17% +17% +28% +49% |
 Key
utilizes our complete platform and a solutions-driven approach to help our
clients drive growth and achieve their strategic goals
Key’s Differentiated Model in Action: Metals Case Study
Legacy Client Profile (FY13)
Legacy Client Profile (FY13)
• Business profile – Products: Engine Components, Fuel Systems, Powertrain, Transmission, Steering – Top end markets – Light Auto (60%) – General Industrial (25%) – Heavy Truck (5%) • Financial profile – Revenue: $375MM – Adj. EBITDA Margin: 13% – Enterprise Value (EV): $400MM – EV / Adj. EBITDA: 6.0x • New leadership 15 Key’s Model in Action Key’s Model in Action Client Profile Today Client Profile Today • Business profile – Products: Engine Components, Fuel Systems, Powertrain, Transmission, Steering, Medical Devices, Aircraft Structural & Communications Components, Electrical Transmission & Distribution Components – Top end markets: – Light Auto (54%) – General Industrial / Aerospace (19%) – Medical (12%) • Financial profile – Revenue: $900MM – Adj. EBITDA Margin: 20% – Enterprise Value (EV): $1.4B – EV / Adj. EBITDA: 8.0x • Strategic advice – Active, ongoing strategic/M&A dialogue, including proprietary deal flow – Two successful buy-side M&A engagements • Capital markets support and sponsorship – Joint Bookrunner on two senior secured credit facilities (> $1B in total capital raised) – Sole Bookrunner on $180MM follow-on equity offering – Joint Bookrunner on $300MM senior unsecured notes offering – Consistent provider of equity research coverage – Non-deal roadshows – Industry conferences – Capital markets updates Note: Key’s Model in Action and Client Profile Today are pro forma for a pending acquisition and associated financings
|
| Appendix 16 *************************************************** ***************************************************** |
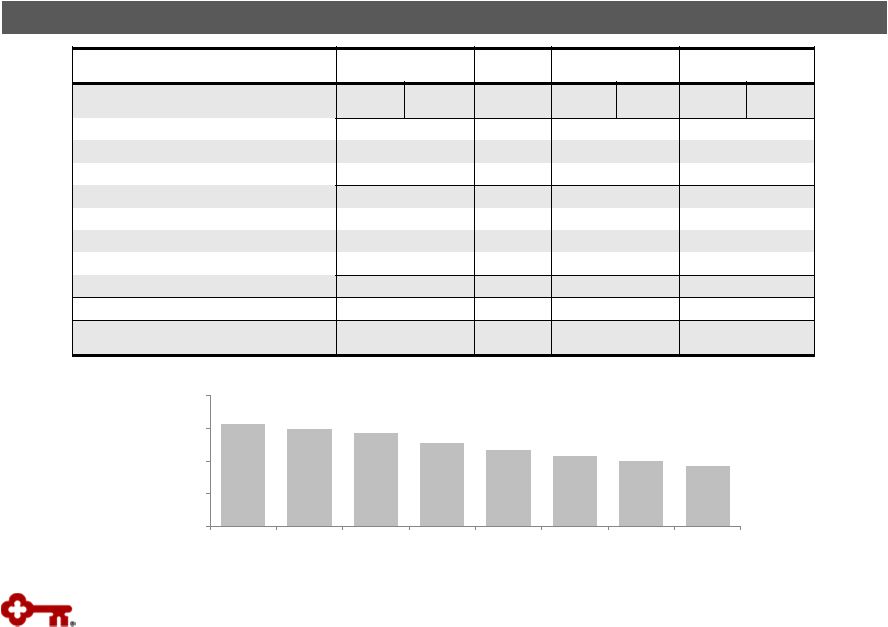
 Progress on
Targets for Success (a)
Continuing operations, unless otherwise noted
(b) Represents period-end consolidated total loans and loans held for sale divided by period-end consolidated total deposits (excluding
deposits in foreign office) (c)
Excludes intangible asset amortization; non-GAAP measure: see slides 31-32 for
reconciliation 17
Balance Sheet Efficiency Balance Sheet Efficiency Moderate Risk Profile Moderate Risk Profile High Quality, Diverse Revenue Streams High Quality, Diverse Revenue Streams Positive Operating Leverage Positive Operating Leverage Disciplined Capital Management Disciplined Capital Management Metrics (a) 2012 2013 Targets Loan to deposit ratio (b) Loan to deposit ratio (b) NCOs to average loans NCOs to average loans Provision for credit losses to average loans Provision for credit losses to average loans Net interest margin Net interest margin Noninterest income to total revenue Noninterest income to total revenue Cash efficiency ratio (c) Cash efficiency ratio (c) Return on average assets Return on average assets 86% 85% .69% .20% 67.8% 66.2% 1.03% 1.08 % .42% .10% 3.21% 2.97% 45% 44% 90% -100% .40% - .60% LT: >3.50% LT: <60% 1.00% -1.25% >40% 2014 2Q15 84% .32% 67.3% 1.03% .26% 3.12% 43% 87% .25% 65.1% 1.03% .28% 2.88% 45% |
 18 Financial Highlights TE = Taxable equivalent, EOP = End of Period (a) From continuing operations (b) Year-over-year average balance growth (c) From consolidated operations (d) Non-GAAP measure: see slides 31-32 for reconciliation EPS – assuming dilution $ .27 $ .26 $ .28 $ .23 $ .27 Cash efficiency ratio (d) 65.1 % 65.1 % 64.4 % 69.7 % 65.6 % Net interest margin (TE) 2.88 2.91 2.94 2.96 2.98 Return on average total assets 1.03 1.03 1.12 .92 1.14 Total loans and leases 4 % 5 % 5 % 5 % 6 % CF&A loans 10 12 12 11 13 Deposits (excl. foreign deposits) 6 5 2 4 2 Common Equity Tier 1 (d) 10.7 % 10.6 % - - - Tier 1 common equity (d) - - 11.2 % 11.3 % 11.3 % Tier 1 risk-based capital 11.1 11.0 11.9 12.0 12.0 Tangible common equity to tangible assets (d) 9.9 9.9 9.9 10.3 10.2 NCOs to average loans .25 % .20 % .22 % .22 % .22 % NPLs to EOP portfolio loans .72 .75 .73 .71 .71 Allowance for loan losses to EOP loans 1.37 1.37 1.38 1.43 1.46 Balance Sheet Growth (a), (b) Balance Sheet Growth (a), (b) Capital (c) Capital (c) Asset Quality (a) Asset Quality (a) Financial Performance (a) Metrics 2Q15 1Q15 4Q14 3Q14 2Q14 |
 19 Loan growth continues to be driven primarily by CF&A loans Deposit growth of 6% from 2Q14 due to strength in commercial mortgage servicing and commercial and consumer client inflows Deposit cost continues to improve compared to prior year Strong Balance Sheet Highlights Highlights Average Total Loan and Deposit Growth Average Total Loan and Deposit Growth Funding Cost Funding Cost (a) Excludes deposits in foreign office $40.0 $55.0 $70.0 3Q13 4Q13 1Q14 2Q14 3Q14 4Q14 1Q15 2Q15 $ in billions Total average loans Total average deposits (a) Deposits up 6% Y-o-Y Loans up 4% Y-o-Y $21.0 $23.0 $25.0 $27.0 $29.0 3Q13 4Q13 1Q14 2Q14 3Q14 4Q14 1Q15 2Q15 $ in billions Average Commercial, Financial & Agricultural Loans Average Commercial, Financial & Agricultural Loans $26.4 $29.0 Cost of total deposits (a) Interest-bearing liability cost |
 20 Average Total Investment Securities Average Total Investment Securities Highlights Highlights Average AFS securities $ in billions High Quality Investment Portfolio Portfolio composed primarily of GNMA and GSE- backed MBS and CMOs Continue to position portfolio for upcoming regulatory liquidity requirements: – 2015 average balance growth reflects actions taken to increase liquidity reserves – Growth and reinvestment of portfolio cash flows have been predominantly in GNMA securities (~47% of total portfolio was GNMA at 6/30/15) Securities cash flows of $1.1 billion in 2Q15, up slightly from $1 billion in 1Q15 Average portfolio life at 6/30/15 of 3.8 years, compared to 3.5 years at 3/31/15 Securities to Total Assets (b) Securities to Total Assets (b) (a) Yield is calculated on the basis of amortized cost (b) Includes end of period held-to-maturity and available-for-sale securities
Average yield (a) Average HTM securities 2.10% .00% 1.00% 2.00% 3.00% $0.0 $5.0 $10.0 $15.0 $20.0 3Q13 4Q13 1Q14 2Q14 3Q14 4Q14 1Q15 2Q15 19% 20% 10% 14% 18% 22% 3Q13 4Q13 1Q14 2Q14 3Q14 4Q14 1Q15 2Q15 $17.4 2.17% $18.3 |
 Interest
Rate Risk Management Naturally Asset Sensitive Balance Sheet
Naturally Asset Sensitive Balance Sheet
Actively Managing Rate Risk
Actively Managing Rate Risk
• High quality • Fixed rate agency MBS and CMOs • Average maturity: 3.8 years • GNMAs total 47% of total portfolio • Reinvesting cash flows into GNMAs $11 $17 $7 $7 Size of swap portfolio Modeled asset sensitivity ~3% 0% ~7% $7 Flexibility to Adjust Rate Sensitivity with Swaps (b) Loan Portfolio Variable: 70% Fixed: 30% Deposits (a) Flexibility to adjust rate sensitivity for changes in balance sheet growth/mix as well as interest rate outlook Debt hedges A/LM hedges Investment Portfolio Noninterest- bearing: 38% Interest- bearing, non- time: 55% CDs: 7% • Maintaining moderate asset sensitive position of ~3% - Assumes 200 basis point increase in short or intermediate- term rates over a 12-month period • Utilize swaps for debt hedging and asset liability management - Fairly even pace of A/LM swap maturities 6/30/15 Swaps ($ in B) 6/30/15 Notional Amt. Wtd. Avg. Maturity (Yrs.) Receive Rate Pay Rate A/L Management $ 10.5 2.6 1.0% .2% Debt 6.8 3.5 2.1 .2 $ 17.3 1.5% .2% 2Q15 $18 B AFS: $13 B HTM: $5 B Balance sheet has relatively short duration and is impacted by short and intermediate-term rates $17 B 21 Actively managing a naturally asset sensitive balance sheet Note: Loan, deposit and investment portfolio balances reflect quarterly average balances
(a) Excludes deposits in foreign office (b) May not foot due to rounding 2Q15 2Q15 |
 22 High Quality and Diverse Revenue TE = Taxable equivalent Net Interest Income & Net Interest Margin Trend (TE) Net Interest Income & Net Interest Margin Trend (TE) Noninterest Income Noninterest Income Net interest income (TE) NIM (TE) $ in millions; continuing operations Highlights Highlights $ in millions; continuing operations Leveraged lease termination gains $579 $591 2.98% 2.88% 2.00% 2.50% 3.00% 3.50% 4.00% $500 $540 $580 $620 3Q13 4Q13 1Q14 2Q14 3Q14 4Q14 1Q15 2Q15 $150 $225 $300 $375 $450 $525 3Q13 4Q13 1Q14 2Q14 3Q14 4Q14 1Q15 2Q15 $455 $488 23% 29% 13% 9% 9% 2% 5% 10% Trust & Investment Services Investment Banking & Debt Placement Deposit Service Charges Cards & Payments Corporate Services Mortgage Fees Operating Lease Income Other 2Q15 Noninterest Income Diversity (a) Other includes corporate-owned life insurance, principal investing, etc. (a) Diverse noninterest income contributes over 40% of total revenue 2Q15: Record quarter for investment banking and debt placement fees Growth in core businesses 2Q15 net interest income growth reflects higher loan balances offset by lower earning asset yields |
 $400 $500 $600 $700 $800 3Q13 4Q13 1Q14 2Q14 3Q14 4Q14 1Q15 2Q15 23 Focused Expense Management Noninterest Expense Noninterest Expense $ in millions Highlights Highlights $687 (a) Non-GAAP measure: see slides 31-32 for reconciliation (b) 3Q12 excludes one-time gains of $54 million related to the redemption of trust preferred securities
Cash Efficiency Ratio
(a), (b) Cash Efficiency Ratio (a), (b) Cash efficiency ratio, excl. costs for continuous improvement efforts $711 2Q15 noninterest expense up 3% from prior year, primarily attributed to: – Performance-based compensation – Costs associated with the 3Q14 acquisition of Pacific Crest 2Q15 included $10 MM of costs associated with continuous improvement and efficiency efforts Expense growth of 6% from 1Q15 driven by: – Performance-based compensation – Seasonal trends • Annual merit increases • Increased day count • Higher marketing spend • Lower employee benefits expense – Business services and professional fees |
 $30
$36 $12 $41 .22% .25% .00% .20% .40% .60% $0 $10 $20 $30 $40 $50 3Q13 4Q13 1Q14 2Q14 3Q14 4Q14 1Q15 2Q15 .71% .72% 0.40% 0.80% 1.20% 1.60% $0 $200 $400 $600 $800 3Q13 4Q13 1Q14 2Q14 3Q14 4Q14 1Q15 2Q15 24 Nonperforming Assets Nonperforming Assets Net Charge-offs & Provision for Credit Losses Net Charge-offs & Provision for Credit Losses NPLs NPLs to period-end loans NCOs Provision for credit losses NCOs to average loans $ in millions $ in millions NPLs held for sale, OREO & other NPAs Strong Asset Quality Highlights Highlights Net loan charge-offs remain below targeted range, at 25 basis points of average loans Nonperforming loans represented 72 basis points of period-end loans Allowance for loan and lease losses represented 1.37% of period-end loans: 190% coverage of nonperforming loans Allowance for Loan and Lease Losses Allowance for Loan and Lease Losses Allowance for loan and lease losses to NPLs Allowance for loan and lease losses $ in millions $814 $796 206% 190% 110% 135% 160% 185% 210% $600 $700 $800 $900 $1,000 3Q13 4Q13 1Q14 2Q14 3Q14 4Q14 1Q15 2Q15 $410 $440 |
 Period- end loans Average loans Net loan charge- offs Net loan charge-offs (b) / average loans (%) Nonperforming loans (c) Ending allowance Allowance / period-end loans (%) Allowance / NPLs (%) 6/30/15 2Q15 2Q15 2Q15 6/30/15 6/30/15 6/30/15 6/30/15 Commercial, financial and agricultural (a) $ 29,285 $ 29,017 $ 15 .21% $ 100
$
418 1.43%
418.00% Commercial real estate: Commercial Mortgage 7,874 7,981 - - 26 144 1.83 553.85 Construction 1,254 1,199 (1) (.33) 12 31 2.47 258.33 Commercial lease financing 4,010 3,981 - - 18 53 1.32 294.44 Real estate – residential mortgage 2,252 2,237 - - 67 20 .89 29.85 Home equity 10,532 10,510 8 .31 184 61 .58 33.15 Credit cards 753 737 7 3.81 2 31 4.12 N/M Consumer other – Key Community Bank 1,595 1,571 4 1.02 1 21 1.32 N/M Consumer other – Exit Portfolio 709 745 3 1.62 9 17 2.40 188.89 Continuing total (d) $ 58,264 $ 57,978 $ 36 .25% $ 419
$
796 1.37%
189.98% Discontinued operations 1,962 2,168 2 .37 6 22 1.12 366.67 Consolidated total $ 60,226 $ 60,146 $ 38 .25% $ 425
$
818 1.36%
192.47% Credit Quality by Portfolio Credit Quality by Portfolio Credit Quality $ in millions 25 (a) 6-30-15 ending loan balance includes $89 million of commercial credit card balances; 6-30-15 average loan balance includes $88
million of assets from commercial credit cards
(b) Net loan charge-off amounts are annualized in calculation (c) 6-30-15 NPL amount excludes $12 million of purchased credit impaired loans
(d) 6-30-15 ending loan balance includes purchased loans of $125 million, of which $12 million were purchased credit impaired
N/M = Not meaningful |
 26 Asset Quality Trends Criticized Outstandings (a) to Period-end Total Loans Criticized Outstandings (a) to Period-end Total Loans Delinquencies to Period-end Total Loans Delinquencies to Period-end Total Loans (a) Loan and lease outstandings (b) From continuing operations 30 – 89 days delinquent 90+ days delinquent .49% .31% .15% .11% .00% .25% .50% .75% 3Q13 4Q13 1Q14 2Q14 3Q14 4Q14 1Q15 2Q15 2.7% 3.1% 0.0% 1.0% 2.0% 3.0% 4.0% 3Q13 4Q13 1Q14 2Q14 3Q14 4Q14 1Q15 2Q15 Metric (b) 2Q15 1Q15 4Q14 3Q14 2Q14 Delinquencies to EOP total loans: 30-89 days .31 % .37 % .41 % .61 % .49 % Delinquencies to EOP total loans: 90+ days .11 .19 .17 .13 .15 NPLs to EOP portfolio loans .72 .75 .73 .71 .71 NPAs to EOP portfolio loans + OREO + Other NPAs .75 .79 .76 .74 .74 Allowance for loan losses to period-end loans 1.37 1.37 1.38 1.43 1.46 Allowance for loan losses to NPLs 189.8 181.7 190.0 200.5 205.6 Continuing operations Continuing operations |
 Vintage
(% of Loans) Loan
Balances Average Loan Size ($) Average FICO Average LTV (a) % of Loans LTV>90% 2012 and later 2011 2010 2009 2008 and prior Loans and lines First lien $ 6,207 $ 64,383 770 67 % .5 % 55 % 4 % 3 % 3 % 35 % Second lien 4,089 51,618 765 76 3.4 37 4 3 4 52 Community Bank $ 10,296 58,741 768 71 1.6 48 4 3 3 42 Exit portfolio 236 19,156 729 80 29.0 - - - - 100 Total home equity portfolio $ 10,532 Nonaccrual loans and lines First lien $ 102
$ 65,179
723 72 % 1.3 % 12 % 3 % 3 % 5 % 77 % Second lien 74 47,054 712 80 1.3 5 2 2 4 87 Community Bank $ 176
56,140 718 76 1.3 9 3 2 5 81 Exit portfolio 8 22,626 702 75 24.0 - - - - 100 Total home equity nonaccruals $ 184
Second quarter net charge-offs (NCOs)
Community Bank $ 7
20 % 1 % 2 % 5 % 72 % % of average loans .27% Exit Portfolio $ 1
- - - - - % of average loans 1.64% (a) Average LTVs are at origination; current average LTVs for Community Bank total home equity loans and lines is approximately 68%, compared to
70% at the end of the first quarter of 2015
Home Equity Portfolio –6/30/15
Home Equity Portfolio –6/30/15
$ in millions, except average loan size
Home Equity Portfolio Highlights Highlights High quality portfolio Community bank loans and lines: 98% of total portfolio; branch- originated – 60% first lien position – Average FICO score of 768 – Average LTV at origination: 71% $3.9 billion of the total portfolio are fixed rate loans that require principal and interest payments; $6.6 billion are lines $1.3 billion in lines outstanding (12% of the total portfolio) come to end of draw period in the next four years – Proactive communication and client outreach initiated near end of draw period 27 |
 Oil &
Gas Longstanding history, expertise and relationships
28 Strong Portfolio Characteristics Strong Portfolio Characteristics >10 years of experience in energy lending with >20 specialists dedicated to oil & gas Focused on middle market companies, aligned with our relationship strategy Portfolio regularly stress tested Primarily secured by proven reserves Total Loans Outstanding, 6/30/15 >40% of clients’ 2015 production is hedged Relationships contribute to noninterest income; ~5% of FY14 investment banking and debt placement fees Net charge-offs lower than overall portfolio Allowance reflects estimated impact of current oil prices Oil & Gas: 2% Other: 98% Oil & Gas Outstanding Balances, 6/30/15 Oilfield Services Upstream: 60%, $0.6 B Midstream: 30%, $0.3 B Downstream: 10%, $0.1 B $0.1 B Oil & Gas $1.0 B |
 Balance
Outstanding Change
Net Loan Charge-offs
Balance on Nonperforming Status 6-30-15 3-31-15 6-30-15 vs. 3-31-15 2Q15 1Q15 (b) 6-30-15 3-31-15 Residential properties – homebuilder $ 6 $ 6 - - $ 1 $ 8 $ 8 Marine and RV floor plan 2 6 $ (4) - - 1 5 Commercial lease financing (a) 831 877 (46) - (1) - - Total commercial loans 839 889 (50) - - 9 13 Home equity – Other 236 253 (17) $ 1 - 8 9 Marine 673 730 (57) 3 2 8 9 RV and other consumer 47 50 (3) - 1 1 1 Total consumer loans 956 1,033 (77) 4 3 17 19 Total exit loans in loan portfolio 1,795 1,922 $ (127) $ 4 $ 3 $ 26 $ 32 Discontinued operations – education lending business (not included in exit loans above) (c) $ 1,962 $ 2,219 $ (257) $ 2 $ 6 $ 6 $ 8 $2,560 $1,859 $0 $1,000 $2,000 $3,000 $4,000 3Q13 4Q13 1Q14 2Q14 3Q14 4Q14 1Q15 2Q15 $ in millions; average balances (a) Includes (1) the business aviation, commercial vehicle, office products, construction and industrial leases; (2) Canadian lease financing portfolios; (3) European lease financing portfolios; and (4) all remaining balances related to lease in, lease out; sale in, lease out; service contract leases; and
qualified technological equipment leases
(b) Credit amounts indicate recoveries exceeded charge-offs (c) Excludes loans held for sale of $179 million at June 30, 2015 $ in millions Exit Loan Portfolio Exit Loan Portfolio Exit Loan Portfolio 29 |
 30 Disciplined capital management – Increased quarterly common share dividend by 15% – Repurchased $129 MM of common shares in 2Q15 Tier 1 Common Equity (a) Tier 1 Common Equity (a) Tangible Common Equity to Tangible Assets (a) Tangible Common Equity to Tangible Assets (a) Strong Capital Highlights Highlights Book Value per Share Book Value per Share Note: Common share repurchase amounts include repurchases to offset issuances of common shares under our employee compensation plans
(a) Non-GAAP measure: see slides 31-32 for reconciliations (b) The Regulatory Capital Rules, effective January 1, 2015 for Key, introduced a new capital measure, “Common Equity Tier 1”
$11.65 $12.21 $9.00 $10.00 $11.00 $12.00 $13.00 3Q13 4Q13 1Q14 2Q14 3Q14 4Q14 1Q15 2Q15 11.25% 10.71% 6.00% 8.00% 10.00% 12.00% 3Q13 4Q13 1Q14 2Q14 3Q14 4Q14 1Q15 2Q15 10.15% 9.86% 6.00% 7.00% 8.00% 9.00% 10.00% 11.00% 3Q13 4Q13 1Q14 2Q14 3Q14 4Q14 1Q15 2Q15 Common Equity Tier 1 (a), (b) Common Equity Tier 1 (a), (b) |
 Three
months ended 6-30-15
3-31-15 12-31-14 9-30-14 6-30-14 Tangible common equity to tangible assets at period end Key shareholders’ equity (GAAP) $ 10,590 $ 10,603 $ 10,530 $ 10,486 $ 10,504 Less: Intangible assets (a) 1,085 1,088 1,090 1,105 1,008 Preferred Stock, Series A (b) 281 281 282 282 282 Tangible common equity (non-GAAP) $ 9,224 $ 9,234 $ 9,158 $ 9,099 $ 9,214 Total assets (GAAP) $ 94,606 $ 94,206 $ 93,821 $ 89,784 $ 91,798 Less: Intangible assets (a) 1,085 1,088 1,090 1,105 1,008 Tangible assets (non-GAAP) $ 93,521 $ 93,118 $ 92,731 $ 88,679 $ 90,790 Tangible common equity to tangible assets ratio (non-GAAP) 9.86 % 9.92 % 9.88 % 10.26 % 10.15 % Common Equity Tier 1 at period end Key shareholders’ equity (GAAP) $ 10,590 $ 10,603 - - - Less: Preferred Stock, Series A (b) 281 281 - - - Common Equity Tier 1 capital before adjustments and deductions 10,309 10,322 - - - Less: Goodwill, net of deferred taxes 1,034 1,036 - - - Intangible assets, net of deferred taxes 33 36 - - - Deferred tax assets 1 1 - - - Net unrealized gains (losses) on available-for-sale securities, net of
deferred taxes - 52 - - - Accumulated gains (losses) on cash flow hedges, net of deferred taxes (20) (8) - - - Amounts in AOCI attributed to pension and postretirement benefit costs, net of deferred taxes (361) (364) - - - Total Common Equity Tier 1 capital $ 9,622 $ 9,569 - - - Net risk-weighted assets (regulatory) $ 89,851 $ 89,967 - - - Common Equity Tier 1 ratio (non-GAAP) 10.71 % 10.64 % - - - Tier 1 common equity at period end Key shareholders’ equity (GAAP) - - $ 10,530 $ 10,486 $ 10,504 Qualifying capital securities - - 339 340 339 Less: Goodwill - - 1,057 1,051 979 Accumulated other comprehensive income (loss) (c) - - (395) (366) (328) Other assets (d) - - 83 110 86 Total Tier 1 capital (regulatory) - - 10,124 10,031 10,106 Less: Qualifying capital securities - - 339 340 339 Preferred Stock, Series A (b) - - 282 282 282 Total Tier 1 common equity (non-GAAP) - - $ 9,503 $ 9,409 $ 9,485 Net risk-weighted assets (regulatory) - - $ 85,100 $ 83,547 $ 84,287 Tier 1 common equity ratio (non-GAAP) - - 11.17 % 11.26 % 11.25 % GAAP to Non-GAAP Reconciliation $ in millions 31 a) Three months ended 6/30/15, 3/31/15, 12/31/14, 9/30/14, and 6/30/14 exclude $55 million, $61 million, $68 million, $72 million, and $79 million, respectively, of period-end purchased credit card receivables b) Net of capital surplus c) Includes net unrealized gains or losses on securities available for sale (except for net unrealized losses on marketable equity securities), net
gains or losses on cash flow hedges, and amounts resulting from the
application of the applicable accounting guidance for defined benefit and other postretirement plans d) Other assets deducted from Tier 1 capital and net risk-weighted assets consist of disallowed intangible assets (excluding goodwill) and
deductible portions of nonfinancial equity investments. There were no
disallowed deferred tax assets at December 31, 2014, September 30, 2014, and June 30, 2014 |
 Three
months ended 6-30-15
3-31-15 12-31-14 9-30-14 6-30-14 Pre-provision net revenue Net interest income (GAAP) $ 584 $ 571 $ 582 $ 575 $ 573 Plus: Taxable-equivalent adjustment 7 6 6 6 6 Noninterest income (GAAP) 488 437 490 417 455 Less: Noninterest expense (GAAP) 711 669 704 706 687 Pre-provision net revenue from continuing operations (non-GAAP) $ 368 $ 345 $ 374 $ 292 $ 347 Average tangible common equity Average Key shareholders’ equity (GAAP) $ 10,590 $ 10,570 $ 10,562 $ 10,473 $ 10,459 Less: Intangible assets (average) (a) 1,086 1,089 1,096 1,037 1,010 Preferred Stock, Series A (average) 290 290 291 291 291 Average tangible common equity (non-GAAP) $ 9,214 $ 9,191 $ 9,175 $ 9,145 $ 9,158 Return on average tangible common equity from continuing operations Net income (loss) from continuing operations attributable to Key common shareholders (GAAP) $ 230 $ 222 $ 246 $ 197 $ 242 Average tangible common equity (non-GAAP) 9,214 9,191 9,175 9,145 9,158 Return on average tangible common equity from continuing operations (non- GAAP) 10.01 % 9.80 % 10.64 % 8.55 % 10.60 % Return on average tangible common equity consolidated Net income (loss) attributable to Key common shareholders (GAAP) $ 233 $ 227 $ 248 $ 180 $ 214 Average tangible common equity (non-GAAP) 9,214 9,191 9,175 9,145 9,158 Return on average tangible common equity consolidated (non-GAAP) 10.14 % 10.02 % 10.72 % 7.81 % 9.37 % Twelve months ended Cash efficiency ratio 12-31-14 12-31-13 12-31-12 Noninterest expense (GAAP) $ 711 $ 669 $ 704 $ 706 $ 687 $ 2,761 $ 2,812 $ 2,834 Less: Intangible asset amortization (GAAP) 9 9 10 10 9 39 44 23 Adjusted noninterest expense (non-GAAP) $ 702 $ 660 $ 694 $ 696 $ 678 $ 2,722 $ 2,768 $ 2,811 Net interest income (GAAP) $ 584 $ 571 $ 582 $ 575 $ 573 $ 2,293 $ 2,325 $ 2,264 Plus: Taxable-equivalent adjustment 7 6 6 6 6 24 23 24 Noninterest income (GAAP) 488 437 490 417 455 1,797 1,766 1,856 Total taxable-equivalent revenue (non-GAAP) $ 1,079 $ 1,014 $ 1,078 $ 998 $ 1,034 $ 4,114 $ 4,114 $ 4,144 Cash efficiency ratio (non-GAAP) 65.1 % 65.1 % 64.4 % 69.7 % 65.6 % 66.2 % 67.3 % 67.8 % GAAP to Non-GAAP Reconciliation (continued) $ in millions (a) Three months ended 6/30/15, 3/31/15, 12/31/14, 9/30/14, and 6/30/14 exclude $58 million, $64 million, $69 million, $76 million, and $82 million,
respectively, of average purchased credit card receivable intangible
assets 32 |
 KeyCorp & Subsidiaries $ in billions Quarter ended June 30, 2015 Common Equity Tier 1 under current Regulatory Capital Rules $ 9.6
Adjustments from current Regulatory Capital Rules to the fully phased-in Regulatory Capital Rules:
Deferred tax assets and other assets (b) (.1) Common Equity Tier 1 anticipated under the fully phased-in Regulatory Capital Rules (c) $ 9.6
Net risk-weighted assets under current Regulatory Capital Rules
$
89.9 Adjustments from
current Regulatory Capital Rules to the fully phased-in Regulatory Capital
Rules: Mortgage
servicing assets (d) .5 All other assets (e) - Total risk-weighted assets anticipated under the fully phased-in Regulatory Capital Rules (c) $ 90.3
Common Equity Tier 1 under the fully phased-in Regulatory Capital Rules 10.6 % (a) Common Equity Tier 1 capital is a non-generally accepted accounting principle (GAAP) financial measure that is used by investors, analysts and bank regulatory agencies to assess the capital position of financial services companies. Management reviews Common Equity Tier 1 along with other measures of
capital as part of its financial analyses
(b) Includes the deferred tax asset subject to future taxable income for realization, primarily tax credit carryforwards, as well as the deductible
portion of purchased credit card receivables
(c) The anticipated amount of regulatory capital and risk-weighted assets is based upon the federal banking agencies’ Regulatory Capital Rules (as fully phased-in on January 1, 2019); Key is subject to the Regulatory Capital Rules under the “standardized approach”
(d) Item is included in the 10%/15% exceptions bucket calculation and is risk-weighted at 250%
(e) Includes the phase in of deferred tax assets arising from temporary differences at 250% risk-weight. Additionally, under the fully
implemented rule, certain deferred tax
assets and intangible assets subject to the transition provision are no longer required to be risk-weighted because they are deducted directly from capital. Table may not foot due to rounding 33 Common Equity Tier 1 Under the Regulatory Capital Rules (estimated) (a) |