Attached files
| file | filename |
|---|---|
| 8-K - 8-K - Virgin America Inc. | d77340d8k.htm |
Exhibit 99.1
|
|
Virgin America
September 2015
|
|
Disclaimer
This presentation includes forward-looking statements that are subject to many risks and uncertainties. These forward-looking statements, such as our statements about our short-term and long-term growth strategies, can sometimes be identified by our use of terms such as “intend,” “expect,” “plan,” “estimate,” “future,” “strive” and similar words. Although we believe that the expectations reflected in our forward-looking statements are reasonable, those statements involve many risks and uncertainties that may cause our actual results to differ from what may be expressed or implied in our statements. Those risks are discussed in our quarterly report on Form 10-Q, which is on file with the Securities and Exchange Commission (the “SEC), particularly in the sections titled “Risk Factors” and “Management’s Discussion and Analysis of Financial Condition and Results of Operations.” No forward-looking statement is a guarantee of future results, and you should not place undue reliance on our forward-looking statements, which reflect our views as of the date of this presentation. We assume no obligation to update any forward-looking statement contained in this presentation, except as may be required by law.
This presentation contains certain information that has not been presented in accordance with generally accepted accounting principles (“GAAP”). Reconciliations of such information to the most directly comparable GAAP financial measures are included in the Appendix to these slides and in our quarterly report on Form 10-Q. This information should not be considered a substitute for any GAAP financial measures.
|
|
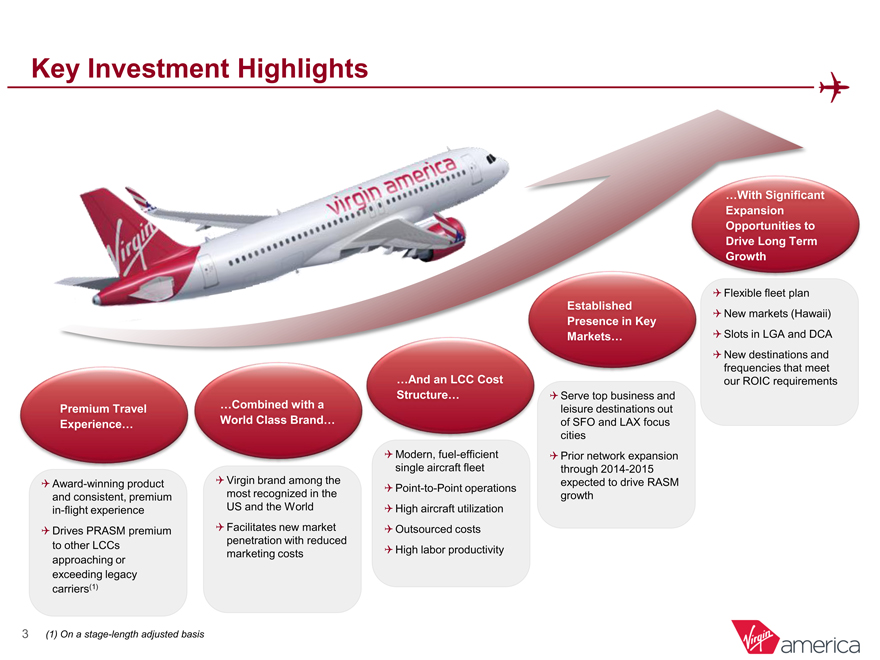
Key Investment Highlights
Premium Travel
Experience…
…Combined with a World Class Brand…
…And an LCC Cost Structure…
Established presence in key markets…
…with significant expansion opportunities to drive long term growth
Award-winning product and consistent, premium in-flight experience Drives PRASM premium to other LCCs approaching or exceeding legacy carriers(1)
Virgin brand among the most recognized in the US and the World Facilitates new market penetration with reduced marketing costs
Modern, fuel-efficient single aircraft fleet Point-to-Point operations High aircraft utilization Outsourced costs High labor productivity
Serve top business and leisure destinations out of SFO and LAX focus cities Prior network expansion through 2014-2015 expected to drive RASM growth
Flexible fleet plan New markets (Hawaii) Slots in LGA and DCA New destinations and frequencies that meet our ROIC requirements
3 (1) On a stage-length adjusted basis
|
|
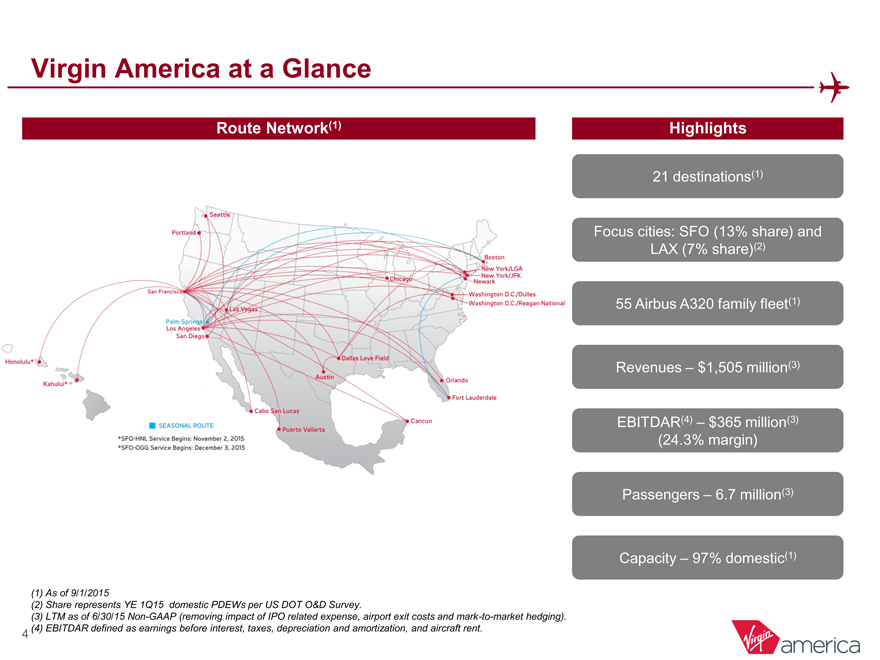
Virgin America at a Glance
Route Network(1)
Highlights
21 destinations(1)
Focus cities: SFO (13% share) and
LAX (7% share)(2)
55 Airbus A320 family fleet(1)
Revenues – $1,505 million(3)
EBITDAR(4) – $365 million(3)
(24.3% margin)
Passengers – 6.7 million(3)
Capacity – 97% domestic(1)
(1) As of 9/1/2015
(2) Share represents YE 1Q15 domestic PDEWs per US DOT O&D Survey.
(3) LTM as of 6/30/15 Non-GAAP (removing impact of IPO related expense, airport exit costs and mark-to-market hedging). (4) EBITDAR defined as earnings before interest, taxes, depreciation and amortization, and aircraft rent.
4
|
|
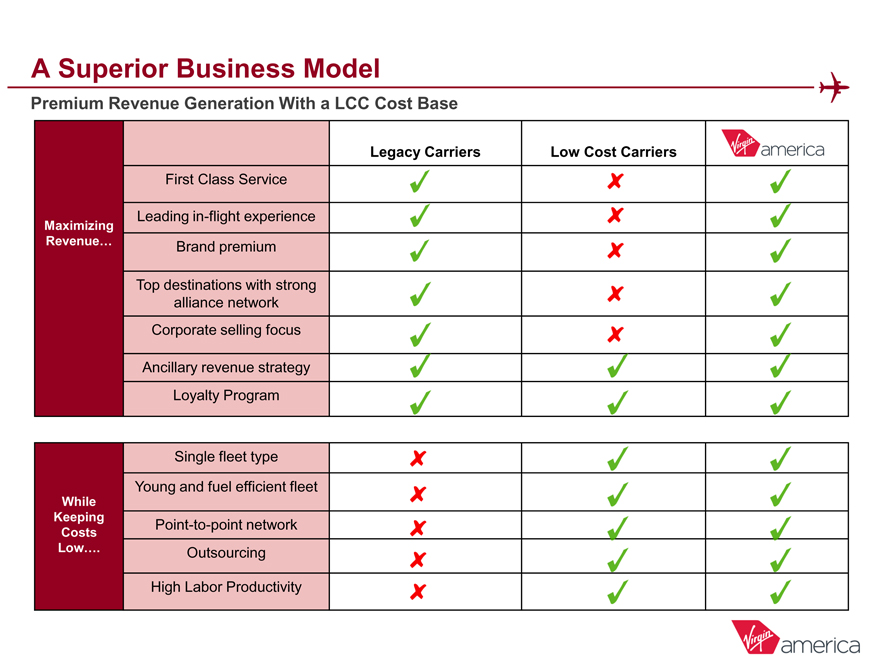
A Superior Business Model
Premium Revenue Generation With a LCC Cost Base
Legacy Carriers Low Cost Carriers
First Class Service
Leading in-flight experience
Maximizing
Revenue… Brand premium
Top destinations with strong
alliance network
Corporate selling focus
Ancillary revenue strategy
Loyalty Program
Single fleet type
Young and fuel efficient fleet
While
Keeping Point-to-point network
Costs
Low…. Outsourcing
High Labor Productivity
|
|
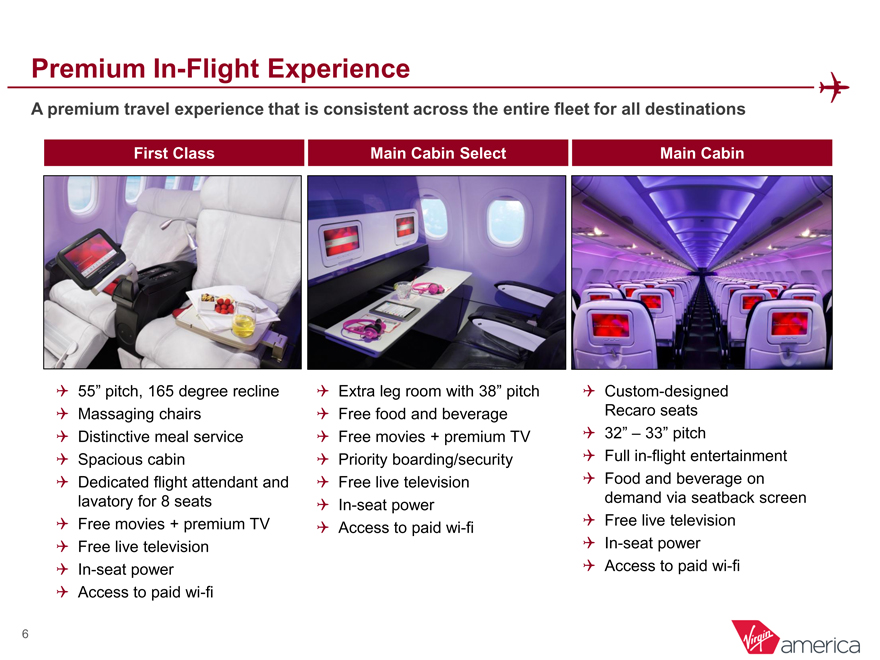
Premium In-Flight Experience
A premium travel experience that is consistent across the entire fleet for all destinations
First Class Main Cabin Select Main Cabin
55” pitch, 165 degree recline
Massaging chairs Distinctive meal service Spacious cabin
Dedicated flight attendant and lavatory for 8 seats Free movies + premium TV Free live television In-seat power Access to paid wi-fi
Extra leg room with 38” pitch
Free food and beverage Free movies + premium TV Priority boarding/security Free live television In-seat power Access to paid wi-fi
Custom-designed Recaro seats
32” – 33” pitch
Full in-flight entertainment Food and beverage on demand via seatback screen Free live television In-seat power Access to paid wi-fi
|
|
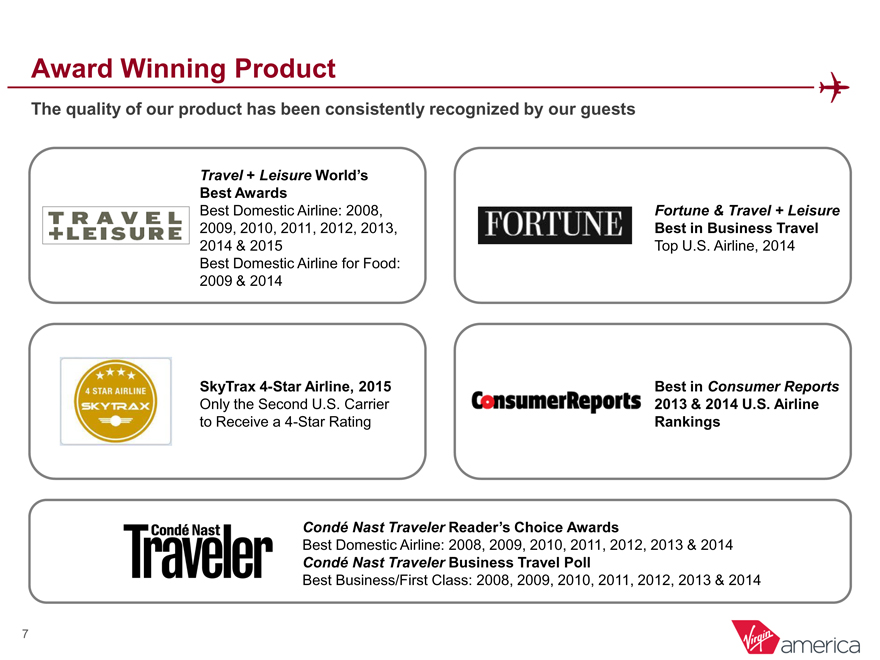
Award Winning Product
The quality of our product has been consistently recognized by our guests
Travel + Leisure World’s
Best Awards
Best Domestic Airline: 2008, 2009, 2010, 2011, 2012, 2013, 2014 & 2015 Best Domestic Airline for Food: 2009 & 2014
Fortune & Travel + Leisure
Best in Business Travel
Top U.S. Airline, 2014
SkyTrax 4-Star Airline, 2015
Only the Second U.S. Carrier to Receive a 4-Star Rating
Best in Consumer Reports
2013 & 2014 U.S. Airline Rankings
Condé Nast Traveler Reader’s Choice Awards
Best Domestic Airline: 2008, 2009, 2010, 2011, 2012, 2013 & 2014
Condé Nast Traveler Business Travel Poll
Best Business/First Class: 2008, 2009, 2010, 2011, 2012, 2013 & 2014
|
|
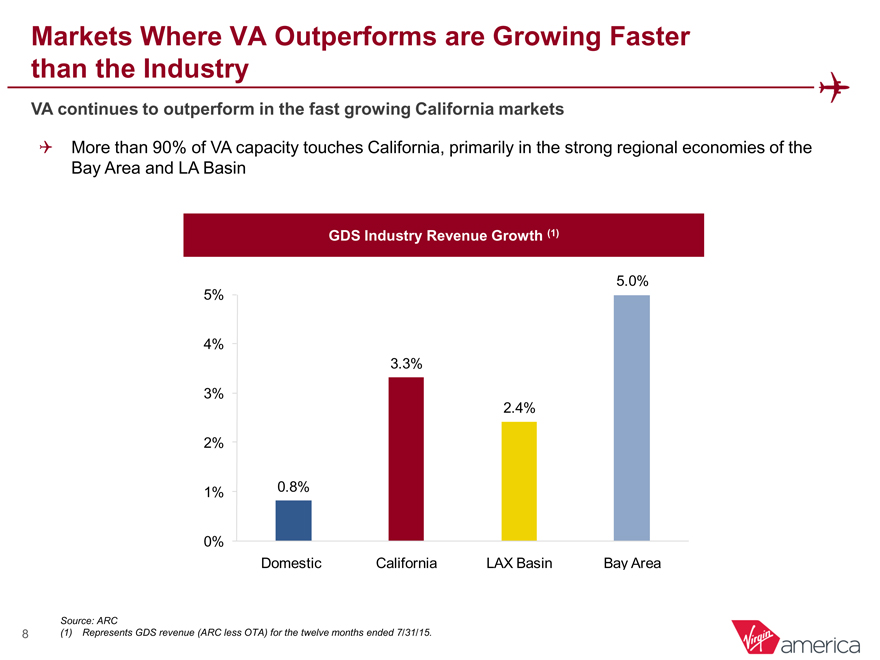
Markets Where VA Outperforms are Growing Faster than the Industry
VA continues to outperform in the fast growing California markets
More than 90% of VA capacity touches California, primarily in the strong regional economies of the Bay Area and LA Basin
GDS Industry Revenue Growth (1)
5.0%
5%
4%
3.3%
3%
2.4%
2%
1% 0.8%
0%
Domestic California LAX Basin Bay Area
Source: ARC
8 (1) Represents GDS revenue (ARC less OTA) for the twelve months ended 7/31/15.
|
|
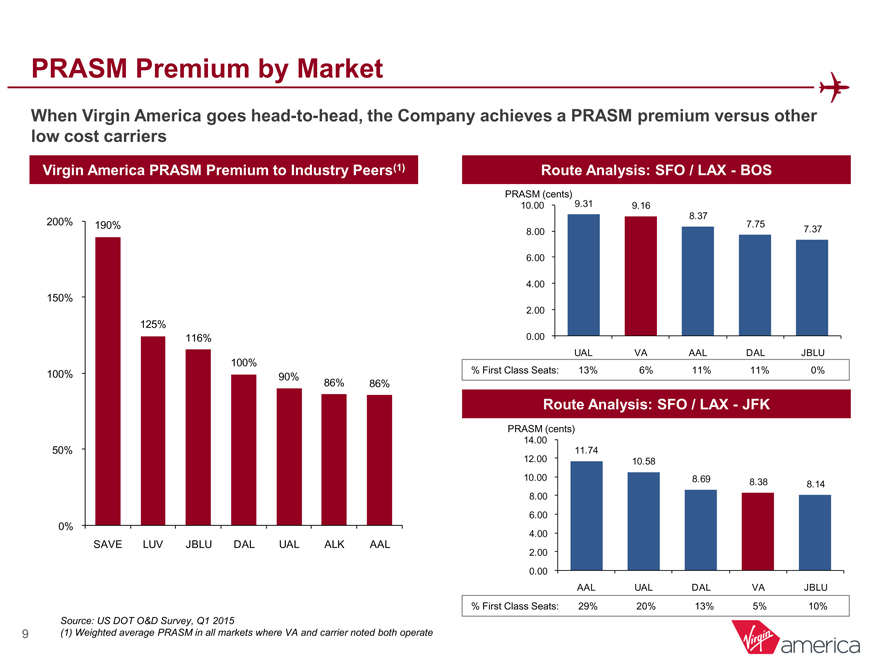
PRASM Premium by Market
When Virgin America goes head-to-head, the Company achieves a PRASM premium versus other low cost carriers
Virgin America PRASM Premium to Industry Peers(1)
Route Analysis: SFO / LAX—BOS
200% 190%
150%
125%
116%
100%
100% 90% 86% 86%
50%
0%
SAVE LUV JBLU DAL UAL ALK AAL
PRASM (cents)
10.00 9.31 9.16
8.37
7.75
8.00 7.37
6.00
4.00
2.00
0.00
UAL VA AAL DAL JBLU
% First Class Seats: 13% 6% 11% 11% 0%
Route Analysis: SFO / LAX—JFK
PRASM (cents)
14.00
11.74
12.00 10.58
10.00 8.69 8.38 8.14
8.00
6.00
4.00
2.00
0.00
AAL UAL DAL VA JBLU
% First Class Seats: 29% 20% 13% 5% 10%
Source: US DOT O&D Survey, Q1 2015
9 (1) Weighted average PRASM in all markets where VA and carrier noted both operate
|
|
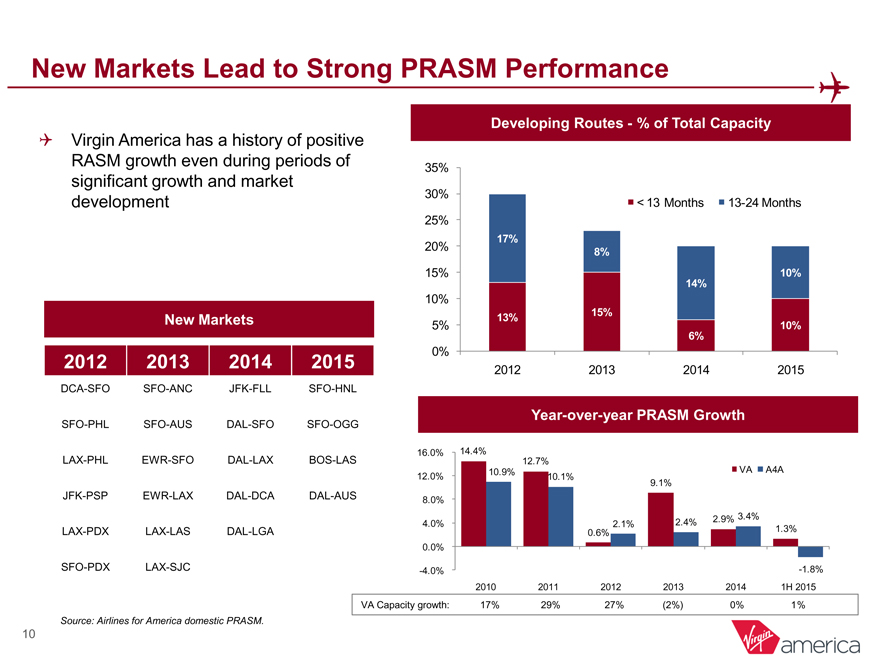
New Markets Lead to Strong PRASM Performance
Virgin America has a history of positive RASM growth even during periods of significant growth and market development
Developing Routes—% of Total Capacity
35%
30%
< 13 Months 13-24 Months 25%
17%
20%
8%
15% 10% 14%
10%
15% 13%
5% 10% 6%
0%
2012 2013 2014 2015
New Markets
2012 2013 2014 2015
DCA-SFO SFO-ANC JFK-FLL SFO-HNL
SFO-PHL SFO-AUS DAL-SFO SFO-OGG
LAX-PHL EWR-SFO DAL-LAX BOS-LAS
JFK-PSP EWR-LAX DAL-DCA DAL-AUS
LAX-PDX LAX-LAS DAL-LGA
SFO-PDX LAX-SJC
Year-over-year PRASM Growth
16.0% 14.4%
12.7%
10.9% VA A4A
12.0% 10.1% 9.1%
8.0%
4.0% 2.1% 2.4% 2.9% 3.4%
0.6% 1.3%
0.0%
-4.0% -1.8%
2010 2011 2012 2013 2014 1H 2015
Source: Airlines for America domestic PRASM.
10
VA Capacity growth: 17% 29% 27% (2%) 0% 1%
|
|
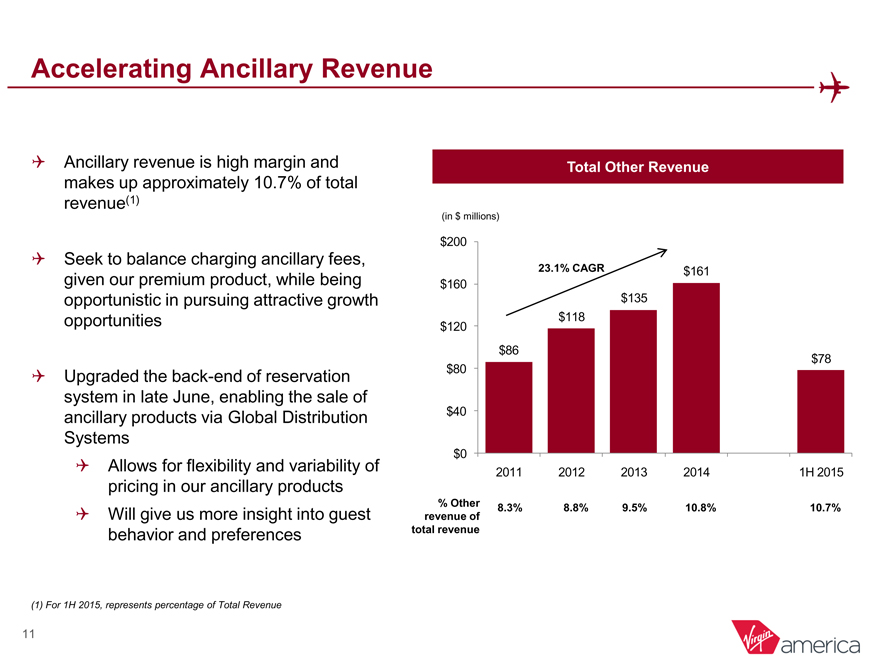
Accelerating Ancillary Revenue
Ancillary revenue is high margin and makes up approximately 10.7% of total revenue(1)
Seek to balance charging ancillary fees, given our premium product, while being opportunistic in pursuing attractive growth opportunities
Upgraded the back-end of reservation system in late June, enabling the sale of ancillary products via Global Distribution Systems
Allows for flexibility and variability of pricing in our ancillary products Will give us more insight into guest behavior and preferences
Total Other Revenue
(in $ millions)
$200
23.1% CAGR $161
$160
$135
$118
$120
$86
$78
$80
$40
$0
2011 2012 2013 2014 1H 2015
% Other 8.3% 8.8% 9.5% 10.8% 10.7%
revenue of
total revenue
(1) For 1H 2015, represents percentage of Total Revenue
11
|
|
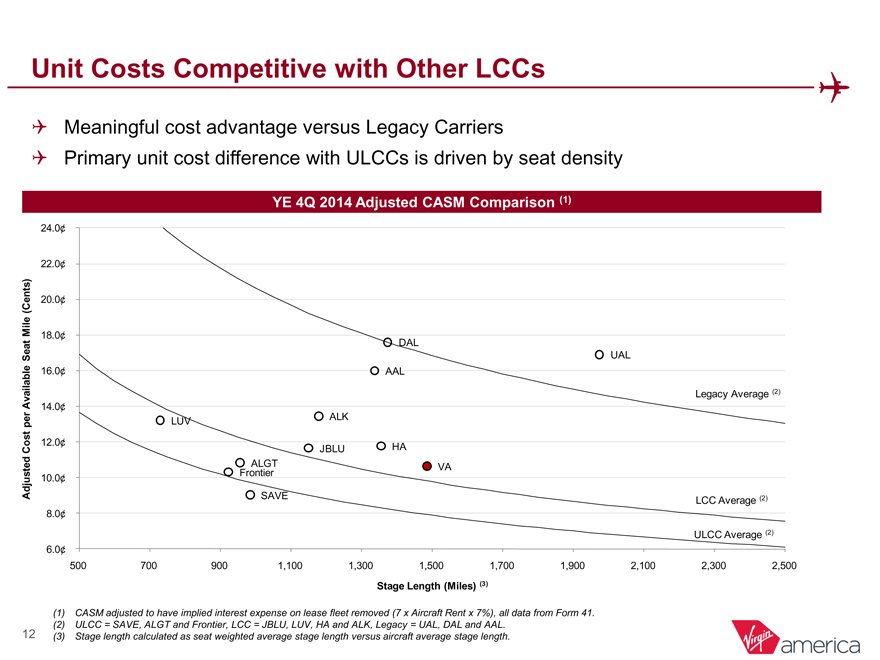
Unit Costs Competitive with Other LCCs
Meaningful cost advantage versus Legacy Carriers
Primary unit cost difference with ULCCs is driven by seat density
YE 4Q 2014 Adjusted CASM Comparison (1)
24.0¢
22.0¢
20.0¢
18.0¢
DAL
UAL
16.0¢ AAL
Legacy Average (2)
14.0¢
LUV ALK
12.0¢ JBLU HA
ALGT VA
Frontier
10.0¢
SAVE LCC Average (2)
8.0¢
ULCC Average (2)
6.0¢
500 700 900 1,100 1,300 1,500 1,700 1,900 2,100 2,300 2,500
Stage Length (Miles) (3)
Adjusted Cost per Available Seat Mile (Cents)
(1) CASM adjusted to have implied interest expense on lease fleet removed (7 x Aircraft Rent x 7%), all data from Form 41.
(2) ULCC = SAVE, ALGT and Frontier, LCC = JBLU, LUV, HA and ALK, Legacy = UAL, DAL and AAL.
12 (3) Stage length calculated as seat weighted average stage length versus aircraft average stage length.
|
|
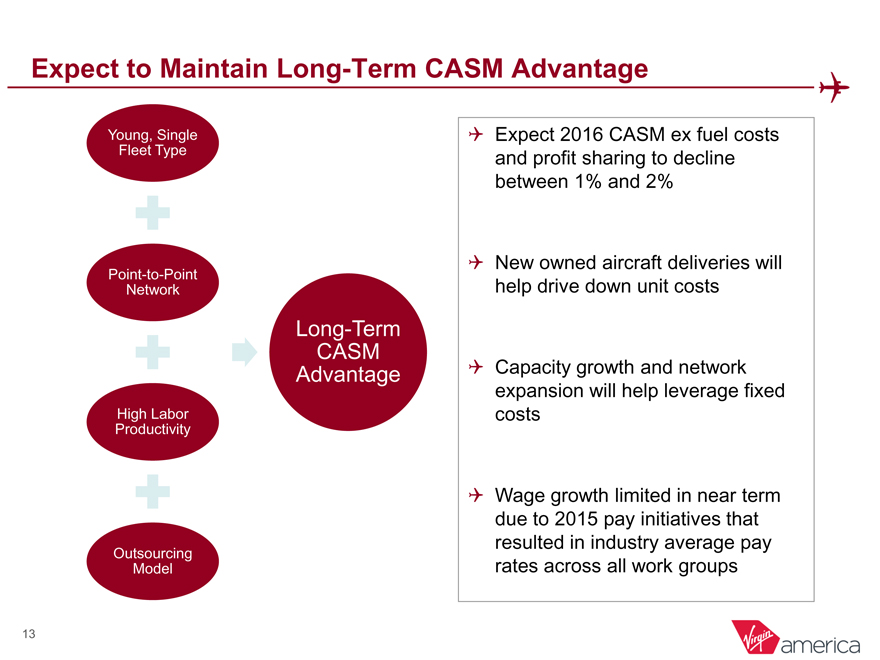
Expect to Maintain Long-Term CASM Advantage
Expect 2016 CASM ex fuel costs and profit sharing to decline between 1% and 2%
New owned aircraft deliveries will help drive down unit costs
Capacity growth and network expansion will help leverage fixed costs
Wage growth limited in near term due to 2015 pay initiatives that resulted in industry average pay rates across all work groups
Young, Single Fleet Type
Point-to-Point Network
Long-Term CASM Advantage
High Labor Productivity
Outsourcing Model
13
|
|
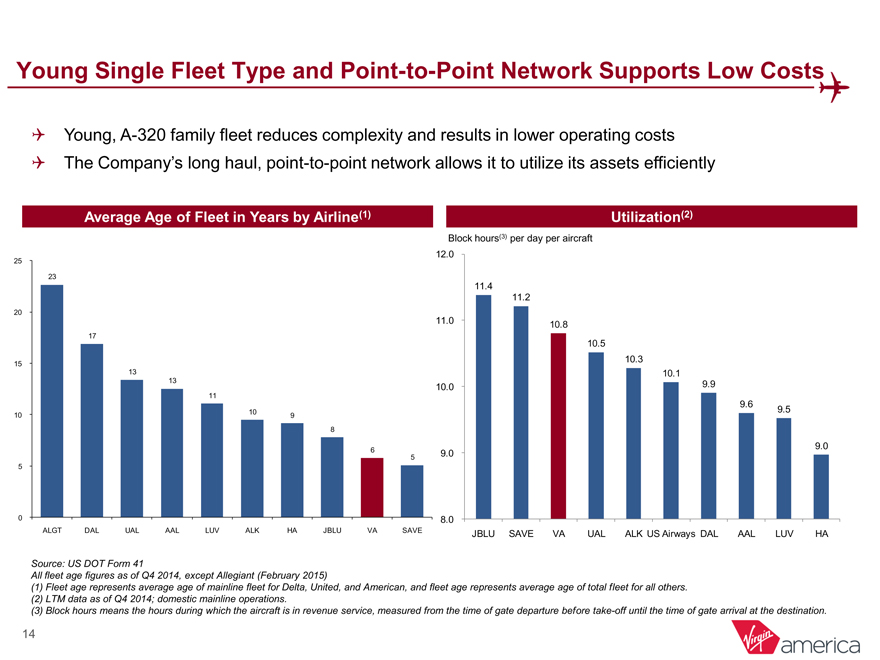
Young Single Fleet Type and Point-to-Point Network Supports Low Costs
Young, A-320 family fleet reduces complexity and results in lower operating costs The Company’s long haul, point-to-point network allows it to utilize its assets efficiently
Average Age of Fleet in Years by Airline(1)
Utilization(2)
25
23
20
17
15
13
13
11
10 10 9
8
6
5
5
0
ALGT DAL UAL AAL LUV ALK HA JBLU VA SAVE
Block hours(3) per day per aircraft
12.0
11.4
11.2
11.0 10.8
10.5
10.3
10.1
10.0 9.9
9.6 9.5
9.0
9.0
8.0
JBLU SAVE VA UAL ALK US Airways DAL AAL LUV HA
Source: US DOT Form 41
All fleet age figures as of Q4 2014, except Allegiant (February 2015)
(1) Fleet age represents average age of mainline fleet for Delta, United, and American, and fleet age represents average age of total fleet for all others. (2) LTM data as of Q4 2014; domestic mainline operations.
(3) Block hours means the hours during which the aircraft is in revenue service, measured from the time of gate departure before take-off until the time of gate arrival at the destination.
14
|
|
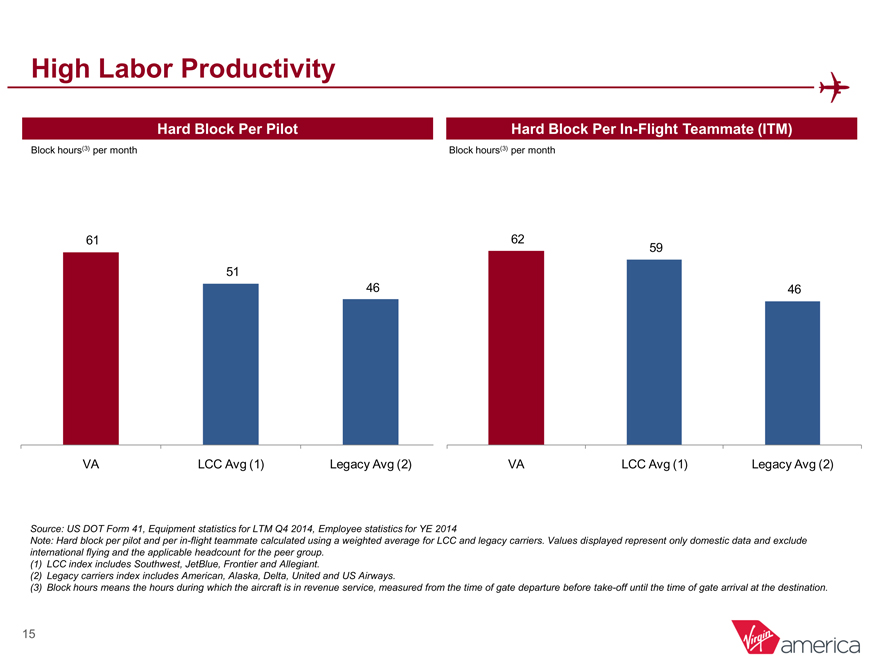
High Labor Productivity
Hard Block Per Pilot
Hard Block Per In-Flight Teammate (ITM)
Block hours(3) per month
Block hours(3) per month
61 62 59
51
46 46
VA LCC Avg (1) Legacy Avg (2) VA LCC Avg (1) Legacy Avg (2)
Source: US DOT Form 41, Equipment statistics for LTM Q4 2014, Employee statistics for YE 2014
Note: Hard block per pilot and per in-flight teammate calculated using a weighted average for LCC and legacy carriers. Values displayed represent only domestic data and exclude international flying and the applicable headcount for the peer group.
(1) LCC index includes Southwest, JetBlue, Frontier and Allegiant.
(2) Legacy carriers index includes American, Alaska, Delta, United and US Airways.
(3) Block hours means the hours during which the aircraft is in revenue service, measured from the time of gate departure before take-off until the time of gate arrival at the destination.
15
|
|
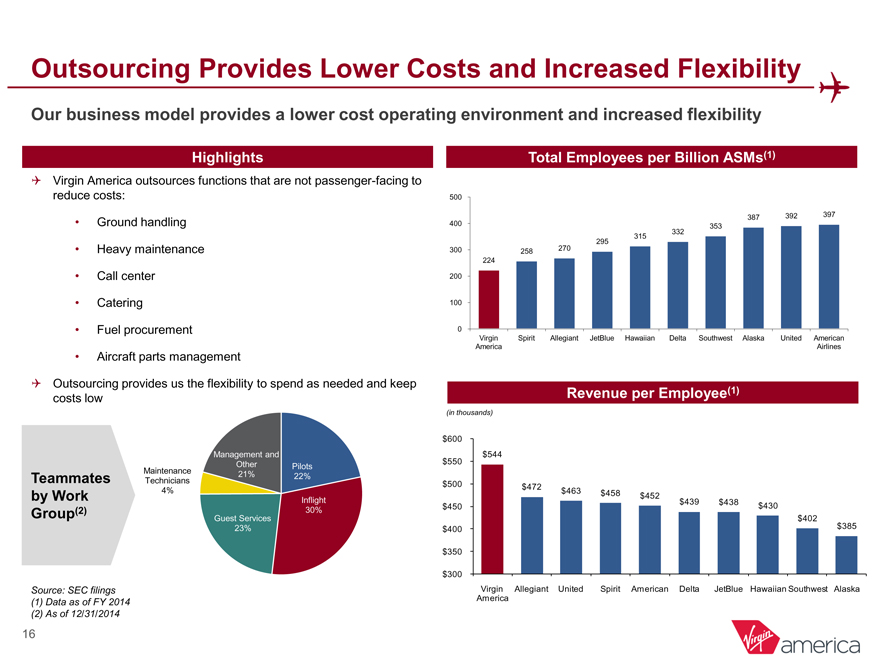
Outsourcing Provides Lower Costs and Increased Flexibility
Our business model provides a lower cost operating environment and increased flexibility
Highlights
Total Employees per Billion ASMs(1)
Virgin America outsources functions that are not passenger-facing to reduce costs:
Ground handling
Heavy maintenance
Call center Catering Fuel procurement
Aircraft parts management
Outsourcing provides us the flexibility to spend as needed and keep costs low
500
387 392 397
400 353
315 332
295
300 258 270
224
200
100
0
Virgin Spirit Allegiant JetBlue Hawaiian Delta Southwest Alaska United American
America Airlines
Management and
Maintenance Other Pilots
Teammates Technicians 21% 22%
by Work 4% Inflight
Group(2) Guest Services 30%
23%
Revenue per Employee(1)
(in thousands)
$ 600
$ 544
$ 550
$ 500 $ 472
$ 463 $ 458 $ 452
$ 439 $ 438
$ 450 $ 430
$ 402
$ 400 $ 385
$ 350
$ 300
Virgin Allegiant United Spirit American Delta JetBlue Hawaiian Southwest Alaska
America
Source: SEC filings (1) Data as of FY 2014 (2) As of 12/31/2014
16
|
|
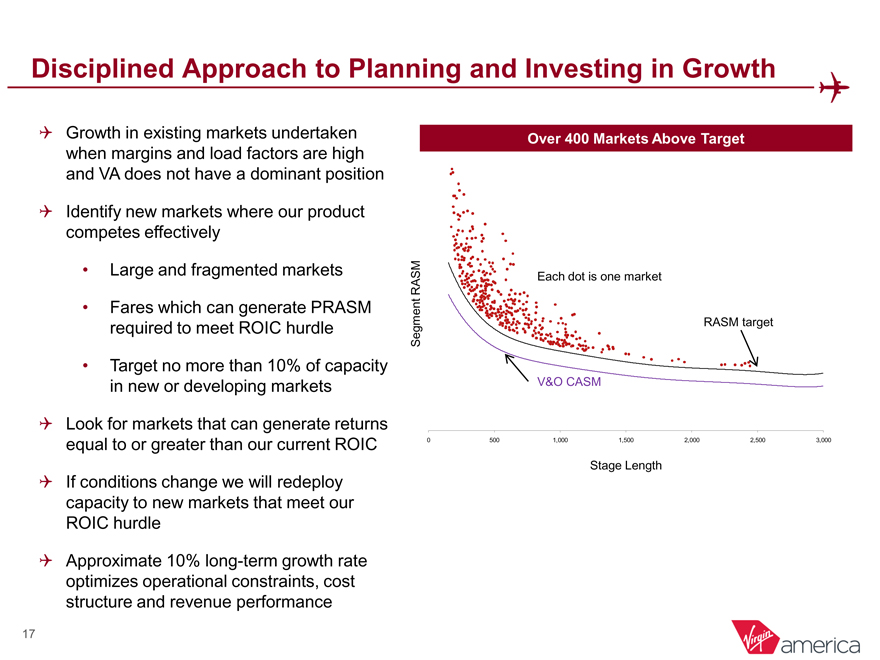
Disciplined Approach to Planning and Investing in Growth
Growth in existing markets undertaken when margins and load factors are high and VA does not have a dominant position
Identify new markets where our product competes effectively
Large and fragmented markets
Fares which can generate PRASM required to meet ROIC hurdle
Target no more than 10% of capacity in new or developing markets
Look for markets that can generate returns equal to or greater than our current ROIC
If conditions change we will redeploy capacity to new markets that meet our ROIC hurdle
Approximate 10% long-term growth rate optimizes operational constraints, cost structure and revenue performance
Over 400 Markets Above Target
Segment RASM
Each dot is one market
RASM target
V&O CASM
0 500 1,000 1,500 2,000 2,500 3,000
Stage Length
17
|
|
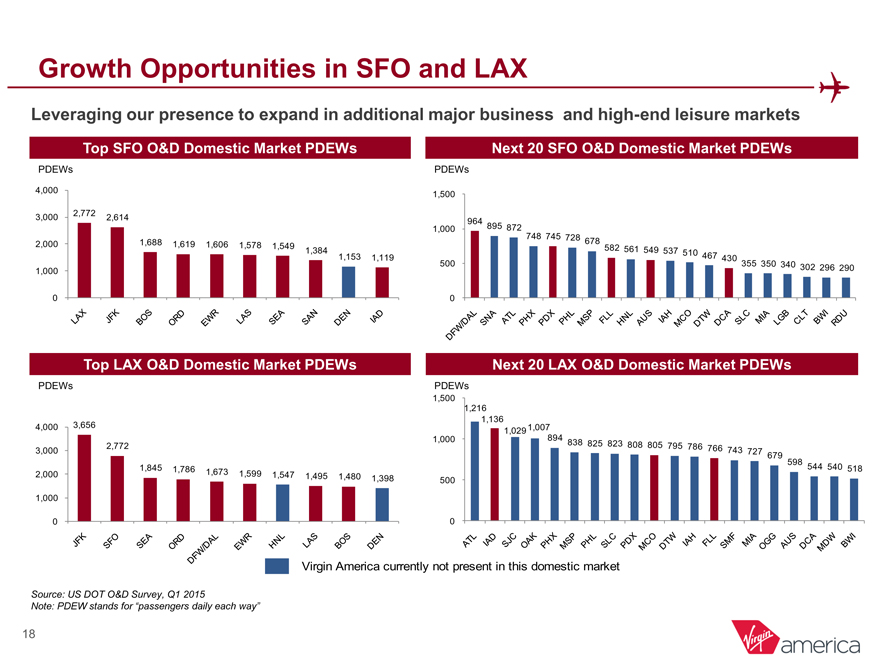
Growth Opportunities in SFO and LAX
Leveraging our presence to expand in additional major business and high-end leisure markets
Top SFO O&D Domestic Market PDEWs
PDEWs
4,000
2,772
3,000 2,614
2,000 1,688 1,619 1,606 1,578 1,549 1,384
1,153 1,119
1,000
0
Next 20 SFO O&D Domestic Market PDEWs
PDEWs
1,500
1,000 964 895 872
748 745 728 678
582 561 549 537 510 467 430
500 355 350 340 302 296 290
0
Top LAX O&D Domestic Market PDEWs
PDEWs
4,000 3,656
3,000 2,772
2,000 1,845 1,786 1,673 1,599 1,547 1,495 1,480 1,398
1,000
0
Next 20 LAX O&D Domestic Market PDEWs
PDEWs
1,500
1,216
1,136
1,029 1,007
1,000 894
838 825 823 808 805 795 786 766 743 727 679
598 544 540 518
500
0
Virgin America currently not present in this domestic market
Source: US DOT O&D Survey, Q1 2015
Note: PDEW stands for “passengers daily each way”
18
|
|
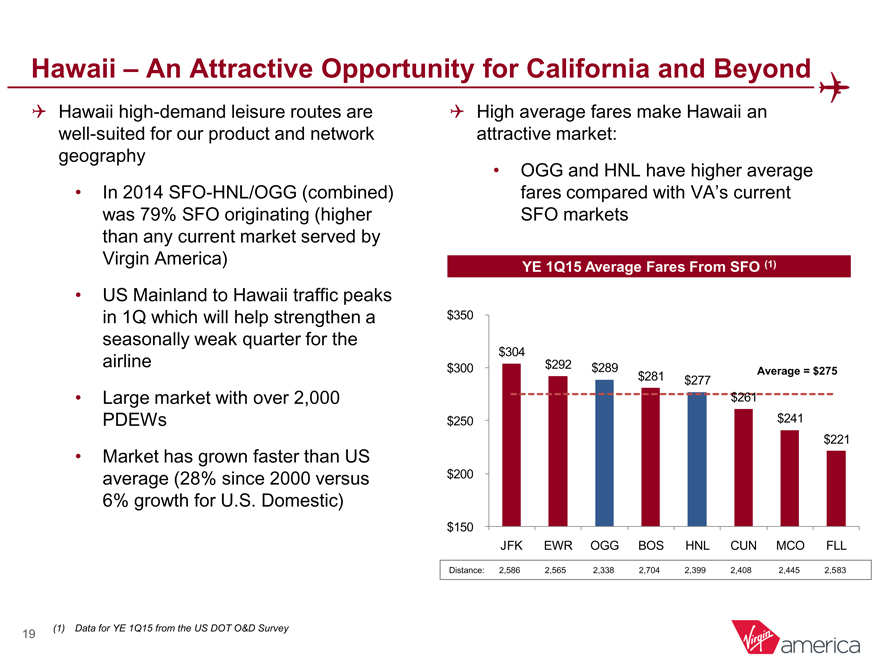
Hawaii – An Attractive Opportunity for California and Beyond
Hawaii high-demand leisure routes are well-suited for our product and network geography
High average fares make Hawaii an attractive market:
In 2014 SFO-HNL/OGG (combined) was 79% SFO originating (higher than any current market served by Virgin America)
US Mainland to Hawaii traffic peaks in 1Q which will help strengthen a seasonally weak quarter for the airline
Large market with over 2,000 PDEWs
Market has grown faster than US average (28% since 2000 versus
6% growth for U.S. Domestic)
OGG and HNL have higher average fares compared with VA’s current
SFO markets
YE 1Q15 Average Fares From SFO (1)
$ 350
$ 304
$ 300 $ 292 $ 289 Average = $275
$ 281 $277
$261
$ 250 $241
$221
$ 200
$ 150
JFK EWR OGG BOS HNL CUN MCO FLL
Distance: 2,586 2,565 2,338 2,704 2,399 2,408 2,445 2,583
(1) Data for YE 1Q15 from the US DOT O&D Survey
19
|
|
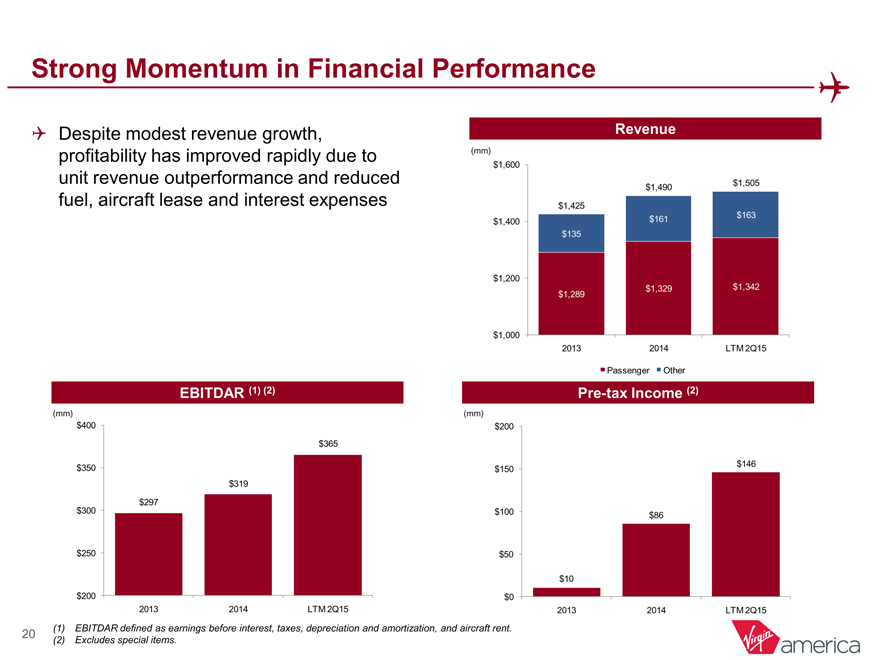
Strong Momentum in Financial Performance
Despite modest revenue growth, profitability has improved rapidly due to unit revenue outperformance and reduced fuel, aircraft lease and interest expenses
Revenue
(mm)
$1,600
$1,490 $1,505
$1,425
$1,400 $161 $163
$135
$1,200
$1,289 $1,329 $1,342
$1,000
2013 2014 LTM 2Q15
EBITDAR (1) (2)
(mm)
$ 400
$ 365
$ 350
$ 319
$ 297
$ 300
$ 250
$ 200
2013 2014 LTM 2Q15
Passenger Other
Pre-tax Income (2)
(mm)
$200
$150 $146
$100 $86
$50
$10
$0
2013 2014 LTM 2Q15
(1) EBITDAR defined as earnings before interest, taxes, depreciation and amortization, and aircraft rent. (2) Excludes special items.
|
|
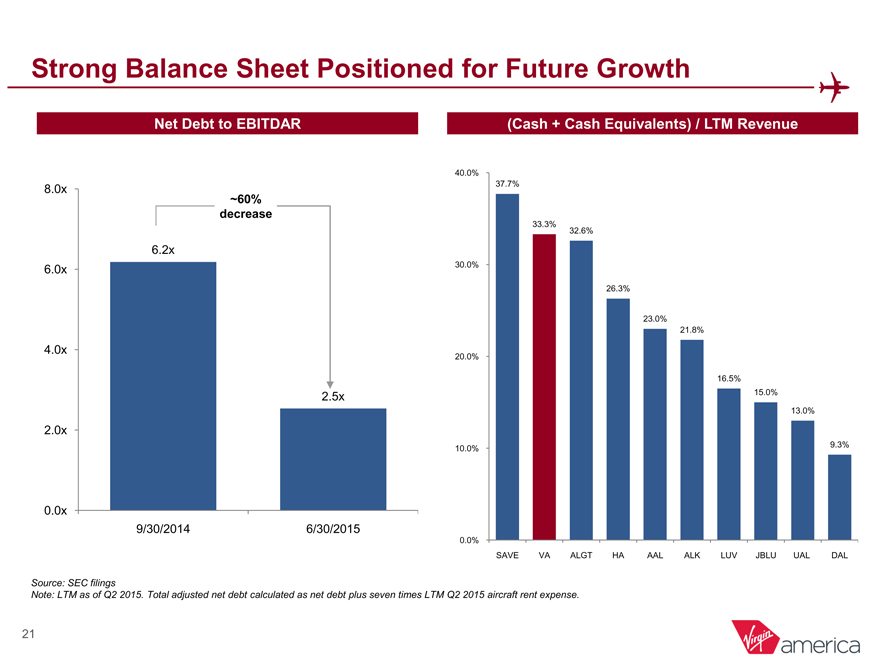
Strong Balance Sheet Positioned for Future Growth
Net Debt to EBITDAR
(Cash + Cash Equivalents) / LTM Revenue
8.0x
~60%
decrease
6.2x
6.0x
4.0x
2.5x
2.0x
0.0x
9/30/2014 6/30/2015
40.0%
37.7%
33.3%
32.6%
30.0%
26.3%
23.0%
21.8%
20.0%
16.5%
15.0%
13.0%
10.0% 9.3%
0.0%
SAVE VA ALGT HA AAL ALK LUV JBLU UAL DAL
Source: SEC filings
Note: LTM as of Q2 2015. Total adjusted net debt calculated as net debt plus seven times LTM Q2 2015 aircraft rent expense.
21
|
|
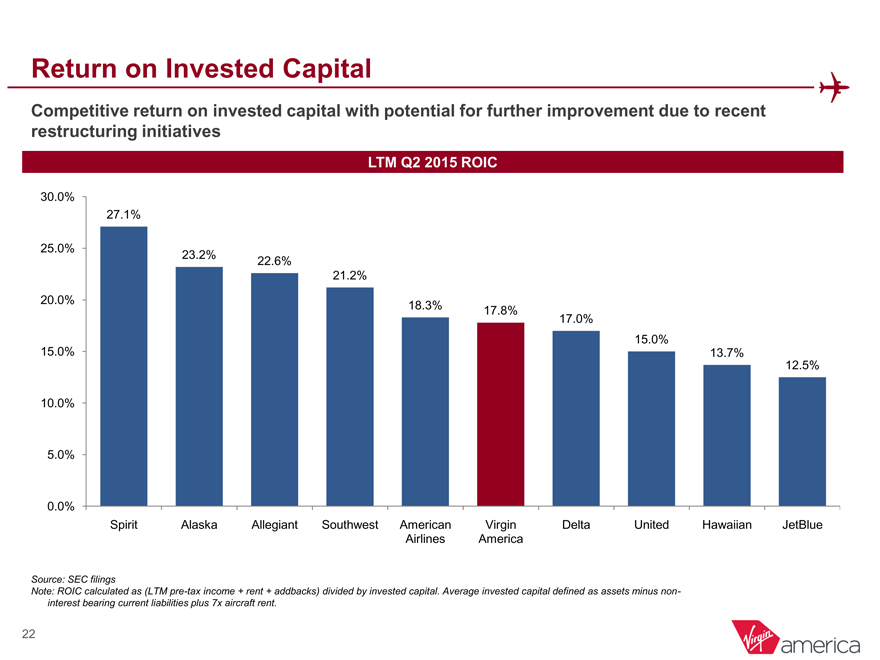
Return on Invested Capital
Competitive return on invested capital with potential for further improvement due to recent restructuring initiatives
LTM Q2 2015 ROIC
30.0%
27.1%
25.0%
23.2% 22.6%
21.2%
20.0%
18.3% 17.8%
17.0%
15.0%
15.0% 13.7%
12.5%
10.0%
5.0%
0.0%
Spirit Alaska Allegiant Southwest American Virgin Delta United Hawaiian JetBlue
Airlines America
Source: SEC filings
Note: ROIC calculated as (LTM pre-tax income + rent + addbacks) divided by invested capital. Average invested capital defined as assets minus non-interest bearing current liabilities plus 7x aircraft rent.
22
|
|
Key Investment Highlights
Premium Travel
Experience…
…Combined with a World Class Brand…
…And an LCC Cost Structure…
Established presence in key markets…
…with significant expansion opportunities to drive long term growth
23
|
|
Appendix
|
|
CONFIDENTIAL
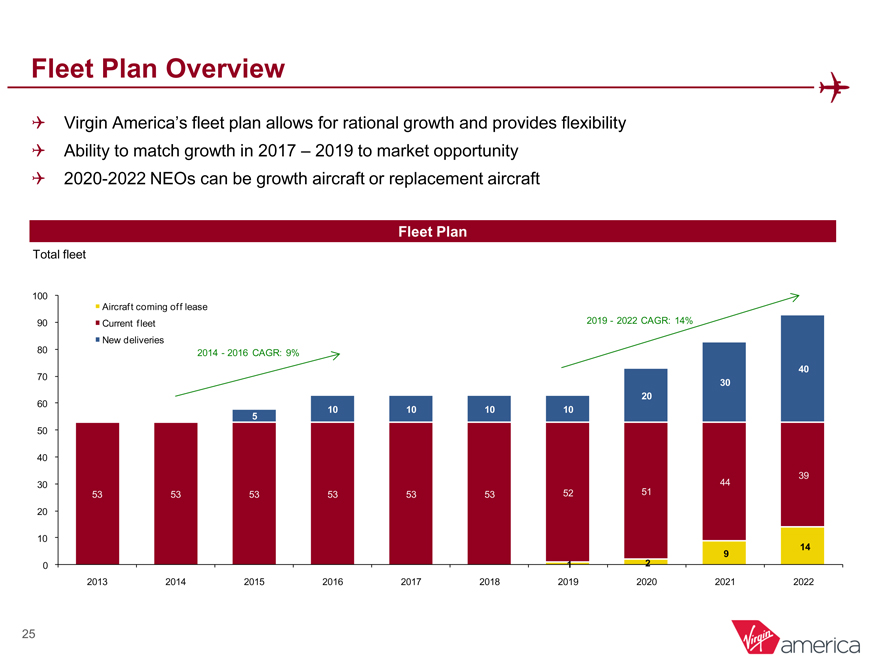
Fleet Plan Overview
Virgin America’s fleet plan allows for rational growth and provides flexibility
Ability to match growth in 2017 – 2019 to market opportunity 2020-2022 NEOs can be growth aircraft or replacement aircraft
Fleet Plan
Total fleet
100
Aircraft coming off lease
90 Current fleet 2019—2022 CAGR: 14%
New deliveries
80 2014—2016 CAGR: 9%
40
70 30
20
60 10 10 10 10
5
50
40
39
30 44
53 53 53 53 53 53 52 51
20
10
14
9
0 1 2
2013 2014 2015 2016 2017 2018 2019 2020 2021 2022
25
|
|
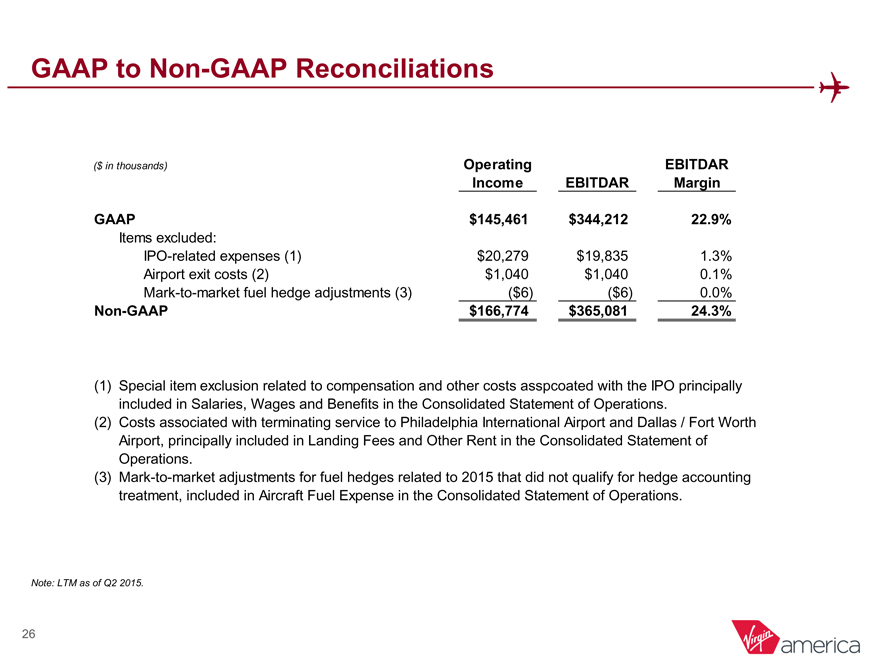
GAAP to Non-GAAP Reconciliations
($ in thousands) Operating EBITDAR
Income EBITDAR Margin
GAAP $145,461 $344,212 22.9%
Items excluded:
IPO-related expenses (1) $20,279 $19,835 1.3%
Airport exit costs (2) $1,040 $1,040 0.1%
Mark-to-market fuel hedge adjustments (3) ($6) ($6) 0.0%
Non-GAAP $166,774 $365,081 24.3%
(1) Special item exclusion related to compensation and other costs asspcoated with the IPO principally included in Salaries, Wages and Benefits in the Consolidated Statement of Operations.
(2) Costs associated with terminating service to Philadelphia International Airport and Dallas / Fort Worth Airport, principally included in Landing Fees and Other Rent in the Consolidated Statement of Operations.
(3) Mark-to-market adjustments for fuel hedges related to 2015 that did not qualify for hedge accounting treatment, included in Aircraft Fuel Expense in the Consolidated Statement of Operations.
Note: LTM as of Q2 2015.
26