Attached files
| file | filename |
|---|---|
| EX-32.1 - EX-32.1 - Virgin America Inc. | d878158dex321.htm |
| EX-23.1 - EX-23.1 - Virgin America Inc. | d878158dex231.htm |
| EX-31.2 - EX-31.2 - Virgin America Inc. | d878158dex312.htm |
| EX-31.1 - EX-31.1 - Virgin America Inc. | d878158dex311.htm |
| EX-10.10 - EX-10.10 - Virgin America Inc. | d878158dex1010.htm |
Table of Contents
UNITED STATES
SECURITIES AND EXCHANGE COMMISSION
WASHINGTON, D.C. 20549
FORM 10-K
| x | ANNUAL REPORT PURSUANT TO SECTION 13 OR 15(d) OF THE SECURITIES EXCHANGE ACT OF 1934 |
For the fiscal year ended December 31, 2014
| ¨ | TRANSITION REPORT PURSUANT TO SECTION 13 OR 15(d) OF THE SECURITIES EXCHANGE ACT OF 1934 |
For the transition period from to
Commission file number 001-36718
VIRGIN AMERICA INC.
(Exact name of registrant as specified in its charter)
| Delaware | 20-1585173 | |||
| (State or other jurisdiction of incorporation or organization) | (I.R.S. Employer Identification Number) |
555 Airport Boulevard
Burlingame, CA 94010
(Address of Principal Executive Offices) (Zip Code)
(650) 762-7000
(Registrant’s telephone number, including area code)
Securities registered pursuant to Section 12(b) of the Act:
| Title of Each Class |
Name of Each Exchange on Which Registered | |
| Common Stock, $0.01 par value | The NASDAQ Global Select Market |
Securities registered pursuant to Section 12(g) of the Act:
None
Indicate by check mark if the registrant is a well-known seasoned issuer, as defined in Rule 405 of the Securities Act. Yes ¨ No x
Indicate by check mark if the registrant is not required to file reports pursuant to Section 13 or Section 15(d) of the Act. Yes ¨ No x
Indicate by check mark whether the registrant (1) has filed all reports required to be filed by Section 13 or 15(d) of the Securities Exchange Act of 1934 during the preceding 12 months (or for such shorter period that the registrant was required to file such reports), and (2) has been subject to such filing requirements for the past 90 days. Yes x No ¨
Indicate by check mark whether the registrant has submitted electronically and posted on its corporate Website, if any, every Interactive Data File required to be submitted and posted pursuant to Rule 405 of Regulation S-T during the preceding 12 months (or for such shorter period that the registrant was required to submit and post such files). Yes x No ¨
Indicate by check mark if disclosure of delinquent filers pursuant to Item 405 of Regulation S-K is not contained herein, and will not be contained, to the best of registrant’s knowledge, in definitive proxy or information statements incorporated by reference in Part III of this Form 10-K or any amendment to this Form 10-K. Yes ¨ No x
Indicate by check mark whether the registrant is a large accelerated filer, an accelerated filer, a non-accelerated filer, or a smaller reporting company. See the definitions of “large accelerated filer,” “accelerated filer” and “smaller reporting company” in Rule 12b-2 of the Exchange Act.
| Large accelerated filer | ¨ | Accelerated filer | ¨ | |||||
| Non-accelerated filer | x | Smaller reporting company | ¨ | |||||
Indicate by check mark whether the registrant is a shell company (as defined in Rule 12b-2 of the Act). Yes ¨ No x
The registrant was not a public company as of the last business day of its most recently completed second fiscal quarter and therefore cannot calculate the aggregate market value of its voting and non-voting common equity held by non-affiliates as of such date.
As of March 2, 2015, the registrant had 43,184,652 shares of common stock outstanding.
DOCUMENTS INCORPORATED BY REFERENCE
Portions of the Registrant’s Proxy Statement for its 2015 Annual Meeting of Stockholders, which is to be filed subsequent to the date hereof, are incorporated by reference into Part III of this Annual Report on Form 10-K.
Table of Contents
| 1 | ||||||
| 1 | ||||||
| 1 | ||||||
| 10 | ||||||
| 12 | ||||||
| 26 | ||||||
| 27 | ||||||
| 27 | ||||||
| 28 | ||||||
| 28 | ||||||
| PART II |
||||||
| 28 | ||||||
| 32 | ||||||
| Item 7. Management’s Discussion and Analysis of Financial Condition and Results of Operations |
33 | |||||
| 33 | ||||||
| 36 | ||||||
| 43 | ||||||
| 46 | ||||||
| 47 | ||||||
| 47 | ||||||
| Item 7A. Quantitative and Qualitative Disclosures about Market Risk |
55 | |||||
| 56 | ||||||
| 59 | ||||||
| 59 | ||||||
| 60 | ||||||
| 62 | ||||||
| 63 | ||||||
| Consolidated Statements of Convertible Preferred Stock and Stockholders’ Equity (Deficit) |
64 | |||||
| 65 | ||||||
| 66 | ||||||
| Item 9. Changes in and Disagreements with Accountants on Accounting and Financial Disclosure |
101 | |||||
| 101 | ||||||
| 102 | ||||||
| PART III |
||||||
| Item 10. Directors, Executive Officers and Corporate Governance |
102 | |||||
| 102 | ||||||
| 102 | ||||||
| Item 13. Certain Relationships and Related Transactions, and Director Independence |
102 | |||||
| 102 | ||||||
| PART IV |
||||||
| 103 |
i
Table of Contents
PART I
| ITEM 1. | BUSINESS |
This Annual Report on Form 10-K contains various “forward-looking statements” within the meaning of Section 27A of the Securities Act of 1933, as amended, and Section 21E of the Securities Exchange Act of 1934, as amended. When used in this Annual Report on Form 10-K, the words “expects,” “estimates,” “plans,” “anticipates,” “indicates,” “believes,” “forecast,” “guidance,” “outlook,” “may,” “will,” “would,” “should,” “seeks,” “targets” and similar expressions are intended to identify forward-looking statements. Forward-looking statements represent the Company’s expectations and beliefs concerning future events, based on information available to the Company on the date of the filing of this Annual Report on Form 10-K, and are subject to various risks and uncertainties that could cause actual performance or results to differ materially from those expressed in or suggested by the forward-looking statements. Forward-looking statements should not be read as a guarantee of future performance or results and will not necessarily be accurate indications of the times at which or by which such performance or results will be achieved. Factors that could cause actual results to differ materially from those referenced in the forward-looking statements include those listed in Part I, Item 1A, Risk Factors and in Part II, Item 7, Management’s Discussion and Analysis of Financial Condition and Results of Operations. The Company disclaims any intent or obligation to update or revise any of the forward-looking statements, whether in response to new information, unforeseen events, changed circumstances or otherwise, except as required by applicable law.
Virgin America is a premium-branded, low-cost airline based in California that provides scheduled air travel in the continental United States and Mexico. We operate primarily from our focus cities of Los Angeles and San Francisco, with a smaller presence at Dallas Love Field (DAL), to other major business and leisure destinations in North America. We provide a distinctive offering for our passengers, whom we call guests, that is centered around our brand and our premium travel experience, while at the same time maintaining a low-cost structure through our point-to-point network and high utilization of our efficient, single fleet type consisting of Airbus A320 - Family aircraft. As of December 31, 2014, we provided service to 21 airports in the United States and Mexico with a fleet of 53 narrow-body aircraft.
Leveraging the reputation of the Virgin brand, a global brand founded by Sir Richard Branson, we target guests who value the experience associated with Virgin and the high-quality product and service that we offer. We have won numerous awards for our product, including Best Domestic Airline in Travel + Leisure Magazine’s World’s Best Awards and Best Domestic Airline in Condé Nast Traveler Magazine’s Readers’ Choice Awards for the past seven consecutive years as well as Best U.S. Business/First Class Airline in Condé Nast Traveler Magazine’s Business Travel Poll for the past six consecutive years.
We were incorporated in the state of Delaware in 2004. Our corporate address is 555 Airport Boulevard, Burlingame, California, and our telephone number is (650) 762-7000. Our internet address is www.virginamerica.com.
The Virgin America Business Model
We believe our business model, which combines a premium product and guest experience with a competitive cost structure, is distinctive within the domestic airline industry. We seek to achieve higher RASM than that of any other low-cost carriers, or “LCCs,” while maintaining a cost structure lower than that of the legacy airlines and competitive with that of other LCCs.
Our Product
We believe that our service is highly differentiated from that of our competitors. Our cabins have a distinctive appearance through innovative design and use of technology. We employ special mood lighting within
1
Table of Contents
our cabins that we designed to create a calming, low-stress environment for our guests. We have installed custom-designed leather seats throughout our cabin that are tailored to provide comfort, especially on our long-haul flights. We were the first airline to offer inflight wireless internet access across our entire fleet, and we also provide electrical power outlets adjacent to every seat. Unlike legacy carriers, which offer certain services on a variety of aircraft types and subcontract some flying to regional airlines, our service is consistent throughout our fleet and on every flight.
All of our guests have access to our Red® inflight entertainment system. The Red system allows each guest to customize his or her inflight experience through a host of entertainment options, including 17 channels of free live television and six pre-recorded channels, on-demand current movies and premium television programs, a free music library with approximately 3,000 MP-3 files from which each guest can create customized playlists, interactive video games and moving map technology that allows guests to track their flights’ progress. A key component of the Red system is our on-demand food and beverage ordering system. Guests can order and pay for high-quality food or beverage items for themselves or for other guests during the flight through the Red system, and our inflight teammates promptly deliver the order. The Red system also features a seat-to-seat chat function which allows guests to message passengers in other seats or send a drink or menu item to another guest. These features provide a distinctive experience for guests to interact during their flight.
Our employees, whom we call teammates, are a key element of our product. We have a highly engaged workforce that strives to provide a high degree of service and friendliness to our guests both at the airport and in flight. We heavily emphasize our service standards with our teammates through training and education programs and monetary incentives related to operational performance and guest surveys.
Within the cabin, we offer three levels of service: First Class, Main Cabin Select, which is our premium economy product, and Main Cabin. Some highlights of our service levels include the following:
First Class:
| • | Exclusive, eight-seat cabin with a dedicated inflight teammate to provide a high level of attention and service; |
| • | Custom-designed 165 degree reclining leather seat with massage functions; |
| • | 55 inches of pitch between rows—one of the most spacious First Class configurations in the U.S. domestic market; |
| • | Complimentary gourmet meals and alcoholic and non-alcoholic beverages with linen table service; |
| • | Individual Red inflight entertainment system; |
| • | Unlimited complimentary on-demand movies and premium television programs; |
| • | Complimentary live television; |
| • | Two free checked bags; and |
| • | Priority boarding and priority security access. |
Main Cabin Select:
| • | 38 inches of pitch, providing generous leg room; |
| • | Individual Red inflight entertainment system at every seatback; |
| • | Complimentary on-demand movies and premium television programs on our Red inflight entertainment system; |
| • | Complimentary live television; |
| • | Complimentary Main Cabin meals, snacks and alcoholic and non-alcoholic beverages; |
2
Table of Contents
| • | One free checked bag; and |
| • | Priority boarding and priority security access. |
Main Cabin:
| • | 32 or 33 inches of pitch—one of the most spacious economy configurations in the U.S. domestic market; |
| • | Individual Red inflight entertainment system at every seatback; |
| • | Complimentary live television; |
| • | Power outlets adjacent to every seat; |
| • | On-demand movies and premium television programs available for purchase; |
| • | A variety of fresh meals, snacks and alcoholic and premium non-alcoholic beverage offerings available for purchase on demand; |
| • | Complimentary non-alcoholic beverages; and |
| • | The ability to purchase reserved seating near the front of the Main Cabin, priority boarding and priority security access with our Express product. |
Our Cost Structure
We employ disciplined strategies to maintain a competitive cost structure. Our CASM was 11.38 cents in 2014. On a stage-length adjusted basis, our CASM was competitive within the industry and below that of legacy airlines. Key components of our low cost structure include the following:
| • | Operating a modern, fuel-efficient single-aircraft fleet type of Airbus A320-family aircraft, with an average age of 5.8 years as of December 31, 2014, resulting in lower maintenance costs and common flight crew training across the entire fleet; |
| • | High aircraft utilization, which averaged 10.8 hours per aircraft day during 2014; |
| • | Point-to-point operations, avoiding the complexities and inefficiencies of a hub-and-spoke system; |
| • | Our productive and engaged workforce; |
| • | The strategic use of outsourcing for non-core activities, such as certain airport ground handling functions, many maintenance functions and call center activities; and |
| • | Lean overhead structure in information technology, finance, human resources and planning that is scalable and can be leveraged as we continue to grow. |
The productivity of our workforce contributes significantly to our competitive cost structure. Our long-haul network provides a naturally efficient environment for crew scheduling. In 2014, our pilots flew an average of 59 block hours per month. Over the same period, our inflight teammates flew an average of 60 block hours per month.
While we maintain our focus on costs, we have chosen to invest in certain areas of our product that we believe support our high RASM strategy. These areas include:
| • | Configuring our First Class and Main Cabin seating capacity with lower density than most airlines. Our Airbus A320 aircraft are configured with 146-149 seats, and our Airbus A319 aircraft are configured with 119 seats. |
| • | Providing a premium travel experience favored by business travelers, including inflight entertainment options, an enhanced cabin with custom leather seats, inflight wireless internet and power outlets adjacent to every seat. |
3
Table of Contents
| • | Focusing on serving primary airports that provide convenience for business travelers but that generally have higher costs than alternative, secondary airports. |
| • | Maintaining a distribution strategy through multiple channels, including global distribution systems, or GDS, and corporate agencies that frequent business travelers value. |
This business model enables us to compete effectively with other low-cost carriers, or LCCs, by generating higher stage-length adjusted RASM but at a stage-length adjusted CASM competitive with that of other LCCs and lower than that of legacy airlines.
Our Competitive Strengths
We believe the following strengths allow us to compete successfully in the U.S. airline industry:
Premium Travel Experience. A key component of our product strength is the consistency across our entire fleet. In contrast to airlines with multiple aircraft types, our product offering is identical on every Airbus 320-family aircraft, allowing for the same enhanced travel experience on every flight. We also provide both First Class and Main Cabin Select products in addition to our Main Cabin economy product. Our First Class cabin has an exclusive feel and a dedicated attendant with just eight seats on every aircraft—fewer than most first class cabins offered on competing airlines, providing a personal level of service. Unlike many other airlines, we do not provide complimentary upgrades to First Class, enhancing the exclusivity of this product. In addition to more leg room, which is a standard feature of most premium economy products, we offer additional features within Main Cabin Select, such as complimentary on-demand current-run movies, premium television programs, premium beverages and Main Cabin meals and snacks.
World-Class Virgin Brand. We believe that the Virgin brand is widely recognized in the United States and is known for being innovative, stylish, entrepreneurial and hip. We believe that the brand is recognized worldwide from the Virgin Group’s offerings in music, air travel, wireless service and a wide variety of other products. We capitalize on the strength of the Virgin brand to target guests who value an enhanced travel experience and association with the Virgin brand. We believe that the Virgin brand has helped us to establish ourselves as a premium airline in the domestic market in a short period of time. When we enter a new market, awareness of the Virgin brand generates interest from new guests. The power of the Virgin brand provides an opportunity for low-cost public relations events that generate extensive media coverage in new markets and has led to other cooperative marketing relationships for us with major companies. In addition to capitalizing on the Virgin brand strength, we are rapidly establishing Virgin America as a distinct and premium brand for air travel in the United States in its own right. We believe our guests associate the Virgin and Virgin America brands with a distinctive high-quality and high-value travel experience.
Low-Cost, Disciplined Operating Structure. A core component of our business model is our disciplined cost structure. Key components of this low cost structure include our modern, fuel-efficient single-aircraft fleet, our high aircraft utilization, our point-to-point operations, our productive and engaged workforce, our outsourcing of non-core activities and our lean, scalable overhead structure. We are committed to maintaining this disciplined cost structure and believe we will continue to improve our competitive cost position in future years as we grow and further leverage our existing infrastructure. In 2014 the average stage-length adjusted domestic CASM of legacy airlines was 25% higher, and the average stage-length adjusted domestic CASM of LCCs was only 13% lower, than our stage-length adjusted CASM. Our lower seating density and three-class cabin configuration, which is a similar configuration to that of many legacy airlines, is the primary reason that our stage-length adjusted CASM was higher than that of other LCCs in 2013. However, our seating configuration with three classes of service was also a primary contributor to our higher stage-length adjusted PRASM when compared to other LCCs in 2013.
Established Presence in Los Angeles and San Francisco. We have built our network around the Los Angeles and San Francisco metropolitan areas, the second- and third-largest domestic air travel markets in the United States in 2014. We believe that these two markets, with a combined population of approximately
4
Table of Contents
27 million people and strong economic bases in the technology, media and entertainment industries, serve as an excellent platform for long-term growth. Los Angeles and San Francisco both have large populations of technologically savvy, entrepreneurial and innovative individuals who we believe value our brand and premium guest experience. We have made significant investments in these key markets since 2010, and as of December 31, 2014, we provide service to 18 destinations from Los Angeles and 20 destinations from San Francisco. These destinations include seven of the top ten domestic destinations served from Los Angeles International Airport (LAX) and nine of the top ten domestic destinations served from San Francisco International Airport (SFO), based on passenger volume. This investment provides greater network coverage across North America for travelers from these two focus markets, and we expect that this investment will allow us to continue to grow by leveraging the loyal guest base that we have established in each market.
Our Team and Entrepreneurial Culture. Our teammates and culture are essential elements of our success because they contribute significantly to our premium travel experience. We start by hiring the right teammates through a rigorous process that includes numerous interviews, as well as pre-employment testing for our frontline teammates and our pilots. Key characteristics of Virgin America teammates include a friendly, personable nature, a willingness to think differently, a passionate approach to his or her work and intense pride in Virgin America and our product. We empower our teammates with a high level of authority to resolve guest issues throughout the travel experience, from making flight reservations to interactions at the airport and in flight. We strive to create an environment for our teammates where open communication is both encouraged and expected and where we celebrate our successes together.
Route Network
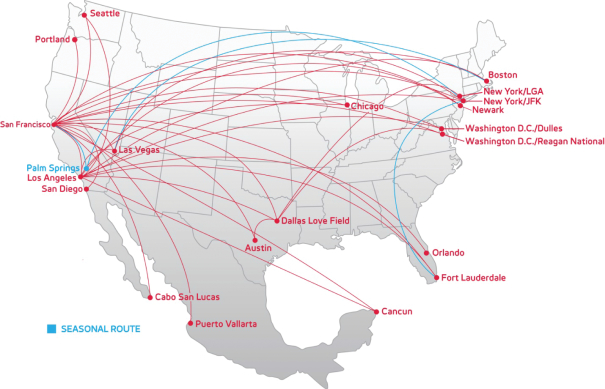
We served 21 airports throughout North America as of December 31, 2014. The majority of our routes operate to and from our focus cities of Los Angeles and San Francisco, with a smaller presence located at Dallas Love Field (DAL). Our current network is a mix of long-haul, transcontinental service combined with short-haul West coast service and select Mexico leisure destinations. Below is a route map of our network.
5
Table of Contents
We use publicly available data related to existing traffic, fares and capacity in domestic markets to identify growth opportunities. To monitor the profitability of each route, we analyze monthly profitability reports as well as near-term forecasting. We routinely make adjustments to capacity and frequency of flights within our network based on the financial performance of our markets, and we discontinue service in markets where we determine that long-term profitability is not likely to meet our expectations.
Our future network plans include growing from our focus cities of Los Angeles and San Francisco to other major markets in North America. By continuing to add destinations in select markets from Los Angeles and San Francisco, we can leverage our existing base of loyal guests and grow our share of revenue within these focus cities while also expanding our customer base as we gain new guests in these markets. In 2014, we added service from DAL to New York LaGuardia Airport (LGA) and Ronald Reagan Washington National Airport (DCA). We believe this DAL opportunity increased the diversity of our route network and will provide growth into strategic airports that are limited by regulation.
Commercial Partnerships
We have codeshare and interline agreements with a number of other high-quality airlines to support our revenue strategy. Our codeshare relationships provide for cross-selling of seamless connecting itineraries from our partners’ international and domestic flights onto our network and, in some instances, also provide for frequent-flyer reciprocity whereby guests can earn and use reward travel on both airlines. Los Angeles and San Francisco are gateways to the U.S. mainland from Asian and trans-Pacific destinations, as well as Hawaii, and our domestic network from these cities provides a natural extension for our codeshare partners.
We currently have codeshare agreements with China Airlines, China Eastern Airlines, Hawaiian Airlines, Singapore Airlines and Virgin Australia, and we plan to add additional codeshare partners in the future, focusing on Asia/Pacific partnership opportunities. We also have interline agreements with 28 additional airlines. Interline agreements allow guests to create itineraries connecting from one airline to another but are more limited in scope than codeshare agreements. Our commercial partnerships contribute to our RASM growth by adding incremental international and domestic guests and revenue and by providing international network opportunities to our existing guests.
Ancillary and Other Revenue
While some of our product features are included in our base pricing, we have unbundled certain ancillary features that our guests separately value. Major ancillary revenue products include checked baggage fees, ticket change fees and our Express product providing reserved seating near the front of the Main Cabin, priority boarding and security access. Guests also pay a reservation fee if they choose to make their reservation through our call center. Additionally, we market certain products from our partners such as travel insurance on our website and recognize revenue in connection with our co-branded credit card program. We also promote and sell products in flight to enhance the guest experience, including meals, snacks, alcoholic and premium non-alcoholic beverages, on-demand current-run movies and premium television programs, headphones and sleep kits. In 2014, other revenue, of which the majority represents the ancillary revenue items noted above, represented 10.8% of our total revenue.
Guest Loyalty Program
We maintain an extensive guest loyalty program called the Elevate® frequent flyer program. Our guests earn points for purchasing travel that are redeemable for travel rewards throughout our network and the networks of our partners. We were the first U.S. airline to adopt a loyalty program based on the value of ticket purchases. The number of points that guests earn is tied directly to the purchase price of the ticket; likewise, guests may redeem Elevate points for any fare within our inventory, without any blackout dates, because our rewards pricing is variable. Elevate members with Gold or Silver status enjoy earning bonus Elevate points on purchases, advance
6
Table of Contents
access to purchase upgrade options, complimentary upgrades to Main Cabin Select on a space-available basis, free checked bags and priority check-in boarding and security access. At the end of 2014, we had approximately 3.5 million Elevate members, which represented a 16.2% increase over the end of 2013.
We maintain partnerships with other companies through our Elevate program. Companies purchase Elevate points from us to reward their own customers. We benefit from the direct sale of Elevate points as well as additional loyalty from guests that earn points through these other channels. Our most significant third-party Elevate relationship is our co-branded consumer credit card issued by Alliance Data Services, or ADS, which replaced our prior co-branded card program in early 2014. The new program provides enhanced features to our Elevate members such as point accumulation, free first checked bag and waived change fees, and various discounts for companion travel and inflight purchases. ADS provides annual guarantees of Elevate points activity significantly greater than our past activity. As a result, we expect this new relationship to result in significant growth in our Elevate program and an increase in revenue for Elevate points sold through this relationship.
Marketing and Distribution
We are focused on direct-to-consumer marketing targeted at our core business and leisure guests. Our principal marketing messages are our association with the Virgin brand, our premium travel experience, popular destinations within our network, our innovative product offerings and competitive fares. Consistent with our business model and our brand, we use edgy and fun marketing messages to engage our key demographic. We are early adopters of technology including social networks, generating significant engagement from our advocates on Facebook, Twitter and other social media channels. We consider these channels important for generating awareness around our product and brand as well as creating a positive connection and communication channel with our guests, teammates and other advocates.
Our primary advertising mediums include online search-and-display advertising, targeted direct email marketing, strategically located outdoor advertisements in our key markets, as well as sponsorships of sports teams, select events and entertainment venues. We are also able to leverage the Virgin brand to create public relations events and low-cost viral marketing campaigns that generate extensive media coverage.
We sell our product through three primary distribution channels: our website, our outsourced call center and third parties such as travel agents who access us through global distribution systems, or GDS (e.g., Amadeus, Sabre and Travelport), and select online travel agents, or OTAs (e.g., Orbitz and Travelocity). We use our website as the primary platform for ticket sales, and approximately 60% of our total tickets sold in 2014 were through direct internet bookings using our website.
We also have a dedicated sales team that focuses on corporate and travel agent accounts. We focus on this segment because corporate accounts and agencies booking through a global distribution system generated average fares 36% higher than those generated through other channels in 2014.
Teammates
We believe maintaining a positive relationship with our teammates is a valuable part of our culture. We believe our relationship with our workforce allows us a highly productive working environment that benefits both the company and our teammates.
At December 31, 2014, our active teammates consisted of 595 pilots, 825 inflight teammates (whom other airlines refer to as flight attendants), 632 guest services teammates, 120 maintenance technicians and 568 management and other personnel. We have a direct working relationship with all of our teammates, other than our inflight teammates, who voted for representation by the Transport Workers Union on August 13, 2014.
Competition
The airline industry is highly competitive. The principal competitive factors in the airline industry are the fare and total price, flight schedules, product and passenger amenities, customer service, number of routes served
7
Table of Contents
from a city, fleet type, safety record and reputation, code-sharing relationships and frequent flier programs. Our competitors and potential competitors include traditional legacy airlines, LCCs and “ultra-low-cost carriers,” or “ULCCs.” We typically compete in markets served by traditional legacy airlines and LCCs and, to a lesser extent, ULCCs.
Our principal competitors on domestic routes are Alaska Airlines, American Airlines, Delta Air Lines, JetBlue Airways, Southwest Airlines and United Airlines. Our principal competitive advantages are our premium product and brand, distinctive culture and low cost structure. We believe our business model enables us to compete effectively with other LCCs by generating higher stage-length adjusted RASM but at a stage-length adjusted CASM competitive within the industry and lower than that of legacy airlines.
The airline industry is particularly susceptible to price discounting because, once a flight is scheduled, airlines incur only nominal incremental costs to provide service to passengers occupying otherwise unsold seats. The expenses of a scheduled aircraft flight do not vary significantly with the number of passengers carried, and as a result, a relatively small change in the number of passengers or in pricing can have a disproportionate effect on an airline’s operating and financial results. Price competition occurs on a market-by-market basis through price discounts, changes in pricing structures, fare matching, target promotions and frequent flier initiatives. Airlines typically use discount fares and other promotions to stimulate traffic during normally slower travel periods to generate cash flow and to maximize RASM. The prevalence of discount fares can be particularly acute when a competitor has excess capacity to sell.
Operational Performance
Operational reliability is paramount to success in the airline industry. We strive to achieve high levels of operational performance through careful planning of our flight schedules, an extensive maintenance reliability program and the use of an operating spare aircraft and spare engines. For both 2014 and 2013, we were the top-ranked airline in the Airline Quality Rating, an annual analysis of airline performance conducted by Wichita State University and Embry-Riddle. The U.S. Department of Transportation, or DOT, publishes statistics regarding measures of customer satisfaction for domestic airlines and can assess civil penalties for failure to comply with certain customer service obligations. Our domestic performance under customer service measures for the years ended December 31, 2014 and 2013 was as follows:
| 2014 | 2013 | |||||||
| On-Time Performance (1) |
81.5 | % | 82.1 | % | ||||
| Completion Factor (2) |
99.4 | % | 99.5 | % | ||||
| Mishandled Baggage (3) |
0.95 | 0.97 | ||||||
| (1) | Percentage of our scheduled flights operated by us on-time (within 15 minutes). |
| (2) | Percentage of our scheduled flights operated by us, whether or not delayed (i.e., not canceled). |
| (3) | Our incidence of delayed, mishandled or lost baggage per 1,000 passengers. |
Aircraft Fuel
Aircraft fuel is our largest expense representing 35.8% of our total operating costs in 2014. The price and availability of jet fuel are volatile due to global economic and geopolitical factors as well as domestic and local supply factors. We use a third-party fuel management vendor to procure most of our fuel. Our historical fuel consumption and costs were as follows:
| Year Ended December 31, | ||||||||||||
| 2014 | 2013 | 2012 | ||||||||||
| Gallons consumed (millions) |
162 | 159 | 161 | |||||||||
| Total cost (millions) |
$ | 499 | $ | 507 | $ | 538 | ||||||
| Average price per gallon |
3.08 | $ | 3.18 | $ | 3.32 | |||||||
| Percent of operating expenses |
35.8 | % | 37.7 | % | 39.4 | % | ||||||
8
Table of Contents
Total cost and average price per gallon each include related fuel fees and taxes as well as effective fuel-hedging gains and losses.
We maintain an active fuel hedging program to reduce our exposure to sudden, sharp increases in fuel prices. We enter into a variety of hedging instruments, such as forward swaps, options and collar contracts on jet fuel and highly correlated commodities such as heating oil and crude oil. We also use fixed forward price contracts, or FFPs, which allow us to lock in the price of jet fuel for specified quantities and at specified locations in future periods.
Maintenance and Repairs
We have a U.S. Federal Aviation Administration, or FAA, mandated and approved maintenance program, which is administered by our technical operations department. Our maintenance technicians undergo extensive initial and ongoing training to ensure the safety of our aircraft.
Aircraft maintenance and repair consist of routine and non-routine maintenance, and work performed is divided into three general categories: line maintenance, major maintenance and component service. Line maintenance consists of routine daily and weekly scheduled maintenance checks on our aircraft, including pre-flight, daily, weekly and overnight checks, diagnostics, routine repairs and any unscheduled items on an as-needed basis. Line maintenance events are currently serviced by our mechanics in Los Angeles, San Francisco, Dallas and New York and are supplemented by contract vendors in other locations. Major airframe maintenance checks consist of a series of more complex tasks that can take from one to four weeks to accomplish and typically are required approximately every 20 months. We outsource our major airframe maintenance to an FAA-certified maintenance provider in the United States. Engine overhauls and engine performance restoration events are quite extensive and can take one to two months. We keep spare engines to maintain continued operations during engine maintenance events. We expect to begin the initial engine maintenance overhauls on our engine fleet approximately eight to ten years after the date of manufacture and introduction into our fleet, with subsequent engine maintenance every four to six years thereafter. We have entered into a long-term flight hour agreement with General Electric for our engine overhaul services. Lufthansa Technik covers our component repair and inventory management services on an hourly basis and also provides all of our aircraft component inventory acquisition, replacement and repairs, thereby eliminating the need to carry expensive spare parts inventory.
Our recent maintenance expenses have been lower than what we expect to incur in the future because of the relatively young age of our aircraft fleet. We expect our maintenance costs to increase as the frequency of repair increases with aircraft age. As our aircraft age, the scheduled scope of work and the frequency of unscheduled maintenance events are likely to increase as with any mature fleet. Our aircraft utilization rate could decrease with the increase in aircraft maintenance. In addition, we account for qualifying major engine maintenance under the deferral method wherein overhaul costs and replacement of engine life limited parts are capitalized and amortized. We expect that the final qualifying major engine maintenance events will be amortized over the remaining lease term rather than until the next estimated major maintenance event, which will result in significantly higher depreciation and amortization expense related to major maintenance in the last few years of the leases as compared to expenses in earlier periods.
Insurance
We maintain multiple insurance policies customary in the airline industry and as required by the DOT. The policies principally provide liability coverage for public and passenger injury, damage to property, loss of or damage to flight equipment, third-party war risk (terrorism), fire and extended coverage, directors’ and officers’ liability and workers’ compensation and employer’s liability. Although we currently believe our insurance coverage is adequate, we cannot assure you that the amount of such coverage will not be changed or that we will not be forced to bear substantial losses from any accidents.
9
Table of Contents
Foreign Ownership
Under DOT regulations and federal law, we must be controlled by U.S. citizens. In order to qualify, no more than 24.9% of our voting stock may be voted, directly or indirectly, by persons who are non-U.S. citizens, no more than 49.9% of our outstanding stock may be owned (beneficially or of record) by persons who are not U.S. citizens and our president and at least two-thirds of the members of our board of directors and senior management must be U.S. citizens. We are currently in compliance with these ownership provisions.
Aviation Regulation
The DOT and FAA have regulatory authority over air transportation in the United States. The DOT has authority to issue certificates of public convenience and necessity required for airlines to provide domestic air transportation. International routes and international code-sharing arrangements are regulated by the DOT and by the governments of the foreign countries involved. An airline’s ability to operate flights to international destinations is subject to the aviation agreement in place between the United States and the foreign country and the carrier’s ability to obtain necessary authority from the DOT and the applicable foreign government.
The U.S. government has negotiated “open skies” agreements with many countries, which allow unrestricted access between the United States and foreign markets. Our international flights to Mexico are governed by a bilateral agreement between the United States and Mexico. Changes in U.S. or Mexico aviation policies could result in the alteration or termination of that agreement, diminish the value of our route authorities or otherwise affect our Mexico operations.
The FAA is responsible for regulating and overseeing matters relating to the safety of air carrier flight operations, including the control of navigable air space, the qualification of flight personnel, flight training practices, compliance with FAA airline operating certificate requirements, aircraft certification and maintenance and other matters affecting air safety. The FAA requires each commercial airline to obtain and hold an FAA air carrier certificate. In January 2014, the FAA implemented a rule to amend flight, duty and rest regulations pertaining to pilots. The new rule may reduce our staffing flexibility, and we increased our level of reserve pilots to meet the operational requirements of these rules.
Airport Access
Flights at four major domestic airports are regulated through allocations of “slots” or similar regulatory mechanisms, which limit take-offs and landings at those airports. Each slot represents the authorization to land at or take off from the particular airport during a specified time period.
In the United States, the FAA currently regulates the allocation of slots, slot exemptions, operating authorizations or similar capacity allocation mechanisms at Ronald Reagan Washington National Airport (DCA) in Washington, D.C., Newark Liberty International Airport (EWR) in New Jersey and New York’s LaGuardia Airport (LGA) and John F. Kennedy International Airport (JFK). Our operations at these airports generally require the allocation of slots or analogous regulatory authorizations. We currently have sufficient slots or operating authorizations to operate our existing flights, but there is no assurance that we will be able to do so in the future because, among other reasons, such allocations are subject to changes in governmental policies.
Consumer Protection Regulation
The DOT also has jurisdiction over certain economic issues affecting air transportation and consumer protection matters, including unfair or deceptive practices and unfair methods of competition by air carriers, airline advertising, denied boarding compensation, ticket refunds, baggage liability and disabled passenger transportation. The DOT frequently adopts new consumer protection regulations, such as recent rules to protect
10
Table of Contents
passengers addressing tarmac delays and chronically delayed flights, and is reviewing new guidelines to address the disclosure and sale of ancillary services and related fees. The DOT also has authority to review certain joint venture agreements between major carriers and engages in regulation of economic matters such as slot transactions.
Security Regulation
The U.S. Transportation Security Administration and the U.S. Customs and Border Protection, each a division of the U.S. Department of Homeland Security, are responsible for certain civil aviation security matters, including passenger and baggage screening at U.S. airports and international passenger prescreening prior to entry into or departure from the U.S. International flights are subject to customs, border, immigration and similar requirements of equivalent foreign governmental agencies.
Environmental Regulation
We are subject to various federal, state and local laws and regulations and foreign government requirements relating to the protection of the environment and affecting matters such as aircraft engine emissions, aircraft noise emissions and the discharge or disposal of materials and chemicals.
Emissions. The U.S. Environmental Protection Agency, or EPA, is authorized to regulate aircraft emissions, including air carrier operations, which affect the quality of air in the United States. We believe the aircraft in our fleet meet the emission standards issued by the EPA. Concern about climate change and greenhouse gases may result in additional regulation or taxation of aircraft emissions in the United States and abroad. Cap and trade restrictions have also been proposed in the United States. In addition, other legislative or regulatory action, including by the EPA, to regulate greenhouse gas emissions is possible. In particular, the EPA has found that greenhouse gases threaten the public health and welfare, which could result in regulation of greenhouse gas emissions from aircraft. In the event that legislation or regulation is enacted in the United States or in the event similar legislation or regulation is enacted in jurisdictions where we operate or where we may operate in the future, it could result in significant costs for us and the airline industry. In addition to direct costs, such regulation may have a greater effect on the airline industry through increases in fuel costs that could result from fuel suppliers passing on increased costs that they incur under such a system. We seek to minimize the impact of greenhouse gas emissions from our operations by operating with newer, more fuel-efficient aircraft. In addition, we have implemented fuel saving procedures in our flight and ground support operations as part of our efforts to reduce our emissions and minimize our impact on the environment.
Noise. Federal law recognizes the right of airport operators with special noise problems to implement local noise abatement procedures so long as those procedures do not interfere unreasonably with interstate and foreign commerce and the national air transportation system. These restrictions can include limiting nighttime operations, directing specific aircraft operational procedures during take-off and initial climb and limiting the overall number of flights at an airport. While we have had sufficient scheduling flexibility to accommodate local noise restrictions in the past, our operations could be adversely impacted if locally imposed regulations become more restrictive or widespread.
Other Regulations
Airlines are also subject to various other federal, state, local and foreign laws and regulations. For example, the U.S. Department of Justice has jurisdiction over airline competition matters. Labor relations in the airline industry are generally governed by the Railway Labor Act. The privacy and security of passenger and employee data is regulated by various domestic and foreign laws and regulations.
Future Regulations
The U.S. government and foreign governments may consider and adopt new laws, regulations, interpretations and policies regarding a wide variety of matters that could directly or indirectly affect our results
11
Table of Contents
of operations. We cannot predict what laws, regulations, interpretations and policies might be considered in the future, nor can we judge what impact, if any, the implementation of any of these proposals or changes might have on our business.
| ITEM 1A. | RISK FACTORS |
Our business involves significant risks, some of which are described below. You should carefully consider these risks, as well as the other information in this Annual Report on Form 10-K, including our financial statements and the related notes and “Management’s Discussion and Analysis of Financial Condition and Results of Operations.” The occurrence of any of the events or developments described below, as well as additional risks and uncertainties not presently known to us or that we currently deem immaterial, could materially adversely affect our business, results of operations, financial condition and growth prospects.
Our business has been and in the future may be materially adversely affected by the price and availability of aircraft fuel. High fuel costs and increases in fuel prices or a shortage or disruption in the supply of aircraft fuel would have a material adverse effect on our business.
The price of aircraft fuel may be high or volatile. The cost of aircraft fuel is highly volatile and is our largest individual operating expense, accounting for 35.8%, 37.7%, and 39.4% of our operating expenses for 2014, 2013, and 2012. High fuel costs or increases in fuel costs (or in the price of crude oil) could materially adversely affect our business. Since August 2014, the price of jet fuel has fallen by approximately fifty percent, which benefits us by lowering our expenses. However, because fuel prices are highly volatile, the price of jet fuel may increase significantly at any time. We may be more susceptible to fuel-price volatility than most of our competitors since fuel represents a larger proportion of our total costs due to the longer average stage length of our flights.
Availability of aircraft fuel may be low. Our business is also dependent on the availability of aircraft fuel (or crude oil), which is not predictable. Weather-related events, natural disasters, terrorism, wars, political disruption or instability involving oil-producing countries, changes in governmental or cartel policy concerning crude oil or aircraft fuel production, labor strikes or other events affecting refinery production, transportation, taxes or marketing, environmental concerns, market manipulation, price speculation and other unpredictable events may drive actual or perceived fuel supply shortages. Shortages in the availability of, or increases in demand for, crude oil in general, other crude-oil-based fuel derivatives and aircraft fuel in particular could result in increased fuel prices and could materially adversely affect our business.
Fare increases may not cover increased fuel costs. We may not be able to increase ticket prices sufficiently to cover increased fuel costs, particularly when fuel prices rise quickly. We sell a significant number of tickets to passengers well in advance of travel, and, as a result, fares sold for future travel may not reflect increased fuel costs. In addition, our ability to increase ticket prices to offset an increase in fuel costs is limited by the competitive nature of the airline industry and the price sensitivity associated with air travel, particularly leisure travel, and any increases in fares may reduce the general demand for air travel.
Our fuel hedging program may not be effective. We cannot assure you our fuel hedging program, including our forward fixed price contracts, or FFPs, which we use as part of our hedging strategy, will be effective or that we will maintain a fuel hedging program. Even if we are able to hedge portions of our future fuel requirements, we cannot guarantee that our hedge contracts will provide an adequate level of protection against increased fuel costs or that the counterparties to our hedge contracts will be able to perform. Certain of our fuel hedge contracts may contain margin funding requirements that could require us to post collateral to counterparties in the event of a significant drop in fuel prices. For example, the recent decrease in the price of jet fuel has triggered unrealized losses on certain hedge positions of $27.1 million at December 31, 2014. Additionally, our ability to realize the benefit of declining fuel prices will be delayed by the impact of fuel hedges in place, and we may record significant losses on fuel hedges during periods of declining prices. A failure of our fuel hedging strategy,
12
Table of Contents
significant margin funding requirements, overpaying for fuel through the use of FFPs or our failure to maintain a fuel hedging program could prevent us from adequately mitigating the risk of fuel price increases and could materially adversely affect our business.
The airline industry is exceedingly competitive, and we compete against both legacy airlines and low-cost carriers; if we are not able to compete successfully in the domestic airline industry, our business will be materially adversely affected.
The domestic airline industry is characterized by significant competition from both large legacy airlines and low-cost carriers, or LCCs. Airlines compete for passengers with a variety of fares, discounts, route networks, flight schedules, flight frequencies, frequent flyer programs and other products and services, including seating, food, entertainment and other on-board amenities. Airlines also compete on the basis of customer-service performance statistics, such as on-time arrivals, customer complaints and mishandled baggage reports. We face significant competition from both large legacy airlines and LCCs on the routes we operate, and if we are unable to compete effectively, our business will be materially adversely affected.
Large legacy airlines have numerous competitive advantages in competing for airline passengers, particularly following the consolidation in the domestic airline industry that occurred between 2008 and 2013, which resulted in the creation of four dominant domestic airlines with significant breadth of network coverage and financial resources. We face competition from one or more of these legacy carriers with respect to nearly all of the routes we serve. The legacy carriers have a number of competitive advantages relative to us that may enable them to attain higher average fares, more passenger traffic and a greater percentage of business passengers than we attain. These advantages include a much larger route network with domestic and international connections, more flights and convenient flight schedules in routes that overlap with ours. These carriers also offer frequent flyer programs and lounge access benefits that reward and create loyalty with travelers, particularly business travelers. Moreover, several legacy carriers have corporate travel contracts that direct employees to fly with a preferred carrier. The enormous route networks operated by these airlines, combined with their marketing and partnership relationships with regional airlines and international alliance partner carriers, allow them to generate increased passenger traffic from domestic and international cities. Our smaller, point-to-point route network and lack of connecting traffic and marketing alliances puts us at a competitive disadvantage to legacy carriers, particularly with respect to our appeal to higher-fare business travelers.
Each of the legacy carriers operates a much larger fleet of aircraft and has greater financial resources than we do, which permits them to add service in response to our entry into new markets. For example, United Airlines operates a hub at San Francisco International Airport (SFO) and has engaged in aggressive competitive practices, such as increasing seat capacity by introducing larger-gauge aircraft or adding incremental flights in response to our entry into new markets served from SFO. Due to our relatively small size, we are more susceptible to a fare war or other competitive activities in one or more of the markets we serve, which could prevent us from attaining the level of passenger traffic or maintaining the level of ticket sales required to sustain profitable operations in new or existing markets.
LCCs also have numerous competitive advantages in competing for airline passengers. LCCs generally offer a more basic service to travelers and therefore have lower cost structures than other airlines. The lower cost structure of LCCs permits them to offer flights to and from many of the same markets as most major airlines, which are defined by the U.S. Department of Transportation, or DOT, as U.S.-based air carriers with annual operating revenues in excess of one billion dollars during a fiscal year, but at lower prices. LCCs also typically fly direct, point-to-point flights, which tends to improve aircraft and crew scheduling efficiency. Many LCCs also provide only a single class of service, thereby avoiding the incremental cost of offering premium-class services like those that we offer.
In addition, some LCCs have a relentless focus on lowering costs and provide only a very basic level of service to passengers. These carriers configure their aircraft with high-density seating configurations and offer
13
Table of Contents
minimal amenities during the flight, and as a result, they incur lower unit costs than we do. Some LCCs also charge ancillary fees for basic services that we provide free of charge, such as making a reservation, printing boarding passes at the airport and carrying bags onboard the cabin for stowage in the overhead bins. In general, LCCs have lower unit costs and therefore are able to offer lower base fares.
If we fail to implement our business strategy successfully, our business will be materially adversely affected.
Our business strategy is to target business and leisure travelers who are willing to pay a premium for our newer aircraft, more comfortable seating, better customer service and the latest on-board amenities while maintaining a cost structure that is lower than that of the legacy airlines that these business and premium travelers have historically favored. We may not be successful in attracting enough passengers willing to pay a premium over the fares offered by the LCCs, which we require to offset the additional costs embedded within our premium service model. In addition, American Airlines, Delta Air Lines, United Airlines and JetBlue Airways are increasing the quality of their seating and on-board amenities in some of the routes where they compete with us, making it more challenging to attract passengers who are loyal to those airlines. Continuing to grow our business profitably is also critical to our business strategy. Growth poses various operational and financial challenges, including securing additional financing for aircraft acquisition, obtaining airport gates and facilities at congested airports that serve business and premium travelers and hiring qualified personnel while maintaining our culture, which we believe is vital to the continued success of our airline. We cannot assure you that we will be able to successfully and profitably expand our fleet, enter new markets or grow existing markets in order to achieve additional economies of scale and maintain or increase our profitability. If we are unsuccessful in deploying our strategy, or if our strategy is unsustainable, our business will be materially adversely affected.
Threatened or actual terrorist attacks or security concerns involving airlines could materially adversely affect our business.
Past terrorist attacks against airlines have caused substantial revenue losses and increased security costs. As a result, any actual or threatened terrorist attack or security breach, even if not directly against an airline, could materially adversely affect our business by weakening the demand for air travel and resulting in increased safety and security costs for us and the airline industry generally. Terrorist attacks made directly on a domestic airline, or the fear of such attacks or other hostilities (including elevated national threat warnings or selective cancellation or redirection of flights due to terror threats), would have a negative impact on the airline industry and materially adversely affect our business.
We rely heavily on technology and automated systems to operate our business, and any failure of these technologies or systems could materially adversely affect our business.
We are highly dependent on technology and computer systems and networks to operate our business. These technologies and systems include our computerized airline reservation system, flight operations systems, telecommunications systems, airline website, maintenance systems and check-in kiosks.
In order for our operations to work efficiently, our website and reservation system must be able to accommodate a high volume of traffic, maintain secure information and deliver flight information. We depend on our reservation system, which is hosted and maintained under a long-term contract by a third-party service provider, to issue, track and accept electronic tickets, conduct check-in, board and manage our passengers through the airports we serve and provide us with access to global distribution systems, which enlarge our pool of potential passengers. In May 2011, we experienced significant reservations system outages, which resulted in lost ticket sales on our website which materially adversely affected our business and goodwill. If our reservation system fails or experiences interruptions again, and we are unable to book seats for any period of time, we could lose a significant amount of revenue as customers book seats on other airlines, and our reputation could be harmed.
14
Table of Contents
We also rely on third-party service providers to maintain our flight operations systems, and if those systems are not functioning, we could experience service disruptions, which could result in the loss of important data, increase our expenses, decrease our operational performance and temporarily stall our operations. Replacement services may not be readily available on a timely basis, at competitive rates or at all, and any transition time to a new system may be significant. In the event that one or more of our primary technology or systems vendors fails to perform and a replacement system is not available, our business could be materially adversely affected.
Our business could be materially adversely affected from an accident or safety incident involving our aircraft.
An accident or safety incident involving one of our aircraft could expose us to significant liability and a public perception that our airline is unsafe or unreliable. In the event of a major accident, we could be subject to significant personal injury and property claims. While we maintain liability insurance in amounts and of the type generally consistent with industry practice, the amount of such coverage may not be adequate to cover fully all claims, and we may be forced to bear substantial losses from an accident. In addition, any accident or incident involving one of our aircraft (or an accident involving another Virgin-branded airline), even if fully insured, could harm our reputation and result in a loss of future passenger demand if it creates a public perception that our operation is unsafe or unreliable as compared to other airlines or means of transportation. As a result, any accident or safety incident involving our aircraft could materially adversely affect our business.
The demand for airline services is sensitive to changes in economic conditions, and another recession would weaken demand for our services and materially adversely affect our business.
The demand for business and leisure travel is affected by U.S. and global economic conditions. Unfavorable economic conditions have historically reduced airline travel spending. For most leisure consumers, travel is a discretionary expense, and during unfavorable economic conditions, travelers have often replaced air travel with car travel or other forms of ground transportation or have opted not to travel at all. Likewise, during unfavorable economic conditions, businesses have foregone or deferred air travel. Travelers have also reduced spending by purchasing less expensive tickets, which can result in a decrease in average revenue per seat. Because we have relatively high fixed costs, much of which cannot be mitigated during periods of lower demand for air travel, our business is particularly sensitive to changes in U.S. economic conditions. A reduction in the demand for air travel due to unfavorable economic conditions also limits our ability to raise fares to counteract increased fuel, labor and other costs. If U.S. or global economic conditions are unfavorable or uncertain for an extended period of time, it would materially adversely affect our business.
We have a limited operating history and have only recorded two years of profit, and we may not sustain or increase profitability in the future.
We have a history of losses and only a limited operating history upon which you can evaluate our business and prospects. While we recorded an annual profit in 2013 and 2014, we cannot assure you that we will be able to sustain or increase profitability on a quarterly or an annual basis. In turn, this may cause the trading price of our common stock to decline and may materially adversely affect our business.
Airlines are subject to extensive regulation and taxation by governmental authorities, and compliance with new regulations and any new or higher taxes will increase our operating costs and may materially adversely affect our business.
We are subject to extensive regulatory and legal compliance requirements. Congress regularly passes laws that affect the airline industry, and the DOT, the Federal Aviation Administration, or FAA, and the Transportation Security Administration, or TSA, continually issue regulations, orders, rulings and guidance relating to the operation, safety and security of airlines that require significant expenditures and investment by us. For example, the DOT has broad authority over airlines to prevent unfair and deceptive practices and has used this authority to impose numerous airline regulations, including rules and fines relating to airline advertising,
15
Table of Contents
pricing, baggage compensation, denied boarding compensation and tarmac delayed flights. The DOT frequently considers the adoption of new regulations, such as rules relating to congestion-based landing fees at airports and limits or disclosures concerning ancillary passenger fees. For example, in June 2014, the DOT issued a notice of proposed rulemaking to further enhance passenger protections that addresses several areas of regulation, including post-purchase ticket increases, ancillary fee disclosures and code-share data reporting and disclosure. Compliance with existing requirements drives administrative, legal and operational costs and subjects us to potential fines, and any new regulatory requirements issued by the DOT may increase our compliance costs, reduce our revenues and materially adversely affect our business.
The FAA has broad authority to address airline safety issues, including inspection authority over our flight, technical and safety operations, and has the ability to issue mandatory orders relating to, among other things, the grounding of aircraft, installation of mandatory equipment and removal and replacement of aircraft parts that have failed or may fail in the future. Any decision by the FAA to require aircraft inspections, complete aircraft maintenance or ground aircraft types operated by us could materially adversely affect our business. For example, on January 4, 2014, the FAA’s new and more stringent pilot flight and duty time requirements under Part 117 of the Federal Aviation Regulations took effect, which has increased costs and could further increase our costs in the future.
The FAA also has extensive authority to address airspace/airport congestion issues and has imposed limitations on take-off and landing slots at four airports: Ronald Reagan Washington National Airport (DCA), LaGuardia Airport (LGA), John F. Kennedy International Airport (JFK) and Newark Liberty International Airport (EWR). The FAA could reduce the number of slots allocated at these airports or impose new slot restrictions at other airports.
The Port Authority of New York & New Jersey maintains a so-called “perimeter rule” that prohibits weekday non-stop flights longer than 1,500 miles from LGA, a restriction that does not exist at JFK and EWR. We currently have a limited number of take-off and landing slots at LGA, compared to certain of our competitors. If the LGA perimeter rule were relaxed or eliminated, it could increase competition at LGA for high-revenue longer haul routes favored by business travelers and higher revenue passengers. If New York business travelers and higher revenue passengers elect to travel out of LGA rather than JFK and EWR, airports that farther from Manhattan, we may not have sufficient slots to compete, which could materially adversely affect our business.
We are also subject to restrictions imposed by federal law that require that no more than 24.9% of our stock be voted, directly or indirectly, by persons who are not U.S. citizens, that no more than 49.9% of our outstanding stock be owned by persons who are not U.S. citizens and that our president and at least two-thirds of the members of our board of directors and senior management be U.S. citizens. For more information on these requirements, see “—Our corporate charter and bylaws include provisions limiting voting and ownership by non-U.S. citizens and specifying an exclusive forum for stockholder disputes.” We are currently in compliance with these ownership restrictions. Our high level of foreign ownership may limit our opportunity to participate in U.S. government travel contracts and the Civilian Reserve Air Fleet program, however, if we are unable to satisfy policies and procedures of the U.S. Department of Defense for the mitigation of foreign ownership, control or influence required of cleared U.S. contractors.
Domestic airlines are also subject to significant taxation, including taxes on jet fuel, passenger tickets and security fees to compensate the federal government for its role in regulating airlines, providing air traffic controls and implementing security measures related to airlines and airports. In July 2014, the TSA implemented an increased passenger security fee at a flat rate of $5.60 per passenger. Any significant increase in ticket taxes or security fees could weaken the demand for air travel, increase our costs and materially adversely affect our business.
Many aspects of airlines’ operations are also subject to increasingly stringent environmental regulations, and growing concerns about climate change may result in the imposition of additional regulation. Since the domestic
16
Table of Contents
airline industry is highly price sensitive, we may not be able to recover from our passengers the cost of compliance with new or more stringent environmental laws and regulations, which could materially adversely affect our business. Although we do not expect the costs of complying with current environmental regulations will have a material adverse effect on our business, we cannot assure you that the costs of complying with environmental regulations would not materially adversely affect us in the future.
Almost all commercial service airports are owned and/or operated by units of local or state governments. Airlines are largely dependent on these governmental entities to provide adequate airport facilities and capacity at an affordable cost. Many airports have increased their rates and charges to air carriers because of higher security costs, increased costs related to updated infrastructures and other costs. Additional laws, regulations, taxes and airport rates and charges have been proposed from time to time that could significantly increase the cost of airline operations or reduce the demand for air travel. Although lawmakers may impose these additional fees and consider them “pass-through” costs, we believe that a higher total ticket price will influence consumer purchase and travel decisions and may result in an overall decline in passenger traffic, which could materially adversely affect our business.
Our ability to obtain financing or access capital markets may be limited.
We have significant obligations to purchase aircraft and spare engines that we have on order from Airbus and CFM International, or CFM, and we have historically relied solely on lessors to provide financing for our aircraft acquisition needs. As of December 31, 2014, committed expenditures for these aircraft and spare engines, including estimated amounts for contractual price escalations and $94.3 million of pre-delivery payment commitments, were approximately $396.1 million. Because we may not have sufficient liquidity or creditworthiness to fund the purchase of aircraft and engines, including payment of pre-delivery payments, we expect to seek external financing for these expenses. There are a number of factors that may affect our ability to raise financing or access the capital markets, including our liquidity and credit status, our operating cash flows, market conditions in the airline industry, U.S. and global economic conditions, the general state of the capital markets and the financial position of the major providers of commercial aircraft financing. We cannot assure you that we will be able to source external financing for our planned aircraft acquisitions or for other significant capital needs, and if we are unable to source financing on acceptable terms, or unable to source financing at all, our business could be materially adversely affected. To the extent we finance our activities with additional debt, we may become subject to financial and other covenants that may restrict our ability to pursue our strategy or otherwise constrain our growth and operations.
In addition, we may be unable to fully finance future aircraft acquisitions if the aircraft are perceived to be less valuable for any reason. We presently have ten Airbus A320-family, current technology aircraft on order for delivery between July 2015 and June 2016. If Airbus’s newer A320neo-family aircraft provide expected improvements in the fuel consumption and an increase in nautical mile range, the Airbus A320-family current-technology aircraft may be perceived to be less valuable. If we are unable to fully finance our acquisition of these aircraft, our business may be materially adversely affected.
The “Virgin” brand is not under our control, and negative publicity related to the Virgin brand name could materially adversely affect our business.
We believe the “Virgin” brand, which is integral to our corporate identity, represents quality, innovation, creativity, fun, a sense of competitive challenge and employee-friendliness. We license rights to the Virgin brand from certain entities affiliated with the Virgin Group on a non-exclusive basis. The Virgin brand is also licensed to and used by a number of other companies, including two airlines, Virgin Atlantic Airways and Virgin Australia Airlines, operating in other geographies. We rely on the general goodwill of consumers and our employees, whom we call teammates, towards the Virgin brand as part of our internal corporate culture and external marketing strategy. Consequently, any adverse publicity in relation to the Virgin brand name or its principals, particularly Sir Richard Branson who is closely associated with the brand, or in relation to another
17
Table of Contents
Virgin-branded company over which we have no control or influence, could have a material adverse effect on our business.
We obtain our rights to use the Virgin brand under agreements with certain entities affiliated with the Virgin Group, and we would lose those rights if these agreements are terminated or not renewed.
We are party to license agreements with certain entities affiliated with the Virgin Group pursuant to which we obtain rights to use the Virgin brand. The licensor may terminate the agreements upon the occurrence of a number of specified events including if we commit a material breach of our obligations under the agreements that is uncured for more than 10 business days or if we materially damage the Virgin brand. If we lose our rights to use the Virgin brand, we would lose the goodwill associated with our brand name and be forced to develop a new brand name, which would likely require substantial expenditures, and our business would likely be materially adversely affected.
We are subject to labor-related disruptions that could materially adversely affect our business.
On August 13, 2014, our inflight teammates (whom other airlines refer to as flight attendants), representing approximately 32% of our workforce at the time, voted for representation by the Transport Workers Union, or TWU. As a result, the TWU has been certified as the representative of our inflight teammates, and we will be engaged with the TWU in a collective bargaining process for a first contract for those teammates in accordance with the requirements of the Railway Labor Act. Although we currently have a direct relationship with our remaining teammates, airline workers are one of the most heavily unionized private-sector employee groups, and any of our other non-management teammates could also seek to unionize. If we are not able to reach agreement with the TWU on the terms of the collective bargaining agreement for our inflight teammates, or if one or more of our other teammate groups elects a union to represent them, it could create a risk of work stoppages which could materially adversely affect our business.
We depend on the Los Angeles and San Francisco markets to be successful.
Most of our current flights operate from our two focus cities of Los Angeles and San Francisco. In 2014, passengers to and from Los Angeles International Airport (LAX) and to and from SFO accounted for 43.2% and 54.1% of our total passengers. We believe that concentrating our service offerings in this way allows us to maximize our investment in personnel, aircraft and ground facilities and to leverage sales and marketing efforts in those regions. As a result, we are highly dependent on the LAX and SFO markets.
At LAX, we operate out of Terminal Three under an airport lease agreement that runs through 2019, subject to our completion of certain leasehold improvement projects. Under the LAX lease, we have the preferential use of six airport gates with the opportunity to build a new seventh gate with a jet-boarding bridge, and shared access with other airlines to additional common-use gates. At SFO, we primarily operate out of recently renovated Terminal Two, under an operating lease that runs through June 2021, with the occasional use of a gate in the international terminal for flights from Mexico. Under the SFO lease, we have preferential access to seven Terminal Two gates, shared access with other airlines to one common-use Terminal Two gate and shared access to international terminal gates. In the past, we have used SFO international gates for domestic flights. While gate space is limited at both LAX and SFO, we believe that our gate access at each airport is capable of handling our planned growth in operations for at least the next several years.
However, both LAX and SFO are high-traffic airports with limited excess facilities and capacity, which may restrict our growth at these two bases or may even constrict our existing operations. If either LAX or SFO are fully utilized by other airlines, we may be unable to increase our operations at such airport. Additionally, under our LAX and SFO leases, each airport has reserved the right to reevaluate the airlines’ collective utilization of the airport facilities, and to impose minimum usage standards on the airlines in order for each airline to maintain preferential gates. If we are unable to meet future minimum usage standards, we may lose access to our
18
Table of Contents
preferential gates. If we are unable to increase flights in these and other key markets, if any events cause a reduction in demand for air transportation in these key markets, if increases in competition cause us to reduce fares in these key markets, or if we lose access to our preferential gates, our business may be materially adversely affected.
Our quarterly results of operations fluctuate due to a number of factors, including seasonality.
We expect our quarterly results of operations to continue to fluctuate due to a number of factors, including actions by our competitors, price changes in aircraft fuel and the timing and amount of maintenance expenses. As a result of these and other factors, quarter-to-quarter comparisons of our results of operations may not be reliable indicators of our future performance. In addition, seasonality may cause our quarterly results of operations to fluctuate since passengers tend to fly more during the summer months and less in the winter months. We cannot assure you that we will find profitable markets in which to operate during the winter season. Lower demand for air travel during the winter months may materially adversely affect our business.
We have a significant amount of fixed obligations.
The airline business is capital intensive, and many airlines, including us, are highly leveraged. We currently lease all of our aircraft, and these leases contain provisions requiring the payment of monthly rent regardless of usage. As of December 31, 2014, we had undiscounted future operating lease obligations of approximately $1.5 billion, as well as significant maintenance reserve requirements associated with these leases that are variable in nature. In addition, we have ordered aircraft and spare engines from Airbus and CFM for delivery over the next eight years. Under those agreements, we are obligated to make pre-delivery payments to Airbus and CFM on regular intervals in advance of the delivery of our ordered aircraft and spare engines. Moreover, we expect to incur additional fixed expenses as we take delivery of new aircraft, with ten aircraft scheduled for delivery between July 2015 and June 2016 and 30 aircraft scheduled for delivery in 2020 through 2022 but that can be canceled by forfeiting amounts on deposit with Airbus.
The amount of our current and expected future fixed obligations could strain our cash flows from operations, reducing the availability of our cash flows to fund working capital, capital expenditures and other general corporate purposes and limiting our flexibility in planning for, or reacting to, changes in our business and the industry in which we compete. Our substantial fixed obligations could reduce our credit, which would negatively impact our ability to obtain additional financing and could place us at a competitive disadvantage compared to less leveraged competitors and competitors that have better access to capital resources or more favorable terms. We cannot assure you that we will be able to generate sufficient cash flows from our operations or from capital market activities to pay our debt and other fixed obligations as they become due or that we will be able to finance these obligations on favorable terms, or at all. If we are unable to generate sufficient cash flows for any reason, we may be unable to meet our fixed obligations, and our business may be materially adversely affected. In particular, if we are unable to make our required aircraft lease rental payments, we could lose access to one or more aircraft and forfeit our rent deposits, and our lessors could exercise their remedies under the lease agreements. Also, an event of default under any of our leases and our debt financing agreements could trigger cross-default provisions under other agreements.
Our credit card processors have the right to impose larger holdbacks which could have a material adverse effect on our business.
Most of our tickets are sold to customers using credit cards as the form of payment. Our credit card processors have rights in their agreements to hold back receivable monies related to tickets sold for future travel services (i.e., a “holdback”). Any related holdback is remitted to us shortly after the customer travels. Holdbacks are commonly imposed on newer or less creditworthy airlines. Prior to our IPO, we had significant holdback requirements with our two primary credit card processors, Elavon Inc. for Visa/MasterCard and American Express. In connection with the IPO, the Virgin Group obtained a $100.0 million letter of credit on our behalf
19
Table of Contents
which was issued to our credit card processors in order to release $100.0 million of our credit card holdbacks. We had no amounts in excess of the letter of credit held back as of December 31, 2014. Outstanding receivable at December 31, 2014 was $9.6 million. If a credit card processor determines there is a material risk with respect to our business or liquidity, it has the right to increase the amount or duration of the holdback. Any increase in the amount or duration of our holdbacks may negatively impact our liquidity and materially adversely affect our business.
Significant flight delays, cancellations or aircraft unavailability may materially adversely affect our business.
Various factors, many of which are beyond our control, such as air traffic congestion at airports, other air traffic control problems, security requirements, unscheduled maintenance and adverse weather conditions, can cause flight delays or cancellations or cause certain of our aircraft to be unavailable for a period of time. SFO, one of our two primary focus airports, is particularly vulnerable to air traffic constraints and other delays due to fog and inclement weather. Factors that cause flight delays frustrate passengers, and reduced aircraft availability could lead to customer dissatisfaction that harms our reputation. Additionally, if we are forced to cancel a flight due to an event within our control, we will be liable to re-accommodate our guests, including by purchasing tickets for them on other airlines. If one or more of our aircraft is unavailable to fly revenue service for any amount of time, our capacity will be reduced. Significant flight delays, cancellations or aircraft unavailability for any reason could have a material adverse effect on our business.
Our maintenance costs will increase as our fleet ages.
As of December 31, 2014, the average age of aircraft in our fleet of Airbus A320-family aircraft was 5.8 years. Our aircraft will require more scheduled and unscheduled maintenance as they age. We are beginning to incur substantial costs for major maintenance visits for our aircraft, and because of the pattern of our historical fleet growth, we expect to have several aircraft undergoing major maintenance at roughly the same time. These more significant maintenance activities result in out-of-service periods during which certain of our aircraft are unavailable to fly passengers. Any significant increase in maintenance and repair expenses, as well as resulting out-of-service periods, could have a material adverse effect on our business.
We expect that costs associated with the final qualifying major engine maintenance events for our aircraft will be amortized over the remaining lease term rather than until the next estimated major maintenance event, because we account for major maintenance under the deferral method. This could result in significantly higher depreciation and amortization expense related to major maintenance in the last few years of the leases as compared to the expenses in earlier periods.
In addition, the terms of our lease agreements require us to pay supplemental rent, also known as maintenance reserves, to our lessor in advance of the performance of major maintenance, resulting in our recording significant aircraft maintenance deposits on our consolidated balance sheet. However, the payments made after the final qualifying major engine maintenance event during the lease term are generally fully expensed, as the majority of these amounts are not reimbursable from the lessor. As such, it will result in both additional rent expense and depreciation and amortization expense for previously capitalized maintenance being recorded in the period after the final qualifying major engine maintenance event and just prior to the termination of the lease.
We depend on sole-source suppliers for our aircraft and engines.
A critical cost-saving element of our business strategy is to operate a single-family aircraft fleet; however, our dependence on the Airbus A320-family aircraft and CFM engines for all of our flights makes us more vulnerable to any design defects or mechanical problems associated with this aircraft type or these engines. In the event of any actual or suspected design defects or mechanical problems with the Airbus A320-family aircraft or CFM engines, whether involving our aircraft or that of another airline, we may choose or be required to suspend
20
Table of Contents
or restrict the use of our aircraft. Our business could also be materially adversely affected if the public avoids flying on our aircraft due to an adverse perception of the Airbus A320-family aircraft or CFM engines, whether because of safety concerns or other problems, real or perceived, or in the event of an accident involving such aircraft or engines. Separately, if Airbus or CFM becomes unable to perform its contractual obligations and we must lease or purchase aircraft from another supplier, we would incur substantial transition costs, including expenses related to acquiring new aircraft, engines, spare parts, maintenance facilities and training activities, and we would lose the cost benefits from our current single-fleet composition, any of which could have a material adverse effect on our business.
We rely on third-party service providers to perform functions integral to our operations.
We depend on third-party service providers to provide the majority of the services required for our operations, including fueling, maintenance, catering, passenger handling, reservations and airport ground handling, as well as certain administrative and support services. We are likely to enter into similar service agreements for new markets we enter, and we cannot assure you that we will be able to obtain the necessary services at acceptable rates. Moreover, although we do enter into agreements with many of our third-party service providers that define expected service performance, we do not directly control these third-party service providers. Any of these third-party service providers may fail to meet their service performance commitments to us, suffer disruptions to their systems that could negatively impact their services or fail to perform their services reliably, professionally or at the high standard of quality that we expect. Any such failure of our third-party service providers may prevent us from operating one or more flights or providing other services to our customers and may materially adversely affect our business. In addition, our business could be materially adversely affected if our customers believe that our services are unreliable or unsatisfactory.
Our business could be affected by severe weather conditions, natural disasters or the outbreak of contagious disease, any of which could materially adversely affect our business.
Our operations may be materially adversely affected by factors beyond our control, including severe weather conditions, natural disasters and the outbreak of disease. Severe weather conditions, such as winter snowstorms, hurricanes or other weather events, can cause flight cancellations, turbulence or significant delays that may result in increased costs and reduced revenue. Also, our two focus cities, Los Angeles and San Francisco, and our headquarters in Burlingame, California, are located on or near active seismic faults, and an earthquake could occur at any time, which could disrupt our operations at those locations. Similarly, outbreaks of pandemic or contagious diseases, such as avian flu, severe acute respiratory syndrome (SARS), H1N1 (swine) flu and the Ebola virus could significantly reduce demand for passenger traffic and result in travel restrictions. Any interruption in our ability to operate flights or reduction in airline passenger demand because of such events could have a material adverse effect on our business.
Increases in insurance costs or reductions in insurance coverage may materially adversely affect our business.
If any of our aircraft were to be involved in an accident or if our property or operations were to be affected by a significant natural catastrophe or other event, we could be exposed to significant liability or loss. If we are unable to obtain sufficient insurance (including aviation hull and liability insurance and property and business interruption coverage) to cover such liabilities or losses, whether due to insurance market conditions or otherwise, our business could be materially adversely affected.
We currently obtain third-party war risk (terrorism) insurance, which is a separate policy from our commercial aviation hull and liability policy, from private insurance companies. Our current war risk insurance from commercial underwriters excludes NBCR (nuclear, biological, chemical and radiological) events. If we are unable to obtain adequate third-party war risk (terrorism) insurance or if a NBCR attack were to take place, our business could be materially adversely affected.
21
Table of Contents
Security breaches involving a compromise of customer information or personal data could expose us to liability, damage our reputation and materially adversely affect our business.
We are subject to laws relating to privacy of personal data. In the processing of our customer transactions and as part of our ordinary business operations, we and certain of our third-party service providers collect, process, transmit and store a large volume of personally identifiable information, including financial data such as credit card information. The security of the systems and network where we and our service providers store this data is a critical element of our business. Any security breach in which employee or customer data is improperly released or disclosed could result in the loss, disclosure or improper use of this data and subject us to regulatory penalties and litigation, disrupt our operation, damage our reputation and materially adversely affect our business. Additionally, any material failure by us or our service providers to maintain compliance with the Payment Card Industry security requirements or rectify a data security issue may result in fines and restrictions on our ability to accept credit cards as a form of payment.
Our business could be materially adversely affected if we lose the services of our key personnel.
Our success depends to a significant extent upon the efforts and abilities of our officers, senior management team and key operating personnel. Competition for highly qualified personnel is intense, and a substantial turnover in key employees without adequate replacement or the inability to attract new qualified personnel could have a material adverse effect on our business.
Concentrated ownership by our principal stockholders could materially adversely affect our other stockholders.
As of December 31, 2014, the Virgin Group and Cyrus Holdings own approximately 16.0% (which does not include the Virgin Group’s non-voting common stock) and 24.4% of our outstanding common stock, respectively. This concentrated ownership may limit the ability of other stockholders to influence corporate matters; as a result, these stockholders may cause us to take actions that our other stockholders do not view as beneficial. For example, this concentration of ownership could delay or prevent a change in control or otherwise discourage a potential acquirer from attempting to obtain control of us, which in turn could cause the trading price of our common stock to decline or prevent our stockholders from realizing a premium over the market price for their common stock.
The requirements of being a public company may strain our resources, divert management’s attention and affect our ability to attract and retain qualified board members or executive officers.
As a public company, we have incurred and will incur significant legal, accounting and other expenses that we did not incur as a private company, including costs associated with public company reporting requirements. We also have incurred and will incur costs associated with the Sarbanes-Oxley Act of 2002, as amended, the Dodd-Frank Wall Street Reform and Consumer Protection Act, related rules implemented or to be implemented by the Securities and Exchange Commission, or the SEC, and the listing rules of the NASDAQ Global Select Market. The expenses incurred by public companies generally for reporting and corporate governance purposes have been increasing. We expect these rules and regulations to increase our legal and financial compliance costs and to make some activities more time-consuming and costly, although we are currently unable to estimate these costs with any degree of certainty. These laws and regulations could also make it more costly for us to obtain certain types of insurance, including director and officer liability insurance, and we may be forced to accept reduced policy limits and coverage or incur substantially higher costs to obtain the same or similar coverage. These laws and regulations could also make it more difficult for us to attract and retain qualified persons to serve on our board of directors or our board committees or as our executive officers and may divert management’s attention. Furthermore, if we are unable to satisfy our obligations as a public company, our common stock could be delisted, and we could be subject to fines, sanctions and other regulatory action and potentially civil litigation.
22
Table of Contents
We will be required to assess our internal control over financial reporting on an annual basis, and any future adverse findings from such assessment could result in a loss of investor confidence in our financial reports, result in significant expenses to remediate any internal control deficiencies and have a material adverse effect on our business.
Pursuant to Section 404 of the Sarbanes-Oxley Act of 2002, as amended, and beginning with our Annual Report on Form 10-K for the year ending December 31, 2015, our management will be required to report on, and our independent registered public accounting firm to attest to, the effectiveness of our internal control over financial reporting. The rules governing management’s assessment of our internal control over financial reporting are complex and require significant documentation, testing and possible remediation. We are currently in the process of reviewing, documenting and testing our internal control over financial reporting. We may encounter problems or delays in completing the implementation of any changes necessary to make a favorable assessment of our internal control over financial reporting. In connection with the attestation process by our independent registered public accounting firm, we may encounter problems or delays in implementing any requested improvements and receiving a favorable attestation. In addition, if we fail to maintain the adequacy of our internal control over financial reporting, we will not be able to conclude on an ongoing basis that we have effective internal control over financial reporting in accordance with Section 404. If we fail to achieve and maintain an effective internal control environment, we could suffer material misstatements in our financial statements and fail to meet our reporting obligations, which would likely cause investors to lose confidence in our reported financial information. Additionally, ineffective internal control over financial reporting could expose us to increased risk of fraud or misuse of corporate assets and subject us to potential delisting from the NASDAQ Global Select Market, regulatory investigations, civil or criminal sanctions and litigation, any of which would materially adversely affect our business.
The market price of our common stock may be volatile, which could cause the value of an investment in our stock to decline.
We completed our initial public offering in November 2014. Prior to that offering, there was no public market for shares of our common stock, and an active public market for our shares may not be sustained. In addition, the market price of our common stock may fluctuate substantially due to a variety of factors, many of which are beyond our control, including:
| • | announcements concerning our competitors, the airline industry or the economy in general; |
| • | strategic actions by us or our competitors, such as acquisitions or restructurings; |
| • | media reports and publications about the safety of our aircraft or the aircraft type we operate; |
| • | new regulatory pronouncements and changes in regulatory guidelines; |
| • | changes in the price of aircraft fuel; |
| • | announcements concerning the availability of the type of aircraft we use; |
| • | general and industry-specific economic conditions; |
| • | changes in financial estimates or recommendations by securities analysts or failure to meet analysts’ performance expectations; |
| • | sales of our common stock or other actions by investors with significant shareholdings, including sales by our principal stockholders; |
| • | trading strategies related to changes in fuel or oil prices; and |
| • | general market, political and other economic conditions. |
The stock markets in general have experienced substantial volatility that has often been unrelated to the operating performance of particular companies. Broad market fluctuations may materially adversely affect the trading price of our common stock.
23
Table of Contents
In the past, stockholders have sometimes instituted securities class action litigation against companies following periods of volatility in the market price of their securities. Any similar litigation against us could result in substantial costs, divert management’s attention and resources and materially adversely affect our business.
If securities or industry analysts do not publish research or reports about our business or publish negative reports about our business, our stock price and trading volume could decline.
The trading market for our common stock depends in part on the research and reports that securities and industry analysts may publish about us or our business. If one or more of the analysts who cover us downgrade our stock or publish inaccurate or unfavorable research about our business, the trading price of our common stock would likely decline. If one or more of these analysts ceases to cover our company or fails to publish reports on us regularly, demand for our stock could decrease, which may cause the trading price of our common stock and our trading volume to decline.
Our anti-takeover provisions may delay or prevent a change of control, which could materially adversely affect the price of our common stock.
Our amended and restated certificate of incorporation and amended and restated bylaws contain provisions that may make it difficult to remove our board of directors and management and may discourage or delay “change of control” transactions, which could materially adversely affect the price of our common stock. These provisions include, among others:
| • | our board of directors is divided into three staggered classes, with each class serving a three-year term, which prevents stockholders from electing an entirely new board of directors at a single annual meeting; |
| • | actions to be taken by our stockholders may only be effected at an annual or special meeting of our stockholders and not by written consent; |
| • | special meetings of our stockholders can be called only by our board of directors, the Chairman of the Board, our chief executive officer or our president; |
| • | advance notice procedures that stockholders must comply with in order to nominate candidates to our board of directors and propose matters to be brought before an annual meeting of our stockholders may discourage or deter a potential acquirer from conducting a solicitation of proxies to elect the acquirer’s own slate of directors or otherwise attempting to obtain control of our company; and |
| • | our board of directors may, without stockholder approval, issue series of preferred stock, or rights to acquire preferred stock, that could dilute the interest of, or impair the voting power of, holders of our common stock or could also be used as a method of discouraging, delaying or preventing a change of control. |
The value of our common stock may be materially adversely affected by additional issuances of common stock or preferred stock by us or sales by our principal stockholders.
Any future issuances or sales of our common stock by us will be dilutive to our existing common stockholders. Cyrus Holdings and the Virgin Group collectively hold approximately 17,399,966 shares of our voting common stock, or 48.0% of our voting common stock outstanding, and 56.2% of the total outstanding equity interests in our company as of December 31, 2014 (which includes 6,852,738 shares of non-voting common stock held by the Virgin Group), and Cyrus Capital and the Virgin Group are entitled to rights with respect to registration of such shares under the Securities Act. Sales of substantial amounts of our common stock in the public or private market, a perception in the market that such sales could occur, or the issuance or exercise of securities exercisable or convertible into our common stock, including warrants to purchase our common stock, could materially adversely affect the prevailing price of our common stock.
24
Table of Contents
Our corporate charter and bylaws include provisions limiting voting and ownership by non-U.S. citizens and specifying an exclusive forum for stockholder disputes.
To comply with restrictions imposed by federal law on foreign ownership of U.S. airlines, our amended and restated certificate of incorporation and amended and restated bylaws restrict voting of shares of our common stock by non-U.S. citizens. The restrictions imposed by federal law currently require that no more than 24.9% of our stock be voted, directly or indirectly, by persons who are not U.S. citizens, that no more than 49.9% of our outstanding stock be owned (beneficially or of record) by persons who are not U.S. citizens and that our president and at least two-thirds of the members of our board of directors and senior management be U.S. citizens. Our amended and restated bylaws provide that the failure of non-U.S. citizens to register their shares on a separate stock record, which we refer to as the “foreign stock record,” would result in a suspension of their voting rights in the event that the aggregate foreign ownership of the outstanding common stock exceeds the foreign ownership restrictions imposed by federal law. Our amended and restated bylaws also provide that any transfer or issuance of our stock that would cause the amount of our stock owned by persons who are not U.S. citizens to exceed foreign ownership restrictions imposed by federal law will be void and of no effect.
Our amended and restated bylaws further provide that no shares of our common stock will be registered on the foreign stock record if the amount so registered would exceed the foreign ownership restrictions imposed by federal law. If it is determined that the amount registered in the foreign stock record exceeds the foreign ownership restrictions imposed by federal law, shares will be removed from the foreign stock record in reverse chronological order based on the date of registration therein, until the number of shares registered therein does not exceed the foreign ownership restrictions imposed by federal law. We are currently in compliance with these ownership restrictions.
As of January 2, 2015, non-U.S. citizens own, in the aggregate, 7,215,503 shares of voting common stock (representing approximately 19.9% of the total voting rights and approximately 16.7% of the total outstanding equity interests in our company).
Our amended and restated certificate of incorporation provides that, unless we consent in writing to an alternative forum, the Court of Chancery of the State of Delaware will, to the fullest extent permitted by law, be the sole and exclusive forum for (i) any derivative action or proceeding brought on behalf of us; (ii) any action asserting a claim of breach of a fiduciary duty owed by, or otherwise wrongdoing by, any of our directors, officers or other employees to us or our stockholders; (iii) any action asserting a claim against us arising pursuant to any provision of the Delaware General Corporation Law or our amended and restated certificate of incorporation or amended and restated bylaws; (iv) any action to interpret, apply, enforce or determine the validity of our amended and restated certificate of incorporation or the bylaws; or (v) any action asserting a claim against us or any of our directors, officers or employees governed by the internal affairs doctrine. Accordingly, you may be limited in your ability to pursue legal actions.
We do not intend to pay cash dividends for the foreseeable future.
We have never declared or paid cash dividends on our common stock. We currently intend to retain our future earnings, if any, to finance the further development and expansion of our business and do not intend to pay cash dividends in the foreseeable future. Any future determination to pay dividends will be at the discretion of our board of directors and will depend on our financial condition, results of operations, capital requirements, restrictions contained in current or future financing instruments, business prospects and such other factors as our board of directors deems relevant.
We may become involved in litigation that may materially adversely affect us.
From time to time, we may become involved in various legal proceedings relating to matters incidental to the ordinary course of our business, including patent, commercial, product liability, employment, class action, whistleblower and other litigation and claims, and governmental and other regulatory investigations and
25
Table of Contents
proceedings. In particular, in recent years, there has been significant litigation in the United States and abroad involving patents and other intellectual property rights. We have in the past faced, and may face in the future, claims by third parties that we infringe upon their intellectual property rights. Such matters can be time-consuming, divert management’s attention and resources, cause us to incur significant expenses or liability and/or require us to change our business practices. Because of the potential risks, expenses and uncertainties of litigation, we may, from time to time, settle disputes, even where we believe that we have meritorious claims or defenses. Because litigation is inherently unpredictable, we cannot assure you that the results of any of these actions will not have a material adverse effect on our business.
Risks associated with our presence in international emerging markets, including political or economic instability, and failure to adequately comply with existing legal requirements, may materially adversely affect us.
Countries with less developed economies, legal systems, financial markets and business and political environments are vulnerable to economic and political problems, such as significant fluctuations in gross domestic product, interest and currency exchange rates, civil disturbances, government instability, nationalization and expropriation of private assets, trafficking and the imposition of taxes or other charges by governments. The occurrence of any of these events in markets served by us now or in the future and the resulting instability may materially adversely affect our business.
We emphasize legal compliance and have implemented and continue to implement and refresh policies, procedures and certain ongoing training of our teammates with regard to business ethics and many key legal requirements; however, we cannot assure you that our teammates will adhere to our code of business ethics, other policies or other legal requirements. If we fail to enforce our policies and procedures properly or maintain adequate record-keeping and internal accounting practices to record our transactions accurately, we may be subject to sanctions. In the event we believe or have reason to believe our teammates have or may have violated applicable laws or regulations, we may incur investigation costs, potential penalties and other related costs which in turn may materially adversely affect our reputation and business.
Our ability to utilize our net operating loss carryforwards and certain other tax attributes may be limited.
We incurred significant cumulative net taxable losses through 2014. Our unused losses generally carry forward to offset future taxable income, if any, until such unused losses expire. We may be unable to use these losses to offset income before such unused losses expire. In addition, if a corporation undergoes an “ownership change” (generally defined as a greater than 50-percentage-point cumulative change in the equity ownership of certain stockholders over a rolling three-year period) under Section 382 of the Internal Revenue Code of 1986, as amended, the corporation’s ability to use its pre-change net operating loss carryforwards (NOLs) and other pre-change tax attributes to offset future taxable income or taxes may be limited. We have experienced ownership changes in the past and in connection with our IPO and 2014 Recapitalization that could limit our ability to use pre-change NOLs in the future or limit the amount of NOLs that can offset future taxable income on an annual basis. In addition, we may experience ownership changes as a result of future changes in our stock ownership (some of which changes may not be within our control), including due to sales of our common stock by Cyrus Capital or the Virgin Group. This, in turn, could materially reduce or eliminate our ability to use our losses or tax attributes to offset future taxable income or tax and have an adverse effect on our future cash flows.
| ITEM 1B. | UNRESOLVED STAFF COMMENTS |
Not applicable.
26
Table of Contents
| ITEM 2. | PROPERTIES |
We fly only Airbus A320-family aircraft and operate only CFM engines, which provide us significant operational and cost advantages compared to airlines that operate multiple fleet and engine types. Flight crews are entirely interchangeable across all of our aircraft, and maintenance, spare parts inventories and other operational support are highly simplified relative to more complex fleets. Due to this commonality among Airbus single-aisle aircraft, we retain the benefits of a fleet consisting of a single family of aircraft while still having flexibility to match the capacity and range of the aircraft to the demands of many routes.
We have a fleet of 53 Airbus single-aisle aircraft, consisting of ten Airbus A319s and 43 Airbus A320s. The average age of the fleet was 5.8 years at December 31, 2014. Our Airbus A319 aircraft accommodate 119 guests, and our Airbus A320 aircraft accommodate 146-149 guests. All of our aircraft are financed under operating leases.
We plan to grow our fleet with additional Airbus A320-family aircraft, and we currently have an order with Airbus for ten Airbus A320 aircraft to be delivered between July 2015 and June 2016 and 30 Airbus A320 new engine option, or A320neo, aircraft to be delivered between 2020 and 2022. We have an option to cancel our Airbus A320neo positions up to two years in advance of delivery in groups of five aircraft, but we could incur a loss of pre-delivery payments and credits as a cancellation fee. We may elect to supplement these deliveries by additional acquisitions from Airbus or in the open market if demand conditions merit. Twenty-six of our existing operating leases will expire between 2016 and 2022, and we believe there will be an opportunity to extend these leases at a reduced lease rate or to replace them with new or used Airbus A320-family aircraft. Although we expect to grow our fleet as we increase our flights on our existing route network and expand our route network to new markets, we are only committed to grow to 63 aircraft. As a result, our fleet plan provides significant flexibility.
Our Airbus A320 aircraft deliveries in 2015 and 2016 will be equipped with sharklets, a new wingtip device that we believe will create up to 3.0% additional fuel efficiency in our network. In addition to lowering our average fuel cost per flight, the sharklets provide increased range. This will reduce technical stops on our transcontinental flights that occasionally occur during specific weather patterns as well as allow for the possibility of operations to the state of Hawaii. Operating to Hawaii will require additional Federal Aviation Authority, or FAA, certification for extended twin-engine over-water operations, and we are currently evaluating these markets and the additional operational requirements.
Facilities
We lease all of our facilities at each of the airports we serve. Our leases for our terminal passenger service facilities, which include ticket counter and gate space, operations support areas and baggage carousel areas, contain provisions for periodic adjustments of lease rates. We are typically responsible for maintenance, insurance and other facility-related expenses and services under these agreements. We have also entered into use agreements at many of the airports we serve that provide for the non-exclusive use of runways, taxiways and other facilities. Landing fees under these agreements are generally based on the number of landings and weight of the aircraft.
We primarily operate out of recently renovated Terminal Two at SFO under an operating lease extending through June 2021, with occasional use of a gate in the international terminal for incoming flights from Mexico. We have preferential access to eight Terminal Two gates, common use access to one Terminal Two gate and common use access to all 28 international terminal gates. Currently, the FAA has not imposed or proposed to impose take-off and landing restrictions at SFO, and we believe that the facility is capable of handling our planned growth of operations. We cannot assure you that the FAA would not impose take-off and landing restrictions at SFO in the future. Additionally, under our SFO lease, SFO has reserved the right to reevaluate the airlines’ collective utilization of the airport facilities, and to impose minimum usage standards on the airlines in order for each airline to maintain preferential gates. If we are unable to meet future minimum usage standards, we cannot assure you that we will continue to have preferential access to eight Terminal Two gates.
27
Table of Contents
Our second largest operation is at LAX, where we operate out of Terminal Three under an airport lease agreement that provides us with the preferential use of six airport gates and access to additional common-use gates as necessary. Our lease agreement extends through 2019, subject to our completion of certain leasehold improvement projects, including the addition of a new seventh gate with a jet-boarding bridge, the renovation of certain gate areas and ticket counters and the completion of infrastructure improvements such as a new HVAC system. Under our lease agreement, the airport authority reimburses us for these renovations as they are completed. While space is limited at LAX, we believe that our leased gates are capable of handling our expected growth in operations and that the planned facility improvements will enhance our airport guest experience. Under our LAX lease, LAX has reserved the right to reevaluate the airlines’ collective utilization of the airport facilities, and to impose minimum usage standards on the airlines in order for each airline to maintain preferential gates. If we are unable to meet future minimum usage standards, we cannot assure you that we will continue to have preferential use of six airport gates at LAX. In addition to our ticket counters and gate areas, we also lease and operate a premium guest lounge in Terminal Three known as the Virgin America Loft. We provide complimentary access to the Virgin America Loft to our First Class guests and generally charge a one-time fee for other guests.
Our principal executive offices and headquarters are located in a leased facility at 555 Airport Boulevard, Burlingame, California 94010, consisting of approximately 85,674 square feet. This lease expires in 2017.
| ITEM 3. | LEGAL PROCEEDINGS |
We are subject to litigation claims and to administrative and regulatory proceedings and reviews that may be asserted or maintained from time to time. We currently believe that the ultimate outcome of such lawsuits, proceedings and reviews will not, individually or in the aggregate, have a material adverse effect on our financial position, liquidity or results of operations.
| ITEM 4. | MINE SAFETY DISCLOSURES |
None applicable.
PART II
| ITEM 5. | MARKET FOR REGISTRANT’S COMMON EQUITY, RELATED STOCKHOLDER MATTERS AND ISSUER PURCHASES OF EQUITY SECURITIES |
Our common stock has been traded on the NASDAQ Global Select Market under the symbol VA since our initial public offering (“IPO”) on November 14, 2014. The table below shows the high and low sales prices for our common stock. Prior to that date, there was no public market for our common stock.
| Low | High | |||||||
| Fourth quarter of fiscal 2014 (November 14, 2014—December 31, 2014) |
26.50 | 45.43 | ||||||
On February 27, 2015, the closing price of our common stock on the NASDAQ Global Select Market was $35.04 per share.
As of February 27, 2015, there were 66 stockholders of record of our common stock. This number excludes stockholders whose stock is held in nominee or street name by brokers.
We have not paid cash dividends on our common stock and have no current intention of doing so. In addition, certain of our current debt instruments and debt instruments we may enter into in the future may contain covenants that restrict our ability to declare or pay dividends. Any future determination to pay cash dividends will be at the discretion of our Board of Directors, subject to applicable limitations under Delaware law. This decision will be dependent upon our results of operations, financial condition and other factors deemed relevant by our Board of Directors.
28
Table of Contents
Performance Graph
This performance graph shall not be deemed “filed” with the SEC or subject to Section 18 of the Exchange Act, nor shall it be deemed incorporated by reference in any of our filings under the Securities Act of 1933, as amended.
The following graph and accompanying table show the cumulative total return to stockholders of Virgin America’s common stock relative to the cumulative total returns of the NASDAQ Composite Index and the AMEX Airline Index from November 14, 2014 to December 31, 2014. The comparison assumes the investment of $100 in our common stock in each of the foregoing indices and reinvestment of all dividends. The stock performance shown represents historical performance and is not representative of future stock performance.
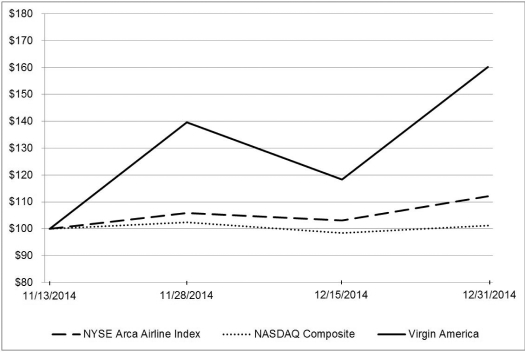
Recent Sales of Unregistered Securities
From January 1, 2014 through December 31, 2014, we sold and issued the following unregistered securities:
2014 Recapitalization
On November 13, 2014, in connection with the consummation of our IPO and pursuant to a recapitalization agreement, we issued an aggregate of (i) 5,742,543 shares of common stock to the former holders of certain related-party warrants in exchange for such certain related-party warrants without receipt of cash consideration; (ii) 22,159,070 shares of common stock to the former holders of certain related-party notes in exchange for such certain related-party notes and (iii) an aggregate of 1,950,937 shares of common stock to the former holders of outstanding shares of our convertible preferred stock and Class A, Class A-1, Class B, Class C and Class G common stock in exchange for such shares of stock.
Virgin Group Note
On November 19, 2014, in connection with the transactions contemplated by the recapitalization described above, we issued a new note with a principal amount of $50.0 million to the Virgin Group in exchange for the cancellation of $50.0 million of outstanding principal of related-party notes held by the Virgin Group.
29
Table of Contents
Stock Issuance Agreement
On November 13, 2014, we issued 39,582 shares of common stock to one of our aircraft lessors in partial settlement of accelerated lease obligations to such lessor triggered by the repayment of the related-party notes as part of the recapitalization described above.
Equity Awards
Prior to filing our registration statement on Form S-8 in 2014, we issued and sold an aggregate of 1,718 shares of common stock upon the exercise of options issued to certain directors, officers, employees, consultants and service providers under the 2005 Stock Incentive Plan at a weighted-average exercise price of $13.89 per share for aggregate cash consideration of approximately $24,000.
Prior to filing our registration statement on Form S-8 in 2014, we granted options to certain directors, officers, employees, consultants and service providers under the 2005 Stock Incentive Plan with respect to an aggregate of 21,856 shares of common stock, at a weighted-average exercise price of $8.45 per share.
Prior to filing our registration statement on Form S-8 in 2014, we granted to certain directors, officers, employees, consultants and other service providers an aggregate of 40,375 RSUs to be settled in shares of common stock under the 2005 Stock Incentive Plan.
Since January 1, 2014, we granted to certain directors, including our chief executive officer, an aggregate of 51,520 RSUs to be settled in shares of common stock outside of the 2005 Stock Incentive Plan and outside of the 2014 Equity Incentive Award Plan.
Unless otherwise stated, the sales of the above securities were deemed to be exempt from registration under the Securities Act in reliance upon Sections 3(a)(9) or 4(a)(2) of the Securities Act or Regulation D or Regulation S promulgated thereunder, or Rule 701 promulgated under Section 3(b) of the Securities Act as transactions by an issuer not involving any public offering or pursuant to benefit plans and contracts relating to compensation as provided under Rule 701. The recipients of the securities in each of these transactions represented their intentions to acquire the securities for investment only and not with a view to or for sale in connection with any distribution thereof, and appropriate legends were placed upon the stock certificates issued in these transactions. All recipients had adequate access, through their relationships with Virgin America, to information about Virgin America. There were no underwriters employed in connection with any of the transactions described above.
Use of Proceeds from Initial Public Offering of Common Stock
On November 13, 2014, the Securities and Exchange Commission declared effective our Registration Statement on Form S-1 (File No. 333-197660), as amended, filed in connection with our initial public offering of our common stock. Pursuant to the Registration Statement, we registered, issued and sold an aggregate of 13,106,377 shares of our common stock at a price to the public of $23.00 per share for aggregate gross offering proceeds of $301.4 million. In addition, pursuant to the Registration Statement, VX Employee Holdings, LLC, a Virgin America employee stock ownership vehicle that we consolidate for financial reporting purposes, sold 231,210 outstanding shares held by it at a price to the public of $23.00 per share for aggregate gross offering proceeds of $5.3 million, which were then immediately disbursed to our teammates. Barclays Capital Inc. and Deutsche Bank Securities Inc. acted as managing underwriters of the offering.
In accordance with a 2014 Recapitalization Agreement among our Company and our pre-IPO investors, we retained $219.9 million of net proceeds from the sale of 13,106,377 shares of common stock by us after deducting underwriting discounts and commissions of $18.8 million and expenses paid by us of $6.2 million and after using $56.5 million of gross proceeds to repay principal and accrued interest on certain related-party notes held by our principal stockholders, Cyrus Capital and the Virgin Group, each of which owns at least 10% of our
30
Table of Contents
outstanding common stock. There has been no material change in the planned use of proceeds from the offering as described in the Registration Statement. In connection with the purchase by PAR Investment Partners, L.P., or “PAR Capital” of 2,264,492 shares of our common stock from the Virgin Group and Cyrus Capital at a price per share equal to 96% of the price to the public in the initial public offering, we paid to the Virgin Group and Cyrus Capital an aggregate amount of $2.1 million, an amount equal to the aggregate discount of the price paid by PAR Capital from the price to the public in the initial public offering, out of the $219.9 million of net proceeds that we retained. In addition, out of the $219.9 million of net proceeds that we retained, we also paid to Barclays Capital Inc. and Deutsche Bank Securities Inc. a private placement commission of $1.2 million in connection with the sale of shares by the Virgin Group and Cyrus Capital to PAR Capital, and we used an additional $2.9 million on other required disbursement items, including the payment of an aggregate of $2.2 million of withholding taxes on the issuance of certain shares to our executive officers and members of management in connection with our initial public offering. We intend to use the remaining net proceeds of $214.9 million for working capital and general corporate purposes. We also distributed the gross proceeds received by VX Employee Holdings, LLC to eligible teammates, which do not include our officers.
31
Table of Contents
| ITEM 6. | SELECTED FINANCIAL DATA |
The following financial information for the five years ended December 31, 2014 has been derived from our consolidated financial statements. This information should be read in conjunction with the consolidated financial statements and related notes thereto included elsewhere in this report.
| Year Ended December 31, | ||||||||||||||||||||
| 2014 | 2013 | 2012 | 2011 | 2010 | ||||||||||||||||
| in thousands, except share and per share data | ||||||||||||||||||||
| Consolidated Statements of Operations Data: |
||||||||||||||||||||
| Operating revenues: |
||||||||||||||||||||
| Passenger |
$ | 1,329,211 | $ | 1,289,268 | $ | 1,215,178 | $ | 950,933 | $ | 655,448 | ||||||||||
| Other |
160,756 | 135,410 | 117,659 | 86,175 | 68,598 | |||||||||||||||
|
|
|
|
|
|
|
|
|
|
|
|||||||||||
| Operating revenues |
1,489,967 | 1,424,678 | 1,332,837 | 1,037,108 | 724,046 | |||||||||||||||
| Operating expenses: |
||||||||||||||||||||
| Aircraft fuel (1) |
499,102 | 507,035 | 537,501 | 417,815 | 246,699 | |||||||||||||||
| Salaries, wages and benefits |
257,367 | 196,477 | 176,216 | 138,276 | 108,901 | |||||||||||||||
| Aircraft rent |
184,357 | 202,071 | 236,800 | 187,876 | 138,422 | |||||||||||||||
| Landing fees and other rents |
133,128 | 122,621 | 110,165 | 87,133 | 69,036 | |||||||||||||||
| Sales and marketing |
113,203 | 106,599 | 107,136 | 81,901 | 59,990 | |||||||||||||||
| Aircraft maintenance |
60,069 | 61,854 | 58,934 | 34,596 | 23,017 | |||||||||||||||
| Depreciation and amortization |
14,486 | 13,963 | 11,260 | 10,155 | 10,530 | |||||||||||||||
| Other operating expenses |
131,840 | 133,177 | 126,558 | 106,752 | 79,888 | |||||||||||||||
|
|
|
|
|
|
|
|
|
|
|
|||||||||||
| Total operating expenses |
1,393,552 | 1,343,797 | 1,364,570 | 1,064,504 | 736,483 | |||||||||||||||
| Operating income (loss) |
96,415 | 80,881 | (31,733 | ) | (27,396 | ) | (12,437 | ) | ||||||||||||
| Other income (expense): |
||||||||||||||||||||
| Interest expense—related party |
(33,708 | ) | (68,439 | ) | (113,708 | ) | (71,925 | ) | (53,896 | ) | ||||||||||
| Interest expense |
(3,811 | ) | (2,854 | ) | (2,402 | ) | (3,652 | ) | (6,247 | ) | ||||||||||
| Capitalized interest (2) |
2,668 | 534 | 2,176 | 2,320 | 3,541 | |||||||||||||||
| Interest income and other |
(276 | ) | 339 | 294 | 264 | 227 | ||||||||||||||
|
|
|
|
|
|
|
|
|
|
|
|||||||||||
| Net income (loss) before income tax |
61,288 | 10,461 | (145,373 | ) | (100,389 | ) | (68,812 | ) | ||||||||||||
| Income tax expense |
1,179 | 317 | 15 | 14 | (137 | ) | ||||||||||||||
|
|
|
|
|
|
|
|
|
|
|
|||||||||||
| Net income (loss) |
$ | 60,109 | $ | 10,144 | $ | (145,388 | ) | $ | (100,403 | ) | $ | (68,675 | ) | |||||||
|
|
|
|
|
|
|
|
|
|
|
|||||||||||
| Net income (loss) per share: |
||||||||||||||||||||
| Basic (3) |
$ | 8.42 | $ | 5.60 | $ | (207.20 | ) | $ | (143.09 | ) | $ | (97.87 | ) | |||||||
|
|
|
|
|
|
|
|
|
|
|
|||||||||||
| Diluted (3) |
$ | 7.13 | $ | 3.68 | $ | (207.20 | ) | $ | (143.09 | ) | $ | (97.87 | ) | |||||||
|
|
|
|
|
|
|
|
|
|
|
|||||||||||
| Shares used in per share calculation: |
||||||||||||||||||||
| Basic (3) |
6,175,786 | 701,671 | 701,671 | 701,671 | 701,671 | |||||||||||||||
| Diluted (3) |
7,470,396 | 1,646,821 | 701,671 | 701,671 | 701,671 | |||||||||||||||
| (1) | Aircraft fuel expense is the sum of (i) the cost of jet fuel and certain other charges such as fuel taxes and certain transportation and distribution costs; (ii) settlement gains and losses arising from fuel price hedging activity; and (iii) unrealized mark-to-market gains and losses associated with open fuel hedge contracts. |
| (2) | Interest attributable to funds used to finance the acquisition of new aircraft, including pre-delivery payments, or PDPs, is capitalized as an additional cost of the related asset approximately two years prior to the intended delivery date. Interest is capitalized at our weighted-average interest rate on long-term debt or, where applicable, the interest rate related to specific borrowings. |
32
Table of Contents
| (3) | See Note 15 to our consolidated financial statements included elsewhere in this Annual Report on Form 10-K for an explanation of the method used to calculate basic and diluted earnings per share. |
The following table presents our historical selected consolidated balance sheet data for the periods presented:
| As of December 31, | ||||||||||||||||||||
| 2014 | 2013 | 2012 | 2011 | 2010 | ||||||||||||||||
| Consolidated Balance Sheet Data: |
||||||||||||||||||||
| Cash and cash equivalents |
$ | 394,643 | $ | 155,659 | $ | 76,018 | $ | 159,815 | $ | 29,904 | ||||||||||
| Total assets |
1,000,176 | 700,996 | 511,022 | 505,644 | 298,250 | |||||||||||||||
| Long-term debt, including current portion |
130,088 | 747,431 | 857,034 | 726,954 | 489,053 | |||||||||||||||
| Convertible preferred stock |
— | 21,406 | 21,406 | 21,406 | 21,406 | |||||||||||||||
| Total stockholders’ equity (deficit) |
459,253 | (384,027 | ) | (630,924 | ) | (484,473 | ) | (393,025 | ) | |||||||||||
OPERATING STATISTICS
| Year Ended December 31, | ||||||||||||||||||||
| 2014 | 2013 | 2012 | 2011 | 2010 | ||||||||||||||||
| Operating Statistics (unaudited): (1) |
||||||||||||||||||||
| Available seat miles—ASMs (millions) |
12,240 | 12,243 | 12,514 | 9,853 | 7,652 | |||||||||||||||
| Departures |
58,432 | 58,215 | 56,362 | 44,696 | 35,737 | |||||||||||||||
| Average stage length (statute miles) |
1,466 | 1,474 | 1,567 | 1,571 | 1,546 | |||||||||||||||
| Aircraft in service—end of period |
53 | 53 | 52 | 44 | 33 | |||||||||||||||
| Fleet utilization |
10.8 | 10.8 | 11.6 | 12.1 | 12.7 | |||||||||||||||
| Passengers (thousands) |
6,507 | 6,329 | 6,219 | 5,030 | 3,909 | |||||||||||||||
| Average fare |
$ | 204.27 | $ | 203.70 | $ | 195.38 | $ | 189.05 | $ | 167.51 | ||||||||||
| Yield per passenger mile (cents) |
13.19 | 13.14 | 12.26 | 11.82 | 10.50 | |||||||||||||||
| Revenue passenger miles—RPMs (millions) |
10,074 | 9,814 | 9,912 | 8,034 | 6,236 | |||||||||||||||
| Load factor |
82.3 | % | 80.2 | % | 79.2 | % | 81.5 | % | 81.5 | % | ||||||||||
| Passenger revenue per available seat mile—PRASM (cents) |
10.86 | 10.53 | 9.71 | 9.64 | 8.56 | |||||||||||||||
| Total revenue per available seat mile—RASM (cents) |
12.17 | 11.64 | 10.65 | 10.53 | 9.46 | |||||||||||||||
| Cost per available seat mile—CASM (cents) |
11.38 | 10.98 | 10.90 | 10.80 | 9.62 | |||||||||||||||
| CASM, excluding fuel (cents) |
7.30 | 6.83 | 6.61 | 6.56 | 6.40 | |||||||||||||||
| CASM, excluding fuel and profit sharing (in cents) |
7.19 | 6.82 | 6.61 | 6.56 | 6.40 | |||||||||||||||
| Fuel cost per gallon |
$ | 3.08 | $ | 3.18 | $ | 3.32 | $ | 3.24 | $ | 2.43 | ||||||||||
| Fuel gallons consumed (thousands) |
161,791 | 159,326 | 161,404 | 128,852 | 101,482 | |||||||||||||||
| Teammates (FTE) |
2,492 | 2,482 | 2,395 | 2,002 | 1,781 | |||||||||||||||
| (1) | See “Glossary of Airline Terms” elsewhere in this Annual Report on Form 10-K for definitions of terms used in this table. |
| ITEM 7. | MANAGEMENT’S DISCUSSION AND ANALYSIS OF FINANCIAL CONDITION AND RESULTS OF OPERATIONS |
Virgin America is a premium-branded, low-cost airline based in California that provides scheduled air travel in the continental United States and Mexico. We operate primarily from our focus cities of Los Angeles and
33
Table of Contents
San Francisco, with a smaller presence at Dallas Love Field, to other major business and leisure destinations in North America. We provide a distinctive offering for our passengers, whom we call guests, that is centered around our brand and our premium travel experience, while at the same time maintaining a low-cost structure through our point-to-point network and high utilization of our efficient, single fleet type. As of December 31, 2014, we provided service to 21 airports in the United States and Mexico with a fleet of 53 narrow-body aircraft.
2014 Highlights
2014 marked our highest level of profitability since our inception in 2005, with net income of $60.1 million. This represents an increase of $50.0 million over net income of $10.1 million in 2013. We continued to strengthen our financial performance in 2014 with improvement in RASM and with the full year impact of reductions in aircraft rent and interest expense resulting from our 2013 Recapitalization (as further described below). Highlights for 2014 include the following:
| • | RASM for 2014 increased by 4.6% as compared to 2013, to 12.17 cents; |
| • | CASM increased 3.6% as compared to 2013, with increases in salaries wages and benefits, landing fees and other rent, and sales and marketing partially offset by decreases in aircraft rent, aircraft fuel, and aircraft maintenance; |
| • | Salaries, wages and benefits include special items totaling $19.6 million related to compensation recorded in connection with our initial public offering, as well as an increase in profit-sharing of $12.3 million; |
| • | Net other non-operating expense declined 50.1%, to $35.3 million, from the 2013 Recapitalization and, to a lesser degree, from the 2014 Recapitalization described below. |
We maintained a stable fleet size of 53 aircraft throughout 2014, and our capacity, as measured by ASMs, was flat as compared to 2013. We did take a number of steps, however, to realign capacity within our network into new growth opportunities that we believe will provide opportunities to increase profitability in the long term. We successfully acquired two gates at Dallas Love Field (“DAL”) and we purchased rights to operate four round trip flights from Washington Reagan National Airport (“DCA”) in 2014, and we purchased rights to operate six round trip flights from New York—LaGuardia Airport (“LGA”) in late 2013. In October 2014 we began operations at DAL by transferring our existing California flights from Dallas/Forth Worth International Airport to DAL, and we initiated service from DAL to DCA and LGA. We provided the capacity for this expansion at DAL by exiting the markets of Los Angeles—San Jose, CA, Los Angeles—Philadelphia, and San Francisco—Philadelphia, and reducing capacity on certain other routes.
We plan to take delivery of five A320 aircraft in the second half of 2015 and five A320 aircraft in the first half of 2016, all of which are on order with Airbus. We expect to add new markets from this expansion, as well as increase frequency in some of our existing markets, from this expansion. We currently expect to purchase these aircraft and finance the majority of the purchase price with long-term debt obtained from commercial banks.
In November 2014 we also completed our initial public offering and the related 2014 Recapitalization, increasing our cash and cash equivalents by $214.9 million and reducing our outstanding debt by $689.8 million. We believe this solid improvement in our balance sheet will enhance our ability to obtain financing for our future growth opportunities.
34
Table of Contents
2014 Recapitalization
In November 2014, immediately prior to the consummation of our IPO, we entered into a recapitalization agreement with the Virgin Group, Cyrus Capital and certain of our other security holders (the “2014 Recapitalization Agreement”). In accordance with the terms of the 2014 Recapitalization Agreement, the majority of our Related Party Notes and warrants to purchase stock were either repaid or exchanged for shares of our common stock. The following table summarizes our long-term debt and components of equity before and after the 2014 Recapitalization and IPO (in thousands, except share numbers):
| Balance Pre- Recapitalization/IPO |
Balance Post- Recapitalization/IPO |
|||||||
| Long-term debt—current portion |
$ | 27,059 | $ | 27,059 | ||||
| Long-term debt—related parties (1) |
728,257 | 38,463 | ||||||
| Long-term debt |
58,012 | 58,012 | ||||||
|
|
|
|
|
|||||
| Total long-term debt |
813,328 | 123,534 | ||||||
| Convertible preferred stock |
21,406 | — | ||||||
| Common stock (2) |
8 | 430 | ||||||
| Additional paid-in capital (2) |
$ | 427,834 | $ | 1,282,108 | ||||
| Shares of common stock outstanding (3) |
841,126 | 42,958,927 | ||||||
| Convertible preferred stock outstanding (3) |
1,109,811 | — | ||||||
| Warrants to purchase shares of common stock (3) |
42,242,601 | — | ||||||
| (1) | As of the date of the 2014 Recapitalization, the Related-Party Notes had contractual value of $684.8 million, which differed from the recorded value primarily due to the application of accounting guidance established for troubled debt restructurings, or “TDR,” in connection with the 2013 Recapitalization. For more information, see “Management’s Discussion and Analysis of Financial Condition and Results of Operations-2013 Recapitalization,” as well as our consolidated financial statements included elsewhere in this report. Related-Party Notes were repaid by $156.5 million in cash, including $56.5 million from the proceeds of our IPO and $100.0 million from the release of cash collateral to us in connection with a $100.0 million letter of credit facility issued on our behalf to certain of our credit card processors by the Virgin Group. For more information, see “Management’s Discussion and Analysis of Financial Condition and Results of Operations-Off-Balance Sheet Arrangements,” as well as our consolidated financial statements included elsewhere in this report. In addition Related-Party Notes were exchanged for a $50.0 million Post-IPO Note held by the Virgin Group. The Post-IPO Note was recorded at the estimated fair value of $38.5 million, calculated using an effective interest rate of 8.5%, determined based on an estimated market rate for unsecured instruments with similar terms. The remainder of the outstanding related party debt was exchanged for 22,159,070 shares of our common stock based on the IPO offering price and the remaining outstanding contractual value of the debt, except for principal and accrued interest under certain FNPA Notes and FNPA II Notes held by Cyrus Capital, which were converted at a premium of 117% of the outstanding contractual value The application of the premium to FNPA had the effect of effectively transferring common ownership between the two principal shareholders, Virgin Group and Cyrus Capital just prior to the IPO. |
| (2) | Common stock and Additional Paid in Capital were increased on a net basis as a result of the following i) sale of shares of voting common stock to the public, ii) the difference between the recorded amount of the Related-Party Notes and cash consideration paid, the fair value adjustment associated with of the Post-IPO Note and a $34.1 million fair value adjustment to record the present value of estimated license fee payments under a revised license agreement in excess of the estimated payments determined under our existing license agreement, refer to our consolidated financial statements for additional information, and iii) proceeds from the IPO of $277.6 million, which exclude share-based compensation triggered by the IPO. |
| (3) | Each issued and outstanding share of our Class A, Class A-1, Class B and Class G common stock and each issued and outstanding share of our convertible preferred stock were converted into one share of common stock in accordance with our certificate of incorporation. Related-Party Warrants to purchase 26,067,475 shares of our common stock were exchanged without receipt of cash consideration for |
35
Table of Contents
| 5,742,543 shares of our common stock and the remaining Related-Party Warrants to purchase an aggregate of 16,175,126 shares of our common stock were canceled in their entirety. The following table summarizes the shares of our common stock outstanding immediately after the 2014 Recapitalization and the IPO: |
| Shares of common stock outstanding immediately prior to the 2014 Recapitalization and the IPO |
841,126 | |||
| Shares of common stock issued in exchange for convertible preferred stock outstanding |
1,109,811 | |||
| Shares of common stock issued in exchange for warrants |
5,742,543 | |||
| Shares of common stock issued in exchange for Related-Party Notes |
22,159,070 | |||
| Shares of common issued and sold in the IPO |
13,106,377 | |||
|
|
|
|||
| Total shares of common stock outstanding after the IPO |
42,958,927 | |||
|
|
|
2013 Recapitalization
In May 2013, we, the Virgin Group and Cyrus Capital agreed to modify and exchange a portion of our then outstanding related-party debt. The Virgin Group and Cyrus Capital reduced $318.4 million of our related-party debt and reduced the interest rates ranging from 15.0% to 20.0% on certain of our remaining related-party debt to 5.0% per year in exchange for the issuance of $75.0 million of new debt and certain Related-Party Warrants. We recognized a $150.5 million restructuring gain as a capital contribution with a direct increase in additional paid-in-capital due to the debt being issued to related parties. In addition, we also recorded Related-Party Warrants at fair value of $83.4 million on the date of issuance as a reduction to the carrying amount of the related-party debt and a corresponding increase to stockholders’ equity.
We also amended substantially all of our lease agreements with our existing aircraft lessors to reduce monthly base rent and/or maintenance reserve payments through monthly cash rent rebates. We estimate these amendments resulted in expense savings on base aircraft rent of approximately $47.2 million in 2014 as compared to what would have been recorded as aircraft rent expense under the original lease terms. Under some of our leases, we also extended the lease terms by three to five years.
For more information, see Notes 3, 8 and 10 to the Consolidated Financial Statements.
2014 Compared to 2013
In 2014, we had net income of $60.1 million compared to net income of $10.1 million in 2013. Our operating income of $96.4 million for 2014 increased by $15.5 million, or 19.2%, compared to 2013. Our operating margin increased by 0.8 points to 6.5% in 2014 as compared to 5.7% in 2013.
Our operating capacity, as measured by ASMs, remained consistent for 2014 and 2013. Our number of passengers increased by 2.8% in 2014 as compared to 2013, and our yield remained relatively consistent.
Our CASM increased by 3.6% to 11.38 cents for 2014 as compared to 10.98 cents for 2013. This was primarily a result of increased salaries, wages and benefits, a significant portion of which was due to one-time share-based compensation expense recognized upon our IPO, profit sharing expense related to our increase in pre-tax income and higher landing fees, partially offset by lower aircraft rent and fuel costs.
In addition, interest expense for 2014 decreased by $33.8 million from the prior year period, primarily as a result of our 2013 Recapitalization and 2014 Recapitalization.
36
Table of Contents
Operating Revenues
| Year Ended December 31, | Change | |||||||||||||||
| 2014 | 2013 | Amount | % | |||||||||||||
| Operating revenues (in thousands): |
||||||||||||||||
| Passenger |
$ | 1,329,211 | $ | 1,289,268 | $ | 39,943 | 3.1 | |||||||||
| Other |
160,756 | 135,410 | 25,346 | 18.7 | ||||||||||||
|
|
|
|
|
|
|
|||||||||||
| Total operating revenues |
$ | 1,489,967 | $ | 1,424,678 | $ | 65,289 | 4.6 | |||||||||
|
|
|
|
|
|
|
|||||||||||
| Operating statistics: |
||||||||||||||||
| Available seat miles (millions) |
12,240 | 12,243 | (3 | ) | — | |||||||||||
| Revenue passenger miles (millions) |
10,074 | 9,814 | 260 | 2.6 | ||||||||||||
| Average stage length (statute miles) |
1,466 | 1,474 | (8 | ) | (0.5 | ) | ||||||||||
| Load factor |
82.3 | % | 80.2 | % | 2.1 | pts | ||||||||||
| Total revenue per available seat mile—RASM (cents) |
12.17 | 11.64 | 0.53 | 4.6 | ||||||||||||
| Yield (cents) |
13.19 | 13.14 | 0.05 | 0.4 | ||||||||||||
| Average fare |
$ | 204.27 | $ | 203.70 | $ | 0.57 | 0.3 | |||||||||
| Passengers (thousands) |
6,507 | 6,329 | 178 | 2.8 | ||||||||||||
Passenger revenue for 2014 increased 3.1% from 2013 on the same level of capacity, measured by ASMs. Full year 2014 PRASM increased year-over-year due to a 0.4% increase in passenger yield and a 2.1 point increase in load factor. Total RASM for 2014 increased 4.6% from 2013, primarily from the increase in PRASM and an 18.7% increase in other revenue.
The 18.7% increase in other revenue for 2014 from 2013 was primarily due to increased advertising and brand revenues resulting from our new co-branded consumer credit card program that we launched in January 2014. In addition, seat selection fee revenue and change fee revenue increased, primarily due to a 2.8% increase in passengers as well as higher fees for ancillary products.
37
Table of Contents
Operating Expenses
| Year Ended December 31, | Change | Cost per ASM | Change | |||||||||||||||||||||||||
| 2014 | 2013 | Amount | % | 2014 | 2013 | % | ||||||||||||||||||||||
| (in cents) | ||||||||||||||||||||||||||||
| Operating expenses (in thousands): |
||||||||||||||||||||||||||||
| Aircraft fuel |
$ | 499,102 | $ | 507,035 | $ | (7,933 | ) | (1.6 | ) | 4.08 | 4.14 | (1.4 | ) | |||||||||||||||
| Salaries, wages and benefits |
257,367 | 196,477 | 60,890 | 31.0 | 2.10 | 1.61 | 30.4 | |||||||||||||||||||||
| Aircraft rent |
184,357 | 202,071 | (17,714 | ) | (8.8 | ) | 1.50 | 1.65 | (9.1 | ) | ||||||||||||||||||
| Landing fees and other rents |
133,128 | 122,621 | 10,507 | 8.6 | 1.09 | 1.00 | 9.0 | |||||||||||||||||||||
| Sales and marketing |
113,203 | 106,599 | 6,604 | 6.2 | 0.92 | 0.87 | 5.7 | |||||||||||||||||||||
| Aircraft maintenance |
60,069 | 61,854 | (1,785 | ) | (2.9 | ) | 0.49 | 0.51 | (3.9 | ) | ||||||||||||||||||
| Depreciation and amortization |
14,486 | 13,963 | 523 | 3.7 | 0.11 | 0.11 | — | |||||||||||||||||||||
| Other operating expenses |
131,840 | 133,177 | (1,337 | ) | (1.0 | ) | 1.09 | 1.09 | — | |||||||||||||||||||
|
|
|
|
|
|
|
|
|
|
|
|||||||||||||||||||
| Total operating expenses |
$ | 1,393,552 | $ | 1,343,797 | $ | 49,755 | 3.7 | 11.38 | 10.98 | 3.6 | ||||||||||||||||||
|
|
|
|
|
|
|
|
|
|
|
|||||||||||||||||||
| Operating statistics: |
||||||||||||||||||||||||||||
| Available seat miles (millions) |
12,240 | 12,243 | (3 | ) | — | |||||||||||||||||||||||
| Average stage length (statute miles) |
1,466 | 1,474 | (8 | ) | (0.5 | ) | ||||||||||||||||||||||
| Departures |
58,432 | 58,215 | 217 | 0.4 | ||||||||||||||||||||||||
| CASM (excluding fuel) |
7.30 | 6.83 | 0.47 | 6.9 | ||||||||||||||||||||||||
| CASM (excluding fuel and profit sharing) |
7.19 | 6.82 | 0.37 | 5.4 | ||||||||||||||||||||||||
| Fuel cost per gallon |
$ | 3.08 | $ | 3.18 | (0.10 | ) | (3.1 | ) | ||||||||||||||||||||
| Fuel gallons consumed (thousands) |
161,791 | 159,326 | 2,465 | 1.5 | ||||||||||||||||||||||||
| Teammates (FTE) |
2,492 | 2,482 | 10 | 0.4 | ||||||||||||||||||||||||
Aircraft fuel
Aircraft fuel expense for 2014, which includes the effect of our fuel hedges, decreased by $7.9 million, or 1.6%, from 2013. The decrease was primarily due to a decrease of $0.10, or 3.1%, in the average fuel cost per gallon offset in part by a 1.5% increase in fuel consumption. The increased fuel consumption was primarily the result of a slight increase in departures.
We maintain an active FFP and hedging program to reduce the impact of sudden, sharp increases in fuel prices. We enter into a variety of hedging instruments, such as forward swaps, options and collar contracts on jet fuel and highly correlated commodities such as heating oil and crude oil. We also use FFPs, which allow us to lock in the price of jet fuel for specified quantities and at specified locations in future periods. At December 31, 2014, we had entered into derivative hedging instruments and FFPs for approximately 27% of our then expected twelve-month fuel requirements, with all of our then existing hedge contracts expected to settle by the end of the third quarter of 2015. Due to the impact of declining fuel prices, we recognized $10.6 million in fuel hedge losses in the year ended December 31, 2014, of which $3.4 million were unrealized losses for fuel hedges that will mature in 2015.
Salaries, wages and benefits
Salaries, wages and benefits expense for 2014 increased by $60.9 million, or 31.0%, from 2013. Salaries and wages for flight crews increased significantly as a result of the competitive marketplace for talent and increasing seniority of our pilots and inflight teammates. In addition, salaries, wages and benefits expense for the year ended December 31, 2014 include an increase of $20.9 million in profit sharing and bonus expense, including a $5.3 million expense recognized for the value of shares distributed by our employee stock ownership
38
Table of Contents
vehicle to teammates, and $14.0 million in share-based compensation expense primarily associated with our IPO. Share-based compensation expense reflects the effect of pre-IPO performance-based stock compensation which achieved the IPO performance trigger in November 2014 and therefore were recognized in the fourth quarter of 2014. Under our annual profit sharing program, we accrued 15% of cumulative year-to-date income before income taxes and profit sharing (excluding certain special items) for the benefit of our eligible teammates in 2014 and 2013. In early 2015, we announced a change to our annual profit sharing program under which profit sharing will still be accrued based on 15% pre-tax income, however income will be 1) net of profit sharing expense and 2) accrued on income above a threshold which is based on $1.5 million times the weighted average number of aircraft in our fleet. For 2015, we estimate the threshold to be approximately $81.0 million.
We expect salaries, wages and benefit expense to grow at a faster rate than our capacity as market and tenure-related adjustments continue. In 2015, a new employee stock purchase program called the Teammate Stock Purchase Plan (TSPP) will begin under which employees may purchase our stock at a 10% discount of the market value at the end of each offering period. Also, subsequent to year end, a new discretionary 401(k) company contribution called “401(k) Plus” will go into effect under which we will make additional 401(k) contributions of up to 4.5% of salary for pilots and 1.5% for all other teammates.
Additionally, in 2015 we will begin incurring costs associated with hiring and training new teammates in connection with our new aircraft deliveries.
Our overall benefit plan costs for 2014 increased from the prior year period due to an increase in the amount of the 401(k) match benefits paid to our teammates and an increase in healthcare costs.
Aircraft rent
Aircraft rent expense for 2014 decreased by $17.7 million, or 8.8% from 2013, primarily due to the full year effect of aircraft lease amendments that we executed in connection with the 2013 Recapitalization in May 2013.
Landing fees and other rents
Landing fees and other rents expense for 2014 increased by $10.5 million, or 8.6%, from 2013, primarily as a result of rate increases for facilities at our destination airports.
For 2013 and for a part of 2014, we received the benefit of landing fee and rent incentives for our added destinations of Austin and San Jose. The expiry of these incentives in the second quarter of 2014 and the additional rate increases at a majority of the airports at which we operate led to an increase in our landing fees and other rents both in absolute dollars and as a percentage of revenue. Additionally, we will begin incurring costs in 2015 associated with opening new destinations.
Sales and marketing
Sales and marketing expense for 2014 increased $6.6 million, or 6.2%, from 2013, primarily due to $5.0 million in one-time credits recognized in 2013. These one-time credits consisted of a contract termination payment from a former software system provider and a contractual marketing incentive.
Aircraft maintenance
Aircraft maintenance expense remained relatively consistent for 2014 and 2013.
Depreciation and amortization
Depreciation and amortization expense remained relatively consistent for 2014 and 2013.
39
Table of Contents
Other operating expenses
Other operating expense remained relatively consistent for 2014 and 2013.
Other Income (Expense)
Other income (expense) for 2014 decreased by $35.3 million, or 50.1%, from 2013, primarily due to the $34.7 million reduction in related-party interest expense as a result of the 2013 Recapitalization. As part of the 2013 Recapitalization, we reduced our related-party debt of $687.5 million with stated interest rates ranging from 4.7% to 20.0% to related-party debt with a recorded value of $529.8 million with effective interest rates of 0.0% to 10.0% per year. Furthermore, in November 2014 in connection the 2014 Recapitalization, we reduced our remaining related-party debt and accrued interest to a recorded value of $38.5 million with an effective interest rate of 8.5%. See Notes 2 and 3 to our consolidated financial statements included elsewhere in this Annual Report on Form 10-K for further details and a discussion of the accounting for these transactions.
Income Taxes
The income tax provision associated with our income in 2014 was largely offset by the release of a valuation allowance against net deferred tax assets. For the year ended December 31, 2014, we recorded a deferred tax liability and tax expense of $1.2 million resulting from the difference between the book and tax basis of indefinite-lived intangible assets that are not available to cover net deferred tax assets subject to a valuation allowance.
2013 Compared to 2012
In 2013, we had net income of $10.1 million compared to a net loss of $145.4 million in 2012. In 2013, we had operating income of $80.9 million, compared to an operating loss of $31.7 million in 2012.
Our 2013 results reflected our strategic decisions to defer and cancel aircraft deliveries, thereby reducing capacity growth in our network, to reduce aircraft utilization across our operations, to eliminate low margin flights and to focus on improving revenue management techniques to increase RASM. We also implemented new ancillary revenue strategies that, when combined with our network and revenue management strategy changes, improved our unit revenue performance. Our RASM increased to 11.64 cents in 2013 from 10.65 cents in 2012, and our average fare increased by 4.3% to $203.70. We also added three new destinations during 2013 by shifting capacity from existing markets.
We continued our disciplined approach to cost control. Our CASM increased by 0.7% to 10.98 cents, primarily due to a 2.2% reduction in ASM and a 5.9% decrease in average stage length in 2013 as compared to 2012. Partially offsetting this increase was a 4.2% reduction in fuel cost per gallon. Our 2013 results also reflect the impact of our debt and lease restructurings described under the 2013 Recapitalization. Through our aircraft lease renegotiations, we reduced aircraft rent expense by $34.7 million in 2013 or 12.8% per ASM. We also reduced interest expense by $44.8 million as a result of the 2013 Recapitalization.
40
Table of Contents
Operating Revenue
| Year Ended December 31, | Change | |||||||||||||||
| 2013 | 2012 | Amount | % | |||||||||||||
| Operating revenues (in thousands): |
||||||||||||||||
| Passenger |
$ | 1,289,268 | $ | 1,215,178 | $ | 74,090 | 6.1 | |||||||||
| Other |
135,410 | 117,659 | 17,751 | 15.1 | ||||||||||||
|
|
|
|
|
|
|
|||||||||||
| Total operating revenues |
$ | 1,424,678 | $ | 1,332,837 | $ | 91,841 | 6.9 | |||||||||
|
|
|
|
|
|
|
|||||||||||
| Operating statistics: |
||||||||||||||||
| Available seat miles (millions) |
12,243 | 12,514 | (271 | ) | (2.2 | ) | ||||||||||
| Revenue passenger miles (millions) |
9,814 | 9,912 | (98 | ) | (1.0 | ) | ||||||||||
| Average stage length (statute miles) |
1,474 | 1,567 | (93 | ) | (5.9 | ) | ||||||||||
| Load factor |
80.2 | % | 79.2 | % | 1.0 | pts | ||||||||||
| Total revenue per available seat mile—RASM (cents) |
11.64 | 10.65 | 0.99 | 9.3 | ||||||||||||
| Yield (in cents) |
13.14 | 12.26 | 0.88 | 7.2 | ||||||||||||
| Average fare |
$ | 203.70 | $ | 195.38 | $ | 8.32 | 4.3 | |||||||||
| Passengers (thousands) |
6,329 | 6,219 | 110 | 1.8 | ||||||||||||
Passenger revenue increased by $74.1 million, or 6.1%, in 2013 as compared to 2012. Passenger revenue accounted for 90.5% of our total operating revenues for the year ended December 31, 2013. Load factor increased one percentage point year-over-year, and average fare increased 4.3% as we focused on maximizing the value of our network by shifting capacity away from seasonally weaker routes, such as transcontinental flights during the winter. During 2013, we added three new destinations: Newark (from LAX and SFO), San Jose (from LAX) and Austin (from SFO). Our network changes resulted in a 5.9% reduction in our average stage length in 2013 as compared to 2012.
Other revenue increased by $17.8 million, or 15.1%, in 2013 as compared to 2012, primarily due to a full year of fees from our Express program that we launched in September 2012, which allows guests to select a reserved seat assignment near the front of the cabin, purchase priority boarding and receive other premium privileges.
41
Table of Contents
Operating Expenses
| Year Ended December 31, | Change |
|
Change | |||||||||||||||||||||||||
| 2013 | 2012 | Amount | % | 2013 | 2012 | % | ||||||||||||||||||||||
| (in cents) | ||||||||||||||||||||||||||||
| Operating expenses (in thousands): |
||||||||||||||||||||||||||||
| Aircraft fuel |
$ | 507,035 | $ | 537,501 | $ | (30,466 | ) | (5.7 | ) | 4.14 | 4.30 | (3.6 | ) | |||||||||||||||
| Aircraft rent |
202,071 | 236,800 | (34,729 | ) | (14.7 | ) | 1.65 | 1.89 | (12.8 | ) | ||||||||||||||||||
| Salaries, wages and benefits |
196,477 | 176,216 | 20,261 | 11.5 | 1.61 | 1.40 | 14.0 | |||||||||||||||||||||
| Landing fees and other rents |
122,621 | 110,165 | 12,456 | 11.3 | 1.00 | 0.88 | 13.8 | |||||||||||||||||||||
| Sales and marketing |
106,599 | 107,136 | (537 | ) | (0.5 | ) | 0.87 | 0.86 | 1.7 | |||||||||||||||||||
| Aircraft maintenance |
61,854 | 58,934 | 2,920 | 5.0 | 0.51 | 0.47 | 7.3 | |||||||||||||||||||||
| Depreciation and amortization |
13,963 | 11,260 | 2,703 | 24.0 | 0.11 | 0.09 | 26.8 | |||||||||||||||||||||
| Other operating expenses |
133,177 | 126,558 | 6,619 | 5.2 | 1.09 | 1.01 | 7.6 | |||||||||||||||||||||
|
|
|
|
|
|
|
|
|
|
|
|||||||||||||||||||
| Total operating expenses |
$ | 1,343,797 | $ | 1,364,570 | $ | (20,773 | ) | (1.5 | ) | 10.98 | 10.90 | 0.7 | ||||||||||||||||
|
|
|
|
|
|
|
|
|
|
|
|||||||||||||||||||
| Operating statistics: |
||||||||||||||||||||||||||||
| Available seat miles (millions) |
12,243 | 12,514 | (271 | ) | (2.2 | ) | ||||||||||||||||||||||
| Average stage length (statute miles) |
1,474 | 1,567 | (93 | ) | (5.9 | ) | ||||||||||||||||||||||
| Departures |
58,215 | 56,362 | 1,853 | 3.3 | ||||||||||||||||||||||||
| CASM (excluding fuel) |
6.83 | 6.61 | 0.22 | 3.3 | ||||||||||||||||||||||||
| CASM (excluding fuel and profit sharing) |
6.82 | 6.61 | 0.21 | 3.2 | ||||||||||||||||||||||||
| Fuel cost per gallon |
$ | 3.18 | $ | 3.32 | (0.14 | ) | (4.2 | ) | ||||||||||||||||||||
| Fuel gallons consumed (thousands) |
159,326 | 161,404 | (2,078 | ) | (1.3 | ) | ||||||||||||||||||||||
| Teammates (FTE) |
2,482 | 2,395 | 87 | 3.6 | ||||||||||||||||||||||||
Aircraft fuel
Aircraft fuel expense decreased by $30.5 million, or 5.7%, in 2013 as compared to 2012. The decrease was primarily due to the decline in the fuel cost per gallon and in our fuel consumption. Fuel cost declined to $3.18 per gallon in 2013 from $3.33 per gallon in 2012 , or 4.2%, and our fuel gallons consumed also declined by 1.3%, primarily due to our reduction in ASMs.
Aircraft rent
Aircraft rent expense decreased by $34.7 million, or 14.7%, in 2013 as compared to 2012 as a result of our aircraft lease amendments entered into in connection with the 2013 Recapitalization. This decrease was partly offset by a full year of rent in 2013 for eight aircraft added to the fleet during 2012, as well as the delivery of one additional aircraft in March 2013.
Salaries, wages and benefits
Salaries, wages and benefits expense increased by $20.3 million, or 11.5%, in 2013 as compared to 2012, primarily due to market and tenure related adjustments and profit sharing for our teammates. In addition, the average number of full-time equivalent teammates increased by 3.6% during 2013, and the average tenure of our teammate population was 3.5 years as of December 31, 2013 as compared to 3.0 years as of December 31, 2012. Salaries, wages and benefits expense in 2013 includes profit sharing expense under our profit sharing program, whereby 15.0% of our pre-profit sharing pre-tax income is paid to our teammates. No such expense was recorded in 2012 because we had a net loss.
42
Table of Contents
Landing fees and other rents
Landing fees and other rents expense increased by $12.5 million, or 11.3%, in 2013 as compared to 2012, primarily due to the addition of our Newark service and the related airport rent, landing fees and slot rental payments. In addition, we also experienced rent increases at some of our major existing airports while landing fee incentives received in 2012 for Philadelphia International Airport (PHL) expired in the second quarter of 2013.
Sales and marketing
Sales and marketing expense remained relatively consistent in 2013 as compared to 2012. During 2013, we received $5.0 million in one-time credits, which consisted of a contract termination payment from a former software system provider and a contractual marketing incentive. These credits were offset by additional expenses commensurate with our revenue growth during 2013.
Aircraft maintenance
Aircraft maintenance costs increased by $2.9 million, or 5.0%, in 2013 as compared to 2012, primarily due to an increase in the number of major airframe checks and engine repairs in 2013 as compared to 2012, as well as an increase in rates, which are correlated to aircraft age, under certain of our maintenance-cost-per-hour agreements.
Depreciation and amortization
Depreciation and amortization expense increased by $2.7 million, or 24.0%, in 2013 as compared to 2012, primarily due to depreciation of our new software licenses and aircraft leasehold improvements.
Other operating expenses
Other operating expenses increased by $6.6 million, or 5.2%, in 2013 as compared to 2012, primarily due to our lower utilization and an increase in our data communication costs associated with new software.
Other Income (Expense)
Other income (expense) decreased by $43.2 million, or 38.0%, in 2013 as compared to 2012, primarily due to the $44.8 million reduction in interest expense under our related-party long-term debt as a result of the 2013 Recapitalization, in which we reduced our related-party debt of $687.5 million with stated interest rates ranging from 4.7% to 20% per year to related-party debt with a recorded value of $529.8 million and effective interest rates of 0% to 10% a year.
Income Taxes
The income tax provision associated with our income in 2013 was largely offset by the release of a valuation allowance against the utilization of prior-year NOLs.
Liquidity and Capital Resources
As of December 31, 2014, our principal sources of liquidity were cash and cash equivalents of $394.6 million. We also had restricted cash of $18.8 million as of December 31, 2014. Restricted cash primarily represents cash collateral securing our letters of credit for airport facility leases. In addition, we had $14.4 million of cash collateral posted with various third parties related to losses under our fuel hedging program. This cash collateral will be released during the first half of 2015 as we settle the underlying hedges with such counterparties.
43
Table of Contents
Our primary uses of liquidity are to fund our operations, which include working capital, sales and marketing activities, general and administrative matters and capital expenditures. We retained $214.9 million of the remaining net proceeds from the sale of 13,106,377 shares of common stock by us in our IPO, after repayment of expenses and related-party debt, to be used for general corporate purposes. In connection with the 2014 Recapitalization, the Virgin Group issued the Letter of Credit Facility, available until November 2019, on our behalf to our credit card processors in exchange for their release of $100.0 million of credit card holdback collateral. Refer to “Management’s Discussion and Analysis of Financial Condition and Results of Operations Off-Balance Sheet Arrangements” for further information.
As of December 31, 2014, we had $33.8 million of short-term debt and $96.3 million of long-term debt, of which $38.8 million was related-party debt. Included in our long-term debt balance is a five-year term loan credit facility we entered into in April 2014 for $40.0 million to finance airport slot purchases. This loan was funded in two tranches in April and May 2014. Principal is repayable in full at the end of five years. We accrue interest on this loan at a variable rate based on LIBOR and pay quarterly in arrears.
Currently our single largest capital expense is the acquisition cost of our aircraft. We operate all of our existing 53 aircraft under operating leases, which required a smaller up-front investment than if we had financed these aircraft with debt. Pre-delivery payments, or PDPs, relating to future deliveries under our agreement with Airbus, are required at various times prior to each aircraft’s delivery date. As of December 31, 2014, we paid $94.3 million of PDPs to Airbus, $51.2 million of which were financed by a third party payable upon delivery of aircraft. We expect that committed expenditures for ten future aircraft deliveries between July 2015 and June 2016, separately sourced spare engines and related aircraft equipment, including estimated amounts for contractual price escalations and PDPs, will total approximately $211.9 million in 2015 and $184.3 million in 2016. We believe that commercially available financing and our cash resources will be sufficient to satisfy these purchase commitments. For six out of the next ten aircraft deliveries, we have obtained a manufacturer back-stop debt-financing commitment, which we presently do not expect to utilize. We do not have financing commitments in place for the remaining 30 Airbus aircraft orders scheduled for delivery between 2020 and 2022. We have the right to cancel the last 30 aircraft, and as a result these are not considered firm commitments. If we ultimately exercise our cancellation rights for up to 30 aircraft, we would incur a loss of deposits and credits of up to $26.0 million as a cancellation fee.
In addition to funding the acquisition of our future fleet, we are required to make maintenance reserve payments to our lessors for our current fleet. Qualifying payments that are expected to be recovered from lessors are recorded as aircraft maintenance deposits in our consolidated balance sheets. Maintenance reserves are paid to aircraft lessors and are held as collateral in advance of our performance of major maintenance activities. In 2014 and 2013, we made $57.5 million and $54.8 million, respectively, of maintenance deposit payments to our lessors, net of certain rebates. We received $4.9 million in 2014 and $5.3 million in 2013 of maintenance reimbursements, due to qualifying maintenance events taking place during the respective periods. In addition, as a result of the lease amendments in 2013, we are entitled to lease rebates either to base rent or maintenance deposits on a monthly basis. We received $9.2 million in maintenance deposit rebates from our lessors in 2014, which are treated as reductions to maintenance deposits on our consolidated balance sheets when earned.
In connection with various lease amendments entered into with our aircraft lessors in 2013, we are entitled to approximately $1.6 million of lease rebates on a monthly basis or $19.8 million annually. Lease rebates will decline over time as aircraft leases expire. Receipt of any future lease rebates is contingent on us maintaining $75.0 million of unrestricted cash and cash equivalents as of the last day of each month. Under the amended lease agreements, we are obligated to refund 25.0% of substantially all the monthly base rent lease rebates received through December 31, 2016 in the first quarter of 2017 or on a pro-rata basis with any debt repayment occurring prior to the first quarter of 2017. As a result of the repayment of related-party debt in connection with the 2014 Recapitalization, we accelerated $2.5 million of lease obligation repayments. As of December 31, 2014, the aggregate amount of lease rebates earned was $39.6 million, net of $7.1 million recorded as a payable to the lessors.
44
Table of Contents
We expect to meet our obligations as they become due through available cash, internally generated funds from our operating cash flows, supplemented by financing activities as necessary and as they may become available to us, although we cannot assure that adequate financing will be available on acceptable terms, or at all. We cannot predict what the effect on our business and financial position might be from the extremely competitive environment in which we operate or from events beyond our control, such as volatile fuel prices, economic conditions, weather-related disruptions, the impact of airline bankruptcies, restructurings or consolidations, U.S. military actions or acts of terrorism. We believe the working capital available to us will be sufficient to meet our cash requirements for at least the next 12 months.
Cash Flows
The following table presents information regarding our cash flows in 2014, 2013 and 2012:
| Year Ended December 31 | ||||||||||||
| 2014 | 2013 | 2012 | ||||||||||
| Net cash provided (used in) by operating activities |
$ | 135,605 | $ | 50,603 | $ | (50,645 | ) | |||||
| Net cash used in investing activities |
(55,160 | ) | (41,996 | ) | (27,184 | ) | ||||||
| Net cash provided by (used in) financing activities |
158,539 | 71,034 | (5,968 | ) | ||||||||
| Net increase in cash and cash equivalents |
238,984 | 79,641 | (83,797 | ) | ||||||||
| Cash and cash equivalents, end of period |
394,643 | 155,659 | 76,018 | |||||||||
Net Cash Flow Provided By (Used In) Operating Activities
During 2014, net cash flow provided by operating activities was $135.6 million. We had net income of $60.1 million adjusted for the following non-cash items: paid in-kind interest expense of $20.7 million, depreciation and amortization of $14.5 million and share-based compensation expense of $14.0 million. Our air traffic liability and credit card holdbacks contributed $92.0 million of operating cash flow, primarily due to a $100.0 million release of holdbacks in connection with the 2014 Recapitalization in exchange for a letter of credit issued by the Virgin Group on our behalf. We increased our maintenance deposits by $29.8 million, primarily due to our reserve payments for future maintenance events. Other non-current assets increased by $31.6 million primarily due to expensing rent on a straight-line basis at a rate that is lower than our cash payments during the period.
During 2013, net cash flow provided by operating activities was $50.6 million. We had net income of $10.1 million adjusted for the following non-cash items: paid in-kind interest expense of $54.3 million and depreciation and amortization of $14.0 million. We increased our maintenance deposits by $38.1 million and reduced other non-current liabilities by $8.5 million, primarily due to our aircraft lease amendments entered into in connection with the 2013 Recapitalization. Air traffic liability, net of credit card holdbacks, contributed $17.8 million of cash flow, primarily due to a $10.0 million advance payment received from our new co-branded credit card partner, increased credit card points deferrals and the timing of receipt of credit card settlements. Other current liabilities increased by $10.6 million, primarily due to the growth of our business, including the addition of three new airports, timing of payments and salary and wage increases.
During 2012, net cash flow used in operating activities was $50.6 million. We had a net loss of $145.4 million adjusted for the following non-cash items: paid-in-kind interest expense of $99.1 million and depreciation and amortization of $11.3 million. During 2012, we added eight additional aircraft to our fleet, which, combined with required payments under our existing leases, resulted in increased maintenance deposits of $33.6 million. Our air traffic liability and credit card holdbacks contributed $15.6 million to our cash flow, primarily as a result of a reduction in the holdback percentage by one of our credit card processors, our 18.2% increase in fleet size, a 3.3% increase in average fare and, to a lesser extent, the timing of our credit card settlements.
45
Table of Contents
Net Cash Flows Used In Investing Activities
During 2014, net cash flow used in investing activities was $55.2 million. We invested $41.8 million in domestic airport operating rights, flight equipment and software and made $13.4 million in pre-delivery payments for our aircraft scheduled to be delivered in 2015 and 2016.
During 2013, net cash flow used in investing activities was $42.0 million. We invested $27.0 million in domestic airport operating rights, and $15.0 million in equipment, software, and aircraft improvements to improve our fleet efficiency and to comply with FAA requirements.
During 2012, net cash flow used in investing activities was $27.2 million. We made pre-delivery payments of $19.2 million in cash for future aircraft deliveries. We also invested $8.0 million for the purchase of equipment for our new leased aircraft placed in service during the year.
Net Cash Flows Provided By (Used In) Financing Activities
During 2014, net cash flow provided by financing activities was $158.5 million primarily as a result of $277.6 million of net proceeds from our IPO, partially offset by $156.5 million of long-term debt repayments. We also borrowed $40.0 million under our April 2014 credit facility related to our purchase of domestic airport operating rights.
During 2013, net cash flow provided by financing activities was $71.0 million, primarily as a result of our related-party debt issuance of $75.0 million in connection with the 2013 Recapitalization.
During 2012, net cash flow used in financing activities was $6.0 million, which represents principal repayments on our third-party debt and capital lease obligations.
Commitments and Contractual Obligations
The following table presents aggregate information about our contractual payment commitments as of December 31, 2014 and the periods in which payments are due (in thousands):
| Total | Less than 1 Year |
1 to 3 Years |
3 to 5 Years |
More than 5 Years |
||||||||||||||||
| Long-term debt including related-party (1) |
$ | 141,535 | $ | 33,824 | $ | 17,416 | $ | 90,295 | $ | — | ||||||||||
| Aircraft and engine purchases (2) |
396,149 | 211,899 | 184,250 | — | — | |||||||||||||||
| Aircraft and engine leases (3) |
1,493,251 | 225,123 | 420,800 | 360,505 | 486,823 | |||||||||||||||
| Maintenance deposits (4) |
88,404 | 8,906 | 18,466 | 20,350 | 40,682 | |||||||||||||||
| Other leases (5) |
153,614 | 27,047 | 53,498 | 40,967 | 32,102 | |||||||||||||||
|
|
|
|
|
|
|
|
|
|
|
|||||||||||
| $ | 2,272,953 | $ | 506,799 | $ | 694,430 | $ | 512,117 | $ | 559,607 | |||||||||||
|
|
|
|
|
|
|
|
|
|
|
|||||||||||
| (1) | Includes accrued interest, excludes future interest of $23.5 million to be accrued through November 2022. |
| (2) | Represents non-cancelable contractual payment commitments for aircraft and engines. |
| (3) | Represents future minimum lease payments under non-cancelable operating leases with initial terms in excess of one year, including renewal payments for signed lease extensions and excluding lease rebates. |
| (4) | Represents the fixed portion of supplemental rent under lessor contracts for maintenance reserve payment commitments; excludes variable future amounts that will be based on actual flight hours. |
| (5) | Represents future minimum lease payments under non-cancelable building, airport station and equipment leases. |
The table above does not include our commitment to pay royalties to the Virgin Group pursuant to amended and restated license agreements related to our use of the Virgin name and brand.
46
Table of Contents
The table above also does not include our obligation to provide a holdback of up to $100.0 million to our credit card processors upon the expiration of the $100.0 million letter of credit facility (“Letter of Credit Facility”) in 2019, if the holdback requirements have not been eliminated by that time. The Virgin Group issued the Letter of Credit Facility, available until November 2019, on our behalf to our credit card processors in exchange for their release of $100.0 million of credit card holdback collateral. Refer to “Management’s Discussion and Analysis of Financial Condition and Results of Operations Off-Balance Sheet Arrangements” for further information.
Certain of our aircraft operating leases and debt instruments include certain financial covenants and cross-default provisions. As of December 31, 2014, we were in compliance with all covenants under these agreements.
Off-Balance Sheet Arrangements
We have significant obligations for aircraft that are classified as operating leases and therefore are not reflected in our consolidated balance sheets. As of December 31, 2014, all 53 aircraft in our fleet were subject to operating leases. These leases expire between 2016 and 2025. Aircraft rent expense related to operating leases, net of rebates earned during each of the periods, were $184.4 million, $202.1 million, and $236.8 million in 2014, 2013 and 2012, including expense of $3.8 million, $3.0 million, and $15.5 million in 2014, 2013 and 2012, for supplemental rent for maintenance related reserves as required by our lessors.
Our contractual purchase commitments consist primarily of aircraft and spare engine acquisitions through manufacturers and aircraft leasing companies. Our firm aircraft order consists of ten aircraft scheduled for delivery between July 2015 and June 2016. Committed expenditures for these aircraft and related flight equipment, including estimated amounts for contractual price escalations and pre-delivery payment commitments, will be approximately $211.9 million in 2015 and $184.3 million in 2016.
In November 2014, in connection with the 2014 Recapitalization Agreement, the Virgin Group arranged for the $100.0 million Letter of Credit Facility issued on our behalf to certain companies that process substantially all of our credit card transactions, which allowed these companies to release $100.0 million of cash collateral to us. The Letter of Credit Facility contains an annual commitment fee of 5.0% of the amount available to be drawn that is payable by us to the Virgin Group, and the Letter of Credit Facility will be provided for a period of up to five years from the date of our IPO. In addition, we are also responsible for annual fees associated with the issuance and maintenance of the Letter of Credit Facility. The Letter of Credit Facility would only become an obligation of ours if one or both of our credit card processors were to draw on the Letter of Credit Facility, and it will be reduced or terminated to the extent that collateral requirements are decreased or eliminated by our credit card transaction processors. In addition, we are restricted from incurring any future secured indebtedness related to our assets that were unencumbered after the 2014 Recapitalization unless our guaranty obligations to the Virgin Group are secured on a pari passu basis with such secured debt. For more information, see “Management’s Discussion and Analysis of Financial Condition and Results of Operations-2014 Recapitalization” and Note 9 to our consolidated financial statements elsewhere in this Annual Report on Form 10-K.
We have also made certain guarantees and indemnities to other unrelated parties that are not reflected on our consolidated balance sheets which we believe will not have a significant impact on our results of operations, financial condition or cash flows.
We have no other off-balance sheet arrangements.
We prepare our consolidated financial statements in accordance with generally accepted accounting principles in the United States, or U.S. GAAP. In doing so, we have to make estimates and assumptions that
47
Table of Contents
affect our reported amounts of assets, liabilities, revenue and expenses, as well as related disclosure of contingent assets and liabilities. To the extent that there are material differences between these estimates and actual results, our financial condition or results of operations would be affected. We base our estimates on past experience and other assumptions that we believe are reasonable under the circumstances, and we evaluate these estimates on an ongoing basis. We refer to accounting estimates of this type as critical accounting estimates, which we discuss further below.
Revenue Recognition including Loyalty Programs
We generate the majority of our revenue from sales of passenger tickets. We initially defer ticket sales as air traffic liability and recognize passenger revenue when the passenger flight occurs. Passenger revenue also includes upgrade fees, which we recognize when the related flights occur.
Tickets expire one year from the date of issuance, if unused by the passenger. We also issue travel credits to passengers for certain changes to flights if a residual value exists after application of any applicable change fee. Travel credits also expire one year from the date of issuance. We estimate and record advanced breakage for tickets and travel credits we expect will expire unused. These estimates are based on our historical experience of expired tickets and travel credits and consider other facts, such as recent aging trends, program changes and modifications that could affect the ultimate expiration patterns of tickets and travel credits.
Other revenue consists of baggage fees, change fees, seat selection fees, passenger-related service fees and inflight meals and entertainment. We recognize revenue for baggage fees, seat selection fees and passenger-related service fees when the associated flight occurs. We recognize change fee revenues as they occur.
Our Elevate® loyalty program provides frequent flyer travel awards to program members based on accumulated points. Points are accumulated as a result of travel, purchases using the co-branded credit card and purchases from other participating partners. The program has an 18-month expiration period for unused points from the month of last account activity. For all points earned under the Elevate program, we have an obligation to provide future travel when these reward points are redeemed.
With respect to points earned as a result of travel, or flown points, we recognize a liability and a corresponding sales and marketing expense, representing the incremental cost associated with the obligation to provide travel in the future, as points are earned by passengers. We offer redemption of points for our Elevate program members through travel on our flights and our partner airlines. Incremental cost for points to be redeemed on our flights is estimated based on historical costs, which include the cost of fuel, passenger fees, complimentary beverages, insurance, miscellaneous passenger supplies and other airline payments. We adjust our liability periodically for changes in our estimate of incremental cost, average points to redeem and breakage estimates.
We account for member points sold to our partners, or sold points, including points related to our participation in other providers’ affinity loyalty programs and member purchases with partner credit card companies as multiple-element arrangements. These arrangements have historically consisted of two elements: transportation and brand marketing-related activities. The transportation element represents the fair value of the travel that we will ultimately provide when the sold points are redeemed. The brand and marketing element consists of brand marketing related activities that we conduct with participating partners.
For points earned from purchases through our original co-branded credit card agreement, we recorded deferred revenue using the residual method. The fair value of a point is estimated using the average points redeemed and the estimated value of purchased tickets. We recognize points redeemed as passenger revenue when the awards are redeemed and the related travel occurs. We recognized the residual portion, if any, upon sale of points as other revenue associated with the other marketing services delivered.
48
Table of Contents
In 2013, we entered into a new co-branded credit card agreement with a new partner, which we refer to as the “New Co-Brand Agreement.” The New Co-Brand Agreement has a seven-year term beginning January 1, 2014, when the new co-branded card was introduced and services to our members began. Services with standalone value provided under this agreement include: (i) the points earned or the travel component; (ii) companion certificates for annual travel discounts up to $150; (iii) unlimited access to the use of our brand and customer list; (iv) advertising; (v) waived bag fees, which are limited to the first checked bag for the cardholder and their companion traveling on the same flight which must be purchased using the card; (vi) unlimited waived change fees provided the ticket is purchased using the premium card; and (vii) unlimited discounts on purchases made through our Red® inflight entertainment system using the co-branded credit card. Under the New Co-Brand Agreement, our partner is required to provide annual guaranteed advance payments over the contract term. Any unearned advance at the end of the calendar year is carried over to the following year until the contract expires. At the end of the contract, we have no obligation to refund any unearned advances to the partner. As of December 31, 2014, excess advances totaled $8.5 million, which we recorded as air traffic liability.
Under the revenue recognition rules for multiple element arrangements, we determine the best estimated selling price, or BESP, of each element and allocate the arrangement consideration using the relative selling price of each element. Based on our valuation of the New Co-Brand Agreement, the majority of the value is attributable to points or the travel component and brand and customer list, for which the BESP is determined using our own and market assumptions as well as other judgments necessary to determine the estimated selling price of each element. When developing the relative selling price allocation attributable to the points or travel component, we primarily considered the total number of points expected to be issued, the BESP for points (specifically the value at which points could be redeemed for free or discounted travel), the number of points expected to be redeemed and the timing of redemptions. The BESP for points is derived based on our estimate of the redemption rate used by our guests to convert points into the equivalent ticket value for travel with us or with one of our airline partners. For brand and customer list, we considered brand power, the size of our customer list and the market royalty rate for equivalent programs. Our estimates of the BESP will not change, but the allocation between elements may change based on changes in the ultimate volume of sales of each element during the term of the contract.
We recognize and record revenue for the majority of the travel-related elements in accordance with our existing policies for such services. Revenue for brand and advertising is recognized in other revenue as such services are provided ratably over the contract term. Revenue from making available unlimited services such as waived bag fees, waived change fees and inflight discounts is recognized in other revenue on a ratable basis over the contract term subject to a contract limitation based on the proportion of cumulative points issued to total contract points expected to be issued.
We estimate breakage for sold points using a regression analysis model supplemented with qualitative considerations, which include the history and success of the program as well as member behavior. In addition, we also consider redemption trends by performing a weighted-average redemption rate calculation to evaluate the reasonableness of our calculated breakage rates. Breakage is recorded for sold points under the redemption method using points expected to be redeemed and our recorded deferred revenue balance to determine a weighted-average rate, which is then applied to actual points redeemed. A change in assumptions as to the period over which points are expected to be redeemed, the actual redemption patterns or the estimated fair value of points expected to be redeemed could have a material impact on our revenue in the year in which the change occurs as well as in future years. Our estimates could change in the future as our members’ behavior changes and more historical data is collected.
Aircraft and Engine Maintenance & Repair
Under our aircraft operating lease agreements and FAA operating regulations, we are obligated to perform all required maintenance activities on our fleet, including component repairs, scheduled air frame checks and
49
Table of Contents
major engine restoration events. We estimate the timing of the next major maintenance event based on assumptions including estimated usage, FAA-mandated maintenance intervals and average removal times as recommended by the manufacturer. The timing and the cost of maintenance are based on third-party estimates, which can be impacted by changes in utilization of our aircraft, changes in government regulations and suggested manufacturer maintenance intervals. Major maintenance events represent six-year and 12-year airframe checks, engine restorations and overhauls to major components. We account for qualifying major engine maintenance under the deferral method wherein restoration costs and replacement of engine life limited parts are capitalized and amortized as a component of depreciation and amortization expense up to the earlier of the lease end or the estimated date for the next engine overhaul. Regular airframe and other routine maintenance costs are expensed as incurred.
In connection with our aircraft operating lease agreements, we are required to make supplemental rent payments to our aircraft lessors, which represent maintenance reserves made to collateralize the lessor. Our lease agreements provide that maintenance reserves are reimbursable to us upon completion of the major maintenance event in an amount equal to the lesser of (i) the amount of the maintenance reserve held by the lessor associated with the specific major maintenance event or (ii) the qualifying costs related to the specific major maintenance event, although in some instances we expect to receive a credit at the end of the lease for a portion of any excess reserves remaining after each event. We record the supplemental payments or maintenance reserves that we expect to recover as aircraft maintenance deposits in the accompanying consolidated balance sheets. When it is not probable that amounts on deposit with lessors will be recovered, we expense such amounts as a component of aircraft rent expense. When the underlying maintenance event is performed, the cost is either capitalized and amortized as a component of depreciation and amortization expense for qualified major engine maintenance or expensed for all other major maintenance, and the deposit is reclassified to a receivable in our consolidated balance sheet.
The terms of most of our aircraft lease agreements also provide that most maintenance reserves held by the lessor which relate to major maintenance events that fall outside of the lease term are nonrefundable to us at the expiration of the lease and will be retained by the lessor, although in some instances we may receive reimbursement for any maintenance costs we incur to meet return conditions under the related lease. We charge supplemental rent payments to aircraft rent expense in our consolidated statement of operations when it becomes less than probable that these amounts will be recovered.
We make certain assumptions at the inception of the lease and at each balance sheet date to determine the recoverability of maintenance deposits. Our assumptions are based on various factors such as the estimated timing of major maintenance events, including replacement of engine life limited parts, the cost of future maintenance events and the number of flight hours and cycles for which we estimate the aircraft will be utilized before it is returned to the lessor. We account for changes in estimates related to maintenance reserve payments on a prospective basis.
For regular maintenance of our leased aircraft, we have maintenance-cost-per-hour contracts for management and repair of certain rotable parts to support scheduled and unscheduled airframe and engine maintenance and repair. These agreements require us to make monthly payments based on utilization, such as flight hours, cycles and age of the aircraft, and in turn, the agreements transfer certain risks related to the supply and repair of component parts to the third-party service provider. We recognize expense based on the contractual payments, which substantially match the service being received over the contract period. In addition, we have an engine service agreement under which a third party is required to perform major engine restoration maintenance for substantially all of our aircraft engines. Under this agreement, we have an agreed rate with the maintenance provider based on engine utilization, which applies when the engines are inducted into an overhaul.
2014 Recapitalization
In connection with the 2014 Recapitalization, we and certain entities affiliated with the Virgin Group entered into amended and restated license agreements related to our use of the Virgin name and brand, which
50
Table of Contents
provided for, among other things, an increase in the license fee that we pay to the Virgin Group from 0.5% to 0.7% of total revenue commencing in the first quarter of 2016 until our annual revenue exceeds $4.5 billion. We recorded the fair value of the increase in the license fee as a component of the 2014 Recapitalization with an offsetting increase in other long-term liabilities as it constituted part of the consideration to the Virgin Group for completing the 2014 Recapitalization. We estimated the incremental license fee obligation based on the present value of the additional cash flows of 0.2% of estimated total revenue over the estimated period required to reach the $4.5 billion cap. We estimated the discount rate based on airline specific weighted average cost of capital, factoring in a judgmental risk spread based on a variety of cash flow estimates.
Also in connection with the 2014 Recapitalization, the Virgin Group arranged for the $100.0 million Letter of Credit Facility issued on our behalf to certain companies that process substantially all of our credit card transactions. Refer to Note 2 to our consolidated financial statements included elsewhere in this Annual Report on Form-10-K for more information. The Letter of Credit Facility will be provided for a period of up to five years from November 18, 2014 and contains an annual commitment fee equal to 5% per annum of the daily maximum amount available to be drawn, accruing on a daily basis from the date of issuance. The fee is payable quarterly by us to the Virgin Group. The Letter of Credit Facility would only become an obligation if one or both of its credit card processors were to draw on the Letter of Credit Facility upon a default by us under our credit card processing agreements. We are restricted from incurring any future secured indebtedness related to our unencumbered assets, unless the reimbursement obligations to the Virgin Group are secured on a pari passu basis with such secured debt. As the fee was provided as part of a transaction with a related party, we evaluated whether the fee is at fair value by comparing it to rates that have been obtained in similar transactions that were made at arm’s length. We concluded that the contractual rate for the fee is reasonably comparable to a rate that would be obtained from a third party, and as a result, we record the fee on monthly basis as related-party expense in other income (expense) in the accompanying consolidated statement of operations.
2013 Debt Modification
In connection with the 2013 Recapitalization, we entered into a series of agreements with the Virgin Group and Cyrus Capital (our primary lenders) to modify certain existing debt agreements, issue new debt for $75.0 million of cash proceeds and issue certain Related-Party Warrants. Pursuant to these agreements, our lenders exchanged $556.0 million of related-party debt which previously had contractual interest rates ranging from 15% to 20% per year for $369.1 million of related-party debt with a lower interest rate of 5% per year, compounded annually, and for new Related Party Warrants to purchase 21.2 million shares of our common stock at an exercise price of $18.87 per share. One of our lenders also exchanged subordinated notes with outstanding principal and accrued interest of approximately $131.5 million, along with certain associated warrants, for new Related-Party Warrants to purchase 1.0 million shares of our common stock at an exercise price of $0.08 per share. Finally, our lenders also funded $75.0 million in cash proceeds to us, and we issued $75.0 million aggregate principal amount of new Related-Party Notes with a stated interest rate of 17%, compounded annually, and new Related-Party Warrants to purchase 1.0 million shares of our common stock at an exercise price of $18.87 per share.
We evaluated these transactions in accordance with the accounting guidance on troubled debt restructurings, which requires that the debtor must be experiencing financial difficulty and that the creditor must have granted a concession, and we determined that we met both criteria. We also made certain assumptions, judgments and estimates to account for the debt modification, which included: (i) excluding an existing Related-Party Note payable from the analysis as it was completely unmodified in the transaction; (ii) analyzing and applying the accounting guidance at the creditor level; and (iii) determining the fair value of the Related-Party Warrants issued, which required us to make assumptions about the fair value of our common stock.
To account for the debt modification, we compared the recorded value of the modified debt and the new debt, less the fair value of the Related-Party Warrants issued, to the restructured aggregate undiscounted cash flows at maturity at the creditor level. The fair value of Related-Party Warrants was based on the Black Scholes option pricing model using the following key assumptions: expected term of 5.0 years; a risk-free interest rate of
51
Table of Contents
0.83%; no expected dividends; a fair value price per share based on an independent third-party valuation at May 2013; and 70.0% estimated share price volatility. When the recorded value of the existing debt exceeded the aggregate undiscounted cash flows associated with the restructured debt, we adjusted the carrying amount of the debt on our balance sheet and recognized a gain equal to the difference as a capital contribution. When the recorded value of the existing debt did not exceed the undiscounted cash flows associated with restructured debt, we calculated the effective interest rate that will be used to accrete the debt to its maturity value.
See Note 3 to our consolidated financial statements included elsewhere in this Annual Report on Form 10-K for further discussion of the accounting of the 2013 Recapitalization.
Lease Amendments
In connection with the 2013 Recapitalization, we amended most of our lease agreements with our existing aircraft lessors to provide us with a reduction in monthly base rent and/or maintenance deposits through monthly cash rent rebates, which we refer to as the “Lease Rebates.” In certain cases, we also extended the lease terms by three to five years. Payment of future Lease Rebates are contingent on us maintaining $75.0 million of unrestricted cash and cash equivalents as of the last day of each month.
We concluded that all amended leases were deemed to be new leases, and we re-evaluated these to determine if they qualified as capital or operating leases. We determined that each of our leases, as amended, continued to be an operating lease. Our lease analysis required us to make certain assumptions and estimates including: (i) the interest rate, which represented a blended rate of recent secured borrowing rates of peer companies and our unsecured borrowing rates; (ii) the fair value of the aircraft at the time of the new lease; and (iii) the fair value rental rates during the non-cancelable lease extension period. We estimated the extension rates utilizing fixed lease extension rates negotiated in other modified agreements based on current independent aircraft appraisals and current market lease rates. We also considered future demand for the leased aircraft while giving consideration to newer, more fuel-efficient aircraft expected to be delivered in the marketplace during the extension period.
We recognize rent expense on a straight-line basis over the non-cancelable lease term, using rates specified in the contract and for certain leases, estimated fixed rates based upon the fair market value of the aircraft as determined by a qualified appraisal at the start of the lease extension period if not specified in the contract. We estimated the extension rates utilizing current independent aircraft appraisals, current market lease rates, and factored in future demand for the leased aircraft while giving consideration to newer, more fuel efficient aircraft expected to be delivered in the marketplace during the extension period. We periodically review and update our estimates of the rental rates as required if significant adjustments become necessary. No adjustments were necessary as of December 31, 2014. We accounted for Lease Rebates received at the start of the amended leases as an incentive to be recorded as a reduction of rent expense on a straight-line basis over the lease term. Future Lease Rebates are considered contingent and are recognized as a reduction in rent expense when the liquidity requirement is met. Under the amended lease agreements, we receive $1.6 million in Lease Rebates on a monthly basis and we are obligated to refund 25.0% of substantially all the Lease Rebates from monthly base rent received through December 31, 2016 in the first quarter of 2017 or on a pro-rata basis with any debt repayment occurring prior to the first quarter of 2017. Therefore, we accrue 25.0% of the Lease Rebates as a component of the deferred rent balance in our consolidated financial statements.
In addition, as certain of our lease terms are now extended, certain major aircraft and engine maintenance events are expected to occur within the extended lease terms. As a result, we recorded $30.1 million of lease incentives associated with previously expensed supplemental rent payments that we now expect to be recoverable by virtue of the lease term extensions. We recorded these lease incentives as an increase to aircraft maintenance deposits and an increase to other liabilities in our consolidated balance sheet in 2013. We determined that a lease incentive resulted from the lease extension when the amount that we expect to be reimbursed in the future exceeds the amount of maintenance deposit currently on our balance sheet plus any future payments to be made
52
Table of Contents
through the date of the qualifying maintenance event. We recorded any excess amount as an incentive to the extent there were supplemental rent payments made during the lease term that had previously been expensed. We calculated our lease incentives on a maintenance event by maintenance event basis, consistent with the manner in which supplemental rent payments are made to our lessors.
Intangible Assets
Our intangible assets consist of take-off and landing slots at LaGuardia Airport (LGA) and Ronald Reagan Washington National Airport (DCA) acquired in 2013 and in 2014. Slots are rights to take-off or land at a slot-controlled airport during a specific time period during the day and are a means by which the FAA manages airspace/airport congestion. The FAA controls slots at four airports, including LGA and DCA. The slots at DCA do not have a stated expiration date. Although the slots at LGA have expiration dates coinciding with the expiration date of the FAA’s slot orders, the FAA’s practice has been to renew the FAA slot orders, and we can continue to hold and use the slots as long as we comply with the FAA’s minimum use requirements. Unlike other assets at slot-controlled airports that are generally depreciated over their expected useful lives, slots require no maintenance and do not have an established residual value. As the demands for air travel at these airports have remained very strong, we expect to use these slots in perpetuity and have determined our slots to be indefinite-lived intangible assets. Intangible assets with indefinite lives are not amortized but rather tested for impairment annually, or more frequently when events and circumstances indicate that impairment may exist.
We apply a fair value based impairment test to the carrying value of indefinite-lived intangible assets on an annual basis during Q4, or more frequently if certain events or circumstances indicate that an impairment loss may have been incurred. The FASB standard “Testing Indefinite-Lived Intangible Assets for Impairment” gives companies the option to perform a qualitative assessment to determine whether it is more likely than not that an indefinite-lived intangible asset is impaired rather than calculating the fair value of the indefinite-lived intangible asset. We applied the provisions to our annual indefinite-lived intangible asset impairment testing in 2014.
We first utilize a qualitative approach and analyze various factors to determine if events and circumstances have affected the fair value of the goodwill and indefinite-lived intangible assets. If we determine it is more likely than not that the asset value may be impaired, we then use the quantitative approach to assess the asset’s fair value and amount of impairment.
Factors which could result in future impairment of owned landing slots, holding other assumptions constant, could include, but are not limited to: (i) increased competition in the slotted airport; (ii) a change in competition in the slotted airport; (iii) significantly higher prices for jet fuel; and (iv) increased competition at a nearby airport. As part of this evaluation we assess whether changes in (i) macroeconomic conditions; (ii) industry and market conditions; (iii) cost factors; (iv) overall financial performance; and (v) certain events specific to our company, had occurred which would impact the use and/or fair value of these assets.
As a result of our qualitative analyses performed during 2014 (October 1), we concluded it was more likely than not that the fair values of our indefinite-lived intangible assets was greater than the carrying value and therefore, a quantitative assessment was not necessary. Thus as a result of the annual impairment test conducted during fourth quarter 2014, no impairment was noted.
Income Taxes
We account for income taxes using the asset and liability method. We record deferred taxes based on differences between the financial statement basis and tax basis of assets and liabilities and available tax loss and credit carryforwards. In evaluating our ability to utilize our deferred tax assets, we consider available evidence, both positive and negative, in determining future taxable income on a jurisdiction-by-jurisdiction basis. We record a valuation allowance against deferred tax assets reported if, based on the weight of the evidence, it is more likely than not that some portion or all of the deferred tax assets will not be realized. Judgment is required
53
Table of Contents
in evaluating our ability to utilize our deferred tax assets, assessing our uncertain tax positions and determining our provision for income taxes. Although we believe our estimates are reasonable, we cannot assure you that the final tax outcome of these matters will not be different from that which is reflected in our historical income tax provisions and accruals.
Although we recorded pretax income in 2014, we have a cumulative loss over the three year period ended December 31, 2014. We believe this cumulative loss, despite earnings in recent years, precludes us from being able to project sufficient taxable income to conclude that our net deferred tax assets are more likely than not of being recovered. As a result, we have maintained a full valuation allowance on our net deferred tax assets. We will continue to evaluate future financial performance to determine whether such performance provides sufficient evidence to support reversal of the valuation allowance in the future.
Section 382 of the Internal Revenue Code, or Section 382, imposes limitations on a corporation’s ability to utilize net operating loss carryforwards, or NOLs, if it experiences an “ownership change.” In general terms, an ownership change results from a cumulative change in the equity ownership of certain stockholders by more than 50 percentage points over a rolling three-year period. In the event of an ownership change, utilization of our pre-change NOLs would be subject to annual limitation under Section 382 determined by multiplying the value of our stock at the time of the ownership change by the applicable long-term tax-exempt rate, increased in the five-year period following such ownership change by “recognized built-in gains” under certain circumstances. Multiple Section 382 limitations can be created by multiple ownership changes. In cases of multiple ownership changes, a subsequent ownership change can reduce, but not increase, the size of the Section 382 limitation that applies to pre-change losses from an earlier ownership change.
We had NOLs of approximately $633.2 million and $433.9 million for federal and state income tax purposes at December 31, 2014. Our federal NOLs expire between 2027 and 2034. As a result of a January 2010 equity restructuring, we experienced a Section 382 ownership change. We have $329.7 million of NOLs generated prior to the change that may be subject to limitation as a result of this change. As a result of the 2014 Recapitalization and our IPO, we believe we have experienced another Section 382 ownership change. We have not yet completed the final calculation of the estimated limitation for the 2014 ownership change, but based on our current calculations, we do not believe we will experience limitations on the use of these NOLs in the near term. We expect to finalize this analysis before the filing of 2014 tax returns.
Share-Based Compensation
Prior to our IPO, we granted performance-based and market-based stock options and restricted stock units to employees and directors. The performance-based vesting condition was achieved at the completion of the IPO in November 2014. Thus we recognized $7.7 million expense in the fourth quarter 2014 for performance shares for which service had already been rendered. As of December 31, 2014, total unamortized compensation for such performance-based awards was $2.3 million, which we will recognize over the remaining service term of the awards. In addition, market-based vesting conditions, such as targeted minimum market prices, further restrict the exercisability or settlement of such awards. Any awards, including those that have vested over a fixed service period, have not become exercisable before an employee’s termination are forfeited.
In connection with our IPO, our board of directors approved 340,411 shares of common stock to be issued upon the vesting of RSUs which were granted at the completion of the IPO in November 2014. These awards will vest over three years following the completion of the offering. Total compensation expense over the three-year service term will be $7.8 million, based on the number of shares multiplied by the initial offering price of $23.00. In addition to stock compensation associated with options and RSUs as described in the preceding notes, 217,898 shares of fully vested common stock were issued to employees and directors at the completion of IPO in November 2014, as approved by our board of directors. We recorded $5.0 million in stock compensation expense and an increase in additional paid in capital, based on the number of shares multiplied by the initial price of the common stock of $23.00.
54
Table of Contents
| ITEM 7A. | QUANTITATIVE AND QUALITATIVE DISCLOSURES ABOUT MARKET RISK |
We are subject to market risks in the ordinary course of our business. These risks include commodity price risk, specifically with respect to aircraft fuel, as well as interest rate risk. The adverse effects of changes in these markets could pose a potential loss as discussed below. The sensitivity analysis provided does not consider the effects that such adverse changes may have on overall economic activity, nor does it consider additional actions we may take to mitigate our exposure to such changes. Actual results may differ.
Aircraft Fuel. Our results of operations can vary materially, due to changes in the price and availability of aircraft fuel and are also impacted by the number of aircraft in use and the number of flights we operate. Aircraft fuel expense for the years ended December 31, 2014, 2013 and 2012 represented approximately 35.8%, 37.7%, and 39.4% of our operating expenses. Increases in aircraft fuel prices or a shortage of supply could have a material adverse effect on our operations and results of operations. Based on December 2014 aircraft fuel market prices and our projected 2015 fuel consumption, a 10% increase in the average price per gallon would increase our annual aircraft fuel expense, net of our hedge portfolio, by approximately $17.8 million. To manage economic risks associated with the fluctuations of aircraft fuel prices, we periodically enter into FFPs, forward swaps, call options for crude oil and collar contracts for heating oil. As of December 31, 2014, we had entered into fuel derivative contracts and FFPs that fixed or established a floor on the price associated with 27% of our forecasted aircraft fuel requirements for the next twelve months at an approximate cost per gallon of $2.51, which is in excess of current market prices. All of our then existing fuel hedge contracts are expected to settle by the end of the second quarter of 2015.
The fair value of our fuel derivative contracts as of December 31, 2014 was a net liability of $27.1 million offset by margin call deposits of $14.4 million , resulting in an overall net liability of $12.7 million. As of December 31, 2013, our fuel hedge net asset was $2.4 million. We measure our fuel derivative instruments at fair value, which is determined using standard option valuation models that use observable market inputs including contractual terms, market prices, yield curves, fuel price curves and measures of volatility. Changes in the related commodity derivative instrument cash flows may change by more or less than the fair value based on further fluctuations in futures prices. Outstanding financial derivative instruments expose us to credit loss in the event of nonperformance by the counterparties to the agreements. As of December 31, 2014, we believe the credit exposure related to these fuel forward contracts was minimal and do not expect the counterparties to fail to meet their obligations.
Interest Rates. We are subject to market risk associated with changing interest rates, due to LIBOR-based interest rates on an applicable portion of our aircraft pre-delivery payments loan and airport slot financing. A hypothetical 10% change in LIBOR in 2014 would have had an immaterial effect on total interest expense in 2014.
Our long-term debt consists of fixed rate notes payable. A hypothetical 10% change in market interest rates as of December 31, 2014 would have no effect on our interest expense but would reduce the fair value of our fixed-rate related-party debt instruments by $2.3 million.
55
Table of Contents
Set forth below is a glossary of industry terms used in this Annual Report on Form 10-K:
Airbus A320-family includes A318, A319, A320 and A321 aircraft manufactured by the Airbus Group. The Airbus A320-family have common engine, airframe and cockpit design, leading to shared maintenance and flight operations procedures. We currently operate A319 and A320 aircraft.
Ancillary revenue means the amount of non-ticket revenue received from passengers, including baggage fees, change fees, seat selection fees, on-board sales and other revenue, including charter revenue
Ancillary revenue per passenger means the total ancillary revenue divided by passengers.
ASMs, or “available seat miles,” refer to the number of seats available for passengers multiplied by the number of miles the seats are flown. Average fare means total passenger revenue divided by passengers.
Block hours means the hours during which the aircraft is in revenue service, measured from the time of gate departure before take-off until the time of gate arrival at the destination.
CASM, or “cost per available seat mile,” means the airline’s total operating costs divided by available seat miles.
CASM, excluding fuel, or “CASM ex-fuel,” means operating costs less aircraft fuel expense divided by ASMs.
CASM, excluding fuel and profit sharing means operating costs less aircraft fuel expense and profit sharing expense divided by ASMs. Under our annual profit sharing program, we accrue 15% of cumulative year-to-date income before income taxes and profit sharing for the benefit of our eligible teammates each quarter to the extent that we have cumulative year-to-date pre-tax income.
Codeshare refers to a type of arrangement where two or more airlines share the same flight and where a seat can be purchased through one airline but actually operated by a cooperating airline under a different flight number or code.
Fleet utilization, or “aircraft utilization,” means block hours in the period divided by average number of aircraft in our fleet divided by number of days in the period.
Flight equipment means all types of property and equipment used in the inflight operation of aircraft.
Flight hours means the total time an aircraft is in the air between an origin-destination airport pair, i.e. from wheels-up at the origin airport to wheels-down at the destination airport.
Hub-and-spoke network refers to a method of organizing an airline network in which one major airport is used as a connecting point for passengers traveling to other destinations, including smaller local airports and international destinations.
Interline refers to a type of agreement among airline partners that allow guests to create itineraries connecting from one airline to another.
Lease Rebates refers to reductions to base monthly rent, maintenance deposits or both through monthly cash rebates. Load factor means the proportion of airline capacity (ASMs) that is actually consumed, calculated by dividing RPMs by ASMs.
Passenger revenue means revenue received by the airline from the carriage of passengers in scheduled operations.
56
Table of Contents
Passengers means the total number of passengers flown on all flight segments.
PDP means pre-delivery payments, which are payments required by aircraft manufacturers in advance of delivery of the aircraft; typically aircraft-specific payments begin 24 months prior to aircraft delivery.
Pitch, or “seat pitch,” means the measure of distance between seat rows on an aircraft, measured in inches from the middle of one seat to the middle of the seat directly in front of it.
Point-to-point network means a method of organizing an airline network in which flights travel directly to a destination rather than going through a central hub.
PRASM, or “passenger revenue per available seat mile,” refers to a measure of passenger unit revenue calculated by dividing passenger revenue by available seat miles, or ASMs.
RASM, “revenue per available seat mile” or “unit revenue” refers to a measure of unit revenue calculated by dividing the airline’s total revenue by available seat miles, or ASMs.
RPMs, or “revenue passenger miles,” means the number of miles flown by revenue passengers.
Seat-weighted stage length means the average distance flown, measured in statute miles, per seat, calculated by dividing total ASMs by the number of total seats flown.
Stage length means the average distance flown, measured in statute miles, per aircraft departure, calculated by dividing total aircraft miles flown by the number of total aircraft departures performed.
Stage length adjusted CASM means CASM adjusted for a seat-weighted stage length.
Stage-length adjustment refers to an adjustment to enable comparison of CASM and RASM across airlines. All other things being equal, the same airline will have lower CASM and RASM as stage length increases since fixed and departure related costs are spread over increasingly larger average flight lengths. Therefore, to properly compare these quantities across airlines (or even across the same airline for two different periods if the airline’s average stage length has changed significantly) requires settling on a common assumed stage length and then adjusting CASM and RASM appropriately. This requires some judgment and different observers may use different stage-length adjustment techniques. We adjust for stage-length using the MIT Global Airline Industry Program’s methodology for adjusting both PRASM and CASM, which we believe to be the most commonly accepted methodology in the industry. For comparisons in this Annual Report on Form 10-K in which CASM is stage-length adjusted, the stage-length being utilized is a seat-weighted distance, or the average of the distances flown by each seat divided by total seats flown. For comparisons where PRASM is stage-length adjusted, the stage being utilized is the passenger-weighted distance, or the average of the individual distances flown by the airlines’ passengers.
U.S. citizen means a “citizen of the United States” as that term is defined in 49 U.S.C. §40102(a)(15).
Yield refers to a measure of average fare paid per mile per passenger, calculated by dividing passenger revenue by revenue passenger miles.
Virgin America Destinations:
AUS—Austin-Bergstrom International Airport (Austin, Texas).
BOS—General Edward Lawrence Logan International Airport (Boston, Massachusetts).
CUN—Cancún International Airport (Cancún, Mexico).
57
Table of Contents
DAL—Dallas Love Field (Dallas, Texas).
DCA—Ronald Reagan Washington National Airport (Washington, D.C.).
EWR—Newark Liberty International Airport (Newark, New Jersey).
FLL—Fort Lauderdale-Hollywood International Airport (Fort Lauderdale, Florida).
IAD—Washington Dulles International Airport (Dulles, Virginia).
JFK—John F. Kennedy International Airport (Jamaica, New York).
LAS—McCarran International Airport (Las Vegas, Nevada).
LAX—Los Angeles International Airport (Los Angeles, California).
LGA—LaGuardia Airport (New York, New York).
MCO—Orlando International Airport (Orlando, Florida).
ORD—Chicago O’Hare International Airport (Chicago, Illinois).
PDX—Portland International Airport (Portland, Oregon).
PSP—Palm Springs International Airport (Palm Springs, California).
PVR—Licenciado Gustavo Díaz Ordaz International Airport (Puerto Vallarta, Mexico).
SAN—San Diego International Airport (San Diego, California).
SEA—Seattle–Tacoma International Airport (Seattle, Washington).
SFO—San Francisco International Airport (San Francisco, California).
SJD—Los Cabos International Airport (Los Cabos, Mexico).
58
Table of Contents
| ITEM 8. | FINANCIAL STATEMENTS AND SUPPLEMENTARY DATA |
Report of Independent Registered Public Accounting Firm
The Board of Directors and Shareholders of Virgin America Inc.
We have audited the accompanying consolidated balance sheets of Virgin America Inc. as of December 31, 2014 and 2013, and the related consolidated statements of operations, comprehensive income (loss), convertible preferred stock and stockholders’ equity (deficit), and cash flows for each of the three years in the period ended December 31, 2014. These financial statements are the responsibility of the Company’s management. Our responsibility is to express an opinion on these financial statements based on our audits.
We conducted our audits in accordance with the standards of the Public Company Accounting Oversight Board (United States). Those standards require that we plan and perform the audit to obtain reasonable assurance about whether the financial statements are free of material misstatement. We were not engaged to perform an audit of the Company’s internal control over financial reporting. Our audits included consideration of internal control over financial reporting as a basis for designing audit procedures that are appropriate in the circumstances, but not for the purpose of expressing an opinion on the effectiveness of the Company’s internal control over financial reporting. Accordingly, we express no such opinion. An audit also includes examining, on a test basis, evidence supporting the amounts and disclosures in the financial statements, assessing the accounting principles used and significant estimates made by management, and evaluating the overall financial statement presentation. We believe that our audits provide a reasonable basis for our opinion.
In our opinion, the financial statements referred to above present fairly, in all material respects, the consolidated financial position of Virgin America Inc. at December 31, 2014 and 2013, and the consolidated results of their operations and their cash flows for each of the three years in the period ended December 31, 2014, in conformity with U.S. generally accepted accounting principles.
/s/ Ernst & Young
San Francisco, California
March 2, 2015
59
Table of Contents
Consolidated Balance Sheets
(in thousands, except share and per share data)
| December 31, | ||||||||
| 2014 | 2013 | |||||||
| Assets |
||||||||
| Current assets: |
||||||||
| Cash and cash equivalents |
$ | 394,643 | $ | 155,659 | ||||
| Credit card holdbacks and receivables |
9,563 | 89,959 | ||||||
| Other receivables, net |
13,851 | 13,708 | ||||||
| Prepaid expenses and other assets |
20,874 | 23,369 | ||||||
|
|
|
|
|
|||||
| Total current assets |
438,931 | 282,695 | ||||||
| Property and equipment: |
||||||||
| Flight equipment |
76,724 | 65,559 | ||||||
| Ground and other equipment |
70,754 | 62,533 | ||||||
| Less accumulated depreciation and amortization |
(74,271 | ) | (60,967 | ) | ||||
|
|
|
|
|
|||||
| 73,207 | 67,125 | |||||||
| Pre-delivery payments for flight equipment |
94,280 | 69,116 | ||||||
|
|
|
|
|
|||||
| Total property and equipment, net |
167,487 | 136,241 | ||||||
| Aircraft maintenance deposits |
211,946 | 159,946 | ||||||
| Aircraft lease deposits |
50,758 | 50,669 | ||||||
| Restricted cash |
18,775 | 12,425 | ||||||
| Other non-current assets |
112,279 | 59,020 | ||||||
|
|
|
|
|
|||||
| 393,758 | 282,060 | |||||||
|
|
|
|
|
|||||
| Total assets |
$ | 1,000,176 | $ | 700,996 | ||||
|
|
|
|
|
|||||
See accompanying notes to the consolidated financial statements.
60
Table of Contents
Virgin America Inc.
Consolidated Balance Sheets
(in thousands, except share and per share data)
| December 31, | ||||||||
| 2014 | 2013 | |||||||
| Liabilities and stockholders’ equity (deficit) |
||||||||
| Current liabilities: |
||||||||
| Accounts payable |
$ | 52,821 | $ | 43,997 | ||||
| Air traffic liability |
150,479 | 138,890 | ||||||
| Other current liabilities |
100,723 | 73,752 | ||||||
| Long-term debt-current portion |
33,824 | — | ||||||
|
|
|
|
|
|||||
| Total current liabilities |
337,847 | 256,639 | ||||||
| Long-term debt-related parties |
38,848 | 707,969 | ||||||
| Long-term debt |
57,416 | 39,462 | ||||||
| Other long-term liabilities |
106,812 | 59,547 | ||||||
|
|
|
|
|
|||||
| Total liabilities |
540,923 | 1,063,617 | ||||||
| Contingencies and commitments (Note 9) |
||||||||
| Convertible preferred stock, $0.01 par value. No shares authorized, no shares issued and outstanding as of December 31, 2014; authorized 1,109,812 shares, 1,109,811 issued and outstanding as of December 31, 2013; liquidation value $12,000 as of December 31, 2013 |
— | 21,406 | ||||||
| Stockholders’ equity (deficit) |
||||||||
| Preferred stock, $0.01 par value per share. 10,000,000 shares authorized, 0 shares issued and outstanding as of December 31, 2014; no shares authorized, no shares issued and outstanding as of December 31, 2013 |
— | — | ||||||
| Common stock, $0.01 par value. Authorized: 750,000,000 (Voting 650,000,000, Non-Voting 100,000,000) shares as of December 31, 2014, 107,260,432 (Class A 56,630,503, Class A-1 29,143, Class B 924,867, Class C 47,688,845, Class D 13, Class E 13, Class F 13, Class G 1,987,035) shares as of December 31, 2013; Issued and outstanding: 43,119,886 (Voting 36,267,148, Non-Voting 6,852,738) shares as of December 31, 2014; 812,952 (Class A 248,308, Class A-1 29,143, Class B 424,221, Class C 0, Class D 13, Class E 13, Class F 13, Class G 111,241) shares as of December 31, 2013 |
431 | 8 | ||||||
| Additional paid-in capital |
1,237,944 | 427,434 | ||||||
| Accumulated deficit |
(753,016 | ) | (813,125 | ) | ||||
| Accumulated other comprehensive income (loss) |
(26,106 | ) | 1,656 | |||||
|
|
|
|
|
|||||
| Total stockholders’ equity (deficit) |
459,253 | (384,027 | ) | |||||
|
|
|
|
|
|||||
| Total liabilities and stockholders’ equity (deficit) |
$ | 1,000,176 | $ | 700,996 | ||||
|
|
|
|
|
|||||
See accompanying notes to the consolidated financial statements.
61
Table of Contents
Consolidated Statements of Operations
(in thousands, except share and per share data)
| Year Ended December 31, | ||||||||||||
| 2014 | 2013 | 2012 | ||||||||||
| Operating revenues: |
||||||||||||
| Passenger |
$ | 1,329,211 | $ | 1,289,268 | $ | 1,215,178 | ||||||
| Other |
160,756 | 135,410 | 117,659 | |||||||||
|
|
|
|
|
|
|
|||||||
| Total operating revenues |
1,489,967 | 1,424,678 | 1,332,837 | |||||||||
|
|
|
|
|
|
|
|||||||
| Operating expenses: |
||||||||||||
| Aircraft fuel |
499,102 | 507,035 | 537,501 | |||||||||
| Salaries, wages and benefits |
257,367 | 196,477 | 176,216 | |||||||||
| Aircraft rent |
184,357 | 202,071 | 236,800 | |||||||||
| Landing fees and other rents |
133,128 | 122,621 | 110,165 | |||||||||
| Sales and marketing |
113,203 | 106,599 | 107,136 | |||||||||
| Aircraft maintenance |
60,069 | 61,854 | 58,934 | |||||||||
| Depreciation and amortization |
14,486 | 13,963 | 11,260 | |||||||||
| Other operating expenses |
131,840 | 133,177 | 126,558 | |||||||||
|
|
|
|
|
|
|
|||||||
| Total operating expenses |
1,393,552 | 1,343,797 | 1,364,570 | |||||||||
|
|
|
|
|
|
|
|||||||
| Operating income (loss): |
96,415 | 80,881 | (31,733 | ) | ||||||||
|
|
|
|
|
|
|
|||||||
| Other income (expense): |
||||||||||||
| Interest expense-related-party |
(33,708 | ) | (68,439 | ) | (113,708 | ) | ||||||
| Interest expense |
(3,811 | ) | (2,854 | ) | (2,402 | ) | ||||||
| Capitalized interest |
2,668 | 534 | 2,176 | |||||||||
| Interest income and other |
(276 | ) | 339 | 294 | ||||||||
|
|
|
|
|
|
|
|||||||
| Total other expense |
(35,127 | ) | (70,420 | ) | (113,640 | ) | ||||||
|
|
|
|
|
|
|
|||||||
| Income (loss) before income tax |
61,288 | 10,461 | (145,373 | ) | ||||||||
| Income tax expense |
1,179 | 317 | 15 | |||||||||
|
|
|
|
|
|
|
|||||||
| Net income (loss) |
$ | 60,109 | $ | 10,144 | $ | (145,388 | ) | |||||
|
|
|
|
|
|
|
|||||||
| Net income (loss) per share: |
||||||||||||
| Basic |
$ | 8.42 | $ | 5.60 | $ | (207.20 | ) | |||||
|
|
|
|
|
|
|
|||||||
| Diluted |
$ | 7.13 | $ | 3.68 | $ | (207.20 | ) | |||||
|
|
|
|
|
|
|
|||||||
| Shares used for computation: |
||||||||||||
| Basic |
6,175,786 | 701,671 | 701,671 | |||||||||
| Diluted |
7,470,396 | 1,646,821 | 701,671 | |||||||||
See accompanying notes to the consolidated financial statements
62
Table of Contents
Consolidated Statements of Comprehensive Income (Loss)
(In thousands)
| Year Ended December 31, | ||||||||||||
| 2014 | 2013 | 2012 | ||||||||||
| Net income (loss) |
$ | 60,109 | $ | 10,144 | $ | (145,388 | ) | |||||
| Fuel derivative financial instruments, net of tax: |
||||||||||||
| Change in unrealized gains (losses) |
(33,230 | ) | 307 | (4,528 | ) | |||||||
| Net losses reclassified into earnings |
5,468 | 2,557 | 3,320 | |||||||||
|
|
|
|
|
|
|
|||||||
| Other comprehensive income (loss) |
(27,762 | ) | 2,864 | (1,208 | ) | |||||||
|
|
|
|
|
|
|
|||||||
| Total comprehensive income (loss) |
$ | 32,347 | $ | 13,008 | $ | (146,596 | ) | |||||
|
|
|
|
|
|
|
|||||||
See accompanying notes to the consolidated financial statements
63
Table of Contents
Consolidated Statements of Convertible Preferred Stock and Stockholders’ Equity (Deficit)
(In thousands, except share data)
| Convertible preferred stock |
Common stock | Additional paid-in capital |
Accumulated deficit |
Accumulated other comprehensive income (loss) |
Total stockholders’ equity (deficit) |
|||||||||||||||||||||||||||
| Shares | Amount | Shares | Amount | |||||||||||||||||||||||||||||
| Balances at December 31, 2011 |
1,109,811 | $ | 21,406 | 469,708 | $ | 5 | $ | 193,403 | $ | (677,881 | ) | $ | — | $ | (484,473 | ) | ||||||||||||||||
|
|
|
|
|
|
|
|
|
|
|
|
|
|
|
|
|
|||||||||||||||||
| Net loss |
— | — | — | — | — | (145,388 | ) | — | (145,388 | ) | ||||||||||||||||||||||
| Share-based compensation and issuance of Class G common stock |
— | — | 339,338 | 3 | 142 | — | — | 145 | ||||||||||||||||||||||||
| Other comprehensive loss |
— | — | — | — | — | — | (1,208 | ) | (1,208 | ) | ||||||||||||||||||||||
|
|
|
|
|
|
|
|
|
|
|
|
|
|
|
|
|
|||||||||||||||||
| Balances at December 31, 2012 |
1,109,811 | $ | 21,406 | 809,046 | $ | 8 | $ | 193,545 | $ | (823,269 | ) | $ | (1,208 | ) | $ | (630,924 | ) | |||||||||||||||
|
|
|
|
|
|
|
|
|
|
|
|
|
|
|
|
|
|||||||||||||||||
| Net income |
— | $ | — | — | — | — | 10,144 | — | 10,144 | |||||||||||||||||||||||
| Share-based compensation and issuance of Class G common stock |
— | — | 3,906 | — | 386 | — | — | 386 | ||||||||||||||||||||||||
| Other comprehensive gain |
— | — | — | — | — | — | 2,864 | 2,864 | ||||||||||||||||||||||||
| Gain on debt restructuring |
— | — | — | — | 150,490 | — | — | 150,490 | ||||||||||||||||||||||||
| Issuance of Class C warrants |
— | — | — | — | 83,361 | — | — | 83,361 | ||||||||||||||||||||||||
| Other |
— | — | — | — | (348 | ) | — | — | (348 | ) | ||||||||||||||||||||||
|
|
|
|
|
|
|
|
|
|
|
|
|
|
|
|
|
|||||||||||||||||
| Balances at December 31, 2013 |
1,109,811 | $ | 21,406 | 812,952 | $ | 8 | $ | 427,434 | $ | (813,125 | ) | $ | 1,656 | $ | (384,027 | ) | ||||||||||||||||
|
|
|
|
|
|
|
|
|
|
|
|
|
|
|
|
|
|||||||||||||||||
| Net income |
— | — | — | — | — | 60,109 | — | 60,109 | ||||||||||||||||||||||||
| Issuance of Class G common stock, pre-IPO |
— | — | 28,213 | — | 24 | — | — | 24 | ||||||||||||||||||||||||
| Conversion of Class D and F common stock and cancellation of Class E common stock, pre-IPO |
— | — | (39 | ) | — | — | — | — | — | |||||||||||||||||||||||
| 2014 Recapitalization |
(1,109,811 | ) | (21,406 | ) | 29,051,006 | 291 | 521,194 | — | — | 521,485 | ||||||||||||||||||||||
| Issuance of Common Stock upon IPO, net of fees |
— | — | 13,106,377 | 131 | 277,466 | — | — | 277,597 | ||||||||||||||||||||||||
| Share-based compensation |
— | — | 121,377 | 1 | 11,826 | — | — | 11,827 | ||||||||||||||||||||||||
| Other comprehensive loss |
— | — | — | — | — | — | (27,762 | ) | (27,762 | ) | ||||||||||||||||||||||
|
|
|
|
|
|
|
|
|
|
|
|
|
|
|
|
|
|||||||||||||||||
| Balances at December 31, 2014 |
— | $ | — | 43,119,886 | $ | 431 | $ | 1,237,944 | $ | (753,016 | ) | $ | (26,106 | ) | $ | 459,253 | ||||||||||||||||
|
|
|
|
|
|
|
|
|
|
|
|
|
|
|
|
|
|||||||||||||||||
See accompanying notes to the consolidated financial statements
64
Table of Contents
Consolidated Statements of Cash Flows
(in thousands)
| Year Ended December 31, | ||||||||||||
| 2014 | 2013 | 2012 | ||||||||||
| Cash flows from operating activities: |
||||||||||||
| Net income (loss) |
$ | 60,109 | $ | 10,144 | $ | (145,388 | ) | |||||
| Adjustments to reconcile net income (loss) to net cash provided by (used in) operating activities: |
||||||||||||
| Depreciation and amortization |
14,486 | 13,963 | 11,260 | |||||||||
| Share-based compensation |
13,985 | 383 | 158 | |||||||||
| Paid-in-kind interest expense and accretion |
20,673 | 54,258 | 99,075 | |||||||||
| Loss on asset disposition |
121 | — | — | |||||||||
| Unrealized (gain) loss on fuel derivative instruments |
3,432 | 1,318 | (389 | ) | ||||||||
| Changes in operating assets and liabilities: |
||||||||||||
| (Increase) decrease in credit card holdbacks |
80,395 | (4,615 | ) | 2,922 | ||||||||
| (Increase) decrease in other receivables, net |
(5,065 | ) | (1,050 | ) | 6,943 | |||||||
| (Increase) decrease in prepaid expenses and other assets |
(1,827 | ) | (369 | ) | 332 | |||||||
| Increase in aircraft maintenance deposits |
(29,765 | ) | (38,134 | ) | (33,609 | ) | ||||||
| Increase in aircraft lease deposits |
(89 | ) | (320 | ) | (765 | ) | ||||||
| Increase in restricted cash |
(6,350 | ) | (2,065 | ) | (3,387 | ) | ||||||
| (Increase) decrease in other non-current assets |
(31,621 | ) | (7,895 | ) | 1,091 | |||||||
| Increase in accounts payable |
7,911 | 586 | 816 | |||||||||
| Increase in air traffic liability |
11,589 | 22,372 | 12,654 | |||||||||
| Increase (decrease) in other current liabilities |
(372 | ) | 10,565 | (1,730 | ) | |||||||
| Increase (decrease) in other non-current liabilities |
(2,007 | ) | (8,538 | ) | (628 | ) | ||||||
|
|
|
|
|
|
|
|||||||
| Net cash provided by (used in) operating activities |
135,605 | 50,603 | (50,645 | ) | ||||||||
|
|
|
|
|
|
|
|||||||
| Cash flows from investing activities: |
||||||||||||
| Acquisition of property and equipment and intangible assets |
(41,775 | ) | (41,996 | ) | (7,978 | ) | ||||||
| Pre-delivery payments for flight equipment |
(13,385 | ) | — | (19,206 | ) | |||||||
|
|
|
|
|
|
|
|||||||
| Net cash used in investing activities |
(55,160 | ) | (41,996 | ) | (27,184 | ) | ||||||
|
|
|
|
|
|
|
|||||||
| Cash flows from financing activities: |
||||||||||||
| Net proceeds of equity issuance |
277,621 | 3 | 45 | |||||||||
| Proceeds of debt issuance and warrants from related party |
— | 75,000 | — | |||||||||
| Proceeds of term loan facility |
40,000 | — | — | |||||||||
| Debt issuance costs |
(401 | ) | — | — | ||||||||
| Payment of long-term debt and capital lease obligations |
(156,523 | ) | (3,969 | ) | (6,013 | ) | ||||||
| Share-based withholding tax payments |
(2,158 | ) | — | — | ||||||||
|
|
|
|
|
|
|
|||||||
| Net cash provided by (used in) financing activities |
158,539 | 71,034 | (5,968 | ) | ||||||||
|
|
|
|
|
|
|
|||||||
| Net increase (decrease) in cash and cash equivalents |
238,984 | 79,641 | (83,797 | ) | ||||||||
| Cash and cash equivalents, beginning of period |
155,659 | 76,018 | 159,815 | |||||||||
|
|
|
|
|
|
|
|||||||
| Cash and cash equivalents, end of period |
$ | 394,643 | $ | 155,659 | $ | 76,018 | ||||||
|
|
|
|
|
|
|
|||||||
| Supplemental disclosure: |
||||||||||||
| Cash paid during the period for: |
||||||||||||
| Interest |
$ | 16,118 | $ | 17,209 | $ | 12,383 | ||||||
| Income tax |
279 | 74 | 13 | |||||||||
| Non-cash transactions: |
||||||||||||
| Non-cash loan borrowings on pre-delivery payments for flight equipment |
11,778 | — | 35,117 | |||||||||
| Gain on debt restructuring |
— | 150,490 | — | |||||||||
| Fair value of warrant issuance |
— | 83,361 | — | |||||||||
| Non-cash effect of lease incentives |
(5,039 | ) | 30,137 | — | ||||||||
| Non-cash effect of 2014 Recapitalization |
521,485 | — | — | |||||||||
See accompanying notes to the consolidated financial statements
65
Table of Contents
Notes to the Consolidated Financial Statements
| (1) | Basis of Presentation |
Virgin America Inc. (the “Company”) manages its operations as a single business unit and only offers air transportation service. Accordingly, the Company concluded that it operates in one segment, air transportation service. The consolidated financial statements for the year ended December 31, 2013 include the accounts of the Company and its variable interest entity, VX Employee Holdings LLC, for which it was the primary beneficiary. See Note 10—Stockholders’ Equity for additional information. The consolidated financial statements were prepared in conformity with Generally Accepted Accounting Principles in the United States (“U.S. GAAP”). Certain prior year amounts have been reclassified to conform to current year presentation. These amounts were not material to any of the periods presented.
The preparation of financial statements in conformity with U.S. GAAP requires management to make estimates and assumptions that affect the amounts reported in the consolidated financial statements and accompanying notes. Actual results could differ from these estimates. On November 7, 2014, the Board of Directors approved a 1-for-7.5489352 reverse stock split of the Company’s outstanding common stock, which was effected on that date. The reverse stock split did not result in an adjustment to par value. The reverse stock split is reflected in the accompanying consolidated financial statements and related notes on a retroactive basis for all periods presented with respect to all share and per share amounts.
On November 18, 2014 the Company completed its initial public offering (“IPO”) in which it issued and sold 13,106,377 shares of common stock at a price to the public of $23.00 per share. In addition, VX Employee Holdings, LLC, a Virgin America employee stock ownership vehicle consolidated for financial reporting purposes (“Employee LLC”), sold 231,210 issued and outstanding shares as a selling stockholder. From the sale of 13,337,587 shares of common stock, the Company received net proceeds in the offering of approximately $277.6 million after deducting underwriting discounts and expenses of the IPO payable by the Company. The Company distributed gross proceeds of $5.3 million from the sale of Employee LLC shares to eligible teammates, which do not include officers. Immediately prior to the IPO, the Company completed the 2014 Recapitalization. Refer to Note 2—2014 Recapitalization for additional information.
For the consolidated financial statements as of December 31, 2014 and 2013 and for each of the three years in the period ended December 31, 2014, the Company evaluated subsequent events through March 2, 2015, the date the consolidated financial statements were available for issuance.
| (2) | 2014 Recapitalization |
In November 2014, concurrently with the pricing of the IPO, the Company entered into a recapitalization agreement with certain security-holders (which transactions are referred to herein as the “2014 Recapitalization”) to exchange or extinguish the majority of its then outstanding related-party debt and accrued interest (“Related-Party Notes”) and all of its convertible preferred stock and outstanding warrants (“Related-Party Warrants”).
66
Table of Contents
The following table summarizes the effect of the transactions related to the 2014 Recapitalization and the IPO (in thousands, except share numbers):
| Balance Pre- Recapitalization/IPO |
Balance Post- Recapitalization/IPO |
|||||||
| Long-term debt—current portion |
$ | 27,059 | $ | 27,059 | ||||
| Long-term debt—related parties (1) |
728,257 | 38,463 | ||||||
| Long-term debt |
58,012 | 58,012 | ||||||
|
|
|
|
|
|||||
| Total long-term debt |
813,328 | 123,534 | ||||||
| Convertible preferred stock |
21,406 | — | ||||||
| Common stock |
8 | 430 | ||||||
| Additional paid-in capital |
$ | 427,834 | $ | 1,282,108 | ||||
| Shares of common stock outstanding |
841,126 | 42,958,927 | ||||||
| Convertible preferred stock outstanding |
1,109,811 | — | ||||||
| Warrants to purchase shares of common stock |
42,242,601 | — | ||||||
| (1) | In connection with the 2014 Recapitalization, the Company extinguished or exchanged Related-Party Notes with recorded value of $728.3 million and contractual value of $684.8 million, which differed from the recorded value primarily due to the application of accounting guidance established for troubled debt restructurings arising from the 2013 Recapitalization. For more information, see Note 3—2013 Recapitalization. |
The table reflects the following transactions that occurred in connection with the 2014 Recapitalization:
| • | The repayment of $100.0 million of Related-Party Notes with amounts equal to the cash released from cash collateral held by the Company’s credit card processors in connection with the establishment of the a letter of credit facility arranged by an affiliate of Virgin Group Holdings Limited (the “Letter of Credit Facility”); |
| • | The issuance of a $50.0 million note (the “Post-IPO Note”) in exchange for the cancellation of $50.0 million of Related-Party Notes held by certain affiliates of Virgin Group Holdings Limited (collectively, the “Virgin Group”), recorded at the estimated fair value of $38.5 million, calculated using an effective interest rate of 8.5%, determined based on an estimated market rate for unsecured instruments with similar terms. The Post-IPO Note bears payment-in-kind interest at 5.0% per year, compounded annually, and is due in November 2022, or in November 2020 if the Company terminates the Letter of Credit Facility prior to its expiration; |
| • | The repayment of principal and accrued interest due under certain Related-Party Notes with $56.5 million of the net proceeds from the sale of shares by the Company in its IPO; |
| • | The exchange of the remaining outstanding Related-Party Notes for 22,159,070 shares of common stock. In the case of certain FNPA Notes or FNPA II Notes, 117% of the principal and accrued interest due under such notes were divided by the IPO price of $23.00, shifting ownership between Cyrus Capital and Virgin Group as this was a transaction between existing equity and debt holders; |
| • | The issuance of 5,742,543 shares of the Company’s common stock upon the exchange of Related-Party Warrants to purchase 26,067,475 shares of common stock and without receipt of cash consideration. The remaining Related-Party Warrants to purchase an aggregate of 16,175,126 shares of common stock were canceled in their entirety; |
| • | The conversion of each of 1,950,937 shares of convertible preferred stock and Class A, Class A-1, Class B, Class C and Class G common stock into shares of common stock on a one-to-one basis; |
| • | The fair value of the increase in the license fee recorded as a reduction in related-party debt and an increase in other long-term liabilities that was a part of the consideration to the Virgin Group for |
67
Table of Contents
| completing the 2014 Recapitalization. The fair value adjustment represents the present value of estimated license fee payments under the revised license agreement with the Virgin Group in excess of the estimated payments determined under the Company’s existing license agreement. In connection with the 2014 Recapitalization, the Company agreed to increase the license fee from 0.5% to 0.7% of total revenue commencing in the first quarter of 2016 until annual revenue exceeds $4.5 billion. The Company calculated the adjustment to be $34.1 million based on the present value of the additional cash flows of 0.2% of estimated total revenue over the estimated period required to reach the $4.5 billion cap using a discount rate of 10.5% based on airline specific weighted-average cost of capital; and |
| • | The presentation of the excess of the recorded amount of debt and preferred stock above the cash and other consideration to be received as additional paid-in capital. |
| (3) | 2013 Recapitalization |
In May 2013, after approval from the U.S. Department of Transportation, the Company executed a series of agreements with its two largest stockholders, funds affiliated with or related to Cyrus Capital Partners, L.P. (collectively, “Cyrus Capital”) and the Virgin Group to recapitalize the Company. Under the agreements, the stockholders agreed to modify and exchange a portion of the Company’s existing related-party debt, primarily accrued paid-in-kind interest on certain older debt and principal as well as accrued interest on all subordinated debt, and the Company issued an additional $75.0 of million new debt and certain warrants to purchase common stock. As a condition to this recapitalization, the Company also amended substantially all of its lease agreements with its existing aircraft lessor to reduce monthly base rent and/or maintenance reserve payments through monthly cash rent rebates. Under some of its leases, the Company also extended the lease terms by three to five years. See Note 9—Contingencies and Commitments for additional information.
A summary of the key terms of the 2013 Recapitalization is as follows:
| a) | The Company’s stockholders exchanged $556.0 million of related-party debt which previously had contractual interest rates of 15%-20% per year for $369.1 million of related-party debt at a lower interest rate of 5% per year (the “5% Notes”) and for warrants to purchase approximately 21.2 million shares of Class C common stock at an exercise price of $18.87 per share. |
| b) | The principal and accrued interest of approximately $131.5 million of related-party subordinated notes, along with the associated warrants, were exchanged for warrants to purchase approximately 1.0 million shares of Class C common stock at an exercise price of $0.08 per share; |
| c) | The Company issued $75.0 million aggregate principal amount of new debt pursuant to the Fifth Note Purchase Agreement (the “FNPA II”), which debt had a stated paid-in-kind annual interest rate of 17%, and also issued warrants to purchase approximately 1.0 million shares of Class C common stock at an exercise price of $18.87 per share. |
The Company evaluated the accounting for the modification of its related-party debt in accordance with the guidance established for troubled debt restructurings, which requires that the debtor must be experiencing financial difficulty and that the creditor must have granted a concession. The Company determined that it met both criteria. The Company was experiencing financial difficulty because of the unsustainable and growing amount of related-party debt, which was subject to annual compounding at interest rates of up to 20%. More specifically, the Company evaluated circumstances against a list of criteria specified in the accounting guidance and concluded that the definition of financial difficulty was met as (a) there was significant doubt as to the Company’s ability to continue as a going concern in 2014 absent a restructuring, (b) the Company’s projection of its entity-specific cash flows would be insufficient to service the debt without restructuring, (c) the Company would not be able to obtain funding from sources other than existing creditors at an effective interest rate equal to the current market interest rate for similar debt and (d) the Company’s lenders agreed to restructure the debt due to the Company’s financial difficulties and not solely to reflect any decrease in market interest rates. Further, the
68
Table of Contents
Company determined that its lenders had granted concessions by agreeing to forgive certain debt and reduce stated interest rates on remaining debt in exchange for Related-Party Warrants. This accounting analysis was performed separately for the Virgin Group and Cyrus Capital, who hold all of the related-party debt. The accounting guidance requires the Company to compare the recorded value of the modified and new debt on a per-creditor basis to its restructured undiscounted cash flows over the life of the loan, including cash flows associated with the remaining scheduled interest and principal payments. For the Virgin Group, the remaining value of the related-party debt after reduction for issuance of warrants, was adjusted to equal its undiscounted cash flows. As such, the Company effectively reduced the value of the modified and new debt to a level that results in an effective interest rate going forward of zero percent. The Company recognized a restructuring gain of $150.5 million as a capital contribution with a direct increase to additional paid-in capital. This gain amount represents the value necessary to adjust the debt to equal the remaining undiscounted cash flows of the restructured debt, and was recorded to equity due to the related-party nature of the creditor. For Cyrus Capital, the undiscounted cash flows exceeded the recorded value of the modified and debt, and as such, the modified and new debt will be accreted up to its maturity value using the effective interest rate inherent in the restructured cash flows. Warrants issued in connection with the debt restructuring were deemed to be freestanding instruments and were recorded at a fair value of $83.4 million on the date of issuance with a reduction to the carrying amount of the related-party debt value (prior to the application of the undiscounted cash flow test described above) and a corresponding decrease to stockholders’ deficit.
The Company utilizes third-party independent valuation reports to assist the Board of Directors with the valuation of Related-Party Warrants, which incorporate a calculation of enterprise value on the Company’s projected future earnings using a discounted cash flow analysis and deducting from the enterprise value the present value of the existing capital structure, debt and other obligations. Related-Party Warrants issued in 2013 with exercise prices of $0.08 and $18.87 were determined to have a fair value of $8.38 per share and $3.40 per share, respectively, based on the Black Scholes option pricing model using the following key assumptions: expected term of 5.0 years, a common stock fair value of $8.45, a risk-free interest rate of 0.83%, no expected dividends and 70.0% estimated share price volatility.
The terms and conditions of an existing related-party note payable (the “FNPA”) were not affected by the 2013 Recapitalization.
The following table summarizes the 2013 Recapitalization and debt restructuring related activities on May 10, 2013 (in thousands):
| Instruments impacted by restructuring - Virgin Group |
Instruments impacted by restructuring - Cyrus Capital |
Related party instruments not impacted by restructuring - FNPA |
Third-party debt |
Total debt | ||||||||||||||||
| Balance pre-restructuring May 10, 2013 |
$ | 653,428 | $ | 34,128 | $ | 164,095 | $ | 39,462 | $ | 891,113 | ||||||||||
| New debt issuance (FNPA II) (1) |
38,059 | 38,059 | — | — | 76,118 | |||||||||||||||
| Issuance of warrants |
(77,880 | ) | (5,481 | ) | — | — | (83,361 | ) | ||||||||||||
| Gain on debt restructuring: |
||||||||||||||||||||
| Debt reduction (concession) (2) |
(230,295 | ) | (4,753 | ) | — | — | (235,048 | ) | ||||||||||||
| Reduction in future interest (2) |
79,805 | 4,753 | — | — | 84,558 | |||||||||||||||
|
|
|
|
|
|
|
|
|
|
|
|||||||||||
| Gain on debt restructuring |
(150,490 | ) | — | — | — | (150,490 | ) | |||||||||||||
|
|
|
|
|
|
|
|
|
|
|
|||||||||||
| Balance after restructuring May 10, 2013 (3) |
$ | 463,117 | $ | 66,706 | $ | 164,095 | $ | 39,462 | $ | 733,380 | ||||||||||
|
|
|
|
|
|
|
|
|
|
|
|||||||||||
| (1) | The debt balances of the Virgin Group and Cyrus Capital each include $0.6 million of interest accrued on the principal amount while the loan proceeds were held in escrow prior to completing the restructuring. |
69
Table of Contents
| (2) | The Virgin Group’s reduction was for principal and future interest, whereas Cyrus Capital’s reduction is for future interest only. |
| (3) | The balance of $463.1 million for the Virgin Group and $66.7 million for Cyrus Capital represents the carrying values of the related-party debt, which was recorded under the accounting guidance established for troubled debt restructurings. As such, the carrying amounts differed and exceeded the contractual obligation or redemption value of $382.8 million for the Virgin Group and $61.4 million for Cyrus Capital, by $80.3 million and $5.3 million respectively, which reflects the inclusion of certain future interest payments under the troubled debt restructuring accounting described above. |
The Company also amended its existing aircraft purchase agreement with Airbus in December 2012, reducing its commitment to purchase 60 A320 aircraft to 40 aircraft and deferring delivery dates to begin in 2015. Under the terms of the Company’s aircraft purchase agreement, the Company is committed to making pre-delivery payments at varying dates prior to delivery. Under the amended agreement, the Company obtained cancellation rights for 30 of the 40 remaining aircraft, which are exercisable in groups of five aircraft two years prior to the stated delivery periods in 2020 to 2022, subject to loss of deposits and credits as a cancellation fee.
| (4) | Summary of Significant Accounting Policies |
| (a) | Cash and Cash Equivalents |
Cash and cash equivalents consist of short-term, highly liquid investments with an original maturity date of three months or less when purchased. Cash equivalents primarily include money market funds and certificates of deposit.
| (b) | Restricted Cash |
Restricted cash primarily consists of cash collateral securing letters of credit for airport facility leases.
| (c) | Credit Card Holdbacks and Receivables |
Credit card holdbacks and receivables are amounts due from credit card processors associated with sales for future travel and are carried at cost. Under the terms of the Company’s credit card processing agreements, certain proceeds from advance ticket sales are held back to serve as collateral by the credit card processors, due to the Company’s credit and in part to cover any possible refunds or chargebacks that may occur. These holdbacks are short-term, as the travel for which they relate occurs within twelve months. Since November 2014, $100.0 million of this collateral has been satisfied by the Letter of Credit obtained from the Virgin Group on the Company’s behalf in connection with the 2014 Recapitalization. Refer to Note 2—2014 Recapitalization and Note 9—Contingencies and Commitments for further information.
| (d) | Fuel Derivative Financial Instruments |
The Company accounts for fuel derivative financial instruments at fair value and recognizes such instruments in the accompanying consolidated balance sheets in other current assets under prepaid expenses and other assets if the total net unsettled fair value balance is in a gain position, or other current liabilities if in a net loss position. For derivatives designated as cash flow hedges, changes in fair value of the derivative are reported in other comprehensive income and are subsequently reclassified into earnings within aircraft fuel expense when the hedged item affects earnings. For derivatives that are not designated as cash flow hedges, the Company records changes in the fair value of such derivative contracts within aircraft fuel expense in the accompanying statements of operations. These amounts include both realized gains and losses and mark to market adjustments of the fair value of derivative instruments not yet settled at the end of each period.
| (e) | Impairment of Long-Lived Assets |
The Company evaluates its long-lived assets used in operations for impairment when events and circumstances indicate that the undiscounted cash flows to be generated by that asset are less than the carrying
70
Table of Contents
amounts of the asset and may not be recoverable. Factors that would indicate potential impairment include, but are not limited to, significant decreases in the market value of the long-lived asset, a significant change in the long-lived asset’s physical condition and operating or cash flow losses associated with the use of the long-lived asset. If an asset is deemed to be impaired, an impairment loss is recorded for the excess of the asset book value in relation to its estimated fair value.
| (f) | Property and Equipment |
The Company records its property and equipment at cost less accumulated depreciation and amortization, and depreciates these assets on a straight-line basis to their estimated residual values over their estimated useful lives. Additions and modifications that enhance the operating performance of assets are capitalized. Leasehold improvements generally are amortized on a straight-line basis over the shorter of the estimated useful life of the improvement or the remaining term of the lease. The Company capitalizes certain costs related to the acquisition and development of computer software for internal use. These costs are amortized using the straight-line method over the estimated useful life of the software, generally one to three years. Software and licenses were $10.8 million and $9.5 million as of December 31, 2014 and 2013, respectively. Amortization expense associated with software and licenses were $4.3 million, $3.0 million, and $2.4 million in 2014, 2013 and 2012, respectively.
Estimated useful lives and residual values for property and equipment are as follows:
| Classification in accompanying consolidated balance sheets |
Estimated useful life | Residual value | ||||
| Aircraft and engine leasehold improvements |
Flight equipment | Lesser of useful life or lease term: 1-15 years |
0% | |||
| Building leasehold improvements |
Ground and other equipment | Lesser of 10 years or lease term |
0% | |||
| Software and licenses |
Ground and other equipment | 1-3 years | 0% | |||
| Computer and network equipment |
Ground and other equipment | 3-7 years | 0% | |||
| Office furniture and other equipment |
Ground and other equipment | 5-10 years | 0% |
| (g) | Capitalized Interest on Pre-Delivery Payments for Flight Equipment |
Interest attributable to funds used to finance the acquisition of new aircraft (i.e. pre-delivery payments) are capitalized as an additional cost of the related asset two years prior to the intended delivery date, when the Company estimates that the aircraft are being manufactured. Interest is capitalized at the Company’s weighted-average interest rate on long-term debt or, where applicable, the interest rate related to specific borrowings. Capitalization of interest ceases and expensing commences when the asset is ready for its intended use.
| (h) | Intangible Assets |
Intangible assets are comprised of domestic airport slots and operating rights in the accompanying consolidated balance sheets. The assets are recorded as indefinite-lived due to the Company’s ability to renew the slots on an unlimited basis, the expectation that the slots will contribute positive cash flows for an indefinite period of time, and the Company’s recent significant growth in certain slot-controlled airports. Due to the assignment of slots as indefinite-lived, the assets are not amortized but instead are tested for impairment annually or more frequently if events or changes in circumstances indicate impairment. The Company applies a fair-value-based impairment test to the carrying value of indefinite-lived intangible assets on an annual basis as of October 1, or more frequently if certain events or circumstances indicate that an impairment loss may have been incurred. The FASB standard “Testing Indefinite-Lived Intangible Assets for Impairment” gives companies the option to perform a qualitative assessment to determine whether it is more likely than not that an indefinite-lived intangible asset is impaired rather than calculating the fair value of the indefinite-lived intangible asset.
71
Table of Contents
The Company first utilizes a qualitative approach and analyzes various factors to determine if events and circumstances have affected the fair value of the goodwill and indefinite-lived intangible assets. Such triggering events may include significant changes to the Company’s network or capacity or other changes impacting slot utilization and valuation. If the Company determines it is more likely than not that the asset value may be impaired, the Company then uses the quantitative approach to assess the asset’s fair value and amount of impairment.
| (i) | Deferred Rent and Deferred Rent Credits |
Deferred rent and deferred rent credits are included in current and non-current other assets or liabilities in the accompanying consolidated balance sheets based on the timing of when amounts are due or will be recognized. Deferred rent represents the Company’s recognition of rent leveling under its operating leases on a straight-line basis over the lease term.
Deferred rent credits are primarily related to aircraft manufacturer incentives, deferred gains and losses on sale and leaseback transactions and aircraft lease incentives.
The Company receives manufacturer incentives on aircraft that are recognized as prepaid assets, with an offsetting deferred rent credit for leased aircraft. The prepaid asset is charged to expense as the credits are used and the deferred credit is recognized as a reduction in aircraft rent expense over the lease term. The Company also periodically receives certain manufacturer incentives in connection with the acquisition of aircraft and engines. These incentives are deferred until the aircraft and engines are delivered and then applied as a reduction of the cost of the related equipment.
Gains and losses on aircraft sale and leaseback transactions are deferred and amortized over the terms of the related leases as an adjustment to aircraft rent expense.
In connection with the 2013 Recapitalization, since the Company amended its aircraft leases and extended lease terms, a number of aircraft and engine major maintenance events that were previously estimated to occur after the original lease term are now expected to occur within the extended lease term. As a result, the Company recorded $28.7 million of lease incentives associated with previously expensed supplemental rent payments that are now expected to be recoverable by virtue of the lease term extensions. In 2014, the Company recorded an additional $6.5 million of lease incentives as a result of one lease term extension. These lease incentives were recorded as an increase to aircraft maintenance deposits and an increase to other liabilities in the Company’s consolidated balance sheet in 2013. The Company determined that a lease incentive resulted from the lease extension when the amount expected to be reimbursed in the future exceeds the amount of maintenance deposit currently on the balance sheet plus any future payments to be made through the date of the qualifying maintenance event. Any excess amount was recorded as an incentive to the extent there were supplemental rent payments made during the lease term that had previously been expensed. The Company calculated its lease incentives on a maintenance-event-by-maintenance-event basis, consistent with the manner in which supplemental rent payments are made to the lessors.
The Company also has several leases for aircraft that were used before they were leased by the Company. Upon the occurrence of a maintenance event, the lessor will fund the cost of maintenance events for the periods in use prior to the commencement of the Company’s lease for such aircraft. Consistent across all aircraft leases, the estimated value of the Company’s rights under the lease to receive reimbursement for these maintenance events is recorded as a lease incentive with an offsetting liability that is amortized as a reduction in aircraft rent over the term of the related leases.
| (j) | License Fee Liability |
In connection with the 2014 Recapitalization, the Company and certain entities affiliated with the Virgin Group entered into amended and restated license agreements related to the use of the Virgin name and brand,
72
Table of Contents
which provided for, among other things, an increase in the quarterly license fee that the Company pays to the Virgin Group from 0.5% to 0.7% of total revenue commencing in the first quarter of 2016 until annual revenue exceeds $4.5 billion. The Company recorded the fair value of the increase in the license fee of $34.1 million as a component of equity with an offsetting increase in other long-term liabilities as it constituted part of the consideration to the Virgin Group for completing the 2014 Recapitalization. The Company estimated the incremental license fee obligation based on the present value of the additional cash flows of 0.2% of estimated total revenue over the estimated period required to reach the $4.5 billion threshold, using a discount rate based on airline specific weighted-average cost of capital, factoring in a judgmental risk spread based on a variety of cash flow estimates. The Company will commence amortizing this liability as an offset to the increase in license fees starting the first quarter of 2016, when such increase begins.
| (k) | Revenue Recognition |
The Company generates the majority of its revenue from sales of passenger tickets. The Company initially defers ticket sales as air traffic liability and recognizes passenger revenue when the passenger flight occurs. Passenger revenue also includes upgrade fees, which are recognized when the related flights occur.
Tickets expire one year from the date of issuance, if unused by the passenger. Travel credits are also issued to passengers for certain changes to flights if a residual value exists after application of any applicable change fee. Travel credits also expire one year from the date of issuance. The Company estimates and records advanced breakage for tickets and travel credits that it expects will expire unused. These estimates are based upon the Company’s historical experience of expired tickets and travel credits and consider other facts, such as recent aging trends, program changes and modifications that could affect the ultimate expiration patterns of tickets and travel credits.
Other revenue consists of baggage fees, change fees, seat selection fees, passenger-related service fees, and inflight meals and entertainment. The Company recognizes revenue for baggage fee, seat selection fee, and passenger-related service fees when the associated flight occurs. Change fee revenues are recognized as they occur.
The Company is also required to collect certain taxes and fees from passengers on behalf of government agencies and remit these to the applicable agency on a periodic basis. These taxes and fees include U.S. federal transportation taxes, federal security charges and airport passenger facility charges. These taxes and fees are collected from passengers when they purchase a ticket, but are not included in passenger revenue. The Company records a liability upon collection and relieves the liability when payments are remitted to the applicable government agency.
The Company’s Elevate® loyalty program provides frequent flyer travel awards to program members based upon accumulated points. Points are accumulated as a result of travel, purchases using the co-branded credit card and purchases from other participating partners. The program has an 18-month expiration period for unused points from the month of last account activity. For all points earned under the Elevate program, the Company has an obligation to provide future travel when these reward points are redeemed. With respect to points earned as a result of travel, or flown points, the Company recognizes a liability and a corresponding sales and marketing expense, representing the incremental cost associated with the obligation to provide travel in the future, as points are earned by passengers. The Company offers redemption of points for Elevate program members through travel on its own flights and its partner airlines. Incremental cost for points to be redeemed on flights is estimated based upon historical costs, which include the cost of fuel, passenger fees, complimentary beverages, insurance, miscellaneous passenger supplies and other airline payments. The Company adjusts its liability periodically for changes in estimates of incremental cost, average points to redeem and breakage estimates.
The Company accounts for member points sold to partners, or sold points, including points related to participation in other providers’ affinity loyalty programs and member purchases with partner credit card
73
Table of Contents
companies as multiple-element arrangements. These arrangements have historically consisted of two elements: transportation and brand marketing-related activities. The transportation element represents the fair value of the travel that the Company will ultimately provide when the sold points are redeemed. The brand and marketing element consists of brand marketing related activities conducted with participating partners. For points earned from purchases through the original co-branded credit card agreement (“Original Co-Branded Agreement’), the Company recorded deferred revenue using the residual method. The fair value of a point is estimated using the average points redeemed and the estimated value of purchased tickets. The Company recognizes points redeemed as passenger revenue when the awards are redeemed and the related travel occurs. The Company recognizes the residual portion, if any, upon sale of points as other revenue associated with the other marketing services delivered.
In 2013, the Company entered into a new co-branded credit card agreement with a new partner (“New Co-Branded Agreement”). The New Co-Branded Agreement has a seven-year term beginning January 1, 2014, when the new co-branded card was introduced and services to members began. Services with standalone value provided under this agreement include: (i) points (i.e. the travel component); (ii) advertising; (iii) companion certificates for annual travel discounts up to $150; (iv) unlimited access to the use of the Company’s brand and customer list; (v) waived bag fees, which are limited to the first checked bag for the cardholder and its companion traveling on the same flight purchased using the card; (vi) unlimited waived change fees provided the ticket is purchased using the premium card; and (vii) unlimited discounts on purchases made through the Company’s Red® inflight entertainment system using the co-branded credit card. Under the New Co-Branded Agreement, the credit card partner is required to provide annual guaranteed advance payments over the contract term. Any unearned advance at the end of the calendar year is carried over to the following year until the contract expires. At the end of the contract, the Company has no obligation to refund any unearned advances to the partner. As of December 31, 2014 and 2013 excess advances totaled $8.5 million and $10.0 million, which the Company recorded as air traffic liability.
Under the revenue recognition rules for multiple element arrangements, the Company determines best estimated selling price (“BESP”) of each element and allocates the arrangement consideration using the relative selling price of each element. Based upon the preliminary valuation of the New Co-Branded Agreement, the majority of the value is attributable to points i.e. the travel component, advertising, brand and customer list, for which the BESP is determined using management and market assumptions, as well as other judgments necessary to determine the estimated selling price of each element. When developing the relative selling price allocation attributable to the points i.e. travel component, the Company primarily considered the total number of points expected to be issued, the BESP for points (specifically the value at which points could be redeemed for free or discounted travel), the number of points expected to be redeemed and the timing of redemptions. The BESP for points is derived based upon management estimate of the redemption rate used by its guests to convert points into the equivalent ticket value for travel on either Virgin, or one of its airline partners. This estimate also considered anticipated point devaluation and discounting factors driven by redemption timing. For advertising, brand and customer list, the Company considered advertising activities, brand power, the size of the Company’s customer list as well as the market royalty rate for equivalent programs. Management estimates of the BESP will not change, but the allocation between elements may change based upon changes in the ultimate volume of sales of each element during the term of the contract. The Company recognizes and records revenue for the majority of the travel related elements in accordance with its existing policies for such services. Revenue for brand and advertising are recognized in other revenue as such services are provided ratably over the contract term. Revenue from making available unlimited services such as waived bag fees, waived change fees and inflight discounts are recognized in other revenue on a ratable basis over the contract term subject to a contract limitation based upon the proportion of cumulative points issued to total contract points expected to be issued.
The Company estimates breakage for sold points using a regression analysis model supplemented with qualitative considerations, which include the history and success of the program, as well as member behavior. In addition, the Company also considers redemption trends by performing a weighted-average redemption rate calculation to evaluate the reasonableness of the calculated breakage rates. Breakage is recorded for sold points
74
Table of Contents
under the redemption method using points expected to be redeemed and the recorded deferred revenue balance to determine a weighted-average rate, which is then applied to actual points redeemed. A change in assumptions as to the period over which points are expected to be redeemed, the actual redemption patterns or the estimated fair value of points expected to be redeemed could have a material impact on revenue in the year in which the change occurs as well as in future years. Management estimates could change in the future as Elevate members’ behavior changes and more historical data is collected. For the New Co-Branded Credit Card Agreement, the Company estimates breakage based on the rate used in the last year of the previous credit card agreement until more data becomes available, at which point the rate will be updated based on analysis tailored specifically to the new program. Breakage estimates associated with the Original Co-Branded Agreement may also change as not all cardholders are transitioning to the new co-branded card.
| (l) | Airframe and Engine Maintenance and Repair |
The Company accounts for qualifying major engine maintenance under the deferral method wherein overhaul costs and replacement of engine limited life parts are capitalized and amortized as a component of depreciation and amortization expense up to the earlier of lease end or the estimated date for the next engine overhaul. The Company has an engine services agreement with a third-party vendor covering major maintenance for nearly all engines. Under the terms of the agreement, the Company pays a set dollar amount per engine hour flown at the time the engine repair occurs and a smaller amount per engine hour flown monthly in arrears. As of December 31, 2014, no major engine maintenance costs had been capitalized due to the young age of the Company’s fleet. Regular airframe and other routine maintenance are expensed as incurred.
The Company has a separate maintenance-cost-per-hour contract for management and repair of certain rotable parts to support airframe and engine maintenance and repair. This agreement requires monthly payments based upon utilization, such as flight hours, cycles and age of the aircraft, and in turn, the agreement transfers certain risks to the third-party service provider. Expense is recognized based on the contractual payments, as these substantially match the services being received over the contract period.
| (m) | Aircraft Maintenance Deposits |
The Company is contractually required to make supplemental rent payments to aircraft lessors, which represent maintenance reserves made solely to collateralize the lessor for future maintenance events. Under most leases, the lease agreements provide that maintenance reserves are reimbursable upon completion of the major maintenance event in an amount equal to the lesser of (i) the amount of the maintenance reserve held by the lessor associated with the specific major maintenance event or (ii) the qualifying costs related to the specific major maintenance event.
The supplemental payments that are expected to be recovered from lessors are recorded as aircraft maintenance deposits in the accompanying consolidated balance sheets. When it is not probable that amounts on deposit with lessors will be recovered, such amounts are expensed as a component of aircraft rent expense. When the underlying maintenance event is performed, the cost is either capitalized for engines or expensed for all other major maintenance and the deposit is reclassified to other receivables in the accompanying consolidated balance sheets.
The terms of the Company’s aircraft lease agreements also provide that most unused maintenance reserves held by the lessor which relate to major maintenance events that fall outside of the lease term are nonrefundable at the expiration of the lease and will be retained by the lessor. The Company charges supplemental rent payments to aircraft rent expense in the accompanying consolidated statements of operations when it becomes less than probable that amounts will be recovered.
The Company makes certain assumptions at the inception of the lease and at each balance sheet date to determine the recoverability of maintenance deposits. These assumptions are based on various factors such as the
75
Table of Contents
estimated time between the maintenance events, the cost of future maintenance events and the number of flight hours the aircraft is estimated to be utilized before it is returned to the lessor. Changes in estimates related to maintenance reserve payments are accounted for on a prospective basis.
| (n) | Advertising |
The Company expenses advertising and the production costs of advertising as incurred. Advertising and marketing expense was $37.4 million, $38.6 million and $42.9 million for the years ended December 31, 2014, 2013 and 2012, respectively.
| (o) | Share-Based Compensation |
Share-based compensation expense for stock options and restricted stock units is measured at fair value on the date of grant. Prior to the IPO, the Company utilized third-party independent valuation reports to assist with valuation of options and restricted stock units and used the Black-Scholes option pricing model for service condition grants. For restricted stock grants issued at the time of IPO and going forward, the Company’s valuation of such stock grants will be based on the market price on grant date. The Company recognizes share-based compensation expense net of estimated forfeitures. The Company estimates its forfeiture rate based on historical activity. Share-based compensation expense is recognized over the requisite service period on a straight line basis for each separately vesting tranche of the award, including awards subject to graded vesting.
Prior to the IPO, the Company granted options and restricted stock units with performance and market-based conditions in addition to service requirements to employees and directors. With respect to certain stock awards, the performance conditions restrict exercisability or settlement until certain liquidity events occur, such as a qualifying IPO or change in control. At IPO, the performance condition was met and deferred stock compensation expense was recognized for grants that had also met service requirements. The market conditions further restrict such exercisability or settlement upon achieving certain targeted minimum market prices of the Company’s publicly traded common stock. For those awards that vest over a fixed service period, if they do not become exercisable before an employee’s termination, they are forfeited to the extent unvested.
| (p) | Income Taxes |
Income taxes are accounted for under the asset and liability method. Deferred tax assets and liabilities are recognized for the future tax consequences attributable to differences among the financial statements, carrying amounts of existing assets and liabilities and their respective tax bases and operating loss and tax credit carryforwards. Deferred tax assets and liabilities are measured using enacted tax rates expected to be applied to taxable income in the years in which those temporary differences are expected to be settled. The effect on deferred tax assets and liabilities of a change in tax rates is recognized in income in the period that includes the enactment date.
Except as noted below, the Company provides a valuation allowance for net deferred tax assets when it is more likely than not that some portion, or all of its deferred tax assets, will not be realized. In determining the amount of valuation allowance necessary, a deferred tax liability related to indefinite-lived assets cannot be used as a source of taxable income to support the realization of deferred tax assets. The realization of deferred tax assets is dependent on future taxable income, including reversals of deferred tax liabilities, during the periods in which those temporary differences will become deductible. Future taxable income is dependent on the Company’s financial performance, the market environment in which the Company operates, the utilization of past tax credits and the length of relevant carryback and carryforward periods.
| (q) | Concentrations of Risk |
The Company’s credit card holdbacks and receivables are concentrated to a few companies. These receivables do not represent a significant concentration of risk at December 31, 2014 due to the frequency with which settlement of the holdbacks takes place.
76
Table of Contents
Fuel derivative instruments expose the Company to credit loss in the event of non-performance by counterparties to the agreements. The amount of such credit exposure is generally limited to the positive fair value of the Company’s outstanding contracts. To manage credit risk, the Company selects counterparties based on credit assessments, limits exposure to a single counterparty by transacting with multiple large, well-known financial institutions and monitors market position relative to each counterparty. Some of the agreements require cash deposits to be placed at another institution if the counterparty credit rating drops below a specified threshold. Such provisions did not affect the Company’s financial position as of December 31, 2014
| (r) | New Accounting Standards or Updates Recently Adopted |
In August 2014, the FASB issued an accounting standards update to require evaluation of whether there are conditions and events that raise substantial doubt about an entity’s ability to continue as a going concern within one year after its financial statements are issued (or available to be issued when applicable) and, if so, disclosure of that fact. The standard requires the Company to make this evaluation for both annual and interim reporting periods, if applicable, and disclose whether its plans alleviate that doubt. The standard is effective for annual periods ending after December 15, 2016 and interim periods within annual periods beginning after December 15, 2016. The Company does not expect this accounting standards update to have an impact on its consolidated financial statements.
In June 2014, the FASB issued an accounting standards update that provides guidance on accounting for share-based compensation when the terms of an award provide that a performance target could be achieved after the requisite service period. The standard provides guidance that this performance target should not be included in the estimate of the award’s grant date fair value. The standard requires compensation cost to be recognized over the required service period if it is probable that the service condition will be achieved. This guidance will be effective for fiscal years and interim periods within those fiscal years beginning after December 15, 2015 and can be applied either prospectively or retrospectively to all awards outstanding as of the beginning of the earliest annual period presented as an adjustment to opening retained earnings. Early adoption is permitted. The Company does not expect this accounting standards update to have a material impact on the consolidated financial statements.
In May 2014, the FASB and IASB jointly issued a comprehensive new revenue recognition standard that will replace most existing revenue recognition standards under U.S. GAAP and IFRS. The new standard will require the Company to recognize revenue when goods or services are transferred to customers in an amount that reflects the consideration to which it expects to be entitled in exchange for those goods or services. As a result, the Company will need to use more judgments and estimates to determine when and how revenue is recognized than U.S. GAAP currently requires. The new standard will become effective for the Company on January 1, 2017. The Company believes the most significant effect of this accounting standards update will be the elimination of the incremental cost method for frequent flyer accounting, which would require the Company to re-value its liability earned by customers associated with flights points with a relative fair value approach. The Company is continuing to evaluate the new guidance and plans to provide additional information about its expected financial effect at a future date.
In July 2013, the FASB issued an accounting standards update that provides guidance on the financial statement presentation of unrecognized tax benefits when a net operating loss carryforward (NOL) or a tax credit carryforward exists. Under the new standard update, unrecognized tax benefits related to NOLs or tax credit carryforwards are to be presented in the financial statements as a reduction to a deferred tax asset. This accounting standard update became effective for the Company as of January 1, 2014. The adoption of the accounting standard update did not have a material impact on the Company’s consolidated financial statements.
77
Table of Contents
| (5) | Balance Sheet Components |
Following are components of current and non-current other assets and liabilities in the accompanying consolidated balance sheets (in thousands):
Prepaid expenses and other assets:
| December 31, | ||||||||
| 2014 | 2013 | |||||||
| Prepaid expenses and other assets |
$ | 20,473 | $ | 10,896 | ||||
| Aircraft maintenance deposits—current portion |
401 | 12,473 | ||||||
|
|
|
|
|
|||||
| $ | 20,874 | $ | 23,369 | |||||
|
|
|
|
|
|||||
See Note 4—Summary of Significant Accounting Policies for additional information about aircraft maintenance deposits.
Other non-current assets:
| December 31, | ||||||||
| 2014 | 2013 | |||||||
| Deferred rent asset |
$ | 57,063 | $ | 24,634 | ||||
| Intangible assets |
49,000 | 27,000 | ||||||
| Other |
6,216 | 7,386 | ||||||
|
|
|
|
|
|||||
| $ | 112,279 | $ | 59,020 | |||||
|
|
|
|
|
|||||
The Company’s intangible assets consist of take-off and landing slots at LaGuardia Airport (LGA) and Ronald Reagan Washington National Airport (DCA) acquired in 2013 and in 2014, which are accounted for as indefinite lived assets. See Note 4—Summary of Significant Accounting Policies, for additional information about Intangible Assets.
Other current liabilities:
| December 31, | ||||||||
| 2014 | 2013 | |||||||
| Accrued salaries, wages and benefits |
$ | 36,101 | $ | 21,292 | ||||
| Fuel hedge payable, net |
12,730 | — | ||||||
| Accrued taxes and fees for passenger travel |
12,510 | 13,057 | ||||||
| Accrued property taxes |
9,797 | 10,779 | ||||||
| Other |
29,585 | 28,624 | ||||||
|
|
|
|
|
|||||
| $ | 100,723 | $ | 73,752 | |||||
|
|
|
|
|
|||||
Fuel hedge payable is net of $14.4 million in margin calls deposited with the Company’s counterparties. See Note 7—Financial Derivative Instruments and Risk Management for more information.
78
Table of Contents
Other liabilities, non-current:
| December 31, | ||||||||
| 2014 | 2013 | |||||||
| Deferred rent credits |
$ | 57,036 | $ | 57,672 | ||||
| License fee liability |
34,102 | — | ||||||
| Other |
15,674 | 1,875 | ||||||
|
|
|
|
|
|||||
| $ | 106,812 | $ | 59,547 | |||||
|
|
|
|
|
|||||
See Note 4—Summary of Significant Accounting Policies for additional information about deferred rent credits associated with lease incentives.
License fee liability represents the increased Virgin Group license fee payment accrual in connection with the 2014 Recapitalization. See Note 4—Summary of Significant Accounting Policies for additional information.
| (6) | Fair Value |
Fair value is defined as the price that would be received from selling an asset or paid to transfer a liability in an orderly transaction between market participants at the measurement date. When determining fair value for assets and liabilities, the Company considers the principal or most advantageous market in which it would transact, and it also considers assumptions that market participants would use when pricing the asset or liability. The accounting guidance establishes a fair value hierarchy based upon the level of independent, objective evidence available to support the inputs used to measure fair value. A financial instrument’s categorization within the fair value hierarchy is based upon the lowest level of input that is significant to the fair value measurement. As a basis for considering such assumptions, the fair value hierarchy is as follows:
| Level 1 |
Observable inputs such as quoted prices in active markets for identical assets or liabilities. | |
| Level 2 |
Observable inputs other than Level 1 prices such as quoted prices in active markets for similar assets and liabilities; quoted prices in markets that are not active; or other inputs that are observable or can be corroborated by observable market data for substantially the full term for the assets or liabilities. | |
| Level 3 |
Unobservable inputs in which there is little or no market data and that are significant to the fair value of the assets or liabilities. | |
79
Table of Contents
The following is a listing of the Company’s assets and liabilities required to be measured at fair value on a recurring basis and where they are classified within the fair value hierarchy as of December 31, 2014 and 2013 respectively (in thousands):
| December 31, 2014 | ||||||||||||||||
| Level 1 | Level 2 | Level 3 | Total | |||||||||||||
| Assets (Liability) |
||||||||||||||||
| Cash equivalents |
$ | 339,211 | $ | — | $ | — | $ | 339,211 | ||||||||
| Restricted cash |
18,775 | — | — | 18,775 | ||||||||||||
| Heating oil collars fuel derivative instruments liability |
— | (27,170 | ) | — | (27,170 | ) | ||||||||||
| Brent calls derivative instrument asset, net |
— | 50 | — | 50 | ||||||||||||
|
|
|
|
|
|
|
|
|
|||||||||
| $ | 357,986 | $ | (27,120 | ) | $ | — | $ | 330,866 | ||||||||
|
|
|
|
|
|
|
|
|
|||||||||
| December 31, 2013 | ||||||||||||||||
| Level 1 | Level 2 | Level 3 | Total | |||||||||||||
| Assets |
||||||||||||||||
| Cash equivalents |
$ | 45,005 | $ | — | $ | — | $ | 45,005 | ||||||||
| Restricted cash |
12,425 | — | — | 12,425 | ||||||||||||
| Heating oil collars fuel derivative instruments asset, net |
— | 811 | — | 811 | ||||||||||||
| Brent calls derivative instrument asset, net |
— | 1,609 | — | 1,609 | ||||||||||||
|
|
|
|
|
|
|
|
|
|||||||||
| $ | 57,430 | $ | 2,420 | $ | — | $ | 59,850 | |||||||||
|
|
|
|
|
|
|
|
|
|||||||||
Cash and cash equivalents include money market securities or operating cash held off-shore that are considered to be highly liquid and easily tradable. These securities are valued using inputs observable in active markets for identical securities and are therefore classified as Level 1 within the fair value hierarchy. The Company maintains cash and cash equivalents with various high-quality financial institutions.
The Company’s fuel derivative instruments are privately negotiated contracts and are not traded on public exchanges. The Company’s derivative instruments are primarily classified as Level 2, as they are not actively traded and are valued using pricing models that use observable market inputs. Inputs to the valuation models include contractual terms, market prices, yield curves, fuel price curves and measures of volatility.
The Company utilizes third-party independent valuation reports to assist with valuation of related-party warrants and related debt balances, which incorporate a calculation of enterprise value on the Company’s projected future earnings using a discounted cash flow analysis and deducting from the enterprise value the present value of the existing capital structure, debt and other obligations. Related-party warrants issued solely as equity transactions prior to the 2013 Recapitalization were recorded in additional paid-in capital in the accompanying consolidated balance sheets. Related-party warrants issued in connection with debt and in connection with the 2013 Recapitalization were recorded as a reduction of the related debt in the accompanying consolidated balance sheets, with an offset to stockholders’ equity. Since significant unobservable inputs are used in determining fair value, warrants are categorized as Level 3 in the fair value hierarchy. See Note 10—Stockholders’ Equity for additional information.
A significant portion of the Company’s debt is privately negotiated with related parties. The estimated fair value of related-party debt was $38.8 million and $621.0 million at December 31, 2014 and 2013, respectively. The estimated fair value of the non-related party debt includes financing associated with aircraft pre-delivery payments of $51.2 million and $39.4 million at December 31, 2014 and 2013, respectively, and a $40.0 million financing of airport slots. The Company uses significant unobservable inputs in determining discounted cash flows to estimate the fair value, and therefore, such amounts are categorized as Level 3 in the fair value hierarchy.
80
Table of Contents
| (7) | Financial Derivative Instruments and Risk Management |
The Company’s results of operations are inherently dependent on the cost of aircraft fuel, which is the Company’s single largest expense. Aircraft fuel prices have significant exposure to price volatility and fluctuate based upon market expectations such as demand and supply as well as other economic factors. Increases in aircraft fuel prices may adversely impact the Company’s financial performance, operating cash flow and financial position as a greater amount of cash may be needed in order to obtain aircraft fuel for operation. Since aircraft fuel is not widely traded on an organized futures exchange, the Company purchases futures contracts on commodities that are highly correlated to aircraft fuel prices. The Company’s fuel risk management strategy is to reduce fuel price volatility while managing the Company’s cash and margin exposure. The Company does not purchase or hold any derivatives financial instruments for trading purposes. To manage economic risks associated with the fluctuations of aircraft fuel prices, since 2012, the Company has hedged a targeted percentage of its forecasted fuel requirements over the following 12 months with a rolling strategy of entering into call options for crude oil and collar contracts for heating oil in the longer term, three to 12 months before the expected fuel purchase date; then prior to maturity of these contracts, within three months of the fuel purchase, the Company exits these contracts by entering into offsetting trades and locks in the price of a percentage of its fuel requirements through the purchase of fixed forward pricing (FFP) contracts in jet fuel. In 2015, the Company will utilize forward swaps on jet fuel, heating oil and crude oil to lock in future fuel purchase prices.
The Company utilizes FFP contracts with its fuel service provider as part of its risk management strategy, wherein fixed prices are negotiated for set volumes of future purchases of fuel. The Company takes physical delivery of the future purchases. The Company has applied the normal purchase and normal sales exception for these commitments. As of December 31, 2014, the total commitment related to FFP contracts was $14.1 million, for which the related fuel will be purchased during 2015. The Company designates the majority of its fuel hedge derivatives contracts as cash flow hedges under the applicable accounting standard, if they qualify for hedge accounting. The accounting standard governing designation of hedges involves stringent documentation requirements, including documentation of hedging strategy, statistical analysis to qualify a commodity for hedge accounting both on a historical and a prospective basis and strict contemporaneous documentation that is required at the time each hedge is designated. The Company assesses the effectiveness of each of its individual hedges on a monthly basis. Under hedge accounting, all periodic changes in the fair value of the derivatives designated as effective hedges are recorded in accumulated other comprehensive income (loss) (AOCI) until the underlying fuel is purchased, at which point the deferred gain or loss will be recorded as fuel expense. This treatment of fuel hedge derivatives exposes the Company to the risk that its hedges may not be effective in offsetting changes in the cost of fuel and therefore may not continue to qualify under hedge accounting. Hedge ineffectiveness results when the change in fair value of the derivative instruments exceeds the change in the value of the Company’s expected future cash outflow relating to fuel purchases and consumption. In the event that the Company’s fuel hedge derivatives do not qualify as effective hedges, the periodic changes in fair value of the derivatives are included in fuel expense in the period they occur. If the Company terminates a fuel hedge derivative contract prior to its settlement date, the cumulative gain or loss recognized in AOCI at the termination date will remain in AOCI until the terminated intended transaction occurs. In the event it becomes improbable that such event will occur, the cumulative gain or loss is immediately reclassified into earnings. All cash flows associated with purchasing and settling of fuel hedge derivatives are classified as operating cash flows in the accompanying consolidated statements of cash flows.
81
Table of Contents
The following tables present the fair value of derivative assets and liabilities that are designated and not designated as hedging instruments, as well as the location of the asset and liability balances within the consolidated balance sheets as of December 31, 2014 and 2013 (in thousands):
| Derivatives designated as cash flow hedges |
Consolidated |
Fair value of derivatives as of December 31, |
||||||||
| 2014 | 2013 | |||||||||
| Fuel derivative instruments—Heating oil collars |
Current assets | $ | — | $ | 769 | |||||
| Current liabilities | (24,762 | ) | — | |||||||
| Fuel derivative instruments—Brent calls |
Current assets | — | 1,424 | |||||||
| Current liabilities | (84 | ) | — | |||||||
|
|
|
|
|
|||||||
| Total current assets (liabilities) |
$ | (24,846 | ) | $ | 2,193 | |||||
|
|
|
|
|
|||||||
| Derivatives not designated as cash flow hedges |
Consolidated |
Fair value of derivatives as of December 31, |
||||||||
| 2014 | 2013 | |||||||||
| Fuel derivative instruments—Heating oil collars |
Current assets | $ | — | $ | 42 | |||||
| Current liabilities | (2,408 | ) | — | |||||||
| Fuel derivative instruments—Brent calls |
Current assets | — | 185 | |||||||
| Current liabilities | 134 | — | ||||||||
|
|
|
|
|
|||||||
| Total current assets (liabilities) |
$ | (2,274 | ) | $ | 227 | |||||
|
|
|
|
|
|||||||
As of December 31, 2014, the Company has deposited $14.4 million as collateral with two of its counterparties to comply with margin call requirements related to derivative losses that exceed the portfolio’s credit limit. The Company has recorded the margin call deposits in other current liabilities in the accompanying consolidated balance sheet as of December 31, 2014, offsetting the net hedge liability of $27.1 million. Thus the total net current liability related to hedges is $12.7 million at December 31, 2014.
The following table summarizes the effect of fuel derivative instruments in the consolidated statements of operations for the years ended December 31, 2014, 2013 and 2012, respectively (in thousands):
| Derivatives accounted for as hedging |
Consolidated |
Gains (losses) on derivative contracts for the year ended December 31, |
||||||||||||
| 2014 | 2013 | 2012 | ||||||||||||
| Fuel derivative instruments |
Aircraft fuel expense | $ | (5,759 | ) | $ | (2,597 | ) | $ | (3,473 | ) | ||||
|
|
|
|
|
|
|
|||||||||
| Total impact to the consolidated statements of operations |
$ | (5,759 | ) | $ | (2,597 | ) | $ | (3,473 | ) | |||||
|
|
|
|
|
|
|
|||||||||
| Derivatives not accounted for as hedging |
Consolidated |
Gains (losses) on derivative contracts for the year ended December 31, |
||||||||||||
| 2014 | 2013 | 2012 | ||||||||||||
| Fuel derivative instruments |
Aircraft fuel expense | $ | (4,808 | ) | $ | (1,849 | ) | $ | (261 | ) | ||||
|
|
|
|
|
|
|
|||||||||
| Total impact to the consolidated statements of operations |
$ | (4,808 | ) | $ | (1,849 | ) | $ | (261 | ) | |||||
|
|
|
|
|
|
|
|||||||||
Amounts excluded from the assessment of hedge effectiveness were not material for the fiscal periods presented. At December 31, 2014, the Company estimates that approximately $26.1 million net derivative losses related to its cash flow hedges included in accumulated other comprehensive income will be reclassified into earnings within the next 12 months.
82
Table of Contents
The effect of fuel derivative instruments designated as cash flow hedges and the underlying hedged items on the consolidated statements of operations for the years ended December 31, 2014 and 2013, respectively, is summarized as follows (in thousands):
| Fuel derivatives designated as cash flow hedges |
Amount of gain (loss) recognized in AOCI on derivatives (Effective portion) |
Gain (loss) reclassified from AOCI into income (Fuel expense) (Effective portion) |
Amount of gain (loss) recognized into income (Ineffective portion) |
|||||||||||||||||||||
| 2014 | 2013 | 2014 | 2013 | 2014 | 2013 | |||||||||||||||||||
| Fuel derivative instruments |
$ | (33,230 | ) | $ | 307 | $ | (5,468 | ) | $ | (2,557 | ) | $ | (291 | ) | $ | (40 | ) | |||||||
The notional amounts of the Company’s outstanding fuel derivatives are summarized as follows (gallons in millions):
| December 31, | ||||||||
| 2014 | 2013 | |||||||
| Derivatives designated as hedging instruments: |
||||||||
| Fuel derivative instruments—Heating oil collars |
36 | 23 | ||||||
| Fuel derivative instruments—Brent calls |
16 | 18 | ||||||
|
|
|
|
|
|||||
| 52 | 41 | |||||||
| Derivatives not designated as hedging instruments: |
||||||||
| Fuel derivative instruments—Heating oil collars |
3 | 1 | ||||||
| Fuel derivative instruments—Brent calls |
13 | 3 | ||||||
|
|
|
|
|
|||||
| 16 | 4 | |||||||
|
|
|
|
|
|||||
| Total |
68 | 45 | ||||||
|
|
|
|
|
|||||
As of December 31, 2014, the Company had entered into fuel derivative contracts for approximately 23% of its forecasted aircraft fuel requirements for 2015 at a weighted-average cost per gallon of $2.52.
The Company presents its fuel derivative instruments at net fair value in the accompanying consolidated balance sheets. The Company’s master netting arrangements with counterparties allow for net settlement under certain conditions. As of December 31, 2014 and 2013 information related to these offsetting arrangements was as follows (in thousands):
| December 31, 2014 | ||||||||||||||||||||||||
| Derivatives offset in consolidated balance sheet | Derivatives eligible for offsetting | |||||||||||||||||||||||
| Gross derivative amounts |
Gross derivative amounts offset in consolidated balance sheet |
Net amount | Gross derivative amounts |
Gross derivative amounts eligible for offsetting |
Net amount | |||||||||||||||||||
| Fair value of assets |
$ | 256 | $ | (256 | ) | $ | — | $ | 256 | $ | (256 | ) | $ | — | ||||||||||
| Fair value of liabilities |
(27,376 | ) | 256 | (27,120 | ) | (27,376 | ) | 256 | (27,120 | ) | ||||||||||||||
| Margin call deposits |
14,390 | 14,390 | ||||||||||||||||||||||
|
|
|
|
|
|||||||||||||||||||||
| Total |
$ | (12,730 | ) | $ | (12,730 | ) | ||||||||||||||||||
|
|
|
|
|
|||||||||||||||||||||
| December 31, 2013 | ||||||||||||||||||||||||
| Derivatives offset in consolidated balance sheet | Derivatives eligible for offsetting | |||||||||||||||||||||||
| Gross derivative amounts |
Gross derivative amounts offset in consolidated balance sheet |
Net amount | Gross derivative amounts |
Gross derivative amounts eligible for offsetting |
Net amount | |||||||||||||||||||
| Fair value of assets |
$ | 2,467 | $ | (47 | ) | $ | 2,420 | $ | 2,467 | $ | (47 | ) | $ | 2,420 | ||||||||||
| Fair value of liabilities |
(47 | ) | 47 | — | (47 | ) | 47 | — | ||||||||||||||||
83
Table of Contents
The fuel derivative agreements the Company has with its counterparties may require the Company to pay all, or a portion of, the outstanding loss positions related to these contracts in the form of a margin call prior to their scheduled maturities. The amount of collateral posted, if any, is adjusted based on the fair value of the fuel hedge derivatives. The Company had $14.4 million of collateral posted related to outstanding fuel hedge contracts at December 31, 2014, which is reflected in the 2014 table above.
| (8) | Long-Term Debt |
In May 2013, the Company executed a series of agreements with its investors to recapitalize the Company. See Note 3—2013 Recapitalization for additional information.
In November 2014, in connection with the IPO, the Company entered into the 2014 Recapitalization Agreement with certain security holders that provided for extinguishment of the principal and accrued but unpaid interest outstanding pursuant to the Related-Party Notes. See Note 2—2014 Recapitalization for additional information.
Long-term debt including accrued paid-in-kind interest consisted of the following at December 31, 2014 and 2013, respectively (in thousands):
| December 31, 2014 |
December 31, 2013 |
|||||||
| Related-party debt: |
||||||||
| Virgin Group (a) |
$ | 50,295 | $ | 463,117 | ||||
| Cyrus Capital (b) |
— | 71,013 | ||||||
| FNPA debt (c) |
— | 173,839 | ||||||
| Third-party debt: |
||||||||
| 5.2%—5.3% Pre–delivery payments loan (d) |
51,240 | 39,462 | ||||||
| Term loan credit facility (e) |
40,000 | — | ||||||
|
|
|
|
|
|||||
| Total debt |
141,535 | 747,431 | ||||||
| Less: current maturities (d) |
(33,824 | ) | — | |||||
| Less: discount on Virgin Group debt (a) |
(11,447 | ) | ||||||
|
|
|
|
|
|||||
| Long–term debt |
$ | 96,264 | $ | 747,431 | ||||
|
|
|
|
|
|||||
| (a) | The 2014 debt balance represents the recorded value and accrued interest of the $50.0 million Post-IPO Note issued in November 2014 as part of the 2014 Recapitalization. The fair value of the note of $38.5 million at the date of issuance was calculated using an effective interest rate of 8.5%. At December 31, 2014, the redemption value of this note was $50.3 million. The Post-IPO Note bears payment-in-kind interest at 5.0% per year, compounded annually, and is due on November 19, 2022, or on November 19, 2020 if the Company terminates the Letter of Credit Facility prior to its expiration. The Post-IPO Note may be redeemed at the option of the Company at any time in the amount equal to the then-outstanding principal of the Post-IPO Note, including accrued interest. Upon a change of control or a qualified sale, the holder of the Post-IPO Note can cause the Company to redeem all of the principal at the redemption price then in effect. The Post-IPO Note is currently unsecured, and the Company is restricted from incurring any future secured indebtedness related to the Company’s unencumbered assets unless the Post-IPO Note is secured on a pari passu basis with such debt. |
All of the related-party debt held by Virgin Group prior to the 2014 Recapitalization was extinguished in November 2014 in connection with the 2014 Recapitalization. Refer to Note 2—2014 Recapitalization for additional information. The difference between the redemption and the recorded value was recorded as an adjustment to APIC. See Note 2—2014 Recapitalization for additional information. The 2013 debt balance represents the Virgin Group’s portion of restructured debt (issued in the form of notes) accounted for in accordance with troubled debt restructuring accounting guidance. It was recorded at an effective interest rate of 0% and had redemption value of $398.6 million as of December 31, 2013. See Note 3—2013 Recapitalization for additional information.
84
Table of Contents
| (b) | Related-party debt payable to Cyrus Capital was extinguished in November 2014 in connection with the 2014 Recapitalization. Refer to Note 2—2014 Recapitalization for further discussion. |
The 2013 debt balance represents Cyrus Capital’s portion of restructured debt (issued in the form of notes) accounted for in accordance with troubled debt restructuring accounting guidance. It was recorded at an effective interest rate of 10% and had redemption value of $66.8 million as of December 31, 2013. See Note 3—2013 Recapitalization for additional information.
| (c) | All FNPA debt, which was held by Cyrus Capital, was extinguished in November 2014 in connection with the 2014 Recapitalization. See Note 2—2014 Recapitalization for additional information on debt extinguishment. |
The 2013 debt balance represents the recorded value of the FNPA notes held by Cyrus Capital. The FNPA notes were issued in December 2011, when the Company raised $150.0 million at a stated interest rate of 17%, of which 50% was paid quarterly and the rest was treated as payable in kind, compounded annually. At December 31, 2013, the redemption value of the notes was $177.5 million.
| (d) | In connection with the Company’s aircraft PDP obligations with Airbus, the Company has a credit agreement with lenders for the Company’s PDP commitments. Interest on borrowings under the credit agreement accrues monthly at a rate of 5% plus LIBOR. The PDP credit agreement is secured by the Company’s aircraft purchase rights under the Company’s purchase agreement with Airbus. The Company will repay advances and related interest allocable to each aircraft in full upon the delivery date of the individual aircraft, and upon repayment, the security for such aircraft’s purchase rights will be released. The current portion of the debt represents the PDP loan advances due with the delivery of the five aircraft in 2015. |
| (e) | In April 2014, the Company entered into a five-year term loan credit facility for $40.0 million to finance the purchase of domestic airport operating rights with principal repayable in full at maturity. The term loan credit facility is secured by certain of the Company’s take-off and landing rights at DCA, LGA and JFK. Amounts borrowed under this term loan accrue interest at a rate of LIBOR plus 3.5%, provided that LIBOR is not less than 1.0%, or a comparable alternative rate based on other interest rate indices. The term loan requires compliance with certain covenants including semi-annual, third-party slot appraisal valuation requirements. |
As of December 31, 2014, the Company is in compliance with all debt covenants.
| (9) | Contingencies and Commitments |
| (a) | Contingencies |
The Company is subject to legal proceedings, claims, investigations and proceedings arising in the ordinary course of business. While the outcome of these matters is currently not determinable, the Company does not expect that the ultimate costs to resolve these matters will have a material adverse effect on its consolidated financial position, results of operations, or cash flows.
The Company is party to routine contracts under which it indemnifies third parties for various risks. The Company has not accrued any liability for these indemnities, as the amounts are not determinable nor estimable.
In its aircraft related agreements, as is typical of commercial arrangements made in order to purchase, finance and operate commercial aircraft, the Company indemnifies the manufacturer, the financing parties and other related parties against liabilities that arise from the manufacture, design, ownership, financing, use, operation and maintenance of the aircraft for tort liability, whether or not these liabilities arise out of or relate to the negligence of these indemnified parties, except for their gross negligence or willful misconduct. The Company believes that it will be covered by insurance subject to deductibles for most tort liabilities and related indemnities as described above with respect to the aircraft the Company will operate. Additionally, if there is a change in the law that results in the imposition of any reserve, capital adequacy, special deposit or similar requirement the result of which is to increase the cost to the lender, the Company will pay the lender the additional amount necessary to compensate the lender for the actual cost increase. The Company cannot estimate the potential amount of future payments under the foregoing indemnities.
85
Table of Contents
| (b) | Commitments |
Pre-Delivery Payments for Flight Equipment
In December 2010, the Company entered into a purchase agreement with Airbus for 60 A320 aircraft, including 30 A320neo aircraft, the first commercial order for the new eco-efficient engine option. Under the terms of the Company’s aircraft purchase agreement, the Company is committed to making pre-delivery payments at varying dates prior to delivery.
In December 2012, the Company amended its 2010 aircraft purchase agreement with Airbus reducing its order of 60 A320 aircraft to 40 aircraft and deferring delivery dates to begin in 2015. Under the amended agreement, the Company also obtained cancellation rights for the last 30 of the 40 aircraft, which cancellation rights are exercisable in groups of five aircraft two years prior to the stated delivery periods in 2020 to 2022, subject to loss of deposits and credits as a cancellation fee. All of the deposits have been reapplied according to the new delivery schedule except for $11.0 million which was converted into a credit earned upon delivery of the last 10 of the 40 aircraft.
The Company evaluated the recoverability of the deposits, credits and related capitalized interest in connection with the anticipated purchase of the aircraft in future periods and determined them to be recoverable. If the Company ultimately exercises its cancellation rights for up to 30 aircraft, it would incur a loss of deposits and credits of up to $26.0 million as a cancellation fee. Because the Company concluded that the deposits and credits are recoverable and that it is not likely to incur cancellation fees, the Company did not record such fees. The Company maintains $94.3 million of pre-delivery payments, of which $68.3 million relates to the next 10 and $26.0 million to the last 30 aircraft, in its accompanying consolidated balance sheets as of December 31, 2014, $51.2 million of which was financed by a third party.
Committed expenditures not subject to cancellation rights for these aircraft and separately sourced spare engines, including estimated amounts for contractual price escalations and pre-delivery payment deposits, will total approximately $396.1 million at December 31, 2014. The Company believes that its cash resources and commercially available aircraft financing will be sufficient to satisfy these purchase commitments. For six out of the first 10 aircraft deliveries, the Company has obtained a manufacturer backstop debt financing commitment, which it does not expect to utilize.
Operating Leases
In connection with the 2013 Recapitalization described in Note 3, the Company executed a series of amendments to its aircraft leases. The aircraft lease amendments resulted in extensions of varying lengths by lease for periods from three to five years, up to 15 years from date of the aircraft manufacture, reductions to base monthly rent, maintenance deposits or both through monthly cash rebates (“Lease Rebates”). Certain aircraft lease extensions will be at fixed rates based upon the fair market value of the aircraft as determined by a qualified appraisal at the start of the lease extension period. The Company estimated the extension rates utilizing current independent aircraft appraisals and current market lease rates and has factored in future demand for the leased aircraft while giving consideration to newer, more fuel-efficient aircraft expected to be delivered in the marketplace during the extension period. All amended leases were re-evaluated to determine if they qualified as a capital lease and were determined to be operating leases under the new lease terms. Thus, as of December 31, 2014, the Company leased all 53 of the aircraft it operates, as well as its spare engines, under operating leases.
Lease Rebates received at the start of the amended leases are accounted for as an incentive to be recorded as a reduction of rent expense on a straight-line basis over the lease term. Payment of future Lease Rebates are contingent on the Company maintaining $75.0 million of unrestricted cash as of the last day of each month and recognized as a reduction in rent expense when the liquidity requirement is met. Under the amended lease agreements, for substantially all of the lessors who are providing Lease Rebates from monthly base rent, the Company is obligated to refund 25% of all the Lease Rebates received through December 31, 2016 in the first
86
Table of Contents
quarter of 2017 or on a pro-rata basis with any debt repayment occurring prior to the first quarter of 2017. Refundable Lease Rebates are recorded as a component of the deferred rent balance in the consolidated financial statements. As a result of the repayment of related-party debt in connection with the 2014 Recapitalization, the Company accelerated $2.5 million of refundable Lease Rebates to December 2014. The aggregate lease rebates earned and recorded as contingent rent for the year ended December 31, 2014 and 2013 were $19.8 million and $11.1 million, respectively.
In addition, as certain lease terms were extended, certain major aircraft and engine maintenance events are expected to fall within the extended lease terms. As a result, the Company recorded lease incentives associated with supplemental rent payments that were previously expensed that are now expected to be recoverable by virtue of the lease term extensions. The Company recorded these lease incentives as an increase to aircraft maintenance deposits and an increase to other liabilities in the consolidated balance sheet in 2014.
The Company also leases airport space, office space and other equipment, which expire in various years through 2022. The Company has funded $67.6 million as of December 31, 2014 in cash to various lessors to serve as collateral for base rent deposits related to all of its leases.
The Company recorded rent expense, net of Lease Rebates, of $233.9 million, $243.9 million and $270.8 million on all non-cancelable operating leases in 2014, 2013, and 2012, respectively, including $3.8 million, $3.0 million, and $15.5 million in 2014, 2013 and 2012, respectively, for supplemental rent as further described in Note 4—Summary of Significant Accounting Policies—Aircraft Maintenance Deposits.
Letter of Credit Facility
In connection with the 2014 Recapitalization, the Virgin Group arranged for a $100.0 million Letter of Credit Facility issued on behalf of the Company to certain companies that process substantially all of the Company’s credit card transactions. This allowed these companies to release approximately $100.0 million of cash collateral to the Company, which was used by the Company to repay principal and accrued interest due under certain of the 5% Notes held by the Virgin Group. Refer to Note 2—2014 Recapitalization for more information. The Letter of Credit Facility will be provided for a period of up to five years from November 18, 2014 and contains an annual commitment fee equal to 5% per annum of the daily maximum amount available to be drawn, accruing on daily basis from the date of issuance. The fee is payable by the Company to the Virgin Group quarterly and is recorded in other income (expense). In addition, the Company is responsible for annual fees associated with the issuance and maintenance of the Letter of Credit Facility. The Letter of Credit Facility would only become an obligation of the Company if one or both of its credit card processors were to draw on the Letter of Credit Facility. The Company is restricted from incurring any future secured indebtedness related to its unencumbered assets unless the reimbursement obligations to the Virgin Group are secured on a pari passu basis with such secured debt. The Letter of Credit Facility will be reduced or terminated to the extent that collateral requirements are decreased or eliminated by the credit card transaction processors.
87
Table of Contents
Summary of Future Payment Obligations
As of December 31, 2014, the Company has the following contractual payment commitments (in thousands):
| Year |
Long-term debt including related- party (1) |
Aircraft and engine purchases (2) |
Aircraft and engine leases (3) |
Maintenance deposits (4) |
Other leases (5) | Total | ||||||||||||||||||
| 2015 |
$ | 33,824 | $ | 211,899 | $ | 225,123 | $ | 8,906 | $ | 27,047 | $ | 506,799 | ||||||||||||
| 2016 |
17,416 | 184,250 | 216,977 | 9,047 | 26,207 | 453,897 | ||||||||||||||||||
| 2017 |
— | — | 203,823 | 9,419 | 27,291 | 240,533 | ||||||||||||||||||
| 2018 |
40,000 | — | 188,423 | 9,882 | 24,083 | 262,388 | ||||||||||||||||||
| 2019 |
50,295 | — | 172,082 | 10,468 | 16,884 | 249,729 | ||||||||||||||||||
| Thereafter |
— | — | 486,823 | 40,682 | 32,102 | 559,607 | ||||||||||||||||||
|
|
|
|
|
|
|
|
|
|
|
|
|
|||||||||||||
| $ | 141,535 | $ | 396,149 | $ | 1,493,251 | $ | 88,404 | $ | 153,614 | $ | 2,272,953 | |||||||||||||
|
|
|
|
|
|
|
|
|
|
|
|
|
|||||||||||||
| (1) | Includes accrued interest; excludes future interest of $23.5 million to be accrued through November 2022. |
| (2) | Represents non-cancelable contractual payment commitments for aircraft and engines. |
| (3) | Represents future minimum lease payments under non-cancelable operating leases with initial terms in excess of one year, including renewal payments for signed lease extensions and excluding lease rebates. |
| (4) | Represents the fixed portion of supplemental rent under lessor contracts for maintenance reserve payment commitments; excludes variable future amounts that will be based on actual flight hours. |
| (5) | Represents future minimum lease payments under non-cancelable building, airport station and equipment leases. |
The table above excludes the Company’s commitment to pay royalties of 0.5% in 2015 of the Company’s operating revenue for the use of the Company’s brand name to a related party. This license fee will increase to 0.7% starting the first quarter of 2016 until the Company’s total annual revenue exceeds $4.5 billion, at which time the annual license fee would resume to 0.5%. Refer to 2014—Recapitalization for additional information.
| (10) | Stockholders’ Equity |
In conjunction with its IPO and the 2014 Recapitalization in November 2014, the Company amended and restated its certificate of incorporation to authorize the issuance of common stock, non-voting common stock, and preferred stock. All pre-existing classes of common stock and convertible preferred stock were converted to common stock or non-voting common stock in connection with the 2014 Recapitalization. See Note 2—2014 Recapitalization for additional information.
Employee LLC was formed in 2010 to facilitate the distribution of incentives to eligible employees, which do not include the Company’s officers, upon the qualified public offering of the Company’s common stock. The Company loaned $3.0 million to Employee LLC, which used the proceeds of this note to purchase limited liability company interests in VAI Partners LLC, a fund managed by Cyrus Capital, which ultimately entitled Employee LLC to 231,210 shares of the Company’s Class A common stock. Under variable interest entity accounting guidelines, the Company consolidated Employee LLC as the Company is the primary beneficiary of Employee LLC. The Company’s liability with respect to Employee LLC was limited to the Company’s initial investment of $3.0 million. At December 31, 2013, the shares of Class A common stock owned by VAI Partners LLC and ultimately attributable to Employee LLC were presented as fully outstanding voting shares, as they held key voting and other rights. In November 2014, VAI Partners LLC distributed the shares held by it, including 231,210 shares that VAI Partners LLC distributed to Employee LLC. In turn, Employee LLC sold all of its outstanding shares in connection with the IPO. Upon the sale of the shares, total proceeds of $5.3 million were paid out to eligible employees as cash bonuses and were recorded as compensation expense in the accompanying consolidated statement of operations.
88
Table of Contents
Prior to the 2014 Recapitalization, the Company had seven classes of common stock. Effective with the 2014 Recapitalization, all pre-existing classes of common stock were converted to common stock or non-voting common stock, subject to U.S. federal statutory and/or regulatory laws with respect to ownership and control of U.S. airlines by non-U.S. citizens. Refer to Stockholders’ Equity as follows:
| Shares authorized | ||||||||||||
| As of December 31, | ||||||||||||
| 2014 | 2013 | |||||||||||
| Voting Common Stock |
(a) | 650,000,000 | — | |||||||||
| Non-Voting Common Stock |
(b) | 100,000,000 | — | |||||||||
| Class A |
(c) | — | 56,630,503 | |||||||||
| Class A-1 |
(d) | — | 29,143 | |||||||||
| Class B |
(e) | — | 924,867 | |||||||||
| Class C |
(f) | — | 47,688,845 | |||||||||
| Class D |
(e) | — | 13 | |||||||||
| Class E |
(g) | — | 13 | |||||||||
| Class F |
(e) | — | 13 | |||||||||
| Class G |
(h) | — | 1,987,035 | |||||||||
|
|
|
|
|
|||||||||
| 750,000,000 | 107,260,432 | |||||||||||
|
|
|
|
|
|||||||||
| Shares issued and outstanding | ||||||||||||
| As of December 31, | ||||||||||||
| 2014 | 2013 | |||||||||||
| Voting Common Stock |
36,267,148 | — | ||||||||||
| Non-Voting Common Stock |
6,852,738 | — | ||||||||||
| Class A |
(j) | — | 248,308 | |||||||||
| Class A-1 |
(j) | — | 29,143 | |||||||||
| Class B |
(j) | — | 424,221 | |||||||||
| Class C |
(j) | — | — | |||||||||
| Class D |
(i) | — | 13 | |||||||||
| Class E |
(g) | — | 13 | |||||||||
| Class F |
(i) | — | 13 | |||||||||
| Class G |
(j) | — | 111,241 | |||||||||
|
|
|
|
|
|||||||||
| 43,119,886 | 812,952 | |||||||||||
|
|
|
|
|
|||||||||
| (a) | Voting Common Stock is entitled to one vote per share. |
| (b) | Non-Voting Common Stock does not have the ability to vote on any matters. |
| (c) | Class A common stock was entitled to one vote per share. |
| (d) | Class A-1 common stock was entitled to 20 votes per share. |
| (e) | Class B, Class D and Class F common stock was entitled one vote per share in the aggregate and was reserved for foreign stockholders. |
| (f) | Class C common stock did not have voting rights and was reserved for issuance upon the exercise of outstanding warrants. |
| (g) | Class E common stock did not have voting rights. All shares of Class E common stock were previously held by a former officer. These shares were canceled in September 2014 and became no longer outstanding. |
| (h) | Class G common stock did not have voting rights and was reserved for issuance of stock grants to employees, contractors and directors. |
| (i) | Class D and Class F common stock reached their automatic conversion date into Class B common stock in May 2014 and became no longer outstanding. The conversion did not increase total Class B shares outstanding. |
| (j) | These classes of shares converted to Common Stock in November 2014 as a result of the 2014 Recapitalization. Refer to Note 2—2014 Recapitalization for additional information. |
89
Table of Contents
The votes per share on all matters that require a vote by the Company’s stockholders are set forth in the Eleventh Amended and Restated Certificate of Incorporation.
Preferred Stock
In connection with the IPO in November 2014, the Company authorized the issuance of 10,000,000 shares of preferred stock, of which none are issued and outstanding at December 31, 2014. Prior to the IPO, the Company had previously authorized the issuance of 1,109,812 shares of redeemable convertible preferred stock, of which 1,109,811 shares were issued and outstanding at December 31, 2013 and up to the date of the 2014 Recapitalization in November 2014. The redeemable convertible preferred stockholders were entitled to receive dividends on a pari passu basis with the common stock and thus were participating securities. No dividends had been declared in 2014, 2013 or 2012. The redeemable convertible preferred stock previously outstanding prior to the IPO was converted to common stock in connection with the 2014 Recapitalization and all shares of redeemable convertible authorized were canceled. Refer to Note 2—2014 Recapitalization for additional information.
Outstanding Related-Party Warrants
In November 2014, in connection with the 2014 Recapitalization, Related-Party Warrants to purchase 26,067,475 shares of common stock were exchanged without receipt of cash consideration for 5,742,543 shares of common stock. The 2014 Recapitalization Agreement also provided that the remaining Related-Party Warrants to purchase an aggregate of 16,175,126 shares of common stock were canceled in their entirety. The Company had no warrants outstanding at December 31, 2014. See Note 2—2014 Recapitalization for additional information.
Just prior to the 2014 Recapitalization event, the following Related-Party Warrants were outstanding:
| Issued title |
Date issued | Aggregate shares issuable |
Exercise price |
Expiration date |
Common Shares Issued at 2014 Recapitalization |
|||||||||||||||||||
| Class A Warrants |
Cyrus Capital, Virgin Group | (a) | 5/31/2007 | 43,122 | $ | 0.08 | 5/31/2037 | 42,980 | ||||||||||||||||
| Class A Warrants |
Cyrus Capital, Virgin Group | (a) | 7/31/2007 | 30,802 | 0.08 | 7/31/2037 | 30,699 | |||||||||||||||||
| Class C-2 Warrants |
Virgin Group | (a) | 5/31/2007 | 178,311 | 0.08 | 5/31/2037 | 177,725 | |||||||||||||||||
| Class C-4 Warrants |
Virgin Group | (a) | 7/31/2007 | 63,682 | 0.08 | 7/31/2037 | 63,472 | |||||||||||||||||
| Class C-5 Warrants |
Virgin Group | (b) | 1/12/2010 | 7,948,140 | 37.74 | 1/12/2040 | Cancelled | |||||||||||||||||
| Class C-6 Warrants |
Cyrus Capital | (b) | 1/12/2010 | 278,847 | 37.74 | 1/12/2040 | Cancelled | |||||||||||||||||
| Class C-7 Warrants |
Cyrus Capital, VAI MBO Investors LLC | (b),(c) | 1/12/2010 | 1,324,689 | 75.49 | 1/12/2040 | Cancelled | |||||||||||||||||
| Class C-8 Warrants |
Cyrus Capital | (b),(c) | 1/12/2010 | 2,649,380 | 113.23 | 1/12/2040 | Cancelled | |||||||||||||||||
| Class C-9 Warrants |
Cyrus Capital | (b),(c) | 1/12/2010 | 3,974,070 | 150.98 | 1/12/2040 | Cancelled | |||||||||||||||||
| Class C-11 Warrants |
Cyrus Capital | (b) | 12/9/2011 | 255,001 | 26.42 | 12/9/2041 | 45,761 | |||||||||||||||||
| Class C-12 Warrants |
Cyrus Capital | (b) | 12/9/2011 | 2,295,022 | 26.42 | 12/9/2041 | 411,870 | |||||||||||||||||
| Class C-14 Warrants |
Virgin Group | (b) | 5/10/2013 | 20,593,027 | 18.87 | 5/10/2043 | 3,695,697 | |||||||||||||||||
| Class C-14 Warrants |
Virgin Group | (b) | 5/10/2013 | 986,487 | 0.08 | 5/10/2043 | 983,249 | |||||||||||||||||
| Class C-15 Warrants |
Cyrus Capital | (b) | 5/10/2013 | 1,622,021 | 18.87 | 5/10/2043 | 291,090 | |||||||||||||||||
|
|
|
|
|
|||||||||||||||||||||
| 42,242,601 | 5,742,543 | |||||||||||||||||||||||
|
|
|
|
|
|||||||||||||||||||||
| (a) | Warrants were exercisable immediately, subject to U.S. federal statutory and/or regulatory laws with respect to ownership and control of U.S. airlines by non-U.S. citizens. |
| (b) | Warrants exercisable upon a qualified public offering. |
| (c) | Warrants expired upon the earlier of (i) the expiration date set forth in the table above, (ii) a qualified public offering at a per-share price less than the applicable exercise price, (iii) a change of control or (iv) an other liquidity event at a per-share price less than the applicable exercise price per share. |
90
Table of Contents
| Note: | The Class C warrants series were not exercisable if the exercise would violate U.S. federal statutory and/or regulatory laws with respect to the ownership and control of U.S. airlines by non-U.S. citizens. |
Class C-10 and Class C-13 warrants to purchase 59,543 and 36,495 shares, respectively, held by a former officer as of December 31, 2013, were exchanged for an outstanding loan and canceled in September 2014. These warrants were not included in the table above because they were canceled prior to the 2014 Recapitalization.
The Company utilizes third-party independent valuation reports to assist with valuation of related-party warrants and related debt balances, which incorporate a calculation of enterprise value on the Company’s projected future earnings using a discounted cash flow analysis and deducting from the enterprise value the present value of the then existing capital structure, debt and other obligations. Related-party warrants issued in solely equity transactions prior to the 2013 Recapitalization were recorded as additional paid-in capital in the accompanying consolidated balance sheets. Related-party warrants issued in connection with debt and in connection with the 2013 Recapitalization were recorded as a reduction of the related debt in the accompanying consolidated balance sheets, with an offset to stockholders’ equity. In 2011, related party-warrants were issued in connection with the FNPA notes and were determined to have a fair value of $2.26 per share based on the Black Scholes option pricing model using the following key assumptions: expected term of 6.3 years, a risk-free interest rate of 1.35%, no expected dividends and 70.0% estimated share price volatility. Related-party warrants issued in 2012 were not significant. Refer to Note 3—2013 Recapitalization for additional information related to warrants issued in 2013.
In May 2013, in connection with the 2013 Recapitalization, certain notes and warrants were exchanged for Class C-14 warrants to purchase approximately 1.0 million shares of Class C common stock with an exercise price of $0.08 per share. This transaction resulted in a concession of the original obligation to the related-party debt. In addition, the Company issued Class C-14 and Class C-15 warrants to purchase an aggregate of approximately 22.2 million shares of Class C common stock with an exercise price of $18.87 per share. See Note 3—2013 Recapitalization for additional information.
| (11) | Share-based Compensation |
(a) Share-based Compensation Plans
In November 2005, the Company adopted the 2005 Virgin America Inc. Stock Incentive Plan (the “2005 Plan”), which had been amended and restated. The total number of shares that could be issued under the 2005 Plan as of December 31, 2013 was 1,771,423, of which 13 such shares were reserved for Class E common stock, and the remaining shares were reserved for Class G common stock. For awards granted under the 2005 Plan that were forfeited or were canceled before being exercised or settled, the shares underlying the awards were added back to the shares available for grant under the 2005 Plan.
In November 2014, the Company adopted the 2014 Virgin America Inc. Equity Incentive Award Plan (the “2014 Plan”), which supercedes the 2005 Plan. There are 1,017,570 shares available for issuance under the Plans, which includes 600,000 shares available for issuance under the 2014 Plan in addition to 417,570 shares available for issuance from the 2005 Plan that rolled over into the 2014 Plan. An annual increase in shares available for issuance under the 2014 Plan on the first day of each year beginning in 2015 and ending in 2024 is subject to the approval of the Compensation Committee of the Board of Directors and is limited to 2.5% of the common stock outstanding at the end of the preceding fiscal year and subject to an overall cap of 13.9 million shares of common stock that may be issued under the 2014 Plan in the aggregate. If any shares subject to an award are forfeited, expire or become tax settled shares withheld, these shares will be added back to shares available for future grant under the 2014 Plan, and thus will be added back to the shares available for issuance. As of December 31, 2014, the Company had 555,782 shares available for grant under the 2014 Plan.
The 2014 Plan is administered by the Compensation Committee of the Board of Directors. The 2005 Plan was administered by the Board. The Board may grant stock awards, including incentive stock options (“ISOs”),
91
Table of Contents
nonqualified stock options (“NSOs”), stock appreciation rights, restricted stock and restricted stock units (“RSUs”) to employees, consultants and non-employee directors of the Company, the vesting of which may be performance-based or market-based along with a requisite service requirement. Certain awards granted prior to the IPO were subject to continuing employment and achieving an IPO and require meeting certain stock price thresholds in order to vest or become exercisable. Under the 2005 Plan, stock options granted have an exercise price of at least 100% of the fair market value of the underlying stock at the time of grant and have an exercise term of ten years from grant date. Stock awards under the 2005 Plan generally vest in annual installments over a two to four year schedules. RSUs granted under the 2005 Plan have contractual vesting and settlement restrictions which are based on certain liquidity events such as IPO and exercisability restrictions such as certain stock price thresholds. The majority of RSUs granted under the 2005 Plan will vest upon meeting market conditions. The Company had not previously recognized expense on these awards prior to November 2014 as the performance condition was not deemed probable of occurring. The Company recognized $7.7 million expense in the fourth quarter 2014 for these options and RSUs as the performance condition associated with the IPO event was met.
RSUs granted to the members of the Board of Directors and to the Company’s chief executive officer (CEO) prior to the IPO were granted outside of the 2005 Plan, and were previously part of the overall Class G shares of common stock authorized for issuance. RSUs granted to the Board members prior to IPO generally vest based upon meeting a one-year service period. RSUs granted to the CEO prior to the IPO generally have service periods of up to four years.
Stock grants under the 2014 Plan made to members of the Board and to employees are in the form of RSUs with service condition of generally three years.
Stock option activity granted under the 2005 Plan and superceded by the 2014 Plan (collectively referred to as “the Plan”) as of December 31, 2014 is as follows:
| Service Options |
Performance Options |
Weighted Average Exercise Price |
Weighted Average Contractual Term (Years) |
|||||||||||||
| Outstanding as of December 31, 2013 |
136,746 | 911,796 | $ | 16.68 | 8.39 | |||||||||||
| Granted |
1,324 | 20,532 | 8.45 | |||||||||||||
| Forfeited / canceled |
(1,839 | ) | (18,984 | ) | 15.26 | |||||||||||
| Exercised |
(1,718 | ) | — | 13.89 | ||||||||||||
|
|
|
|
|
|
|
|||||||||||
| Outstanding as of December 31, 2014 |
134,513 | 913,344 | 15.95 | 7.31 | ||||||||||||
| Options vested and expected to vest as of December 31, 2014 |
133,714 | 908,889 | $ | 15.98 | 7.30 | |||||||||||
| Options vested and exercisable as of December 31, 2014 |
115,839 | — | $ | 25.22 | 4.03 | |||||||||||
| Unrecognized compensation (in thousands) |
$ | 82 | (1) | $ | 155 | (2) | ||||||||||
| (1) | The Company expects to recognize this share-based compensation expense over a weighted-average remaining recognition period of 1.19 years. |
| (2) | The Company expects to recognize this share-based compensation expense over a weighted-average remaining recognition period of 0.77 years. |
The total intrinsic value of options exercised and the fair value of service condition options granted to employees that vested during each of the years ended December 31, 2014, 2013, and 2012 were de minimus. The aggregate intrinsic value for options outstanding and options exercisable represents the total pretax intrinsic value based on the fair value of the Company’s common stock of $43.25 per share that would have been received by the option holders had those options holders exercised their stock options as of December 31, 2014. The aggregate intrinsic value of options outstanding at December 31, 2014 is $29.4 million and options exercisable is $2.8 million. The options outstanding not yet exercisable are subject to stock price covenants which restrict exercise until stock price performance metrics are met.
92
Table of Contents
With respect to the stock option grants containing performance-based conditions, $4.6 million expense was recorded in 2014 and no share-based compensation expense was recorded in 2013 and 2012. At December 31, 2014, unrecognized compensation related to these stock options is approximately $0.2 million.
RSU activity granted under the Plan is as follows:
| Service restricted stock units |
Performance restricted stock units |
Total restricted stock units |
Weighted average grant date fair value per share |
Aggregate grant date fair value (in thousands) |
||||||||||||||||
| Unvested as of December 31, 2013 |
— | 261,165 | 261,165 | $ | 8.45 | $ | 2,208 | |||||||||||||
| Granted |
340,411 | 40,375 | 380,786 | 21.88 | 8,331 | |||||||||||||||
| Vested |
— | — | — | — | — | |||||||||||||||
| Forfeited and canceled |
— | (5,761 | ) | (5,761 | ) | 8.45 | (50 | ) | ||||||||||||
|
|
|
|
|
|
|
|
|
|
|
|||||||||||
| Unvested as of December 31, 2014 |
340,411 | 295,779 | 636,190 | $ | 16.49 | $ | 10,489 | |||||||||||||
|
|
|
|
|
|
|
|
|
|
|
|||||||||||
Pre-IPO RSU activity granted outside of the Plan is as follows:
| Service restricted stock units |
Performance restricted stock units |
Total restricted stock units |
Weighted average grant date fair value per share |
Aggregate grant date fair value (in thousands) |
||||||||||||||||
| Unvested as of December 31, 2013 |
26,493 | 604,384 | 630,877 | $ | 10.18 | $ | 6,421 | |||||||||||||
| Granted |
51,520 | — | 51,520 | 8.45 | 435 | |||||||||||||||
| Vested |
(26,493 | ) | — | (26,493 | ) | 8.45 | (226 | ) | ||||||||||||
| Forfeited and canceled |
— | — | — | — | — | |||||||||||||||
|
|
|
|
|
|
|
|
|
|
|
|||||||||||
| Unvested as of December 31, 2014 |
51,520 | 604,384 | 655,904 | $ | 10.11 | $ | 6,630 | |||||||||||||
|
|
|
|
|
|
|
|
|
|
|
|||||||||||
Prior to the IPO, the Company granted certain performance-based and market-based RSU awards that were not subject to continued employment of the award holder. Accordingly, compensation expense related to these awards was recognized over the service period.
As of December 31, 2014 total unrecognized compensation expense for RSUs granted under all Plans and outside the Plans was approximately $8.6 million to be recognized over a weighted-average remaining recognition period of 1.72 years.
In addition to stock compensation associated with options and RSUs as described in the preceding notes, in November 2014, 217,898 shares of common stock were issued to employees and directors at the completion of the IPO under the 2014 Plan as approved by the Company’s Board of Directors. The Company recorded $5.0 million in stock compensation expense and an increase in additional paid in capital, based on the number of shares multiplied by the initial price of the common stock in the offering. These shares became fully issued and outstanding upon issuance.
The Company estimated the fair value of stock options granted using the Black-Scholes option valuation model with the following assumptions:
| Year Ended December 31, | ||||||||||||
| 2014 | 2013 | 2012 | ||||||||||
| Expected volatility |
70.0 | % | 70.0 | % | 53.0 | % | ||||||
| Risk-free interest rate |
1.86% - 1.89 | % | 0.71% - 1.34 | % | 1.04 | % | ||||||
| Dividend yield |
— | — | — | |||||||||
| Expected term (in years) |
6.3 | 5.0 | 6.3 | |||||||||
| Weighted-average fair value of options granted |
$ | 5.45 | $ | 3.85 | $ | 9.44 | ||||||
93
Table of Contents
The expected stock price volatility assumptions were determined by examining the historical volatilities for industry peers for the time period equal to the expected term as the Company’s common stock is not publicly traded.
The risk-free interest rate assumption is based upon U.S. Treasury instruments whose term is consistent with the expected term of the Company’s stock options at the time of grant.
The expected dividend assumption is based on the Company’s history and expectation of dividend payouts.
For options with exercise prices equal to the fair value of the Company’s common stock at the date of grant, the expected term of the options is generally based on the simplified average approach based on the options’ vesting term and the contractual term of the options, as the Company did not have sufficient historical information to develop reasonable expectations about future exercise patterns and post-vesting employment termination behavior. For options with exercise prices which exceed the fair value of the Company’s common stock at the grant date, the Company estimated the expected term based on peer companies’ reported experience.
The Company records share-based compensation expense only for those awards expected to vest using an estimated forfeiture rate based upon the Company’s historical pre-vesting forfeiture experience. Share-based compensation expense is recorded in salaries, wages and benefits in the accompanying consolidated statements of operations. Total share-based compensation expense recorded for 2014, 2013, 2012, including stock options and RSUs granted under both the 2014 and 2005 Plans and outside of the Plans, as well as a grant of shares of common stock on the IPO date was $14.0 million, $0.4 million, and $0.2 million, respectively. In May 2013, the Company modified all outstanding options with performance and market conditions to reduce the exercisability restriction from $37.74 per share to $26.42 per share. This had a deminimus impact on the consolidated statement of operations for the year ended December 31, 2013.
No material income tax benefit has been recognized relating to share-based compensation expense and no tax benefits have been realized from exercised stock options. Stock-based awards activity did not have an impact on cash flows from financing activities for 2014, 2013 and 2012.
(b) Teammate Stock Purchase Plan
In November 2014, the Company adopted the Teammate Stock Purchase Plan (“TSPP”), under which 160,000 shares of the Company’s common stock have been reserved for issuance to eligible employees. An annual increase on the first day of each year beginning in 2015 and ending in 2024 is subject to approval by the Compensation Committee of the Board of Directors, limited to 1% of the common stock outstanding at the end of the preceding year and subject to an overall cap of 4.8 million shares of common stock that may be issued under the TSPP in the aggregate. Employees are offered shares bi-annually through two six-month offering periods, which begin on February 15 and August 15 of each year. Employees may purchase a limited number of shares of the Company’s stock via regular payroll deductions at a discount of 10% of the market value at the end of the six-month offering period. Employees may deduct up to 10% of payroll up to $25,000 per year, with a cap of 5,000 shares per employee per offering period. The TSPP is scheduled to terminate on January 3, 2024. No shares have been issued under the TSPP as of December 31, 2014. The first offering period begins in February 2015.
| (12) | Employee Benefit Plans |
(a) 401(k) Plan
The Company sponsors a retirement savings 401(k) defined contribution plan covering all employees that includes Company matching contributions. Company contributions expensed in 2014, 2013, and 2012 were $10.6 million, $6.0 million, and $4.9 million, respectively.
Beginning January 1, 2014, the Company match increased to 125% of the first 6% of employee contributions. Until December 31, 2013, the Company matched 100% of the first 5% of employee contributions.
94
Table of Contents
There is no waiting period for eligibility for Company matching.
Subsequent to year end, the Company adopted a new discretionary 401(k) company contribution in 2015 called “401(k) Plus” under which the Company will make additional 401(k) contributions of 4.5% of salary for pilots and 1.5% for all other teammates. 401(k) Plus contributions will be evaluated annually by the Board of Directors and may change in future years. The new plan contributions will take effect beginning in 2015.
(b) Profit Sharing Plan
The Company’s teammate profit-sharing program generally provides that, for each year in which the Company has an annual pre-tax profit, it will pay 15% of that profit net of profit-sharing expense to substantially all of its teammates (other than officers and certain management teammates who are not eligible). For the year ended December 31, 2014, the Company adjusted pre-tax income to exclude certain IPO related expenses, as the Company considered these expenses one-time, non-operational items that should not reduce the profit-sharing basis for teammates. The Company recorded profit-sharing expense of $14.4 million and $2.1 million, respectively for the year ended December 31, 2014 and 2013, respectively. For the year ended December 31, 2012, the Company did not record profit-sharing expense as it incurred a pre-tax loss in each of those years.
Subsequent to year end, the Company has adopted a change in the annual teammate profit-sharing program in 2015, which will become effective with the 2016 payout. A threshold will be implemented in 2015 on pre-tax income net of profit-sharing expense, determined by multiplying $1.5 million times the average number of aircraft in the Company’s fleet for the full year. For 2015, the pre-tax income threshold is expected to be approximately $81.0 million. The Company will accrue 15% profit-sharing for teammates on pre-tax income net of profit-sharing expense above this threshold, and the Company will not incur any profit-sharing compensation on pre-tax income up to the $81.0 million threshold.
| (13) | Income Taxes |
The expense for income taxes consists of the following (in thousands):
| Year Ended December 31, | ||||||||||||
| 2014 | 2013 | 2012 | ||||||||||
| Current: |
||||||||||||
| Federal |
$ | — | $ | — | $ | — | ||||||
| State |
(23 | ) | 317 | 15 | ||||||||
| Deferred: |
||||||||||||
| Federal |
1,110 | — | — | |||||||||
| State |
92 | — | — | |||||||||
|
|
|
|
|
|
|
|||||||
| $ | 1,179 | $ | 317 | $ | 15 | |||||||
|
|
|
|
|
|
|
|||||||
95
Table of Contents
The following table shows significant components of the Company’s deferred tax assets and liabilities (in thousands). These are classified in other current and non-current assets and liabilities:
| December 31, | ||||||||
| 2014 | 2013 | |||||||
| Deferred tax assets: |
||||||||
| Capitalized start-up costs |
$ | 21,610 | $ | 24,612 | ||||
| License fee liability |
12,914 | — | ||||||
| Gain on debt restructuring |
— | 27,485 | ||||||
| Share-based compensation |
5,162 | 6,539 | ||||||
| Accruals and reserves |
46,503 | 24,803 | ||||||
| Unrealized loss on fuel hedges |
12,022 | — | ||||||
| Net operating loss carryforwards |
245,384 | 234,263 | ||||||
|
|
|
|
|
|||||
| Total deferred tax assets |
343,595 | 317,702 | ||||||
| Deferred tax liabilities: |
||||||||
| Unrealized gain on fuel hedges |
— | (631 | ) | |||||
| Manufacturers incentives |
(26 | ) | (26 | ) | ||||
| Maintenance deposits |
(80,354 | ) | (50,960 | ) | ||||
| Deferred aircraft rent |
(19,756 | ) | (3,968 | ) | ||||
| Related-party debt |
(4,334 | ) | — | |||||
| Indefinite lived slots |
(1,201 | ) | — | |||||
| Property and equipment |
(1,030 | ) | (686 | ) | ||||
|
|
|
|
|
|||||
| Total deferred tax liabilities |
(106,701 | ) | (56,271 | ) | ||||
| Less: Valuation allowance |
(238,095 | ) | (261,431 | ) | ||||
|
|
|
|
|
|||||
| Net deferred tax liability |
$ | (1,201 | ) | $ | — | |||
|
|
|
|
|
|||||
Deferred taxes as presented in the consolidated balance sheets are as follows (in thousands):
| December 31, | ||||||||
| 2014 | 2013 | |||||||
| Current deferred tax assets |
$ | 40,502 | $ | 22,479 | ||||
| Valuation allowance |
(28,066 | ) | (18,731 | ) | ||||
|
|
|
|
|
|||||
| Net current deferred tax assets |
12,436 | 3,748 | ||||||
| Current deferred tax liabilities |
(178 | ) | (4,560 | ) | ||||
|
|
|
|
|
|||||
| Net current deferred tax assets and liabilities |
$ | 12,258 | $ | (812 | ) | |||
|
|
|
|
|
|||||
| Non-current deferred tax assets |
$ | 303,093 | $ | 291,255 | ||||
| Valuation allowance |
(210,029 | ) | (242,700 | ) | ||||
|
|
|
|
|
|||||
| Net non-current deferred tax assets |
93,064 | 48,555 | ||||||
| Non-current deferred tax liabilities |
(106,523 | ) | (47,743 | ) | ||||
|
|
|
|
|
|||||
| Net non-current deferred tax assets and liabilities |
$ | (13,459 | ) | $ | 812 | |||
|
|
|
|
|
|||||
Net current deferred tax assets and liabilities are included in “Prepaid expenses and other assets” and “Other current liabilities,” respectively, in the consolidated balance sheets. Net non-current deferred tax assets and liabilities are included in “Other non-current assets” and “Other liabilities,” respectively, in the consolidated balance sheets.
96
Table of Contents
For the year ended December 31, 2014, the Company recorded a deferred tax liability and tax expense of $1.2 million resulting from the difference between the book and tax basis of indefinite-lived intangible assets that are not available to cover net deferred tax assets subject to a valuation allowance.
The Company’s expense (benefit) for income taxes differs from that using the federal statutory rate due to the following (in thousands):
| Year Ended December 31, | ||||||||||||
| 2014 | 2013 | 2012 | ||||||||||
| Federal income tax at the statutory rate |
$ | 21,451 | $ | 3,661 | $ | (50,880 | ) | |||||
| Permanent items |
651 | 1,526 | 2,723 | |||||||||
| State income taxes, net of federal tax benefit |
1,758 | 325 | (4,830 | ) | ||||||||
| Change—valuation allowance |
(22,681 | ) | (5,195 | ) | 53,002 | |||||||
|
|
|
|
|
|
|
|||||||
| Total income tax expense |
$ | 1,179 | $ | 317 | $ | 15 | ||||||
|
|
|
|
|
|
|
|||||||
At December 31, 2014, the Company had NOLs of approximately $633.2 million for federal income tax purposes that expire beginning in 2027 and continuing through 2034, and the Company has NOLs of approximately $433.9 million for state income tax purposes that expire beginning in 2017 and continuing through 2036. The NOL amounts in the preceding sentence include NOLs that are currently estimated to be in excess of limitations imposed under Section 382, as described below.
The Company had valuation allowances of $238.1 million and $261.4 million as of December 31, 2014 and 2013, respectively. Valuation allowance changes in each period were exclusively driven by changes in net deferred tax assets including NOLs.
| 2014 | 2013 | 2012 | ||||||||||
| Balance at beginning of year |
$ | 261,432 | $ | 306,005 | $ | 267,966 | ||||||
| Charged to provision |
(22,681 | ) | (5,195 | ) | 53,002 | |||||||
| Charged to equity |
(6,898 | ) | (38,298 | ) | — | |||||||
| Charged to OCI |
6,242 | (1,080 | ) | (14,963 | ) | |||||||
|
|
|
|
|
|
|
|||||||
| Balance at end of year |
$ | 238,095 | $ | 261,432 | $ | 306,005 | ||||||
|
|
|
|
|
|
|
|||||||
Section 382 of the Internal Revenue Code of 1986, as amended (“Section 382”), imposes limitations on a corporation’s ability to utilize NOLs if it experiences an “ownership change.” In general terms, an ownership change results from a cumulative change in the equity ownership of certain stockholders by more than 50 percentage points over a three-year period. In the event of an ownership change, utilization of the Company’s pre-charge NOLs would be subject to annual limitation under Section 382, which is generally determined by multiplying the value of the Company’s stock at the time of the ownership change by the applicable long-term tax-exempt rate. Multiple Section 382 limitations can be created by multiple ownership changes. In cases of multiple ownership changes, a subsequent ownership change can reduce, but not increase, the size of the Section 382 limitation that applies to pre-change losses from an earlier ownership change. As a result of a January 2010 equity restructuring, the Company experienced a Section 382 ownership change, and the Company estimates that certain of its federal and state NOLs will be subject to limitation as a result of this change. As a result of the 2014 Recapitalization and the IPO, the Company believes it has experienced another Section 382 ownership change. The Company has not yet completed the final calculation of the estimated limitation for the 2014 ownership change, but based on the Company’s current calculations, the Company does not believe it will experience limitations on the use of these NOLs in the near term. The Company expects to finalize the analysis before the filing of 2014 tax returns.
97
Table of Contents
In accordance with applicable income tax accounting guidance, the Company recorded an unrecognized tax benefit of approximately $5.0 million for the year ended December 31, 2012. The unrecognized tax benefit balance did not change in the periods ended December 31, 2014 and 2013. Changes in the unrecognized tax benefit will have no impact on the effective tax rate due to the existence of the valuation allowance. The Company estimates that the unrecognized tax benefit will not significantly change within the next 12 months.
A reconciliation of the gross unrecognized tax benefits is as follows:
| 2014 | 2013 | 2012 | ||||||||||
| Balance at beginning of year |
$ | 5,043 | $ | 5,043 | $ | — | ||||||
| Increase (decrease) for tax positions taken in prior years |
— | — | — | |||||||||
| Increase for tax positions taken in the current year |
— | — | 5,043 | |||||||||
| Decrease for settlements with taxing authorities |
— | — | — | |||||||||
| Decrease for lapsing of the statute of limitations |
— | — | — | |||||||||
|
|
|
|
|
|
|
|||||||
| Balance at end of year |
$ | 5,043 | $ | 5,043 | $ | 5,043 | ||||||
|
|
|
|
|
|
|
|||||||
The Company files income tax returns in the U.S. federal jurisdiction and various state jurisdictions and has identified its state tax return in California as a “major” tax jurisdiction. With few exceptions, the Company is no longer subject to U.S. federal, state and local or non-U.S. income tax examinations by tax authorities for years before 2006. In California, the income tax years 2006 through 2013 remain open to examination.
The Company recognizes interest and penalties accrued related to unrecognized tax benefits in income tax expense. The Company had no accruals for the payment of interest and penalties at December 31, 2014 or 2013.
| (14) | Related-Party Transactions |
The Company licenses the use of its brand name from certain entities affiliated with the Virgin Enterprises Limited, a company incorporated in England and Wales (“VEL”). VEL is an affiliate of one of the Company’s largest stockholder, the Virgin Group, which has two designees on the Board of Directors. Under the trademark license, the Company has the exclusive right to operate its airline under the brand name “Virgin America” within the United States (including Puerto Rico), Canada and Mexico, as well as the right to operate from any of the foregoing countries to points in the Caribbean. In December 2013, the Company entered into an amendment of the license agreement which expands the rights of Virgin Atlantic Airways, an affiliate of both the Company and VX Holdings L.P. to code share with other airlines. Royalties payable for use of the license are 0.5% of revenues. In November 2014, in connection with the 2014 Recapitalization and the IPO, the Company entered into amended and restated license agreements which provided for, among other things:
| • | An extension of the Company’s right to use the Virgin name and brand for a term of 25 years after November 13, 2014, and |
| • | Commencing in the first quarter of 2016, an increase in the annual license fee to the Virgin Group from 0.5% to 0.7% of total revenue, until the Company’s total annual revenue exceeds $4.5 billion, at which time the annual license fee would resume 0.5%. |
The Company recorded the fair value of the increase of $34.1 million as a reduction in related-party debt and an increase in other long-term liabilities as it is a part of the consideration to the Virgin Group for completing the 2014 Recapitalization. Refer to Note 2—2014 Recapitalization for additional details.
The Company paid license fees of $7.4 million, $7.1 million and $6.7 million during the years ended December 31, 2014, 2013 and 2012, respectively. The Company has accrued unpaid royalty fees of $1.8 million at both December 31, 2014 and 2013.
98
Table of Contents
As of December 31, 2014 the Virgin Group, through its affiliates including VX Holdings L.P., owns approximately 19.0% of the Company’s issued and outstanding voting stock and have other significant investments in the Company. In order to comply with requirements under U.S. law governing the ownership and control of U.S. airlines, at least 75% of the voting stock of the Company must be held by U.S. citizens and at least two-thirds of the Board of Directors must be U.S. citizens. U.S. citizen investors own over 75% of the voting stock of the Company, of which Cyrus Aviation Holdings, LLC, the largest single U.S. investor, owns approximately 29.0% as of December 31, 2014.
As of December 31, 2014, 29.9% of the Company’s $130.1 million debt is held by related-party investors. All of the Company’s previously outstanding related-party debt was extinguished in November 2014 as part of the 2014 Recapitalization. See Note 2—2014 Recapitalization for additional information. In connection with this, the Company incurred $33.7 million, $68.4 million and $113.7 million of related-party interest expense for the years ended December 31, 2014, 2013 and 2012, respectively. Commencing in November 2014, the Company began to incur an annual commitment fee on the $100.0 million Letter of Credit Facility issued by the Virgin Group. The fee is equal to 5.0% per annum of the daily maximum amount available to be drawn, accruing on daily basis from the date of issuance and is payable quarterly. For the year ended December 31, 2014 the Company recorded $0.6 million commitment fee in other income (expense) in the accompanying consolidated statement of operations.
| (15) | Net Income Per Share |
Basic and diluted net income (loss) per share are computed using the two-class method for periods prior to the completion of the Company’s IPO, which is an allocation method that determines net income (loss) per share for common stock and participating securities. The undistributed earnings are allocated between common stock and participating securities as if all earnings had been distributed during the period presented.
Basic net income (loss) per share is calculated by taking net income (loss), less earnings allocated to participating securities, divided by the basic weighted-average common shares outstanding. Shares of convertible preferred stock are considered participating securities because they are entitled to participate pari passu in any dividends declared and paid on the common stock on an as converted to common stock basis.
Diluted net income (loss) per share is calculated using the more dilutive of the if-converted method and the two-class method. Because the Company’s convertible preferred stock participated pari passu in any dividends declared and paid on the common stock on an as-converted to common stock basis, the diluted earnings per share are the same under both methods. Therefore the two-class method has been presented below.
For periods prior to the completion of the Company’s IPO, the basic weighted-average common shares outstanding included shares of Class A, Class A-1, and Class B common stock, but excluded Class D, Class E and Class F common stock as the holders of these classes were not entitled to dividends or distributions declared on common stock until the initial investments of the Company’s initial stockholders had been returned. The basic weighted-average common shares outstanding also excluded Class G common stock, which did not participate in dividends or distributions and were director and employee stock awards. Class D and Class F common stock reached their automatic conversion date and were converted into Class B common stock in May 2014 and thus were no longer outstanding at the date of the Company’s IPO. The conversion did not increase total Class B shares outstanding. All previously outstanding shares of Class E common stock were canceled in September 2014 and were also no longer outstanding at the date of the Company’s IPO. Subsequent to the Company’s IPO, the exercise or settlement of all options and RSUSs will result in the issuance of common stock that participates in dividends and distributions; thus, all options and RSUs have been included in diluted EPS for the period subsequent to the IPO, if the effect is dilutive.
For periods prior to the completion of the Company’s IPO, the diluted net income (loss) per share calculations included shares of Class A, Class A-1, and Class B common stock, as well as warrants to purchase shares of Class A and Class C common stock where the warrant exercise price was below the fair value of the
99
Table of Contents
underlying common stock and therefore had a dilutive effect. Stock options and unvested RSUs were excluded from the calculation of diluted net income (loss) per share because exercise or settlement of these awards would have resulted in issuance of Class G common stock, which did not participate in dividends or distributions. Immediately prior to the consummation of the IPO in November 2014, all outstanding shares of preferred stock and all classes of common stock were converted to shares of voting common stock or non-voting common stock. As a result, voting and non-voting, which participate equally in dividends and distributions, are the only outstanding equity in the Company as of December 31, 2014 and are included in basic EPS for the period outstanding. The following table sets forth the computation of the Company’s basic and diluted net income (loss) per share attributable to common stock for the periods presented (in thousands, except share and per share data):
| For the Year Ended December 31, | ||||||||||||
| 2014 | 2013 | 2012 | ||||||||||
| BASIC: |
||||||||||||
| Net (loss) income |
$ | 60,109 | $ | 10,144 | $ | (145,388 | ) | |||||
| Less: net income allocated to participating securities |
(8,093 | ) | (6,215 | ) | — | |||||||
|
|
|
|
|
|
|
|||||||
| Net (loss) income attributable to common shareholders |
$ | 52,016 | $ | 3,929 | $ | (145,388 | ) | |||||
|
|
|
|
|
|
|
|||||||
| Weighted-average common shares outstanding |
6,175,786 | 701,671 | 701,671 | |||||||||
|
|
|
|
|
|
|
|||||||
| Basic net (loss) income per share |
$ | 8.42 | $ | 5.60 | $ | (207.20 | ) | |||||
|
|
|
|
|
|
|
|||||||
| DILUTED: |
||||||||||||
| Net (loss) income |
$ | 60,109 | $ | 10,144 | $ | (145,388 | ) | |||||
| Less: net income allocated to participating securities |
(6,850 | ) | (4,084 | ) | — | |||||||
|
|
|
|
|
|
|
|||||||
| Net (loss) income attributable to common shareholders |
$ | 53,259 | $ | 6,060 | $ | (145,388 | ) | |||||
|
|
|
|
|
|
|
|||||||
| Weighted-average common shares outstanding-basic |
6,175,786 | 701,671 | 701,671 | |||||||||
| Effect of dilutive potential common shares |
1,294,610 | 945,150 | — | |||||||||
|
|
|
|
|
|
|
|||||||
| Weighted-average common shares outstanding-diluted |
7,470,396 | 1,646,821 | 701,671 | |||||||||
|
|
|
|
|
|
|
|||||||
| Diluted net (loss) income per share |
$ | 7.13 | $ | 3.68 | $ | (207.20 | ) | |||||
|
|
|
|
|
|
|
|||||||
The following warrants and director and employee stock awards were excluded from the calculation of diluted net loss per share attributable to common stockholders because their effect would have been anti-dilutive for the periods presented (share data, in thousands):
| For the Year Ended December 31, | ||||||||||||
| 2014 | 2013 | 2012 | ||||||||||
| Warrants to purchase common stock |
— | 33,124 | 20,090 | |||||||||
| Stock option awards |
17 | — | — | |||||||||
| Restricted stock awards |
— | — | — | |||||||||
100
Table of Contents
Quarterly Financial Information
Quarterly results of operations for the years ended December 31 (unaudited) are summarized below (in millions, except per share amounts):
| First Quarter | Second Quarter | Third Quarter | Fourth Quarter | |||||||||||||
| 2014 (1) |
||||||||||||||||
| Operating revenues |
$ | 313,390 | $ | 398,845 | $ | 405,534 | $ | 372,198 | ||||||||
| Operating income (loss) |
(13,131 | ) | 47,126 | 52,325 | 10,095 | |||||||||||
|
|
|
|
|
|
|
|
|
|||||||||
| Net income (loss) |
(22,354 | ) | 36,983 | 41,608 | 3,872 | |||||||||||
|
|
|
|
|
|
|
|
|
|||||||||
| Basic earnings per share |
$ | (31.86 | ) | $ | 20.42 | $ | 22.97 | $ | 0.17 | |||||||
| Diluted earnings per share |
$ | (31.86 | ) | $ | 11.92 | $ | 13.41 | $ | 0.16 | |||||||
| 2013 |
||||||||||||||||
| Operating revenues |
$ | 301,332 | $ | 376,074 | $ | 387,345 | $ | 359,927 | ||||||||
| Operating income (loss) |
(14,976 | ) | 27,872 | 44,396 | 23,589 | |||||||||||
|
|
|
|
|
|
|
|
|
|||||||||
| Net income (loss) |
(46,388 | ) | 8,849 | 33,503 | 14,180 | |||||||||||
|
|
|
|
|
|
|
|
|
|||||||||
| Basic earnings per share |
$ | (66.11 | ) | $ | 4.89 | $ | 18.49 | $ | 7.83 | |||||||
| Diluted earnings per share |
$ | (66.11 | ) | $ | 3.31 | $ | 10.80 | $ | 4.57 | |||||||
| (1) | Fourth quarter of 2014 includes approximately $19.6 million of salaries, wages and benefits charges resulting from the IPO. |
The sum of the quarterly earnings per share amounts does not equal the annual amount reported since per share amounts are computed independently for each quarter and for the full year based on respective weighted-average common shares outstanding and other dilutive potential common shares.
| ITEM 9. | CHANGES IN AND DISAGREEMENTS WITH ACCOUNTANTS ON ACCOUNTING AND FINANCIAL DISCLOSURE |
None.
| ITEM 9A. | CONTROLS AND PROCEDURES |
Disclosure Controls and Procedures
Our management, with the participation of our Chief Executive Officer and Chief Financial Officer, has evaluated the effectiveness of our disclosure controls and procedures (as defined in Rules 13a-15(e) and 15d-15(e) under the Exchange Act) as of December 31, 2014. Management recognizes that any controls and procedures, no matter how well designed and operated, can provide only reasonable assurance of achieving their objectives, and management necessarily applies its judgment in evaluating the cost-benefit relationship of possible controls and procedures. Based upon that evaluation, our Chief Executive Officer and Chief Financial Officer have concluded that, as of December 31, 2014, our disclosure controls and procedures were effective at the reasonable assurance level in ensuring that information required to be disclosed in reports that we file or submit under the Exchange Act is recorded, processed, summarized and reported within the time periods specified in the rules and forms of the Securities and Exchange Commission (the “SEC”) and is accumulated and communicated to our management, including our Chief Executive Officer and Chief Financial Officer, as appropriate to allow timely decisions regarding required disclosure.
Management’s Report on Internal Control over Financial Reporting
This Annual Report on Form 10-K does not include a report of management’s assessment regarding internal control over financial reporting (as defined in Rule 13a-l5(f) of the Exchange Act) or an attestation report of our independent registered public accounting firm due to a transition period established by the rules of the SEC for newly public companies.
101
Table of Contents
Changes in Internal Control over Financial Reporting
There have been no changes in our internal control over financial reporting that occurred during our fiscal quarter ended December 31, 2014 that have materially affected, or are reasonably likely to materially affect, our internal control over financial reporting.
| ITEM 9B. | OTHER INFORMATION |
None.
PART III
| ITEM 10. | DIRECTORS, EXECUTIVE OFFICERS AND CORPORATE GOVERNANCE |
The information required by this item will be contained in our Proxy Statement and is incorporated herein by reference.
| ITEM 11. | EXECUTIVE COMPENSATION |
The information required by this item will be contained in our Proxy Statement and is incorporated herein by reference.
| ITEM 12. | SECURITY OWNERSHIP OF CERTAIN BENEFICIAL OWNERS AND MANAGEMENT AND RELATED STOCKHOLDER MATTERS |
The information required by this item will be contained in our Proxy Statement and is incorporated herein by reference.
| ITEM 13. | CERTAIN RELATIONSHIPS AND RELATED TRANSACTIONS, AND DIRECTOR INDEPENDENCE |
The information required by this item will be contained in our Proxy Statement and is incorporated herein by reference.
| ITEM 14. | PRINCIPAL ACCOUNTING FEES AND SERVICES |
The information required by this item will be contained in our Proxy Statement and is incorporated herein by reference.
102
Table of Contents
PART IV
| ITEM 15. | EXHIBITS, FINANCIAL STATEMENT SCHEDULES |
| 1. | Financial Statements: |
The financial statements included in Item 8. Financial Statements and Supplementary Data above are filed as part of this annual report.
| 2 | Financial Statement Schedules: |
There are no financial statement schedules filed as part of this annual report, since the required information is included in the Consolidated Financial Statements, including the notes thereto, or the circumstances requiring inclusion of such schedules are not present.
| 3. | Exhibits: |
| Exhibit Number |
Exhibit Description | Incorporated by Reference | Filed Herewith | |||||||
| Form | Exhibit No. |
Filing Date | ||||||||
| 3.1 | Amended and Restated Certificate of Incorporation of Virgin America Inc. | 8-K | 3.1 | 11/19/14 | ||||||
| 3.2 | Amended and Restated Bylaws of Virgin America Inc. | 8-K | 3 | 11/19/2014 | ||||||
| 10.1† | General Terms Agreement No. CFM-04-0012B, dated as of June 14, 2004, between Best Air Holdings, Inc. and CFM International, Inc., as amended by Amendment No. 1, dated November 18, 2005, and as supplemented by Letter Agreement No. 1 dated June 14, 2004 (as amended by Amendment No. 1 to Letter Agreement No. 1, dated October 10, 2005, Amendment No. 2 to Letter Agreement No. 1, dated August 2, 2006, Amendment No. 3 to Letter Agreement No. 1, dated October 8, 2010 and Amendment No. 4 to Letter Agreement No. 1, dated December 29, 2010), Letter Agreement No. 2-2 dated November 1, 2013, Letter Agreement No. 4 dated November 9, 2010, Letter Agreement No. 5 dated April 18, 2011 (as amended by Amendment No. 1 to Letter Agreement No. 5, dated December 20, 2012) and Letter Agreement No. 6 dated October 3, 2011 (as amended by Amendment No. 1 to Letter Agreement No. 6, dated December 20, 2012) | S-1/A | 10 | 10/7/2014 | ||||||
| 10.2† | Amended and Restated Engine Services Agreement, dated as of October 22, 2008, between Virgin America Inc. and GE Engine Services, Inc., as amended by Amendment No. 1, dated July 24, 2009, Amendment No. 2, dated November 29, 2010, Amendment No. 3, dated March 21, 2011, Amendment No. 4, dated April 18, 2011 and Amendment No. 5, dated January 8, 2013 | S-1/A | 10 | 10/7/2014 | ||||||
| 10.3† | Rate Per Flight Hour Agreement for Engine Shop Maintenance Services, dated as of October 1, 2011, between Virgin America Inc. and CFM International, Inc., as amended by Amendment No. 1, dated December 20, 2012 | S-1/A | 10.3 | 10/7/2014 | ||||||
103
Table of Contents
| Exhibit Number |
Exhibit Description | Incorporated by Reference | Filed Herewith |
|||||||||
| Form | Exhibit No. |
Filing Date | ||||||||||
| 10.4† | Signatory Agreement, dated as of November 5, 2009, between Virgin America Inc. and U.S. Bank National Association, as amended by First Amendment, effective as of July 25, 2013 and Second Amendment, dated February 3, 2014 | S-1/A | 10.4 | 11/3/14 | ||||||||
| 10.5† | Signatory Agreement, dated as of August 14, 2012 between Virgin America Inc. and Elavon Financial Services Limited | S-1/A | 10.5 | 11/3/14 | ||||||||
| 10.6† | Signatory Agreement, dated as of June 1, 2010 between Virgin America Inc. and U.S. Bank National Association | S-1/A | 10.6 | 11/3/14 | ||||||||
| 10.7† | Signatory Agreement, dated as of June 1, 2010 between Virgin America Inc. and Elavon Canada Company | S-1/A | 10.7 | 11/3/14 | ||||||||
| 10.8† | Payment Processing Support Services Agreement, dated as of January 20, 2014 by and between Elavon, Inc. and Virgin America Inc | S-1/A | 10.8 | 11/3/14 | ||||||||
| 10.9† | Terms and Conditions of Worldwide Acceptance of the American Express Card by Airlines, dated as of September 1, 2006, by and between Virgin America Inc. and American Express Travel Related Services Company, Inc. | S-1/A | 10.9 | 9/16/14 | ||||||||
| 10.10 | Amendment to the Terms and Conditions of Worldwide Acceptance of the American Express Card by Airlines, dated November 18, 2014, by and between Virgin America Inc. and American Express Travel Related Services Company, Inc. | X | ||||||||||
| 10.11 | Registration Rights Agreement, dated November 13, 2014, among Virgin America Inc. and certain of its stockholders | 8-K | 99.1 | 11/19/14 | ||||||||
| 10.12† | Co-Brand Credit Card Program Agreement, dated as of May 16, 2013, by and between Virgin America Inc. and Comenity Capital Bank | S-1/A | 10.11 | 10/10/14 | ||||||||
| 10.13 | Trade Mark License Agreement, dated as of April 9, 2007, by and among Virgin America Inc., VAL Trademark Three Limited and Virgin Enterprises Limited, as amended by Amendment No. 1 dated March 1, 2013 | S-1/A | 10.12 | 8/25/14 | ||||||||
| 10.14 | Trade Mark License Agreement, dated as of November 24, 2008, by and among Virgin America Inc., Virgin Enterprises Limited, Virgin Money Investment Holdings Limited and Virgin Money Investment Group Limited | S-1 | 10.13 | 7/28/14 | ||||||||
| 10.15 | Office Lease Agreement, dated as of December 9, 2005, between CA-Bay Park Plaza Limited Partnership and Virgin America Inc., as amended by First Amendment, dated as of July 1, 2009, Second Amendment, dated as of March 1, 2010, Third Amendment, dated as of November 5, 2010, Fourth Amendment, dated as of March 28, 2011, Fifth Amendment, dated as of January 23, 2012, Sixth Amendment, dated as of July 31, 2012 and Seventh Amendment, dated as of January 29, 2014 | S-1/A | 10.14 | 8/25/14 | ||||||||
104
Table of Contents
| Exhibit Number |
Exhibit Description | Incorporated by Reference | Filed Herewith | |||||||
| Form | Exhibit No. |
Filing Date | ||||||||
| 10.16† | A320 Aircraft Purchase Agreement, dated as of December 29, 2010, between Airbus S.A.S. and Virgin America Inc., as amended by Amendment No. 1 dated as of March 23, 2011 (as supplemented by Letter Agreement No. 1 to Amendment No. 1, dated March 23, 2011), Amendment No. 2 dated as of September 30, 2011 (as supplemented by Letter Agreement No. 1 to Amendment No. 2, dated September 30, 2011), Amendment No. 3 dated as of December 14, 2012 (as supplemented by Letter Agreement No. 1 to Amendment No. 3, dated December 14, 2012 and Letter Agreement No. 2 to Amendment No. 3, dated December 14, 2012), Amendment No. 4 dated as of October 1, 2012 and Amendment No. 5 dated as of December 14, 2012 (as supplemented by Letter Agreement No. 1 to Amendment No. 5, dated December 14, 2012), and as supplemented by Letter Agreement No. 1 dated as of December 29, 2010, Letter Agreement No. 2 dated as of December 29, 2010, Letter Agreement No. 3 dated as of December 29, 2010, Letter Agreement No. 4 dated as of December 29, 2010, Letter Agreement No. 5A dated as of December 29, 2010, Letter Agreement No. 5B dated as of December 29, 2010, Letter Agreement No. 5C dated as of December 29, 2010, Letter Agreement No. 5D dated as of December 29, 2010, Letter Agreement No. 5E dated as of December 29, 2010, Letter Agreement No. 5F dated as of December 29, 2010, Letter Agreement No. 6 dated as of December 29, 2010, Letter Agreement No. 7 dated as of December 29, 2010, Letter Agreement No. 8 dated as of December 29, 2010, Letter Agreement No. 9 dated as of December 29, 2010, Letter Agreement No. 10 dated as of December 29, 2010 | S-1/A | 10.15 | 10/7/14 | ||||||
| 10.17+ | Amended and Restated 2005 Virgin America Inc. Stock Incentive Plan | S-1 | 10.16 | 7/28/14 | ||||||
| 10.18+ | Form of Stock Option Agreement under 2005 Stock Incentive Plan | S-1 | 10.17 | 7/28/14 | ||||||
| 10.19+ | Form of Restricted Stock Unit Agreement under 2005 Stock Incentive Plan | S-1 | 10.18 | 7/28/14 | ||||||
| 10.20+ | Virgin America Inc. 2014 Equity Incentive Award Plan | S-1/A | 10.19 | 11/3/14 | ||||||
| 10.21+ | Form of Stock Option Agreement under 2014 Equity Incentive Award Plan | S-1/A | 10.20 | 11/3/14 | ||||||
| 10.22+ | Form of Restricted Stock Agreement under 2014 Equity Incentive Award Plan | S-1/A | 10.21 | 11/3/14 | ||||||
| 10.23+ | Form of Restricted Stock Unit Agreement under 2014 Equity Incentive Award Plan | S-1/A | 10.22 | 11/3/14 | ||||||
| 10.24+ | Employee Stock Purchase Plan | S-1/A | 10.23 | 11/3/14 | ||||||
105
Table of Contents
| Exhibit Number |
Exhibit Description | Incorporated by Reference | Filed Herewith | |||||||
| Form | Exhibit No. |
Filing Date | ||||||||
| 10.25+ | Offer Letter by and between Virgin America Inc. and David Cush dated as of December 18, 2007 | S-1 | 10.24 | 7/28/14 | ||||||
| 10.26+ | Offer Letter by and between Virgin America Inc. and Frances Fiorillo dated as of January 20, 2006 | S-1 | 10.25 | 7/28/14 | ||||||
| 10.27+ | Offer Letter by and between Virgin America Inc. and Steve Forte dated as of March 15, 2013 | S-1 | 10.26 | 7/28/14 | ||||||
| 10.28+ | Offer Letter by and between Virgin America Inc. and Peter Hunt dated as of May 26, 2011 | S-1 | 10.27 | 7/28/14 | ||||||
| 10.29+ | Offer Letter by and between Virgin America Inc. and John MacLeod dated as of July 18, 2012 | S-1 | 10.28 | 7/28/14 | ||||||
| 10.30+ | Offer Letter by and between Virgin America Inc. and John Varley dated as of June 22, 2010 | S-1 | 10.29 | 7/28/14 | ||||||
| 10.31+ | Form of Change in Control and Severance Agreement | S-1/A | 10.30 | 11/3/14 | ||||||
| 10.32+ | Management Incentive Compensation Plan | S-1 | 10.31 | 7/28/14 | ||||||
| 10.33 | Second Amended and Restated Note Purchase Agreement, dated as of December 9, 2011, among Virgin America Inc., Virgin Management Limited, VA Holdings (Guernsey) LP and the Bank of Utah, as collateral agent, as amended by Amendment No. 1, dated as of May 10, 2013 | S-1/A | 10.33 | 9/8/14 | ||||||
| 10.34 | Second Amended and Restated Additional Note Purchase Agreement, dated as of December 9, 2011, among Virgin America Inc., Virgin Management Limited, VA Holdings (Guernsey) LP, the Cyrus Parties (as defined therein) and the Bank of Utah, as collateral agent, as amended by Amendment No. 1, dated as of May 10, 2013 | S-1/A | 10.34 | 9/8/14 | ||||||
| 10.35 | Amended and Restated Third Note Purchase Agreement, dated as of December 9, 2011, among Virgin America Inc., Virgin Management Limited, VA Holdings (Guernsey) LP, the Cyrus Parties (as defined therein) and the Bank of Utah, as collateral agent, as amended by Amendment No. 1, dated as of May 10, 2013 | S-1/A | 10.35 | 9/8/14 | ||||||
| 10.36 | Fourth Note Purchase Agreement, dated as of December 9, 2011, among Virgin America Inc., Virgin Management Limited, the Cyrus Parties (as defined therein) and the Bank of Utah, as collateral agent, as amended by Amendment No. 1, dated as of May 10, 2013 | S-1/A | 10.36 | 9/8/14 | ||||||
| 10.37 | Fifth Note Purchase Agreement, dated as of May 10, 2013, among Virgin America Inc., Virgin Management Limited, the Cyrus Parties (as defined therein) and the Bank of Utah, as collateral agent | S-1/A | 10.37 | 9/8/14 | ||||||
| 10.38 | Form of Seventh Closing Warrant Agreement, between Virgin America Inc. and certain entities affiliated with Virgin Group Holdings Limited | S-1/A | 10.44 | 9/8/14 | ||||||
106
Table of Contents
| Exhibit Number |
Exhibit Description | Incorporated by Reference | Filed Herewith | |||||||
| Form | Exhibit No. |
Filing Date | ||||||||
| 10.39 | Form of Seventh Closing Warrant Agreement, between Virgin America Inc. and certain funds affiliated with or related to Cyrus Capital Partners, L.P. | S-1/A | 10.45 | 9/8/14 | ||||||
| 10.40 | Form of Indemnification Agreement between Virgin America Inc. and its directors and executive officers | S-1/A | 10.32 | 10/7/14 | ||||||
| 10.41 | Recapitalization Agreement dated November 13, 2014 among Virgin America Inc. and certain of its stockholders | 8-K | 99.2 | 11/19/14 | ||||||
| 10.42 | Note Purchase Agreement dated November 19, 2014 between Virgin America Inc. and Virgin Management Limited | 8-K | 99.3 | 11/19/14 | ||||||
| 10.43 | Letter of Credit Reimbursement Agreement dated November 18, 2014 between Virgin America Inc. and Virgin Holdings Limited | 8-K | 99.4 | 11/19/14 | ||||||
| 10.44 | Letter Agreement dated November 13, 2014 between Virgin America Inc. and certain affiliates of Virgin Group Holdings Limited | 8-K | 99.5 | 11/19/14 | ||||||
| 10.45 | Amended and Restated Virgin America Trade Mark License dated November 13, 2014 among Virgin America Inc., Virgin Aviation TM Limited and Virgin Enterprises Limited | 8-K | 99.6 | 11/19/14 | ||||||
| 10.46 | Securities Purchase Agreement, dated November 2, 2014, among Virgin America Inc., Cyrus Aviation Holdings, LLC, VX Holdings, L.P. and PAR Investment Partners, L.P. | 8-K | 99.7 | 11/19/14 | ||||||
| 14.1 | Code of Business Conduct and Ethics | S-1 | 14.1 | 11/3/14 | ||||||
| 23.1 | Consent of Ernst & Young LLP, independent registered public accounting firm | X | ||||||||
| 24.1 | Power of Attorney (included on the signature page to this Annual Report on Form 10-K) | X | ||||||||
| 31.1 | Certification of the Chief Executive Officer pursuant to Section 302 of the Sarbanes-Oxley Act of 2002 | X | ||||||||
| 31.2 | Certification of the Chief Financial Officer pursuant to Section 302 of the Sarbanes-Oxley Act of 2002 | X | ||||||||
| 32.1** | Certifications pursuant to 18 U.S.C. Section 1350, as adopted pursuant to Section 906 of the Sarbanes-Oxley Act of 2002 | X | ||||||||
| ** | The certification attached as Exhibit 32.1 that accompanies this Annual Report on Form 10-K is not deemed filed with the Securities and Exchange Commission and is not to be incorporated by reference into any filing of Virgin America Inc. under the Securities Act of 1933, as amended, or the Securities Exchange Act of 1934, as amended, whether made before or after the date of this Form 10-K, irrespective of any general incorporation language contained in such filing. |
| + | Indicates a management contract or compensatory plan or arrangement. |
| † | Confidential treatment granted for certain portions of this Exhibit pursuant to Rule 406 under the Securities Act or Rule 24b-2 under the Exchange Act, which portions are omitted and filed separately with the Securities and Exchange Commission. |
107
Table of Contents
SIGNATURES
Pursuant to the requirements of Section 13 or 15(d) of the Securities Exchange Act of 1934, the registrant has duly caused this Annual Report on Form 10-K to be signed on its behalf by the undersigned, thereunto duly authorized.
Dated: March 2, 2015
| VIRGIN AMERICA INC. | ||
| By: |
/s/ C. DAVID CUSH | |
| C. David Cush President and Chief Executive Officer | ||
POWER OF ATTORNEY
KNOW ALL PERSONS BY THESE PRESENTS, that each person whose signature appears below constitutes and appoints Peter D. Hunt and John J. Varley, jointly and severally, his or her attorney-in-fact, with the power of substitution, for him or her in any and all capacities, to sign any amendments to this Annual Report on Form 10-K and to file the same, with exhibits thereto and other documents in connection therewith, with the Securities and Exchange Commission, hereby ratifying and confirming all that each of said attorneys-in-fact, or his or her substitute or substitutes, may do or cause to be done by virtue hereof.
Pursuant to the requirements of the Securities Exchange Act of 1934, this Annual Report on Form 10-K has been signed below by the following persons on behalf of the registrant and in the capacities and on the dates indicated.
| Signature |
Title |
Date | ||
| /s/ C. DAVID CUSH |
President and Chief Executive Officer (principal executive officer) | March 2, 2015 | ||
| C. David Cush |
||||
| /s/ PETER D. HUNT Peter D. Hunt |
Senior Vice President & Chief Financial Officer (principal financial and accounting officer) | March 2, 2015 | ||
| /s/ DONALD J. CARTY |
Director (Chairman of the Board) | March 2, 2015 | ||
| Donald J. Carty |
||||
| /s/ SAMUEL K. SKINNER |
Director (Vice Chairman of the Board) | March 2, 2015 | ||
| Samuel K. Skinner |
||||
| /s/ CYRUS F. FREIDHEIM, JR. |
Director | March 2, 2015 | ||
| Cyrus F. Freidheim, Jr. |
||||
| /s/ STEPHEN C. FREIDHEIM |
Director | March 2, 2015 | ||
| Stephen C. Freidheim |
||||
| /s/ EVAN M. LOVELL |
Director | March 2, 2015 | ||
| Evan M. Lovell |
||||
| /s/ ROBERT A. NICKELL |
Director | March 2, 2015 | ||
| Robert A. Nickell |
||||
| /s/ JOHN R. RAPAPORT |
Director | March 2, 2015 | ||
| John R. Rapaport |
||||
| /s/ STACY J. SMITH |
Director | March 2, 2015 | ||
| Stacy J. Smith |
||||