Attached files
| file | filename |
|---|---|
| EX-31.1 - EXHIBIT 31.1 - OCLARO, INC. | ex-311.htm |
| EX-31.2 - EXHIBIT 31.2 - OCLARO, INC. | ex-312.htm |
| EX-32.2 - EXHIBIT 32.2 - OCLARO, INC. | ex-322.htm |
| EX-32.1 - EXHIBIT 32.1 - OCLARO, INC. | ex-321.htm |
| EX-23.1 - EXHIBIT 23.1 - OCLARO, INC. | ex-231_consent2015.htm |
| EX-21.1 - EXHIBIT 21.1 - OCLARO, INC. | ex-211_significantsubsidia.htm |
| EX-10.48 - EXHIBIT 10.48 - OCLARO, INC. | ex-1048_supplementalleasec.htm |
| XML - IDEA: XBRL DOCUMENT - OCLARO, INC. | R9999.htm |
| EX-10.47 - EXHIBIT 10.47 - OCLARO, INC. | ex-1047_leasecontract.htm |
UNITED STATES
SECURITIES AND EXCHANGE COMMISSION
Washington, DC 20549
FORM 10-K
x | ANNUAL REPORT PURSUANT TO SECTION 13 OR 15(d) OF THE SECURITIES EXCHANGE ACT OF 1934 |
FOR THE FISCAL YEAR ENDED JUNE 27, 2015
or
¨ | TRANSITION REPORT PURSUANT TO SECTION 13 OR 15(d) OF THE SECURITIES EXCHANGE ACT OF 1934 |
For the transition period from to
Commission file number: 000-30684

OCLARO, INC.
(Exact Name of Registrant as Specified in Its Charter)
Delaware | 20-1303994 | |
(State or other jurisdiction of incorporation or organization) | (I.R.S. Employer Identification No.) | |
2560 Junction Avenue, San Jose, California, 95134
(Address of principal executive offices, zip code)
(408) 383-1400
(Registrant’s telephone number, including area code)
Securities registered pursuant to Section 12(b) of the Act:
Title of each class | Name of each exchange on which registered | |
Common Stock, Par Value $0.01 Per Share | NASDAQ Global Select Market | |
Securities registered pursuant to Section 12(g) of the Act: None
Indicate by check mark if the Registrant is a well-known seasoned issuer, as defined in Rule 405 of the Securities Act. Yes ¨ No x
Indicate by check mark if the Registrant is not required to file reports pursuant to Section 13 or Section 15(d) of the Act. Yes ¨ No x
Indicate by check mark whether the registrant: (1) has filed all reports required to be filed by Section 13 or 15(d) of the Securities Exchange Act of 1934 during the preceding 12 months (or for such shorter period that the registrant was required to file such reports), and (2) has been subject to such filing requirements for the past 90 days. Yes x No ¨
Indicate by check mark whether the registrant has submitted electronically and posted on its corporate Web site, if any, every Interactive Data File required to be submitted and posted pursuant to Rule 405 of Regulation S-T during the preceding 12 months (or for such shorter period that the registrant was required to submit and post such files). Yes x No ¨
Indicate by check mark if disclosure of delinquent filers pursuant to Item 405 of Regulation S-K is not contained herein, and will not be contained, to the best of the registrant’s knowledge, in definitive proxy or information statements incorporated by reference in Part III of this Form 10-K or any amendment to this Form 10-K. ¨
Indicate by check mark whether the registrant is a large accelerated filer, an accelerated filer, a non-accelerated filer, or a smaller reporting company. See the definitions of “large accelerated filer,” “accelerated filer” and “smaller reporting company” in Rule 12b-2 of the Exchange Act. (Check one):
Large accelerated filer | ¨ | Accelerated filer | x | |||
Non-accelerated filer | ¨ | (Do not check if a smaller reporting company) | Smaller reporting company | ¨ | ||
Indicate by check mark whether the registrant is a shell company (as defined in Rule 12b-2 of the Exchange Act). Yes ¨ No x
The aggregate market value of the common stock held by non-affiliates of the registrant was $201,493,136 based on the last reported sale price of the registrant’s common stock on December 27, 2014 as reported by the NASDAQ Global Select Market ($1.88 per share). As of August 21, 2015, there were 110,147,993 shares of common stock outstanding.
DOCUMENTS INCORPORATED BY REFERENCE
Part III incorporates certain information by reference from the registrant’s Proxy Statement for its 2015 Annual Meeting of Stockholders, which will be filed on or before October 26, 2015. With the exception of the sections of the registrant’s Proxy Statement for its 2015 Annual Meeting of Stockholders specifically incorporated herein by reference, the registrant’s Proxy Statement for its 2015 Annual Meeting of Stockholders is not deemed to be filed as part of this Form 10-K.
OCLARO, INC.
ANNUAL REPORT ON FORM 10-K
FOR THE FISCAL YEAR ENDED JUNE 27, 2015
TABLE OF CONTENTS
Page | ||
Item 1. | ||
Item 1A. | ||
Item 1B. | ||
Item 2. | ||
Item 3. | ||
Item 4. | ||
Item 5. | ||
Item 6. | ||
Item 7. | ||
Item 7A. | ||
Item 8. | ||
Item 9. | ||
Item 9A. | ||
Item 9B. | ||
Item 10. | ||
Item 11. | ||
Item 12. | ||
Item 13. | ||
Item 14. | ||
Item 15. | ||
SPECIAL NOTE REGARDING FORWARD-LOOKING STATEMENTS
This Annual Report on Form 10-K and the documents incorporated herein by reference contain forward-looking statements, within the meaning of Section 21E of the Securities Exchange Act of 1934, as amended, and Section 27A of the Securities Act of 1933, as amended, about our future expectations, plans or prospects and our business. You can identify these statements by the fact that they do not relate strictly to historical or current events, and contain words such as “anticipate,” “estimate,” “expect,” “project,” “intend,” “will,” “plan,” “believe,” “should,” “outlook,” “could,” “target,” “model,” “may” and other words of similar meaning in connection with discussion of future operating or financial performance. We have based our forward looking statements on our management’s beliefs and assumptions based on information available to our management at the time the statements are made. There are a number of important factors that could cause our actual results or events to differ materially from those indicated by such forward-looking statements, including (i) our ability to timely develop, commercialize and ramp the production of new products, (ii) our ability to increase the percentage of sales associated with our new products, (iii) our ability to respond to evolving technologies, customer requirements and demands, and product design challenges, (iv) our dependence on a limited number of customers for a significant percentage of our revenues, (v) our ability to maintain strong relationships with certain customers, (vi) the effects of fluctuating product mix on our results, (vii) competition and pricing pressure, (viii) our ability to effectively manage our inventory, (ix) our ability to meet or exceed our gross margin expectations, (x) the effects of fluctuations in foreign currency exchange rates, (xi) our ability to maintain or increase our cash reserves and obtain debt or equity-based financing on acceptable terms or at all, (xii) our future performance and our ability to effectively restructure our operations and business, (xiii) our ability to effectively compete with companies that have greater name recognition, broader customer relationships and substantially greater financial, technical and marketing resources, (xiv) our ability to timely capitalize on any increase in market demand, (xv) our ability to service and repay our outstanding indebtedness pursuant to the terms of the applicable agreements, (xvi) the potential inability to realize the expected benefits of asset dispositions, (xvii) the sale of businesses which may or may not arise in connection with executing our restructuring plans, (xviii) our ability to reduce costs and operating expenses, (xix) increased costs related to downsizing and compliance with regulatory and legal requirements in connection with such downsizing, (xx) the risks associated with our international operations, (xxi) the impact of continued uncertainty in world financial markets and any resulting reduction in demand for our products, (xxii) the outcome of tax audits or similar proceedings, (xxiii) the outcome of pending litigation against us, and (xxiv) other factors described in other documents we periodically file with the SEC. We cannot guarantee any future results, levels of activity, performance or achievements. You should not place undue reliance on forward-looking statements. Moreover, we assume no obligation to update forward-looking statements or update the reasons actual results could differ materially from those anticipated in forward-looking statements. Several of the important factors that may cause our actual results to differ materially from the expectations we describe in forward-looking statements are identified in the sections captioned “Business,” “Risk Factors,” and “Management’s Discussion and Analysis of Financial Condition and Results of Operations” in this Annual Report on Form 10-K and the documents incorporated herein by reference.
As used herein, “Oclaro,” “we,” “our,” and similar terms include Oclaro, Inc. and its subsidiaries, unless the context indicates otherwise.
3
PART I
Item 1. Business
Overview of Oclaro
During our fiscal year 2015, we were one of the leading providers of optical components, modules and subsystems for the core optical transport, service provider, enterprise and data center markets. Leveraging over three decades of laser technology innovation, photonic integration and subsystem design, we provide differentiated solutions for optical networks and high-speed interconnects driving the next wave of streaming video, cloud computing, application virtualization and other bandwidth-intensive and high-speed applications.
Our customers include ADVA Optical Networking ("ADVA"); Alcatel-Lucent; Ciena Corporation ("Ciena"); Cisco Systems, Inc. ("Cisco"); Coriant GmbH ("Coriant"); Fiberhome Networks ("Fiberhome"); Huawei Technologies Co. Ltd ("Huawei"); Juniper Networks, Inc. ("Juniper"); Telefonaktiebolaget LM Ericsson ("Ericsson") and ZTE Corporation ("ZTE").
Corporate Information
We were incorporated in Delaware in June 2004. On September 10, 2004, we became the publicly traded parent company of the Oclaro Technology Ltd (formerly Bookham Technology plc) group of companies, including Oclaro Technology Ltd, a limited company incorporated under the laws of England and Wales whose stock was previously traded on the London Stock Exchange and the NASDAQ National Market under the Bookham name. Effective January 3, 2011, our common stock is traded on the NASDAQ Global Select Market under the symbol “OCLR.”
Our principal executive offices are located at 2560 Junction Avenue, San Jose, California 95134, and our telephone number at that location is (408) 383-1400. We maintain a web site with the address www.oclaro.com. Our web site includes links to our Code of Business Conduct and Ethics and our Audit Committee, Compensation Committee, and Nominating and Corporate Governance Committee charters. We did not waive any provisions of our Code of Business Conduct and Ethics during the year ended June 27, 2015. We are not including the information contained in our web site or any information that may be accessed through our web site as part of, or incorporating it by reference into, this Annual Report on Form 10-K. We make available free of charge, through our web site, our annual reports on Form 10-K, quarterly reports on Form 10-Q, and current reports on Form 8-K, and amendments to these reports, as soon as reasonably practical after such material is electronically filed with, or furnished to, the Securities and Exchange Commission ("SEC"). Any document we file with the SEC, may be inspected, without charge, at the SEC’s public reference room at 100 F Street NE, Washington, DC 20549 or may be obtained by calling the SEC at 1-800-SEC-0330 or at the SEC’s internet address at http://www.sec.gov (the information contained in the SEC’s website is not intended to be a part of this filing).
Recent Developments
Business Combinations and Dispositions
On December 30, 2014, we entered into a Settlement Agreement with II-VI Incorporated, a Pennsylvania corporation (“II-VI”) and II-VI Holdings B.V., a Netherlands corporation (“II-VI B.V.,” and together with II-VI, the "II-VI Parties"), a wholly-owned subsidiary of II-VI, regarding disposition of the amounts held back by the II-VI Parties pursuant to the Share and Asset Purchase Agreement between Oclaro Technology and II-VI B.V. (as previously disclosed in our Current Report on Form 8-K filed on September 17, 2013) and pursuant to the Asset Purchase Agreement between Oclaro Technology and II-VI (as previously disclosed in our Current Report on Form 8-K filed on October 11, 2013) (the “Settlement Agreement”). Of the $10.0 million aggregate holdback, a total of $2.35 million was paid to us in January 2015 and a total of $7.65 million was released to II-VI Holdings B.V. We and the II-VI Parties also agreed to a mutual release of certain claims related to the Share and Asset Purchase Agreement, the Asset Purchase Agreement and certain related documents and transactions.
On August 5, 2014, Oclaro Japan, Inc. our wholly-owned subsidiary (“Oclaro Japan”), entered into a Master Separation Agreement (“MSA”) with Ushio Opto Semiconductors, Inc. (“Ushio Opto”) and Ushio, Inc. (“Ushio”), whereby Ushio Opto agreed to acquire the industrial and consumer business of Oclaro Japan located at its Komoro, Japan facility (the “Komoro Business”), by means of an absorption-type demerger under the Japanese Companies Act (such transaction, the “Transaction”). On October 27, 2014, the sale was completed. Consideration for the Transaction consisted of 1.85 billion Japanese yen (approximately $17.1 million based on the exchange rate on October 27, 2014) in cash, of which 1.6 billion Japanese yen (approximately $14.8 million based on the exchange rate on October 27, 2014) was paid at the closing and 250 million Japanese yen (approximately $2.1 million based on the exchange rate on April 24, 2015) was paid into escrow and was released to Oclaro Japan on April 24, 2015. In addition, under the MSA, we are subject to a post-closing net asset valuation adjustment. We determined that based on the net assets transferred to Ushio Opto during the second quarter of fiscal year 2015, we owed
4
Ushio Opto a post-closing net asset valuation adjustment of $1.4 million, which was paid to Ushio Opto in the third quarter of fiscal year 2015.
Convertible Notes
On February 19, 2015, we closed the private placement of $65.0 million aggregate principal amount of Convertible Senior Notes ("6.00% Notes"). The 6.00% Notes were sold at 100 percent of par, resulting in net proceeds of approximately $61.6 million, after deducting the Initial Purchaser’s discounts. We also incurred offering expenses of $0.6 million. We intend to use the net proceeds of the offering for general corporate purposes, including working capital for, among other things, investing in development of new products and technologies.
Employee Stock Plans
On July 30, 2014, our board of directors approved the Fifth Amended and Restated 2001 Long-Term Stock Incentive Plan (the “Plan”) and on November 14, 2014, our shareholders ratified this plan. The Plan amends and restates in its entirety the Fourth Amended and Restated 2001 Long-Term Stock Incentive Plan. The Plan (i) increases the number of shares of common stock available for issuance by 6.0 million shares, (ii) consolidates the share reserve of the Plan with the share reserve of the Amended and Restated 2004 Stock Incentive Plan ("2004 Plan"), such that from November 14, 2014, no additional awards will be granted under the 2004 Plan, and (iii) establishes that full value awards count as 1.40 shares of common stock for purposes of the Plan.
Litigation Update
On August 21, 2015, the Shaanxi High Court in China delivered its judgment to Oclaro Technology (Shenzhen) Co., Ltd. or Oclaro Shenzhen. See Legal Proceedings-Specific Matters- Raysung Commercial Litigation in Part I, Item 3 for additional details regarding this litigation. Following the delivery of this judgment, we recorded a $2.5 million charge in selling, general and administrative expense within our consolidated statement of operations for fiscal year 2015 and the quarter ended June 27, 2015 and $2.5 million in accrued expenses and other liabilities in our consolidated balance sheet at June 27, 2015. As a result, both the operating loss and net loss we reported in our earnings release for the fiscal year and quarter ended June 27, 2015 and included in our Current Report on Form 8-K furnished to the SEC on August 4, 2015, was $2.5 million less, the amount of the settlement, than the operating loss and net loss reported below and reflected in our consolidated financial statements included elsewhere in this Annual Report on Form 10-K.
Our Business
We are a supplier of core optical network technology to leading telecommunication and data communication equipment companies worldwide. We target communications equipment manufacturers that integrate our optical technology into the switching, routing and transport systems they offer to the global service and content providers that are building, upgrading and operating high-performance optical networks. Service and content providers are increasingly demanding greater levels of network capacity from their communications equipment suppliers, our primary customers, in order to meet their rapidly growing network bandwidth requirements. This is being driven by bandwidth intensive applications and devices that are at the access or edge of the network, such as all forms of mobile devices, streaming video, social media, cloud computing and voice over Internet Protocol ("VoIP"). The optical communications market has started to expand beyond a small number of very large service providers, and is now transitioning to a variety of open and captive networks created solely for in house use by large video services, search engines and companies offering a variety of cloud computing services. We believe that the trend toward an increase in demand for optical solutions, which increase network capacity, is in response to growing bandwidth demand driven by increased transmission of video, voice and data over optical communication networks. Service providers also seek to decrease the total cost of ownership of their networks, and many of our advanced optical solutions, both now and potentially in terms of future optical technologies to enable new network architectures, can provide a level of flexibility and responsiveness that will support these goals by enabling savings in both operational and capital expenses. The rapid development of network infrastructure underway in developing countries is also driving growth in demand for optical solutions. Increasingly, internet content providers with their own wide area networks have similar requirements and are also becoming customers for our optical network products. We design, manufacture and market optical components, modules and subsystems that generate, detect, combine and separate light signals in optical communications networks. During fiscal year 2015, we were a leading supplier of optical products at the component level, including tunable lasers, external modulators, integrated lasers and modulators and receivers. During fiscal year 2015, we were also a leading supplier of products at the module and subsystem levels, including transceivers, transponders and controlled subsystems. Many of our products enable increased flexibility in optical communications networks, making the networks more dynamic in nature. We supply transmission products at the component level and the module level into 10 gigabits per second ("Gb/s"), 40 Gb/s and 100 Gb/s communications solutions.
5
Additionally, in data communications ("datacom"), enterprises and institutions such as datacenters have grown in complexity as they manage the rapidly escalating demands for increased bandwidth and diverse types of data driven through the consumerization of information technology and the transition to Software as a Service ("SaaS") services. These next generation architectures, such as hyperscale datacenters, require very high speed interconnects to support intensive data traffic within and between corporate datacenters. The providers of hyperscale datacenters are upgrading and deploying their own high-speed local, storage and wide-area networks, also called LANs, SANs and WANs, respectively. These deployments increase the ability to utilize high-bandwidth applications that are growing in importance to their organizations and also increase utilization across telecommunications networks as this traffic leaves the LANs, SANs and WANs and travels over the network service providers’ edge and core networks. We are a leading supplier of client-side and short reach optical transceivers at 10 Gb/s, 40 Gb/s, 100 Gb/s and, in some cases, less than 10 Gb/s, into data communications and enterprise solutions.
With the increasing demand of mobile connectivity on an ever increasing range of devices, from phones to tablet computers, enabling the consumer to use bandwidth intensive applications such as video streaming requires mobile infrastructure providers to use optical solutions from the mast head to a remote terminal and/or central office. We are a supplier of optical transceivers at speeds up to 10 Gb/s into the wireless fronthaul and backhaul market.
Competitive Differentiation
We believe that demonstrating the following competitive strengths will continue to be important to maintain and reinforce our position as a leading provider of core optical network components, modules and subsystems:
• | Optical Technology Leadership. We have extensive expertise in optical technologies including optoelectronic semiconductors, electronics design, firmware and software capabilities. Our expertise includes III-V optoelectronic semiconductors utilizing indium phosphide ("InP") substrates. As of June 27, 2015, we have approximately 1,000 patents issued. Our intellectual property ("IP") portfolio represents a significant investment in the optical industry over the past 30 years. We believe our commitment to the optical industry and our IP and know-how represents a differentiated value proposition for our customers. We are a leading supplier in many of our metro and long-haul telecom product markets. |
• | Leading Photonic Integration Capabilities. Photonic integration, which is the combination of multiple functions on one chip, is an important source of differentiation. Photonic integration can reduce the number of component elements, and thus the cost, of a solution, reduce the footprint of the required functionality, reduce the complexity of the corresponding integration of component elements and reduce overall power consumption of the related functionality. Our wafer fabrication facilities and process technologies position us to be a leader in delivering photonic integration. We believe that photonic integration will enable us to capture additional value in the optical network supply chain as customers demand increasing product integration and complexity to build the next generation network. |
• | Vertically Integrated Approach. Our wafer fabrication facilities position us to introduce product innovations delivering optical network cost and performance advantages to our customers. We believe that the combination of our in-house control of the product lifecycle process combined with the scalability and flexibility of our contract manufacturers enables us to respond more quickly to changing customer requirements, allowing our customers to reduce the time it takes them to deliver products to market. We operate back-end assembly and test facilities in China and Japan. We believe that our ability to deliver innovative technologies in a variety of vertical form factors, ranging from chip level to module level to subsystem level, allows us to address the needs of a broad base of potential customers regardless of their desired level of product integration or complexity. |
• | Flexibility and Responsiveness to Customers. We believe that providing innovative solutions to enhance our customers’ ease of doing business is critical to success, and this is at the core of our strategy. This includes exhibiting high standards of flexibility and quality and the ability to provide products ranging from standard components to advanced subsystems designed in partnership with our customers. We are a leading supplier of optical products at the component level, including tunable lasers, external modulators, integrated lasers and modulators and receivers. We are also a leading supplier of products at the module and subsystem levels, including transceivers, transponders, and controlled subsystems. |
Business Strategy
In order to maintain our position as a leading provider of core optical network components, modules and subsystems, we are continuing to pursue the following business strategies:
• | Increase the Focus of Our Business on Our Core Competencies. We do not believe that our recent operating results have been satisfactory. We believe that, in order to have an opportunity to potentially execute a plan that restores us to profitability, we need to ensure our overhead expenses continue to be aligned with our revenue levels, refine the focus of our research and development efforts into areas where we have the potential for significant technological |
6
differentiation, and continue to simplify our operating footprint. For example, in October 2014, we completed the sale of the industrial and consumer business of Oclaro Japan, which simplifies our operating footprint and generated capital for other improvements. We have also deemed our 40 Gb/s transmission products to be mature and have decreased the corresponding research and development expenditures and/or reallocated the expenditures to product areas with more potential for technology differentiation in high growth markets such as 100 Gb/s, 200 Gb/s and 400 Gb/s.
• | Maintain Focus on Communications Networks. We are positioned as a key strategic supplier to the major telecom equipment and datacom equipment companies and intend to continue to focus on enabling our customers to build equipment for the implementation of next generation core optical networks. Our optical IP and development expertise provides us with optical network insights that enable us to partner with our customers to continue to develop and deliver innovative optical solutions. We plan to continue to work with our customers to develop key technologies and expand our product offerings across the optical network. |
• | Expand Position with Tier One Customers Through Technology Innovation and Manufacturing Flexibility. We believe we are a market leader in many of the market segments we address. Our combination of technology innovation and manufacturing flexibility enable us to deliver low-latency, high-performance products to our customers. We believe our customer-centric strategy will enable us to continue to gain share in our markets by innovating in partnership with our customers and delivering cost-effective solutions to them. |
• | Capture Share in New and Emerging Web 2.0 and Datacenter Markets. The emerging datacenter and Web 2.0 markets are one of the fastest growing segments in optical communications, both in terms of capital network equipment investment and growth of high data rate optical transceivers. To support the higher data rates needed, single mode fiber is the connectivity media of choice for greenfield data centers, maximizing the operators’ return on investment. We are ideally placed with our technology to support a broad portfolio of high speed discrete lasers, receivers, optical sub-assemblies and transceivers, and supporting this market segment is a key strategic initiative for us as we move forward. |
• | Extend Optical Product Differentiation. We plan to continue to invest in optical innovation in order to power the infrastructure required to serve the rapidly growing demand for bandwidth. Our photonic integration capability enables additional functionality of our products and we plan to continue to leverage this advantage to advance optical technology in the network. We also plan to evaluate acquisitions of and investments in complementary businesses, products or technologies in order to continuously improve our solutions for customers. |
• | Match Global Engineering and Manufacturing Resources with Customer Demands. We believe our global engineering and manufacturing infrastructure enables us to deliver cost-effective solutions for our customers and meet our time to market objectives. Our use of contract manufacturers, primarily in Southeast Asia, to augment our internal manufacturing capabilities, provides us with an effective cost base and enables us to dynamically manage our production in the face of varying customer demand. We also operate back-end assembly and test facilities in China and Japan. We continually evaluate the capabilities of additional potential contract manufacturing partners to ensure we have a scalable and cost effective manufacturing strategy appropriate for executing to our business objectives over a long-term horizon. |
• | In the Future We May Consider the Use of Strategic Investments, Acquisitions and Divestitures to Maintain an Optical Leadership Position. In the short term we expect to focus our strategy on improving our existing businesses and do not anticipate making strategic investments or acquiring companies or businesses to extend or reinforce our position. However, we could consider the use of strategic investments, acquisitions and divestitures in the future. Our industry has historically been fragmented and characterized by large numbers of competitors, but in recent years has experienced increasing levels of consolidation. In addition to our internal development capabilities, we have used acquisitions as a means to enhance our scale, obtain critical technologies and enter new markets. We have historically expanded our business through acquisitions where we have seen an opportunity to enhance scale, broaden our product offerings or integrate new technology. Our July 2012 acquisition of Opnext was consistent with this strategy. In addition, we have participated in significant past merger, acquisition and divestiture activities, including our merger with Avanex in April 2009; our acquisition of Xtellus, Inc. ("Xtellus") in December 2009; our acquisition of Mintera Corporation ("Mintera") in July 2010; and divestitures of our Zurich Business in September 2013, our Amplifier Business in November 2013 and our industrial and consumer business based in Komoro, Japan (the "Komoro Business") in October 2014. |
Our Product Offerings
• | Client Side Transceivers. Our pluggable transceiver portfolio includes fixed wavelength SFP at data rates less than 10 Gb/s, Xenpak, X2, XFP and SFP+ at 10 Gb/s, QSFP at 40 Gb/s, CFP, CFP2 and CFP4 at 100 Gb/s. These package form factors support different link distances based on different optical connectors and media types, in both industry |
7
standard and proprietary optical specifications. These link distances typically go from 100 meters to 100 kilometers, depending on the laser and receiver technology utilized.
• | Line Side Transceivers. We believe the photonic integration of our internal components represents a differentiator and a competitive advantage in our 10 Gb/s tunable XFP and tunable SFP+ products. We were the first company to supply coherent CFP2 transceivers at 100 Gb/s and 200 GB/s. Our internal device and sub-assembly technology enables our customers to provide a coherent pluggable 100 Gb/s solution for metro and long haul networks. |
• | Tunable laser transmitters. Our tunable laser products include discrete lasers and co-packaged laser modulators to optimize performance and reduce the size of the product. Our tunable products at the component level include an InP tunable laser chip, an integrated tunable laser assembly ("iTLA") and a 10 Gb/s co-packaged laser modulator tunable compact mach-zender. We also supply our tunable components into our customers’ 40 Gb/s products, and believe we are a primary supplier of these and related components into the 40 Gb/s solutions commercially available today. We are ramping production of our micro-iTLA product, which is a tunable laser product suitable for 100 Gb/s systems. |
• | Lithium niobate modulators. Our lithium niobate external modulators are optical devices that manipulate the phase or the amplitude of an optical signal. Their primary function is to transfer information on an optical carrier by modulating the light. These devices externally modulate the lasers of discrete transmitter products including, but not limited to, our own standalone laser products. We are leaders in the market for 10 Gb/s modulators, and are ramping production of 100 Gb/s modulators for coherent applications. |
• | Transponder modules. Our transponder modules provide both transmitter and receiver functions. A transponder includes electrical circuitry to control the laser diode and modulation function of the transmitter as well as the receiver electronics. We supply a small form factor tunable transponder at 10 Gb/s, and large form factor 40 Gb/s transponders based on a differential phase shift keying ("DPSK") modulation scheme. We believe the photonic integration of our internal componentry can represent a differentiator and a competitive advantage in certain of these products. |
• | Receivers. Our portfolio of discrete receivers for metro and long-haul applications includes 10 Gb/s XMD PIN and avalanche photodiode ("APD") receivers, 40 Gb/s XLMD PIN receivers, 10 Gb/s coplanar receivers in PIN and APD configurations and 20 Gb/s balanced receivers, coherent receivers and receivers based on photonic integration at both 40 Gb/s and 100 Gb/s data rates. |
The following table sets forth our revenues by product group for the periods indicated:
Year Ended | |||||||||||
June 27, 2015 | June 28, 2014 | June 29, 2013 | |||||||||
(Thousands) | |||||||||||
100 Gb/s transmission modules | $ | 119,276 | $ | 78,552 | $ | 42,241 | |||||
40 Gb/s transmission modules | 74,520 | 98,891 | 100,521 | ||||||||
10 Gb/s and lower transmission modules | 138,116 | 183,522 | 236,034 | ||||||||
Industrial and consumer | 9,364 | 29,906 | 25,833 | ||||||||
$ | 341,276 | $ | 390,871 | $ | 404,629 | ||||||
Customers, Sales and Marketing
We believe it is essential to maintain a comprehensive and capable sales and marketing organization. As of June 27, 2015, our sales and marketing organization, which included direct sales force, customer service, marketing communications and product line specific marketing employees, totaled 78 people in Canada, China, Germany, Italy, Japan, Malaysia, the United Kingdom and the United States. In addition to our direct sales and marketing organization, we also sell and market our products through international sales representatives and resellers that extend our commercial reach to smaller geographic locations and customers that are not currently covered by our direct sales and marketing efforts.
Many of our products typically have a long sales cycle. The period of time from our initial contact with a customer to the receipt of an actual purchase order is frequently a year or more. In addition, many customers perform, and require us to perform, extensive process and product evaluation and testing of components before entering into purchase arrangements.
We offer support services in connection with the sale and purchase of certain products, primarily consisting of customer service and technical support. Customer service representatives assist customers with orders, warranty returns and other administrative functions. Technical support engineers provide customers with answers to technical and product-related questions. Technical support engineers also provide application support to customers who have incorporated our products into custom applications.
8
For the fiscal year ended June 27, 2015, Coriant accounted for 19 percent, Huawei accounted for 14 percent and Alcatel-Lucent accounted for 11 percent of our revenues. For the fiscal year ended June 28, 2014, Coriant accounted for 20 percent, Cisco accounted for 13 percent and Huawei accounted for 11 percent of our revenues. For the fiscal year ended June 29, 2013, Cisco accounted for 14 percent, Coriant accounted for 14 percent and Huawei accounted for 10 percent of our revenues.
Our customers are primarily network equipment manufacturers of telecommunications and data communications systems and hyperscale datacenter operators.
The following table sets forth our revenues by geographic region for the periods indicated, determined based on the country or region to which the products were shipped:
Year Ended | |||||||||||
June 27, 2015 | June 28, 2014 | June 29, 2013 | |||||||||
(Thousands) | |||||||||||
China | $ | 105,516 | $ | 101,889 | $ | 113,203 | |||||
United States | 54,017 | 41,047 | 36,106 | ||||||||
Malaysia | 47,335 | 46,997 | 41,825 | ||||||||
Mexico | 40,900 | 33,483 | 26,045 | ||||||||
Germany | 25,825 | 66,611 | 56,874 | ||||||||
Italy | 25,034 | 20,323 | 20,122 | ||||||||
Japan | 8,417 | 35,295 | 51,534 | ||||||||
Thailand | 3,676 | 9,166 | 15,251 | ||||||||
Rest of world | 30,556 | 36,060 | 43,669 | ||||||||
$ | 341,276 | $ | 390,871 | $ | 404,629 | ||||||
Manufacturing
Our wafer fabrication facilities in particular, we believe, position us to introduce product innovations delivering optical network cost and performance advantages to our customers. We also believe that our ability to deliver innovative technologies in a variety of form factors, ranging from chip level to module level to subsystem level, allows us to address the needs of a broad base of potential customers regardless of their desired level of product integration or complexity.
We believe our advanced chip and component design and manufacturing facilities would be very expensive to replicate. On-chip, or monolithic, integration of functionality is more difficult to achieve without control over the production process, and requires advanced process know-how and equipment. Although the market for optical integrated circuits is still in its early stages, it shares many characteristics with the semiconductor market, including the positive relationship between the number of features integrated on a chip, the wafer size and the cost and sophistication of the fabrication equipment. For example, we believe our 3-inch wafer InP semiconductor fabrication facility in Caswell, U.K. provides us a competitive advantage by allowing us to increase the complexity of the optical circuits that we design and manufacture, and the integration of photonics components within smaller packages, without the relatively high cost, power and size issues associated with less integrated solutions.
Our manufacturing capabilities include fabrication processing operations for InP substrates and lithium niobate substrates, including clean room facilities for each of these fabrication processes, along with assembly and test capability and reliability/quality testing. We utilize sophisticated semiconductor processing equipment in these operations, such as epitaxy reactors, metal deposition systems, photolithography, etching, analytical measurement and control equipment. Our assembly and test facilities, whether internal or under service agreements with our contract manufacturers, include specialized automated assembly equipment, temperature and humidity control and reliability and testing facilities.
We have wafer fabrication facilities in Caswell, U.K.; Sagamihara, Japan; and San Donato, Italy. We also have facilities in Shenzhen, China where we perform assembly and test operations; and a facility in California where we perform a portion of the manufacturing of our 40 Gb/s products. In our Caswell, U.K. facility, we also manufacture 100 Gb/s line side transceivers; in our San Donato, Italy facility we also manufacture 100 Gb/s modulators; and in our Sagamihara facility we also perform assembly and test operations for our 100 Gb/s client side transceivers. We believe that innovation at the wafer and fab level is a key differentiator in optical components and we are positioned accordingly. We also use third-party contract manufacturers in Thailand (Fabrinet), Malaysia (Venture) and China. We also use other contract manufacturers to a lesser degree, on a specific product basis. We continually evaluate the capabilities of additional potential contract manufacturing partners to ensure we have a scalable and cost effective manufacturing strategy appropriate for executing our business objectives over a long-term
9
horizon. As part of our sale of the Komoro Business in fiscal year 2015, we transferred our facilities in Komoro to Ushio Opto. As part of our sale of the Zurich Business in fiscal year 2014, we transferred our facilities in Zurich, Switzerland to II-VI. We also sold our manufacturing operations in South Korea during fiscal year 2014 and sold our remaining WSS patents.
As of June 27, 2015, our manufacturing organization was comprised of 830 people.
Research and Development
We draw upon our internal development and manufacturing capability to continue to create innovative solutions for our customers. We believe that continued focus on the development of our technology, and cost reduction of existing products through design enhancements, are critical to our future competitive success. We seek to expand and develop our products to reduce cost, improve performance and address new market opportunities, and to enhance our manufacturing processes to reduce production costs, provide increased device performance and reduce product time to market.
We have significant expertise in optical technologies such as optoelectronic semiconductors utilizing InP, and lithium niobate substrates and micro-optic assembly and packaging technology. In addition to these technologies, we also have electronics design, firmware and software capabilities to produce transceivers and transponders. We will also consider supplementing our in-house technical capabilities with strategic alliances or technology development arrangements with third parties when we deem appropriate. We spent $46.4 million, $64.2 million and $79.3 million on research and development during the years ended June 27, 2015, June 28, 2014 and June 29, 2013, respectively. As of June 27, 2015, our research and development organization was comprised of 208 people.
Our research and development facilities are in China, Italy, Japan, the United Kingdom, and the United States. These facilities include computer-aided design stations, modern laboratories and automated test equipment. Our research and development organization has optical and electronic integration expertise that facilitates meeting customer-specific requirements as they arise. Research and development facilities in Komoro, Japan were included in the sale of the industrial and consumer business to Ushio Opto in fiscal year 2015. Research and development facilities in Zurich, Switzerland, Tucson, Arizona and Horseheads, New York were included in the sale of product lines to II-VI in fiscal year 2014. We also sold our research and development operations in Korea and closed our research and development operations in Israel during fiscal year 2014.
Intellectual Property
Our competitive position significantly depends upon our research, development, engineering, manufacturing and marketing capabilities, and not just on our patent position. However, obtaining and enforcing intellectual property rights, including patents, provides us with a further competitive advantage. In the appropriate circumstances, these rights can help us to obtain entry into new markets by providing consideration for cross-licenses. In other circumstances, they can be used to prevent competitors from copying our products or from using our inventions. Accordingly, our practice is to file patent applications in the United States and certain other countries for inventions that we consider significant. In addition to patents, we also possess other intellectual property, including trademarks, know-how, trade secrets, design rights and copyrights.
We have a substantial number of patents in the United States and other countries, and additional applications are pending. These relate to technology that we have obtained from our acquisitions of businesses and companies in addition to our own internally developed technology. As of June 27, 2015, we held approximately 1,000 issued patents worldwide, with additional patent applications pending in various jurisdictions. Although our business is not materially dependent upon any one patent, our rights and the products made and sold under our patents, taken as a whole, are a significant element of our business. We maintain an active program designed to identify technology appropriate for patent protection.
We require employees and consultants to execute appropriate non-disclosure and proprietary rights agreements. These agreements acknowledge our exclusive ownership of intellectual property developed for us and require that all proprietary information disclosed remain confidential. While such agreements are intended to be binding, we may not be able to enforce these agreements in all jurisdictions. Although we continue to take steps to identify and protect our patentable technology and to obtain and protect proprietary rights to our technology, we cannot be certain the steps we have taken will prevent misappropriation of our technology, especially in certain countries where the legal protections of intellectual property are still developing. We may take legal action to enforce our patents and trademarks and other intellectual property rights. However, legal action may not always be successful or appropriate, and may be costly. Further, situations may arise in which we may decide to grant intellectual property licenses to third parties in which case other parties will be able to exploit our technology in the marketplace.
We enter into patent and technology licensing agreements with other companies when management determines that it is in our best interest to do so, for example, see our risk factor “Our products may infringe the intellectual property rights of others, which could result in expensive litigation or require us to obtain a license to use the technology from third parties, or we may
10
be prohibited from selling certain products in the future” appearing in Item 1A of this Annual Report on Form 10-K. These may result in net royalties payable to us by third parties or by us to third parties. However, royalties received from or paid to third parties to date have not been material to our consolidated results of operations.
In the normal course of business, we periodically receive and make inquiries regarding possible patent infringement. In dealing with such inquiries, it may become necessary or useful for us to obtain or grant licenses or other rights. However, there can be no assurance that such licenses or rights will be available to us on commercially reasonable terms, or at all. If we are not able to resolve or settle claims, obtain necessary licenses on commercially reasonable terms, and/or successfully prosecute or defend our position, our business, financial condition and results of operations could be materially and adversely affected.
Competition
The optical communications markets are rapidly evolving. We expect these markets to continue to be highly competitive because of the available capacity and number of competitors. We compete with domestic and international companies, many of which have substantially greater financial and other resources than we do. As of June 27, 2015, we believe that our principal competitors in the optical subsystems, modules and components industry include Finisar Corporation ("Finisar"), JDS Uniphase Corporation ("JDSU"), NeoPhotonics Corporation, Avago Technologies Ltd. ("Avago"), Sumitomo Electric Industries, Ltd. ("Sumitomo"), Furukawa Electric Co., Ltd. and vertically-integrated equipment manufacturers such as Fujitsu Limited. On August 1, 2015, JDSU split into two separate companies, one of which, Lumentum Holdings Inc. ("Lumentum"), is now also one of our competitors. The principal competitive factors upon which we compete include breadth of product line, availability, performance, product reliability, innovation and selling price. We seek to differentiate ourselves from our competitors by offering high levels of customer value through collaborative product design, technology innovation, manufacturing capabilities, optical/mechanical performance, intelligent features for configuration, control and monitoring, multi-function integration and overall customization. There can be no assurance that we will continue to compete favorably with respect to these factors. We encounter substantial competition in most of our markets, although no one competitor competes with us across all product lines or markets.
Consolidation in the optical systems and components industry has intensified, and future consolidation could further intensify, the competitive pressures that we face. For example, in addition to our mergers with Opnext and Avanex, our fiscal year 2010 acquisition of Xtellus and our fiscal year 2011 acquisition of Mintera, Ciena acquired Cyan Inc. in 2015, NeoPhotonics acquired the tunable laser product line of Emcore Corporation in 2015, Avago has agreed to acquire Broadcom Corp. in 2015, Nokia has agreed to acquire Alcatel-Lucent in 2015, Finisar acquired u2t Photonics AG in 2014, Avago acquired CyOptics, Inc. in 2013, Cisco acquired Lightwire, Inc. in 2012, Finisar acquired Ignis Optics in 2011 and Red-C Optical Networks Ltd. in 2012, and NeoPhotonics acquired Santur in 2011.
We also face competition from companies that may expand into our industry and introduce additional competitive products. Existing and potential customers are also our potential competitors. These customers may internally develop or acquire additional competitive products or technologies, which may cause them to reduce or cease their purchases from us.
Amendment and Restatement of Credit Facility
In November 2012, January 2013, May 2013, August 2013 and September 2013, we entered into amendments and restatements of our senior secured revolving credit facility with Wells Fargo Capital Finance, Inc. and the other lenders party thereto, prior to terminating the credit facility in March 2014. These amendments and restatements are more fully discussed in Note 7, Credit Line and Notes to our consolidated financial statements included elsewhere in this Annual Report on Form 10-K.
In March 2014, we entered into a loan and security agreement with Silicon Valley Bank (the “Bank”) pursuant to which the Bank provided us with a three-year revolving credit facility of up to $40.0 million. This agreement is more fully discussed in Note 7, Credit Line and Notes to our consolidated financial statements included elsewhere in this Annual Report on Form 10-K.
11
Long-Lived Tangible Assets and Total Assets
The following table sets forth our long-lived tangible assets and total assets by geographic region as of the dates indicated:
Long-lived Tangible Assets | Total Assets | ||||||||||||||
June 27, 2015 | June 28, 2014 | June 27, 2015 | June 28, 2014 | ||||||||||||
(Thousands) | |||||||||||||||
United States | $ | 1,581 | $ | 2,980 | $ | 109,818 | $ | 53,120 | |||||||
United Kingdom | 6,965 | 6,408 | 81,813 | 120,400 | |||||||||||
Japan | 16,698 | 26,216 | 74,191 | 107,597 | |||||||||||
China | 8,046 | 5,671 | 24,809 | 43,102 | |||||||||||
Rest of world | 8,476 | 9,493 | 35,253 | 41,466 | |||||||||||
$ | 41,766 | $ | 50,768 | $ | 325,884 | $ | 365,685 | ||||||||
Employees
As of June 27, 2015, we employed 1,233 people, including 208 in research and development, 830 in manufacturing, 78 in sales and marketing, and 117 in general and administration. In Italy, 156 employees belong to local collective bargaining/professional guilds. None of our other employees are subject to collective bargaining agreements.
Item 1A. Risk Factors
Investing in our securities involves a high degree of risk. The risks described below are not the only ones facing us. Additional risks not currently known to us or that we currently believe are immaterial also may impair our business, operations, liquidity and stock price materially and adversely. You should carefully consider the risks and uncertainties described below in addition to the other information included or incorporated by reference in this Annual Report on Form 10-K. If any of the following risks actually occur, our business, financial condition or results of operations would likely suffer. In that case, the trading price of our common stock could fall and you could lose all or part of your investment.
We may not be able to ramp the production of our new products to customer required volumes, which could result in delayed or lost revenue.
Many of our new product samples for metro, data center and long haul 100 and 200 gigahertz ("GHz") communication applications have been well received by potential customers of these products. As a result, we anticipate significant backlog for these new generation products. These newer generation products typically will have greater functionality and a smaller footprint, resulting in more complexity in the manufacturing process. This increased complexity will result in lower manufacturing yields or more difficult production to manufacture in volume. If we experience large demand for these products and are unable to manufacture them in sufficient volume, we would fall short of the planned output and revenue targets as we move from low volume sampling to manufacturing for commercial production. In addition, a production ramp for certain products can include a manufacturing transition between two or more locations which carries an inherent risk of delay. For example, we are currently in the process of transitioning the assembly and test processes for our 100 Gb/s CFP2 coherent transceiver from Caswell to our Shenzhen facility and to Venture Corporation Limited ("Venture"). Our failure to satisfy our customers' demand for these products could result in our customers postponing or canceling orders or seeking alternative suppliers for these products, which would adversely affect our results of operations.
Customer requirements for new products are increasingly challenging, which could lead to significant executional risk in designing and manufacturing such products.
Across the entire network, our customers are demanding increased performance from our products, at lower prices and in smaller and lower power designs. These requirements stretch the capabilities of our optical chips, packages and electronics to the limit of technical feasibility. In addition these demands are often customer specific, leading to numerous product variations. We enter our new product introduction, or NPI, process with clear performance and cost goals. Because of the complexity of design requirements, executing on these goals is becoming increasingly difficult and less predictable. These difficulties could result in product sampling delays and/or missing targets on key specifications and customer requirements, leading to design losses. Our failure to meet our customers' technical and performance requirements for these products could result in our customers seeking alternative suppliers for these products, which would adversely affect our results of operations.
Sales of older legacy products continue to represent a significant percentage of our total revenues and, if we do not increase the percentage of sales associated with new products, our revenues may not grow in the future or could decline.
12
The markets for our products are characterized by changing technology and continuing process development. The future of our business will depend in large part upon the continuing relevance of our technological capabilities, and our ability to introduce new products that address our customers’ requirements for more cost-effective and higher bandwidth solutions. Our inability to successfully launch or sustain new or next generation programs or product features that anticipate or adequately address future market trends and market transitions in a timely manner could materially adversely affect our revenues and financial results. We may also encounter competition from new or revised technologies that render our products less profitable or obsolete in our chosen markets, and our operating results may suffer. Furthermore, we cannot assure you that we will introduce new or next generation products in a timely manner, that these products will gain market acceptance, or that new product revenues will increase at a rate sufficient to replace declining legacy product revenues, and failure to do so could materially affect our operating results.
We have a history of large operating losses. We may not be able to achieve profitability in the future and as a result we may not be able to maintain sufficient levels of liquidity.
We have historically incurred losses and negative cash flows from operations since our inception. As of June 27, 2015, we had an accumulated deficit of $1,354.2 million. We incurred a loss from continuing operations of $48.2 million and negative cash flows from operations of $46.3 million during the year ended June 27, 2015, and we incurred losses from continuing operations for the years ended June 28, 2014 and June 29, 2013 of $102.1 million and $120.3 million, respectively.
As of June 27, 2015, we held $115.1 million in cash and restricted cash, comprised of $111.8 million in cash and cash equivalents and $3.3 million in restricted cash; and we had working capital, including cash, of $186.7 million. At June 27, 2015, we had debt of $66.0 million, consisting of capital leases and convertible notes payable.
During fiscal years 2013, 2014 and 2015, we executed a number of asset sale and financing transactions in order to generate funds to help sustain our operations: we sold our interleaver and thin film filter business, executed two convertible debt transactions, and executed sales of product lines in order to generate additional capital. On May 6, 2013, we secured a short term loan from Providence Equity of $25.0 million (with net proceeds to us of $20.5 million after discounts and expenses) as a bridge to the conclusion of certain asset sales. In order to obtain the short term loan, we amended our credit agreement to add Providence as a term lender. In connection with this amendment, we agreed to complete certain asset sales and use the proceeds to repay amounts we have borrowed under the credit agreement by July 15, 2013. On August 21, 2013, we amended our credit agreement to extend the time frame within which we must complete such asset sales to make such repayments to September 2, 2013. The corresponding sale of our Zurich Business to II-VI Incorporated ("II-VI") was closed on September 12, 2013. We received proceeds of $90.6 million in cash on September 12, 2013 and an additional $2.9 million subject to a potential post-closing working capital adjustment, which was calculated based on the level of working capital in the Oclaro Switzerland GmbH subsidiary at the September 12, 2013 close versus a target based on working capital at June 29, 2013. We also received $1.4 million in January 2015 that had been held back from the purchase price by II-VI. We also received $5.0 million for a 30 day option to sell our Amplifier Business. On November 1, 2013, the sale of our Amplifier Business to II-VI and certain of its affiliates closed and we received $79.6 million in cash from II-VI. We also received $0.9 million in January 2015 that had been held back from the purchase price by II-VI.
Following the sale of the Zurich Business, we repaid all amounts outstanding under the Credit Agreement as required, and terminated the Credit Agreement on March 14, 2014. On March 28, 2014, we entered into a loan and security agreement (the “Loan Agreement”) with Silicon Valley Bank (the “Bank”) pursuant to which the Bank provided us with a three-year revolving credit facility of up to $40.0 million. Under the Loan Agreement, advances are available based on up to 80 percent of “eligible accounts” as defined in the Loan Agreement.
The optical communications industry is subject to significant operational fluctuations. In order to remain competitive we incur substantial costs associated with research and development, qualification, production capacity and sales and marketing activities in connection with products that may be purchased, if at all, long after we have incurred such costs. In addition, the rapidly changing industry in which we operate, the length of time between developing and introducing a product to market, frequent changing customer specifications for products, customer cancellations of products and general down cycles in the industry, among other things, make our prospects difficult to evaluate. We are not generating positive cash flow from operations, and it is possible that we may not (i) generate sufficient positive cash flow from operations; (ii) raise funds through the issuance of equity, equity-linked or convertible debt securities; (iii) be able to draw advances under our loan agreement in the future or repay any such amounts; (iv) conclude additional strategic dispositions or similar transactions; or (v) otherwise have sufficient capital resources to meet our future capital or liquidity needs. There are no guarantees we will be able to generate additional financial resources beyond our existing balances.
13
We depend on a limited number of customers for a significant percentage of our revenues and the loss of a major customer could have a materially adverse impact on our financial condition.
Historically, we have generated most of our revenues from a limited number of customers. Our dependence on a limited number of customers is due to the fact that the optical telecommunications systems industry is dominated by a small number of large companies. These companies in turn depend primarily on a limited number of major telecommunications carrier customers to purchase their products that incorporate our optical components. For example, during the fiscal years ended June 27, 2015, June 28, 2014 and June 29, 2013, our three largest customers accounted for 45 percent, 43 percent and 38 percent of our revenues, respectively. Because we rely on a limited number of customers for significant percentages of our revenues, a decrease in demand for our products from any of our major customers for any reason (including due to market conditions, catastrophic events or otherwise) could have a materially adverse impact on our financial conditions and results of operations. For example, during the second half of fiscal 2012, our revenues were adversely impacted by a significant change in demand expectations from a particular major customer. Further, the industry in which our customers operate is subject to a trend of consolidation. To the extent this trend continues, we may become dependent on even fewer customers to maintain and grow our revenues.
The markets in which we operate are highly competitive, which could result in lost sales and lower revenues.
The market for optical components and modules is highly competitive and this competition could result in our existing customers moving their orders to our competitors. We are aware of a number of companies that have developed or are developing optical component products, including tunable lasers, pluggable components, modulators and subsystems, among others, that compete directly with our current and proposed product offerings.
Certain of our competitors may be able to more quickly and effectively:
• | develop or respond to new technologies or technical standards; |
• | react to changing customer requirements and expectations; |
• | devote needed resources to the development, production, promotion and sale of products; |
• | attain high manufacturing yields on new product designs; and |
• | deliver competitive products at lower prices. |
Some of our current competitors, as well as some of our potential competitors, have longer operating histories, greater name recognition, broader customer relationships and industry alliances and substantially greater financial, technical and marketing resources than we do. In addition, market leaders in industries such as semiconductor and data communications, who may also have significantly more resources than we do, may in the future enter our market with competing products. Our competitors and new Chinese companies are establishing manufacturing operations in China to take advantage of comparatively low manufacturing costs. All of these risks may be increased if the market were to further consolidate through mergers or other business combinations between our competitors.
We may not be able to compete successfully with our competitors and aggressive competition in the market may result in lower prices for our products and/or decreased gross margins. Any such development could have a material adverse effect on our business, financial condition and results of operations.
We may not be able to maintain or improve gross margin levels.
We may not be able to maintain or improve our gross margins, due to slow introductions of new products, pricing pressure from increased competition, the failure to effectively reduce the cost of existing products, the failure to improve our product mix, the potential for future macroeconomic or market volatility reducing sales volumes, changes in customer demand (including a change in product mix between different areas of our business) or other factors. Our gross margins can also be adversely impacted for reasons including, but not limited to, fixed manufacturing costs that would not be expected to decrease in proportion to any decrease in revenues; unfavorable production yields or variances; increases in costs of input parts and materials; the timing of movements in our inventory balances; warranty costs and related returns; changes in foreign currency exchange rates; and possible exposure to inventory valuation reserves. Any failure to maintain, or improve, our gross margins will adversely affect our financial results, including our goals to achieve profitability and achieve sustainable cash flow from operations.
14
The majority of our long-term customer contracts do not commit customers to specified buying levels, and our customers may decrease, cancel or delay their buying levels at any time with little or no advance notice to us.
The majority of our customers typically purchase our products pursuant to individual purchase orders or contracts that do not contain purchase commitments. Some customers provide us with their expected forecasts for our products several months in advance, but these customers may decrease, cancel or delay purchase orders already in place, and the impact of any such actions may be intensified given our dependence on a small number of large customers. If any of our major customers decrease, stop or delay purchasing our products for any reason, our business and results of operations would be harmed. Cancellation or delays of such orders may cause us to fail to achieve our short-term and long-term financial and operating goals and result in excess and obsolete inventory.
As a result of our global operations, our business is subject to currency fluctuations that may adversely affect our results of operations.
Our financial results have been and will continue to be materially impacted by foreign currency fluctuations. At certain times in our history, declines in the value of the U.S. dollar versus the U.K. pound sterling and the Japanese yen have had a major negative effect on our margins and our cash flow. A significant portion of our expenses are denominated in U.K. pounds sterling and Japanese yen and substantially all of our revenues are denominated in U.S. dollars.
Fluctuations in the exchange rate between these currencies and, to a lesser extent, other currencies in which we collect revenues and/or pay expenses could have a material effect on our future operating results. For example during fiscal 2015, the Japanese yen depreciated approximately 22 percent relative to the U.S. dollar, impacting our manufacturing overhead and operating expenses. If the U.S. dollar stays the same or depreciates relative to the U.K. pound sterling and/or Japanese yen in the future, our future operating results may be materially impacted. Additional exposure could also result should the exchange rate between the U.S. dollar and the Chinese yuan or the Euro vary more significantly than they have to date.
We periodically engage in currency hedging transactions in an effort to cover some of our exposure to U.S. dollar to U.K. pound sterling and Japanese Yen currency fluctuations, and we may be required to convert currencies to meet our obligations. These transactions may not operate to fully hedge our exposure to currency fluctuations, and under certain circumstances, these transactions could have an adverse effect on our financial condition.
We may experience low manufacturing yields.
Manufacturing yields depend on a number of factors, including the volume of production due to customer demand and the nature and extent of changes in specifications required by customers for which we perform design-in work. Higher volumes due to demand for a fixed, rather than continually changing, design generally results in higher manufacturing yields, whereas lower volume production generally results in lower yields. In addition, lower yields may result, and have in the past resulted, from commercial shipments of products prior to full manufacturing qualification to the applicable specifications. Changes in manufacturing processes required as a result of changes in product specifications, changing customer needs, introduction of new product lines and changes in contract manufacturers have historically caused, and may in the future cause, significantly reduced manufacturing yields, resulting in low or negative margins on those products. Moreover, an increase in the rejection rate of products during the quality control process, before, during or after manufacture, results in lower yields and margins. Finally, manufacturing yields and margins can also be lower if we receive or inadvertently use defective or contaminated materials from our suppliers. Any reduction in our manufacturing yields will adversely affect our gross margins and could have a material impact on our operating results.
In order to remain competitive, we have been in the past and may be in the future required to agree to customer terms and conditions that may have an adverse effect on our financial condition and operating results.
Many of our customers have significant purchasing power and, accordingly, have requested more favorable terms and conditions, including extended payment terms, than we typically provide. In order for us to remain competitive, we may be required to accommodate these requests, which may include granting terms that affect the timing of our receipt of cash. As a result, these more favorable customer terms may have a material adverse effect on our financial condition and results of operations.
We have recently announced significant changes at Oclaro relating to our operations, strategic plan and management team. The operation of our business could be adversely affected by the transition of key personnel as we rebuild our executive leadership team and make additional organizational changes.
Beginning in June 2013, we have announced a series of events, transactions and restructuring plans, which have had a significant impact on our business. Among other things, we sold our Komoro, Zurich and Amplifier Businesses and announced a restructuring plan to focus our business on our core competencies. While we believe these events, transactions and plans will
15
have a positive impact on our financial condition and results of operations, these changes will result in at least a significant near-term reduction in our revenues, could lead to a disruption in our operations and employee morale, could lead to unplanned attrition of employees, and adversely affect our ability to attract highly skilled employees. In addition, many of our senior management are relatively new. Since June 2013, we have appointed a new Chief Executive Officer, Chief Financial Officer and Chief Operating Officer, and have hired a new Chief Commercial Officer, a new General Counsel, a new Principal Accounting Officer, a new Executive Vice President of Human Resources and a new President of our Integrated Photonics Division, who is currently in the process of transitioning his role to become our Chief Scientist. We have also decreased the size of our Board of Directors from nine to seven. It is important to our success that our Chief Executive Officer continues building an effective management team and global organization. It may take some time for each of the new members of our management team to become fully integrated into our business. Our failure to manage these transitions, or to find and retain experienced management personnel, could adversely affect our ability to compete effectively and could adversely affect our operating results. If we experience these or other adverse consequences, fail to manage these transitions, do not find and retain experienced management personnel, or are otherwise unable to realize the expected benefits of our restructuring plan, our business, results of operations and financial condition would be materially and adversely affected and we may not be able to continue as a going concern over the long term.
Delays, disruptions or quality control problems in manufacturing could result in delays in product shipments to customers and could adversely affect our business.
We may experience delays, disruptions or quality control problems in our manufacturing operations or the manufacturing operations of our subcontractors. As a result, we could incur additional costs that would adversely affect our gross margins, and our product shipments to our customers could be delayed beyond the shipment schedules requested by our customers, which would negatively affect our revenues, competitive position and reputation. Furthermore, even if we are able to deliver products to our customers on a timely basis, we may be unable to recognize revenues at the time of delivery based on our revenue recognition policies.
We depend on a limited number of suppliers and key contract manufacturers who could disrupt our business if they stopped, decreased, delayed or were unable to meet our demand for shipments of their products or manufacturing of our products.
We depend on a limited number of suppliers of raw materials and equipment used to manufacture our products. We currently also depend on a limited number of contract manufacturers, principally Fabrinet in Thailand and Venture in Malaysia, to manufacture certain of our products. Some of these suppliers are sole sources. We typically have not entered into long-term agreements with our suppliers other than Fabrinet and Venture. As a result, these suppliers generally may stop supplying us materials and equipment at any time. Our reliance on a sole supplier or limited number of suppliers could result in delivery problems, reduced control over product pricing and quality, and an inability to identify and qualify another supplier in a timely manner. Some of our suppliers that may be small or under-capitalized may experience financial difficulties that could prevent them from supplying us materials and equipment. In addition, our suppliers, including our sole source suppliers, may experience manufacturing delays or shut downs due to circumstances beyond their control such as earthquakes, floods, fires, labor unrest, political unrest or other natural disasters.
Fabrinet’s manufacturing operations are located in Thailand. In October 2011, due to flooding in Thailand, Fabrinet suspended operations at both of its factories that supply us with finished goods. Thailand has also been subject to political unrest in the past, including the temporary interruption of service at one of its international airports, and has again begun to experience political unrest. If Fabrinet is unable to supply us with materials or equipment, or if it is unable to ship our materials or equipment out of Thailand due to future flooding or political unrest, this could materially adversely affect our ability to fulfill customer orders and our results of operations.
Any supply deficiencies relating to the quality or quantities of materials or equipment we use to manufacture our products could materially and adversely affect our ability to fulfill customer orders and our results of operations. Lead times for the purchase of certain materials and equipment from suppliers have increased and in some cases have limited our ability to rapidly respond to increased demand, and may continue to do so in the future. To the extent we introduce additional contract manufacturing partners, introduce new products with new partners and/or move existing internal or external production lines to new partners, we could experience supply disruptions during the transition process. In addition, due to our customers’ requirements relating to the qualification of our suppliers and contract manufacturing facilities and operations, we cannot quickly enter into alternative supplier relationships, which prevents us from being able to respond immediately to adverse events affecting our suppliers.
16
If our customers do not qualify our manufacturing lines or the manufacturing lines of our subcontractors for volume shipments, our operating results could suffer.
Most of our customers do not purchase products, other than limited numbers of evaluation units, prior to qualification of the manufacturing line for volume production. Our existing manufacturing lines, as well as each new manufacturing line, must pass through varying levels of qualification with our customers. Our manufacturing lines have passed our qualification standards, as well as our technical standards. However, our customers also require that our manufacturing lines pass their specific qualification standards and that we, and any subcontractors that we may use, be registered under international quality standards. In addition, we have in the past, and may in the future, encounter quality control issues as a result of relocating our manufacturing lines or introducing new products to fill production. We may be unable to obtain customer qualification of our manufacturing lines or we may experience delays in obtaining customer qualification of our manufacturing lines. Such delays or failure to obtain qualifications would harm our operating results and customer relationships. If we introduce new contract manufacturing partners and move any production lines from existing internal or external facilities, the new production lines will likely need to be re-qualified with our customers.
Our results of operations may suffer if we do not effectively manage our inventory, and we may continue to incur inventory-related charges.
We need to manage our inventory of component parts and finished goods effectively to meet changing customer requirements. Accurately forecasting customers’ product needs is difficult. Some of our products and supplies have in the past, and may in the future, become obsolete or be deemed excess while in inventory due to rapidly changing customer specifications or a decrease in customer demand. For example, following our acquisition of Opnext in July 2012, we reviewed the inventory we acquired from Opnext in the acquisition and, when we added that Opnext inventory to our preexisting inventory, we reduced the value of the Opnext inventory on our balance sheet by approximately $43.5 million (compared to its value on Opnext’s financial records as of the closing of the acquisition) to reflect our review. This reduced value was reflected in the inventory we reported in our financial statements for the quarter ended September 29, 2012. We also have exposure to contractual liabilities to our contract manufacturers for inventories purchased by them on our behalf, based on our forecasted requirements, which may become excess or obsolete. Our inventory balances also represent an investment of cash. To the extent our inventory turns are slower than we anticipate based on historical practice, our cash conversion cycle extends and more of our cash remains invested in working capital. If we are not able to manage our inventory effectively, we may need to write down the value of some of our existing inventory or write off non-saleable or obsolete inventory. We have from time to time incurred significant inventory-related charges. Any such charges we incur in future periods could materially and adversely affect our results of operations and our cash flow.
We have a large amount of intercompany balances with our China entities which may be subject to taxes and penalties when we try to pay them down or collect them.
Payments for goods and services into and out of China are subject to numerous and over-lapping government regulation with respect to foreign exchange controls, banking controls, import and export controls, and taxes. We have been operating in China for an extended period of time and have accumulated significant intercompany balances with our related entities. Our ability to repay or collect these balances may be restricted by Chinese laws and, as a result, we may be unable to successfully pay down or collect on these balances. As a consequence, we may be assessed additional taxes in China if we are unable to claim bad debt deductions or incur debt forgiveness income from the cancellation of these intercompany balances. Additionally, if we are found not to have complied with the various local laws surrounding cross border payments, we may incur penalties and fines for non-compliance. Any such taxes, penalties and/or fines could be significant in amount and, as a result, could have a material adverse effect on our financial condition, including our cash and cash equivalent balances.
Our business and results of operations may continue to be negatively impacted by general economic, financial market conditions and market conditions in the industries in which we operate, and such conditions may increase the other risks that affect our business.
Over the past few years, the world’s financial markets have experienced significant turmoil, resulting in reductions in available credit, increased costs of credit, extreme volatility in security prices, potential changes to existing credit terms, and rating downgrades of investments. In light of these economic conditions, many of our customers reduced their spending plans, leading them to draw down their existing inventory and reduce orders for our products. It is possible that current economic conditions, including recent developments in China, could result in further setbacks, and that some of our customers could as a result significantly reduce their capital expenditures, draw down their inventories, reduce production levels of existing products, defer introduction of new products or place orders and accept delivery for products for which they do not pay us due to their economic difficulties or other reasons. In the past, these conditions have materially and adversely affected the market conditions in the industries in which we operate, and have had a material adverse impact on our revenues. In addition, the
17
financial downturn affected the financial strength of certain of our customers, including their ability to obtain credit to finance purchases of our products, and could adversely affect additional customers in the future. Our suppliers may also be adversely affected by economic conditions that may impact their ability to provide important components used in our manufacturing processes on a timely basis, or at all. To a large degree, orders from our customers are dependent on demand from telecom carriers around the world. Telecom carrier capital expenditure plans and execution can also be adversely impacted, both in terms of total spend and in determination of areas of investment within network infrastructures, by global and regional macroeconomic conditions.
These conditions could also result in reduced capital resources because of the potential lack of credit availability, higher costs of credit and the stretching of payables by creditors seeking to preserve their own cash resources. We are unable to predict the likely duration, severity and potential continuation of any disruption in financial markets and adverse economic conditions in the U.S. and other countries, but the longer the duration the greater the risks we face in operating our business.
If we fail to attract and retain key personnel, our business could suffer.
Our future success depends, in part, on our ability to attract and retain key personnel. Competition for highly skilled technical personnel is extremely intense and we continue to face difficulty identifying and hiring qualified engineers in many areas of our business. We may not be able to hire and retain such personnel at compensation levels consistent with our existing compensation and salary structure. Our future success also depends on the continued contributions of our executive management team and other key management and technical personnel, each of whom would be difficult to replace. The loss of services of these or other executive officers or key personnel or the inability to continue to attract qualified personnel could have a material adverse effect on our business.
In the future we may need to access the capital markets to raise additional equity, which could dilute our shareholder base.
We may need additional liquidity beyond our current expectations, such as to fund future growth, strengthen our balance sheet or to fund the cost of restructuring activities, and will continue to explore other sources of additional liquidity. These additional sources of liquidity could include one, or a combination, of the following: (i) issuing equity securities, (ii) incurring indebtedness secured by our assets, (iii) issuing debt and/or convertible debt securities, or (iv) selling product lines, other assets and/or portions of our business. There can be no guarantee that we will be able to raise additional funds on terms acceptable to us, or at all.
If we raise funds through the issuance of equity, equity-linked or convertible debt securities, our stockholders may be significantly diluted, and these newly-issued securities may have rights, preferences or privileges senior to those of securities held by existing stockholders. If we raise funds through the issuance of debt instruments, such as we did in February 2015 when we issued convertible notes and December 2012 when we issued exchangeable bonds, the agreements governing such debt instruments may contain covenant restrictions that limit our ability to, among other things: (i) incur additional debt, assume obligations in connection with letters of credit, or issue guarantees; (ii) create liens; (iii) make certain investments or acquisitions; (iv) enter into transactions with our affiliates; (v) sell certain assets; (vi) redeem capital stock or make other restricted payments; (vii) declare or pay dividends or make other distributions to stockholders; and (viii) merge or consolidate with any entity. (See Note 7, Credit Line and Notes, elsewhere in this Annual Report on Form 10-K, for further details). The exchangeable bonds issued in 2012 were subsequently exchanged for common stock. We cannot assure you that additional financing will be available on terms favorable to us, or at all. If adequate funds are not available or are not available on acceptable terms, if and when needed, our ability to fund our operations, develop or enhance our products, or otherwise respond to competitive pressures and operate effectively could be significantly limited.
We may have to incur substantially more debt in the future, which may subject us to restrictive covenants that could limit our ability to operate our business.
In the future, we may incur additional indebtedness through arrangements such as credit agreements or term loans that may impose restrictions and covenants that limit our ability to respond appropriately to market conditions, make capital investments or take advantage of business opportunities. In addition, any debt arrangements we may enter into would likely require us to make regular interest payments, which would adversely affect our results of operations.
We may undertake acquisitions or mergers, that do not prove successful, which would materially and adversely affect our business, prospects, financial condition and results of operations.
From time to time, we consider acquisitions or mergers, collectively referred to as “acquisitions,” of other businesses, assets or companies that would complement our current product offerings, enhance our intellectual property rights or offer other competitive opportunities. For example, on March 26, 2012, we entered into an Agreement and Plan of Merger and Reorganization with Opnext, which was completed on July 23, 2012. However, in the future, we may not be able to identify
18
suitable acquisition candidates at prices we consider appropriate. In addition, we are in an industry that is actively consolidating and, as a result, there is no guarantee that we will successfully and satisfactorily bid against third parties, including competitors, when we identify a critical target we want to acquire.
We cannot readily predict the timing or size of our future acquisitions, or the success of our recent or future acquisitions. Failure to successfully implement our future acquisition plans could have a material adverse effect on our business, prospects, financial condition and results of operations. Even successful acquisitions could have the effect of reducing our cash balances, diluting the ownership interests of existing stockholders or increasing our indebtedness. For example, in our acquisition of Opnext we issued approximately 38.4 million newly issued shares of our common stock to the former stockholders of Opnext.
In connection with the acquisition of Xtellus, Inc. ("Xtellus") in 2009, during the first quarter of fiscal year 2012, we issued 0.9 million shares of our common stock related to the settlement of our Xtellus escrow liability. In October 2011, we paid $0.5 million in cash and issued 0.8 million shares of our common stock to pay earnout obligations related to our acquisition of Mintera Corporation ("Mintera"). In the fourth quarter of fiscal year 2012, we paid $2.2 million to settle a portion of our Mintera earnout obligations, and settled the remaining $8.6 million obligation in cash in the first quarter of fiscal year 2013.
All acquisitions involve potential risks and uncertainties, including the following, any of which could harm our business and adversely affect our results of operations:
• | failure to realize the potential financial or strategic benefits of the acquisition; |
• | increased costs associated with merged or acquired operations; |
• | increased indebtedness obligations; |
• | economic dilution to gross and operating profit (loss) and earnings (loss) per share; |
• | failure to successfully further develop the combined, acquired or remaining technology, which could, among other things, result in the impairment of amounts recorded as goodwill or other intangible assets; |
• | unanticipated costs and liabilities and unforeseen accounting charges; |
• | difficulty in integrating product offerings; |
• | difficulty in coordinating and rationalizing research and development activities to enhance introduction of new products and technologies with reduced cost; |
• | difficulty in coordinating and integrating the manufacturing activities, including with respect to third-party manufacturers, including coordination, integration or transfers of any manufacturing activities associated with our acquisition of Opnext in 2012; |
• | delays and difficulties in delivery of products and services; |
• | failure to effectively integrate or separate management information systems, personnel, research and development, marketing, sales and support operations; |
• | difficulty in maintaining internal control procedures and disclosure controls that comply with the requirements of the Sarbanes-Oxley Act of 2002, or poor integration of a target’s procedures and controls; |
• | difficulty in preserving important relationships of our acquired businesses and resolving potential conflicts between business cultures; |
• | uncertainty on the part of our existing customers, or the customers of an acquired company, about our ability to operate effectively after a transaction, and the potential loss of such customers; |
• | loss of key employees; |
• | difficulty in coordinating the international activities of our acquired businesses, including Opnext, which has substantial operations in Japan as well as the United States, and which uses contract manufacturing suppliers in Southeast Asia; |
• | the effect of tax laws and other legal and regulatory regimes due to increasing complexities of our global operating structure; |
• | greater exposure to the impact of foreign currency changes on our business; |
• | the effect of employment law or regulations or other limitations in foreign jurisdictions that could have an impact on timing, amounts or costs of achieving expected synergies; and |
• | substantial demands on our management as a result of these transactions that may limit their time to attend to other operational, financial, business and strategic issues. |
19
Our integration with acquired businesses has been and will continue to be a complex, time-consuming and expensive process. We cannot assure you that we will be able to successfully integrate these businesses in a timely manner, or at all, or that any of the anticipated benefits from our previous or future acquisitions will be realized. There are inherent challenges in integrating the operations of geographically diverse companies. We may have difficulty, and may incur unanticipated expenses related to, integrating management and personnel from our acquisitions. Our failure to achieve the strategic objectives of our past and future acquisitions could have a material adverse effect on our revenues, expenses and our other operating results and cash resources, and could result in us not achieving the anticipated potential benefits of these transactions. In addition, we cannot assure you that the growth rate of the combined company will equal the historical growth rate experienced by any of the companies that we have acquired. Comparable risks would accompany any divestiture of businesses or assets we might undertake.
In addition, even if we successfully integrate the operations of companies that we have acquired or may acquire in the future, we cannot predict with certainty which strategic, financial or operating synergies or other benefits, if any, will actually be achieved from our acquisition, the timing of any such benefits, or whether those benefits which have been achieved will be sustainable on a long-term basis. Our failure to successfully integrate the operations of companies that we acquire would likely have a material and adverse impact on our business, prospects, financial condition and results of operations.
We have a complex multinational tax structure, and changes in effective tax rates or adverse outcomes resulting from examination of our income tax returns could adversely affect our results.
We have a complex multinational tax structure with multiple types of intercompany transactions, and our allocation of profits and losses among us and our subsidiaries through our intercompany transfer pricing agreements is subject to review by the Internal Revenue Service and other tax authorities. Our future effective tax rates could be adversely affected by earnings being lower than anticipated in countries where we have lower statutory rates and higher than anticipated in countries where we have higher statutory rates, by changes in the valuation of our deferred tax assets and liabilities, or by changes in tax laws, regulations, accounting principles or interpretations thereof. In addition, we are also subject to periodic examination of our income tax returns and related transfer pricing documentation by the Internal Revenue Service and other tax authorities. We regularly assess the likelihood of adverse outcomes resulting from these examinations to determine the adequacy of our provision for income taxes. There can be no assurance that the outcomes from these examinations will not have an adverse effect on our operating results and financial condition.
Our intellectual property rights may not be adequately protected.
Our future success will depend, in large part, upon our intellectual property rights, including patents, copyrights, design rights, trade secrets, trademarks and know-how. We maintain an active program of identifying technology appropriate for patent protection. Our practice is to require employees and consultants to execute non-disclosure and proprietary rights agreements upon commencement of employment or consulting arrangements. These agreements acknowledge our exclusive ownership of all intellectual property developed by the individuals during their work for us and require that all proprietary information disclosed will remain confidential. Although such agreements may be binding, they may not be enforceable in full or in part in all jurisdictions and any breach of a confidentiality obligation could have a negative effect on our business and our remedy for such breach may be limited.
Our intellectual property portfolio is an important corporate asset. The steps we have taken and may take in the future to protect our intellectual property may not adequately prevent misappropriation or ensure that others will not develop competitive technologies or products. We cannot assure you that our competitors will not successfully challenge the validity of our patents or design products that avoid infringement of our proprietary rights with respect to our technology. There can be no assurance that other companies are not investigating or developing other similar technologies, that any patents will be issued from any application pending or filed by us, or that, if patents are issued, that the claims allowed will be sufficiently broad to deter or prohibit others from marketing similar products. In addition, we cannot assure you that any patents issued to us will not be challenged, invalidated or circumvented, or that the rights under those patents will provide a competitive advantage to us or that our products and technology will be adequately covered by our patents and other intellectual property. Further, the laws of certain regions in which our products are or may be developed, manufactured or sold, including Asia-Pacific, Southeast Asia and Latin America, may not be enforceable to protect our products and intellectual property rights to the same extent as the laws of the United States, the United Kingdom and continental European countries. This is especially relevant since we have transferred our assembly and test operations and chip-on-carrier operations, including certain engineering-related functions, to Shenzhen, China, and have recently completed the transition of portions of these assembly and test operations to Venture in Malaysia.
Opnext historically relied on Hitachi, one of our major shareholders, for assistance with the research and development efforts related to Opnext’s product portfolio. Any failure of Hitachi to continue to provide these services could have a material adverse effect on our business. Opnext’s product expertise is based on the research ability developed within their Hitachi heritage and
20
through joint research and development in lasers and optical technologies. A key factor to Opnext’s business success and strategy is fundamental laser research. Opnext relied on access to Hitachi’s research laboratories pursuant to a research and development agreement with Hitachi, which includes access to Hitachi’s research facilities and engineers, to conduct research and development activities that are important to the establishment of new technologies and products vital to their current and future business. Should access to Hitachi’s research laboratories become unavailable or available at less attractive terms in the future, this may impede development of new technologies and products, and our financial condition and operating results could be materially adversely affected.
Our revenues and operating results are likely to fluctuate significantly as a result of factors that are outside our control.
Our revenues and operating results are likely to fluctuate significantly in the future as a result of factors that are outside our control. The timing of order placement, size of orders and satisfaction of contractual customer acceptance criteria, changes in the pricing of our products due to competitive pressures as well as order or shipment delays or deferrals, with respect to our products, may cause material fluctuations in revenues. Our lengthy sales cycle, which may extend to more than one year, may cause our revenues and operating results to vary from period to period and it may be difficult to predict the timing and amount of any variation. Delays or deferrals in purchasing decisions by our customers may increase as we develop new or enhanced products for new markets, including data communications, industrial, research, consumer and biotechnology markets. Purchase decisions by our customers are also impacted by the capital expenditure plans of the global telecom carriers, which tend to be the primary customers of our customers. Our current and anticipated future dependence on a small number of customers increases the revenue impact of each such customer’s decision to delay or defer purchases from us, or decision not to purchase products from us. For example, during the second half of fiscal 2012, our revenues were adversely impacted by a significant change in demand expectations from a particular major customer. Our expense levels in the future will be based, in large part, on our expectations regarding future revenue sources and, as a result, operating results for any quarterly period in which material orders fail to occur, or are delayed or deferred, could vary significantly. Because our business is capital intensive, significant fluctuations in our revenues, without a corresponding decrease in expenses, can have a significant adverse impact on our operating results.
We have significant operations in China, which exposes us to risks inherent in doing business in China.
A significant portion of our assembly and test operations, chip-on-carrier operations and manufacturing and supply chain management operations are concentrated in our facility in Shenzhen, China. In addition, we have research and development related activities in Shenzhen, China. To be successful in China we will need to:
• | qualify our manufacturing lines and the products we produce in Shenzhen, as required by our customers; and |
• | attract and retain qualified personnel to operate our Shenzhen facility. |
We cannot assure you that we will be able to achieve these objectives.
Employee turnover in China is high due to the intensely competitive and fluid market for skilled labor. To operate our Shenzhen facility under these conditions, we need to continue to hire direct manufacturing personnel, administrative personnel and technical personnel; obtain and retain required legal authorization to hire such personnel; and incur the time and expense to hire and train such personnel. On March 28, 2012, shortly after announcing our agreement with Venture to transition certain manufacturing operations, certain of our employees in Shenzhen initiated a work stoppage. The work stoppage impacted our Shenzhen manufacturing capabilities temporarily up to and including April 4, 2012. Revenues for the three months ended March 31, 2012 were adversely impacted by approximately $4.0 million due to the work stoppage.
Inflation rates in China are higher than in most jurisdictions in which we operate. We believe that salary inflation rates for the skilled personnel we hire and seek to retain in Shenzhen are likely to be higher than overall inflation rates.
Operations in China are subject to greater political, legal and economic risks than our operations in other countries. In particular, the political, legal and economic climate in China, both nationally and regionally, is fluid and unpredictable. For example, we have been subject to commercial litigation in China initiated by a former supplier. For a description of this lawsuit, see Part I, Item 3, Legal Proceedings, "Raysung Commercial Litigation," in this Annual Report on Form 10-K. Our ability to operate in China may be adversely affected by changes in Chinese laws and regulations such as those related to, among other things, taxation, import and export tariffs, environmental regulations, land use rights, intellectual property, currency controls, employee benefits and other matters. In addition, we may not obtain or retain the requisite legal permits to continue to operate in China, and costs or operational limitations may be imposed in connection with obtaining and complying with such permits.
We intend to continue to export the products manufactured at our Shenzhen facility. Under current regulations, upon application and approval by the relevant governmental authorities, we will not be subject to certain Chinese taxes and will be exempt from certain duties on imported materials that are used in the manufacturing process and subsequently exported from China as
21
finished products. However, Chinese trade regulations are in a state of flux, and we may become subject to other forms of taxation and duties in China or may be required to pay export fees in the future. In the event that we become subject to new forms of taxation or export fees in China, our business and results of operations could be materially adversely affected. We may also be required to expend greater amounts than we currently anticipate in connection with increasing production at our Shenzhen facility. Any one of the factors cited above, or a combination of them, could result in unanticipated costs or interruptions in production, which could materially and adversely affect our business.
Our products may infringe the intellectual property rights of others, which could result in expensive litigation or require us to obtain a license to use the technology from third parties, or we may be prohibited from selling certain products in the future.
Companies in the industry in which we operate frequently are sued or receive informal claims of patent infringement or infringement of other intellectual property rights. We have, from time to time, received such claims, including from competitors and from companies that have substantially more resources than us. For example, see Part I, Item 3, Legal Proceedings, "Furukawa Patent Litigation," in our 2014 Annual Report on Form 10-K.
Third parties may in the future assert claims against us concerning our existing products or with respect to future products under development, or with respect to products that we may acquire through acquisitions. We have entered into and may in the future enter into indemnification obligations in favor of some customers that could be triggered upon an allegation or finding that we are infringing other parties’ proprietary rights. If we do infringe a third party’s rights, we may need to negotiate with holders of those rights in order to obtain a license to those rights or otherwise settle any infringement claim. We have from time to time received notices from third parties alleging infringement of their intellectual property and where appropriate have entered into license agreements with those third parties with respect to that intellectual property. Any license agreements that we wish to enter into the future with respect to intellectual property rights may not be available to us on commercially reasonable terms, or at all. We may not in all cases be able to resolve allegations of infringement through licensing arrangements, settlement, alternative designs or otherwise. We may take legal action to determine the validity and scope of the third-party rights or to defend against any allegations of infringement. Holders of intellectual property rights could become more aggressive in alleging infringement of their intellectual property rights and we may be the subject of such claims asserted by a third party. In the course of pursuing any of these means or defending against any lawsuits filed against us, we could incur significant costs and diversion of our resources and our management’s attention. Due to the competitive nature of our industry, it is unlikely that we could increase our prices to cover such costs. In addition, such claims could result in significant penalties or injunctions that could prevent us from selling some of our products in certain markets or result in settlements or judgments that require payment of significant royalties or damages.
Fluctuations in our operating results could adversely affect the market price of our common stock.
Our revenues and other operating results are likely to fluctuate significantly in the future. The timing of order placement, size of orders and satisfaction of contractual customer acceptance criteria, changes in the pricing of our products due to competitive pressures as well as order or shipment delays or deferrals, with respect to our products, acquisitions and asset sales may cause material fluctuations in revenues. Our lengthy sales cycle, which may extend to more than one year, may cause our revenues and operating results to vary from period to period and it may be difficult to predict the timing and amount of any variation. Delays or deferrals in purchasing decisions by our customers may increase as we develop new or enhanced products for new markets, including data communications, industrial, research, consumer and biotechnology markets. Our current and anticipated future dependence on a small number of customers increases the revenue impact of each such customer’s decision to delay or defer purchases from us, or decision not to purchase products from us. Our expense levels in the future will be based, in large part, on our expectations regarding future revenue sources and, as a result, operating results for any quarterly period in which material orders fail to occur, or are delayed or deferred, could vary significantly.
Because of these and other factors, quarter-to-quarter comparisons of our results of operations may not be indicative of our future performance. In future periods, our results of operations may differ, in some cases materially, from the estimates of public market analysts and investors. Such a discrepancy, or our failure to meet published financial projections, could cause the market price of our common stock to decline.
If we fail to obtain the right to use the intellectual property rights of others necessary to operate our business, our business and results of operations will be materially and adversely affected.
Certain companies in the telecommunications and optical components markets in which we sell our products have experienced frequent litigation regarding patent and other intellectual property rights. Numerous patents in these industries are held by others, including academic institutions and our competitors. Optical component suppliers may seek to gain a competitive advantage or other third parties, inside or outside our market, may seek an economic return on their intellectual property portfolios by making infringement claims against us. We currently in-license certain intellectual property of third parties, and in
22
the future, we may need to obtain license rights to patents or other intellectual property held by others to the extent necessary for our business. Unless we are able to obtain such licenses on commercially reasonable terms, patents or other intellectual property held by others could be used to inhibit or prohibit our production and sale of existing products and our development of new products for our markets. Licenses granting us the right to use third-party technology may not be available on commercially reasonable terms, or at all. Generally, a license, if granted, would include payments of up-front fees, ongoing royalties or both. These payments or other terms could have a significant adverse impact on our operating results. In addition, in the event we are granted such a license, it is likely such license would be non-exclusive and other parties, including competitors, may be able to utilize such technology. Our larger competitors may be able to obtain licenses or cross-license their technology on better terms than we can, which could put us at a competitive disadvantage. In addition, our larger competitors may be able to buy such technology and preclude us from licensing or using such technology.
We generate a significant portion of our revenues internationally and therefore are subject to additional risks associated with the extent of our international operations.
For fiscal years ended June 27, 2015, June 28, 2014 and June 29, 2013, 16 percent, 11 percent and 9 percent of our revenues, respectively, were derived from sales to customers located in the United States and 84 percent, 89 percent and 91 percent of our revenues, respectively, were derived from sales to customers located outside the United States. We are subject to additional risks related to operating in foreign countries, including:
• | currency fluctuations, which could result in increased operating expenses and reduced revenues; |
• | greater difficulty in accounts receivable collection and longer collection periods; |
• | difficulty in enforcing or adequately protecting our intellectual property; |
• | ability to hire qualified candidates; |
• | foreign taxes; |
• | political, legal and economic instability in foreign markets; |
• | foreign regulations; |
• | changes in, or impositions of, legislative or regulatory requirements; |
• | trade restrictions, including restrictions imposed by the United States government on trading with parties in foreign countries; |
• | transportation delays; |
• | epidemics and illnesses; |
• | terrorism and threats of terrorism; |
• | work stoppages and infrastructure problems due to adverse weather conditions or natural disasters; |
• | work stoppages related to employee dissatisfaction; |
• | changes in import/export regulations, tariffs, and freight rates; and |
• | the effective protections of, and the ability to enforce, contractual arrangements. |
Any of these risks, or any other risks related to our foreign operations, could materially adversely affect our business, financial condition and results of operations.
We may face product liability claims.
Despite quality assurance measures, defects may occur in our products. The occurrence of any defects in our products could give rise to liability for damages caused by such defects, including consequential damages. Such defects could, moreover, impair market acceptance of our products. Both could have a material adverse effect on our business and financial condition. In addition, we may assume product warranty liabilities related to companies we acquire, which could have a material adverse effect on our business and financial condition. In order to mitigate the risk of liability for damages, we carry product liability insurance with a $25.0 million aggregate annual limit and errors and omissions insurance with a $5.0 million annual limit. We cannot assure you that this insurance would adequately cover our costs arising from any defects in our products or otherwise.
23
At times, the market price of our common stock has fluctuated significantly.
The market price of our common stock has been, and is likely to continue to be, highly volatile. For example, between June 29, 2014 and June 27, 2015, the market price of our common stock ranged from a low of $1.31 per share to a high of $2.85 per share. Many factors could cause the market price of our common stock to rise and fall.
In addition to the matters discussed in other risk factors included in our public filings, some of the events that could impact our stock price are:
• | fluctuations in our financial condition and results of operations, including our gross margins and cash flow; |
• | changes in our business, operations or prospects; |
• | hiring or departure of key personnel; |
• | new contractual relationships with key suppliers or customers by us or our competitors; |
• | proposed acquisitions and dispositions by us or our competitors; |
• | financial results or projections that fail to meet public market analysts’ expectations and changes in stock market analysts’ recommendations regarding us, other optical technology companies or the telecommunication industry in general; |
• | future sales of common stock, or securities convertible into, exchangeable or exercisable for common stock; |
• | adverse judgments or settlements obligating us to pay damages; |
• | future issuances of common stock in connection with acquisitions or other transactions; |
• | acts of war, terrorism, or natural disasters; |
• | industry, domestic and international market and economic conditions, including sovereign debt issues in certain parts of the world and related global macroeconomic issues; |
• | low trading volume in our stock; |
• | developments relating to patents or property rights; and |
• | government regulatory changes. |
In connection with our acquisition of Xtellus, during the first quarter of fiscal year 2012 we issued 0.9 million shares of our common stock to settle our escrow liability. In connection with our acquisition of Mintera, during the second quarter of fiscal year 2012, we issued 0.8 million shares of our common stock to pay portions of the 12 month earnout obligations. In connection with our acquisition of Opnext, during the first quarter of fiscal year 2013, we issued 38.4 million shares of our common stock. In addition, during the second quarter of fiscal year 2014, we issued 13.5 million shares of our common stock in connection with the conversion of the convertible notes issued in December, 2012. We also have $65 million of convertible notes outstanding, which if converted, would result in us issuing up to 44.5 million shares of our common stock. In May 2013, we also issued 1.8 million warrants to purchase our common stock at an exercise price of $1.50 per share in connection with the Term Loan we received in May 2013 (See Note 7, Credit Line and Notes, in this Annual Report on Form 10-K, for further details). On May 2, 2014, these warrants were exercised, resulting in the issuance of 978,457 shares of our common stock. The issuance of these shares and their subsequent sale will dilute our existing stockholders and could potentially have a negative impact on our stock price.
Our shares of common stock have experienced substantial price and volume fluctuations, in many cases without any direct relationship to our operating performance. An outgrowth of this market volatility is the significant vulnerability of our stock price to any actual or perceived fluctuation in the strength of the markets we serve, regardless of the actual consequence of such fluctuations. As a result, the market price for our stock is highly volatile. These broad market and industry factors have caused the market price of our common stock to fluctuate, and may in the future cause the market price of our common stock to fluctuate, regardless of our actual operating performance.
We are not restricted from issuing additional shares of our common stock, including securities that are convertible into or exchangeable for, or that represent the right to receive, shares of our common stock. Issuances of shares of our common stock or convertible securities, including outstanding options and warrants, will dilute the ownership interest of our stockholders.
24
A lack of effective internal controls over our financial reporting could result in an inability to report our financial results accurately, which could lead to a loss of investor confidence in our financial reports and have an adverse effect on our stock price.
In fiscal year 2013, in connection with establishing the fair values of certain assets and liabilities associated with our acquisition of Opnext, we identified a material weakness over controls related to our recording of the purchase under Accounting Standards Codification Topic 805, Business Combinations. In the fourth quarter of fiscal year 2013, we made adjustments to the fair value of certain items, including property and equipment, capital leases and intangible assets. As a result of these adjustments, management concluded that we did not maintain effective internal controls over financial reporting as of June 29, 2013, because the potential impact of these adjustments could have been material to our financial position and results of operations. During the year ended June 28, 2014, we hired new finance personnel and added oversight for the accounting of acquisitions and dispositions. Our remediation efforts, including the testing of these controls, continued throughout fiscal year 2014. This material weakness was considered remediated in the fourth quarter of fiscal year 2014, once these controls were shown to be operational for a sufficient period of time to allow management to conclude that these controls were operating effectively.
In fiscal year 2014, we also identified control deficiencies relating to inventory and property and equipment, which in the aggregate constituted a material weakness. We determined that our processes, procedures and controls related to the review and analysis of inventory and property and equipment were not effective to ensure that certain amounts related to these financial statement accounts were accurately reported in a timely manner. As a result of these adjustments, management concluded that we did not maintain effective internal controls over financial reporting as of June 28, 2014. Our remediation efforts, including the testing of these controls, continued throughout fiscal year 2015. This material weakness was considered remediated in the fourth quarter of fiscal year 2015, once these controls were shown to be operational for a sufficient period of time to allow management to conclude that these controls were operating effectively.
In addition, we have in the past, and may in the future, acquire companies that have either experienced material weaknesses in their internal controls over financial reporting or have had no previous reporting obligations under Sarbanes-Oxley. Failure to integrate acquired businesses into our internal controls over financial reporting could cause those controls to fail.
We cannot assure you that similar material weaknesses will not recur in the future. If additional material weaknesses or significant deficiencies in our internal control are discovered or occur in the future, our consolidated financial statements may contain material misstatements and we could be required to restate our financial results.
Effective internal controls over financial reporting are necessary for us to provide reliable financial reports. Our failure to implement and maintain effective internal control over financial reporting could result in a material misstatement of our financial statements or otherwise cause us to fail to meet our financial reporting obligations. This, in turn, could result in a loss of investor confidence in the accuracy and completeness of our financial reports, which could have an adverse effect on our business, financial condition, operating results and our stock price, and we could be subject to stockholder litigation and our common stock may be delisted as a result. Even if we are able to implement and maintain effective internal control over financial reporting, the costs of doing business may increase and our management may be required to dedicate greater time and resources to that effort.
We have been named as a party to derivative action lawsuits in the past, and we may be named in additional litigation in the future, all of which would require significant management time and attention and result in significant legal expenses and could result in an unfavorable outcome which could have a material adverse effect on our business, financial condition, results of operations and cash flows.
When the market price of a stock experiences a sharp decline, as has happened to us in the past, holders of that stock have often brought securities class action litigation against the company that issued the stock. Several securities class action lawsuits have been filed against us and certain of our current and former officers and directors. Other class action lawsuits have been initiated in the past against Opnext, us and certain of our respective current and former officers and directors as purported derivative actions. The securities class action complaints alleged violations of section 10(b) of the Securities Exchange Act of 1934 and Rule 10b-5 promulgated by the Securities and Exchange Commission. Each purported derivative complaint alleged, among other things, counts for breaches of fiduciary duty, waste, and unjust enrichment. The courts approved the settlement of these lawsuits and the settlements became final in December 2014. For a description of these lawsuits, see Part II, Item 1, Legal Proceedings, "Class Action and Derivative Litigation" in our Quarterly Report on Form 10-Q filed on February 5, 2015. If new litigation of this type were to be initiated in the future, such litigation would likely divert the time and attention of our management and could cause us to incur significant expense in defending against the litigation. In addition, if any such suits were resolved in a manner adverse to us, the damages we could be required to pay may be substantial and could have an adverse impact on our results of operations and our ability to operate our business.
25
Because we do not intend to pay dividends, stockholders will benefit from an investment in our common stock only if it appreciates in value.
We have never declared or paid any dividends on our common stock. We anticipate that we will retain any future earnings to support operations and to finance the development of our business and do not expect to pay cash dividends in the foreseeable future. As a result, the success of an investment in our common stock will depend entirely upon any future appreciation in its value. There is no guarantee that our common stock will appreciate in value or even maintain the price at which stockholders have purchased their shares.
We are subject to anti-corruption laws in the jurisdictions in which we operate, including the U.S. Foreign Corrupt Practices Act, or the FCPA. Our failure to comply with these laws could result in penalties which could harm our reputation and have a material adverse effect on our business, results of operations and financial condition.
We are subject to the FCPA, which generally prohibits companies and their intermediaries from making improper payments to foreign officials for the purpose of obtaining or keeping business and/or other benefits, along with various other anti-corruption laws. Although we have implemented policies and procedures designed to ensure that we, our employees and other intermediaries comply with the FCPA and other anti-corruption laws to which we are subject, there is no assurance that such policies or procedures will work effectively all of the time or protect us against liability under the FCPA or other laws for actions taken by our employees and other intermediaries with respect to our business or any businesses that we may acquire. We have manufacturing operations in China and other jurisdictions, many of which pose elevated risks of anti-corruption violations, and we export our products for sale internationally. This puts us in frequent contact with persons who may be considered “foreign officials” under the FCPA, resulting in an elevated risk of potential FCPA violations. If we are not in compliance with the FCPA and other laws governing the conduct of business with government entities (including local laws), we may be subject to criminal and civil penalties and other remedial measures, which could have an adverse impact on our business, financial condition, results of operations and liquidity. Any investigation of any potential violations of the FCPA or other anti-corruption laws by U.S. or foreign authorities could harm our reputation and have an adverse impact on our business, financial condition and results of operations.
We sold our Komoro, Zurich and Amplifier Businesses and may pursue other strategic dispositions or a further reduction in the number of our locations which could be difficult to implement, disrupt our business or further change our business profile significantly.
The sale of our Komoro Business in 2014, the sale of our Zurich and Amplifier Businesses in 2013, and any future strategic disposition of assets or businesses or reduction in the number of our locations, each involve numerous risks. These risks include: (i) potential disruption of our ongoing business and distraction of management; (ii) difficulty segregating assets or businesses to be disposed of or consolidated; (iii) exposure to unknown, contingent or other liabilities, including litigation arising in connection with the disposition; (iv) changing our business profile in ways that could have unintended negative consequences; (v) the failure to achieve anticipated benefits; (vi) accounting charges that may affect our financial condition and results of operations; (vii) significant fluctuations in our revenues and operating results; (viii) our ability to support manufacturing services and transition services and the risk to the rest of our business resulting from resources focusing on those services. These asset sales contributed to a decrease in our total revenues during 2014 compared to 2013, and a further decrease of revenues during 2015 compared to 2014. These decreases have and may continue to adversely impact our operating results. Additional asset sales that we may consider in the future could cause us to face similar risks, which could weaken our financial condition and adversely impact our operating results.
In the future we may incur significant additional restructuring charges that could adversely affect our results of operations.
We have previously enacted a series of restructuring plans and cost reduction plans designed to reduce our manufacturing overhead and our operating expenses that have resulted in significant restructuring charges.
For instance, during fiscal years 2015 and 2014, we incurred $2.5 million and $3.5 million in restructuring charges, respectively, in connection with the transition of certain portions of our Shenzhen, China assembly and test operations to Venture. In addition, during the year ended June 27, 2015 and June 28, 2014, we also incurred $4.0 million and $13.2 million in restructuring charges in connection with the restructuring plan we initiated in the first quarter of fiscal year 2014 to simplify our operating footprint, reduce our cost structure and focus our research and development investment in the optical communications market where we can leverage our core competencies.
We cannot assure you that we will not incur additional restructuring charges. Significant additional restructuring charges could materially and adversely affect our operating results in the periods that they are incurred and recognized. In addition, such charges could require significant cash commitments that may adversely affect our cash balances.
26
We may undertake divestitures of portions of our business, such as the divestiture of our Komoro Business, Zurich Business and our Amplifier Business, that require us to continue providing substantial post-divestiture transition services and support, which may cause us to incur unanticipated costs and liabilities and adversely affect our financial condition and results of operations.
From time to time, we consider divestitures of product lines or portions of our assets in order to streamline our business, focus on our core operations and raise cash. For example, on October 27, 2014, we sold our Komoro Business to Ushio Opto Semiconductors, Inc. ("Ushio"). In addition, on September 12, 2013, we sold our Zurich Business to II-VI and on November 1, 2013, we sold our Amplifier Business to II-VI (See Note 3, Business Combinations and Dispositions, elsewhere in this Annual Report on Form 10-K, for further details). In connection with these divestitures, we entered into transition service, manufacturing service and supply agreements with both Ushio and II-VI to facilitate the ownership transition, collectively referred to as “transition agreements.” Pursuant to these transition agreements, we continue to manufacture certain products for II-VI and perform limited administrative functions for Ushio. From time to time, substantial amounts of executive resources have been diverted from our core ongoing business to manage these transitions. For each of these divestitures, a material portion of the purchase price was held back to address post-closing claims, including claims related to our performance of the transition agreements. We received a portion of the hold-back from the sale of the Zurich Business during the third quarter of fiscal year 2014. We expected to receive an additional $10.0 million which was subject to hold-back by II-VI until December 31, 2014 to address any post-closing adjustments or claims related to the sale of the Zurich and Amplifier Businesses. On December 30, 2014, we entered into a Settlement Agreement with II-VI and II-VI Holdings B.V. regarding disposition of the amounts held back by the II-VI parties. Of the $10.0 million subject to hold-back until December 31, 2014, we received $2.35 million in January 2015 and we released the remaining $7.65 million to II-VI Holdings B.V. In order to perform under these transition agreements, we have been required to continue operating certain facilities, dedicate certain manufacturing capacity and maintain certain supplier agreements that have added additional costs and delayed our ability to fully restructure our operations to efficiently focus on our core ongoing business. If we fail to perform under any of these transition agreements, or if we do not successfully execute the restructuring of our operations after our transition agreement obligations have been fulfilled, our financial condition and results of operations could be harmed.
Litigation may substantially increase our costs and harm our business.
We are a party to numerous lawsuits and will continue to incur legal fees and other costs related thereto, including potentially expenses for the reimbursement of legal fees of officers and directors under indemnification obligations. The expense of continuing to defend such litigation may be significant. In addition, there can be no assurance that we will be successful in any defense. Further, the amount of time that will be required to resolve these lawsuits is unpredictable and these actions may divert management’s attention from the day-to-day operations of our business, which could adversely affect our business, results of operations and cash flows. Litigation is subject to inherent uncertainties, and an adverse result in these or other matters that may arise from time to time could have a material adverse effect on our business, results of operations and financial condition.
For a description of our current material litigation, see Part I, Item 3 – Legal Proceedings of this Annual Report on Form 10-K.
In addition, from time to time, we have been a party to certain intellectual property infringement litigation as more fully described above under “Risks Related to Our Business — Our products may infringe the intellectual property rights of others, which could result in expensive litigation or require us to obtain a license to use the technology from third parties, or we may be prohibited from selling certain products in the future.”
The inability to obtain government licenses and approvals for desired international trading activities or technology transfers may prevent the profitable operation of our business.
Many of our present and future business activities are subject to licensing by the United States government under the Export Administration Act, the Export Administration Regulations and other laws, regulations and requirements governing international trade and technology transfer. We presently manufacture products in China and Thailand that require such licenses. The profitable operations of our business may require the continuity of these licenses and may require further licenses and approvals for future products in these and other countries. However, there is no certainty to the continuity of these licenses, nor that further desired licenses and approvals may be obtained.
Prior to our acquisition of Opnext, Opnext licensed its intellectual property to Hitachi and its wholly owned subsidiaries without restriction. In addition, Hitachi is free to license certain of Hitachi’s intellectual property that Opnext used in its business to any third party, including competitors, which could harm our business and operating results.
Opnext was initially created as a stand-alone entity by acquiring certain assets of Hitachi through various transactions. In connection with these transactions, Opnext acquired a number of patents and know-how from Hitachi, but also granted Hitachi and its wholly owned subsidiaries a perpetual right to continue to use those patents and know-how, as well as other patents and
27
know-how that Opnext developed during a period which ended in July 2011 (or October 2012 in certain cases). This license back to Hitachi is broad and permits Hitachi to use this intellectual property for any products or services anywhere in the world, including licensing this intellectual property to our competitors.
Additionally, while significant intellectual property owned by Hitachi was assigned to Opnext when Opnext was formed, Hitachi retained and only licensed to Opnext the intellectual property rights to underlying technologies used in both Opnext products and the products of Hitachi. Under the agreement, Hitachi remains free to license these intellectual property rights to the underlying technologies to any party, including competitors. The intellectual property that has been retained by Hitachi and that can be licensed in this manner does not relate solely or primarily to one or more of Opnext’s products, or groups of products; rather, the intellectual property that is licensed to Opnext by Hitachi is generally used broadly across Opnext’s entire product portfolio. Competition by third parties using the underlying technologies retained by Hitachi could harm the Opnext business, financial condition and results of operations.
We may record additional impairment charges that will adversely impact our results of operations.
As of June 27, 2015, we had $2.6 million in other intangible assets and $41.8 million of property and equipment, net on our condensed consolidated balance sheet. If we make changes in our business strategy or if market or other conditions adversely affect our business operations, we may be forced to record an impairment charge related to these assets, which would adversely impact our results of operations. If impairment has occurred, we will be required to record an impairment charge for the difference between the carrying value of the other intangible assets and the implied fair value of the other intangible assets in the period in which such determination is made. The testing of other intangible assets for impairment requires us to make significant estimates about the future performance and cash flows of our business, as well as other assumptions. These estimates can be affected by numerous factors, including changes in economic, industry, or market conditions, changes in underlying business operations, future reporting unit operating performance, changes in competition, or changes in technologies. Any changes in key assumptions, or actual performance compared with those assumptions, about our business and its future prospects or other assumptions could affect the fair value of one or more reporting units, and result in an impairment charge.
During the fourth quarter of fiscal year 2013 we completed our annual analysis for potential impairment of our goodwill, which included examining, based on factors and conditions then existing, the impact of current general economic conditions on our future prospects and the current level of our market capitalization. Based on this analysis, we determined that the goodwill related to our Mintera reporting unit was fully impaired. This resulted in a $10.9 million impairment charge in our statement of operations for fiscal year 2013. In addition, during the first quarter of fiscal year 2013, we recorded $0.9 million in impairment charges related to the impairment of certain technology that is now considered redundant following the acquisition of Opnext. In the fourth quarter of fiscal year 2013, we recorded an additional $13.7 million impairment charge related to the impairment of intangible assets related to certain technologies and we recorded impairment charges of $1.7 million related to other long-lived assets.
Our business and operating results may be adversely affected by natural disasters or other catastrophic events beyond our control.
Our business and operating results are vulnerable to natural disasters, such as earthquakes, fires, tsunami, volcanic activity and floods, as well as other events beyond our control such as power loss, telecommunications failures and uncertainties arising out of terrorist attacks in the United States and armed conflicts overseas. For example, in the latter three quarters of fiscal year 2012, our results of operations were materially and adversely impacted by the flooding in Thailand. Additionally, our corporate headquarters and a portion of our research and development and manufacturing operations are located in Silicon Valley, California, and select manufacturing facilities are located in Japan. These regions in particular have been vulnerable to natural disasters, such as the 2011 earthquake and subsequent tsunami that occurred in Japan. The occurrence of any of these events could pose physical risks to our property and personnel, which may adversely affect our ability to produce and deliver products to our customers. Although we presently maintain insurance against certain of these events, we cannot be certain that our insurance will be adequate to cover any damage sustained by us or by our customers.
Our business involves the use of hazardous materials, and we are subject to environmental and import/export laws and regulations that may expose us to liability and increase our costs.
We handle hazardous materials as part of our manufacturing activities. Consequently, our operations are subject to environmental laws and regulations governing, among other things, the use and handling of hazardous substances and waste disposal. We may incur costs to comply with current or future environmental laws. As with other companies engaged in manufacturing activities that involve hazardous materials, a risk of environmental liability is inherent in our manufacturing activities, as is the risk that our facilities will be shut down in the event of a release of hazardous waste, or that we would be subject to extensive monetary liabilities. The costs associated with environmental compliance or remediation efforts or other
28
environmental liabilities could adversely affect our business. Under applicable European Union regulations, we, along with other electronics component manufacturers, are prohibited from using lead and certain other hazardous materials in our products. We could lose business or face product returns if we fail to maintain these requirements properly.
In addition, the sale and manufacture of certain of our products require on-going compliance with governmental security and import/export regulations. We may, in the future, be subject to investigation which may result in fines for violations of security and import/export regulations. Furthermore, any disruptions of our product shipments in the future, including disruptions as a result of efforts to comply with governmental regulations, could adversely affect our revenues, gross margins and results of operations.
The new disclosure requirements related to the “conflict minerals” provision of the Dodd-Frank Act may limit our supply and increase our costs for certain metals used in our products and could affect our reputation with customers or shareholders.
Under the Dodd-Frank Wall Street Reform and Consumer Protection Act of 2010 (Dodd-Frank Act), the Securities and Exchange Commission (SEC) adopted a new rule requiring public companies to disclose the use of specified minerals, known as conflict minerals, that are necessary to the functionality or production of products manufactured or contracted to be manufactured. The new rule, which went into effect for calendar year 2013 and required a disclosure report to be filed with the SEC by June 2, 2014, requires companies to perform due diligence, disclose and report whether or not such minerals originate from the Democratic Republic of Congo (DRC) or an adjoining country. Portions of the new rule have been challenged in the courts and may be subject to further interpretation and amendment either of which could impose additional or different obligations on us. The new rule could affect sourcing at competitive prices and availability in sufficient quantities of certain minerals used in the manufacturing of our products. The number of suppliers who provide conflict-free minerals may be limited. In addition, there may be material costs associated with complying with the disclosure requirements, such as costs related to the due diligence process of determining the source of certain minerals used in our products, as well as costs of possible changes to products, processes, or sources of supply as a consequence of such verification activities. As our supply chain is complex and we use contract manufacturers for some of our products, we may not be able to sufficiently verify the origins of the relevant minerals used in our products through the due diligence procedures that we implement, which may harm our reputation. If we cannot determine that our products exclude conflict minerals sourced from the DRC or adjoining countries, some of our customers may discontinue, or materially reduce, purchases of our products, which could negatively affect our results of operations.
We can issue shares of preferred stock that may adversely affect your rights as a stockholder of our common stock.
Our certificate of incorporation authorizes us to issue up to 1.0 million shares of preferred stock with designations, rights and preferences determined from time-to-time by our board of directors. Accordingly, our board of directors is empowered, without stockholder approval, to issue preferred stock with dividend, liquidation, conversion, voting or other rights superior to those of holders of our common stock. For example, an issuance of shares of preferred stock could:
• | adversely affect the voting power of the holders of our common stock; |
• | make it more difficult for a third-party to gain control of us; |
• | discourage bids for our common stock at a premium; |
• | limit or eliminate any payments that the holders of our common stock could expect to receive upon our liquidation; or |
• | otherwise adversely affect the market price of our common stock. |
We may in the future issue shares of authorized preferred stock at any time.
Delaware law and our charter documents contain provisions that could discourage or prevent a potential takeover, even if such a transaction would be beneficial to our stockholders.
Some provisions of our certificate of incorporation and bylaws, as well as provisions of Delaware law, may discourage, delay or prevent a merger or acquisition that a stockholder may consider favorable. These include provisions:
• | authorizing the board of directors to issue preferred stock; |
• | prohibiting cumulative voting in the election of directors; |
• | limiting the persons who may call special meetings of stockholders; |
• | prohibiting stockholder actions by written consent; |
• | creating a classified board of directors pursuant to which our directors are elected for staggered three-year terms; |
29
• | permitting the board of directors to increase the size of the board and to fill vacancies; |
• | requiring a super-majority vote of our stockholders to amend our bylaws and certain provisions of our certificate of incorporation; and |
• | establishing advance notice requirements for nominations for election to the board of directors or for proposing matters that can be acted on by stockholders at stockholder meetings. |
We are subject to the provisions of Section 203 of the Delaware General Corporation Law which limit the right of a corporation to engage in a business combination with a holder of 15 percent or more of the corporation’s outstanding voting securities, or certain affiliated persons. We do not currently have a stockholder rights plan in place.
Although we believe that these charter and bylaw provisions, and provisions of Delaware law, provide an opportunity for the board to assure that our stockholders realize full value for their investment, they could have the effect of delaying or preventing a change of control, even under circumstances that some stockholders may consider beneficial.
Item 1B. Unresolved Staff Comments
None.
Item 2. Properties
Our principal properties as of June 27, 2015 are set forth below:
Location | Square Feet | Principal Use | Ownership | Lease Expiration | ||||
Sagamihara-shi, Japan | 343,000 | Office space, manufacturing, research and development | Lease | March 2033 | ||||
Caswell, United Kingdom | 183,000 | Office space, manufacturing, research and development | Lease | March 2026 | ||||
Shenzhen, China | 127,000 | Office space, manufacturing, research and development | Lease | June 2019 | ||||
San Donato, Italy | 66,000 | Office space, manufacturing, research and development | Lease | July 2017 | ||||
San Jose, California | 52,000 | Corporate headquarters, office space, manufacturing, research and development | Lease | January 2016 | ||||
Acton, Massachusetts | 31,000 (1) | Office space | Lease | January 2016 | ||||
(1) Leased property in Acton, Massachusetts is not needed for our operations.
In addition to the above properties, we also lease administrative, manufacturing and research and development facilities in Paignton, United Kingdom (18,000 square feet); Santa Clara, California (10,000 square feet); Ontario, Canada (4,000 square feet); Penang, Malaysia (1,000 square feet); Bangkok, Thailand (1,000 square feet); and Shanghai, China (1,000 square feet), with lease expiration dates ranging from November 2015 to December 2017.
On October 27, 2014, we completed the sale of our industrial and consumer business of Oclaro Japan to Ushio Opto, including transferring the lease for our Komoro, Japan facility. On September 12, 2013 and November 1, 2013, we sold our Zurich and Amplifier Businesses, respectively, to II-VI, including transferring the leases for our Zurich, Switzerland; Tucson, Arizona; and Horseheads, New York facilities.
As of June 27, 2015, we leased a total of approximately 0.8 million square feet worldwide, including the locations listed above. We believe that our properties are adequate to meet our business needs.
30
Item 3. Legal Proceedings
Overview
In the ordinary course of business, we are involved in various legal proceedings, and we anticipate that additional actions will be brought against us in the future. The most significant of these proceedings are described below. These legal proceedings, as well as other matters, involve various aspects of our business and a variety of claims in various jurisdictions. Complex legal proceedings frequently extend for several years, and a number of the matters pending against us are at very early stages of the legal process. As a result, some pending matters have not yet progressed sufficiently through discovery and/or development of important factual information and legal issues to enable us to determine whether the proceeding is material to us or to estimate a range of possible loss, if any. Unless otherwise disclosed, we are unable to estimate the possible loss or range of loss for the legal proceedings described below. While it is not possible to accurately predict or determine the eventual outcomes of these items, an adverse determination in one or more of these items currently pending could have a material adverse effect on our results of operations, financial position or cash flows.
Specific Matters
Raysung Commercial Litigation
On October 23, 2013, Xi’an Raysung Photonics Inc., or Raysung, filed a civil suit against our wholly-owned subsidiary, Oclaro Technology (Shenzhen) Co., Ltd. (formerly known as Bookham Technology (Shenzhen) Co., Ltd.), or Oclaro Shenzhen, in the Xi’an Intermediate People’s Court in Shaanxi Province of the People’s Republic of China, or the Xi’an Court. The complaint filed by Raysung alleged that Oclaro Shenzhen terminated its purchase order pursuant to which Raysung had supplied certain products and was to supply certain products to Oclaro Shenzhen.
Raysung initially requested that the court award damages of approximately RMB 4.8 million (equivalent to approximately $0.8 million at the exchange rate in effect June 27, 2015), and requested that Oclaro Shenzhen take the finished products that are now stored in Raysung’s warehouse (the value of the finished product is approximately RMB 13.5 million (equivalent to approximately $2.2 million at the exchange rate in effect June 27, 2015)) and requested that Oclaro Shenzhen pay its court fees in connection with this suit.
The Xi’an Court delivered an Asset Preservation Order which was served on Oclaro Shenzhen and the local Customs office. According to the Asset Preservation Order, Oclaro Shenzhen was ordered to maintain RMB 15.0 million (equivalent to approximately $2.5 million at the exchange rate in effect June 27, 2015) or assets equivalent to the said amount during the litigation process, and the Customs office was ordered to restrict Oclaro Shenzhen's equipment from being exported before the Asset Preservation Order is lifted. On November 11, 2013, Oclaro Shenzhen entered into a settlement agreement. Under the terms of this settlement agreement, Oclaro Shenzhen agreed to pay $0.5 million in payment of invoices for certain materials to Raysung and to work with Raysung to requalify it as a vendor for certain Oclaro Shenzhen manufacturing requirements, in consideration of which Raysung agreed to submit the settlement agreement to the Xi’an Court so it could issue a civil mediation agreement, apply for a discharge of the Asset Preservation Order and waive the right to bring any legal actions against Oclaro Shenzhen relating to these matters. Oclaro Shenzhen performed its obligations under the settlement agreement, however, on January 15, 2014, Raysung applied to the Xi’an Court to terminate the settlement agreement and add Oclaro, Inc. as a co-defendant in the original civil suit.
On March 26, 2014, the Xi’an Court froze RMB 15.0 million (equivalent to approximately $2.5 million at the exchange rate in effect June 27, 2015) of cash held in Oclaro Shenzhen’s bank account in China. On April 30, 2014, Oclaro Shenzhen submitted a challenge to the jurisdiction of the Xi'an Court. On May 26, 2014, the Xi'an Court overruled the jurisdictional challenge. On June 4, 2014, Oclaro Shenzhen filed an appeal with the Shaanxi High Court to revoke the civil order of the Xi'an Court overruling Oclaro Shenzhen's jurisdictional challenge. The Shaanxi High Court held hearings on July 15, 2014 and July 30, 2014, and on August 20, 2014 sustained the Xi'an Court's civil order on jurisdiction and transferred the case back to the Xi'an Court for substantive proceedings. On September 22, 2014, Raysung amended its complaint in the Xi'an Court proceeding by increasing its claims to RMB 36.2 million (equivalent to approximately $5.9 million at the exchange rate in effect on June 27, 2015). On October 22, 2014, the Xi'an Court conducted a hearing on the substantive elements of Raysung's claims. At the same hearing, Oclaro Shenzhen filed counterclaims against Raysung for RMB 7.4 million (equivalent to approximately $1.2 million at the exchange rate in effect on June 27, 2015) of losses resulting from supply of products with unqualified materials. On December 17, 2014, the Xi'an Court conducted a hearing on the substantive elements of each party's claims against the other party. On April 2, 2015, the Xi'an Court released RMB 5.0 million of cash (equivalent to approximately $0.8 million at the exchange rate in effect June 27, 2015) previously frozen in Oclaro Shenzhen's bank account in exchange for a new lien on physical assets located at Oclaro Shenzhen's facility with an equivalent appraised value. The Asset Preservation Order is currently in effect until March 2016. On April 10, 2015, the Xi'an Court issued a decision, ruling that Oclaro Shenzhen should
31
pay Raysung RMB 11.4 million (equivalent to approximately $1.9 million at the exchange rate in effect June 27, 2015). The Xi'an Court also dismissed Raysung's other claims and each of Oclaro Shenzhen's counterclaims.
On April 24, 2015, Oclaro Shenzhen filed an appeal of the Xi'an Court decision with the Shaanxi High Court, on the basis of both factual and legal error in the underlying decision. On June 30, 2015, the Shaanxi High Court conducted an appeal hearing, at which time Oclaro Shenzhen and Raysung presented arguments supporting their respective positions and rebutting each other's claims. During July 2015, the Shaanxi High Court conducted ex parte meetings with each of Oclaro Shenzhen and Raysung and asked for additional information, but did not subsequently schedule or hold any additional hearings with both parties present. On August 21, 2015, the Shaanxi High Court's judgment was delivered to Oclaro Shenzhen's Chinese counsel and became effective on this date. The Shaanxi High Court found that Oclaro Shenzhen was the breaching party and, therefore, has required that Oclaro Shenzhen pay Raysung, on or before August 31, 2015, a total of approximately RMB 15.0 million (equivalent to approximately $2.5 million at the exchange rate in effect June 27, 2015), which includes damages and fees. We intend to make the payment required by the judgment of the Shaanxi High Court and to close this matter.
Following the delivery of the Shaanxi High Court judgment to Oclaro Shenzhen on August 21, 2015, we recorded a $2.5 million charge in selling, general and administrative expense within our consolidated statement of operations for fiscal year 2015 and the quarter ended June 27, 2015 and $2.5 million in accrued expenses and other liabilities in our consolidated balance sheet at June 27, 2015.
Kunst Worker Compensation Matter
On June 18, 2015, Gerald Kunst, or Kunst, filed a civil suit against us and Travelers Property Casualty Company of America, or Travelers, in Massachusetts Superior Court, Civil Action No. SUCV2015-01818F. Travelers is our worker compensation insurance carrier. The complaint filed by Kunst, an employee of a third party service provider, alleges that he was injured while performing air conditioning repair services on the premises of our Acton, Massachusetts facility and seeks judgment in an amount to be determined by the court or jury, together with interest and costs. On July 24, 2015, we filed an answer to the complaint, which included our affirmative defenses. As of August 28, 2015, no hearing has been scheduled in this matter. We intend to vigorously defend against this litigation.
Item 4. Mine Safety Disclosures
None.
32
PART II
Item 5. Market for Registrant’s Common Equity, Related Stockholder Matters and Issuer Purchases of Equity Securities
Market Information and Holders
Our common stock is currently quoted on the NASDAQ Global Select Market under the symbol “OCLR.” The following table shows, for the periods indicated, the high and low sale prices of our common stock as reported on the NASDAQ Global Select Market.
Price Per Share of Common Stock | |||||||
High | Low | ||||||
Fiscal year 2015 quarter ended: | |||||||
September 27, 2014 | $ | 2.28 | $ | 1.50 | |||
December 27, 2014 | 2.07 | 1.31 | |||||
March 28, 2015 | 2.05 | 1.40 | |||||
June 27, 2015 | 2.85 | 1.76 | |||||
Fiscal year 2014 quarter ended: | |||||||
September 28, 2013 | $ | 1.84 | $ | 0.88 | |||
December 28, 2013 | 2.60 | 1.71 | |||||
March 29, 2014 | 3.29 | 2.39 | |||||
June 28, 2014 | 3.57 | 1.44 | |||||
On August 21, 2015, the closing sale price of our common stock as reported on the NASDAQ Global Select Market was $2.68 per share. According to the records of our transfer agent, there were 2,220 stockholders of record of our common stock on August 21, 2015. A substantially greater number of holders of our common stock are “street name” or beneficial owners, whose shares of record are held by banks, brokers and other financial institutions.
Dividends
We have never paid cash dividends on our common stock or ordinary shares. To the extent we generate earnings, we intend to retain them for use in our business and, therefore, do not anticipate paying any cash dividends on our common stock in the foreseeable future. In addition, our credit facility contains restrictions on our ability to pay cash dividends on our common stock.
33
Comparison of Stockholder Return
The following graph compares the cumulative five-year total return provided shareholders on Oclaro, Inc.’s common stock relative to the cumulative total returns of the NASDAQ Composite Index and the NASDAQ Telecommunications Index.
COMPARISON OF 5 YEAR CUMULATIVE TOTAL RETURN*
Among Oclaro, Inc., the NASDAQ Composite Index, and the NASDAQ Telecommunications Index
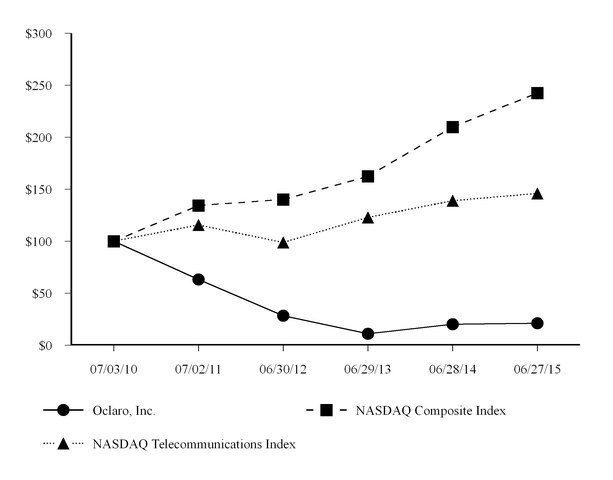
July 3 2010 | July 2 2011 | June 30 2012 | June 29 2013 | June 28 2014 | June 27, 2015 | ||||||||||||||||||
Oclaro, Inc. | $ | 100.00 | $ | 63.29 | $ | 28.54 | $ | 11.08 | $ | 20.19 | $ | 21.22 | |||||||||||
NASDAQ Composite Index | $ | 100.00 | $ | 134.49 | $ | 140.17 | $ | 162.53 | $ | 210.04 | $ | 242.64 | |||||||||||
NASDAQ Telecommunications Index | $ | 100.00 | $ | 115.64 | $ | 98.94 | $ | 122.96 | $ | 139.10 | $ | 146.01 | |||||||||||
* Assumes that $100.00 was invested in Oclaro common stock and in each index at market closing prices on July 3, 2010, and that all dividends were reinvested. No cash dividends have been declared on our common stock. Stockholder returns over the indicated period should not be considered indicative of future stockholder returns.
34
Item 6. Selected Financial Data
The selected financial data set forth below should be read in conjunction with our consolidated financial statements and related notes and “Management’s Discussion and Analysis of Financial Condition and Results of Operations” appearing elsewhere in this Annual Report on Form 10-K.
The selected financial data set forth below at June 27, 2015 and June 28, 2014, and for the fiscal years ended June 27, 2015, June 28, 2014 and June 29, 2013, are derived from our consolidated financial statements included elsewhere in this Annual Report on Form 10-K, after giving effect to the discontinued operations of our Amplifier and Zurich Businesses.
The selected financial data at June 29, 2013, June 30, 2012 and July 2, 2011, and for the fiscal years ended June 30, 2012 and July 2, 2011 are derived from audited financial statements not included in this Annual Report on Form 10-K, and adjusted to reflect the discontinued operations related to our Amplifier and Zurich Businesses for the fiscal year ended June 30, 2012. The selected financial data for the fiscal year ended July 2, 2011 has not been adjusted to reflect the discontinued operations related to our Amplifier and Zurich Businesses.
Consolidated Statements of Operations Data
Year Ended | |||||||||||||||||||
June 27, 2015 | June 28, 2014 | June 29, 2013 | June 30, 2012 | July 2, 2011 | |||||||||||||||
(Thousands, except per share data) | |||||||||||||||||||
Revenues | $ | 341,276 | $ | 390,871 | $ | 404,629 | $ | 194,208 | $ | 466,505 | |||||||||
Operating loss | (45,461 | ) | (102,331 | ) | (124,795 | ) | (67,673 | ) | (33,610 | ) | |||||||||
Loss from continuing operations | (48,234 | ) | (102,125 | ) | (120,295 | ) | (63,997 | ) | (46,425 | ) | |||||||||
Income (loss) from discontinued operations | (8,458 | ) | 119,944 | (2,450 | ) | (2,506 | ) | — | |||||||||||
Net income (loss) | (56,692 | ) | 17,819 | (122,745 | ) | (66,503 | ) | (46,425 | ) | ||||||||||
Loss from continuing operations per common share: | |||||||||||||||||||
Basic | $ | (0.45 | ) | $ | (1.03 | ) | $ | (1.37 | ) | $ | (1.27 | ) | $ | (0.96 | ) | ||||
Diluted | $ | (0.45 | ) | $ | (1.03 | ) | $ | (1.37 | ) | $ | (1.27 | ) | $ | (0.96 | ) | ||||
Weighted average shares of common stock outstanding: | |||||||||||||||||||
Basic | 108,144 | 98,986 | 87,770 | 50,396 | 48,444 | ||||||||||||||
Diluted | 108,144 | 98,986 | 87,770 | 50,396 | 48,444 | ||||||||||||||
Consolidated Balance Sheet Data
June 27, 2015 | June 28, 2014 | June 29, 2013 | June 30, 2012 | July 2, 2011 | |||||||||||||||
(Thousands) | |||||||||||||||||||
Total assets | $ | 325,884 | $ | 365,685 | $ | 449,894 | $ | 328,306 | $ | 375,174 | |||||||||
Total stockholders’ equity | 153,000 | 207,928 | 154,132 | 167,651 | 229,095 | ||||||||||||||
Long-term obligations | 71,545 | 18,884 | 48,756 | 12,391 | 6,277 | ||||||||||||||
The following items affect the comparability of our financial data for the periods shown in the consolidated statements of operations data above:
Revenues, operating loss, loss from continuing operations and net income (loss) in fiscal year 2015, 2014 and 2013 includes the revenues, costs of revenues and operating expenses of our industrial and consumer business of Oclaro Japan through October 27, 2014, the date the sale was completed to Ushio Opto.
Revenues, operating loss, loss from continuing operations and net income (loss) in fiscal year 2015, 2014 and 2013 includes the revenues, costs of revenues and operating expenses of Opnext from July 23, 2012, the date of the Opnext merger.
35
Revenues, operating loss, loss from continuing operations and net income (loss) in fiscal year 2011 includes the revenues, costs of revenues and operating expenses of our discontinued operations from our Amplifier and Zurich businesses.
Operating losses for fiscal years 2013 and 2011 include $26.0 million and $20.0 million, respectively, in recognition of impairment of goodwill and other intangible assets as more fully discussed in Note 4, Goodwill and Other Intangible Assets, to our consolidated financial statements included elsewhere in this Annual Report on Form 10-K.
Operating losses for fiscal years 2014 and 2013 include approximately $3.7 million and $29.5 million, respectively, in flood-related income related to settlement payments from our insurers and contract manufacturer relating to losses we incurred during the Thailand flooding.
Operating losses for fiscal year 2012 include a significant decline in product sales and impairment charges related to the same flooding in Thailand, as more fully discussed in Note 6, Flood-Related (Income) Expense, Net, to our consolidated financial statements included elsewhere in this Annual Report on Form 10-K.
Loss from continuing operations for fiscal year 2013 includes a gain on bargain purchase of $24.9 million related to our acquisition of Opnext on July 23, 2012, which is more fully discussed in Note 3, Business Combinations and Dispositions, to our consolidated financial statements included elsewhere in this Annual Report of Form 10-K.
Income (loss) from discontinued operations corresponds to the net operating results of our Amplifier and Zurich Businesses, as more fully discussed in Note 3, Business Combinations and Dispositions, to our consolidated financial statements included elsewhere in this Annual Report on Form 10-K.
Item 7. Management’s Discussion and Analysis of Financial Condition and Results of Operations
The following discussion and analysis of our financial condition and results of operations should be read in conjunction with “Risk Factors” appearing in Item 1A of this Annual Report on Form 10-K, “Selected Financial Data” appearing in Item 6 of this Annual Report on Form 10-K and our consolidated financial statements and related notes appearing elsewhere in this Annual Report on Form 10-K, including Note 1, Basis of Preparation and Summary of Significant Accounting Policies, to such consolidated financial statements, which have been prepared assuming that we will continue as a going concern. This discussion and analysis contains forward-looking statements that involve risks and uncertainties. Our actual results may differ materially from those anticipated by the forward-looking statements due to, among other things, our critical accounting estimates discussed below and important other factors set forth in this Annual Report on Form 10-K. Please see “Special Note Regarding Forward-Looking Statements” appearing elsewhere in this Annual Report on Form 10-K.
Overview
During our fiscal year 2015, we were one of the leading providers of optical components, modules and subsystems for the core optical transport, service provider, enterprise and data center markets. Leveraging over three decades of laser technology innovation, photonic integration, and subsystem design, we provide differentiated solutions for optical networks and high-speed interconnects driving the next wave of streaming video, cloud computing, application virtualization and other bandwidth-intensive and high-speed applications.
Our customers include ADVA Optical Networking ("ADVA"); Alcatel-Lucent; Ciena Corporation ("Ciena"); Cisco Systems, Inc. ("Cisco"); Coriant GmbH ("Coriant"); Fiberhome Networks ("Fiberhome"); Huawei Technologies Co. Ltd ("Huawei"); Juniper Networks, Inc. ("Juniper"); Telefonaktiebolaget LM Ericsson ("Ericsson") and ZTE Corporation ("ZTE").
Recent Developments
Business Combinations and Dispositions
On December 30, 2014, we entered into a Settlement Agreement with II-VI Incorporated, a Pennsylvania corporation (“II-VI”) and II-VI Holdings B.V., a Netherlands corporation (“II-VI B.V.,” and together with II-VI, the "II-VI Parties"), a wholly-owned subsidiary of II-VI, regarding disposition of the amounts held back by the II-VI Parties pursuant to the Share and Asset Purchase Agreement between Oclaro Technology and II-VI B.V. (as previously disclosed in our Current Report on Form 8-K filed on September 17, 2013) and pursuant to the Asset Purchase Agreement between Oclaro Technology and II-VI (as previously disclosed in our Current Report on Form 8-K filed on October 11, 2013) (the “Settlement Agreement”). Of the $10.0 million aggregate holdback, a total of $2.35 million was paid to us in January 2015 and a total of $7.65 million was released to II-VI Holdings B.V. We and the II-VI Parties also agreed to a mutual release of certain claims related to the Share and Asset Purchase Agreement, the Asset Purchase Agreement and certain related documents and transactions.
36
On August 5, 2014, Oclaro Japan, Inc. our wholly-owned subsidiary (“Oclaro Japan”), entered into a Master Separation Agreement (“MSA”) with Ushio Opto Semiconductors, Inc. (“Ushio Opto”) and Ushio, Inc. (“Ushio”), whereby Ushio Opto agreed to acquire the industrial and consumer business of Oclaro Japan located at its Komoro, Japan facility (the “Komoro Business”), by means of an absorption-type demerger under the Japanese Companies Act (such transaction, the “Transaction”). On October 27, 2014, the sale was completed. Consideration for the Transaction consisted of 1.85 billion Japanese yen (approximately $17.1 million based on the exchange rate on October 27, 2014) in cash, of which 1.6 billion Japanese yen (approximately $14.8 million based on the exchange rate on October 27, 2014) was paid at the closing and 250 million Japanese yen (approximately $2.1 million based on the exchange rate on April 24, 2015) was paid into escrow and was released to Oclaro Japan on April 24, 2015. In addition, under the MSA, we are subject to a post-closing net asset valuation adjustment. We determined that based on the net assets transferred to Ushio Opto during the second quarter of fiscal year 2015, we owed Ushio Opto a post-closing net asset valuation adjustment of $1.4 million, which was paid to Ushio Opto in the third quarter of fiscal year 2015.
Convertible Notes
On February 19, 2015, we closed the private placement of $65.0 million aggregate principal amount of Convertible Senior Notes ("6.00% Notes"). The 6.00% Notes were sold at 100 percent of par, resulting in net proceeds of approximately $61.6 million, after deducting the Initial Purchaser’s discounts. We also incurred offering expenses of $0.6 million. We intend to use the net proceeds of the offering for general corporate purposes, including working capital for, among other things, investing in development of new products and technologies.
Employee Stock Plans
On July 30, 2014, our board of directors approved the Fifth Amended and Restated 2001 Long-Term Stock Incentive Plan (the “Plan”) and on November 14, 2014, our shareholders ratified this plan. The Plan amends and restates in its entirety the Fourth Amended and Restated 2001 Long-Term Stock Incentive Plan. The Plan (i) increases the number of shares of common stock available for issuance by 6.0 million shares, (ii) consolidates the share reserve of the Plan with the share reserve of the Amended and Restated 2004 Stock Incentive Plan ("2004 Plan"), such that from November 14, 2014, no additional awards will be granted under the 2004 Plan, and (iii) establishes that full value awards count as 1.40 shares of common stock for purposes of the Plan.
Litigation Update
On August 21, 2015, the Shaanxi High Court in China delivered its judgment to Oclaro Shenzhen. See Legal Proceedings-Specific Matters- Raysung Commercial Litigation in Part I, Item 3 for additional details regarding this litigation. Following the delivery of this judgment, we recorded a $2.5 million charge in selling, general and administrative expense within our consolidated statement of operations for fiscal year 2015 and the quarter ended June 27, 2015 and $2.5 million in accrued expenses and other liabilities in our consolidated balance sheet at June 27, 2015. As a result, both the operating loss and net loss we reported in our earnings release for the fiscal year and quarter ended June 27, 2015 and included in our Current Report on Form 8-K furnished to the SEC on August 4, 2015, was $2.5 million less, the amount of the settlement, than the operating loss and net loss reported below and reflected in our consolidated financial statements included elsewhere in this Annual Report on Form 10-K.
Results of Operations
On October 27, 2014, we completed the sale of our industrial and consumer business of Oclaro Japan located at our Komoro, Japan facility to Ushio Opto. The transaction is more fully discussed in Note 3, Business Combinations and Dispositions to our consolidated financial statements included elsewhere in this Annual Report on Form 10-K. The consolidated statement of operations for the years ended June 27, 2015, June 28, 2014 and June 29, 2013 include the results of operations of the Komoro Business through October 27, 2014, the date of sale.
On September 12, 2013 we announced the sale of our Zurich Business to II-VI, along with an exclusive option to purchase our Amplifier Business. On October 10, 2013, we entered into an Asset Purchase Agreement with II-VI for the sale of our Amplifier Business, which subsequently closed on November 1, 2013. We have classified the financial results of the Zurich and Amplifier Businesses as discontinued operations for all periods presented. The following presentations relate to continuing operations only and accordingly excludes the financial results of the Zurich and Amplifier Businesses, unless otherwise indicated.
On July 23, 2012, we completed a merger with Opnext, Inc. (“Opnext”). The acquisition is more fully discussed in Note 3, Business Combinations and Dispositions to our consolidated financial statements included elsewhere in this Annual Report on Form 10-K. The consolidated statement of operations for the years ended June 27, 2015, June 28, 2014 and June 29, 2013 include the results of operations of the combined entities from July 23, 2012, the date of the acquisition.
37
Fiscal Years Ended June 27, 2015 and June 28, 2014
The following table sets forth our consolidated results of operations for the fiscal years ended June 27, 2015 and June 28, 2014, and the year-over-year increase (decrease) in our results, expressed both in dollar amounts (thousands) and as a percentage of revenues, except where indicated:
Year Ended | Increase (Decrease) | |||||||||||||||||||||
June 27, 2015 | June 28, 2014 | Change | ||||||||||||||||||||
(Thousands) | % | (Thousands) | % | (Thousands) | % | |||||||||||||||||
Revenues | $ | 341,276 | 100.0 | $ | 390,871 | 100.0 | $ | (49,595 | ) | (12.7 | ) | |||||||||||
Cost of revenues | 284,528 | 83.4 | 338,424 | 86.6 | (53,896 | ) | (15.9 | ) | ||||||||||||||
Gross profit | 56,748 | 16.6 | 52,447 | 13.4 | 4,301 | 8.2 | ||||||||||||||||
Operating expenses: | ||||||||||||||||||||||
Research and development | 46,419 | 13.6 | 64,218 | 16.4 | (17,799 | ) | (27.7 | ) | ||||||||||||||
Selling, general and administrative | 56,256 | 16.5 | 70,937 | 18.2 | (14,681 | ) | (20.7 | ) | ||||||||||||||
Amortization of other intangible assets | 1,133 | 0.3 | 1,680 | 0.4 | (547 | ) | (32.6 | ) | ||||||||||||||
Restructuring, acquisition and related (income) expense, net | (1,516 | ) | (0.5 | ) | 18,491 | 4.7 | (20,007 | ) | n/m | (1 | ) | |||||||||||
Flood-related (income) expense, net | — | — | (1,797 | ) | (0.5 | ) | 1,797 | (100.0 | ) | |||||||||||||
Impairment of goodwill, other intangible assets and long-lived assets | — | — | 584 | 0.2 | (584 | ) | (100.0 | ) | ||||||||||||||
(Gain) loss on sale of property and equipment | (83 | ) | — | 665 | 0.2 | (748 | ) | n/m | ||||||||||||||
Total operating expenses | 102,209 | 29.9 | 154,778 | 39.6 | (52,569 | ) | (34.0 | ) | ||||||||||||||
Operating loss | (45,461 | ) | (13.3 | ) | (102,331 | ) | (26.2 | ) | 56,870 | (55.6 | ) | |||||||||||
Other income (expense): | ||||||||||||||||||||||
Interest income (expense), net | (2,051 | ) | (0.6 | ) | (9,228 | ) | (2.3 | ) | 7,177 | (77.8 | ) | |||||||||||
Loss on foreign currency transactions | (2,144 | ) | (0.6 | ) | (1,158 | ) | (0.3 | ) | (986 | ) | 85.1 | |||||||||||
Other income (expense), net | 1,750 | 0.5 | 1,227 | 0.3 | 523 | 42.6 | ||||||||||||||||
Total other income (expense) | (2,445 | ) | (0.7 | ) | (9,159 | ) | (2.3 | ) | 6,714 | (73.3 | ) | |||||||||||
Loss from continuing operations before income taxes | (47,906 | ) | (14.0 | ) | (111,490 | ) | (28.5 | ) | 63,584 | (57.0 | ) | |||||||||||
Income tax provision (benefit) | 328 | 0.1 | (9,365 | ) | (2.4 | ) | 9,693 | n/m | (1 | ) | ||||||||||||
Loss from continuing operations | (48,234 | ) | (14.1 | ) | (102,125 | ) | (26.1 | ) | 53,891 | (52.8 | ) | |||||||||||
Income (loss) from discontinued operations, net of tax | (8,458 | ) | (2.5 | ) | 119,944 | 30.7 | (128,402 | ) | n/m | (1 | ) | |||||||||||
Net income (loss) | $ | (56,692 | ) | (16.6 | ) | $ | 17,819 | 4.6 | $ | (74,511 | ) | n/m | (1 | ) | ||||||||
(1) | Not meaningful |
Revenues
Revenues for the year ended June 27, 2015 decreased by $49.6 million, or 13 percent, compared to the year ended June 28, 2014. Compared to the year ended June 28, 2014, revenues from sales of our 100 Gb/s transmission modules increased by $40.7 million, or 52 percent, a result of growth in our line side discrete components and our 100 Gb/s client side transceivers; revenues from sales of our 40 Gb/s transmission modules decreased by 24.4 million, or 25 percent; revenues from sales of our 10 Gb/s and lower transmission modules decreased by $45.4 million, or 25 percent, as certain legacy 10 Gb/s products are gradually replaced by our newer products; and revenues from sales of our industrial and consumer products decreased by $20.5 million, or 69 percent, which related to the sale of the Komoro Business in our second quarter of fiscal year 2015. This product mix shift reflects the continued focus on the market for higher speed products that are smaller in size and have lower power consumption.
38
For the year ended June 27, 2015, Coriant GmbH ("Coriant") accounted for $66.2 million, or 19 percent, of our revenues, Huawei Technologies Co., Ltd. (“Huawei”) accounted for $49.4 million, or 14 percent, of our revenues; and Alcatel-Lucent accounted for $39.0 million, or 11 percent, of our revenues.
For the fiscal year ended June 28, 2014, Coriant accounted for $77.1 million, or 20 percent, of our revenues, Cisco Systems, Inc. ("Cisco") accounted for $49.1 million, or 13 percent, of our revenues, and Huawei accounted for $42.6 million, or 11 percent, of our revenues.
Gross Profit
Gross profit is calculated as revenues less cost of revenues. Gross margin rate is gross profit reflected as a percentage of revenues.
Our cost of revenues consists of the costs associated with manufacturing our products, and includes the purchase of raw materials, labor costs and related overhead, including stock-based compensation charges and the costs charged by our contract manufacturers for the products they manufacture for us. Charges for excess and obsolete inventory are also included in cost of revenues. Costs and expenses related to our manufacturing resources incurred in connection with the development of new products are included in research and development expenses.
Our gross margin rate increased to 17 percent for the year ended June 27, 2015, compared to 13 percent for the year ended June 28, 2014. A better product mix of higher margin 100 Gb/s products and favorable foreign currency exchange movements contributed approximately 6 percentage points of improvement and lower inventory related charges contributed approximately 1 percentage point. These increases were partially offset by a decrease of approximately 3 percentage points due to the absence of relatively higher margin industrial and consumer products as a result of the sale of our Komoro Business in the second quarter of fiscal year 2015.
Research and Development Expenses
Research and development expenses consist primarily of salaries and related costs of employees engaged in research and design activities, including stock-based compensation charges related to those employees, costs of design tools and computer hardware, costs related to prototyping and facilities costs for certain research and development focused sites.
Research and development expenses decreased by $17.8 million, or 28 percent, for the year ended June 27, 2015, compared to the year ended June 28, 2014. The decline was primarily related to a decrease of $7.9 million as a result of our restructuring plan which was initiated during the first quarter of fiscal year 2014, a decrease of $3.7 million related to the impact of the Japanese yen, British pound and Euro weakening relative to the U.S. dollar, a decrease of $3.4 million related to the sale of our Komoro Business in the second quarter of fiscal year 2015, a decrease of $1.8 million related to the recognition of a United Kingdom research and development tax credit in the fourth quarter of fiscal year 2015, and a decrease of $1.4 million related to our decision to no longer develop the WSS product line.
Selling, General and Administrative Expenses
Selling, general and administrative expenses consist primarily of personnel-related expenses, including stock-based compensation charges related to employees engaged in sales, general and administrative functions, and other costs, including costs for audit, professional fees and insurance costs; information technology; insurance; sales and marketing; human resources and legal and other corporate costs. Selling, general and administrative expenses also include facilities expenses for sites which are not primarily focused on manufacturing or research and development.
Selling, general and administrative expenses decreased by $14.7 million, or 21 percent, for the year ended June 27, 2015, compared to the year ended June 28, 2014. The decline was primarily related to a decrease of $5.8 million as a result of our restructuring plan which was initiated during the first quarter of fiscal year 2014, a decrease of $4.0 million in audit and legal costs, a decrease of $3.6 million related to the impact of the Japanese yen, British pound and Euro weakening relative to the U.S. dollar, a decrease of $1.8 million related to the sale of our Komoro Business in the second quarter of fiscal year 2015, and a decrease of $1.1 million in stock compensation costs compared to the prior year primarily related to a grant of 0.8 million RSUs to our chief executive officer in fiscal year 2014 that vested in full on the grant date. These reductions were partially offset by a charge of $2.5 million incurred as a result of the August 2015 judgment against our Shenzhen subsidiary imposed by the Shaanxi High Court in China. See Legal Proceedings in Part I, Item 3 for additional details regarding this litigation.
Amortization of Other Intangible Assets
Amortization of other intangible assets declined during year ended June 27, 2015 as compared to the year ended June 28, 2014, primarily due to the sale of our Komoro Business in the second quarter of fiscal year 2015. With the sale of our Komoro Business, we expect our future amortization of intangible assets to be $1.0 million for fiscal year 2016, $0.8 million for fiscal
39
year 2017, $0.6 million for fiscal year 2018 and $0.1 million for fiscal year 2019, based on the current level of our other intangible assets as of June 27, 2015.
Restructuring, Acquisition and Related (Income) Expense, Net
Our restructuring, acquisition and related (income) expense, net primarily consisted of the following activities during the year ended June 27, 2015:
• | In the second quarter of fiscal year 2015, we completed the sale of our Komoro Business to Ushio Opto, and recognized a gain of $8.3 million. |
• | During the first quarter of fiscal year 2014, we initiated a restructuring plan to simplify our operating footprint, reduce our cost structure and focus our research and development investment in the optical communications market where we can leverage our core competencies. During the year ended June 27, 2015, we recorded restructuring charges of $4.0 million related to this restructuring plan, consisting of $4.1 million related to workforce reductions and a $0.1 million reversal of restructuring charges related to revised estimates for lease cancellations and commitments. |
• | During fiscal year 2012, we initiated a restructuring plan in connection with the transfer of our Shenzhen, China manufacturing operations to Venture Corporation Limited ("Venture"). In connection with this transition, we recorded restructuring charges of $2.5 million during the year ended June 27, 2015, which related primarily to employee separation charges. |
We do not expect to incur any additional restructuring charges in connection with these restructuring plans in fiscal year 2016.
Our restructuring, acquisition and related (income) expense, net primarily consisted of the following activities during the year ended June 28, 2014:
• | In connection with our restructuring plan we initiated in fiscal year 2014, we recorded restructuring charges of $13.2 million during the year ended June 28, 2014, consisting of $8.5 million related to workforce reductions, $2.9 million in costs related to transferring production capabilities of our 10 Gb/s InP products in-house from one of our contract manufacturers, $0.8 million related to a facility lease loss liability, $0.7 million related to the write-off of certain fixed assets in connection with our relocation of our manufacturing and research and development facilities from Totsuka, Japan, and $0.3 million in other lease cancellations and commitments. |
• | In connection with the acquisition of Opnext, we initiated a restructuring plan to integrate the businesses in the first quarter of fiscal year 2013. We recorded $1.1 million in restructuring charges during the year ended June 28, 2014. The restructuring charges in fiscal year 2014 included $0.9 million related to external consulting charges and professional fees associated with reorganizing the infrastructure and $0.1 million related to facility exit costs. |
• | In connection with our transition of our Shenzhen, China manufacturing operations to Venture, we recorded $3.5 million during the year ended June 28, 2014. All of the restructuring charges in fiscal year 2014 related to employee separation charges. |
Flood-Related (Income) Expense, Net
In October 2011, certain areas in Thailand suffered major flooding as a result of monsoons. This flooding had a material and adverse impact on our business and results of operations. Our primary contract manufacturer, Fabrinet, suspended operations at two factories located in Chokchai, Thailand and Pinehurst, Thailand. The Chokchai factory suffered extensive flood damage and became inaccessible due to high water levels inside and surrounding the manufacturing facility.
During the year ended June 28, 2014, we recorded $1.8 million in net flood-related income in our consolidated statement of operations, primarily consisting of $3.7 million in insurance settlement proceeds received in the second and third quarters of fiscal year 2014 and adjustments to retainers for professional services of $0.1 million, partially offset by an out-of-period adjustment of $2.0 million related to the impairment of leased assets assumed pursuant to the Opnext merger that had been damaged by the flooding. Approximately $1.5 million of the $3.7 million received in fiscal year 2014 represents payments against insurance claims filed under the former Opnext entity.
40
Flood-related (income) expense, net for the years ended June 27, 2015 and June 28, 2014 include the following:
Year Ended | |||||||
June 27, 2015 | June 28, 2014 | ||||||
(Thousands) | |||||||
Write-off of net book value of damaged property and equipment | $ | — | $ | 2,009 | |||
Personnel-related costs, professional fees and related expenses | — | (143 | ) | ||||
Settlement payments | — | (3,663 | ) | ||||
$ | — | $ | (1,797 | ) | |||
Impairment of Goodwill, Other Intangible Assets and Long-Lived Assets
In fiscal year 2014, we recorded an impairment charge of $0.6 million related to the write-off of certain machinery that was not being utilized.
During the fourth quarter of fiscal years 2015 and 2014, we reviewed our other intangible assets for impairment. We compared their carrying amounts to market prices or the future undiscounted cash flows the assets are expected to generate. We determined that the carrying value of the assets did not exceed the fair value based on market prices or future discounted cash flows. We did not record any impairment charges related to other intangible assets in fiscal years 2015 or 2014.
Other Income (Expense), Net
Other income (expense) was $2.4 million in expense for the year ended June 27, 2015 as compared to $9.2 million in expense for the year ended June 28, 2014. This decrease in expense primarily related to an $8.3 million decrease in interest expense related to the redemption exchange make-whole payment for the conversion of the 7.50% Exchangeable Senior Secured Second Lien Notes into common stock in fiscal year 2014, partially offset by a $1.0 million increase in foreign currency transaction losses during the year ended June 27, 2015, as compared to the year ended June 28, 2014, related to the revaluation of our U.S. dollar denominated balances in our U.K. and Japan subsidiaries.
Income Tax (Benefit) Provision
For the fiscal year ended June 27, 2015, we recorded a tax provision of approximately $0.3 million primarily related to our foreign operations as offset by a reserve release related to Italy, Korea and Germany due to the lapse of relevant statute of limitations.
For the fiscal year ended June 28, 2014, our income tax benefit of $9.4 million primarily related to our foreign operations and an adjustment relating to the income tax accounting for intra-period tax allocation during fiscal year 2014 between continuing operations and discontinued operations related to our sales of our Zurich and Amplifier Businesses.
Income (Loss) from Discontinued Operations, Net of Tax
During the year ended June 27, 2015, we recorded a loss from discontinued operations of $8.5 million related to the sale of the Zurich and Amplifier Businesses. This loss primarily related to the release of hold-back payments due from II-VI and II-VI Holdings B.V. On December 30, 2014, we entered into a Settlement Agreement with II-VI and II-VI Holdings B.V. regarding disposition of the amounts held back by the II-VI parties pursuant to the Share and Asset Purchase Agreements. Of the $10.0 million subject to hold-back until December 31, 2014, we received $2.35 million in January 2015 and we released II-VI from the remaining $7.65 million. We recorded the $7.65 million release of the hold-backs as a loss from discontinued operations within the consolidated statement of operations during the year ended June 27, 2015. In connection with the Settlement Agreement, we also agreed with the II-VI parties to a mutual release of certain claims related to the Share and Asset Purchase Agreements, and certain related documents and transactions.
During the year ended June 28, 2014, we recorded income from discontinued operations from the Amplifier and Zurich Businesses of $59.1 million and $60.8 million, respectively, which includes the gain of $68.9 million related to the sale of the Amplifier Business and a gain of $63.2 million related to the sale of the Zurich Business.
41
The following table sets forth the results of the discontinued operations of our Zurich and Amplifier Businesses and the year-over-year increases (decreases) in our results:
Year Ended | |||||||||||
June 27, 2015 | June 28, 2014 | Change | |||||||||
(Thousands) | |||||||||||
Revenues | $ | — | $ | 49,081 | $ | (49,081 | ) | ||||
Cost of revenues | 163 | 37,418 | (37,255 | ) | |||||||
Gross profit | (163 | ) | 11,663 | (11,826 | ) | ||||||
Operating expenses | 645 | 8,971 | (8,326 | ) | |||||||
Other income (expense), net | (7,650 | ) | 130,518 | (138,168 | ) | ||||||
Income (loss) from discontinued operations before income taxes | (8,458 | ) | 133,210 | (141,668 | ) | ||||||
Income tax provision | — | 13,266 | (13,266 | ) | |||||||
Income (loss) from discontinued operations | $ | (8,458 | ) | $ | 119,944 | $ | (128,402 | ) | |||
42
Fiscal Years Ended June 28, 2014 and June 29, 2013
The following table sets forth our consolidated results of operations for the fiscal years ended June 28, 2014 and June 29, 2013, and the year-over-year increase (decrease) in our results, expressed both in dollar amounts (thousands) and as a percentage of revenues, except where indicated:
Year Ended | Increase (Decrease) | |||||||||||||||||||||
June 28, 2014 | June 29, 2013 | Change | ||||||||||||||||||||
(Thousands) | % | (Thousands) | % | (Thousands) | % | |||||||||||||||||
Revenues | $ | 390,871 | 100.0 | $ | 404,629 | 100.0 | $ | (13,758 | ) | (3.4 | ) | |||||||||||
Cost of revenues | 338,424 | 86.6 | 376,461 | 93.0 | (38,037 | ) | (10.1 | ) | ||||||||||||||
Gross profit | 52,447 | 13.4 | 28,168 | 7.0 | 24,279 | 86.2 | ||||||||||||||||
Operating expenses: | ||||||||||||||||||||||
Research and development | 64,218 | 16.4 | 79,266 | 19.6 | (15,048 | ) | (19.0 | ) | ||||||||||||||
Selling, general and administrative | 70,937 | 18.2 | 78,618 | 19.4 | (7,681 | ) | (9.8 | ) | ||||||||||||||
Amortization of other intangible assets | 1,680 | 0.4 | 5,029 | 1.3 | (3,349 | ) | (66.6 | ) | ||||||||||||||
Restructuring, acquisition and related (income) expense, net | 18,491 | 4.7 | (7,631 | ) | (1.9 | ) | 26,122 | n/m | (1 | ) | ||||||||||||
Flood-related (income) expense, net | (1,797 | ) | (0.5 | ) | (29,510 | ) | (7.3 | ) | 27,713 | (93.9 | ) | |||||||||||
Impairment of goodwill, other intangible assets and long-lived assets | 584 | 0.2 | 27,021 | 6.7 | (26,437 | ) | (97.8 | ) | ||||||||||||||
(Gain) loss on sale of property and equipment | 665 | 0.2 | 170 | — | 495 | 291.2 | ||||||||||||||||
Total operating expenses | 154,778 | 39.6 | 152,963 | 37.8 | 1,815 | 1.2 | ||||||||||||||||
Operating loss | (102,331 | ) | (26.2 | ) | (124,795 | ) | (30.8 | ) | 22,464 | (18.0 | ) | |||||||||||
Other income (expense): | ||||||||||||||||||||||
Interest income (expense), net | (9,228 | ) | (2.3 | ) | (3,271 | ) | (0.8 | ) | (5,957 | ) | 182.1 | |||||||||||
Loss on foreign currency transactions | (1,158 | ) | (0.3 | ) | (14,542 | ) | (3.6 | ) | 13,384 | (92.0 | ) | |||||||||||
Other income (expense), net | 1,227 | 0.3 | (2,527 | ) | (0.6 | ) | 3,754 | n/m | (1 | ) | ||||||||||||
Gain on bargain purchase | — | — | 24,866 | 6.1 | (24,866 | ) | (100.0 | ) | ||||||||||||||
Total other income (expense) | (9,159 | ) | (2.3 | ) | 4,526 | 1.1 | (13,685 | ) | n/m | (1 | ) | |||||||||||
Loss from continuing operations before income taxes | (111,490 | ) | (28.5 | ) | (120,269 | ) | (29.7 | ) | 8,779 | (7.3 | ) | |||||||||||
Income tax provision | (9,365 | ) | (2.4 | ) | 26 | — | (9,391 | ) | n/m | (1 | ) | |||||||||||
Loss from continuing operations | (102,125 | ) | (26.1 | ) | (120,295 | ) | (29.7 | ) | 18,170 | (15.1 | ) | |||||||||||
Gain (loss) from discontinued operations, net of tax | 119,944 | 30.7 | (2,450 | ) | (0.6 | ) | 122,394 | n/m | (1 | ) | ||||||||||||
Net income (loss) | $ | 17,819 | 4.6 | $ | (122,745 | ) | (30.3 | ) | $ | 140,564 | n/m | (1 | ) | |||||||||
(1) | Not meaningful |
Revenues
Revenues for the year ended June 28, 2014 decreased by $13.8 million, or 3 percent, compared to the year ended June 29, 2013. Compared to the year ended June 29, 2013, revenues from sales of our 100 Gb/s transmission modules increased by $36.3 million, or 86 percent; revenues from sales of our 40 Gb/s transmission modules decreased by $1.6 million, or 2 percent; revenues from sales of our 10 Gb/s and lower transmission modules decreased by $52.5 million, or 22 percent; and revenues from sales of our industrial and consumer products increased by $4.1 million, or 16 percent. This reflects the growth in the market for higher speed products that are smaller in size and have lower power consumption.
For the year ended June 28, 2014, Coriant accounted for $77.1 million, or 20 percent, of our revenues, Cisco accounted for $49.1 million, or 13 percent, of our revenues, and Huawei accounted for $42.6 million, or 11 percent, of our revenues.
43
For the fiscal year ended June 29, 2013, Cisco accounted for $56.4 million, or 14 percent, of our revenues, Coriant accounted for $55.7 million, or 14 percent, of our revenues, and Huawei accounted for $42.2 million, or 10 percent, of our revenues.
Gross Profit
Our gross margin rate increased to 13 percent for the year ended June 28, 2014, compared to 7 percent for the year ended June 29, 2013. Three percentage points of the the 6 percentage point improvement in gross margin rate related to the product mix of our sales, with an increased mix of our higher margin 100 Gb/s products during the year ended June 28, 2014, as compared to the year ended June 29, 2013. In addition, reduced manufacturing overhead costs contributed 2 percentage points of improvement, and the absence of certain acquisition costs combined with lower outsource transition costs in fiscal year 2014 as compared to fiscal year 2013, contributed 1 percentage point of improvement.
Research and Development Expenses
Research and development expenses decreased by $15.0 million, or 19 percent, for the year ended June 28, 2014, compared to the year ended June 29, 2013. The decrease primarily related to a $6.2 million reduction in costs as a result of aligning and reducing combined research and development resources of Oclaro and Opnext in association with the merger, a decrease of $3.5 million related to our decision to no longer develop the WSS product line, a decrease of $3.2 million related to headcount reductions and other cost savings measures, a decrease of $1.6 million related to the impact of the depreciation of the Japanese Yen, and a decrease in stock compensation expense of $0.5 million.
Selling, General and Administrative Expenses
Selling, general and administrative expenses decreased by $7.7 million, or 10 percent, for the year ended June 28, 2014, compared to the year ended June 29, 2013. The decrease was primarily related to $10.1 million reduction in costs as a result of aligning and reducing combined selling, general and administrative resources of Oclaro and Opnext in association with the merger, a decrease of $0.8 million related to the impact of the depreciation of the Japanese Yen, and a $1.0 million reduction in expenses associated with the shutdown of the WSS product line. These reductions were partially offset by an increase in audit fees of $1.2 million, an increase in variable compensation of $1.2 million, an increase in legal costs of $0.8 million and an increase in stock compensation charges of $1.0 million.
Amortization of Other Intangible Assets
Amortization of other intangible assets decreased to $1.7 million for the year ended June 28, 2014 from $5.0 million for the year ended June 29, 2013. The decrease in our amortization is a result of recording a $14.2 million impairment charge related to our other intangible assets during the fourth quarter of fiscal year 2013, including $6.4 million related to intangibles acquired in connection with our acquisition of Mintera, $2.6 million related to intangibles acquired in connection with our acquisition of Opnext, and $5.2 million related to intangibles acquired in connection with other earlier acquisitions.
Restructuring, Acquisition and Related (Income) Expense, Net
In connection with our restructuring plan that we initiated in 2014, we recorded restructuring charges of $13.2 million during the year ended June 28, 2014, consisting of $8.5 million related to workforce reductions, $2.9 million in costs related to transferring production capabilities of our 10 Gb/s InP products in-house from one of our contract manufacturers, $0.8 million related to a facility lease loss liability, $0.7 million related to the write-off of certain fixed assets in connection with our relocation of our manufacturing and research and development facilities from Totsuka, Japan, and $0.3 million in other lease cancellations and commitments.
In connection with the acquisition of Opnext, we initiated a restructuring plan to integrate the businesses in the first quarter of fiscal year 2013. In connection with the integration, we recorded $1.1 million and $12.1 million in restructuring charges during the year ended June 28, 2014 and June 29, 2013, respectively. The restructuring charges in fiscal year 2014 included $0.9 million related to external consulting charges and professional fees associated with reorganizing the infrastructure and $0.1 million related to facility exit costs. The restructuring charges in fiscal year 2013 included $10.5 million related to workforce reductions, $0.9 million related to the impairment of certain technology that is now considered redundant following the acquisition, $0.4 million related to the write-off of net book value inventory that supported this technology, and $0.3 million related to revised estimates for lease cancellations and commitments.
Included in our restructuring charges during fiscal year 2013, we recorded $2.2 million relating to the separation agreement with our former Chief Executive Officer.
44
In connection with the transfer of our Shenzhen, China manufacturing operations to Venture, we recorded restructuring charges of $3.5 million and $5.1 million during the year ended June 28, 2014 and June 29, 2013, respectively. All of the restructuring charges in fiscal year 2014 and 2013 related to employee separation charges.
During the second quarter of fiscal year 2013, we sold our thin film filter business and interleaver product line in exchange for $27.0 million in cash. During the year ended June 29, 2013, we recorded a gain of $24.8 million related to this sale in the restructuring, acquisition and related (income) expense, net in our consolidated statement of operations.
Flood-Related (Income) Expense, Net
During the year ended June 28, 2014, we recorded $1.8 million in net flood-related income in our consolidated statement of operations, primarily consisting of $3.7 million in insurance settlement proceeds received in the second and third quarters of fiscal year 2014 and adjustments to retainers for professional services of $0.1 million, partially offset by an out-of-period adjustment of $2.0 million related to the impairment of leased assets assumed pursuant to the Opnext merger that had been damaged by the flooding. Approximately $1.5 million of the $3.7 million received in fiscal year 2014 represents payments against insurance claims filed under the former Opnext entity.
During the year ended June 29, 2013, we recorded net flood-related income of $29.5 million comprised of $30.8 million in settlement payments, offset in part by $1.3 million in professional fees and related expenses incurred in connection with our recovery efforts. Approximately $14.0 million of the $30.8 million received in fiscal year 2013 represents payments against insurance claims filed under the former Opnext entity.
Flood-related (income) expense, net for the years ended June 28, 2014 and June 29, 2013 include the following:
Year Ended | |||||||
June 28, 2014 | June 29, 2013 | ||||||
(Thousands) | |||||||
Write-off of net book value of damaged property and equipment | 2,009 | — | |||||
Personnel-related costs, professional fees and related expenses | (143 | ) | 1,287 | ||||
Settlement payments | (3,663 | ) | (30,797 | ) | |||
$ | (1,797 | ) | $ | (29,510 | ) | ||
Impairment of Goodwill, Other Intangible Assets and Long-Lived Assets
In fiscal year 2014, we recorded an impairment charge of $0.6 million related to the write-off of certain machinery that was not being utilized.
During the fourth quarter of fiscal year 2014, we reviewed our other intangible assets for impairment. We compared their carrying amounts to market prices or the future undiscounted cash flows the assets are expected to generate. We determined that the carrying value of the assets did not exceed the fair value based on market prices or future discounted cash flows. We did not record any impairment charges related to other intangible assets in fiscal year 2014.
During the fourth quarter of fiscal year 2013, we performed an annual analysis for potential impairment of our goodwill, which included examining. based on factors and conditions then existing, the impact of current general economic conditions on our future prospects, the decline in our market capitalization, and the anticipated resizing of our operations with the recent sale of certain of our products and/or businesses. The first step of testing goodwill for impairment is based on a reporting unit’s “fair value,” which is generally determined through market prices. In certain cases, due to the absence of market prices for a particular element of our business, we have elected to base our analysis on discounted future expected cash flows. Based on this analysis, we concluded that our remaining goodwill on our consolidated balance sheet, which relates to our acquisition of Mintera, was impaired. We performed a second step impairment analysis, which indicated that the goodwill in connection with the Mintera reporting unit was fully impaired. Based upon this evaluation, we recorded $10.9 million for the goodwill impairment loss in our consolidated statement of operations for the year ended June 29, 2013. The impairment did not result in any cash expenditures. In connection with our second step goodwill impairment analysis, we also evaluated the fair value of our other intangible assets in this reporting unit, and our other reporting units, and concluded that based on declines in our forecasts, our decision to sell or abandon certain product lines and other factors, certain of these other intangible assets were also impaired as of June 29, 2013. We recorded impairment losses of $6.4 million related to intangibles acquired in connection with our acquisition of Mintera, $2.6 million related to intangibles acquired in connection with our acquisition of Opnext, and $5.2 million related to intangibles acquired in connection with other earlier acquisitions.
45
During fiscal year 2013, we also recorded $0.9 million related to the impairment of certain technology that was considered redundant following the acquisition of Opnext.
Other Income (Expense)
Other income (expense) decreased to $9.2 million in expense for the year ended June 28, 2014 from $4.5 million in income for the year ended June 29, 2013. This decrease was primarily due to a $24.9 million gain on bargain purchase in connection with our acquisition of Opnext in the first quarter of fiscal year 2013, and by a $6.9 million increase in interest expense primarily related to the make-whole payment from the conversion of the 7.50% Exchangeable Senior Secured Second Lien Notes into common stock in the second quarter of fiscal year 2014, partially offset by a $3.6 million impairment charge related to the revaluation of an investment during the year ended June 29, 2013, and as a result of recording lower foreign currency transaction losses of $13.4 million during the year ended June 28, 2014 as compared to the year ended June 29, 2013. The $13.4 million foreign currency transaction loss during the year ended June 29, 2013 was predominantly a result of revaluing intercompany receivables denominated in Japanese yen.
Income Tax Provision
For the fiscal year ended June 28, 2014, our income tax benefit of $9.4 million related primarily to our foreign operations and an adjustment relating to the income tax accounting for intra-period tax allocation during fiscal year 2014 between continuing operations and discontinued operations related to our sales of our Zurich and Amplifier Businesses.
For the fiscal year ended June 29, 2013, our income tax provision was minimal and related primarily to our foreign operations, which operate on a cost-plus basis for services associated with manufacturing and research and development.
Income from Discontinued Operations, Net of Tax
During the year ended June 28, 2014, we recorded income from discontinued operations from the Amplifier and Zurich Businesses of $59.1 million and $60.8 million, respectively, which includes a gain of $68.9 million related to the sale of the Amplifier Business and a gain of $63.2 million related to the sale of the Zurich Business.
For the year ended June 29, 2013, we recorded income from discontinued operations from the Amplifier Business of $1.5 million and a loss from discontinued operations from the Zurich Business of $3.9 million.
The following table sets forth the results of the discontinued operations of our Zurich and Amplifier Businesses and the year-over-year increases (decreases) in our results:
Year Ended | |||||||||||
June 28, 2014 | June 29, 2013 | Change | |||||||||
(Thousands) | |||||||||||
Revenues | $ | 49,081 | $ | 181,399 | $ | (132,318 | ) | ||||
Cost of revenues | 37,418 | 145,165 | (107,747 | ) | |||||||
Gross profit | 11,663 | 36,234 | (24,571 | ) | |||||||
Operating expenses | 8,971 | 36,195 | (27,224 | ) | |||||||
Other income (expense), net | 130,518 | (996 | ) | 131,514 | |||||||
Income (loss) from discontinued operations before income taxes | 133,210 | (957 | ) | 134,167 | |||||||
Income tax provision | 13,266 | 1,493 | 11,773 | ||||||||
Income (loss) from discontinued operations | $ | 119,944 | $ | (2,450 | ) | $ | 122,394 | ||||
46
Liquidity and Capital Resources
The consolidated statements of cash flows and the discussion below on cash flows from operating activities, investing activities and financing activities have not been adjusted for the effects of the discontinued operations.
Cash flows from Operating Activities
Net cash used in operating activities for the year ended June 27, 2015 was $46.3 million, primarily resulting from a loss from continuing operations before income taxes of $47.9 million, adjusted for accumulated non-cash charges of $15.9 million (excluding the losses resulting from the adjustment to the hold-backs related to the sales of the Zurich and Amplifier Businesses) and a $13.1 million decrease in cash due to changes in operating assets and liabilities. The $15.9 million of non-cash adjustments primarily consisted of $18.6 million of expense related to depreciation and amortization, $6.2 million expense related to stock-based compensation, $0.3 million related to the amortization of debt issuance costs of the 6.00% Convertible Senior Notes due 2020, partially offset by an $8.3 million gain in connection with the sale of the Komoro Business in the fiscal year 2015 and $0.9 million from the amortization of the deferred gain from two sales-leaseback transactions. The $13.1 million decrease in cash due to changes in operating assets and liabilities was primarily comprised of a $10.8 million decrease in accrued expenses and other liabilities, a $5.3 million increase in inventory, a $4.9 million decrease in accounts payable and a $0.3 million increase in other non-current assets, partially offset by an $8.0 million decrease in prepaid expenses and other current assets and a $0.1 million decrease in accounts receivable. The $0.1 million decrease of accounts receivable included a $8.1 increase attributable to timing of payments from a significant customer .
Net cash used in operating activities for the year ended June 28, 2014 was $81.2 million, primarily resulting from a loss from continuing operations before income taxes of $111.5 million, adjusted for accumulated non-cash charges of $38.4 million (excluding the gains on the sale of the Zurich and Amplifier Businesses) and a $5.3 million decrease in cash due to changes in operating assets and liabilities. The $38.4 million of non-cash adjustments primarily consisted of $26.4 million of expense related to depreciation and amortization, $6.2 million expense related to stock-based compensation, $4.3 million related to the amortization and write-off of the issuance costs of a term loan and $2.0 million related to non-cash flood-related impairments, partially offset by $2.1 million from the amortization of the deferred gain from two sales-leaseback transactions. The $5.3 million decrease in cash due to changes in operating assets and liabilities was primarily comprised of a $27.2 million decrease in accounts payable, a $14.7 million decrease in accrued expenses and other liabilities and a $7.0 million increase in prepaid expenses and other current assets, partially offset by a $26.5 million decrease in accounts receivable, net, a $15.5 million decrease in inventory, and a $1.5 million decrease in other non-current assets.
Net cash used in operating activities for the year ended June 29, 2013 was $87.5 million, primarily resulting from a net loss of $122.7 million, partially offset by $28.4 million of non-cash adjustments and a $6.9 million increase in cash due to changes in operating assets and liabilities. The $28.4 million of non-cash adjustments was primarily comprised of $42.2 million of expense related to depreciation and amortization, $26.0 million related to the impairment of goodwill and other intangibles, $7.2 million of expense related to stock-based compensation, $3.6 million related to the impairment of an investment in a privately-held company, and $1.1 million charge related to other non-cash transactions, partially offset by $24.9 million for the bargain purchase gain related to our acquisition of Opnext, $24.8 million related to the gain on the sale of the thin film filter business and interleaver product line, and $2.1 million from the amortization of the deferred gain from two sales-leaseback transactions. The $6.9 million increase in cash due to changes in operating assets and liabilities was primarily comprised of a $33.9 million decrease in accounts receivable, net, and a $14.4 million decrease in inventory, partially offset by a $23.4 million decrease in accounts payable, a $15.0 million increase in prepaid expenses and other current assets and a $2.9 million decrease in accrued expenses and other liabilities.
Cash flows from Investing Activities
Net cash provided by investing activities for the year ended June 27, 2015 was $0.8 million, primarily consisting of proceeds from the sale of the Komoro Business of $14.6 million, net of deal costs, $2.4 million related to the receipt of hold-back payments from II-VI in connection with the sale of the Amplifier and Zurich Businesses, $1.8 million reduction in restricted cash and $0.1 million related to the sale of short-term investments, partially offset by $18.1 million used in capital expenditures.
Net cash provided by investing activities for the year ended June 28, 2014 was $169.2 million, primarily consisting of $93.5 million in proceeds from the sale of the Zurich Business, $84.6 million in proceeds from the sale of the Amplifier Business, $2.1 million from the sale of certain assets, partially offset by $8.8 million used in capital expenditures and $2.3 million increase in restricted cash.
Net cash provided by investing activities for the year ended June 29, 2013 was $66.8 million, primarily consisting of $36.1 million cash acquired in the acquisition of Opnext, $26.0 million in proceeds from the sale of the thin film filter business and interleaver product line, a $17.9 million reduction in restricted cash and $3.9 million in proceeds from the sale of an investment in a privately-held company, which were partially offset by $17.2 million used in capital expenditures.
47
Cash Flows from Financing Activities
Net cash provided by financing activities for the year ended June 27, 2015 was $56.8 million, primarily consisting of $60.9 million in proceeds from the sale of convertible notes, net of issuance and deal related costs, partially offset by $4.2 million in payments on capital leases.
Net cash used in financing activities for the year ended June 28, 2014 was $72.1 million, primarily consisting of $65.0 million in repayments on a term loan and our revolving credit facility and $7.1 million in payments on capital leases.
Net cash provided by financing activities for the year ended June 29, 2013 was $30.8 million, primarily consisting of $22.8 million in proceeds from the sale of convertible notes, $22.5 million from borrowings under a term loan, $15.3 million in borrowings under our revolving credit facility and $1.6 million in proceeds from the issuance of common stock through stock option exercises and our employee stock purchase plan, partially offset by $16.0 million in repayments on a note payable and our revolving credit facility, $8.6 million in payments in connection with the remaining earnout obligations related to our acquisition of Mintera, and $6.7 million in payments on capital lease obligations.
Effect of Exchange Rates on Cash and Cash Equivalents for the Years Ended June 27, 2015, June 28, 2014 and June 29, 2013
The effect of exchange rates on cash and cash equivalents for the years ended June 27, 2015, June 28, 2014 and June 29, 2013, was an increase of $1.4 million, a decrease of $1.6 million and an increase of $12.8 million, respectively, which primarily consisted of the revaluation of the U.S. dollar denominated operating intercompany payables and receivables of our foreign subsidiaries and the revaluation of foreign currency cash balances to the functional currency of the respective subsidiaries.
Credit Line and Notes
On February 19, 2015, we closed a private placement of $65.0 million in aggregate principal Convertible Senior Notes due 2020 (the “6.00% Notes”). The sale of the 6.00% Notes resulted in proceeds of approximately $61.6 million, after deducting the discount. We also incurred offering costs of $0.6 million in connection with the 6.00% Notes. As of June 27, 2015, the net carrying value of the liability component was $61.2 million and the unamortized value of the debt discount and issuance costs was $3.8 million. Interest on the 6.00% Notes is payable semi-annually in arrears on February 15 and August 15 of each year, beginning on August 15, 2015. During the year ended June 27, 2015, we recorded $1.4 million in interest expense related to these 6.00% Notes. See Note 7, Credit Line and Notes, for additional information regarding the 6.00% Notes.
As of June 27, 2015, we had a $40.0 million revolving credit facility with Silicon Valley Bank. As of June 27, 2015, there were no amounts outstanding under this credit facility. See Note 7, Credit Line and Notes, for additional information regarding this credit facility.
Prior to establishing our credit facility with Silicon Valley Bank, we maintained a credit facility with Wells Fargo Capital Finance, Inc. ("Wells Fargo") and certain other lenders, which was terminated on March 14, 2014. All amounts outstanding under this credit facility were repaid during fiscal year 2014. See Note 7, Credit Line and Notes, for additional information regarding this credit facility.
On May 6, 2013, we secured a $25.0 million term loan (the “Term Loan”), which was subsequently repaid during the first quarter of fiscal year 2014, with the proceeds from the sale of our Zurich Business. See Note 7, Credit Line and Notes, for additional information regarding this Term Loan.
On December 14, 2012, we closed a private placement of $25.0 million aggregate principal amount 7.50% Exchangeable Senior Secured Second Lien Notes due 2018. The sale of the convertible notes resulted in net proceeds of approximately $22.8 million. On December 19, 2013, the holders exercised their rights to exchange the convertible notes for our common stock. See Note 7, Credit Line and Notes, for additional information regarding these convertible notes.
Future Cash Requirements
As of June 27, 2015, we held $115.1 million in cash, cash equivalents and restricted cash, comprised of $111.8 million in cash and cash equivalents and $3.3 million in restricted cash; and we had working capital of $186.7 million.
Based on our current cash and cash equivalent balances, together with our existing credit facility, we believe that we have sufficient funds to support our operations through the next 12 months, including approximately $30 to $40 million of capital expenditures that we expect to incur.
48
In the event we need additional liquidity beyond our current expectations, such as to fund future growth or strengthen our balance sheet, we may find it necessary to lower our operating income break-even level and undertake additional cost cutting measures. We will continue to explore other sources of additional liquidity. These additional sources of liquidity could include one, or a combination, of the following: (i) issuing equity securities, (ii) incurring indebtedness secured by our assets, (iii) issuing debt and/or convertible debt securities, or (iv) selling product lines, other assets and/or portions of our business. There can be no guarantee that we will be able to raise additional funds on terms acceptable to us, or at all.
We have incurred significant operating losses from continuing operations and generated negative cash flows from operations for fiscal years 2015, 2014 and 2013. Recoverability of a major portion of the recorded asset amounts shown in the accompanying balance sheet is dependent upon us having sufficient resources to operate our business. In addition to the availability of our cash resources as of June 27, 2015, the continued operation of our business is dependent upon our achieving cash flows expected to be generated from the execution of our current operating plan, together with amounts expected to be available under our Credit Agreement. The financial statements do not include any adjustments relating to the recoverability and classification of recorded asset amounts or amounts and classification of liabilities that might be necessary should we be unable to continue in existence.
In addition, we have been operating in China for an extended period of time and have accumulated significant intercompany balances with our related entities. Our ability to repay or collect these balances may be restricted by Chinese laws and, as a result, we may be unable to successfully pay down or collect on these balances. As a consequence, we may be assessed additional taxes in China if we are unable to claim bad debt deductions or incur debt forgiveness income from the cancellation of these intercompany balances. Additionally, if we are found not to have complied with the various local laws surrounding cross border payments, we may incur penalties and fines for non-compliance. Any such taxes, penalties and/or fines could be significant in amount and, as a result, could have a material adverse effect on our financial condition, including our cash and cash equivalent balances.
For additional information on the risks we face related to future cash requirements, see Item 1A. Risk Factors under “— Risks Related to Our Business — We have a history of large operating losses and we may not be able to achieve profitability in the future and maintain sufficient levels of liquidity,” included elsewhere in this Annual Report on Form 10-K.
As of June 27, 2015, $35.2 million of the $115.1 million of our cash, cash equivalents and restricted cash was held by our foreign subsidiaries. If these funds are needed for our operations in the United States, we could be required to accrue and pay foreign withholding taxes to repatriate these funds. However, our intent is to permanently reinvest these funds outside of the U.S., except for specific entities in Shanghai, China, Korea, Israel, Germany and Japan where we decided to exit certain businesses in fiscal year 2015.
Risk Management — Foreign Currency Risk
As our business is multinational in scope, we are subject to fluctuations based upon changes in the exchange rates between the currencies in which we collect revenues and pay expenses. We expect that a majority of our revenues will continue to be denominated in U.S. dollars, while a significant portion of our expenses will continue to be denominated in U.K. pounds sterling and the Japanese yen. Fluctuations in the exchange rate between the U.S. dollar, the U.K. pound sterling, the Japanese yen and, to a lesser extent, other currencies in which we collect revenues and pay expenses could affect our operating results. This includes the Chinese yuan and the Euro in which we pay expenses in connection with operating our facilities in Shenzhen and Shanghai, China; and San Donato, Italy. To the extent the exchange rate between the U.S. dollar and these currencies were to fluctuate more significantly than experienced to date, our exposure would increase.
From time to time, we have entered into foreign currency forward exchange contracts in an effort to mitigate a portion of our exposure to such fluctuations between the U.S. dollar and the U.K. pound sterling, and we may be required to convert currencies to meet our obligations. Under certain circumstances, foreign currency forward exchange contracts can have an adverse effect on our financial condition. As of June 27, 2015 and June 28, 2014, we did not have any outstanding foreign currency forward exchange contracts.
49
Contractual Obligations
Our contractual obligations at June 27, 2015, by nature of the obligation and amount due over identified periods of time, are set out in the table below:
Capital Lease Obligations(1) | Operating Lease Obligations | Sublease Income | Purchase Obligations | Long-Term Obligations(1) | Total | ||||||||||||||||||
(Thousands) | |||||||||||||||||||||||
Fiscal Year: | |||||||||||||||||||||||
2016 | $ | 3,487 | $ | 8,006 | $ | (370 | ) | $ | 66,686 | $ | 3,857 | $ | 77,813 | ||||||||||
2017 | 1,294 | 7,776 | (210 | ) | — | 3,900 | 12,760 | ||||||||||||||||
2018 | 68 | 7,637 | (100 | ) | — | 3,900 | 11,505 | ||||||||||||||||
2019 | 25 | 7,424 | (90 | ) | — | 3,900 | 11,259 | ||||||||||||||||
2020 | 24 | 6,123 | (90 | ) | — | 68,900 | 74,957 | ||||||||||||||||
Thereafter | 85 | 52,641 | — | — | — | 52,726 | |||||||||||||||||
$ | 4,983 | $ | 89,607 | $ | (860 | ) | $ | 66,686 | $ | 80,604 | $ | 241,020 | |||||||||||
(1) | Amounts include interest. |
The purchase obligations consist of our total outstanding purchase order commitments at June 27, 2015. Any capital purchases to which we are committed are included in these outstanding purchase order commitments, with the exception of capital purchases made under capital leases, which are shown separately. Operating leases are future annual commitments under non-cancelable operating leases, including rents payable for land and buildings.
Off-Balance Sheet Arrangements
We indemnify our directors and certain employees as permitted by law, and have entered into indemnification agreements with our directors and executive officers. We have not recorded a liability associated with these indemnification arrangements as we historically have not incurred any material costs associated with such indemnification obligations. Costs associated with such indemnification obligations may be mitigated by insurance coverage that we maintain, however, such insurance may not cover any, or may cover only a portion of, the amounts we may be required to pay. In addition, we may not be able to maintain such insurance coverage in the future.
We also have indemnification clauses in various contracts that we enter into in connection with acquisitions, divestitures and during the normal course of business, such as indemnifications in favor of customers in respect of liabilities they may incur as a result of purchasing our products should such products infringe the intellectual property rights of a third party. We have not historically paid out any material amounts related to these indemnifications; therefore, no accrual has been made for these indemnifications.
Other than as set forth above, we are not currently party to any material off-balance sheet arrangements.
Recent Accounting Pronouncements
See Note 1, Basis of Preparation and Summary of Significant Accounting Policies, to our consolidated financial statements included elsewhere in this Annual Report on Form 10-K for information regarding the effect of new accounting pronouncements on our consolidated financial statements.
50
Application of Critical Accounting Policies and Estimates
The discussion and analysis of our financial condition and results of operations is based on our consolidated financial statements included elsewhere in this Annual Report on Form 10-K, which have been prepared in accordance with accounting principles generally accepted in the United States, or U.S. GAAP. The preparation of our financial statements requires us to make estimates and judgments that affect our reported assets and liabilities, revenues and expenses and other financial information. Actual results may differ significantly from those based on our estimates and judgments or could have been materially different if we had used different assumptions, estimates or conditions. In addition, our financial condition and results of operations could vary due to a change in the application of a particular accounting standard.
We regard an accounting estimate or assumption underlying our financial statements as a “critical accounting estimate” where:
• | the nature of the estimate or assumption is material due to the level of subjectivity and judgment necessary to account for highly uncertain matters or the susceptibility of such matters to change; and |
• | the impact of such estimates and assumptions on our financial condition or operating performance is material. |
Our significant accounting policies are described in Note 1, Basis of Preparation and Summary of Significant Accounting Policies, to our consolidated financial statements included elsewhere in this Annual Report on Form 10-K. Not all of these significant accounting policies, however, require that we make estimates and assumptions that we believe are “critical accounting estimates.” We have discussed our accounting policies with the audit committee of our board of directors, and we believe that the policies described below involve critical accounting estimates.
Revenue Recognition and Sales Returns
Revenue represents the amounts, excluding sales taxes, derived from the sale of goods and services to third-party customers during a given period. Specifically, we recognize product revenue when persuasive evidence of an arrangement exists, the product has been shipped, title has transferred, collectability is reasonably assured, fees are fixed or determinable and there are no uncertainties with respect to customer acceptance. For certain sales, we are required to determine, in particular, whether the delivery has occurred, whether items will be returned and whether we will be paid under normal commercial terms. For certain products sold to customers, we specify delivery terms in the agreement under which the sale was made and assess each shipment against those terms, and only recognize revenue when we are certain that the delivery terms have been met. We record a provision for estimated sales returns in the same period as the related revenues are recorded, which is netted against revenue. These estimates for sales returns are based on historical sales return rates, other known factors and our return policy. Before accepting a new customer, we review publicly available information and credit rating databases to provide ourselves with reasonable assurance that the new customer will pay all outstanding amounts in accordance with our standard terms. For existing customers, we monitor historic payment patterns and we perform ongoing credit evaluations to assess whether we can expect payment in accordance with the terms set forth in the agreement under which the sale was made.
Inventory Valuation
In general, our inventories are valued at the lower of cost to acquire or manufacture our products or market value, less write-offs of inventory we believe could prove to be unsalable. Manufacturing costs include the cost of the components purchased to produce our products and related labor and overhead. We review our inventory on a quarterly basis to determine if it is saleable. Products may be unsalable because they are technically obsolete due to substitute products, specification changes or excess inventory relative to customer forecasts. We currently reduce the cost basis for inventory using methods that take these factors into account. If we find that the cost of inventory is greater than the current market price, we will write the inventory down to the estimated selling price, less the estimated cost to complete and sell the product.
Business Combinations
Our acquisitions are accounted for pursuant to Accounting Standards Codification ("ASC") Topic 805, Business Combinations. Under ASC Topic 805, there are significant management estimates that impact our financial position and operating results, including:
• | Tangible and identifiable intangible assets acquired and liabilities assumed as of the acquisition date are recorded at the acquisition date fair value. Such valuations require management to make significant estimates and assumptions, especially with respect to the identifiable intangible assets. |
• | Goodwill is recognized for any excess of purchase price over the net fair value of assets acquired and liabilities assumed. A bargain purchase gain results if the fair value of the purchase price is less than the net fair value of the assets acquired and liabilities assumed. We recorded a $24.9 million bargain purchase gain related to our acquisition of Opnext during fiscal year 2013. |
51
For tangible assets acquired in any acquisition, such as plant and equipment, we estimate useful lives by considering comparable lives of similar assets, past history, the intended use of the assets and their condition. In estimating the useful life of acquired intangible assets with definite lives, we consider the industry environment and specific factors relating to each product relative to our business strategy and the likelihood of technological obsolescence. Acquired intangible assets primarily include core and current technology, patents, supply agreements, capitalized licenses and customer contracts. We amortize our acquired intangible assets with definite lives over periods generally ranging from 1 to 11 years, and in the case of one specific customer contract, 15 years.
Management makes estimates of fair value based upon assumptions believed to be reasonable and that of a market participant. For instance, in our Mintera acquisition, we agreed to pay additional revenue-based consideration whereby former security holders of Mintera were entitled to receive up to $20.0 million, determined based on a set of sliding scale formulas, to the extent revenue from Mintera products is more than $29.0 million in the 12 months following the acquisition and/or more than $40.0 million in the 18 months following the acquisition. The estimated fair value of these obligations were determined using management estimates of the total amounts expected to be paid based on estimated operating results, discounted to their present value using our incremental borrowing cost.
Our preliminary estimates of fair value are inherently uncertain and subject to refinement. As a result, during the measurement period for a business combination, which may be up to one year, we may record adjustments to the values of assets acquired and liabilities assumed. After the conclusion of the measurement period or our final determination of the values of assets acquired or liabilities assumed, whichever comes first, subsequent adjustments affecting earnings are recorded within our consolidated statements of operations. For example, in the fourth quarter of fiscal year 2013, we made significant adjustments to the preliminary purchase price allocation of the assets acquired and liabilities assumed in our acquisition of Opnext upon the completion of our valuation. See Note 3, Business Combinations and Dispositions, included elsewhere in this Annual Report on Form 10-K, for additional information.
Insurance Recoveries
Insurance recoveries related to impairment losses previously recorded and other recoverable expenses will be recognized up to the amount of the related loss or expense in the period that recoveries become realizable. Insurance recoveries under business interruption coverage and insurance recovery gains in excess of amounts previously written off related to impaired inventory and equipment or in excess of other recoverable expenses previously recognized will be recognized when they become realizable and all contingencies have been resolved.
During the year ended June 28, 2014 and June 29, 2013, we received $3.7 million and $30.8 million in settlement payments, respectively, relating to losses we incurred due to the flooding in Thailand. As there were no contingencies associated with these payments, we recorded the payments within flood related income (expense), net in our consolidated statements of operations.
The evaluation of insurance recoveries requires estimates and judgments about future results which affect reported amounts and certain disclosures. Actual results could differ from those estimates. Insurance recoveries we receive in future periods will be recorded net of the related expense in the consolidated statement of operations.
Impairment of Goodwill and Other Intangible Assets
Goodwill is tested annually for impairment, in our case during the fourth quarter of each fiscal year, or more often if an event or circumstance suggests impairment has occurred. In addition, we review identifiable intangibles, excluding goodwill, for impairment whenever events or changes in circumstances indicate the carrying amount of an asset may not be recoverable. During the fourth quarter of fiscal year 2013 we completed our annual first step analysis for potential impairment of our goodwill, which included examining the impact of current general economic conditions on our future prospects, the decline in our market capitalization, and the anticipated resizing of our operations with the recent sale of certain of our products and/or businesses.
Circumstances which could trigger an impairment test include, but are not limited to, significant decreases in the market price of the asset, significant adverse changes to the business climate or legal factors, current period cash flow or operating losses or a forecast of continuing losses associated with the use of the asset and a current expectation that the asset will more likely than not be sold or disposed of significantly below carrying value before the end of its estimated useful life.
The first step of testing goodwill for impairment is based on a reporting unit’s “fair value,” which is generally determined through market prices. In certain cases, due to the absence of market prices for a particular element of our business, we have elected to base our testing on discounted future expected cash flows. Although the discount rates and other input variables may differ, the model we use in this process is the same model we use to evaluate the fair value of acquisition candidates and the fairness of offers to purchase businesses that we are considering for divestiture. The forecasted cash flows we use are derived
52
from the annual long-range planning process that we perform and present to our board of directors. In this process, each reporting unit is required to develop reasonable sales, earnings and cash flow forecasts for the next three to seven years based on current and forecasted economic conditions. For purposes of testing for impairment, the cash flow forecasts are adjusted as needed to reflect information that becomes available concerning changes in business levels and general economic trends. The discount rates used for determining discounted future cash flows are generally based on our weighted-average cost of capital and are then adjusted for “plan risk” (the risk that a business will fail to achieve its forecasted results) and “country risk” (the risk that economic or political instability in the countries in which we operate will cause a business unit’s projections to be inaccurate). Finally, a growth factor beyond the three to seven-year period for which cash flows are planned is selected based on expectations of future economic conditions. Virtually all of the assumptions used in our models are susceptible to change due to global and regional economic conditions as well as competitive factors in the industry in which we operate. Unanticipated changes in discount rates from one year to the next can also have a significant effect on the results of the calculations. While we believe the estimates and assumptions we use are reasonable, various economic factors could cause the results of our goodwill testing to vary significantly.
During the fourth quarter of fiscal year 2013, we completed our annual first step analysis for potential impairment of our goodwill, which included, based on factors and conditions then existing, examining the impact of current general economic conditions on our future prospects, the decline in our market capitalization, and the anticipated resizing of our operations with the recent sale of certain of our products and/or businesses, and we concluded that the goodwill related to our Mintera reporting unit was impaired. We completed our full evaluation of the second step impairment analysis, which indicated that the goodwill was fully impaired and we recorded $10.9 million for impairment losses in our consolidated statement of operations for the year ended June 29, 2013. In connection with our second step goodwill impairment analysis, we also evaluated the fair value of our other intangible assets of this reporting unit, and our other reporting units, and concluded that based on the decline in our forecast, our decision to sell or abandon certain product lines and other factors, certain of these other intangible assets were also impaired as of June 29, 2013. We recorded impairment losses in the fourth quarter of fiscal year 2013 of $6.4 million related to intangibles acquired in connection with our acquisition of Mintera, $2.6 million related to intangibles acquired in connection with our acquisition of Opnext, and $5.2 million related to intangibles acquired in connection with other earlier acquisitions.
During the fourth quarter of fiscal years 2014 and 2015, we reviewed our other intangible assets for impairment. We compared their carrying amounts to market prices or the future undiscounted cash flows the assets are expected to generate. We determined that the carrying value of the assets did not exceed the fair value based on market prices or future discounted cash flows. We did not record any impairment charges in fiscal years 2014 or 2015.
Accounting for Stock-Based Compensation
We recognize in our statement of operations all stock-based compensation, including grants of employee stock options, grants of restricted stock and purchase rights under our Employee Stock Purchase Plan, based on their fair values on the grant dates. Estimating the grant date fair value of employee stock options and purchase rights requires us to make judgments in the determination of inputs into the Black-Scholes valuation model which we use to arrive at an estimate of the fair value for such awards. These inputs are based upon highly subjective assumptions as to the volatility of the underlying stock, risk free interest rates and the expected life of the options. Judgment is also required in estimating the number of share-based awards that are expected to be forfeited during any given period. As required under the accounting standards, we review our valuation assumptions at each grant date, and, as a result, our valuation assumptions used to value employee stock options granted and purchase rights in future periods may change. If actual results or future changes in estimates differ significantly from our current estimates, stock-based compensation expense and our consolidated results of operations could be materially impacted. During the years ended June 27, 2015, June 28, 2014 and June 29, 2013, we recognized $6.2 million, $6.0 million and $6.4 million of stock-based compensation expense, respectively. See Note 12, Stock-based Compensation, to the accompanying consolidated financial statements included elsewhere in this Annual Report on Form 10-K for further information.
Income Taxes
We account for income taxes using an asset and liability based approach. Deferred income tax assets and liabilities are recorded based on the differences between the financial statement and tax bases of assets and liabilities using enacted applicable tax rates. Valuation allowances are provided against deferred income tax assets which are not likely to be realized.
Recognition of deferred tax assets is appropriate when realization of these assets is more likely than not. Based upon the weight of available evidence, which includes our historical operating performance, recorded cumulative net losses in prior fiscal periods and uncertainty about the timing of future profits, we have provided a full valuation allowance against most of our U.S. and foreign deferred tax assets. Our valuation allowance decreased by $16.6 million and decreased by $97.2 million, in fiscal years 2015 and 2014, respectively.
53
Item 7A. Quantitative and Qualitative Disclosures About Market Risk
Our principal market risks are our exposure to changes in interest rates and certain exchange rates. We do not use risk sensitive instruments for trading purposes.
Interest rates
We finance our operations through a mixture of issuances of equity and debt securities, capital leases, working capital and by drawing on our Credit Agreement. We have exposure to interest rate fluctuations on our cash deposits and for amounts borrowed under our Credit Agreement, convertible notes and through our capital leases. At June 27, 2015, there were no amounts outstanding under our Credit Agreement, $65.0 million of convertible notes with an interest rate of 6.0 percent and $4.7 million outstanding under capital leases.
We monitor our interest rate risk on cash balances primarily through cash flow forecasting. We believe our current interest rate risk is immaterial.
Foreign currency
As our business is multinational in scope, we are subject to fluctuations based upon changes in the exchange rates between the currencies in which we collect revenues and pay expenses. In the future, we expect that a majority of our revenues will continue to be denominated in U.S. dollars, while a significant portion of our expenses will continue to be denominated in U.K. pounds sterling and Japanese yen. Fluctuations in the exchange rate between the U.S. dollar, the U.K. pound sterling, and the Japanese yen and, to a lesser extent, other currencies in which we collect revenues and pay expenses, could affect our operating results. This includes the Chinese yuan and the Euro in which we pay expenses in connection with operating our facilities in Shenzhen and Shanghai, China; and San Donato, Italy. To the extent the exchange rate between the U.S. dollar and these currencies were to fluctuate more significantly than experienced to date, our exposure would increase.
As of June 27, 2015, our U.K. subsidiary had $47.7 million, net, in U.S. dollar denominated operating intercompany payables, $20.8 million in U.S. dollar denominated accounts receivable and payable, net, related to sales to external customers and purchases from suppliers, and $16.0 million in U.S. dollar denominated cash accounts. It is estimated that a 10 percent fluctuation in the U.S. dollar relative to the U.K. pound sterling would lead to a profit of $1.1 million (U.S. dollar strengthening), or loss of $1.1 million (U.S. dollar weakening) on the translation of these receivables and other cash balances, which would be recorded as gain (loss) on foreign exchange in our consolidated statement of operations.
As of June 27, 2015, our Japan subsidiary had $41.8 million, net, in U.S. dollar denominated operating intercompany payables, $9.0 million in U.S. dollar denominated accounts payable, net of accounts receivable, related to sales to external customers and purchases from suppliers, and $12.2 million in U.S. dollar denominated cash and restricted cash accounts. It is estimated that a 10 percent fluctuation in the U.S. dollar relative to the Japanese yen would lead to a profit of $3.9 million (U.S. dollar weakening), or loss of $3.9 million (U.S. dollar strengthening) on the translation of these balances, which would be recorded as gain (loss) on foreign exchange in our consolidated statement of operations.
Bank Liquidity Risk
As of June 27, 2015, we have approximately $109.0 million of unrestricted cash in operating accounts that are held with domestic and international financial institutions. These cash balances could be lost or become inaccessible if the underlying financial institutions fail or if they are unable to meet the liquidity requirements of their depositors and they are not supported by the national government of the country in which such financial institution is located. Notwithstanding, to date, we have not incurred such losses and have had full access to our operating accounts. See Note 3, Balance Sheet Details. We believe any failures of domestic and international financial institutions could impact our ability to fund our operations in the short term.
Hedging Program
From time to time, we enter into foreign currency forward contracts in an effort to mitigate a portion of our exposure to fluctuations between the U.S. dollar and the Japanese Yen and between the U.S. dollar and U.K. pound sterling. We do not currently hedge our exposure to the Chinese yuan or the Euro, but we may in the future if conditions warrant. We also do not currently hedge our exposure related to our U.S. dollar denominated intercompany payables and receivables. We may be required to convert currencies to meet our obligations. Under certain circumstances, foreign currency forward contracts can have an adverse effect on our financial condition.
During the year ended June 27, 2015, we entered into foreign currency forward exchange contracts, which expired in the same fiscal quarter in which they were opened. In connection with these hedges, during the year ended June 27, 2015, we recorded a $0.7 million loss on foreign currency transactions, net within our consolidated statement of operations. As of June 27, 2015, we did not have any outstanding foreign currency forward contracts.
54
Item 8. Financial Statements and Supplementary Data
The financial statements required by this item may be found beginning on pages F-1 of this Annual Report on Form 10-K.
Item 9. Changes in and Disagreements With Accountants on Accounting and Financial Disclosure
None.
Item 9A. Controls and Procedures
(a)Evaluation of Disclosure Controls and Procedures
Our management, with the participation of our Chief Executive Officer and Chief Financial Officer, evaluated the effectiveness of our disclosure controls and procedures as of June 27, 2015.
The term “disclosure controls and procedures,” as defined in Rules 13a-15(e) and 15d-15(e) under the Securities Exchange Act of 1934, or the Exchange Act, means controls and other procedures of a company that are designed to ensure that information required to be disclosed by the company in the reports that it files or submits under the Exchange Act is recorded, processed, summarized and reported, within the time periods specified in the SEC’s rules and forms. Disclosure controls and procedures include, without limitation, controls and procedures designed to ensure that information required to be disclosed by a company in the reports that it files or submits under the Exchange Act is accumulated and communicated to the company’s management, including its Chief Executive Officer and Chief Financial Officer, as the principal executive and financial officers, as appropriate to allow timely decisions regarding required disclosure.
Based upon that evaluation, our Chief Executive Officer and Chief Financial Officer concluded that, as of the end of the period covered in this report, our disclosure controls and procedures were effective.
As of June 27, 2015, management believes that (i) this Form 10-K does not contain any untrue statement of a material fact or omit to state a material fact necessary to make the statements made, in light of the circumstances under which they were made, not misleading with respect to the periods covered by this Report and (ii) the consolidated financial statements, and other financial information, included in this Report fairly present in all material respects in accordance with U.S. GAAP our financial condition, results of operations and cash flows as of, and for, the dates and periods presented.
(b) Management’s Report on Internal Control over Financial Reporting
Our management is responsible for establishing and maintaining adequate internal control over our financial reporting, as such term is defined in Exchange Act Rule 13a-15(f). Because of its inherent limitations, internal control over financial reporting may not prevent or detect misstatements, fraud or the results of fraud. Projections of any evaluation of effectiveness to future periods are subject to the risk that controls may become inadequate because of changes in conditions, or that the degree of compliance with the policies or procedures may deteriorate.
Our management assessed the effectiveness of our internal control over financial reporting as of June 27, 2015. In making its assessment of internal control over financial reporting, our management used the criteria set forth by the Committee of Sponsoring Organizations of the Treadway Commission (COSO) in Internal Control - Integrated Framework (2013). Based on our assessment, management concluded that, as of June 27, 2015, our internal control over financial reporting is effective based on these criteria.
Our independent registered public accounting firm has issued an attestation report on the effectiveness of our internal control over financial reporting. This report appears under Item 8 of this Annual Report on Form 10-K.
(c) Remediation of Prior Year Material Weakness
As disclosed in our Annual Report on Form 10-K for the year ended June 28, 2014, we identified a material weakness in our internal control over financial reporting such that our processes, procedures, and controls related to the review and analysis of inventory and property and equipment were not effective to ensure that certain amounts related to these financial statement accounts were accurately reported in a timely manner. Over the past year, we have implemented several measures, including new comprehensive global inventory policies and procedures to ensure inventory is valued timely and accurately. We have also
55
assigned new personnel to inventory accounting roles that have the experience and expertise to ensure control deficiencies do not reoccur. In addition, we have developed a global fixed asset policy which established requirements and guidelines for the performance of physical counts and valuation of fixed assets. Pursuant to this new policy, we have performed a full fixed asset count in fiscal year 2015. We have also taken steps to ensure that personnel assigned to fixed asset accounting roles have the experience and expertise to ensure control deficiencies do not reoccur. Our remediation efforts, including the testing of these controls, continued throughout fiscal year 2015. These controls have been operational for a sufficient period of time to allow management to conclude that these controls are operating effectively and the material weakness is considered remediated.
(d) Changes in Internal Control over Financial Reporting
Except as noted above, there were no changes in our internal control over financial reporting during the most recent fiscal quarter ended June 27, 2015 that has materially affected, or is reasonably likely to materially affect, our internal control over financial reporting.
Item 9B. Other Information
None.
56
PART III
Item 10. Directors, Executive Officers and Corporate Governance
Information required by this Item is incorporated by reference to the information contained in our definitive Proxy Statement for our 2015 Annual Meeting of Stockholders under the headings “Proposal 1 — Election of Class I Directors,” “Corporate Governance,” “Section 16(a) Beneficial Ownership Reporting Compliance,” and “Code of Business Conduct and Ethics.”
Item 11. Executive Compensation
Information required by this Item is incorporated by reference to the information contained in our definitive Proxy Statement for our 2015 Annual Meeting of Stockholders under the headings “Executive Compensation,” “Director Compensation,” “Compensation Committee Interlocks and Insider Participation,” “Compensation Committee Report,” and “Employment, Change of Control and Severance Arrangements.”
Item 12. Security Ownership of Certain Beneficial Owners and Management and Related Stockholder Matters
Information required by this Item is incorporated by reference to the information contained in our definitive Proxy Statement for our 2015 Annual Meeting of Stockholders under the headings “Security Ownership of Certain Beneficial Owners and Management,” “Section 16(a) Beneficial Ownership Reporting Compliance,” and “Equity Compensation Plan Information.”
Item 13. Certain Relationships and Related Transactions, and Director Independence
Information required by this Item is incorporated by reference to the information contained in our definitive Proxy Statement for our 2015 Annual Meeting of Stockholders under the headings "Related Party Transactions," “Policies and Procedures for Related Person Transactions,” “Director Independence,” “Employment, Change of Control and Severance Arrangements,” “Proposal 1 — Election of Class I Directors,” and “Corporate Governance.”
Item 14. Principal Accounting Fees and Services
Information required by this Item is incorporated by reference to the information contained in our definitive Proxy Statement for our 2015 Annual Meeting of Stockholders under the headings “Principal Accounting Fees and Services” and “Pre-Approval Policies and Procedures.”
57
PART IV
Item 15. Exhibits, Financial Statement Schedules
(a) | The following documents are filed as part of or are included in this Annual Report on Form 10-K: |
1. Financial Statements
See Index to Consolidated Financial Statements on page F-1 of this Annual Report on Form 10-K.
2. Financial Statement Schedule
The Financial Statement Schedule II: Valuation and Qualifying Accounts that follows the Notes to Consolidated Financial Statements is filed as part of this Annual Report Form 10-K. Other financial statement schedules have been omitted since they are either not required or the information is otherwise included.
3. List of Exhibits
The Exhibits filed as part of this Annual Report on Form 10-K, or incorporated by reference, are listed on the Exhibit Index immediately preceding such Exhibits, which Exhibit Index is incorporated herein by reference.
58
SIGNATURES
Pursuant to the requirements of Section 13 or 15(d) of the Securities Exchange Act of 1934, the Registrant has duly caused this report to be signed on its behalf by the undersigned, thereunto duly authorized.
OCLARO, INC. (Registrant) | |||
August 28, 2015 | By: | /s/ Greg Dougherty | |
Greg Dougherty | |||
Chief Executive Officer | |||
KNOW ALL PERSONS BY THESE PRESENTS, that each person whose signature appears below constitutes and appoints Greg Dougherty, Pete Mangan and Mike Fernicola, jointly and severally, as their attorneys-in-fact, with full power of each to act alone and full powers of substitution, for them in any and all capacities, to sign any amendments to this Annual Report on Form 10-K, and to file the same, with exhibits thereto and other documents in connection therewith, with the Securities and Exchange Commission, hereby ratifying and confirming all that said attorneys-in-fact and agents, or his or their substitutes, may do or cause to be done by virtue hereof.
Pursuant to the requirements of the Securities Exchange Act of 1934, this report has been signed below by the following persons on behalf of the Registrant and in the capacities and on the dates indicated.
Signature | Title | Date | ||
/s/ Greg Dougherty | Director and Chief Executive Officer | August 28, 2015 | ||
Greg Dougherty | (Principal Executive Officer) | |||
/s/ Pete Mangan | Chief Financial Officer | August 28, 2015 | ||
Pete Mangan | (Principal Financial Officer) | |||
/s/ Mike Fernicola | Chief Accounting Officer | August 28, 2015 | ||
Mike Fernicola | (Principal Accounting Officer) | |||
/s/ Marissa Peterson | Chair of the Board | August 28, 2015 | ||
Marissa Peterson | ||||
/s/ Edward B. Collins | Director | August 28, 2015 | ||
Edward B. Collins | ||||
/s/ Kendall W. Cowan | Director | August 28, 2015 | ||
Kendall W. Cowan | ||||
/s/ Lori Holland | Director | August 28, 2015 | ||
Lori Holland | ||||
/s/ Joel Smith III | Director | August 28, 2015 | ||
Joel Smith III | ||||
/s/ William L. Smith | Director | August 28, 2015 | ||
William L. Smith | ||||
59
INDEX TO CONSOLIDATED FINANCIAL STATEMENTS
Page | |
F- 1
REPORT OF INDEPENDENT REGISTERED PUBLIC ACCOUNTING FIRM
Board of Directors and Stockholders
Oclaro, Inc.
We have audited the accompanying consolidated balance sheets of Oclaro Inc. (a Delaware corporation) and subsidiaries (the “Company”) as of June 27, 2015 and June 28, 2014, and the related consolidated statements of operations, comprehensive income (loss), stockholders’ equity, and cash flows for each of the three years in the period ended June 27, 2015. Our audits of the basic consolidated financial statements included the financial statement schedule listed in the index appearing under Item 15(a)(2). These financial statements and financial statement schedule are the responsibility of the Company’s management. Our responsibility is to express an opinion on these financial statements and financial statement schedule based on our audits.
We conducted our audits in accordance with the standards of the Public Company Accounting Oversight Board (United States). Those standards require that we plan and perform the audit to obtain reasonable assurance about whether the financial statements are free of material misstatement. An audit includes examining, on a test basis, evidence supporting the amounts and disclosures in the financial statements. An audit also includes assessing the accounting principles used and significant estimates made by management, as well as evaluating the overall financial statement presentation. We believe that our audits provide a reasonable basis for our opinion.
In our opinion, the consolidated financial statements referred to above present fairly, in all material respects, the financial position of Oclaro Inc. and subsidiaries as of June 27, 2015 and June 28, 2014, and the results of their operations and their cash flows for each of the three years in the period ended June 27, 2015 in conformity with accounting principles generally accepted in the United States of America. Also in our opinion, the related financial statement schedule, when considered in relation to the basic consolidated financial statements taken as a whole, presents fairly, in all material respects, the information set forth therein.
We also have audited, in accordance with the standards of the Public Company Accounting Oversight Board (United States), the Company’s internal control over financial reporting as of June 27, 2015, based on criteria established in the 2013 Internal Control-Integrated Framework issued by the Committee of Sponsoring Organizations of the Treadway Commission (COSO), and our report dated August 28, 2015 expressed an unqualified opinion thereon.
/s/ GRANT THORNTON LLP
San Francisco, California
August 28, 2015
F- 2
REPORT OF INDEPENDENT REGISTERED PUBLIC ACCOUNTING FIRM
Board of Directors and Stockholders
Oclaro, Inc.
We have audited the internal control over financial reporting of Oclaro, Inc. (a Delaware corporation) and subsidiaries (the “Company”) as of June 27, 2015, based on criteria established in the 2013 Internal Control-Integrated Framework issued by the Committee of Sponsoring Organizations of the Treadway Commission (COSO). The Company’s management is responsible for maintaining effective internal control over financial reporting and for its assessment of the effectiveness of internal control over financial reporting, included in the accompanying Management’s Report on Internal Control over Financial Reporting (“Management’s Report”). Our responsibility is to express an opinion on the Company’s internal control over financial reporting based on our audit.
We conducted our audit in accordance with the standards of the Public Company Accounting Oversight Board (United States). Those standards require that we plan and perform the audit to obtain reasonable assurance about whether effective internal control over financial reporting was maintained in all material respects. Our audit included obtaining an understanding of internal control over financial reporting, assessing the risk that a material weakness exists, testing and evaluating the design and operating effectiveness of internal control based on the assessed risk, and performing such other procedures as we considered necessary in the circumstances. We believe that our audit provides a reasonable basis for our opinion.
A company’s internal control over financial reporting is a process designed to provide reasonable assurance regarding the reliability of financial reporting and the preparation of financial statements for external purposes in accordance with generally accepted accounting principles. A company’s internal control over financial reporting includes those policies and procedures that (1) pertain to the maintenance of records that, in reasonable detail, accurately and fairly reflect the transactions and dispositions of the assets of the company; (2) provide reasonable assurance that transactions are recorded as necessary to permit preparation of financial statements in accordance with generally accepted accounting principles, and that receipts and expenditures of the company are being made only in accordance with authorizations of management and directors of the company; and (3) provide reasonable assurance regarding prevention or timely detection of unauthorized acquisition, use, or disposition of the company’s assets that could have a material effect on the financial statements.
Because of its inherent limitations, internal control over financial reporting may not prevent or detect misstatements. Also, projections of any evaluation of effectiveness to future periods are subject to the risk that controls may become inadequate because of changes in conditions, or that the degree of compliance with the policies or procedures may deteriorate.
In our opinion, the Company maintained, in all material respects, effective internal control over financial reporting as of June 27, 2015 based on criteria established in the 2013 Internal Control-Integrated Framework issued by COSO.
We also have audited, in accordance with the standards of the Public Company Accounting Oversight Board (United States), the consolidated financial statements of the Company as of and for the year ended June 27, 2015, and our report dated August 28, 2015 expressed an unqualified opinion on those financial statements.
/s/ GRANT THORNTON LLP
San Francisco, California
August 28, 2015
F- 3
OCLARO, INC.
CONSOLIDATED BALANCE SHEETS
June 27, 2015 | June 28, 2014 | ||||||
(Thousands, except par value) | |||||||
ASSETS | |||||||
Current assets: | |||||||
Cash and cash equivalents | $ | 111,840 | $ | 98,973 | |||
Restricted cash | 3,275 | 5,055 | |||||
Short-term investments | — | 95 | |||||
Accounts receivable, net of allowances for doubtful accounts and sales returns of $2,815 and zero, respectively, as of June 27, 2015, and $2,750 and $579, respectively, as of June 28, 2014; and including $709 and $2,706 due from related parties as of June 27, 2015 and June 28, 2014, respectively | 74,815 | 82,872 | |||||
Inventories | 66,342 | 71,099 | |||||
Prepaid expenses and other current assets | 22,746 | 45,275 | |||||
Total current assets | 279,018 | 303,369 | |||||
Property and equipment, net | 41,766 | 50,768 | |||||
Other intangible assets, net | 2,579 | 8,536 | |||||
Other non-current assets | 2,521 | 3,012 | |||||
Total assets | $ | 325,884 | $ | 365,685 | |||
LIABILITIES AND STOCKHOLDERS’ EQUITY | |||||||
Current liabilities: | |||||||
Accounts payable, including $4,831 and $4,483 due to related parties as of June 27, 2015 and June 28, 2014, respectively | $ | 53,133 | $ | 71,283 | |||
Accrued expenses and other liabilities | 35,648 | 51,492 | |||||
Capital lease obligations, current | 3,580 | 5,387 | |||||
Total current liabilities | 92,361 | 128,162 | |||||
Deferred gain on sale-leasebacks | 8,978 | 10,711 | |||||
Convertible notes payable | 61,246 | — | |||||
Capital lease obligations, non-current | 1,167 | 4,539 | |||||
Other non-current liabilities | 9,132 | 14,345 | |||||
Total liabilities | 172,884 | 157,757 | |||||
Commitments and contingencies (Note 9) | |||||||
Stockholders’ equity: | |||||||
Preferred stock: 1,000 shares authorized; none issued and outstanding | — | — | |||||
Common stock: $0.01 par value per share; 175,000 shares authorized; 109,889 shares issued and outstanding as of June 27, 2015 and 107,779 shares issued and outstanding as of June 28, 2014 | 1,099 | 1,077 | |||||
Additional paid-in capital | 1,464,567 | 1,458,487 | |||||
Accumulated other comprehensive income | 41,526 | 45,864 | |||||
Accumulated deficit | (1,354,192 | ) | (1,297,500 | ) | |||
Total stockholders’ equity | 153,000 | 207,928 | |||||
Total liabilities and stockholders’ equity | $ | 325,884 | $ | 365,685 | |||
The accompanying notes form an integral part of these consolidated financial statements.
F- 4
OCLARO, INC.
CONSOLIDATED STATEMENTS OF OPERATIONS
Year Ended | |||||||||||
June 27, 2015 | June 28, 2014 | June 29, 2013 | |||||||||
(Thousands, except per share amounts) | |||||||||||
Revenues, including $3,604, $13,412 and $9,311 from related parties for the years ended June 27, 2015, June 28, 2014 and June 29, 2013, respectively | $ | 341,276 | $ | 390,871 | $ | 404,629 | |||||
Cost of revenues | 284,528 | 338,424 | 376,461 | ||||||||
Gross profit | 56,748 | 52,447 | 28,168 | ||||||||
Operating expenses: | |||||||||||
Research and development | 46,419 | 64,218 | 79,266 | ||||||||
Selling, general and administrative | 56,256 | 70,937 | 78,618 | ||||||||
Amortization of other intangible assets | 1,133 | 1,680 | 5,029 | ||||||||
Restructuring, acquisition and related (income) expense, net | (1,516 | ) | 18,491 | (7,631 | ) | ||||||
Flood-related (income) expense, net | — | (1,797 | ) | (29,510 | ) | ||||||
Impairment of goodwill, other intangible assets and long-lived assets | — | 584 | 27,021 | ||||||||
(Gain) loss on sale of property and equipment | (83 | ) | 665 | 170 | |||||||
Total operating expenses | 102,209 | 154,778 | 152,963 | ||||||||
Operating loss | (45,461 | ) | (102,331 | ) | (124,795 | ) | |||||
Other income (expense): | |||||||||||
Interest income (expense), net | (2,051 | ) | (9,228 | ) | (3,271 | ) | |||||
Loss on foreign currency transactions | (2,144 | ) | (1,158 | ) | (14,542 | ) | |||||
Other income (expense), net | 1,750 | 1,227 | (2,527 | ) | |||||||
Gain on bargain purchase | — | — | 24,866 | ||||||||
Total other income (expense) | (2,445 | ) | (9,159 | ) | 4,526 | ||||||
Loss from continuing operations before income taxes | (47,906 | ) | (111,490 | ) | (120,269 | ) | |||||
Income tax provision (benefit) | 328 | (9,365 | ) | 26 | |||||||
Loss from continuing operations | (48,234 | ) | (102,125 | ) | (120,295 | ) | |||||
Income (loss) from discontinued operations, net of tax | (8,458 | ) | 119,944 | (2,450 | ) | ||||||
Net income (loss) | $ | (56,692 | ) | $ | 17,819 | $ | (122,745 | ) | |||
Basic and diluted net income (loss) per share: | |||||||||||
Loss per share from continuing operations | $ | (0.45 | ) | $ | (1.03 | ) | $ | (1.37 | ) | ||
Income (loss) per share from discontinued operations | (0.08 | ) | 1.21 | (0.03 | ) | ||||||
Basic and diluted net income (loss) per share | $ | (0.52 | ) | $ | 0.18 | $ | (1.40 | ) | |||
Shares used in computing net income (loss) per share: | |||||||||||
Basic | 108,144 | 98,986 | 87,770 | ||||||||
Diluted | 108,144 | 98,986 | 87,770 | ||||||||
The accompanying notes form an integral part of these consolidated financial statements.
F- 5
OCLARO, INC.
CONSOLIDATED STATEMENTS OF COMPREHENSIVE INCOME (LOSS)
Year Ended | |||||||||||
June 27, 2015 | June 28, 2014 | June 29, 2013 | |||||||||
(Thousands) | |||||||||||
Net income (loss) | $ | (56,692 | ) | $ | 17,819 | $ | (122,745 | ) | |||
Other comprehensive income (loss): | |||||||||||
Unrealized loss on hedging transactions | — | — | (7 | ) | |||||||
Unrealized gain (loss) on marketable securities | 209 | (104 | ) | 86 | |||||||
Currency translation adjustments | (5,139 | ) | 771 | 9,193 | |||||||
Pension adjustment, net of tax benefits of $639 in 2013 | 592 | 5,829 | 558 | ||||||||
Total comprehensive income (loss) | $ | (61,030 | ) | $ | 24,315 | $ | (112,915 | ) | |||
The accompanying notes form an integral part of these consolidated financial statements.
F- 6
OCLARO, INC.
CONSOLIDATED STATEMENTS OF CASH FLOWS
Year Ended | |||||||||||
June 27, 2015 | June 28, 2014 | June 29, 2013 | |||||||||
(Thousands) | |||||||||||
Cash flows from operating activities: | |||||||||||
Net income (loss) | $ | (56,692 | ) | $ | 17,819 | $ | (122,745 | ) | |||
Adjustments to reconcile net income (loss) to net cash used in operating activities: | |||||||||||
Amortization of deferred gain on sale-leasebacks | (914 | ) | (2,134 | ) | (2,059 | ) | |||||
Amortization and write-off of debt discount and issuance costs | 305 | 4,293 | 524 | ||||||||
Depreciation and amortization | 18,613 | 26,383 | 42,177 | ||||||||
Flood-related non-cash losses | — | 2,011 | — | ||||||||
Gain on sale of Komoro Business | (8,315 | ) | — | — | |||||||
Gain on sale of Zurich Business | — | (63,240 | ) | — | |||||||
Gain on sale of Amplifier Business | — | (68,923 | ) | — | |||||||
Adjustment to the hold-backs related to the sales of the Zurich and Amplifier Businesses | 7,650 | — | — | ||||||||
Gain on bargain purchase on acquisition of Opnext | — | — | (24,866 | ) | |||||||
Gain on sale of assets | — | — | (24,846 | ) | |||||||
(Gain) loss on sale of property and equipment | (83 | ) | 665 | (80 | ) | ||||||
Impairment of goodwill, other intangible assets and long-lived assets | — | 584 | 26,015 | ||||||||
Stock-based compensation expense | 6,164 | 6,243 | 7,212 | ||||||||
Other adjustments | 161 | 365 | 4,306 | ||||||||
Changes in operating assets and liabilities, net of acquired businesses: | |||||||||||
Accounts receivable, net | 138 | 26,547 | 33,862 | ||||||||
Inventories | (5,308 | ) | 15,517 | 14,449 | |||||||
Prepaid expenses and other current assets | 7,996 | (6,987 | ) | (15,008 | ) | ||||||
Other non-current assets | (267 | ) | 1,509 | (151 | ) | ||||||
Accounts payable | (4,873 | ) | (27,179 | ) | (23,393 | ) | |||||
Accrued expenses and other liabilities | (10,828 | ) | (14,657 | ) | (2,895 | ) | |||||
Net cash used in operating activities | (46,253 | ) | (81,184 | ) | (87,498 | ) | |||||
Cash flows from investing activities: | |||||||||||
Purchases of property and equipment | (18,084 | ) | (8,756 | ) | (17,202 | ) | |||||
Proceeds from sale of Komoro Business | 14,647 | — | — | ||||||||
Proceeds from sale of Zurich Business | 1,410 | 93,545 | — | ||||||||
Proceeds from sale of Amplifier Business | 940 | 84,600 | — | ||||||||
Proceeds from sales of property and equipment | — | — | 80 | ||||||||
Proceeds from sale of assets | — | 2,120 | 26,000 | ||||||||
Proceeds from sale of investments | 141 | — | 3,861 | ||||||||
Transfer (to) from restricted cash, net of acquired businesses | 1,793 | (2,309 | ) | 17,893 | |||||||
Cash acquired from business combinations | — | — | 36,123 | ||||||||
Net cash provided by investing activities | 847 | 169,200 | 66,755 | ||||||||
Cash flows from financing activities: | |||||||||||
Proceeds from issuance of common stock, net | 42 | (46 | ) | 1,646 | |||||||
Proceeds from borrowings under credit line | — | — | 15,256 | ||||||||
Proceeds from the sale of convertible notes, net | 60,941 | — | 22,768 | ||||||||
Proceeds from term loan, net | — | — | 22,455 | ||||||||
Payments on capital lease obligations | (4,153 | ) | (7,073 | ) | (6,676 | ) | |||||
Repayments on borrowings under credit line, convertible notes payable and term loan | — | (64,964 | ) | (16,040 | ) | ||||||
Cash paid under earnout obligations | — | — | (8,628 | ) | |||||||
Net cash provided by (used in) financing activities | 56,830 | (72,083 | ) | 30,781 | |||||||
Effect of exchange rate on cash and cash equivalents | 1,443 | (1,595 | ) | 12,837 | |||||||
Net increase in cash and cash equivalents | 12,867 | 14,338 | 22,875 | ||||||||
Cash and cash equivalents at beginning of fiscal year | 98,973 | 84,635 | 61,760 | ||||||||
Cash and cash equivalents at end of fiscal year | $ | 111,840 | $ | 98,973 | $ | 84,635 | |||||
Supplemental disclosures of cash flow information: | |||||||||||
Cash paid for interest | $ | — | $ | 10,437 | $ | 2,496 | |||||
Cash paid for income taxes | 507 | 2,571 | 3,589 | ||||||||
Supplemental disclosures of non-cash transactions: | |||||||||||
Issuance of common stock in connection with exercise of convertible notes | $ | — | $ | 23,050 | $ | — | |||||
Issuance of common stock, stock options and stock appreciation rights related to the acquisition of Opnext | — | — | 89,842 | ||||||||
Capital lease obligations incurred for purchases of property and equipment | — | — | (658 | ) | |||||||
Warrants issued in connection with term loans | — | — | 667 | ||||||||
The accompanying notes form an integral part of these consolidated financial statements.
F- 7
OCLARO, INC.
CONSOLIDATED STATEMENTS OF STOCKHOLDERS’ EQUITY
Additional Paid-In Capital | Accumulated Other Comprehensive Income | Accumulated Deficit | Total Stockholders’ Equity | |||||||||||||||||||
Common Stock | ||||||||||||||||||||||
Shares | Amount | |||||||||||||||||||||
(Thousands) | ||||||||||||||||||||||
Balance at June 30, 2012 | 51,511 | 515 | 1,330,172 | 29,538 | (1,192,574 | ) | 167,651 | |||||||||||||||
Issuance of shares related to share awards and restricted stock units | 1,697 | 17 | (83 | ) | — | — | (66 | ) | ||||||||||||||
Issuance of shares upon the exercise of common stock options | 6 | — | 3 | — | — | 3 | ||||||||||||||||
Issuance of shares in connection with the employee stock purchase plan | 1,135 | 11 | 1,699 | — | — | 1,710 | ||||||||||||||||
Shares issued in connection with acquisitions | 38,416 | 385 | 89,457 | — | — | 89,842 | ||||||||||||||||
Stock-based compensation | — | — | 7,240 | — | — | 7,240 | ||||||||||||||||
Warrants issued in connection with notes | — | — | 667 | — | — | 667 | ||||||||||||||||
Other comprehensive gain | — | — | — | 9,830 | — | 9,830 | ||||||||||||||||
Net loss | — | — | — | — | (122,745 | ) | (122,745 | ) | ||||||||||||||
Balance at June 29, 2013 | 92,765 | 928 | 1,429,155 | 39,368 | (1,315,319 | ) | 154,132 | |||||||||||||||
Issuance of shares related to share awards and restricted stock units | 338 | 3 | (218 | ) | — | — | (215 | ) | ||||||||||||||
Issuance of shares upon the exercise of common stock options | 155 | 1 | 158 | — | — | 159 | ||||||||||||||||
Issuance of shares in connection with exercise of warrants | 978 | 10 | — | — | — | 10 | ||||||||||||||||
Issuance of shares in connection with conversion of convertible notes, net of adjustments for unamortized issuance and discount costs | 13,543 | 135 | 22,983 | — | — | 23,118 | ||||||||||||||||
Stock-based compensation | — | — | 6,409 | — | — | 6,409 | ||||||||||||||||
Other comprehensive gain | — | — | — | 6,496 | — | 6,496 | ||||||||||||||||
Net income | — | — | — | — | 17,819 | 17,819 | ||||||||||||||||
Balance at June 28, 2014 | 107,779 | 1,077 | 1,458,487 | 45,864 | (1,297,500 | ) | 207,928 | |||||||||||||||
Issuance of shares related to share awards and restricted stock units | 2,085 | 21 | (23 | ) | — | — | (2 | ) | ||||||||||||||
Issuance of shares upon the exercise of common stock options | 25 | 1 | 42 | — | — | 43 | ||||||||||||||||
Stock-based compensation | — | — | 6,061 | — | — | 6,061 | ||||||||||||||||
Other comprehensive loss | — | — | — | (4,338 | ) | — | (4,338 | ) | ||||||||||||||
Net loss | — | — | — | — | (56,692 | ) | (56,692 | ) | ||||||||||||||
Balance at June 27, 2015 | 109,889 | $ | 1,099 | $ | 1,464,567 | $ | 41,526 | $ | (1,354,192 | ) | $ | 153,000 | ||||||||||
The accompanying notes form an integral part of these consolidated financial statements.
F- 8
NOTES TO CONSOLIDATED FINANCIAL STATEMENTS
NOTE 1. BASIS OF PREPARATION AND SUMMARY OF SIGNIFICANT ACCOUNTING POLICIES
Business
Oclaro, Inc., a Delaware corporation, is sometimes referred to in this Annual Report on Form 10-K as “Oclaro,” “we,” “us,” or “our.”
During our fiscal year 2015, we were one of the leading providers of optical components, modules and subsystems for the core optical transport, service provider, enterprise and data center markets. Leveraging over three decades of laser technology innovation, photonic integration and subsystem design, we provide differentiated solutions for optical networks and high-speed interconnects driving the next wave of streaming video, cloud computing, application virtualization and other bandwidth-intensive and high-speed applications.
On August 5, 2014, we entered into a separation agreement to sell our industrial and consumer business of Oclaro Japan located at our Komoro, Japan facility to Ushio Opto Semiconductors, Inc. ("Ushio Opto"). On October 27, 2014, the sale was completed. The transaction is more fully discussed in Note 3, Business Combinations and Dispositions.
On November 1, 2013, we sold our optical amplifier and micro-optics business (the “Amplifier Business”) to II-VI Incorporated ("II-VI"). On September 12, 2013, we sold our Oclaro Switzerland GmbH subsidiary and associated laser diodes and pump business (the “Zurich Business”) to II-VI. These sales are more fully discussed in Note 3, Business Combinations and Dispositions. These sales are reported as discontinued operations, which require retrospective restatement of prior periods to classify the results of operations as discontinued operations. The notes to our consolidated financial statements relate to our continuing operations only, unless otherwise indicated.
On July 23, 2012, we completed a merger with Opnext, Inc. ("Opnext"). The acquisition is more fully discussed in Note 3, Business Combinations and Dispositions. The consolidated statements of operations, comprehensive income (loss) and cash flows for the years ended June 27, 2015, June 28, 2014 and June 29, 2013 include the results of operations of the combined entities from July 23, 2012, the date of the acquisition.
Basis of Preparation
The consolidated financial statements include the accounts of Oclaro and our subsidiaries. All significant intercompany accounts and transactions have been eliminated in consolidation.
The consolidated financial statements have been prepared in accordance with accounting principles generally accepted in the United States of America ("GAAP"), which contemplate the continuation of a company as a going concern. As of June 27, 2015, we held $115.1 million in cash and restricted cash, comprised of $111.8 million in cash and cash equivalents and $3.3 million in current restricted cash; and we had working capital of $186.7 million. We have incurred significant operating losses from continuing operations and generated negative cash flows from operations for fiscal year 2015. Recoverability of a major portion of the recorded asset amounts shown in the accompanying balance sheet is dependent upon us having sufficient resources to operate our business. In addition to the availability of our cash resources as of June 27, 2015, the continued operation of our business is dependent upon our achieving cash flows expected to be generated from the execution of our current operating plan, including anticipated restructuring plans, together with amounts expected to be available under our credit agreement. The financial statements do not include any adjustments relating to the recoverability and classification of recorded asset amounts or amounts and classification of liabilities that might be necessary should we be unable to continue in existence.
In the event that any of the sources of liquidity described in the preceding paragraph are, for any reason, not available to us in a timely manner or in the event that we need additional liquidity beyond our current expectations, such as to fund future growth or strengthen our balance sheet or to fund the cost of restructuring activities, we may find it necessary to lower our operating income break-even level and undertake additional cost cutting measures. We will continue to explore other sources of additional liquidity. These additional sources of liquidity could include one, or a combination, of the following: (i) issuing equity securities, (ii) incurring indebtedness secured by our assets, (iii) issuing debt and/or convertible debt securities, or (iv) selling product lines, other assets and/or portions of our business. There can be no guarantee that we will be able to raise additional funds on terms acceptable to us, or at all.
Use of Estimates
The preparation of financial statements in conformity with GAAP requires management to make estimates and assumptions that affect the reported amounts of assets and liabilities, disclosure of contingent assets and liabilities at the date of the financial
F- 9
statements, and the reported amounts of revenue and expenses during the reported periods. Examples of significant estimates and assumptions made by management involve the fair value of other intangible assets and long-lived assets, valuation allowances for deferred tax assets, the fair value of stock-based compensation, the fair value of embedded derivatives related to convertible debt, the fair value of pension liabilities, estimates used to determine facility lease loss liabilities, estimates for allowances for doubtful accounts and valuation of excess and obsolete inventories. These judgments can be subjective and complex and consequently actual results could differ materially from those estimates and assumptions.
Out of Period Adjustment
In fiscal year 2015, we recorded out-of-period adjustments of approximately $2.0 million in cost of goods sold in our consolidated statements of operations. The adjustments, which increased cost of goods sold, also increased accrued liabilities and decreased inventory, and were made to correct our fiscal year 2014 inventory valuation and the value of our purchase commitment accrual. We determined that the adjustments did not have a material impact to our current or prior period consolidated financial statements.
In fiscal year 2014, we recorded an out-of-period adjustment of approximately $2.0 million in flood-related (income) expense, net, in our consolidated statements of operations. The adjustment, which decreased flood-related income and decreased property and equipment, net, was made to account for the impairment of leased assets assumed pursuant to the Opnext merger that had been damaged in the 2011 Thailand flood (see Note 6, Flood-Related (Income) Expense, Net). We determined that this adjustment did not have a material impact to our current or prior period consolidated financial statements.
Fiscal Years
We operate on a 52/53 week year ending on the Saturday closest to June 30. Our fiscal years ended June 27, 2015, June 28, 2014 and June 29, 2013 were each 52 week years.
Cash and Cash Equivalents
We consider all liquid investment securities with a maturity date of three months or less to be cash equivalents. Any realized gains and losses on liquid investment securities are included in other income (expense), net in our consolidated statements of operations.
The following table provides details regarding our cash and cash equivalents at the dates indicated:
June 27, 2015 | June 28, 2014 | ||||||
(Thousands) | |||||||
Cash and cash equivalents: | |||||||
Cash-in-bank | $ | 110,196 | $ | 97,759 | |||
Money market funds | 1,644 | 1,214 | |||||
$ | 111,840 | $ | 98,973 | ||||
As of June 27, 2015, $33.5 million of the $111.8 million of our cash and cash equivalents was held by our foreign subsidiaries. If these funds are needed for our operations in the United States, we could be required to accrue and pay foreign withholding taxes to repatriate these funds.
As of June 27, 2015, we also had restricted cash of $3.5 million, including $0.2 million in other non-current assets, consisting of collateral for the performance of our obligations under certain facility lease agreements, collateral to secure certain of our credit card accounts and deposits for value-added taxes in foreign jurisdictions, and $1.6 million (equivalent to RMB 10.0 million) of cash held in Oclaro Shenzhen’s bank account in China that was frozen by the Xi'an Court in connection with our litigation with Xi’an Raysung Photonics Inc. (see Note 9, Commitments and Contingencies, for additional details regarding this litigation.)
Concentration of Credit Risks
We place our cash and cash equivalents with and in the custody of financial institutions, which at times, are in excess of amounts insured. Management monitors the ongoing creditworthiness of these institutions. To date, we have not experienced significant losses on these investments.
Our trade accounts receivable are concentrated with companies in the telecom industry. At June 27, 2015, four customers accounted for a total of 59 percent of our gross accounts receivable. At June 28, 2014, three customers accounted for a total of 42 percent of our gross accounts receivable.
F- 10
Allowance for Doubtful Accounts and Sales Return Allowance
We perform ongoing credit evaluations of our customers and record specific allowances for doubtful accounts when a customer is unable to meet its financial obligations, as in the case of bankruptcy filings or deteriorated financial position. Estimates are used in determining allowances for customers based on factors such as current trends, the length of time the receivables are past due and historical collection experience. We write-off a receivable account when all rights, remedies and recourses against the account and its principals are exhausted and record a benefit when previously reserved accounts are collected. We recorded additional provisions as allowances for doubtful accounts in fiscal year 2015, 2014 and 2013 of $41,000, $38,000 and $0.7 million, respectively.
We record a provision for estimated sales returns, which is netted against revenues, in the same period as the related revenues are recorded. These estimates are based on historical sales returns, other known factors and our return policy. In fiscal year 2015, 2014 and 2013, we recorded a provision of zero, zero and $3.1 million as sales return allowances, respectively.
Inventories
Inventories, consisting of raw materials, work-in-process and finished goods are stated at the lower of cost (first in, first out basis) or market. We plan production based on orders received and a forecast demand. These production estimates are dependent on assessment of current and expected orders from our customers, including consideration that orders are subject to cancellation with limited advance notice prior to shipment. We assess the valuation of our inventory, including significant inventories held by contract manufacturers on our behalf, on a quarterly basis. Products may be unsalable because they are technically obsolete due to substitute products, specification changes or excess inventory relative to customer forecasts. We adjust the carrying value of inventory using methods that take these factors into account. If we find that the cost basis of our inventory is greater than the current market value, we write the inventory down to the estimated selling price, less the estimated costs to complete and sell the product.
The following table provides details regarding our inventories at the dates indicated:
June 27, 2015 | June 28, 2014 | ||||||
(Thousands) | |||||||
Inventories: | |||||||
Raw materials | $ | 19,610 | $ | 20,036 | |||
Work-in-process | 19,812 | 20,505 | |||||
Finished goods | 26,920 | 30,558 | |||||
$ | 66,342 | $ | 71,099 | ||||
In connection with our sale of the Komoro Business, we transferred approximately $4.6 million in inventories to Ushio Opto during fiscal year 2015.
Property and Equipment
Property and equipment are stated at cost. Depreciation is computed using the straight-line method based upon the estimated useful lives of the assets, which generally range from three to seven years. Leasehold improvements are amortized using the straight-line method over the estimated useful lives or the term of the related lease, whichever is shorter. When assets are retired or otherwise disposed of, the assets and related accumulated depreciation are removed from the accounts. Gains or losses resulting from asset dispositions are included in (gain) loss on sale of property and equipment in the accompanying consolidated statements of operations. Repair and maintenance costs are expensed as incurred.
F- 11
The following table provides details regarding our property and equipment, net at the dates indicated:
June 27, 2015 | June 28, 2014 | ||||||
(Thousands) | |||||||
Property and equipment, net: | |||||||
Buildings and improvements | $ | 11,837 | $ | 12,989 | |||
Plant and machinery | 33,603 | 47,247 | |||||
Fixtures, fittings and equipment | 4,785 | 9,701 | |||||
Computer equipment | 12,401 | 13,723 | |||||
62,626 | 83,660 | ||||||
Less: accumulated depreciation | (20,860 | ) | (32,892 | ) | |||
$ | 41,766 | $ | 50,768 | ||||
In connection with our sale of the Komoro Business, we transferred approximately $3.7 million in property and equipment to Ushio Opto during fiscal year 2015.
Property and equipment includes assets under capital leases of $4.7 million and $9.9 million at June 27, 2015 and June 28, 2014, respectively, the majority of which were assumed in connection with the Opnext acquisition. Amortization associated with assets under capital leases is recorded in depreciation expense.
Depreciation expense was $17.5 million, $25.3 million and $30.0 million for the fiscal years ended June 27, 2015, June 28, 2014 and June 29, 2013, respectively. In fiscal year 2014, we recorded an impairment charge of $0.6 million related to the write-off of certain machinery that was not being utilized.
Goodwill and Other Intangible Assets
We review our goodwill and other intangible assets for impairment whenever events or changes in circumstances indicate that the carrying amount of these assets may not be recoverable and also review goodwill annually. The values assigned to goodwill and other intangible assets are based on estimates and judgments regarding expectations for the success and life cycle of products and technologies acquired.
In fiscal year 2013, our goodwill was tested for impairment using a two-step process. In the first step, the estimated fair value of a reporting unit is compared to its carrying value. If the carrying value of the net assets assigned to a reporting unit exceeds the fair value of a reporting unit, a second step of the impairment test is performed, whereby we hypothetically apply purchase accounting to the reporting unit using the fair value from the first step in order to determine the implied fair value of a reporting unit’s goodwill. We estimate the fair value of the reporting unit using the expected present value of future cash flows and also compare our market capitalization plus a control premium for reasonableness. Based upon this evaluation, we recorded a $10.9 million impairment loss in our consolidated statement of operations for the year ended June 29, 2013. See Note 4. Goodwill and Other Intangible Assets.
Intangible assets with definite lives are amortized over their estimated useful lives, which is generally from 1 to 11 years and 15 years as to one specific customer contract.
Impairment of Long-Lived Assets
We review property and equipment and certain identifiable intangibles, excluding goodwill, for impairment whenever events or changes in circumstances indicate that the carrying amount of an asset may not be recoverable. Recoverability of these assets is measured by comparing their carrying amounts to market prices or the future undiscounted cash flows the assets are expected to generate. If property and equipment or certain identifiable intangibles are considered to be impaired, the impairment to be recognized would equal the amount by which the carrying value of the asset exceeds its fair value based on market prices or future discounted cash flows.
In the fourth quarter of fiscal year 2015, we completed an impairment assessment and determined that while no impairment existed, certain of our other intangible assets related to our integrated photonics product line had shorter estimated useful lives than initially anticipated. Accordingly, we adjusted the estimated useful lives of these other intangible assets.
F- 12
Non-Marketable Cost Method Investments
We account for our non-marketable cost method investments, which consist of less than 20 percent equity ownership interests of common stock and/or preferred stock in privately-held companies, under the cost method of accounting. As of June 27, 2015 and June 28, 2014, we no longer held any investments in privately-held companies. During fiscal year 2013, we sold our remaining cost method investment for $3.9 million of cash proceeds. We had previously acquired this investment in fiscal year 2010 for a purchase price of $7.5 million. We recorded a $3.6 million impairment charge during fiscal year 2013 in other income (expense) in our consolidated statement of operations.
Derivative Financial Instruments
Our operating results are subject to fluctuations based upon changes in the exchange rates between the currencies in which we collect revenues and pay expenses. A majority of our revenues are denominated in U.S. dollars, while a significant portion of our expenses are denominated in United Kingdom (U.K.) pounds sterling, Japanese yen, Chinese yuan and euros, in which we pay expenses in connection with operating our facilities in the United Kingdom, Japan, China and Italy. Prior to our sale of our Zurich Business in fiscal year 2013, we also incurred a significant portion of our expenses in Swiss francs. Historically, we have entered into foreign currency forward exchange contracts in an effort to mitigate a portion of our exposure to exchange rate fluctuations between the U.S. dollar and the U.K. pound sterling.
We recognize all derivatives, such as foreign currency forward exchange contracts, on our consolidated balance sheets at fair value regardless of the purpose for holding the instrument. If the derivative is a hedge, depending on the nature of the hedge, changes in the fair value of the derivative will either be offset against the change in fair value of the hedged assets, liabilities or firm commitments through operating results or recognized in accumulated other comprehensive income until the hedged item is recognized in operating results in our consolidated statements of operations.
During the year ended June 27, 2015, we entered into foreign currency forward exchange contracts, which expired in the same fiscal quarter in which they were opened. In connection with these hedges, during the year ended June 27, 2015, we recorded a $0.7 million loss on foreign currency transactions, net within our consolidated statement of operations. At June 27, 2015 and June 28, 2014, we had no outstanding foreign currency forward exchange contracts.
Accrued Expenses and Other Liabilities
The following table provides details for our accrued expenses and other liabilities at the dates indicated:
June 27, 2015 | June 28, 2014 | ||||||
(Thousands) | |||||||
Accrued expenses and other liabilities: | |||||||
Trade payables | $ | 5,250 | $ | 18,612 | |||
Compensation and benefits related accruals | 11,298 | 10,242 | |||||
Warranty accrual | 2,932 | 4,672 | |||||
Accrued restructuring, current | 712 | 2,220 | |||||
Purchase commitments in excess of future demand, current | 3,162 | 1,844 | |||||
Other accruals | 12,294 | 13,902 | |||||
$ | 35,648 | $ | 51,492 | ||||
In connection with our sale of the Komoro Business, we transferred approximately $2.4 million in accrued expenses and other liabilities to Ushio Opto during fiscal year 2015.
Warranty
We generally provide a warranty for our products ranging from 12 months to 36 months from the date of sale, although warranties for certain of our products may be longer. We accrue for the estimated costs to provide warranty services at the time revenue is recognized. Our estimate of costs to service our warranty obligations is based on historical experience and expectation of future conditions. To the extent we experience increased warranty claim activity or increased costs associated with servicing those claims, our warranty costs would increase, resulting in a decrease in gross profit.
Revenue Recognition
We recognize product revenue when (i) persuasive evidence of an arrangement exists, (ii) the product has been shipped and title has transferred, (iii) collectability is reasonably assured, (iv) the fees are fixed or determinable and (v) there are no uncertainties with respect to customer acceptance. We record a provision for estimated sales returns in the same period as the related
F- 13
revenues are recorded, which is netted against revenue. These estimates are based on historical sales returns, other known factors and our return policy.
Research and Development Costs
Research and development costs are expensed as incurred.
Advertising Costs
Advertising costs are expensed as incurred. Our advertising costs for the years ended June 27, 2015, June 28, 2014 and June 29, 2013 were not significant.
Restructuring Expenses
We record costs associated with employee terminations and other exit activities when the liability is incurred. Employee termination benefits are recorded when the benefit arrangement is communicated to the employee and no significant future services are required. If employees are required to render service until they are terminated in order to receive the termination benefits, the fair value of the termination date liability is recognized ratably over the future service period. Lease cancellation and commitment costs are recorded when we cease using the facility. Lease cancellation and commitment costs are calculated using estimated future lease commitments less estimated sublease income, based on current market conditions. See Note 5, Restructuring Liabilities.
Insurance Recoveries
Insurance recoveries related to impairment losses previously recorded and other recoverable expenses will be recognized up to the amount of our related loss or expense in the period that recoveries become realizable. Insurance recoveries under business interruption coverage and insurance recovery gains in excess of amounts previously written off related to impaired inventory and equipment or in excess of other recoverable expenses previously recognized will be recognized when they become realizable and all contingencies have been resolved.
During the year ended June 28, 2014 and June 29, 2013, we received $3.7 million and $30.8 million in settlement payments, respectively, relating to losses we incurred due to flooding at our contract manufacturer in Thailand. As there were no contingencies associated with these payments, we recorded these payments within flood-related (income) expense, net in our consolidated statements of operations for the year ended June 28, 2014 and June 29, 2013, respectively.
The evaluation of insurance recoveries requires estimates and judgments about future results which affect reported amounts and certain disclosures. Actual results could differ from those estimates.
Stock-Based Compensation
We use the Black-Scholes option pricing model to value the fair value of stock options, purchase rights under our employee stock purchase program and stock appreciation rights. We use grant date fair value to value restricted stock awards, restricted stock units and performance shares.
We record compensation expense using the straight-line method and estimate forfeitures when recognizing compensation expense, and we adjust our estimate of forfeitures over the requisite service period based on the extent to which actual forfeitures differ, or are expected to differ, from such estimates. Changes in estimated forfeitures will be recognized through a cumulative catch-up adjustment in the period of change and will also impact the amount of compensation expense to be recognized in future periods.
The amount of stock-based compensation expense recognized in any one period related to performance shares can vary based on the achievement or anticipated achievement of the performance conditions. If the performance conditions are not met or not expected to be met, no compensation cost would be recognized on the underlying performance shares, and any previously recognized compensation expense related to those performance shares would be reversed.
Stock options have a term of seven to ten years and generally vest over a two to four year service period, and restricted stock awards generally vest over a one to four year service period, and in certain cases each may vest earlier based upon the achievement of specific performance-based objectives as set by our board of directors or may be subject to additional vesting conditions based upon achievement of such performance-based objectives.
Foreign Currency Transactions and Translation Gains and Losses
The assets and liabilities of our foreign operations are translated from their respective functional (local) currencies into U.S. dollars at the rates in effect at the consolidated balance sheet dates, and revenue and expense amounts are translated at the average rate during the applicable periods reflected on the consolidated statements of operations. Foreign currency translation adjustments are recorded as accumulated other comprehensive income, except for the translation adjustment of short-term
F- 14
intercompany loans or payables which are recorded as gain (loss) on foreign currency transactions in our consolidated statements of operations. Gains and losses from foreign currency transactions, realized and unrealized in the event of foreign currency transactions not designated as hedges, and those transactions denominated in currencies other than our functional currency, are recorded as gain (loss) on foreign currency transactions in our consolidated statements of operations.
Income Taxes
We account for income taxes using an asset and liability based approach. Deferred income tax assets and liabilities are recorded based on the differences between the financial statement and tax bases of assets and liabilities using enacted tax rates. Valuation allowances are provided against deferred income tax assets which are not likely to be realized.
Net Income (Loss) Per Share
Basic net income (loss) per share is computed using only the weighted-average number of shares of common stock outstanding for the applicable period, while diluted net income (loss) per share is computed assuming conversion of all potentially dilutive securities, such as stock options, stock appreciation rights, unvested restricted stock awards, warrants and shares issuable in connection with convertible notes during such period. For the fiscal years ended June 27, 2015, June 28, 2014 and June 29, 2013, we excluded such dilutive securities from the computation of diluted shares outstanding since we incurred a net loss from continuing operations in these periods and their inclusion would have an anti-dilutive effect.
Recent Accounting Pronouncements
In April 2015, the FASB issued Accounting Standards Update ("ASU") No. 2015-03, Simplifying the Presentation of Debt Issuance Costs. Under ASU 2015-03, debt issuance costs are required to be presented as a direct deduction of debt balances on the balance sheet. This new standard does not affect the recognition and measurement of debt issuance costs. We elected to early adopt ASU No. 2015-03, as permitted. This guidance is effective on a retrospective basis, as a change in accounting principle. The impact of the early adoption on our consolidated balance sheet for fiscal year 2015 is to decrease prepaid expenses and other current assets by $0.6 million and decrease convertible notes payable by $0.6 million. There is no impact of the early adoption on our consolidated balance sheet for fiscal year 2014.
In January 2015, the FASB issued ASU No. 2015-01, Income Statement - Extraordinary and Unusual Items. This ASU eliminates from U.S. GAAP the concept of extraordinary items. Eliminating the extraordinary classification simplifies income statement presentation by altogether removing the concept of extraordinary items from consideration. This guidance is effective for fiscal years, and interim periods within those fiscal years, beginning after December 15, 2015. This guidance is effective for us prospectively in the first quarter of fiscal year 2017. We are currently evaluating the impact that the implementation of this standard will have on our financial statements.
In August 2014, the FASB issued ASU No. 2014-15, Presentation of Financial Statements—Going Concern. The update provides U.S. GAAP guidance on management’s responsibility in evaluating whether there is substantial doubt about a company’s ability to continue as a going concern and about related footnote disclosures. For each reporting period, management will be required to evaluate whether there are conditions or events that raise substantial doubt about a company’s ability to continue as a going concern within one year from the date the financial statements are issued. This guidance is effective for us beginning with our annual financial statements for the fiscal year ended July 1, 2017, and interim periods thereafter. We are currently evaluating the impact that the implementation of this standard will have on our financial statements.
In May 2014, the FASB issued ASU 2014-09, Revenue from Contracts with Customers. This update clarifies the principles for recognizing revenue and develops a common revenue standard for GAAP and International Financial Reporting Standards. The standard outlines a single comprehensive model for entities to use in accounting for revenue arising from contracts with customers and supersedes most current revenue recognition guidance. In July 2015, the FASB deferred the effective date by one year for public entities to annual periods, and interim periods within those fiscal years, beginning after December 15, 2017. Early adoption is permitted for periods beginning after December 15, 2016. We are currently evaluating the impact that the implementation of this standard will have on our financial statements.
In April 2014, the FASB issued ASU No. 2014-08, Reporting Discontinued Operations and Disclosures of Disposals of Components of an Entity. This update requires that a disposal representing a strategic shift that has (or will have) a major effect on an entity's financial results be reported as discontinued operations. The standard also expands the disclosures for discontinued operations and requires new disclosures related to individually material disposals that do not meet the definition of a discontinued operation. The provisions of this ASU are effective for interim and annual periods beginning after December 15, 2014. We early adopted this guidance in our first quarter of fiscal year 2015. In accordance with this guidance, our sale of the Komoro Business does not meet the definition of a discontinued operation. We consider this sale as an individually material disposal and have expanded our disclosures related to this transaction, including presenting the pre-tax profit (loss) of the Komoro Business for the years ended June 27, 2015 and June 28, 2014.
F- 15
NOTE 2. FAIR VALUE
We define fair value as the price that would be received from selling an asset or paid to transfer a liability in an orderly transaction between market participants at the measurement date. When determining fair value measurements for assets and liabilities which are required to be recorded at fair value, we consider the principal or most advantageous market in which we would transact and the market-based risk measurements or assumptions that market participants would use in pricing the asset or liability, such as inherent risk, transfer restrictions and credit risk. We apply the following fair value hierarchy, which ranks the quality and reliability of the information used to determine fair values:
Level 1 – Quoted prices in active markets for identical assets or liabilities.
Level 2 – Inputs other than Level 1 prices, such as quoted prices for similar assets or liabilities, quoted prices of identical assets or liabilities in markets with insufficient volume or infrequent transactions (less active markets), or other inputs that are observable or can be corroborated by observable market data for substantially the full term of the assets or liabilities.
Level 3 – Unobservable inputs to the valuation methodology that are significant to the measurement of the fair value of the assets or liabilities.
Our cash equivalents and marketable securities are generally classified within Level 1 or Level 2 of the fair value hierarchy because they are valued using quoted market prices, broker or dealer quotations, or alternative pricing sources with reasonable levels of price transparency. The types of instruments valued based on quoted market prices in active markets include most marketable securities and money market securities. Such instruments are generally classified within Level 1 of the fair value hierarchy.
The contingent obligation related to the make-whole premium on our 6.00% Convertible Senior Notes ("6.00% Notes") was valued using a binomial lattice valuation model which estimated the value based on the probability and timing of conversion. As of February 19, 2015, the date of the debt issuance, and as of June 27, 2015, the fair value of this contingent obligation is estimated at zero. The contingent obligation will continue to be revalued each reporting period and classified within Level 3 of the fair value hierarchy.
The contingent obligation related to the make-whole premium on our 7.50% Exchangeable Senior Secured Lien Notes ("7.50% Notes") was also valued using a valuation model which estimated the value based on the probability and timing of conversion. The contingent obligation was classified within Level 3 of the fair value hierarchy in fiscal year 2013, prior to settling the make-whole premium in fiscal year 2014 upon the holders of the convertible notes exercising their rights to exchange the convertible notes for common stock.
Assets and Liabilities Measured at Fair Value on a Recurring Basis
Assets and liabilities measured at fair value on a recurring basis are shown in the tables below by their corresponding balance sheet captions and consisted of the following types of instruments at June 27, 2015 and June 28, 2014:
Fair Value Measurement at June 27, 2015 Using | ||||||||||||||
Quoted Prices | Significant | |||||||||||||
in Active | Other | Significant | ||||||||||||
Markets for | Observable | Unobservable | ||||||||||||
Identical Assets | Inputs | Inputs | ||||||||||||
(Level 1) | (Level 2) | (Level 3) | Total | |||||||||||
Assets: | (Thousands) | |||||||||||||
Cash and cash equivalents: (1) | ||||||||||||||
Money market funds | 1,644 | — | — | 1,644 | ||||||||||
Restricted cash: | ||||||||||||||
Money market funds | 1,215 | — | — | 1,215 | ||||||||||
Total assets measured at fair value | $ | 2,859 | — | — | $ | 2,859 | ||||||||
(1) | Excludes $110.2 million in cash held in our bank accounts at June 27, 2015. |
F- 16
Fair Value Measurement at June 28, 2014 Using | ||||||||||||||
Quoted Prices | Significant | |||||||||||||
in Active | Other | Significant | ||||||||||||
Markets for | Observable | Unobservable | ||||||||||||
Identical Assets | Inputs | Inputs | ||||||||||||
(Level 1) | (Level 2) | (Level 3) | Total | |||||||||||
Assets: | (Thousands) | |||||||||||||
Cash and cash equivalents: (1) | ||||||||||||||
Money market funds | 1,214 | — | — | 1,214 | ||||||||||
Short-term investments: | ||||||||||||||
Marketable securities | 95 | — | — | 95 | ||||||||||
Total assets measured at fair value | $ | 1,309 | — | — | $ | 1,309 | ||||||||
(1) | Excludes $97.8 million in cash held in our bank accounts at June 28, 2014. |
The following table provides details regarding the changes in assets and liabilities classified within Level 3 from June 29, 2013 to June 27, 2015:
Other non-current | ||||||||||
liabilities | ||||||||||
(Thousands) | ||||||||||
Balance at June 29, 2013 | 99 | |||||||||
Adjustments to the make-whole premium on the 7.50% Notes | 600 | |||||||||
Settlement of make-whole premium upon conversion of the 7.50% Notes | (699 | ) | ||||||||
Balance at June 28, 2014 and June 27, 2015 | $ | — | ||||||||
During fiscal year 2014, the holders of the convertible notes exercised their rights to exchange the convertible notes for our common stock. The conversion of the notes is more fully discussed in Note 7, Credit Line and Notes.
NOTE 3. BUSINESS COMBINATIONS AND DISPOSITIONS
During the fiscal years ended June 27, 2015, June 28, 2014 and June 29, 2013, we recorded $1.0 million, $7.8 million and $3.7 million, respectively, in legal and other direct acquisition-related costs in connection with business combinations and asset dispositions.
Sale of Komoro, Japan Industrial and Consumer Business ("Komoro Business")
On August 5, 2014, Oclaro Japan, Inc., our wholly-owned subsidiary (“Oclaro Japan”), entered into a Master Separation Agreement (“MSA”) with Ushio Opto and Ushio, Inc. (“Ushio”), whereby Ushio Opto agreed to acquire the industrial and consumer business of Oclaro Japan located at its Komoro, Japan facility (the “Komoro Business”), by means of an absorption-type demerger under the Japanese Companies Act. On October 27, 2014, the sale was completed. Initial consideration for this transaction consisted of 1.85 billion Japanese yen (approximately $17.1 million based on the exchange rate on October 27, 2014) in cash, of which 1.6 billion Japanese yen (approximately $14.8 million based on the exchange rate on October 27, 2014) was paid at the closing and 250 million Japanese yen (approximately $2.1 million based on the exchange rate on April 24, 2015) was paid into escrow and was released to Oclaro Japan on April 24, 2015. In addition, under the MSA, we are subject to a post-closing net asset valuation adjustment. We determined that based on the net assets transferred to Ushio Opto during the second quarter of fiscal year 2015, we owed Ushio Opto a post-closing net asset valuation adjustment of $1.4 million, which was paid to Ushio Opto in the third quarter of fiscal year 2015.
In connection with the sale of the Komoro Business, we transferred net assets with a book value of $6.3 million to Ushio Opto, consisting of $3.4 million in accounts receivable, $4.6 million in inventories, $0.9 million in prepaid expenses and other current assets, $3.7 million in property, plant and equipment, $4.4 million in other intangible assets, $5.9 million in accounts payable, $2.9 million in accrued expenses, other liabilities and capital lease obligations, and $1.9 million in other non-current liabilities. We also incurred $1.0 million in legal fees and other administrative costs related to this transaction. We completed the transfer
F- 17
of net assets in fiscal year 2015 and recognized a gain of $8.3 million within restructuring, acquisition and related (income) expense, net in the consolidated statements of operations.
At the closing of the transaction, Oclaro Japan and Ushio Opto entered into certain transition services and reciprocal services agreements to allow the Komoro Business to continue operations during the ownership transition, as well as an intellectual property agreement. Ushio has guaranteed the performance of Ushio Opto’s obligations under the MSA. Oclaro Japan, Ushio Opto and Ushio each provided customary and reciprocal representations, warranties and covenants in the MSA.
Income from continuing operations before income taxes attributable to the Komoro Business was $1.3 million for the year ended June 27, 2015 (up through October 27, 2014, the date the sale was completed), and $6.4 million for the year ended June 28, 2014, respectively.
Sale of Amplifier Business
On October 10, 2013, Oclaro Technology Limited entered into an Asset Purchase Agreement with II-VI, whereby Oclaro Technology Limited agreed to sell to II-VI and certain of its affiliates its Amplifier Business for $88.6 million in cash. The transaction closed on November 1, 2013. We classified the sale of our Amplifier Business as a discontinued operation as of September 12, 2013, the date management committed to sell the business.
Consideration, valued initially at $88.6 million consisting of $79.6 million in cash, which was received on November 1, 2013, $4.0 million which was subject to hold-back by II-VI until December 31, 2014 to address any post-closing claims and $5.0 million related to the exclusive option, which was received on September 12, 2013 and was credited against the purchase price upon closing of the sale. On December 30, 2014, Oclaro Technology Limited entered into a Settlement Agreement with II-VI and II-VI Holdings B.V. regarding disposition of the amounts held back by the II-VI parties pursuant to the Asset Purchase Agreement. Of the $4.0 million subject to hold-back until December 31, 2014, we received $0.9 million in January 2015 and we released II-VI from the remaining $3.1 million. In connection with the Settlement Agreement, we also agreed with the II-VI parties to a mutual release of certain claims related to the Asset Purchase Agreement, and certain related documents and transactions.
In connection with this transaction, we transferred $16.2 million in net assets to II-VI. We also incurred approximately $3.0 million in legal fees, commissions and other administrative costs related to this transaction. We recognized an initial gain of $68.9 million on the sale of the Amplifier Business, which is recorded within discontinued operations in the consolidated statement of operations in fiscal year 2014. We recorded the $3.1 million release of the hold-back as a loss from discontinued operations within the consolidated statement of operations in fiscal year 2015.
The following table presents the statements of operations for the discontinued operations of the Amplifier Business:
Year Ended | |||||||||||
June 27, 2015 | June 28, 2014 | June 29, 2013 | |||||||||
(Thousands) | |||||||||||
Revenues | $ | — | $ | 35,185 | $ | 93,902 | |||||
Cost of revenues | — | 26,389 | 72,901 | ||||||||
Gross profit | — | 8,796 | 21,001 | ||||||||
Operating expenses | 161 | 5,545 | 18,739 | ||||||||
Other income (expense), net | (3,060 | ) | 68,923 | — | |||||||
Income from discontinued operations before income taxes | (3,221 | ) | 72,174 | 2,262 | |||||||
Income tax provision | — | 13,068 | 800 | ||||||||
Income from discontinued operations | $ | (3,221 | ) | $ | 59,106 | $ | 1,462 | ||||
In connection with the sale of the Amplifier Business, we entered into certain transition service and manufacturing service agreements to allow the Amplifier Business to continue operations during the ownership transition. Both parties provided customary and reciprocal representations, warranties and covenants in the Asset Purchase Agreement.
F- 18
Sale of Zurich Business
On September 12, 2013, we completed a Share and Asset Purchase Agreement with II-VI, pursuant to which we sold our Oclaro Switzerland GmbH subsidiary and associated laser diodes and pump business to II-VI, which includes its GaAs fabrication facility, and also the corresponding high power laser diodes, VCSEL and 980 nm pump laser product lines, including intellectual property, inventory, equipment and a related research and development facility in Tucson. Also, as part of the agreement, II-VI purchased certain pieces of equipment which are located in our Caswell facility. We continue to operate this equipment on behalf of II-VI, and provide certain wafer processing services in Caswell as part of an ongoing manufacturing services agreement. We have classified the sale of our Zurich Business as a discontinued operation.
We received proceeds of $90.6 million in cash on September 12, 2013, and $2.9 million in cash during the third quarter of fiscal year 2014 which related to a final settlement of the post-closing working capital adjustment. We were also scheduled to receive an additional $6.0 million subject to hold-back by II-VI until December 31, 2014 to address any post-closing adjustments or claims. On December 30, 2014, we entered into a Settlement Agreement with II-VI and II-VI Holdings B.V. regarding disposition of the amounts held back by the II-VI parties pursuant to the Share and Asset Purchase Agreement. Of the $6.0 million subject to hold-back until December 31, 2014, we received $1.4 million in January 2015 and we released II-VI from the remaining $4.6 million. In connection with the Settlement Agreement, we also agreed with the II-VI parties to a mutual release of certain claims related to the Share and Asset Purchase Agreement, and certain related documents and transactions.
In connection with this transaction, we transferred $31.4 million in net assets to II-VI and incurred approximately $4.8 million in legal fees, commissions and other administrative costs. We retained approximately $14.7 million in accounts receivable related to the Zurich Business and approximately $9.6 million of supplier and employee related payables related to the Zurich Business which were not included in the Zurich subsidiary.
We recognized an initial gain of $63.2 million on the sale of the Zurich Business, which was recorded within discontinued operations in the consolidated statement of operations in fiscal year 2014. In fiscal year 2014, we also recorded $3.1 million in income from discontinued operations related to the release of the cumulative translation adjustment from deconsolidating our Swiss subsidiary and a $4.8 million loss from discontinued operations related to the interest charges incurred in connection with the settlement of the term loan (refer to Note 7, Credit Line and Notes for further details.) In fiscal year 2015, we recorded the $4.6 million release of the hold-back as a loss from discontinued operations within the consolidated statement of operations.
The following table presents the statements of operations for the discontinued operations of the Zurich Business:
Year Ended | |||||||||||
June 27, 2015 | June 28, 2014 | June 29, 2013 | |||||||||
(Thousands) | |||||||||||
Revenues | $ | — | $ | 13,896 | $ | 87,497 | |||||
Cost of revenues | 163 | 11,029 | 72,264 | ||||||||
Gross profit | (163 | ) | 2,867 | 15,233 | |||||||
Operating expenses | 484 | 3,426 | 17,456 | ||||||||
Other income (expense), net | (4,590 | ) | 61,595 | (996 | ) | ||||||
Income (loss) from discontinued operations before income taxes | (5,237 | ) | 61,036 | (3,219 | ) | ||||||
Income tax provision | — | 198 | 693 | ||||||||
Income (loss) from discontinued operations | $ | (5,237 | ) | $ | 60,838 | $ | (3,912 | ) | |||
In connection with the sale of the Zurich Business, we entered into into certain transition service and manufacturing service agreements to allow the Zurich Business to continue operations during the ownership transition. Both parties provided customary and reciprocal representations, warranties and covenants in the Share and Asset Purchase Agreement.
Sale of Thin Film Filter Business and Interleaver Product Line
On November 19, 2012, we entered into an asset purchase agreement with II-VI Incorporated, Photop Technologies, Inc. and Photop Koncent, Inc. (FuZhou), both wholly owned subsidiaries of II-VI Incorporated, pursuant to which we sold substantially all of the assets of our thin film filter business and our interleaver product line. The transactions closed on December 3, 2012.
F- 19
The total purchase price under the asset purchase agreement was $27.0 million in cash. During fiscal year 2013, we received $26.0 million in cash proceeds and the remaining $1.0 million during fiscal year 2014.
Under the asset purchase agreement, we made certain customary representations and warranties regarding our thin film filter business and interleaver product line, and we are subject to customary indemnification obligations related to pre-closing liabilities and breaches of representations, warranties and covenants. Also pursuant to the asset purchase agreement, we have agreed not to compete in the thin film filter or interleaver business for a period of five years, subject to certain limitations and exceptions.
In connection with these transactions, we transferred $0.9 million of property, plant and equipment at net book value, $0.7 million of inventory and $0.2 million of other net assets. We also incurred approximately $0.4 million in legal fees, commissions and other administrative costs related to the transactions. We recognized a gain of $24.8 million under the asset purchase agreement within restructuring, acquisition and related (income) expense, net in the consolidated statements of operations for the year ended June 29, 2013.
Acquisition of Opnext
On March 26, 2012, we entered into an Agreement and Plan of Merger and Reorganization, by and among Opnext, Tahoe Acquisition Sub, Inc., a newly formed wholly-owned subsidiary of Oclaro (Merger Sub), and Oclaro, pursuant to which we acquired Opnext through a merger of Merger Sub with and into Opnext. On July 23, 2012, we consummated the acquisition following approval by the stockholders of both companies.
As a result of the acquisition, we converted each issued and outstanding share of Opnext common stock into the right to receive 0.42 of a share of our common stock, par value $0.01 per share (and cash in lieu of fractional shares). In addition, each Opnext stock option that was outstanding and unexercised immediately prior to the acquisition was converted into an option to purchase our common stock (adjusted to give effect to the exchange ratio); and each Opnext stock appreciation right that was outstanding and that remained unsettled immediately prior to the acquisition was converted into either a stock appreciation right with respect to our common stock (adjusted to give effect to the exchange ratio) or a stock appreciation right subject to cash settlement and remained subject to the same terms and conditions of the Opnext equity plan and the applicable stock appreciation right agreement as in effect immediately prior to the acquisition.
In connection with the acquisition: (i) 91,467,739 shares of Opnext common stock were converted into the right to receive 38,416,355 shares of our common stock; (ii) outstanding options to purchase 10,119,340 shares of Opnext common stock were converted into options to purchase 4,250,011 shares of our common stock; and (iii) stock appreciation rights ("SARs") with respect to 412,123 shares of Opnext common stock were converted into SARs with respect to 172,970 shares of our common stock. Immediately following the effective time of the merger, Oclaro stockholders immediately prior to the merger owned approximately 57 percent and Opnext’s stockholders owned approximately 43 percent of the combined company. The combination is intended to qualify as a tax-free reorganization for federal income tax purposes. We accounted for this acquisition under the purchase method of accounting. The estimated fair value of assets acquired and liabilities assumed and the results of operations of Opnext from the closing date of the acquisition, July 23, 2012, are included in our consolidated financial statements at June 27, 2015 and June 28, 2014 and for the years then ended.
For accounting purposes, the fair value of the consideration paid to Opnext stockholders in the acquisition was $89.8 million; which includes the fair value of $88.7 million in common stock, based on the 38.4 million shares of common stock issued at a price of $2.31 per share, which was the closing market price of our common stock on the day the acquisition was consummated; and $1.1 million representing the fair value of vested stock options and SARs to purchase our common stock that we assumed.
Total Consideration | |||
(Thousands) | |||
Common shares issued to Opnext stockholders | $ | 88,742 | |
Estimated fair value of vested stock options assumed | 1,095 | ||
Estimated fair value of vested stock appreciation rights assumed | 5 | ||
Total consideration | $ | 89,842 | |
The total consideration given to former stockholders of Opnext has been allocated to the assets acquired and liabilities assumed based on their estimated relative fair values as of the date of the acquisition. Because of the complexities involved with performing our valuation, we initially recorded the tangible and intangible assets acquired and liabilities assumed based upon preliminary management estimates of their fair values as of July 23, 2012. During the fourth quarter of fiscal year 2013, we completed our fair value assessment of the Opnext acquisition, which resulted in changes to the estimated fair values of the
F- 20
assets acquired and liabilities assumed from the amounts we previously reported in our Quarterly Reports on Form 10-Q during fiscal year 2013.
Our final purchase price allocation, as adjusted, is as follows:
Purchase Price Allocation | |||
(Thousands) | |||
Cash and cash equivalents | $ | 36,123 | |
Restricted cash | 20,000 | ||
Accounts receivable | 55,572 | ||
Inventories | 68,011 | ||
Prepaid expenses and other current assets | 14,432 | ||
Property and equipment | 58,701 | ||
Intangible assets | 16,420 | ||
Other non-current assets | 212 | ||
Accounts payable | (68,503 | ) | |
Accrued expenses and other current liabilities | (27,081 | ) | |
Note payable | (19,133 | ) | |
Capital lease obligations | (29,003 | ) | |
Deferred tax liabilities | (2,131 | ) | |
Other non-current liabilities | (8,912 | ) | |
Estimate of the fair value of assets acquired and liabilities assumed | 114,708 | ||
Gain on bargain purchase | (24,866 | ) | |
Total purchase price | $ | 89,842 | |
The fair value of raw materials inventories were based on historical cost on a first-in first-out basis, reduced to reflect amounts related to inventory we believe will prove to be unsalable. Products may be unsalable because they are technically obsolete due to substitute products, specification changes or excess inventory relative to customer forecasts. Work in process, finished goods and spare parts were valued using the comparative sales method, which estimates the expected sales price of the subject inventory, reduced for all costs expected to be incurred in its completion (for work in process), disposition and a profit on those efforts. Work in process, finished goods and spare parts were also reduced to reflect amounts related to inventory we believe will prove to be unsalable.
The preliminary fair value of property and equipment was determined using management estimates based on currently available information and a high-level review of similar historical transactions completed by us during the previous three fiscal years. In the third and fourth quarters of fiscal year 2013, we adjusted our initial estimates by reducing the fair value of property and equipment by a total of $4.0 million based on completing our valuation. We recorded a corresponding reduction in our gain on bargain purchase as of the acquisition date and adjusted depreciation expense for all interim periods to reflect the revised fair value estimate as of the acquisition date.
During the fourth quarter of fiscal year 2013, we reduced the preliminary fair value of the capital lease obligations by $1.0 million upon completion of our valuation.
The fair value of intangible assets was based on internal assessments using the “income approach,” which requires an estimate or forecast of all the expected future cash flows through the application of the multi-period excess earnings method, relief-from-royalty method or other acceptable methods. During the fourth quarter of fiscal year 2013, we completed our valuation and identified the following significant intangible assets: $8.7 million of developed technology with an estimated weighted average useful life of 6 years, $0.2 million of contract backlog with an estimated weighted average useful life of 1 year, $4.9 million of customer relationships with an estimated weighted average useful life of 11 years, and $2.7 million of trademarks and other with an estimated weighted average useful life of 6 years.
Any excess of the fair value of assets acquired and liabilities assumed over the aggregate consideration given for such acquisition results in a gain on bargain purchase. In the first quarter of fiscal year 2013, we initially recorded a gain on bargain purchase of $39.5 million in connection with the acquisition of Opnext, which was subsequently adjusted to $24.9 million in
F- 21
the fourth quarter of fiscal year 2013, upon completing our purchase price allocation and finalizing our fair value estimates of assets acquired and liabilities assumed.
The bargain purchase gain of $24.9 million results from the difference between the fair value of consideration given and our estimate of the fair value of assets acquired and liabilities assumed. The consideration given for Opnext consisted of a fixed number of our shares for each Opnext Share (0.42 for one), which was agreed upon on March 26, 2012. On that date, the closing price of our common stock was $4.66. At the consummation of the merger on July 23, 2012, the closing price of our common stock was $2.31. This share price, multiplied by the fixed number of our shares outstanding at the merger, and including the fair value of vested stock awards assumed by us, resulted in the fair value of consideration given being $89.8 million, less than the estimate of the fair market value of the net assets acquired and liabilities assumed of $114.7 million.
Upon the close of the acquisition, the combined company implemented significant workforce restructuring actions. Among other things, we combined our global sales, finance, legal and human resources operations. We also realigned our global operations and business units under a single management structure. Our newly combined global organizations provide services for both the pre-acquisition Oclaro and former Opnext products. We have also reduced redundant product offerings by eliminating selected products from each predecessor company and transitioned existing customers for such products to the other company’s current offering. In addition, we have merged our research and development efforts along product families, so many of our new product introductions going forward will benefit from both Oclaro and Opnext technology. For these reasons, we believe it would be impracticable to allocate revenues going forward to one predecessor entity or the other and to separately disclose revenues and earnings of Opnext since the acquisition date.
Acquisition of Mintera
On July 21, 2010, we acquired Mintera, a privately-held company providing high-performance optical transport sub-systems solutions. Under the terms of this agreement, we paid $10.5 million in cash to the former security holders and creditors of Mintera at the time of close and assumed $1.5 million in liabilities due by the security holders of Mintera, which we paid during fiscal year 2011. We also agreed to pay additional revenue-based consideration whereby former security holders of Mintera were entitled to receive up to $20.0 million. The earnout consideration was payable in cash or, at our option, newly issued shares of our common stock, or a combination of cash and stock. During fiscal year 2012, we settled the 12 month earnout obligation with the former security holders by paying them $0.5 million in cash and issuing 0.8 million shares of our common stock valued at $2.8 million, and also settled a portion of the 18 month earnout obligation with the former security holders by paying them $2.2 million in cash. The remaining 18 month earnout obligation of $8.6 million was settled in fiscal year 2013.
For accounting purposes, the total fair value of consideration given in connection with the acquisition of Mintera was $25.6 million, We recorded goodwill of $10.9 million in connection with the acquisition. In fiscal year 2013, we determined the goodwill related to this acquisition was impaired. Refer to Note 4, Goodwill and Other Intangible Assets for more information on the impairment of the goodwill.
NOTE 4. GOODWILL AND OTHER INTANGIBLE ASSETS
Additions and Dispositions
In connection with our sale of the Komoro Business, we transferred certain of our other intangible assets with a book value of $4.4 million to Ushio Opto during fiscal year 2015.
In connection with our sale of the Zurich Business, we transferred certain of our other intangible assets to II-VI. As of September 12, 2013, the date of the sale, these other intangible assets had no carrying value. For the year ended June 29, 2013, we recorded $0.3 million in amortization related to these intangible assets, which has been reclassified to discontinued operations in the consolidated statements of operations.
In connection with our acquisition of Opnext on July 23, 2012, we recorded $16.4 million in other intangible assets as our estimate of the fair value of acquired intangible assets. The intangible assets acquired from Opnext consist of $8.7 million of developed technology with an estimated weighted average useful life of 6 years, $0.2 million of contract backlog with an estimated weighted average useful life of 1 year, $4.9 million of customer relationships with an estimated weighted average useful life of 11 years, and $2.7 million of trademarks and other with an estimated weighted average useful life of 6 years.
In connection with our acquisition of Mintera on July 21, 2010, we recorded $10.9 million in goodwill and $11.7 million in other intangible assets. The other intangible assets acquired from Mintera consist of core and current technology assets of $6.0 million with a weighted-average life of 6 years, a development agreement of $3.4 million with a weighted-average life of 7 years, customer relationships of $1.4 million with a weighted-average life of 8.5 years, manufacturing software of $0.7 million with a weighted-average life of 6 years, patents of $0.1 million with a weighted-average life of 5.5 years, trade names of $0.1 million with a weighted-average life of 1.5 years and backlog of $30,000 with a weighted-average life of 1.5 years.
F- 22
Impairment Assessments
During the fourth quarter of fiscal year 2014 and 2015, we reviewed our other intangible assets for impairment. We compared their carrying amounts to market prices or the future undiscounted cash flows the assets are expected to generate. We determined that the carrying value of the assets did not exceed the fair value based on market prices or future discounted cash flows. We did not record any impairment charges related to our other intangibles in fiscal year 2014 or 2015.
During the fourth quarter of fiscal year 2013, we performed an annual analysis for potential impairment of our goodwill, which included examining the impact of current general economic conditions on our future prospects, the decline in our market capitalization, and the anticipated resizing of our operations with the recent sale of certain of our products and/or businesses. The first step of testing goodwill for impairment is based on a reporting unit’s “fair value,” which is generally determined through market prices. In certain cases, due to the absence of market prices for a particular element of our business, we have elected to base our analysis on discounted future expected cash flows. Based on this analysis, we concluded that our remaining goodwill on our consolidated balance sheet, which related to our acquisition of Mintera, was impaired. We performed a second step impairment analysis, which indicated that the goodwill in connection with the Mintera reporting unit was fully impaired. Based upon this evaluation, we recorded $10.9 million for the goodwill impairment loss in our consolidated statement of operations for the year ended June 29, 2013. The impairment did not result in any cash expenditures. In connection with our second step goodwill impairment analysis, we also evaluated the fair value of our other intangible assets in this reporting unit, and our other reporting units, and concluded that based on declines in our forecasts, our decision to sell or abandon certain product lines and other factors, certain of these other intangible assets were also impaired as of June 29, 2013. We recorded impairment losses of $6.4 million related to intangibles acquired in connection with our acquisition of Mintera, $2.6 million related to intangibles acquired in connection with our acquisition of Opnext, and $5.2 million related to intangibles acquired in connection with other earlier acquisitions.
During fiscal year 2013, we also determined that a portion of the technology we acquired in connection with our acquisition of Mintera in July 2010 was considered redundant, following the acquisition of Opnext and its product lines. We recorded $0.9 million for the impairment loss related to these other intangible assets in our consolidated statement of operations for the year ended June 29, 2013.
Amortization
Amortization of other intangible assets for the fiscal years ended June 27, 2015, June 28, 2014 and June 29, 2013, was $1.1 million, $1.7 million and $5.0 million, respectively. Amortization is recorded as an operating expense within the consolidated statements of operations.
In the fourth quarter of fiscal year 2015, we revised the estimated useful lives of certain of our other intangible assets related to our integrated photonics product line to adjust for the shorter time period in which we expect to benefit from these other intangible assets.
Estimated future amortization expense of other intangible assets is as follows, based on the current level of our other intangible assets as of June 27, 2015:
Estimated Future Amortization | |||
(Thousands) | |||
Fiscal Year: | |||
2016 | $ | 1,014 | |
2017 | 834 | ||
2018 | 649 | ||
2019 | 82 | ||
2020 | — | ||
Thereafter | — | ||
$ | 2,579 | ||
F- 23
Activity Related to Goodwill and Other Intangible Assets
The following table provides details regarding the changes in our goodwill for each of the three years then ended:
Total | |||
(Thousands) | |||
Balance at June 30, 2012 | $ | 10,904 | |
Impairment | (10,904 | ) | |
Balance at June 29, 2013, June 28, 2014 and June 27, 2015 | — | ||
The following table summarizes the activity related to our other intangible assets for fiscal years ended June 27, 2015, June 28, 2014 and June 29, 2013:
Core and Current Technology | Development and Supply Agreements | Customer Relationships | Patent Portfolio | Other Intangibles | Amortization | Total | |||||||||||||||||||||
(Thousands) | |||||||||||||||||||||||||||
Balance at June 30, 2012 | $ | 10,238 | $ | 6,520 | $ | 2,807 | $ | 2,910 | $ | 965 | $ | (7,071 | ) | $ | 16,369 | ||||||||||||
Additions | 8,700 | — | 4,860 | — | 2,860 | — | 16,420 | ||||||||||||||||||||
Amortization | — | — | — | — | — | (5,029 | ) | (5,029 | ) | ||||||||||||||||||
Impairment | (9,119 | ) | (1,954 | ) | (1,568 | ) | (1,995 | ) | (475 | ) | — | (15,111 | ) | ||||||||||||||
Translations and adjustments | (1,486 | ) | (10 | ) | (901 | ) | — | (12 | ) | (7 | ) | (2,416 | ) | ||||||||||||||
Balance at June 29, 2013 | $ | 8,333 | $ | 4,556 | $ | 5,198 | $ | 915 | $ | 3,338 | $ | (12,107 | ) | $ | 10,233 | ||||||||||||
Amortization | — | — | — | — | — | (1,680 | ) | (1,680 | ) | ||||||||||||||||||
Translations and adjustments | (66 | ) | 104 | (55 | ) | — | — | — | (17 | ) | |||||||||||||||||
Balance at June 28, 2014 | $ | 8,267 | $ | 4,660 | $ | 5,143 | $ | 915 | $ | 3,338 | $ | (13,787 | ) | $ | 8,536 | ||||||||||||
Sale of Komoro Business | (1,904 | ) | — | (2,545 | ) | — | — | — | (4,449 | ) | |||||||||||||||||
Amortization | — | — | — | — | — | (1,133 | ) | (1,133 | ) | ||||||||||||||||||
Translations and adjustments | (114 | ) | (65 | ) | (196 | ) | — | — | — | (375 | ) | ||||||||||||||||
Balance at June 27, 2015 | $ | 6,249 | $ | 4,595 | $ | 2,402 | $ | 915 | $ | 3,338 | $ | (14,920 | ) | $ | 2,579 | ||||||||||||
During fiscal year 2013, the Japanese yen declined in value relative to the U.S. dollar by approximately 20 percent, thus reducing the value of our Japanese yen denominated intangible assets, acquired in connection with our acquisition of Opnext, by approximately $2.4 million at June 29, 2013.
NOTE 5. RESTRUCTURING LIABILITIES
For all periods presented, separation payments under the restructuring and cost reduction efforts were accrued and charged to restructuring in the period that the amounts were both determined and communicated to the affected employees.
2014 Restructuring Plan
During the first quarter of fiscal year 2014, we initiated a restructuring plan to simplify our operating footprint, reduce our cost structure and focus our research and development investment in the optical communications market where we can leverage our core competencies. During the year ended June 27, 2015 and June 28, 2014, we recorded restructuring charges of $4.0 million and $13.2 million, respectively, pursuant to this plan. The restructuring charges for the year ended June 27, 2015 consisted of $4.1 million related to workforce reductions and a $0.1 million reversal of restructuring charges related to revised estimates for lease cancellations and commitments. The restructuring charges for the year ended June 28, 2014 consisted of $8.5 million related to workforce reductions, $2.9 million related to transferring production capabilities of our 10 Gb/s InP products in-house from one of our contract manufacturers, $0.8 million related to a facility lease loss liability, $0.7 million related to the write-off of certain fixed assets in connection with our relocation of our manufacturing and research and development facilities from Totsuka, Japan, and $0.3 million in other lease cancellations and commitments.
F- 24
During the year ended June 27, 2015 and June 28, 2014, we paid $5.3 million and $8.5 million, respectively, to settle a portion of these restructuring liabilities.
As of June 27, 2015, we had $0.7 million in accrued restructuring liabilities related to this restructuring plan. We do not expect to incur any additional restructuring charges in connection with this restructuring plan.
Opnext Restructuring
In connection with the acquisition of Opnext, we initiated a restructuring plan to integrate the businesses in the first quarter of fiscal year 2013. We completed the restructuring activities related to the integration in fiscal year 2014. In connection with the integration, we recorded $1.1 million and $12.1 million in restructuring charges during the year ended June 28, 2014 and June 29, 2013, respectively. The restructuring charges in fiscal year 2014 included $0.9 million related to external consulting charges and professional fees associated with reorganizing the infrastructure and $0.1 million related to revised estimates for lease cancellations and commitments. The restructuring charges in fiscal year 2013 included $10.5 million related to workforce reductions, $0.9 million related to the impairment of certain technology that is now considered redundant following the acquisition, $0.4 million related to the write-off of net book value inventory that supported this technology, and $0.3 million related to revised estimates for lease cancellations and commitments. Included in our restructuring charges during fiscal year 2013, we recorded $2.2 million relating to the separation agreement with our former Chief Executive Officer.
During the year ended June 28, 2014 and June 29, 2013, we made scheduled payments of $2.2 million and $8.0 million, respectively, to settle these restructuring liabilities. During the year ended June 28, 2014 and June 29, 2013, we also paid $1.8 million and $0.3 million, respectively, to settle the liability related to the separation agreement with our former Chief Executive Officer.
As of June 27, 2015 and June 28, 2014, we had no remaining accrued restructuring liabilities related to this restructuring plan.
Restructuring Plan related to our Manufacturing Operations in Shenzhen, China
During fiscal year 2012, we initiated a restructuring plan in connection with the transfer of a portion of our Shenzhen, China manufacturing operations to Venture Corporation Limited ("Venture"). This transition occurred in a phased and gradual transfer of certain products and was completed in fiscal year 2015. In connection with this transition, we recorded restructuring charges of $2.5 million, $3.5 million and $5.1 million during the year ended June 27, 2015, June 28, 2014 and June 29, 2013, respectively. The restructuring charges in fiscal year 2015, 2014 and 2013 related primarily to employee separation charges.
During fiscal year 2015, 2014 and 2013, we made scheduled payments of $3.1 million, $7.1 million and $2.7 million, respectively, to settle these restructuring liabilities.
As of June 27, 2015, we had no remaining accrued restructuring liabilities related to this restructuring plan.
F- 25
Activity Related to Restructuring Liabilities
The following table summarizes the activity related to our restructuring liability for the years ended June 27, 2015, June 28, 2014 and June 29, 2013:
Lease Cancellations, Commitments and Other Charges | Termination Payments to Employees and Related Costs | Total Accrued Restructuring Charges | |||||||||
(Thousands) | |||||||||||
Balance at June 30, 2012 | $ | — | $ | 2,306 | $ | 2,306 | |||||
Charged to restructuring costs | 1,555 | 15,619 | 17,174 | ||||||||
Paid or written off | (1,325 | ) | (10,612 | ) | (11,937 | ) | |||||
Adjustments | — | (277 | ) | (277 | ) | ||||||
Balance at June 29, 2013 | 230 | 7,036 | 7,266 | ||||||||
Charged to restructuring costs | 4,794 | 12,914 | 17,708 | ||||||||
Paid or written off | (3,125 | ) | (19,047 | ) | (22,172 | ) | |||||
Adjustments | (18 | ) | 59 | 41 | |||||||
Balance at June 28, 2014 | 1,881 | 962 | 2,843 | ||||||||
Charged to restructuring costs | (36 | ) | 6,552 | 6,516 | |||||||
Paid or written off | (1,404 | ) | (7,030 | ) | (8,434 | ) | |||||
Adjustments | (213 | ) | — | (213 | ) | ||||||
Balance at June 27, 2015 | $ | 228 | $ | 484 | $ | 712 | |||||
Current portion | 228 | 484 | 712 | ||||||||
Non-current portion | — | — | — | ||||||||
NOTE 6. FLOOD-RELATED (INCOME) EXPENSE, NET
In October 2011, certain areas in Thailand suffered major flooding as a result of monsoons. This flooding had a material impact on our business and results of operations. Our primary contract manufacturer, Fabrinet, suspended operations at two factories located in Chokchai, Thailand and Pinehurst, Thailand. The Chokchai factory suffered extensive flood damage and became inaccessible due to high water levels inside and surrounding the manufacturing facility. As a result of this flooding, we experienced a significant decline in product sales due to our inability or limited ability to manufacture certain of our products and we incurred significant damage to our inventory and property and equipment located at the Chokchai facility.
During the year ended June 28, 2014, we recorded $1.8 million in net flood-related income in our consolidated statement of operations, primarily consisting of $3.7 million in insurance settlement proceeds received in fiscal year 2014 and adjustments to retainers for professional services of $0.1 million, partially offset by an out-of-period adjustment of $2.0 million related to the impairment of leased assets assumed pursuant to the Opnext merger that had been damaged by the flooding. Approximately $1.5 million of the $3.7 million received in fiscal year 2014 represents payments against insurance claims filed under the former Opnext entity.
During the year ended June 29, 2013, we recorded net flood-related income of $29.5 million comprised of $30.8 million in settlement payments, offset in part by $1.3 million in professional fees and related expenses incurred in connection with our recovery efforts. Approximately $14.0 million of the $30.8 million received in fiscal year 2013 represents payments against insurance claims filed under the former Opnext entity.
The flood-related benefits and charges are recorded within the operating expense caption flood-related (income) expense, net in our consolidated statements of operations.
F- 26
Flood-related (income) expense, net for the year ended June 27, 2015, June 28, 2014 and June 29, 2013 included the following:
Year Ended | |||||||||||
June 27, 2015 | June 28, 2014 | June 29, 2013 | |||||||||
(Thousands) | |||||||||||
Write-off of net book value of damaged property and equipment | $ | — | $ | 2,009 | $ | — | |||||
Personnel-related costs, professional fees and related expenses | — | (143 | ) | 1,287 | |||||||
Settlement payments | — | (3,663 | ) | (30,797 | ) | ||||||
$ | — | $ | (1,797 | ) | $ | (29,510 | ) | ||||
While we maintain both property and business interruption insurance coverage, there can be no assurance as to the amount or timing of future insurance recoveries. Insurance recoveries related to impairment losses previously recorded and other recoverable expenses will be recognized to the extent of the related loss or expense in the period that recoveries become probable and realizable. Insurance recoveries under business interruption coverage and insurance recovery gains in excess of amounts previously written-off related to impaired inventory and equipment or in excess of other recoverable expenses previously recognized will be recognized when they become realizable and all contingencies have been resolved. The evaluation of insurance recoveries requires estimates and judgments about future results which affect reported amounts and certain disclosures. Actual results could differ from those estimates. We do not expect any future flood-related insurance recoveries related to this incident.
NOTE 7. CREDIT LINE AND NOTES
6.00% Convertible Senior Notes due 2020 ("6.00% Notes")
On February 12, 2015, we entered into a Purchase Agreement (the “Purchase Agreement”), with Jefferies LLC (the “Initial Purchaser”), pursuant to which we agreed to issue and sell to the Initial Purchaser up to $65.0 million in aggregate principal Convertible Senior Notes due 2020 (the “6.00% Notes”). On February 19, 2015, we closed the private placement of $65.0 million aggregate principal amount of the 6.00% Notes. The 6.00% Notes were sold at 100 percent of par, resulting in net proceeds of approximately $61.6 million, after deducting the Initial Purchaser’s discounts of $3.4 million. We also incurred offering expenses of $0.6 million. The net proceeds of this offering will be used for general corporate purposes, including working capital for, among other things, investing in development of new products and technologies. The initial exchange price was $1.95 per share of common stock.
The 6.00% Notes will mature on February 15, 2020 and will bear interest at a fixed rate of 6.00 percent per year, payable semi-annually in arrears on February 15 and August 15 of each year, beginning on August 15, 2015. During the year ended June 27, 2015, we recorded $1.4 million in interest expense related to these 6.00% Notes.
The Purchase Agreement contains customary representations and warranties of the parties and indemnification and contribution provisions under which we, on the one hand, and the Initial Purchaser, on the other, have agreed to indemnify each other against certain liabilities, including liabilities under the Securities Act of 1933, as amended (the “Securities Act”).
The 6.00% Notes are governed by an Indenture, dated February 19, 2015 (the “Indenture”), entered into between us and U.S. Bank National Association, as trustee (the “Trustee”). The Indenture contains affirmative and negative covenants that, among other things, limits our ability to incur, assume or guarantee additional indebtedness; create liens; sell or otherwise dispose of substantially all of our assets; and enter into mergers and consolidations. The Indenture also contains customary events of default. Upon the occurrence of certain events of default, the Trustee or the holders of the 6.00% Notes may declare all outstanding 6.00% Notes to be due and payable immediately.
Prior to February 15, 2018, in the event that the last reported sale price of our common stock for 20 or more trading days (whether or not consecutive) in a period of 30 consecutive trading days ending within five trading days immediately prior to the date we receive a notice of conversion exceeds the conversion price in effect on each such trading day, we will, in addition to delivering shares upon conversion by the holder of 6.00% Notes, together with cash in lieu of fractional shares, make an interest make-whole payment in cash equal to the sum of the remaining scheduled payments of interest on the 6.00% Notes to be converted through February 15, 2018.
Any holder that converts its 6.00% Notes in connection with a make-whole fundamental change, as defined in the Indenture, will not receive the interest make-whole payment but will instead receive the additional shares set forth in the Indenture.
Prior to February 15, 2018, we may not redeem the 6.00% Notes. On or after February 15, 2018, we may redeem for cash all of the 6.00% Notes if the last reported sale price per share of our common stock has been at least 130 percent of the conversion price then in effect for at least 20 trading days (whether or not consecutive) during any 30 consecutive trading-day period ending within five trading days prior to the date on which we provide notice of redemption. The redemption price will equal (i) 100 percent of the principal amount of the Notes being redeemed, plus (ii) accrued and unpaid interest, including additional
F- 27
interest, if any, to, but excluding, the redemption date plus (iii) the sum of the present values of each of the remaining scheduled payments of interest that would have been made on the 6.00% Notes to be redeemed had such 6.00% Notes remained outstanding from the redemption date to the maturity date (excluding interest accrued to, but excluding, the redemption date that is otherwise paid pursuant to the immediately preceding clause (ii)).
Upon the occurrence of a fundamental change, subject to certain conditions, each holder of the 6.00% Notes will have the option to require that we purchase all or a portion of such holder’s Notes in cash at a purchase price equal to 100 percent of the principal amount of the 6.00% Notes to be purchased plus any accrued and unpaid interest, including additional interest, if any, to, but excluding, the fundamental change purchase date.
Our contingent obligation to make a make-whole payment in the event of an early conversion by the holders of the 6.00% Notes, or at our election to redeem the 6.00% Notes for cash, are both considered embedded derivatives. As of February 19, 2015, the date of the debt issuance, and as of June 27, 2015, the fair value of the embedded derivatives is estimated at zero. The estimated fair value of the embedded derivatives was determined by using a binomial lattice approach to determine the probability and timing of a conversion or redemption.
On February 19, 2015, we also entered into a Registration Rights Agreement (the “Registration Rights Agreement”) with the Initial Purchaser to provide the holders of the 6.00% Notes with registration rights with respect to shares of common stock that have been issued upon conversion of the 6.00% Notes and are then outstanding, but only if Rule 144 under the Securities Act is unavailable to holders of the 6.00% Notes who are not affiliates of ours on and following the date that is six months after the original issuance date of the 6.00% Notes.
On February 19, 2015, we entered into a Consent and First Loan Modification Agreement (the “Amendment”) with Silicon Valley Bank (“SVB”). The Amendment modifies the Loan and Security Agreement, dated as of March 28, 2014, by and among us, Oclaro Technology Limited and SVB to allow the cash payments provided for in the Indenture and the 6.00% Notes and include the 6.00% Notes as permitted indebtedness.
The following table sets forth balance sheet information related to the 6.00% Notes at June 27, 2015:
June 27, 2015 | ||||
(Thousands) | ||||
Principal value of the liability component | $ | 65,000 | ||
Unamortized value of the debt discount and issuance costs | (3,754 | ) | ||
Net carrying value of the liability component | $ | 61,246 | ||
At June 27, 2015, the $3.2 million debt discount and the $0.6 million issuance costs are recorded in convertible notes payable within the consolidated balance sheet.
Silicon Valley Bank Credit Facility
On March 28, 2014, Oclaro, Inc. and its subsidiary, Oclaro Technology Limited (the “Borrower”), entered into a loan and security agreement (the “Loan Agreement”) with Silicon Valley Bank (the “Bank”) pursuant to which the Bank provided the Borrower with a three-year revolving credit facility of up to $40.0 million. Under the Loan Agreement, advances are available based on up to 80 percent of “eligible accounts” as defined in the Loan Agreement. The Loan Agreement has a $10.0 million sub-facility for letters of credit, foreign exchange contracts and cash management services.
The obligations of the Borrower under the Loan Agreement are guaranteed by us and certain subsidiaries of ours (collectively, the “Guarantors”) pursuant to an Unconditional Guaranty in favor of the Bank (the “Guaranty”), and are secured by substantially all of the assets of the Borrower and the Guarantors, including a pledge of the capital stock holdings of the Borrower and the Guarantors in their direct subsidiaries.
Borrowings made under the Loan Agreement bear interest at a rate based on either the London Interbank Offered Rate plus 2.25 percent or Wall Street Journal’s prime rate plus 1.00 percent. If the sum of (a) the Borrower’s unrestricted cash and cash equivalents that are subject to the Bank’s liens less (b) the amount outstanding to the Bank under the Loan Agreement (such sum being “Net Cash”) is less than $15.0 million, then the interest rates are increased by 0.75 percent until Net Cash exceeds $15.0 million for a calendar month. If interest paid under the Loan Agreement is less than $45,000 in any fiscal quarter, the Borrower is required to pay the Bank an additional amount equal to the difference between $45,000 and the actual interest paid during such fiscal quarter. The minimum interest payment is in lieu of a stand-by charge.
F- 28
The obligations of the Borrower under the Loan Agreement may be accelerated, and the Guarantors may become obligated under the Guaranty, upon the occurrence of an event of default under the Loan Agreement. The Loan Agreement includes customary events of default. Upon the occurrence and during the continuance of an event of default, obligations shall bear interest at a rate per annum which is 2 percentage points above the rate that is otherwise applicable thereto, unless the Bank elects otherwise, in its sole discretion.
The Loan Agreement contains covenants applicable to us, the Borrower and our subsidiaries, including a financial covenant that, on a consolidated basis, requires us to maintain a minimum fixed charge coverage ratio of no less than 1.10 to 1.00, if the Borrower has not maintained Net Cash of at least $15.0 million, and other customary covenants. The Loan Agreement also contains restrictions on our ability to pay cash dividends on our common stock.
If the Loan Agreement terminates prior to its maturity date, the Borrower will pay a termination fee equal to 1.00 percent of the total credit facility if such termination occurs in the first year after closing, 0.75 percent of the total credit facility if such termination occurs in the second year after closing and 0.50 percent of the total credit facility if such termination occurs in the third year after closing. The maturity date of the Loan Agreement is March 28, 2017.
At June 27, 2015, there were no amounts outstanding under the Loan Agreement.
Wells Fargo Credit Line and Term Loan
On August 2, 2006, Oclaro, Inc., as the (“Parent”), along with Oclaro Technology Limited, (“Borrower”), Oclaro Photonics, Inc. and Oclaro Technology, Inc., each a wholly-owned subsidiary, entered into a Credit Agreement with Wells Fargo Capital Finance, Inc. ("Wells Fargo") and certain other lenders.
From time to time, we amended and restated the Credit Agreement, before terminating the agreement on March 14, 2014.
• | On November 2, 2012, Borrower and the Parent entered into a Second Amended and Restated Credit Agreement with Wells Fargo and the other lenders regarding the senior secured revolving credit facility, increasing the facility size from $45.0 million to $50.0 million and extending the term thereof to November 2, 2017. |
• | On January 23, 2013, Silicon Valley Bank ("SVB") and Wells Fargo ("Agent"), collectively the Lenders, entered into a Joinder Agreement (the "Joinder Agreement") pursuant to the Second Amended and Restated Credit Agreement among Parent, Borrower, the Lenders and the Agent, as administrative agent for the Lenders. Pursuant to the Joinder Agreement, SVB agreed to become an additional Lender under the Second Amended and Restated Credit Agreement, and the Lenders agreed to increase the revolving credit facility under the Credit Agreement from $50.0 million to $80.0 million. In connection with the Joinder Agreement, the Parent paid SVB a lender fee of $0.2 million. |
• | On January 23, 2013, Parent, Borrower, the Lenders and the Agent entered into Amendment Number One to the Credit Agreement and the associated security agreements (the "Amendment"), pursuant to which the parties agreed that (i) the senior secured second lien notes due 2018 issued by Oclaro Luxembourg S.A. in the original principal amount of $25.0 million shall be applied against the maximum dollar limit of senior unsecured convertible notes that Parent may issue without the consent of Agent, and (ii) the cash balances of Opnext, Pine Photonics Communications, Inc., and Opnext Subsystems Inc. would be subject to a required sweep to the Agent’s account upon the occurrence of certain triggering events. Under the Credit Agreement advances are available based on up to 85 percent of “eligible accounts receivable,” as defined in the Credit Agreement. |
• | On May 6, 2013, Parent, Borrower, the Lenders, the Agent and PECM Strategic Funding LP and Providence TMT Debt Opportunity Fund II LP (the “Term Lenders”) entered into Amendment Number Two to the Credit Agreement and the associated guaranties and security agreements (“Amendment Number Two”), which amended the Credit Agreement in pertinent part by: (i) adding a $25 million, one year term loan (the “Term Loan”) to be provided by the Term Lenders; (ii) reducing the revolving credit facility from $80.0 million to $50.0 million (to be further reduced on a dollar-for-dollar basis by an amount equal to the net proceeds of certain asset sale transactions that the Parent may undertake in the future), eliminating the Borrower’s option to increase the revolving credit facility to $100.0 million and implementing an availability block under the revolving credit facility of at least $10.0 million; (iii) removing the financial covenants so that Borrower is not required to maintain a minimum of $15.0 million of availability under the revolving credit facility or $15.0 million in qualified cash balances; (iv) adding an affirmative covenant that Borrower shall have consummated one or more asset sales by July 15, 2013 and with a minimum threshold of net proceeds as set forth in the Amendment, and (v) providing for payments and proceeds of asset sales to be applied to repay the credit facility and the Term Loan (with the first $20.0 million of such proceeds being applied to repay Wells Fargo and SVB, the next $25.0 million being applied to repay the Term Lenders and the remaining proceeds being used to repay Wells Fargo and SVB all amounts outstanding under the credit facility), and events of default relating thereto. During a |
F- 29
continuing event of default, the Agent or Lenders can declare any amounts outstanding under the Credit Agreement immediately due and payable.
Interest on the Term Loan obligations accrued at a per annum rate equal to the sum of: (i) the PIK Term Loan Interest Rate, with such accrued interest to be capitalized quarterly and added to the outstanding principal balance of the Term Loan, and (b) the Cash Term Loan Interest Rate. The PIK Term Loan Interest Rate is 2.0 percent beginning on the effective date of the Term Loan (the “Effective Date”) up to but excluding the date six months thereafter, then it is 4.0 percent until the date twelve months after the Effective Date and then it is 5.0 percent. The Cash Term Loan Interest Rate is 7.0 percent beginning on the Effective Date up to but excluding the date six months thereafter, then it is 8.5 percent until the date twelve months after the Effective Date and then it is 10.0 percent.
In connection with Amendment Number Two, the Borrower paid the revolving lenders an amendment fee of $0.5 million and the Term Lenders a closing fee of $2.1 million. These costs were capitalized and scheduled to be amortized straight-line to expense over the one year term of the loan. In connection with the Term Loan, we also issued certain warrants. The Term Lenders exercised these warrants in May 2014, which is more fully discussed in Note 10, Stockholders’ Equity.
• | On August 21, 2013, Parent, Borrower, the Lenders and the Agent entered into Waiver and Amendment Number Three to the Credit Agreement, which amended the Credit Agreement in pertinent part by: (i) extending the date by which the Borrower shall have consummated one or more asset sales with a minimum threshold of net proceeds to September 2, 2013; (ii) eliminating the mandatory reduction of the revolving credit facility upon the consummation of the asset sales described in (i) above; and (iii) adding a covenant that the Borrower is required to maintain a minimum liquidity of at least $45.0 million at all times (liquidity being the sum of the Borrower’s excess availability under the revolving credit facility plus the lesser of $25.0 million and qualified cash balances). The Borrower paid the lenders an amendment fee of $0.7 million. |
Under the Credit Agreement, as amended, we were required to complete certain asset sales on or by September 2, 2013. We completed the sale of the Zurich Business on September 12, 2013 and applied the net proceeds to repay all amounts outstanding under the Credit Agreement. The event of default resulting from not completing the transaction on September 2, 2013 was waived on September 26, 2013. This waiver eliminated the requirement for the Agent and Lenders to make any advances, issue any letters of credit or provide any other extension of credit until the Agent and Lenders agree otherwise and prevented us from exercising any right or action set forth in the applicable loan documents that is conditioned on the absence of any event of default.
•On March 14, 2014, we terminated the Credit Agreement.
Borrowings made under the Credit Agreement bore interest at a rate based on either the London Interbank Offered Rate plus 2.50 percentage points or the bank’s prime rate plus 1.25 percentage points. During fiscal year 2014 and 2013, we made interest payments of $0.3 million and $1.2 million, respectively, in connection with the Credit Agreement.
At June 28, 2014, there were no amounts outstanding under the Credit Agreement or the Term Loan. All amounts owed under the Credit Agreement and Term Loan were repaid during fiscal year 2014. During the year ended June 28, 2014, we recorded the remaining unamortized debt discount and issuance costs of $4.8 million related to the Term Loan in discontinued operations within the consolidated statement of operations.
7.50% Exchangeable Senior Secured Second Lien Notes ("7.50% Notes")
On December 14, 2012, we and our indirect, wholly owned subsidiary, Oclaro Luxembourg S.A., closed the private placement of $25.0 million aggregate principal amount 7.50% Exchangeable Senior Secured Second Lien Notes due 2018 ("7.50% Notes"). The sale of the 7.50% Notes resulted in net proceeds of approximately $22.8 million. The private placement was completed pursuant to a purchase agreement, dated December 14, 2012 entered into by us, certain of our domestic and foreign subsidiaries (the "Guarantors") and Morgan Stanley & Co. LLC. The 7.50% Notes are governed by an Indenture, entered into by us and the Guarantors with Wells Fargo Bank, National Association, as trustee and second lien collateral agent (the "Trustee"). The Indenture contained affirmative and negative covenants that, among other things, limited the ability of us and the Guarantors to incur, assume or guarantee additional indebtedness; make restricted payments including, without limitation, paying dividends, repurchasing capital stock and redeeming debt that is junior in right of payment to the convertible notes; create liens; sell or otherwise dispose of assets, including capital stock of subsidiaries; and enter into mergers and consolidations. The Indenture also contained customary events of default. Upon the occurrence of certain events of default, the Trustee or the holders of the 7.50% Notes may declare all outstanding convertible notes to be due and payable immediately. The 7.50% Notes are unconditionally guaranteed, jointly and severally, on a senior secured basis by us and all of the Guarantors.
F- 30
Under the terms of the 7.50% Notes, on or after December 15, 2013, in the event that the last reported sale price of our common stock for 20 or more trading days (whether or not consecutive) in a period of 30 consecutive trading days ending within five trading days immediately prior to the date that we receive a notice of exchange exceeded the exchange price in effect on each such trading day, we were obliged, in addition to delivering shares upon exchange by the holder of convertible notes, together with cash in lieu of fractional shares, to make a “make-whole premium” payment in cash equal to the sum of the present value of the remaining scheduled payments of interest on the convertible notes to be exchanged through the maturity date computed using a discount rate equal to 0.50 percent. The initial exchange price was $1.846 per share of common stock. Any holder that exchanged its 7.50% Notes after such holder’s convertible notes had been called for redemption by us would, in addition to receiving shares of common stock deliverable upon such exchange and cash in lieu of fractional shares, receive a payment (the “redemption exchange make-whole payment”) in cash equal to the sum of the remaining scheduled payments of interest that would have been made on the 7.50% Notes to be exchanged had such 7.50% Notes remained outstanding from the applicable exchange date to the maturity date. If the redemption exchange make-whole payment is payable upon exchange of a holder’s 7.50% Notes, then such holder would not receive the “make-whole premium” payment described above.
We considered the contingent obligation of having to make a make-whole payment in the event of an early conversion by the holders of the 7.50% Notes as an embedded derivative. On December 19, 2013, the holders exercised their rights to exchange the 7.50% Notes for our common stock. The exchange rate for the exchanges was 541.7118 shares of common stock per $1,000 in principal amount of 7.50% Notes. We issued 13,542,791 shares of common stock in connection with the exchange, with cash payable in lieu of fractional shares. In addition, pursuant to the terms of the indenture governing the 7.50% Notes, we made a redemption exchange make-whole payment of $8.3 million, which we recorded in interest (income) expense, net, in the consolidated statements of operations for the year ended June 28, 2014.
During the year ended June 28, 2014 and June 29, 2013, we recorded and paid $0.9 million and $0.9 million, respectively, in routine interest payments related to these 7.50% Notes. Interest on the 7.50% Notes was payable semi-annually in arrears on June 15 and December 15 of each year, beginning on June 15, 2013.
In connection with the private placement of the 7.50% Notes, we incurred approximately $1.3 million in debt discount and $0.9 million in issuance costs. Upon exchange of the 7.50% Notes during fiscal year 2014, we recorded the remaining unamortized debt discount and issuance costs of $1.8 million in additional paid-in capital within the consolidated balance sheet.
NOTE 8. POST-RETIREMENT BENEFITS
401(k) Plan
In the U.S., we sponsor a 401(k) plan that allows voluntary contributions by eligible employees, who may elect to contribute up to the maximum allowed under the U.S. Internal Revenue Service regulations. We generally make 100 percent matching contributions on the first 3 percent and 50 percent matching contributions on the following 2 percent (up to a maximum of $18,000 per eligible employee for calendar year 2015). We recorded related expenses of $0.5 million, $0.8 million and $1.4 million in fiscal years ended June 27, 2015, June 28, 2014 and June 29, 2013, respectively, including amounts related to our discontinued operations.
Defined Contribution Plan
We contribute to a U.K. based defined contribution pension scheme for employees. Contributions under this plan and the related expenses were $1.2 million, $1.4 million and $1.3 million in the fiscal years ended June 27, 2015, June 28, 2014 and June 29, 2013, respectively.
F- 31
Switzerland Defined Benefit Plan
During the first quarter of fiscal year 2014, we sold our Zurich Business, and as part of the sale transferred the pension plan covering employees of our Swiss subsidiary (the “Swiss Plan”) to II-VI. At the end of our first quarter of fiscal year 2014, we had no remaining obligations under the Swiss Plan.
Net periodic pension costs associated with the Swiss Plan are recorded in discontinued operations and included the following components in fiscal years ended June 28, 2014 and June 29, 2013:
Year Ended | |||||||
June 28, 2014 | June 29, 2013 | ||||||
(Thousands) | |||||||
Service cost | $ | 703 | $ | 3,291 | |||
Interest cost | 169 | 722 | |||||
Expected return on plan assets | (279 | ) | (1,197 | ) | |||
Net amortization | 76 | 369 | |||||
Net periodic pension cost | $ | 669 | $ | 3,185 | |||
Prior to transferring the Swiss Plan to II-VI in fiscal year 2014, we contributed $0.5 million to the Swiss Plan. During fiscal year ended June 29, 2013, we contributed $2.3 million to the Swiss Plan.
Japan Defined Contribution and Benefit Plan
In connection with our acquisition of Opnext, we assumed a defined contribution plan and a defined benefit plan that provides retirement benefits to our employees in Japan.
Under the defined contribution plan, contributions are provided based on grade level and totaled $0.5 million and $0.8 million for the year ended June 27, 2015 and June 28, 2014, respectively. Employees can elect to receive the benefit as additional salary or contribute the benefit to the plan on a tax-deferred basis.
Under the defined benefit plan in Japan (the "Japan Plan"), we calculate benefits based on an employee’s individual grade level and years of service. Employees are entitled to a lump sum benefit upon retirement or upon certain instances of termination. During the second quarter of fiscal year 2015, we sold our Komoro Business, and as part of the sale transferred a portion of our Japan Plan covering employees of the Komoro Business to Ushio Opto.
As of June 27, 2015, there were no Japan Plan assets. As of June 27, 2015, there was $0.3 million in accrued expenses and other liabilities and $4.5 million in other non-current liabilities in our consolidated balance sheet, to account for the projected benefit obligations under the Japan Plan.
F- 32
The reconciliation of the actuarial present value of the projected benefit obligations for the defined benefit plan for the year ended June 27, 2015 and June 28, 2014 was as follows:
June 27, 2015 | June 28, 2014 | ||||||
(Thousands) | |||||||
Change in projected benefit obligation: | |||||||
Projected benefit obligation, beginning of period | $ | 8,287 | $ | 8,084 | |||
Service cost | 693 | 963 | |||||
Interest cost | 69 | 95 | |||||
Benefits paid | (580 | ) | (674 | ) | |||
Decrease in obligation in connection with the sale of the Komoro Business | (1,974 | ) | — | ||||
Actuarial (gain) loss on obligation | (60 | ) | 22 | ||||
Change in methodology used to estimate the actuarial present value of accumulated plan benefits | (471 | ) | — | ||||
Currency translation adjustment | (1,147 | ) | (203 | ) | |||
Projected benefit obligation, end of period | $ | 4,817 | $ | 8,287 | |||
Amounts recognized in consolidated balance sheets: | |||||||
Accrued expenses and other liabilities: | |||||||
Underfunded pension liability | $ | 273 | $ | 129 | |||
Other non-current liabilities: | |||||||
Underfunded pension liability | $ | 4,544 | $ | 8,186 | |||
Amounts recognized in accumulated other comprehensive income, net of tax: | |||||||
Pension adjustment | $ | (182 | ) | $ | 414 | ||
Accumulated benefit obligation, end of period | $ | 4,817 | $ | 7,776 | |||
During the first quarter of fiscal year 2015, we recorded an adjustment of $0.5 million in accumulated other comprehensive income in connection with revising our methodology for estimating the actuarial present value of accumulated plan benefits under the Japan Plan.
Net periodic pension cost associated with the Japan Plan in fiscal years ended June 27, 2015, June 28, 2014 and June 29, 2013 include the following components:
June 27, 2015 | June 28, 2014 | June 29, 2013 | |||||||||
(Thousands) | |||||||||||
Service cost | $ | 693 | $ | 963 | $ | 1,059 | |||||
Interest cost | 69 | 95 | 135 | ||||||||
Net amortization | 35 | 62 | 74 | ||||||||
Net periodic pension cost | $ | 797 | $ | 1,120 | $ | 1,268 | |||||
The projected and accumulated benefit obligations for the Japan Plan were calculated as June 27, 2015 and June 28, 2014 using the following assumptions:
June 27, 2015 | June 28, 2014 | ||||
Discount rate | 1.1 | % | 1.2 | % | |
Salary increase rate | 2.2 | % | 2.2 | % | |
Expected average remaining working life (in years) | 13.8 | 14.1 | |||
As of June 27, 2015, the accumulated benefit obligation was $4.8 million. Estimated future benefit payments under the Japan Plan are estimated to be $0.2 million in fiscal year 2016, $0.1 million in fiscal year 2017, $0.2 million in fiscal year 2018, $0.3 million in fiscal year 2019, $0.4 million in fiscal year 2020 and a total of $1.6 million for the following 5 years.
F- 33
NOTE 9. COMMITMENTS AND CONTINGENCIES
Loss Contingencies
We are involved in various lawsuits, claims and proceedings that arise in the ordinary course of business. We record a loss provision when we believe it is both probable that a liability has been incurred and the amount can be reasonably estimated.
Guarantees
We indemnify our directors and certain employees as permitted by law, and have entered into indemnification agreements with our directors and executive officers. We have not recorded a liability associated with these indemnification arrangements, as we historically have not incurred any material costs associated with such indemnification obligations. Costs associated with such indemnification obligations may be mitigated by insurance coverage that we maintain, however, such insurance may not cover any, or may cover only a portion of, the amounts we may be required to pay. In addition, we may not be able to maintain such insurance coverage in the future.
We also have indemnification clauses in various contracts that we enter into in the normal course of business, such as indemnifications in favor of customers in respect of liabilities they may incur as a result of purchasing our products should such products infringe the intellectual property rights of a third party. We have not historically paid out any material amounts related to these indemnifications; therefore, no accrual has been made for these indemnifications.
Warranty Accrual
We generally provide a warranty for our products for twelve to thirty-six months from the date of sale, although warranties for certain of our products may be longer. We accrue for the estimated costs to provide warranty services at the time revenue is recognized. Our estimate of costs to service our warranty obligations is based on historical experience and expectation of future conditions. To the extent we experience increased warranty claim activity or increased costs associated with servicing those claims, our warranty costs would increase, resulting in a decrease in gross profit.
The following table summarizes movements in the warranty accrual for the periods indicated:
Year Ended | |||||||||||
June 27, 2015 | June 28, 2014 | June 29, 2013 | |||||||||
(Thousands) | |||||||||||
Warranty provision—beginning of period | $ | 4,672 | $ | 4,670 | $ | 2,599 | |||||
Fair value of warranties assumed in acquisitions | — | — | 5,537 | ||||||||
Warranties issued | 1,430 | 2,207 | 3,240 | ||||||||
Warranties utilized or expired | (2,709 | ) | (3,629 | ) | (6,369 | ) | |||||
Currency translation and other adjustments | (461 | ) | 1,424 | (337 | ) | ||||||
Warranty provision—end of period | $ | 2,932 | $ | 4,672 | $ | 4,670 | |||||
F- 34
Capital Leases
In connection with our acquisition of Opnext, we assumed certain capital leases with Hitachi Capital Corporation, a related party, for certain equipment. The terms of the leases generally range from one to five years and the equipment can be purchased at the residual value upon expiration. We can terminate the leases at our discretion in return for a penalty payment as stated in the lease contracts.
The following table shows the future minimum lease payments due under non-cancelable capital leases with Hitachi Capital Corporation at June 27, 2015:
Capital Leases | |||
(Thousands) | |||
Fiscal Year Ending: | |||
2016 | 3,487 | ||
2017 | 1,294 | ||
2018 | 68 | ||
2019 | 25 | ||
2020 | 24 | ||
Thereafter | 85 | ||
Total minimum lease payments | 4,983 | ||
Less amount representing interest | (236 | ) | |
Present value of capitalized payments | 4,747 | ||
Less: current portion | (3,580 | ) | |
Long-term portion | $ | 1,167 | |
In connection with our sale of the Komoro Business in fiscal year 2015, we transferred $0.5 million in capital leases with Hitachi Corporation to Ushio Opto.
Operating Leases
We lease certain facilities under non-cancelable operating lease agreements that expire at various dates through 2033. Our future fiscal year minimum lease payments under non-cancelable operating leases and related sublease income, including the sale-leaseback of our Caswell facility, are as follows:
Operating Lease Payments | Sublease Income | ||||||
(Thousands) | |||||||
Fiscal Year: | |||||||
2016 | $ | 8,006 | $ | (370 | ) | ||
2017 | 7,776 | (210 | ) | ||||
2018 | 7,637 | (100 | ) | ||||
2019 | 7,424 | (90 | ) | ||||
2020 | 6,123 | (90 | ) | ||||
Thereafter | 52,641 | — | |||||
$ | 89,607 | $ | (860 | ) | |||
Rent expense for these leases was $9.5 million, $8.6 million and $12.6 million during the fiscal years ended June 27, 2015, June 28, 2014 and June 29, 2013, respectively, including our discontinued operations.
We continue to lease one building in Acton, Massachusetts, which we previously used to house the manufacturing and research and development related to certain of our products which was considered redundant, following the acquisition of Opnext and its product lines. The lease for the building is scheduled to expire on January 31, 2016, with a current rental cost of approximately $0.5 million annually. In determining our facility lease loss liability, various assumptions were made, including the time period over which the buildings will be vacant, expected sublease terms and expected sublease rates. During the fourth quarter of fiscal
F- 35
year 2014, we recorded a lease loss liability of $0.8 million related to this facility. Adjustments to this accrual will be made in future periods, if events and circumstances change.
Taxes
It is our policy to classify accrued interest and penalties related to unrecognized tax benefits in the provision for income taxes. For fiscal years 2015, 2014 and 2013, we recognized an insignificant amount of interest and penalties related to unrecognized tax benefits. As of June 27, 2015 and June 28, 2014, we accrued $0.8 million and $0.9 million, respectively, of interest and penalties related to unrecognized tax benefits. At this time, we are unable to reasonably estimate the timing of the long-term payments or the amount by which the liability will increase or decrease over time.
Purchase Commitments
We purchase components from a variety of suppliers and use contract manufacturers to provide manufacturing services for our products. During the normal course of business, in order to manage manufacturing lead times and help ensure adequate component supply, we enter into agreements with suppliers and contract manufacturers that either allow them to procure inventory based upon criteria as defined by us or establish the parameters defining our requirements. A significant portion of our reported purchase commitments arising from these agreements consist of firm, non-cancelable and unconditional commitments. As of June 27, 2015, we had total purchase commitments of $66.7 million.
We record a liability for firm, non-cancelable and unconditional purchase commitments for quantities in excess of its future demand forecasts consistent with the valuation of our excess and obsolete inventory. As of June 27, 2015, the liability for these purchase commitments was $3.2 million and was included in accrued expenses and other liabilities.
Litigation
Overview
In the ordinary course of business, we are involved in various legal proceedings, and we anticipate that additional actions will be brought against us in the future. The most significant of these proceedings are described below. These legal proceedings, as well as other matters, involve various aspects of our business and a variety of claims in various jurisdictions. Complex legal proceedings frequently extend for several years, and a number of the matters pending against us are at very early stages of the legal process. As a result, some pending matters have not yet progressed sufficiently through discovery and/or development of important factual information and legal issues to enable us to determine whether the proceeding is material to us or to estimate a range of possible loss, if any. Unless otherwise disclosed, we are unable to estimate the possible loss or range of loss for the legal proceedings described below. While it is not possible to accurately predict or determine the eventual outcomes of these items, an adverse determination in one or more of these items currently pending could have a material adverse effect on our results of operations, financial position or cash flows.
Raysung Commercial Litigation
On October 23, 2013, Xi’an Raysung Photonics Inc., or Raysung, filed a civil suit against our wholly-owned subsidiary, Oclaro Technology (Shenzhen) Co., Ltd. (formerly known as Bookham Technology (Shenzhen) Co., Ltd.), or Oclaro Shenzhen, in the Xi’an Intermediate People’s Court in Shaanxi Province of the People’s Republic of China, or the Xi’an Court. The complaint filed by Raysung alleged that Oclaro Shenzhen terminated its purchase order pursuant to which Raysung had supplied certain products and was to supply certain products to Oclaro Shenzhen.
Raysung initially requested that the court award damages of approximately RMB 4.8 million (equivalent to approximately $0.8 million at the exchange rate in effect June 27, 2015), and requested that Oclaro Shenzhen take the finished products that are now stored in Raysung’s warehouse (the value of the finished product is approximately RMB 13.5 million (equivalent to approximately $2.2 million at the exchange rate in effect June 27, 2015)) and requested that Oclaro Shenzhen pay its court fees in connection with this suit.
The Xi’an Court delivered an Asset Preservation Order which was served on Oclaro Shenzhen and the local Customs office. According to the Asset Preservation Order, Oclaro Shenzhen was ordered to maintain RMB 15.0 million (equivalent to approximately $2.5 million at the exchange rate in effect June 27, 2015) or assets equivalent to the said amount during the litigation process, and the Customs office was ordered to restrict Oclaro Shenzhen's equipment from being exported before the Asset Preservation Order is lifted. On November 11, 2013, Oclaro Shenzhen entered into a settlement agreement. Under the terms of this settlement agreement, Oclaro Shenzhen agreed to pay $0.5 million in payment of invoices for certain materials to Raysung and to work with Raysung to requalify it as a vendor for certain Oclaro Shenzhen manufacturing requirements, in consideration of which Raysung agreed to submit the settlement agreement to the Xi’an Court so it could issue a civil mediation agreement, apply for a discharge of the Asset Preservation Order and waive the right to bring any legal actions against Oclaro Shenzhen relating to these matters. Oclaro Shenzhen performed its obligations under the settlement agreement,
F- 36
however, on January 15, 2014, Raysung applied to the Xi’an Court to terminate the settlement agreement and add Oclaro, Inc. as a co-defendant in the original civil suit.
On March 26, 2014, the Xi’an Court froze RMB 15.0 million (equivalent to approximately $2.5 million at the exchange rate in effect June 27, 2015) of cash held in Oclaro Shenzhen’s bank account in China. On April 30, 2014, Oclaro Shenzhen submitted a challenge to the jurisdiction of the Xi'an Court. On May 26, 2014, the Xi'an Court overruled the jurisdictional challenge. On June 4, 2014, Oclaro Shenzhen filed an appeal with the Shaanxi High Court to revoke the civil order of the Xi'an Court overruling Oclaro Shenzhen's jurisdictional challenge. The Shaanxi High Court held hearings on July 15, 2014 and July 30, 2014, and on August 20, 2014 sustained the Xi'an Court's civil order on jurisdiction and transferred the case back to the Xi'an Court for substantive proceedings. On September 22, 2014, Raysung amended its complaint in the Xi'an Court proceeding by increasing its claims to RMB 36.2 million (equivalent to approximately $5.9 million at the exchange rate in effect on June 27, 2015). On October 22, 2014, the Xi'an Court conducted a hearing on the substantive elements of Raysung's claims. At the same hearing, Oclaro Shenzhen filed counterclaims against Raysung for RMB 7.4 million (equivalent to approximately $1.2 million at the exchange rate in effect on June 27, 2015) of losses resulting from supply of products with unqualified materials. On December 17, 2014, the Xi'an Court conducted a hearing on the substantive elements of each party's claims against the other party. On April 2, 2015, the Xi'an Court released RMB 5.0 million of cash (equivalent to approximately $0.8 million at the exchange rate in effect June 27, 2015) previously frozen in Oclaro Shenzhen's bank account in exchange for a new lien on physical assets located at Oclaro Shenzhen's facility with an equivalent appraised value. The Asset Preservation Order is currently in effect until March 2016. On April 10, 2015, the Xi'an Court issued a decision, ruling that Oclaro Shenzhen should pay Raysung RMB 11.4 million (equivalent to approximately $1.9 million at the exchange rate in effect June 27, 2015). The Xi'an Court also dismissed Raysung's other claims and each of Oclaro Shenzhen's counterclaims.
On April 24, 2015, Oclaro Shenzhen filed an appeal of the Xi'an Court decision with the Shaanxi High Court, on the basis of both factual and legal error in the underlying decision. On June 30, 2015, the Shaanxi High Court conducted an appeal hearing, at which time Oclaro Shenzhen and Raysung presented arguments supporting their respective positions and rebutting each other's claims. During July 2015, the Shaanxi High Court conducted ex parte meetings with each of Oclaro Shenzhen and Raysung and asked for additional information, but did not subsequently schedule or hold any additional hearings with both parties present. On August 21, 2015, the Shaanxi High Court's judgment was delivered to Oclaro Shenzhen's Chinese counsel and became effective on this date. The Shaanxi High Court found that Oclaro Shenzhen was the breaching party and, therefore, has required that Oclaro Shenzhen pay Raysung, on or before August 31, 2015, a total of approximately RMB 15.0 million (equivalent to approximately $2.5 million at the exchange rate in effect June 27, 2015), which includes damages and fees. We intend to make the payment required by the judgment of the Shaanxi High Court and to close this matter.
Following the delivery of the Shaanxi High Court judgment to Oclaro Shenzhen on August 21, 2015, we recorded a $2.5 million charge in selling, general and administrative expense within our consolidated statement of operations for fiscal year 2015 and the quarter ended June 27, 2015 and $2.5 million in accrued expenses and other liabilities in our consolidated balance sheet at June 27, 2015.
Kunst Worker Compensation Matter
On June 18, 2015, Gerald Kunst, or Kunst, filed a civil suit against us and Travelers Property Casualty Company of America, or Travelers, in Massachusetts Superior Court, Civil Action No. SUCV2015-01818F. Travelers is our worker compensation insurance carrier. The complaint filed by Kunst, an employee of a third party service provider, alleges that he was injured while performing air conditioning repair services on the premises of our Acton, Massachusetts facility and seeks judgment in an amount to be determined by the court or jury, together with interest and costs. On July 24, 2015, we filed an answer to the complaint, which included our affirmative defenses. As of August 28, 2015, no hearing has been scheduled in this matter. We intend to vigorously defend against this litigation.
Sale-Leasebacks
Shenzhen Sale-Leaseback
In May 2012, our Oclaro Technology (Shenzhen) Co., Ltd. subsidiary entered into an agreement with Shenzhen Fangdao Technology Co., Ltd. for the sale and leaseback of our manufacturing facility located in Shenzhen, China. On June 7, 2012, we completed the sale transaction for 136.0 million Chinese yuan (approximately $21.5 million at the exchange rate in effect on the date of the transaction). We received approximately $18.7 million in net proceeds after transfer taxes of approximately $2.5 million and transaction costs of approximately $0.4 million. This agreement also provides for Oclaro Technology (Shenzhen) Co., Ltd. to lease back the facility for a term of four years, provided that we may terminate the lease after the second or third year of the term upon written notice. Rental payments in fiscal years ended June 27, 2015 and June 28, 2014 were $0.7 million and $1.2 million, respectively. Annual rent for year three and year four of the lease is scheduled to increase 8 percent and 17 percent, respectively, from the rental rate during the first two years of the lease.
F- 37
As a result of this transaction, we recorded a $13.6 million gain on the sale of this facility, recognizing $11.3 million of this amount in gain (loss) on sale of property and equipment in our consolidated statement of operations in fiscal year 2012, and amortizing $2.3 million of the gain against rent expense over the initial two year non-cancelable lease term. As of June 28, 2014, we had fully amortized the deferred gain.
Caswell Sale-Leaseback
In March 2006, our Oclaro Technology Ltd. subsidiary entered into multiple agreements with a subsidiary of Scarborough Development (Scarborough) for the sale and leaseback of the land and buildings located at our Caswell, U.K., manufacturing site. The sale transaction, which closed on March 30, 2006, resulted in proceeds to Oclaro Technology Ltd. of £13.75 million (approximately $24.0 million on the date of the transaction). Under these agreements, Oclaro Technology Ltd. leases back the Caswell site for an initial term of 20 years, with options to renew the lease term for 5 years following the initial term and for rolling 2-year terms thereafter. Based on the exchange rate on June 27, 2015, annual rent for the next year of the lease is approximately £1.2 million, or $2.0 million; annual rent for the subsequent 5 years of the lease is approximately £1.4 million, or $2.2 million per year; and annual rent for the last 5 years of the lease is approximately £1.6 million, or $2.5 million per year. Rent during the optional renewal terms will be determined according to the then market rent for the site. The obligations of Oclaro Technology Ltd under these agreements are guaranteed by us. In addition, Scarborough and us entered into a pre-emption agreement with the buyer under which Oclaro Technology Ltd, within the initial 20-year term, has a right to purchase the Caswell site in whole or in part on terms acceptable to Scarborough if Scarborough agrees to terms with or receives an offer from a third party to purchase the Caswell facility. As a result of these agreements, we deferred a related gain of $20.4 million, which is being amortized ratably against rent expense over the initial 20-year term of the lease. As of June 27, 2015, the unamortized balance of this deferred gain is $9.9 million.
At the inception of the Caswell lease, we determined the total minimum lease payments which were to be paid over the lease term, and we are recognizing the effects of scheduled rent increases, which are included in the total minimum lease payments, on a straight-line basis over the lease term.
NOTE 10. STOCKHOLDERS’ EQUITY
Common Stock
On July 23, 2012, in connection with the Opnext acquisition, our stockholders approved an amendment to our restated certificate of incorporation to increase the number of authorized shares of Oclaro to 176.0 million, consisting of 175.0 million shares of common stock and 1.0 million shares of preferred stock.
On May 2, 2014, PECM Strategic Funding L.P. and Providence TMT Debt Opportunity Fund L.P., holders of warrants (the “Warrants”) to purchase shares of our common stock, exercised the Warrants in full. We delivered 978,457 shares of our common stock in connection with the cashless exercise of the Warrants.
On December 19, 2013, the holders of our convertible notes exercised their rights to exchange the convertible notes for our common stock. The exchange rate for the exchanges was 541.7118 shares of common stock per $1,000 in principal amount of convertible notes. We issued 13,542,791 shares of common stock in connection with the exchange, with cash payable in lieu of fractional shares.
During fiscal year 2013, we issued approximately 38.4 million shares of our common stock for all of the outstanding shares of Opnext common stock. We also issued approximately 4.3 million stock options and 0.2 million SARs in exchange for Opnext stock options and SARs. The fair value of the stock options and SARs was determined to be approximately $1.9 million as of the acquisition date, July 23, 2012. See Note 3, Business Combinations and Dispositions.
During fiscal year 2013, we also issued 1.1 million shares of common stock under our 2011 Employee Stock Purchase Plan (ESPP) prior to suspending the ESPP program in the third quarter of fiscal year 2013, for total proceeds of $1.7 million. The ESPP is more fully discussed in Note 11, Employee Stock Plans.
Preferred Stock
Our restated certificate of incorporation authorizes us to issue up to 1.0 million shares of preferred stock with designations, rights and preferences determined from time-to-time by our board of directors. To date, we have not issued any preferred stock.
Warrants
On May 6, 2013, we entered into Amendment Number Two to the Credit Agreement (refer to Note 7, Credit Line and Notes for further details), pursuant to which we issued warrants to purchase, in the aggregate, 1,836,000 shares of our common stock at an exercise price of $1.50 per share (subject to adjustment from time to time, as provided in the Warrants). The Warrants were issued by us in consideration of the Term Lenders entering into the Amendment and providing the Term Loan. The offer and
F- 38
sale of the Warrants was not registered under the Securities Act of 1933 in reliance upon the exemption from registration under Section 4(2) of the Securities Act as such transaction did not involve a public offering of securities. We also granted to the Term Lenders certain registration rights with respect to the Warrants.
The warrants were valued using the Black-Scholes pricing model, which were determined to have a value of $0.7 million as of the date of grant. On May 2, 2014, the Term Lenders exercised their Warrants. We delivered 978,457 shares of our common stock in connection with the cashless exercise of the Warrants.
The following table summarizes activity relating to warrants to purchase our common stock:
Warrants Outstanding | Weighted- Average Exercise Price | |||||
(Thousands) | ||||||
Balance at June 30, 2012 | — | — | ||||
Granted | 1,836 | 1.50 | ||||
Balance at June 29, 2013 | 1,836 | 1.50 | ||||
Exercised | (1,836 | ) | 1.50 | |||
Balance at June 28, 2014 and June 27, 2015 | — | $ | — | |||
Accumulated Other Comprehensive Income
The components of accumulated other comprehensive income, net of tax, are as follows:
June 27, 2015 | June 28, 2014 | ||||||
(Thousands) | |||||||
Currency translation adjustments | $ | 41,351 | $ | 46,490 | |||
Unrealized loss on marketable securities | — | (209 | ) | ||||
Adjustment for Switzerland and Japan defined benefit plans | 175 | (417 | ) | ||||
$ | 41,526 | $ | 45,864 | ||||
NOTE 11. EMPLOYEE STOCK PLANS
Stock Incentive Plans
On July 23, 2013, our board of directors approved the Fourth Amended and Restated 2001 Long-Term Stock Incentive Plan and on January 14, 2014, our shareholders ratified this plan, establishing it as our primary equity incentive plan at that time. This plan (i) revised the eligibility section to allow us to make grants to all our employees, non-employee directors and consultants, (ii) allowed us to grant incentive stock options and awards which may be able to qualify as qualified performance-based compensation under Section 162(m) of the Internal Revenue Code, (iii) extended the term of the plan to ten years from the effective date of the plan (the plan expires in July 2023), and (iv) conforms the share counting provisions of the plan to provide that full value awards count as 1.25 shares for purposes of this plan.
On July 30, 2014, our board of directors approved the Fifth Amended and Restated 2001 Long-Term Stock Incentive Plan (the “Incentive Plan”) and on November 14, 2014, our shareholders ratified the Incentive Plan. The Incentive Plan amends and restates in its entirety the Fourth Amended and Restated 2001 Long-Term Stock Incentive Plan. The Incentive Plan (i) increases the number of shares of common stock available for issuance by 6.0 million shares, (ii) consolidates the share reserve of the Incentive Plan with the share reserve of the Amended and Restated 2004 Stock Incentive Plan ("2004 Plan"), such that from November 14, 2014, no additional awards will be granted under the 2004 Plan, and (iii) establishes that full value awards count as 1.40 shares of common stock for purposes of the Incentive Plan.
As of June 27, 2015, there were 8.9 million shares of our common stock available for grant under the Incentive Plan.
We generally grant stock options that vest over a two to four year service period, and restricted stock awards and units that vest over a one to four year service period, and in certain cases each may vest earlier based upon the achievement of specific performance-based objectives as set by our board of directors or the compensation committee of our board of directors.
We also have a minimal amount of SARs outstanding as of June 27, 2015, which we assumed in connection with our acquisition of Opnext.
F- 39
In July 2011, our board of directors approved the grant of 0.2 million performance stock units (“PSUs”) to certain executive officers with an aggregate estimated grant date fair value of $0.9 million. These PSUs were to vest, up to 150 percent of the target PSUs, upon the achievement of certain revenue growth targets through June 30, 2013, relative to certain comparable companies. In October 2013, the board of directors determined that achievement of the performance conditions was reached at the 100 percent target level. Approximately 0.1 million of the grants outstanding, or 50 percent, vested on October 22, 2013, with the remaining 50 percent scheduled to vest upon a two-year service condition through August 2015. As of June 27, 2015, there were minimal PSUs outstanding, after adjustments for forfeitures due to terminations, related to this grant, with a de minimis aggregate estimated grant date fair value.
In July 2012, our board of directors approved a grant of 0.6 million PSUs to certain executive officers, subject to shareholder approval of an amendment to our Incentive Plan. Prior to shareholder approval, approximately 0.4 million of the PSUs were forfeited as a result of certain executive officer departures. On January 14, 2014, shareholder approval was obtained at our annual general meeting of stockholders. These PSUs vest upon the achievement of certain adjusted earnings before interest, taxes, depreciation and amortization targets through June 30, 2014. During fiscal year 2015, it was determined that the performance conditions were not achieved, and the corresponding PSUs were forfeited.
In February 2014, our board of directors granted our chief executive officer 0.8 million restricted stock units ("RSUs") in satisfaction of the terms set forth in his employment agreement dated September 11, 2013. The RSUs vested in full on the date of grant, and settled on August 15, 2014. The RSUs had an aggregate grant date fair value of $2.0 million, which was recorded during fiscal year 2014.
In March 2014, our board of directors approved a grant of 0.2 million PSUs to certain executive officers with an aggregate estimated grant date fair value of $0.5 million. These PSUs vest upon the achievement of non-GAAP operating income break-even for calendar year 2015. Vesting is also contingent upon service conditions being met through February 2018. If the performance condition is not achieved, then the corresponding PSUs will be forfeited in the third quarter of fiscal year 2016. As of June 27, 2015, there were 0.1 million PSUs outstanding, after adjustments for forfeitures due to terminations, related to this grant, with an aggregate estimated grant date fair value of $0.4 million. During fiscal year 2015, we determined that the achievement of the performance conditions associated with these PSUs was improbable. In the second quarter of fiscal year 2015, we reversed approximately $0.1 million in previously recognized stock-based compensation expense related to these PSUs.
In August 2014, our board of directors approved a grant of 0.5 million PSUs to certain executive officers with an aggregate estimated grant date fair value of $0.9 million. These PSUs will vest at 100 percent upon the achievement of two consecutive quarters with positive earnings before interest, taxes, depreciation and amortization on or before the end of our fiscal year 2017. If the performance condition is not achieved, then the corresponding PSUs will be forfeited in the first quarter of fiscal year 2018.
In August 2014, our board of directors approved a retention grant of 0.4 million RSUs to certain of our executives, which vest over three years. In September 2014, our board of directors also approved a retention grant of 1.4 million RSUs to other employees, which vest over two years.
F- 40
The following table summarizes the combined activity under all of our equity incentive plans for the three-year period ended June 27, 2015:
Awards Available For Grant | Stock Options / SARs Outstanding | Weighted- Average Exercise Price | Restricted Stock Awards / Units Outstanding | Weighted- Average Grant Date Fair Value | ||||||||||||
(Thousands) | (Thousands) | (Thousands) | ||||||||||||||
Balances at June 30, 2012 | 2,537 | 3,470 | $ | 7.84 | 1,051 | $ | 5.76 | |||||||||
Assumed in acquisition | 6,307 | 4,423 | 10.95 | 55 | 2.31 | |||||||||||
Granted | (3,419 | ) | 423 | 2.57 | 2,541 | 2.53 | ||||||||||
Exercised or released | — | (6 | ) | 1.11 | (457 | ) | 5.52 | |||||||||
Canceled or forfeited | 2,153 | (1,835 | ) | 8.84 | (340 | ) | 3.80 | |||||||||
Balances at June 29, 2013 | 7,578 | 6,475 | 9.36 | 2,850 | 3.17 | |||||||||||
Granted | (5,166 | ) | 320 | 2.16 | 3,900 | 2.47 | ||||||||||
Exercised or released | — | (155 | ) | 1.03 | (1,592 | ) | 2.77 | |||||||||
Canceled or forfeited | 3,291 | (2,484 | ) | 10.63 | (885 | ) | 2.69 | |||||||||
Balances at June 28, 2014 | 5,703 | 4,156 | 8.43 | 4,273 | 2.59 | |||||||||||
Increase in share reserve | 6,000 | — | — | — | — | |||||||||||
Granted | (4,279 | ) | 164 | 1.79 | 3,215 | 1.49 | ||||||||||
Exercised or released | — | (25 | ) | 1.70 | (2,490 | ) | 2.63 | |||||||||
Canceled or forfeited | 1,497 | (914 | ) | 12.64 | (453 | ) | 2.70 | |||||||||
Balances at June 27, 2015 | 8,921 | 3,381 | $ | 7.07 | 4,545 | $ | 1.80 | |||||||||
Supplemental disclosure information about our stock options and SARs outstanding as of June 27, 2015 was as follows:
Shares | Weighted- Average Exercise Price | Weighted- Average Remaining Contractual Life | Aggregate Intrinsic Value | |||||||||
(Thousands) | (Years) | (Thousands) | ||||||||||
Options and SARs exercisable at June 27, 2015 | 2,953 | $ | 7.80 | 4.1 | $ | 68 | ||||||
Options and SARs outstanding at June 27, 2015 | 3,381 | $ | 7.07 | 4.7 | $ | 196 | ||||||
The aggregate intrinsic value in the table above represents the total pre-tax intrinsic value, based on our closing stock price of $2.26 as of June 26, 2015, which would have been received by the option holders had all option holders exercised their options as of that date. There were approximately 0.1 million shares of common stock subject to in-the-money options which were exercisable as of June 27, 2015. We settle employee stock option exercises with newly issued shares of common stock.
2011 Employee Stock Purchase Plan
On October 26, 2011, our ESPP was approved by our stockholders. Under the ESPP, we reserved 1.7 million shares of our common stock for issuance. In fiscal year 2013, prior to commencing our third six-month offering period on February 16, 2013, we suspended the ESPP program because of the limited number of shares available for future issuance. At June 27, 2015, we had 0.6 million shares available for future issuance under our ESPP.
F- 41
NOTE 12. STOCK-BASED COMPENSATION
We recognize compensation expense in our statement of operations related to all share-based awards, including grants of stock options and purchase rights under our ESPP, based on the grant date fair value of such share-based awards. Estimating the grant date fair value of such share-based awards requires us to make judgments in the determination of inputs into the Black-Scholes stock option pricing model which we use to arrive at an estimate of the grant date fair value for such awards. This model requires assumptions to be made related to expected stock price volatility, expected option life, risk-free interest rate and dividend yield. While the risk-free interest rate is a less subjective assumption, typically based on factual data derived from public sources, the expected stock price volatility and option life assumptions require a greater level of judgment, which makes them critical accounting estimates. We have not issued and do not anticipate issuing dividends to stockholders and accordingly use a zero percent dividend yield assumption for all Black-Scholes stock option pricing calculations. We use an expected stock-price volatility assumption that is based on an implied and historical realized volatility of our underlying common stock during a period of time. With regard to the weighted-average option life assumption, we evaluate the exercise behavior of past grants and comparison to industry peer companies as a basis to predict future activity.
The weighted-average assumptions used in this model to value stock option grants and purchase rights under the ESPP for the fiscal years ended June 27, 2015, June 28, 2014 and June 29, 2013 were as follows:
Year Ended | ||||||||
June 27, 2015 | June 28, 2014 | June 29, 2013 | ||||||
Stock options: | ||||||||
Expected life | 5.3 years | 5.3 years | 5.1 years | |||||
Risk-free interest rate | 1.6 | % | 1.6 | % | 0.7 | % | ||
Volatility | 76.9 | % | 77.3 | % | 82.9 | % | ||
Dividend yield | — | — | — | |||||
Purchase rights under ESPP: | ||||||||
Expected life | N/A | N/A | 0.5 years | |||||
Risk-free interest rate | N/A | N/A | 0.1 | % | ||||
Volatility | N/A | N/A | 67.0 | % | ||||
Dividend yield | N/A | N/A | — | |||||
The amounts included in cost of revenues, operating expenses and net loss for stock-based compensation expenses for the fiscal years ended June 27, 2015, June 28, 2014 and June 29, 2013 were as follows:
Year Ended | |||||||||||
June 27, 2015 | June 28, 2014 | June 29, 2013 | |||||||||
(Thousands) | |||||||||||
Stock-based compensation by category of expense: | |||||||||||
Cost of revenues | $ | 1,801 | $ | 1,001 | $ | 1,627 | |||||
Research and development | 1,515 | 1,039 | 1,488 | ||||||||
Selling, general and administrative | 2,848 | 3,983 | 2,984 | ||||||||
Restructuring, acquisition and related costs | — | — | 277 | ||||||||
$ | 6,164 | $ | 6,023 | $ | 6,376 | ||||||
Stock-based compensation by type of award: | |||||||||||
Stock options | $ | 390 | $ | 983 | $ | 2,450 | |||||
Restricted stock awards | 5,670 | 5,206 | 3,424 | ||||||||
Purchase rights under ESPP | — | — | 531 | ||||||||
Inventory adjustment to cost of revenues | 104 | (166 | ) | (29 | ) | ||||||
$ | 6,164 | $ | 6,023 | $ | 6,376 | ||||||
As of June 27, 2015 and June 28, 2014, we capitalized $0.5 million and $0.4 million, respectively, of stock-based compensation in inventory.
F- 42
Included in stock-based compensation for the year ended June 28, 2014, is approximately $2.0 million in compensation cost related to the grant of 0.8 million RSUs to our chief executive officer on February 10, 2014, which vested in full on the grant date.
Also included in stock-based compensation for the years ended June 27, 2015 and June 28, 2014, is approximately $0.3 million and $0.1 million, respectively, in compensation cost related to the issuance of PSUs from July 2011, March 2014 and August 2014. The amount of stock-based compensation expense recognized in any one period related to PSUs can vary based on the achievement or anticipated achievement of the performance conditions. If the performance conditions are not met or not expected to be met, no compensation cost would be recognized on the underlying PSUs, and any previously recognized compensation expense related to those PSUs would be reversed. During the second quarter of fiscal year 2015, we determined that the achievement of the performance conditions associated with the PSUs granted in March 2014 was improbable. We reversed approximately $0.1 million in previously recognized stock-based compensation expense related to these PSUs.
As of June 27, 2015, we had $0.5 million in unrecognized stock-based compensation expense related to unvested stock options, net of estimated forfeitures, that will be recognized over a weighted-average period of 2.7 years, and $5.1 million in unrecognized stock-based compensation expense related to unvested time-based restricted stock awards, net of estimated forfeitures, that will be recognized over a weighted-average period of 1.3 years.
NOTE 13. INCOME TAXES
For financial reporting purposes, our loss from continuing operations before income taxes includes the following:
Year Ended | |||||||||||
June 27, 2015 | June 28, 2014 | June 29, 2013 | |||||||||
(Thousands) | |||||||||||
Domestic | $ | (5,725 | ) | $ | (22,197 | ) | $ | 685 | |||
Foreign | (42,181 | ) | (89,293 | ) | (120,954 | ) | |||||
$ | (47,906 | ) | $ | (111,490 | ) | $ | (120,269 | ) | |||
The components of our income tax provision are as follows:
Year Ended | |||||||||||
June 27, 2015 | June 28, 2014 | June 29, 2013 | |||||||||
(Thousands) | |||||||||||
Current: | |||||||||||
Domestic | $ | (5 | ) | $ | 49 | $ | (156 | ) | |||
Foreign | 543 | 2,873 | 1,564 | ||||||||
Deferred: | |||||||||||
Domestic | — | (13,054 | ) | (1,513 | ) | ||||||
Foreign | (210 | ) | 767 | 131 | |||||||
$ | 328 | $ | (9,365 | ) | $ | 26 | |||||
F- 43
Reconciliations of our income tax provision at the statutory rate to our income tax provision are as follows:
Year Ended | |||||||||||
June 27, 2015 | June 28, 2014 | June 29, 2013 | |||||||||
(Thousands) | |||||||||||
Tax benefit at U.S. federal statutory rate | $ | (16,288 | ) | $ | (37,907 | ) | $ | (40,890 | ) | ||
Tax benefit at state statutory rate | (487 | ) | (999 | ) | (3,404 | ) | |||||
Permanent adjustments | 1,815 | 1,165 | (29,746 | ) | |||||||
Foreign rate differential | 11,635 | 21,666 | 33,010 | ||||||||
Change in valuation allowance | 4,165 | 18,286 | 40,027 | ||||||||
Non-deductible goodwill impairment loss | — | — | 4,018 | ||||||||
Intraperiod tax allocation | — | (13,054 | ) | (1,513 | ) | ||||||
Other | (512 | ) | 1,478 | (1,476 | ) | ||||||
Provision for (benefit from) income taxes | $ | 328 | $ | (9,365 | ) | $ | 26 | ||||
We plan to permanently reinvest the unremitted earnings of our non-U.S. subsidiaries except for those subsidiaries where the closure of these subsidiaries is imminent following the sale of certain assets reported in discontinued operations and where we intend to restructure operations of certain subsidiaries. We recorded a tax liability of $0.1 million and $0.3 million for the withholding taxes that would be owed upon distribution of these entities' earnings as of June 27, 2015 and June 28, 2014, respectively. Determination of the amount of unrecognized deferred U.S. income tax liability on unremitted earnings is not practicable due to the complexities associated with its hypothetical calculation.
Deferred income taxes reflect the tax effects of temporary differences between the carrying amounts of assets and liabilities for financial reporting purposes and the amounts used for income tax purposes. Significant components of our deferred tax assets are as follows:
June 27, 2015 | June 28, 2014 | ||||||
(Thousands) | |||||||
Deferred tax assets: | |||||||
Net operating loss carryforwards | $ | 245,070 | $ | 254,483 | |||
Depreciation and capital losses | 44,454 | 47,453 | |||||
Capitalized research and development | 14,770 | 15,999 | |||||
Inventory valuation | 5,730 | 14,074 | |||||
Accruals and reserves | 11,637 | 10,525 | |||||
Tax credit carryforwards | 5,586 | 3,579 | |||||
Stock-based compensation | 2,099 | 2,902 | |||||
Other asset impairments | 1,998 | 2,011 | |||||
Deferred tax assets | 331,344 | 351,026 | |||||
Valuation allowance | (330,375 | ) | (346,949 | ) | |||
Total deferred tax assets | 969 | 4,077 | |||||
Deferred tax liabilities: | |||||||
Acquired intangibles | (969 | ) | (4,077 | ) | |||
Withholding tax | (138 | ) | (339 | ) | |||
Total deferred tax liabilities | (1,107 | ) | (4,416 | ) | |||
Net deferred tax assets | $ | (138 | ) | $ | (339 | ) | |
Deferred tax assets and liabilities are measured using the enacted tax rates and laws that will be in effect when the differences are expected to reverse. In evaluating our ability to recover deferred tax assets, we consider all available positive and negative evidence including past operating results, the existence of cumulative losses and our forecast of future taxable income. In determining future taxable income, we are responsible for assumptions utilized including the amount of state, federal and international pre-tax operating income, the reversal of temporary differences and the implementation of feasible and prudent tax planning strategies. These assumptions require significant judgment about the forecasts of future taxable income and are consistent with the plans and estimates we use to manage the underlying businesses.
F- 44
Recognition of deferred tax assets is appropriate when realization of these assets is more likely than not. Based upon the weight of available evidence, which includes our historical operating performance, the recorded cumulative net losses in prior fiscal periods and the uncertainty of the timing of future profits, we have provided a full valuation allowance against our U.S. and foreign deferred tax assets. Our valuation allowance decreased by $16.6 million, decreased by $97.2 million and increased by $177.4 million for fiscal years 2015, 2014 and 2013, respectively.
We have elected to derecognize both the gross deferred income tax assets and the offsetting valuation allowance pertaining to net operating loss and tax credit carryforwards that represent excess tax benefits from stock-based awards. Recognition of a deferred tax asset for excess tax benefits due to stock-based compensation deductions that have not yet been realized through a reduction in income taxes payable is prohibited. Such unrecognized deferred tax benefits totaled $3.3 million for federal and state as of June 27, 2015, and if and when realized through a reduction in income taxes payable, will be accounted for as a credit to additional paid-in capital.
As of June 27, 2015, we had foreign net operating loss carry forwards of approximately $605.1 million, $120.8 million, $2.1 million, $3.3 million and $6.0 million in the United Kingdom, Japan, Israel, Canada and Shanghai, China, respectively. Our Israel and Shanghai, China subsidiaries are currently in the process of closing down. The United Kingdom and Israel net operating losses do not expire. The Japan net operating loss will expire at various times from 2018 through 2024. The Canada net operating loss will expire at various times from 2026 through 2035. The Shanghai, China net operating loss will expire during 2020. We also have U.S. federal and California net operating losses of approximately $214.2 million and $156.4 million, respectively, which will expire in various years from 2016 through 2035 if unused. As of June 27, 2015, we had U.S. federal, California, United Kingdom and Canada research and development credits of approximately $0.1 million, $0.9 million, $0.6 million and $2.4 million, respectively. The U.S. federal research credits will expire from 2019 through 2035. The California and United Kingdom research credit may be carried forward indefinitely. The Canada research credit will expire during 2029 if unused. In addition, we have foreign tax credits of approximately $1.9 million, which will expire from 2028 through 2035.
Utilization of net operating loss carryforwards and credit carryforwards are subject to annual limitations due to ownership changes as provided in the Internal Revenue Code of 1986, as amended, as well as similar state and foreign tax laws. This annual limitation may result in the expiration of a significant portion of the net operating loss carry forwards and tax credits before utilization.
Our total amount of unrecognized tax benefits as of June 27, 2015 was approximately $4.1 million. The total amount of unrecognized tax benefits that, if recognized, would affect the effective tax rate is $3.0 million as of June 27, 2015. While it is often difficult to predict the final outcome of any particular uncertain tax position, management believes unrecognized tax benefits could decrease by approximately $1.0 million in the next twelve months.
A reconciliation of the beginning balance and the ending balance of gross unrecognized tax benefits, net of interest and penalties, for fiscal year ended June 27, 2015, June 28, 2014 and June 29, 2013 is as follows:
Year Ended | |||||||||||
June 27, 2015 | June 28, 2014 | June 29, 2013 | |||||||||
(Thousands) | |||||||||||
Balance at beginning of period | $ | 4,164 | $ | 8,016 | $ | 7,248 | |||||
Additions for tax positions related to the current year | 232 | 522 | 1,851 | ||||||||
Additions for tax positions related to prior years | 759 | 606 | 130 | ||||||||
Reductions for tax positions related to prior years | (473 | ) | (741 | ) | (1,055 | ) | |||||
Lapse of the applicable statute of limitations | (624 | ) | (4,239 | ) | (158 | ) | |||||
Balance at end of period | $ | 4,058 | $ | 4,164 | $ | 8,016 | |||||
We include interest and penalties related to unrecognized tax benefits within the provision for income taxes on our consolidated statements of operations. For fiscal years 2015, 2014 and 2013, we recognized an insignificant amount of interest and penalties related to unrecognized tax benefits. As of June 27, 2015 and June 28, 2014, we have accrued approximately $0.8 million and $0.9 million for payment of interest and penalties related to unrecognized tax benefits, respectively.
We file U.S. federal, U.S. state and foreign tax returns and have determined that our major tax jurisdictions are the United States, the United Kingdom, Italy, Japan and China. Certain jurisdictions remain open to examination by the appropriate governmental agencies; U.S. federal, Italy, Japan and China tax years 2009 to 2015, various U.S. states for tax years 2008 through 2015, and the United Kingdom tax years 2008 to 2015. In addition, in the U.S., any net operating loss and credit carryforwards may be subject to examination in the years they are utilized on the tax returns. We have currently been contacted
F- 45
for examination in Israel and we believe that our tax returns are supportable as filed. However, we cannot predict the outcome of the examination. We are not currently under any U.S., state, or other foreign examinations.
NOTE 14. NET LOSS PER SHARE
Basic net loss per share is computed using only the weighted-average number of shares of common stock outstanding for the applicable period, while diluted net income (loss) per share is computed assuming conversion of all potentially dilutive securities, such as stock options, stock appreciation rights, unvested restricted stock awards, warrants and shares issuable in connection with convertible notes during such period. For fiscal years 2015, 2014 and 2013, we excluded such dilutive securities from the computation of diluted shares outstanding since we incurred a net loss from continuing operations in these periods which would have resulted in their inclusion having an anti-dilutive effect.
For fiscal years ended June 27, 2015, June 28, 2014 and June 29, 2013, we excluded 20.4 million, 16.5 million and 17.5 million, respectively, of outstanding stock options, stock appreciation rights, warrants, unvested restricted stock units or shares issuable in connection with convertible notes from the calculation of diluted net income (loss) per share because their effect would have been anti-dilutive.
NOTE 15. GEOGRAPHIC INFORMATION, PRODUCT GROUPS AND CUSTOMER CONCENTRATION
We evaluate our reportable segments in accordance with ASC Topic 280, Segment Reporting, which establishes standards for reporting information about operating segments, geographic areas and major customers in financial statements. During fiscal years 2015, 2014 and 2013, we had one operating segment in which we designed, manufactured and marketed lasers and optical components, modules and subsystems for the optical communications, industrial and consumer laser markets.
Geographic Information
The following table shows revenues by geographic area for the fiscal years ended June 27, 2015, June 28, 2014 and June 29, 2013, based on the delivery locations of our products:
Year Ended | |||||||||||
June 27, 2015 | June 28, 2014 | June 29, 2013 | |||||||||
(Thousands) | |||||||||||
China | $ | 105,516 | $ | 101,889 | $ | 113,203 | |||||
United States | 54,017 | 41,047 | 36,106 | ||||||||
Malaysia | 47,335 | 46,997 | 41,825 | ||||||||
Mexico | 40,900 | 33,483 | 26,045 | ||||||||
Germany | 25,825 | 66,611 | 56,874 | ||||||||
Italy | 25,034 | 20,323 | 20,122 | ||||||||
Japan | 8,417 | 35,295 | 51,534 | ||||||||
Thailand | 3,676 | 9,166 | 15,251 | ||||||||
Rest of world | 30,556 | 36,060 | 43,669 | ||||||||
$ | 341,276 | $ | 390,871 | $ | 404,629 | ||||||
The following table sets forth our long-lived tangible assets and total assets by geographic region as of the dates indicated:
Long-lived Tangible Assets | Total Assets | ||||||||||||||
June 27, 2015 | June 28, 2014 | June 27, 2015 | June 28, 2014 | ||||||||||||
(Thousands) | |||||||||||||||
United States | $ | 1,581 | $ | 2,980 | $ | 109,818 | $ | 53,120 | |||||||
United Kingdom | 6,965 | 6,408 | 81,813 | 120,400 | |||||||||||
Japan | 16,698 | 26,216 | 74,191 | 107,597 | |||||||||||
China | 8,046 | 5,671 | 24,809 | 43,102 | |||||||||||
Rest of world | 8,476 | 9,493 | 35,253 | 41,466 | |||||||||||
$ | 41,766 | $ | 50,768 | $ | 325,884 | $ | 365,685 | ||||||||
F- 46
Product Groups
The following table sets forth revenues by product group for the fiscal years ended June 27, 2015, June 28, 2014 and June 29, 2013:
Year Ended | |||||||||||
June 27, 2015 | June 28, 2014 | June 29, 2013 | |||||||||
(Thousands) | |||||||||||
100 Gb/s transmission modules | $ | 119,276 | $ | 78,552 | $ | 42,241 | |||||
40 Gb/s transmission modules | 74,520 | 98,891 | 100,521 | ||||||||
10 Gb/s and lower transmission modules | 138,116 | 183,522 | 236,034 | ||||||||
Industrial and consumer | 9,364 | 29,906 | 25,833 | ||||||||
$ | 341,276 | $ | 390,871 | $ | 404,629 | ||||||
Significant Customers and Concentration of Credit Risk
For the fiscal year ended June 27, 2015, three customers accounted for 10 percent or more of our revenues, representing 19 percent, 14 percent and 11 percent of our revenues, respectively. For the fiscal year ended June 28, 2014, three customers accounted for 10 percent or more of our revenues, representing 20 percent, 13 percent and 11 percent of our revenues, respectively. For the fiscal year ended June 29, 2013, three customers accounted for 10 percent or more of our revenues, representing 14 percent, 14 percent and 10 percent of our revenues, respectively.
As of June 27, 2015, four customers accounted for 10 percent or more or our accounts receivable, representing approximately 24 percent, 13 percent, 11 percent and 11 percent of our accounts receivable, respectively. As of June 28, 2014, two customers accounted for 10 percent or more of our accounts receivable, representing approximately 19 percent and 13 percent of our accounts receivable, respectively.
NOTE 16. RELATED PARTY TRANSACTIONS
As a result of our acquisition of Opnext on July 23, 2012, Hitachi, Ltd. (Hitachi) holds approximately 11 percent of our outstanding common stock as of June 27, 2015 based on Hitachi’s most recent Schedule 13G filed with the Securities and Exchange Commission on February 12, 2014.
We continue to enter into transactions with Hitachi in the normal course of business. Sales to Hitachi were $3.6 million, $13.4 million and $9.3 million for the years ended June 27, 2015, June 28, 2014 and June 29, 2013, respectively. Purchases from Hitachi were $15.7 million, $13.9 million and $21.0 million for the years ended June 27, 2015, June 28, 2014 and June 29, 2013, respectively. At June 27, 2015 and June 28, 2014 we had $0.7 million and $2.7 million, respectively, in accounts receivable due from Hitachi and $4.8 million and $4.5 million, respectively, in accounts payable due to Hitachi. We also have certain capital equipment leases with Hitachi Capital Corporation as described in Note 9, Commitments and Contingencies and we lease certain facilities in Japan from Hitachi.
We are party to a research and development agreement and intellectual property license agreements with Hitachi.
NOTE 17. SUBSEQUENT EVENT
On October 23, 2013, Raysung filed a civil suit against our wholly-owned subsidiary, Oclaro Shenzhen, in the Xi’an Intermediate People’s Court in Shaanxi Province of the People’s Republic of China, or the Xi’an Court. The complaint filed by Raysung alleged that Oclaro Shenzhen terminated its purchase order pursuant to which Raysung had supplied certain products and was to supply certain products to Oclaro Shenzhen. On April 10, 2015, the Xi'an Court ruled that Oclaro Shenzhen should pay Raysung RMB 11.4 million (equivalent to approximately $1.9 million at the exchange rate in effect June 27, 2015). On April 24, 2015, Oclaro Shenzhen filed an appeal of this decision with the Shaanxi High Court. On August 21, 2015, the Shaanxi High Court's judgment was delivered to Oclaro Shenzhen's Chinese counsel and became effective on this date. The Shaanxi High Court found that Oclaro Shenzhen was the breaching party and, therefore, has required that Oclaro Shenzhen pay Raysung, on or before August 31, 2015, a total of approximately RMB 15.0 million (equivalent to approximately $2.5 million at the exchange rate in effect June 27, 2015), which includes damages and fees. We intend to make the payment required by the judgment of the Shaanxi High Court and to close this matter. See Note 9, Commitments and Contingencies, for additional details regarding this litigation.
Following the delivery of the Shaanxi High Court judgment to Oclaro Shenzhen on August 21, 2015, we recorded a $2.5 million charge in selling, general and administrative expense within our consolidated statement of operations for fiscal year
F- 47
2015 and the quarter ended June 27, 2015 and $2.5 million in accrued expenses and other liabilities in our consolidated balance sheet at June 27, 2015.
NOTE 18. SELECTED QUARTERLY CONSOLIDATED FINANCIAL DATA (UNAUDITED)
The following tables set forth our unaudited condensed consolidated statements of operations data for each of the eight quarterly periods ended June 27, 2015. We have prepared this unaudited information on a basis consistent with our audited consolidated financial statements, reflecting all normal recurring adjustments that we consider necessary for a fair presentation of our financial position and operating results for the fiscal quarters presented. Basic and diluted net loss per share is computed independently for each of the quarters presented. Therefore, the sum of quarterly basic and diluted per share information may not equal annual basic and diluted net income (loss) per share.
On September 12, 2013 and November 1, 2013, we sold our Zurich and Amplifier Businesses, respectively. These sales are reported as discontinued operations, which require retrospective restatement of prior periods to classify the results of operations as discontinued operations.
Quarter Ended | |||||||||||||||
June 27, 2015 | March 28, 2015 | December 27, 2014 | September 27, 2014 | ||||||||||||
(Thousands) | |||||||||||||||
Revenues | $ | 82,192 | $ | 83,023 | $ | 86,820 | $ | 89,241 | |||||||
Cost of revenues | 66,319 | 70,323 | 73,054 | 74,832 | |||||||||||
Gross profit | 15,873 | 12,700 | 13,766 | 14,409 | |||||||||||
Operating expenses | 26,683 | 26,082 | 17,572 | 31,872 | |||||||||||
Other income (expense), net | (3,110 | ) | 2,659 | (435 | ) | (1,559 | ) | ||||||||
Loss from continuing operations before income taxes | (13,920 | ) | (10,723 | ) | (4,241 | ) | (19,022 | ) | |||||||
Income tax (benefit) provision | (51 | ) | (537 | ) | (38 | ) | 954 | ||||||||
Loss from continuing operations | (13,869 | ) | (10,186 | ) | (4,203 | ) | (19,976 | ) | |||||||
Loss from discontinued operations, net of tax | — | — | (8,080 | ) | (378 | ) | |||||||||
Net loss | (13,869 | ) | (10,186 | ) | (12,283 | ) | (20,354 | ) | |||||||
Basic and diluted net loss per share: | |||||||||||||||
Loss per share from continuing operations | $ | (0.13 | ) | $ | (0.09 | ) | $ | (0.04 | ) | $ | (0.19 | ) | |||
Loss per share from discontinued operations | — | — | (0.07 | ) | — | ||||||||||
Basic and diluted net loss per share | $ | (0.13 | ) | $ | (0.09 | ) | $ | (0.11 | ) | $ | (0.19 | ) | |||
Shares used in computing net loss per share: | |||||||||||||||
Basic | 109,122 | 108,357 | 107,849 | 107,249 | |||||||||||
Diluted | 109,122 | 108,357 | 107,849 | 107,249 | |||||||||||
F- 48
Quarter Ended | |||||||||||||||
June 28, 2014 | March 29, 2014 | December 28, 2013 | September 28, 2013 | ||||||||||||
(Thousands) | |||||||||||||||
Revenues | $ | 95,911 | $ | 95,398 | $ | 102,914 | $ | 96,648 | |||||||
Cost of revenues | 82,694 | 84,298 | 86,001 | 85,430 | |||||||||||
Gross profit | 13,217 | 11,100 | 16,913 | 11,218 | |||||||||||
Operating expenses | 36,240 | 33,564 | 42,184 | 42,790 | |||||||||||
Other income (expense), net | (93 | ) | 540 | (11,352 | ) | 1,745 | |||||||||
Loss from continuing operations before income taxes | (23,116 | ) | (21,924 | ) | (36,623 | ) | (29,827 | ) | |||||||
Income tax (benefit) provision | (11,836 | ) | 745 | 1,424 | 302 | ||||||||||
Loss from continuing operations | (11,280 | ) | (22,669 | ) | (38,047 | ) | (30,129 | ) | |||||||
Income (loss) from discontinued operations, net of tax | (12,749 | ) | (252 | ) | 69,538 | 63,407 | |||||||||
Net income (loss) | (24,029 | ) | (22,921 | ) | 31,491 | 33,278 | |||||||||
Basic and diluted net income (loss) per share: | |||||||||||||||
Loss per share from continuing operations | $ | (0.11 | ) | $ | (0.22 | ) | $ | (0.41 | ) | $ | (0.33 | ) | |||
Income (loss) per share from discontinued operations | (0.12 | ) | — | 0.75 | 0.70 | ||||||||||
Basic and diluted net income (loss) per share | $ | (0.23 | ) | $ | (0.22 | ) | $ | 0.34 | $ | 0.37 | |||||
Shares used in computing net income (loss) per share: | |||||||||||||||
Basic | 106,287 | 105,487 | 93,204 | 90,966 | |||||||||||
Diluted | 106,287 | 105,487 | 93,204 | 90,966 | |||||||||||
F- 49
Financial Statement Schedule II: Valuation and Qualifying Accounts
For the Years Ended June 27, 2015, June 28, 2014 and June 29, 2013
Allowance for Doubtful Accounts | Allowance for Sales Returns | ||||||
(Thousands) | |||||||
Balance at June 30, 2012 | $ | 1,317 | $ | 153 | |||
Balances assumed in acquisitions | 485 | — | |||||
Additions charged to cost, expenses or revenues | 725 | 3,110 | |||||
Deductions, write-offs and adjustments | 466 | (57 | ) | ||||
Balance at June 29, 2013 | 2,993 | 3,206 | |||||
Additions charged to cost, expenses or revenues | 38 | — | |||||
Deductions, write-offs and adjustments | (281 | ) | (2,627 | ) | |||
Balance at June 28, 2014 | 2,750 | 579 | |||||
Additions charged to cost, expenses or revenues | 41 | — | |||||
Deductions, write-offs and adjustments | 24 | (579 | ) | ||||
Balance at June 27, 2015 | $ | 2,815 | $ | — | |||
F- 50
EXHIBIT INDEX
Exhibit Number | Description of Exhibit | |
2.1 | Agreement and Plan of Merger dated March 26, 2012, among Oclaro, Inc., Tahoe Acquisition Sub, Inc. and Opnext, Inc. (previously filed as Exhibit 2.1 to Registrant's Current Report on Form 8-K filed on March 26, 2012 and incorporated herein by reference.) | |
2.2 (1) | Master Separation Agreement, dated August 5, 2014, entered into by Oclaro Japan, Inc., Ushio Opto Semiconductors, Inc., and Ushio, Inc. (previously filed as Exhibit 2.4 to Registrant's Annual Report on Form 10-K on September 10, 2014 and incorporated herein by reference). | |
3.1 | Amended and Restated By-Laws of Oclaro, Inc. (previously filed as Exhibit 3.1 to Registrant's Current Report on Form 8-K filed on October 29, 2014 and incorporated herein by reference). | |
3.2 | Oclaro, Inc. Restated Certificate of Incorporation (previously filed as Exhibit 3.1 to Registrant's Current Report on Form 8-K filed on August 1, 2014 and incorporated herein by reference.) | |
10.1 | Asset Purchase Agreement, dated October 10, 2013, entered into by Oclaro Technology Limited and II-VI Incorporated (previously filed as Exhibit 10.3 to Registrant's Quarterly Report on Form 10-Q on November 7, 2013 and incorporated herein by reference.) | |
10.2 | Share and Asset Purchase Agreement, dated September 12, 2013, entered into by Oclaro Technology Limited and II-VI Holdings B.V. (previously filed as Exhibit 2.1 to Registrant’s Current Report on Form 8-K filed on September 17, 2013 and incorporated herein by reference.) | |
10.3 | Option Agreement, dated September 12, 2013, entered into by Oclaro Technology Limited, Oclaro, Inc., Oclaro (North America), Inc., Avanex Communications Technologies Co, II-VI Holdings B.V., and II-VI Incorporated (previously filed as Exhibit 10.6 to Registrant's Quarterly Report on Form 10-Q filed on November 7, 2013 and incorporated herein by reference.) | |
10.4 | Asset Purchase Agreement between Oclaro, Inc. and II-VI Incorporated, Photop Technologies, Inc. (California) and Photop Koncent, Inc. (Fuzhou) (China) dated as of November 19, 2012 (previously filed as Exhibit 10.8 to Registrant’s Quarterly Report on Form 10-Q filed on February 7, 2013 and incorporated herein by reference.) | |
10.5 (1) | Manufacturing and Purchase Agreement, dated March 19, 2012, between Oclaro Technology, Ltd and Venture Corporation Ltd. (previously filed as Exhibit 10.5 to Registrant’s Quarterly Report on Form 10-Q filed on May 10, 2012 and incorporated herein by reference.) | |
10.6 | Equipment and Inventory Purchase Agreement, dated March 19, 2012, between Oclaro Technology Ltd, Oclaro Technology (Shenzhen) Co., Ltd, Venture Electronics (Shenzhen) Co., Ltd, and Venture Electronics Services (M) Sdn Bhd. (previously filed as Exhibit 10.6 to Registrant’s Quarterly Report on Form 10-Q filed on May 10, 2012 and incorporated herein by reference.) | |
10.7 (1) | Manufacturing and Purchase Agreement, dated November 8, 2011, between Oclaro, Inc. and Fabrinet. (previously filed as Exhibit 10.4 to Registrant’s Quarterly Report on Form 10-Q filed on February 8, 2012 and incorporated herein by reference.) | |
10.8 (1) | Loan and Security Agreement, dated March 28, 2014, by and among Oclaro, Inc., Oclaro Technology Ltd. and Silicon Valley Bank (previously filed as Exhibit 10.2 to Registrant's Quarterly Report on Form 10-Q filed on May 8, 2014 and incorporated herein by reference.) | |
10.9 | Unconditional Guaranty, dated March 28, 2014, by and among Oclaro, Inc., Oclaro Technology Ltd. and Silicon Valley Bank (previously filed as Exhibit 10.3 to Registrant's Quarterly Report on Form 10-Q filed on May 8, 2014 and incorporated herein by reference.) | |
10.10 (2) | Offer Letter of Adam Carter, Chief Commercial Officer, dated June 12, 2014 (previously filed as Exhibit 10.27 to Registrant's Annual Report on Form 10-K filed on September 10, 2014 and incorporated herein by reference.) | |
10.11 (2) | Offer Letter of Richard Craig, President, Integrated Photonics Division, dated April 21, 2014 (previously filed as Exhibit 10.4 to Registrant's Quarterly Report on Form 10-Q filed on May 8, 2014 and incorporated herein by reference.) | |
10.12 (2) | Offer Letter of David L. Teichmann, Executive Vice President, General Counsel and Corporate Secretary, dated December 5, 2013 (previously filed as Exhibit 10.7 to Registrant's Quarterly Report on Form 10-Q filed on February 6, 2014 and incorporated herein by reference.) | |
10.13 (2) | Employment Agreement, dated September 11, 2013, between Oclaro, Inc. and Greg Dougherty (previously filed as Exhibit 10.1 to Registrant’s Current Report on Form 8-K filed on September 17, 2013 and incorporated herein by reference.) | |
10.14 (2) | Contract of Employment between Oclaro Technology Ltd and Jim Haynes (previously filed as Exhibit 10.38 to Registrant’s Annual Report on Form 10-K for the year ended July 2, 2005, and incorporated herein by reference.) | |
10.15 (2) | Form of Indemnification Agreement, between Oclaro, Inc. and directors and executive officers (previously filed as Exhibit 10.2 to Registrant’s Quarterly Report on Form 10-Q filed on February 6, 2008 and incorporated herein by reference.) | |
10.16 (2) | Oclaro, Inc. Fourth Amended and Restated 2001 Long-Term Stock Incentive Plan (previously filed as Annex A to our Proxy Statement for our 2013 Annual Meeting of Stockholders on November 26, 2013 and incorporated herein by reference.) | |
10.17 (2) | Oclaro, Inc. (Opnext, Inc.) Third Amended and Restated 2001 Long-Term Stock Incentive Plan, dated as of July 23, 2013 (previously filed as Exhibit 10.45 to Registrant's Annual Report on Form 10-K filed on September 27, 2013.) | |
10.18 (2) | U.K. Subplan to the 2004 Stock Incentive Plan (previously filed as Exhibit 10.4 to Registrant’s Quarterly Report on Form 10-Q filed on May 17, 2005, and incorporated herein by reference.) | |
10.19 (2) | Form of Incentive Stock Option, Form of Non-Statutory Stock Option, Form of Restricted Stock Unit Agreement and Form of Restricted Stock Award Agreement (previously filed as Exhibit 10.25 to Registrant’s Annual Report on Form 10-K filed on September 9, 2011 and incorporated herein by reference.) | |
10.20 (2) | Oclaro, Inc. Amended and Restated 2004 Stock Incentive Plan (previously filed as Exhibit 10.1 to Registrant’s Current Report on Form 8-K, filed with the SEC on October 28, 2010, and incorporated herein by reference.) | |
10.21 (2) | Opnext, Inc. 2001 Long-Term Stock Incentive Plan (previously filed as Exhibit 10.3 to Opnext, Inc.’s Registration Statement 333-138262 on Form S-1 filed on October 27, 2006 and incorporated herein by reference.) | |
10.22 (2) | Opnext, Inc. 2001 Long-Term Stock Incentive Plan, Nonqualified Stock Option Agreement (previously filed as Exhibit 10.4 to Opnext, Inc.’s Registration Statement 333-138262 on Amendment Number 1 to Form S-1 filed on December 13, 2006 and incorporated herein by reference.) | |
10.23 (2) | Opnext, Inc. 2001 Long-Term Stock Incentive Plan, Nonqualified Stock Option Agreement for Senior Executives (previously filed as Exhibit 10.4A to Opnext, Inc.’s Registration Statement 333-138262 on Amendment Number 1 to Form S-1 filed on December 13, 2006 and incorporated herein by reference.) | |
10.24 (2) | Opnext, Inc. 2001 Long-Term Stock Incentive Plan, Stock Appreciation Right Agreement (previously filed as Exhibit 10.4C to Opnext, Inc.’s Registration Statement 333-138262 on Amendment Number 1 to Form S-1 filed on December 13, 2006 and incorporated herein by reference.) | |
10.25 | Registration Rights Agreement between Oclaro, Inc. and Hitachi, Ltd. (previously filed as Exhibit 10.1 to Registrant’s Current Report on Form 8-K filed on August 24, 2012 and incorporated herein by reference.) | |
10.26 | Lease dated December 23, 1999 by and between Silicon Valley Properties, LLC and Oclaro Photonics, Inc., with respect to 2580 Junction Avenue, San Jose, California (previously filed as Exhibit 10.32 to Registrant’s Amendment No. 1 to Transition Report on Form 10-K/A for the for the transition period from January 1, 2004 to July 3, 2004, filed on October 5, 2004 and incorporated herein by reference.) | |
10.27 | Second Amendment to Lease dated November 30, 2010 by and between 702/703 Investors LLC and Oclaro, Inc., with respect to 2580 Junction Avenue, San Jose, California (previously filed as Exhibit 10.18 to Registrant’s Annual Report on Form 10-K filed on September 9, 2011 and incorporated herein by reference.) | |
10.28 | Pre-emption Agreement dated as of March 10, 2006, by and among Oclaro Technology Ltd, Coleridge (No. 45) Limited and Oclaro, Inc. (previously filed as Exhibit 10.4 to Registrant’s Quarterly Report on Form 10-Q filed on May 9, 2006 and incorporated herein by reference.) | |
10.29 | Lease dated as of March 10, 2006, by and among Oclaro Technology Ltd, Coleridge (No. 45) Limited and Oclaro, Inc. (previously filed as Exhibit 10.5 to Registrant’s Quarterly Report on Form 10-Q filed on May 9, 2006 and incorporated herein by reference.) | |
10.30 (2) | Form of Amended and Restated Indemnification Agreement between Oclaro, Inc. and its directors and executive officers (previously filed as Exhibit 10.58 to Registrant's Quarterly Report on Form 10-Q filed on November 6, 2014 and incorporated herein by reference.) | |
10.31 (2) | Oclaro, Inc. Fourth Amended and Restated Long-Term Stock Incentive Plan, Form of Restricted Stock Agreement for Directors (previously filed as Exhibit 10.59 to Registrant's Quarterly Report on Form 10-Q filed on November 6, 2014 and incorporated herein by reference.) | |
10.32 (2) | Oclaro, Inc. Fourth Amended and Restated Long-Term Stock Incentive Plan, Form of Restricted Stock Agreement (previously filed as Exhibit 10.60 to Registrant's Quarterly Report on Form 10-Q filed on November 6, 2014 and incorporated herein by reference.) | |
10.33 (2) | Oclaro, Inc. Fourth Amended and Restated Long-Term Stock Incentive Plan, Form of Restricted Stock Unit Agreement (previously filed as Exhibit 10.61 to Registrant's Quarterly Report on Form 10-Q filed on November 6, 2014 and incorporated herein by reference.) | |
10.34 (2) | Oclaro, Inc. Fourth Amended and Restated Long-Term Stock Incentive Plan, Form of Stock Option Agreement (previously filed as Exhibit 10.62 to Registrant's Quarterly Report on Form 10-Q filed on November 6, 2014 and incorporated herein by reference.) | |
10.35 (2) | Oclaro, Inc. Fourth Amended and Restated Long-Term Stock Incentive Plan, Form of Performance Stock Unit Agreement (previously filed as Exhibit 10.63 to Registrant's Quarterly Report on Form 10-Q filed on November 6, 2014 and incorporated herein by reference.) | |
10.36 | Settlement Agreement, dated December 30, 2014, entered into by Oclaro Technology Limited, II-VI Incorporated and II-VI Holdings B.V. (previously filed as Exhibit 10.64 to Registrant's Quarterly Report on Form 10-Q filed on February 5, 2015 and incorporated herein by reference.) | |
10.37 (2) | Offer Letter of Lisa Paul, Executive Vice President, Human Resources, dated October 8, 2014 (previously filed as Exhibit 10.65 to Registrant's Quarterly Report on Form 10-Q filed on February 5, 2015 and incorporated herein by reference.) | |
10.38 (2) | Oclaro, Inc. Fifth Amended and Restated 2001 Long-Term Stock Incentive Plan (previously filed as Annex A to our Proxy Statement for our 2014 Annual Meeting of Stockholders on November 14, 2014 and incorporated herein by reference.) | |
10.39 (2) | Oclaro, Inc. Fifth Amended and Restated 2001 Long-Term Stock Incentive Plan, Form of Restricted Stock Unit Agreement (previously filed as Exhibit 10.67 to Registrant's Quarterly Report on Form 10-Q filed on February 5, 2015 and incorporated herein by reference.) | |
10.40 (2) | Oclaro, Inc. Fifth Amended and Restated 2001 Long-Term Stock Incentive Plan, Form of Stock Option Agreement (previously filed as Exhibit 10.68 to Registrant's Quarterly Report on Form 10-Q filed on February 5, 2015 and incorporated herein by reference.) | |
10.41 (2) | Oclaro, Inc. Fifth Amended and Restated 2001 Long-Term Stock Incentive Plan, Form of Performance Stock Unit Agreement (previously filed as Exhibit 10.69 to Registrant's Quarterly Report on Form 10-Q filed on February 5, 2015 and incorporated herein by reference.) | |
10.42 (2) | Form of Executive Severance and Retention Agreement, between Oclaro, Inc. and its executive officers (previously filed as Exhibit 10.1 to Registrant's Current Report on Form 8-K filed on August 1, 2014 and incorporated herein by reference.) | |
10.43 | Purchase Agreement, dated February 12, 2015, between Oclaro, Inc. and Jefferies LLC (previously filed as Exhibit 10.70 to Registrant's Quarterly Report on Form 10-Q filed on May 7, 2015 and incorporated herein by reference.) | |
10.44 | Indenture, dated February 19, 2015, between Oclaro, Inc. and U.S. Bank National Association, as Trustee (previously filed as Exhibit 10.71 to Registrant's Quarterly Report on Form 10-Q filed on May 7, 2015 and incorporated herein by reference.) | |
10.45 | Registration Rights Agreement, dated February 19, 2015, between Oclaro, Inc. and Jefferies LLC (previously filed as Exhibit 10.72 to Registrant's Quarterly Report on Form 10-Q filed on May 7, 2015 and incorporated herein by reference.) | |
10.46 | Consent and First Loan Modification Agreement, dated February 19, 2015, between Oclaro, Inc., Oclaro Technology Limited and Silicon Valley Bank (previously filed as Exhibit 10.73 to Registrant's Quarterly Report on Form 10-Q filed on May 7, 2015 and incorporated herein by reference.) | |
10.47 (3) | Lease dated April 21, 2015, by and among Oclaro Technology (Shenzhen) Co., Ltd. and Shenzhen Fangdao Technology Co., Ltd. for the premises at No. 2, Phoenix Road, Futian Free Trade Zone, Shenzhen, China. | |
10.48 (3) | Supplemental Lease dated April 21, 2015, by and among Oclaro Technology (Shenzhen) Co., Ltd. and Shenzhen Fangdao Technology Co., Ltd. for the premises at No. 2, Phoenix Road, Futian Free Trade Zone, Shenzhen, China. | |
21.1 (3) | Oclaro, Inc. Significant Subsidiaries | |
23.1 (3) | Consent of Independent Registered Public Accounting Firm | |
31.1 (3) | Certification of Chief Executive Officer Pursuant to Section 302(a) of the Sarbanes-Oxley Act of 2002 | |
31.2 (3) | Certification of Chief Financial Officer Pursuant to Section 302(a) of the Sarbanes-Oxley Act of 2002 | |
32.1 (3) | Certification of Chief Executive Officer Pursuant to 18 U.S.C. Section 1350 | |
32.2 (3) | Certification of Chief Financial Officer Pursuant to 18 U.S.C. Section 1350 | |
101.INS | XBRL Instance Document | |
101.SCH | XBRL Taxonomy Extension Schema Document | |
101.CAL | XBRL Taxonomy Extension Calculation Linkbase Document | |
101.DEF | XBRL Taxonomy Extension Definition Linkbase Document | |
101.LAB | XBRL Taxonomy Extension Label Linkbase Document | |
101.PRE | XBRL Taxonomy Extension Presentation Linkbase Document | |
(1) | Portions of this exhibit have been omitted pursuant to a request for confidential treatment submitted to the Securities and Exchange Commission. |
(2) | Management contract or compensatory plan or arrangement. |
(3) | Filed herewith. |