Attached files
| file | filename |
|---|---|
| 8-K - FORM 8-K - Sprouts Farmers Market, Inc. | d48936d8k.htm |
Exhibit 99.1
SPROUTS FARMERS MARKET
INVESTOR DECK AUGUST 2015
Forward-Looking Statements and Non-GAAP Financial Measures
SPROUTS FARMERS MARKET
Certain statements in this presentation are forward-looking as defined in the Private Securities Litigation Reform Act of 1995. Any statements contained herein (including, but not limited to, statements to the effect that Sprouts Farmers Market, Inc. (the “Company”) or its management “anticipates,” “plans,” “estimates,” “expects,” “believes,” or the negative of these terms and other similar expressions) that are not statements of historical fact should be considered forward-looking statements, including, without limitation, statements regarding the Company’s estimated growth, expected results and long-term financial targets. These statements involve certain risks and uncertainties that may cause actual results to differ materially from expectations as of the date of this presentation. These risks and uncertainties include, without limitation, risks associated with the Company’s ability to successfully compete in its intensely competitive industry; the Company’s ability to successfully open new stores; the Company’s ability to manage its rapid growth; the Company’s ability to maintain or improve its comparable store sales and operating margins; the Company’s ability to identify and react to trends in consumer preferences; product supply disruptions; general economic conditions; and other factors as set forth from time to time in the Company’s Securities and Exchange Commission filings. The Company intends these forward-looking statements to speak only as of the date of this presentation and does not undertake to update or revise them as more information becomes available, except as required by law.
In addition to reporting financial results in accordance with GAAP, the Company has presented adjusted net income, adjusted earnings per share and adjusted EBITDA. These measures are not in accordance with, or an alternative to GAAP. The Company’s management believes that these presentations provide useful information to management, analysts and investors regarding certain additional financial and business trends relating to its results of operations and financial condition. In addition, management uses these measures for reviewing the financial results of the Company as well as a component of incentive compensation. The Company defines adjusted net income as net income excluding store closure and exit costs, one-time costs associated with its April 2011 combination (the “Henry’s Transaction”) with Henry’s Holdings, LLC (“Henry’s”) and its May 2012 business combination with Sunflower Farmers Market, Inc. (“the Sunflower Transaction,” and collectively, the “Transactions”), gain and losses from disposal of assets, IPO bonus, expenses incurred by the Company in its secondary public offerings and employment taxes paid by the Company in connection with options exercised in those offerings (“Public Offering Expenses”), the loss on extinguishment of debt and the related tax impact of those adjustments. The Company defines adjusted basic and diluted earnings per share as adjusted net income divided by the weighted average basic and diluted shares outstanding. The Company defines EBITDA as net income before interest expense, provision for income tax, and depreciation, amortization and accretion, and defines adjusted EBITDA as EBITDA excluding store closure and exit costs, onetime costs associated with the Transactions, gains and losses from disposal of assets, Public Offering Expenses, and the loss on extinguishment of debt.
These non-GAAP measures are intended to provide additional information only and do not have any standard meanings prescribed by GAAP. Use of these terms may differ from similar measures reported by other companies. Because of their limitations, none of these non-GAAP measures should be considered as a measure of discretionary cash available to use to reinvest in growth of the Company’s business, or as a measure of cash that will be available to meet the Company’s obligations. Each of these non-GAAP measures has its limitations as an analytical tool, and you should not consider them in isolation or as a substitute for analysis of the Company’s results as reported under GAAP. See the Appendix for reconciliation for these non-GAAP measures to the comparable GAAP measures.
2
SPROUTS FARMERS MARKET
OVERVIEW OF SPROUTS
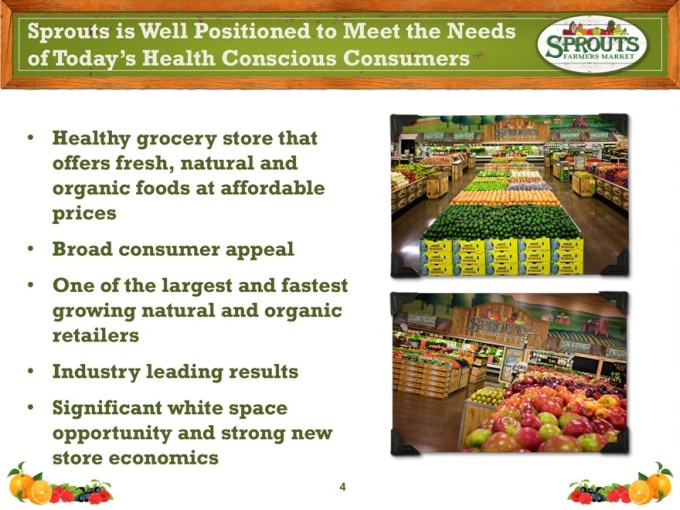
Sprouts is Well Positioned to Meet the Needs of Today’s Health Conscious Consumers
SPROUTS FARMERS MARKET
Healthy grocery store that offers fresh, natural and organic foods at affordable prices
Broad consumer appeal
One of the largest and fastest growing natural and organic retailers
Industry leading results
Significant white space opportunity and strong new store economics
4
Significant Growth Continues in the Natural
& Organic Channel
SPROUTS FARMERS MARKET
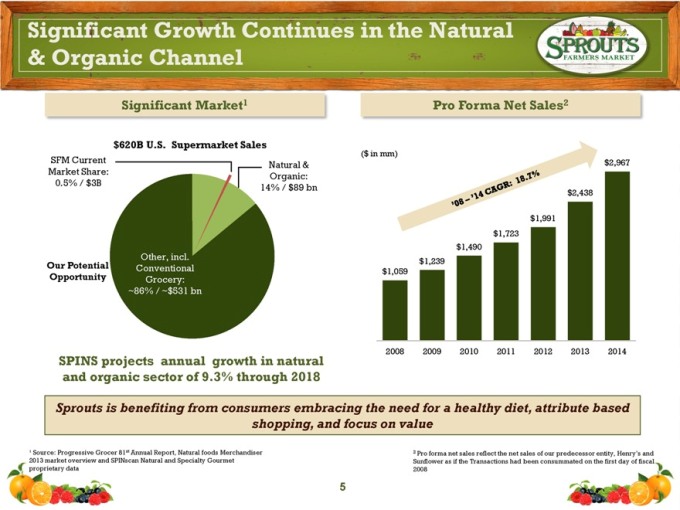
Significant Market1
$620B U.S. Supermarket Sales
SFM Current Market Share: 0.5% / $3B
Natural & Organic: 14% / $89 bn
Our Potential Opportunity
Other, incl. Conventional Grocery: ~86% / ~$531 bn
SPINS projects annual growth in natural and organic sector of 9.3% through 2018
Pro Forma Net Sales2
($ in mm)
’08 – ’14 CAGR: 18.7%
$1,059
$1,239
$1,490
$1,723
$1,991
$2,438
$2,967
2008 2009 2010 2011 2012 2013 2014
Sprouts is benefiting from consumers embracing the need for a healthy diet, attribute based shopping, and focus on value
1 Source: Progressive Grocer 81st Annual Report, Natural foods Merchandiser 2013 market overview and SPINscan Natural and Specialty Gourmet proprietary data
2 Pro forma net sales reflect the net sales of our predecessor entity, Henry’s and Sunflower as if the Transactions had been consummated on the first day of fiscal 2008
5
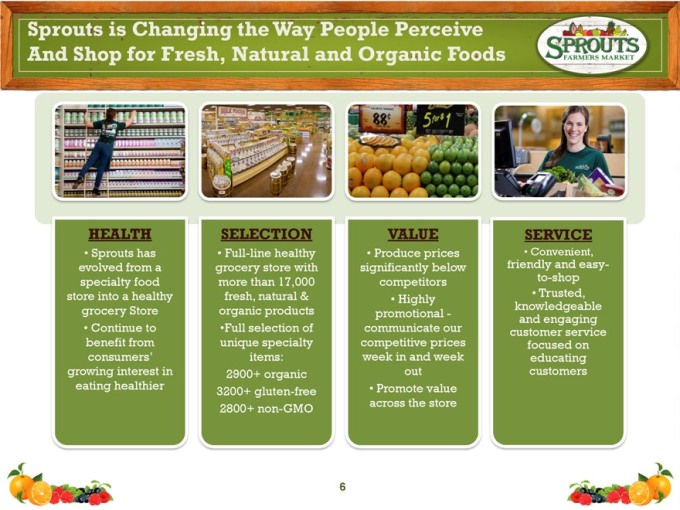
Sprouts is Changing the Way People Perceive And Shop for Fresh, Natural and Organic Foods
SPROUTS FARMERS MARKET
HEALTH
Sprouts has evolved from a specialty food store into a healthy grocery Store
Continue to benefit from consumers’ growing interest in eating healthier
SELECTION
Full-line healthy grocery store with more than 17,000 fresh, natural & organic products
Full selection of unique specialty items: 2900+ organic 3200+ gluten-free 2800+ non-GMO
VALUE
Produce prices significantly below competitors
Highly promotional - communicate our competitive prices week in and week out
Promote value across the store
SERVICE
Convenient, friendly and easy-to-shop
Trusted, knowledgeable and engaging customer service focused on educating customers
6
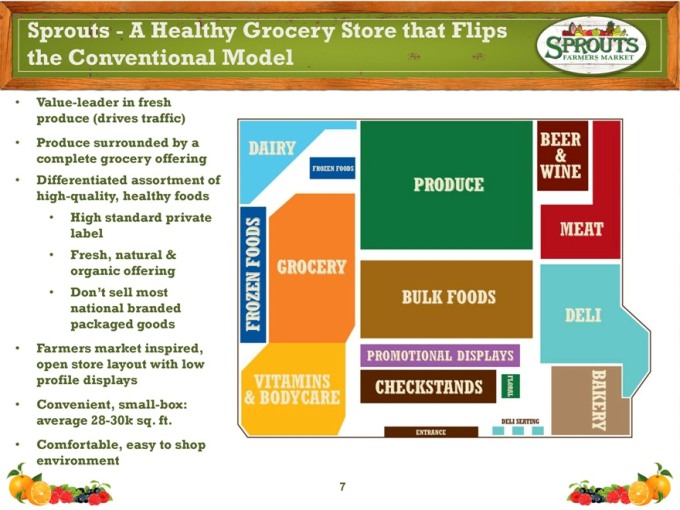
Sprouts - A Healthy Grocery Store that Flips the Conventional Model
SPROUTS FARMERS MARKET
Value-leader in fresh produce (drives traffic)
Produce surrounded by a complete grocery offering
Differentiated assortment of high-quality, healthy foods
High standard private label
Fresh, natural & organic offering
Don’t sell most national branded packaged goods
Farmers market inspired, open store layout with low profile displays
Convenient, small-box: average 28-30k sq. ft.
Comfortable, easy to shop environment
FROZEN FOODS
DAIRY
FROZEN FOODS
GROCERY
VITAMINS & BODYCARE
PRODUCE
BULK FOODS
PROMOTIONAL DISPLAY
CHECKSTANDS
FLORAL
ENTRANCE
DELI SEATING
BEER & WINE
MEAT
DELI
BAKERY
7
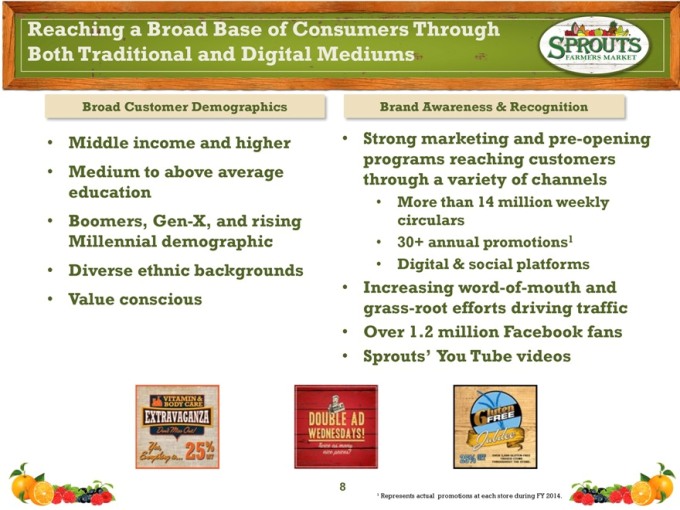
Reaching a Broad Base of Consumers Through Both Traditional and Digital Mediums
SPROUTS FARMERS MARKET
Broad Customer Demographics
Middle income and higher
Medium to above average education
Boomers, Gen-X, and rising Millennial demographic
Diverse ethnic backgrounds
Value conscious
Brand Awareness & Recognition
Strong marketing and pre-opening programs reaching customers through a variety of channels
More than 14 million weekly circulars
30+ annual promotions1
Digital & social platforms
Increasing word-of-mouth and grass-root efforts driving traffic
Over 1.2 million Facebook fans
Sprouts’ You Tube videos
VITAMIN & BODY CARE
EXTRAVAGANZA
Don’t Miss Out!
Yes, Everything is 25% OFF
DOUBLE AD WEDNESDAYS!
Twice as many nice prices
Gluten FREE
Jubilee
25% OFF
1 Represents actual promotions at each store during FY 2014.
8
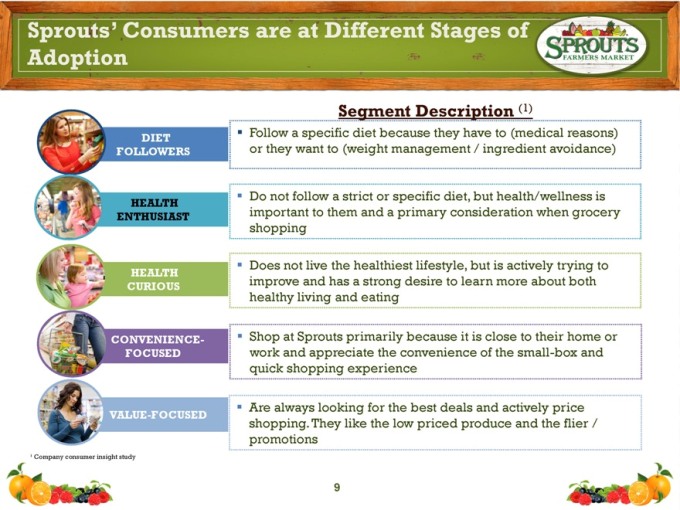
Sprouts’ Consumers are at Different Stages of Adoption
SPROUTS FARMERS MARKET
Segment Description (1)
DIET FOLLOWERS
HEALTH ENTHUSIAST
HEALTH CURIOUS
CONVENIENCE-FOCUSED
VALUE-FOCUSED
Follow a specific diet because they have to (medical reasons) or they want to (weight management / ingredient avoidance)
Do not follow a strict or specific diet, but health/wellness is important to them and a primary consideration when grocery shopping
Does not live the healthiest lifestyle, but is actively trying to improve and has a strong desire to learn more about both healthy living and eating
Shop at Sprouts primarily because it is close to their home or work and appreciate the convenience of the small-box and quick shopping experience
Are always looking for the best deals and actively price shopping. They like the low priced produce and the flier / promotions
1 Company consumer insight study
9
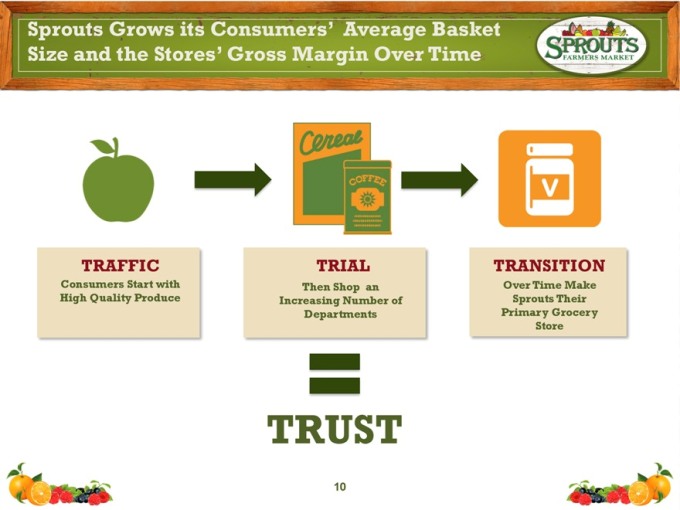
Sprouts Grows its Consumers’ Average Basket Size and the Stores’ Gross Margin Over Time
SPROUTS FARMERS MARKET
Cereal
COFFEE
TRAFFIC
Consumers Start with High Quality Produce
TRIAL
Then Shop an Increasing Number of Departments
TRANSITION
Over Time Make Sprouts Their Primary Grocery Store
TRUST
10
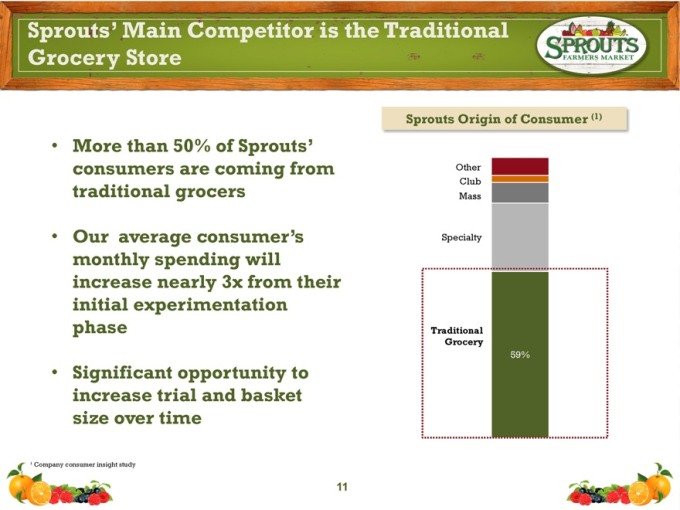
Sprouts’ Main Competitor is the Traditional Grocery Store
SPROUTS FARMERS MARKET
More than 50% of Sprouts’ consumers are coming from traditional grocers
Our average consumer’s monthly spending will increase nearly 3x from their initial experimentation phase
Significant opportunity to increase trial and basket size over time
Sprouts Origin of Consumer (1)
Other
Club
Mass
Specialty
Traditional
Grocery
59%
1 Company consumer insight study
11
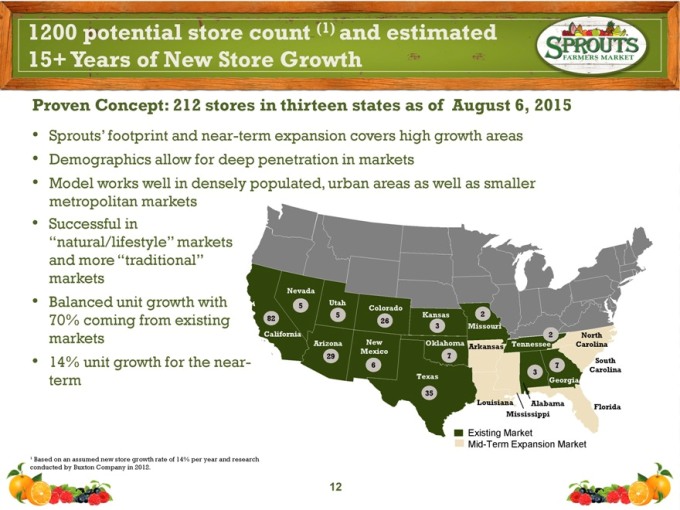
1200 potential store count (1) and estimated 15+ Years of New Store Growth
SPROUTS FARMERS MARKET
Proven Concept: 212 stores in thirteen states as of August 6, 2015
Sprouts’ footprint and near-term expansion covers high growth areas
Demographics allow for deep penetration in markets
Model works well in densely populated, urban areas as well as smaller metropolitan markets
Successful in
“natural/lifestyle” markets and more “traditional” markets
Balanced unit growth with 70% coming from existing markets
14% unit growth for the near-term
Nevada
5
Utah
5
Colorado
26
Kansas
3
Missouri
2
California
82
Tennessee
2
Arizona
29
Oklahoma
7
South Carolina
Arkansas
New Mexico
6
7
Texas
35
3
North Carolina
Georgia
Louisiana
Alabama
Mississippi
Florida
Existing Market
Mid-Term Expansion Market
1 Based on an assumed new store growth rate of 14% per year and research conducted by Buxton Company in 2012.
12
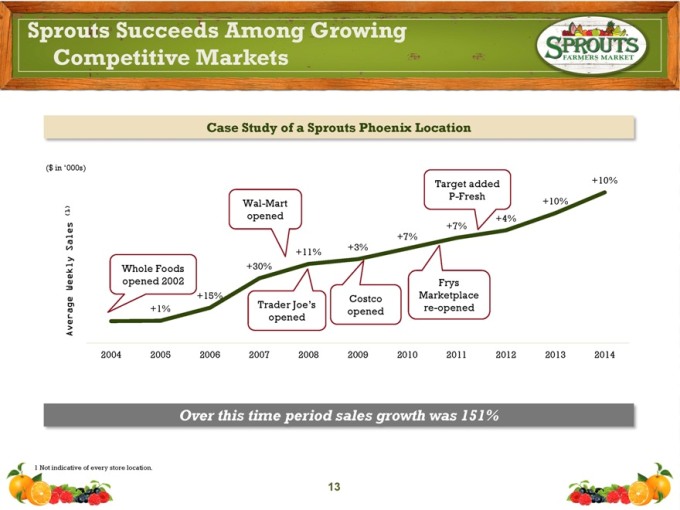
Sprouts Succeeds Among Growing Competitive Markets
SPROUTS FARMERS MARKET
Case Study of a Sprouts Phoenix Location
($ in ‘000s)
Average Weekly Sales (1)
Whole Foods opened 2002
Wal-Mart opened
Target added P-Fresh
+1%
+15%
+30%
+11%
+3%
+7%
+7%
+4%
+10%
+10%
Trader Joe’s opened
Costco opened
Frys Marketplace re-opened
2004 2005 2006 2007 2008 2009 2010 2011 2012 2013 2014
Over this time period sales growth was 151%
1 Not indicative of every store location.
13
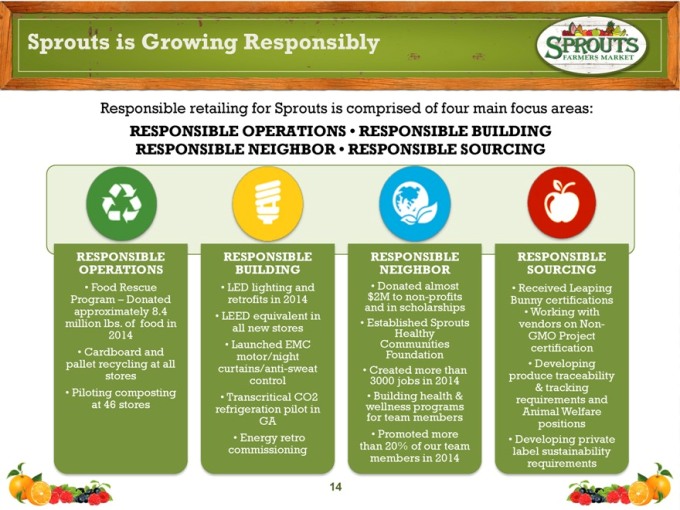
Sprouts is Growing Responsibly
SPROUTS FARMERS MARKET
Responsible retailing for Sprouts is comprised of four main focus areas:
RESPONSIBLE OPERATIONS • RESPONSIBLE BUILDING
RESPONSIBLE NEIGHBOR • RESPONSIBLE SOURCING
RESPONSIBLE OPERATIONS
Food Rescue
Program – Donated approximately 8.4 million lbs. of food in 2014
Cardboard and pallet recycling at all stores
Piloting composting at 46 stores
RESPONSIBLE BUILDING
LED lighting and retrofits in 2014
LEED equivalent in all new stores
Launched EMC motor/night curtains/anti-sweat control
• Transcritical CO2 refrigeration pilot in GA
• Energy retro commissioning
RESPONSIBLE NEIGHBOR Donated almost $2M to non-profits and in scholarships
Established Healthy Sprouts Communities Foundation
Created more than 3000 jobs in 2014
Building health & wellness programs for team members
Promoted more than 20% of our team members in 2014
RESPONSIBLE SOURCING
Received Leaping Bunny certifications
Working with vendors on Non-GMO Project certification
Developing produce traceability & tracking requirements and Animal Welfare positions
Developing private label sustainability requirements
14
SPROUTS FARMERS MARKET
BUSINESS & FINANCIAL PERFOMANCE
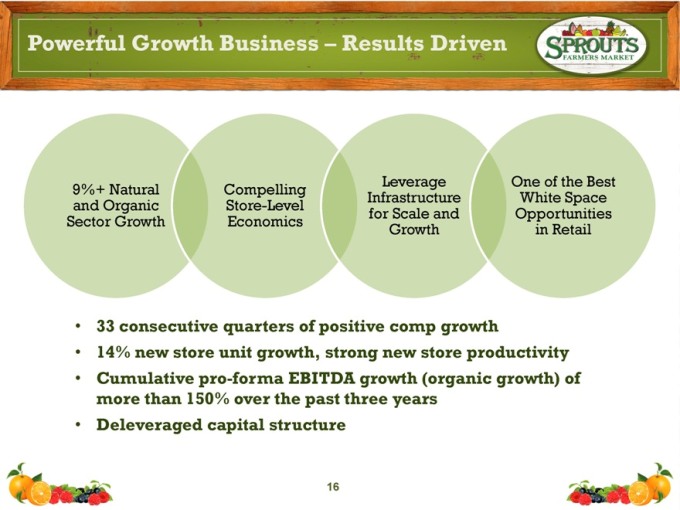
Powerful Growth Business – Results Driven
SPROUTS FARMERS MARKET
9%+ Natural and Organic Sector Growth
Compelling Store-Level Economics
Leverage Infrastructure for Scale and Growth
One of the Best White Space Opportunities in Retail
33 consecutive quarters of positive comp growth
14% new store unit growth, strong new store productivity
Cumulative pro-forma EBITDA growth (organic growth) of more than 150% over the past three years
Deleveraged capital structure
16
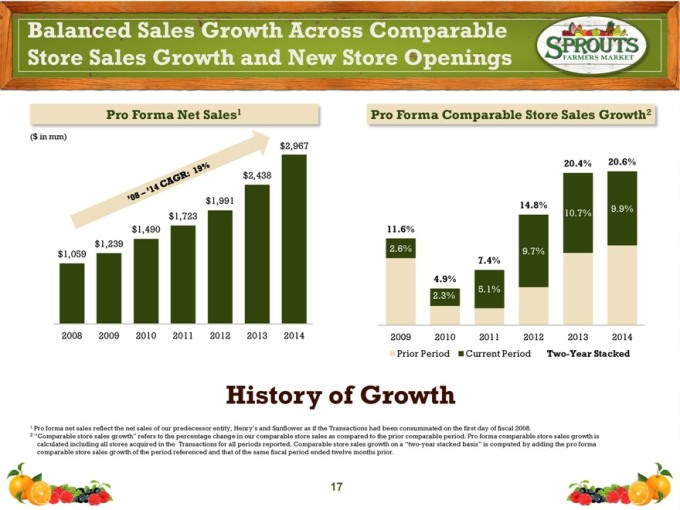
Balanced Sales Growth Across Comparable Store Sales Growth and New Store Openings
SPROUTS FARMERS MARKET
Pro Forma Net Sales1
($ in mm)
‘08 – ‘14 CAGR: 19%
$2,967
$2,438
$1,991
$1,723
$1,490
$1,239
$1,059
2008 2009 2010 2011 2012 2013 2014
Pro Forma Comparable Store Sales Growth2
11.6%
2.6%
4.9%
2.3%
7.4%
5.1%
14.8%
9.7%
20.4%
10.7%
20.6%
9.9%
2009 2010 2011 2012 2013 2014
Prior Period Current Period Two-Year Stacked
History of Growth
1 Pro forma net sales reflect the net sales of our predecessor entity, Henry’s and Sunflower as if the Transactions had been consummated on the first day of fiscal 2008.
2 “Comparable store sales growth” refers to the percentage change in our comparable store sales as compared to the prior comparable period. Pro forma comparable store sales growth is calculated including all stores acquired in the Transactions for all periods reported. Comparable store sales growth on a “two-year stacked basis” is computed by adding the pro forma comparable store sales growth of the period referenced and that of the same fiscal period ended twelve months prior.
17
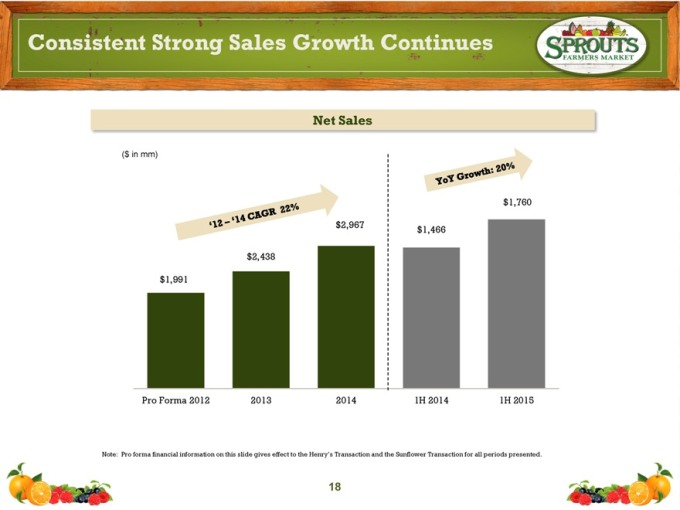
Consistent Strong Sales Growth Continues
SPROUTS FARMERS MARKET
Net Sales
($ in mm)
‘12 – ‘14 CAGR 22%
YoY Growth: 20%
$1,991
Pro Forma 2012
$2,438
2013
$2,967
2014
$1,466
1H 2014
$1,760
1H 2015
Note: Pro forma financial information on this slide gives effect to the Henry’s Transaction and the Sunflower Transaction for all periods presented.
18
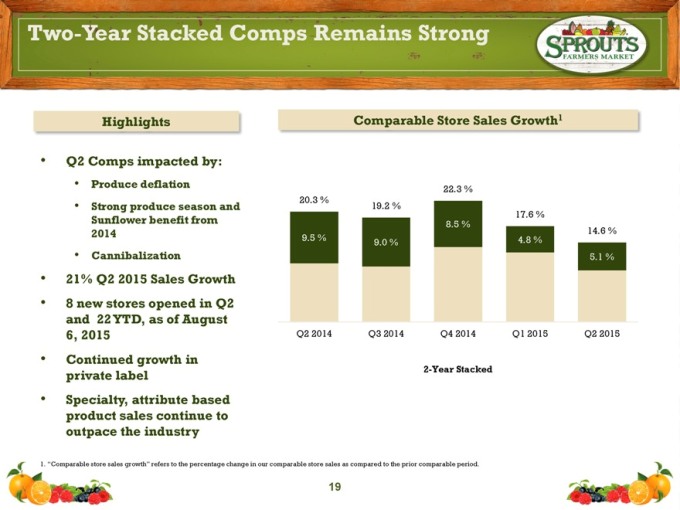
Two-Year Stacked Comps Remains Strong
SPROUTS FARMERS MARKET
Highlights
Q2 Comps impacted by:
Produce deflation
Strong produce season and Sunflower benefit from 2014
Cannibalization
21% Q2 2015 Sales Growth
8 new stores opened in Q2 and 22 YTD, as of August 6, 2015
Continued growth in private label
Specialty, attribute based product sales continue to outpace the industry
Comparable Store Sales Growth1
20.3 %
9.5 %
Q2 2014
19.2 %
9.0 %
Q3 2014
22.3 %
8.5 %
Q4 2014
17.6 %
4.8 %
Q1 2015
14.6 %
5.1 %
Q2 2015
2-Year Stacked
1. “Comparable store sales growth” refers to the percentage change in our comparable store sales as compared to the prior comparable period.
19
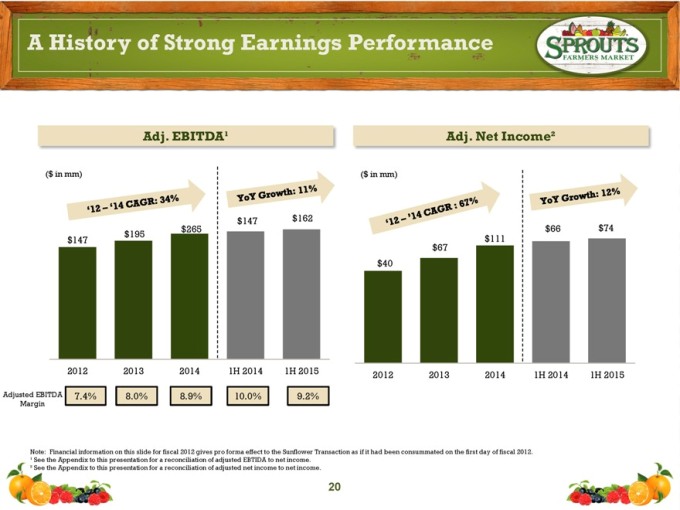
A History of Strong Earnings Performance
SPROUTS FARMERS MARKET
Adj. EBITDA1
($ in mm)
‘12 – ‘14 CAGR: 34%
YOY Growth: 11%
$147
2012
$195
2013
$265
2014
$147
1H 2014
$162
1H 2015
Adjusted EBITDA 7.4% 8.0% 8.9% 10.0% 9.2%
Margin
($ in mm)
‘12 – ‘14 CAGR: 67%
YOY Growth: 12%
$40
2012
$67
2013
$111
2014
$66
1H 2014
$74
1H 2015
Note: Financial information on this slide for fiscal 2012 gives pro forma effect to the Sunflower Transaction as if it had been consummated on the first day of fiscal 2012.
1 See the Appendix to this presentation for a reconciliation of adjusted EBTIDA to net income.
2 See the Appendix to this presentation for a reconciliation of adjusted net income to net income.
20
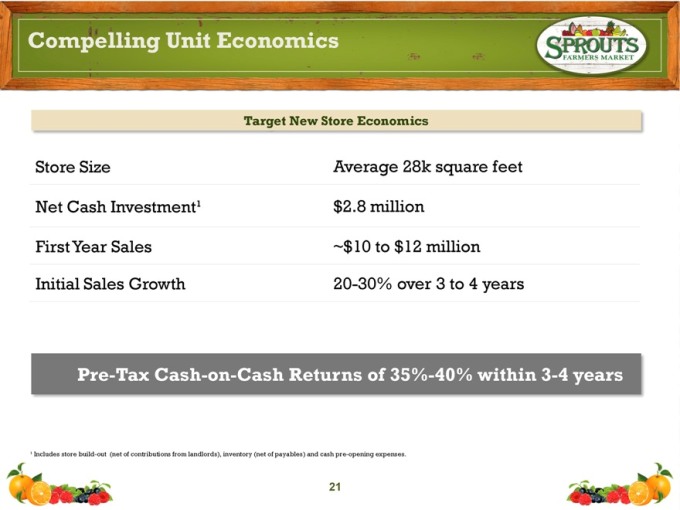
Compelling Unit Economics
SPROUTS FARMERS MARKET
Target New Store Economics
Store Size
Net Cash Investment1
First Year Sales
Initial Sales Growth
Average 28k square feet
$2.8 million
~$10 to $12 million
20-30% over 3 to 4 years
Pre-Tax Cash-on-Cash Returns of 35%-40% within 3-4 years
1 Includes store build-out (net of contributions from landlords), inventory (net of payables) and cash pre-opening expenses.
21
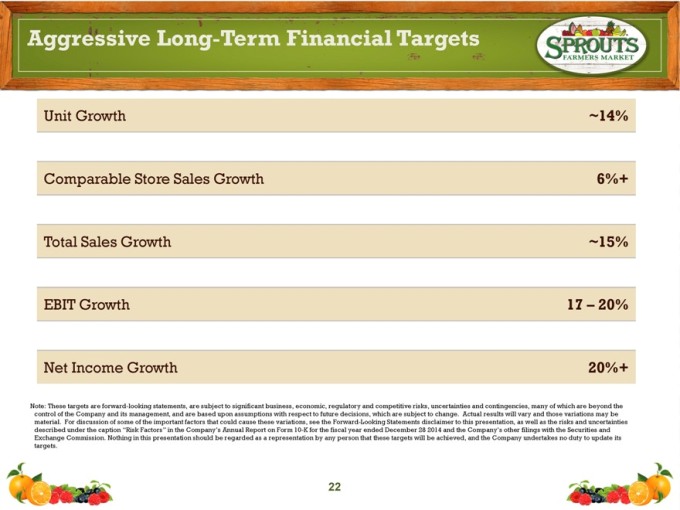
Aggressive Long-Term Financial Targets
SPROUTS FARMERS MARKET
Unit Growth
Comparable Store Sales Growth
Total Sales Growth
EBIT Growth
Net Income Growth
~14%
6%+
~15%
17 – 20%
20%+
Note: These targets are forward-looking statements, are subject to significant business, economic, regulatory and competitive risks, uncertainties and contingencies, many of which are beyond the control of the Company and its management, and are based upon assumptions with respect to future decisions, which are subject to change. Actual results will vary and those variations may be material. For discussion of some of the important factors that could cause these variations, see the Forward-Looking Statements disclaimer to this presentation, as well as the risks and uncertainties described under the caption “Risk Factors” in the Company’s Annual Report on Form 10-K for the fiscal year ended December 28 2014 and the Company’s other filings with the Securities and Exchange Commission. Nothing in this presentation should be regarded as a representation by any person that these targets will be achieved, and the Company undertakes no duty to update its targets.
22
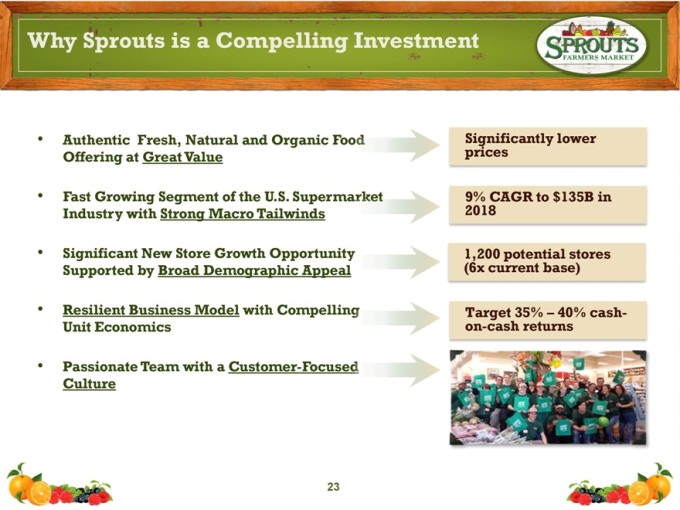
Why Sprouts is a Compelling Investment
SPROUTS FARMERS MARKET
Authentic Fresh, Natural and Organic Food Offering at Great Value
Fast Growing Segment of the U.S. Supermarket Industry with Strong Macro Tailwinds
Significant New Store Growth Opportunity Supported by Broad Demographic Appeal
Resilient Business Model with Compelling Unit Economics
Passionate Team with a Customer-Focused Culture
Significantly lower prices
9% CAGR to $135B in 2018
1,200 potential stores (6x current base)
Target 35% – 40% cash-on-cash returns
23
SPROUTS FARMERS MARKET
APPENDIX: SUPPLEMENTAL MATERIALS
Appendix
SPROUTS FARMERS MARKET
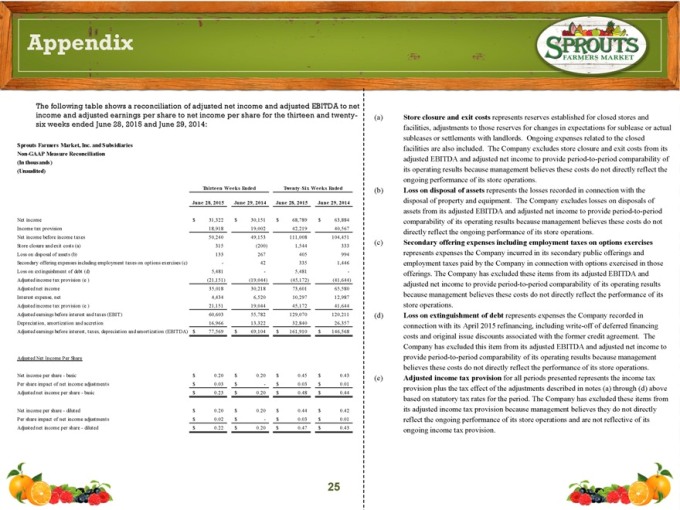
The following table shows a reconciliation of adjusted net income and adjusted EBITDA to net income and adjusted earnings per share to net income per share for the thirteen and twenty-six weeks ended June 28, 2015 and June 29, 2014:
Sprouts Farmers Market, Inc. and Subsidiaries
Non-GAAP Measure Reconciliation
(In thousands)
(Unaudited)
| Thirteen Weeks Ended |
Twenty-Six Weeks Ended | |||||||
| June 28, |
June 29, |
June 28, |
June 29, | |||||
| Net income |
$31,322 |
$30,151 |
$68,789 |
$63,884 | ||||
| Income tax provision |
18,918 |
19,002 |
42,219 |
40,567 | ||||
| Net income before income taxes |
50,240 |
49,153 |
111,008 |
104,451 | ||||
| Store closure and exit costs (a) |
315 |
(200) |
1,544 |
333 | ||||
| Loss on disposal of assets (b) |
133 |
267 |
405 |
994 | ||||
| Secondary offering expenses including employment taxes on options exercises (c) |
- |
42 |
335 |
1,446 | ||||
| Loss on extinguishment of debt (d) |
5,481 |
- |
5,481 |
- | ||||
| Adjusted income tax provision (e) |
(21,151) |
(19,044) |
(45,172) |
(41,644) | ||||
| Adjusted net income |
35,018 |
30,218 |
73,601 |
65,580 | ||||
| Interest expense, net |
4,434 |
6,520 |
10,297 |
12,987 | ||||
| Adjusted income tax provision (e ) |
21,151 |
19,044 |
45,172 |
41,644 | ||||
| Adjusted earnings before interest and taxes (EBIT) |
60,603 |
55,782 |
129,070 |
120,211 | ||||
| Depreciation, amortization and accretion |
16,966 |
13,322 |
32,840 |
26,357 | ||||
| Adjusted earnings before interest, taxes, depreciation and amortization (EBITDA) |
$77,569 |
$69,104 |
$161,910 |
$146,568 | ||||
| Adjusted Net Income Per Share |
||||||||
| Net income per share - basic |
$0.20 |
$0.20 |
$0.45 |
$0.43 | ||||
| Per share impact of net income adjustments |
$0.03 |
$ - |
$0.03 |
$0.01 | ||||
| Adjusted net income per share - basic |
$0.23 |
$0.20 |
$0.48 |
$0.44 | ||||
| Net income per share - diluted |
$0.20 |
$0.20 |
$0.44 |
$0.42 | ||||
| Per share impact of net income adjustments |
$0.02 |
$ - |
$0.03 |
$0.01 | ||||
| Adjusted net income per share - diluted |
$0.22 |
$0.20 |
$0.47 |
$0.43 | ||||
(a) Store closure and exit costs represents reserves established for closed stores and facilities, adjustments to those reserves for changes in expectations for sublease or actual subleases or settlements with landlords. Ongoing expenses related to the closed facilities are also included. The Company excludes store closure and exit costs from its adjusted EBITDA and adjusted net income to provide period-to-period comparability of its operating results because management believes these costs do not directly reflect the ongoing performance of its store operations.
(b) Loss on disposal of assets represents the losses recorded in connection with the disposal of property and equipment. The Company excludes losses on disposals of assets from its adjusted EBITDA and adjusted net income to provide period-to-period comparability of its operating results because management believes these costs do not directly reflect the ongoing performance of its store operations.
(c) Secondary offering expenses including employment taxes on options exercises represents expenses the Company incurred in its secondary public offerings and employment taxes paid by the Company in connection with options exercised in those offerings. The Company has excluded these items from its adjusted EBITDA and adjusted net income to provide period-to-period comparability of its operating results because management believes these costs do not directly reflect the performance of its store operations.
(d) Loss on extinguishment of debt represents expenses the Company recorded in connection with its April 2015 refinancing, including write-off of deferred financing costs and original issue discounts associated with the former credit agreement. The Company has excluded this item from its adjusted EBITDA and adjusted net income to provide period-to-period comparability of its operating results because management believes these costs do not directly reflect the performance of its store operations.
(e) Adjusted income tax provision for all periods presented represents the income tax provision plus the tax effect of the adjustments described in notes (a) through (d) above based on statutory tax rates for the period. The Company has excluded these items from its adjusted income tax provision because management believes they do not directly reflect the ongoing performance of its store operations and are not reflective of its ongoing income tax provision.
25
SPROUTS
FARMERS MARKET
Thank you!