Attached files
| file | filename |
|---|---|
| 8-K - 8-K - BROADRIDGE FINANCIAL SOLUTIONS, INC. | form8-kreearningsandpresen.htm |
| EX-99.2 - EXHIBIT 99.2 - BROADRIDGE FINANCIAL SOLUTIONS, INC. | ex992presentation.htm |
| EX-99.1 - EXHIBIT 99.1 - BROADRIDGE FINANCIAL SOLUTIONS, INC. | ex991earningsrelease-20150.htm |

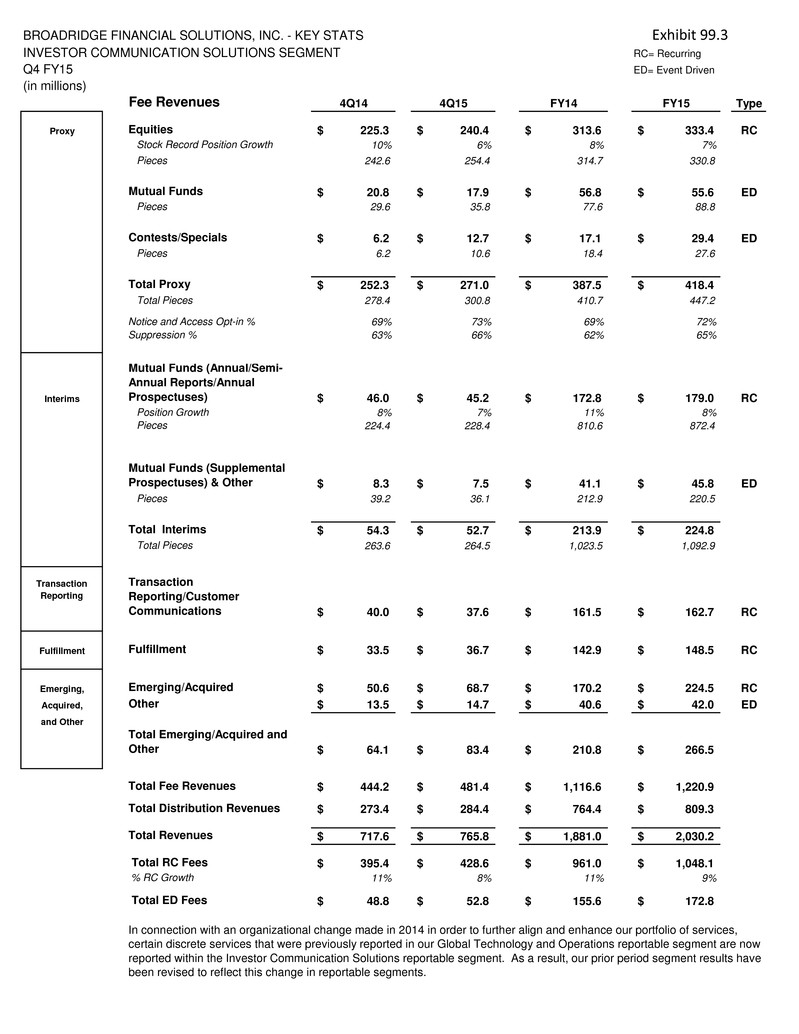
BROADRIDGE FINANCIAL SOLUTIONS, INC. - KEY STATS Exhibit 99.3 INVESTOR COMMUNICATION SOLUTIONS SEGMENT RC= Recurring Q4 FY15 ED= Event Driven (in millions) Fee Revenues 4Q14 4Q15 FY14 FY15 Type Proxy Equities 225.3$ 240.4$ 313.6$ 333.4$ RC Stock Record Position Growth 10% 6% 8% 7% Pieces 242.6 254.4 314.7 330.8 Mutual Funds 20.8$ 17.9$ 56.8$ 55.6$ ED Pieces 29.6 35.8 77.6 88.8 Contests/Specials 6.2$ 12.7$ 17.1$ 29.4$ ED Pieces 6.2 10.6 18.4 27.6 Total Proxy 252.3$ 271.0$ 387.5$ 418.4$ Total Pieces 278.4 300.8 410.7 447.2 Notice and Access Opt-in % 69% 73% 69% 72% Suppression % 63% 66% 62% 65% Interims Mutual Funds (Annual/Semi- Annual Reports/Annual Prospectuses) 46.0$ 45.2$ 172.8$ 179.0$ RC Position Growth 8% 7% 11% 8% Pieces 224.4 228.4 810.6 872.4 Mutual Funds (Supplemental Prospectuses) & Other 8.3$ 7.5$ 41.1$ 45.8$ ED Pieces 39.2 36.1 212.9 220.5 Total Interims 54.3$ 52.7$ 213.9$ 224.8$ Total Pieces 263.6 264.5 1,023.5 1,092.9 Transaction Reporting Transaction Reporting/Customer Communications 40.0$ 37.6$ 161.5$ 162.7$ RC Fulfillment Fulfillment 33.5$ 36.7$ 142.9$ 148.5$ RC Emerging, Emerging/Acquired 50.6$ 68.7$ 170.2$ 224.5$ RC Acquired, Other 13.5$ 14.7$ 40.6$ 42.0$ ED and Other Total Emerging/Acquired and Other 64.1$ 83.4$ 210.8$ 266.5$ Total Fee Revenues 444.2$ 481.4$ 1,116.6$ 1,220.9$ Total Distribution Revenues 273.4$ 284.4$ 764.4$ 809.3$ Total Revenues 717.6$ 765.8$ 1,881.0$ 2,030.2$ Total RC Fees 395.4$ 428.6$ 961.0$ 1,048.1$ % RC Growth 11% 8% 11% 9% Total ED Fees 48.8$ 52.8$ 155.6$ 172.8$ In connection with an organizational change made in 2014 in order to further align and enhance our portfolio of services, certain discrete services that were previously reported in our Global Technology and Operations reportable segment are now reported within the Investor Communication Solutions reportable segment. As a result, our prior period segment results have been revised to reflect this change in reportable segments.

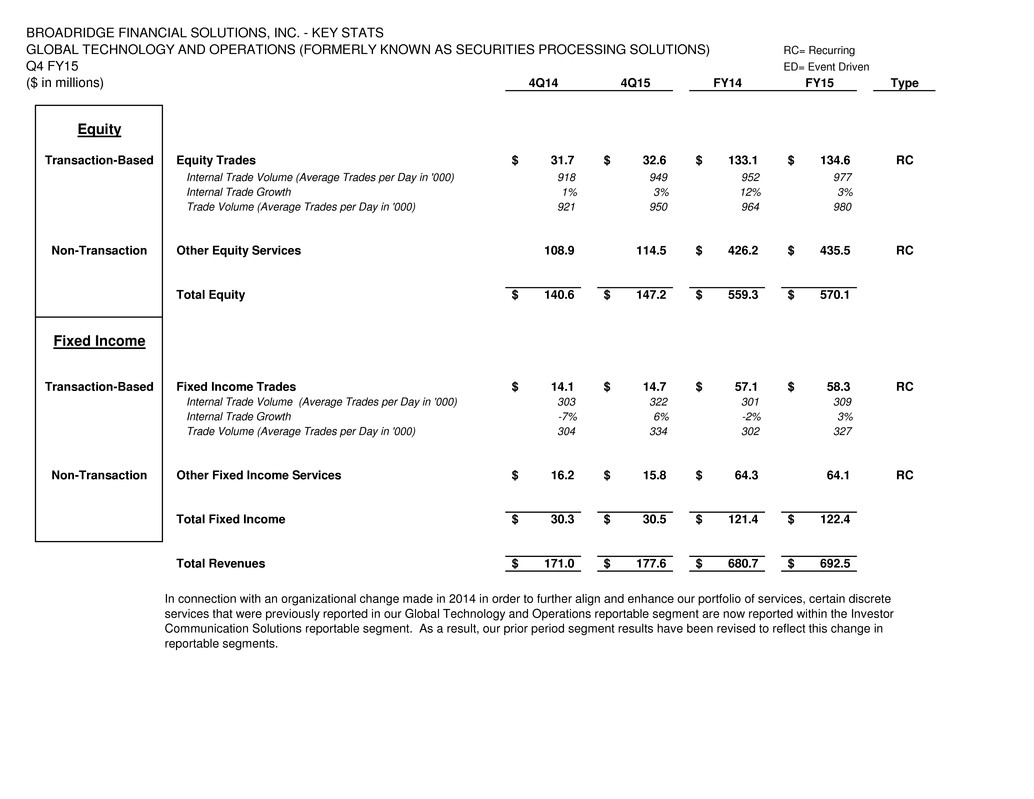
BROADRIDGE FINANCIAL SOLUTIONS, INC. - KEY STATS GLOBAL TECHNOLOGY AND OPERATIONS (FORMERLY KNOWN AS SECURITIES PROCESSING SOLUTIONS) RC= Recurring Q4 FY15 ED= Event Driven ($ in millions) 4Q14 4Q15 FY14 FY15 Type Equity Transaction-Based Equity Trades 31.7$ 32.6$ 133.1$ 134.6$ RC Internal Trade Volume (Average Trades per Day in '000) 918 949 952 977 Internal Trade Growth 1% 3% 12% 3% Trade Volume (Average Trades per Day in '000) 921 950 964 980 Non-Transaction Other Equity Services 108.9 114.5 426.2$ 435.5$ RC Total Equity 140.6$ 147.2$ 559.3$ 570.1$ Fixed Income Transaction-Based Fixed Income Trades 14.1$ 14.7$ 57.1$ 58.3$ RC Internal Trade Volume (Average Trades per Day in '000) 303 322 301 309 Internal Trade Growth -7% 6% -2% 3% Trade Volume (Average Trades per Day in '000) 304 334 302 327 Non-Transaction Other Fixed Income Services 16.2$ 15.8$ 64.3$ 64.1 RC Total Fixed Income 30.3$ 30.5$ 121.4$ 122.4$ Total Revenues 171.0$ 177.6$ 680.7$ 692.5$ In connection with an organizational change made in 2014 in order to further align and enhance our portfolio of services, certain discrete services that were previously reported in our Global Technology and Operations reportable segment are now reported within the Investor Communication Solutions reportable segment. As a result, our prior period segment results have been revised to reflect this change in reportable segments.
