Attached files
| file | filename |
|---|---|
| 8-K - 8-K - BROADRIDGE FINANCIAL SOLUTIONS, INC. | form8-kreearningsandpresen.htm |
| EX-99.3 - EXHIBIT 99.3 - BROADRIDGE FINANCIAL SOLUTIONS, INC. | ex993.htm |
| EX-99.1 - EXHIBIT 99.1 - BROADRIDGE FINANCIAL SOLUTIONS, INC. | ex991earningsrelease-20150.htm |
1© 2014 | Earnings Webcast & Conference Call Fourth Quarter and Fiscal Year 2015 August 7, 2015 EXHIBIT 99.2
2 Forward-Looking Statements This presentation and other written or oral statements made from time to time by representatives of Broadridge may contain “forward-looking statements” within the meaning of the Private Securities Litigation Reform Act of 1995. Statements that are not historical in nature, and which may be identified by the use of words such as “expects,” “assumes,” “projects,” “anticipates,” “estimates,” “we believe,” could be” and other words of similar meaning, are forward-looking statements. In particular, information referred to as “Fiscal Year 2016 Financial Guidance” or our three-year performance objectives and outlook are forward-looking statements. These statements are based on management’s expectations and assumptions and are subject to risks and uncertainties that may cause actual results to differ materially from those expressed. These risks and uncertainties include those risk factors discussed in Part I, “Item 1A. Risk Factors” of our Annual Report on Form 10-K for the fiscal year ended June 30, 2015 (the “2015 Annual Report”), as they may be updated in any future reports filed with the Securities and Exchange Commission. All forward-looking statements speak only as of the date of this presentation and are expressly qualified in their entirety by reference to the factors discussed in the 2015 Annual Report. These risks include: the success of Broadridge in retaining and selling additional services to its existing clients and in obtaining new clients; Broadridge’s reliance on a relatively small number of clients, the continued financial health of those clients, and the continued use by such clients of Broadridge’s services with favorable pricing terms; changes in laws and regulations affecting Broadridge’s clients or the services provided by Broadridge; declines in participation and activity in the securities markets; any material breach of Broadridge security affecting its clients’ customer information; the failure of Broadridge’s outsourced data center services provider to provide the anticipated levels of service; a disaster or other significant slowdown or failure of Broadridge’s systems or error in the performance of Broadridge’s services; overall market and economic conditions and their impact on the securities markets; Broadridge’s failure to keep pace with changes in technology and demands of its clients; Broadridge’s ability to attract and retain key personnel; the impact of new acquisitions and divestitures; and competitive conditions. Broadridge disclaims any obligation to update or revise forward-looking statements that may be made to reflect events or circumstances that arise after the date made or to reflect the occurrence of unanticipated events, other than as required by law.
3 Explanation and Reconciliation of the Company’s Use of Non-GAAP Financial Measures The Company's results in this presentation are presented in accordance with generally accepted accounting principles in the United States (“GAAP”) except where otherwise noted. In certain circumstances, results have been presented on an adjusted basis and are not generally accepted accounting principles measures (“Non-GAAP”). These Non-GAAP financial measures should be viewed in addition to, and not as a substitute for, the Company's reported results. With regard to statements in this presentation that include certain Non-GAAP financial measures, the adjusted earnings measures are adjusted to exclude the impact of certain costs, expenses, gains and losses and other specified items that management believes are not indicative of our ongoing performance. These adjusted measures exclude the impact of Acquisition Amortization and Other Costs which represent the amortization charges associated with intangible asset values as well as other deal costs associated with the Company’s acquisitions. The Adjusted Operating income margin and Adjusted Diluted earnings per share fiscal year 2016 guidance provided in this presentation is adjusted to exclude the projected impact of Acquisition Amortization and Other Costs. We also provide information on our Free cash flows because we believe this information helps our investors understand the amount of cash available for dividends, share repurchases, acquisitions and other discretionary investments. Free cash flows is a Non-GAAP measure and is defined by the Company as Net cash flows provided by operating activities less capital expenditures and purchases of intangibles. The Company believes Non-GAAP financial information helps investors understand the effect of these items on our reported results and provides a better representation of our operating performance. These Non-GAAP measures are indicators that management uses to provide additional meaningful comparisons between our current results and prior reported results, and as a basis for planning and forecasting for future periods. Reconciliations of such Non-GAAP measures to the most directly comparable financial measures presented in accordance with GAAP can be found in the attached Appendix. Use of Material Contained Herein The information contained in this presentation is being provided for your convenience and information only. This information is accurate as of the date of its initial presentation. If you plan to use this information for any purpose, verification of its continued accuracy is your responsibility. Broadridge assumes no duty to update or revise the information contained in this presentation. You may reproduce information contained in this presentation provided you do not alter, edit, or delete any of the content and provided you identify the source of the information as Broadridge Financial Solutions, Inc., which owns the copyright. Broadridge and the Broadridge logo are registered trademarks of Broadridge Financial Solutions, Inc.
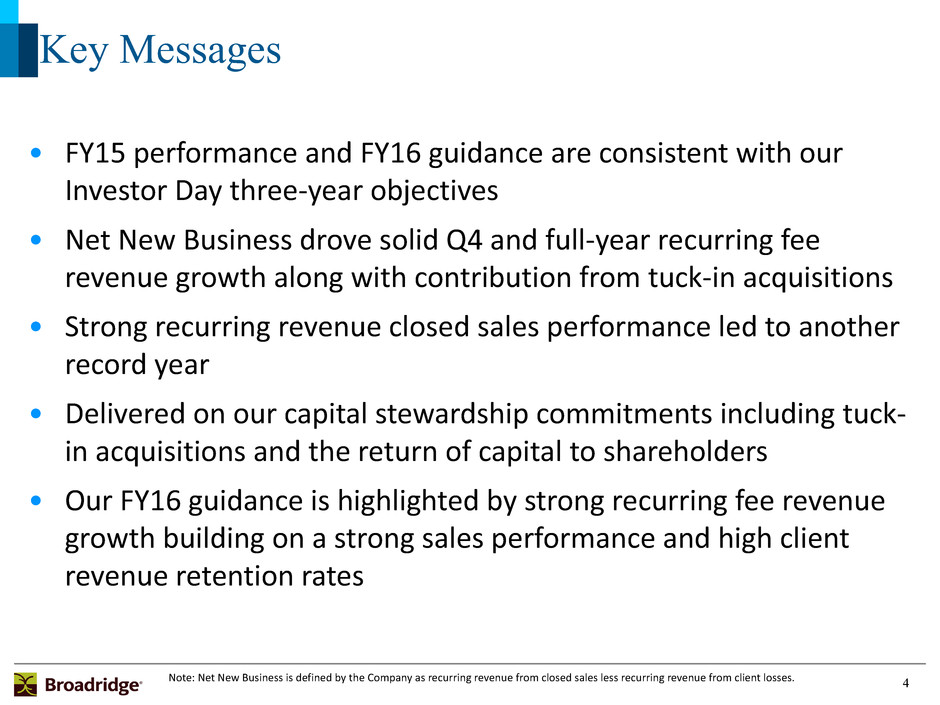
4 Key Messages • FY15 performance and FY16 guidance are consistent with our Investor Day three-year objectives • Net New Business drove solid Q4 and full-year recurring fee revenue growth along with contribution from tuck-in acquisitions • Strong recurring revenue closed sales performance led to another record year • Delivered on our capital stewardship commitments including tuck- in acquisitions and the return of capital to shareholders • Our FY16 guidance is highlighted by strong recurring fee revenue growth building on a strong sales performance and high client revenue retention rates B Note: Net New Business is defined by the Company as recurring revenue from closed sales less recurring revenue from client losses.
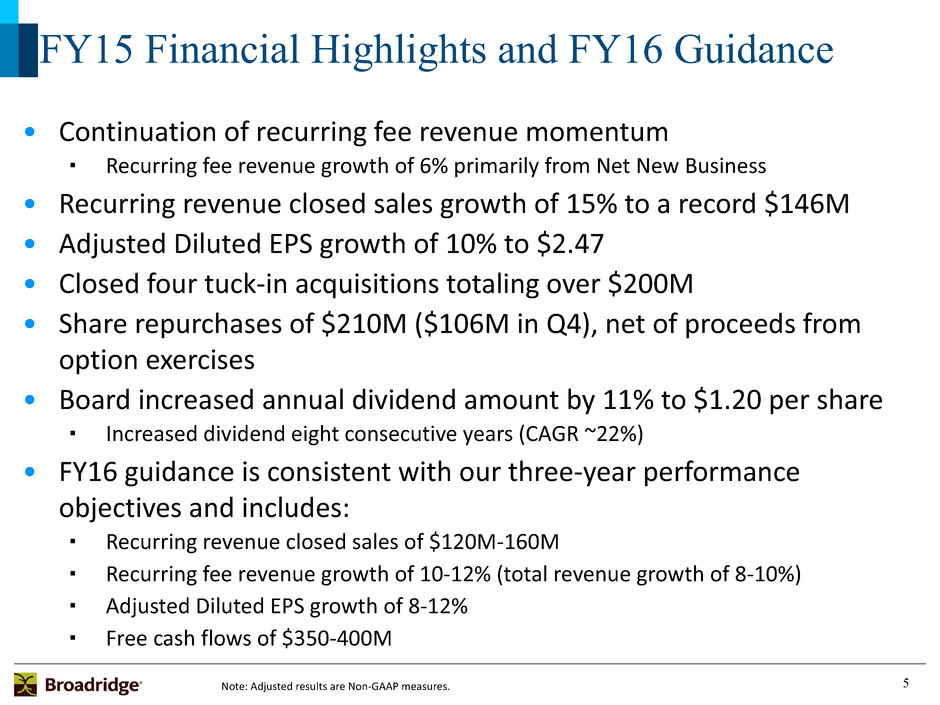
5 FY15 Financial Highlights and FY16 Guidance • Continuation of recurring fee revenue momentum ▪ Recurring fee revenue growth of 6% primarily from Net New Business • Recurring revenue closed sales growth of 15% to a record $146M • Adjusted Diluted EPS growth of 10% to $2.47 • Closed four tuck-in acquisitions totaling over $200M • Share repurchases of $210M ($106M in Q4), net of proceeds from option exercises • Board increased annual dividend amount by 11% to $1.20 per share ▪ Increased dividend eight consecutive years (CAGR ~22%) • FY16 guidance is consistent with our three-year performance objectives and includes: ▪ Recurring revenue closed sales of $120M-160M ▪ Recurring fee revenue growth of 10-12% (total revenue growth of 8-10%) ▪ Adjusted Diluted EPS growth of 8-12% ▪ Free cash flows of $350-400M Note: Adjusted results are Non-GAAP measures.
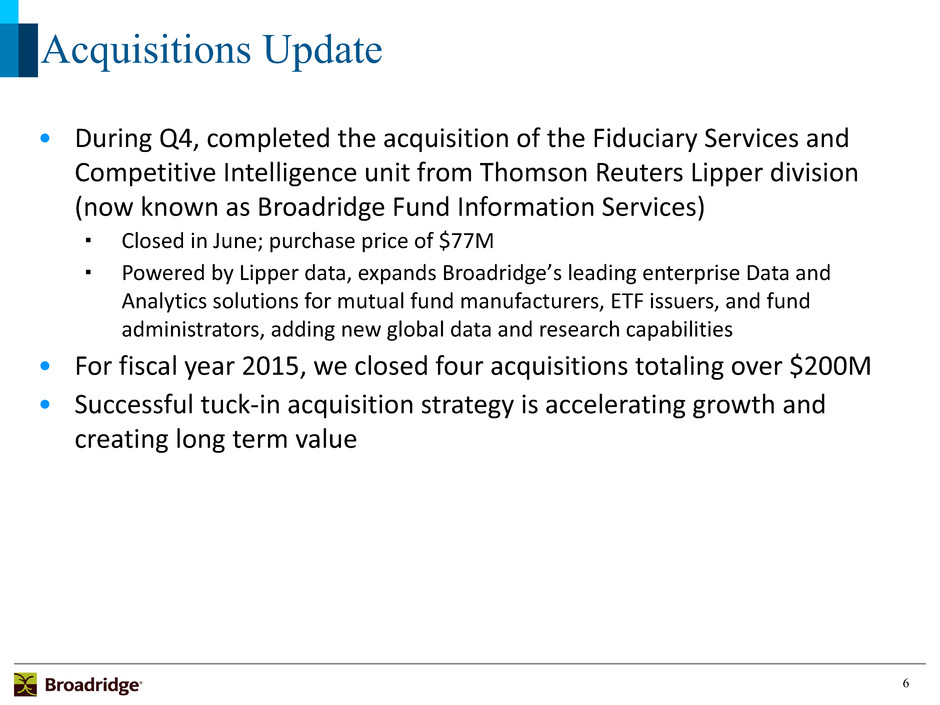
6 Acquisitions Update • During Q4, completed the acquisition of the Fiduciary Services and Competitive Intelligence unit from Thomson Reuters Lipper division (now known as Broadridge Fund Information Services) ▪ Closed in June; purchase price of $77M ▪ Powered by Lipper data, expands Broadridge’s leading enterprise Data and Analytics solutions for mutual fund manufacturers, ETF issuers, and fund administrators, adding new global data and research capabilities • For fiscal year 2015, we closed four acquisitions totaling over $200M • Successful tuck-in acquisition strategy is accelerating growth and creating long term value
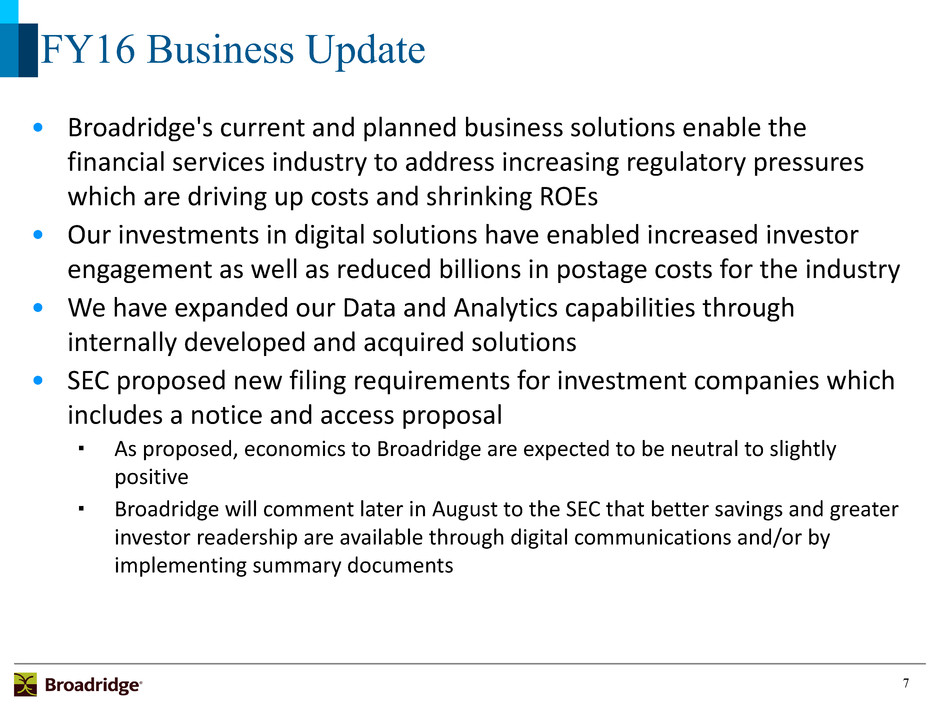
7 FY16 Business Update • Broadridge's current and planned business solutions enable the financial services industry to address increasing regulatory pressures which are driving up costs and shrinking ROEs • Our investments in digital solutions have enabled increased investor engagement as well as reduced billions in postage costs for the industry • We have expanded our Data and Analytics capabilities through internally developed and acquired solutions • SEC proposed new filing requirements for investment companies which includes a notice and access proposal ▪ As proposed, economics to Broadridge are expected to be neutral to slightly positive ▪ Broadridge will comment later in August to the SEC that better savings and greater investor readership are available through digital communications and/or by implementing summary documents
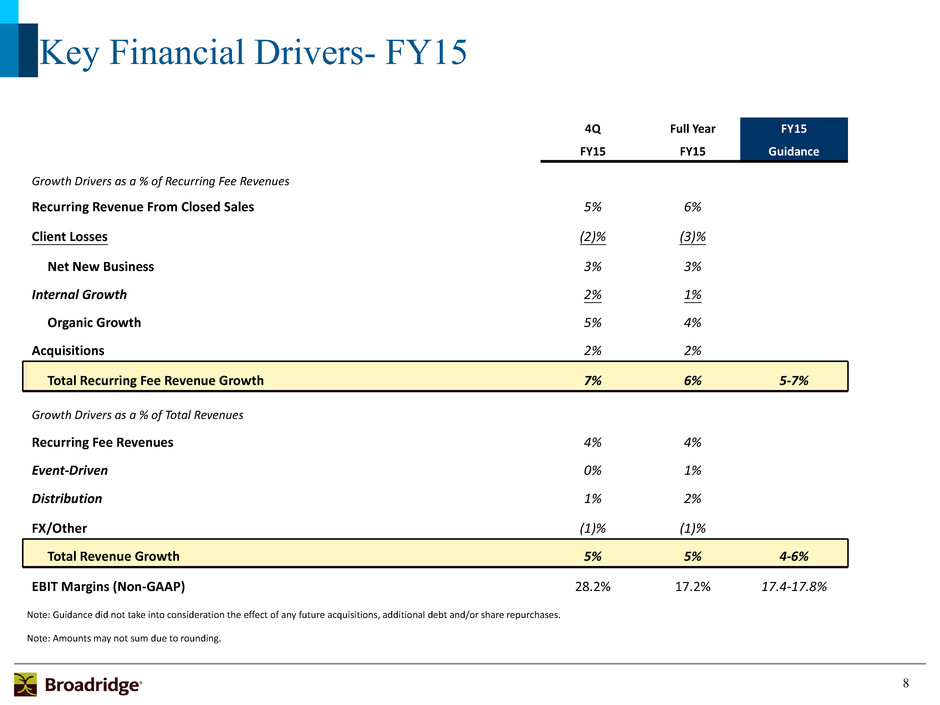
8 4Q Full Year FY15 FY15 FY15 Guidance Growth Drivers as a % of Recurring Fee Revenues Recurring Revenue From Closed Sales 5% 6% Client Losses (2)% (3)% Net New Business 3% 3% Internal Growth 2% 1% Organic Growth 5% 4% Acquisitions 2% 2% Total Recurring Fee Revenue Growth 7% 6% 5-7% Growth Drivers as a % of Total Revenues Recurring Fee Revenues 4% 4% Event-Driven 0% 1% Distribution 1% 2% FX/Other (1)% (1)% Total Revenue Growth 5% 5% 4-6% EBIT Margins (Non-GAAP) 28.2% 17.2% 17.4-17.8% Note: Guidance did not take into consideration the effect of any future acquisitions, additional debt and/or share repurchases. Note: Amounts may not sum due to rounding. Key Financial Drivers- FY15
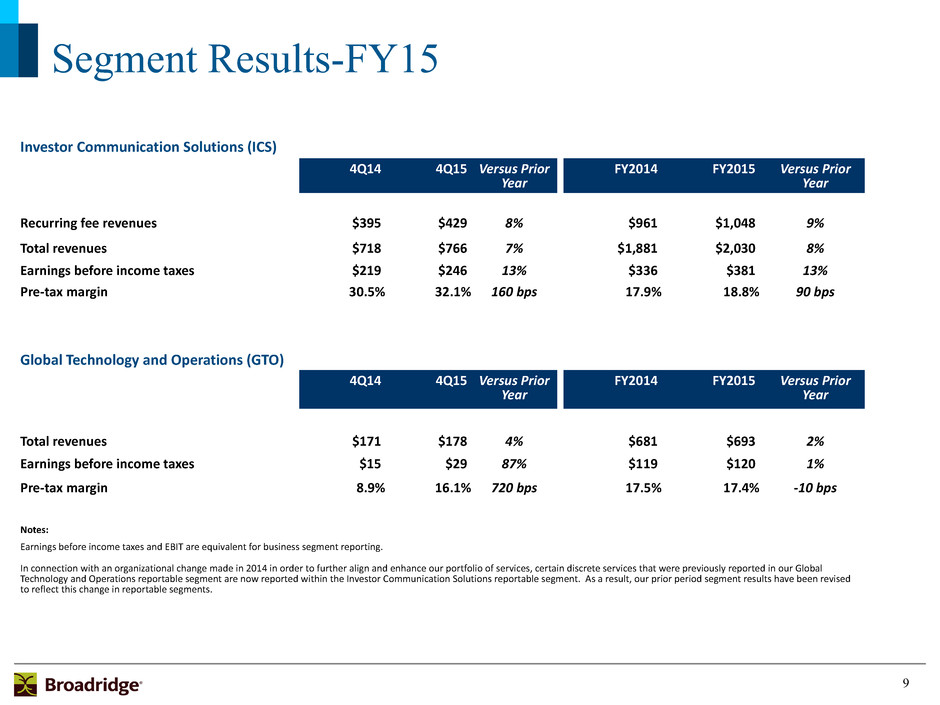
9 Investor Communication Solutions (ICS) 4Q14 4Q15 Versus Prior Year FY2014 FY2015 Versus Prior Year Recurring fee revenues $395 $429 8% $961 $1,048 9% Total revenues $718 $766 7% $1,881 $2,030 8% Earnings before income taxes $219 $246 13% $336 $381 13% Pre-tax margin 30.5% 32.1% 160 bps 17.9% 18.8% 90 bps Global Technology and Operations (GTO) 4Q14 4Q15 Versus Prior Year FY2014 FY2015 Versus Prior Year Total revenues $171 $178 4% $681 $693 2% Earnings before income taxes $15 $29 87% $119 $120 1% Pre-tax margin 8.9% 16.1% 720 bps 17.5% 17.4% -10 bps Notes: Earnings before income taxes and EBIT are equivalent for business segment reporting. In connection with an organizational change made in 2014 in order to further align and enhance our portfolio of services, certain discrete services that were previously reported in our Global Technology and Operations reportable segment are now reported within the Investor Communication Solutions reportable segment. As a result, our prior period segment results have been revised to reflect this change in reportable segments. Segment Results-FY15
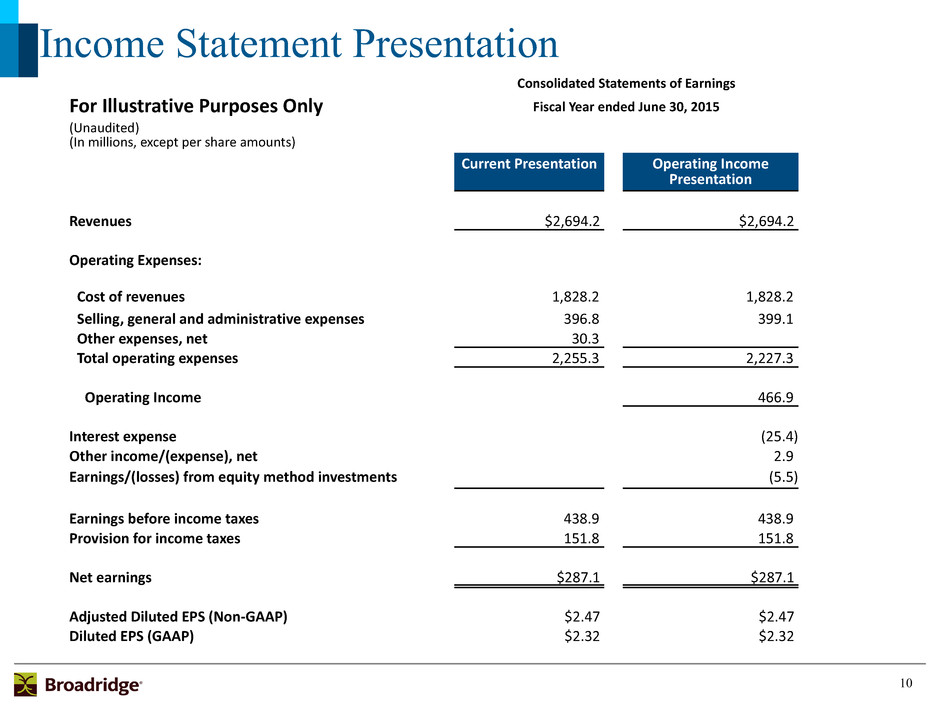
10 Income Statement Presentation Consolidated Statements of Earnings For Illustrative Purposes Only Fiscal Year ended June 30, 2015 (Unaudited) (In millions, except per share amounts) Current Presentation Operating Income Presentation Revenues $2,694.2 $2,694.2 Operating Expenses: Cost of revenues 1,828.2 1,828.2 Selling, general and administrative expenses 396.8 399.1 Other expenses, net 30.3 Total operating expenses 2,255.3 2,227.3 Operating Income 466.9 Interest expense (25.4) Other income/(expense), net 2.9 Earnings/(losses) from equity method investments (5.5) Earnings before income taxes 438.9 438.9 Provision for income taxes 151.8 151.8 Net earnings $287.1 $287.1 Adjusted Diluted EPS (Non-GAAP) $2.47 $2.47 Diluted EPS (GAAP) $2.32 $2.32
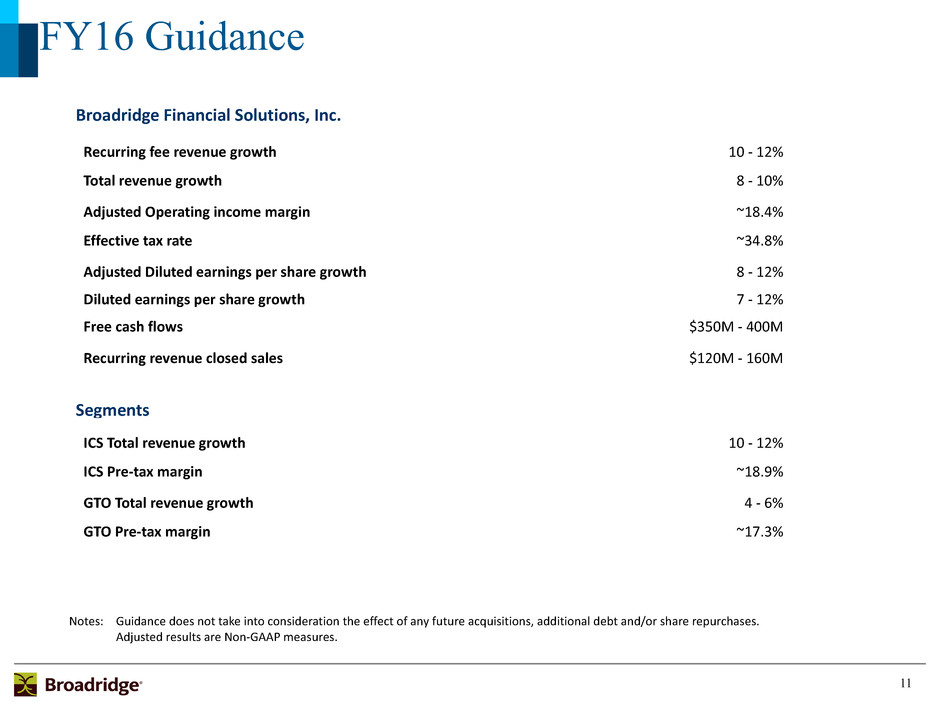
11 Broadridge Financial Solutions, Inc. Recurring fee revenue growth 10 - 12% Total revenue growth 8 - 10% Adjusted Operating income margin ~18.4% Effective tax rate ~34.8% Adjusted Diluted earnings per share growth 8 - 12% Diluted earnings per share growth 7 - 12% Free cash flows $350M - 400M Recurring revenue closed sales $120M - 160M Segments ICS Total revenue growth 10 - 12% ICS Pre-tax margin ~18.9% GTO Total revenue growth 4 - 6% GTO Pre-tax margin ~17.3% Notes: Guidance does not take into consideration the effect of any future acquisitions, additional debt and/or share repurchases. Adjusted results are Non-GAAP measures. FY16 Guidance
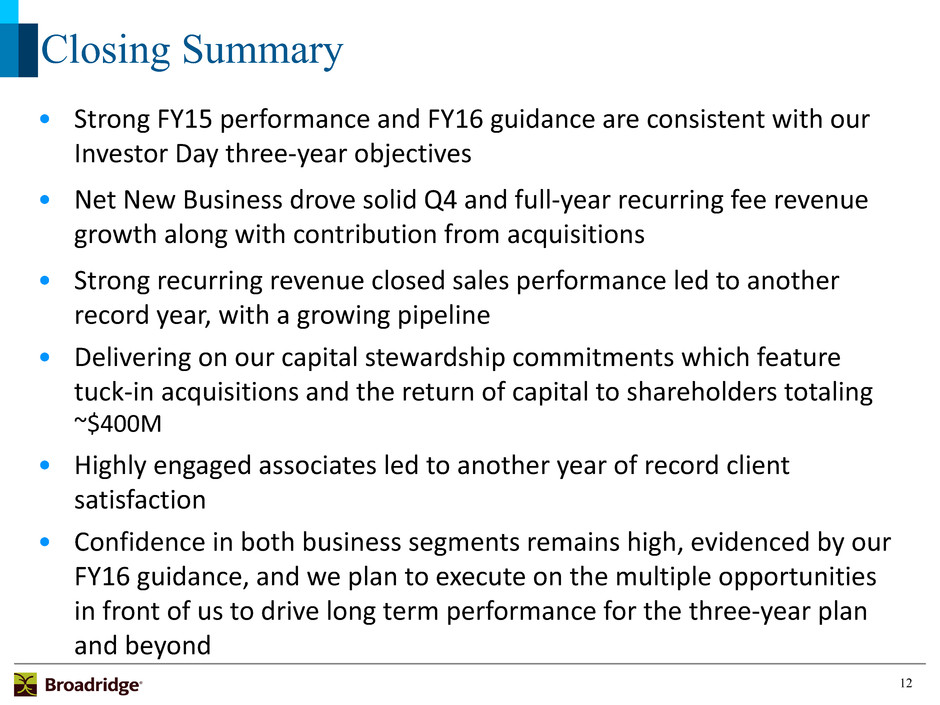
12 Closing Summary • Strong FY15 performance and FY16 guidance are consistent with our Investor Day three-year objectives • Net New Business drove solid Q4 and full-year recurring fee revenue growth along with contribution from acquisitions • Strong recurring revenue closed sales performance led to another record year, with a growing pipeline • Delivering on our capital stewardship commitments which feature tuck-in acquisitions and the return of capital to shareholders totaling ~$400M • Highly engaged associates led to another year of record client satisfaction • Confidence in both business segments remains high, evidenced by our FY16 guidance, and we plan to execute on the multiple opportunities in front of us to drive long term performance for the three-year plan and beyond
13 Q&A and Closing Comments There are no slides during this portion of the presentation
14 Appendix
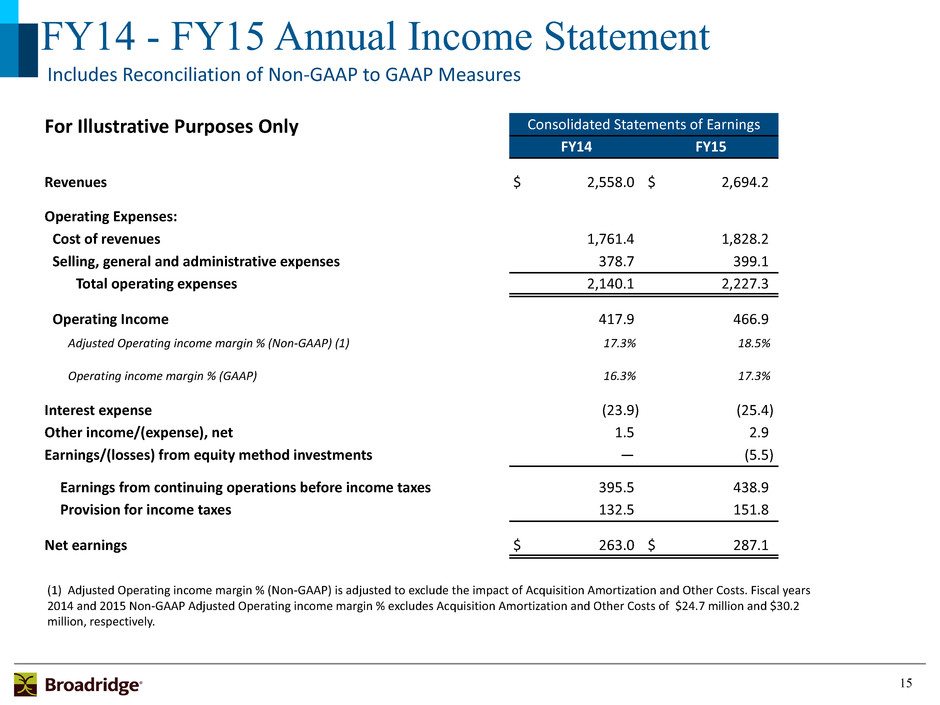
15 FY14 - FY15 Annual Income Statement For Illustrative Purposes Only Consolidated Statements of Earnings FY14 FY15 Revenues $ 2,558.0 $ 2,694.2 Operating Expenses: Cost of revenues 1,761.4 1,828.2 Selling, general and administrative expenses 378.7 399.1 Total operating expenses 2,140.1 2,227.3 Operating Income 417.9 466.9 Adjusted Operating income margin % (Non-GAAP) (1) 17.3% 18.5% Operating income margin % (GAAP) 16.3% 17.3% Interest expense (23.9) (25.4) Other income/(expense), net 1.5 2.9 Earnings/(losses) from equity method investments — (5.5) Earnings from continuing operations before income taxes 395.5 438.9 Provision for income taxes 132.5 151.8 Net earnings $ 263.0 $ 287.1 (1) Adjusted Operating income margin % (Non-GAAP) is adjusted to exclude the impact of Acquisition Amortization and Other Costs. Fiscal years 2014 and 2015 Non-GAAP Adjusted Operating income margin % excludes Acquisition Amortization and Other Costs of $24.7 million and $30.2 million, respectively. Includes Reconciliation of Non-GAAP to GAAP Measures
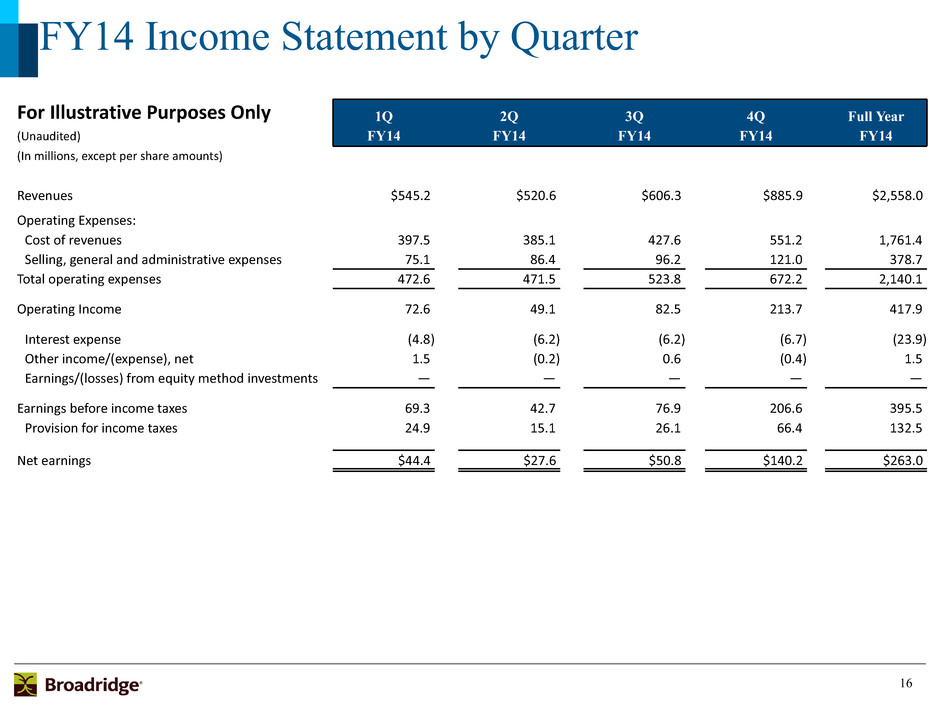
16 FY14 Income Statement by Quarter For Illustrative Purposes Only 1Q 2Q 3Q 4Q Full Year (Unaudited) FY14 FY14 FY14 FY14 FY14 (In millions, except per share amounts) Revenues $545.2 $520.6 $606.3 $885.9 $2,558.0 Operating Expenses: Cost of revenues 397.5 385.1 427.6 551.2 1,761.4 Selling, general and administrative expenses 75.1 86.4 96.2 121.0 378.7 Total operating expenses 472.6 471.5 523.8 672.2 2,140.1 Operating Income 72.6 49.1 82.5 213.7 417.9 Interest expense (4.8) (6.2) (6.2) (6.7) (23.9) Other income/(expense), net 1.5 (0.2) 0.6 (0.4) 1.5 Earnings/(losses) from equity method investments — — — — — Earnings before income taxes 69.3 42.7 76.9 206.6 395.5 Provision for income taxes 24.9 15.1 26.1 66.4 132.5 Net earnings $44.4 $27.6 $50.8 $140.2 $263.0
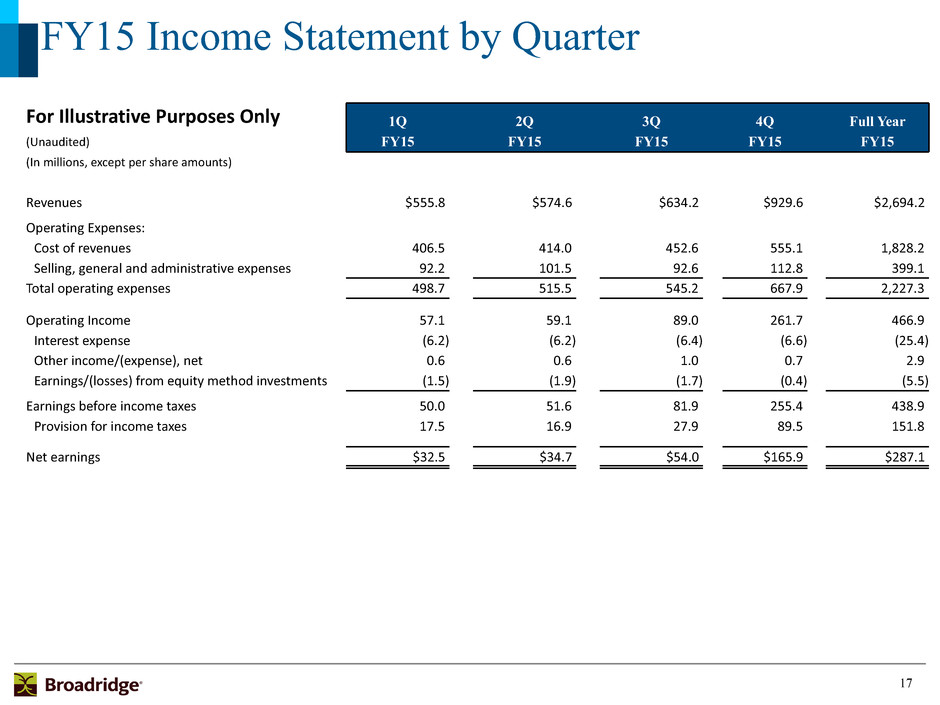
17 FY15 Income Statement by Quarter For Illustrative Purposes Only 1Q 2Q 3Q 4Q Full Year (Unaudited) FY15 FY15 FY15 FY15 FY15 (In millions, except per share amounts) Revenues $555.8 $574.6 $634.2 $929.6 $2,694.2 Operating Expenses: Cost of revenues 406.5 414.0 452.6 555.1 1,828.2 Selling, general and administrative expenses 92.2 101.5 92.6 112.8 399.1 Total operating expenses 498.7 515.5 545.2 667.9 2,227.3 Operating Income 57.1 59.1 89.0 261.7 466.9 Interest expense (6.2) (6.2) (6.4) (6.6) (25.4) Other income/(expense), net 0.6 0.6 1.0 0.7 2.9 Earnings/(losses) from equity method investments (1.5) (1.9) (1.7) (0.4) (5.5) Earnings before income taxes 50.0 51.6 81.9 255.4 438.9 Provision for income taxes 17.5 16.9 27.9 89.5 151.8 Net earnings $32.5 $34.7 $54.0 $165.9 $287.1
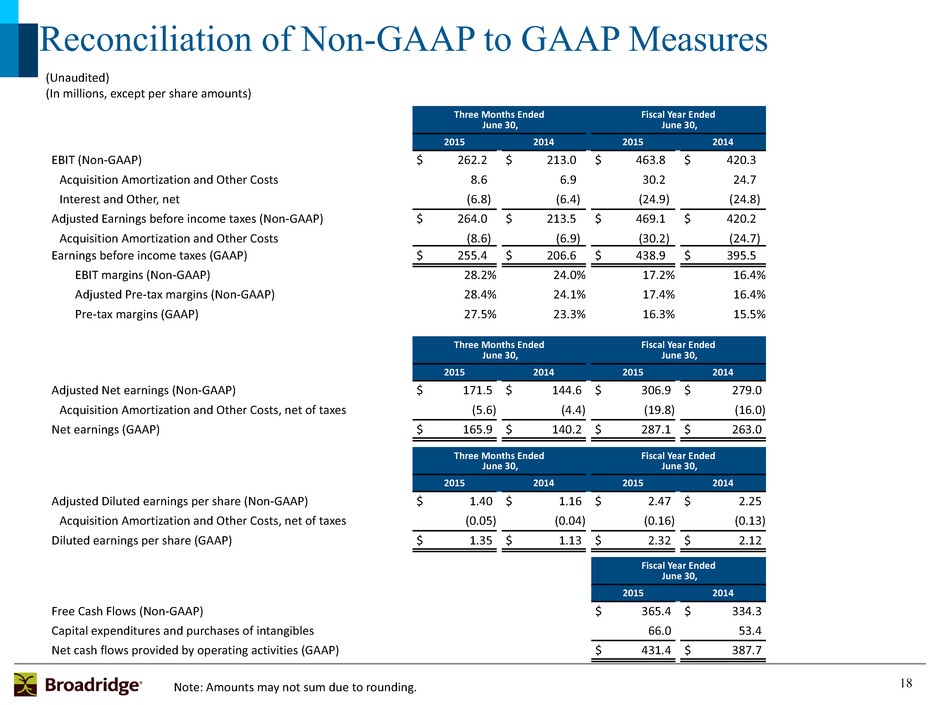
18 Reconciliation of Non-GAAP to GAAP Measures Three Months Ended June 30, Fiscal Year Ended June 30, 2015 2014 2015 2014 EBIT (Non-GAAP) $ 262.2 $ 213.0 $ 463.8 $ 420.3 Acquisition Amortization and Other Costs 8.6 6.9 30.2 24.7 Interest and Other, net (6.8) (6.4) (24.9) (24.8) Adjusted Earnings before income taxes (Non-GAAP) $ 264.0 $ 213.5 $ 469.1 $ 420.2 Acquisition Amortization and Other Costs (8.6) (6.9) (30.2) (24.7) Earnings before income taxes (GAAP) $ 255.4 $ 206.6 $ 438.9 $ 395.5 EBIT margins (Non-GAAP) 28.2% 24.0% 17.2% 16.4% Adjusted Pre-tax margins (Non-GAAP) 28.4% 24.1% 17.4% 16.4% Pre-tax margins (GAAP) 27.5% 23.3% 16.3% 15.5% Three Months Ended June 30, Fiscal Year Ended June 30, 2015 2014 2015 2014 Adjusted Net earnings (Non-GAAP) $ 171.5 $ 144.6 $ 306.9 $ 279.0 Acquisition Amortization and Other Costs, net of taxes (5.6) (4.4) (19.8) (16.0) Net earnings (GAAP) $ 165.9 $ 140.2 $ 287.1 $ 263.0 Three Months Ended June 30, Fiscal Year Ended June 30, 2015 2014 2015 2014 Adjusted Diluted earnings per share (Non-GAAP) $ 1.40 $ 1.16 $ 2.47 $ 2.25 Acquisition Amortization and Other Costs, net of taxes (0.05) (0.04) (0.16) (0.13) Diluted earnings per share (GAAP) $ 1.35 $ 1.13 $ 2.32 $ 2.12 Fiscal Year Ended June 30, 2015 2014 Free Cash Flows (Non-GAAP) $ 365.4 $ 334.3 Capital expenditures and purchases of intangibles 66.0 53.4 Net cash flows provided by operating activities (GAAP) $ 431.4 $ 387.7 Note: Amounts may not sum due to rounding. (Unaudited) (In millions, except per share amounts)

19 Reconciliation of Non-GAAP to GAAP Measures- FY16 Guidance Earnings Per Share Growth Rate (1) FY16 Guidance Adjusted Diluted earnings per share (Non-GAAP) 8% - 12% growth Diluted earnings per share (GAAP) 7% - 12% growth Operating Income Margin (2) FY16 Guidance Adjusted Operating income margin % (Non-GAAP) ~18.4% Operating income margin % (GAAP) ~17.3% (2) Adjusted Operating income margin % (Non-GAAP) is adjusted to exclude the projected impact of Acquisition Amortization and Other Costs. Fiscal year 2016 Non-GAAP Adjusted Operating income margin % guidance estimates exclude estimated Acquisition Amortization and Other Costs of $34 million. (1) Adjusted Diluted EPS growth (Non-GAAP) is adjusted to exclude the projected impact of Acquisition Amortization and Other Costs. Fiscal year 2016 Non- GAAP Adjusted Diluted EPS guidance estimates exclude estimated Acquisition Amortization and Other Costs, net of taxes, of $0.18 per share. Note: Guidance does not take into consideration the effect of any future acquisitions, additional debt, and/or share repurchases. (Unaudited)
