Attached files
| file | filename |
|---|---|
| EX-99.1 - PRESS RELEASE - Stagwell Inc | v417420_ex99-1.htm |
| EX-99.3 - PRESS RELEASE - Stagwell Inc | v417420_ex99-3.htm |
| 8-K - CURRENT REPORT - Stagwell Inc | v417420_8k.htm |
Exhibit 99.2

August 6, 2015 Management Presentation Second Quarter 2015 Results
2 FORWARD LOOKING STATEMENTS & OTHER INFORMATION This presentation, including our “ 2015 Financial Outlook”, contains forward - looking statements . The Company’s representatives may also make forward - looking statements orally from time to time . Statements in this presentation that are not historical facts, including statements about the Company’s beliefs and expectations, earnings guidance, recent business and economic trends, potential acquisitions, estimates of amounts for deferred acquisition consideration and “put” option rights, constitute forward - looking statements . These statements are based on current plans, estimates and projections, and are subject to change based on a number of factors, including those outlined in this section . Forward - looking statements speak only as of the date they are made, and the Company undertakes no obligation to update publicly any of them in light of new information or future events, if any . Forward - looking statements involve inherent risks and uncertainties . A number of important factors could cause actual results to differ materially from those contained in any forward - looking statements . Such risk factors include, but are not limited to, the following : • risks associated with the Subpoena and ongoing SEC investigation ; • risks associated with severe effects of international, national and regional economic downturn ; • the Company’s ability to attract new clients and retain existing clients; • the spending patterns and financial success of the Company’s clients; • the Company’s ability to remain in compliance with its debt agreements and the Company’s ability to finance its contingent pa yme nt obligations when due and payable, including but not limited to those relating to “put” option rights and deferred acquisition co nsideration; • the successful completion and integration of acquisitions which compliment and expand the Company’s business capabilities; an d • foreign currency fluctuations. The Company’s business strategy includes ongoing efforts to engage in material acquisitions of ownership interests in entities in the marketing communications services industry . The Company intends to finance these acquisitions by using available cash from operations and through incurrence of bridge or other debt financing, either of which may increase the Company’s leverage ratios, or by issuing equity, which may have a dilutive impact on existing shareholders proportionate ownership . At any given time the Company may be engaged in a number of discussions that may result in one or more material acquisitions . These opportunities require confidentiality and may involve negotiations that require quick responses by the Company . Although there is uncertainty that any of these discussions will result in definitive agreements or the completion of any transactions, the announcement of any such transaction may lead to increased volatility in the trading price of the Company’s securities . Investors should carefully consider these risk factors and the additional risk factors outlined in more detail in the Annual Report on Form 10 - K under the caption “Risk Factors” and in the Company’s other SEC filings .
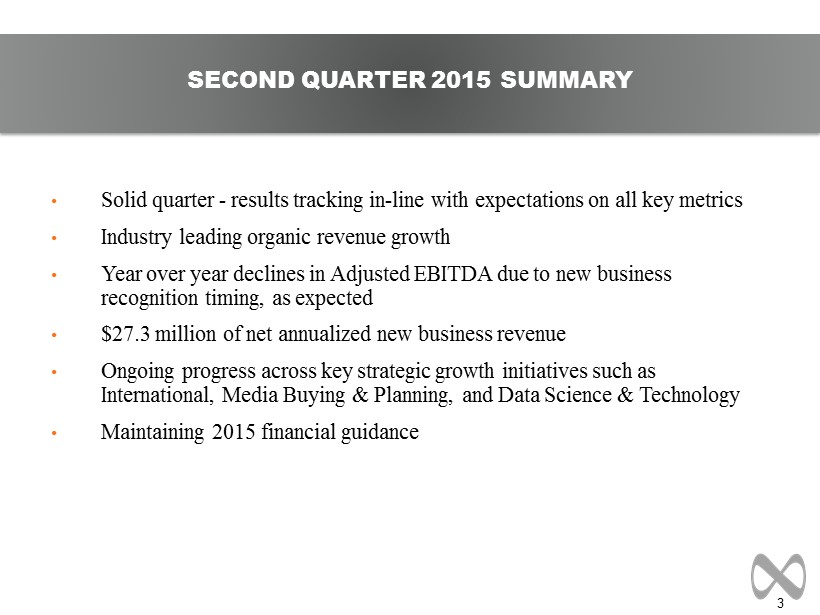
3 • Solid quarter - results tracking in - line with expectations on all key metrics • Industry leading organic revenue growth • Year over year declines in Adjusted EBITDA due to new business recognition timing, as expected • $27.3 million of net annualized new business revenue • Ongoing progress across key strategic growth initiatives such as International, Media Buying & Planning, and Data Science & Technology • Maintaining 2015 financial guidance SECOND QUARTER 2015 SUMMARY
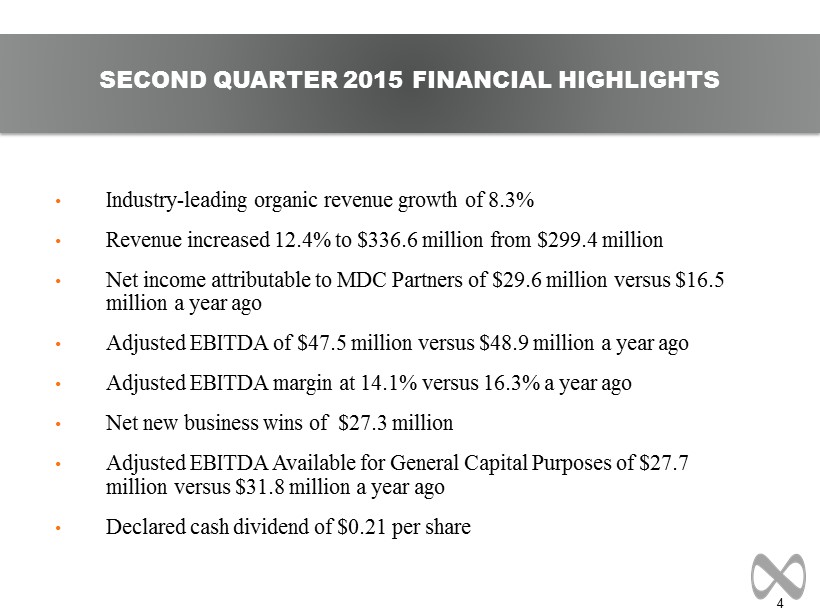
4 • Industry - leading organic revenue growth of 8.3% • Revenue increased 12.4% to $336.6 million from $299.4 million • Net income attributable to MDC Partners of $29.6 million versus $16.5 million a year ago • Adjusted EBITDA of $47.5 million versus $48.9 million a year ago • Adjusted EBITDA margin at 14.1% versus 16.3% a year ago • Net new business wins of $27.3 million • Adjusted EBITDA Available for General Capital Purposes of $27.7 million versus $31.8 million a year ago • Declared cash dividend of $0.21 per share SECOND QUARTER 2015 FINANCIAL HIGHLIGHTS
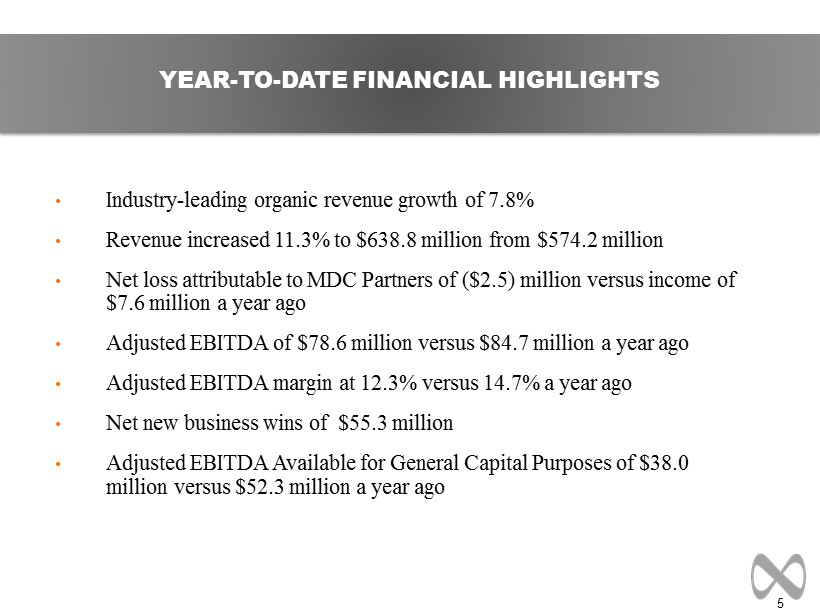
5 • Industry - leading organic revenue growth of 7.8% • Revenue increased 11.3% to $638.8 million from $574.2 million • Net loss attributable to MDC Partners of ($2.5) million versus income of $7.6 million a year ago • Adjusted EBITDA of $78.6 million versus $84.7 million a year ago • Adjusted EBITDA margin at 12.3% versus 14.7% a year ago • Net new business wins of $55.3 million • Adjusted EBITDA Available for General Capital Purposes of $38.0 million versus $52.3 million a year ago YEAR - TO - DATE FINANCIAL HIGHLIGHTS
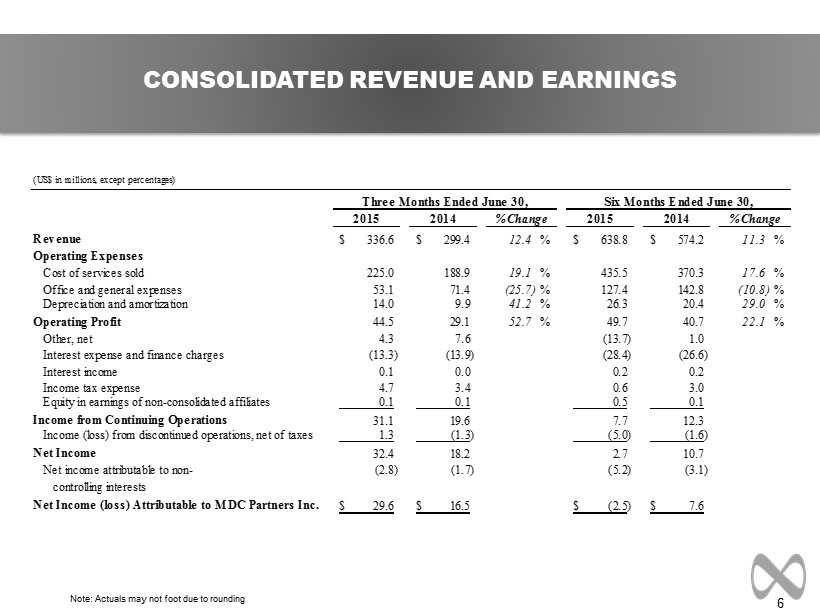
6 Note: Actuals may not foot due to rounding CONSOLIDATED REVENUE AND EARNINGS (US$ in millions, except percentages) 2015 2014 2015 2014 Revenue 336.6$ 299.4$ 12.4 % 638.8$ 574.2$ 11.3 % Operating Expenses Cost of services sold 225.0 188.9 19.1 % 435.5 370.3 17.6 % Office and general expenses 53.1 71.4 (25.7) % 127.4 142.8 (10.8) % Depreciation and amortization 14.0 9.9 41.2 % 26.3 20.4 29.0 % Operating Profit 44.5 29.1 52.7 % 49.7 40.7 22.1 % Other, net 4.3 7.6 (13.7) 1.0 Interest expense and finance charges (13.3) (13.9) (28.4) (26.6) Interest income 0.1 0.0 0.2 0.2 Income tax expense 4.7 3.4 0.6 3.0 Equity in earnings of non-consolidated affiliates 0.1 0.1 0.5 0.1 Income from Continuing Operations 31.1 19.6 7.7 12.3 Income (loss) from discontinued operations, net of taxes 1.3 (1.3) (5.0) (1.6) Net Income 32.4 18.2 2.7 10.7 Net income attributable to non- (2.8) (1.7) (5.2) (3.1) controlling interests Net Income (loss) Attributable to MDC Partners Inc. 29.6$ 16.5$ (2.5)$ 7.6$ % Change Three Months Ended June 30, Six Months Ended June 30, % Change
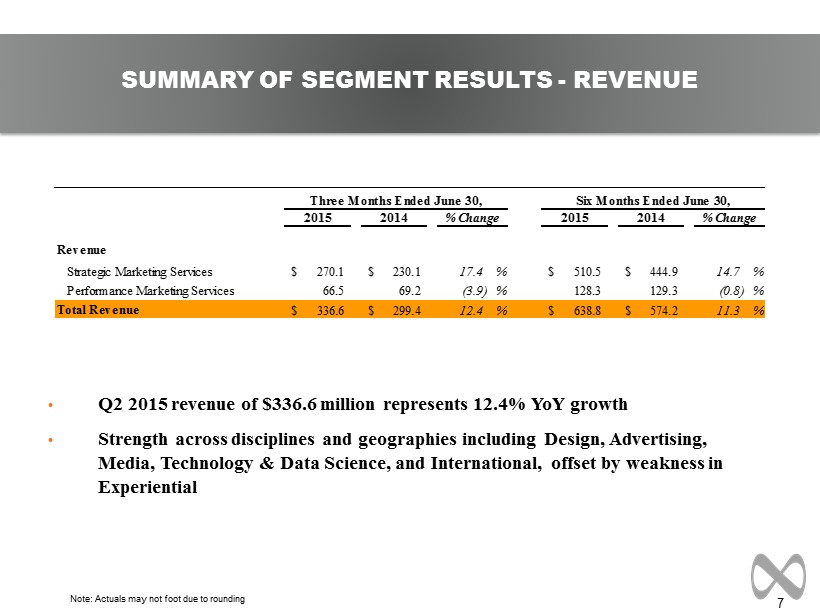
7 • Q2 2015 revenue of $336.6 million represents 12.4% YoY growth • Strength across disciplines and geographies including Design , Advertising, Media, Technology & Data Science, and International, offset by weakness in Experiential SUMMARY OF SEGMENT RESULTS - REVENUE Note: Actuals may not foot due to rounding 2015 2014 2015 2014 Revenue Strategic Marketing Services 270.1$ 230.1$ 17.4 % 510.5$ 444.9$ 14.7 % Performance Marketing Services 66.5 69.2 (3.9) % 128.3 129.3 (0.8) % Total Revenue 336.6$ 299.4$ 12.4 % 638.8$ 574.2$ 11.3 % % Change Three Months Ended June 30, Six Months Ended June 30, % Change
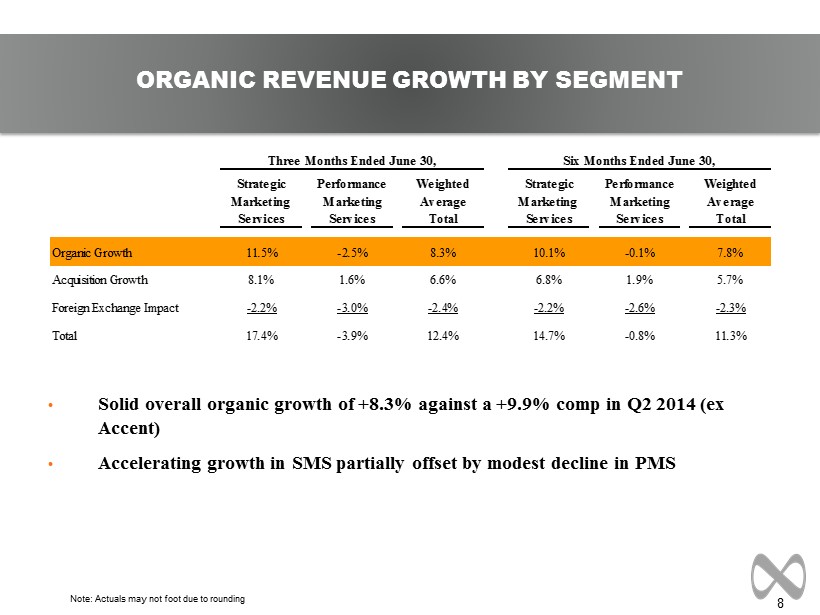
8 ORGANIC REVENUE GROWTH BY SEGMENT Note: Actuals may not foot due to rounding • Solid overall organic growth of +8.3% against a +9.9% comp in Q2 2014 (ex Accent) • Accelerating growth in SMS partially offset by modest decline in PMS Strategic Performance Weighted Strategic Performance Weighted Marketing Marketing Average Marketing Marketing Average Services Services Total Services Services Total Organic Growth 11.5% -2.5% 8.3% 10.1% -0.1% 7.8% Acquisition Growth 8.1% 1.6% 6.6% 6.8% 1.9% 5.7% Foreign Exchange Impact -2.2% -3.0% -2.4% -2.2% -2.6% -2.3% Total 17.4% -3.9% 12.4% 14.7% -0.8% 11.3% Three Months Ended June 30, Six Months Ended June 30,
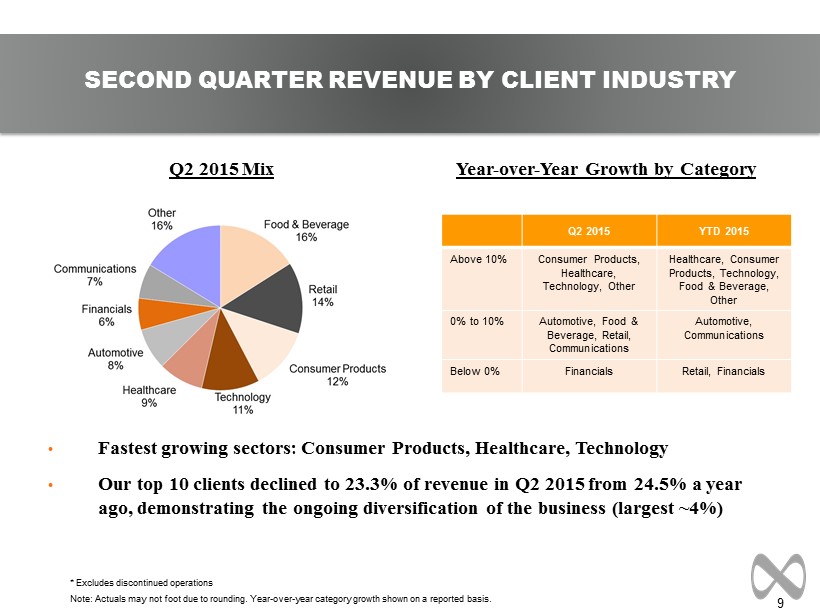
9 Q2 2015 Mix Year - over - Year Growth by Category • Fastest growing sectors: Consumer Products, Healthcare, Technology • Our top 10 clients declined to 23.3% of revenue in Q2 2015 from 24.5% a year ago, demonstrating the ongoing diversification of the business (largest ~4%) SECOND QUARTER REVENUE BY CLIENT INDUSTRY * Excludes discontinued operations Note : Actuals may not foot due to rounding. Year - over - year category growth shown on a reported basis. Q2 2015 YTD 2015 Above 10% Consumer Products, Healthcare, Technology, Other Healthcare, Consumer Products, Technology, Food & Beverage, Other 0% to 10% Automotive, Food & Beverage, Retail, Communications Automotive, Communications Below 0% Financials Retail, Financials
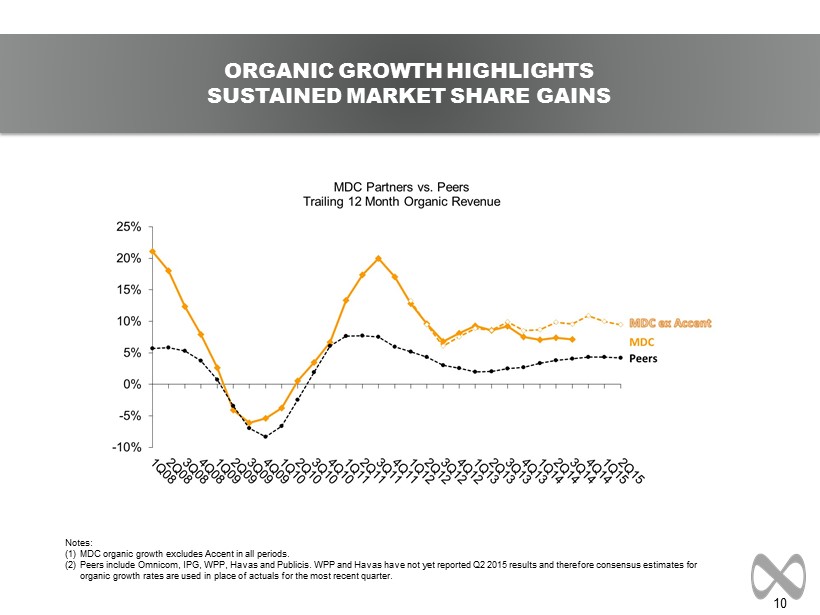
10 ORGANIC GROWTH HIGHLIGHTS SUSTAINED MARKET SHARE GAINS Notes: (1) MDC organic growth excludes Accent in all periods. (2) Peers include Omnicom, IPG, WPP, Havas and Publicis . WPP and Havas have not yet reported Q2 2015 results and therefore consensus estimates for organic growth rates are used in place of actuals for the most recent quarter.
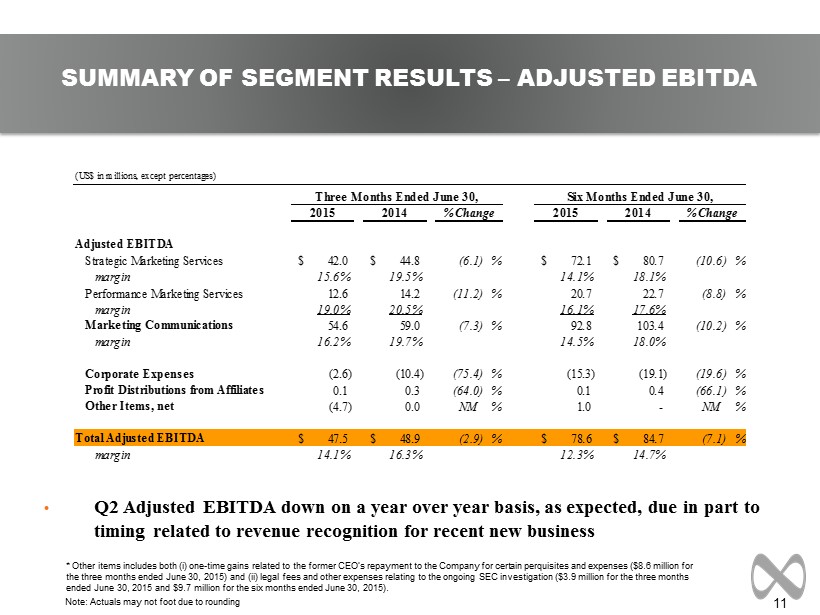
11 Note: Actuals may not foot due to rounding • Q2 Adjusted EBITDA down on a year over year basis, as expected, due in part to timing related to revenue recognition for recent new business SUMMARY OF SEGMENT RESULTS – ADJUSTED EBITDA * Other non - recurring items includes the perquisite reimbursement from the former CEO, offset by legal fees and other related expenses relating to the ongoing SEC inquiry. Additional costs may be incurred in future periods related to these matters. (US$ in millions, except percentages) 2015 2014 2015 2014 Adjusted EBITDA Strategic Marketing Services 42.0$ 44.8$ (6.1) % 72.1$ 80.7$ (10.6) % margin 15.6% 19.5% 14.1% 18.1% Performance Marketing Services 12.6 14.2 (11.2) % 20.7 22.7 (8.8) % margin 19.0% 20.5% 16.1% 17.6% Marketing Communications 54.6 59.0 (7.3) % 92.8 103.4 (10.2) % margin 16.2% 19.7% 14.5% 18.0% Corporate Expenses (2.6) (10.4) (75.4) % (15.3) (19.1) (19.6) % Profit Distributions from Affiliates 0.1 0.3 (64.0) % 0.1 0.4 (66.1) % Other Non-recurring Items, net (4.7) 0.0 NM % 1.0 - NM % Total Adjusted EBITDA 47.5$ 48.9$ (2.9) % 78.6$ 84.7$ (7.1) % margin 14.1% 16.3% 12.3% 14.7% % Change Three Months Ended June 30, Six Months Ended June 30, % Change
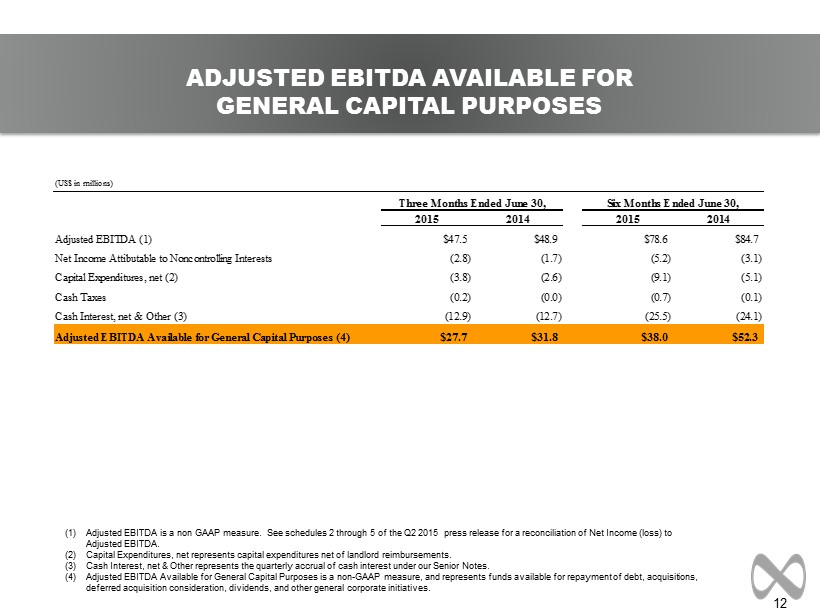
12 Note: Actuals may not foot due to rounding ADJUSTED EBITDA AVAILABLE FOR GENERAL CAPITAL PURPOSES (1) Adjusted EBITDA is a non GAAP measure. See schedules 2 through 5 of the Q2 2015 press release for a reconciliation of Net Income (loss) to Adjusted EBITDA. (2) Capital Expenditures, net represents capital expenditures net of landlord reimbursements . (3) Cash Interest, net & Other represents the quarterly accrual of cash interest under our Senior Notes . (4) Adjusted EBITDA Available for General Capital Purposes is a non - GAAP measure, and represents funds available for repayment of de bt, acquisitions, deferred acquisition consideration, dividends, and other general corporate initiatives. (US$ in millions) 2015 2014 2015 2014 Adjusted EBITDA (1) $47.5 $48.9 $78.6 $84.7 Net Income Attibutable to Noncontrolling Interests (2.8) (1.7) (5.2) (3.1) Capital Expenditures, net (2) (3.8) (2.6) (9.1) (5.1) Cash Taxes (0.2) (0.0) (0.7) (0.1) Cash Interest, net & Other (3) (12.9) (12.7) (25.5) (24.1) Adjusted EBITDA Available for General Capital Purposes (4) $27.7 $31.8 $38.0 $52.3 Three Months Ended June 30, Six Months Ended June 30,
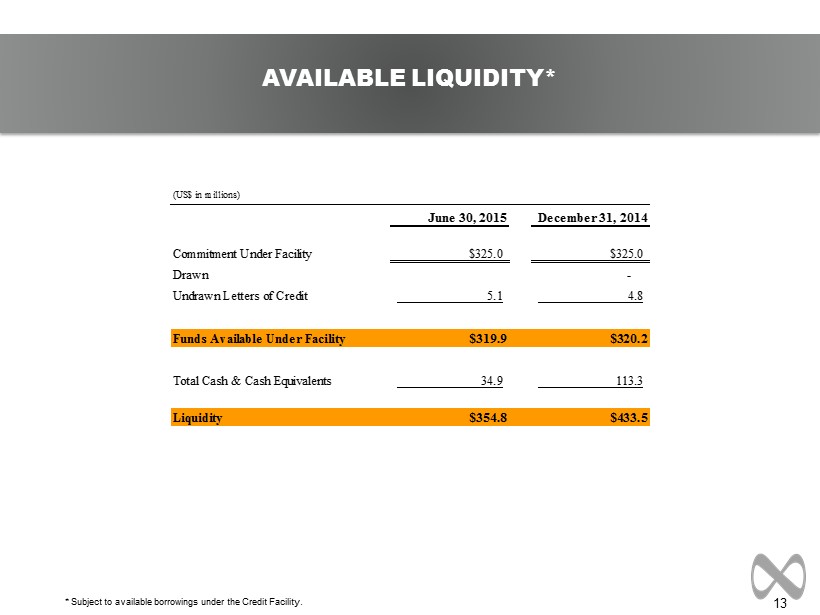
13 AVAILABLE LIQUIDITY* (US$ in millions) June 30, 2015 December 31, 2014 Commitment Under Facility $325.0 $325.0 Drawn - Undrawn Letters of Credit 5.1 4.8 Funds Available Under Facility $319.9 $320.2 Total Cash & Cash Equivalents 34.9 113.3 Liquidity $354.8 $433.5 Note: Subject to available borrowings under the Credit Facility.
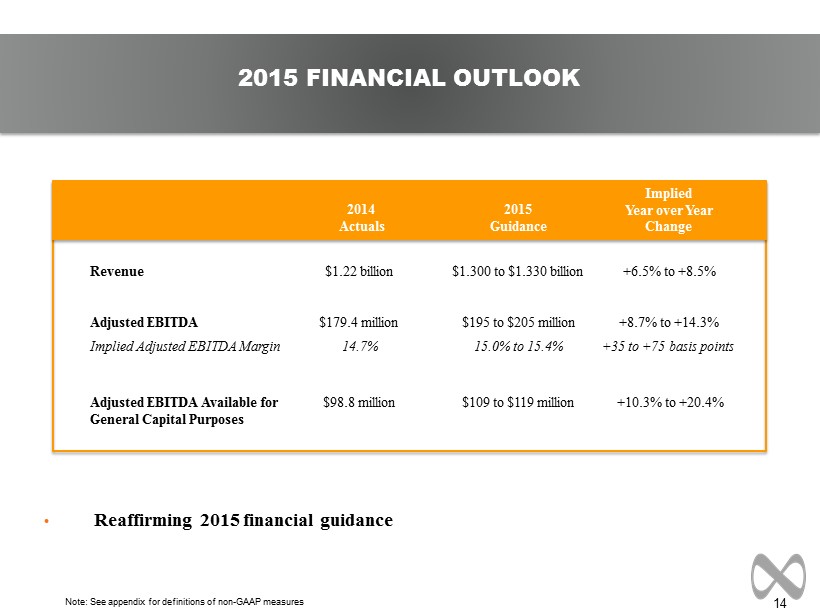
14 2015 FINANCIAL OUTLOOK Note: See appendix for definitions of non - GAAP measures Revenue Adjusted EBITDA Adjusted EBITDA Available for General Capital Purposes Implied Adjusted EBITDA Margin $1.22 billion $179.4 million $98.8 million 14.7% $1.300 to $1.330 billion $195 to $205 million $109 to $119 million 15.0% to 15.4% +6.5% to +8.5% +8.7% to +14.3% +10.3% to +20.4% +35 to +75 basis points 2014 Actuals Implied Year over Year Change 2015 Guidance • Reaffirming 2015 financial guidance

15 APPENDIX
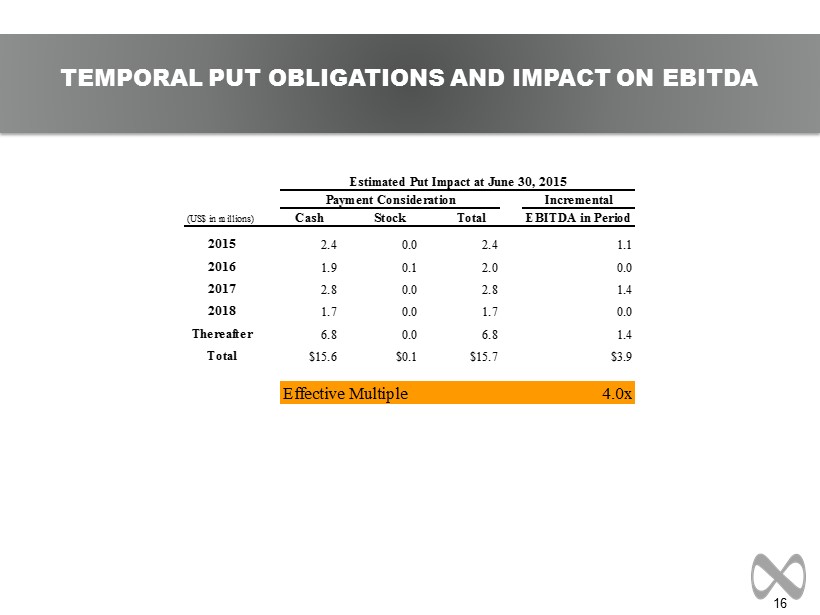
16 TEMPORAL PUT OBLIGATIONS AND IMPACT ON EBITDA Incremental (US$ in millions) Cash Stock Total EBITDA in Period 2015 2.4 0.0 2.4 1.1 2016 1.9 0.1 2.0 0.0 2017 2.8 0.0 2.8 1.4 2018 1.7 0.0 1.7 0.0 Thereafter 6.8 0.0 6.8 1.4 Total $15.6 $0.1 $15.7 $3.9 Effective Multiple 4.0x Estimated Put Impact at June 30, 2015 Payment Consideration
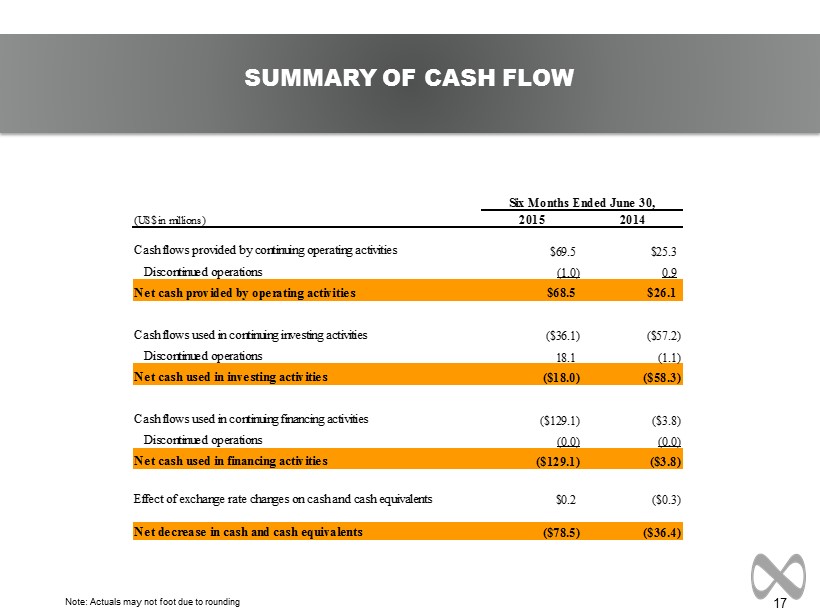
17 Note: Actuals may not foot due to rounding SUMMARY OF CASH FLOW Note: Actuals may not foot due to rounding (US$ in millions) 2015 2014 Cash flows provided by continuing operating activities $69.5 $25.3 Discontinued operations (1.0) 0.9 Net cash provided by operating activities $68.5 $26.1 Cash flows used in continuing investing activities ($36.1) ($57.2) Discontinued operations 18.1 (1.1) Net cash used in investing activities ($18.0) ($58.3) Cash flows used in continuing financing activities ($129.1) ($3.8) Discontinued operations (0.0) (0.0) Net cash used in financing activities ($129.1) ($3.8) Effect of exchange rate changes on cash and cash equivalents $0.2 ($0.3) Net decrease in cash and cash equivalents ($78.5) ($36.4) Six Months Ended June 30,
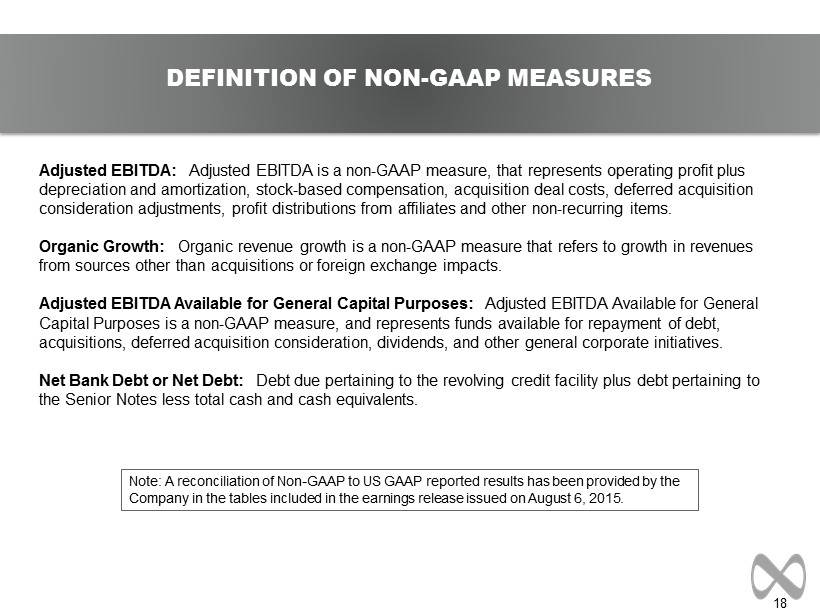
18 Note: Actuals may not foot due to rounding DEFINITION OF NON - GAAP MEASURES Adjusted EBITDA: Adjusted EBITDA is a non - GAAP measure, that represents operating profit plus depreciation and amortization, stock - based compensation, acquisition deal costs, deferred acquisition consideration adjustments, profit distributions from affiliates and other non - recurring items. Organic Growth: Organic revenue growth is a non - GAAP measure that refers to growth in revenues from sources other than acquisitions or foreign exchange impacts. Adjusted EBITDA Available for General Capital Purposes: Adjusted EBITDA Available for General Capital Purposes is a non - GAAP measure, and represents funds available for repayment of debt, acquisitions, deferred acquisition consideration, dividends, and other general corporate initiatives . Net Bank Debt or Net Debt: Debt due pertaining to the revolving credit facility plus debt pertaining to the Senior Notes less total cash and cash equivalents. Note: A reconciliation of Non - GAAP to US GAAP reported results has been provided by the Company in the tables included in the earnings release issued on August 6, 2015.

MDC Partners Innovation Centre 745 Fifth Avenue, Floor 19 New York, NY 10151 646 - 429 - 1800 www.mdc - partners.com