Attached files
| file | filename |
|---|---|
| 8-K - 8-K - GAIN Capital Holdings, Inc. | form8-kx6x30x15earnings.htm |
| EX-99.1 - PRESS RELEASE - GAIN Capital Holdings, Inc. | earningsreleaseq215.htm |

Financial and Operating Results Second Quarter and First Half 2015 August 2015

GAIN Capital 2 Safe Harbor Statement Forward Looking Statements The forward-looking statements contained herein include, without limitation, statements relating to GAIN Capital’s and/or City Index (Holdings) Limited (“City Index”) expectations regarding the opportunities and strengths of the combined company created by the business combination, anticipated cost and revenue synergies, the strategic rationale for the business combination, including expectations regarding product offerings, growth opportunities, value creation, and financial strength. All forward looking statements are based upon current expectations and beliefs and various assumptions. There can be no assurance that GAIN Capital or City Index will realize these expectations or that these beliefs will prove correct. In addition, a variety of important factors could cause results to differ materially from such statements. These factors are noted throughout GAIN Capital’s annual report on Form 10-K, as filed with the Securities and Exchange Commission on March 16, 2015, and include, but are not limited to, the actions of both current and potential new competitors, fluctuations in market trading volumes, financial market volatility, evolving industry regulations, errors or malfunctions in GAIN Capital’s systems or technology, rapid changes in technology, effects of inflation, customer trading patterns, the success of our products and service offerings, our ability to continue to innovate and meet the demands of our customers for new or enhanced products, our ability to successfully integrate assets and companies we have acquired, our ability to effectively compete, changes in tax policy or accounting rules, fluctuations in foreign exchange rates and commodity prices, adverse changes or volatility in interest rates, as well as general economic, business, credit and financial market conditions, internationally or nationally, and our ability to continue paying a quarterly dividend in light of future financial performance and financing needs. The forward-looking statements included herein represent GAIN Capital’s views as of the date of this release. GAIN Capital undertakes no obligation to revise or update publicly any forward-looking statement for any reason unless required by law. Non-GAAP Financial Measures This presentation contains various non-GAAP financial measures, including adjusted EBITDA, adjusted net income, adjusted EPS, cash EPS and various “pro forma” non-GAAP measures. These non-GAAP financial measures have certain limitations, including that they do not have a standardized meaning and, therefore, our definitions may be different from similar non-GAAP financial measures used by other companies and/or analysts. Thus, it may be more difficult to compare our financial performance to that of other companies. We believe our reporting of these non-GAAP financial measures assists investors in evaluating our historical and expected operating performance. However, because these are not measures of financial performance calculated in accordance with GAAP, such measures should be considered in addition to, but not as a substitute for, other measures of our financial performance reported in accordance with GAAP, such as net income.

GAIN Capital 3 Second Quarter Overview • Significant progress on integration of City Index; tracking to high end of $45-$55 million synergy range • Continued scaling of business with near record levels of trading volume, active accounts and customer assets • Solid performance from GTX institutional business, growing faster than peers • Solid progress in reducing core fixed operating expenses, decreasing 4% and 7% from 1Q15 and 2Q14 • Continued success diversifying revenue; retail OTC product mix was 63%/37% FX/non-FX from 75%/25% • Solid revenue capture in FX and CFDs, but unusually adverse trading conditions across indices temper results
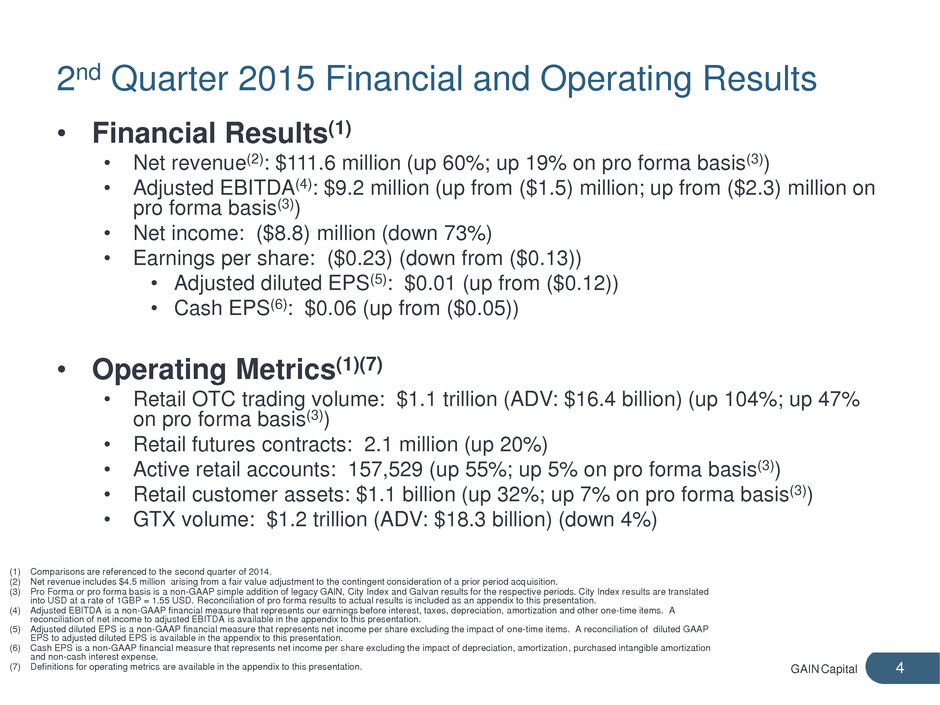
GAIN Capital 4 2nd Quarter 2015 Financial and Operating Results • Financial Results(1) • Net revenue(2): $111.6 million (up 60%; up 19% on pro forma basis(3)) • Adjusted EBITDA(4): $9.2 million (up from ($1.5) million; up from ($2.3) million on pro forma basis(3)) • Net income: ($8.8) million (down 73%) • Earnings per share: ($0.23) (down from ($0.13)) • Adjusted diluted EPS(5): $0.01 (up from ($0.12)) • Cash EPS(6): $0.06 (up from ($0.05)) • Operating Metrics(1)(7) • Retail OTC trading volume: $1.1 trillion (ADV: $16.4 billion) (up 104%; up 47% on pro forma basis(3)) • Retail futures contracts: 2.1 million (up 20%) • Active retail accounts: 157,529 (up 55%; up 5% on pro forma basis(3)) • Retail customer assets: $1.1 billion (up 32%; up 7% on pro forma basis(3)) • GTX volume: $1.2 trillion (ADV: $18.3 billion) (down 4%) (1) Comparisons are referenced to the second quarter of 2014. (2) Net revenue includes $4.5 million arising from a fair value adjustment to the contingent consideration of a prior period acquisition. (3) Pro Forma or pro forma basis is a non-GAAP simple addition of legacy GAIN, City Index and Galvan results for the respective periods. City Index results are translated into USD at a rate of 1GBP = 1.55 USD. Reconciliation of pro forma results to actual results is included as an appendix to this presentation. (4) Adjusted EBITDA is a non-GAAP financial measure that represents our earnings before interest, taxes, depreciation, amortization and other one-time items. A reconciliation of net income to adjusted EBITDA is available in the appendix to this presentation. (5) Adjusted diluted EPS is a non-GAAP financial measure that represents net income per share excluding the impact of one-time items. A reconciliation of diluted GAAP EPS to adjusted diluted EPS is available in the appendix to this presentation. (6) Cash EPS is a non-GAAP financial measure that represents net income per share excluding the impact of depreciation, amortization, purchased intangible amortization and non-cash interest expense. (7) Definitions for operating metrics are available in the appendix to this presentation.
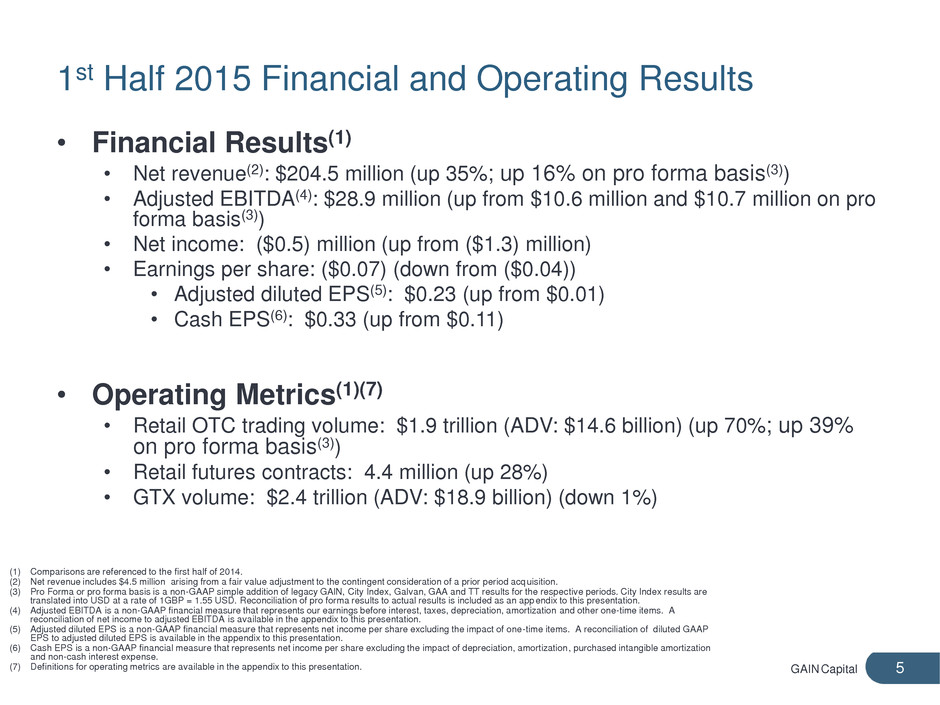
GAIN Capital 5 1st Half 2015 Financial and Operating Results • Financial Results(1) • Net revenue(2): $204.5 million (up 35%; up 16% on pro forma basis(3)) • Adjusted EBITDA(4): $28.9 million (up from $10.6 million and $10.7 million on pro forma basis(3)) • Net income: ($0.5) million (up from ($1.3) million) • Earnings per share: ($0.07) (down from ($0.04)) • Adjusted diluted EPS(5): $0.23 (up from $0.01) • Cash EPS(6): $0.33 (up from $0.11) • Operating Metrics(1)(7) • Retail OTC trading volume: $1.9 trillion (ADV: $14.6 billion) (up 70%; up 39% on pro forma basis(3)) • Retail futures contracts: 4.4 million (up 28%) • GTX volume: $2.4 trillion (ADV: $18.9 billion) (down 1%) (1) Comparisons are referenced to the first half of 2014. (2) Net revenue includes $4.5 million arising from a fair value adjustment to the contingent consideration of a prior period acquisition. (3) Pro Forma or pro forma basis is a non-GAAP simple addition of legacy GAIN, City Index, Galvan, GAA and TT results for the respective periods. City Index results are translated into USD at a rate of 1GBP = 1.55 USD. Reconciliation of pro forma results to actual results is included as an appendix to this presentation. (4) Adjusted EBITDA is a non-GAAP financial measure that represents our earnings before interest, taxes, depreciation, amortization and other one-time items. A reconciliation of net income to adjusted EBITDA is available in the appendix to this presentation. (5) Adjusted diluted EPS is a non-GAAP financial measure that represents net income per share excluding the impact of one-time items. A reconciliation of diluted GAAP EPS to adjusted diluted EPS is available in the appendix to this presentation. (6) Cash EPS is a non-GAAP financial measure that represents net income per share excluding the impact of depreciation, amortization, purchased intangible amortization and non-cash interest expense. (7) Definitions for operating metrics are available in the appendix to this presentation.

GAIN Capital 6 Scale and Complementary Businesses Create Significant Value Opportunity • Strong growth in financial and operating metrics • TTM pro forma(1) revenue and adjusted EBITDA(2) of $539.2 million and $111.3 million, respectively • Trading volume ($1.1 trillion), customer assets(3) ($1.1 billion) and active accounts(3) (157,529) at or near record levels • Growing retail business benefits from attractive brands, strong reputation and diversified geographic footprint • Futures offering being further integrated into retail business as part of multi-asset strategy • GTX institutional ECN growing faster than peers with several recent transactions valuing similar businesses at 15-20x EBITDA multiples • Sum of these parts creates attractive value opportunity with significant EBITDA generation, diversified retail OTC businesses and fast-growing FX ECN (GTX) (1) Pro Forma or pro forma basis is a non-GAAP simple addition of legacy GAIN, City Index, Galvan, GAA and TT results for the respective periods. City Index results are translated into USD at a rate of 1GBP = 1.55 USD. Reconciliation of pro forma results to actual results is included as an appendix to this presentation. (2) Adjusted EBITDA is a non-GAAP financial measure that represents our earnings before interest, taxes, depreciation, amortization and other one-time items. A reconciliation of net income to adjusted EBITDA is available in the appendix to this presentation. (3) Definitions for operating metrics are available in the appendix to this presentation.

GAIN Capital 7 Increasing Scale and Strong Growth in Retail • Strong growth in trading volume: • Retail OTC business: ADTV up 104% year-over-year (up 47% pro forma(1)) • Retail futures: Average Daily Futures Contracts up 24% year- over-year • Fast-growing base of active retail OTC accounts: up 58% year-over-year (up 5% pro forma(1)) • Solid growth in customer assets: up 32% year-over-year, up 46% from 12/31/14 64.1 94.3 148.76.7 7.2 8.8 70.8 101.5 157.5 Q2 13 Q2 14 Q2 15 Total Active Accounts (in thousands) Retail OTC Retail futures $7.1 $8.0 $16.4 Q2 13 Q2 14 Q2 15 Average Daily Retail OTC Volume (in billions) $359 $664 $878 $117 $176 $232 $477 $840 $1,110 Q2 13 Q2 14 Q2 15 Client Assets (in millions) Retail OTC Retail futures (1) Pro forma or pro forma basis is a non-GAAP simple addition of legacy GAIN and legacy City Index results for the respective periods. City Index results are translated into USD at a rate of 1GBP = 1.55 USD. Reconciliation of pro forma results to actual results is included as an appendix to this presentation. (2) Definitions for operating metrics are available in the appendix to this presentation. (2) (2) (2)
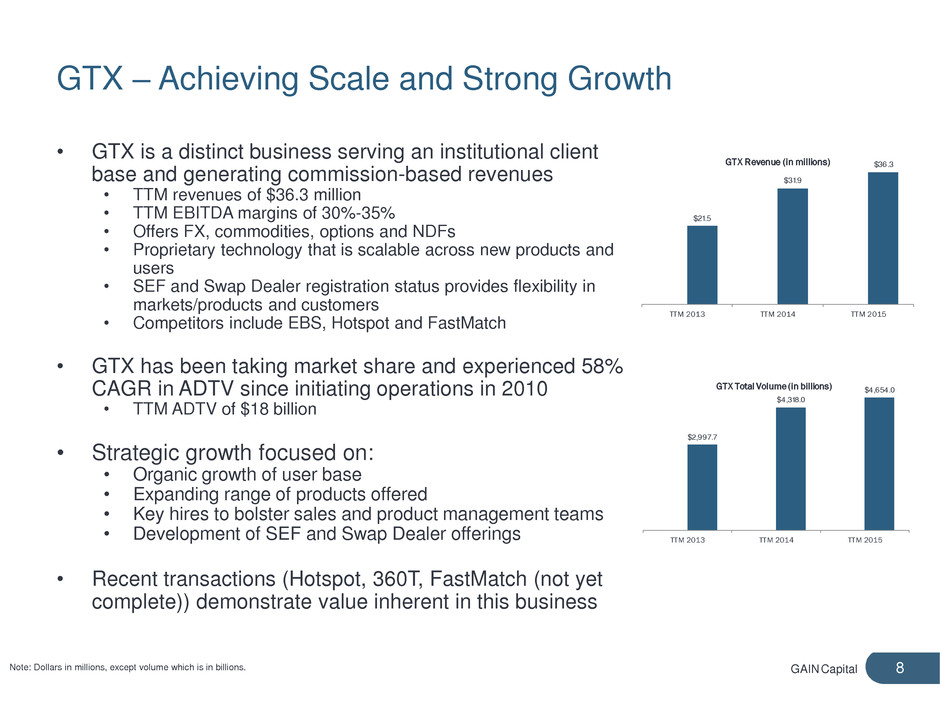
GAIN Capital 8 GTX – Achieving Scale and Strong Growth • GTX is a distinct business serving an institutional client base and generating commission-based revenues • TTM revenues of $36.3 million • TTM EBITDA margins of 30%-35% • Offers FX, commodities, options and NDFs • Proprietary technology that is scalable across new products and users • SEF and Swap Dealer registration status provides flexibility in markets/products and customers • Competitors include EBS, Hotspot and FastMatch • GTX has been taking market share and experienced 58% CAGR in ADTV since initiating operations in 2010 • TTM ADTV of $18 billion • Strategic growth focused on: • Organic growth of user base • Expanding range of products offered • Key hires to bolster sales and product management teams • Development of SEF and Swap Dealer offerings • Recent transactions (Hotspot, 360T, FastMatch (not yet complete)) demonstrate value inherent in this business Note: Dollars in millions, except volume which is in billions. $21.5 $31.9 $36.3 TTM 2013 TTM 2014 TTM 2015 GTX Revenue (in millions) $2,997.7 $4,318.0 $4,654.0 TTM 2013 TTM 2014 TTM 2015 GTX Total Volume (in billions)
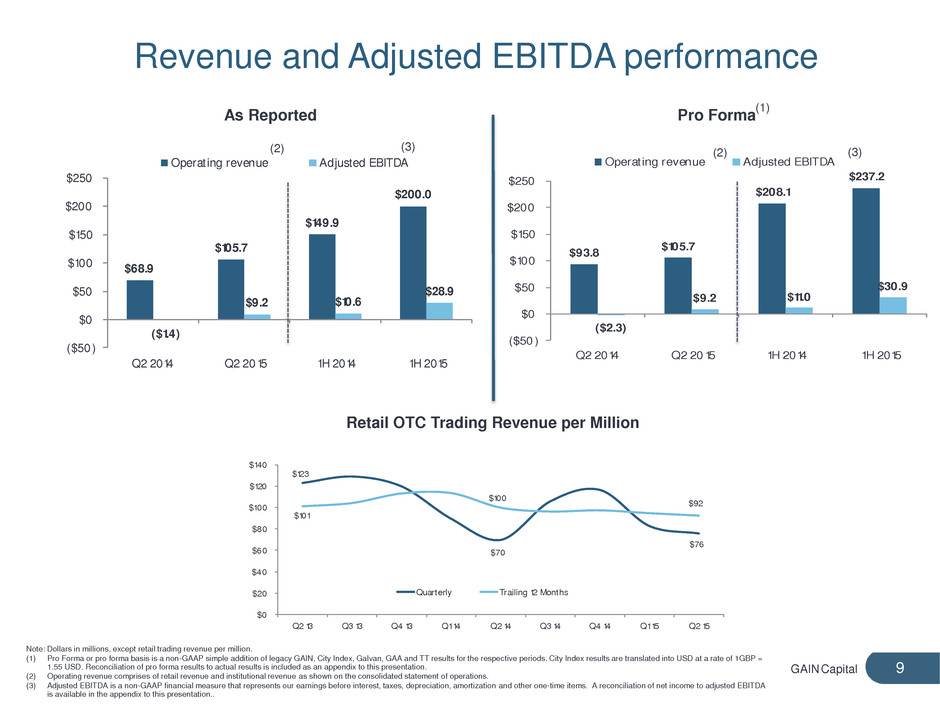
GAIN Capital $68.9 $105.7 $149.9 $200.0 ($1.4) $9.2 $10.6 $28.9 ($50 ) $0 $50 $100 $150 $200 $250 Q2 2014 Q2 2015 1H 2014 1H 2015 Operat ing revenue Adjusted EBITDA 9 Revenue and Adjusted EBITDA performance Note: Dollars in millions, except retail trading revenue per million. (1) Pro Forma or pro forma basis is a non-GAAP simple addition of legacy GAIN, City Index, Galvan, GAA and TT results for the respective periods. City Index results are translated into USD at a rate of 1GBP = 1.55 USD. Reconciliation of pro forma results to actual results is included as an appendix to this presentation. (2) Operating revenue comprises of retail revenue and institutional revenue as shown on the consolidated statement of operations. (3) Adjusted EBITDA is a non-GAAP financial measure that represents our earnings before interest, taxes, depreciation, amortization and other one-time items. A reconciliation of net income to adjusted EBITDA is available in the appendix to this presentation.. $93.8 $105.7 $2 8.1 $237.2 ($2.3) $9.2 $11.0 $30.9 ($50 ) $0 $50 $100 $150 $200 $250 4 Q2 2015 1H 2014 1H 2015 Operat ing revenue Adjusted EBITDA As Reported Pro Forma (3) (3) (2) (2) (1) $123 $70 $76 101 $100 $92 $0 $20 $40 $60 $80 $100 $120 $140 Q2 13 Q3 13 Q4 13 Q1 14 Q2 14 Q3 14 Q4 14 Q1 15 Q2 15 Quarterly Trailing 12 Months Retail OTC Trading Revenue per Million
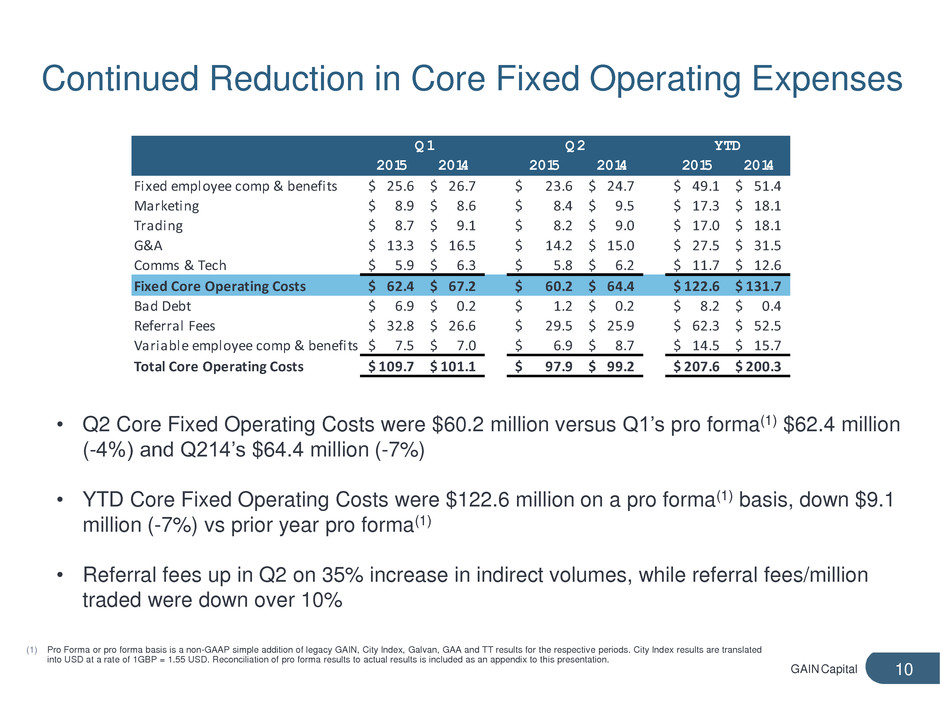
10 GAIN Capital • Q2 Core Fixed Operating Costs were $60.2 million versus Q1’s pro forma(1) $62.4 million (-4%) and Q214’s $64.4 million (-7%) • YTD Core Fixed Operating Costs were $122.6 million on a pro forma(1) basis, down $9.1 million (-7%) vs prior year pro forma(1) • Referral fees up in Q2 on 35% increase in indirect volumes, while referral fees/million traded were down over 10% 2015 2014 2015 2014 2015 2014 Fixed employee comp & benefits 25.6$ 26.7$ 23.6$ 24.7$ 49.1$ 51.4$ Marketing 8.9$ 8.6$ 8.4$ 9.5$ 17.3$ 18.1$ Trading 8.7$ 9.1$ 8.2$ 9.0$ 17.0$ 18.1$ G&A 13.3$ 16.5$ 14.2$ 15.0$ 27.5$ 31.5$ Comms & Tech 5.9$ 6.3$ 5.8$ 6.2$ 11.7$ 12.6$ Fixed Core Operating Costs 62.4$ 67.2$ 60.2$ 64.4$ 122.6$ 131.7$ Bad Debt 6.9$ 0.2$ 1.2$ 0.2$ 8.2$ 0.4$ Referral Fees 32.8$ 26.6$ 29.5$ 25.9$ 62.3$ 52.5$ Variable employee comp & benefits 7.5$ 7.0$ 6.9$ 8.7$ 14.5$ 15.7$ Total Core Operating Costs 109.7$ 101.1$ 97.9$ 99.2$ 207.6$ 200.3$ Q1 Q2 YTD Continued Reduction in Core Fixed Operating Expenses (1) Pro Forma or pro forma basis is a non-GAAP simple addition of legacy GAIN, City Index, Galvan, GAA and TT results for the respective periods. City Index results are translated into USD at a rate of 1GBP = 1.55 USD. Reconciliation of pro forma results to actual results is included as an appendix to this presentation.
GAIN Capital 11 Capital Utilization and Return • GAIN continuing to strategically deploy cash to grow the business and generate returns for shareholders • Primary use of cash is investing in high ROI initiatives of existing businesses • Continue to review several acquisition and investment opportunities • Targeting new products, geographic expansion and technology • Return of capital to shareholders • $0.05 per share quarterly dividend approved • Record date: September 14, 2015 • Payment date: September 23, 2015 • Share buyback plan in place to opportunistically repurchase shares • Expect buyback purchases to be more active in Q3

GAIN Capital 12 Closing Remarks • Continuing to scale the business and execute on strategic plan to further our leadership position as a leading multi-asset broker focused on retail and institutional clients • Focus on managing operating expenses and delivering cost synergies associated with the acquisition of City Index • Continuing to develop GTX into a market-leading institutional ECN • Looking forward to expanding adjusted EBITDA margin through further cost management and capture of acquisition synergies • Continue to actively review corporate development opportunities to grow existing businesses and add complementary products, technology and/or geographies

GAIN Capital Appendix 13

GAIN Capital 14 Consolidated Statement of Operations Three Months Ended Six Months Ended June 30, June 30, 2015 2014 2015 2014 Revenue Retail revenue 97.3$ 60.3$ 181.6$ 132.8$ Institutional revenue 8.4 8.5 18.4 17.1 Other revenue 5.9 0.6 4.5 0.7 Total non-interest revenue 111.6 69.4 204.5 150.6 Interest revenue 0.3 0.4 0.6 0.7 Interest expense 0.3 0.1 0.6 0.2 Total net interest revenue - 0.3 - 0.5 Net revenue (1) 111.6 69.7 204.5 151.1 Expenses Em ployee com pensation and benefits 30.5 24.1 52.6 45.9 Selling and m arketing 8.4 5.2 13.0 11.3 Referral fees 29.5 20.5 56.1 41.2 Trading expense 8.2 7.2 15.3 14.1 General & Adm inistrative 14.2 9.8 23.4 19.0 Depreciation and am ortization 2.7 1.8 4.7 4.0 Purchased intangible am ortization 4.3 1.6 6.4 2.6 Com m unication and technology 5.8 3.8 8.6 7.8 Bad debt provision 1.3 0.6 4.6 1.2 Acquisition costs 2.5 0.2 2.5 0.6 Restructuring 1.9 0.2 1.9 0.6 Integration costs 12.3 0.3 12.4 1.7 Im pairm ent on investm ent - - Total operating expense 121.6 75.3 201.5 150.0 Operating incom e (10.0) (5.6) 3.0 1.1 Interest on long term borrowings 2.5 1.5 4.0 2.9 Gain on extinguishm ent of debt - - Incom e before tax expense (12.5) (7.1) (1.0) (1.8) Incom e tax expense (4.1) (2.0) (1.3) (0.7) Net incom e (8.4) (5.1) 0.3 (1.1) Net incom e attributable to non-controlling interest 0.4 0.1 0.8 0.2 Net incom e applicable to Gain Capital Holdings Inc. (8.8)$ (5.2)$ (0.5)$ (1.3)$ Earnings per com m on share (2) Basic ($0.23) ($0.13) ($0.07) ($0.04) Diluted ($0.23) ($0.13) ($0.07) ($0.04) W eighted averages com m on shares outstanding used in com puting earnings per com m on share: Basic 49,070,783 40,135,820 46,154,905 39,839,012 Diluted 49,070,783 40,135,820 46,154,905 39,839,012 Note: Dollars in millions, except per share data (1) Net revenue includes $4.5 million arising from a fair value adjustment to the contingent consideration of a prior period acquisition. (2) Earnings per share includes an adjustment for the redemption value of the NCI put option

GAIN Capital 15 Consolidated Balance Sheet Note: Dollars in millions. As of 6/30/15 12/31/14 ASSETS: Cash and cash equivalents 135.0$ 139.4$ Cash and securities held for custom ers 1,109.4 759.6 Short term investm ents 0.3 0.2 Receivables from banks and brokers 157.0 134.9 Property and equipm ent - net of accum ulated depreciation 27.8 18.8 Prepaid assets 8.4 2.5 Goodwill 48.0 34.6 Intangible assets, net 111.5 60.8 Other assets 55.2 35.1 Total assets 1,652.6$ 1,185.9$ LIABILITIES AND SHAREHOLDERS' EQUITY: Payables to custom er, brokers, dealers, FCM'S and other regulated entities 1,109.4$ 759.6$ Accrued com pensation & benefits 8.5 16.9 Accrued expenses and other liabilities 65.5 64.4 Incom e tax payable 3.6 1.5 Loan payable 119.8 68.4 Total liabilities 1,306.8$ 910.8$ Non-controlling interest 12.8$ 10.2$ Shareholders' Equity 333.0 264.9 Total liabilities and shareholders' equity 1,652.6$ 1,185.9$
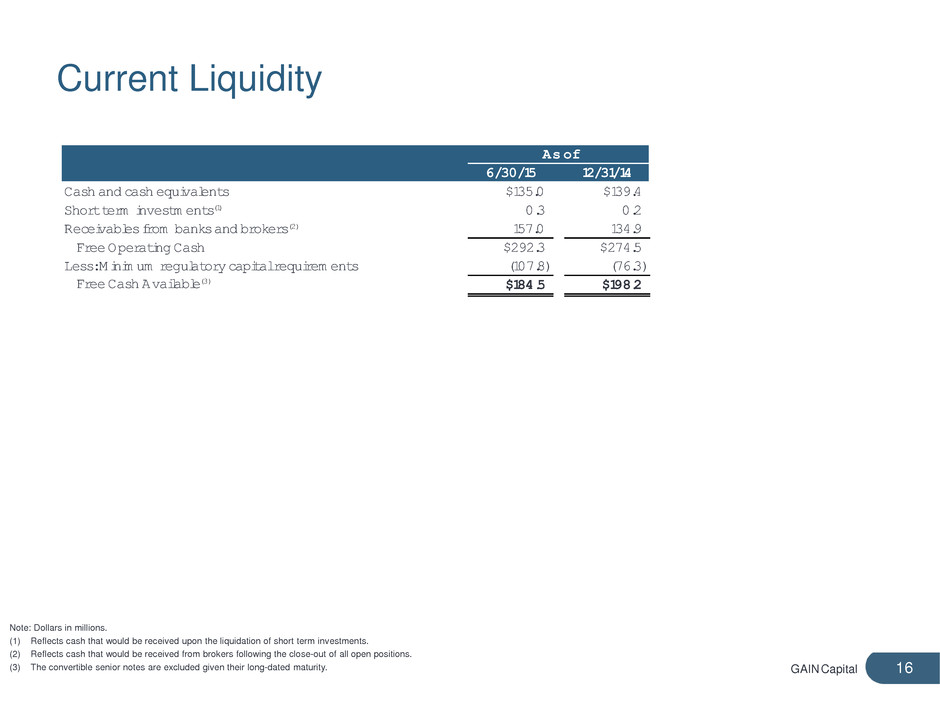
GAIN Capital 16 Current Liquidity Note: Dollars in millions. (1) Reflects cash that would be received upon the liquidation of short term investments. (2) Reflects cash that would be received from brokers following the close-out of all open positions. (3) The convertible senior notes are excluded given their long-dated maturity. As of 6/30/15 12/31/14 Cash and cash equivalents $135.0 $139.4 Short term investm ents(1) 0.3 0.2 Receivables from banks and brokers(2) 157.0 134.9 Free Operating Cash $292.3 $274.5 Less: Minim um regulatory capital requirem ents (107.8) (76.3) Free Cash Available(3) $184.5 $198.2

GAIN Capital 17 Adjusted EBITDA & Margin Reconciliation Note: Dollars in millions. (1) Adjusted EBITDA margin is calculated as adjusted EBITDA divided by net revenue. 3 Months Ended June 30, 6 Months Ended June 30, 2015 2014 2015 2014 Net Revenue 111.5$ 69.8$ 204.5$ 151.1$ Net Incom e (8.8) (5.2) (0.5) (1.3) Net Incom e Margin % (8%) (7%) (0%) (1%) Net Incom e (8.8)$ (5.2)$ (0.5)$ (1.3)$ Depreciation & am ortization 2.7 1.8 4.7 4.0 Purchase intangible am ortization 4.3 1.6 6.4 2.6 Interest expense 2.5 1.5 4.0 2.9 Incom e tax expense (4.1) (2.0) (1.3) (0.7) Acquisition costs 2.5 0.2 2.5 0.6 Restructuring 1.9 0.2 1.9 0.6 Integrationcosts 12.3 0.3 12.4 1.7 Acquisition contingent consideration adjustm ent (4.5) - (4.5) - Bad debt related to SNB event in January of 2015 - - 2.5 - Net incom e attributable to non-controlling interest 0.4 0.1 0.8 0.2 Adjusted EBITDA 9.2$ (1.5)$ 28.9$ 10.6$ Adjusted EBITDA Margin % (1) 8% (2%) 14% 7%

GAIN Capital 18 Cash Net Income and EPS Reconciliation Note: Dollars in millions, except per share and share data 3 Months Ended June 30, 6 Months Ended June 30, 2015 2014 2015 2014 Net Incom e (8.8)$ (5.2)$ (0.5)$ (1.3)$ Depreciation & am ortization, net of tax 2.0 1.3 3.5 2.4 Integration, net of tax 9.3 0.2 9.3 1.0 Purchase intangible am ortization, net of tax 3.2 1.1 4.8 1.6 Acquisition contingent consideration adjustm ent, net of tax (3.4) - (3.4) - Non-cash interest expense, net of tax 0.8 0.4 1.4 0.7 Cash Net Incom e 3.1$ (2.2)$ 15.1$ 4.4$ Cash Earnings per Com m on Share: Basic 0.06$ (0.05)$ 0.33$ 0.11$ Diluted 0.06$ (0.05)$ 0.33$ 0.11$ W eighted average com m on shares outstanding used in com puting earnings per com m on share: Basic 49,070,783 40,135,820 46,154,905 39,839,012 Dilued 49,070,783 40,135,820 46,154,905 39,839,012
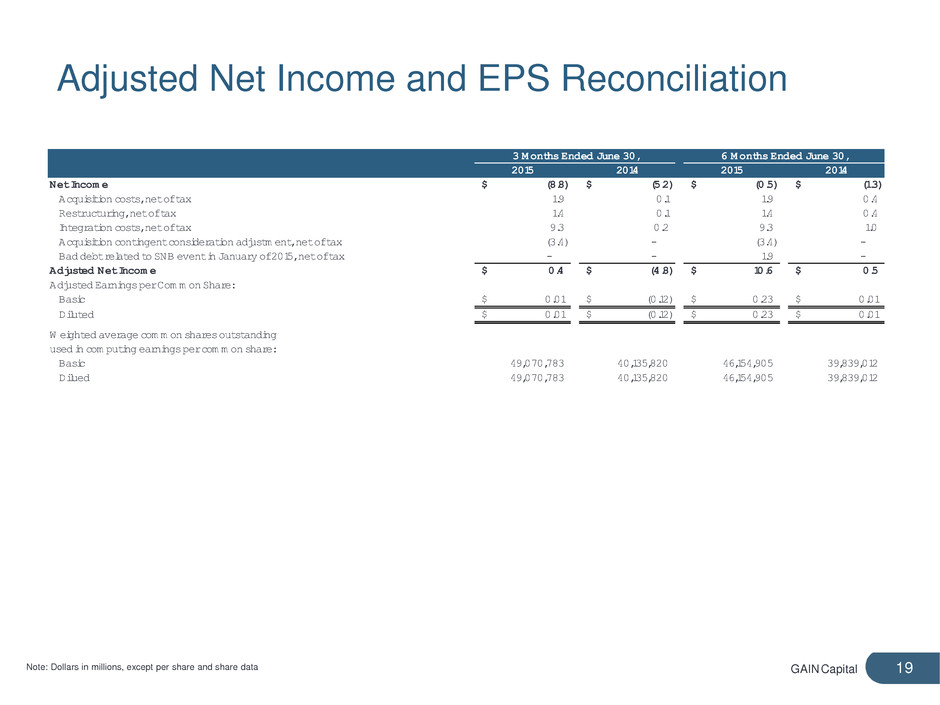
GAIN Capital 19 Adjusted Net Income and EPS Reconciliation 3 Months Ended June 30, 6 Months Ended June 30, 2015 2014 2015 2014 Net Incom e (8.8)$ (5.2)$ (0.5)$ (1.3)$ Acquisition costs, net of tax 1.9 0.1 1.9 0.4 Restructuring, net of tax 1.4 0.1 1.4 0.4 Integration costs, net of tax 9.3 0.2 9.3 1.0 Acquisition contingent consideration adjustm ent, net of tax (3.4) - (3.4) - Bad debt related to SNB event in January of 2015, net of tax - - 1.9 - Adjusted Net Incom e 0.4$ (4.8)$ 10.6$ 0.5$ Adjust Earnings per Com m on Share: Basic 0.01$ (0.12)$ 0.23$ 0.01$ Diluted 0.01$ (0.12)$ 0.23$ 0.01$ W eighted average com m on shares outstanding used in com puting earnings per com m on share: Basic 49,070,783 40,135,820 46,154,905 39,839,012 Dilued 49,070,783 40,135,820 46,154,905 39,839,012 Note: Dollars in millions, except per share and share data
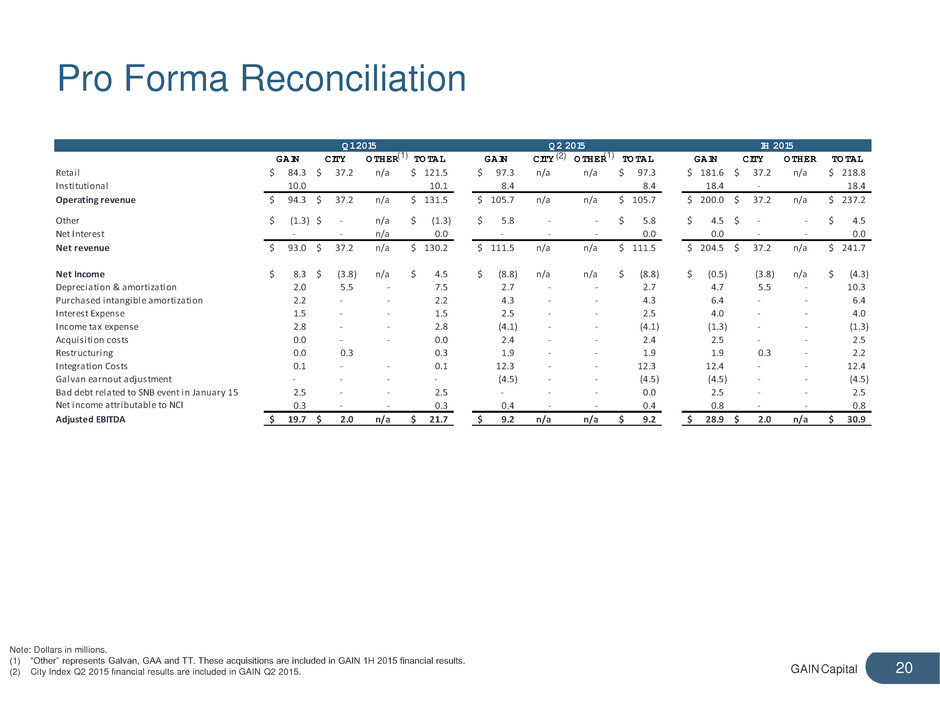
GAIN Capital 20 Pro Forma Reconciliation GAIN CITY OTHER TOTAL GAIN CITY OTHER TOTAL GAIN CITY OTHER TOTAL Retail 84.3$ 37.2$ n/a 121.5$ 97.3$ n/a n/a 97.3$ 181.6$ 37.2$ n/a 218.8$ Institutional 10.0 10.1 8.4 8.4 18.4 - 18.4 Operating revenue 94.3$ 37.2$ n/a 131.5$ 105.7$ n/a n/a 105.7$ 200.0$ 37.2$ n/a 237.2$ Other (1.3)$ -$ n/a (1.3)$ 5.8$ - - 5.8$ 4.5$ -$ - 4.5$ Net Interest - - n/a 0.0 - - - 0.0 0.0 - - 0.0 Net revenue 93.0$ 37.2$ n/a 130.2$ 111.5$ n/a n/a 111.5$ 204.5$ 37.2$ n/a 241.7$ Net Income 8.3$ (3.8)$ n/a 4.5$ (8.8)$ n/a n/a (8.8)$ (0.5)$ (3.8) n/a (4.3)$ Depreciation & amortization 2.0 5.5 - 7.5 2.7 - - 2.7 4.7 5.5 - 10.3 Purchased intangible amortization 2.2 - - 2.2 4.3 - - 4.3 6.4 - - 6.4 Interest Expense 1.5 - - 1.5 2.5 - - 2.5 4.0 - - 4.0 Income tax expense 2.8 - - 2.8 (4.1) - - (4.1) (1.3) - - (1.3) Acquisition costs 0.0 - - 0.0 2.4 - - 2.4 2.5 - - 2.5 Restructuring 0.0 0.3 0.3 1.9 - - 1.9 1.9 0.3 - 2.2 Integration Costs 0.1 - - 0.1 12.3 - - 12.3 12.4 - - 12.4 Galvan earnout adjustment - - - - (4.5) - - (4.5) (4.5) - - (4.5) Bad debt related to SNB event in January 15 2.5 - - 2.5 - - - 0.0 2.5 - - 2.5 Net income attributable to NCI 0.3 - - 0.3 0.4 - - 0.4 0.8 - - 0.8 Adjusted EBITDA 19.7$ 2.0$ n/a 21.7$ 9.2$ n/a n/a 9.2$ 28.9$ 2.0$ n/a 30.9$ Q1 2015 Q2 2015 1H 2015 Note: Dollars in millions. (1) “Other” represents Galvan, GAA and TT. These acquisitions are included in GAIN 1H 2015 financial results. (2) City Index Q2 2015 financial results are included in GAIN Q2 2015. (1) (1) (2)

GAIN Capital 21 Pro Forma Reconciliation cont. GAIN CITY OTHER TOTAL GAIN CITY OTHER TOTAL GAIN CITY OTHER TOTAL Retail 90.5$ 35.4$ n/a 125.9$ 105.7$ 43.6$ n/a 149.3$ 196.2$ 79.0$ n/a 275.2$ Institutional 8.4 8.4 9.3 9.3 17.7 - 17.7 Operating revenue 98.9$ 35.4$ n/a 134.3$ 115.0$ 43.6$ n/a 158.6$ 213.9$ 79.0$ n/a 292.9$ Other 4.5$ -$ n/a 4.5$ (0.3)$ -$ n/a (0.3)$ 4.2$ -$ 4.2$ Net Interest 0.3 - n/a 0.3 0.0 - n/a 0.0 0.3 - 0.3 Net revenue 103.7$ 35.4$ n/a 139.1$ 114.8$ 43.6$ n/a 158.3$ 218.4$ 79.0$ n/a 297.4$ Net Income 15.4$ 1.9$ n/a 17.3$ 17.6$ 3.1$ n/a 20.7$ 33.0$ 5.0$ n/a 38.0$ Depreciation & amortization 1.6 2.1 - 3.8 1.3 2.4 - 3.7 3.0 4.5 - 7.5 Purchased intangible amortization 2.1 2.9 - 5.1 3.1 3.0 - 6.1 5.3 5.9 - 11.2 Interest Expense 1.5 - - 1.5 1.8 - - 1.8 3.3 - - 3.3 Income tax expense 5.3 - - 5.3 8.4 - - 8.4 13.7 - - 13.7 Acquisition costs 0.9 - - 0.9 2.0 - - 2.0 2.9 - - 2.9 Restructuring 0.4 - - 0.4 0.2 - - 0.2 0.6 - - 0.6 Integration Costs - - - - 0.7 1.2 - 2.0 0.7 1.2 - 2.0 Impairment on investment - - - - 0.1 - - 0.1 0.1 - - 0.1 Net income attributable to NCI 0.8 - - 0.8 0.4 - - 0.4 1.2 - - 1.2 Adjusted EBITDA 28.1$ 6.9$ n/a 35.0$ 35.7$ 9.7$ n/a 45.4$ 63.8$ 16.7$ n/a 80.4$ Q3 2014 Q4 2014 2H 2014 Note: Dollars in millions. (1) “Other” represents Galvan, GAA and TT. These acquisitions are included in GAIN 2H 2014 financial results. (1) (1)

GAIN Capital 22 Pro Forma Reconciliation cont. GAIN CITY OTHER TOTAL GAIN CITY OTHER TOTAL GAIN CITY OTHER TOTAL Retail 72.2$ 27.9$ 5.5$ 105.6$ 60.3$ 22.6$ 2.3$ 85.2$ 132.5$ 50.4$ 7.8$ 190.8$ Institutional 8.8 8.8 8.6 8.6 17.4 - - 17.4 Operating revenue 81.0$ 27.9$ 5.5$ 114.4$ 68.9$ 22.6$ 2.3$ 93.8$ 149.9$ 50.4$ 7.8$ 208.1$ Other 0.1$ -$ (0.0)$ 0.1$ 0.6$ -$ -$ 0.6$ 0.7$ -$ (0.0)$ 0.7$ Net Interest 0.2 - (0.2) 0.1 0.3 - - 0.3 0.6 - (0.2) 0.4 Net revenue 81.3$ 27.9$ 5.3$ 114.6$ 69.8$ 22.6$ 2.3$ 94.7$ 151.2$ 50.4$ 7.6$ 209.2$ Net Income 3.8$ (6.2)$ 0.2$ (2.2)$ (5.1)$ (6.3)$ 0.7$ (10.8)$ (1.3)$ (12.5)$ 0.8$ (13.0)$ Depreciation & amortization 2.2 1.8 - 3.9 1.8 1.9 - 3.7 3.9 3.7 - 7.6 Purchased intangible amortization 1.0 5.4 - 6.4 1.6 2.9 - 4.5 2.5 8.3 - 10.8 Interest Expense 1.5 - - 1.5 1.5 - - 1.5 2.9 - - 2.9 Income tax expense 1.3 - - 1.3 (2.0) - - (2.0) (0.7) - - (0.7) Acquisition costs 0.4 - - 0.4 0.2 - - 0.2 0.6 - - 0.6 Restructuring 0.4 - - 0.4 0.2 - - 0.2 0.6 - - 0.6 Integration Costs 1.5 - - 1.5 0.3 - - 0.3 1.8 - - 1.8 Net income attributable to NCI 0.0 - - 0.0 0.1 - - 0.1 0.1 - - 0.1 Adjusted EBITDA 12.1$ 1.0$ 0.2$ 13.2$ (1.4)$ (1.5)$ 0.7$ (2.3)$ 10.5$ (0.6)$ 0.8$ 10.7$ Q1 2014 Q2 2014 1H 2014 Note: Dollars in millions. (1) “Other” represents Galvan, GAA and TT in Q1 2014; GAA and TT results are included in GAIN for Q2 2014 (1) (1)
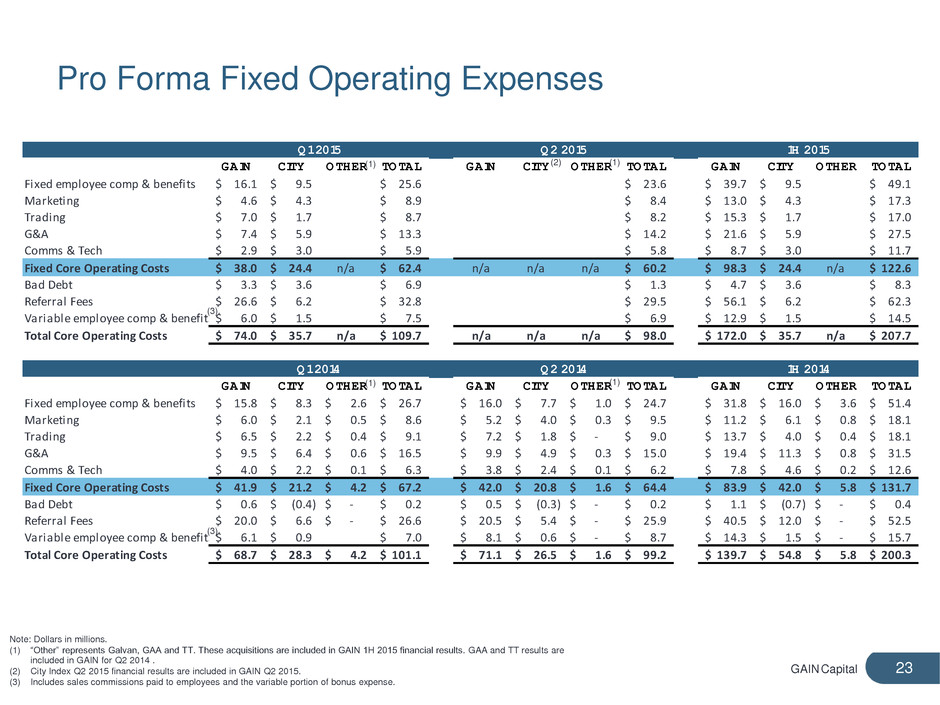
GAIN Capital 23 Pro Forma Fixed Operating Expenses GAIN CITY OTHER TOTAL GAIN CITY OTHER TOTAL GAIN CITY OTHER TOTAL Fixed employee comp & benefits 16.1$ 9.5$ 25.6$ 23.6$ 39.7$ 9.5$ 49.1$ Marketing 4.6$ 4.3$ 8.9$ 8.4$ 13.0$ 4.3$ 17.3$ Trading 7.0$ 1.7$ 8.7$ 8.2$ 15.3$ 1.7$ 17.0$ G&A 7.4$ 5.9$ 13.3$ 14.2$ 21.6$ 5.9$ 27.5$ Comms & Tech 2.9$ 3.0$ 5.9$ 5.8$ 8.7$ 3.0$ 11.7$ Fixed Core Operating Costs 38.0$ 24.4$ n/a 62.4$ n/a n/a n/a 60.2$ 98.3$ 24.4$ n/a 122.6$ Bad Debt 3.3$ 3.6$ 6.9$ 1.3$ 4.7$ 3.6$ 8.3$ Referral Fees 26.6$ 6.2$ 32.8$ 29.5$ 56.1$ 6.2$ 62.3$ Variable employee comp & benefits 6.0$ 1.5$ 7.5$ 6.9$ 12.9$ 1.5$ 14.5$ Total Core Operating Costs 74.0$ 35.7$ n/a 109.7$ n/a n/a n/a 98.0$ 172.0$ 35.7$ n/a 207.7$ GAIN CITY OTHER TOTAL GAIN CITY OTHER TOTAL GAIN CITY OTHER TOTAL Fixed employee comp & benefits 15.8$ 8.3$ 2.6$ 26.7$ 16.0$ 7.7$ 1.0$ 24.7$ 31.8$ 16.0$ 3.6$ 51.4$ Marketing 6.0$ 2.1$ 0.5$ 8.6$ 5.2$ 4.0$ 0.3$ 9.5$ 11.2$ 6.1$ 0.8$ 18.1$ Trading 6.5$ 2.2$ 0.4$ 9.1$ 7.2$ 1.8$ -$ 9.0$ 13.7$ 4.0$ 0.4$ 18.1$ G&A 9.5$ 6.4$ 0.6$ 16.5$ 9.9$ 4.9$ 0.3$ 15.0$ 19.4$ 11.3$ 0.8$ 31.5$ Comms & Tech 4.0$ 2.2$ 0.1$ 6.3$ 3.8$ 2.4$ 0.1$ 6.2$ 7.8$ 4.6$ 0.2$ 12.6$ Fixed Core Operating Costs 41.9$ 21.2$ 4.2$ 67.2$ 42.0$ 20.8$ 1.6$ 64.4$ 83.9$ 42.0$ 5.8$ 131.7$ Bad Debt 0.6$ (0.4)$ -$ 0.2$ 0.5$ (0.3)$ -$ 0.2$ 1.1$ (0.7)$ -$ 0.4$ Referral Fees 20.0$ 6.6$ -$ 26.6$ 20.5$ 5.4$ -$ 25.9$ 40.5$ 12.0$ -$ 52.5$ Variable employee comp & benefits 6.1$ 0.9$ 7.0$ 8.1$ 0.6$ -$ 8.7$ 14.3$ 1.5$ -$ 15.7$ Total Core Operating Costs 68.7$ 28.3$ 4.2$ 101.1$ 71.1$ 26.5$ 1.6$ 99.2$ 139.7$ 54.8$ 5.8$ 200.3$ Q1 2014 Q2 2014 1H 2014 Q1 2015 Q2 2015 1H 2015 Note: Dollars in millions. (1) “Other” represents Galvan, GAA and TT. These acquisitions are included in GAIN 1H 2015 financial results. GAA and TT results are included in GAIN for Q2 2014 . (2) City Index Q2 2015 financial results are included in GAIN Q2 2015. (3) Includes sales commissions paid to employees and the variable portion of bonus expense. (1) (1) (1) (1) (2) (3) (3)

GAIN Capital 24 Quarterly Operating Metrics Note: Volumes in billions; assets in millions Definitions for all operating metrics are available on page 25. 3 Months Ended, Jun-14 Sep-14 Dec-14 Mar-15 Jun-15 Retail Metrics OTC Trading Volum e $522.2 $605.4 $730.6 $798.6 $1,067.3 Average Daily Volum e $8.0 $9.2 $11.2 $12.6 $16.4 Active OTC Accounts 94,261 93,777 94,895 99,017 148,730 Active Futures Accounts 7,247 7,780 8,184 8,562 8,799 Active Retail Accounts 101,508 101,557 103,079 107,579 157,529 OTC Custom er Assets $663.6 $641.3 $562.9 $599.0 $877.6 Futures Custom er Assets $176.4 $208.4 $196.7 $227.8 $231.8 Total Retail Assets $840.0 $849.7 $759.6 $826.8 $1,109.4 Futures Contracts 1,710,944 1,764,586 1,979,013 2,381,073 2,055,878 Average Daily Futures Contracts 26,322 26,736 30,446 39,034 32,633 Sales Trader Volum e $111.7 $92.0 $90.8 $96.0 $92.8

GAIN Capital 25 Definition of Metrics • Active Accounts: Retail accounts who executed a transaction within the last 12 months • Trading Volume: Represents the U.S. dollar equivalent of notional amounts traded • Customer Assets: Represents amounts due to clients, including customer deposits and unrealized gains or losses arising from open positions

Financial and Operating Results Second Quarter and First Half 2015 August 2015
