Attached files
| file | filename |
|---|---|
| EX-32.2 - EXHIBIT 32.2 - GAIN Capital Holdings, Inc. | exhibit322cfocertification.htm |
| EX-32.1 - EXHIBIT 32.1 - GAIN Capital Holdings, Inc. | exhibit321ceocertification.htm |
| EX-31.2 - EXHIBIT 31.2 - GAIN Capital Holdings, Inc. | exhibit312cfocertification.htm |
| EX-31.1 - EXHIBIT 31.1 - GAIN Capital Holdings, Inc. | exhibit311ceocertification.htm |
| EX-23.3 - EXHIBIT 23.3 - GAIN Capital Holdings, Inc. | exhibit233kpmgconsent.htm |
| EX-23.2 - EXHIBIT 23.2 - GAIN Capital Holdings, Inc. | exhibit232bdoconsent.htm |
| EX-23.1 - EXHIBIT 23.1 - GAIN Capital Holdings, Inc. | exhibit231deloitteconsent.htm |
| EX-21.1 - EXHIBIT 21.1 - GAIN Capital Holdings, Inc. | exhibit211subsidiarylist.htm |
| EX-10.43 - EXHIBIT 10.43 - GAIN Capital Holdings, Inc. | exhibit1043jeffreyscottemp.htm |
UNITED STATES
SECURITIES AND EXCHANGE COMMISSION
Washington, D.C. 20549
FORM 10-K
ý | ANNUAL REPORT PURSUANT TO SECTION 13 OR 15(d) OF THE SECURITIES EXCHANGE ACT OF 1934 |
For the Fiscal Year Ended December 31, 2016
OR
¨ | TRANSITION REPORT PURSUANT TO SECTION 13 OR 15(d) OF THE SECURITIES EXCHANGE ACT OF 1934 |
For the Transition Period from to .
Commission File Number 001-35008
GAIN CAPITAL HOLDINGS, INC.
(Exact name of registrant as specified in its charter)
Delaware | 20-4568600 | |
(State or other jurisdiction of incorporation or organization) | (I.R.S. Employer Identification No.) | |
Bedminster One 135 Route 202/206 Bedminster, New Jersey | 07921 | |
(Address of principal executive offices) | (Zip Code) | |
Registrant’s telephone number, including area code: (908) 731-0700
Securities registered pursuant to Section 12(b) of the Act:
Title of each class | Name of exchange on which registered | |
Common stock, $0.00001 | New York Stock Exchange | |
Indicate by a check mark if the registrant is a well-known seasoned issuer, as defined in Rule 405 of the Securities Act. o Yes x No
Indicate by a check mark if the registrant is not required to file reports pursuant to Section 13 or Section 15(d) of the Act. o Yes x No
Indicate by check mark whether the registrant (1) has filed all reports required to be filed by Section 13 or 15(d) of the Securities Exchange Act of 1934 during the preceding 12 months (or for such shorter period that the registrant was required to file such reports), and (2) has been subject to such filing requirements for the past 90 days. ý Yes ¨ No
Indicate by check mark whether the registrant has submitted electronically and posted on its corporate Web site, if any, every Interactive Data File required to be submitted and posted pursuant to Rule 405 of Regulation S-T during the preceding 12 months (or for such shorter period that the registrant was required to submit and post such files). ý Yes ¨ No
Indicate by check mark if disclosure of delinquent filers pursuant to Item 405 of Regulation S-K is not contained herein, and will not be contained to the best of the registrant’s knowledge, in definitive proxy or information statements incorporated by reference into Part III of this Form 10-K or any amendment to this Form 10-K. ý
Indicate by check mark whether the registrant is a large accelerated filer, an accelerated filer, a non-accelerated filer, or a smaller reporting company. See the definitions of “large accelerated filer,” “accelerated filer” and “smaller reporting company” in Rule 12b-2 of the Exchange Act.
Large accelerated filer | ¨ | Accelerated filer | ý | |
Non-accelerated filer | ¨ (Do not check if a smaller reporting company) | Smaller reporting company | ¨ | |
Indicate by a check mark whether the registrant is a shell company (as defined in Rule 12b-2 of the Exchange Act). ¨ Yes ý No
The aggregate market value of the voting stock held by non-affiliates of the registrant as of June 30, 2016, was approximately $239 million.
As of March 1, 2017, the registrant had 48,232,068 shares of common stock, $0.00001 par value per share, outstanding.
DOCUMENTS INCORPORATED BY REFERENCE
Certain information contained in the registrant’s Definitive Proxy Statement to be filed pursuant to Regulation 14A within 120 days after the end of the fiscal year is incorporated by reference into Part III of this Form 10-K.
GAIN Capital Holdings, Inc.
FORM 10-K FOR THE FISCAL YEAR ENDED DECEMBER 31, 2016
Item 1. | Business | |
Item 1A. | Risk Factors | |
Item 1B. | Unresolved Staff Comments | |
Item 2. | Properties | |
Item 3. | Legal Proceedings | |
Item 4. | Mine Safety Disclosures | |
Item 5. | Market for Registrant’s Common Equity, Related Stockholder Matters and Issuer Purchases of Equity Securities | |
Item 6. | Selected Financial Data | |
Item 7. | Management’s Discussion and Analysis of Financial Condition and Results of Operations | |
Item 7A. | Quantitative and Qualitative Disclosures about Market Risk | |
Item 8. | Financial Statements and Supplementary Data | |
Item 9. | Changes in and Disagreements with Accountants on Accounting and Financial Disclosure | |
Item 9A. | Controls and Procedures | |
Item 9B. | Other Information | |
PART III | ||
Item 10. | Directors, Executive Officers and Corporate Governance | |
Item 11. | Executive Compensation | |
Item 12. | Security Ownership of Certain Beneficial Owners and Management and Related Stockholder Matters | |
Item 13. | Certain Relationships and Related Transactions, and Director Independence | |
Item 14. | Principal Accountant Fees and Services | |
PART IV | ||
Item 15. | Exhibits and Financial Statement Schedules | |
EXHIBIT INDEX | ||
3
PART I
FORWARD-LOOKING INFORMATION
In this Annual Report on Form 10-K, the words “GAIN,” the “Company,” “our,” “we” and “us” refer to GAIN Capital Holdings, Inc. and, except as otherwise specified herein, to GAIN’s subsidiaries. GAIN’s fiscal year ended on December 31, 2016.
This Annual Report on Form 10-K contains a number of forward-looking statements within the meaning of Section 21E of the Securities Exchange Act of 1934 as amended. These forward-looking statements are based on current expectations, estimates, forecasts and projections about the industry and markets in which GAIN operates and management’s current beliefs and assumptions. Any statements contained herein (including without limitation statements to the effect that management or GAIN “believes,” “expects,” “anticipates,” “plans” and similar expressions) that are not statements of historical fact should be considered forward-looking statements and should be read in conjunction with the consolidated financial statements and notes to consolidated financial statements included in this report and the section entitled “Management’s Discussion and Analysis of Financial Condition and Results of Operations.” These statements are not guarantees of future performance and involve certain risks, uncertainties and assumptions that are difficult to predict. There are a number of important factors that could cause actual results to differ materially from those indicated by such forward-looking statements. These factors include, without limitation, those set forth in the section entitled “Item 1A – Risk Factors” below and discussed elsewhere herein. The risks and uncertainties described below are not the only ones we face. We expressly disclaim any obligation to update any forward-looking statements, except as may be required by law.
ITEM 1. | BUSINESS |
OVERVIEW
We are a global provider of trading services and solutions, specializing in over-the-counter, or OTC, and exchange-traded markets. Our retail, institutional and futures segments service customers in more than 180 countries worldwide, and we conduct business from our offices in Bedminster, New Jersey; Jersey City, New Jersey; London, England; Cornwall, England; Chicago, Illinois; Powell, Ohio; Tokyo, Japan; Sydney, Australia; Beijing, China; Shanghai, China; Pembroke, Bermuda; Hong Kong, Dubai, U.A.E. and Singapore.
We offer our customers access to a diverse range of over 12,500 financial products, including spot foreign exchange, or forex, and precious metals trading, as well as “contracts for difference”, or CFDs, which are investment products with returns linked to the performance of underlying assets. We offer CFDs on currencies, commodities, indices, individual equities, bonds and interest rate products. We also support trading of exchange-traded futures and options on futures on more than 30 global exchanges. In the United Kingdom, we offer spread bets, which are investment products similar to CFDs, but that offer more favorable tax treatment for residents of that country.
We have invested considerable resources since our inception to develop our proprietary trading platforms to provide our customers with advanced price discovery, trade execution and order management functions, while improving our ability to acquire and service our customers efficiently, as well as manage market and credit risk associated with our customer’s trading activity. Today our customers can trade through web-based, downloadable and mobile trading platforms and have access to innovative trading tools to assist them with research and analysis, automated trading and account management.
We operate our business in three segments. Through our retail segment, we provide our retail customers around the world with access to a diverse range of global financial markets, including spot forex, precious metals, spread bets and CFDs on commodities, indices, individual equities and interest rate products, as well OTC options on forex. Our institutional segment provides agency execution services and electronic access to spot and forward foreign exchange and precious metals markets via our Electronic Communications Network (ECN), GTX. Our futures segment offers execution and risk management services for exchange-traded futures and futures options on major U.S. and European futures and options exchanges. Each of our operating segments is discussed in more detail below. For financial information regarding our segments, please see Note 21 to our audited consolidated financial statements included in this Annual Report.
As a global provider of online trading services, our results of operations are impacted by a number of external factors, including market volatility, competition, the regulatory environment in the various jurisdictions and markets in which we operate and the financial condition of the retail and institutional customers to whom we provide our services. These factors are not the only
4
factors that impacted our results of operations for the most recent fiscal period, and additional or other factors may impact, or have different degrees of impact, on our results of operations in future periods.
The following table sets forth the key financial data and operating metrics for our business:
Key Financial Data | |||||||||||||||||||
(in millions) | |||||||||||||||||||
Year Ended December 31, | |||||||||||||||||||
2016 | 2015 | 2014 | 2013 | 2012 | |||||||||||||||
Net Revenue | $ | 411.8 | $ | 435.3 | $ | 369.2 | $ | 267.7 | $ | 151.8 | |||||||||
Net income applicable to Gain Capital Holdings, Inc. | $ | 35.3 | $ | 10.3 | $ | 24.9 | $ | 28.1 | $ | 2.6 | |||||||||
Adjusted net income(1) | $ | 45.1 | $ | 34.3 | $ | 30.9 | $ | 29.8 | $ | 4.3 | |||||||||
Key Operating Metrics | |||||||||||||||||||
(Unaudited) | |||||||||||||||||||
Year Ended December 31, | |||||||||||||||||||
2016 | 2015 | 2014 | 2013 | 2012 | |||||||||||||||
Retail | |||||||||||||||||||
OTC Trading Volume (billions) | $ | 2,822.0 | $ | 3,985.8 | $ | 2,430.5 | $ | 1,796.7 | $ | 1,303.4 | |||||||||
OTC Average Daily Volume (billions) | $ | 10.9 | $ | 15.4 | $ | 9.4 | $ | 6.9 | $ | 5.0 | |||||||||
Active OTC Accounts(2) | 129,036 | 146,977 | 94,895 | 98,696 | 60,219 | ||||||||||||||
Client Assets (millions) | $ | 945.5 | $ | 920.6 | $ | 759.6 | $ | 739.3 | $ | 446.3 | |||||||||
Institutional | |||||||||||||||||||
Volume (billions) | $ | 2,960.1 | $ | 2,671.9 | $ | 3,183.7 | $ | 2,599.6 | $ | 1,493.8 | |||||||||
Average Daily Volume (billions) | $ | 11.4 | $ | 10.3 | $ | 12.7 | $ | 10 | $ | 5.7 | |||||||||
Futures | |||||||||||||||||||
Futures Contracts(3) | 8,304,376 | 8,623,392 | 7,027,008 | 5,386,383 | 1,507,425 | ||||||||||||||
Futures Average Daily Contracts | 32,954 | 34,356 | 28,108 | 21,460 | 18,383.2 | ||||||||||||||
(1) | Adjusted net income is a non-GAAP financial measure and represents our net income excluding restructuring, acquisition and integration-related expenses, impairment on investment and gain on extinguishment of debt. See “Management’s Discussion and Analysis of Financial Condition and Results of Operations - Key Income Statement Line Items and Key Operating Metrics” and “Reconciliation of Non-GAAP Financial Measures,” for discussion and reconciliation of non-GAAP financial measures. |
(2) | Represents accounts which executed a transaction over the last 12 months. |
(3) | Futures contracts represent the total number of contracts transacted by customers of our futures business. |
For financial information by geographic area, please see Note 21 to our audited consolidated financial statements included in this Annual Report.
5
Growth Strategies
We intend to grow our business and increase our profitability principally by employing the following growth strategies:
• | Continue to enhance our proprietary trading platforms and innovative trading tools in our retail, institutional and futures segments in order to attract customers and increase our market share; |
• | Strategically expand our operations and customer base through business acquisitions, investments and partnerships, such as our purchase of the entire issued and outstanding share capital of City Index (Holdings) Limited ("City Index"), subsequently renamed as Gain Capital Holdings Ltd, a global online trading firm specializing in CFDs, forex and spread betting, which we completed on April 1, 2015; |
• | Expand our product offerings in order to facilitate clients' trading of our wide range of financial products and to generate more revenue per customer; and |
• | Identify and enter high-growth markets in order to expand our presence globally in markets where we believe there are large revenue opportunities. |
Our Retail Segment
Our retail segment represented 80.3% of our net revenue for the year ended December 31, 2016. We conduct our retail business primarily through our FOREX.com and City Index brands. As of December 31, 2016, we had 144,946 funded retail accounts.
We provide our retail customers around the world with access to a diverse range of 12,500 global financial markets, including spot forex and precious metals trading, as well as “contracts for difference”, or CFDs, which are investment products with returns linked to the performance of underlying assets. We offer CFDs on currencies, commodities, indices, individual equities, bonds and interest rate products. In the United Kingdom, we offer spread bets, which are investment products similar to CFDs, but that offer more favorable tax treatment to residents of that country. We offer these products under the diverse regulatory environments in which we operate. For example, because of U.S. regulations, neither we, nor our subsidiaries, offer CFDs or spread bets in the United States or to U.S. residents.
We seek to attract and support our customers through direct and indirect channels. Our primary direct channels for our retail segment are our Internet websites, FOREX.com and Cityindex.com, which are available in multiple languages, including English, Chinese, Japanese, German and Arabic. Our indirect channel includes our relationships with introducing brokers, who solicit customers on our behalf, and white label partners, who offer our trading services to their customers under their own brand. Total retail trading volume sourced through direct and indirect channels was 56% and 44%, respectively, for the year ended December 31, 2016.
Our retail segment also includes Trade Facts, Ltd., or Trade Facts (formerly known as Galvan Research & Trading, Ltd.), which we acquired in 2014. Trade Facts, along with its subsidiary, Faraday Research LLP, provides individual investors with professional advice and trading recommendations across a wide range of markets, including forex, individual equities, equity indices and other market sectors.
We generate revenue in our retail segment in two ways: (1) trading revenue from our market making activities for OTC products, earned principally from the bid/offer spread we offer our customers and any net gains and losses generated through changes in the market value of the currencies and other products held in our net exposure and (2) fees, including financing charges for positions held overnight, commissions on equity CFD trades and advisory services, and other account related fees.
In 2016, we generated approximately 82.0% of our retail segment trading volume from customers outside the United States. For a discussion of the risks associated with our retail segment operations outside the United States, please see "Item 1A. Risk Factors."
The following are the key components of our retail business:
Innovative trading tools
We have made significant investment in the development and support of our award-winning proprietary trading technology in order to provide our customers with an enhanced customer experience and multiple ways to trade and manage their accounts, tailored to their level of experience and preferred mode of access. In addition, we also selectively offer third party trading tools
6
that we believe complement our proprietary offerings. We believe that our proprietary trading technology has and will continue to provide us with a significant competitive advantage because we have the ability to adapt quickly to our customers’ changing needs, rapidly incorporate new products and features and offer our customers multiple ways to engage with us.
Competitive pricing and fast, accurate trade execution
For our OTC business, we have leveraged our extensive experience in the global OTC markets to develop highly automated processes, which allow us to deliver tight bid/offer spreads generally reflective of currently available pricing in the markets we offer and to execute our customers’ trades quickly and efficiently.
In this regard, we have longstanding relationships with a large number of institutional liquidity providers, as well as access to multiple liquidity venues, which we believe allow us to offer our customers superior liquidity and more competitive pricing with tighter bid/offer spreads than many of our competitors. In addition, we have developed a proprietary pricing engine that electronically aggregates quotes from our liquidity sources based on the midpoint price between the available “best bid” and “best offer.” This proprietary technology enables us to update our prices, on average three times a second for each market we offer, helping to ensure that our prices accurately reflect current market price levels. Our proprietary technology also enables us to provide our customers with high-speed trade execution. In 2016, we handled over 13 million trade requests through FOREX.com's proprietary platform and executed 99.9% of trades in less than one second, with an average execution speed of 0.05 seconds. We have established a set of standards we use to measure execution quality for FOREX.com, and we publish execution statistics on a monthly basis. The FOREX.com execution scorecard, which is available on our website, demonstrates our ability to provide fast, accurate trade executions, as well as our commitment to transparency in our business. We believe we are the only firm in our industry to voluntarily publish a monthly execution scorecard with the level of detail that we provide.
Automated customer onboarding and account management
We have developed proprietary technology to automate or otherwise facilitate operational functions that are core to our business and that we believe are important to our ability to deliver a superior customer experience. This includes a highly automated account opening and customer verification process, fast online account funding and withdrawals with a wide variety of automated payment methods, and on-demand delivery of customer information, such as account statements and other account-related reporting. We also offer account opening and funding functions on our mobile trading applications in order to provide a superior experience to the large number of customers who trade primarily through their mobile devices. Given the highly regulated and global nature of our business, these processes are customized to each regulatory jurisdiction in which we operate, and are further tailored to customer needs and preferences in specific countries in order to make it easier for clients in these countries to open accounts with us and then to fund and trade in those accounts. As a result, we have experienced a strong success at acquiring clients from countries in the world where we do not have a local office.
Sophisticated risk management
Because we are exposed to market and credit risk in connection with our retail trading activities, developing and maintaining robust risk management capabilities is a high priority.
We allow our customers to trade notional amounts greater than the funds they have on deposit with us through the use of leverage, making management of credit risk a key focus for us. The maximum leverage available to retail traders is generally set by the regulator in each jurisdiction. We manage customer credit risk through a combination of providing trading tools that allow our customers to avoid taking on excessive risk and automated processes that close customer positions in accordance with our policies, in the event that the funds in customers' accounts are not sufficient to hold their positions. For example, our customer trading platforms provide a real-time margin monitoring tool to enable customers to know when they are approaching their margin limits. If a customer’s equity falls below the amount required to support one or more positions, we will automatically liquidate positions to bring the customer’s account into margin compliance.
In addition, we actively monitor and assesses various market factors, including volatility and liquidity, and takes steps to address identified risks, such as proactively adjusting required customer margin (both initial and maintenance). For example, on January 15, 2015, the Swiss National Bank, or SNB, unexpectedly announced that it would move interest rates to -0.75% and abandon the 1.20 floor for EUR/CHF that it had previously maintained. The announcement led to unprecedented volatility in the Swiss franc, which negatively impacted many market participants. However, as part of our ordinary course risk management process, we had identified significant risk relating to EUR/CHF products and had increased client margin requirements to 5% well in advance, which mitigated the risk of negative client equity in the event the price floor was abandoned.
7
When a retail customer executes a trade with us, the trade may be naturally hedged against an offsetting trade from another customer, hedged through an offsetting trade with one of our liquidity providers or may become part of our net exposure portfolio. For naturally hedged trades, we receive the entire bid/offer spread we offer our customers on the two offsetting transactions. For trades hedged with our liquidity providers, we earn the difference between the retail bid/offer spread we offer our customers and the wholesale bid/offer spread we receive from our liquidity providers. Customer trades in our net exposure portfolio are managed pursuant to our risk-management policies and procedures, including risk limits established by the Risk Committee of our Board of Directors, and we receive the net gains or losses generated through the management of our net exposure.
Our risk management policies and procedures have been developed to enable us to effectively manage our exposure to market risk, particularly in connection with the management of our net exposure. Our net exposure is evaluated each second and is continuously rebalanced throughout the trading day, thereby minimizing the risk we will be adversely affected by changes in the market prices of the products we hold. This real-time rebalancing of our portfolio enables us to curtail risk and to be profitable in both up and down market scenarios.
Our risk management policies and procedures are established and reviewed regularly by the Risk Committee of our Board of Directors. Our risk-management team monitors risk exposure continuously and updates senior management both informally over the course of the trading day and formally through real-time, intraday and end-of-day reporting. We do not actively initiate proprietary market positions in anticipation of future movements in the relative prices of the products we offer.
Customers
Our retail customers consist primarily of self-directed traders, who execute trades on their own behalf. A small percentage of our customers have engaged an intermediary to make trading decisions on their behalf.
Our typical self-directed customer is generally comfortable making trading decisions and is specifically interested in trading leveraged products, which generally have a higher risk/reward profile. For the year ended December 31, 2016, self-directed customers represented approximately 99.0% of our retail trading volume.
The intermediaries engaged by our managed account customers, which we refer to as authorized traders, include professional money managers, which trade a significant amount of aggregated customer funds, and individuals that trade for a small number of customer accounts. For the year ended December 31, 2016, managed account customers collectively represented approximately 1.0% of our retail trading volume.
Sales and Marketing
In connection with our retail business, we look to acquire new customers as cost-efficiently as possible, primarily through online marketing efforts such as advertising on third-party websites, search engine marketing and email marketing. Our experienced in-house marketing team creates highly targeted online campaigns tailored to experienced traders, as well as marketing programs and materials designed to support and educate novice traders. We use sophisticated tracking and measurement techniques to monitor the results of individual campaigns and continually work to optimize our overall marketing results.
One of our principal lead-generation tools is to offer prospective customers access to free registered practice trading accounts for a 30-day trial period. From a prospective customer’s point of view, we believe the registered practice trading account serves two important functions. First, it allows the prospective customer to evaluate our trading platform, tools and services. Second, for less experienced traders, it serves as an educational tool, providing the prospective customers with the opportunity to try trading in a risk-free environment, without committing any capital. During this trial period, our customer service team is available to assist and educate the prospective customers.
We also actively forge partnerships with introducing brokers in order to expand our customer base. We work with a variety of different types of introducing brokers, ranging from small, specialized firms that specifically identify and solicit customers interested in forex and CFD trading, to larger, more established financial services firms. Introducing brokers direct customers to us in return for either a commission on each referred customer’s trading volume or a share of net revenue generated by each referred customer’s trading activity.
Competition
The market for our retail services is rapidly evolving and highly competitive. Our competitors vary by region in terms of regulatory status, breadth of product offering, size and geographic scope of operations. Our main competitors during 2016 can be categorized as follows:
8
• | Regulated Forex Firms such as OANDA Corporation and Forex Capital Markets LLC. Like us, these firms have also expanded globally over the past several years, and we considered them to be a competitors in the United States during 2016, as well as in several of our key international markets. In February 2017, Forex Capital Markets LLC was required to cease offering its services in the United States by the Commodities Futures Trading Commission and we acquired substantially all of the company's U.S.-domiciled customers. For more information, please see Note 23 to our audited consolidated financial statements included in this Annual Report. |
• | Global Multi-Asset Trading Firms, including firms such as Interactive Brokers, IG Group Holdings plc and CMC Group. These firms generally offer a broad set of asset classes and earn a significant percentage of their revenue from CFDs, forex and other exchange-traded products. |
Our Institutional Segment
Through our institutional segment, we provide agency execution services and electronic access to spot and forward foreign exchange and precious metals markets via our ECN, GTX. We also offer high touch services through a team of institutional sales and trading employees. For the year ended December 31, 2016, our institutional segment represented 7.0% of our net revenue.
In contrast to our retail segment, in our institutional segment, we primarily act as agent between the principals to the transactions that are executed, do not assume any market or credit risk and earn commissions or commission equivalents (markup/markdown). Our institutional segment also facilitates client orders through riskless principal trades.
Electronic Execution Services
Through our GTX platform, we provide deep liquidity in spot and forward foreign exchange and precious metals to buy-side and sell-side firms, including banks, brokers, hedge funds, Commodity Trading Advisors and asset managers. GTX’s unique centrally-cleared prime brokerage model supports true peer-to-peer trading capabilities, meaning every GTX client has an opportunity to add market liquidity to the venue by posting real-time bids and offers, as well as trade on the bid and offers of other participants. For the year ended December 31, 2016, net revenue from our ECN business represented 68% of the net revenue of our institutional segment.
Our GTX Direct offering, a component of our ECN business, allows experienced traders who meet certain qualifications, but do not have a credit line with a prime broker, access to the liquidity of the GTX platform. Through GTX Direct, our clients deposit collateral with us and we make trades through the GTX trading platform on our clients’ behalf, earning a commission for each trade.
GTX is powered by software and intellectual property that we first licensed on a exclusive basis in 2010. After undertaking significant development and enhancement efforts, we acquired full ownership of the software and intellectual property in July 2014.
Institutional Sales and Trading
Our institutional sales and trading business serves a broad range of participants across several asset classes, allowing clients to interact with the market based on their specific needs and preferences. As a result, we are able to attract a base of clients with diverse investment styles and strategies. Our institutional sales and trading business includes our agency voice brokers who assist clients with complex liquidity sourcing and trade executions, as well as our swap execution facility, or SEF, which provides an electronic venue for trading FX non-deliverable forwards.
Nearly all of our revenue from institutional sales and trading consists of commissions derived from transaction execution services for institutional clients, conducted on an agency basis, as well as commission-equivalents generated on riskless principal transactions. Over the past several years we have built up this business primarily through a focus on client service and an expansion of our sales and trading team. For the year ended December 31, 2016, net revenue from our institutional sales and trading business represented 32% of the net revenue of our institutional segment.
Sales and Marketing
We have a direct sales team that is dedicated to building relationships with potential institutional customers and expanding our institutional business. Since its inception in 2010, our institutional business has quickly expanded to include customers
9
throughout the United States, Europe and Asia.
Competition
In general, competition for business with institutional clients is based on a variety of factors, including technology, execution quality, client relationships, client service, cost and reputation.
GTX competes with other firms offering electronic trading platforms, such as Nex Group, formerly ICAP, through its EBS offering; Thomson Reuters; Currenex, owned by State Street Bank; Hotspot, a subsidiary of CBOE Holdings, Inc.; Integral Development Corp.; and others.
Our Futures Segment
Our futures segment offers execution and related services for exchange-traded futures and futures options on major U.S. and European exchanges. We offer futures services through our regulated FCM, GAIN Capital Group, LLC ("GCGL"). In 2014, we expanded our futures business by acquiring a majority interest in Global Asset Advisors, LLC ("GAA"), a Chicago-based futures brokerage firm that markets to and services clients through Daniels Trading, an online futures brokerage targeting retail and professional traders. At the same time, we also acquired a majority interest in Top Third Ag Marketing, LLC ("TT"), which uses options-based hedging strategies to help clients manage the risks of agricultural production.
Revenue in our futures segment is primarily generated through commissions earned on futures and futures options trades. Our futures segment represented 11.5% of our net revenue for the year ended December 31, 2016.
Advanced Trading Platform
As with our retail segment, our futures segment seeks to provide customers with an enhanced customer experience through our proprietary trading platform. We have invested in high-speed connectivity to over 30 global electronic exchanges to deliver streaming quotes and high-speed executions. Our GAIN Trader platform (previously known as OEC Trader) is an easy-to-use electronic trading platform that offers users access to a full suite of trading tools. These include charting tools, custom alerts and indicators that allow customers to trade and monitor activity through a single charting window, as well as automated trading and risk management tools. Our futures segment also provides Trade Desk Manager, a broker version of our GAIN Trader platform that is designed to provide brokers with information and tools to manage their customers' accounts. We also license a white label version of our GAIN Trader platform to select third parties.
Risk Management
In our futures segment, we are exposed to the risk that if an adverse market move related to a client’s position occurs and we are unable to collect a margin call in a timely manner, in such a case the client account may incur a loss, resulting in a debit balance. If a client account were to incur a loss resulting in a debit balance and we were unable to collect the debit balance from our client, we would incur a bad debt expense, which could have a material adverse effect on our results of operations. In recognition of this risk, we monitor all client accounts in near real time and have employed multiple risk mitigation measures to help ensure that our client accounts are properly margined at all times.
Sales and Marketing
As with our other segments, we seek to acquire customers as cost-efficiently as possible. Sales leads are generated through seminars, online advertising and other media.
Our futures segment customers are sourced directly through dedicated sales staff at GCGL, GAA and TT. These sales teams focus on a variety of sectors and provide differentiated services to our customers.
Additionally, our futures segment is introduced to customers indirectly through a network of introducing brokers.
Competition
Our futures segment competes for both wholesale introducing business and direct client business. At the wholesale level, we attract partners who are interested in white labeling our proprietary software. In this regard, our primary competitors are the limited number of FCMs that own and operate proprietary technology, including R.J. O'Brien, Rosenthal Collins Group, Interactive Brokers and ADM Investor Services.
10
With the acquisition of GAA and Top Third, we also have a sizable and growing direct client business in our futures segment. This business is primarily focused on individual retail speculators and agricultural clients seeking to hedge commodity price exposure. The majority of our competitors in the commodity hedging space are small, privately held firms like Allendale, Advance Trading and Roach Ag Marketing, although we compete with larger firms, such as Interactive Brokers, with respect to individual retail speculators.
Intellectual Property
We rely on a combination of trademark, copyright, trade secret and unfair competition laws in the United States and other jurisdictions to protect our proprietary technology, intellectual property rights and our brands (e.g., FOREX.com, GAIN Capital, City Index and GTX). We also enter into confidentiality and invention assignment agreements with our employees and consultants, and confidentiality agreements with other third parties. We rigorously control access to our proprietary technology. Currently, we do not have any pending or issued patents.
We use a variety of service marks that have been registered with the U.S. Patent and Trademark Office, including: GAIN Capital (registered service mark), FOREX.com GAIN Capital Group (registered service mark), Forex Insider (registered service mark), ForexTrader (registered service mark), FOREX.com (registered service mark), It’s Your World. Trade It. (registered service mark), GAIN Capital Futures (registered service mark), GAIN Futures, OEC (registered service mark). We also have registered trademarks covering our City Index brand name and logo in a variety of jurisdictions, including the United Kingdom, European Union and China, and have pending applications in a number of other jurisdictions, including Australia, Malaysia and Singapore.
Regulation
Overview
Our business and industry are highly regulated. Our operating subsidiaries are regulated in a number of jurisdictions, including the United States, the United Kingdom (through which we have accessed regulatory passport rights to operate in a number of European Economic Area jurisdictions), Japan, Australia, Hong Kong, Canada, Singapore and the Cayman Islands. Government regulators and self-regulatory organizations oversee the conduct of our business in many ways, and several perform regular examinations to monitor our compliance with applicable statutes, regulations and rules. These statutes, regulations and rules cover all aspects of our business, including:
• | sales and marketing activities, including our interaction with, and solicitation of, customers; |
• | trading practices, including the types of products and services we may offer; |
• | the methods by which customers can fund accounts with us; |
• | treatment of customer assets, including custody, control, safekeeping and, in certain countries, segregation of our customer funds and securities; |
• | maintaining specified minimum amounts of capital and limiting withdrawals of funds from our regulated operating subsidiaries; |
• | continuing education requirements for our employees; |
• | anti-money laundering practices; |
• | recordkeeping and reporting; and |
• | supervision regarding the conduct of directors, officers and employees. |
In some jurisdictions in which we offer our products and services, we are not subject to regulation as a result of the nature of the market or the manner in which we conduct our business. We consult with legal counsel in jurisdictions in which we operate on a regular basis as to whether we have the required authorizations, licenses or approvals or whether we may conduct our business cross-border with residents in that jurisdiction without obtaining local regulatory authorization, approval or consent. To the extent that we wish to serve customers in a jurisdiction in which we determine licensing or registration is required, we may also elect to direct such customers to a licensed white label or other partner, rather than pursuing licensing or registration ourselves.
Though we conduct our business in a manner which we believe complies with applicable local law, regulators may assert authority over activities that they deem to take place within the jurisdiction they regulate, and new laws, rules or regulations may be enacted that change the regulatory landscape and result in new, or clarify preexisting, registration or licensing requirements.
11
The primary responsibility for ensuring that we maintain compliance with all applicable regulatory requirements is vested in our legal and compliance departments. In addition, our legal and compliance departments are responsible for our ongoing training and education programs, supervision of our personnel required to be licensed by one or more of our regulators, review of sales, marketing and other communications and other related functions. In addition, all of our sales employees are licensed pursuant to applicable regulation.
U.S. Regulation
In the United States, the CFTC and the NFA regulate our forex and futures trading activities. Historically, the principal legislation covering our U.S. forex business was the Commodity Exchange Act, which provides for federal regulation of all commodities and futures trading activities and requires all futures and commodity options to be traded on organized exchanges. In recent years, as in the case of other companies in the financial services industry, our forex business has been subject to increasing regulatory oversight. Specifically, in 2008, Congress passed the CFTC Reauthorization Act, which amended the Commodity Exchange Act to grant the CFTC express authority to regulate the retail forex industry. On October 18, 2010, the CFTC adopted a series of rules which regulate various aspects of our business, including:
• | creating “retail foreign exchange dealers,” or RFEDs, a new regulated category of forex brokers focused on retail investors that are permitted to act as counterparty to retail forex transactions; |
• | imposing an initial minimum security deposit amount of 2.0% of the notional value for retail forex transactions in “major currency” pairs and 5.0% of the notional value for all other retail forex transactions; |
• | providing that introducing brokers, money managers and fund managers must either (i) register with the CFTC and become members of the NFA or apply for an exemption from registration and (ii) meet the minimum net capital requirements applicable to futures and commodity options introducing brokers or enter into a guarantee agreement with a CFTC-regulated forex dealer member and permitting only one such guarantee agreement per introducing broker; |
• | requiring that a risk disclosure statement be provided to every retail forex customer, including disclosure of the number of profitable and unprofitable non-discretionary accounts maintained by the forex broker during the four most recent calendar quarters; |
• | prohibiting RFEDs, FCMs and introducing brokers from including statements in sales and marketing materials that would appear to convey to potential retail forex customers that there is a guaranty against loss, and requiring that FCMs, RFEDs and introducing brokers provide retail forex customers with enhanced written disclosure statements that, among other things, inform customers of the risk of loss; and |
• | requiring RFEDs to maintain net capital of at least $20.0 million, plus 5.0% of the RFED’s retail customer obligations in excess of $10.0 million. In addition, in the event an RFED’s net capital position falls below 110.0% of the minimum net capital requirement, the RFED would be subject to additional reporting requirements. |
Our exchange-traded futures business, which is carried on by our subsidiary GCGL, is subject to the CFTC Net Capital Rule (Regulation 1.17). Our OTC foreign exchange business, also carried on by our subsidiary GCGL under the Forex.com brand, is subject to the CFTC Net Capital Rule (Regulation 5.7). Under applicable provisions of these regulations, GCGL is required to maintain adjusted net capital of the greater of $1.0 million or 8% of Customer and Non-Customer Maintenance Margin or $20.0 million plus 5% of all liabilities owed to retail customers exceeding $10.0 million, plus 10% of all liabilities owed to eligible contract participant counterparties acting as a dealer that are not an affiliate. In addition, Gain Capital Group, LLC is subject to Regulation 1.17(c)(5) which requires the company to reduce net capital by various haircut charges including, but not limited to haircut for uncovered foreign currency balances, haircut for securities, as well as charges for under margined commodity futures and commodity options accounts. At December 31, 2016, GCGL maintained $19.5 million more than the required minimum regulatory capital for a total of 1.7 times the required capital.
In July 2010, Congress passed the Dodd-Frank Wall Street Reform and Consumer Protection Act, or the Dodd-Frank Act. A number of significant provisions contained in the law affect, or will affect once implementing regulations are adopted by the appropriate federal agencies, our business. Specifically, the Dodd-Frank Act includes:
• | rules that, beginning in October 2010, require us to ensure that our customers residing in the United States have accounts open only with our NFA-member operating entity, GCGL; |
• | amendments to the Commodity Exchange Act that, beginning on July 15, 2011, required essentially all retail transactions in any commodity other than foreign currency to be executed on an exchange, rather than OTC; |
• | a requirement that federal banking regulators adopt new rules regarding the conduct and operation of retail forex businesses by banks; and |
12
• | a requirement that the SEC adopt rules regarding the conduct and operation of retail forex businesses by broker-dealers. |
The Dodd-Frank Act also provides for additional regulation of swaps and security-based swaps, including some types of foreign exchange and metals derivatives in which we engage. The Dodd-Frank Act requires the registration of swap dealers with the CFTC and imposes significant regulatory requirements on swap dealers and swap execution facilities. Effective February 27, 2013, GAIN GTX, LLC, became provisionally registered with the CFTC and NFA as a swap dealer. Effective June 2016, GTX SEF, LLC became permanently registered with the CFTC as a swap execution facility, replacing the temporary registration previously granted in April 2014. Certain of our other subsidiaries may be required to register, or may register voluntarily, as swap dealers and/or swap execution facilities.
Swap dealers and swap execution facilities are subject to a comprehensive regulatory regime with new obligations for the swaps activities for which they are registered, including adherence to risk management policies, supervisory procedures, trade record and real time reporting requirements, as well as proposed rules for new minimum capital requirements. GAIN GTX, LLC and GTX SEF, LLC have faced, and may continue to face, increased costs due to the registration and regulatory requirements listed above, as may any other of our subsidiaries that register as a swap dealer and/or swap execution facility. In particular, the CFTC has proposed rules that would require a swap-dealer to maintain regulatory capital of at least $20 million. Compliance with this or other swap-related regulatory capital requirements may require us to devote more capital to our GTX business or otherwise restructure our operations, such as by combining our GTX business with other regulated subsidiaries that must also satisfy regulatory capital requirements. The increased costs associated with compliance, and the changes that will be required in our OTC and clearing businesses, may adversely impact our results of operations, cash flows or financial condition.
U.S. Patriot Act and Anti-Money Laundering
Like other companies in the financial services industry, we are subject to a variety of statutory and regulatory requirements concerning our relationships with customers and the review and monitoring of their transactions. Specifically, we are subject to the Uniting and Strengthening America by Providing Appropriate Tools Required to Intercept and Obstruct Terrorism Act of 2001, or the Patriot Act, which requires that we maintain a comprehensive anti-money laundering, or AML, program, a customer identification program, or CIP, designate an AML compliance officer, provide specified employee training and conduct an annual independent audit of our AML program. Consistent with the Patriot Act, our CIP includes both documentary and non-documentary review and analysis of potential customers. Under our CIP, we review each prospective customer’s identity internally and also contract with third-party firms that perform extensive background checks on each prospective customer, including through review of the U.S. Treasury Department’s Office of Foreign Assets and Control, Specially Designated Nationals and Blocked Persons lists. These procedures and tools, coupled with our periodic training, assist us in complying with the Patriot Act, as well as the CFTC’s and NFA’s applicable AML and CIP requirements.
United Kingdom Regulation
GAIN Capital-Forex.com U.K. Ltd. ("GCUK1"), GAIN Capital UK Ltd. ("GCUK2") and Trade Facts, which we collectively refer to as the U.K. Entities, are all registered in the U.K. and are regulated by the Financial Conduct Authority in respect of their activities. The U.K. Entities are required to comply with relevant U.K. and E.U. legislation. In addition they must comply with the rules and guidance contained in the FCA Handbook of Rules and Guidance, or FCA Handbook.
GCUK1, is regulated by the FCA, as a full scope €730k IFPRU Investment Firm. GCUK1 is required to maintain the greater of approximately $1.0 million (€730,000) or the Financial Resources Requirement, which is calculated as the sum of the firm’s operational, credit, counterparty, concentration, market and forex risk. At December 31, 2016, GCUK1 maintained $23.5 million more than the minimum required regulatory capital for a total of 4.7 times the required capital. Following the successful integration of City Index in the UK, GCUK1 no longer has any clients and is no longer trading. It is currently in the process of deregistering its license with FCA. Until that time, GCUK1 will maintain its regulatory capital in line with applicable requirements.
GCUK2, is regulated by the FCA as a full scope €730k IFPRU Investment Firm. GCUK2 is required to maintain the greater of approximately $1.0 million (€730,000) or the Financial Resources Requirement, which is calculated as the sum of the firm’s operational, credit, counterparty, concentration, market and forex risk. At December 31, 2016, GCUK2 maintained $87.5 million more than the minimum required regulatory capital for a total of 2.2 times the required capital.
13
Gain Capital Payments Ltd is regulated in the U.K by the FCA as an Authorized Payments Institution and is authorized to carry out payment services under the Payment Services Regulations 2009. The minimum regulatory capital required is defined as the greater of either (i) approximately $0.1 million (€125,000) or (ii) requirements determined by the ‘overhead scalar approach’. At December 31, 2016, Gain Capital Payments Limited maintained the minimum required regulatory capital.
Effective on January 1, 2016, the FCA required regulated firms to add a capital conservation buffer and a countercyclical capital buffer in line with the requirements set out in Capital Requirements Directive, or CRD IV, Article 160 Transitional Provisions for Capital Buffers. These rules require all firms to maintain an additional capital buffer on top of the otherwise applicable minimum capital requirements. The amount of buffer, which is expressed as a percentage of the firm’s common equity tier 1 capital against the total risk exposure amount, will be phased in during a transitional period from January 1, 2016 to December 31, 2018. During that period, the minimum common equity tier 1 ("CET1") capital ratio requirement will increase from 5.125% to 5.75% in 2017 then to 7.0% in 2019. GCUK2 maintains a CET1 ratio significantly above the minimum requirement and, given the nature of our U.K. regulated firms' activities, the effect of the countercyclical buffer is expected to be negligible.
Trade Facts is regulated by the FCA as a BIPRU Limited License Firm. Trade Facts is required to maintain a base financial resources requirement of approximately $0.1 million (€0.05 million) and a capital requirement of the higher of either credit risk plus market risk or fixed overhead requirement. At December 31, 2016, Trade Facts maintained $3.1 million more than the minimum required regulatory capital for a total of 7.2 times the required capital.
Client Money Rules
GCUK1 and GCUK2 are subject to the FCA’s client money rules by virtue of being authorized by the FCA to hold client money. Under these rules, we are required to:
• | maintain adequate segregation of client funds; |
• | maintain adequate records in order to be able to meet future obligations when we hold client assets as collateral and be able to identify details of those assets to clients; |
• | comply with custody rules when holding financial instruments (as defined by MiFID I) or other investments belonging to a client in the course of our business, including the safeguarding of those investments and holding all dividends and fees (e.g., stock lending fees) in accordance with the client money rules; |
• | have adequate organizational arrangements in place to minimize the risk that client money may be paid for the account of a client whose money has not yet been received by us; |
• | undertake daily internal and external client money reconciliations; and |
• | appoint an individual who is responsible for Client Asset Sourcebook, or CASS, oversight. |
Anti-Money Laundering and Sanctions
As in the U.S., we are subject to statutory and regulatory requirements concerning our relationships with customers and the review and monitoring of their transactions. Specifically, the U.K. Entities are subject to ongoing customer due diligence, or CDD, obligations under the Money Laundering Regulations 2007, or MLR, and the FCA Handbook.
The prescribed CDD measures require the U.K. Entities to (i) verify customer identity and understand the nature and purpose of the proposed relationship on the basis of documents, data or information obtained from a reliable and independent source and (ii) review and monitor their customer’s transactions and activities. The U.K. Entities are required to determine the extent of CDD measures required for each customer on a risk sensitive basis depending on the type of customer, business relationship, product or transaction and we must be able to demonstrate that such measures are appropriate in view of the risks of money laundering and terrorist financing. Our procedures are based on the Joint Money Laundering Group’s Guidance for the UK Financial Sector, which provides guidance to firms for the determination of appropriate CDD measures.
The FCA requires the U.K. Entities to have systems and controls in place to enable them to identify, assess, monitor and manage money laundering risk. Accordingly, we have the requisite systems and controls in place which are comprehensive and proportionate to the nature, scale and complexity of our activities. We provide appropriate training to our employees in relation to money laundering and retain documentation of our risk management policies and risk profile in relation to money laundering. As required, we provide regular reports to our Money Laundering Reporting Officer, or MLRO, on the operation and effectiveness of these systems and controls, including details of our regular assessments of the adequacy of these systems and controls to ensure their compliance with FCA requirements.
14
Our systems and controls also include CDD and other measures to identify where customers and others with whom we transact may be subject to financial sanctions, including those initiated or adopted by the UK Treasury or the EU.
EMIR
The E.U. European Market Infrastructure Regulation (Regulation (EU) 648/2012), or EMIR, imposes requirements on entities that enter into any form of derivative contract, including foreign exchange derivatives, and applies directly to firms in the E.U. and indirectly to non-E.U. firms that trade with E.U. firms. Accordingly, the U.K. Entities need to:
• | report all derivative contracts and their lifecycle events (concluded, modified and terminated) to which we are a party to a trade repository either by ourselves or through a third party; |
• | keep all records relating to concluding of derivative contracts and any subsequent modification for 5 years; |
• | comply with the risk management requirements for OTC bilateral derivatives, including portfolio reconciliation, portfolio compression, record keeping, dispute resolution and margining (these requirements began to be phased in starting in September 2016); and |
• | clear through central counterparties all OTC derivatives which will be subject to the mandatory clearing obligation. |
Appropriateness assessments
Where firms offer “execution only” services for certain financial instruments which are deemed “complex”, E.U. Markets in Financial Instruments Directive (Directive 2004/39/EC), or MiFID I, requires firms to assess the appropriateness of those investments for retail clients. For this assessment, we are required to collect information about our existing and potential clients’ knowledge and experience with regard to specific products and services, including:
• | the types of services, transactions and financial instruments with which the retail client is familiar; |
• | the nature, volume, and frequency of the retail client’s transactions in financial instruments and the period over which they have been carried out; and |
• | the level of education, and profession or relevant former profession of the retail client or potential retail client. |
We are required to offer to a retail client or transact for them only those products that are deemed appropriate for their knowledge, experience and other circumstances. If the retail client demands a product that has been assessed as inappropriate for the retail client’s circumstances by us, we may offer that product to the client but we are required to give the retail client a warning that the product is inappropriate to its circumstances. We are not required to undertake this analysis for professional clients as we are entitled to assume that a professional client has the necessary knowledge and experience in order to understand the risks involved in relation to the particular products or services for which he has been classified as a professional client.
MiFID II
MiFID I applied in the UK from November 2007 but has been recast into a new directive, the Markets in Financial Instruments Directive II (Directive 2014/65/EU), or MiFID II, and a new regulation, the Markets in Financial Instruments Regulation (Regulation 600/2014), or MiFIR. The changes implemented by MiFID II and MiFIR were set to take effect from January 3, 2017, but the implementation has been delayed until January 3, 2018.
MiFID II will:
• | expand the number of financial instruments for which firms are required to carry out an appropriateness assessment before providing an execution only service to retail clients; |
• | extend the pre- and post-trade transparency regime to derivatives traded on regulated markets, multi-lateral trading facilities, or MTFs, and organized trading facilities, or OTFs; |
• | expand transaction reporting to those financial instruments traded on MTFs, OTFs, and those financial instruments where the underlying instrument is traded on a Trading Venue; and |
• | give E.U. Member State regulators the new power to ban or restrict the marketing, distribution or sale of a financial instrument or types of financial practice where there is a threat to investor protection, the orderly functioning and integrity of markets or to financial stability. The European Banking Authority and the European Securities and Markets Authority have similar powers to impose a ban on an EU-wide basis or in relation to a particular E.U. Member State. |
15
Packaged Retail and Insurance-based Investment Products (PRIIPs)
Regulation 1286/486 on key information documents for packaged retail and insurance-based investment products, or the PRIIPs Regulation, will apply in the UK from January 1, 2018, reflecting a delay from the original implementation date of December 31, 2016. From the implementation date, the U.K. Entities will need to comply with the new regime set out in the PRIIPs Regulation in relation to PRIIPS that they manufacture, advise on or sell to retail clients. The FCA regards derivatives (including options, futures, and contracts for differences) as falling within the definition of a PRIIP. The new regime will require us to provide retail clients with a standardized key information document, or KID, in good time before any transaction in derivatives is concluded or for transactions concluded by distance communications, after the transaction has taken place, but only if it is not possible to provide the KID in advance and the client consents.
FCA Consultation Paper CP16/40
In December 2016, the FCA issued a consultation paper, referred to as CP16/40, that includes a number of proposed changes to the regulatory requirements relating to companies, such as GCUK2, that offer CFDs and spread bets. These proposed requirements include enhanced risk disclosures, a ban on offering account bonuses or similar promotional incentives to clients, mandatory margin close-out levels for retail clients and limitations on the leverage that may be offered to clients, with the limitations varying based on whether the clients are classified as experienced or inexperienced using criteria identified by the FCA. The comment period for CP16/40 expires in March 2017 and we cannot currently predict which, if any, of the proposed changes will be implemented.
Other International Regulation
We have provided below a brief description of the key aspects of the regulations governing our operations in the jurisdictions outside of the U.S. and the United Kingdom in which we have registered with, or obtained a license from, the local regulator, as well as material regulatory developments affecting our business in other jurisdictions important to our business, including developments that have presented risks or uncertainties for our operations.
Japan
Gain Capital Japan Co., Ltd., or GC Japan, is a registered Type I financial instruments business firm regulated by the Japan Financial Services Agency, or FSA, in accordance with Financial Instruments and Exchange Law (Law No. 25 of 1948, as amended). GC Japan is a member of the Financial Futures Association of Japan. GC Japan is subject to a minimum capital adequacy ratio of 140%, which is derived by dividing Net Capital (as defined in Law No. 25) by the sum of GC Japan’s market, counterparty credit risk and operational risk. At December 31, 2016, GC Japan maintained $7.0 million more than the minimum required regulatory capital for a total of 5.7 times the required capital.
Australia
GAIN Capital Forex.com Australia, Pty. Ltd., or GCAU1, is regulated under the laws of Australia, including the Corporations
Act 2001 (Commonwealth of Australia). The Australian Securities and Investments Commission, or ASIC, is the corporate, markets and financial services regulator in Australia responsible for administering aspects of the Corporations Act 2001. GCAU1 holds an Australian Financial Services License that has been issued by ASIC. GCAU1 is required to maintain a minimum capital requirement of approximately $0.7 million (1.0 million AUD). The regulatory capital held is required to be in excess of 110% of its requirements at all times. At December 31, 2016, GCAU1 maintained $1.8 million more than the minimum required regulatory capital for a total of 3.6 times the required capital.
Gain Capital Australia Pty Ltd, or GCAU2 is regulated under the laws of Australia, including the Corporations Act 2001 (Commonwealth of Australia). The ASIC is the corporate, markets and financial services regulator in Australia responsible for administering aspects of the Corporations Act 2001. GCAU2 holds an Australian Financial Services License that has been issued by ASIC. GCAU2 is required to maintain a minimum capital requirement of approximately $0.7 million (1.0 million AUD). The regulatory capital held is required to be in excess of 110% of its requirements at all times. At December 31, 2016, GCAU2 maintained $3.4 million more than the minimum required regulatory capital for a total of 5.9 times the required capital.
Effective January 31, 2014, ASIC increased the Net Tangible Assets (NTA) requirement, as part of RG166: Licensing: Financial Requirements, for OTC derivative issuers. ASIC requires retail OTC derivative issuers to have at all times the greater of approximately $0.7 million (1.0 million AUD) or 10% of average revenue on hand at all times. RG166 outlines that, at the minimum, 50% of the NTA requirement is required to be held in cash or cash equivalents and 50% in liquid assets. OTC
16
derivative issuers must report to ASIC if their NTA falls below 110% of the requirement within 3 business days after becoming aware of the event.
ASIC has also recently implemented additional reporting regulations. As part of phase 2 of RG251 under ASIC, GCAU1 and GCAU2 began transaction reporting on October 1, 2014 and began position reporting on April 1, 2015. Australian Financial Service Licensees (AFSL) are required to report commodity, credit, equity, interest, and foreign exchange derivatives transactions and positions. AFSL holders will need to report to ASIC approved trade repositories under the Corporations Act 2001 as per the reporting requirement.
Hong Kong
GAIN Capital - Forex.com Hong Kong, Ltd., or GCHK, is licensed by the Securities and Futures Commission, or SFC, to carry out Type 3 Regulated Activity, Leveraged Foreign Exchange Trading. GCHK is subject to the requirements of section 145 of the Securities and Futures Ordinance (Cap.571). Under this rule, GCHK is required to maintain a minimum liquid capital requirement of the higher of approximately $1.9 million or the sum of 1.5% of its aggregate gross foreign currency position and 5% of its adjusted liabilities and clients’ margin calculated in accordance with applicable rules. At December 31, 2016, GCHK maintained $1.6 million more than the minimum required regulatory capital for a total of 1.8 times the required capital.
Cayman Islands
GAIN Global Markets, Inc., or GGMI, our Cayman Island subsidiary, is a registered securities arranger with the Cayman Islands Monetary Authority, or CIMA. GGMI is required to maintain a capital level that is the greater of one quarter of relevant annual expenditure, or approximately $0.1 million. At December 31, 2016, GGMI maintained $1.2 million more than the minimum required regulatory capital for a total of 13.0 times the required capital.
Canada
GAIN Capital - Forex.com Canada, Ltd., or GCCA, is a Dealer Member of the Investment Industry Regulatory Organization of Canada, or IIROC, and regulated under the laws of Canada, including the Canadian Investor Protection Fund. In Canada, the securities industry is governed by provincial or territorial legislation, and there is no national regulator. Local legislation differs from province to province and territory to territory, but generally requires that forex dealing representatives register with applicable regulators and self-regulatory organizations in order to offer forex and/or CFD products to retail clients. GCCA’s principal provincial regulator is the Ontario Securities Commission, or OSC. GCCA is required to maintain risk-adjusted capital in excess of the minimum capital requirement. At December 31, 2016, GCCA maintained $1.2 million more than the minimum required regulatory capital for a total of 7.0 times the required capital.
Singapore
Gain Capital Singapore Pte Ltd (“GCS”) is registered by the Monetary Authority of Singapore (“MAS”) and operates as an approved holder of Capital Market Services License. GCS is subject to the requirements of MAS and pursuant to the Securities and Futures Act (Cap 289). Under these rules GCS is required to maintain a minimum base capital of approximately $0.3 million (1.0 million SGD) and Financial Resources in excess of 120% of the total risk requirements, which is calculated as the sum of operational, counterparty, large exposure and market risk at all times. At December 31, 2016, GCS maintained $8.5 million more than the required minimum regulatory capital for a total of 29.3 times the required capital.
Global Anti-Money Laundering
Our anti-money laundering and customer identification programs are designed to comply with applicable rules and regulations on a global basis. In addition, we have developed proprietary methods for risk-management and continue to add specialized processes, queries and automated reports designed to identify potential money laundering, fraud and other suspicious activities.
Employees
As of December 31, 2016, we had 741 employees. None of our employees are covered by collective bargaining agreements.
Corporate Information
We were incorporated in Delaware in October 1999 as GAIN Capital, Inc. Our principal executive offices are located at Bedminster One, 135 Route 202/206, Bedminster, New Jersey 07921. We operate our trading risk management and most administrative services out of our Bedminster, New Jersey; Jersey City, New Jersey; London, England; Cornwall, England;
17
Chicago, Illinois; Powell, Ohio; Tokyo, Japan; Sydney, Australia; Beijing, China; Shanghai, China; Pembroke, Bermuda; Hong Kong, Dubai, U.A.E. and Singapore. A complete list of our subsidiaries can be found in Exhibit 21.1 to this Annual Report.
Available Information
GAIN maintains a corporate website with the address www.gaincapital.com. Its intended use is as a regular means of disclosing material public information and for complying with disclosure obligations under Regulation FD promulgated by the SEC. Such disclosures are included on the website under the heading “Investor Relations.” Accordingly, investors should monitor such portions of the website, in addition to following our press releases, SEC filings and public conference calls and webcasts.
We are not incorporating information contained in the website by reference into this Annual Report on Form 10-K. We will make available, free of charge through the website under the heading “Investor Relations,” our Annual Reports on Form 10-K, Quarterly Reports on Form 10-Q and Current Reports on Form 8-K, and any amendments to these reports as soon as reasonably practicable after electronically filing such material with, or furnishing such material to, the SEC. In addition, we make available on our website (i) our Proxy Statements and reports filed by officers and directors under Section 16(a) of the Exchange Act, (ii) the charters for the committees of our Board of Directors, including the Audit Committee, Compensation Committee, Nominating and Corporate Governance Committee and Risk Committee and (iii) our Code of Business Conduct and Ethics governing our directors, officers and employees. We intend to disclose on our website any amendments to, or waivers from, our Code of Business Conduct and Ethics that are required to be disclosed pursuant to the rules of the SEC and the New York Stock Exchange.
Materials filed with the SEC can also be read or copied at the SEC’s Public Reference Room at 100 F Street, N.E., Washington, D.C. 20549. Please call the SEC at 1-800-SEC-0330 for further information about the Public Reference Room. The SEC also maintains a website, www.sec.gov, containing the reports, proxy statements and other information that we file with the SEC.
ITEM 1A. RISK FACTORS
Risks Related to Our Business
Our revenue and profitability are influenced by trading volume and currency volatility, which are directly impacted by domestic and international market and economic conditions that are beyond our control.
During recent years, there has been significant disruption and volatility in the global financial markets. Our revenue is influenced by the general level of trading activity in the global financial markets. Our revenue and operating results may vary significantly from period to period due primarily to movements and trends in the world’s financial markets and to fluctuations in trading levels. We have generally experienced greater trading volume in periods of volatile markets. In the event we experience lower levels of market volatility, our revenue and profitability will likely be negatively affected. In addition, our customer base is primarily comprised of individual retail customers who view trading in the markets we offer as an alternative investment class. If global economic conditions limit the disposable income of our customers, our business could be materially adversely affected as our customers may choose to curtail their trading, which could result in reduced customer trading volume and trading revenue.
Like other financial services firms, our business and profitability are directly affected by elements that are beyond our control, such as economic and political conditions, broad trends in business and finance, changes in the volume of market transactions, changes in supply and demand for currencies, movements in currency exchange rates, changes in the financial strength of market participants, legislative and regulatory changes, changes in the markets in which such transactions occur, changes in how such transactions are processed and disruptions due to terrorism, war or extreme weather events. Any one or more of these factors, or other factors, may adversely affect our business and results of operations and cash flows. A weakness in equity markets could result in reduced trading activity by our customers and, therefore, could have a material adverse effect on our business, financial condition and results of operations and cash flows. As a result, period-to-period comparisons of our operating results may not be meaningful and our future operating results may be subject to significant fluctuations or declines.
Our risk-management policies and procedures may not be effective and may leave us exposed to unidentified or unexpected risks.
We are dependent on our risk-management policies and the adherence to such policies by our trading staff. Our policies, procedures and practices used to identify, monitor and control a variety of risks, including risks related to human error, customer defaults, market movements, fraud and money-laundering, are established and reviewed by the Risk Committee of
18
our Board of Directors. Some of our methods for managing risk are discretionary by nature and are based on internally developed controls and observed historical market behavior, and also involve reliance on standard industry practices. These methods may not adequately prevent losses, particularly as they relate to extreme market movements, which may be significantly greater than historical fluctuations in the market. Our risk-management methods also may not adequately prevent losses due to technical errors if our testing and quality control practices are not effective in preventing software or hardware failures. In addition, we may elect to adjust our risk-management policies to allow for an increase in risk tolerance, which could expose us to the risk of greater losses. Our risk-management methods rely on a combination of technical and human controls and supervision that are subject to error and failure. These methods may not protect us against all risks or may protect us less than anticipated, in which case our business, financial condition and results of operations and cash flows may be materially adversely affected.
Our trading activities involve significant risks and unforeseen events could have a material adverse effect on our business, financial condition, results of operations and cash flows.
We offer our clients access to a wide array of products, including forex, CFDs, spread bets, futures, futures options, OTC currency derivatives and gold and silver spot trading products. Our trading activities in these various products involve significant risks.
Through our retail and institutional forex trading activities, our principal sources of revenues and profits arise from the difference between the prices at which we buy and sell, or sell and buy, foreign currencies. We may incur trading losses for a variety of reasons, including:
• | price changes in foreign currencies; |
• | lack of liquidity in foreign currencies in which we have positions; and |
• | inaccuracies in our proprietary pricing mechanism, or rate engine, which evaluates, monitors and assimilates market data and reevaluates our outstanding currency quotes, and is designed to publish prices reflective of prevailing market conditions throughout the trading day. |
These risks may affect the prices at which we are able to sell or buy foreign currencies or may limit or restrict our ability to either resell foreign currencies that we have purchased or repurchase foreign currencies that we have sold.
In addition, competitive forces often require us to match the breadth of quotes our competitors display and to hold varying amounts and types of foreign currencies at any given time. By having to maintain positions in certain currencies, we are subjected to a high degree of risk. We may not be able to manage such risk successfully and may experience significant losses from such activities, which could have a material adverse effect on our business, financial condition, results of operations and cash flows.
All of the risks that pertain to our trading activities in the forex market also apply to our CFDs, spread bets, OTC currency derivatives and gold and silver spot trading products and any other products we may offer in the future. These risks include market risk, counterparty risk, liquidity risk, technology risk, third-party risk and risk of human error. In addition, unexpected events can occur that can result in great financial loss to us, including our inability to effectively integrate new products into our existing trading platforms or our failure to properly manage the market risks associated with making markets for new products. The profit margins for these products may not be similar to the profit margins we have realized with respect to forex trading.
In our futures segment, we are also exposed to debit/deficit risk with our clients for exchange-traded futures and options on futures. If an adverse market move related to a client’s position occurs and we are unable to collect a margin call in a timely manner, the client account may incur a loss, resulting in a debit balance. If a client account were to incur a loss resulting in a debit balance and we were unable to collect the debit balance from our client, we would incur a bad debt expense, which could have a material adverse effect on our results of operations.
Our acquisition strategy may result in significant transaction expenses, integration and consolidation risks and risks associated with entering new markets, and we may be unable to profitably operate our consolidated company.
We have engaged in, and intend to continue to pursue, acquisitions of other businesses as part of our strategy to increase the range of products that we offer, especially into non-forex products, and to expand our businesses into new markets and geographies. Such acquisitions involve significant transaction expenses, including, but not limited to, fees paid to legal, financial, tax and accounting advisors, filing fees and printing costs. Acquisitions also present risks associated with offering new products or entering new markets and integrating the acquired companies. Other areas where we may face risks include:
19
• | diversion of management time and focus from operating our business to address challenges that may arise in integrating the acquired business; |
• | transition of operations, users and customers onto our existing platforms or onto platforms of the acquired company; |
• | failure to successfully further develop the acquired business; |
• | failure to realize anticipated operational or financial synergies; |
• | implementation or remediation of controls, procedures, and policies at the acquired company; |
• | in the case of foreign acquisitions, the need to integrate operations across different cultures and languages and to address the particular economic, currency, political, and regulatory risks associated with specific countries; |
• | liability for activities of the acquired company before the acquisition, such as violations of laws, commercial disputes, tax liabilities, and other known and unknown liabilities; and |
• | integration of the acquired business’ accounting, human resource and other administrative systems, and coordination of trading and sales and marketing functions. |
Future acquisitions could also result in dilutive issuances of our equity securities, the incurrence of debt, amortization expenses, impairment of goodwill and purchased long-lived assets, and restructuring charges, any of which could harm our financial condition or results. Additionally, any new businesses that we may acquire, once integrated with our existing operations, may not produce expected or intended results. Our failure to address these risks or other problems encountered in connection with our future acquisitions could cause us to fail to realize the anticipated benefits of such acquisitions or incur unanticipated liabilities, any of which could have a material adverse effect on our business, financial condition, results of operations and cash flows.
The accounting method for convertible debt securities that may be settled in cash, such as our 4.125% Convertible Senior Notes due 2018 and our 4.125% Convertible Senior Notes due 2020, could have a material effect on our reported financial results.
In May 2008, the Financial Accounting Standards Board, or "FASB", issued FASB Staff Position No. APB 14-1, Accounting for Convertible Debt Instruments That May Be Settled in Cash upon Conversion (Including Partial Cash Settlement), which has subsequently been codified as Accounting Standards Codification 470-20, Debt with Conversion and Other Options, or ASC 470-20. ASC 470-20 requires an entity to separately account for the liability and equity components of convertible debt instruments whose conversion may be settled entirely or partially in cash (such as our 4.125% Convertible Senior Notes due 2018 and our 4.125% Convertible Senior Notes due 2020) in a manner that reflects the issuer’s economic interest cost for non-convertible debt. The liability component of the notes is initially valued at the fair value of a similar debt instrument that does not have an associated equity component and is reflected as a liability in our Consolidated Balance Sheets in an amount equal to the fair value. The equity component of the notes is included in the additional paid-in capital section of our stockholders’ equity on our Consolidated Balance Sheets, and the value of the equity component is treated as original issue discount for purposes of accounting for the debt component. This original issue discount is amortized to non-cash interest expense over the term of the notes, and, as a result, we record a greater amount of interest expense in current periods. Accordingly, we will report lower net income in our financial results than would have been recorded had we reflected only cash interest expense in our consolidated income statement because ASC 470-20 will require the interest expense associated with the notes to include both the current period’s amortization of the original issue discount and the notes’ cash coupon interest, which could adversely affect our reported or future financial results, the trading price of our common stock and the trading price of the notes.
In addition, under certain circumstances, convertible debt instruments whose conversion may be settled entirely or partly in cash (such as our 4.125% Convertible Senior Notes due 2018 and our 4.125% Convertible Senior Notes due 2020) are currently accounted for using the treasury stock method. Under this method, the shares issuable upon conversion of the notes are not included in the calculation of diluted earnings per share unless the conversion value of the notes exceeds their principal amount at the end of the relevant reporting period. If the conversion value exceeds their principal amount, then, for diluted earnings per share purposes, the notes are accounted for as if the number of shares of common stock that would be necessary to settle the excess, if we elected to settle the excess in shares, were issued. The accounting standards in the future may not continue to permit the use of the treasury stock method. If we are unable to use the treasury stock method in accounting for the shares, if any, issuable upon conversion of the notes, then our diluted earnings per share could be adversely affected.
Servicing our debt requires a significant amount of cash, and we may not have sufficient cash flow from our business
to pay our substantial debt.
Our ability to make scheduled payments of the principal of, to pay interest on or to refinance our indebtedness,
including our 4.125% Convertible Senior Notes due 2018, which were issued in November 2013, and our 4.125% Convertible Senior Notes due 2020, which were issued in connection with our acquisition of City Index, depends on our future performance, which is subject to economic, financial, competitive and other factors beyond our control. Our business may not
20
continue to generate cash flow from operations in the future sufficient to service our debt because of factors beyond our control. If we are unable to generate such cash flow, we may be required to adopt one or more alternatives, such as selling assets, restructuring debt or obtaining additional equity capital on terms that may be onerous or highly dilutive. Our ability to refinance our indebtedness will depend on the capital markets and our financial condition at such time. We may not be able to engage in any of these activities or engage in these activities on desirable terms, which could result in a default on our debt obligations.
Any disruption or corruption of our proprietary technology could have a material adverse effect on our business, financial condition and results of operations and cash flows.
We rely on our proprietary technology to receive and properly process internal and external data. Any disruption in the proper functioning or any corruption of our software or erroneous or corrupted data may cause us to make erroneous trades, accept customers from jurisdictions where we do not possess the proper licenses, authorizations or permits or require us to suspend our services, any of which could have a material adverse effect on our business, financial condition and results of operations and cash flows.
Systems failures could cause interruptions in our services or decreases in the responsiveness of our services, which could harm our business.
If our systems fail to perform, we could experience disruptions in operations, slower response times or decreased customer satisfaction. Our ability to facilitate transactions successfully and provide high quality customer service depends on the efficient and uninterrupted operation of our computer and communications hardware and software systems. These systems have in the past experienced periodic interruptions and disruptions in operations, which we believe will continue to occur from time to time. Our systems also are vulnerable to damage or interruption from human error, natural disasters, power loss, telecommunication failures, break-ins, sabotage, computer viruses, intentional acts of vandalism and similar events. We do not have fully redundant capabilities. While we currently maintain a disaster recovery plan, or DRP, which is intended to minimize service interruptions and secure data integrity, our DRP may not work effectively during an emergency. Any systems failure that causes an interruption in our services or decreases the responsiveness of our services could impair our reputation, damage our brand name and materially adversely affect our business, financial condition and results of operations and cash flows.
We may not be able to develop and adopt new technologies in a timely fashion, which could adversely impact our ability to compete in the markets in which we operate.
Our success in the past has largely been attributable to our proprietary technology that has taken many years to develop. If our competitors develop more advanced technologies, we may be required to devote substantial resources to the development of more advanced technology to remain competitive. Our industry is characterized by rapidly changing technology, evolving industry standards and changing trading systems, practices and techniques. We may not be able to keep up with these rapid changes in the future, develop new technology, realize a return on amounts invested in developing new technologies or remain competitive in the future.
We may not be able to protect our intellectual property rights or may be prevented from using intellectual property necessary for our business.
We rely on a combination of trademark, copyright, trade secret and unfair competition laws in the United States and other jurisdictions to protect our proprietary technology, intellectual property rights and our brands. We do not have any patents. While we rigorously control access to our proprietary technology and enter into confidentiality and invention assignment agreements with our employees, consultants and other third parties, it is possible that third parties may copy or otherwise obtain and use our proprietary technology without authorization or otherwise infringe on our rights. Such unauthorized use and infringement would undermine the competitive benefits offered by our proprietary technology and could adversely impact our business and results of operations.
We also license or are permitted to use intellectual property or technologies owned by others. In the event such intellectual property or technology becomes material to our business, the loss of our license or our inability to otherwise continue use of such technologies would have a material adverse effect on our business. We may also face claims of infringement that could interfere with our ability to use technology that is material to our business operations.
Attrition of customer accounts and failure to attract new accounts in a cost-effective manner could have a material adverse effect on our business, financial condition and results of operations and cash flows.
21
Our customer base is primarily comprised of individual retail customers who generally trade with us for short periods. Although we offer products and tailored services designed to educate, support and retain our customers, our efforts to attract new customers or reduce the attrition rate of our existing customers may not be successful. If we are unable to maintain or increase our customer retention rates or generate a substantial number of new customers in a cost-effective manner, our business, financial condition and results of operations and cash flows would likely be adversely affected. Although we have spent significant financial resources on sales and marketing expenses and related expenses and plan to continue to do so, these efforts may not be cost-effective at attracting new customers. In particular, we believe that rates for desirable advertising and marketing placements, including online, search engine, print and television advertising, are likely to increase in the foreseeable future, and we may be disadvantaged relative to our larger competitors in our ability to expand or maintain our advertising and marketing commitments. Additionally, our sales and marketing methods are subject to regulation by the Commodity Futures Trading Commission, or CFTC, and National Futures Association, or NFA, in the United States, the Financial Conduct Authority, or FCA, in the United Kingdom and by other regulators in other non-US jurisdictions. The rules and regulations of these organizations impose specific limitations on our sales methods, advertising and marketing. If we do not achieve our advertising objectives, our profitability and growth may be materially adversely affected.
We are subject to litigation risk which could adversely affect our reputation, business, financial condition and results of operations and cash flows.
Many aspects of our business involve risks that expose us to potential liability under federal, state and local laws, both in the U.S. and in the other jurisdictions in which we operate, as well as the rules and enforcement efforts of our regulators and self-regulatory organizations worldwide. These risks include, among others, disputes over trade terms with customers and other market participants, customer losses resulting from system delay or failure and customer claims that we or our employees executed unauthorized transactions, made materially false or misleading statements or lost or diverted customer assets in our custody. We may also be subject to regulatory investigation and enforcement actions seeking to impose significant fines or other sanctions, which in turn could trigger civil litigation for our previous operations that may be deemed to have violated applicable rules and regulations in one or more jurisdictions.
The volume of claims and the amount of damages and fines claimed in litigation and regulatory proceedings against financial services firms has been increasing and may continue to increase. The amounts involved in the trades we execute, together with rapid price movements in our currency pairs, can result in potentially large damage claims in any litigation resulting from such trades. Dissatisfied customers, regulators or self-regulatory organizations may make claims against us regarding the quality of trade execution, improperly settled trades, mismanagement or even fraud, and these claims may increase as our business expands.
Litigation may also arise from disputes over the exercise of our rights with respect to customer accounts and collateral. Although our customer agreements generally provide that we may exercise such rights with respect to customer accounts and collateral as we deem reasonably necessary for our protection, our exercise of these rights may lead to claims by customers that we did so improperly.
We may also have to rely on litigation to enforce our intellectual property rights, protect our trade secrets, determine the validity and scope of the proprietary rights of others or defend against claims of infringement or invalidity. Even if we prevail in any litigation or enforcement proceedings against us, we could incur significant legal expenses defending against the claims, even those without merit. Moreover, because even claims without merit can damage our reputation or raise concerns among our customers, we may feel compelled to settle claims at significant cost. The initiation of any claim, proceeding or investigation against us, or an adverse resolution of any such matter, could have a material adverse effect on our reputation, business, financial condition and results of operations and cash flows.
We may be subject to customer litigation, financial losses, regulatory sanctions and harm to our reputation as a result of employee misconduct or errors that are difficult to detect and deter.
There have been a number of highly publicized cases involving fraud or other misconduct by employees of financial services firms in recent years. Our employees could execute unauthorized transactions for our customers, use customer assets improperly or without authorization, carry out improper activities on behalf of customers or use confidential customer or company information for personal or other improper purposes, as well as improperly record or otherwise try to hide improper activities from us.
In addition, employee errors, including mistakes in executing, recording or reporting transactions for customers, may cause us to enter into transactions that customers disavow and refuse to settle. Employee errors expose us to the risk of material losses until the errors are detected and the transactions are unwound or reversed. The risk of employee error or miscommunication
22
may be greater for products that are new or have non-standardized terms. Further, such errors may be more likely to occur following any acquisitions during the integration of or migration from technological systems. Misconduct by our employees or former employees could subject us to financial losses or regulatory sanctions and seriously harm our reputation. It may not be possible to detect or deter employee misconduct, and the precautions we take to prevent and detect this activity may not be effective in all cases. Our employees may also commit good faith errors that could subject us to financial claims for negligence or otherwise, as well as regulatory actions.
Misconduct by employees of our customers can also expose us to claims for financial losses or regulatory proceedings when it is alleged we or our employees knew or should have known that an employee of our customer was not authorized to undertake certain transactions. Dissatisfied customers can make claims against us, including claims for negligence, fraud, unauthorized trading, failure to supervise, breach of fiduciary duty, employee errors, intentional misconduct, unauthorized transactions by persons associated with us or failures in the processing of transactions.
Our customer accounts may be vulnerable to identity theft and credit card fraud.
Credit card issuers have adopted credit card security guidelines as part of their ongoing efforts to prevent identity theft and credit card fraud. We continue to work with credit card issuers to ensure that our services, including customer account maintenance, comply with these rules. When there is unauthorized access to credit card data that results in financial loss, there is the potential that we could experience reputational damage and parties could seek damages from us.
If our reputation is harmed, or the reputation of the online financial services industry as a whole is harmed, our business, financial condition and results of operations and cash flows may be materially adversely affected.
Our ability to attract and retain customers and employees may be adversely affected if our reputation is damaged. If we fail, or appear to fail, to deal with issues that may give rise to reputation risk, our business prospects could be materially adversely affected. These issues include, but are not limited to, appropriately dealing with potential conflicts of interest, legal and regulatory requirements, ethical issues, money-laundering, privacy, client data protection, record keeping, sales and trading practices, and the proper identification of the legal, credit, liquidity, and market risks inherent in our business. Failure to appropriately address these issues could also give rise to additional legal risk to us, which could, in turn, increase the size and number of claims and damages asserted against us or subject us to regulatory enforcement actions, fines and penalties. Any such sanctions could materially adversely affect our reputation, thereby reducing our ability to attract and retain customers and employees.
In addition, our ability to attract and retain customers may be adversely affected if the reputation of the online financial services industry as a whole or the forex industry is damaged. In recent years, a number of financial services firms have suffered significant damage to their reputations from highly publicized incidents that in turn resulted in significant and in some cases irreparable harm to their business. A perception of instability within the online financial services industry also could materially adversely affect our ability to attract and retain customers.
The loss of our key employees could materially adversely affect our business, including our ability to grow our business.
Our key employees, including Glenn Stevens, our chief executive officer, have significant experience in the forex industry and have made significant contributions to our business. In addition, other senior employees have made significant contributions to our business. Our continued success is dependent upon the retention of these and other key executive officers and employees, as well as the services provided by our trading staff, technology and programming specialists and a number of other key managerial, marketing, planning, financial, technical and operations personnel. The loss of such key personnel could have a material adverse effect on our business. In addition, our ability to grow our business is dependent, to a large degree, on our ability to retain such employees.
The industries in which we operate are highly competitive and we may be adversely affected if we are unable to compete effectively.
The OTC derivatives market served by our retail segment is rapidly evolving and characterized by intense competition and evolving domestic and global regulatory oversight and rules. Tighter spreads and increased competition could make our business less profitable. Our prospects may be materially adversely affected by our ability to adapt to these changes and effectively manage the risks, expenses and difficulties frequently encountered in the operation of a business in a rapidly evolving industry. We face similar competitive pressure in our institutional and futures segments.
23
In addition, our competitors include sophisticated institutions which have larger customer bases, more established name recognition and substantially greater financial, marketing, technological and personnel resources than we do. These advantages may enable them, among other things, to:
• | develop products and services that are similar to ours, or that are more attractive to customers than ours in one or more of our markets; |
• | provide products and services we do not offer; |
• | provide execution and clearing services that are more rapid, reliable, efficient or less expensive than ours; |
• | offer products and services at prices below ours to gain market share and to promote other businesses, such as forex options, futures, listed securities, CFDs, precious metals and OTC derivatives; |
• | adapt at a faster rate to market conditions, new technologies and customer demands; |
• | offer better, faster and more reliable technology; |
• | outbid us for desirable acquisition targets; |
• | more efficiently engage in and expand existing relationships with strategic alliances; |
• | market, promote and sell their products and services more effectively; and |
• | develop stronger relationships with customers. |
These competitors, including commercial and investment banking firms, may have access to capital in greater amounts and at lower costs than we do, and, therefore, may be better able to respond to changes in the industries in which we operate, to compete for skilled professionals, to finance acquisitions, to fund internal growth and to compete for market share generally. Access to capital is critical to our business to satisfy regulatory obligations and liquidity requirements. Among other things, access to capital determines our creditworthiness, which if perceived negatively in the market could materially impair our ability to attract customer assets. Access to capital also determines the degree to which we can expand our operations. Therefore, if we are unable to maintain or increase our capital on competitive terms, we could be at a significant competitive disadvantage, and our ability to maintain or increase our revenue and earnings could be materially impaired. Also, new or existing competitors in our markets could make it difficult for us to maintain our current market share or increase it in desirable markets. Increased competition could also result in narrowing bid/offer spreads, which could materially adversely affect our business, financial condition and results of operations and cash flows. Any reduction in revenues without a commensurate reduction in expenses would decrease our profitability. We may not be able to compete effectively against these firms, particularly those with greater financial resources, and our failure to do so could materially and adversely affect our business, financial condition and results of operations and cash flows.
We may be unable to effectively manage our growth.
As we continue to seek to grow our business, both organically and by selectively pursuing acquisitions, we may need to expand and upgrade the reliability and scalability of our transaction processing systems, network infrastructure and other aspects of our proprietary technology. We may not be able to expand and upgrade our technology systems and infrastructure to accommodate increases in our business activity in a timely manner, which could lead to operational breakdowns and delays, loss of customers, a reduction in the growth of our customer base, increased operating expenses, financial losses, increased litigation or customer claims, regulatory sanctions or increased regulatory scrutiny. In addition, we will need to continue to attract, hire and retain highly skilled and motivated executives and employees. We may not be able to attract or retain the executives and employees necessary to manage our growth effectively.
We may be unable to respond to customers’ demands for new services and products and our business, financial condition and results of operations and cash flows may be materially adversely affected.
The market for Internet-based and mobile trading is characterized by:
• | changing customer demands; |
• | the need to enhance existing services and products or introduce new services and products; |
• | evolving industry practices; and |
• | rapidly evolving technology solutions. |
New services and products provided by our competitors may render our existing services and products less competitive. Our future success will depend, in part, on our ability to respond to customers’ demands for new services and products on a timely and cost-effective basis and to adapt to address the increasingly sophisticated requirements and varied needs of our customers and prospective customers. We may not be successful in developing, introducing or marketing new services and products. In addition, our new service and product enhancements may not achieve market acceptance. Any failure on our part to anticipate or respond adequately to customer requirements or changing industry practices, or any significant delays in the development,
24
introduction or availability of new services, products or service or product enhancements could have a material adverse effect on our business, financial condition and results of operations and cash flows.
Our international operations present special challenges and our failure to adequately address such challenges or compete in these markets, either directly or through joint ventures with local firms, could have a material adverse effect on our business, financial condition and results of operations and cash flows.
In 2016, we generated approximately 82.0% of our retail segment trading volume from customers outside the United States. Expanding our business in new markets is an important part of our growth strategy. Due to certain cultural, regulatory and other challenges relevant to those markets, however, we may be at a competitive disadvantage in those regions relative to local firms or to international firms that have a well-established local presence. These challenges include:
• | less developed or mature local technological infrastructure and higher costs, which could make our products and services less attractive or accessible in emerging markets; |
• | difficulty in complying with the diverse regulatory requirements of multiple jurisdictions, which may be more burdensome, not clearly defined and subject to unexpected changes, potentially exposing us to significant compliance costs and regulatory penalties; |
• | less developed and established local financial and banking infrastructure, which could make our products and services less accessible; |
• | reduced protection of intellectual property rights; |
• | inability to enforce contracts; |
• | difficulties and costs associated with staffing and managing foreign operations, including reliance on newly hired local personnel; |
• | tariffs and other trade barriers; |
• | currency and tax laws that may prevent or restrict the transfer of capital and profits among our various operations around the world; and |
• | time zone, language and cultural differences among personnel in different areas of the world. |
In addition, in order to be competitive in these local markets, or in some cases because of restrictions on the ability of foreign firms to do business locally, we may seek to operate through joint ventures with local firms. Doing business through joint ventures may limit our ability to control the conduct of the business and could expose us to reputational and greater operational risks. We may also face intense competition from other international firms over relatively scarce opportunities for market entry. Given the intense competition from other international brokers that are also seeking to enter these new markets, we may have difficulty finding suitable local firms willing to enter into the kinds of relationships with us that we may need to gain access to these markets. This competition could make it difficult for us to expand our business internationally as planned.
If our operating subsidiaries are unable to pay us dividends when needed, we may be unable to satisfy our obligations when they arise.
As a holding company, nearly all of our funds generated from operations are generated by our operating subsidiaries. Historically, we have accessed these funds through receipt of dividends from these subsidiaries. Some of our subsidiaries are subject to regulation and requirements of various regulatory bodies, including the CFTC and NFA in the United States, the FCA in the United Kingdom, the FSA, METI and MAFF in Japan, the SFC in Hong Kong, IIROC and the Ontario Securities Commission, or OSC, in Canada and the CIMA in the Cayman Islands, relating to liquidity and capital standards, which may have the effect of limiting funds available for the payment of dividends to the holding company. Accordingly, if our operating subsidiaries are unable to pay us dividends and make other payments to us when needed, due to regulatory restrictions or otherwise, we may be unable to satisfy our obligations when they arise.
Risks Related to Regulation
Failure to comply with the rapidly evolving laws and regulations governing our businesses may result in regulatory agencies taking action against us, which could significantly harm our business.
Substantially all of our operations are conducted through subsidiaries that are regulated by governmental bodies or self-regulatory organizations. Many of the regulations we are governed by are intended to protect the public, our customers and the integrity of the markets, and not necessarily our shareholders.
Among other things, we are subject to regulation with regard to:
25
• | sales and marketing activities, including our interaction with, and solicitation of, customers; |
• | trading practices, including the types of investment products we may offer; |
• | the methods by which customers can fund accounts with us, including the recently implemented NFA ban on the use of credit cards to fund accounts in the United States; |
• | treatment of customer assets, including custody, control, safekeeping and, in certain countries, segregation of our customer funds and securities; |
• | maintaining specified minimum amounts of capital and limiting withdrawals of funds from our regulated operating subsidiaries; |
• | continuing education requirements for our employees; |
• | anti-money laundering practices; |
• | record keeping and reporting; and |
• | supervision regarding the conduct of directors, officers and employees. |
Compliance with these regulations is complicated, time consuming and expensive. Our ability to comply with all applicable laws and regulations is dependent in large part on our internal legal and compliance functions, as well as our ability to attract and retain qualified personnel, which we may not be able to do. Regulators and self-regulatory organizations broadly oversee the conduct of our business and several perform regular examinations of our operations to monitor our compliance with applicable laws and regulations. If a regulator finds that we have failed to comply with applicable rules and regulations, we may be subject to censure, fines, cease-and-desist orders, suspension of our business, removal of personnel, civil litigation or other sanctions, including, in some cases, increased reporting requirements or other undertakings, revocation of our operating licenses or criminal conviction. In addition, we could incur significant legal expenses in defending ourselves against and resolving actions or investigations by such regulatory agencies. An adverse resolution of any future actions or investigations by such regulatory agencies against us could result in a negative perception of our company and cause the market price of our common stock to decline or otherwise have a material adverse effect on our business, financial condition, results of operations and cash flows.
Regulatory changes in the jurisdictions in which we operate may disrupt our operations or require us to comply with additional regulatory requirements.
Recently, the legislative and regulatory environment in which we operate has undergone significant changes, and U.S. and foreign regulators have expressed their intention to review existing regulation in a number of areas. For example, in December 2016, the FCA in the United Kingdom proposed changes to the regulatory requirements relating to companies, such as GCUK2, that offer CFDs and spread bets, including enhanced risk disclosures, a ban on offering account bonuses or similar promotional incentives to clients, mandatory margin close-out levels for retail clients and limitations on the leverage that may be offered to clients based on whether the clients are classified as experienced or inexperienced using criteria identified by the FCA. In addition, the regulators in a number of other European countries, such as France and Belgium, have adopted rules and regulations that prohibit or limit offering, advertising and promoting leveraged derivative products such as CFDs, and other regulators may follow suit. Our ability to expand our presence in various jurisdictions throughout the world will depend on the nature of future changes to the regulatory environment and our ability to continue to comply with evolving requirements. Any of these new regulatory developments, alone or in combination, could have a material adverse effect on our business and profitability.
As we operate in many jurisdictions without local registration, licensing or authorization, we may be subject to possible enforcement action and sanction for our operations in such jurisdictions if our operations are determined to have violated regulations in those jurisdictions. Further, our growth may be limited by various restrictions and we remain at risk that we may be required to cease operations if we become subject to regulation by local government bodies.
For the year ended December 31, 2016, although a majority of our retail trading volume was attributable to customers resident in a jurisdiction where we or our white label partners are licensed, regulated or deal with customers cross-border in a manner that we believe does not require us to be regulated in that jurisdiction, a portion of our retail trading volume was attributable to customers in jurisdictions in which we or our white label partners are not currently licensed or authorized by the local government or applicable self-regulatory organization. We determine the nature and extent of services we can offer and the manner in which we conduct our business in the various jurisdictions in which we serve customers based on a variety of factors, including legal advice received from local counsel, our review of applicable U.S. and local laws and regulations and, in some cases, our discussions with local regulators. In cases in which we operate in jurisdictions based on local legal advice, we are exposed to the risk that our legal and regulatory analysis is subsequently determined by a local regulatory agency or other authority to be incorrect and that we have not been in compliance with local laws or regulations, including local licensing or authorization requirements, and to the risk that the regulatory environment in a jurisdiction may change, including in a
26
circumstance where laws or regulations or licensing or authorization requirements that previously were not enforced become subject to enforcement.
In jurisdictions in which we are not licensed or authorized, we may be subject to a variety of restrictions regarding the manner in which we conduct our business or serve customers, including restrictions on:
• | our sales and marketing activities; |
• | the use of a website specifically targeted to potential customers in a particular country; |
• | the minimum income level or financial sophistication of potential customers we may contact; |
• | our ability to have a physical presence in a particular country; or |
• | the types of services we may offer customers physically present in each country. |
These restrictions may limit our ability to grow our business in any such jurisdiction or may result in increased overhead costs or degradation in our services in that jurisdiction. Consequently, we cannot assure you that our international expansion plans will be achieved.
We may be subject to possible enforcement action and penalties if we are determined to have previously offered, or currently offer, our services in violation of applicable laws and regulations in any of the markets in which we serve customers. In any such case, we may be required to cease the conduct of our business with customers in one or more jurisdictions. We may also determine that compliance with the laws or licensing, authorization or other regulatory requirements for continuing the business in one or more jurisdictions are too onerous to justify making the necessary changes. In addition, any such event could negatively impact our relationship with the regulators or self-regulatory organizations in the jurisdictions where we are subject to regulation.
We are required to maintain high levels of capital, which could constrain our growth and subject us to regulatory sanctions.
Our regulators have stringent rules requiring that we maintain specific minimum levels of regulatory capital in our operating subsidiaries. In the United States, as a Futures Commission Merchant, or FCM, and a Retail Forex Exchange Dealer, or RFED, we are required to maintain adjusted net capital of $20.0 million plus 5.0% of the amount of retail customer liabilities over $10.0 million. On a worldwide basis, as of December 31, 2016, we were required to maintain approximately $113.0 million in minimum capital in the aggregate across all jurisdictions. Regulators continue to evaluate and modify regulatory capital requirements from time to time in response to market events and to improve the stability of the international financial system. Additional revisions to this framework or new capital adequacy rules applicable to us may be proposed and ultimately adopted, which could further increase our minimum capital requirements in the future.
Even if regulators do not change existing regulations or adopt new ones, our minimum capital requirements will generally increase in proportion to the size of the business conducted by our regulated subsidiaries. As a result, we will need to increase our regulatory capital in order to expand our operations and increase our revenue, and our inability to increase our capital on a cost-efficient basis could constrain our growth. In addition, in many cases, we are not permitted to withdraw regulatory capital maintained by our subsidiaries without prior regulatory approval or notice, which could constrain our ability to allocate our capital resources most efficiently throughout our global operations. In particular, these restrictions could adversely affect our ability to withdraw funds needed to satisfy our ongoing operating expenses, debt service and other cash needs and could affect any future decision by our Board of Directors regarding the payment of our quarterly dividends. Regulators monitor our levels of capital closely and we are required to report the amount of regulatory capital we maintain to our regulators on a regular basis, and must report any deficiencies or material declines promptly. While we expect that our current amount of regulatory capital will be sufficient to meet anticipated short-term increases in requirements, any failure to maintain the required levels of regulatory capital, or to report any capital deficiencies or material declines in capital could result in severe sanctions, including fines, censure, restrictions on our ability to conduct business and revocation of our registrations. The imposition of one or more of these sanctions could ultimately lead to our liquidation, or the liquidation of one or more of our operating subsidiaries.
Interpretation of corporate tax laws and regulations and changes in such laws and regulations, as well as adverse determinations regarding the application of such laws and regulations, could adversely affect our earnings.
We are subject to the income tax laws of the U.S., its states and municipalities and those of the foreign jurisdictions in which we have significant business operations. These tax laws are complex and may be subject to different interpretations. We must make judgments and interpretations about the application of these inherently complex tax laws when determining the provision for income taxes and must also make estimates about when in the future certain items affect taxable income in the various tax jurisdictions. Disputes over interpretations of the tax laws may be settled with the taxing authority upon examination or audit.
27
In addition, changes to the Internal Revenue Code, administrative rulings or court decisions could increase our provision for income taxes and reduce our earnings.
Servicing customers via the Internet may require us to comply with the laws and regulations of each country in which we are deemed to conduct business. Failure to comply with such laws may negatively impact our financial results.
Since our services are available over the Internet in foreign countries and we have customers residing in foreign countries, foreign jurisdictions may require us to qualify to do business in their country. We believe that the number of our customers residing outside of the United States will continue to increase over time. We are required to comply with the laws and regulations of each country in which we conduct business, including laws and regulations currently in place or which may be enacted related to Internet services available to the residents of each country from service providers located elsewhere. Any failure to develop effective compliance and reporting systems could result in regulatory penalties in the applicable jurisdiction, which could have a material adverse effect on our business, financial condition and results of operations and cash flows.
Procedures and requirements of the Patriot Act and other anti-money laundering and know your customer regulations may expose us to significant costs or penalties.
As participants in the financial services industry, we are, and our subsidiaries are, subject to numerous laws and regulations, including the United States Patriot Act, that require that we know our customers and monitor transactions for suspicious financial activities. The cost of complying with the Patriot Act and similar laws and regulations is significant. We face the risk that our policies, procedures, technology and personnel directed toward complying with these laws and regulations are insufficient and that we could be subject to significant criminal and civil penalties due to noncompliance. Such penalties could have a material adverse effect on our business, financial condition and results of operations and cash flows.
Risks Related to Third Parties
If we lose access to our prime brokers and other liquidity providers, we may be unable to provide competitive trading services, which will materially adversely affect our business, financial condition and results of operations and cash flows.
We rely on third-party financial institutions to provide us with market liquidity. We maintain relationships with a large network of liquidity providers, including established global prime brokers such as J.P. Morgan, Citibank and UBS. We depend on these relationships, particularly those with our prime brokers, for our access to a pool of liquidity to ensure that we are able to execute our customers’ trades in the products we offer at the notional amounts our customers request. These liquidity providers, although under contract with us, may terminate our arrangements at any time. If we were to experience a disruption in the services provided by a liquidity provider, particularly one of our prime brokers, due to a financial, technical or other adverse development, our business could be materially adversely affected to the extent that we are unable to transfer positions and margin balances to another liquidity provider that allows us to offer competitive trading services in a timely fashion. In the event of the insolvency of one of our prime broker or other liquidity providers, we might not be able to recover any or all of the funds we have on deposit with such entity since we will be among the entity’s unsecured creditors. In the event that we no longer have access to the levels of liquidity that we currently have, we may be unable to provide competitive trading services, which would materially adversely affect our business, financial condition and results of operations and cash flows.
A systemic market event that impacts the various market participants with whom we interact could have a material adverse effect on our business, financial condition and results of operations and cash flows.
We interact with various third parties through our relationships with our liquidity providers, white label partners and introducing brokers. Some of these market participants could be overleveraged. In the event of sudden, large market price movements, such market participants may not be able to meet their obligations to brokers who, in turn, may not be able to meet their obligations to their counterparties. As a result, a system collapse in the financial system could occur, which would have a material adverse effect on our business, financial condition and results of operations and cash flows.
We are subject to risk of default by financial institutions that hold our funds and our customers’ funds.
We have significant deposits of our own funds and our customers' funds with banks and other financial institutions, including liquidity providers. In the event of the insolvency of one of these financial institutions, we might not be able to fully recover the assets we have deposited since we will be among the institution’s unsecured creditors. As a result, our business could be materially adversely affected by the loss of these funds.
28
Retail Forex customer funds deposited with us in the United States are not permitted to be segregated from our own funds for purposes of applicable CFTC, NFA, bankruptcy or insolvency laws and regulations, meaning such funds may be at risk of default if we were to become insolvent.
Pursuant to CFTC and NFA regulations for our U.S.-regulated subsidiaries, retail forex customer funds deposited with us are not permitted to be segregated from our own funds for purposes of applicable CFTC, NFA, bankruptcy and insolvency laws and regulations. Although we are required to designate and report specific depository accounts as accounts holding assets to cover our obligations to retail forex customers; our customers’ funds may be aggregated with our own for these purposes. In the event we were to become insolvent, our customers may be unable to fully recover the funds they have deposited with us, as they will be among our unsecured creditors, and the extent to which these funds will be entitled to insurance by the Federal Deposit Insurance Corporation is uncertain.
We are subject to credit risk in that a customer’s losses may exceed the amount of cash in their account.
Our trading operations require a commitment of our capital and involve risk of loss because of the potential that a customer’s losses may exceed the amount of cash in their account. Our margin policy allows customers to leverage their account balances by trading notional amounts that may be significantly larger than their cash balances. We mark our customers’ accounts to market each time a currency price in their portfolio changes. While this allows us to closely monitor each customer’s exposure, it does not guarantee our ability to eliminate negative customer account balances prior to an adverse currency price change or other market events, such as the extreme volatility in the Swiss franc following the SNB market event in January 2015. Although we have the ability to alter our margin requirements without prior notice to our customers, this may not eliminate the risk that our access to liquidity becomes limited or market conditions, including currency price volatility and liquidity constraints, change faster than our ability to modify our margin requirements. Changes in market conditions or unforeseen extreme market events could result in our customers experiencing losses in excess of the funds they have deposited with us. In such an event, we may not be able to recover the negative client equity from our customers, which may result in our incurring a bad debt expense. In addition, if we cannot recover funds from our customers, we may nonetheless be required to fund positions we hold with our liquidity providers or other third parties. Any of the foregoing events could have a material adverse effect on our business, financial condition, results of operations and cash flows.
Failure of third-party systems or third-party service and software providers upon which we rely could adversely affect our business.
We rely on certain third-party computer systems or third-party service and software providers, including trading platforms, back-office systems, Internet service providers, software development partners and communications facilities. For example, for the year ended December 31, 2016, 31.2% of our retail trading volume was derived from trades utilizing the MetaTrader platform, a third-party trading platform we license that is particularly popular in the international retail trading community. Any interruption in these third-party services, or deterioration in their performance or quality, could adversely affect our business. If our arrangement with any third party is terminated, we may not be able to find an alternative systems or services provider on a timely basis or on commercially reasonable terms. This could have a material adverse effect on our business, financial condition and results of operations and cash flows.
Security breaches in our computer infrastructure may jeopardize confidential information transmitted over the Internet, cause interruptions in our operations or give rise to liabilities to third parties.
Our computer infrastructure is potentially vulnerable to physical or electronic computer break-ins, viruses and similar disruptive problems and security breaches. Any such problems or security breaches could give rise to liabilities to one or more third parties, including our customers, and disrupt our operations. A party able to circumvent our security measures could misappropriate proprietary information or customer information, jeopardize the confidential nature of information we transmit over the Internet or cause interruptions in our operations. Concerns over the security of Internet transactions and the safeguarding of confidential personal information could also inhibit our customers’ use of our systems over the Internet. To the extent that our activities involve the storage and transmission of proprietary information and personal financial information, security breaches could expose us to a risk of financial loss, litigation and other liabilities. Our current insurance policies may not protect us against all of such losses and liabilities. Any of these events, particularly if they result in a loss of confidence in our services, could have a material adverse effect on our business, financial condition and results of operations and cash flows.
29
Failure to maintain relationships with introducing brokers who direct new customers to us could have a material adverse effect on our business, financial condition and results of operations and cash flows.
We have relationships with introducing brokers who direct new customers to us and provide marketing and other services for these customers. In certain jurisdictions, we are only able to provide our services through introducing brokers. For the year ended December 31, 2016, approximately 24.6% of our retail trading volume was derived from introducing brokers. Many of our relationships with introducing brokers are nonexclusive or may be terminated by the brokers on short notice. In addition, under our agreements with introducing brokers, they have no obligation to provide us with new customers or minimum levels of transaction volume. Our failure to maintain our relationships with these introducing brokers, the failure of the introducing brokers to provide us with customers or our failure to create new relationships with introducing brokers would result in a loss of revenue, which could have a material adverse effect on our business, financial condition and results of operations and cash flows. To the extent any of our competitors offers more attractive compensation terms to one or more of our introducing brokers, we could lose the brokers’ services or be required to increase the compensation we pay to retain the brokers. In addition, we may agree to set the compensation for one or more introducing brokers at a level where, based on the transaction volume generated by customers directed to us by such brokers, it would have been more economically attractive to seek to acquire the customers directly rather than through the introducing broker.
Our business or reputation could be harmed by introducing broker misconduct or errors that are difficult to detect and deter.
It may be perceived that we are responsible for any improper conduct by our introducing brokers, even though we do not control their activities. Many of our introducing brokers operate websites, which they use to advertise our services or direct customers to us. It is difficult for us to closely monitor the contents of their websites to ensure that the statements they make in relation to our services are accurate and comply with applicable rules and regulations. Any disciplinary action taken against any of our introducing brokers in the United States and abroad could have a material adverse effect on our reputation, damage our brand name and materially adversely affect our business, financial condition and results of operations and cash flows.
Risks Related to our Common Stock
The market price of our common stock may be volatile.
Our results of operations and cash flows have fluctuated significantly from period to period in the past based on a variety of factors, including some that are beyond our control, such as currency volatility and fluctuations in trading volume. These variations, along with any failure to achieve operating results that meet or exceed the expectations of our investors and the market as a whole, could result in significant price and volume fluctuations in our common stock. Other factors that could affect the market price of our common stock include:
• | future announcements concerning us or our competitors, including the announcement of acquisitions; |
• | changes in government regulations or in the status of our regulatory approvals or licensure; |
• | public perceptions of risks associated with our services or operations; |
• | developments in our industry; and |
• | general economic, market and political conditions and other factors that may be unrelated to our operating performance or the operating performance of our competitors. |
If securities analysts stop publishing research or reports about us or our business or if they downgrade our common stock, the market price of our common stock could decline.
The market for our common stock relies in part on the research and reports that industry or financial analysts publish about us or our business. We do not control these analysts. If any analyst who covers us downgrades our stock or lowers its future stock price targets or estimates of our operating results, our stock price could decline rapidly. Furthermore, if any analyst ceases to cover us, we could lose visibility in the market, which in turn could cause the market price of our common stock to decline.
Our stockholder rights plan may prevent efforts by our stockholders to effect a change of control of our company or a change in our management.
We have adopted a stockholder rights plan, commonly referred to as a poison pill. The rights plan is intended to deter an attempt to acquire us in a manner or on terms not approved by our Board of Directors. The rights plan will not prevent an acquisition that is approved by our Board of Directors. Our rights plan could substantially impede the ability of public
30
stockholders to benefit from a change in control and, as a result, may reduce the market price of our common stock and the ability of holders of our common stock to realize any potential change of control premium.
We may be unable to obtain capital when we need it, on acceptable terms, or at all.
Our business depends on the availability of adequate funding and regulatory capital under applicable regulatory requirements. Historically, we have satisfied these needs from internally generated funds and from our offering of convertible debt securities. While we currently anticipate that our available cash resources will be sufficient to meet our presently anticipated working capital and capital expenditure requirements for at least the next 12 months, we may need to raise additional funds to:
• | support more rapid expansion; |
• | develop new or enhanced services and products; |
• | respond to competitive pressures; |
• | acquire new businesses, products or technologies; or |
• | respond to unanticipated requirements. |
Additional financing may not be available when needed on terms favorable to us or at all.
The limited liquidity for our common stock could affect your ability to sell your shares at a satisfactory price.
Our common stock is relatively illiquid. As of March 1, 2017, we had 47,754,411 shares of common stock outstanding (excluding shares held by us as treasury stock). The average daily trading volume in our common stock during the 60 calendar days ended March 1, 2017 was approximately 230,160 shares. A more active public market for our common stock may not develop, which could continue to adversely affect the liquidity of our common stock and adversely affect the trading price of our common stock. Moreover, without a large public float, our common stock is less liquid than the stock of companies with broader public ownership and, as a result, the trading prices of our common stock may be more volatile than that of other companies or the market as a whole. In addition, in the absence of an active public trading market, you may be unable to liquidate your investment in us at a satisfactory price.
Stockholders may be diluted by the future issuance of additional common stock in connection with our incentive plans, acquisitions, conversion of our 4.125% Convertible Senior Notes due 2018 or our 4.125% Convertible Senior Notes due 2020, or otherwise.
As of December 31, 2016, we had approximately 67.2 million shares of common stock authorized but unissued. As of December 31, 2016, we have reserved an aggregate of 8.7 million shares for issuance under our equity incentive compensation plans (5.8 million to be issued pursuant to future awards and grants under the 2015 Plan, 2.7 million shares that are subject to outstanding grants under the 2010 Plan, and 0.2 million shares to be issued pursuant to the 2011 Employee Stock Purchase Plan). In addition, our 4.125% Convertible Senior Notes due 2018, which were issued in November 2013, are convertible into shares of our common stock, although we may, at our election and subject to certain limitations, choose to settle any conversion by the payment or delivery of cash, shares of our common stock, or a combination thereof. Prior to June 1, 2018, these notes may be converted only upon the occurrence of specified events set forth in the indenture pursuant to which they were issued, while on or after June 1, 2018, holders may convert their notes at any time. Our 4.125% Convertible Senior Notes due 2020, which were issued in April 2015 in connection with our acquisition of City Index, are convertible into shares of our common stock, although we may, at our election and subject to certain limitations, choose to settle any conversion by the payment or delivery of cash, shares of our common stock, or a combination thereof. Prior to October 1, 2019, these notes may be converted only upon the occurrence of specified events set forth in the indenture pursuant to which they were issued, while on or after October 1, 2019, holders may convert their notes at any time. Any common stock that we issue, including under our 2015 Plan, 2011 Employee Stock Purchase Plan or other equity incentive plans that we may adopt in the future, or upon conversion of any of our convertible senior notes will dilute the percentage ownership held by investors who own our common stock.
ITEM 1B. UNRESOLVED STAFF COMMENTS
There are no unresolved staff comments.
ITEM 2. PROPERTIES
We are a global provider of trading services and solutions, specializing in over-the-counter, or OTC, and exchange-traded markets. Our retail, institutional and futures segments service customers in more than 180 countries worldwide, and we conduct
31
business from our offices in Bedminster, New Jersey; Jersey City, New Jersey; London, England; Cornwall, England; Chicago, Illinois; Powell, Ohio; Tokyo, Japan; Sydney, Australia; Beijing, China; Shanghai, China; Pembroke, Bermuda; Hong Kong, Dubai, U.A.E., and Singapore. Our retail segment conducts business in each of these locations, except our locations in Illinois and Ohio, which are focused primarily on our futures segment. Our institutional segment conducts business primarily from our locations in New Jersey and Bermuda, while our corporate segment is primarily located in our corporate headquarters in Bedminster, New Jersey. All of our office space was leased as of December 31, 2016
While we believe that these facilities are adequate to meet our current needs, it may become necessary to secure additional space in the future to accommodate any future growth. We believe that such additional space will be available as needed in the future on commercially reasonable terms.
ITEM 3. LEGAL PROCEEDINGS
On February 16, 2012, we received a Letter of Claim on behalf of certain individuals who had lost money in an investment scheme operated by a third-party money management firm, incorporated in the United Kingdom, which has since been closed down by the United Kingdom’s Financial Services Authority. The investment firm, Cameron Farley Ltd, had opened a corporate account with us and invested the individuals’ money, representing such funds as its own, while operating a fraudulent scheme. Though a complaint has been filed and served on us, the claimants requested, and we agreed, to follow the United Kingdom’s Pre-Action Protocol, a pre-litigation process intended to resolve matters without the need to engage in formal litigation. On April 28, 2016, the parties entered into a Settlement Agreement in which we agreed to make a one-time settlement payment of $9.2 million, net of insurance recoveries, in exchange for a full and final settlement of all claims.
In addition to the matter discussed above, we are involved in various claims and legal actions arising in the ordinary course of business. In the opinion of our management, the outcome of such other claims and legal actions, if decided adversely, is not expected to have a material adverse effect on our quarterly or annual operating results, cash flows or consolidated financial position.
ITEM 4. MINE SAFETY DISCLOSURES
Not Applicable.
32
PART II
ITEM 5. MARKET FOR REGISTRANT'S COMMON EQUITY, RELATED STOCKHOLDER MATTERS AND ISSUER PURCHASES OF EQUITY SECURITIES
Our common stock began trading on the New York Stock Exchange under the symbol “GCAP” on December 15, 2010. Prior to that date, there was no established trading market for our common stock. As of March 1, 2017, we estimate that we had approximately 76 stockholders of record. Because many of our shares of common stock are held by brokers and other institutions on behalf of stockholders, we are unable to estimate the total number of underlying beneficial stockholders represented by these record holders.
The following table details the high and low closing prices for the common stock as reported by the New York Stock Exchange for the periods indicated.
2016 | 2015 | ||||||||||||||
Quarter | High | Low | High | Low | |||||||||||
First Quarter | $ | 7.61 | $ | 6.21 | $ | 10.24 | $ | 7.98 | |||||||
Second Quarter | $ | 7.03 | $ | 6.11 | $ | 10.38 | $ | 9.29 | |||||||
Third Quarter | $ | 6.97 | $ | 6.15 | $ | 9.69 | $ | 6.98 | |||||||
Fourth Quarter | $ | 7.01 | $ | 4.57 | $ | 8.41 | $ | 7.14 | |||||||
DIVIDEND POLICY
In October 2011, our Board of Directors approved a policy of paying quarterly dividends, subject to available cash flow from operations, other considerations and the determination by our Board of Directors of the amount. Each quarter since, we have paid a $0.05 per share dividend to holders of our common stock. In November 2016, our Board of Directors approved a change in the dividend policy which increased the dividend to $0.06 per share to holders of our common stock. The latest dividend of $0.06 per share was declared in March 2017 and is payable on March 31, 2017 to stockholders of record on March 28, 2017.
Although we intend to continue our policy of paying quarterly dividends, any declaration and payment of dividends will be at the discretion of our Board of Directors and will depend upon, among other things, our earnings, financial condition, capital requirements, level of indebtedness, contractual restrictions with respect to the payment of dividends, and other considerations that our Board of Directors deems relevant. The Board’s ability to declare a dividend is also subject to limits imposed by Delaware corporate law. In addition, our subsidiaries are permitted to pay dividends to us subject to (i) certain regulatory restrictions related to the maintenance of minimum net capital in those of our subsidiaries that are subject to net capital requirements imposed by applicable law or regulation and (ii) general restrictions imposed on dividend payments under the laws of the jurisdiction of incorporation or organization of each subsidiary.
RECENT SALES OF UNREGISTERED SECURITIES; USE OF PROCEEDS FROM REGISTERED SECURITIES
None.
REPURCHASES OF COMMON STOCK
During the year ended December 31, 2016, we repurchased approximately 1.3 million shares of our common stock pursuant to the terms of our approved stock repurchase plan.
33
Total | Maximum Number | ||||||||||||
Number of Shares | (or Approximate | ||||||||||||
Purchased as | Dollar Value) of | ||||||||||||
Part of Publicly | Shares that May | ||||||||||||
Total Number | Announced | Yet Be Purchased | |||||||||||
of Shares | Average Price | Plans or | Under the Plans or | ||||||||||
Period | Purchased(1) | Paid per Share(1) | Programs(1) | Programs(1)(2) | |||||||||
January 2016 | 190,000 | $ | 7.00 | 190,000 | $ | 2,106,089 | |||||||
February 2016 | 200,000 | 6.94 | 200,000 | 714,921.07 | |||||||||
March 2016 | 110,000 | 7.36 | 110,000 | 14,903,590 | |||||||||
April 2016 | 251,924 | 6.66 | 251,924 | 13,220,906 | |||||||||
May 2016 | 24,000 | 6.86 | 24,000 | 13,055,887 | |||||||||
June 2016 | — | — | — | 13,055,887 | |||||||||
July 2016 | — | — | — | 13,055,887 | |||||||||
August 2016 | — | — | — | 13,055,887 | |||||||||
September 2016 | — | — | — | 13,055,887 | |||||||||
October 2016 | — | — | — | 13,055,887 | |||||||||
November 2016 | 223,708 | 6.26 | 223,708 | 26,651,524 | |||||||||
December 2016 | 317,737 | 6.61 | 317,737 | 24,545,306 | |||||||||
(1) On May 16, 2011, the Company announced that its Board of Directors approved a share repurchase plan, which authorized the expenditure of up to $10.0 million for the purchase of the Company’s common stock. On May 6, 2013, the Company announced that the Board of Directors approved to increase the total amount available for the purchase of the Company's common stock by $15.0 million. On May 3, 2016, the Company's Board of Directors approved to increase the total amount available for the purchase of the Company's common stock by an additional $15.0 million, including amounts allocable to certain prior purchases made in March, April and May 2016. On November 3, 2016, the Company announced that its Board of Directors had increased the total amount available for the repurchase of the Company’s common stock under the Company’s share repurchase plan to $30.0 million.
(2) Transaction fees related to the share purchases are deducted from the total remaining allowable expenditure amount.
STOCK PERFORMANCE GRAPH
The following performance chart assumes an investment of $100 on December 15, 2010 (the date our shares began trading on the NYSE) and compares the change at December 31, 2010 through December 31, 2016 in the market price for our common stock with the Russell 2000 Index, the NASDAQ Composite Index, and a peer group identified by us (the “Selected Peer Group Index”). The Selected Peer Group Index was selected to include publicly-traded companies engaging in one or more of our lines of business.
The Selected Peer Group Index is weighted according to the respective issuer’s stock market capitalization and is comprised of the following companies: BGC Partners, Inc., DST Systems, E*Trade Financial Corporation, FactSet Research Systems, Inc., FXCM, Inc., INTL FCStone Inc., Investment Technology Group, Inc., Knight Capital Group, Inc., Market Axcess Holdings, Inc., and, MSCI, Inc. We have updated the Selected Peer Group to remove Advent Software, Inc., GFIG Group, Inc. and SWS Group, Inc., each of which was included in the Selected Peer Group in our Annual Report on Form 10-K for the year ended December 31, 2015, as the securities of each of those companies are no longer publicly traded.
The comparisons in the graphs below are based on historical data and are not intended to forecast the possible future performance of our common stock.
34
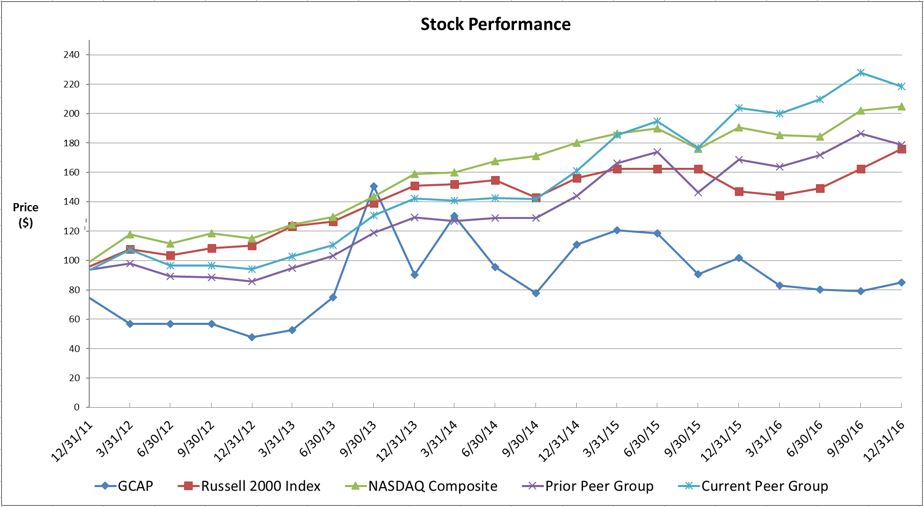
EQUITY COMPENSATION PLAN INFORMATION
The following table provides information with respect to our compensation plans under which equity compensation was authorized as of December 31, 2016.
Number of | |||||||||
securities remaining | |||||||||
Number of | Weighted-average | available for future | |||||||
securities to be | exercise price | issuance under | |||||||
issued upon exercise | of | equity compensation | |||||||
of outstanding | outstanding | plans (excluding | |||||||
options, warrants | options, warrants | securities reflected | |||||||
and rights | and rights | in column (a) | |||||||
Plan category | (a) | (b) | (c) | ||||||
Equity compensation plans approved by security holders | 1,392,633 | $ | 6.13 | 4,428,791 | |||||
ITEM 6. SELECTED FINANCIAL DATA
The financial data set forth below should be read in conjunction with “Management’s Discussion and Analysis of Financial Condition and Results of Operations” and our audited consolidated financial statements as of December 31, 2016 and 2015 and for the years ended December 31, 2016, December 31, 2015 and December 31, 2014, included in this annual report on Form 10-K.
Our historical results of operations are not necessarily indicative of future results.
35
Selected Consolidated Statement of Income and Comprehensive Income | |||||||||||||||||||
(in thousands, except share and per share data) | |||||||||||||||||||
Year Ended December 31, | |||||||||||||||||||
2016 | 2015(1) | 2014 | 2013(1) | 2012 | |||||||||||||||
Consolidated Statement of Income and Comprehensive Income Data: | |||||||||||||||||||
Net Revenue | $ | 411,825 | $ | 435,347 | $ | 369,189 | $ | 267,691 | $ | 151,804 | |||||||||
Total operating expense | $ | 354,162 | $ | 417,698 | $ | 317,592 | $ | 222,968 | $ | 150,218 | |||||||||
Income before income tax expense | $ | 47,242 | $ | 8,427 | $ | 45,450 | $ | 45,490 | $ | 1,142 | |||||||||
Net Income applicable to GAIN Capital Holdings, Inc. | $ | 35,272 | $ | 10,279 | $ | 24,877 | $ | 28,107 | $ | 2,621 | |||||||||
Earnings per common share: | |||||||||||||||||||
Basic | $ | 0.67 | $ | 0.22 | $ | 0.56 | $ | 0.76 | $ | 0.08 | |||||||||
Diluted | $ | 0.67 | $ | 0.22 | $ | 0.53 | $ | 0.71 | $ | 0.07 | |||||||||
Weighted average common shares outstanding used in computing earnings per common share | |||||||||||||||||||
Basic | 48,588,917 | 47,601,979 | 40,561,644 | 36,551,246 | 34,940,800 | ||||||||||||||
Diluted | 48,785,674 | 48,379,051 | 43,214,895 | 39,632,878 | 37,880,208 | ||||||||||||||
Cash dividends per share | $ | 0.21 | $ | 0.20 | $ | 0.20 | $ | 0.20 | $ | 0.20 | |||||||||
Selected Consolidated Balance Sheet | |||||||||||||||||||
(in thousands unless otherwise stated) | |||||||||||||||||||
Year Ended December 31, | |||||||||||||||||||
2016 | 2015(1) | 2014 | 2013(1) | 2012 | |||||||||||||||
Consolidated Balance Sheet Data: | |||||||||||||||||||
Cash and cash equivalents | $ | 234,760 | $ | 171,888 | $ | 139,351 | $ | 39,871 | $ | 36,820 | |||||||||
Cash and securities held for customers | $ | 945,468 | $ | 920,621 | $ | 759,559 | $ | 739,318 | $ | 446,311 | |||||||||
Receivables from brokers | $ | 61,096 | $ | 121,153 | $ | 134,908 | $ | 227,630 | $ | 89,916 | |||||||||
Total assets | $ | 1,430,084 | $ | 1,424,559 | $ | 1,183,301 | $ | 1,112,560 | $ | 629,262 | |||||||||
Payables to customers | $ | 945,468 | $ | 920,621 | $ | 759,559 | $ | 739,318 | $ | 446,311 | |||||||||
Convertible senior notes | $ | 124,769 | $ | 121,740 | $ | 68,367 | $ | 65,360 | $ | — | |||||||||
Total shareholders' equity | $ | 294,182 | $ | 306,084 | $ | 249,920 | $ | 226,723 | $ | 162,568 | |||||||||
(1) | There were material business combinations that occurred in 2013 and 2015, respectively, which impacted the comparability of the amounts shown above. See Note 10 for further discussion. |
ITEM 7. MANAGEMENT'S DISCUSSION AND ANALYSIS OF FINANCIAL CONDITION AND RESULTS OF OPERATION
36
The following discussion and analysis should be read in conjunction with our audited consolidated financial statements and the accompanying notes thereto provided under “Item 8. Financial Statements and Supplementary Data” contained elsewhere within this Annual Report on Form 10-K.
Overview
We are a global provider of trading services and solutions, specializing in over-the-counter, or OTC, and exchange-traded markets. Our retail, institutional and futures segments service customers in more than 180 countries worldwide, and we conduct business from our offices in Bedminster, New Jersey; Jersey City, New Jersey; London, England; Cornwall, England; Chicago, Illinois; Powell, Ohio; Tokyo, Japan; Sydney, Australia; Shanghai, China; Pembroke, Bermuda; Hong Kong, Dubai, U.A.E., and Singapore.
We offer our customers access to a diverse range of over 12,500 financial products, including spot foreign exchange, or forex, and precious metals trading, as well as “contracts for difference”, or CFDs, which are investment products with returns linked to the performance of underlying assets. We offer CFDs on currencies, commodities, indices, individual equities, bonds and interest rate products. We also support trading of exchange-traded futures and options on futures on more than 30 global exchanges. In the United Kingdom, we offer spread bets, which are investment products similar to CFDs, but that offer more favorable tax treatment for residents of that country.
We have invested considerable resources over the past 17 years to develop our proprietary trading platforms to provide our customers with advanced price discovery, trade execution and order management functions, while improving our ability to acquire and service our customers efficiently, as well as manage market and credit risk associated with our customer’s trading activity. Today our customers can trade through web-based, downloadable and mobile trading platforms and have access to innovative trading tools to assist them with research and analysis, automated trading and account management.
We operate our business in three segments. Through our retail segment, we provide our retail customers around the world with access to a diverse range of global financial markets, including spot forex, precious metals, spread bets and CFDs on commodities, indices, individual equities and interest rate products, as well OTC options on forex. Our institutional segment provides agency execution services and offers access to markets and self-directed trading in foreign exchange, commodities, equities, options and futures via our GTX platform. Our futures segment offers execution and risk management services for exchange-traded futures and futures options on major U.S. and European futures and options exchanges. Each of our operating segments is discussed in more detail below.
As a global provider of online trading services, our results of operations are impacted by a number of external market factors, including market volatility and transaction volumes, competition, the regulatory environment in the various jurisdictions and markets in which we operate and the financial condition of the retail and institutional customers to whom we provide our services. These factors are not the only factors that impacted our results of operations for the most recent fiscal period, and additional or other factors may impact, or have different degrees of impact, on our results of operations in future periods. Please see "Item 1A. Risk Factors" for a discussion of other factors that may impact our business.
Market Environment and Trading Volatility
Our revenue and operating results may vary significantly from period to period primarily due to movements and trends in the world’s financial markets and to fluctuations in market volatility. As a general rule, our businesses typically benefit from volatility in the markets that we serve, as periods of increased volatility often coincide with higher levels of trading by our clients and a higher volume of transactions. However, periods of extreme volatility may result in significant market dislocations that can also lead clients to reduce their trading activity. In addition, volatility that results in trading within a relatively narrow band of prices may lead to less profitable trading activity. Also, low or extremely high market volatility can adversely affect our ability to profitably manage our net exposure, which represents the unhedged portion of the trading positions we enter into with customers in our retail segment.
Market volatility is driven by a range of external factors, some of which are market specific and some of which are correlated to general macroeconomic conditions. Weakness in equity markets, which occurred in much of 2011 and several of the previous years, can result in reduced overall trading activity. The European sovereign debt crisis, which arose in the second quarter of 2010 and continued throughout 2011 and 2012, created economic uncertainty, adversely affecting the equities and other financial markets for much of this period, leading investors to, at times, reduce their trading activity, and also resulted in anomalous and challenging market conditions over several significant periods during 2011 and 2012. Market conditions again became challenging in late 2013 and early 2014, with volatility in several of the major currencies reaching 5-year lows. Overall market conditions in the second half of 2014 and into 2015 broadly improved, although our overall revenue capture in the first half of 2015 was tempered by an early concentration of one-way trading in the Euro/U.S. dollar pair, which required us
37
to hedge more volume with our liquidity providers, as well as unusually adverse trading conditions in indices. Market conditions improved in the second half of 2015, with higher volatility in indices and commodities. Several events in 2016, including the presidential election, entrance of a new administration, Brexit, potential global interest rate hikes, presented the Company with opportunities for growth. While it is difficult to predict volatility, we anticipate these factors to continue to impact the trading market and create an elevated level of volatility in the future.
Competition
The products we offer have generally been accessible to retail investors for a significantly shorter period than many other securities products, such as equities, and our industry is rapidly evolving and characterized by intense competition. Entering new markets often requires us to lower our pricing in order to attract customers and compete with other companies which have already established customer bases in such markets. In addition, in existing markets, on occasion we make short-term decisions to be more aggressive regarding the pricing we offer our customers, or we may decide to offer additional services at reduced rates, or free of charge, in order to attract customers and take market share from our competitors.
Regulatory Environment
In recent years, the financial markets have experienced a major global regulatory overhaul, as regulators and legislators in the United States and abroad have proposed and, in some instances, adopted, a wide range of regulatory changes that have had a significant effect on the manner in which we operate our businesses. For example, as a result of the Dodd-Frank Act’s requirement that essentially all transactions in commodities be executed on an exchange, after July 15, 2011, we were no longer permitted to offer leveraged spot metal transactions in the United States. In addition, in December 2016, the FCA issued a consultation paper, referred to as CP16/40, that includes a number of proposed changes to the regulatory requirements relating to companies, such as GCUK2, that offer CFDs and spread bets. These proposed requirements include enhanced risk disclosures, a ban on offering account bonuses or similar promotional incentives to clients, mandatory margin close-out levels for retail clients and limitations on the leverage that may be offered to clients, with the limitations varying based on whether the clients are classified as experienced or inexperienced using criteria identified by the FCA.
Part of our growth strategy is to enter new markets, and as we do so we will become subject to regulation in those markets. Complying with different regulatory regimes in multiple markets is expensive, and in many markets the regulatory environment is unclear and evolving. Changes in regulatory requirements and changes in the interpretation of existing regulatory requirements may force us to alter our business practices.
City Index Acquisition
On April 1, 2015, we completed the acquisition of the entire issued and outstanding share capital of City Index (Holdings) Limited, or City Index, a global online trading firm specializing in CFDs, forex and spread betting from City Index Group Limited. The preliminary purchase price consisted of approximately (i) $6.1 million in cash, inclusive of working capital adjustments and $1.0 million in cash to be held in escrow; (ii) 5,319,149 shares of our common stock, including 4,787,234 shares to be held in escrow; and (iii) 4.125% unsecured Convertible Senior Notes with an aggregate principal amount of
$60.0 million, including convertible senior notes with an aggregate principal amount of $54.0 million to be held in escrow. In addition, we paid City Index approximately $22.4 million, which was used to settle certain inter-company liabilities between City Index and City Index Group Limited.
Global Asset Advisors, LLC and Top Third Ag Marketing LLC Acquisitions
On March 7, 2014, we entered into a Membership Interest Purchase Agreement, which we refer to as the GAA Agreement, with Global Asset Advisors, LLC, or GAA, Lucky Good Dog, L.L.C., or LGD, Glenn A. Swanson and Andrew W. Daniels (as sellers' representative). On March 21, 2014, upon the terms and subject to the conditions set forth in the GAA Agreement, we purchased 55% of the outstanding membership interests in GAA from LGD and Mr. Swanson, whom we collectively refer to as the GAA Sellers, for an aggregate purchase price consisting of (i) $4,420,240 in cash, subject to certain adjustments, and (ii) 116,801 shares of the Company's common stock. Under the terms of the GAA Agreement, LGD and Mr. Swanson are also entitled to receive, for a period of seven years after the closing of the acquisition, annual payments of a portion of the net interest earned on the assets of clients of GAA at the time of the closing. Under the terms of the Amended and Restated Operating Agreement of GAA, which was executed at the closing of the acquisition, we have, for a period of six years after the closing, a call right to purchase the remaining membership interests in GAA for a price based on a multiple of GAA's trailing twelve month EBITDA. From the third anniversary through the sixth anniversary of the closing date, the GAA Sellers may put their remaining interests in GAA to us on the same terms.
38
Also on March 7, 2014, we entered into a Membership Interest Purchase Agreement, which we refer to as the Top Third Agreement, with Top Third Ag Marketing LLC, or Top Third, LGD, Mark Gold and Glenn A. Swanson. On March 21, 2014, upon the terms and subject to the conditions set forth in the Top Third Agreement, we purchased 55% of the outstanding membership interests in Top Third from LGD and Messrs. Gold and Swanson, whom we collectively refer to as the Top Third Sellers, for an aggregate purchase price consisting of $4,749,289, subject to certain adjustments, a portion of which will be payable to Mr. Gold contingent upon satisfying certain requirements over the three year period following the closing date of the acquisition. Under the terms of the Amended and Restated Operating Agreement of Top Third, which was executed on the closing of the acquisition, we have, for a period of six years after the closing, a call right to purchase the remaining membership interests in Top Third for a price based on a multiple of Top Third's trailing twelve month EBITDA. From the third anniversary through the sixth anniversary of the closing date, the Top Third Sellers may put their remaining interests in Top Third to us on the same terms.
In December 2016, we entered into an agreement with the other members of GAA and TT to acquire an additional 24% of the membership interests of each company, bringing our total ownership interest in each company to 79%.
Trade Facts Acquisition
In July 2014, we closed on our acquisition Galvan Research and Trading Ltd., which has since been renamed Trade Facts, Ltd., or Trade Facts. Trade Facts, along with its subsidiary, Faraday Research LLP, provides individual investors with professional advice and trading recommendations across a wide range of markets, including FX, individual equities, equity indices and other market sectors. The consideration for the acquisition consisted of a cash payment at closing of $9.7 million, as well as an earn-out arrangement under which the sellers may be entitled to additional contingent consideration based upon the acquired businesses achieving certain performance targets in 2014, 2015 and 2016. At the time the acquisition closed, we estimated the acquisition date fair value of the contingent consideration to be $10.5 million. In December 2015, we entered into an agreement with the former owners of Trade Facts to satisfy all remaining obligations under the contingent earn-out arrangement for a one-time payment of $1.5 million, which was paid in early 2016.
Acquisition of Intellectual Property Assets
On July 10, 2014, we entered into asset purchase agreements with Valaquenta Intellectual Property Limited, or Valaquenta, and Forexster Limited, or Forexster, pursuant to which one of our subsidiaries, GAIN GTX Bermuda, Ltd., or GTX Bermuda, agreed to purchase, from Valaquenta and Forexster, the software and other intellectual property assets utilized to operate the electronic trading platform offered to customers in our GTX business. Prior to the closing of the acquisition, which took place on July 10, 2014, we had agreements with Valaquenta and Forexster granting us the exclusive right to use the intellectual property in the field of forex trading and non-exclusive rights to use the intellectual property for the trading of financial products in the fields of precious metals and hydrocarbons. Following the closing of the acquisition, GTX Bermuda has full rights and title over the intellectual property for the trading of currencies, commodities and all other financial instruments of any kind whatsoever.
The purchase was made with a combination of $12.4 million in cash and $5.3 million of our unregistered common stock. In addition, GTX Bermuda agreed to pay Valaquenta contingent consideration in the event that GTX Bermuda or any of its affiliates in the future provide customers the ability to trade new types of financial instruments using the purchased intellectual property and the trading of such new products generates "Net Revenue" (as defined in the agreement with Valaquenta) in excess of thresholds set out in the agreement.
Key Income Statement Line Items and Key Operating Metrics
The following section briefly describes the key components of our revenues and expenses, our use of non-GAAP financial measures, and key operating metrics we use to evaluate the performance of our business.
Revenue
Revenue from our business consists of retail segment revenue, institutional segment revenue, futures segment revenue, other revenue and interest revenue.
Retail Segment Revenue
Retail segment revenue is our largest source of revenue. Retail segment revenue is comprised of trading revenue from our retail segment, commission revenue from our advisory business, as well as inactivity fees and interest revenue.
39
Prior to our acquisitions of Global Futures and Forex, Ltd., or GFT, and City Index, trading revenue in our retail segment had been generated primarily by forex products. As a result of the GFT and City Index acquisitions, trading revenue generated by non-forex products, particularly CFDs relating to equity indices, single stock equities and commodities, has increased both in magnitude and as a percentage of total revenue in our retail segment.
We generate revenue in our retail segment in two ways: (1) trading revenue from our market making activities for OTC products, earned principally from the bid/offer spread we offer our customers and any net gains and losses generated through changes in the market value of the currencies and other products held in our net exposure and (2) fees, including financing charges for positions held overnight, commissions on equity CFD trades and advisory services, and other account related fees.
For the year ended December 31, 2016, approximately 98% of our average daily retail segment trading volume was either naturally hedged or hedged by us with one of our liquidity providers, which is substantially similar to our average daily retail segment trading volume hedged of approximately 98% and 96% in both 2015 and 2014, respectively. The remaining 2%, 2%, and 4% of our average daily retail segment trading volume in 2016, 2015 and 2014, respectively consisted of our net exposure.
We manage our net exposure by applying position and exposure limits established under our risk-management policies and by continuous, active monitoring by our trading and risk teams. Based on our risk management policies and procedures, over time a portion of our net exposure may be hedged with our liquidity providers. Although we do not actively initiate proprietary market positions in anticipation of future movements in the relative prices of the products we offer, through our net exposure we are likely to have open positions in various products at any given time. In the event of unfavorable market movements, we may experience losses on such positions. See “Our Retail Segment - Sophisticated Risk Management” in Item 1. Business, in this Form 10-K for further details regarding our risk management policies for the retail segment.
In 2015 and earlier periods, we had a retail sales trader business which provided high-touch trading services and execution to high net worth customers. We primarily earned commissions on this trade flow, which we typically hedged fully. In the latter part of 2015, our sales trader business was restructured and integrated into the rest of the retail segment.
Institutional Segment Revenue
Institutional segment revenue consists primarily of revenue from our GTX business, which provides a proprietary trading platform and sales and trading services to institutions, as well as interest revenue. Revenue for our GTX business is generated primarily through commissions on trades executed on the GTX platform. We act as an agent for the trades executed on the GTX platform and, therefore, do not assume any market or credit risk in connection with those transactions. Our institutional segment revenue includes revenue generated by intercompany transactions with other segments/affiliates that are eliminated when calculating our consolidated net revenue. This intercompany revenue totaled approximately $1.2 million for the year ended December 31, 2016.
Futures Segment Revenue
Futures revenue is comprised primarily of commissions earned on futures and futures options trades, as well as interest revenue. We act as an agent for the trading executed in our futures segment and are not exposed to market risk in connection with their activity.
Corporate and Other Revenue
Corporate and other revenue primarily comprises foreign currency translation gains and losses. During the twelve months ended December 31, 2015, corporate and other revenue also included a $6.7 million adjustment to the contingent consideration related to our Trade Facts acquisition. In December 2015, we entered into an agreement with the former owners of Trade Facts to satisfy all remaining obligations under the contingent earn-out arrangement for a one-time payment of $1.5 million, which was paid in early 2016.
Net Interest Revenue
Net interest revenue/expense consists primarily of the revenue generated by our cash and customer cash held by us at banks and on deposit as collateral with our liquidity providers, less interest paid to our customers.
Our cash and customer cash is generally invested in money market funds, which primarily invest in short-term United States government securities or treasury bills. Interest paid to customers varies primarily due to the net value of a customer
40
account. A customer’s net account value equals cash on deposit plus the mark-to-market of open positions as of the measurement date. Interest income and interest expense are recorded when earned and incurred, respectively. Net interest revenue was $1.1 million for the year ended December 31, 2016, compared to net interest revenue of $0.2 million for the year ended December 31, 2015.
Expenses
Our expenses are principally comprised of employee compensation and benefits, selling and marketing, referral fees, trading expenses, interest on long term borrowings, communications and technology expenses, as well as general and administrative expenses.
Employee Compensation and Benefits
Employee compensation and benefits includes salaries, bonuses, commissions, stock-based compensation, contributions to benefit programs and other related employee costs.
Selling and Marketing
Our marketing strategy employs a combination of direct online marketing and focused branding programs, with the goal of raising awareness and cost-effectively acquiring customers for our products and services.
Referral Fees
Referral fees consist of compensation paid to our white label partners and introducing brokers. We generally provide white label partners with the platform, systems, and back-office services necessary for them to offer trading services to their customers. Introducing brokers identify and direct customers to us.
Referral fees are largely variable and change principally based on the level of customer trading volume directed to us from our white label partners and introducing brokers, the specific terms of our agreements with the white label partners and introducing brokers, which vary on a partner-by-partner and regional basis, and the relative percentage of trading volume generated from particular relationships in any given period. The majority of our white label and introducing broker partners are paid based on the trading volume generated by the customers they introduce, directly or indirectly, to us, rather than on a revenue sharing basis. As such, during periods in which their customers’ trading activity is not profitable for us, if the associated trading volume remains high, we may be required to make larger payments to these partners despite the fact that we are generating lower revenue from the customers that they have introduced. Our indirect business accounted for 43.5%, 48.4% and 48.7% of retail trading volume in the years ended December 31, 2016, 2015 and 2014, respectively.
Trading Expenses
Trading expenses consists of exchange fees paid to stock exchanges and other third-parties for exchange market data that we provide to our customers or use to create our own derived data products, as well as fees for news services and fees paid to prime brokers in connection with our institutional and futures segments.
General and Administrative
General and administrative expenses consist of bank fees, professional fees, occupancy and equipment and other miscellaneous expenses.
Depreciation and amortization
Depreciation and amortization consists of the recognition of expense for physical assets and software purchased for use over a period of several years and of the amortization of internally developed software.
Purchased Intangible Amortization
Purchased intangible amortization consists of amortization related to intangible assets we acquired in connection with our acquisitions. The principal intangible assets acquired were technology, customer assets and a non-compete agreement. These intangible assets have useful lives ranging from one year to ten years.
Communications and Technology
41
Communications and technology consists of communications fees, data fees, product development, software and maintenance expenses.
Bad debt provision
Bad debt provision represents the amounts estimated for the uncollectibility of certain outstanding balances during the period.
Restructuring Expenses
In 2016, 2015 and 2014, we incurred restructuring expenses, which reflected costs arising from headcount reductions and other exit costs, measured and disclosed in accordance with ASC 420 Exit or Disposal Cost Obligations and ASC 712 Compensation - Nonretirement Postemployment Benefits.
Acquisition Expenses
In 2015 and 2014, we incurred acquisition-related expenses, which included professional services costs, such as legal, accounting, valuation and other costs specified in ASC 805. These costs are expensed as incurred.
Integration Expenses
In 2016, 2015 and 2014, we incurred integration expenses, which are acquisition-related costs that are incurred while integrating the acquired company into the consolidated group. These costs include retention bonuses paid to employees and the cost of retiring redundant assets.
Impairment of Investment
In 2013, our investment in Kapitall, Inc. became impaired. In 2014, the remaining value of the investment was written off.
Interest Expense on Long-term borrowings
Interest expense on long-term borrowings consists of interest expense on our 4.125% Convertible Senior Notes due 2018, issued in November 2013, and interest expense on our 4.125% Convertible Senior Notes due 2020, issued in April 2015 as part of the consideration for the City Index acquisition.
Non-GAAP Financial Measures
We use free cash available, adjusted net income and adjusted earnings per common share, each of which is a non-GAAP financial measure, to evaluate our business. We believe our reporting of free cash available, adjusted net income and adjusted earnings per share assists investors in evaluating our operating performance. Free cash available, adjusted net income and adjusted earnings per common share are not measures of financial performance calculated in accordance with GAAP. They should be considered in addition to, but not as a substitute for, other measures of our financial performance reported in accordance with GAAP, such as net income and earnings per common share. Below is a discussion and reconciliation of these non-GAAP financial measures.
Free Cash Available
Free cash available is a non-GAAP financial measure and consists of our Cash and cash equivalents, plus our Receivables from banks and brokers, less the minimum regulatory capital requirements applicable to our business. We use this non-GAAP measure to evaluate our ability to continue to fund growth in our business.
Adjusted Net Income and Adjusted Earnings Per Share
Adjusted net income is a non-GAAP financial measure and represents our net income excluding restructuring, acquisition and integration expenses, which include deal-related acquisition costs, such as legal, accounting and valuation expenses, accelerated amortization of trading platforms, gain on extinguishment of debt and other expenses incurred in connection with, or as a result of, merger and acquisition transactions. In addition, adjusted net income excludes the adjustment to the fair value of consideration from the Trade Facts acquisition and the bad debt expense related to the Swiss National Bank event in January 2015. We exclude these items from our adjusted net income and adjusted earnings per share, because we view these as transactions that are not part of our core operations, which we believe to be the most meaningful indicators of the Company's performance.
42
Adjusted earnings per share is a non-GAAP financial measure and represents our adjusted net income per share. We believe these financial measures assist investors in evaluating our operating performance. These non-GAAP financial measures have certain limitations, including that they do not have standardized meanings. Therefore, our definitions may be different from similar non-GAAP financial measures used by other companies or analysts, and it may be difficult to compare our financial performance to that of other companies.
Reconciliation of Non-GAAP Financial Measures
For a reconciliation of free cash available to Cash and cash equivalents, please see "Item 7. Management's Discussion and Analysis of Financial Condition and Results of Operations - Liquidity and Capital Resources" below. The following table provides a reconciliation of GAAP net income to adjusted net income and adjusted earnings per common share for the restated amounts (amounts in thousands except per share amounts):
Year Ended December 31, | |||||||||||
2016 | 2015 | 2014 | |||||||||
Net income applicable to GAIN Capital Holdings, Inc. | $ | 35,272 | $ | 10,279 | $ | 24,877 | |||||
Add Back, net of tax: | |||||||||||
Acquisition expense | — | 2,199 | 2,539 | ||||||||
Restructuring | 812 | 2,716 | 1,680 | ||||||||
Integration | 1,812 | 21,510 | 1,792 | ||||||||
Other items(1) | — | — | 36 | ||||||||
Adjustment to fair value of contingent consideration | — | (4,369 | ) | — | |||||||
Legal Settlement | 7,180 | — | — | ||||||||
Bad Debt related to SNB event in January 2015 | — | 1,950 | — | ||||||||
Adjusted net income | $ | 45,076 | $ | 34,285 | $ | 30,924 | |||||
Adjusted earnings per common share | |||||||||||
Basic | $ | 0.93 | $ | 0.72 | $ | 0.76 | |||||
Diluted | $ | 0.92 | $ | 0.71 | $ | 0.72 | |||||
(1) Other items, net of tax include impairment of investment and gain on extinguishment of debt.
43
Operating Metrics
In addition to the financial measures discussed above, we review various key operating metrics, which are described below, to evaluate the performance of our businesses.
Key Operating Metrics | |||||||||||||||||||
(Unaudited) | |||||||||||||||||||
Year Ended December 31, | |||||||||||||||||||
2016 | 2015 | 2014 | 2013 | 2012 | |||||||||||||||
Retail | |||||||||||||||||||
OTC Trading Volume (billions) | $ | 2,822 | $ | 3,985.8 | $ | 2,430.5 | $ | 1,796.7 | $ | 1,303.4 | |||||||||
OTC Average Daily Volume (billions) | $ | 10.9 | $ | 15.4 | $ | 9.4 | $ | 6.9 | $ | 5.0 | |||||||||
Active OTC Accounts | 129,036 | 146,977 | 94,895 | 98,696 | 60,219 | ||||||||||||||
Client Assets (millions) | $ | 945.5 | $ | 920.6 | $ | 759.6 | $ | 739.3 | $ | 446.3 | |||||||||
Institutional | |||||||||||||||||||
Volume (billions) | $ | 2,960.1 | $ | 2,671.9 | $ | 3,183.7 | $ | 2,599.6 | $ | 1,493.8 | |||||||||
Average Daily Volume (billions) | $ | 11.4 | $ | 10.3 | $ | 12.7 | $ | 10 | $ | 5.7 | |||||||||
Futures | |||||||||||||||||||
Futures Contracts | 8,304,376 | 8,623,392 | 7,027,008 | 5,386,383 | 1,507,425 | ||||||||||||||
Futures Average Daily Contracts | 32,954 | 34,356 | 28,108 | 21,460 | 18,383.2 | ||||||||||||||
OTC Trading Volume
OTC trading volume is the U.S. dollar equivalent of the aggregate notional value of OTC trades executed by customers in our retail segment. Approximately 48.8% of our overall customer trading volume for the year ended December 31, 2016 was generated in our retail segment, compared to 59.9% for the year ended December 31, 2015.
OTC Average Daily Volume
Average daily volume is the U.S. dollar equivalent of the aggregate notional value of trades executed by our customers in a given period divided by the number of trading days in the given period.
Active OTC Accounts
Active OTC accounts represents retail segment customers who executed at least one trade during the relevant period. We believe active OTC accounts is an important operating metric because it correlates to trading volume and revenue in our retail segment.
Client Assets
Client assets represent amounts due to clients in our retail and futures segments, including customer deposits and unrealized gains or losses arising from open positions.
Institutional Volume
Institutional volume is the U.S. dollar equivalent of the aggregate notional value of OTC trades executed by customers in our institutional segment. Approximately 51.2% and 40.1% of our overall customer trading volume for the years ended December 31, 2016 and 2015, respectively, was generated in our institutional segment.
Futures Contracts
Futures contracts represent the total number of contracts transacted by customers in our futures segment.
44
We believe that our customer trading volumes are driven by eight main factors. Four of these factors are broad external factors outside of our control that generally impact customer trading volumes, and include:
• | overall economic conditions and outlook; |
• | volatility of financial markets; |
• | legislative changes; and |
• | regulatory changes. |
The volatility of financial markets has generally been positively correlated with customer trading volume. Our customer trading volume is also affected by the following additional factors:
• | the effectiveness of our sales activities; |
• | the competitiveness of our products and services; |
• | the effectiveness of our customer service team; and |
• | the effectiveness of our marketing activities. |
In order to increase customer trading volume, we focus our marketing and our customer service and education activities on attracting new customers and extending the duration and scope of the relationship our customers have with us.
For the years ended December 31, 2016 and December 31, 2015, no single retail or institutional customer accounted for more than 3% of our total net revenue.
Results of Operations
During the fourth quarter of 2015, we changed our segment reporting structure to include three operating segments, retail, institutional and futures, rather than a single operating segment as had been previously reported. These operating segments are discussed in more detail below. We also report information relating to general corporate services in a fourth component, corporate and other. See Notes 1 and 21 to our audited consolidated financial statements for additional information.
45
Year Ended December 31, 2016 Compared to Year Ended December 31, 2015
Revenue (amounts in thousands)
Year Ended December 31, | |||||||
2016 | 2015 | ||||||
REVENUE: | |||||||
Retail revenue | $ | 330,744 | $ | 347,489 | |||
Institutional revenue | 29,030 | 33,773 | |||||
Futures revenue | 47,430 | 45,427 | |||||
Other revenue | 3,504 | 8,487 | |||||
Total non-interest revenue | 410,708 | 435,176 | |||||
Interest revenue | 1,669 | 1,220 | |||||
Interest expense | 552 | 1,049 | |||||
Total net interest revenue | 1,117 | 171 | |||||
Net Revenue | $ | 411,825 | $ | 435,347 | |||
Our total net revenue decreased $23.5 million, or 5.4%, for the year ended December 31, 2016, compared to the year ended December 31, 2015.
Retail revenue decreased $16.7 million, or 4.8%, for the year ended December 31, 2016, compared to the year ended December 31, 2015. The decrease was primarily due to a decrease in trading volume.
Institutional revenue decreased $4.7 million, or 14.0%, for the year ended December 31, 2016, compared to the year ended December 31, 2015. The decrease primarily resulted from a decrease in volume in our non-platform institutional trading services and a shift in the mix of trading volume on our GTX platform reflecting an increased percentage of lower revenue-per-contract transactions, partially offset by an increase in ECN trading volume.
Futures revenue increased $2.0 million, or 4.4%, for the year ended December 31, 2016, compared to the year ended December 31, 2015. The increase was primarily due to an increase in revenue per traded contract during the year.
Other revenue decreased $5.0 million, or 58.7%, for the year ended December 31, 2016, compared to the year ended December 31, 2015. The decrease was primarily due to an adjustment to the recorded amount of contingent consideration relating to our Trade Facts acquisition in 2015, partially offset by an increase in foreign currency revaluation.
Our net interest revenue increased from $0.2 million for the year ended December 31, 2015 to $1.1 million for the year ended December 31, 2016.
Operating Expenses (amounts in thousands)
Year Ended December 31, | |||||||
2016 | 2015 | ||||||
Total operating expenses (amounts in thousands) | $ | 354,162 | $ | 417,698 | |||
As a percentage of net revenue | 86.0 | % | 95.9 | % | |||
Our total operating expenses decreased $63.5 million, or 15.2%, for the year ended December 31, 2016, compared to the year ending December 31, 2015, primarily due to our ongoing integration and expense reduction efforts following the City Index acquisition and a reduction in variable costs due to lower trading volume during 2016.
The decrease in operating expenses consisted primarily of decreases of $4.7 million in employee compensation and benefits, $32.8 million in referral fees, $0.8 million in trading expenses, $2.4 million in restructuring expenses, $1.5 million in purchased intangible amortization, $30.3 million in integration expenses, and $3.3 million in bad debt provision, partially offset by an increase of $1.6 million in selling and marketing, $2.8 million in depreciation and amortization and $2.8 million in acquisition expenses.
46
The changes in expenses are discussed in more detail below.
Employee Compensation and Benefits
Year Ended December 31, | |||||||
2016 | 2015 | ||||||
Employee compensation and benefits (amounts in thousands) | $ | 101,904 | $ | 106,581 | |||
As a percentage of net revenue | 24.7 | % | 24.5 | % | |||
Employee compensation and benefits expenses decreased $4.7 million, or 4.4%, for the year ended December 31, 2016, compared to the year ended December 31, 2015. The decrease was primarily due to the effects of restructuring actions taken in 2015 to reduce headcount following the City Index acquisition.
Selling and Marketing Expenses
Year Ended December 31, | |||||||
2016 | 2015 | ||||||
Selling and marketing (amounts in thousands) | $ | 28,742 | $ | 27,168 | |||
As a percentage of net revenue | 7.0 | % | 6.2 | % | |||
Selling and marketing expenses increased $1.6 million, or 5.8%, for the year ended December 31, 2016, compared to the year ended December 31, 2015. The increase was primarily due to increased costs to support our retail brands during the fourth quarter of 2016, partially offset by a reduction in marketing spend in the first three quarters of 2016 while we focused on integration activities.
Referral Fees
Year Ended December 31, | |||||||
2016 | 2015 | ||||||
Referral fees (amounts in thousands) | $ | 70,752 | $ | 103,523 | |||
As a percentage of net revenue | 17.2 | % | 23.8 | % | |||
Referral fees decreased $32.8 million, or 31.7%, for the year ended December 31, 2016, compared to the year ended December 31, 2015. The decrease was primarily due to our focus on terminating unprofitable partner relationships and, to a lesser extent, renegotiating ongoing partner agreements to more favorable terms.
Trading Expenses
Year Ended December 31, | |||||||
2016 | 2015 | ||||||
Trading expenses (amounts in thousands) | $ | 31,159 | $ | 31,914 | |||
As a percentage of net revenue | 7.6 | % | 7.3 | % | |||
Trading expenses decreased $0.8 million, or 2.4%, for the year ended December 31, 2016, compared to the year ended December 31, 2015. The decrease was primarily due to the full-year effect of the wind down of our sales trader business, which was integrated into our retail segment during the course of 2015.
General and Administrative
Year Ended December 31, | |||||||
2016 | 2015 | ||||||
General and administrative (amounts in thousands) | $ | 55,036 | $ | 55,067 | |||
As a percentage of net revenue | 13.4 | % | 12.6 | % | |||
47
General and administrative expense remained relatively flat for the year ended December 31, 2016, compared to the year ended December 31, 2015.
Depreciation and Amortization
Year Ended December 31, | |||||||
2016 | 2015 | ||||||
Depreciation and amortization (amounts in thousands) | $ | 13,905 | $ | 11,111 | |||
As a percentage of net revenue | 3.4 | % | 2.6 | % | |||
Depreciation and amortization increased by $2.8 million, or 25.1%, for the year ended December 31, 2016, compared to the year ended December 31, 2015. The increase was primarily due to the depreciation of property and equipment acquired in the City Index acquisition in the second quarter of 2015.
Purchased Intangible Amortization
Year Ended December 31, | |||||||
2016 | 2015 | ||||||
Purchased intangible amortization (amounts in thousands) | $ | 15,016 | $ | 16,550 | |||
As a percentage of net revenue | 3.6 | % | 3.8 | % | |||
Purchased intangible amortization decreased $1.5 million, or 9.3%, for the year ended December 31, 2016, compared to the year ended December 31, 2015. The decrease was primarily due to the full amortization of the GFT acquisition in the fourth quarter of 2015, partially offset by the amortization of intangible assets acquired as part of the City Index transaction.
Communications and Technology
Year Ended December 31, | |||||||
2016 | 2015 | ||||||
Communications and technology (amounts in thousands) | $ | 20,460 | $ | 18,929 | |||
As a percentage of net revenue | 5.0 | % | 4.3 | % | |||
Communications and technology expenses increased $1.5 million, or 8.1%, for the year ended December 31, 2016, compared to the year ended December 31, 2015. The increase was primarily due to the inclusion of a full year of communication and technology expenses acquired as part of the City Index transaction in 2015.
Bad debt provision
Year Ended December 31, | |||||||
2016 | 2015 | ||||||
Bad debt (amounts in thousands) | $ | 4,154 | $ | 7,462 | |||
As a percentage of net revenue | 1.0 | % | 1.7 | % | |||
Bad debt provision decreased $3.3 million, or 44.3%, for the year ended December 31, 2016, compared to the year ended December 31, 2015. The decrease was primarily due to the $2.5 million in bad debt which arose in connection with the Swiss National Bank in January 2015.
48
Restructuring expenses
Year Ended December 31, | |||||||
2016 | 2015 | ||||||
Restructuring (amounts in thousands) | $ | 1,041 | $ | 3,482 | |||
As a percentage of net revenue | 0.3 | % | 0.8 | % | |||
Restructuring expenses were $1.0 million and $3.5 million for the years ended December 31, 2016 and December 31, 2015, respectively. The decrease in 2016 was primarily due to the wind down of our restructuring activities from the integration of City Index. Restructuring expenses include severance payments and related expenses that arose in connection with headcount reduction relating to our ongoing integration of City Index.
Integration expenses
Year Ended December 31, | |||||||
2016 | 2015 | ||||||
Integration (amounts in thousands) | $ | 2,788 | $ | 33,092 | |||
As a percentage of net revenue | 0.7 | % | 7.6 | % | |||
Integration expenses were $2.8 million and $33.1 million for the years ended December 31, 2016 and December 31, 2015 respectively. In 2016, these expenses consisted of acquisition-related activity, primarily the accelerated amortization of intangible and other assets made redundant as a result of the City Index acquisition, employee relocation costs and retention payments to employees. In the year ended December 31, 2015, these expenses included the accelerated amortization of the trading platform acquired in the GFT transaction which was retired following our acquisition of City Index.
Acquisition expenses
Year Ended December 31, | |||||||
2016 | 2015 | ||||||
Acquisition expense (amounts in thousands) | $ | — | $ | 2,819 | |||
As a percentage of net revenue | — | % | 0.6 | % | |||
The Company did not incur any acquisition expenses for the year ended December 31, 2016. Acquisition expenses were $2.8 million for the year ended December 31, 2015 and arose primarily in connection with the City Index transaction. Acquisition expenses are costs directly attributable to acquisitions, including legal, accounting and other professional advisory fees.
Legal Settlement
Year Ended December 31, | |||||||
2016 | 2015 | ||||||
Legal Settlement (amounts in thousands) | $ | 9,205 | $ | — | |||
As a percentage of net revenue | 2.2 | % | — | % | |||
On April 28, 2016, we entered into a settlement agreement with the claimants in the Cameron Farley Ltd. matter discussed below in "Part II - Other Information - Item 1. Legal Proceedings". Pursuant to the terms of the settlement agreement, we agreed to make a one-time settlement payment in exchange for a full and final settlement of all claims. The settlement amount, net of insurance recoveries, totaled approximately $9.2 million.
49
Interest on long term borrowings
Year Ended December 31, | |||||||
2016 | 2015 | ||||||
Interest on long term borrowings (amounts in thousands) | $ | 10,421 | $ | 9,222 | |||
As a percentage of net revenue | 2.5 | % | 2.1 | % | |||
Interest on long term borrowings was $10.4 million and $9.2 million for the years ended December 31, 2016 and December 31, 2015, respectively. Interest on long-term borrowings consists of interest expense on our 4.125% Convertible Senior Notes due 2018, issued in November 2013, and our 4.125% Convertible Senior Notes due 2020, issued in April 2015 in connection with the City Index transaction. The year ended December 31, 2016 was the first full year of interest expense for the 4.125% Convertible Senior Notes due 2020.
Income Taxes
Year Ended December 31, | |||||||
2016 | 2015 | ||||||
Income tax expense (amounts in thousands) | $ | 9,768 | $ | (3,512 | ) | ||
Effective tax rate | 20.7 | % | (41.7 | )% | |||
Income tax expense increased $13.3 million, resulting in a tax expense of $9.8 million for the year ended December 31, 2016, compared to income tax benefit of $3.5 million for the year ended December 31, 2015. Our effective tax rate in the year ended December 31, 2016 was 20.7%. The increase in effective tax rate was primarily due to a change in the mix of earnings from different foreign jurisdictions. See Note 18 to our audited consolidated financial statements for more detail.
Segment Results - Year Ended December 31, 2016 Compared to Year Ended December 31, 2015
Retail Segment (amounts in thousands)
Year Ended December 31, | |||||||
2016 | 2015 | ||||||
Net revenue | $ | 336,353 | $ | 351,472 | |||
Employee compensation and benefits | 62,423 | 67,515 | |||||
Selling and marketing | 27,666 | 26,129 | |||||
Referral fees | 55,080 | 87,175 | |||||
Other operating expenses | 75,488 | 76,301 | |||||
Segment profit | $ | 115,696 | $ | 94,352 | |||
Retail segment net revenue decreased $15.1 million, or 4.3%, for the year ended December 31, 2016, compared to the year ended December 31, 2015. The decrease was primarily related to a decrease in trading volume, partially offset by an increase in revenue per million.
Employee compensation and benefits expenses for the retail segment decreased $5.1 million, or 7.5%, for the year ended December 31, 2016, compared to the year ended December 31, 2015. The decrease was primarily due to a
reduction in our annual employee incentive compensation costs, as well as the headcount reductions effected in the third and fourth quarters of 2015.
Selling and marketing expense for the retail segment increased $1.5 million, or 5.9%, for the year ended December 31, 2016, compared to the year ended December 31, 2015. The increase was primarily due to increased costs to support the retail brands
50
during the fourth quarter of 2016, partially offset by a reduction in marketing spend in the first three quarters of 2016 while we focused on integration activities.
Referral fees for the retail segment decreased $32.1 million, or 36.8%, for the year ended December 31, 2016, compared to the year ended December 31, 2015. The decrease was primarily due to our focus on terminating unprofitable partner relationships and, to a lesser extent, renegotiating ongoing partner agreements to more favorable terms.
Other operating expenses for the retail segment decreased $0.8 million, or 1.1%, for the year ended December 31, 2016, compared to the year ended December 31, 2015. The decrease was primarily due to a decrease in U.K. regulatory fees, partially offset by an increase in audit fees for the year ended December 31, 2016.
Institutional Segment (amounts in thousands)
Year Ended December 31, | |||||||
2016 | 2015 | ||||||
Net revenue | $ | 30,219 | $ | 35,072 | |||
Employee compensation and benefits | 14,424 | 15,305 | |||||
Selling and marketing | 103 | 138 | |||||
Other operating expenses | 10,342 | 9,573 | |||||
Segment profit | $ | 5,350 | $ | 10,056 | |||
Institutional segment net revenue decreased $4.9 million, or 13.8%, for the year ended December 31, 2016, compared to the year ended December 31, 2015. The decrease was primarily due to a decrease in volume in our non-platform institutional trading services and a shift in the mix of trading volume on our GTX platform reflecting an increased percentage of lower revenue-per-contract transactions, partially offset by an increase in ECN trading volume.
Employee compensation and benefits expenses for the institutional segment decreased $0.9 million, or 5.8%, for the year ended December 31, 2016, compared to the year ended December 31, 2015. The decrease was primarily due to a decrease in commissions paid to employees as a result of the decrease in revenue.
Selling and marketing expenses for the institutional segment were largely unchanged for the year ended December 31, 2016, compared to the year ended December 31, 2015.
Other operating expenses for the institutional segment increased $0.8 million, or 8.0%, for the year ended December 31, 2016, compared to the year ended December 31, 2015. The increase was primarily due to the mix of trading fees paid to third parties for the year ended December 31, 2016, compared to the prior year. Other operating expenses from the institutional segment include general and administrative expenses, communication and technology expenses and trading expenses.
Futures Segment (amounts in thousands)
Year Ended December 31, | |||||||
2016 | 2015 | ||||||
Net revenue | $ | 48,084 | $ | 45,797 | |||
Employee compensation and benefits | 11,967 | 10,634 | |||||
Selling and marketing | 972 | 901 | |||||
Referral fees | 15,672 | 16,348 | |||||
Other operating expenses | 14,769 | 13,960 | |||||
Segment profit | $ | 4,704 | $ | 3,954 | |||
Futures segment net revenue increased $2.3 million, or 5.0%, for the year ended December 31, 2016, compared to the year ended December 31, 2015. The increase was primarily due to an increase in revenue per traded contract in 2016.
51
Employee compensation and benefits expenses for the futures segment increased $1.3 million, or 12.5%, for the year ended December 31, 2016, compared to the year ended December 31, 2015. The increase was primarily due to additional commissions paid to employees as a result of the increase in revenue.
Selling and marketing expenses for the futures segment were relatively flat for the year ended December 31, 2016, compared to the year ended December 31, 2015.
Referral fees for the futures segment decreased $0.7 million, or 4.1%, for the year ended December 31, 2016, compared to the year ended December 31, 2015. The decrease was primarily due to a decrease in indirect futures volumes.
Other operating expenses for the futures segment increased $0.8, or 5.8%, for the year ended December 31, 2016, compared to the year ended December 31, 2015. The increase was primarily due to an increase in trading expenses. Other operating expenses from the futures segment include general and administrative expenses, communication and technology expenses and trading expenses.
Corporate and Other (amounts in thousands)
Year Ended December 31, | |||||||
2016 | 2015 | ||||||
Other revenue | $ | (2,831 | ) | $ | (3,716 | ) | |
Selling and marketing | 1 | — | |||||
Employee compensation and benefits | 13,090 | 13,127 | |||||
Other operating expenses | 10,210 | 11,038 | |||||
Loss | $ | (26,132 | ) | $ | (27,881 | ) | |
Corporate and other revenue increased $0.9 million, for the year ended December 31, 2016, compared to the year ended December 31, 2015. The increase was largely due to changes in foreign currency revaluations.
Employee compensation and benefits expenses for employees not attributed to any of our operating segments, such as our executive officers, remained relatively flat for the year ended December 31, 2016, compared to the year ended December 31, 2015.
Other operating expenses not attributed to any of our operating segments decreased $0.8 million, or 7.5%, for the year ended December 31, 2016, compared to the year ended December 31, 2015. The decrease was primarily due to a decrease in professional fees.
52
Year Ended December 31, 2015 Compared to Year Ended December 31, 2014
Revenue (amounts in thousands)
Year Ended December 31, | |||||||
2015 | 2014 | ||||||
REVENUE: | |||||||
Retail revenue | $ | 347,489 | $ | 292,778 | |||
Institutional revenue | 33,773 | 34,518 | |||||
Futures revenue | 45,427 | 36,160 | |||||
Other revenue | 8,487 | 4,904 | |||||
Total non-interest revenue | 435,176 | 368,360 | |||||
Interest revenue | 1,220 | 1,428 | |||||
Interest expense | 1,049 | 599 | |||||
Total net interest revenue | 171 | 829 | |||||
Net Revenue | $ | 435,347 | $ | 369,189 | |||
Our total net revenue increased $66.2 million, or 17.9%, for the year ended December 31, 2015, compared to the year ended December 31, 2014.
Retail revenue increased $54.7 million, or 18.7%, for the year ended December 31, 2015, compared to the year ended December 31, 2014. The increase was primarily the result of the City Index acquisition in April 2015.
Institutional revenue decreased $0.7 million, or 2.2%, for the year ended December 31, 2015, compared to the year ended December 31, 2014. The decrease primarily resulted from a reduction in commission revenue from our institutional sales and
trading services, partially offset by a growth in commissions revenue from trading on our GTX platform.
Futures revenue increased $9.3 million, or 25.6%, for the year ended December 31, 2015, compared to the year ended December 31, 2014. The increase was primarily due to inclusion of full year results of GAA and Top Third, in which we
acquired controlling interests in March 2014.
Other revenue increased $3.6 million, for the year ended December 31, 2015, compared to the year ended December 31, 2014. The increase was primarily due to an adjustment to the recorded amount of contingent consideration
relating to our Trade Facts acquisition, partially offset by foreign currency revaluation.
Our net interest revenue decreased from $0.8 million for the year ended December 31, 2014 to $0.2 million for the year ended December 31, 2015.
Operating Expenses
Year Ended December 31, | |||||||
2015 | 2014 | ||||||
Total operating expenses (amounts in thousands) | $ | 417,698 | $ | 317,592 | |||
As a percentage of net revenue | 95.9 | % | 86.0 | % | |||
Our total operating expenses increased $100.1 million, or 31.5%, for the year ended December 31, 2015, compared to the year ending December 31, 2014, primarily due to the effects of the City Index acquisition.
The increase in operating expenses was primarily due to increases of $7.3 million in employee compensation and benefits, $7.0 million in selling and marketing expenses, $12.6 million in referral fees, $5.7 million in trading expenses, $16.4 million in general and administrative expenses, $4.5 million in depreciation and amortization expenses, $8.5 million in purchased intangible amortization, $3.4 million in communication and technology, $3.8 million in bad debt provision, $1.1 million in restructuring expenses, and $30.6 million in integration expenses offset by a decrease of $0.7 million in acquisition expenses.
53
Employee Compensation and Benefits
Year Ended December 31, | |||||||
2015 | 2014 | ||||||
Employee compensation and benefits (amounts in thousands) | $ | 106,581 | $ | 99,233 | |||
As a percentage of net revenue | 24.5 | % | 26.9 | % | |||
Employee compensation and benefits expenses increased $7.3 million, or 7.4%, for the year ended December 31, 2015,
compared to the year ended December 31, 2014. The increase was primarily due to compensation and benefits for the
additional employees acquired in the acquisition of City Index, partially offset by the headcount reductions effected in the third
and fourth quarters of 2015.
Selling and Marketing Expenses
Year Ended December 31, | |||||||
2015 | 2014 | ||||||
Selling and marketing (amounts in thousands) | $ | 27,168 | $ | 20,213 | |||
As a percentage of net revenue | 6.2 | % | 5.5 | % | |||
Selling and marketing expenses increased $7.0 million, or 34.4%, for the year ended December 31, 2015, compared to the year ended December 31, 2014. These increase was primarily due to costs incurred to support additional brands following the
acquisition of City Index.
Referral fees
Year Ended December 31, | |||||||
2015 | 2014 | ||||||
Referral fees (amounts in thousands) | $ | 103,523 | $ | 90,972 | |||
As a percentage of net revenue | 23.8 | % | 24.6 | % | |||
Referral fees increased $12.6 million, or 13.8%, for the year ended December 31, 2015, compared to the year ended December 31, 2014. The increase was primarily due to increased trading volume introduced to us by introducing brokers in
2015, primarily due to our acquisition of City Index, partially offset by lower average referral fees per million paid to such
partners in respect of introduced trading volumes.
Trading Expenses
Year Ended December 31, | |||||||
2015 | 2014 | ||||||
Trading expenses (amounts in thousands) | $ | 31,914 | $ | 26,168 | |||
As a percentage of net revenue | 7.3 | % | 7.1 | % | |||
Trading expenses increased $5.7 million, or 22.0%, for the year ended December 31, 2015, compared to the year ended December 31, 2014. The increase was primarily due to increased trading expenses resulting from the expansion of our business
following the acquisition of City Index.
General and Administrative
Year Ended December 31, | |||||||
2015 | 2014 | ||||||
General and administrative (amounts in thousands) | $ | 55,067 | $ | 38,651 | |||
As a percentage of net revenue | 12.6 | % | 10.5 | % | |||
54
General and administrative expenses increased $16.4 million, or 42.5%, for the year ended December 31, 2015, compared to the year ended December 31, 2014. The increase was primarily due to an increase in occupancy and equipment, primarily due to the additional locations acquired in the City Index transaction, as well as increased bank fees attributable to an increase in
customer activity and accounts acquired in the City Index transaction.
Depreciation and Amortization
Year Ended December 31, | |||||||
2015 | 2014 | ||||||
Depreciation and amortization (amounts in thousands) | $ | 11,111 | $ | 6,610 | |||
As a percentage of net revenue | 2.6 | % | 1.8 | % | |||
Depreciation and amortization increased by $4.5 million, or 68.1%, for the year ended December 31, 2015, compared to the year ended December 31, 2014. The increase was primarily due to the depreciation of property and equipment acquired in the
City Index transaction.
Purchased Intangible Amortization
Year Ended December 31, | |||||||
2015 | 2014 | ||||||
Purchased intangible amortization (amounts in thousands) | $ | 16,550 | $ | 8,080 | |||
As a percentage of net revenue | 3.8 | % | 2.2 | % | |||
Purchased intangible amortization increased $8.5 million, or 104.8%, for the year ended December 31, 2015, compared to the year ended December 31, 2014. The increase was primarily due to an increase in amortization relating to the acquisitions of
City Index in 2015 and the full year inclusion of amortization from our acquisitions in 2014 of GAA, Top Third, Trade Facts and the intellectual property rights relating to our GTX platform.
Communications and Technology
Year Ended December 31, | |||||||
2015 | 2014 | ||||||
Communication and technology (amounts in thousands) | $ | 18,929 | $ | 15,567 | |||
As a percentage of net revenue | 4.3 | % | 4.2 | % | |||
Communications and technology expenses increased $3.4 million, or 21.6%, for the year ended December 31, 2015, compared to the year ended December 31, 2014. These increases were primarily due to the acquisition of City Index.
Bad Debt Provision
Year Ended December 31, | |||||||
2015 | 2014 | ||||||
Bad debt provision (amounts in thousands) | $ | 7,462 | $ | 3,699 | |||
As a percentage of net revenue | 1.7 | % | 1.0 | % | |||
Bad debt provision increased $3.8 million, or 101.7%, for the year ended December 31, 2015, compared to the year ended December 31, 2014. This increase was primarily due to an increase in bad debt as a result of negative balances experienced by
some of our customers following actions taken by the Swiss National Bank in January 2015, as well as the acquisition of City
Index.
55
Restructuring expenses
Year Ended December 31, | |||||||
2015 | 2014 | ||||||
Restructuring (amounts in thousands) | $ | 3,482 | $ | 2,334 | |||
As a percentage of net revenue | 0.8 | % | 0.6 | % | |||
Restructuring expenses were $3.5 million and $2.3 million for the years ended December 31, 2015 and December 31, 2014,
respectively. Restructuring expenses include severance payments and related expenses that arose in connection with headcount
reduction initiatives, such as those that took place in the third and fourth quarters of 2015 following our acquisition of City
Index.
Acquisition expenses
Year Ended December 31, | |||||||
2015 | 2014 | ||||||
Acquisition expense (amounts in thousands) | $ | 2,819 | $ | 3,526 | |||
As a percentage of net revenue | 0.6 | % | 1.0 | % | |||
Acquisition expenses were $2.8 million and $3.5 million for the years ended December 31, 2015 and December 31, 2014
respectively. Acquisition expenses are costs directly attributable to acquisitions, including legal, accounting and other
professional advisory fees.
Integration expense
Year Ended December 31, | |||||||
2015 | 2014 | ||||||
Integration (amounts in thousands) | $ | 33,092 | $ | 2,489 | |||
As a percentage of net revenue | 7.6 | % | 0.7 | % | |||
Integration expenses were $33.1 million and $2.5 million for the years ended December 31, 2015 and December 31, 2014
respectively. In the year ended December 31, 2015 these expenses consisted primarily of the accelerated amortization of
intangible and other assets made redundant by the City Index acquisition. In the year ended December 31, 2014, these expenses
included accelerated amortization of platform assets related to our GFT acquisition integration efforts.
Interest on long term borrowings
Year Ended December 31, | |||||||
2015 | 2014 | ||||||
Interest on long term borrowings (amounts in thousands) | $ | 9,222 | $ | 6,147 | |||
As a percentage of net revenue | 2.1 | % | 1.7 | % | |||
Interest on long term borrowings were $9.2 million and $6.1 million for the years ended December 31, 2015 and December 31, 2014, respectively. Interest on long-term borrowings consists of interest expense on our 4.125% Convertible Senior Notes due 2018, issued in November 2013, and our 4.125% Convertible Senior Notes due 2020, issued in April 2015 in connection with the City Index acquisition.
Income Taxes
Year Ended December 31, | |||||||
2015 | 2014 | ||||||
Income tax expense/(benefit) (amounts in thousands) | $ | (3,512 | ) | $ | 19,140 | ||
Effective tax rate | (41.7 | )% | 42.1 | % | |||
56
Income tax expense decreased $22.7 million, resulting in a tax expense of $(3.5) million for the year ended December 31, 2015, compared to income tax expense of $19.1 million for the year ended December 31, 2014. Our effective tax rate in the year ended December 31, 2015 was (41.7)%. The decrease in effective tax compared to the year ended December 31, 2014 was due
to significant discrete items in the year ended December 31, 2015. See Note 18 to our audited consolidated financial
statements for more detail.
Segment Results - Year Ended December 31, 2015 Compared to Year Ended December 31, 2014
Retail Segment (amounts in thousands)
Year Ended December 31, | |||||||
2015 | 2014 | ||||||
Net revenue | $ | 351,472 | $ | 296,941 | |||
Employee compensation and benefits | 67,515 | 61,989 | |||||
Selling and marketing | 26,129 | 19,574 | |||||
Referral fees | 87,175 | 78,553 | |||||
Other operating expenses | 76,301 | 51,561 | |||||
Segment profit | $ | 94,352 | $ | 85,264 | |||
Retail segment net revenue increased $54.5 million, or 18.4%, for the year ended December 31, 2015, compared to the year ended December 31, 2014. The increase was primarily the result of the City Index acquisition in April 2015.
Employee compensation and benefits expenses for the retail segment increased $5.5 million, or 8.9%, for the year ended December 31, 2015, compared to the year ended December 31, 2014. The increase was primarily due to the compensation and
benefits for the additional employees employed following the acquisition of City Index, partially offset by the headcount
reductions effected in the third and fourth quarters of 2015.
Selling and marketing expenses for the retail segment increased $6.6 million, or 33.5%, for the year ended December 31, 2015, compared to the year ended December 31, 2014. The increase was primarily due to costs incurred to support additional brands
following the acquisition of City Index.
Referral fees for the retail segment increased $8.6 million, or 11.0%, for the year ended December 31, 2015, compared to the year ended December 31, 2014. The increase in referral fees was primarily due to increased trading volume introduced to us by
introducing brokers, primarily due to our acquisition of City Index, partially offset by lower average referral fees per million
paid to partners in respect of introduced trading volumes.
Other operating expenses for the retail segment increased $24.7 million, or 48.0%, for the year ended December 31, 2015, compared to the year ended December 31, 2014. The increase was primarily due to the acquisition of City Index. Other
operating expenses for the retail segment include general and administrative expenses, communication and technology
expenses and trading expenses.
Institutional Segment (amounts in thousands)
Year Ended December 31, | |||||||
2015 | 2014 | ||||||
Net revenue | 35,072 | 35,413 | |||||
Employee compensation and benefits | 15,305 | 13,963 | |||||
Selling and marketing | 138 | 120 | |||||
Other operating expenses | 9,573 | 10,939 | |||||
57
Segment profit | $ | 10,056 | $ | 10,391 | |||
Institutional segment net revenue was largely unchanged for the year ended December 31, 2015, compared to the year ended December 31, 2014. Institutional segment revenue for the year ended December 31, 2015 reflected a decrease in commission revenue of $3.6 million from our institutional sales and trading services, partially offset by growth in commissions revenue of $3.1 million from trading on our GTX platform, in each case as compared to the year ended December 31, 2014.
Employee compensation and benefits expenses for the institutional segment increased $1.3 million, or 9.6%, for the year ended December 31, 2015, compared to the year ended December 31, 2014. The increase was primarily due to additional employees hired during late 2014 to support our institutional segment operations.
Other operating expenses for the institutional segment decreased $1.4 million, or 12.5%, for the year ended December 31, 2015, compared to the year ended December 31, 2014. The decrease was primarily due to reduced platform operating costs following the purchase of the software and other intellectual property assets utilized to operate the electronic trading platform offered to customers in our GTX business. Other operating expenses from the institutional segment include general and administrative expenses, communication and technology expenses and trading expenses.
Futures Segment (amounts in thousands)
Year Ended December 31, | |||||||
2015 | 2014 | ||||||
Net revenue | $ | 45,797 | $ | 36,016 | |||
Employee compensation and benefits | 10,634 | 8,918 | |||||
Selling and marketing | 901 | 519 | |||||
Referral fees | 16,348 | 12,419 | |||||
Other operating expenses | 13,960 | 11,585 | |||||
Segment profit | $ | 3,954 | $ | 2,575 | |||
Futures segment net revenue increased $9.8 million, or 27.2%, for the year ended December 31, 2015, compared to the year ended December 31, 2014. The increase was primarily due to inclusion of full year results of GAA and Top Third, which were acquired in March 2014.
Employee compensation and benefits expenses for the futures segment increased $1.7 million, or 19.2%, for the year ended December 31, 2015, compared to the year ended December 31, 2014. The increase was primarily due to the inclusion of a full year of compensation and benefits for the additional employees employed following the acquisitions of GAA and Top Third in March 2014.
Selling and marketing expenses for the futures segment increased $0.4 million, or 73.6%, for the year ended December 31, 2015, compared to the year ended December 31, 2014. The increase was primarily due to the inclusion of a full year of selling and marketing expenses related to GAA and Top Third, in which we acquired controlling interests in March 2014.
Referral fees for the futures segment increased $3.9 million, or 31.6%, for the year ended December 31, 2015, compared to the year ended December 31, 2014. The increase was primarily due to the inclusion of a full year of referral fees for GAA and Top Third.
Other operating expenses for the futures segment increased $2.4 million, or 20.5%, for the year ended December 31, 2015, compared to the year ended December 31, 2014. The increase was primarily due to the inclusion of a full year of other operating expenses related to GAA and Top Third. Other operating expenses from the futures segment include general and administrative expenses, communication and technology expenses and trading expenses.
58
Corporate and Other (amounts in thousands)
Year Ended December 31, | |||||||
2015 | 2014 | ||||||
Other revenue | $ | (3,716 | ) | $ | 819 | ||
Employee compensation and benefits | 13,127 | 14,362 | |||||
Other operating expenses | 11,038 | 10,001 | |||||
Loss | $ | (27,881 | ) | $ | (23,544 | ) | |
Corporate and other revenue decreased $4.5 million for the year ended December 31, 2015, compared to the year ended December 31, 2014. The increase was primarily due to an adjustment to the recorded amount of contingent consideration relating to our Trade Facts acquisition, partially offset by foreign currency revaluations.
Employee compensation and benefits expenses for employees not attributed to any of our operating segments, such as our executive officers, decreased $1.2 million, or 8.6%, for the year ended December 31, 2015, compared to the year ended December 31, 2014.
Other operating expenses not attributed to any of our operating segments increased $1.0 million, or 10.4%, for the year ended December 31, 2015, compared to the year ended December 31, 2014. The increase was primarily due to an increase in indirect taxes primarily due to our acquisition of City Index.
Liquidity and Capital Resources
We have historically financed our liquidity and capital needs primarily through the use of funds generated from operations by our subsidiaries, the issuance of debt and equity securities, including the 4.125% Convertible Senior Notes due 2018 that we issued in the fourth quarter of 2013 and the 4.125% Convertible Senior Notes due 2020 that were issued in 2015 in connection with our acquisition of City Index, and access to secured lines of credit. We plan to finance our future operating liquidity and regulatory capital needs in a manner consistent with our past practice. We expect that our capital expenditures for the next 12 months will be consistent with our annual spend during 2016, as we continue to build out the technology platforms that were acquired as part of the City Index transaction.
We primarily hold and invest our cash at various financial institutions and in various investments, including cash held at banks, deposits at our liquidity providers and money market funds which invest in short-term U.S. government securities. In general, we believe all of our investments and deposits are of high credit quality and we have more than adequate liquidity to conduct our businesses.
The following table shows the amount of accumulated earnings held by our operating subsidiaries located outside the United States at December 31, 2016 (amounts in millions):
59
Entity Name | Accumulated Earnings | ||
GAIN Capital-Forex.com U.K., Ltd. | $ | 21.6 | |
GAIN Capital UK Ltd. | 37.4 | ||
GAIN Capital Japan Co., Ltd. | — | ||
GAIN Capital Forex.com Australia, Pty. Ltd. | — | ||
GAIN Capital-Forex.com Hong Kong, Ltd. | — | ||
GAIN Capital-Forex.com Canada Ltd. | — | ||
GAIN Capital Singapore Pte. Ltd. | — | ||
GAIN Capital Australia Pty Ltd. | 1.2 | ||
Trade Facts Ltd. | 3.4 | ||
GAIN Global Markets, Inc. | — | ||
Faraday Research LLP | 0.6 | ||
GTX Bermuda Ltd. | 12.7 | ||
Gain Global Markets Bermuda, Ltd. | — | ||
Total | $ | 76.9 | |
At December 31, 2016, we had approximately $76.9 million of undistributed earnings of our operating foreign subsidiaries indefinitely invested outside the United States. In connection with the previously announced restatement of our financial statements for the years ended December 31, 2014 and 2013 and certain quarters of 2015, we took a charge for U.S. taxes that would arise if $48.3 million of these earnings were repatriated to the United States. Accordingly, these funds could in fact be repatriated without the need to pay any additional U.S. taxes. The remaining earnings are indefinitely invested outside the United States and are expected to be reinvested in the working capital and other business needs of the foreign subsidiaries. If the remaining earnings had been repatriated into the United States as of December 31, 2016, in the form of dividends or otherwise, we would have been subject to additional income taxes of approximately $6.4 million.
Several of our operating subsidiaries are subject to requirements of regulatory bodies, including the CFTC and NFA in the United States, the FCA in the United Kingdom, the FSA, METI and MAFF in Japan, the SFC in Hong Kong, IIROC and the OSC in Canada and the CIMA in the Cayman Islands, relating to liquidity and capital standards, which limit funds available for the payment of dividends to GAIN Capital Holdings, Inc. As a result, we may be unable to access funds which are generated by our operating subsidiaries when we need them.
The following table illustrates the minimum regulatory capital our subsidiaries were required to maintain as of December 31, 2016 and the actual amounts of capital that were maintained on that date (amounts in millions):
Entity Name | Minimum Regulatory Capital Requirements | Capital Levels Maintained | Excess Net Capital | ||||||||
GAIN Capital Group, LLC | $ | 28.5 | $ | 48.0 | $ | 19.5 | |||||
GAIN Capital Forex.com Australia, Pty. Ltd. | 0.7 | 2.5 | 1.8 | ||||||||
GAIN Capital Securities, Inc. | 0.1 | 0.4 | 0.3 | ||||||||
Trade Facts, Ltd. | 0.5 | 3.6 | 3.1 | ||||||||
GAIN Capital-Forex.com Hong Kong, Ltd. | 1.9 | 3.5 | 1.6 | ||||||||
GAIN Capital Australia Pty Ltd. | 0.7 | 4.1 | 3.4 | ||||||||
GAIN Capital-Forex.com Canada Ltd. | 0.2 | 1.4 | 1.2 | ||||||||
GAIN Capital-Forex.com U.K., Ltd. | 6.4 | 29.9 | 23.5 | ||||||||
GAIN Capital Japan Co., Ltd. | 1.5 | 8.5 | 7.0 | ||||||||
GAIN Global Markets, Inc. | 0.1 | 1.3 | 1.2 | ||||||||
GAIN Capital UK, Ltd. | 71.9 | 159.4 | 87.5 | ||||||||
GAIN Capital Singapore Pte, Ltd. | 0.3 | 8.8 | 8.5 | ||||||||
60
Global Assets Advisors, LLC | 0.1 | 1.6 | 1.5 | ||||||||
GAIN Capital Payments Ltd. | 0.1 | 0.1 | — | ||||||||
Total | $ | 113.0 | $ | 273.1 | $ | 160.1 | |||||
Our futures commission merchant and forex dealer subsidiary, GCGL is subject to the Commodity Futures Trading Commission Net Capital Rule (Rule 1.17) and NFA Financial Requirements, Sections 11 and 12. Under applicable provisions of these regulations, GCGL is required to maintain adjusted net capital of the greater of $1.0 million or 8% of Customer and Non-Customer Maintenance Margin, or $20 million plus 5% of all liabilities owed to retail customers exceeding $10 million, plus 10% of all liabilities owed to eligible contract participant counterparties acting as a dealer that are not an affiliate. Net capital represents current assets less total liabilities as defined by CFTC Rule 1.17. GCGL's current assets primarily consist of cash and cash equivalents reported on its balance sheet as cash, receivables from brokers and trading securities, which are generally short-term U.S. government securities. GCGL's total liabilities include payables to customers, accrued expenses, accounts payable, sales and marketing expense payable, introducing broker fees payable and other liabilities. From net capital we take certain percentage deductions against assets held based on factors required by the Commodity Exchange Act to calculate adjusted net capital. GCGL's net capital and adjusted net capital changes from day to day. As of December 31, 2016, GCGL had net capital of approximately $48.0 million and net capital requirements of $28.5 million. As of December 31, 2016, GAIN Capital Group’s excess net capital was $19.5 million. We believe that we currently have sufficient capital to satisfy these on-going minimum net capital requirements. In accordance with CFTC regulation 1.12 and NFA Financial Requirements Section 1, a 20.0% decrease in GCGL’s net capital and a 30.0% decrease in excess net capital due to a planned equity withdrawal requires regulatory notification and/or approval.
GCUK1, GCUK2 and Trade Facts, all three together the U.K. Entities, are all registered in the U.K. and are regulated by the Financial Conduct Authority in respect of their trading activity. The U.K. Entities are required to comply with relevant U.K. and E.U. legislation. In addition they must comply with the rules and guidance contained in the FCA Handbook of rules and guidance, or FCA Handbook.
GCUK1, is regulated by the FCA, as a full scope €730k IFPRU Investment Firm. GCUK1 is required to maintain the greater of approximately $1.0 million (€730,000) or the Financial Resources Requirement, which is calculated as the sum of the firm’s operational, credit, counterparty, concentration, market and forex risk. At December 31, 2016, GCUK1 maintained $23.5 million more than the minimum required regulatory capital for a total of 4.7 times the required capital. Following the successful integration of City Index in the UK, GCUK1 no longer has any clients and is no longer conducting any operational activities. It is currently in the process of deregistering its licence with FCA. Until that time, GCUK1 will maintain its regulatory capital in line with requirements.
GCUK2, is regulated by the FCA as a full scope €730k IFPRU Investment Firm. GCUK2 is required to maintain the greater of approximately $1.0 million (€730,000) or the Financial Resources Requirement, which is calculated as the sum of the firm’s operational, credit, counterparty, concentration, market and forex risk. At December 31, 2016, GCUK2 maintained $87.5 million more than the minimum required regulatory capital for a total of 2.2 times the required capital.
Gain Capital Payments Ltd is regulated in the U.K by the FCA and is authorized to carry out Payment services under the Payment Services Regulations 2009. The regulatory capital must be the greater of either (i) $0.1 million (€125,000) or (ii) requirements determined by the ‘overhead scalar approach’. At December 31, 2016, Gain Capital Payments Limited maintained the minimum required regulatory capital.
Effective from January 1, 2016, the FCA has introduced the addition of a capital conservation buffer and a countercyclical capital buffer in line with the requirements set out in Capital Requirements Directive, or CRD IV, Article 160 Transitional Provisions for Capital Buffers. This will require all firms to maintain an additional buffer on top of the minimum capital requirements. The amount of required buffer, which is a percentage of the firm’s common equity tier 1 capital against the total risk exposure amount, will vary during a transitional period from January 1, 2016 to December 31, 2018. During that period, the minimum common equity tier 1 capital ratio requirement will increase from 5.125% to 5.75% in 2017, then 7.0% beginning on January 1, 2019. Given the nature of our UK-regulated firms activities, the effect of the countercyclical buffer is expected to be negligible.
Trade Facts, is regulated by the FCA as a BIPRU Limited License Firm. Trade Facts is required to maintain a base financial resources requirement of approximately $0.5 million (€0.05 million) and a capital requirement of the higher of either credit risk plus market risk or fixed overhead requirement. At December 31, 2016, Trade Facts maintained $3.1 million more than the minimum required regulatory capital for a total of 7.2 times the required capital.
61
In July 2010, Congress passed the Dodd-Frank Wall Street Reform and Consumer Protection Act, or the Dodd-Frank Act. A number of significant provisions contained in the law affect, or will affect once implementing regulations are adopted by the appropriate federal agencies, our business. Among other things, the Dodd-Frank Act provides for additional regulation of swaps and security-based swaps, including some types of foreign exchange and metals derivatives in which we engage. The Dodd-Frank Act requires the registration of swap dealers with the CFTC and imposes significant regulatory requirements on swap dealers and swap execution facilities. Effective February 27, 2013, GAIN GTX, LLC, became provisionally registered with the CFTC and NFA as a swap dealer. Effective June 2016, GTX SEF, LLC became permanently registered with the CFTC as a swap execution facility, replacing the temporary registration previously granted in April 2014. Certain of our other subsidiaries may be required to register, or may register voluntarily, as swap dealers and/or swap execution facilities.
Swap dealers and swap execution facilities are subject to a comprehensive regulatory regime with new obligations for the swaps activities for which they are registered, including adherence to risk management policies, supervisory procedures, trade record and real time reporting requirements, as well as proposed rules for new minimum capital requirements. GAIN GTX, LLC and GTX SEF, LLC have faced, and may continue to face, increased costs due to the registration and regulatory requirements listed above, as may any other of our subsidiaries that register as a swap dealer and/or swap execution facility. In particular, the CFTC has proposed rules that would require a swap-dealer to maintain regulatory capital of at least $20 million. Compliance with this or other swap-related regulatory capital requirements may require us to devote more capital to our GTX business or otherwise restructure our operations, such as by combining our GTX business with other regulated subsidiaries that must also satisfy regulatory capital requirements. The increased costs associated with compliance, and the changes that will be required in our OTC and clearing businesses, may adversely impact our results of operations, cash flows or financial condition.
We are required to maintain cash on deposit with our liquidity providers in order to conduct our hedging activities. As of December 31, 2016, we posted $61.1 million in cash with liquidity providers. As of December 31, 2016, our total client assets were $945.5 million. Total client assets represent amounts due to clients, including deposits and unrealized gains or losses arising from open positions.
The table set forth below provides a measure of our available free cash as of December 31, 2016 and 2015, respectively. We use this non-GAAP measure to evaluate our ability to continue to fund growth in our business (amounts in millions):
December 31, | December 31, | ||||||
2016 | 2015 | ||||||
Cash and cash equivalents | $ | 234.8 | $ | 171.9 | |||
Receivables from brokers | 61.1 | 121.2 | |||||
Net operating cash | 295.9 | 293.1 | |||||
Less: Minimum regulatory requirements | (113.0 | ) | (114.5 | ) | |||
Free Cash Available(1) | $ | 182.9 | $ | 178.6 | |||
(1) | Our Convertible Senior Notes due 2018 and 2020 are excluded given their long-dated maturity |
Convertible Senior Notes
On November 27, 2013, we issued $80 million aggregate principal amount of our 4.125% Convertible Senior Notes due 2018 in a private offering to qualified institutional buyers pursuant to Rule 144A under the Securities Act of 1933, as amended. The net proceeds from the note offering were approximately $77.2 million, after deducting discounts to the initial purchasers and estimated offering expenses payable by the company.
The notes bear interest at a fixed rate of 4.125% per year, payable semiannually in arrears on June 1 and December 1 of each year, beginning on June 1, 2014. The interest payment on the notes was approximately $3.3 million for the year ended December 31, 2014. The notes are convertible into cash, shares of our common stock, or a combination thereof, at our election. The notes will mature on December 1, 2018, unless earlier converted, redeemed or repurchased.
On April 1, 2015, as part of the consideration for our acquisition of City Index, we issued $60 million aggregate principal amount of our 4.125% Convertible Senior Notes due 2020 to City Index Group Limited. These notes bear interest at a fixed
62
rate of 4.125% per year, payable semiannually in arrears on April 1 and October 1 of each year, beginning on October 1, 2015. The notes are convertible into cash, shares of our common stock, or a combination thereof, at our election, subject to certain limitations. The notes will mature on April 1, 2020, unless earlier converted, redeemed or repurchased. We may not redeem the
notes until the two year period prior to the maturity date of the notes.
In May 2008, the FASB issued FASB Staff Position No. APB 14-1, Accounting for Convertible Debt Instruments That May Be Settled in Cash upon Conversion (Including Partial Cash Settlement), which has subsequently been codified as Accounting Standards Codification 470-20, Debt with Conversion and Other Options, or ASC 470-20. ASC 470-20 requires an entity to separately account for the liability and equity components of convertible debt instruments whose conversion may be settled entirely or partially in cash (such as our 4.125% Convertible Senior Notes and the convertible notes to be issued in connection with our acquisition of City Index) in a manner that reflects the issuer’s economic interest cost for non-convertible debt. The liability component of the notes is initially valued at the fair value of a similar debt instrument that does not have an associated equity component and, for our 4.125% Convertible Senior Notes, is reflected as a liability in our consolidated balance sheet in an amount equal to the fair value, which, as of December 31, 2016 and 2015, was $124.8 million and $121.7 million, respectively. The equity component of the notes is included in the additional paid-in capital section of our stockholders’ equity on our Consolidated Balance Sheets, and the value of the equity component is treated as original issue discount for purposes of accounting for the debt component. The equity component, as of December 31, 2016 and 2014, for our 4.125% Convertible Senior Notes was $12.1 million. This original issue discount is amortized to non-cash interest expense over the term of the notes, and, as a result, we record a greater amount of interest expense in current periods. Accordingly, we will report lower net income in our financial results than would have been recorded had we reflected only cash interest expense in our consolidated income statement because ASC 470-20 will require the interest expense associated with the notes to include both the current period’s amortization of the original issue discount and the notes’ cash coupon interest, which could adversely affect our reported or future financial results, the trading price of our common stock and the trading price of the notes.
In addition, under certain circumstances, convertible debt instruments whose conversion may be settled entirely or partly in cash (such as our 4.125% Convertible Senior Notes due 2018 and our 4.125% Convertible Senior Notes due 2020) are currently accounted for using the treasury stock method. Under this method, the shares issuable upon conversion of the notes are not included in the calculation of diluted earnings per share unless the conversion value of the notes exceeds their principal amount at the end of the relevant reporting period. If the conversion value exceeds their principal amount, then, for diluted earnings per share purposes, the notes are accounted for as if the number of shares of common stock that would be necessary to settle the excess, if we elected to settle the excess in shares, were issued.
Cash Flow
The following table sets forth a summary of our cash flow for each of the three years ended December 31, 2016 (amounts in thousands):
Year ended December 31, | |||||||||||
2016 | 2015 | 2014 | |||||||||
Net cash provided by operating activities | $ | 124,839 | $ | 77,213 | $ | 136,788 | |||||
Net cash used for investing activities | (31,327 | ) | (16,081 | ) | (35,463 | ) | |||||
Net cash used for financing activities | (21,175 | ) | (25,840 | ) | (5,938 | ) | |||||
Effect of exchange rate changes on cash and cash equivalents | (9,465 | ) | (2,755 | ) | 4,093 | ||||||
NET INCREASE IN CASH AND CASH EQUIVALENTS | $ | 62,872 | $ | 32,537 | $ | 99,480 | |||||
The primary drivers of our cash flow provided by/(used for) operating activities are net income, adjusted for non-cash charges, such as depreciation and amortization, and amounts posted as collateral with liquidity providers.
Our largest operating expenses are employee compensation and benefits, marketing and referral fees. Employee compensation and benefits include salaries, bonuses and other employee related costs as well as commissions paid to certain sales personnel. Marketing expenses consist primarily of selling and promotional costs to support our retail, institutional and futures brands. Referral fees consist primarily of payments made to our white label partners and introducing brokers.
Unrealized gains and losses on cash positions revalued at prevailing foreign currency exchange rates are included in trading revenue but have no direct impact on cash flow from operations. Gains and losses become realized and impact cash flow from operations when customer transactions are liquidated. To some extent, the amount of net deposits made by our customers in any
63
given period is influenced by unrealized gains and losses because our customers’ trading positions are impacted by unrealized gains and losses and our customers may be required to post additional funds to maintain open positions or may choose to withdraw excess funds on open positions.
Year Ended December 31, 2016 Compared to Year Ended December 31, 2015
Cash provided by operating activities was $124.8 million for the year ended December 31, 2016, compared to $77.2 million provided by operating activities for the year ended December 31, 2015. Non-cash integration costs decreased approximately $26.5 million due to the acceleration of the amortization of the GFT platform in the year ended December 31, 2015. This was offset by an increase in cash provided by deferred taxes of $8.9 million for the year ended December 31, 2016.
Cash used for investing activities was $31.3 million for the year ended December 31, 2016, compared to $16.1 million used for investing activities in the year ended December 31, 2015. Cash used for acquisitions and for the purchase of intangible assets increased approximately $3.3 million, which was offset by the purchase of an additional 24% ownership interest in each of GAA and TT for an aggregate purchase price of $7.4 million and a decrease of $7.6 million in cash received in the City acquisition in 2015. Cash used for the purchase of property and equipment increased $4.2 million.
Cash used for financing activities was $21.2 million for the year ended December 31, 2016, compared to $25.8 million used for financing activities for the year ended December 31, 2015. Cash used in acquisitions decreased $13.9 million as the City Index acquisition closed in 2015 and there were no acquisitions in 2016. In addition, cash used for tax benefit from employee stock option exercises increased $1.1 million, cash used for the purchase of treasury stock increased $3.9 million due to our stock repurchase activities for the year ended December 31, 2016, and cash used for the repurchase of the convertible notes increased $1.7 million due to the note buy backs for the year ended December 31, 2016.
Year Ended December 31, 2015 Compared to Year Ended December 31, 2014
Cash provided by operating activities was $77.2 million for the year ended December 31, 2015, compared to $136.8 million provided by operating activities for the year ended December 31, 2014. Our cash provided by operating activities for the year ended December 31, 2014 was primarily related to the change in the manner in which we viewed amounts posted with our liquidity providers in excess of applicable collateral requirements.
Cash used for investing activities was $16.1 million for the year ended December 31, 2015, compared to $35.5 million used for investing activities in the year ended December 31, 2014. Cash used for acquisitions and for the purchase of intangible assets decreased approximately $11.7 million and $12.4 million, respectively, period over period. Cash used for the purchase of property and equipment increased $10.9 million.
Cash used for financing activities was $25.8 million for the year ended December 31, 2015, compared to $5.9 million used for financing activities for the year ended December 31, 2014. Cash used for contractual payments of acquisition increased $13.9 million, cash used for tax benefit from employee stock option exercises increased $0.1 million, cash used for the purchase of treasury stock increased $3.8 million, and cash used for the dividend payments increased $1.4 million.
Capital Expenditures
Capital expenditures were $23.9 million for the year ended December 31, 2016, compared to $19.7 million for the year ended December 31, 2015 and $8.8 million for the year ended December 31, 2014. Capital expenditures for the years ended December 31, 2016, 2015, and 2014 were primarily related to the development of various trading platforms and websites, including the build out of the technology trading platforms, with expenditures increasing each year due to hardware upgrades required to support our increasing customer base, as well as software upgrades relating to our ongoing platform development.
Off-Balance-Sheet Arrangements
At December 31, 2016 and 2015 we did not have any relationships with unconsolidated entities or financial partnerships, such as entities often referred to as structured finance or special purpose entities, which would have been established for the purpose of facilitating off-balance sheet arrangements or other contractually narrow or limited purposes.
Contractual Obligations
The following table sets forth our contractual obligations as of December 31, 2016. (Amounts in thousands):
64
Less than | 1-3 | 3-5 | More than | ||||||||||||||||
Total | 1 Year | Years | Years | 5 Years | |||||||||||||||
Purchase Obligations | $ | 7,879 | $ | 7,841 | $ | 37 | $ | 1 | $ | — | |||||||||
Operating Leases | 28,922 | 5,107 | 7,996 | 6,976 | 8,843 | ||||||||||||||
Total | $ | 36,801 | $ | 12,948 | $ | 8,033 | $ | 6,977 | $ | 8,843 | |||||||||
The amounts reported above for "Purchase Obligations" are calculated to include mandatory pre-cancellation notice periods, if any. Excluded from the amounts set forth above are obligations relating to the $80 million in principal amount of our 4.125% Convertible Senior Notes due 2018 that we issued in the fourth quarter of 2013 and the $60 million in principal amount of our 4.125% Convertible Senior Notes due 2020 that were issued in 2015 in connection with our acquisition of City Index, as our obligations under these Convertible Senior Notes are not certain to be settled in cash. By their terms, these Convertible Senior Notes may be settled in cash, shares of our common stock or in a combination of shares and cash at our discretion. Purchase obligations due in less than one year primarily consist of agreements with service providers related to maintenance, data, system support, and network services.
Critical Accounting Policies and Estimates
Our consolidated financial statements and accompanying notes have been prepared in accordance with GAAP applied on a consistent basis. The preparation of these financial statements requires us to make certain estimates and assumptions that affect the reported amounts of assets and liabilities, disclosure of contingent assets and liabilities at the date of the financial statements and the reported amounts of revenue and expenses during the periods presented. We evaluate these estimates and assumptions on an ongoing basis. We base our estimates on the information currently available to us and on various other assumptions that we believe to be reasonable under the circumstances. Actual results may differ from these estimates under different assumptions or conditions.
An accounting policy is deemed to be critical if it requires an accounting estimate to be made based on assumptions about matters that are highly uncertain at the time the estimate is made; if different estimates reasonably could have been used; or if changes in the estimate that are reasonably likely to occur periodically could materially impact the financial statements. While our significant accounting policies are described in more detail in the notes to our consolidated financial statements included in this annual report, we believe the following accounting policies are critical to the estimates and assumptions used in the preparation of our consolidated financial statements.
Revenue Recognition
Retail revenue comprises trading and commission revenue from our retail segment. OTC trading includes forex trading, metals trading, CFDs and spread-betting (in markets which do not prohibit such transactions), as well as other financial products.
Gains or losses are realized when customer transactions are liquidated. Unrealized gains or losses on trading positions are revalued at prevailing foreign currency exchange rates (the difference between contract price and market price) at the date of the balance sheet and are included in Receivables brokers as well as Payables to customers on the Consolidated Balance Sheets. Changes in net unrealized gains or losses are recorded in Retail revenue on the Consolidated Statements of Income and Comprehensive Income. Retail revenue is recorded on a trade date basis.
Institutional revenue consists of revenue from our institutional segment, which provides a proprietary trading platform and sales and trading services to institutions. Revenue from the institutional segment is generated primarily through commissions or spreads on trades executed on the GTX platform or by voice-brokers. We act as an agent for the trades executed on the GTX platform and therefore do not assume any market or credit risk in connection with those transactions. Revenues are booked on a trade date basis.
Futures revenue consists of revenue from our futures segment, which offers exchange-based trading execution services, focusing on the indices, agricultural hedging, and commodities sectors. Revenues in this business are generated through commissions, which are earned for executing our customers' trades. These revenues are booked on a trade date basis. We act in an agency capacity with respect to the clearing of trades, but as a principal with respect to fees paid to introducing brokers in the futures business. Therefore, we take no market risk in this business.
Income Taxes
65
Current income tax is calculated on the basis of the tax laws enacted or substantially enacted at the year-end in the countries where we operate and generate taxable income.
Deferred income tax expenses are provided using the asset and liability method, under which deferred tax assets and liabilities are determined based upon the temporary differences between the consolidated financial statements and the income tax basis, using currently enacted tax rates. The effect on deferred tax assets and liabilities of a change in tax rates is recognized in our Consolidated Statements of Income and Comprehensive Income in the period of enactment. We routinely evaluate all deferred tax assets to determine the likelihood of their realization.
We use estimates in determining income tax positions under ASC 740-10-25, Income Taxes. Although we believe that our tax estimates are reasonable, the ultimate tax determination involves significant judgment and is subject to audit by tax authorities in the ordinary course of business.
To the extent we are required to pay amounts in excess of our reserves, our effective income tax rate in a given financial statement period could be materially affected. An unfavorable tax settlement could require use of our cash and result in an increase in our effective income tax rate in the period of resolution.
In accordance with ASC 740, we evaluate a tax position to determine whether it is more likely than not that the tax position will be sustained upon examination, based on the technical merits of the position. If the position does not meet a more likely than not threshold, a tax reserve is established and no income tax benefit is recognized. We are audited by U.S. federal and state, as well as foreign, tax authorities. In some cases, many years may elapse before a tax return containing tax positions for which an ASC 740 reserve has been established is examined and an audit is completed. As audit settlements are reached, we adjust the corresponding reserves, if required, in the period in which the final determination is made. While it is difficult to predict the final outcome or timing of a particular tax matter, we believe that our reserves for uncertain tax positions are recorded pursuant to the provisions of ASC 740.
We operate a permanent reinvestment strategy, under which earnings derived from foreign business remain invested in the Company’s foreign subsidiaries. We have no plans to repatriate these earnings.
Goodwill and Intangible Assets
Relevant accounting guidance requires purchased intangible assets other than goodwill to be amortized over their useful lives unless the useful lives are determined to be indefinite. If the assets are determined to have a finite life in the future, we will amortize the carrying value over the remaining useful life at that time. Our URLs (foreignexchange.com and forex.com) are indefinite life intangible assets and are, therefore, not amortized. We compare the recorded value of the indefinite life intangible assets to their fair value on an annual basis and whenever circumstances arise that indicate that an impairment may have occurred. In accordance with relevant accounting guidance, we test goodwill for impairment on an annual basis during the fourth quarter and on an interim basis when conditions indicate impairment may have occurred. When testing for goodwill impairment, the Company first assesses qualitative factors to determine whether the existence of events or circumstances leads to a determination that it is more likely than not that the fair value of a reporting unit is less than its carrying amount. If the Company concludes it is more likely than not that the fair value of a reporting unit is less than its carrying amount, a quantitative fair value test is performed using a two-step impairment test. We performed our annual test for goodwill impairment in the fourth quarter of 2016 and noted there was no impairment.
Share Based Payments
ASC 718-10, Compensation – Stock Compensation, requires measurement of share based payment arrangements at fair value and recognition of compensation cost over the service period, net of estimated forfeitures. The fair value of restricted stock units is determined based on the number of units granted and the grant date fair value of GAIN Capital Holding, Inc.’s common stock.
We measure the fair value of stock options on the date of grant using the Black-Scholes option pricing model which requires the use of several estimates, including:
• | The volatility of our stock price; |
• | The expected life of the option; |
• | Risk free interest rates; and |
• | Expected dividend yield. |
66
The use of different assumptions in the Black-Scholes pricing model would result in different amounts of stock-based compensation expense. Furthermore, if different assumptions are used in future periods, stock-based compensation expense could be materially impacted in the future.
The average risk free rate is based upon the five year bond rate converted to a continuously compounded interest rate.
Recent Accounting Pronouncements
In February 2016, the FASB issued new guidance regarding the accounting for leases. The FASB issued this update to increase transparency and comparability among organizations by recognizing lease assets and lease liabilities on the balance sheet and disclosing key information about leasing arrangements. The guidance is effective for fiscal years beginning after December 15, 2018, including interim periods within those fiscal year. We are currently assessing the impact on our consolidated financial statements of adopting this guidance.
In September 2015, FASB issued new guidance regarding the accounting for provisional adjustments of business combinations. The guidance states that if changes are required to be made to provisional amounts included in previously issued financial statements, such changes should be included in the period in which they are identified. These changes include adjustments to goodwill, as well as the cumulative impact of adjustments for depreciation, amortization or other income. The guidance is effective for annual periods beginning after December 15, 2015, including interim periods within that reporting period. This guidance will impact how we deal with provisional adjustments for future business combinations following adoption.
In April 2015, the FASB issued new guidance regarding the accounting for debt issuance costs. The guidance requires presenting any deferred financing costs from debt issuances as a reduction in the amount of debt included on the balance sheet, which is a change from currently applicable rules requiring such costs to be classified as assets. In August 2015, the FASB issued updated guidance, which incorporated an SEC staff announcement highlighting that costs incurred for line-of-credit arrangements could be recorded as assets and amortized ratably over the term of the line-of-credit arrangement (regardless of whether there are any outstanding borrowings). The guidance is effective for interim and annual periods beginning after December 15, 2015. Early adoption is permitted for financial statements that have not been previously issued. This guidance does not have a material impact on our consolidated financial statements.
In May 2014, the FASB issued new revenue recognition guidance that superseded the previously existing revenue recognition guidance and most industry-specific guidance applicable to revenue recognition. The guidance requires recognizing revenue when transferring promised goods or services to customers. Recognition should reflect the consideration which the company expects to receive in exchange for those goods or services. The guidance requires enhanced disclosures to help financial statement users better understand the nature, amount, timing and uncertainty of the revenues that are recognized. The guidance is effective for interim reporting periods within annual reporting periods beginning after December 15, 2017, which is a one year deferral from the original guidance, approved by the FASB in July 2015. Early application is permitted for annual periods beginning after December 15, 2016, including interim periods within that reporting period. We are currently assessing the impact on our consolidated financial statements of adopting this guidance.
ITEM 7A. QUANTITATIVE AND QUALITATIVE DISCLOSURES ABOUT MARKET RISK
Interest Rate Risk
Interest rate risk arises from the possibility that changes in interest rates will impact our consolidated financial statements. Our net interest revenue is directly affected by the short-term interest rates we earn from re-investing our cash and our customer’s cash. As a result, a portion of our interest income will decline if interest rates fall. Short-term interest rates are highly sensitive to factors that are beyond our control, including general economic conditions and the policies of various governmental and regulatory authorities. Our cash and cash equivalents and customer cash and cash equivalents are held in cash and cash equivalents including cash at banks, deposits at liquidity providers, in money market funds that invest in short-term U.S. government securities and in United States and Canadian Imperial Bank of Commerce treasury bills. The interest rates earned on these deposits and investments affects our interest revenue. We estimate that as of December 31, 2016, an immediate 100 basis point increase in short-term interest rates would result in approximately $10.7 million more in annual pretax income.
67
Foreign Currency Risk
Currency risk arises from the possibility that fluctuations in foreign exchange rates will impact the value of our earnings and assets. Entities that have assets and liabilities denominated in currencies other than the primary economic environment in which the entity operates are subject to re-translation.
We monitor our exchange rate exposure and may make settlements to reduce our exposure. We do not take proprietary directional market positions.
Virtually all sales and related operating costs are denominated in the currency of the local country and translated into USD for consolidated reporting purposes. Although the majority of the assets and liabilities of these subsidiaries are denominated in the functional currency of the subsidiary, they may also hold assets or liabilities denominated in other currencies. These items may give rise to foreign currency transaction gains and losses. As a result, our results of operations and financial position are exposed to changing currency exchange rates. We may consider entering into hedging transactions to mitigate our exposure to foreign currency exchange rates. These hedging transactions may not be successful.
Credit Risk
Our trading operations require a commitment of our capital and involve risk of loss because of the potential that a customer’s losses may exceed the amount of cash in their account. While we are able to closely monitor each customer’s exposure, it does not guarantee our ability to eliminate negative customer account balances prior to an adverse currency price change or other market events, such as the extreme volatility in the Swiss franc following the SNB market event in January 2015. Changes in market conditions or unforeseen extreme market events could result in our customers experiencing losses in excess of the funds they have deposited with us. In such an event, we may not be able to recover the negative client equity from our customers, which could materially adversely affect our results of operations. In addition, if we cannot recover funds from our customers, we may nonetheless be required to fund positions we hold with our liquidity providers or other third parties and, in such an event, our available funds may not be sufficient to meet our obligations to these third parties, which could materially adversely affect our business, financial condition, results of operations and cash flows.
In order to help mitigate this risk, we require that each trade must be collateralized in accordance with our margin policies described below. Each customer is required to have minimum funds in their account for opening positions, which we refer to as the initial margin, and for maintaining positions, which we refer to as maintenance margin, depending on the product being traded. Margin requirements are expressed as a percentage of the customer’s total position in that product, and the customer’s total margin requirement is based on the aggregate margin requirement across all of the positions that a customer holds at any one moment in time. Each net position in a particular product is margined separately. Accordingly, we do not net across different positions, thereby following a more conservative margin policy. Our systems automatically monitor each customer’s margin requirements in real time, and we confirm that each of our customers has sufficient cash collateral in his or her account before we execute their trades. We may also adjust required customer margins (both initial and maintenance) from time to time based on our monitoring of various factors, including volatility and liquidity. If at any point in time a customer's trading position does not comply with the applicable margin requirement, the position may be automatically liquidated, partially or entirely, in accordance with our margin policies and procedures. This policy protects both us and the customer. Our margin and liquidation policies are set forth in our customer agreements.
We are also exposed to potential credit risk relating to the counterparties with which we hedge our trades and the financial institutions with which we deposit cash. We mitigate these risks by transacting with several of the largest financial institutions in the world. In the event that our access to one or more financial institutions becomes limited, our ability to hedge may be impaired.
68
Market Risk
We are exposed to market risk in connection with our retail trading activities. Because we act as counterparty to our retail customers’ transactions, we are exposed to risk on each trade that the market price of our position will decline. Accordingly, accurate and efficient management of our net exposure is a high priority, and as such we have developed both automated and manual policies and procedures to manage our exposure. These risk-management policies and procedures are established and reviewed regularly by the Risk Committee of our Board of Directors. Our risk-management policies require quantitative analyses by instrument pair, as well as assessment of a range of market inputs, including trade size, dealing rate, customer margin and market liquidity. Our risk-management procedures require our team of senior traders to monitor risk exposure on a continuous basis and update senior management both informally over the course of the trading day and formally through intraday and end of day reporting. A key component of our approach to managing market risk is that we do not initiate market positions for our own account in anticipation of future movements in the relative prices of products we offer. To facilitate our risk-management activities, we maintain levels of capital in excess of those currently required under applicable regulations. As of December 31, 2016, we maintained capital levels of $273.1 million, which represented approximately 2.4 times the capital we were required to hold under applicable regulations.
Cash Liquidity Risk
In normal conditions, our market making business and related services is self financing as we generate sufficient cash flows to pay our expenses as they become due. As a result, we generally do not face the risk that we will be unable to raise cash quickly enough to meet our payment obligations as they arise. Our cash flows, however, are influenced by customer trading volume, currency volatility and liquidity in foreign currencies pairs in which we have positions. These factors are directly impacted by domestic and international market and economic conditions that are beyond our control. In an effort to manage this risk, we have secured a substantial liquidity pool by establishing trading relationships with several financial institutions. These relationships provide us with sufficient access to liquidity to allow us to consistently execute significant trades in varying market conditions at the notional amounts our customers desire by providing us with as much as 50:1 leverage on the notional amounts of our available collateral we have on deposit with such financial institutions. We generally maintain collateral on deposit, which includes our funds and our customers’ funds, with our liquidity providers. Collateral on deposit ranged from $93.8 million to $331.3 million in the aggregate, during the year ended December 31, 2016.
In addition, our trading operations involve the risk of losses due to the potential failure of our customers to perform their obligations under the transactions we enter into with them, which increases our exposure to cash liquidity risk. To reduce this risk, our margin policy requires that we mark our customers’ accounts to market each time the market price of a position in their portfolio changes and provides for automatic liquidation of positions, as described above.
Operational Risk
Our operations are subject to broad and various risks resulting from technological interruptions, failures or capacity constraints in addition to risks involving human error or misconduct. Regarding technological risks, we are heavily dependent on the capacity and reliability of the computer and communications systems supporting our operations. Our computer infrastructure is potentially vulnerable to physical or electronic computer break-ins, viruses and similar disruptive problems and security breaches. We have established a program to monitor our computer systems, platforms and related technologies and to promptly address issues that arise. We have also established disaster recovery facilities in strategic locations to ensure that we can continue to operate with limited interruptions in the event that our primary systems are damaged. As with our technological systems, we have established policies and procedures designed to monitor and prevent both human errors, such as clerical mistakes or incorrectly placed trades, as well as human misconduct, such as unauthorized trading, fraud or negligence. In addition, we seek to mitigate the impact of any operational issues by maintaining insurance coverage for various contingencies.
Regulatory Capital Risk
Various domestic and foreign government bodies and self-regulatory organizations responsible for overseeing our business activities require that we maintain specified minimum levels of regulatory capital in our operating subsidiaries. If not properly monitored or adjusted, our regulatory capital levels could fall below the required minimum amounts set by our regulators, which could expose us to various sanctions ranging from fines and censure to imposing partial or complete restrictions on our ability to conduct business. To mitigate this risk, we continuously evaluate the levels of regulatory capital at each of our operating subsidiaries and adjust the amounts of regulatory capital in each operating subsidiary as necessary to ensure compliance with all regulatory capital requirements. These requirements may increase or decrease from time to time as required by regulatory authorities. We also maintain excess regulatory capital to provide liquidity during periods of unusual or
69
unforeseen market volatility, and we intend to continue to follow this policy. In addition, we monitor regulatory developments regarding capital requirements so that we may be prepared for increases in the required minimum levels of regulatory capital that may occur from time to time in the future.
Regulatory Risk
We operate in a highly regulated industry and are subject to the risk of sanctions from U.S., federal and state, and international authorities if we fail to comply adequately with regulatory requirements. Failure to comply with applicable regulations could result in financial, operational and other penalties. Our authority to conduct business could be suspended or revoked. In addition, efforts to comply with applicable regulations may increase our costs or limit our ability to pursue certain business opportunities. Federal and state regulations significantly limit the types of activities in which we may engage. Please refer to "Item 1A. Risk Factors - Risks Related to Regulation" elsewhere in this Annual Report for more information.
ITEM 8. FINANCIAL STATEMENTS AND SUPPLEMENTARY DATA
Our consolidated financial statements are included in pages F-1 to F-58 of this Annual Report on Form 10-K.
ITEM 9. CHANGES AND DISAGREEMENTS WITH ACCOUNTANTS ON ACCOUNTING AND FINANCIAL DISCLOSURE
None.
ITEM 9A. CONTROLS AND PROCEDURES
(a) Evaluation of Disclosure Controls and Procedures
The Company maintains disclosure controls and procedures that are designed to ensure that information required to be disclosed in the Company’s reports under the Securities Exchange Act of 1934, as amended (the “Exchange Act”), is recorded, processed, summarized and reported within the time periods specified in the SEC’s rules and forms, and that such information is accumulated and communicated to management, including our Chief Executive Officer (“CEO”) and Chief Financial Officer (“CFO”) as appropriate, to allow timely decisions regarding required disclosure.
Management of the Company, with the participation of its CEO and CFO, evaluated the effectiveness of the Company’s disclosure controls and procedures. Based on their evaluation, as of the end of the period covered by this Form 10-K, the Company’s CEO and CFO have concluded that the Company’s disclosure controls and procedures (as defined in Rules 13a-15(e) and 15d-15(e) under the Securities Exchange Act of 1934, as amended) were effective.
(b) Management’s Report On Internal Control Over Financial Reporting
Management is responsible for establishing and maintaining adequate internal control over financial reporting. Internal control over financial reporting is defined in Rules 13a-15(f) and 15d-15(f) promulgated under the Exchange Act as a process designed by, or under the supervision of, our principal executive and principal financial officers and is affected by the Company’s Board of Directors, management and other personnel, to provide reasonable assurance regarding the reliability of financial reporting and the preparation of financial statements for external purposes in accordance with generally accepted accounting principles (“GAAP”) and includes those policies and procedures that:
• | Pertain to the maintenance of records that, in reasonable detail, accurately and fairly reflect our transactions and dispositions of our assets; |
• | Provide reasonable assurance that transactions are recorded as necessary to permit preparation of our financial statements in accordance with GAAP, and that our receipts and expenditures are being made only in accordance with authorizations of management and directors of the Company; and |
• | Provide reasonable assurance regarding prevention or timely detection of unauthorized acquisition, use or disposition of our assets that could have a material effect on the financial statements. |
Because of its inherent limitations, a system of internal control over financial reporting can provide only reasonable assurance and may not prevent or detect misstatements. Further, because of changes in conditions, effectiveness of internal controls over financial reporting may vary over time. Our system contains self-monitoring mechanisms, and actions are taken to correct deficiencies as they are identified.
70
Management assessed the effectiveness of the Company’s internal control over financial reporting as of December 31, 2016. In making this assessment, management used the criteria set forth by the Committee of Sponsoring Organizations of the Treadway Commission (COSO) in Internal Control-Integrated Framework (2013). Based on this assessment, management, including the Company’s CEO and CFO, concluded that our internal control over financial reporting was effective as of December 31, 2016.
Our independent registered public accounting firm has audited and issued a report on the effectiveness of our internal control over financial reporting as of December 31, 2016, which appears elsewhere in this Annual Report on Form 10-K.
(c) Changes in Internal Control Over Financial Reporting
On March 17, 2016, the Company filed the December 31, 2015 Form 10-K indicating that the Company had determined that there were material errors in the manner in which the Company accounted for income taxes for the years ended December 31, 2013 and 2014 and for certain quarters of 2015 under ASC 740, “Income Taxes”. These errors related primarily to the manner in which certain intercompany payables and receivables between domestic and overseas subsidiaries of the Company were treated for accounting and tax purposes during the impacted periods. Accordingly, management, including the Company’s CEO and CFO, concluded that a material weakness in internal control over financial reporting existed as of December 31, 2015.
Since identifying the material weakness in its internal controls over financial reporting discussed above, the Company introduced new preventive policies and detective controls requiring review and approval of all cash movements as well as the accounting for and tax treatment of intercompany payables and receivables, particularly those between domestic and overseas subsidiaries. The Company believes the new preventive policy requiring approval by the Global Head of Tax for all intercompany cash transfers reduces the likelihood of impermissible cash transfers and bookings, while the Company believes the new detective controls requiring both a pre- and post-quarter close review of all intercompany balances for settlement will safeguard that any impermissible intercompany balance or bookings are cleared or corrected prior to the end of any financial statement period. These new procedures were put in place during 2016, and the Company's management considered these remedial measures in performing its evaluation of the Company's internal control over financial reporting described above. During the fourth quarter of 2016, there were no additional changes in the Company's internal control over financial reporting that materially affected, or are reasonably likely to materially affect, our internal control over financial reporting.
71
REPORT OF INDEPENDENT REGISTERED PUBLIC ACCOUNTING FIRM
To the Board of Directors and Shareholders of
GAIN Capital Holdings, Inc.
We have audited GAIN Capital Holdings, Inc.’s (the “Company”) internal control over financial reporting as of December 31, 2016, based on criteria established in Internal Control - Integrated Framework (2013) issued by the Committee of Sponsoring Organizations of the Treadway Commission (COSO). The Company’s management is responsible for maintaining effective internal control over financial reporting and for its assessment of the effectiveness of internal control over financial reporting, included in the accompanying Management’s Report on Internal Control Over Financial Reporting. Our responsibility is to express an opinion on the Company’s internal control over financial reporting based on our audit.
We conducted our audit in accordance with the standards of the Public Company Accounting Oversight Board (United States). Those standards require that we plan and perform the audit to obtain reasonable assurance about whether effective internal control over financial reporting was maintained in all material respects. Our audit included obtaining an understanding of internal control over financial reporting, assessing the risk that a material weakness exists, and testing and evaluating the design and operating effectiveness of internal control based on the assessed risk. Our audit also included performing such other procedures as we considered necessary in the circumstances. We believe that our audit provides a reasonable basis for our opinion.
A company’s internal control over financial reporting is a process designed to provide reasonable assurance regarding the reliability of financial reporting and the preparation of financial statements for external purposes in accordance with generally accepted accounting principles. A company’s internal control over financial reporting includes those policies and procedures that (1) pertain to the maintenance of records that, in reasonable detail, accurately and fairly reflect the transactions and dispositions of the assets of the company; (2) provide reasonable assurance that transactions are recorded as necessary to permit preparation of financial statements in accordance with generally accepted accounting principles, and that receipts and expenditures of the company are being made only in accordance with authorizations of management and directors of the company; and (3) provide reasonable assurance regarding prevention or timely detection of unauthorized acquisition, use, or disposition of the company’s assets that could have a material effect on the financial statements.
Because of its inherent limitations, internal control over financial reporting may not prevent or detect misstatements. Also, projections of any evaluation of effectiveness to future periods are subject to the risk that controls may become inadequate because of changes in conditions, or that the degree of compliance with the policies or procedures may deteriorate.
In our opinion, GAIN Capital Holdings, Inc. maintained, in all material respects, effective internal control over financial reporting as of December 31, 2016, based on criteria established in Internal Control - Integrated Framework (2013) issued by the Committee of Sponsoring Organizations of the Treadway Commission (COSO).
We also have audited, in accordance with the standards of the Public Company Accounting Oversight Board (United States), the consolidated balance sheet of GAIN Capital Holdings, Inc. and subsidiaries as of December 31, 2016, and the related consolidated statements of income and comprehensive income, changes in shareholders’ equity, and cash flows for the year then ended, and our report dated March 15, 2017 expressed an unqualified opinion on those consolidated financial statements.
/s/ KPMG LLP
New York, New York
March 15, 2017
72
ITEM 9B. OTHER INFORMATION
None.
73
PART III
ITEM 10. DIRECTORS, EXECUTIVE OFFICERS AND CORPORATE GOVERNANCE
Information required to be included in this item is incorporated by reference to our definitive proxy statement to be filed pursuant to Regulation 14A, which we intend to file within 120 days of the end of our fiscal year.
Our Code of Business Conduct and Ethics (the “Code”) applies to all of our employees, directors and officers, including our principal executive officer, principal financial officer and principal accounting officer, or persons performing similar functions. We make the Code available free of charge through our investor relations website, which is located at ir.gaincapital.com. We intend to disclose any amendments to, or waivers from, the Code that are required to be publicly disclosed pursuant to rules of the SEC and the New York Stock Exchange in filings with the SEC and by posting such information on our website.
ITEM 11. EXECUTIVE COMPENSATION
Information required to be included in this item is incorporated by reference to our definitive proxy statement to be filed pursuant to Regulation 14A, which we intend to file within 120 days of the end of our fiscal year.
ITEM 12. SECURITY OWNERSHIP OF CERTAIN BENEFICIAL OWNERS AND MANAGEMENT AND RELATED STOCKHOLDER MATTERS
Information required to be included in this item is incorporated by reference to our proxy statement to be filed pursuant to Regulation 14A, which we intend to file within 120 days of the end of our fiscal year.
ITEM 13. CERTAIN RELATIONSHIPS AND RELATED TRANSACTIONS, AND DIRECTOR INDEPENDENCE
Information required to be included in this item is incorporated by reference to our proxy statement to be filed pursuant to Regulation 14A, which we intend to file within 120 days of the end of our fiscal year.
ITEM 14. PRINCIPAL ACCOUNTANT FEES AND SERVICES
Information to be included in this item is incorporated by reference to our proxy statement to be filed pursuant to Regulation 14A, which we intend to file within 120 days of the end of our fiscal year.
74
PART IV
ITEM 15. EXHIBITS AND FINANCIAL STATEMENT SCHEDULES
Financial Statements and Schedules:
1. Financial Statements
The following financial statements and reports of independent registered public accounting firm are included herein:
Reports of Independent Registered Public Accounting Firms | F-2 |
Consolidated Balance Sheets as of December 31, 2016 and 2015 | F-4 |
Consolidated Statements of Income and Comprehensive Income for the Years Ended December 31, 2016, 2015 and 2014 | F-5 |
Consolidated Statements of Changes in Shareholders' Equity for the Years Ended December 31, 2016, 2015 and 2014 | F-6 |
Consolidated Statements of Cash Flows for the Years Ended December 31, 2016, 2015 and 2014 | F-8 |
Notes to Consolidated Financial Statements | F-10 |
2. Financial Statement Schedules
The following supplemental schedule is filed herewith:
Schedule I - Condensed Financial Information of GAIN Capital Holdings, Inc, (Parent Company Only) as of December 31, 2016 and 2015 and for the Years ended December 31, 2016, 2015 and 2014 | F-58 |
Schedules other than those listed above have been omitted because they are not applicable or the required
information is included in the financial statements or notes thereto.
75
INDEX TO
CONSOLIDATED FINANCIAL STATEMENTS AND
FINANCIAL STATEMENT SCHEDULE
Consolidated Financial Statements: | |
Reports of Independent Registered Public Accounting Firms | F-2 |
Consolidated Balance Sheets as of December 31, 2016 and 2015 | F-4 |
Consolidated Statements of Income and Comprehensive Income for the Years Ended December 31, 2016, 2015, and 2014 | F-5 |
Consolidated Statements of Changes in Shareholders' Equity for the Years Ended December 31, 2016, 2015, and 2014 | F-6 |
Consolidated Statements of Cash Flows for the Years Ended December 31, 2016, 2015, and 2014 | F-8 |
Notes to Consolidated Financial Statements | F-10 |
Financial Statement Schedule: | |
Schedule I - Condensed Financial Information of GAIN Capital Holdings, Inc. (Parent Company Only) as of December 31, 2016 and 2015 and for the Years ended December 31, 2016, 2015 and 2014 | F-58 |
F-1
REPORT OF INDEPENDENT REGISTERED PUBLIC ACCOUNTING FIRM
To the Board of Directors and Shareholders of
GAIN Capital Holdings, Inc.
We have audited the accompanying consolidated balance sheet of GAIN Capital Holdings, Inc. and subsidiaries as of December 31, 2016, and the related consolidated statements of income and comprehensive income, changes in shareholders’ equity, and cash flows for the year then ended. In connection with our audit of the consolidated financial statements, we also have audited financial statement schedule I. These consolidated financial statements and financial statement schedule are the responsibility of the Company’s management. Our responsibility is to express an opinion on these consolidated financial statements and financial statement schedule based on our audit.
We conducted our audit in accordance with the standards of the Public Company Accounting Oversight Board (United States). Those standards require that we plan and perform the audit to obtain reasonable assurance about whether the financial statements are free of material misstatement. An audit includes examining, on a test basis, evidence supporting the amounts and disclosures in the financial statements. An audit also includes assessing the accounting principles used and significant estimates made by management, as well as evaluating the overall financial statement presentation. We believe that our audit provides a reasonable basis for our opinion.
In our opinion, the consolidated financial statements referred to above present fairly, in all material respects, the financial position of GAIN Capital Holdings, Inc. and subsidiaries as of December 31, 2016, and the results of their operations and their cash flows for the year then ended, in conformity with U.S. generally accepted accounting principles. Also in our opinion, the related financial statement schedule, when considered in relation to the basic consolidated financial statements taken as a whole, presents fairly, in all material respects, the information set forth therein.
We also have audited, in accordance with the standards of the Public Company Accounting Oversight Board (United States), GAIN Capital Holdings, Inc.’s internal control over financial reporting as of December 31, 2016, based on criteria established in Internal Control - Integrated Framework (2013) issued by the Committee of Sponsoring Organizations of the Treadway Commission (COSO), and our report dated March 15, 2017 expressed an unqualified opinion on the effectiveness of the Company’s internal control over financial reporting.
/s/ KPMG LLP
New York, New York
March 15, 2017
F-2
REPORT OF INDEPENDENT REGISTERED PUBLIC ACCOUNTING FIRM
To the Board of Directors and Shareholders of
GAIN Capital Holdings, Inc.
Bedminster, New Jersey
We have audited the accompanying consolidated balance sheet of GAIN Capital Holdings, Inc. and subsidiaries (the “Company”) as of December 31, 2015, and the related consolidated statements of income and comprehensive income, changes in shareholders’ equity, and cash flows for each of the two years in the period ended December 31, 2015. Our audits also included the financial statement schedule as of December 31, 2015 and for the two years in the period ended December 31, 2015, listed in the Index at Item 15. These consolidated financial statements and financial statement schedule are the responsibility of the Company’s management. Our responsibility is to express an opinion on these consolidated financial statements and financial statement schedule based on our audits. We did not audit the consolidated financial statements of GAIN Capital UK Limited, a wholly owned subsidiary, which statements reflect total assets and revenues constituting 32% and 24%, respectively of the related consolidated financial statement amounts as of and for the year ended December 31, 2015. Those statements were audited by other auditors whose report has been furnished to us, and our opinion, insofar as it relates to the amounts included for GAIN Capital UK Limited, is based solely on the report of the other auditors.
We conducted our audits in accordance with the standards of the Public Company Accounting Oversight Board (United States). Those standards require that we plan and perform the audit to obtain reasonable assurance about whether the consolidated financial statements are free of material misstatement. An audit includes examining, on a test basis, evidence supporting the amounts and disclosures in the consolidated financial statements. An audit also includes assessing the accounting principles used and significant estimates made by management, as well as evaluating the overall financial statement presentation. We believe that our audits and the report of the other auditors provide a reasonable basis for our opinion.
In our opinion, based on our audits and the report of the other auditors, such consolidated financial statements present fairly, in all material respects, the financial position of GAIN Capital Holdings, Inc. and subsidiaries as of December 31, 2015, and the results of their operations and their cash flows for each of the two years in the period ended December 31, 2015, in conformity with accounting principles generally accepted in the United States of America. Also, in our opinion, based on our audits and the report of the other auditors, such financial statement schedule as of December 31, 2015 and for each of the two years in the period ended December 31, 2015, when considered in relation to the basic 2015 and 2014 consolidated financial statements taken as a whole, presents fairly, in all material respects, the information set forth therein.
As discussed in Note 2, the consolidated statements of income and comprehensive income, changes in shareholders’ equity and cash flows for the years ended December 31, 2014 have been restated to correct a misstatement.
/s/ Deloitte & Touche LLP
New York, New York
March 17, 2016
F-3
Report of Independent Registered Public Accounting Firm
Board of Directors and Shareholder
GAIN Capital UK Limited
London, United Kingdom
We have audited the accompanying balance sheet of GAIN Capital UK Limited as of December 31, 2015 and the related profit and loss account, statement of changes in equity and cash flows for the nine-month period ended December 31, 2015 and the year ended March 31, 2015, and the related notes to the financial statements. These financial statements are the responsibility of the Company’s management. Our responsibility is to express an opinion on these financial statements based on our audits.
We conducted our audits in accordance with the standards of the Public Company Accounting Oversight Board (United States). Those standards require that we plan and perform the audit to obtain reasonable assurance about whether the financial statements are free of material misstatement. An audit includes examining, on a test basis, evidence supporting the amounts and disclosures in the financial statements, assessing the accounting principles used and significant estimates made by management, as well as evaluating the overall financial statement presentation. We believe that our audits provide a reasonable basis for our opinion.
In our opinion, the financial statements referred to above present fairly, in all material respects, the financial position of GAIN Capital UK Limited at December 31, 2015 and the results of its operations and its cash flows for the nine-month period ended December 31, 2015 and the year ended March 31, 2015, in accordance with United Kingdom Financial Reporting Standard 102 ‘The Financial Reporting Standard applicable in the UK and Republic of Ireland.
United Kingdom Financial Reporting Standard 102 ‘The Financial Reporting Standard applicable in the UK and Republic of Ireland’ varies in certain significant respects from accounting principles generally accepted in the United States of America. Information relating to the nature and effect of such differences is presented in Note 29 to the financial statements.
We also have audited, in accordance with the standards of the Public Company Accounting Oversight Board (United States), GAIN Capital UK Limited’s internal control over financial reporting as of December 31, 2015, based on criteria established in Internal Control - Integrated Framework (2013) issued by the Committee of Sponsoring Organizations of the Treadway Commission (COSO) and our report dated March 15, 2016 expressed an unqualified opinion thereon.
/s/ BDO LLP
BDO LLP
London, United Kingdom
March 15, 2016
F-4
GAIN CAPITAL HOLDINGS, INC.
Consolidated Balance Sheets
(in thousands, except share data)
December 31, 2016 | December 31, 2015 | ||||||
ASSETS: | |||||||
Cash and cash equivalents | $ | 234,760 | $ | 171,888 | |||
Cash and securities held for customers | 945,468 | 920,621 | |||||
Receivables from brokers | 61,096 | 121,153 | |||||
Property and equipment | 36,462 | 30,367 | |||||
Intangible assets | 67,358 | 91,512 | |||||
Goodwill | 32,107 | 34,017 | |||||
Other assets | 52,833 | 55,001 | |||||
Total assets | $ | 1,430,084 | $ | 1,424,559 | |||
LIABILITIES AND SHAREHOLDERS’ EQUITY: | |||||||
Liabilities | |||||||
Payables to customers | $ | 945,468 | $ | 920,621 | |||
Accrued compensation and benefits | 13,559 | 12,362 | |||||
Accrued expenses and other liabilities | 41,547 | 51,638 | |||||
Income tax payable | 3,965 | 1,068 | |||||
Convertible senior notes | 124,769 | 121,740 | |||||
Total liabilities | $ | 1,129,308 | $ | 1,107,429 | |||
Commitments and contingent liabilities | |||||||
Redeemable non-controlling interests | $ | 6,594 | $ | 11,046 | |||
Shareholders’ equity | |||||||
Common stock ($0.00001 par value; 120 million shares authorized, 52,848,811 shares issued and 48,220,243 shares outstanding as of December 31, 2016; 120 million shares authorized, 52,072,884 shares issued and 48,771,015 shares outstanding as of December 31, 2015) | $ | — | $ | — | |||
Accumulated other comprehensive loss | (36,842 | ) | (5,865 | ) | |||
Additional paid-in capital | 218,392 | 212,981 | |||||
Treasury stock, at cost (4,628,568 shares at December 31, 2016 and 3,301,869 at December 31, 2015, respectively) | (30,767 | ) | (21,808 | ) | |||
Retained earnings | 143,399 | 120,776 | |||||
Total shareholders’ equity | 294,182 | 306,084 | |||||
Total liabilities and shareholders’ equity | $ | 1,430,084 | $ | 1,424,559 | |||
The accompanying notes are an integral part of these consolidated financial statements.
F-5
GAIN CAPITAL HOLDINGS, INC.
Consolidated Statements of Income and Comprehensive Income
(in thousands, except share and per share data)
Year Ended December 31, | |||||||||||
2016 | 2015 | 2014 | |||||||||
REVENUES: | |||||||||||
Retail revenue | $ | 330,744 | $ | 347,489 | $ | 292,778 | |||||
Institutional revenue | 29,030 | 33,773 | 34,518 | ||||||||
Futures revenue | 47,430 | 45,427 | 36,160 | ||||||||
Other revenue | 3,504 | 8,487 | 4,904 | ||||||||
Total non-interest revenue | 410,708 | 435,176 | 368,360 | ||||||||
Interest revenue | 1,669 | 1,220 | 1,428 | ||||||||
Interest expense | 552 | 1,049 | 599 | ||||||||
Total net interest revenue | 1,117 | 171 | 829 | ||||||||
Net revenue | $ | 411,825 | $ | 435,347 | $ | 369,189 | |||||
EXPENSES: | |||||||||||
Employee compensation and benefits | $ | 101,904 | $ | 106,581 | $ | 99,233 | |||||
Selling and marketing | 28,742 | 27,168 | 20,213 | ||||||||
Referral fees | 70,752 | 103,523 | 90,972 | ||||||||
Trading expenses | 31,159 | 31,914 | 26,168 | ||||||||
General and administrative | 55,036 | 55,067 | 38,651 | ||||||||
Depreciation and amortization | 13,905 | 11,111 | 6,610 | ||||||||
Purchased intangible amortization | 15,016 | 16,550 | 8,080 | ||||||||
Communications and technology | 20,460 | 18,929 | 15,567 | ||||||||
Bad debt provision | 4,154 | 7,462 | 3,699 | ||||||||
Acquisition expenses | — | 2,819 | 3,526 | ||||||||
Restructuring expenses | 1,041 | 3,482 | 2,334 | ||||||||
Integration expenses | 2,788 | 33,092 | 2,489 | ||||||||
Legal settlement | 9,205 | — | — | ||||||||
Impairment of investment | — | — | 50 | ||||||||
Total operating expense | 354,162 | 417,698 | 317,592 | ||||||||
OPERATING PROFIT | 57,663 | 17,649 | 51,597 | ||||||||
Interest expense on long term borrowings | 10,421 | 9,222 | 6,147 | ||||||||
INCOME BEFORE INCOME TAX EXPENSE | 47,242 | 8,427 | 45,450 | ||||||||
Income tax (benefit)/expense | 9,768 | (3,512 | ) | 19,140 | |||||||
Equity in net loss of affiliate | (62 | ) | — | — | |||||||
NET INCOME | 37,412 | 11,939 | 26,310 | ||||||||
Net income attributable to non-controlling interest | 2,140 | 1,660 | 1,433 | ||||||||
NET INCOME APPLICABLE TO GAIN CAPITAL HOLDINGS, INC. | 35,272 | 10,279 | 24,877 | ||||||||
Other comprehensive loss: | |||||||||||
Foreign currency translation adjustment | (30,977 | ) | (4,352 | ) | (4,089 | ) | |||||
NET COMPREHENSIVE INCOME APPLICABLE TO GAIN CAPITAL HOLDINGS, INC. | $ | 4,295 | $ | 5,927 | $ | 20,788 | |||||
Earnings per common share: | |||||||||||
Basic | $ | 0.67 | $ | 0.22 | $ | 0.56 | |||||
Diluted | $ | 0.67 | $ | 0.22 | $ | 0.53 | |||||
Weighted average common shares outstanding used in computing earnings per common share: | |||||||||||
Basic | 48,588,917 | 47,601,979 | 40,561,644 | ||||||||
Diluted | 48,785,674 | 48,379,051 | 43,214,895 | ||||||||
F-6
GAIN CAPITAL HOLDINGS, INC.
Consolidated Statement of Changes in Shareholders’ Equity
(in thousands, except share data)
Common Stock | Treasury Stock | Additional Paid in Capital | Retained Earnings | Accumulated Other Comprehensive Income/(Loss) | Total | |||||||||||||||||||||
Shares (1) | Amount | |||||||||||||||||||||||||
BALANCE—January 1, 2014 | 39,425,434 | $ | — | $ | (15,469 | ) | $ | 134,399 | $ | 105,217 | $ | 2,576 | $ | 226,723 | ||||||||||||
Net income applicable to Gain Capital Holdings, Inc. | — | — | — | — | 24,877 | — | 24,877 | |||||||||||||||||||
Exercise of options | 719,719 | — | — | 2,087 | — | — | 2,087 | |||||||||||||||||||
Issuance of common stock | 978,736 | — | — | 6,493 | — | — | 6,493 | |||||||||||||||||||
Conversion of restricted stock into common stock | 1,863,396 | — | — | — | — | — | — | |||||||||||||||||||
Issuance of common stock for the employee stock purchase plan | 98,606 | — | — | 740 | — | — | 740 | |||||||||||||||||||
Purchase of common stock for treasury | (151,332 | ) | — | (1,251 | ) | — | — | — | (1,251 | ) | ||||||||||||||||
Share-based compensation | — | — | — | 3,452 | — | — | 3,452 | |||||||||||||||||||
Tax benefit of stock options exercises | — | — | — | 1,221 | — | — | 1,221 | |||||||||||||||||||
Other | — | — | — | (14 | ) | (73 | ) | — | (87 | ) | ||||||||||||||||
Adjustment to the redemption value of put options related to non-controlling interests | — | — | — | — | (2,107 | ) | — | (2,107 | ) | |||||||||||||||||
Dividends declared | — | — | — | — | (8,139 | ) | — | (8,139 | ) | |||||||||||||||||
Foreign currency translation adjustment | — | — | — | — | — | (4,089 | ) | (4,089 | ) | |||||||||||||||||
BALANCE—January 1, 2015 | 42,934,559 | $ | — | $ | (16,720 | ) | $ | 148,378 | $ | 119,775 | $ | (1,513 | ) | $ | 249,920 | |||||||||||
Net income applicable to Gain Capital Holdings, Inc. | — | — | — | — | 10,279 | — | 10,279 | |||||||||||||||||||
Exercise of options | 638,241 | — | — | 2,386 | — | — | 2,386 | |||||||||||||||||||
Issuance of common stock | 5,319,149 | — | — | 45,100 | — | — | 45,100 | |||||||||||||||||||
Conversion of restricted stock into common stock | 440,651 | — | — | — | — | — | — | |||||||||||||||||||
Issuance of common stock for the employee stock purchase plan | 92,777 | — | — | 789 | — | — | 789 | |||||||||||||||||||
Purchase of common stock for treasury | (654,362 | ) | — | (5,088 | ) | — | — | — | (5,088 | ) | ||||||||||||||||
Share-based compensation | — | — | — | 3,680 | — | — | 3,680 | |||||||||||||||||||
Tax benefit of stock options exercises | — | — | — | 1,140 | — | — | 1,140 | |||||||||||||||||||
Convertible note issuance | — | — | — | 15,348 | — | — | 15,348 | |||||||||||||||||||
Tax effect of convertible note | — | — | — | (3,840 | ) | — | — | (3,840 | ) | |||||||||||||||||
Other | — | — | — | — | (56 | ) | — | (56 | ) | |||||||||||||||||
Adjustment to the redemption value of put options related to non-controlling interests | — | — | — | — | 308 | — | 308 | |||||||||||||||||||
Dividends declared | — | — | — | — | (9,530 | ) | — | (9,530 | ) | |||||||||||||||||
Foreign currency translation adjustment | — | — | — | — | — | (4,352 | ) | (4,352 | ) | |||||||||||||||||
BALANCE—January 1, 2016 | 48,771,015 | $ | — | $ | (21,808 | ) | $ | 212,981 | $ | 120,776 | $ | (5,865 | ) | $ | 306,084 | |||||||||||
Net income applicable to Gain Capital Holdings, Inc. | — | — | — | — | 35,272 | — | 35,272 | |||||||||||||||||||
Exercise of options | 179,501 | — | — | 706 | — | — | 706 | |||||||||||||||||||
Issuance of common stock | — | — | — | — | — | — | — | |||||||||||||||||||
F-7
Conversion of restricted stock into common stock | 500,253 | — | — | — | — | — | — | |||||||||||||||||||
Issuance of common stock for the employee stock purchase plan | 96,173 | — | — | 611 | — | — | 611 | |||||||||||||||||||
Purchase of common stock for treasury | (1,326,699 | ) | — | (8,959 | ) | — | — | — | (8,959 | ) | ||||||||||||||||
Share-based compensation | — | — | — | 4,151 | — | — | 4,151 | |||||||||||||||||||
Tax effect of convertible note | — | — | — | 48 | — | — | 48 | |||||||||||||||||||
Repurchase of convertible notes | — | — | — | (105 | ) | — | — | (105 | ) | |||||||||||||||||
Adjustment to the redemption value of put options related to non-controlling interests | — | — | — | — | (2,715 | ) | — | (2,715 | ) | |||||||||||||||||
Adjustment to fair value of redeemable non-controlling interests | — | — | — | — | 258 | — | 258 | |||||||||||||||||||
Dividends declared | — | — | — | — | (10,192 | ) | — | (10,192 | ) | |||||||||||||||||
Foreign currency translation adjustment | — | — | — | — | — | (30,977 | ) | (30,977 | ) | |||||||||||||||||
BALANCE—December 31, 2016 | 48,220,243 | $ | — | $ | (30,767 | ) | $ | 218,392 | $ | 143,399 | $ | (36,842 | ) | $ | 294,182 | |||||||||||
The accompanying notes are an integral part of these consolidated financial statements.
F-8
GAIN CAPITAL HOLDINGS, INC.
Consolidated Statements of Cash Flows
(in thousands)
Year Ended December 31, | |||||||||||
2016 | 2015 | 2014 | |||||||||
CASH FLOWS FROM OPERATING ACTIVITIES: | |||||||||||
Net income | $ | 37,412 | $ | 11,939 | $ | 26,310 | |||||
Adjustments to reconcile net income to cash provided by operating activities | |||||||||||
Loss / (gain) on foreign currency exchange rates | 1,692 | 2,432 | (1,618 | ) | |||||||
Depreciation and amortization | 28,921 | 27,661 | 14,690 | ||||||||
Non-cash integration costs | 366 | 26,827 | 1,162 | ||||||||
Deferred tax (benefit)/expense | (3,481 | ) | (12,355 | ) | 5,108 | ||||||
Amortization of deferred financing costs | 442 | 354 | 354 | ||||||||
Bad debt provision | 4,154 | 7,462 | 3,699 | ||||||||
Impairment of cost method investment | — | — | 50 | ||||||||
Convertible senior notes discount amortization | 4,311 | 3,624 | 2,150 | ||||||||
Stock compensation expense | 4,151 | 3,680 | 3,452 | ||||||||
Gain on extinguishment of debt | (89 | ) | — | — | |||||||
Equity in net loss of affiliate | 62 | — | — | ||||||||
Adjustment to fair value of contingent consideration | — | (6,722 | ) | — | |||||||
Changes in operating assets and liabilities: | |||||||||||
Cash and securities held for customers | (77,216 | ) | 101,325 | (9,260 | ) | ||||||
Receivables from brokers | 58,360 | 45,576 | 94,933 | ||||||||
Prepaid assets | — | (1,445 | ) | 2,730 | |||||||
Other assets | (13,079 | ) | (6,229 | ) | (8,495 | ) | |||||
Payables to customers | 77,216 | (101,325 | ) | 9,260 | |||||||
Accrued compensation and benefits | 2,045 | (7,454 | ) | 4,497 | |||||||
Accrued expenses and other liabilities | (6,703 | ) | (18,748 | ) | (2,422 | ) | |||||
Income tax payable | 6,275 | 611 | (9,812 | ) | |||||||
Net cash provided by operating activities | 124,839 | 77,213 | 136,788 | ||||||||
CASH FLOWS FROM INVESTING ACTIVITIES: | |||||||||||
Purchases of property and equipment | (23,883 | ) | (19,676 | ) | (8,759 | ) | |||||
Purchase of partial interest in GAA/TT | (7,444 | ) | — | — | |||||||
Sale of treasury bills | — | — | 614 | ||||||||
Intangible asset purchases | — | — | (12,400 | ) | |||||||
Funding of acquisitions, net of cash acquired | — | (3,258 | ) | (14,918 | ) | ||||||
Cash received relating to acquisitions | — | 7,612 | — | ||||||||
Purchase of investment | — | (759 | ) | — | |||||||
Net cash used for investing activities | (31,327 | ) | (16,081 | ) | (35,463 | ) | |||||
CASH FLOWS FROM FINANCING ACTIVITIES: | |||||||||||
Contractual payments for acquisitions | — | (13,893 | ) | — | |||||||
Proceeds from exercise of stock options | 706 | 2,386 | 2,087 | ||||||||
Proceeds from employee stock purchase plan | 611 | 789 | 740 | ||||||||
Purchase of treasury stock | (8,959 | ) | (5,088 | ) | (1,251 | ) | |||||
Excess tax benefit from employee stock option exercises | — | 1,140 | 1,221 | ||||||||
Dividend payments | (10,192 | ) | (9,530 | ) | (8,139 | ) | |||||
Distributions to non-controlling interest holders | (1,605 | ) | (1,644 | ) | (596 | ) | |||||
F-9
Repurchase of convertible notes | (1,736 | ) | — | — | |||||||
Net cash used for financing activities | $ | (21,175 | ) | $ | (25,840 | ) | $ | (5,938 | ) | ||
Effect of exchange rate changes on cash and cash equivalents | (9,465 | ) | (2,755 | ) | 4,093 | ||||||
NET INCREASE IN CASH AND CASH EQUIVALENTS | 62,872 | 32,537 | 99,480 | ||||||||
CASH AND CASH EQUIVALENTS—Beginning of year | $ | 171,888 | $ | 139,351 | $ | 39,871 | |||||
CASH AND CASH EQUIVALENTS—End of year | $ | 234,760 | $ | 171,888 | $ | 139,351 | |||||
SUPPLEMENTARY DISCLOSURES OF CASH FLOW INFORMATION: | |||||||||||
Cash paid during the year for: | |||||||||||
Interest | $ | 6,251 | $ | 5,065 | $ | 3,373 | |||||
Income taxes | $ | 8,438 | $ | 9,861 | $ | 13,151 | |||||
Non-cash investing activities: | |||||||||||
Purchase of fixed assets included in accrued expense and other liabilities | $ | — | $ | — | $ | 701 | |||||
Non-cash financing activities: | |||||||||||
Common stock issued as consideration for asset and business acquisitions | $ | — | $ | 45,100 | $ | 6,493 | |||||
Convertible senior notes issued as consideration for business acquisitions | $ | — | $ | 65,000 | $ | — | |||||
Deferred taxes related to convertible senior notes | $ | — | $ | (3,840 | ) | $ | — | ||||
Adjustment to redemption value of non-controlling interests | $ | (2,715 | ) | $ | 308 | $ | (2,107 | ) | |||
The accompanying notes are an integral part of these consolidated financial statements.
F-10
GAIN CAPITAL HOLDINGS, INC.
NOTES TO CONSOLIDATED FINANCIAL STATEMENTS
1. ORGANIZATION AND BASIS OF PRESENTATION
GAIN Capital Holdings, Inc. (together with its subsidiaries, the “Company”), is a Delaware corporation formed and incorporated on March 24, 2006. GAIN Holdings, LLC is a wholly-owned subsidiary of GAIN Capital Holdings, Inc., and it owns all outstanding membership units of GAIN Capital Group, LLC (“Group, LLC”), the Company's primary regulated entity in the United States. Gain Capital Holdings Ltd. (previously known as "City Index (Holdings) Ltd" or "City Index") is the holding company of the Company's primary regulated entity in the United Kingdom.
The Company is a global provider of trading services and solutions, specializing in over-the-counter, or OTC, and exchange-traded markets. The Company operates its business in three segments. Through its retail segment, the Company provides its retail customers around the world with access to a diverse range of global financial markets, including spot forex, precious metals, spread bets and contracts for difference, or CFDs, on commodities, indices, individual equities and interest rate products, as well as OTC options on forex. The Company's institutional segment provides agency execution services and electronic access to spot and forward foreign exchange and precious metals markets via the electronic communications network, or ECN, GTX. The Company's futures segment offers execution and risk management services for exchange-traded futures and futures options on major U.S. and European futures and options exchanges. For more information about the Company's segments, please see Note 21.
Group, LLC is a retail foreign exchange dealer (“RFED”) and a Futures Commission Merchant (“FCM”) registered with the Commodity Futures Trading Commission (the “CFTC”). As such, it is subject to the regulations of the CFTC, an agency of the U.S. government, and the rules of the National Futures Association (“NFA”), an industry self-regulatory organization.
GCUK1 and GCUK2 are each registered in the United Kingdom ("U.K.") and regulated by the Financial Conduct Authority (“FCA”) as full scope €730k IFPRU Investment Firms.
In April 2015, the Company acquired all of the outstanding share capital of City Index from City Index Group Limited. GCUK2, GCAU2 and GCS are each subsidiaries that were acquired as part of the City Index acquisition. Each of these entities is regulated locally by the relevant regulators, including the FCA.
In July 2014, the Company acquired all of the outstanding share capital of Trade Facts, a U.K. based corporation, and its subsidiaries, Faraday Research LLP and Galvan LLP. Galvan is regulated by the FCA.
In March 2014, the Company acquired controlling interests in Global Asset Advisors, LLC ("GAA") and Top Third Ag Marketing, LLC ("Top Third"). In December 2016, the Company acquired additional ownership interests in each of GAA and Top Third, increasing its ownership percentage of each company to 79%.
The consolidated financial statements are presented in accordance with accounting principles generally accepted in the United States of America ("GAAP") and have been prepared in accordance with the regulations of the Securities and Exchange Commission ("SEC").
During the fourth quarter of 2015, the Company changed its segment reporting structure from a single operating segment to three operating segments, Retail, Institutional and Futures. The Company also provides general corporate services to its segments through a corporate function, which only earns revenues that are incidental to the public entity and is therefore not an operating segment. Such costs are reported as "Corporate and Other." The segment reporting structure is consistent with how the Chief Operating Decision Maker reviews the businesses, makes investing and resource decisions and assesses operating performance. Previously disclosed segment information has been retrospectively adjusted to conform with changes made to the current segment presentation.
2. SUMMARY OF SIGNIFICANT ACCOUNTING POLICIES
Consolidation
F-11
The consolidated financial statements include the accounts of the Company, its wholly owned subsidiaries and other subsidiaries in which the Company holds a controlling financial interest. All intercompany transactions and balances are eliminated in consolidation.
Use of Estimates
The preparation of consolidated financial statements in conformity with GAAP requires management to make estimates and assumptions that affect the reported amounts of assets and liabilities and disclosure of contingent assets and liabilities at the date of the consolidated financial statements and the reported amounts of revenue and expenses during the reporting period. In presenting the consolidated financial statements, management makes estimates regarding:
• | Valuation of assets and liabilities requiring fair value estimates; |
• | Certain accruals; |
• | The allowance for doubtful accounts; |
• | The realization of deferred taxes; |
• | The carrying amount of goodwill and other intangible assets; |
• | The useful lives of intangible assets and other long-lived assets with finite lives; |
• | Incentive based compensation accruals and valuation of share-based payment arrangements; |
• | Transfer pricing; |
• | The recognition and measurement of uncertain tax positions; and |
• | Other matters that affect the reported amounts and disclosure of contingencies in the consolidated financial statements. |
Estimates, by their nature, are based on judgment and available information. Therefore, actual results could differ from those estimates and could have a material impact on the consolidated financial statements, and it is possible that such changes could occur in the near term.
Revenue Recognition
Revenue is recognized in accordance with revenue recognition guidance. The Company primarily generates revenue through market making and by providing trading execution services for its clients. The Company categorizes revenue as Retail revenue, Institutional revenue, Futures revenue, Other revenue and Net interest revenue.
Retail revenue is the Company's largest source of revenue. Retail revenue comprises trading revenue from the retail OTC business, sales trader, and advisory businesses. OTC trading includes forex trading ("forex"), metals trading, CFDs and spread-betting (in markets which do not prohibit such transactions), as well as other financial products.
Gains or losses are realized when customer transactions are liquidated. Unrealized gains or losses on trading positions are revalued at prevailing foreign currency exchange rates (the difference between contract price and market price) at the date of the balance sheet and are included in Receivables from brokers as well as Payables to customers on the Consolidated Balance Sheets. Changes in net unrealized gains or losses are recorded in Retail revenue on the Consolidated Statements of Income and Comprehensive Income. Retail revenue is recorded on a trade date basis.
Institutional revenue consists of revenue from the Company's GTX business, which provides a proprietary trading platform and sales and trading services to institutions. Revenue for the GTX business is generated primarily through commissions or spreads on trades executed on the GTX platform or by voice-brokers. The Company acts as an agent for the trades executed on the GTX platform. The Company, therefore, does not assume any market or credit risk in connection with those transactions. Revenues are booked on a trade date basis.
Futures revenue consists of revenue from the Company's futures business, which offers exchange-based trading execution services, focusing on the indices, agricultural hedging, and commodities sectors. Revenues in this business are generated through commissions, which are earned for executing the Company's customers' trades. These revenues are booked on a trade date basis. The Company acts in an agency capacity with respect to the clearing of trades, but is a principal with respect to fees paid to introducing brokers in its futures business. The Company does not assume any market risk with respect to customer trades in this business.
F-12
Other revenue primarily comprises account management and transaction fees, inactivity, training fees charged to customer accounts, and adjustments to contingent consideration, as well as foreign currency transaction gains and losses.
Net interest revenue consists primarily of the revenue generated by our cash and customer cash held by us at banks, as well as funds on deposit as collateral with our liquidity providers, less interest paid to our customers.
Interest revenue and interest expense are recorded when earned and incurred, respectively.
Selling and marketing
Selling and marketing costs are related to producing and communicating advertising, as well as other marketing activities, and are expensed as incurred.
Restructuring expenses
In 2016, 2015 and 2014, the Company incurred restructuring expenses, which reflected costs arising from headcount reductions and other exit costs, measured and disclosed in accordance with relevant accounting guidance. These costs are expensed as incurred.
Acquisition expenses
In 2015 and 2014, the Company incurred acquisition related expenses, which included costs such as legal, accounting, valuation and other costs specified in accounting guidance. These costs are expensed as incurred.
Integration expenses
In 2016, 2015 and 2014, the Company incurred integration expenses, which are acquisition related costs that are subsequently incurred while integrating the acquired company into the consolidated group. These costs are expensed as incurred.
Investments
For equity investments in which the Company exerts significant influence over operating and financial policies but does not have a controlling financial interest, the equity method of accounting is used. There was $0.1 million of undistributed losses in 2016, and no distributed or undistributed earnings from equity method investees during 2015 and 2014.
Cash and cash equivalents
The Company considers all highly liquid investments with an original maturity of 90 days or less at the time of acquisition to be cash equivalents. The Company’s cash equivalents consisted of U.S. treasury bills and money market accounts with an initial maturity of 90 days or less. Cash equivalents are recorded at fair value.
For the year ended December 31, 2016, the Company changed its presentation of cash and equivalents, cash and securities held for customers, and receivables from brokers in the Consolidated Balance Sheet in order to present cash and securities held for customers in a single financial statement caption. In the past, rehypothecated customer funds had been reported as part of Receivables from brokers as opposed to Cash and securities held for customers. These rehypothecated funds were reclassified as Cash and securities held for customers and no longer reported as part of Receivables from brokers. Both presentations discussed above are in compliance with U.S. GAAP. Prior period financial statement amounts have not been reclassified to maintain comparability among the periods presented as the impact was not considered material.
Cash and securities held for customers
Cash and securities held for customers represents cash and other highly liquid assets held to fund customer liabilities in connection with trading positions. Included in this balance are funds deposited by customers and funds accruing to customers as a result of trades or contracts. The Company records a corresponding liability in connection with this amount in Payables to customers. In addition, the Company holds certain customer funds in segregated or secured broker accounts. Legally segregated balances are not available for general use, in accordance with certain jurisdictional regulatory requirements.
Receivables from Brokers
Receivables from brokers include funds that the Company has posted with brokers as collateral required by agreements for holding hedging positions. Also, Receivables from brokers contains funds required to collateralize customer futures trading, as
F-13
well as the related excess and the Company's own collateral. These amounts are reflected as Receivables from brokers on the Consolidated Balance Sheets and include gains or losses realized on settled contracts, as well as unrealized gains or losses on open positions.
Fair Value
Certain financial assets and liabilities are recorded at fair value in accordance with applicable accounting guidance, as discussed in Note 3 Fair Value Information.
Other financial assets and liabilities are not measured at fair value on a recurring basis but nevertheless approximate fair value due to their short term maturities. Such financial assets and liabilities include: Receivables from brokers; Convertible senior notes; certain other assets; Payables to customers; and Accrued expenses and other liabilities.
The above referenced receivables and payables include open trading positions which are held at fair value, hedging and customer positions, both of which change in value as the price of the underlying product changes. The prices approximate the amounts at which the Company can settle the positions at the balance sheet date.
Concentrations of Credit Risk
The Company owns financial instruments that subject the Company to credit risk. These financial instruments are held primarily in Cash and cash equivalents as well as Cash and securities held for customers. The Company’s credit risk is managed by investing cash and cash equivalents primarily in high-quality money market and, from time to time, U.S. Government instruments. The majority of the Company’s cash and cash equivalents are held at ten financial institutions.
The Company also has credit risk related to receivables from brokers included in Receivables from brokers and Cash and cash equivalents. As of December 31, 2016 and 2015, 54% and 28%, respectively, of the Company’s brokers receivables, included in the Consolidated Balance Sheets, were from one large, global financial institution.
Property and Equipment and Other Long-Lived Assets
Property and equipment are recorded at cost, net of accumulated depreciation. Identifiable significant improvements are capitalized and expenditures for maintenance and repairs are charged to expense as incurred.
Property and equipment are depreciated on a straight-line basis over a three year useful life, except for leasehold improvements, which are depreciated on a straight-line basis over the shorter of the lease term or estimated useful life.
The Company accounts for costs incurred to develop its trading platforms and related software in accordance with Accounting Standards Codification (ASC) 350-40, Internal-Use Software. ASC 350-40 requires that such technology be capitalized in the application and infrastructure development stages. Costs related to training, administration and non-value-added maintenance are charged to expense as incurred. Capitalized software development costs are being amortized over the useful life of the software, which the Company has estimated at three years.
In accordance with ASC 360-10, Property, Plant and Equipment, the Company periodically evaluates the carrying value of long-lived assets when events and circumstances warrant such review. The carrying value of a long-lived asset is considered impaired when the anticipated identifiable undiscounted cash flows from such an asset (or asset group) are less than the carrying value. In that event, a loss is recognized in the amount by which the carrying value exceeds the fair market value of the long-lived asset. This guidance applies to assets held for use and not to assets held for sale. The Company has no assets held for sale. The Company has identified no such impairment indicators as of December 31, 2016 or December 31, 2015.
Foreign Currencies
Items included in the financial statements of each of the Company's subsidiaries are measured using the currency of the primary economic environment in which the subsidiaries operate (the functional currency). The Company has determined that it's functional currency is U.S. dollars (USD). The Company’s Accumulated other comprehensive income/(loss) consists of foreign currency translation adjustments from subsidiaries not using the USD as their functional currency.
Foreign currency transactions are remeasured into functional currency using the exchange rates prevailing at the dates of the transactions. Foreign exchange gains and losses resulting from the settlement of such transactions and from the remeasurement at period end exchange rates of monetary assets and liabilities denominated in foreign currencies are recognized in Other revenue on the Consolidated Statements of Income and Comprehensive Income. The Company recorded foreign exchange
F-14
losses of $1.7 million, $2.4 million and a gain of $1.6 million for the years ended December 31, 2016, 2015 and 2014, respectively.
Intangible Assets
Accounting guidance addressing intangible assets requires purchased intangible assets other than goodwill to be amortized over their estimated useful lives unless their lives are determined to be indefinite. If indefinite-lived assets are determined to have a finite life in the future, the Company will amortize the carrying value over the remaining estimated useful life at that time.
The Company analyzes its business, legal and regulatory environment at least annually and on an interim basis when conditions indicate impairment may have occurred to determine whether its indefinite-lived intangible assets are likely to be impaired. This qualitative assessment indicated that it is more likely than not that the Company's indefinite lived intangible assets are not impaired. See Note 7 Intangible Assets and Goodwill for additional information.
Goodwill
The Company obtained goodwill as a result of the acquisitions of certain subsidiaries. Goodwill represents the excess of the cost over the fair market value of net assets acquired. In accordance with relevant accounting guidance, the Company tests goodwill for impairment on an annual basis during the fourth quarter and on an interim basis when conditions indicate impairment may have occurred (see Note 7). In performing these assessments, management relies on and considers a number of factors, including operating results, business plans, economic projections, anticipated future cash flows, comparable market transactions (to the extent available), other market data and the Company's overall market capitalization. There are inherent uncertainties related to these factors which require judgment in applying them to the analysis of goodwill and intangible assets for impairment.
When testing for goodwill impairment, the Company first assesses qualitative factors to determine whether the existence of events or circumstances leads to a determination that it is more likely than not that the fair value of a reporting unit is less than its carrying amount. If the Company concludes it is more likely than not that the fair value of a reporting unit is less than its carrying amount, a quantitative fair value test is performed using a two-step impairment test.
Step one - the fair value of each reporting unit is compared to its carrying value in order to identify potential impairment. If the fair value of a reporting unit exceeds the carrying value of its net assets, goodwill is not considered impaired and no further testing is required. If the carrying value of the net assets exceeds the fair value of a reporting unit, potential impairment is indicated at the reporting unit level and step two of the impairment test is performed.
Step two - when potential impairment is indicated in step one, we compare the implied fair value of goodwill with the carrying amount of that goodwill. Determining the implied fair value of goodwill requires a valuation of the reporting unit's tangible and (non-goodwill) intangible assets and liabilities in a manner similar to the allocation of the purchase price in a business combination. Any excess in the value of a reporting unit over the amounts assigned to its assets and liabilities is referred to as the implied fair value of goodwill. If the carrying amount of the reporting unit goodwill exceeds the implied fair value of that goodwill, an impairment loss is recognized in an amount equal to that excess.
For the year ended December 31, 2016, the Company elected to perform a qualitative analysis for each of its reporting units to determine whether it was more likely than not that the fair value was less than the carrying value. As a result of this assessment, the Company determined that it was not necessary to perform a quantitative impairment test and concluded that goodwill assigned to each reporting unit was not impaired at December 31, 2016.
Derivatives
Forex, metals, and CFDs allow for exchanging the difference in value of a particular asset such as a stock index, energy product, or gold contracts, between the time at which a contract is opened and the time at which it is closed. The Company's retail customer open positions and positions held with liquidity providers are considered derivatives under derivative accounting guidance in ASC 815. Therefore, they are accounted for at fair value, and included in Receivables from brokers and Payables to customers in the Consolidated Balance Sheets. The Company did not designate any of its derivatives as hedging instruments. Net gains and losses with respect to derivative instruments are reflected in Retail Revenue in the accompanying Consolidated Statements of Income and Comprehensive Income.
Allowance for Doubtful Accounts
F-15
The Company records an increase in the allowance for doubtful accounts when the prospect of collecting a specific customer account balance becomes doubtful. Management specifically analyzes accounts receivable and historical bad debt experience when evaluating the adequacy of the allowance for doubtful accounts. Changes in estimates are recognized in current year earnings. The customer receivables, net of allowance for doubtful accounts, is included in Other assets on the Consolidated Balance Sheets. Receivables from customers are reserved for and the related reserves are recorded in Bad debt provision on the Consolidated Statements of Income and Comprehensive Income. The allowance for doubtful accounts consisted of the following (amounts in thousands):
Balance as of January 1, 2014 | $ | (1,158 | ) |
Addition to provision | (3,699 | ) | |
Amounts written off | 302 | ||
Balance as of December 31, 2014 | (4,555 | ) | |
Addition to provision | (7,462 | ) | |
Amounts written off | 5,185 | ||
Balance as of December 31, 2015 | (6,832 | ) | |
Addition to provision | (4,154 | ) | |
Amounts written off | 1,749 | ||
Balance as of December 31, 2016 | $ | (9,237 | ) |
Payables to Customers
Payables to customers, included on the Consolidated Balance Sheets, include amounts due on cash and margin transactions. These transactions include deposits, commissions and gains or losses arising from settled trades. The payables balance also reflects unrealized gains or losses arising from open positions in customer accounts. The Company engages in white label, or omnibus relationships, with other regulated financial institutions. The payables balance includes amounts deposited by these financial institutions in order for the Company to act as a clearing broker.
Referral fees
Introducing brokers direct customers to the Company in return for a commission on each referred customer’s trading volume or a share of net revenue generated by each referred customer’s trading activity. Such fees are referred to as introducing broker fees and are recorded on a trade date basis, in Referral Fees, in the Consolidated Statements of Income and Comprehensive Income.
Trading Expenses
Trading expenses consist of exchange fees paid to stock exchanges and other third-parties for exchange market data that the Company provides to its customers or uses to create its own derived data products, as well as fees for news services and fees paid to prime brokers in connection with its institutional GTX business and futures business. These costs are expensed as incurred.
Income Taxes
Income taxes are accounted for using the asset and liability method. Deferred tax assets and liabilities are recognized for the future tax consequences attributable to differences between the financial statement carrying amounts of existing assets and liabilities and their respective tax bases. Deferred tax assets and liabilities are measured using enacted tax rates expected to apply to taxable income in the years in which those temporary differences are expected to be recovered or settled. The effect on deferred tax assets and liabilities of a change in tax rates is recognized in income in the period that includes the enactment date. A valuation allowance is recorded against deferred tax assets if it is more likely than not that such assets will not be realized. Contingent income tax liabilities are recorded when the criteria for loss recognition have been met. An uncertain tax position is recognized based on the determination of whether or not a tax position is more likely than not to be sustained upon examination based upon the technical merits of the position. If this recognition threshold is met, the tax benefit is then measured based on the largest benefit that has a greater than fifty percent likelihood of being realized upon ultimate resolution. The Company operates under a permanent reinvestment strategy, under which earnings derived from foreign businesses remain invested in the Company’s foreign subsidiaries. In accordance with accounting guidance, the Company does not recognize domestic tax expense related to the permanently reinvested earnings. The Company has no plans to repatriate accumulated unremitted earnings as of December 31, 2016.
F-16
Share Based Compensation
Share-based compensation expense requires measurement of compensation cost for share-based awards at fair value and recognition of compensation cost over the vesting period, net of estimated forfeitures. For awards with service conditions, the Company recognizes compensation cost on a straight-line basis over the requisite service period.
The fair value of stock options granted is estimated using the Black-Scholes option-pricing model, which considers, among other factors, the expected term of the award and the expected volatility of the Company's stock price. Although the Black-Scholes model meets the requirements of ASC 718, Compensation-Stock Compensation, the fair values generated by the model may not be indicative of the actual fair values of the underlying awards, as it does not consider other factors important to those share-based compensation awards, such as continued employment, periodic vesting requirements and limited transferability.
The risk-free interest rate used in the Black-Scholes option-pricing model is based on the U.S. Treasury yield curve in effect at the time of grant. The expected option life is based on historical experience of employee exercise behavior. Expected volatility is based on historical volatility, implied volatility, price observations taken at regular intervals and other factors deemed appropriate. Expected dividend is based upon the current dividend rate.
The fair value of restricted stock unit awards is based on the fair value of the Company's common stock on the grant date.
Treasury Shares
In accordance with ASC 505-30, Equity - Treasury Stock, the Company treats the cost of acquired shares purchased as a deduction from shareholders’ equity and as a reduction of the total shares outstanding when calculating earnings per share.
Earnings Per Common Share
Basic earnings per common share is calculated using the weighted average common shares outstanding during the year. Common equivalent shares from stock options and restricted stock awards, using the treasury stock method, are also included in the diluted per share calculations unless their effect of inclusion would be anti-dilutive. See Note 15 for discussion of the impact of the Company's convertible notes and non-controlling interests on EPS.
Recent Accounting Pronouncements
In December 2016, the FASB issued technical corrections and improvements to revenue recognition guidance previously issued in May 2014 as discussed below. The FASB issued this update to address narrow aspects of the revenue recognition guidance issued in May 2014, which is not yet effective. The effective date and transition requirements for the amendments in this update are the same as the effective date and transition requirements of the revenue recognition guidance issued in May 2014. The Company is currently assessing the impact of adopting this guidance on its Consolidated Financial Statements.
In November 2016, the FASB issued guidance requiring that amounts generally described as restricted cash and restricted cash equivalents be included with cash and cash equivalents when reconciling the beginning-of-period and end-of-period total amounts shown on the statement of cash flows. The guidance is effective for interim and annual periods beginning in 2018 and should be applied using a retrospective transition method to each period presented. Early adoption is permitted. The Company is currently evaluating the effect of the standard on its Consolidated Statement of Cash Flows.
In August 2016, the FASB issued new guidance regarding the classification of certain cash receipts and cash payments on the Statements of Cash Flows. This new standard clarifies certain aspects of the statement of cash flows, including the classification of debt prepayment or debt extinguishment costs or other debt instruments with coupon interest rates that are insignificant in relation to the effective interest rate of the borrowing, contingent consideration payments made after a business combination, proceeds from the settlement of insurance claims, proceeds from the settlement of corporate-owned life insurance policies, distributions received from equity method investees and beneficial interests in securitization transactions. This new standard also clarifies that an entity should determine each separately identifiable source of use within the cash receipts and payments on the basis of the nature of the underlying cash flows. In situations in which cash receipts and payments have aspects of more than one class of cash flows and cannot be separated by source or use, the appropriate classification should depend on the activity that is likely to be the predominant source or use of cash flows for the item. The guidance is effective for fiscal years and interim periods within those fiscal years, beginning after December 15, 2017. The Company is currently assessing the impact of adopting this guidance on its financial statements.
In May 2016, the FASB issued new guidance regarding the accounting for revenue from contracts with customers. The FASB issued this update to address certain issues related to assessing collectibility, presentation of sales taxes, non-cash consideration,
F-17
completed contracts, and contract modifications at transition by reducing cost, complexity, and the potential for diversity in practice at initial application. The guidance affects the revenue recognition guidance issued in May 2014, which is not yet effective. The effective date and transition requirements for the amendments in this update are the same as the effective date and transition requirements of the revenue recognition guidance issued in May 2014, discussed below. The Company is currently assessing the impact of adopting this guidance on its Consolidated Financial Statements.
In March 2016, the FASB issued new guidance regarding the accounting for stock compensation. The FASB issued this update to simplify several aspects of the accounting for share-based payment transactions, including income tax consequences, classification of awards as either equity or liabilities, and classification on the statement of cash flows, forfeitures, minimum statutory tax withholding requirements, and classification of employee taxes paid on the statement of cash flows when an employer withholds shares for tax-withholding purposes. The guidance is effective for annual periods beginning after December 15, 2016, and interim periods within those annual periods. The Company has elected to early adopt this guidance in the fourth quarter of 2016 which did not have a significant impact on the Company's Consolidated Financial Statements.
In March and April 2016, the FASB issued new guidance regarding the accounting for revenue from contracts with customers. The FASB issued these updates to improve the operability and understandability of the implementation guidance on principal versus agent considerations, and to provide clarification on identifying performance obligations and the licensing implementation guidance, while retaining the related principles for those areas. The guidance affects the revenue recognition guidance issued in May 2014, which is not yet effective. The effective date and transition requirements for the amendments in this update are the same as the effective date and transition requirements of the revenue recognition guidance issued in May 2014, discussed below. The Company is currently assessing the impact of adopting this guidance on its Consolidated Financial Statements.
In February 2016, the FASB issued new guidance regarding the accounting for leases. The FASB issued this update to increase transparency and comparability among organizations by recognizing lease assets and lease liabilities on the balance sheet and disclosing key information about leasing arrangements. The guidance is effective for fiscal years beginning after December 15, 2018, including interim periods within that fiscal year. The Company is currently assessing the impact on its Consolidated Financial Statements of adopting this guidance.
In April 2015, the FASB issued new guidance regarding the accounting for debt issuance costs. The guidance requires a company to present any deferred financing costs from debt issuance as a reduction of debt. The Company adopted this guidance in the first quarter of 2016. The effect of the adoption is not material to the Consolidated Financial Statements.
In May 2014, the FASB issued new revenue recognition guidance that supersedes the existing revenue recognition guidance and most industry-specific guidance applicable to revenue recognition. The guidance requires a company to recognize revenue when it transfers promised goods or services to customers. Recognition should be in an amount that reflects the consideration to which the company expects to be entitled in exchange for those services. The guidance requires enhanced disclosures to help users of financial statements better understand the nature, amount, timing, and uncertainty of revenues recognized. In July 2015, the FASB deferred the effective date of the new revenue recognition standard by one year, and it is effective for interim and annual periods beginning after December 15, 2017. Early adoption is permitted, but no earlier than the original effective date of January 1, 2017. The Company is currently assessing the impact of adopting this guidance on its Consolidated Financial Statements.
Previously Reported Restatement
As previously disclosed in the Company's Annual Report on Form 10-K for the year ended December 31, 2015, the Company had previously determined that there were errors in the manner in which the Company accounted for income taxes as of and for the year ended December 31, 2014 under ASC 740, Income Taxes. These errors related primarily to the manner in which certain intercompany payables and receivables among domestic and overseas subsidiaries of the Company were treated for accounting and tax purposes during the impacted periods. Accordingly, the consolidated financial statements of the Company as of and for the years ended December 31, 2014 included in this report reflect the Company's previously report restatement to reflect the correction of these errors. In addition, certain other adjustments, previously determined to be immaterial individually and in the aggregate, have also been corrected in the restated financial statements.
The following tables reflect the financial statement line items for the year ended December 31, 2014 impacted by the previously disclosed restatement. The column headed "Tax Adjustment" reflects the impact of the tax matters discussed above, while the "All Other Adjustments" column reflects the impact of the other previously identified immaterial adjustments in the Consolidated Balance Sheet and Statements of Income and Comprehensive Income. The column headed "Adjustments"
F-18
reflects the impact of the tax matters discussed above as well as the impact of the other previously identified immaterial adjustments in the Consolidated Statement of Cash Flows. For the avoidance of doubt, the following tables include only those line items impacted by the restatement and are unchanged from the information presented in the Company's Annual Report on Form 10-K for the year ended December 31, 2015.
Consolidated Statements of Income and Comprehensive Income
For the Fiscal Year Ended December 31, 2014 | |||||||||||||||
As Reported | Tax Adjustment | Other Adjustments | Restated | ||||||||||||
REVENUE: | |||||||||||||||
Retail revenue(1) | $ | 293,122 | $ | — | $ | (344 | ) | $ | 292,778 | ||||||
Institutional revenue(1) | 34,518 | — | — | 34,518 | |||||||||||
Futures revenue(1) | 36,160 | — | — | 36,160 | |||||||||||
Total non-interest revenue | 368,704 | — | (344 | ) | 368,360 | ||||||||||
Net revenue | $ | 369,533 | $ | — | $ | (344 | ) | $ | 369,189 | ||||||
EXPENSES: | |||||||||||||||
Employee compensation and benefits | $ | 99,485 | $ | — | $ | (252 | ) | $ | 99,233 | ||||||
Referral fees | 91,092 | — | (120 | ) | 90,972 | ||||||||||
Trading expenses | 26,285 | — | (117 | ) | 26,168 | ||||||||||
General and administrative | 38,509 | — | 142 | 38,651 | |||||||||||
Depreciation and amortization | 7,125 | — | (515 | ) | 6,610 | ||||||||||
Restructuring expenses | 1,214 | — | 1,120 | 2,334 | |||||||||||
Total operating expense | 317,334 | — | 258 | 317,592 | |||||||||||
OPERATING PROFIT | 52,199 | — | (602 | ) | 51,597 | ||||||||||
INCOME BEFORE INCOME TAX EXPENSE | 46,052 | — | (602 | ) | 45,450 | ||||||||||
Income tax (benefit)/expense | 12,993 | 6,200 | (53 | ) | 19,140 | ||||||||||
NET INCOME | 33,059 | (6,200 | ) | (549 | ) | 26,310 | |||||||||
NET INCOME APPLICABLE TO GAIN CAPITAL HOLDINGS, INC. | 31,626 | (6,200 | ) | (549 | ) | 24,877 | |||||||||
Other comprehensive (loss)/income: | |||||||||||||||
Foreign currency translation adjustment | (4,630 | ) | 541 | (4,089 | ) | ||||||||||
NET COMPREHENSIVE INCOME APPLICABLE TO GAIN CAPITAL HOLDINGS, INC. | $ | 26,996 | $ | (5,659 | ) | $ | (549 | ) | $ | 20,788 | |||||
Earnings per common share: | |||||||||||||||
Basic | $ | 0.76 | $ | (0.16 | ) | $ | (0.04 | ) | $ | 0.56 | |||||
Diluted | $ | 0.71 | $ | (0.14 | ) | $ | (0.04 | ) | $ | 0.53 | |||||
(1) - The Company has changed its revenue presentation, see Note 1 for detail
F-19
Consolidated Statement of Changes in Shareholders' Equity
Additional Paid in Capital | Retained Earnings | Accumulated Other Comprehensive Income/(Loss) | Total | ||||||||||||||||||||||||||||
As Reported | As Restated | As Reported | As Restated | As Reported | As Restated | As Reported | As Restated | ||||||||||||||||||||||||
BALANCE—January 1, 2014 | $ | 138,691 | $ | 134,399 | $ | 108,603 | $ | 105,217 | $ | 2,576 | $ | 2,576 | $ | 234,401 | $ | 226,723 | |||||||||||||||
BALANCE—December 31, 2014 | $ | 152,684 | $ | 148,378 | $ | 130,984 | $ | 119,775 | $ | (2,054 | ) | $ | (1,513 | ) | $ | 264,894 | $ | 249,920 | |||||||||||||
Consolidated Statement of Cash Flows
For the Fiscal Year Ended December 31, 2014 | |||||||||||
As Reported | Adjustments | As Restated | |||||||||
CASH FLOWS FROM OPERATING ACTIVITIES: | |||||||||||
Net income | $ | 33,059 | $ | (6,749 | ) | $ | 26,310 | ||||
Adjustments to reconcile net income to cash provided by / (used for) operating activities | |||||||||||
Depreciation and amortization | 16,367 | (1,677 | ) | 14,690 | |||||||
Non-cash integration costs | — | 1,162 | 1,162 | ||||||||
Deferred tax (benefit)/expense | 2,536 | 2,572 | 5,108 | ||||||||
Changes in operating assets and liabilities: | |||||||||||
Cash and securities held for customers | (9,679 | ) | 419 | (9,260 | ) | ||||||
Receivables from brokers | 94,657 | 276 | 94,933 | ||||||||
Prepaid assets | 2,729 | 1 | 2,730 | ||||||||
Other assets | (11,536 | ) | 3,041 | (8,495 | ) | ||||||
Payables to customers | 9,679 | (419 | ) | 9,260 | |||||||
Accrued compensation and benefits | 3,671 | 826 | 4,497 | ||||||||
Accrued expenses and other liabilities | (8,565 | ) | 6,143 | (2,422 | ) | ||||||
Income tax payable | (2,832 | ) | (6,980 | ) | (9,812 | ) | |||||
Cash provided by / (used for) operating activities | 138,173 | (1,385 | ) | 136,788 | |||||||
Effect of exchange rate changes on cash and cash equivalents | 2,760 | 1,333 | 4,093 | ||||||||
INCREASE/ (DECREASE) IN CASH AND CASH EQUIVALENTS | 99,532 | (52 | ) | 99,480 | |||||||
CASH AND CASH EQUIVALENTS—End of year | $ | 139,403 | $ | (52 | ) | $ | 139,351 | ||||
SUPPLEMENTARY DISCLOSURES OF CASH FLOW INFORMATION: | |||||||||||
Adjustment to redemption value of non-controlling interests | $ | (978 | ) | $ | (1,129 | ) | $ | (2,107 | ) | ||
3. FAIR VALUE INFORMATION
Accounting guidance defines fair value as the price that would be received in exchange for an asset or paid to transfer a liability in an orderly transaction between market participants at the measurement date. The guidance establishes a three level hierarchy that ranks the quality and reliability of information used in developing fair value estimates for financial instruments. The hierarchy gives the highest priority to quoted prices in active markets and the lowest priority to unobservable data. In cases where two or more levels of inputs are used to determine fair value, a financial instrument's level is determined based on the
F-20
lowest level input that is considered significant to the fair value measurement in its entirety. The three levels of fair value hierarchy are summarized below:
Level 1 - Unadjusted quoted prices in active markets that are accessible at the measurement date for identical, unrestricted assets or liabilities;
Level 2 - Quoted prices in markets that are not considered to be active or financial instruments for which all significant inputs are observable, either directly or indirectly; and
Level 3 - Valuations that require inputs that are both unobservable to a market participant and significant to the fair value measurement.
For assets and liabilities that are transferred between levels during the period, fair values are ascribed as if the assets or liabilities had been transferred as of the beginning of the period.
The following table presents the Company’s assets and liabilities that were measured at fair value on a recurring basis during the reporting period and the related hierarchy levels (amounts in thousands):
Fair Value Measurements on a Recurring Basis as of December 31, 2016 | |||||||||||||||
Level 1 | Level 2 | Level 3 | Total | ||||||||||||
Financial Assets (Liabilities): | |||||||||||||||
Cash and cash equivalents: | |||||||||||||||
Money market accounts | $ | 120,927 | $ | — | $ | — | $ | 120,927 | |||||||
Cash and securities held for customers: | |||||||||||||||
US treasury bills: U.S. government and agency securities | 135,974 | — | — | 135,974 | |||||||||||
Receivable from brokers: | |||||||||||||||
Broker derivative contracts | — | 5,228 | — | 5,228 | |||||||||||
Other assets: | |||||||||||||||
Certificates of deposit | 175 | — | — | 175 | |||||||||||
Other | 115 | — | — | 115 | |||||||||||
Payables to customers: | |||||||||||||||
Customer derivative contracts | — | 115,677 | — | 115,677 | |||||||||||
Total | $ | 257,191 | $ | 120,905 | $ | — | $ | 378,096 | |||||||
Fair Value Measurements on a Recurring Basis as of December 31, 2015 | |||||||||||||||
Level 1 | Level 2 | Level 3 | Total | ||||||||||||
Financial Assets (Liabilities): | |||||||||||||||
Cash and cash equivalents: | |||||||||||||||
Money market accounts | $ | 25,167 | $ | — | $ | — | $ | 25,167 | |||||||
Receivable from brokers: | |||||||||||||||
Broker derivative contracts | — | (12,568 | ) | — | (12,568 | ) | |||||||||
Other assets: | |||||||||||||||
Certificates of deposit | 174 | — | — | 174 | |||||||||||
Investment in gold | 107 | — | — | 107 | |||||||||||
Payables to customers: | |||||||||||||||
Customer derivative contracts | — | 143,918 | — | 143,918 | |||||||||||
Total | $ | 25,448 | $ | 131,350 | $ | — | $ | 156,798 | |||||||
The Company has not changed its valuation techniques in measuring the fair value of any financial assets and liabilities during the years ended December 31, 2016 and December 31, 2015, nor has there been any movement between levels during these respective periods.
F-21
Level 1 Financial Assets
The Company has U.S. Treasury bills, money market accounts and certificates of deposit that are Level 1 financial instruments that are recorded based upon listed or quoted market rates. The U.S. Treasury bills and money market accounts are recorded in Cash and cash equivalents and Cash and securities held for customers and the certificates of deposit are recorded in Other Assets.
Level 2 Financial Assets and Liabilities
The Company has customer derivative contracts that are Level 2 financial instruments recorded in Payables to customers.
The Company has broker derivative contracts that are Level 2 financial instruments recorded in Receivables from brokers.
The fair values of these Level 2 financial instruments are based upon directly observable values for underlying instruments.
Level 3 Financial Liabilities
The Company did not have any Level 3 Financial Assets or Liabilities on December 31, 2016 or December 31, 2015.
Financial Instruments Not Measured at Fair Value
The table below presents the carrying value, fair value and fair value hierarchy category of certain financial instruments that are not measured at fair value in the consolidated balance sheets (amounts in thousands).
Receivables from brokers comprise open trades, which are measured at fair value (disclosed above), and the Company's deposits, which are not measured at fair value but approximate fair value. These deposits approximate fair value because they are cash balances that the Company may withdraw at its discretion. Settlement would occur within a relatively short period of time once a withdrawal is initiated.
Payables to customers comprise open trades, which are measured at fair value (disclosed above), and customer deposits that the Company holds for its role as clearing broker. These deposits are not measured at fair value, but approximate fair value, because they are cash balances that the Company or its customers can settle at either party's discretion. Such settlement would occur within a relatively short period of time once a withdrawal is initiated.
The carrying value of Convertible senior notes represents the notes’ principal amounts net of unamortized discount (see Note 13). The Company assessed the notes' fair value as determined by current Company-specific and risk free interest rates as of the balance sheet date.
(amounts in thousands) | As of December 31, 2016 | Fair Value Measurements using: | |||||||||||||||||
Carrying Value | Fair Value | Quoted Prices in Active Markets for Identical Assets (Level 1) | Significant Observable Inputs (Level 2) | Significant Unobservable Inputs (Level 3) | |||||||||||||||
Financial Assets: | |||||||||||||||||||
Receivables from brokers | $ | 55,868 | $ | 55,868 | $ | — | $ | 55,868 | $ | — | |||||||||
Financial Liabilities: | |||||||||||||||||||
Payables to customers | $ | 1,061,146 | $ | 1,061,146 | $ | — | $ | 1,061,146 | $ | — | |||||||||
Convertible senior notes | $ | 124,769 | $ | 122,544 | $ | — | $ | 122,544 | $ | — | |||||||||
As of December 31, 2015 | Fair Value Measurements using: | ||||||||||||||||||
Carrying Value | Fair Value | Quoted Prices in Active Markets for Identical Assets (Level 1) | Significant Observable Inputs (Level 2) | Significant Unobservable Inputs (Level 3) | |||||||||||||||
Financial Assets: | |||||||||||||||||||
Receivables from brokers | $ | 133,721 | $ | 133,721 | $ | — | $ | 133,721 | $ | — | |||||||||
Financial Liabilities: | |||||||||||||||||||
F-22
Payables to customers | $ | 1,064,539 | $ | 1,064,539 | $ | — | $ | 1,064,539 | $ | — | |||||||||
Convertible senior notes | $ | 121,740 | $ | 122,264 | $ | — | $ | 122,264 | $ | — | |||||||||
F-23
4. DERIVATIVES
The Company's contracts with its customers and its liquidity providers are deemed to be derivative instruments. The table below represents the fair values of the Company’s derivative instruments reported within Receivables from brokers and Payables to customers on the accompanying Consolidated Balance Sheets (amounts in thousands):
December 31, 2016 | |||||||||||
Gross amounts of assets for derivative open positions at fair value | Gross amount of (liabilities) for derivative open positions at fair value | Net amounts of assets/(liabilities) for derivative open positions at fair value | |||||||||
Derivative Instruments: | |||||||||||
Foreign currency exchange contracts | $ | 130,301 | $ | (59,631 | ) | $ | 70,670 | ||||
CFD contracts | 74,443 | (37,241 | ) | 37,202 | |||||||
Metals contracts | 18,766 | (5,733 | ) | 13,033 | |||||||
Total | $ | 223,510 | $ | (102,605 | ) | $ | 120,905 | ||||
December 31, 2016 | |||||||||||
Cash Collateral | Net amounts of assets/(liabilities) for derivative open positions at fair value | Net amounts of assets/(liabilities) presented in the balance sheet | |||||||||
Derivative Assets/(Liabilities:) | |||||||||||
Receivables from brokers | $ | 55,868 | $ | 5,228 | $ | 61,096 | |||||
Payables to customers | $ | (1,061,145 | ) | $ | 115,677 | $ | (945,468 | ) | |||
December 31, 2015 | |||||||||||
Gross amounts of assets for derivative open positions at fair value | Gross amount of (liabilities) for derivative open positions at fair value | Net amounts of assets/(liabilities) for derivative open positions at fair value | |||||||||
Derivative Instruments: | |||||||||||
Foreign currency exchange contracts | $ | 138,140 | $ | (59,468 | ) | $ | 78,672 | ||||
CFD contracts | 111,844 | (70,429 | ) | 41,415 | |||||||
Metals contracts | 18,866 | (7,603 | ) | 11,263 | |||||||
Total | $ | 268,850 | $ | (137,500 | ) | $ | 131,350 | ||||
December 31, 2015 | |||||||||||
Cash Collateral | Net amounts of assets/(liabilities) for derivative open positions at fair value | Net amounts of assets/(liabilities) presented in the balance sheet | |||||||||
Derivative Assets/(Liabilities): | |||||||||||
Receivables from brokers | $ | 133,721 | $ | (12,568 | ) | $ | 121,153 | ||||
Payables to customers | $ | (1,064,539 | ) | $ | 143,918 | $ | (920,621 | ) | |||
The Company’s derivatives include different underlyings which vary in price. Foreign exchange contracts typically have prices less than two dollars, while certain metals contracts and CFDs can have considerably higher prices. The amounts reported within Receivables from brokers and Payables to customers on the Consolidated Balance Sheets are derived from the number of contracts below (amounts in thousands):
F-24
December 31, 2016 | |||||
Total contracts in long positions | Total contracts in short positions | ||||
Derivative Instruments: | |||||
Foreign currency exchange contracts | 2,427,066 | 2,288,386 | |||
CFD contracts | 112,685 | 156,308 | |||
Metals contracts | 820 | 341 | |||
Total | 2,540,571 | 2,445,035 | |||
December 31, 2015 | |||||
Total contracts in long positions | Total contracts in short positions | ||||
Derivative Instruments: | |||||
Foreign currency exchange contracts | 3,106,885 | 2,931,109 | |||
CFD contracts | 139,465 | 285,640 | |||
Metals contracts | 1,278 | 308 | |||
Total | 3,247,628 | 3,217,057 | |||
The Company did not designate any of its derivatives as hedging instruments. Net gains with respect to derivative instruments reflected in Retail Revenue in the accompanying Consolidated Statements of Income and Comprehensive Income for the years ended December 31, 2016 and 2015 were as follows (amounts in thousands):
For the Years Ended December 31, | |||||||
2016 | 2015 | ||||||
Derivative Instruments: | |||||||
Foreign currency exchange contracts | $ | 163,096 | $ | 163,315 | |||
CFD contracts | 128,737 | 151,553 | |||||
Metals contracts | 38,089 | 28,918 | |||||
Total | $ | 329,922 | $ | 343,786 | |||
5. RECEIVABLES FROM BROKERS
The Company has posted funds with brokers as collateral required by agreements for holding trading positions. These amounts are reflected as Receivables from brokers on the Consolidated Balance Sheets.
Amounts receivable from brokers consisted of the following as of (amounts in thousands):
December 31, 2016 | December 31, 2015 | ||||||
Required collateral | $ | 55,868 | $ | 129,042 | |||
Excess from futures broker - restricted | — | 4,679 | |||||
Open foreign exchange positions | 5,228 | (12,568 | ) | ||||
Total | $ | 61,096 | $ | 121,153 | |||
F-25
6. PROPERTY AND EQUIPMENT
Property and equipment, including leasehold improvements and capitalized software development costs, consisted of the following as of (amounts in thousands):
December 31, 2016 | December 31, 2015 | ||||||
Software | $ | 52,891 | $ | 44,194 | |||
Computer equipment | 19,797 | 14,300 | |||||
Leasehold improvements | 11,055 | 11,200 | |||||
Telephone equipment | 778 | 881 | |||||
Office equipment | 2,138 | 2,113 | |||||
Furniture and fixtures | 2,285 | 1,761 | |||||
Web site development costs | 644 | 668 | |||||
Gross property and equipment | 89,588 | 75,117 | |||||
Less: Accumulated depreciation and amortization | (53,126 | ) | (44,750 | ) | |||
Property and equipment, net | $ | 36,462 | $ | 30,367 | |||
Depreciation and amortization expense for property and equipment was $13.9 million, $11.1 million and $6.6 million for the years ended December 31, 2016, 2015 and 2014, respectively.
The Company adjusted the amortization period of certain property and equipment that experienced changes in useful lives as a result of the City Index acquisition. This change in useful lives resulted in an additional charge of $0.4 million and $5.4 million for the years ended December 31, 2016 and December 31, 2015, respectively. The additional charge was recorded in Integration expenses.
In addition, the Company wrote off certain property and equipment that became obsolete as a result of the City Index acquisition. This resulted in an additional charge of $1.9 million for the year ended December 31, 2015. The additional charge was recorded in Integration expenses. There was no additional charge incurred for the year ended December 31, 2016.
F-26
7. INTANGIBLE ASSETS
The Company's various intangible assets consisted of the following as of (amounts in thousands):
December 31, 2016 | December 31, 2015 | ||||||||||||||||||||||
Intangibles | Gross | Accumulated Amortization | Net | Gross | Accumulated Amortization | Net | |||||||||||||||||
Customer list | $ | 50,253 | $ | (20,928 | ) | $ | 29,325 | $ | 56,388 | $ | (14,111 | ) | $ | 42,277 | |||||||||
Technology | 70,145 | (37,074 | ) | 33,071 | 74,378 | (32,117 | ) | 42,261 | |||||||||||||||
Trademark | 7,104 | (2,505 | ) | 4,599 | 8,289 | (1,678 | ) | 6,611 | |||||||||||||||
Total finite lived intangibles | $ | 127,502 | $ | (60,507 | ) | $ | 66,995 | $ | 139,055 | $ | (47,906 | ) | $ | 91,149 | |||||||||
Trademarks not subject to amortization(1) | 363 | — | 363 | 363 | — | 363 | |||||||||||||||||
Total intangibles assets | $ | 127,865 | $ | (60,507 | ) | $ | 67,358 | $ | 139,418 | $ | (47,906 | ) | $ | 91,512 | |||||||||
(1) These indefinite-life trademarks relate to the Forex.com and foreignexchange.com domain names where management determined there was no legal, regulatory or technological limitation on their useful lives. The Company compares the recorded value of the indefinite-life intangible assets to their fair value on an annual basis and whenever circumstances arise that indicate that impairment may have occurred.
The Company had the following identifiable intangible assets and weighted average amortization periods as of December 31, 2016:
Intangible Asset | Amount (in thousands) | Weighted average amortization period | |||
Customer list | $ | 50,253 | 7.6 years | ||
Technology | 70,145 | 9.0 years | |||
Trademark(1) | 7,467 | 6.7 years | |||
Total intangible assets | $ | 127,865 | |||
(1) Trademarks with an indefinite life, as described above, comprise $0.4 million of the $7.5 million of trademarks.
The final purchase price allocations to intangible assets for the acquisition of City Index are detailed below in Note 10.
Amortization expense for the purchased intangibles was $15.0 million, $16.6 million and $8.1 million for the years ended December 31, 2016, 2015 and 2014, respectively.
The Company adjusted the amortization period of certain intangible assets that experienced changes in useful lives as a result of the City Index acquisition. This change in useful lives resulted in no additional charge for the year ended December 31, 2016, and $19.7 million for the year ended December 31, 2015, respectively. The additional charges were recorded in Integration expenses.
Future annual estimated amortization expense is as follows (amounts in thousands):
Years Ended December 31: | |||
2017 | $ | 13,126 | |
2018 | 11,978 | ||
2019 | 9,770 | ||
2020 | 8,931 | ||
2021 | 8,859 | ||
Thereafter | 14,331 | ||
Total | $ | 66,995 | |
Goodwill
Goodwill is evaluated for impairment on an annual basis during the fourth quarter and in interim periods when events or changes indicate the carrying value may not be recoverable. The Company operates under three reporting units, retail,
F-27
institutional and futures. There were no additions or impairments to the carrying value of the Company’s goodwill during the year ended December 31, 2016.
For the year ended December 31, 2016, the Company elected to perform a qualitative analysis to determine whether it was more likely than not that the fair value of its reporting units was less than their carrying value. As a result of this assessment, the Company determined that it was not necessary to perform a quantitative impairment test and concluded that goodwill assigned to each of its reporting units was not impaired at December 31, 2016.
As of December 31, 2016 and December 31, 2015, the Company had recorded goodwill of approximately $32.1 million and $34.0 million, respectively. The decrease of $1.9 million was related to foreign currency translation adjustments.
The following represents the changes in the carrying amount of goodwill by segment for 2016 and 2015:
Retail | Institutional | Futures | Total | |||||||||
Carrying amount of goodwill as of December 31, 2015 | $ | 26,722 | $ | 4,788 | $ | 2,507 | $ | 34,017 | ||||
Foreign currency translation adjustments | (1,500 | ) | (269 | ) | (141 | ) | (1,910 | ) | ||||
Carrying amount of goodwill as of December 31, 2016 | $ | 25,222 | $ | 4,519 | $ | 2,366 | $ | 32,107 | ||||
8. OTHER ASSETS
Other assets consisted of the following as of (amounts in thousands):
December 31, 2016 | December 31, 2015 | ||||||
Vendor and security deposits | $ | 9,670 | $ | 11,486 | |||
Income tax receivable | 1,017 | 9,482 | |||||
Deferred tax assets, net | 15,071 | 17,827 | |||||
GTX trade receivables | 7,515 | 4,881 | |||||
Customer debit positions | 9,781 | 7,340 | |||||
Allowance on customer debit positions | (9,237 | ) | (6,832 | ) | |||
Insurance receivable | 3,500 | — | |||||
Prepaid assets | 8,300 | 7,835 | |||||
Miscellaneous receivables | 6,615 | 2,160 | |||||
Equity method investment | 601 | 822 | |||||
$ | 52,833 | $ | 55,001 | ||||
9. RELATED PARTY TRANSACTIONS
Certain officers and directors of the Company have personal funds on deposit in separate customer accounts with the Company. These accounts are recorded in Payables to customers on the consolidated balance sheets. The aggregate amount of these funds was $0.3 million and $0.3 million at December 31, 2016 and December 31, 2015, respectively.
IPGL Limited, the majority selling shareholder in the acquisition of City Index, has a trading account with the Company which is recorded in Payables to customers on the consolidated balance sheet. The aggregate amount of these funds was $3.8 million and $21.7 million at December 31, 2016 and December 31, 2015, respectively.
10. ACQUISITIONS
City Index (Holdings) Limited
F-28
On April 1, 2015, the Company acquired the entire issued and outstanding share capital of City Index. City Index is a global online trading firm specializing in offering CFDs, forex and spread betting for retail customers. This acquisition was made to strengthen and diversify the Company's existing global footprint in the retail business.
The purchase price consisted of approximately $6.1 million in cash, inclusive of working capital adjustments and $1.0 million in cash to be held in escrow; 5,319,149 shares of the Company's common stock, inclusive of 4,787,234 shares to be held in escrow; and 4.125% unsecured Convertible Senior Notes with an aggregate principal amount of $60.0 million and fair value of $65.0 million, inclusive of an aggregate principal amount of $54.0 million to be held in escrow. In addition, the Company paid City Index approximately$22.4 million, which was used to settle certain inter-company liabilities between City Index and City Index Group Limited (its former parent company).
The purchase price was derived as follows (amounts in thousands):
Cash | $ | 6,103 | |
Convertible senior notes | 65,000 | ||
Common stock issued | 45,100 | ||
Total purchase price | $ | 116,203 | |
The purchase price of City Index was allocated to the fair value of various assets and liabilities as follows (amounts in thousands):
Cash | $ | 10,546 | |
Cash and securities held for customers | 281,576 | ||
Receivable from brokers | 35,974 | ||
Property and equipment | 10,466 | ||
Prepaid assets | 4,038 | ||
Other assets | 5,119 | ||
Total tangible assets | 347,719 | ||
Total liabilities assumed | 299,000 | ||
Net assets acquired | 48,719 | ||
Identifiable intangible assets: | |||
Customer list | 34,277 | ||
Trade name | 6,645 | ||
Technology | 26,157 | ||
Intangible assets, net | 67,079 | ||
Goodwill | $ | 405 | |
Acquisition expenses were $2.8 million for the year ended December 31, 2015. They were recorded in Acquisition Expense.
For the period from acquisition to December 31, 2015, revenues generated by City Index were $136.0 million, of which $30.8 million have been eliminated in consolidation, and expenses were $95.0 million of which $2.3 million have been eliminated in consolidation. City Index generated income before taxes of $41.0 million, of which $28.5 million has been eliminated in consolidation.
The weighted average lives of City Index's intangible assets are 7.6 years for customer lists, 6.7 years for trade names, and 9.0 years for technology.
Pro Forma Information (unaudited):
The following unaudited pro forma data is presented as if the acquisition of City Index had occurred on January 1, 2015. The unaudited pro forma data does not include the impact of forecasted operating expense synergies.
The unaudited pro forma data is provided for informational purposes only and may not necessarily be indicative of future results of operations or what the results of operations would have been had the Company and City Index operated as a combined entity for the periods presented.
F-29
Unaudited pro forma income statement line items for the twelve months ended December 31, 2015 were as follows (amounts in thousands):
For the Fiscal Year Ended December 31, | |||
2015 | |||
REVENUE: | |||
Total non-interest revenue | $ | 471,959 | |
Interest revenue | 1,303 | ||
Interest expense | 1,049 | ||
Total net interest revenue | 254 | ||
Net revenue | 472,213 | ||
EXPENSES: | |||
Depreciation and amortization | 11,753 | ||
Purchased intangible amortization | 18,619 | ||
Other expense items | 424,229 | ||
Total operating expense | 454,601 | ||
OPERATING PROFIT | 17,612 | ||
Interest on long term borrowings | 10,267 | ||
Gain on extinguishment of debt | — | ||
Impairment of investment | — | ||
INCOME BEFORE INCOME TAX EXPENSE | 7,345 | ||
Income tax expense | 126 | ||
NET INCOME | 7,219 | ||
Net income attributable to non-controlling interests | 1,660 | ||
Net income applicable to Gain Capital Holdings, Inc. | $ | 5,559 | |
Restructuring
During 2016 and 2015, the Company incurred restructuring expenses related to the global headcount reductions following the City Index acquisition. The Company incurred $1.0 million and $3.5 million of restructuring expenses for the twelve months ended December 31, 2016 and December 31, 2015, respectively. These expenses reflected the cost of reducing global headcount following the City Index acquisition and are recorded in Restructuring expenses in the Consolidated Statements of Income and Comprehensive Income. The restructuring liabilities have all been paid as of December 31, 2016.
(in thousands) | |||
Restructuring liability as of January 1, 2015 | $ | 375 | |
2015 restructuring expenses | 3,482 | ||
Payments made in 2015 | (3,358 | ) | |
Liability as of December 31, 2015 | 499 | ||
2016 restructuring expenses | 1,041 | ||
Payments made in 2016 | (1,540 | ) | |
Liability as of December 31, 2016 | $ | — | |
11. NON-CONTROLLING INTERESTS
Non-controlling interests
In March 2014, the Company acquired controlling interests in GAA and Top Third. The Company purchased 55% of each entity, and the respective sellers maintained a 45% interest in each entity, subject to immediately exercisable call options for the Company to purchase the the remaining interests, as well as put options for the sellers to sell their remaining interests in each
F-30
entity to the Company that were to become exercisable in 2017. In December 2016, the Company acquired an additional 24% of each entity and, accordingly, the respective sellers now maintain a 21% interest in each entity. In connection with the purchase of these additional interests, the Company and the respective sellers agreed that neither would exercise the call options or put options with respect to the remaining interests prior to December 31, 2017.
In accordance with ASC 480-10-S99-3A, Classification and Measurement of Redeemable Securities, non-controlling interests are classified outside of permanent equity as their redemption is not (i) mandatory, (ii) at fixed prices, and (iii) exclusively within the Company's control.
The non-controlling interests are not classified as liabilities, because redemption is not mandatory or at fixed prices. They are not classified as equity because their redemption is not exclusively in the Company's control. Therefore, the non-controlling interests are held in temporary equity in the Consolidated Balance Sheets.
The non-controlling interests' carrying value is determined by the Company's purchase prices and the non-controlling interests' share of the Company's subsequent net income. This value is benchmarked against the redemption value of the sellers' put options. The carrying value is adjusted to the latter, provided that it does not fall below the initial carrying values, as determined by the Company's purchase price allocation. The Company reflects any changes caused by such an adjustment in retained earnings, rather than in current earnings.
The table below reflects the non-controlling interests effects on the Company's financial statements:
Redeemable non-controlling interests | |||
December 31, 2014 | 11,338 | ||
Adjustment to the redemption value of non-controlling interests | (308 | ) | |
Net income attributable to non-controlling interests | 1,660 | ||
Distributions to non-controlling interest holders | (1,644 | ) | |
December 31, 2015 | $ | 11,046 | |
Purchase of additional shares of non-controlling interest | (7,444 | ) | |
Adjustment to fair value of non-controlling interests | (258 | ) | |
Adjustment to the redemption value of non-controlling interests | 2,715 | ||
Net income attributable to non-controlling interests | 2,140 | ||
Distributions to non-controlling interest holders | (1,605 | ) | |
December 31, 2016 | $ | 6,594 | |
12. SHAREHOLDERS' EQUITY
Common Stock — At December 31, 2016 and 2015, the Company had authorized 120,000,000 shares of Common Stock, of which 52,848,811 and 48,220,243 shares were issued and outstanding, respectively as of December 31, 2016, and 52,072,884 and 48,771,015 shares were issued and outstanding, respectively as of December 31, 2015.
Treasury Stock — As of December 31, 2016 and 2015, the Company had repurchased 4.6 million shares and 3.3 million shares, respectively, of outstanding Common Stock for an aggregate cost of $30.8 million and $21.8 million, respectively, reducing the number of shares outstanding.
Dividends — In March, May, August and November of 2016, the Company announced the quarterly dividend payments of $0.05, $0.05, $0.05 and $0.06 per share of Common Stock, respectively. In February, May, July and November of 2015 and 2014, the Company announced the quarterly dividend payment of a $0.05 per share of Common Stock for each quarter. The dividend payments were paid in March, June, September and December of each year for an aggregate amount of $10.2 million, $9.5 million and $8.1 million for the years ended December 31, 2016, 2015, and 2014, respectively, which resulted in a reduction to Retained Earnings.
F-31
13. CONVERTIBLE SENIOR NOTES
Convertible Senior Notes due 2020
On April 1, 2015, as part of the City Index acquisition consideration, the Company issued to the sellers $60.0 million aggregate principal amount of 4.125% Convertible Senior Notes maturing on April 1, 2020. These Convertible Senior Notes pay interest semi-annually on April 1 and October 1 at a rate of 4.125% per year, which commenced on October 1, 2015.
Prior to the date that is six months immediately preceding the maturity date, the Convertible Notes will be convertible only upon the occurrence of specified events set forth in the Note Indenture. Thereafter, until the close of business on the business day immediately preceding the maturity date, holders may convert their Convertible Notes at any time. The Company will settle conversions of the Convertible Notes by paying or delivering, as the case may be, cash, shares of Common Stock or a combination thereof, at its election. The conversion rate for the Convertible Notes will be equal to $1,000, divided by the initial conversion price, rounded to the nearest 1/10,000th share of Common Stock. The initial conversion price will be equal to 125% of the arithmetic average of the daily volume-weighted average price for the Common Stock over the 20 consecutive trading day period ending on, and including, the trading day immediately preceding the closing date; provided that the initial conversion price shall not exceed the greater of (i) $9.25 and (ii) the last reported sale price of the Common Stock on the Closing Date; and shall not be less than $7.20. The conversion rate and the corresponding conversion price will be subject to customary anti-dilution adjustments, as described in the Note Indenture, including, but not limited to, Common Stock splits, Common Stock combinations, issuances of Common Stock as a dividend on the Common Stock, issuances of options rights, warrants or other securities of the Company as a dividend on the Common Stock, payment by the Company of any cash dividend in excess of $0.05 per quarter per share of Common Stock, and above-market tender offers or exchange offers by the Company or its subsidiaries for the Common Stock. In addition, in certain circumstances, the Company may be required to increase the conversion rate for any Convertible Notes converted in connection with a make-whole fundamental change as defined in the Note Indenture.
If the Company undergoes a fundamental change, holders may require the Company to repurchase for cash all or part of their Convertible Notes at a purchase price equal to 100% of the principal amount of the Convertible Notes to be repurchased, plus accrued and unpaid interest to, but excluding, the date of repurchase.
Prior to the date that is two years immediately preceding the maturity date, the Company will not have the right to redeem the Convertible Notes. During the two year period immediately preceding the maturity date, the Company may redeem for cash all, but not less than all, of the Convertible Notes if the last reported sale price of the Common Stock equals or exceeds 130% of the conversion price for the Convertible Notes for at least 20 trading days, whether or not consecutive, during the 30 consecutive trading day period ending on the trading day immediately preceding the date the Company delivers notice of
redemption. If the Company elects to redeem the Convertible Notes, holders may convert their Convertible Notes at any time prior to the close of business on the business day immediately preceding the redemption date.
The Indenture will contain events of default customary for convertible debt securities (with customary grace periods, as applicable) and will provide that, upon the occurrence of an event of default arising from certain events of bankruptcy or insolvency with respect to the Company, all outstanding Convertible Notes will become due and payable immediately without further action or notice. If any other type of event of default occurs and is continuing, then the holders of at least 25% in aggregate principal amount of the then outstanding Convertible Notes or the trustee may declare all of the outstanding Convertible Notes to be due and payable immediately.
Convertible Senior Notes due 2018
On November 27, 2013, the Company issued $80.0 million principal amount of 4.125% Convertible Senior Notes maturing on December 1, 2018. The Company received net proceeds of $77.9 million, after deducting the initial purchasers' discount. These Convertible Senior Notes pay interest semi-annually on June 1 and December 1 at a rate of 4.125% per year, which commenced on June 1, 2014. During the first quarter of 2016, the Company repurchased $1.9 million in principal amount of the convertible senior notes due in 2018, for an aggregate purchase price of $1.7 million.
The Convertible Senior Notes will be convertible at an initial conversion rate of 83.33 shares of the Company's common stock per $1,000 principal amount, which is equivalent to an initial conversion price of approximately $12.00. In addition, following certain corporate transactions occurring prior to the maturity date, the Company will, in certain circumstances, increase the conversion rate for a holder electing to convert notes in connection with such corporate transaction. Upon conversion, the Company will deliver cash up to the principal amount. With respect to any conversion value in excess of the principal amount, the Company will deliver shares of its common stock, unless it elects to deliver cash in lieu of all or a portion of such shares.
F-32
Holders may convert notes in integral multiples of $1,000 principal amount, at any time prior to the close of business on the business day immediately preceding June 1, 2018, but only in the following circumstances:
• | During any calendar quarter commencing after the calendar quarter ending on March 31, 2014 (and only during such quarter), the last reported sale price of the Company’s common stock for each of at least 20 of the preceding 30 trading days, ending on and including the last trading day of the quarter exceeds 130% of the conversion price. These days need not be consecutive; |
• | During the five consecutive business day period immediately after any five consecutive trading day period (such five consecutive trading day period being referred to as the “measurement period”), in which the trading price (as defined in the offering memorandum) per $1,000 principal amount of the notes, as determined following a request by a holder of the notes in the manner described in the offering memorandum, for each trading day of the measurement period, was less than 98% of the product of the last reported sale price of the Company's common stock and the conversion rate on such trading day; |
• | Upon the occurrence of specified corporate events (as described in the offering memorandum); or |
• | If the Company has called the notes for redemption (as described in the offering memorandum). |
In addition, regardless of the foregoing circumstances, holders may convert their notes at any time on or after June 1, 2018 until the close of business on the business day immediately preceding the maturity date.
In addition, if the Company undergoes a fundamental change (as defined in the Note indenture), holders may, subject to certain conditions, require the Company to repurchase their notes for cash at a price equal to 100% of the principal amount of the notes to be purchased, plus accrued and unpaid interest.
Under accounting guidance, an entity must separately account for the liability and equity components of a convertible debt instrument that may be settled entirely or partially in cash upon conversion. The separate accounting must reflect the issuer's economic interest cost. The fair value of the equity component, net of pro-rata initial purchasers’ discounts, is included in the additional paid-in capital section of stockholders' equity in the Company's Consolidated Balance Sheets. The principal amount of the Convertible Senior Notes is reduced by unamortized original issue discount, which reflects the Convertible Senior Notes fair value. At issuance, the equity component of the Convertible Senior Notes was valued at $27.9 million before pro-rata initial purchasers' commissions of $0.3 million and related additional costs of $0.1 million. The Convertible Senior Notes were valued at $117.1 million consisting of $140.0 million of principal, net of $27.9 million allocated to equity, not including pro-rata initial purchasers' commissions of $1.8 million and additional related costs of $0.4 million. The original issue discount will be amortized over the life of the Convertible Senior Notes due 2020 and 2018 using the effective interest rate of 8.6% and 8.1%, respectively.
Relevant accounting guidance requires entities to disclose the dilutive effects of convertible instruments. As of December 31, 2016 and 2015, the Company’s common stock had not met the convertibility criteria noted in the offering memorandum. Therefore, the Convertible Senior Notes were not dilutive as of December 31, 2016 and 2015.
The balances of the liability and equity components as of December 31, 2016 and 2015, were as follows, with amounts in thousands:
December 31, | December 31, | ||||||
2016 | 2015 | ||||||
Liability component - principal | $ | 138,150 | $ | 140,000 | |||
Deferred bond discount | 13,213 | 18,004 | |||||
Deferred financing cost | 168 | 256 | |||||
Liability component - net carrying value | $ | 124,769 | $ | 121,740 | |||
Additional paid in capital | $ | 27,822 | $ | 27,920 | |||
Discount attributable to equity | (419 | ) | (412 | ) | |||
Equity component | $ | 27,403 | $ | 27,508 | |||
F-33
Interest expense related to the Convertible Senior Notes, included in Interest expense on long-term borrowings in the Consolidated Statements of Income and Comprehensive Income, was as follows, with amounts in thousands:
For the Fiscal Year Ended December 31, | |||||||
2016 | 2015 | ||||||
Interest expense - stated coupon rate | $ | 5,725 | $ | 5,156 | |||
Interest expense - amortization of deferred bond discount and costs | 4,696 | 3,712 | |||||
Total interest expense - convertible note | $ | 10,421 | $ | 8,868 | |||
14. SHARE BASED COMPENSATION
Share Based Payment
Total share-based compensation expense recognized during 2016, 2015 and 2014 consisted of the following ($ in thousands:)
For the Years Ended December 31, | |||||||||||
2016 | 2015 | 2014 | |||||||||
Employee compensation and benefits | $ | 4,151 | $ | 3,680 | $ | 3,452 | |||||
On September 30, 2015, the Company's board of directors adopted the GAIN Capital Holdings, Inc. 2015 Omnibus Incentive Compensation Plan, (the "2015 Plan"), which became effective November 30, 2015.
The 2015 Plan replaced the GAIN Capital Holdings, Inc. 2010 Omnibus Incentive Compensation Plan, (the “2010 Plan”). The 2015 Plan has available 8.7 million shares (5.8 million to be issued pursuant to future awards and grants under the 2015 Plan, 2.7 million shares that are subject to outstanding grants under the 2010 Plan, and 0.2 million shares to be issued pursuant to the 2011 Employee Stock Purchase Plan) for awards to employees, nonemployee directors, consultants, and advisors in the form of incentive stock options ("ISO"), nonqualified stock options ("NQSO"), restricted stock awards ("RSA"), restricted stock units ("RSU"), stock appreciation rights and other stock-based awards. The "evergreen" provision that allowed the Company to authorize additional shares to be issued under the 2010 plan was removed from the 2015 Plan. Accordingly, the maximum number of shares that can be issued will be fixed and cannot be increased in the future without shareholder approval.
Under the 2015 Plan, the Compensation Committee of the Board of Directors (the "Compensation Committee") will determine the exercise price of the options granted and may grant options to purchase shares of the Company’s common stock in amounts as determined by the Compensation Committee. The Compensation Committee may grant options that are intended to qualify as ISOs under Section 422 of the Internal Revenue Code, or NQSOs which are not intended to so qualify. ISOs may only be granted to employees. Anyone eligible to participate in the 2015 Plan may receive a grant of NQSOs. The exercise price of a stock option granted under the 2015 Plan cannot be less than the fair market value of a share of the Company’s common stock on the date the option is granted. All options granted under the 2015 Plan expire seven years from the date of grant.
Stock Options
The following table summarizes the stock option activity under all plans from January 1, 2016 through December 31, 2016 (in thousands, except per share amounts):
F-34
Options Outstanding | ||||||||||||||
Weighted | ||||||||||||||
Weighted | Average | |||||||||||||
Number of | Average | Remaining | Aggregate | |||||||||||
Options | Exercise Price | Life (Years) | Intrinsic Value | |||||||||||
Outstanding January 1, 2016 | 1,358 | $ | 5.76 | 4.16 | ||||||||||
Granted | 243 | 6.76 | 7.00 | |||||||||||
Exercised | (180 | ) | 3.93 | 1.55 | ||||||||||
Forfeited/Expired | (28 | ) | 7.36 | 4.05 | ||||||||||
Outstanding December 31, 2016 | 1,393 | $ | 6.13 | 2.96 | $ | 1,604 | ||||||||
Vested and expected to vest options | 1,368 | $ | 6.10 | 3.61 | $ | 1,603 | ||||||||
Exercisable, December 31, 2016 | 956 | $ | 5.62 | 2.80 | $ | 1,465 | ||||||||
Fair market value of common stock at exercise date | $ | 1,249 | ||||||||||||
Cost to exercise | 706 | |||||||||||||
Net value of stock options exercised | $ | 542 | ||||||||||||
The following table summarizes information concerning outstanding and exercisable stock options as of December 31, 2016:
Options Outstanding | Options Exercisable | |||||||||||||||
Weighted | ||||||||||||||||
Average | ||||||||||||||||
Weighted | Remaining | Number of | Weighted | |||||||||||||
Number | Average | Contractual | Options | Average | ||||||||||||
Exercise Price | Outstanding | Exercise Price | Life (Years) | Exercisable | Exercise Price | |||||||||||
$3.83 | 317 | $ | 3.83 | 0.57 | 317 | $ | 3.83 | |||||||||
$4.40 | 218 | 4.40 | 3.22 | 154 | $ | 4.40 | ||||||||||
$5.30 | 199 | 5.30 | 2.16 | 199 | $ | 5.30 | ||||||||||
$6.76 | 244 | 6.76 | 6.34 | — | $ | 6.76 | ||||||||||
$8.02 | 210 | 8.02 | 1.22 | 210 | $ | 8.02 | ||||||||||
$9.51 | 127 | 9.51 | 5.40 | 34 | $ | 9.51 | ||||||||||
$9.95 | 78 | 9.95 | 4.17 | 42 | $ | 9.95 | ||||||||||
1,393 | $ | 6.13 | 2.96 | 956 | $ | 5.62 | ||||||||||
The weighted-average remaining contractual life for the 1.4 million outstanding options as of December 31, 2016, is approximately 2.96 years. There were 1.0 million stock options exercisable as of December 31, 2016. The total intrinsic value of stock options exercised during 2016, 2015, and 2014 respectively was $0.5 million, $3.5 million and $4.2 million. During 2016, the Company had 0.2 million stock options vest. The Company received $0.7 million, $2.4 million, and $2.1 million from stock option exercises in 2016, 2015, and 2014, respectively.
In 2016, the Company granted 0.2 million options to employees. In 2015, the Company granted 0.1 million options to employees. In 2014, the Company granted 0.1 million options to employees. The weighted average grant-date fair value of stock options granted in the years ended December 31, 2016, 2015, and 2014 was $2.18, $3.43, and $3.79, respectively.
The Compensation Committee approved stock option grants with a fair market value estimated under a Black-Scholes option pricing valuation model using the following assumptions:
F-35
For the Fiscal Year Ended December 31, | |||||
2016 | 2015 | 2014 | |||
Valuation Assumptions | |||||
Risk-free rate | 1.19% | 1.47% | 1.40% | ||
Expected volatility | 47.63% | 49.08% | 51.80% | ||
Expected term (years) | 4.75 | 4.75 | 4.80 | ||
Dividend yield | 3.0% | 2.1% | 2.0% | ||
The expected volatility was calculated on the basis of the volatility of the Company's common stock. The average risk free rate is based upon the risk free rate of the U.S. Treasury bond rate with a maturity commensurate with the expected term. The options granted during 2016 were granted on May 5, 2016.
Restricted Stock Units and Restricted Stock Awards
The 2015 Plan provides for the issuance of RSUs that are convertible on a 1:1 basis into shares of the Company’s common stock. The Company maintains a restricted stock unit account for each grantee. RSU grants typically vest over four years, with 25% vesting on each anniversary date of the grant. After the RSUs vest, the grantee shall receive payment in the form of cash, shares of the Company’s common stock, or a combination of the two, as determined by the Company. Payment of cash and issuance of shares shall be made upon the vesting date, upon a predetermined delivery date, upon a change in control of the Company, or upon the employee leaving the Company. The Company has historically settled these awards through the issuance of common stock to recipients and intends to continue to do so. The Company may also issue performance grants, which vest immediately, but under which delivery of the common stock is deferred until a later date. RSUs are assigned the value of the Company’s common stock at date of grant issuance, and the grant date fair value is amortized over a four year period. During 2016, 2015 and 2014, 0.9 million, 0.6 million and 0.5 million RSUs, respectively, were granted to employees and members of the Board of Directors.
The 2015 Plan also provides for the issuance of restricted stock awards, or RSAs, which represent shares of the Company’s common stock subject to transfer and other restrictions. The Company maintains a restricted stock award account for each grantee. Restrictions typically lapse over four years, with 25% vesting on each anniversary date of the grant. After the restrictions lapse, or upon a change in control of the Company, the grantee shall receive payment in the form of cash, shares of the Company’s common stock, or a combination of the two, as determined by the Company. The Company has historically settled these awards through the issuance of common stock to recipients and intends to continue to do so. The Company may also issue performance grants which have immediate vesting. There were no RSAs granted during 2016, 2015 or 2014.
A summary of the status of the Company’s non-vested shares of RSUs as of December 31, 2016 and changes during the year ended December 31, 2016, is presented below (in thousands, except per share amounts):
Weighted Average | ||||||
Number | Grant Date | |||||
Non-Vested Shares | of RSUs | Fair Value | ||||
Non-vested at January 1, 2016 | 1,183 | $ | 8.03 | |||
Granted | 920 | 6.76 | ||||
Vested | (500 | ) | 7.27 | |||
Forfeited | (129 | ) | 8.18 | |||
Non-vested at December 31, 2016 | 1,474 | $ | 7.49 | |||
As of December 31, 2016, there was $9.8 million of total unrecognized compensation cost related to non-vested share-based compensation arrangements granted under the 2010 Plan. The cost is expected to be recognized over a weighted-average period of approximately three years. The fair market value on the grant date for RSUs and RSAs vested during the years ended December 31, 2015 and December 31, 2014 was $2.9 million and $4.3 million, respectively. The total intrinsic value of the RSUs that became unrestricted during the year ended December 31, 2016 was $3.4 million at the date they became unrestricted. RSUs that were vested during the year ended December 31, 2016, had a value at grant date of $3.6 million. The Company granted RSUs during the year ended December 31, 2016 which had a value of $6.2 million at grant date. There were
F-36
no RSAs granted or vested during the year ended December 31, 2016. The fair market value of RSUs at the date of grant during the year ended December 31, 2015 was $5.7 million.
Employee Stock Purchase Plan
The 2011 Employee Stock Purchase Plan ("ESPP") was adopted by the Company’s Board of Directors on November 22, 2010. The ESPP became effective on January 1, 2011. The ESPP permits eligible employees to purchase shares of the Company’s common stock at a 15% discount from the lesser of the fair market value per share of the Company’s common stock on the first day of the offering period or the fair market value of the Company’s common stock on the interim purchase date through after-tax payroll deductions. The total number of shares reserved for issuance under the ESPP was initially 500,000. It is intended that the ESPP meet the requirements for an “employee stock purchase plan” under Section 423 of the Internal Revenue Code. For the year ended December 31, 2016, 96,173 shares were issued under the plan. For the year ended December 31, 2015, 92,777 shares were issued under the ESPP. The discount on the ESPP of $0.1 million is recorded to Employee compensation and benefits in the Consolidated Statement of Income and Comprehensive Income.
15. EARNINGS PER COMMON SHARE
Basic and diluted earnings per common share are computed by dividing net income by the weighted average number of common shares outstanding during the period. Diluted earnings per share includes the determinants of basic net income per share and, in addition, gives effect to the potential dilution that would occur if securities or other contracts to issue common stock were exercised, vested or converted into common stock, unless they are anti-dilutive. Diluted weighted average common shares include vested and unvested stock options, unvested restricted stock units and unvested restricted stock awards. Approximately 0.2 million and 0.4 million stock options were excluded from the calculation of diluted earnings per share for the years ended December 31, 2016 and 2015, respectively, as they were anti-dilutive.
Diluted earnings per share excludes any shares of Company common stock potentially issuable under the Company's convertible senior notes, which are discussed in Note 13. Based upon an assumed trading price of $13 for each share of the Company's common stock, and if the relevant conditions under the indenture governing both 2018 and 2020 convertible senior notes were satisfied, there would be no additional dilutive shares as of December 31, 2016 for the 2018 and 2020 notes, respectively.
The following table sets forth the computation of earnings per share (amounts in thousands except share and per share data):
For the years ended December 31, | |||||||||||
2016 | 2015 | 2014 | |||||||||
Net income applicable to GAIN Capital Holdings, Inc. | $ | 35,272 | $ | 10,279 | $ | 24,877 | |||||
Adjustment(1) | (2,715 | ) | 308 | (2,107 | ) | ||||||
Net income available to GAIN common shareholders | $ | 32,557 | $ | 10,587 | $ | 22,770 | |||||
Weighted average common shares outstanding: | |||||||||||
Basic weighted average common shares outstanding | 48,588,917 | 47,601,979 | 40,561,644 | ||||||||
Effect of dilutive securities: | |||||||||||
Stock options | 163,223 | 424,087 | 763,068 | ||||||||
RSUs/RSAs | 33,534 | 352,985 | 1,890,183 | ||||||||
Diluted weighted average common shares outstanding | 48,785,674 | 48,379,051 | 43,214,895 | ||||||||
Earnings per common share | |||||||||||
Basic | $ | 0.67 | $ | 0.22 | $ | 0.56 | |||||
Diluted | $ | 0.67 | $ | 0.22 | $ | 0.53 | |||||
(1) | During the years ending December 31, 2016, 2015 and 2014, the Company concluded that the carrying value of the Company's redeemable non-controlling interests was less than their redemption value, requiring that an adjustment to the carrying value be recorded for purposes of calculating earnings per common share. The adjustment to increase or reduce the carrying value will, respectively, reduce or increase earnings per common share by reducing or increasing net income available to common shareholders. |
F-37
16. LEGAL
From time to time the Company becomes involved in legal proceedings and in each case the Company assesses the likely liability and/or the amount of damages as appropriate. Where available information indicates that it is probable a liability had been incurred at the date of the consolidated financial statements and the Company can reasonably estimate the amount of that loss, the Company accrues the estimated loss by a charge to income. In many proceedings, however, it is inherently difficult to determine whether any loss is probable or even reasonably possible or to estimate the amount of any loss. In addition, even where loss is possible or an exposure to loss exists in excess of the liability already accrued with respect to a previously recognized loss contingency, it is often not possible to reasonably estimate the size of the possible loss or range of loss.
For certain legal proceedings, the Company can estimate possible losses, additional losses, ranges of loss or ranges of additional loss in excess of amounts accrued. For certain other legal proceedings, the Company cannot reasonably estimate such losses, if any, since the Company cannot predict if, how or when such proceedings will be resolved or what the eventual settlement, fine, penalty or other relief, if any, may be, particularly for proceedings that are in their early stages of development or where plaintiffs seek substantial or indeterminate damages. Numerous issues must be developed, including the need to discover and determine important factual matters and the need to address novel or unsettled legal questions relevant to the proceedings in question, before a loss or additional loss or range of loss can be reasonably estimated for any proceeding.
Litigation
On February 16, 2012, the Company received a Letter of Claim on behalf of certain individuals who had lost money in an investment scheme operated by a third-party money management firm, incorporated in the United Kingdom, which has since been closed down by the United Kingdom’s Financial Services Authority. The investment firm, Cameron Farley Ltd, had opened a corporate account with the Company and invested the individuals’ money, representing such funds as its own, while operating a fraudulent scheme. Though a complaint had been filed and served on the Company, the claimants requested, and the Company agreed, to follow the United Kingdom’s Pre-Action Protocol, a pre-litigation process intended to resolve matters without the need to engage in formal litigation. On April 28, 2016, the parties entered into a Settlement Agreement in which the Company agreed to make a one-time settlement payment in exchange for a full and final settlement of all claims. For the year ended December 31, 2016, the settlement amount, net of insurance recoveries, totaled approximately $9.2 million.
17. COMMITMENTS AND CONTINGENCIES
Leases & Purchase Obligations — The Company leases office space under non-cancelable operating lease agreements that expire on various dates through 2025. Such leases do not require any contingent rental payments or impose any financial restrictions. Certain of the Company's leases include renewal options and escalation clauses. In addition, the Company has certain non-cancelable purchase obligations for its operational needs. Future annual minimum lease payments for the Company's non-cancellable operating leases and purchase obligations are as follows (amounts in thousands):
Years Ended December 31: | |||
2017 | $ | 12,948 | |
2018 | 4,310 | ||
2019 | 3,723 | ||
2020 | 3,120 | ||
2021 and beyond | 12,700 | ||
Total | $ | 36,801 | |
Rent expense, which is recorded on a straight-line basis, was $2.9 million, $3.7 million, and $5.1 million for the years ended December 31, 2016, 2015 and 2014, respectively.
18. INCOME TAXES
The following table presents the U.S. and non-U.S. components of income before income tax (benefit) / expense for the years ended December 31, 2016, 2015, and 2014 (amounts in thousands):
For the Fiscal Year Ended | |||||||||||
December 31, | |||||||||||
F-38
2016 | 2015 | 2014 | |||||||||
U.S. | $ | 2,701 | $ | (39,761 | ) | $ | 17,439 | ||||
Non-U.S. | 44,541 | 48,188 | 28,011 | ||||||||
Total income before tax (benefit) / expense | $ | 47,242 | $ | 8,427 | $ | 45,450 | |||||
Income tax (benefit) / expense consisted of (amounts in thousands):
For the Fiscal Year Ended | |||||||||||
December 31, | |||||||||||
2016 | 2015 | 2014 | |||||||||
Current | |||||||||||
Federal | $ | 3,365 | $ | 1,136 | $ | 8,658 | |||||
State | 336 | 172 | (199 | ) | |||||||
UK | 8,859 | 7,239 | 5,322 | ||||||||
Japan | 64 | 127 | 173 | ||||||||
Other non-U.S. | 625 | 169 | 78 | ||||||||
Total current income tax expense | 13,249 | 8,843 | 14,032 | ||||||||
Deferred | |||||||||||
Federal | (276 | ) | (9,889 | ) | 4,966 | ||||||
State | (822 | ) | (1,375 | ) | (99 | ) | |||||
UK | 601 | (337 | ) | (122 | ) | ||||||
Singapore | (2,162 | ) | — | — | |||||||
Japan | (528 | ) | (148 | ) | 159 | ||||||
Other non-U.S. | (620 | ) | (545 | ) | 20 | ||||||
Change in valuation allowance | 326 | (61 | ) | 184 | |||||||
Total deferred tax (benefit) / expense | (3,481 | ) | (12,355 | ) | 5,108 | ||||||
Total income tax (benefit) / expense | $ | 9,768 | $ | (3,512 | ) | $ | 19,140 | ||||
Deferred income taxes reflect the net tax effects of temporary differences between the financial reporting and tax basis of assets and liabilities and are measured using the enacted tax rates and laws that will be in effect when such differences are expected to reverse. Certain net deferred tax assets of the Company are included in Other assets on the Consolidated Balance Sheets. The change in valuation allowance for the year ended December 31, 2016 compared to December 31, 2015 was $0.3 million. Significant components of the Company’s deferred tax assets and liabilities were as follows (amounts in thousands):
December 31, | |||||||
2016 | 2015 | ||||||
Deferred tax assets | |||||||
Foreign net operating losses | $ | 10,161 | $ | 13,286 | |||
Share-based compensation | 1,506 | 1,437 | |||||
Intangible assets | 5,423 | 3,012 | |||||
Basis difference in property and equipment | 5,138 | 4,950 | |||||
Other | 2,793 | 2,962 | |||||
Total deferred tax assets | 25,021 | 25,647 | |||||
Valuation allowance | (1,179 | ) | (853 | ) | |||
Total deferred tax assets after valuation allowance | $ | 23,842 | $ | 24,794 | |||
Deferred tax liabilities | |||||||
Unrealized trading losses | (4,234 | ) | — | ||||
Discount on convertible note | (4,727 | ) | (6,186 | ) | |||
F-39
Other | (181 | ) | (781 | ) | |||
Total deferred liabilities | (9,142 | ) | (6,967 | ) | |||
Net deferred tax assets | $ | 14,700 | $ | 17,827 | |||
The Company has $51.7 million in foreign net operating loss (“NOL”) carry forwards as of December 31, 2016. These NOLs begin to expire in 2019. The Company has a deferred tax asset of $10.2 million relating to these NOLs. For the year ended December 31, 2016, the Company has established a valuation allowance of $1.2 million. The Company believes it is more likely than not that it will fully realize, excluding the amount of deferred tax asset for which it established a valuation allowance, the deferred tax assets.
The following table reconciles the effective tax rate to the U.S. federal statutory income tax rate:
2016 | 2015 | 2014 | ||||||
Federal income tax at statutory rate | 35.00 | % | 35.00 | % | 35.00 | % | ||
Increase/(decrease) in effective tax rate resulting from: | ||||||||
State income tax | (0.67 | )% | (9.25 | )% | (0.57 | )% | ||
Foreign rate differential | 8.20 | % | (96.96 | )% | (9.71 | )% | ||
Deemed dividends | 0.01 | % | 55.30 | % | — | % | ||
Non-deductible transaction costs | — | % | 11.71 | % | 1.42 | % | ||
Impact of non-controlling interests | (1.59 | )% | (6.89 | )% | (1.10 | )% | ||
Contingent liability | — | % | (27.92 | )% | — | % | ||
Foreign losses | — | % | (19.20 | )% | — | % | ||
162 (m) | 0.33 | % | 3.44 | % | — | % | ||
GFT Carryback | — | % | (6.58 | )% | — | % | ||
Uncertain tax positions | 2.36 | % | 19.67 | % | 14.04 | % | ||
Impairment of investment | 8.36 | % | — | % | — | % | ||
Non-taxable dividend | (32.16 | )% | — | % | — | % | ||
U.K. Bank tax | 2.92 | % | — | % | — | % | ||
Rate changes | (1.34 | )% | — | % | — | % | ||
True-ups and deferred tax adjustments | (2.78 | )% | — | % | — | % | ||
Other permanent differences | 2.04 | % | — | % | 3.03 | % | ||
Effective Tax Rate | 20.68 | % | (41.68 | )% | 42.11 | % | ||
In 2016, the Company had a number of discrete tax items that impacted its effective tax rate:
• | The Company paid inter-company dividends due to internal restructuring of $43.4 million which is non-taxable in the jurisdiction received. |
• | The Company wrote down the investment value of one of its subsidiaries resulting in a non-deductible expense. |
• | The elimination of the inter-company transactions listed above had an unfavorable impact on its foreign rate differential. |
At December 31, 2016, the Company had approximately $76.9 million of undistributed earnings of our foreign subsidiaries indefinitely invested outside the United States. In connection with the previously announced restatement of our financial statements for the years ended December 31, 2014 and 2013 and certain quarters of 2015, we took a charge for U.S. taxes that would arise if $48.3 million of these earnings were repatriated to the United States. The remaining earnings are indefinitely invested outside the United States and are expected to be reinvested in the working capital and other business needs of the foreign subsidiaries. If the remaining earnings had been repatriated into the United States as of December 31, 2016, in the form of dividends or otherwise, we would have been subject to additional income taxes of approximately $6.4 million.
The Company has recorded a liability of $4.6 million related to uncertain tax positions at December 31, 2016 in accordance with ASC 740-10, Income Taxes. This liability is recorded in Accrued expenses and other liabilities on the Consolidated Balance Sheet.
F-40
The following table summarizes the activity of the gross unrecognized tax benefits from uncertain tax positions (amounts in thousands):
As of December 31, | |||||||||||
2016 | 2015 | 2014 | |||||||||
Beginning balance as of January 1 | $ | 11,801 | $ | 10,517 | $ | 8,345 | |||||
Increases based on tax positions related to the current period | — | 885 | 2,197 | ||||||||
Increases/(decreases) based on tax positions related to prior periods | (6,617 | ) | 429 | — | |||||||
Decreases related to settlements | (554 | ) | — | — | |||||||
Decreases related to a lapse of applicable statute of limitations | (2 | ) | (30 | ) | (25 | ) | |||||
Ending balance as of December 31 | $ | 4,628 | $ | 11,801 | $ | 10,517 | |||||
Included in the balance of unrecognized tax benefits as of December 31, 2016, December 31, 2015 and December 31, 2014 are $4.6 million, $11.8 million and $10.5 million, respectively, of tax benefits that, if recognized, would affect the effective tax rate. The Company’s open tax years range from 2010 through 2015 for its U.S. federal returns, from 2012 through 2015 for the U.K., from March 2015 through March 2016 for Japan and from 2011 through 2015 for its major U.S. state jurisdictions. It is reasonably possible that the amount of liability for unrecognized tax benefits could change during the next 12 months. An estimate of the range of the possible change cannot be made until issues are further developed or examinations closed.
In addition to the total unrecognized tax benefits noted above, the Company recorded $0.9 million and $1.8 million of penalties and interest for the years ended December 31, 2016 and December 31, 2015, respectively. These amounts are recorded in Income tax (benefit) / expense in the Consolidated Statements of Income and are part of the uncertain tax positions impact when reconciling the federal income tax rate to the Company's effective tax rate.
19. RETIREMENT PLANS
The Company sponsors a “Safe Harbor” 401(k) retirement plan which was put into effect as of January 1, 2011. The plan provides for a 100% match by the Company on the first 3% of the employee’s salary contributed to the plan and 50% on the next 2% with immediate vesting on all employer contributions, subject to IRS limitations. Substantially all of the Company’s employees are eligible to participate in the plan.
The expense recorded to employee compensation and benefits on the Consolidated Statements of Income and Comprehensive Income by the Company for its employees’ participation in the respective plans during the years ended December 31, 2016, 2015 and 2014 was $0.9 million, $0.9 million, and $1.3 million, respectively.
20. REGULATORY REQUIREMENTS
GCGL is the Company’s FCM and RFED subsidiary, is subject to the CFTC Net Capital Rule (Rule 1.17) and NFA Financial Requirements Sections 11 and 12. Under applicable provisions of these regulations, GCGL is required to maintain adjusted net capital of the greater of $1.0 million or 8% of Customer and Non-Customer Maintenance Margin or $20.0 million plus 5.0% of all liabilities owed to retail customers exceeding $10.0 million plus 10% of all liabilities owed to eligible contract participant counterparties acting as a dealer that are not an affiliate. In addition, Gain Capital Group, LLC is subject to Regulation 1.17(c)(5) which require the company to reduce net capital by various haircut charges including, but not limited to haircut for uncovered foreign currency balances, haircut for securities as well as charges for under margined commodity futures and commodity options accounts. At December 31, 2016, GCGL maintained $19.5 million more than the required minimum regulatory capital for a total of 1.7 times the required capital.
GAIN Capital Securities, Inc. ("GCSI") is a broker-dealer registered with the SEC under the Securities Exchange Act of 1934, as amended. GCSI is a member of the Financial Industry Regulatory Authority (“FINRA”), Municipal Securities Rulemaking Board (“MSRB”), and Securities Investor Protection Corporation (“SIPC”). Pursuant to the SEC’s Uniform Net Capital Rule 15c3-1, GCSI is required to maintain a minimum net capital balance (as defined) of $0.1 million. GCSI must also maintain a ratio of aggregate indebtedness (as defined) to net capital of not more than 15 to 1. At December 31, 2016, GCSI maintained $0.3 million more than the minimum required regulatory capital for a total of 4.0 times the required capital.
F-41
GCUK1 is registered in the U.K. and regulated by the FCA as a full scope €730k IFPRU Investment Firm. GCUK1 is required to maintain the greater of approximately $1.0 million (€730,000) or the Financial Resources Requirement, which is calculated as the sum of the firm’s operational, credit, counterparty, concentration, market risk. At December 31, 2016, GCUK1 maintained $23.5 million more than the minimum required regulatory capital for a total of 4.7 times the required capital. Following the successful integration of City Index in the UK, GCUK1 no longer has any clients and is no longer trading. It is currently in the process of deregistering its licence with FCA. Until that time, GCUK1 will maintain its regulatory capital in line with requirements.
GCUK2 is registered in the U.K. and regulated by the FCA as a full scope €730k IFPRU Investment Firm. GCUK2 is required to maintain the greater of approximately $1.0 million (€730,000) or the Financial Resources Requirement, which is calculated as the sum of the firm’s operational, credit, counterparty, concentration, market risk. At December 31, 2016, GCUK2 maintained $87.5 million more than the minimum required regulatory capital for a total of 2.2 times the required capital.
GC Japan is a registered Type I financial instruments business firm regulated by the Japan Financial Services Agency ("FSA") in accordance with Financial Instruments and Exchange Law (Law No. 25 of 1948, as amended). GC Japan is a member of the Financial Futures Association of Japan. GC Japan is subject to a minimum capital adequacy ratio of 140%, which is derived by dividing Net Capital (as defined in Law No. 25) by the sum of GC Japan’s market, counterparty credit risk and operational risk. At December 31, 2016, GC Japan maintained $7.0 million more than the minimum required regulatory capital for a total of 5.7 times the required capital.
GCAU1 is regulated under the laws of Australia, including the Corporations Act 2001 (Commonwealth of Australia). The Australian Securities and Investments Commission ("ASIC") is the corporate, markets and financial services regulator in Australia responsible for administering aspects of the Corporations Act 2001. GCAU1 holds an Australian Financial Services License that has been issued by ASIC. GCAU1 is required to maintain a minimum capital requirement of $0.7 million (1.0 million AUD). The regulatory capital held is required to be in excess of 110% of its requirements at all times. At December 31, 2016, GCAU1 maintained $1.8 million more than the minimum required regulatory capital for a total of 3.6 times the required capital.
Effective January 31, 2014, ASIC increased the Net Tangible Assets ("NTA") requirement, as part of RG166: Licensing: Financial Requirements, for OTC derivative issuers. ASIC requires retail OTC derivative issuers to have at all times the greater of $0.8 million or 10% of average revenue on hand at all times. RG166 outlines that, at the minimum, 50% of the NTA requirement is required to be held in cash or cash equivalents and 50% in liquid assets. OTC derivative issuers must report to ASIC if their NTA falls below 110% of the requirement within 3 business days after becoming aware of the event.
GCAU2 is regulated under the laws of Australia, including the Corporations Act 2001 (Commonwealth of Australia). GCAU2 holds an Australian Financial Services License that has been issued by ASIC. GCAU2 is required to maintain a minimum capital requirement of $0.7 million (1.0 million AUD). The regulatory capital held is required to be in excess of 110% of its requirements at all times. At December 31, 2016, GCAU2 maintained $3.4 million more than the minimum required regulatory capital for a total of 5.9 times the required capital.
Gain Capital Forex.Com Hong Kong, Ltd. ('GCHK') is licensed by the Securities and Futures Commission (“SFC”) to carry out Type 3 Regulated Activity, Leveraged Foreign Exchange Trading. GCHK is subject to the requirements of section 145 of the Securities and Futures Ordinance (Cap.571). Under this rule, GCHK is required to maintain a minimum liquid capital requirement of the higher of $1.9 million or the sum of 1.5% of its aggregate gross foreign currency position and 5% of its adjusted liabilities and clients’ margin calculated in accordance with applicable rules. At December 31, 2016, GCHK maintained $1.6 million more than the minimum required regulatory capital for a total of 1.8 times the required capital.
GGMI, the Company’s Cayman Island subsidiary, is a registered securities arranger and market leader with the Cayman Islands Monetary Authority (“CIMA”). GGMI is required to maintain a capital level that is the greater of one quarter of relevant annual expenditure, or the financial resources requirement which is the sum of the Base Requirement, counterparty and position risk requirement, or $0.1 million. At December 31, 2016, GGMI maintained $1.2 million more than the minimum required regulatory capital for a total of 13.0 times the required capital.
GCCA is a Dealer Member of the Investment Industry Regulatory Organization of Canada ("IIROC) and regulated under the laws of Canada, including the Canadian Investor Protection Fund. In Canada, the securities industry is governed by provincial or territorial legislation, and there is no national regulator. Local legislation differs from province to province and territory to territory, but generally requires that forex dealing representatives register with applicable regulators and self-regulatory organizations in order to offer forex and/or CFD products to retail clients. GCCA’s principal provincial regulator is the Ontario Securities Commission, or OSC. GCCA is required to maintain risk-adjusted capital in excess of the minimum capital
F-42
requirement. At December 31, 2016, GCCA maintained $1.2 million more than the minimum required regulatory capital for a total of 7.0 times the required capital.
GCS is registered by the Monetary Authority of Singapore (“MAS”) and operates as an approved holder of Capital Market Services License. GCS is subject to the requirements of MAS and pursuant to the Securities and Futures Act (Cap 289). Under these rules GCS is required to maintain a minimum base capital of approximately $0.3 million (1.0 million SGD) and Financial Resources in excess of 120% of the total risk requirements, which is calculated as the sum of operational, counterparty, large exposure and market risk at all times. At December 31, 2016, GCS maintained $8.5 million more than the required minimum regulatory capital for a total of 29.3 times the required capital.
Trade Facts is registered in the U.K. and regulated by the FCA as a BIPRU Limited License Firm. Trade Facts is required to maintain a base financial resources requirement of approximately $0.5 million (€0.05 million) and a capital requirement of the higher of either credit risk plus market risk or fixed overhead requirement. At December 31, 2016, Trade Facts maintained $3.1 million more than the minimum required regulatory capital for a total of 7.2 times the required capital.
GAA is a registered Introducing Broker and is subject to the CFTC Net Capital Rule (Rule 1.17). Under applicable provisions of these rules, GAA is required to maintain adjusted net capital of $0.1 million. At December 31, 2016, GAA maintained $1.5 million more than the minimum required regulatory capital for a total of 16.0 times the required capital.
Gain Capital Payments Ltd is regulated in the U.K by the FCA and is authorized to carry out Payment services under the Payment Services Regulations 2009. The regulatory capital held should exceed the minimum defined as the greater of either (i) $0.1 million (€125,000) or (ii) requirements determined by the ‘overhead scalar approach’. At December 31, 2016, Gain Capital Payments Limited maintained the minimum required regulatory capital.
The following table illustrates the minimum regulatory capital our subsidiaries were required to maintain as of December 31, 2016 and the actual amounts of capital that were maintained (amounts in millions):
Entity Name | Minimum Regulatory Capital Requirements | Capital Levels Maintained | Excess Net Capital | Percent of Requirement Maintained | ||||||||||
GAIN Capital Group, LLC | $ | 28.5 | $ | 48.0 | $ | 19.5 | 168 | % | ||||||
GAIN Capital Forex.com Australia, Pty. Ltd. | 0.7 | 2.5 | 1.8 | 357 | % | |||||||||
GAIN Capital Securities, Inc. | 0.1 | 0.4 | 0.3 | 400 | % | |||||||||
Trade Facts, Ltd. | 0.5 | 3.6 | 3.1 | 720 | % | |||||||||
GAIN Capital-Forex.com Hong Kong, Ltd. | 1.9 | 3.5 | 1.6 | 184 | % | |||||||||
GAIN Capital Australia Pty Ltd. | 0.7 | 4.1 | 3.4 | 586 | % | |||||||||
GAIN Capital-Forex.com Canada Ltd. | 0.2 | 1.4 | 1.2 | 700 | % | |||||||||
GAIN Capital-Forex.com U.K., Ltd. | 6.4 | 29.9 | 23.5 | 467 | % | |||||||||
GAIN Capital Japan Co., Ltd. | 1.5 | 8.5 | 7.0 | 567 | % | |||||||||
GAIN Global Markets, Inc. | 0.1 | 1.3 | 1.2 | 1,300 | % | |||||||||
GAIN Capital UK, Ltd. | 71.9 | 159.4 | 87.5 | 222 | % | |||||||||
GAIN Capital Singapore Pte, Ltd. | 0.3 | 8.8 | 8.5 | 2,933 | % | |||||||||
Global Assets Advisors, LLC | 0.1 | 1.6 | 1.5 | 1,600 | % | |||||||||
GAIN Capital Payments Ltd. | 0.1 | 0.1 | $ | — | 100 | % | ||||||||
Total | $ | 113.0 | $ | 273.1 | $ | 160.1 | 242 | % | ||||||
21. SEGMENT INFORMATION
ASC 280, Disclosures about Segments of an Enterprise and Related Information, establishes standards for reporting information about operating segments. Operating segments are defined as components of an enterprise which engage in business activities from which they may earn revenues and incur expenses and about which separate financial information is available that is evaluated regularly by the chief operating decision-maker, or decision making group, in deciding how to allocate resources and in assessing performance. Reportable segments are defined as an operating segment that either (a) exceeds 10% of revenue, or (b) reported profit or loss in absolute amount exceeds 10% of profit of all operating segments
F-43
that did not report a loss or (c) exceeds 10% of the combined assets of all operating segments. The Company’s operations relate to global trading services and solutions.
Retail Segment
Business in the retail segment is conducted primarily through the Company's FOREX.com and City Index brands. The Company provides its retail customers around the world with access to a diverse range of 12,500 global financial markets, including spot forex, precious metals and CFDs on commodities, indices, individual equities and interest rate products, as well as OTC options on forex. In the United Kingdom, the Company also offer spread bets, which are investment products similar to CFDs, but that offer more favorable tax treatment to residents of that country.
Institutional Segment
The institutional segment provides agency execution services and offers access to markets and self-directed trading in foreign exchange, commodities, equities, options and futures via an electronic communications network, or ECN, through the Company's GTX platform. The Company also offers high touch sales and trading aided by a team of sales employees.
Futures Segment
The futures segment offers execution and related services for exchange-traded futures and futures options on major U.S. and European exchanges. The Company offers futures services through its subsidiary, GAIN Capital Group, LLC, under the GAIN Capital Futures brand. In addition, in 2014, the Company expanded its futures business by acquiring majority interests in GAA and TT.
Corporate and other
Corporate and other provides general corporate services to the Company's segments and also includes eliminations between operating segments which were $1.2 million, $1.3 million and $0.9 million for the twelve months ended December 31, 2016, 2015 and 2014. Corporate and other revenue primarily comprises foreign currency transaction gains and losses. During the twelve months ended December 31, 2015, corporate and other revenue also included a $6.7 million adjustment to the contingent consideration related to the Trade Facts acquisition.
Selected financial information by segment is presented in the following tables (amounts in thousands):
Retail | |||||||||||
Year Ended December 31, | |||||||||||
2016 | 2015 | 2014 | |||||||||
Net revenue | $ | 336,353 | $ | 351,472 | $ | 296,941 | |||||
Employee compensation and benefits | 62,423 | 67,515 | 61,989 | ||||||||
Selling and marketing | 27,666 | 26,129 | 19,574 | ||||||||
Referral fees | 55,080 | 87,175 | 78,553 | ||||||||
Other operating expenses | 75,488 | 76,301 | 51,561 | ||||||||
Segment profit | $ | 115,696 | $ | 94,352 | $ | 85,264 | |||||
Institutional | |||||||||||
Year Ended December 31, | |||||||||||
2016 | 2015 | 2014 | |||||||||
Net revenue | $ | 30,219 | $ | 35,072 | $ | 35,413 | |||||
Employee compensation and benefits | 14,424 | 15,305 | 13,963 | ||||||||
Selling and marketing | 103 | 138 | 120 | ||||||||
F-44
Referral fees | — | — | — | ||||||||
Other operating expenses | 10,342 | 9,573 | 10,939 | ||||||||
Segment profit | $ | 5,350 | $ | 10,056 | $ | 10,391 | |||||
Futures | |||||||||||
Year Ended December 31, | |||||||||||
2016 | 2015 | 2014 | |||||||||
Net revenue | $ | 48,084 | 45,797 | 36,016 | |||||||
Employee compensation and benefits | 11,967 | 10,634 | 8,918 | ||||||||
Selling and marketing | 972 | 901 | 519 | ||||||||
Referral fees | 15,672 | 16,348 | 12,419 | ||||||||
Other operating expenses | 14,769 | 13,960 | 11,585 | ||||||||
Segment profit | $ | 4,704 | $ | 3,954 | $ | 2,575 | |||||
Corporate and Other | |||||||||||
Year Ended December 31, | |||||||||||
2016 | 2015 | 2014 | |||||||||
Other revenue | $ | (2,831 | ) | $ | (3,716 | ) | $ | 819 | |||
Employee compensation and benefits | 13,090 | 13,127 | 14,362 | ||||||||
Selling and marketing | 1 | — | — | ||||||||
Referral fees | — | — | — | ||||||||
Other operating expenses | 10,210 | 11,038 | 10,001 | ||||||||
Loss | $ | (26,132 | ) | $ | (27,881 | ) | $ | (23,544 | ) | ||
F-45
Reconciliation of operating segment profit to Income before income tax expense
For the Fiscal Year Ended December 31, | |||||||||||
2016 | 2015 | 2014 | |||||||||
Retail segment | $ | 115,696 | $ | 94,352 | $ | 85,264 | |||||
Institutional segment | 5,350 | 10,056 | 10,391 | ||||||||
Futures segment | 4,704 | 3,954 | 2,575 | ||||||||
Corporate and other | (26,132 | ) | (27,881 | ) | (23,544 | ) | |||||
SEGMENT PROFIT | 99,618 | 80,481 | 74,686 | ||||||||
Depreciation and amortization | 13,905 | 11,111 | 6,610 | ||||||||
Purchased intangible amortization | 15,016 | 16,550 | 8,080 | ||||||||
Acquisition expenses | — | 2,819 | 3,526 | ||||||||
Restructuring expenses | 1,041 | 3,482 | 2,334 | ||||||||
Integration expenses | 2,788 | 33,092 | 2,489 | ||||||||
Impairment of investment | — | — | 50 | ||||||||
Change in fair value to contingent consideration | — | (6,722 | ) | — | |||||||
Legal settlement | 9,205 | — | — | ||||||||
SNB bad debt provision | — | 2,500 | — | ||||||||
OPERATING PROFIT | 57,663 | 17,649 | 51,597 | ||||||||
Interest expense on long term borrowings | 10,421 | 9,222 | 6,147 | ||||||||
INCOME BEFORE INCOME TAX EXPENSE | $ | 47,242 | $ | 8,427 | $ | 45,450 | |||||
Net revenue (loss) by geographic area for the years ended December 31, 2016, 2015 and 2014 is as follows ($ in thousands):
2016 | 2015 | 2014 | |||||||||
Net Revenue(1): | |||||||||||
North America(2) | $ | 126,600 | $ | 107,534 | $ | 133,103 | |||||
Europe(3) | 264,879 | 307,087 | 237,391 | ||||||||
Other | 20,346 | 20,726 | (1,305 | ) | |||||||
Total Net Revenue | $ | 411,825 | $ | 435,347 | $ | 369,189 | |||||
(1) - Net revenue is attributed to individual countries based on the jurisdiction of the formation of the reporting entity that records the transaction
(2) - Includes U.S. net revenue of $126.3 million, $107.5 million, and $133.1 million for 2016, 2015, and 2014 respectively.
(3) - Includes U.K. net revenue of $264.7 million and $307.3 million, and $237.7 million for 2016, 2015, and 2014 respectively.
Long-lived assets by geographic area as of December 31, 2016 and 2015 are as follows (in thousands):
2016 | 2015 | ||||||
Long-lived assets(1): | |||||||
North America(2) | $ | 6,875 | $ | 6,370 | |||
Europe(3) | 27,779 | 23,147 | |||||
Other | 1,808 | 850 | |||||
Total long-lived assets | $ | 36,462 | $ | 30,367 | |||
(1) - Long-lived assets are comprised of property and equipment, net. They exclude goodwill, other intangible assets and other assets, which are not attributable to any one geographic location.
(2) - Includes U.S. long-lived assets of $6.9 million, $6.4 million for 2016 and 2015, respectively.
(3) - Includes UK long-lived assets of $27.8 million, $23.1 million for 2016 and 2015, respectively.
F-46
22. QUARTERLY FINANCIAL DATA (UNAUDITED)
The following table sets forth selected quarterly financial data for 2016 and 2015 (in thousands, except per share data):
First | Second | Third | Fourth | ||||||||||||
Quarter | Quarter | Quarter | Quarter | ||||||||||||
For the Year Ended December 31, 2016 | |||||||||||||||
Total non-interest revenue | $ | 115,340 | $ | 107,975 | $ | 71,966 | $ | 115,427 | |||||||
Net revenue | $ | 115,554 | $ | 108,290 | $ | 72,223 | $ | 115,758 | |||||||
Income/(loss) before income tax expense | $ | 11,064 | $ | 16,629 | $ | (7,156 | ) | $ | 26,705 | ||||||
Net income/(loss) | $ | 8,701 | $ | 11,586 | $ | (3,966 | ) | $ | 21,091 | ||||||
Net income attributable to non-controlling interest | $ | 349 | $ | 745 | $ | 748 | $ | 298 | |||||||
Net income/(loss) applicable to GAIN Capital Holdings, Inc. | $ | 8,352 | $ | 10,841 | $ | (4,714 | ) | $ | 20,793 | ||||||
Basic net income/(loss) per share | $ | 0.17 | $ | 0.19 | $ | (0.11 | ) | $ | 0.42 | ||||||
Diluted net income/(loss) per share | $ | 0.17 | $ | 0.19 | $ | (0.11 | ) | $ | 0.42 | ||||||
For the Year Ended December 31, 2015 | |||||||||||||||
Total non-interest revenue | $ | 92,967 | $ | 111,452 | $ | 128,045 | $ | 102,712 | |||||||
Net revenue | $ | 92,986 | $ | 111,457 | $ | 128,111 | $ | 102,793 | |||||||
Income/(loss) before income tax expense | $ | 11,554 | $ | (12,741 | ) | $ | 9,418 | $ | 196 | ||||||
Net income/(loss) | $ | 5,809 | $ | (6,702 | ) | $ | 1,556 | $ | 11,276 | ||||||
Net income attributable to non-controlling interest | $ | 344 | $ | 416 | $ | 583 | $ | 317 | |||||||
Net income/(loss) applicable to GAIN Capital Holdings, Inc. | $ | 5,465 | $ | (7,118 | ) | $ | 973 | $ | 10,959 | ||||||
Basic net income/(loss) per share | $ | 0.11 | $ | (0.16 | ) | $ | 0.05 | $ | 0.23 | ||||||
Diluted net income/(loss) per share | $ | 0.11 | $ | (0.16 | ) | $ | 0.05 | $ | 0.23 | ||||||
23. SUBSEQUENT EVENTS
In March 2017, the Company announced the payment of a $0.06 dividend per share of Common Stock payable on March 31, 2017 to stockholders of record on March 28, 2017.
On February 7, 2017, the Company entered into an Asset Purchase Agreement (the "Purchase Agreement") with Forex Capital Markets L.L.C. ("FXCM"). Pursuant to the terms of the Purchase Agreement, FXCM transferred substantially all of its U.S.-domiciled customer accounts to the Company effective as of February 24, 2017. In consideration of the transfer of these accounts, the Company will pay FXCM, without duplication:
• | $500 per account for each transferred account that first executes a new trade with GAIN during the 76-day period immediately following the closing of the account transfer (the "Initial Period"); and |
• | $250 per account for each transferred account that (i) did not execute a new trade with GAIN during the Initial Period and (ii) executes a new trade with GAIN during the 77-day period immediately following the last day of the Initial Period. |
F-47
Schedule I
GAIN CAPITAL HOLDINGS, INC.
(Parent Company Only)
Condensed Balance Sheets
(in thousands, except share data)
As of December 31, | |||||||
2016 | 2015 | ||||||
ASSETS: | |||||||
Cash and cash equivalents | $ | 3,350 | $ | 451 | |||
Equity investments in subsidiaries | 501,553 | 447,732 | |||||
Receivables from affiliates | — | 2,442 | |||||
Income tax receivable | 903 | 9,482 | |||||
Deferred tax assets, net | 10,120 | 13,563 | |||||
Other assets | 6,100 | 499 | |||||
Total assets | $ | 522,026 | $ | 474,169 | |||
LIABILITIES AND SHAREHOLDERS' EQUITY: | |||||||
Liabilities | |||||||
Accrued compensation and benefits | $ | 60 | $ | 211 | |||
Accrued expenses and other liabilities | 13,489 | 20,438 | |||||
Payable to affiliates | 89,526 | 25,440 | |||||
Convertible senior notes | 124,769 | 121,996 | |||||
Total liabilities | 227,844 | 168,085 | |||||
Commitments and contingent liabilities (see Note 3) | |||||||
Shareholders' Equity | |||||||
Common stock ($0.00001 par value; 120 million shares authorized, 52,848,811 shares issued and 48,220,243 shares outstanding as of December 31, 2016; 120 million shares authorized, 52,072,884 shares issued and 48,771,015 shares outstanding as of December 31, 2015) | — | — | |||||
Accumulated other comprehensive income | (36,842 | ) | (5,865 | ) | |||
Additional paid-in capital | 218,392 | 212,981 | |||||
Treasury stock, at cost (4,628,568 shares at December 31, 2016 and 3,301,869 at December 31, 2015, respectively) | (30,767 | ) | (21,808 | ) | |||
Retained earnings | 143,399 | 120,776 | |||||
Total shareholders' equity | 294,182 | 306,084 | |||||
Total liabilities and shareholders' equity | $ | 522,026 | $ | 474,169 | |||
F-48
Schedule I
GAIN CAPITAL HOLDINGS, INC.
(Parent Company Only)
Condensed Statements of Income and Comprehensive Income
(in thousands)
For the Fiscal Year Ended | |||||||||||
December 31, | |||||||||||
2016 | 2015 | 2014 | |||||||||
REVENUE: | |||||||||||
Dividends from subsidiaries | $ | — | $ | 38,642 | $ | — | |||||
Interest and other | 64 | 178 | 90 | ||||||||
Total revenue | $ | 64 | $ | 38,820 | $ | 90 | |||||
OPERATING EXPENSES: | |||||||||||
Interest expense | 39 | 63 | 64 | ||||||||
Employee compensation and benefits | 6,852 | 10,096 | 11,578 | ||||||||
Legal Settlements | 9,205 | — | — | ||||||||
General and administrative | 6,412 | 6,775 | 8,208 | ||||||||
Total operating expenses | 22,508 | 16,934 | 19,850 | ||||||||
Interest expense on long term borrowings | 10,421 | 9,222 | 6,147 | ||||||||
INCOME/(LOSS) BEFORE INCOME TAX EXPENSE | (32,865 | ) | 12,664 | (25,907 | ) | ||||||
Income tax (benefit) / expense | 2,603 | (10,875 | ) | (2,584 | ) | ||||||
NET INCOME/(LOSS) BEFORE UNDISTRIBUTED EARNINGS OF SUBSIDIARIES | (35,468 | ) | 23,539 | (23,323 | ) | ||||||
Equity in earnings of subsidiaries | 70,741 | (13,260 | ) | 48,200 | |||||||
NET INCOME | 35,273 | 10,279 | 24,877 | ||||||||
Other comprehensive (loss) / income | |||||||||||
Foreign currency translation adjustment | (30,977 | ) | (4,352 | ) | (4,089 | ) | |||||
EQUITY IN COMPREHENSIVE INCOME | $ | 4,296 | $ | 5,927 | $ | 20,788 | |||||
F-49
Schedule I
GAIN CAPITAL HOLDINGS, INC.
(Parent Company Only)
Condensed Statements of Cash Flows
(in thousands)
For the Fiscal Year Ended | |||||||||||
December 31, | |||||||||||
2016 | 2015 | 2014 | |||||||||
CASH FLOWS FROM OPERATING ACTIVITIES: | |||||||||||
Net income | $ | 35,273 | $ | 10,279 | $ | 24,877 | |||||
Adjustments to reconcile net income to cash provided by operating activities | |||||||||||
Equity in earnings of subsidiaries | (70,741 | ) | 13,260 | (48,200 | ) | ||||||
Loss on extinguishment of debt | (89 | ) | — | — | |||||||
Gain on foreign currency exchange rates | 21 | (66 | ) | — | |||||||
Deferred tax (benefit)/expense | (1,098 | ) | (11,264 | ) | 4,867 | ||||||
Amortization of deferred finance costs | 442 | 354 | 354 | ||||||||
Dividends received | 28 | — | — | ||||||||
Stock compensation expense | 4,151 | 3,680 | 3,452 | ||||||||
Convertible note discount amortization | 4,310 | 3,624 | 2,150 | ||||||||
Changes in operating assets and liabilities: | |||||||||||
Receivables from affiliates | 2,442 | 37,548 | (33,827 | ) | |||||||
Other assets | (5,861 | ) | 7,237 | (9,996 | ) | ||||||
Income tax receivable | 13,121 | (9,069 | ) | (771 | ) | ||||||
Accrued compensation and benefits | (151 | ) | 160 | 51 | |||||||
Accrued expenses and other liabilities | (6,949 | ) | (4,876 | ) | 10,426 | ||||||
Payable to affiliates | 64,064 | (36,549 | ) | 61,990 | |||||||
Cash provided by operating activities | 38,963 | 14,318 | 15,373 | ||||||||
CASH FLOWS FROM INVESTING ACTIVITIES: | |||||||||||
Investment and funding of subsidiaries | (23,957 | ) | 7,081 | (51,107 | ) | ||||||
Purchase of partial interest in GAA/TT | 7,444 | — | — | ||||||||
Purchase of short term investments | — | — | (92 | ) | |||||||
Cash provided by / (used for) investing activities | (16,513 | ) | 7,081 | (51,199 | ) | ||||||
CASH FLOWS FROM FINANCING ACTIVITIES: | |||||||||||
Contractual payments for acquisitions | — | (11,829 | ) | — | |||||||
Repurchase of Convertible Notes | (1,735 | ) | — | — | |||||||
Proceeds from exercise of stock options | 706 | 2,386 | 2,087 | ||||||||
Proceeds from employee stock purchase plan | 610 | 789 | 740 | ||||||||
Purchase of treasury stock | (8,959 | ) | (5,088 | ) | (1,251 | ) | |||||
Tax benefit from employee stock option exercises | 49 | 1,140 | 1,221 | ||||||||
Dividend payments | (10,222 | ) | (9,530 | ) | (8,139 | ) | |||||
Cash used for financing activities | (19,551 | ) | (22,132 | ) | (5,342 | ) | |||||
(DECREASE) / INCREASE IN CASH AND CASH EQUIVALENTS | 2,899 | (733 | ) | (41,168 | ) | ||||||
CASH AND CASH EQUIVALENTS — Beginning of year | 451 | 1,184 | 42,352 | ||||||||
CASH AND CASH EQUIVALENTS — End of year | $ | 3,350 | $ | 451 | $ | 1,184 | |||||
SUPPLEMENTARY DISCLOSURES OF CASH FLOW INFORMATION: | |||||||||||
Cash paid during the year for: | |||||||||||
F-50
Interest paid | $ | 5,830 | $ | 4,538 | $ | 3,373 | |||||
Taxes refunds received/taxes (paid) | $ | (3,552 | ) | $ | 733 | $ | (3,711 | ) | |||
Non-cash financing activities related to acquisitions: | |||||||||||
Common stock issued as consideration for asset and business acquisitions | $ | — | $ | 45,100 | $ | 6,493 | |||||
F-51
SCHEDULE I —
GAIN CAPITAL HOLDINGS, INC.
(PARENT COMPANY ONLY)
NOTES TO CONDENSED FINANCIAL STATEMENTS
1. Basis of Presentation
Basis of Financial Information — The accompanying condensed financial statements of GAIN Capital Holdings, Inc. (“Parent Company”), including the notes thereto, should be read in conjunction with the consolidated financial statements of GAIN Capital Holdings, Inc. and Subsidiaries (the “Company”) and the related notes.
The condensed financial statements are prepared in accordance with accounting principles generally accepted in the U.S. which require the Company or Parent Company to make estimates and assumptions regarding valuations of certain financial instruments and other matters that affect the Parent Company Financial Statements and related disclosures. Actual results could differ from these estimates.
The Company has several subsidiaries that are subjected to minimum net capital requirements as noted in Note 20 - Regulatory Requirements, in the accompanying consolidated financial statements. In accordance with SEC Rule § 210.12-04 Condensed financial information of registrant, the condensed financial information of the Parent Company is required to be presented when the restricted net assets of consolidated subsidiaries exceed 25 percent of the consolidated net assets as of the end of the most recently completed fiscal year. For purposes of the above test, restricted net assets of consolidated subsidiaries shall mean that amount of the registrant's proportionate share of net assets of consolidated subsidiaries (after intercompany eliminations) which as of the end of the most recent fiscal year may not be transferred to the Parent Company by subsidiaries in the form of loans, advances or cash dividends without the consent of a third party such as the primary regulators of the Company’s operating subsidiaries.
The Parent Company on a stand-alone basis, has accounted for majority-owned subsidiaries using the equity method of accounting.
2. Transactions with Subsidiaries
The Parent Company has transactions with its subsidiaries determined on an agreed upon basis. Cash dividends from subsidiaries were $0.0 million, $38.6 million, and $0.0 million for the years ended December 31, 2016, 2015, and 2014, respectively.
3. Commitments and Contingencies
For a discussion of commitments and contingencies, see Note 17 to the Company’s consolidated financial statements.
ITEM 16. FORM 10-K SUMMARY
None.
3. Exhibit Index
Exhibit No. | Description | |||
2.1† | Asset Purchase Agreement dated as of April 20, 2011 by and among GAIN Capital Group, LLC and Deutsche Bank AG, acting through is London Branch (Incorporated by reference to Exhibit 2.1 of the Registrant’s Form 10-Q for the quarter ended March 31, 2011, filed on May 16, 2011, No. 001-35008). | |||
2.2 | Stock Purchase Agreement, dated as of April 24, 2013, by and among GAIN Capital Holdings, Inc., Gary J. Tilkin and Global Futures & Forex, Ltd. (Incorporated by reference to Exhibit 2.1 of the Registrant’s Form 10-Q for the quarter ended March 31, 2013, filed on May 10, 2013, No. 001-35008). | |||
F-52
2.3 | Amended and Restated Stock Purchase Agreement, dated as of September 24, 2013, by and among GAIN Capital Holdings, Inc., Gary J. Tilkin and Global Futures & Forex, Ltd. (Incorporated by reference to Exhibit 2.1 to the Registrant's Current Report on Form 8-K, filed on September 25, 2013, No. 001-35008). | |||
2.4 | Share Purchase Agreement, dated as of October 31, 2014, by and among GAIN Capital Holdings, Inc., City Index Group Limited, INCAP Gaming B.V. and IPGL Limited (Incorporated by reference to Exhibit 2.1 of the Registrant's Current Report on Form 8-K/A, filed on January 12, 2015, No. 001-35008). | |||
3.1 | Third Amended and Restated Certificate of Incorporation (Incorporated by reference to Exhibit 3.3 of the Registrant’s Registration Statement on Form S-1, as amended, No. 333-161632). | |||
3.2 | Certificate of Designation of Series A Participating Cumulative Preferred Stock of GAIN Capital Holdings, Inc. (Incorporated by reference to Exhibit 3.1 to the Registrant's Current Report on Form 8-K, filed on April 10, 2013, No. 001-35008). | |||
3.3 | Amended and Restated By-laws (Incorporated by reference to Exhibit 3.2 of the Registrant’s Registration Statement on Form S-1, as amended, No. 333-161632). | |||
4.1 | Specimen Certificate evidencing shares of common stock (Incorporated by reference to Exhibit 4.1 of the Registrant’s Registration Statement on Form S-1, as amended, No. 333-161632). | |||
4.2 | Investor Rights Agreement, dated January 11, 2008, by and among the Company, the Investors and the Founding Stockholders, as defined therein (Incorporated by reference to Exhibit 4.2 of the Registrant’s Registration Statement on Form S-1, as amended, No. 333-161632). | |||
4.3 | Amendment to Investor Rights Agreement, dated as of November 18, 2013, by and among the Company, the Investors named therein and the Founding Stockholder, as defined therein (Incorporated by reference to Exhibit 4.3 of the Registrant's Annual Report on Form 10-K for the year ended December 31, 2013, as filed on March 17, 2014, No. 001-35008). | |||
4.4 | Rights Agreement, dated as of April 9, 2013, between GAIN Capital Holdings, Inc. and Broadridge Corporate Issuer Solutions, Inc., as Rights Agent (Incorporated by reference to Exhibit 4.1 to the Registrant's Current Report on Form 8-K, filed on April 10, 2013, No. 001-35008). | |||
4.5 | Indenture, dated as of November 27, 2013, between GAIN Capital Holdings, Inc. and The Bank of New York Mellon (Incorporated by reference to Exhibit 4.1 to the Registrant's Current Report on Form 8-K, filed on November 27, 2013, No. 001-35008). | |||
4.6 | Indenture, dated as of April 1, 2015, between GAIN Capital Holdings, Inc. and The Bank of New York Mellon (Incorporated by reference to Exhibit 4.11 of the Registrant's Registration Statement on Form S-3, as amended, No. 333-208175). | |||
10.1 | 2015 Omnibus Incentive Compensation Plan (Incorporated by reference to Annex A of the Registrant’s Definitive Proxy Statement on Schedule 14A, filed on October 15, 2015, No. 001-35008).** | |||
10.2 | 2010 Omnibus Incentive Compensation Plan (Incorporated by reference to Exhibit 10.2 of the Registrant’s Registration Statement on Form S-1, as amended, No. 333-161632).** | |||
F-53
10.3 | 2011 Employee Stock Purchase Plan (Incorporated by reference to Exhibit 10.3 of the Registrant’s Registration Statement on Form S-1, as amended, No. 333-161632).** | |||
10.4 | Nonqualified Deferred Compensation Plan (Incorporated by reference to Exhibit 10.3 of the Registrant’s Form 10-K for the year ended December 31, 2010, filed on March 30, 2011, No. 001-35008).** | |||
10.5 | Form of Incentive Stock Option Agreement (Incorporated by reference to Exhibit 10.4 of the Registrant’s Registration Statement on Form S-1, as amended, No. 333-161632). ** | |||
10.6 | Form of Nonqualified Stock Option Agreement (Incorporated by reference to Exhibit 10.5 of the Registrant’s Registration Statement on Form S-1, as amended, No. 333-161632). ** | |||
10.7 | Form of Restricted Stock Agreement (Incorporated by reference to Exhibit 10.6 of the Registrant’s Registration Statement on Form S-1, as amended, No. 333-161632). ** | |||
10.8 | Form of Restricted Stock Unit Agreement (Time Vesting) (Incorporated by reference to Exhibit 10.7 of the Registrant’s Registration Statement on Form S-1, as amended, No. 333-161632).** | |||
10.9 | Form of Restricted Stock Unit Agreement (Performance Vesting) (Incorporated by reference to Exhibit 10.8 of the Registrant’s Registration Statement on Form S-1, as amended, No. 333-161632).** | |||
10.10 | Form of Indemnification Agreement with the Company’s Non-Employee Directors (Incorporated by reference to Exhibit 10.10 of the Registrant’s Registration Statement on Form S-1, as amended, No. 333-161632).** | |||
10.11 | Amended and Restated 2006 Equity Compensation Plan, effective December 31, 2006 (Incorporated by reference to Exhibit 10.60 of the Registrant’s Registration Statement on Form S-1, as amended, No. 333-161632).** | |||
10.12 | Amendment No. 2007-1 to the GAIN Capital Holdings, Inc. 2006 Equity Compensation Plan (Incorporated by reference to Exhibit 10.61 of the Registrant’s Registration Statement on Form S-1, as amended, No. 333-161632).** | |||
10.13 | Amendment No. 2008-1 to the GAIN Capital Holdings, Inc. 2006 Equity Compensation Plan (Incorporated by reference to Exhibit 10.62 of the Registrant’s Registration Statement on Form S-1, as amended, No. 333-161632).** | |||
10.14 | Amendment No. 2010-1 to the GAIN Capital Holdings, Inc. 2006 Equity Compensation Plan (Incorporated by reference to Exhibit 10.63 of the Registrant’s Registration Statement on Form S-1, as amended, No. 333-161632).** | |||
10.15† | FX Prime Brokerage Master Agreement, dated as of December 6, 2006, by and between GAIN Capital Group, LLC and The Royal Bank of Scotland, plc. (Incorporated by reference to Exhibit 10.24 of the Registrant’s Registration Statement on Form S-1, as amended, No. 333-161632). | |||
10.16† | FX Prime Brokerage Agreement, dated as of July 8, 2005, by and between UBS AG and GAIN Capital, Inc. (Incorporated by reference to Exhibit 10.25 of the Registrant’s Registration Statement on Form S-1, as amended, No. 333-161632). | |||
F-54
10.17† | Foreign Exchange Prime Brokerage Agency Agreement, dated as of July 12, 2006, by and between GAIN Capital Group, LLC and The Royal Bank of Scotland, plc. (Incorporated by reference to Exhibit 10.26 of the Registrant’s Registration Statement on Form S-1, as amended, No. 333-161632). | |||
10.18† | Foreign Exchange Prime Brokerage Agreement, dated October 18, 2005, by and between Deutsche Bank AG, London Branch and GCAM, LLC (Incorporated by reference to Exhibit 10.27 of the Registrant’s Registration Statement on Form S-1, as amended, No. 333-161632). | |||
10.19 | Amendment to Foreign Exchange Prime Brokerage Agreement, dated January 26, 2006, by and between Deutsche Bank AG, London Branch and GCAM, LLC (Incorporated by reference to Exhibit 10.28 of the Registrant’s Registration Statement on Form S-1, as amended, No. 333-161632). | |||
10.20 | Form of ISDA Master Agreement, 1992 edition (Incorporated by reference to Exhibit 10.29 of the Registrant’s Registration Statement on Form S-1, as amended, No. 333-161632). | |||
10.21 | Form of Introducing Broker Agreement (Incorporated by reference to Exhibit 10.30 of the Registrant’s Registration Statement on Form S-1, as amended, No. 333-161632). | |||
10.22 | Form of Agreement for White Label Services (Incorporated by reference to Exhibit 10.31 of the Registrant’s Registration Statement on Form S-1, as amended, No. 333-161632). | |||
10.23 | Lease and Lease Agreement, dated August 18, 2009, by and between S/K Bed One Associates LLC and GAIN Capital Holdings, Inc. (Incorporated by reference to Exhibit 10.37 of the Registrant’s Registration Statement on Form S-1, as amended, No. 333-161632). | |||
10.24† | License Agreement, dated August 9, 2007, by and between GAIN Capital Group, LLC and MetaQuotes Software Corp. (Incorporated by reference to Exhibit 10.43 of the Registrant’s Registration Statement on Form S-1, as amended, No. 333-161632). | |||
10.25† | Agreement, dated November 22, 2004, by and between esignal, a division of Interactive Data Corporation, and GAIN Capital, Inc. (Incorporated by reference to Exhibit 10.44 of the Registrant’s Registration Statement on Form S-1, as amended, No. 333-161632). | |||
10.26 | Form of ISDA Master Agreement, 2002 edition (Incorporated by reference to Exhibit 10.49 of the Registrant’s Registration Statement on Form S-1, as amended, No. 333-161632). | |||
10.27 | Executive Employment Agreement, dated May 5, 2015, by and between GAIN Capital Holdings, Inc. and Glenn Stevens (Incorporated by reference to Exhibit 10.1 of the Registrant’s Quarterly Report on Form 10-Q for the quarter ended June 30, 2015, filed on August 10, 2015, No. 001-35008).** | |||
10.28 | Executive Employment Agreement, dated May 5, 2015, by and between GAIN Capital Holdings, Inc. and Samantha Roady (Incorporated by reference to Exhibit 10.2 of the Registrant’s Quarterly Report on Form 10-Q for the quarter ended June 30, 2015, filed on August 10, 2015, No. 001-35008).** | |||
10.29 | Executive Employment Agreement, dated May 5, 2015, by and between GAIN Capital Holdings, Inc. and Diego Rotsztain (Incorporated by reference to Exhibit 10.3 of the Registrant’s Quarterly Report on Form 10-Q for the quarter ended June 30, 2015, filed on August 10, 2015, No. 001-35008).** | |||
F-55
10.30* | Service Agreement, dated as of March 9, 2011, by and between City Index Limited and Nigel Rose (Incorporated by reference to Exhibit 10.31 of the Registrant's Annual Report on Form 1-K for the year ended December 31, 2015, filed on March 17, 2016, No. 001-35008).** | |||
10.31 | Asset Purchase Agreement, dated as of October 5, 2010, by and among GAIN Capital Group, LLC, GAIN Capital-Forex.com U.K., and GAIN Capital Forex.com Japan, Co. Ltd., and Capital Market Services, LLC, Capital Market Services UK Ltd., Capital Market Services International - BM, Ltd., and CMS Japan K.K. (Incorporated by reference to Exhibit 10.64 of the Registrant’s Registration Statement on Form S-1, as amended, No. 333-161632). | |||
10.33 | Amendment No. 1 to Asset Purchase Agreement, dated as of November 23, 2010, by and among GAIN Capital Group, LLC, GAIN Capital-Forex.com U.K., and GAIN Capital Forex.com Japan, Co. Ltd., and Capital Market Services, LLC, Capital Market Services UK Ltd., Capital Market Services International - BM, Ltd., and CMS Japan K.K. (Incorporated by reference to Exhibit 10.65 of the Registrant’s Registration Statement on Form S-1, as amended, No. 333-161632). | |||
10.33 | Stock Purchase Agreement between optionsXpress Holdings, Inc. and GAIN Capital Group, LLC dated as of June 27, 2012 (Incorporated by reference to Exhibit 10.1 of the Registrant’s Quarterly Report on Form 10-Q for the quarter ended June 30, 2012, filed August 9, 2012, No. 001-35008). | |||
10.34 | Stockholders’ Agreement, dated as of April 24, 2013, by and among GAIN Capital Holdings, Inc. and Gary J. Tilkin (Incorporated by reference to Exhibit 10.1 of the Registrant’s Form 10-Q for the quarter ended March 31, 2013, filed on May 10, 2013, No. 001-35008). | |||
10.35 | Amended and Restated Stockholders’ Agreement, dated as of September 24, 2013, by and between GAIN Capital Holdings, Inc. and Gary J. Tilkin (Incorporated by reference to Exhibit 10.1 of the Registrant’s Form 10-Q for the quarter ended September 30, 2013, filed on November 12, 2013, No. 001-35008). | |||
10.36 | Membership Interest Purchase Agreement, dated as of March 7, 2014, by and among GAIN Capital Holdings, Inc., Global Asset Advisors, LLC, Lucky Good Dog, L.L.C., Glenn A. Swanson and Andrew W. Daniels (Incorporated by reference to Exhibit 10.1 of the Registrant's Quarterly Report on Form 10-Q for the quarter ended March 31, 2014, filed on May 12, 2014, No. 001-35008). | |||
10.37 | Membership Interest Purchase Agreement, dated as of March 7, 2014, by and among GAIN Capital Holdings, Inc., Top Third Ag Marketing LLC, Global Asset Advisors, LLC, Lucky Good Dog, L.L.C., Glenn A. Swanson and Mark Gold (Incorporated by reference to Exhibit 10.2 of the Registrant's Quarterly Report on Form 10-Q for the quarter ended March 31, 2014, filed on May 12, 2014, No. 001-35008). | |||
10.38 | Asset Purchase Agreement, dated as of July 10, 2014, between GAIN GTX Bermuda, Ltd., GAIN Capital Holdings, Inc. and Valaquenta Intellectual Properties Limited (Incorporated by reference to Exhibit 10.1 of the Registrant's Quarterly Report on Form 10-Q for the quarter ended September 30, 2014, filed on November 11, 2014, No. 001-35008). | |||
10.39 | Asset Purchase Agreement, dated as of July 10, 2014, between GAIN GTX Bermuda, Ltd., GAIN Capital Holdings, Inc. and Forexster Limited (Incorporated by reference to Exhibit 10.2 of the Registrant's Quarterly Report on Form 10-Q for the quarter ended September 30, 2014, filed on November 11, 2014, No. 001-35008). | |||
F-56
10.40 | Stockholders' Agreement, effective as of October 31, 2104, among GAIN Capital Holdings, Inc., City Index Group Limited and the other parties identified as "Stockholders" therein (Incorporated by reference to Exhibit 10.1 of the Registrant's Current Report on Form 8-K/A, filed on January 12, 2015, No. 001-35008). | |||
10.41 | Form of Registration Rights Agreement among GAIN Capital Holdings, Inc., City Index Group Limited, INCAP Gaming B.V. and the other parties identified as "Investors" therein (Incorporated by reference to Exhibit 10.2 of the Registrant's Current Report on Form 8-K/A, filed on January 12, 2015, No. 001-35008). | |||
10.42 | Letter Agreement, dated as of December 10, 2014, by and among GAIN Capital Holdings, Inc., VantagePoint Venture Partners IV (Q), L.P., VantagePoint Venture Partners IV, L.P., VantagePoint Venture Partners IV Principals Fund, L.P. and VP New York Venture Partners, L.P. | |||
10.43* | Employment Agreement, dated as of October 1, 2016, by and between GAIN Capital Holdings, Inc. and Jeffrey Scott.** | |||
21.1* | Subsidiaries of the Registrant. | |||
23.1* | Consent of Deloitte & Touche LLP | |||
23.2* | Consent of BDO LLP | |||
23.3* | Consent of KPMG LLP | |||
31.1* | Certification of Chief Executive Officer pursuant to rule 13a-14(a) under the Securities Exchange Act of 1934, as amended. | |||
31.2* | Certification of Chief Financial Officer pursuant to rule 13a-14(a) under the Securities Exchange Act of 1934, as amended. | |||
32.1* | Certification of Chief Executive Officer as required by section 906 of the Sarbanes-Oxley Act of 2002. | |||
32.2* | Certification of Chief Financial Officer as required by section 906 of the Sarbanes-Oxley Act of 2002. | |||
101.INS+ | XBRL Instance | |||
101.SCH+ | XBRL Taxonomy Extension Schema | |||
101.CAL+ | XBRL Taxonomy Extension Calculation | |||
101.DEF+ | XBRL Taxonomy Extension Definition | |||
101.LAB+ | XBRL Taxonomy Extension Labels | |||
101.PRE+ | XBRL Taxonomy Extension Presentation | |||
F-57
* | Filed herewith. | |||
** | Compensation related contract. |
† | Confidential treatment requested. Confidential materials omitted and filed separately with the Securities and Exchange Commission. |
+ | XBRL (Extensible Business Reporting Language) information is furnished and not filed, and is not a part of a registration statement or prospectus for purposes of Sections 11 or 12 of the Securities Act of 1933, as amended, is deemed not filed for purposes of Section 18 of the Securities Exchange Act of 1934, as amended, and otherwise is not subject to liability under these sections. |
F-58
SIGNATURES
Pursuant to the requirements of Section 13 or 15(d) of the Securities Exchange Act of 1934, the registrant has duly caused this
report to be signed on its behalf by the undersigned, thereunto duly authorized on the 15th day of March, 2017.
GAIN CAPITAL HOLDINGS, INC. | |
By: | /s/ Glenn H. Stevens |
Glenn H. Stevens | |
President and Chief Executive Officer (Principal Executive Officer) | |
Pursuant to the requirements of the Securities Act of 1934, the registrant has duly caused this report to be signed on its behalf by the undersigned thereunto duly authorized.
Signature | Title | Date | ||
/s/ Glenn H. Stevens | President, Chief Executive Officer and Director (Principal Executive Officer) | March 15, 2017 | ||
Glenn H. Stevens | ||||
/s/ Nigel Rose | Chief Financial Officer (Principal Financial Officer and Principal Accounting Officer) | March 15, 2017 | ||
Nigel Rose | ||||
/s/ Peter Quick | Chairman of the Board of Directors | March 15, 2017 | ||
Peter Quick | ||||
/s/ Joseph A. Schenk | Director | March 15, 2017 | ||
Joseph A. Schenk | ||||
/s/ Christopher W. Calhoun | Director | March 15, 2017 | ||
Christopher W. Calhoun | ||||
/s/ Thomas Bevilacqua | Director | March 15, 2017 | ||
Thomas Bevilacqua | ||||
/s/ Christopher S. Sugden | Director | March 15, 2017 | ||
Christopher S. Sugden | ||||
F-59