Attached files
| file | filename |
|---|---|
| 8-K - FORM 8-K - TOYS R US INC | d24065d8k.htm |
 Toys“R”Us, Inc. Investor Presentation July 30, 2015 Exhibit 99.1 |
 2 | Forward Looking Statements This presentation contains “forward-looking” statements within the meaning of the federal securities laws, and such
statements are intended to be covered by the safe harbors created
thereby. These forward-looking statements reflect our current views with respect to, among other things, our operations and financial performance. All statements herein or therein that are not historical facts, including statements about our beliefs or expectations, are
forward-looking statements. We generally identify these
statements by words or phrases, such as “anticipate,” “estimate,” “plan,” “project,” “expect,” “believe,” “intend,”
“foresee,” “forecast,” “will,” “may,”
“outlook” or the negative version of these words or other similar words or phrases. These statements discuss, among other things, our strategy, store openings, integration and remodeling, the development, implementation and integration of our Internet
business, future financial or operational performance, projected
sales for certain periods, comparable store net sales from one period to another, cost savings, results of store closings and restructurings, outcome or impact of pending or threatened litigation, domestic or international developments, amount and
allocation of future capital expenditures, growth initiatives,
inventory levels, cost of goods, selection and type of merchandise, marketing positions, implementation of safety standards, future financings, estimates regarding future effective tax rates, and other goals and targets and statements of the
assumptions underlying or relating to any such statements.
These statements are subject to risks, uncertainties and other factors,
including, among others, the seasonality of our business, competition in the retail industry, changes in our product distribution mix and distribution channels, general economic factors in the United States and other
countries in which we conduct our business, consumer spending
patterns, birth rates, our ability to implement our strategy including implementing initiatives for season, our ability to recognize cost savings, implementation and operation of our new eCommerce platform, marketing strategies, the availability of adequate
financing, access to trade credit, changes in consumer
preferences, changes in employment legislation, our dependence on key vendors for our merchandise, political and other developments associated with our international operations, potential savings in connection with any store closings, costs of goods that
we sell, labor costs, transportation costs, domestic and
international events affecting the delivery of toys and other products to our stores, product safety issues including product recalls, the existence of adverse litigation, changes in laws that impact our business, our substantial level of indebtedness and related
debt-service obligations, restrictions imposed by covenants
in our debt agreements and other risks, uncertainties and factors set forth under Item1A entitled “RISK FACTORS” of Toys“R”Us, Inc.’s Annual Report on Form 10-K for the fiscal year ended January 31, 2015 and its other reports and
documents filed with the Securities and Exchange Commission. In
addition, we typically earn a disproportionate part of our annual operating earnings in the fourth quarter as a result of seasonal buying patterns and these buying patterns are difficult to forecast with certainty. These factors should not be construed as exhaustive,
and should be read in conjunction with the other cautionary
statements that are included in those reports and documents. We believe that all forward-looking statements are based on reasonable assumptions when made; however, we caution that it is impossible to predict actual results or outcomes or the effects of
risks, uncertainties or other factors on anticipated results or
outcomes and that, accordingly, one should not place undue reliance on these statements. Forward-looking statements speak only as of the date they were made, and we undertake no obligation to update these statements in light of subsequent events or
developments unless required by the Securities and Exchange
Commission’s rules and regulations. Actual results and outcomes may differ materially from anticipated results or outcomes discussed in any forward-looking statement. PRELIMINARY ESTIMATES
The presentation includes an estimated Last Twelve Months (LTM) Adjusted EBITDA for the second quarter of fiscal 2015, which is based on
preliminary internal financial reports and is subject to revision
based on the completion of the second fiscal quarter and the quarterly accounting and financial reporting processes. Accordingly, our actual results may differ from this estimate and such a difference may be material. |
 David Brandon Chairman & CEO 3 | |
 Company Overview and FY 2014/Q1 2015 Highlights
4 | 1 |
 5 | Toys“R”Us Unique Brand Strengths Iconic brand with global recognition Growing international presence Strongest growth coming from China and Southeast Asia Net sales of $12 billion – 61% U.S.; 39% International – Significant liquidity $1.2 billion in global internet sales and growing Omnichannel initiatives providing efficiencies and growth opportunities A strong and loyal customer base Well-established vendor relationships 19 million active loyalty members in the U.S. and millions more in international programs Working with key vendors on joint business planning and optimizing supply chain Continue to obtain exclusive offerings |
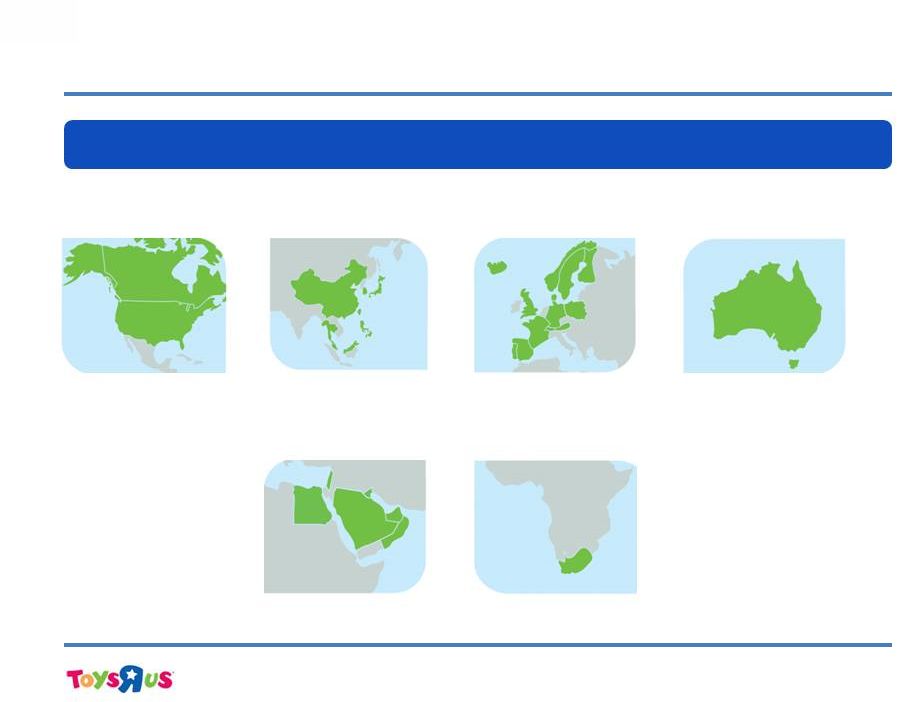 6 | Global Footprint and Growing International Presence As of May 2, 2015 OPERATED INT’L MARKETS ACCOUNTED FOR 39% OF TOTAL 2014 ANNUAL NET SALES
North America Operated: 953 Middle East Licensed: 58 Asia Operated*: 323 Licensed: 59 Excludes express stores with a cumulative lease term of less than 2 years
* Includes a Joint Venture in which we hold a 70% ownership (160
stores) Africa
Licensed: 74
Europe Operated: 287 Licensed: 53 Australia Operated: 34 |
 7 | Company Highlights – FY 2014/YTD 2015 Improving customer satisfaction 1 Refinanced 2016 maturities 2 3 First annual net sales growth since FY 2010 1 4 FFG delivers $111M of savings in FY 2014 5 Adj. EBITDA grew by 10% in FY 2014 6 Q1‘15 LTM Adj. EBITDA of $685M 2 7 FFG savings target increased to $325M 8 Hired Dave Brandon 9 Moving eCommerce in-house by mid-2016 Extended $1.85BN Delaware ABL in March 2014 10 1 On a constant FX basis 2 See Appendix for Adjusted EBITDA reconciliation Note: FFG = Fit for Growth 2014 YTD 2015 Estimated Q2’15 LTM Adj. EBITDA of $700M+ 2 11 |
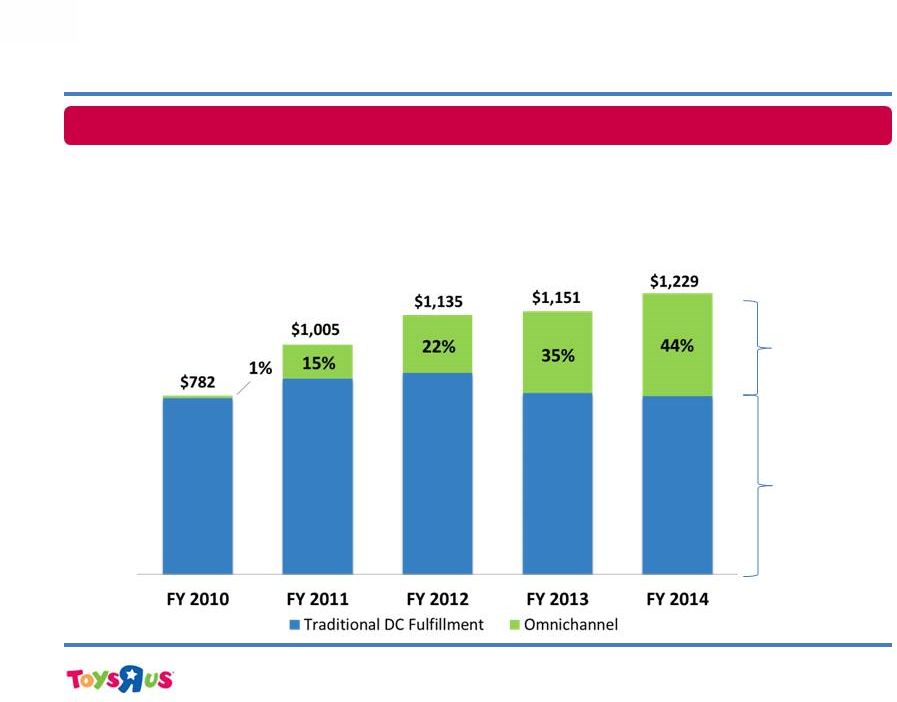 Growth - eCommerce 8 | Bringing eCommerce platform in-house by mid-2016 to increase control Traditional DC Fulfillment Omnichannel $’s in millions |
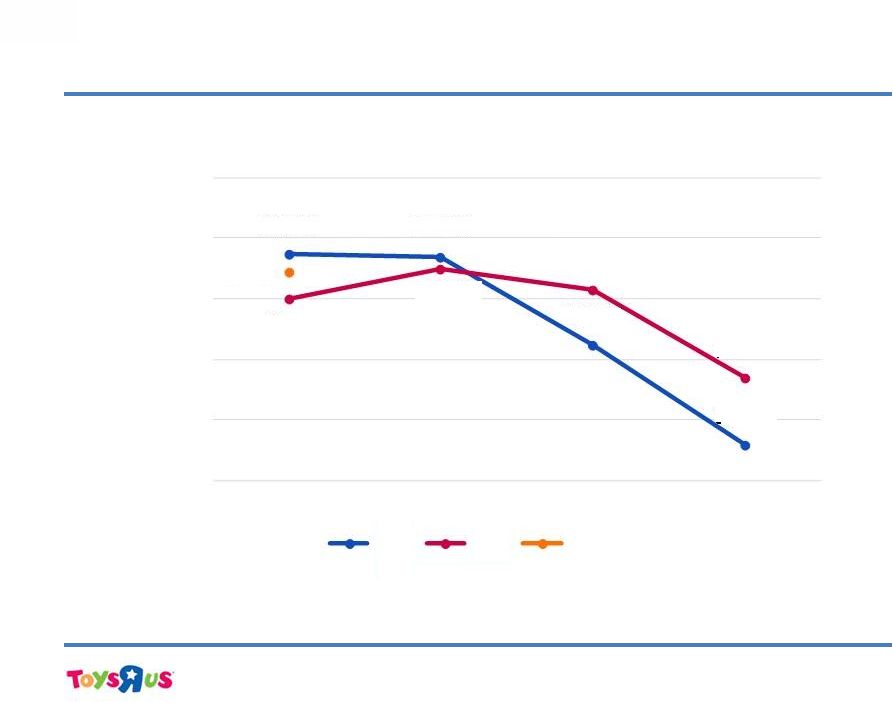 Excludes ($51M) charge in Q4 2013 (+1.5% impact), $11M benefit in Q1 2014 (-0.7% impact) and ($19M) charge in Q2 2014 (+1.3% impact) related to excess and obsolete inventory identified in Q4 2013 Includes a $2M benefit in Q1 2013 (+0.1% impact) related to unrecognized dotcom sales, and excludes $3M recorded in Q2 2013 (-0.2% impact) related to a dotcom prior period sales adjustment 9 | Improving U.S. Gross Margin Trends 36.5% 36.4% 33.5% 30.2% 35.0% 36.0% 35.3% 32.4% 35.9% 29.0% 31.0% 33.0% 35.0% 37.0% 39.0% Q1 Q2 Q3 Q4 2013 2014 2015 |
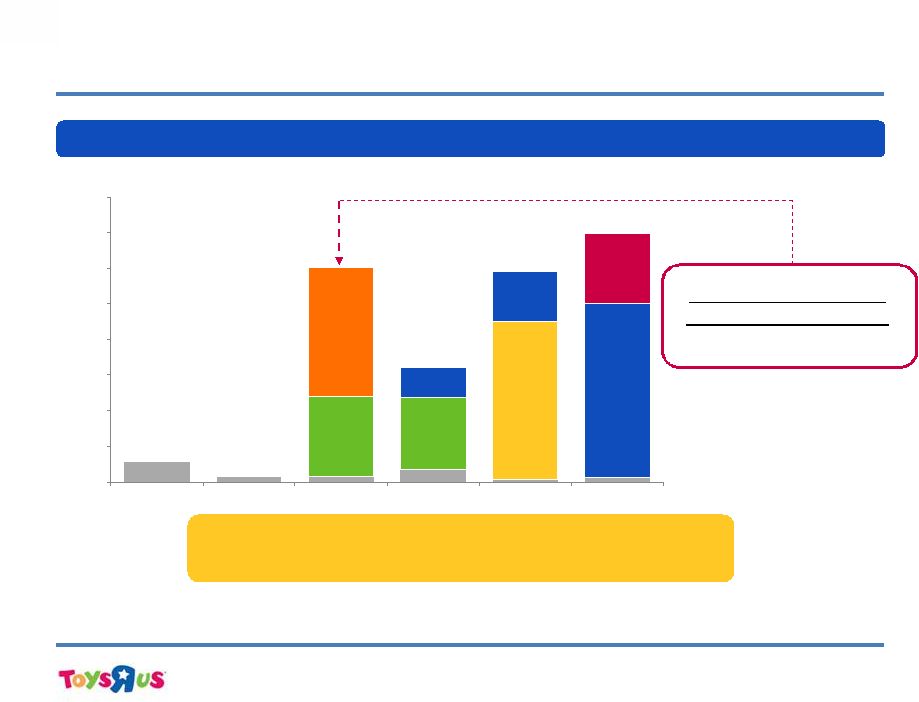
   10 | Fit For Growth Savings • Significant cost savings already achieved with a clear path to additional savings
identified – In FY 2014 identified $237 in global margin & SG&A savings – As initiatives have taken hold, additional $88 identified in the US taking total
global savings to $325
$’s in millions
Initiatives Domestic International Consolidated Marketing Effectiveness $84 $-- $84 End-to-End 21 -- 21 Private Label 18 12 30 Sub-total Margin $123 $12 $135 In-Store Operations 53 14 67 Supply Chain 4 9 13 Organizational Effectiveness 25 12 37 Procurement & Other 58 15 73 Sub-total SG&A $140 $50 $190 Fit For Growth Total $263 $62 $325 Margin SG&A |
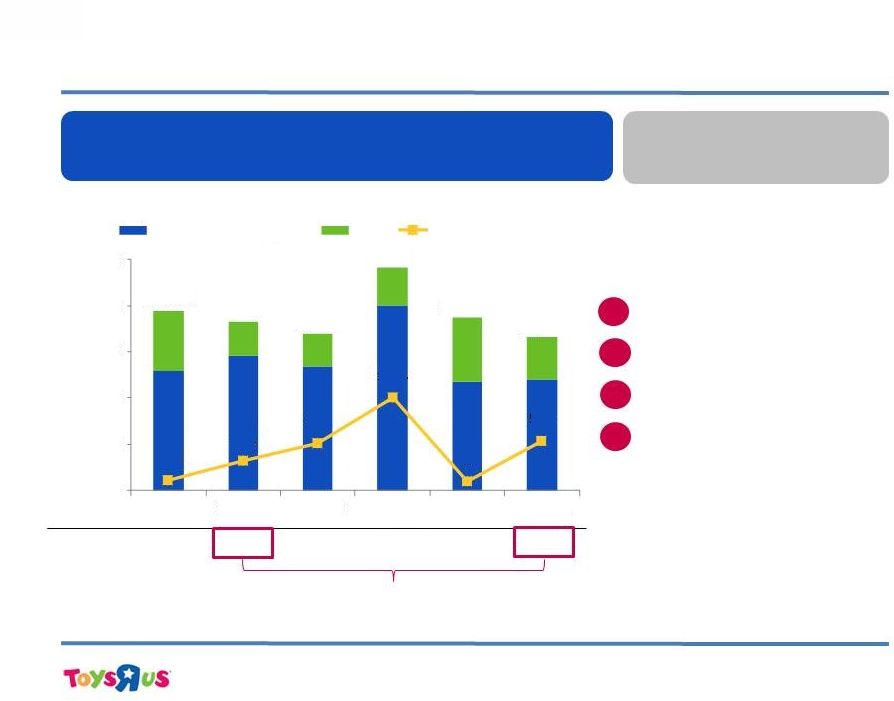
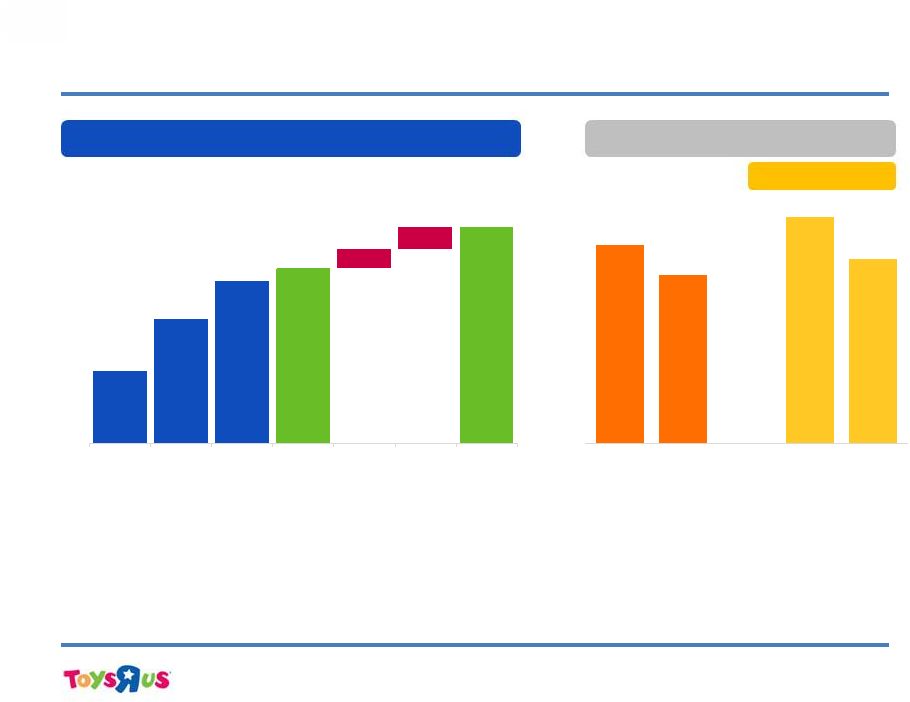 7.5x 6.4x 8.5x 7.0x 2013 2014 2014 2015 Q1 Q4 $583 $642 $685 $700 $747 $22 $25 FY 2013 FY 2014 LTM Q1 2015 Estimated LTM Q2 2015 FAO / Times Square Consultant Fees / Other Estimated Pro Forma LTM Q2 2015 11 | Forward Adjusted EBITDA Momentum LTM Adj. EBITDA Net Debt / LTM Adj. EBITDA $’s in millions • We expect an end to FFG consultants in 2015 • Further upside from annualization of remaining FFG initiatives (not currently quantified) • Company continues to delever + + Deleveraged by 1.5x |
 Total Liquidity
$1,835 $1,505 $1,176 $1,407
$1,773 $1,125
12 | Global Liquidity $’s in millions Significant liquidity even during FY 2014 peak borrowing with corresponding excess availability of $910 Draw for Oct. 2014 Refi……………...($134) Decr. in U.S./Can Borrowing Base..($116) Decr. in Japan Credit Line………………($71) Incr. in Annual Bonus………………….…($63)
Liquidity Reconciliation
4 Change of $380 Main drivers of change in total liquidity between Q1 2014 and Q1 2015 are: 108 324 514 1,003 99 533 $- $500 $1,000 $1,500 $2,000 $2,500 2013 Q4 2014 Q1 2014 Q2 2014 Q3 2014 Q4 2015 Q1 Gross Borrowing Capacity Cash Usage (including LCs) $1,943 $1,829 $1,690 $2,410 $1,872 $1,658 3 2 1 Note: Total borrowing capacity takes into consideration the $125 million excess availability covenant at Toys-Delaware, does not
include Toys Labuan uncommitted lines
|
 Inc. Notes Inc. Notes Propco II Notes Delaware B-2/B-3 Propco I Term Loan Delaware FILO Delaware B-4 Loan UK Propco 0 200 400 600 800 1,000 1,200 1,400 1,600 2015 2016 2017 2018 2019 2020+ 13 | Debt Maturities Maturity Profile Note: Excludes $13 million capital lease obligations, $189 million of finance obligations associated with capital projects, and $47
million of mandatory prepayments related to Propco I Term loan
where the cash is currently held on deposit Debt presented at face
value $’s in millions | As of FY 2014
2017 Maturity Profile
Q1 Q2 Q3 Q4 $ -- $ -- $450 $725 No significant debt maturities until August 2017 provides a clear path for business plan execution |
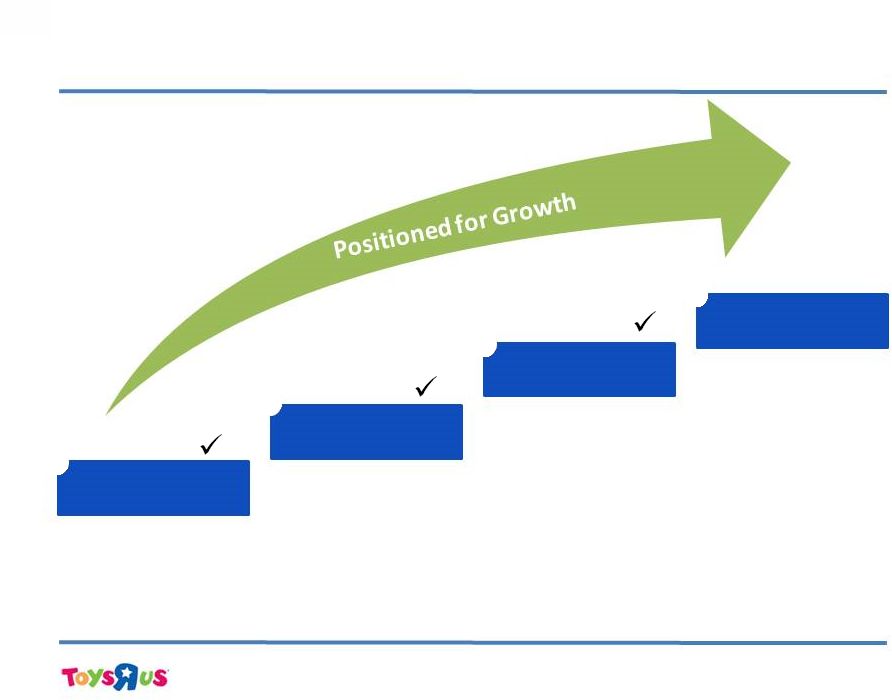 Toys“R”Us Transformation 14 | Transformed Customer Experience • Increased GSAT scores • eCommerce • Babies“R”Us focus Develop High Performing Teams Become Fit for Growth Growth Executed Executed Executing Entering Phase • New management hires • Store productivity • Rewards/ recognition • Streamline costs • $325M of cost savings • $155M through Q1 • Hired CEO, David Brandon • Insourcing eCommerce 1 2 3 4 |
 Financial Summary
15 | 2 |
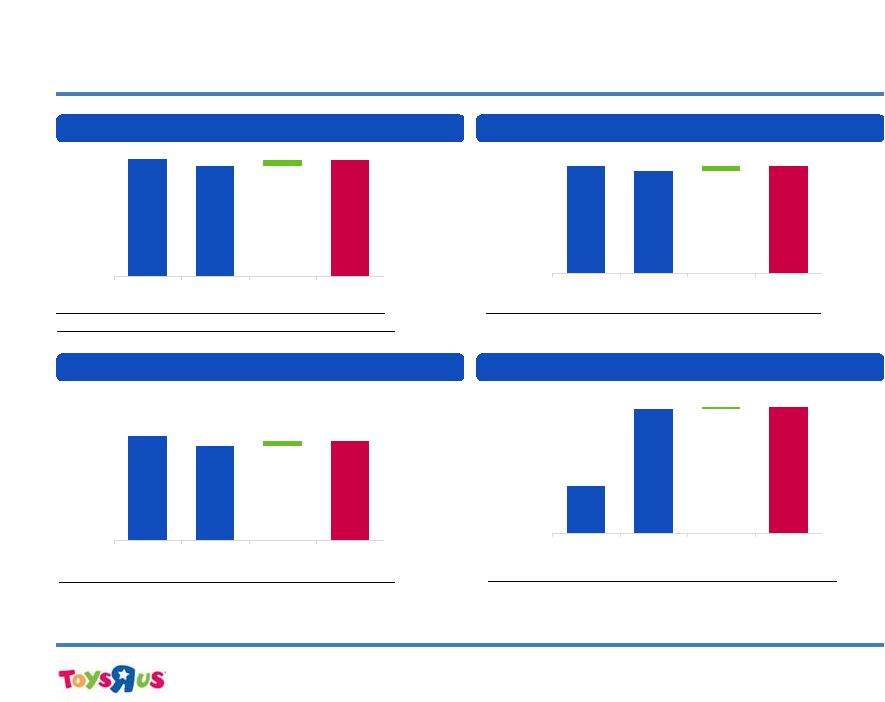
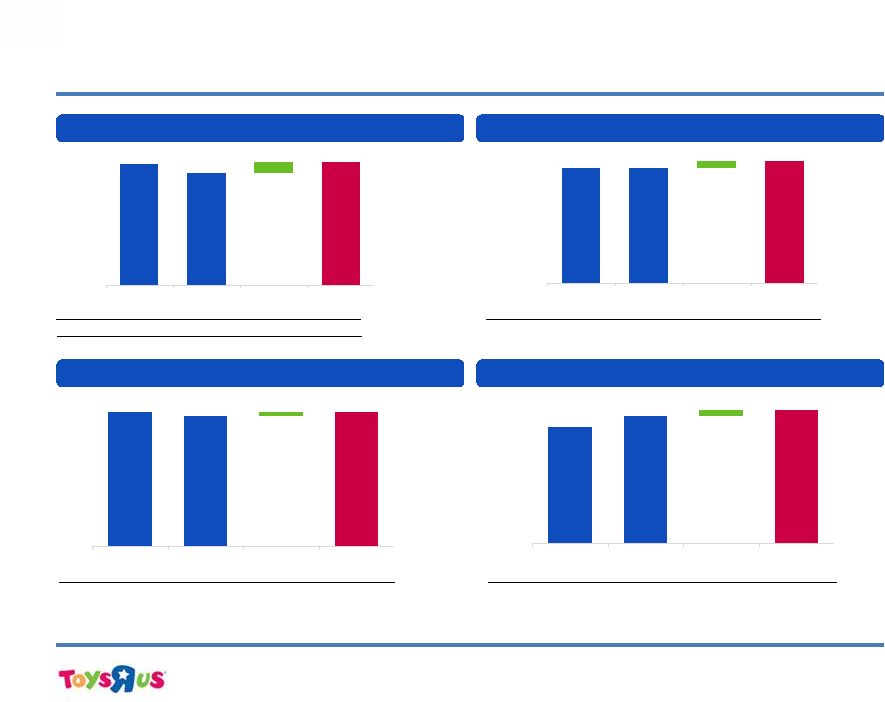 $583 $642 $666 $24 FY 2013 FY 2014 FX Adjusted FY 2014 $3,856 $3,796 $3,855 $59 FY 2013 FY 2014 FX Adjusted FY 2014 $12,543 $12,361 $12,604 $243 FY 2013 FY 2014 FX Adjusted FY 2014 $4,439 $4,438 $4,521 $83 FY 2013 FY 2014 FX Adjusted FY 2014 Toys“R”Us, Inc. Summary P&L – Full Year 16 | Adjusted SG&A Adjusted EBITDA Net
Sales
(1.5%) 0.5%
SFS
Change
0.0% 0.0%
Adj. Gross
Margin
35.9% 35.9%
Adj. SG&A Margin
30.7% 30.6%
Adj. EBITDA Margin
5.2% 5.3%
Note: SG&A includes Other Income
See Appendix for summary of adjustments to the above balances
Net Sales Adjusted Gross Margin $’s in millions |
 Toys“R”Us, Inc. Summary P&L – Q1 2015 17 | Adjusted SG&A Adjusted EBITDA Net Sales (6.2%)
(0.9%)
SFS
Change
(1.0%) (1.0%)
Adj. Gross
Margin
37.1% 37.1%
Adj. SG&A
Margin
34.1% 34.2%
Adj. EBITDA
Margin
3.0% 2.9%
$2,479 $2,325 $2,456 $131 Q1 2014 Q1 2015 FX Adjusted Q1 2015 $907 $862 $912 $50 Q1 2014 Q1 2015 FX Adjusted Q1 2015 $880 $792 $841 $49 Q1 2014 Q1 2015 FX Adjusted Q1 2015 $27 $70 $71 $1 Q1 2014 Q1 2015 FX Adjusted Q1 2015 Net Sales Adjusted Gross Margin $’s in millions Note: SG&A includes Other Income See Appendix for summary of adjustments to the above balances |
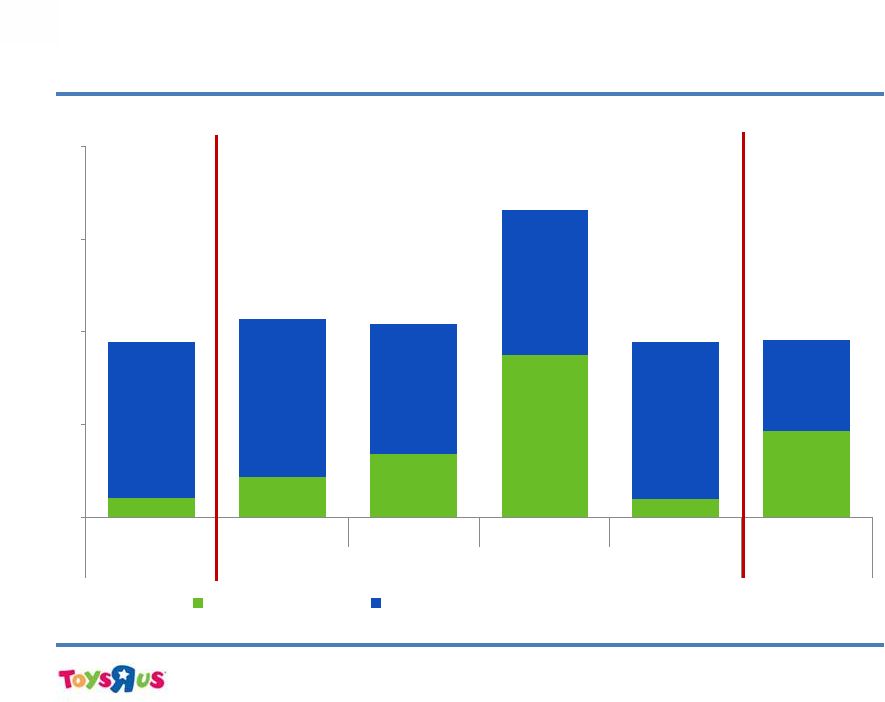 18 | 2015 North American ABL Availability $’s in millions $844 $854 $703 $777 $848 $490 $103 $216 $342 $877 $99 $464 -- $500 $1,000 $1,500 $2,000 Q4 Q1 Q2 Q3 Q4 Q1 2013 2014 2015 Usage (incl LC's) Excess Availability (net of $125 million covenant) |
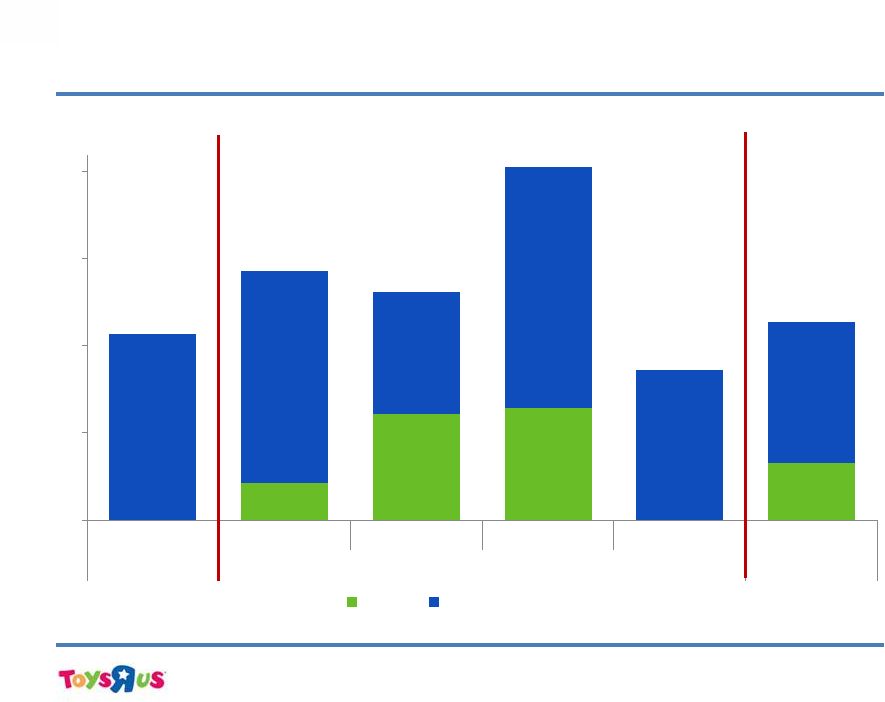 19 | 2015 European/Australian ABL Availability $’s in millions -- $21 $61 $65 -- $33 $107 $122 $70 $138 $86 $81 -- $50 $100 $150 $200 Q4 Q1 Q2 Q3 Q4 Q1 2013 2014 2015 Usage Excess Availability |
 Trade Credit Overview
20 | 3 |
 21 | Big Three Credit Insurers • S&P rated: AA- • In business for 99 years • 34% market share (#1) • Look after 52,000 companies • 20,000 credit decisions per day • 40 million companies monitored • Member of Allianz Euler Hermes • Moody’s rated: A2 • In business for 70 years • Present in 99 countries • Look after 40,000 companies • 10,000 credit decisions a day • Natixis is a major shareholder Coface • Moody’s rated: A3 • In business for 90 years • 31% market share • Present in 50 countries • Provide information on 200 million companies Atradius Source: Company websites |
 22 | Trade Creditor Illustrative Example • In certain instances we may assist vendors with early payments, which is a timing based
action • However, in these instances we work with our vendor partners such that the exchange is
mutually beneficial for both them and us
• In the example above, we may have differing terms of early payment based on the size of
the vendor Terms Original Potential Offer Inventory Purchase Amount $100 $100 Terms Net / 45 1.5% / 10 Payment Amount $100 $98 APR -- 16.0% |
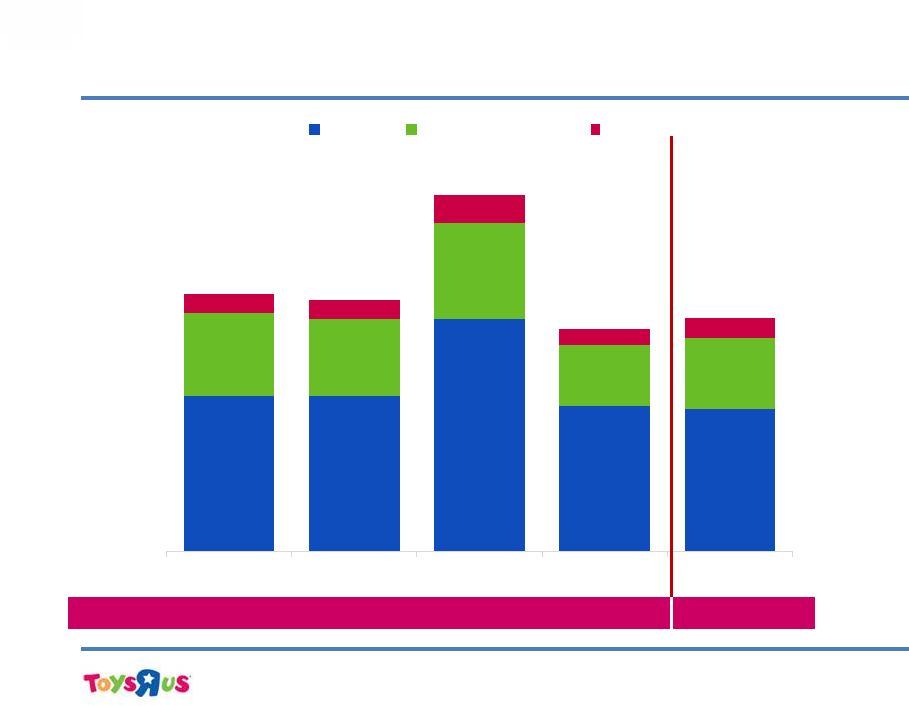 $1,440 $1,442 $2,168 $1,353 $1,329 $779 $733 $890 $569 $663 $177 $169 $266 $142 $172 $2,396 $2,344 $3,324 $2,064 $2,164 2014 Q1 2014 Q2 2014 Q3 2014 Q4 2015 Q1 Domestic Europe/Asia/Australia Canada 23 | Inventory By Region $’s in millions Note: Includes FX impact Total Liquidity
$1,505 $1,176
$1,407 $1,773 $1,125
|
 Appendix 4 24 | |
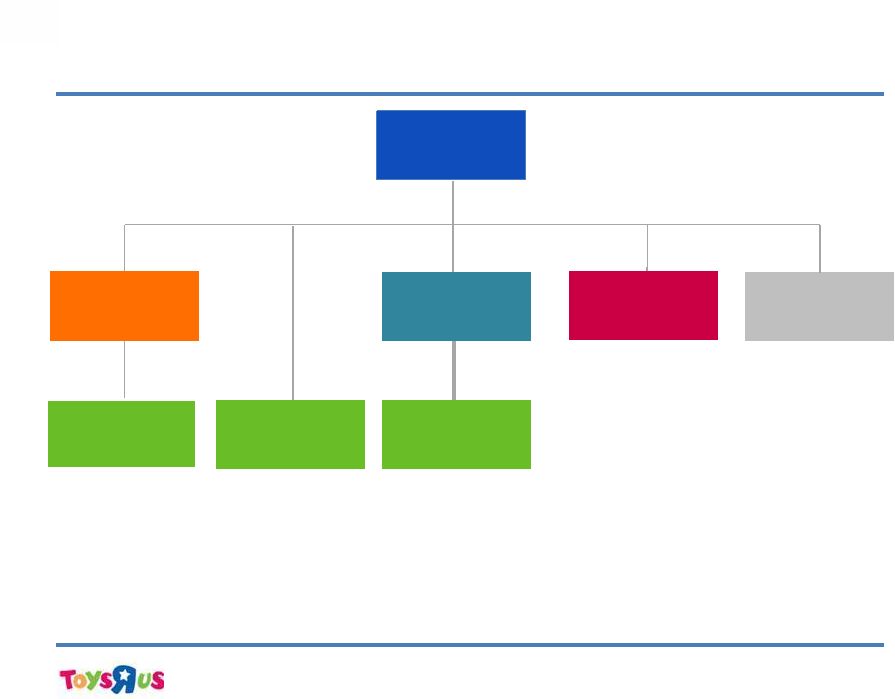 25 | Capital Structure $’s in millions | as of May 2, 2015 Toys“R”Us, Inc. Toys“R”Us Property Company II, LLC (“PropCo II”) Toys“R”Us Property Company II, LLC (“PropCo II”) Term Loan | $970 Senior Notes | $850 Note: Chart has been simplified and does not include all entities; debt balances presented at face value and excludes capital leases and finance obligations associated with capital projects Toys“R”Us Property Company I, LLC (“PropCo I”) Toys“R”Us Property Company I, LLC (“PropCo I”) Toys“R”Us- Delaware, Inc. (Toys-Delaware) Toys“R”Us- Delaware, Inc. (Toys-Delaware) Toys“R”Us Europe Toys“R”Us Europe Toys“R”Us Japan Toys“R”Us Japan Asia Joint Venture Asia Joint Venture Credit Lines| $36 Bank Loans | $59 Short-term borrowings| $6 Secured Notes | $725 European PropCos (UK, France, & Spain) European PropCos (UK, France, & Spain) Loans | $482 ABL | $367 Loans and Notes | $1,525 ABL | $33 |
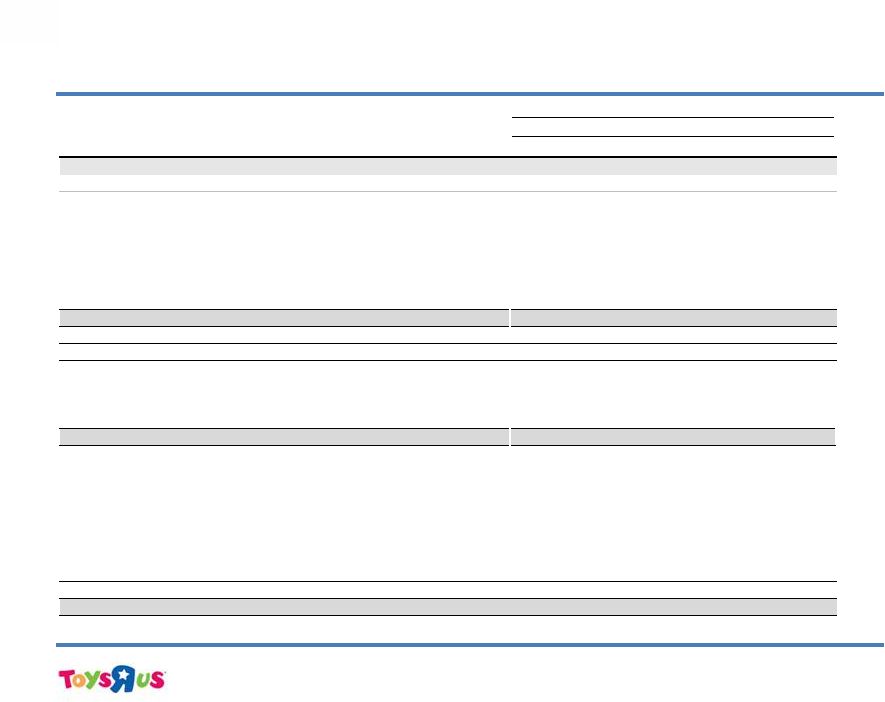 26 | Capital Structure Overview As of May 2, 2015 Note: Debt presented at face value Amortization & Principal Repayments Fiscal Year ($'s in millions) Maturity Rate Amount 2015 2016 2017 2018 2019 2020+ CFR/CCR: B3/B- Cash $453 Delaware Recourse Debt U.S./Canadian ABL 3/21/19 L + 1.50% $367 $-- $-- $-- $-- $367 $-- FILO 10/24/19 L + 7.25% 280 -- -- -- -- 280 -- B2/B3 5/25/18 L + 3.75% 200 5 6 6 183 -- -- B4/ New Delaware Financing 4/24/20 L + 8.75% 1,023 8 10 10 10 10 975 Debentures 9/1/21 8.750% 22 -- -- -- -- -- 22 Capital Leases & Other Various 12.00% 178 4 3 2 1 0 168 Total Third Party Delaware Recourse Debt 2,070 17 19 18 194 657 1,165 Propco II 12/1/17 8.500% 725 -- -- 725 -- -- -- Total Delaware Debt (10-Q Filing) 2,795 17 19 743 194 657 1,165 10.375% Notes due 2017 8/15/17 10.375% 450 -- -- 450 -- -- -- 7.375% Notes due 2018 10/15/18 7.375% 400 -- -- -- 400 -- -- Propco I 8/21/19 L + 5.00% 970 47 -- -- -- 923 -- Inc. Capital Leases Various Various 16 16 -- -- -- -- -- Total Domestic/Inc. Debt 4,631 80 19 1,193 594 1,580 1,165 International Silo Debt European/Australian ABL 3/8/16 L + 2.50% 33 -- 33 -- -- -- -- Spain Propco 1/29/16 E + 6.00% 31 31 -- -- -- -- -- French Propco 2/27/18 E + 4.50% 52 1 1 1 49 -- -- UK Propco 7/7/20 6.85% 399 -- -- -- -- -- 399 Japanese Debt Various 2.00% 95 50 33 3 3 3 3 JV Debt Various 2.00% 6 6 -- -- -- -- -- International Capital Leases Various Various 10 1 1 1 1 1 5 Total International Debt 626 89 68 5 53 4 407 Total Debt $5,257 $169 $87 $1,198 $647 $1,584 $1,572 |
 27 | Toys“R”Us, Inc. Annual Adjusted EBITDA Reconciliation
(1) The impact of these adjustments are excluded from the Gross Margin balances
in this presentation (2) The impact of these adjustments are
excluded from the SG&A balances in this presentation (3) The
impact of these adjustments are excluded from the Other Income balances in this presentation Fiscal Year ($'s in millions) 2010 2011 2012 2013 2014 Operating earnings (loss) attributable to Toys "R" Us, Inc. $647 $580 $555 ($353) $187 Depreciation and amortization 388 403 407 388 377 EBITDA $1,035 $983 $962 $35 $564 Adjustments: Obsolete inventory clearance (1) -- -- -- 51 8 Prior period adjustments (1) -- -- -- (1) -- Compensation expense (2) 6 1 2 3 22 Sponsors’ management and advisory fees (2) 20 20 21 22 18 Severance (2) 4 7 3 13 17 Store closure costs (2) 5 5 7 2 4 Obsolete inventory clearance (2) -- -- -- -- 1 Property losses, net of insurance recoveries (2) -- 11 8 -- (9) Litigation (2) 23 8 1 23 (8) Certain accounting transaction costs (2) -- 6 6 1 (2) Foreign currency re-measurement (3) -- -- -- -- 15 Prior period adjustments (2) 16 -- -- 17 -- Restructuring (2) 3 3 2 -- -- Transfer tax benefit (2) 6 -- (1) -- -- Impairment of long-lived assets (3) 11 6 11 44 13 Net gains on sales of properties (3) (10) (3) (4) (8) (5) Net (loss) earnings attributable to noncontrolling interest (1) 2 1 3 4 Goodwill impairment -- -- -- 378 -- Acquisition Cost (2) -- 4 -- -- -- Loss on Liquidation of TRU (HK) Limited (3) -- 1 -- -- -- Adjusted EBITDA $1,118 $1,054 $1,019 $583 $642 |
 28 | Toys“R”Us, Inc. Quarterly Adjusted EBITDA Reconciliation
(1) The impact of these adjustments are excluded from the Gross Margin balances
in this presentation (2) The impact of these adjustments are
excluded from the SG&A balances in this presentation (3) The
impact of these adjustments are excluded from the Other Income balances in this presentation LTM ($'s in millions) Q1 2013 Q1 2014 Q2 2014 Q1 2015 Q1 2014 Q1 2015 Q2 2015F Operating (loss) earnings attributable to Toys "R" Us, Inc. ($73) ($91) ($43) ($31) ($371) $247 $281 Depreciation and amortization 100 104 95 87 392 $360 353 EBITDA $27 $13 $52 $56 $21 $607 $634 Adjustments: Obsolete inventory clearance (1) -- (11) -- -- 40 19 -- Prior period adjustments (1) 2 -- -- -- (3) -- -- Compensation expense (2) 1 -- 5 3 2 25 29 Sponsors’ management and advisory fees (2) 6 6 6 5 22 17 11 Severance (2) 4 11 4 5 20 11 12 Store closure costs (2) -- 5 -- 4 7 3 4 Obsolete inventory clearance (2) -- -- 20 -- -- 1 -- Property losses, net of insurance recoveries (2) -- -- (7) -- -- (9) (2) Litigation (2) -- -- -- -- 23 (8) (9) Certain accounting transaction costs (2) 1 -- 1 1 -- (1) (2) Foreign currency re-measurement (3) -- -- -- (6) -- 9 11 Prior period adjustments (2) -- -- -- -- 17 -- -- Restructuring (2) -- -- -- -- -- -- -- Transfer tax benefit (2) -- -- -- -- -- -- -- Impairment of long-lived assets (3) 2 3 4 2 45 12 10 Net gains on sales of properties (3) (2) -- (3) (1) (6) (6) (3) Net earnings attributable to noncontrolling interest -- -- 1 1 3 5 5 Goodwill impairment -- -- -- -- 378 -- -- Acquisition Cost (2) -- -- -- -- -- -- -- Loss on Liquidation of TRU (HK) Limited (3) -- -- -- -- -- -- -- Adjusted EBITDA $41 $27 $83 $70 $569 $685 $700 |