Attached files
| file | filename |
|---|---|
| 8-K - 8-K - C. H. ROBINSON WORLDWIDE, INC. | d88132d8k.htm |
| EX-99.1 - EX-99.1 - C. H. ROBINSON WORLDWIDE, INC. | d88132dex991.htm |
 Earnings Conference Call –
Second Quarter 2015 July 29, 2015 John Wiehoff, Chairman & CEO Andrew Clarke, CFO Tim Gagnon, Director, Investor Relations Exhibit 99.2 |
 2 Safe Harbor Statement Except for the historical information contained herein, the matters set forth in this
presentation and the accompanying earnings release are forward-looking statements
that represent our expectations, beliefs, intentions or strategies
concerning future events. These forward-looking statements are
subject to certain risks and uncertainties that could cause actual
results to differ materially from our historical experience or our
present expectations, including, but not limited to such factors as
changes in economic conditions, including uncertain consumer demand; changes in
market demand and pressures on the pricing for our services; competition
and growth rates within the third party logistics industry; freight
levels and increasing costs and availability of truck capacity or
alternative means of transporting freight, and changes in relationships
with existing truck, rail, ocean and air carriers; changes in our
customer base due to possible consolidation among our customers; our ability to integrate the operations of acquired companies with our historic operations successfully; risks associated with litigation and insurance coverage; risks associated
with operations outside of the U.S.; risks associated with the potential impacts of
changes in government regulations; risks associated with the produce
industry, including food safety and contamination issues; fuel prices and
availability; changes to our share repurchase activity; the impact of war
on the economy; and other risks and uncertainties detailed in our Annual
and Quarterly Reports. |
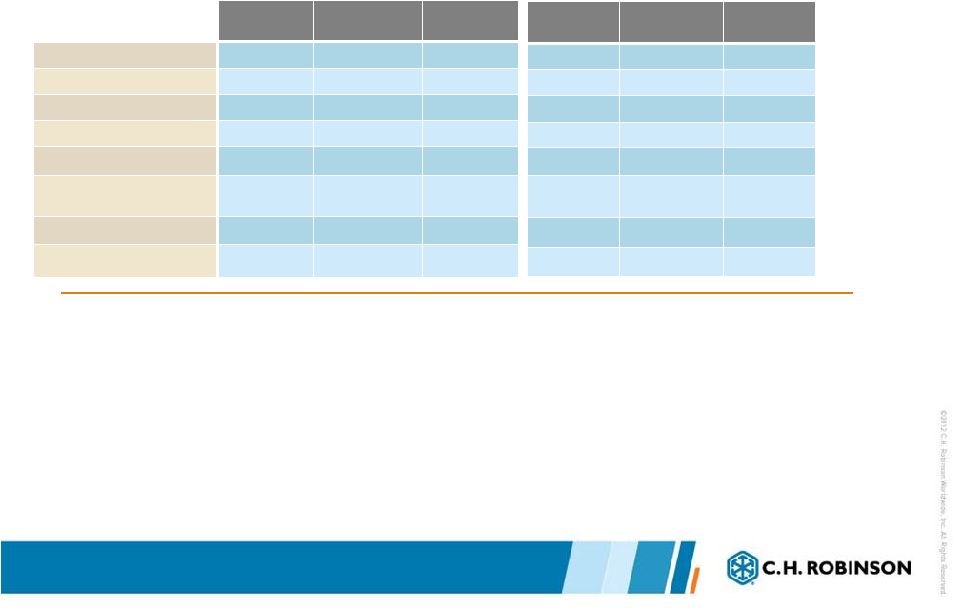 3 Results Q2 2015 Three months ended June 30 in thousands, except per share amounts • Record net revenues in the second quarter with Freightquote adding approximately 7 percentage points to our total net revenue growth. • Total company net revenue growth per business day accelerated in May and June when compared to April. • Net revenue grew faster than total revenue in the second quarter of 2015, primarily the result of decreased fuel prices. • The base CHRW average headcount grew approximately 1.6 percent in the second quarter when compared to the second quarter of 2014. 2015 2014 % Change Total revenues $3,545,088 $3,502,918 1.2% Total net revenues $584,018 $521,037 12.1% Income from operations $229,095 $200,382 14.3% Net income $137,208 $118,596 15.7% Earnings per share (diluted) $0.94 $0.80 17.5% Weighted average shares outstanding (diluted) 145,679 147,974 -1.6% Average headcount 12,850 11,674 10.1% Ending headcount 13,068 11,645 12.2% 2015 2014 % Change $6,845,978 $6,645,503 3.0% $1,109,128 $978,272 13.4% $411,020 $357,353 15.0% $243,684 $211,783 15.1% $1.67 $1.43 16.8% 146,020 148,293 -1.5% 12,732 11,675 9.1% 13,068 11,645 12.2% Six months ended June 30 |
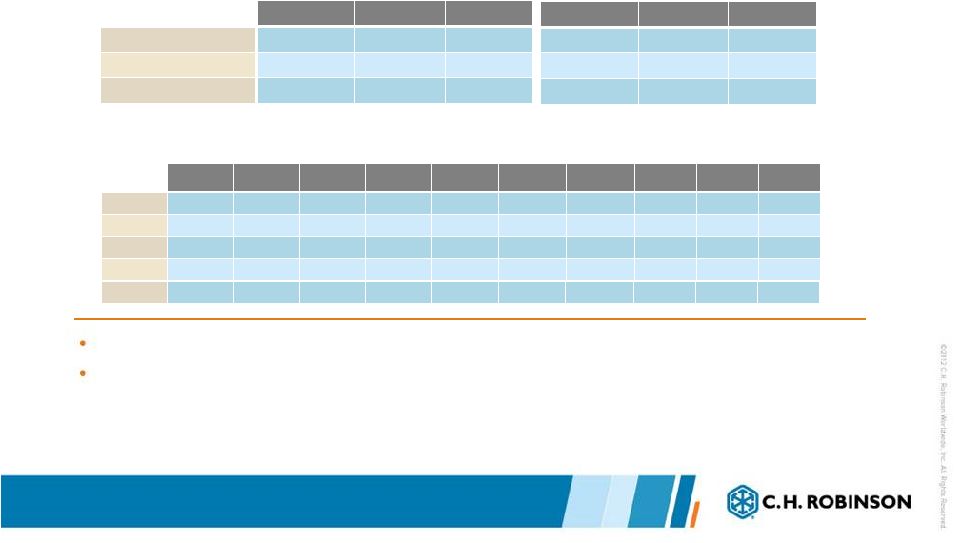 4 Transportation Results Q2 2015 Net revenue margin increased in all transportation services in the second quarter.
The decrease in fuel prices accounted for most of the year-over-year increase
in net revenue margin.
2015 2014 % Change Total revenues $3,130,722 $3,042,102 2.9% Total net revenues $548,348 $486,143 12.8% Net revenue margin 17.5% 16.0% 9.6% Three months ended June 30 TRANSPORTATION in thousands TRANSPORTATION NET REVENUE MARGIN PERCENTAGE 2006 2007 2008 2009 2010 2011 2012 2013 2014 2015 Q1 18.3% 20.2% 18.2% 22.6% 17.4% 17.2% 16.9% 16.3% 15.3% 16.8% Q2 17.1% 17.9% 15.4% 20.6% 15.8% 16.2% 14.9% 15.4% 16.0% 17.5% Q3 17.5% 18.0% 15.9% 19.8% 16.6% 16.4% 15.6% 15.0% 16.2% Q4 18.3% 17.7% 19.0% 18.3% 17.6% 16.3% 15.8% 15.1% 15.9% Year 17.8% 18.4% 17.0% 20.2% 16.8% 16.5% 15.8% 15.4% 15.9% 2015 2014 % Change $6,077,979 $5,848,879 3.9% $1,043,493 $916,532 13.9% 17.2% 15.7% 9.6% Six months ended June 30 |
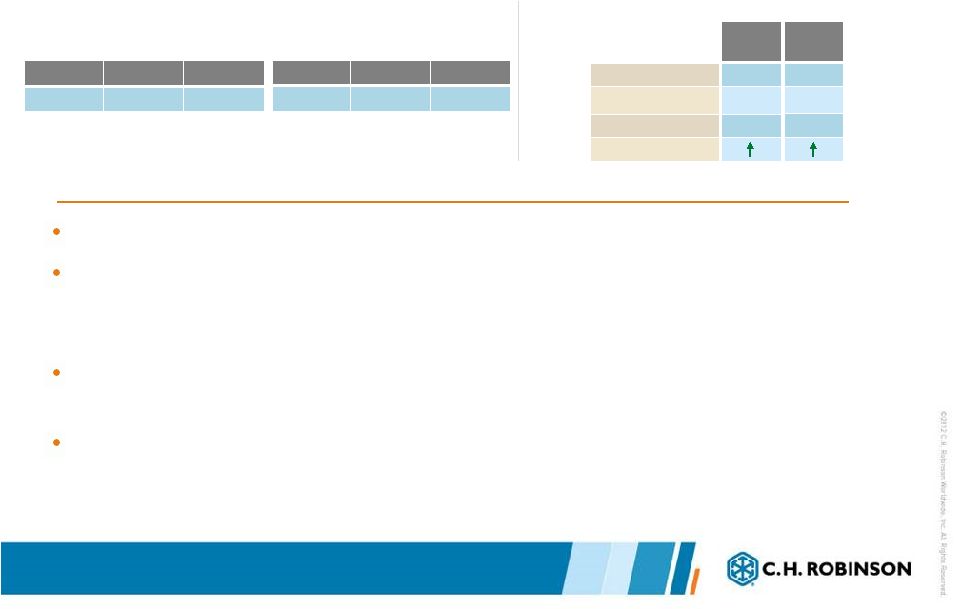 5 Truckload Results Q2 2015 2015 2014 % Change $334,546 $308,152 8.6% Three months ended June 30 TRUCKLOAD NET REVENUES in thousands North America Truckload Year over year change *Pricing and cost measures exclude the estimated impact of the change in fuel prices Net revenue per shipment growth increased throughout the quarter. Freightquote added approximately 3.5 percentage points to our truckload net revenue growth in the second quarter of 2015 when compared to the second quarter of 2014. Approximately 3 percent of the North America Truckload volume increase was due to the acquisition of Freightquote. Added over 3,000 new carriers in the second quarter of 2015. Quarter Volume 7% Approximate pricing* 3% Approximate cost* 2.5% Net revenue margin 2015 2014 % Change $632,926 $580,499 9.0% Six months ended June 30 YTD 7% 4% 4% |
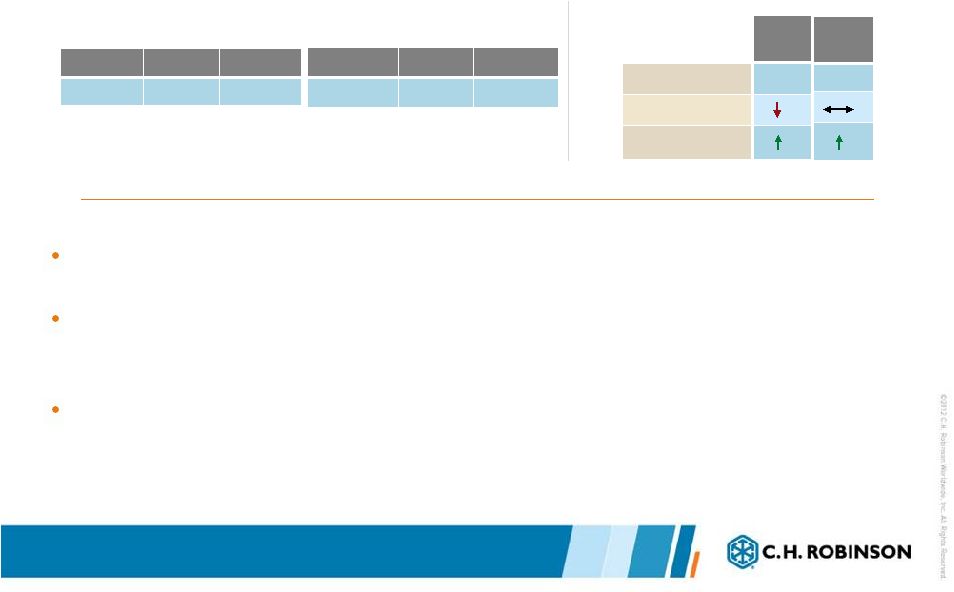 6 LTL Results Q2 2015 2015 2014 % Change $91,524 $67,376 35.8% Three months ended June 30 LTL NET REVENUES in thousands LTL Year over year change Net revenue and volume growth in all LTL services (Common Carrier, Temperature Controlled, Consolidation, Small Parcel). Freightquote added approximately 33 percentage points to our LTL net revenue growth in the second quarter of 2015 when compared to the second quarter of 2014. Freightquote added approximately 20 percentage points to our LTL volume growth in the second quarter of 2015 when compared to the second quarter of 2014. Quarter Volume 33% Pricing Net revenue margin 2015 2014 % Change $176,894 $127,514 38.7% Six months ended June 30 YTD 30% |
 7 Intermodal Results Q2 2015 Freightquote added approximately 9 percentage points to both our intermodal net revenue growth and our intermodal volume growth in the second quarter of 2015 when compared to the second quarter of 2014. Net revenue margin improvement in the second quarter of 2015 was driven by improved operating efficiencies and routing selections in addition to a reduction in fuel expense. Transactional customer business decreased in the second quarter of 2015 when compared to the second quarter of 2014. 2015 2014 % Change $11,539 $10,863 6.2% Three months ended June 30 INTERMODAL NET REVENUES in thousands Year over year change INTERMODAL Quarter Volume 6% Pricing Net revenue margin 2015 2014 % Change $22,051 $19,803 11.4% Six months ended June 30 YTD 10% |
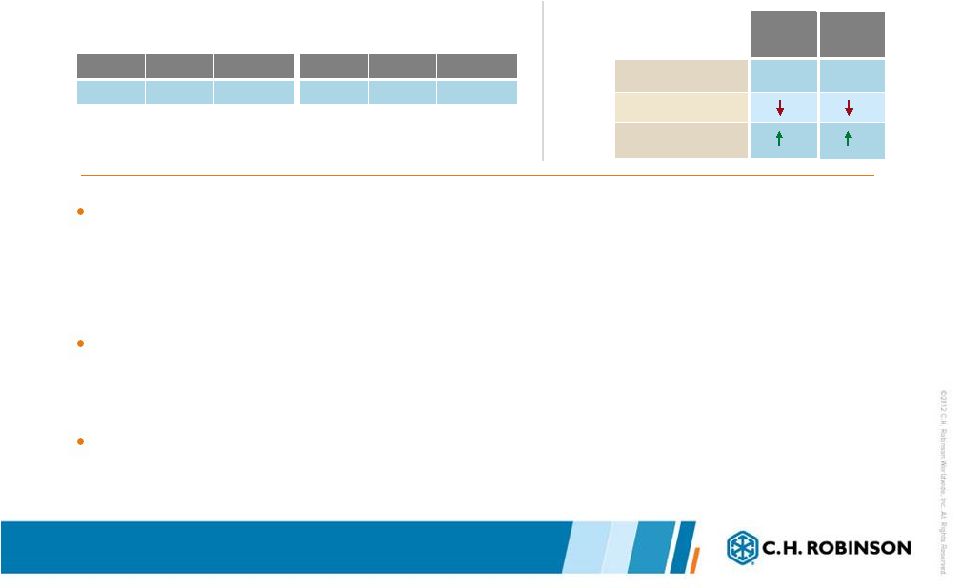
 8 Global Forwarding Results Q2 2015 Ocean, Air and Customs 2015 2014 % Change Ocean $59,066 $50,486 17.0% Air $19,596 $21,747 -9.9% Customs $10,973 $10,312 6.4% Three months ended June 30 NET REVENUES in thousands Quarter Volume Pricing Net revenue margin OCEAN Quarter Volume Pricing Net revenue margin AIR Year over year change Year over year change Combined Global Forwarding services net revenues increased 8.6% in the second quarter when compared to the second quarter of 2014. Cross selling initiatives continue to produce new opportunities and net revenue
growth. Retained #1 NVOCC in ocean shipments from China to the U.S. (ranking based on TEU’s shipped in the second quarter of 2015). Airfreight net revenues decreased as a result of lower rates charged to customers
offset slightly by increased net revenue margin and a small increase in
volumes. 2015
2014 % Change Ocean $109,256 $94,098 16.1% Air $40,235 $39,201 2.6% Customs $21,236 $19,644 8.1% Six months ended June 30 YTD YTD |
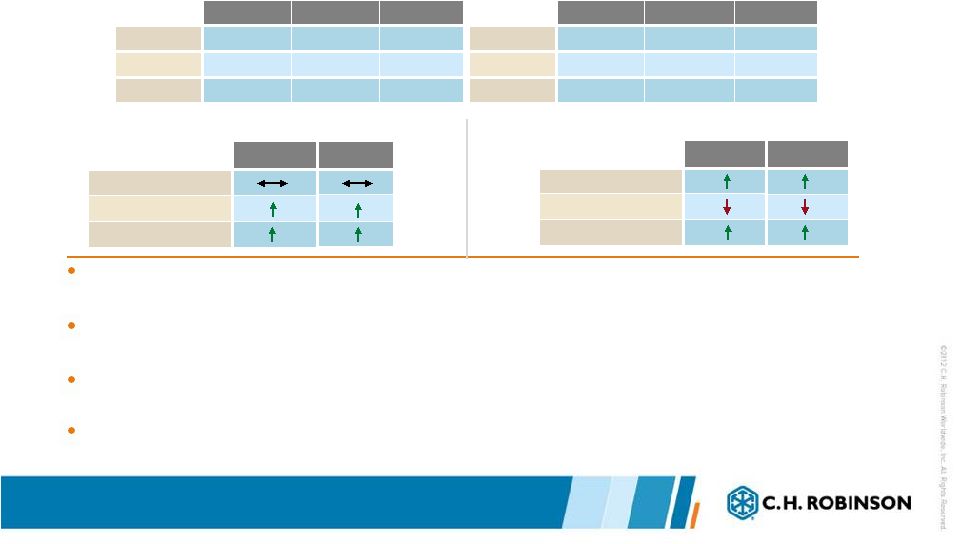
 9 Other Logistics Services Results Q2 2015 Other Logistics Services net revenues include transportation managed services, warehousing and small parcel. Other Logistics Services net revenues increased 22.6 percent in the second quarter when compared to the second quarter of 2014, primarily due to the increase in managed services. Managed services growth largely the result of the addition of new customers and growth with existing customers. 2015 2014 % Change $21,104 $17,207 22.6% Three months ended June 30 NET REVENUES in thousands 2015 2014 % Change $40,895 $35,773 14.3% Six months ended June 30 |
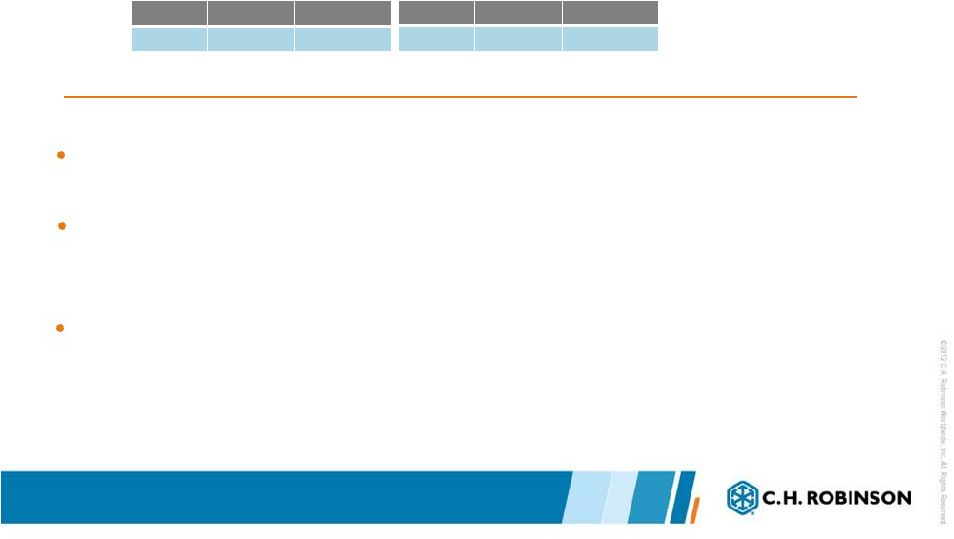
 10 Sourcing Results Q2 2015 Improved market conditions yielded increased net revenue margins in the second quarter of 2015 when compared to the second quarter of 2014. Net revenues increased as a result of volume growth with strategic commodities and services. 2015 2014 % Change Total revenues $414,366 $460,816 -10.1% Total net revenues $35,670 $34,894 2.2% Net revenue margin 8.6% 7.6% 13.7% Three months ended June 30 SOURCING NET REVENUES in thousands 2015 2014 % Change $767,999 $796,624 -3.6% $65,635 $61,740 6.3% 8.5% 7.8% 10.3% Six months ended June 30 |
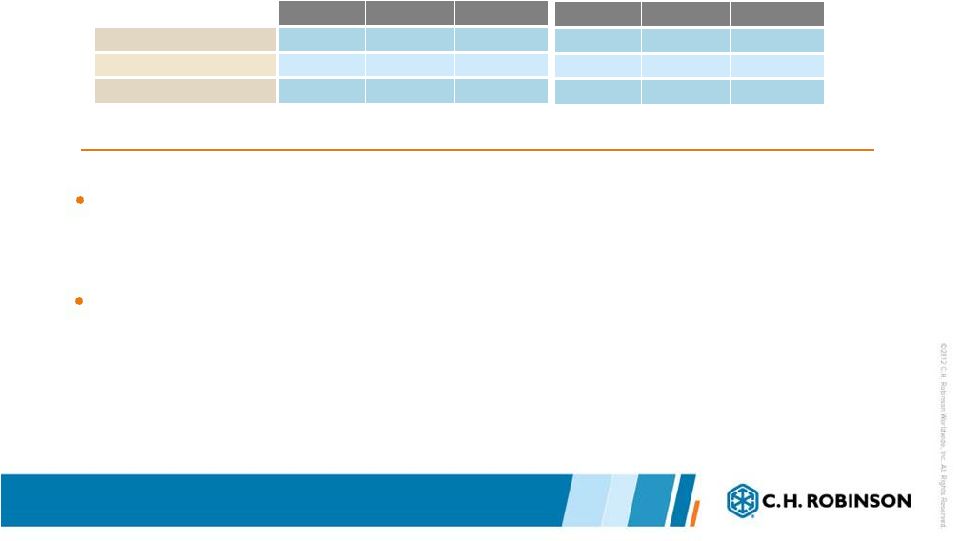
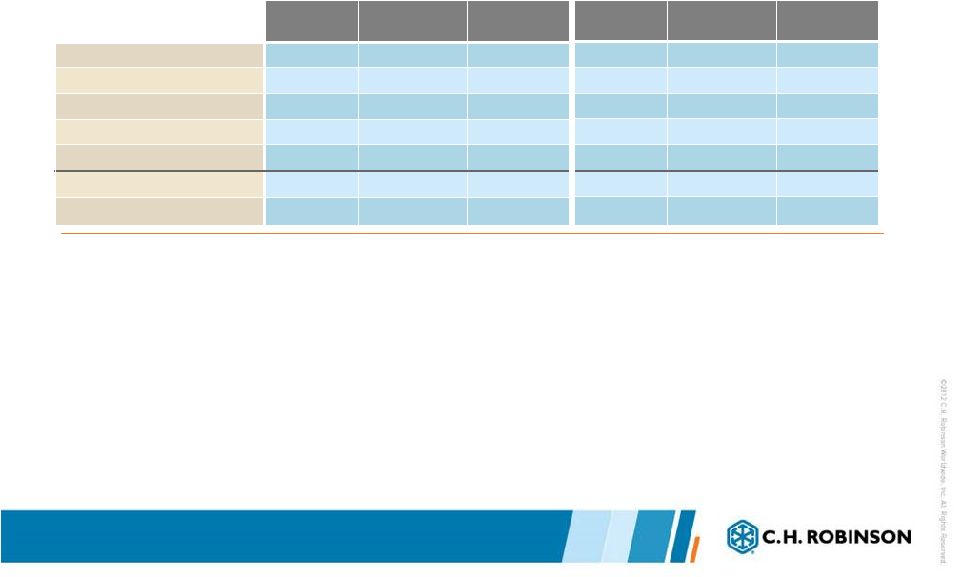 11 in thousands Summarized Income Statement • 70 basis point improvement in operating income as a percent of net revenues in the second quarter of 2015 when compared to the second quarter of 2014. • Personnel expense growth was primarily the result of the Freightquote acquisition and from an increase in variable compensation. • Other SG&A expenses increased primarily due to our acquisition of Freightquote, including amortization expenses of approximately $1.9 million. Three months ended June 30 2015 2014 % Change Total revenues $3,545,088 $3,502,918 1.2% Total net revenues 584,018 521,037 12.1% Personnel expenses 263,999 238,986 10.5% Selling, general & admin 90,924 81,669 11.3% Total operating expenses 354,923 320,655 10.7% Income from operations $229,095 $200,382 14.3% Percent of net revenue 39.2% 38.5% 2.0% 2015 2014 % Change $6,845,978 $6,645,503 3.0% 1,109,128 978,272 13.4% 519,143 459,283 13.0% 178,965 161,636 10.7% 698,108 620,919 12.4% $411,020 $357,353 15.0% 37.1% 36.5% 1.4% Six months ended June 30 |
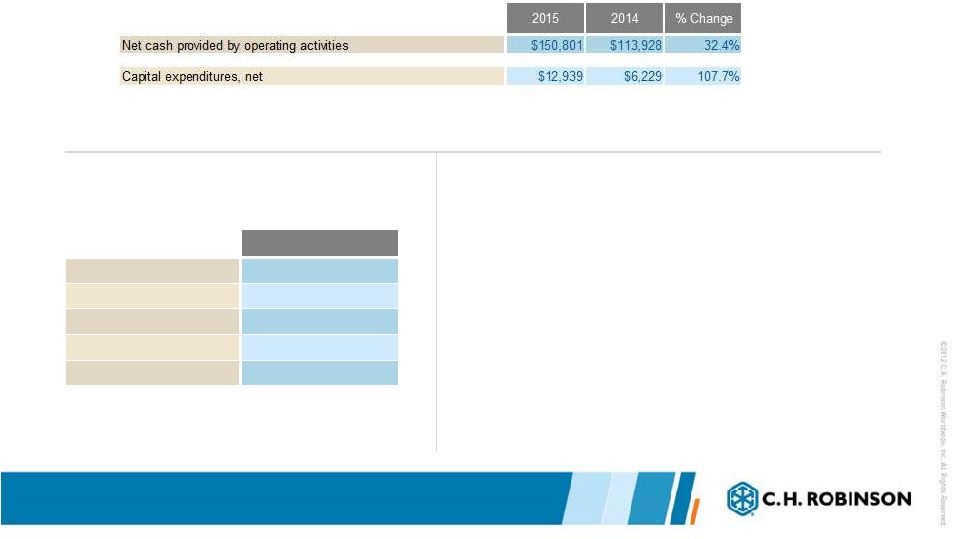 12 Three months ended June 30 June 30, 2015 Cash & investments $171,451 Current assets $1,944,339 Total assets $3,404,014 Debt $1,130,000 Stockholders investment $1,111,851 CASH FLOW DATA BALANCE SHEET DATA Other Financial Information in thousands • Strong cash flow quarter • Total debt balance $1.130 billion • $500 million, 4.28% average coupon • $630 million drawn on new revolver, 1.30% current rate as of June 30, 2015 |
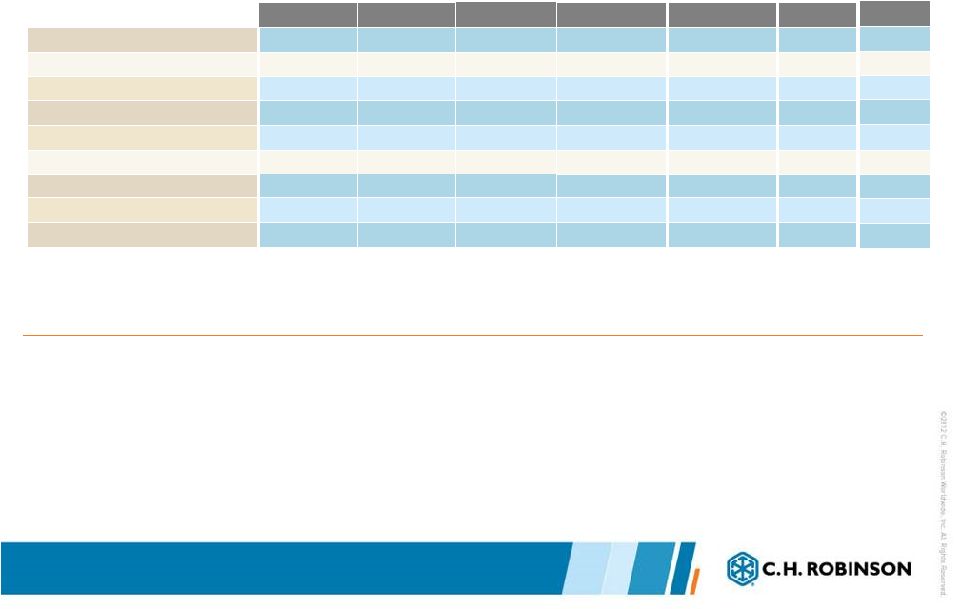 13 in thousands Capital Distribution • Capital returned to shareholders during the quarter • $57.2 million cash dividend • $49.0 million in cash for repurchase activity • 765,775 shares • Average price $63.99 for shares repurchased • Target is to return approximately 90% of net income to shareholders annually. 2010 2011 2012 (a) 2013 2014 Q2 2015 Net income $387,026 $431,612 $447,007 $415,904 $449,711 $137,208 Capital distribution Cash dividends paid $168,902 $194,697 $219,313 $220,257 $215,008 $57,182 Share repurchases 157,381 250,274 255,849 807,449 (b) 176,645 48,998 Subtotal $326,283 $444,971 $475,162 $1,027,706 $391,653 $106,183 Percent of net income Cash dividends paid 44% 45% 49% 53% 48% 42% Open market share repurchases 41% 58% 57% 194% 39% 36% Subtotal 84% 103% 106% 247% 87% 78% (a) 2012 Net Income is adjusted to excluded transaction related gains and expenses. A reconciliation of adjusted results
appears in Appendix A. 2012 Dividends exclude the fifth dividend
payment made during the year. (b) Includes a $500 million
accelerated share repurchase. YTD 2015
$243,684 $114,517 92,923 $207,443 47% 38% 85% |
 14 A look ahead July to date, total company net revenue has increased approximately 12 percent per business day when compared to July to date in 2014. Freightquote integration continues into the second half of the year. Remain focused on balanced growth initiatives and strategic investments. |
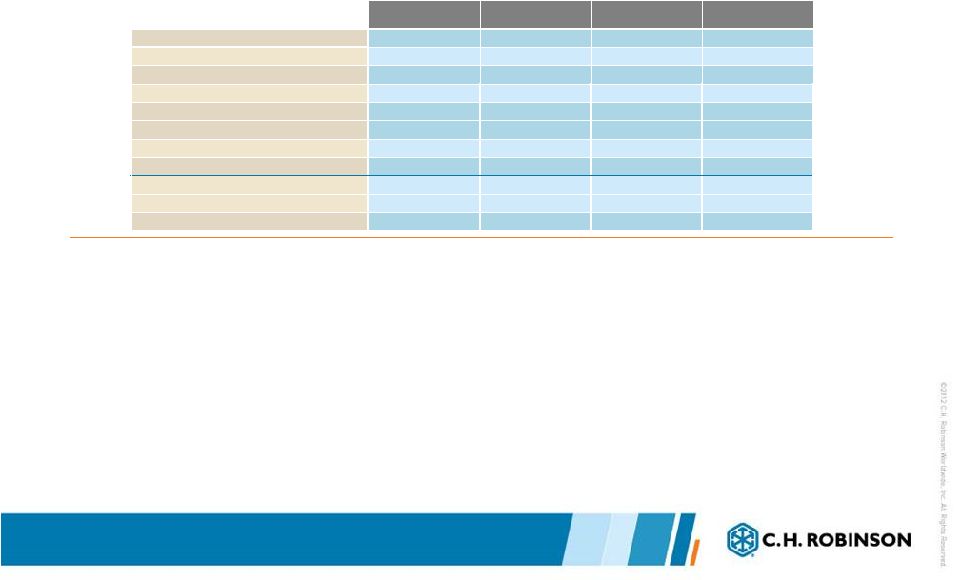 15 Appendix A: 2012 Summarized Adjusted Income Statement In thousands, except per share amounts Twelve months ended December 31, 2012 1) The adjustment to personnel consists of $33 million of incremental vesting expense of our equity awards triggered by the gain on the divestiture of T-Chek. The balance consists of transaction related bonuses. 2) The adjustments to other operating expenses reflect fees paid to third parties for:
a) Investment banking fees related to the acquisition of Phoenix b) External legal and accounting fees related to the acquisitions of Apreo and Phoenix and the divestiture of T-Chek. 3) The adjustment to investment and other income reflects the gain from the divestiture of T-Chek.
4) The adjustment to diluted weighted average shares outstanding relates to the shares of C.H. Robinson stock issued as consideration paid to the
sellers in the acquisition of Phoenix.
5) The adjustment to diluted weighted average shares outstanding relates to the additional vesting of performance-based restricted stock as a
result of the gain on sale recognized from the divestiture of
T-Chek. 2012 Actual
Non-recurring Acquisition Impacts Non-recurring Divestiture Impacts Adjusted Total net revenues $1,717,571 $1,717,571 Personnel expenses (1) 766,006 -385 -34,207 731,414 Other operating expenses (2) 276,245 -10,225 -379 265,641 Total operating expenses 1,042,251 -10,610 -34,586 997,055 Income from operations 675,320 10,610 34,586 720,516 Investment & other income (3) 283,142 -281,551 1,591 Income before taxes 958,462 10,610 -246,965 722,107 Provision for income taxes 364,658 2,745 -92,303 275,100 Net income $593,804 7,865 -$154,662 $447,007 Net income per share (diluted) 3.67 2.76 Weighted average shares (diluted) 161,946 185 (4) 92 (5) 161,669 To assist investors in understanding our financial performance, we supplement the financial results that are generated in accordance with the
accounting principles generally accepted in the United States, or GAAP,
with non-GAAP financial measures, including non-GAAP operating expenses, non-GAAP income from operations, non-GAAP net income and non-GAAP diluted net income per share. We believe that these non-GAAP
measures provide meaningful insight into our operating performance
excluding certain event-specific charges, and provide an alternative perspective of our results of operations. We use non-GAAP measures to assess our operating performance for the quarter. Management believes that these non-GAAP
financial measures reflect an additional way of analyzing aspects of our
ongoing operations that, when viewed with our GAAP results, provides a more complete understanding of the factors and trends affecting our business. |
 |