Attached files
| file | filename |
|---|---|
| EX-99.1 - EXHIBIT 99.1 RELEASE - NORTHWESTERN CORP | ex991pressreleaseq22015.htm |
| 8-K - 8-K 2015 2ND Q FINANCIAL RESULTS - NORTHWESTERN CORP | form8kearningsreleaseq22015.htm |
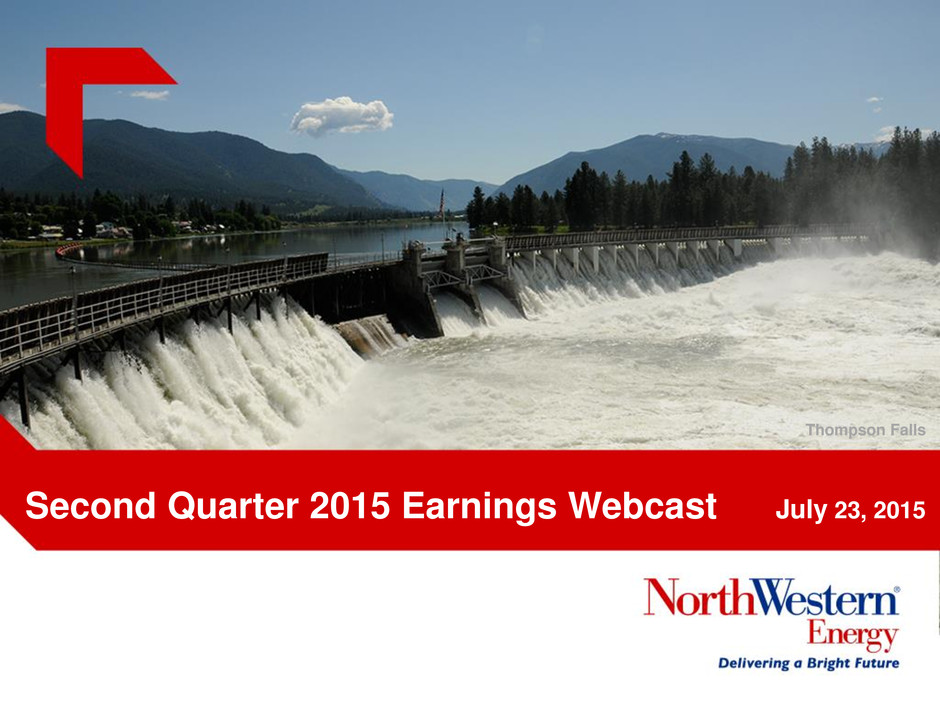
Second Quarter 2015 Earnings Webcast July 23, 2015 Thompson Falls
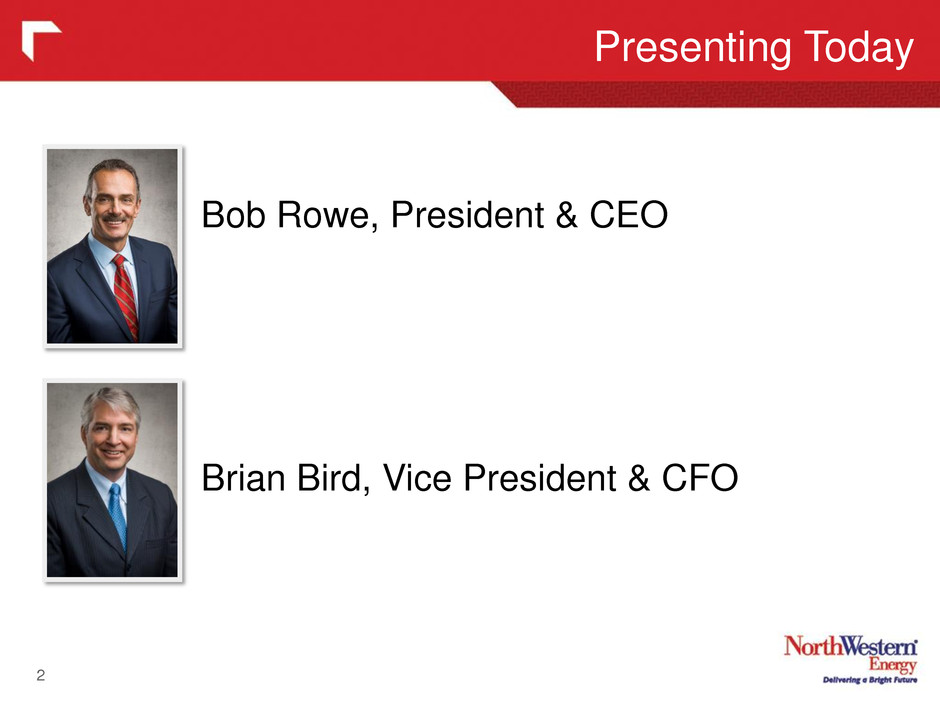
Presenting Today 2 Bob Rowe, President & CEO Brian Bird, Vice President & CFO
3 Forward Looking Statements During the course of this presentation, there will be forward-looking statements within the meaning of the “safe harbor” provisions of the Private Securities Litigation Reform Act of 1995. Forward-looking statements often address our expected future business and financial performance, and often contain words such as “expects,” “anticipates,” “intends,” “plans,” “believes,” “seeks,” or “will.” The information in this presentation is based upon our current expectations as of the date hereof unless otherwise noted. Our actual future business and financial performance may differ materially and adversely from our expectations expressed in any forward-looking statements. We undertake no obligation to revise or publicly update our forward-looking statements or this presentation for any reason. Although our expectations and beliefs are based on reasonable assumptions, actual results may differ materially. The factors that may affect our results are listed in certain of our press releases and disclosed in the Company’s Form 10-K and 10-Q along with other public filings with the SEC.
Recent Significant Activities 4 • Net income improved $23.3 million in the second quarter of 2015 as compared with the same period in 2014 primarily due to an insurance settlement and the impact of the November 2014 hydro acquisition. • Diluted EPS of $0.65 as compared to $0.20 for the same period in 2014. • Adjusted Non-GAAP Diluted EPS of $0.48 compared to $0.25 for the same period in 2014. • The insurance settlement agreement was with an insurance carrier for the former Montana Power Company primarily related to previously incurred environmental remediation costs on electric generation assets. • The previously incurred remediation costs and associated litigation expense to reach the settlement were not reflected in rates. • As a result of this settlement, we recognized a net recovery of $20.8 million (pretax). • Issued $200 million of 10 and 30 year Montana First Mortgage Bonds (MFMB) at a blended coupon of 3.74% to refinance $150 million MFMB with a 6.04% coupon due in 2016. • Reaffirming full year 2015 adjusted guidance of $3.10 - $3.30 per diluted share. • Board of Directors approved a $0.48 stock dividend payable Sept. 30, 2015. • Entered into an agreement to acquire $143 million, 80 megawatt Beethoven wind project for the benefit of our South Dakota customers.
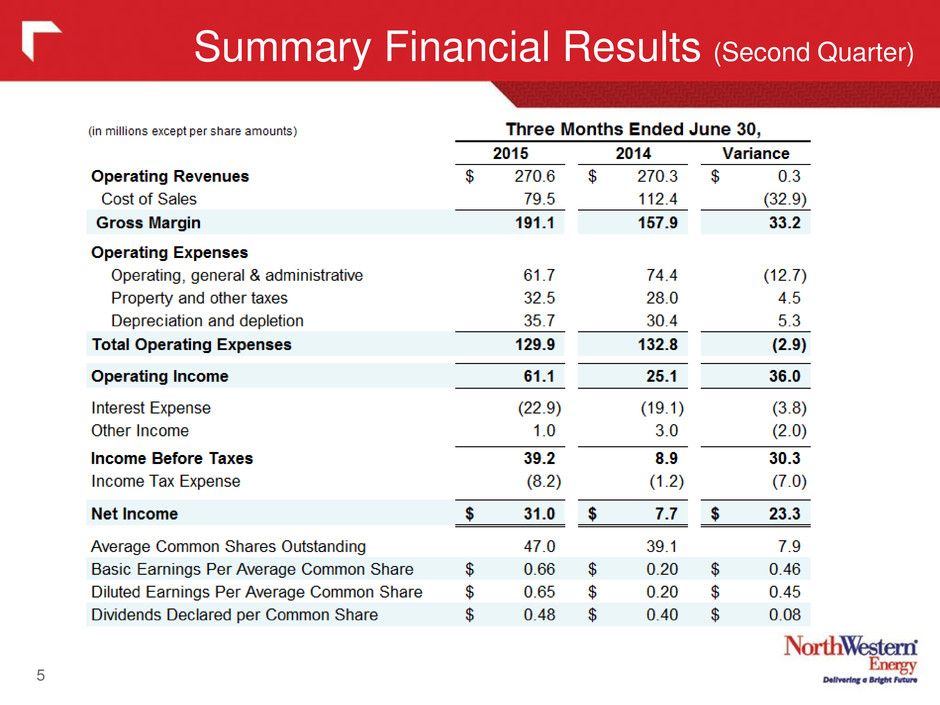
Summary Financial Results (Second Quarter) 5
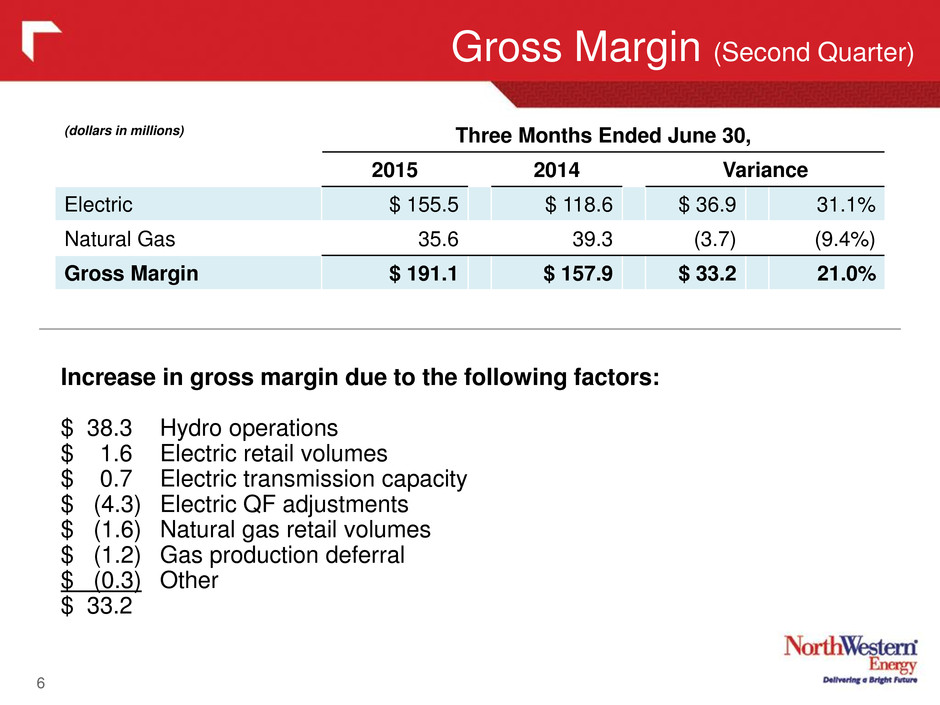
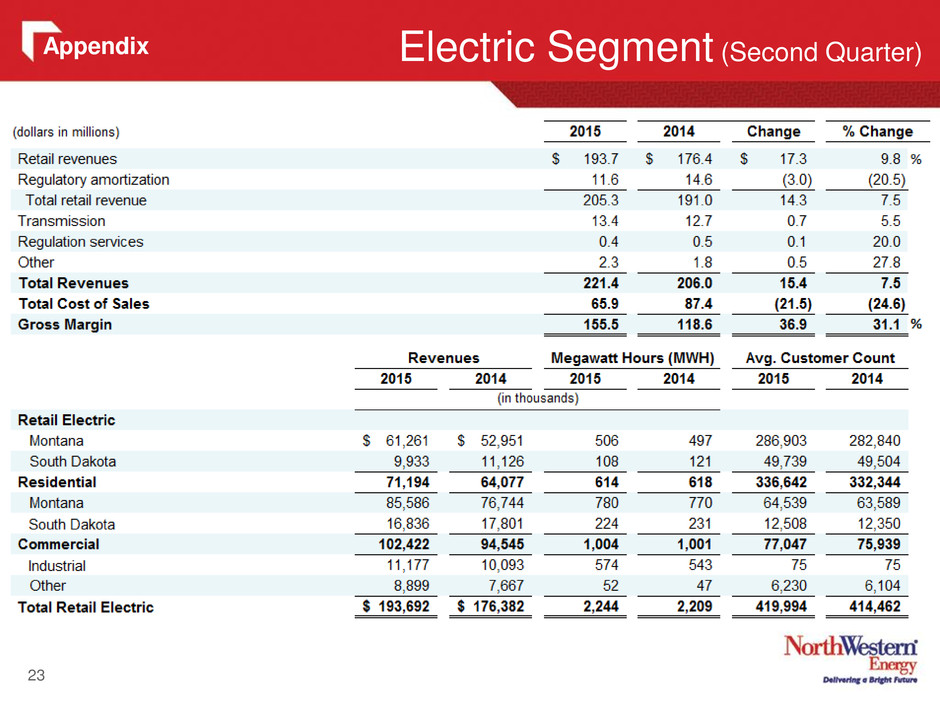
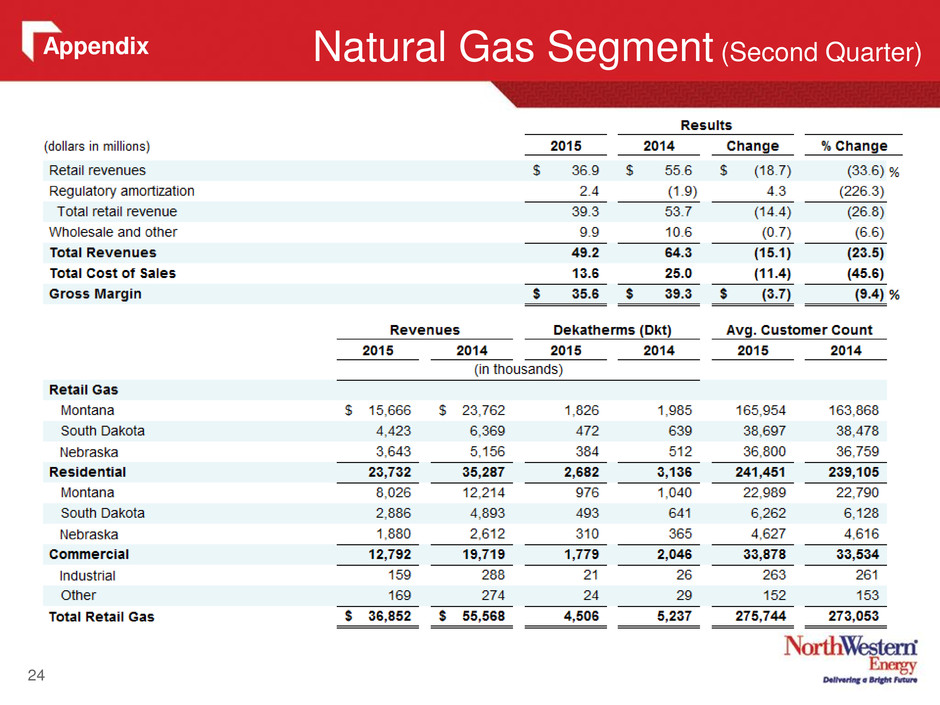
6 Gross Margin (Second Quarter) (dollars in millions) Three Months Ended June 30, 2015 2014 Variance Electric $ 155.5 $ 118.6 $ 36.9 31.1% Natural Gas 35.6 39.3 (3.7) (9.4%) Gross Margin $ 191.1 $ 157.9 $ 33.2 21.0% Increase in gross margin due to the following factors: $ 38.3 Hydro operations $ 1.6 Electric retail volumes $ 0.7 Electric transmission capacity $ (4.3) Electric QF adjustments $ (1.6) Natural gas retail volumes $ (1.2) Gas production deferral $ (0.3) Other $ 33.2
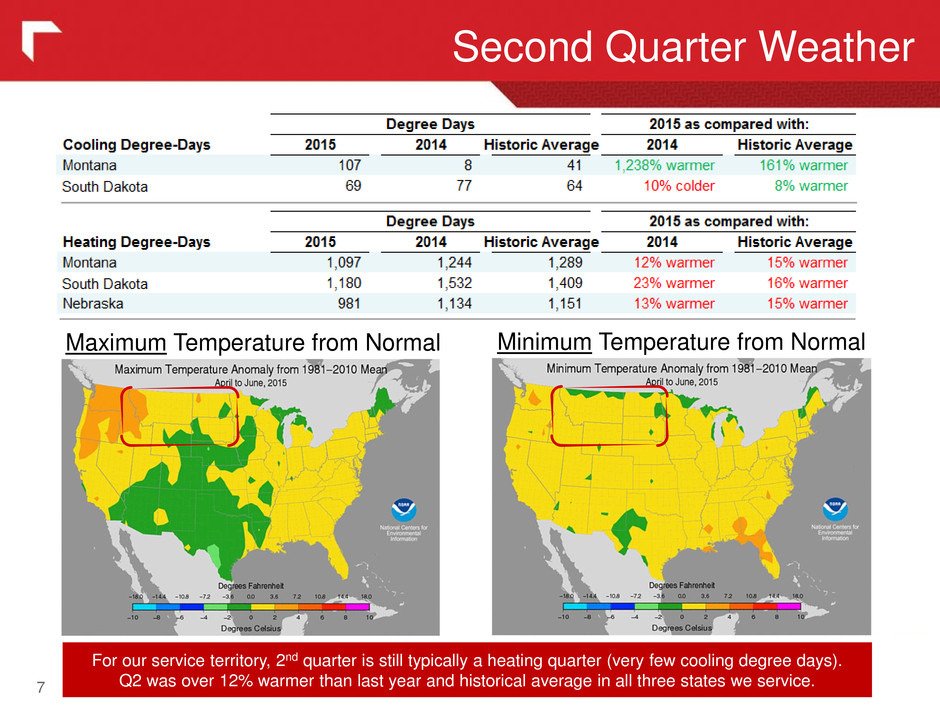
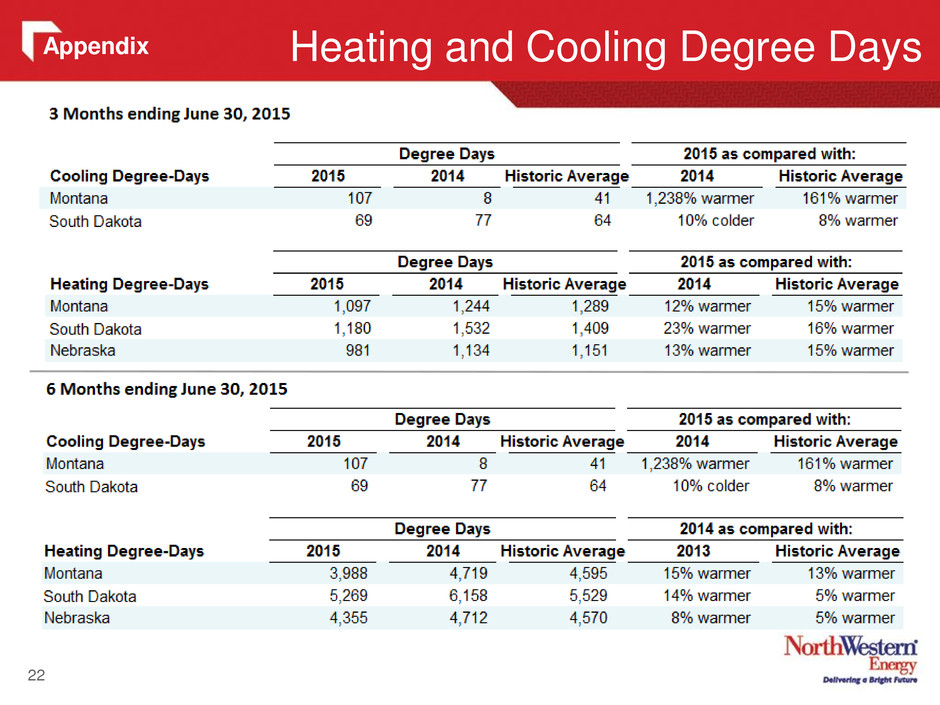
Second Quarter Weather 7 Maximum Temperature from Normal Minimum Temperature from Normal For our service territory, 2nd quarter is still typically a heating quarter (very few cooling degree days). Q2 was over 12% warmer than last year and historical average in all three states we service.
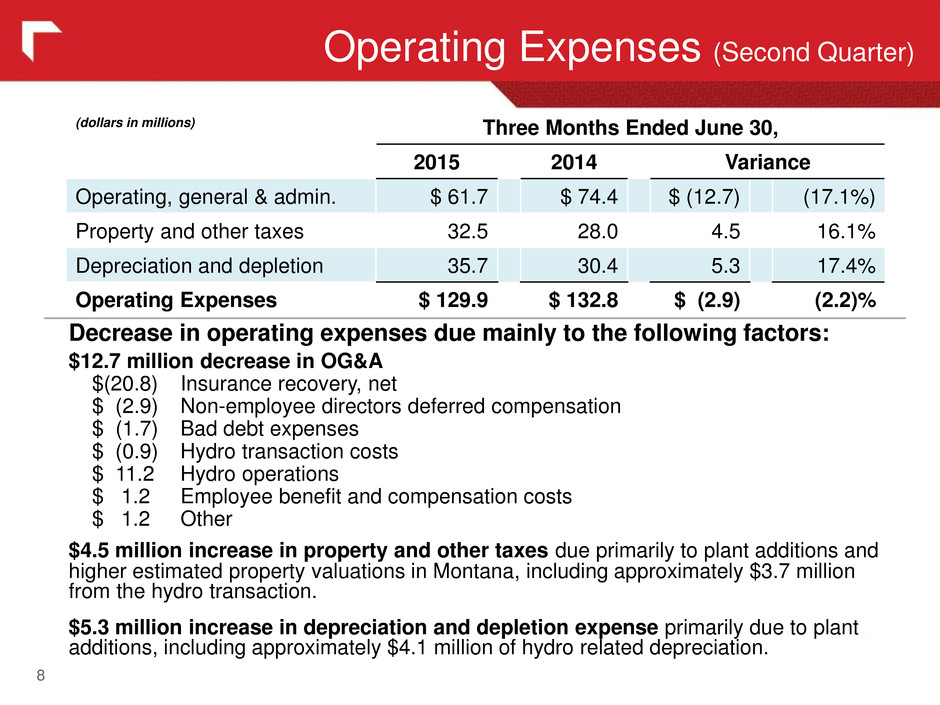
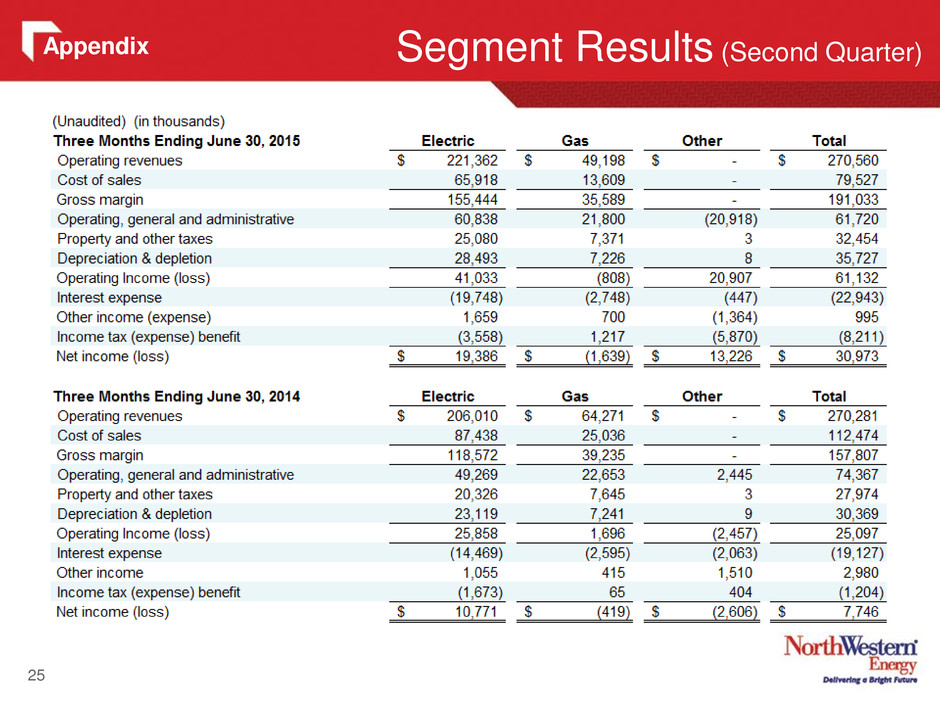
Operating Expenses (Second Quarter) 8 Decrease in operating expenses due mainly to the following factors: $12.7 million decrease in OG&A $(20.8) Insurance recovery, net $ (2.9) Non-employee directors deferred compensation $ (1.7) Bad debt expenses $ (0.9) Hydro transaction costs $ 11.2 Hydro operations $ 1.2 Employee benefit and compensation costs $ 1.2 Other $4.5 million increase in property and other taxes due primarily to plant additions and higher estimated property valuations in Montana, including approximately $3.7 million from the hydro transaction. $5.3 million increase in depreciation and depletion expense primarily due to plant additions, including approximately $4.1 million of hydro related depreciation. (dollars in millions) Three Months Ended June 30, 2015 2014 Variance Operating, general & admin. $ 61.7 $ 74.4 $ (12.7) (17.1%) Property and other taxes 32.5 28.0 4.5 16.1% Depreciation and depletion 35.7 30.4 5.3 17.4% Operating Expenses $ 129.9 $ 132.8 $ (2.9) (2.2)%
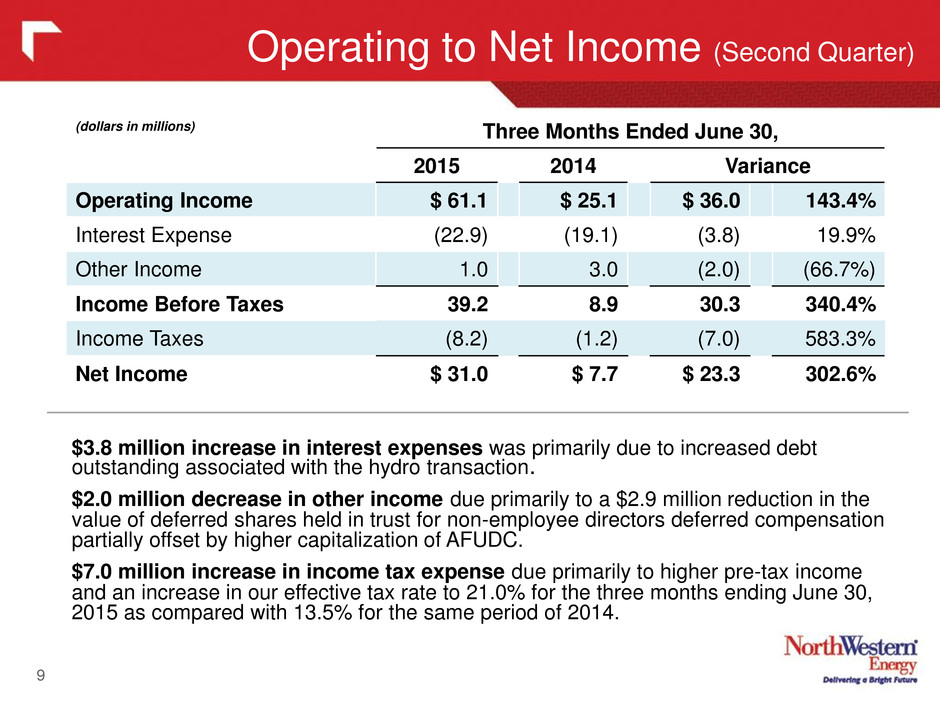
Operating to Net Income (Second Quarter) 9 $3.8 million increase in interest expenses was primarily due to increased debt outstanding associated with the hydro transaction. $2.0 million decrease in other income due primarily to a $2.9 million reduction in the value of deferred shares held in trust for non-employee directors deferred compensation partially offset by higher capitalization of AFUDC. $7.0 million increase in income tax expense due primarily to higher pre-tax income and an increase in our effective tax rate to 21.0% for the three months ending June 30, 2015 as compared with 13.5% for the same period of 2014. (dollars in millions) Three Months Ended June 30, 2015 2014 Variance Operating Income $ 61.1 $ 25.1 $ 36.0 143.4% Interest Expense (22.9) (19.1) (3.8) 19.9% Other Income 1.0 3.0 (2.0) (66.7%) Income Before Taxes 39.2 8.9 30.3 340.4% Income Taxes (8.2) (1.2) (7.0) 583.3% Net Income $ 31.0 $ 7.7 $ 23.3 302.6%
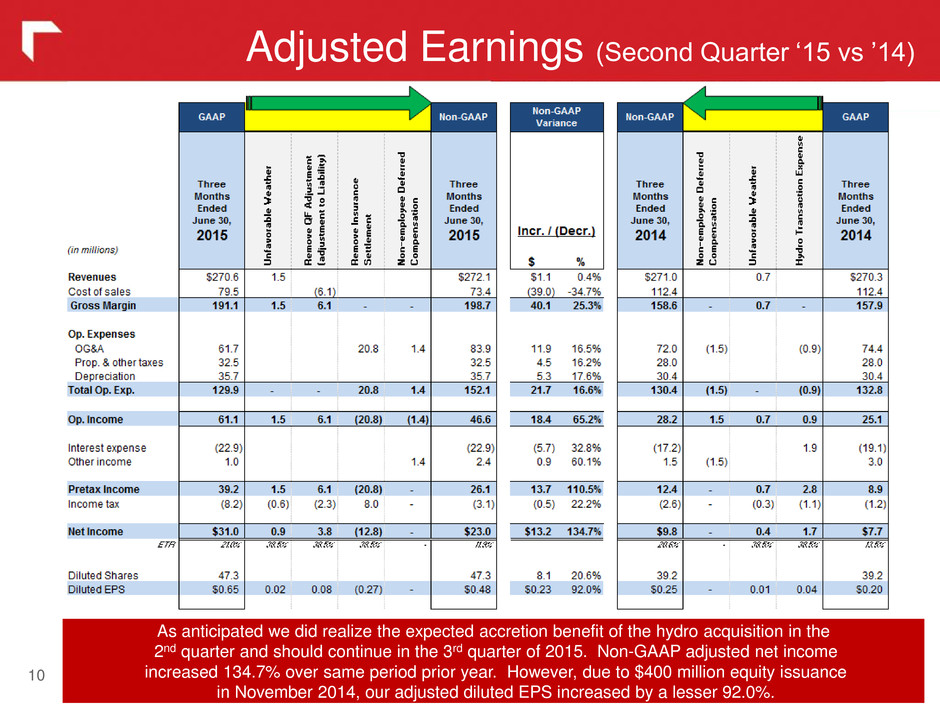
Adjusted Earnings (Second Quarter ‘15 vs ’14) 10 As anticipated we did realize the expected accretion benefit of the hydro acquisition in the 2nd quarter and should continue in the 3rd quarter of 2015. Non-GAAP adjusted net income increased 134.7% over same period prior year. However, due to $400 million equity issuance in November 2014, our adjusted diluted EPS increased by a lesser 92.0%.
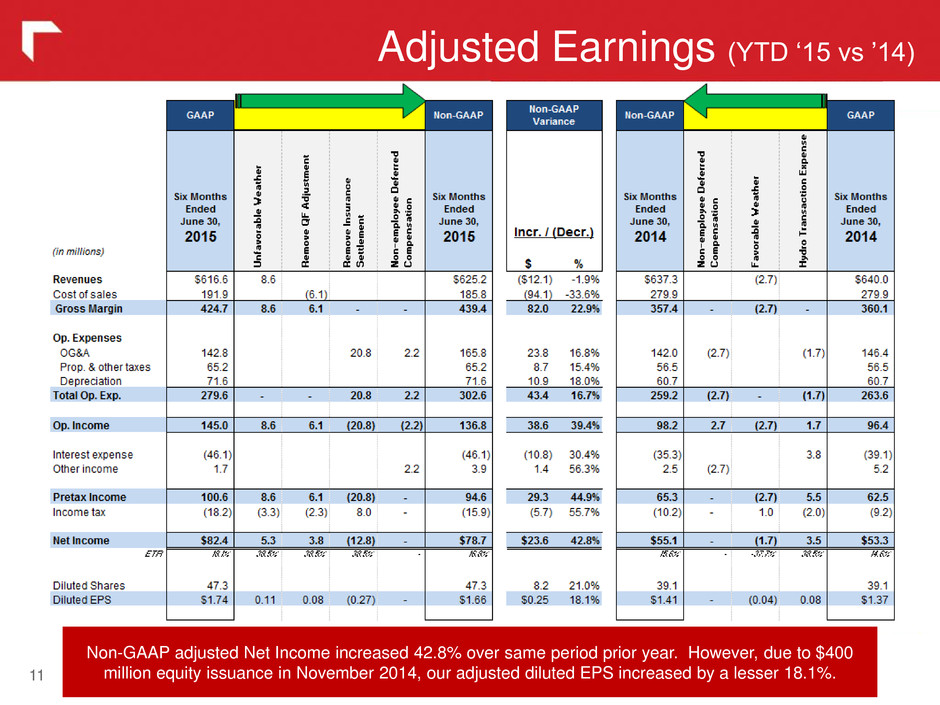
Adjusted Earnings (YTD ‘15 vs ’14) 11 Non-GAAP adjusted Net Income increased 42.8% over same period prior year. However, due to $400 million equity issuance in November 2014, our adjusted diluted EPS increased by a lesser 18.1%.
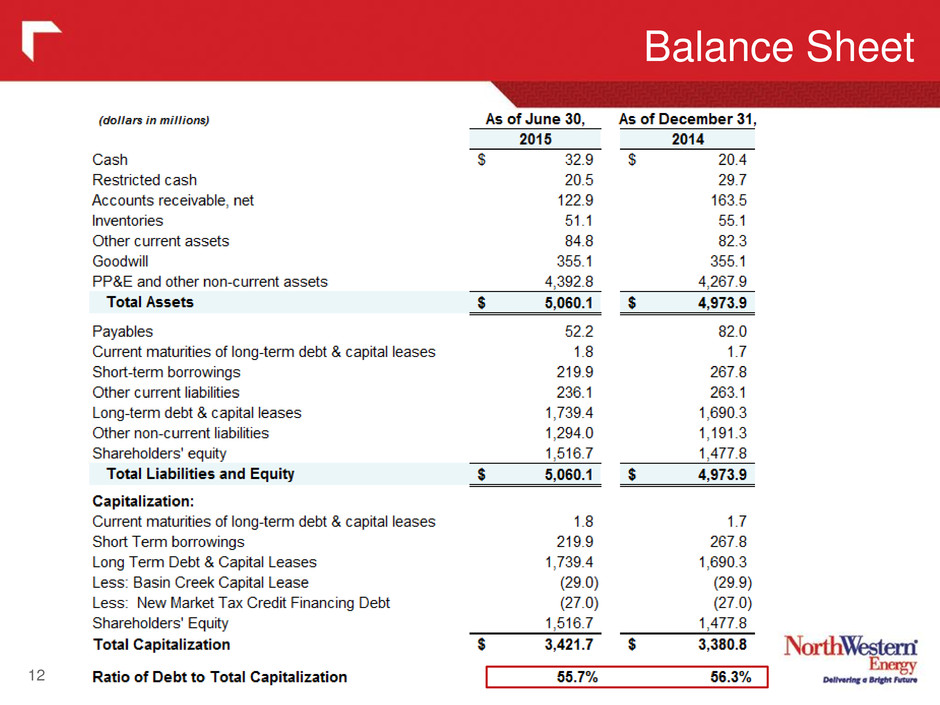
Balance Sheet 12
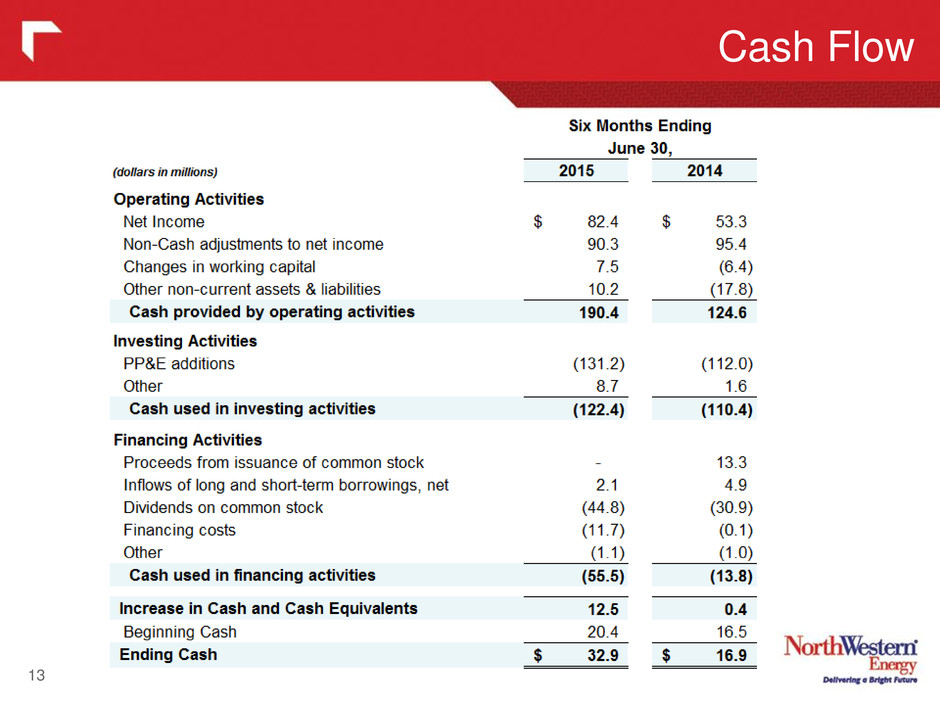
Cash Flow 13
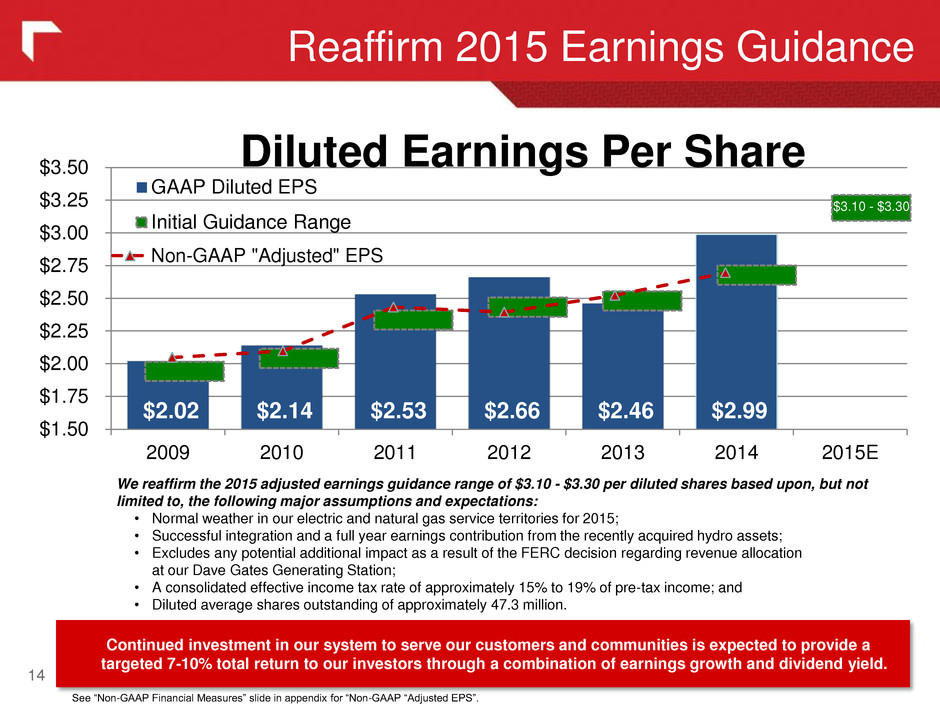
Reaffirm 2015 Earnings Guidance 14 We reaffirm the 2015 adjusted earnings guidance range of $3.10 - $3.30 per diluted shares based upon, but not limited to, the following major assumptions and expectations: • Normal weather in our electric and natural gas service territories for 2015; • Successful integration and a full year earnings contribution from the recently acquired hydro assets; • Excludes any potential additional impact as a result of the FERC decision regarding revenue allocation at our Dave Gates Generating Station; • A consolidated effective income tax rate of approximately 15% to 19% of pre-tax income; and • Diluted average shares outstanding of approximately 47.3 million. Continued investment in our system to serve our customers and communities is expected to provide a targeted 7-10% total return to our investors through a combination of earnings growth and dividend yield. See “Non-GAAP Financial Measures” slide in appendix for “Non-GAAP “Adjusted EPS”. $2.60 - $2.75 $2.02 $2.14 $2.53 $2.66 $2.46 $2.99 $- $1.50 $1.75 $2.00 $2.25 $2.50 $2.75 $3.00 $3.25 $3.50 2009 2010 2011 2012 2013 2014 2015E GAAP Diluted EPS Initial Guidance Range Non-GAAP "Adjusted" EPS Diluted Earnings Per Share $3.10 - $3.30
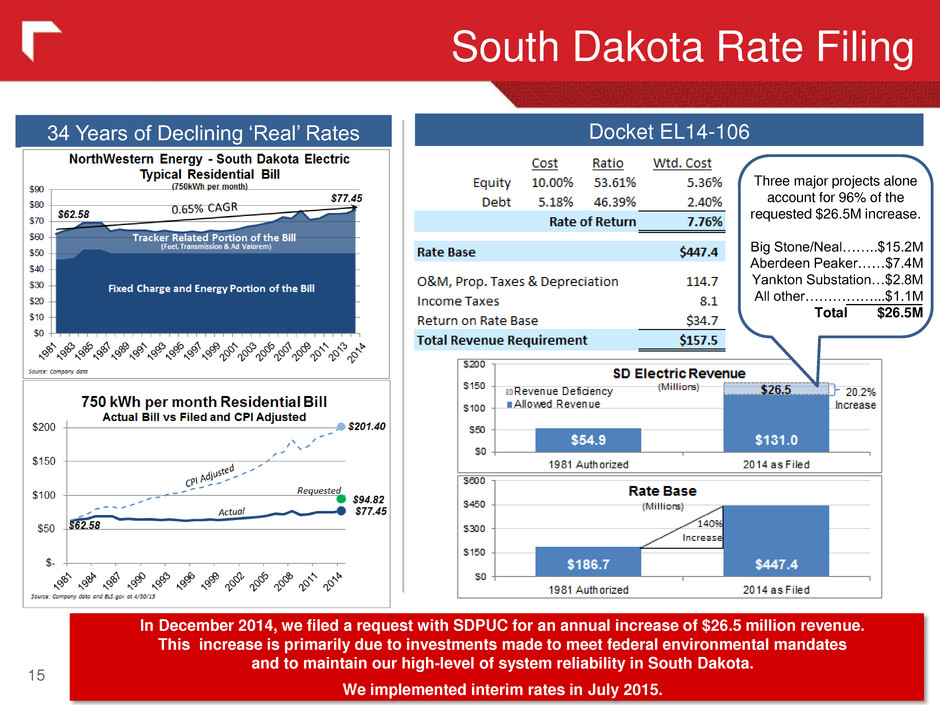
South Dakota Rate Filing 15 34 Years of Declining ‘Real’ Rates Docket EL14-106 In December 2014, we filed a request with SDPUC for an annual increase of $26.5 million revenue. This increase is primarily due to investments made to meet federal environmental mandates and to maintain our high-level of system reliability in South Dakota. We implemented interim rates in July 2015. Three major projects alone account for 96% of the requested $26.5M increase. Big Stone/Neal……..$15.2M Aberdeen Peaker……$7.4M Yankton Substation…$2.8M All other……………...$1.1M Total $26.5M
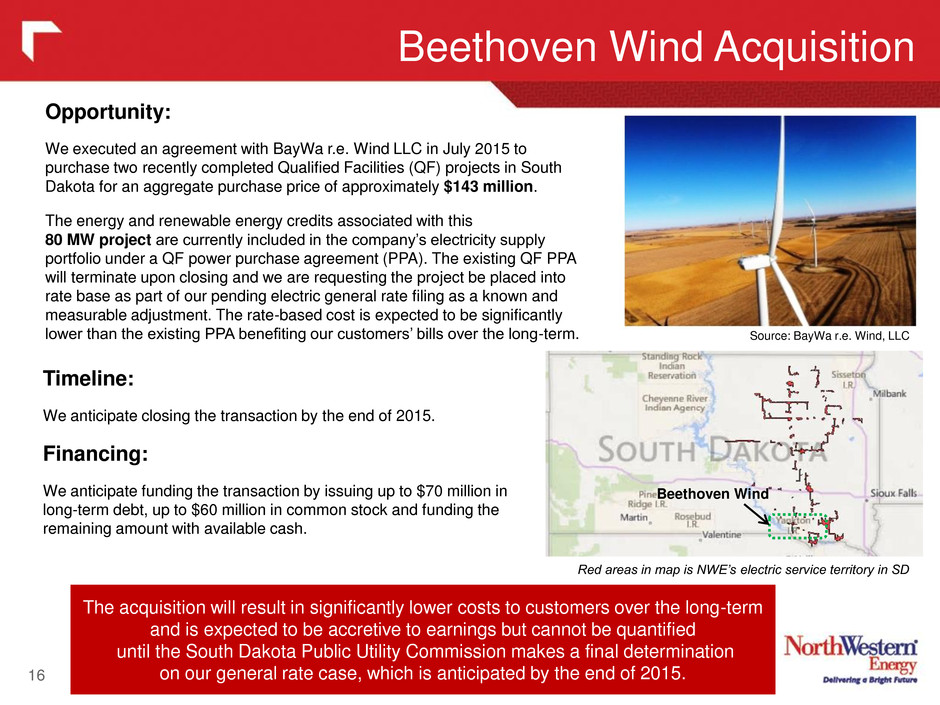
16 Beethoven Wind Acquisition The acquisition will result in significantly lower costs to customers over the long-term and is expected to be accretive to earnings but cannot be quantified until the South Dakota Public Utility Commission makes a final determination on our general rate case, which is anticipated by the end of 2015. Opportunity: We executed an agreement with BayWa r.e. Wind LLC in July 2015 to purchase two recently completed Qualified Facilities (QF) projects in South Dakota for an aggregate purchase price of approximately $143 million. The energy and renewable energy credits associated with this 80 MW project are currently included in the company’s electricity supply portfolio under a QF power purchase agreement (PPA). The existing QF PPA will terminate upon closing and we are requesting the project be placed into rate base as part of our pending electric general rate filing as a known and measurable adjustment. The rate-based cost is expected to be significantly lower than the existing PPA benefiting our customers’ bills over the long-term. Timeline: We anticipate closing the transaction by the end of 2015. Financing: We anticipate funding the transaction by issuing up to $70 million in long-term debt, up to $60 million in common stock and funding the remaining amount with available cash. Source: BayWa r.e. Wind, LLC Beethoven Wind Red areas in map is NWE’s electric service territory in SD
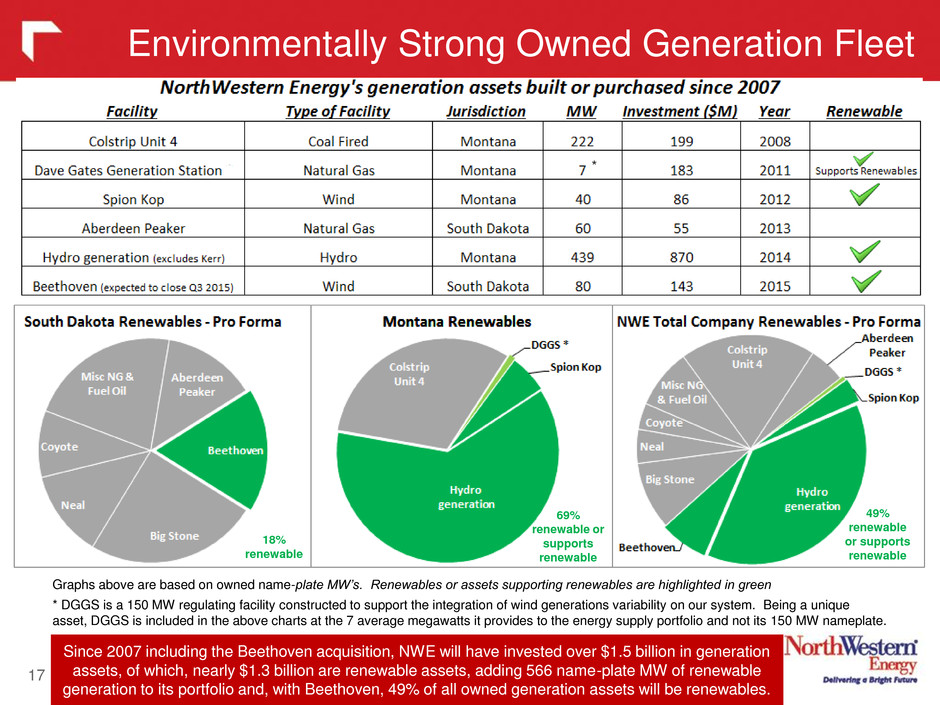
17 Environmentally Strong Owned Generation Fleet Since 2007 including the Beethoven acquisition, NWE will have invested over $1.5 billion in generation assets, of which, nearly $1.3 billion are renewable assets, adding 566 name-plate MW of renewable generation to its portfolio and, with Beethoven, 49% of all owned generation assets will be renewables. 18% renewable Graphs above are based on owned name-plate MW’s. Renewables or assets supporting renewables are highlighted in green * DGGS is a 150 MW regulating facility constructed to support the integration of wind generations variability on our system. Being a unique asset, DGGS is included in the above charts at the 7 average megawatts it provides to the energy supply portfolio and not its 150 MW nameplate. 69% renewable or supports renewable 49% renewable or supports renewable *
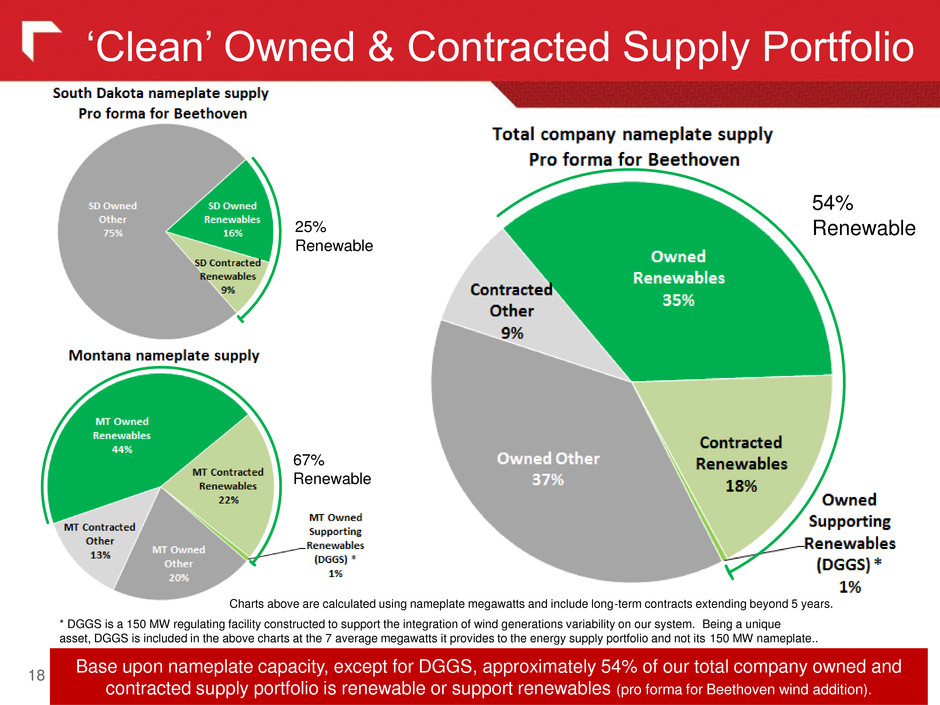
18 ‘Clean’ Owned & Contracted Supply Portfolio Base upon nameplate capacity, except for DGGS, approximately 54% of our total company owned and contracted supply portfolio is renewable or support renewables (pro forma for Beethoven wind addition). Charts above are calculated using nameplate megawatts and include long-term contracts extending beyond 5 years. 25% Renewable 67% Renewable 54% Renewable * DGGS is a 150 MW regulating facility constructed to support the integration of wind generations variability on our system. Being a unique asset, DGGS is included in the above charts at the 7 average megawatts it provides to the energy supply portfolio and not its 150 MW nameplate..
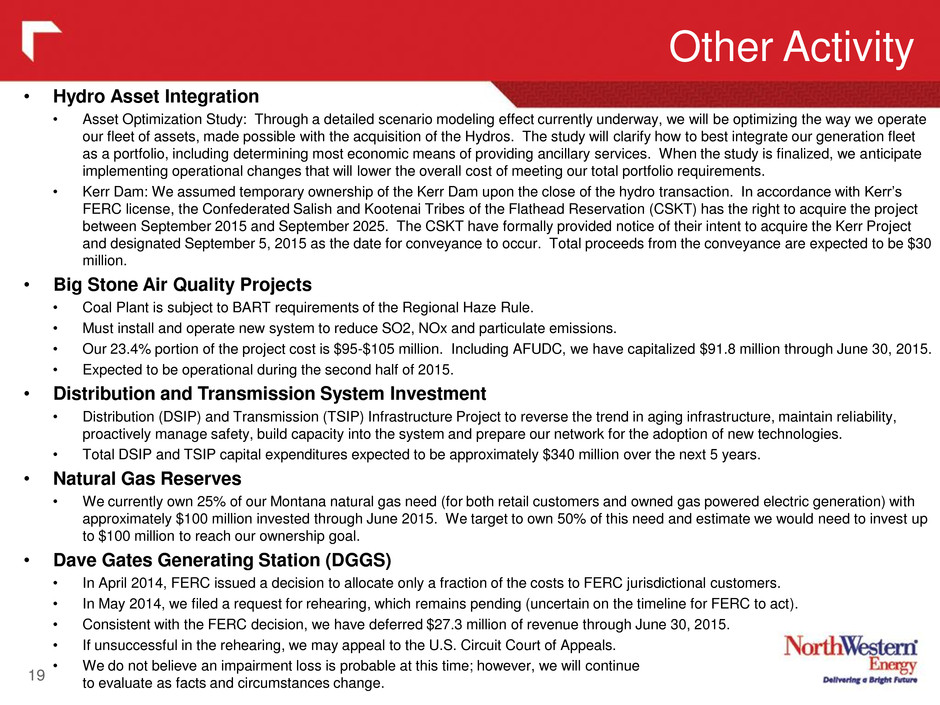
Other Activity 19 • Hydro Asset Integration • Asset Optimization Study: Through a detailed scenario modeling effect currently underway, we will be optimizing the way we operate our fleet of assets, made possible with the acquisition of the Hydros. The study will clarify how to best integrate our generation fleet as a portfolio, including determining most economic means of providing ancillary services. When the study is finalized, we anticipate implementing operational changes that will lower the overall cost of meeting our total portfolio requirements. • Kerr Dam: We assumed temporary ownership of the Kerr Dam upon the close of the hydro transaction. In accordance with Kerr’s FERC license, the Confederated Salish and Kootenai Tribes of the Flathead Reservation (CSKT) has the right to acquire the project between September 2015 and September 2025. The CSKT have formally provided notice of their intent to acquire the Kerr Project and designated September 5, 2015 as the date for conveyance to occur. Total proceeds from the conveyance are expected to be $30 million. • Big Stone Air Quality Projects • Coal Plant is subject to BART requirements of the Regional Haze Rule. • Must install and operate new system to reduce SO2, NOx and particulate emissions. • Our 23.4% portion of the project cost is $95-$105 million. Including AFUDC, we have capitalized $91.8 million through June 30, 2015. • Expected to be operational during the second half of 2015. • Distribution and Transmission System Investment • Distribution (DSIP) and Transmission (TSIP) Infrastructure Project to reverse the trend in aging infrastructure, maintain reliability, proactively manage safety, build capacity into the system and prepare our network for the adoption of new technologies. • Total DSIP and TSIP capital expenditures expected to be approximately $340 million over the next 5 years. • Natural Gas Reserves • We currently own 25% of our Montana natural gas need (for both retail customers and owned gas powered electric generation) with approximately $100 million invested through June 2015. We target to own 50% of this need and estimate we would need to invest up to $100 million to reach our ownership goal. • Dave Gates Generating Station (DGGS) • In April 2014, FERC issued a decision to allocate only a fraction of the costs to FERC jurisdictional customers. • In May 2014, we filed a request for rehearing, which remains pending (uncertain on the timeline for FERC to act). • Consistent with the FERC decision, we have deferred $27.3 million of revenue through June 30, 2015. • If unsuccessful in the rehearing, we may appeal to the U.S. Circuit Court of Appeals. • We do not believe an impairment loss is probable at this time; however, we will continue to evaluate as facts and circumstances change.

20
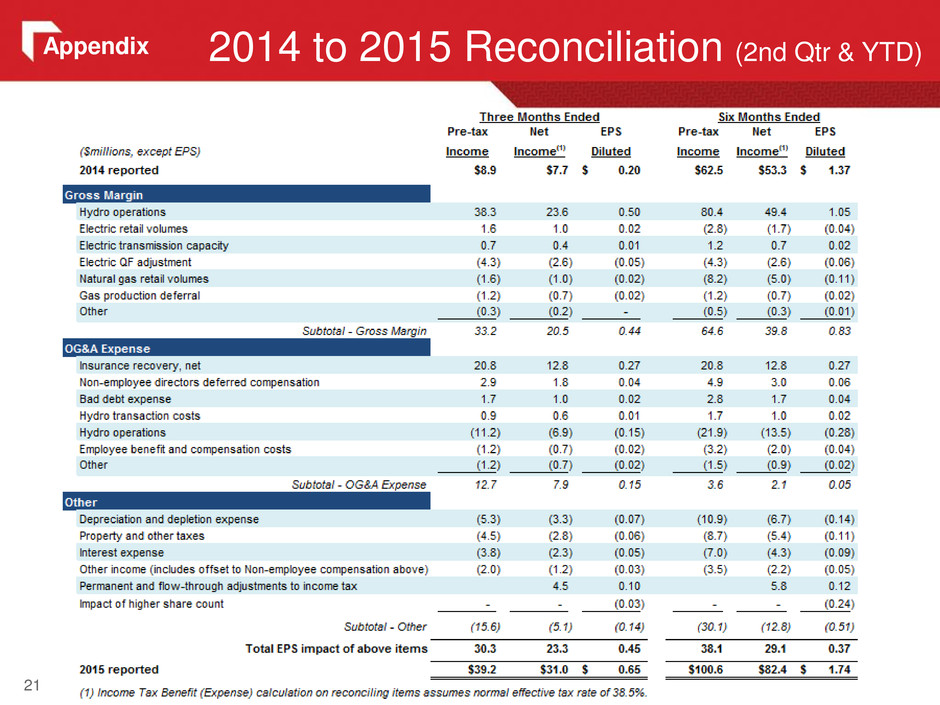
21 2014 to 2015 Reconciliation (2nd Qtr & YTD) Appendix
22 Heating and Cooling Degree Days Appendix
23 Electric Segment (Second Quarter) Appendix
24 Natural Gas Segment (Second Quarter) Appendix
25 Segment Results (Second Quarter) Appendix
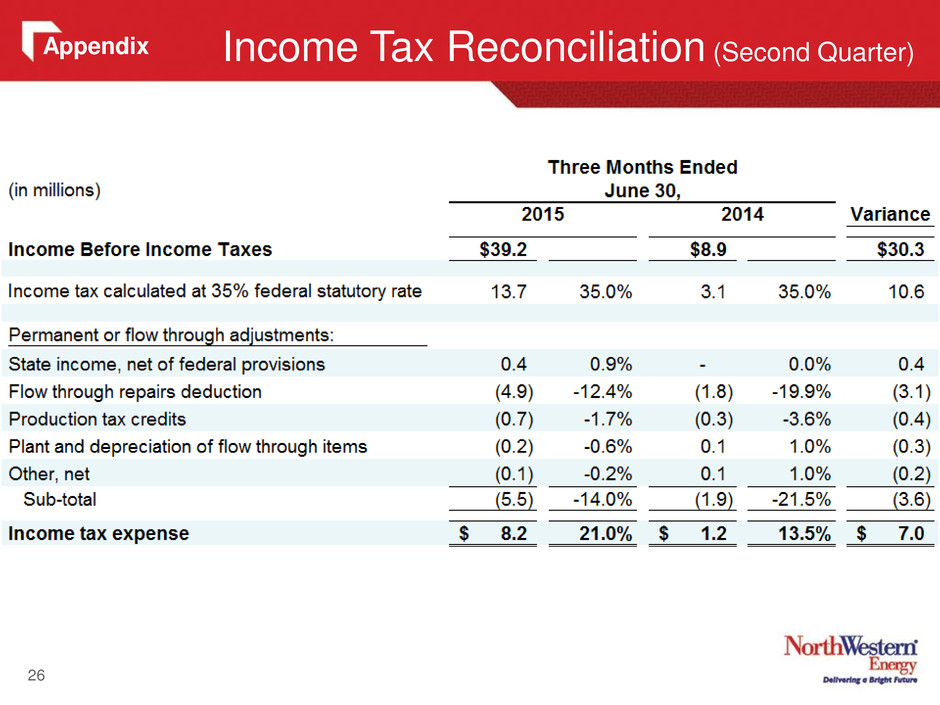
Income Tax Reconciliation (Second Quarter) 26 Appendix
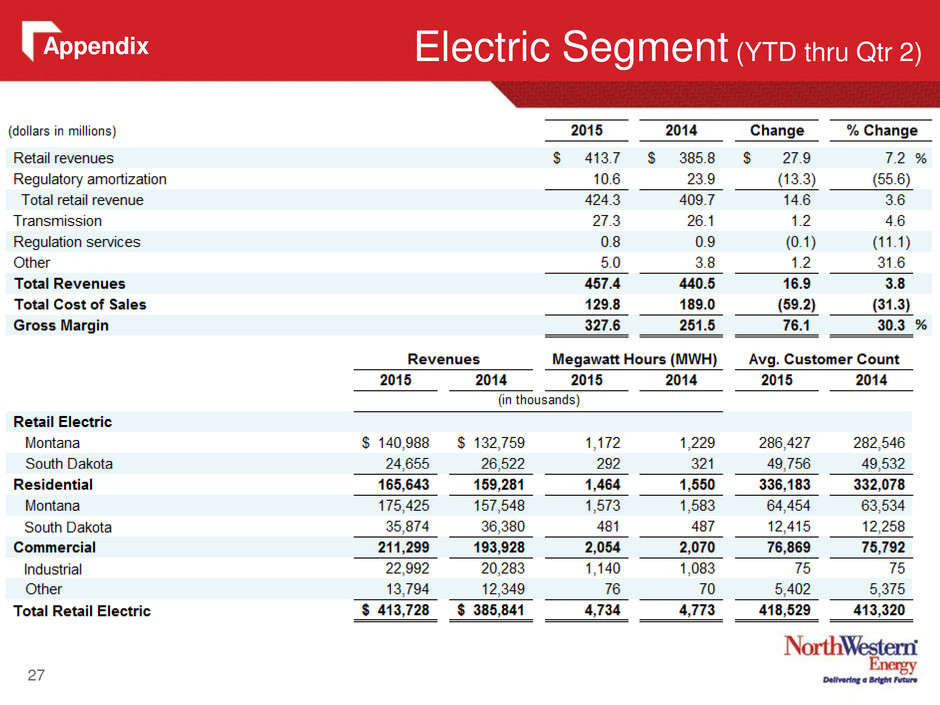
27 Electric Segment (YTD thru Qtr 2) Appendix
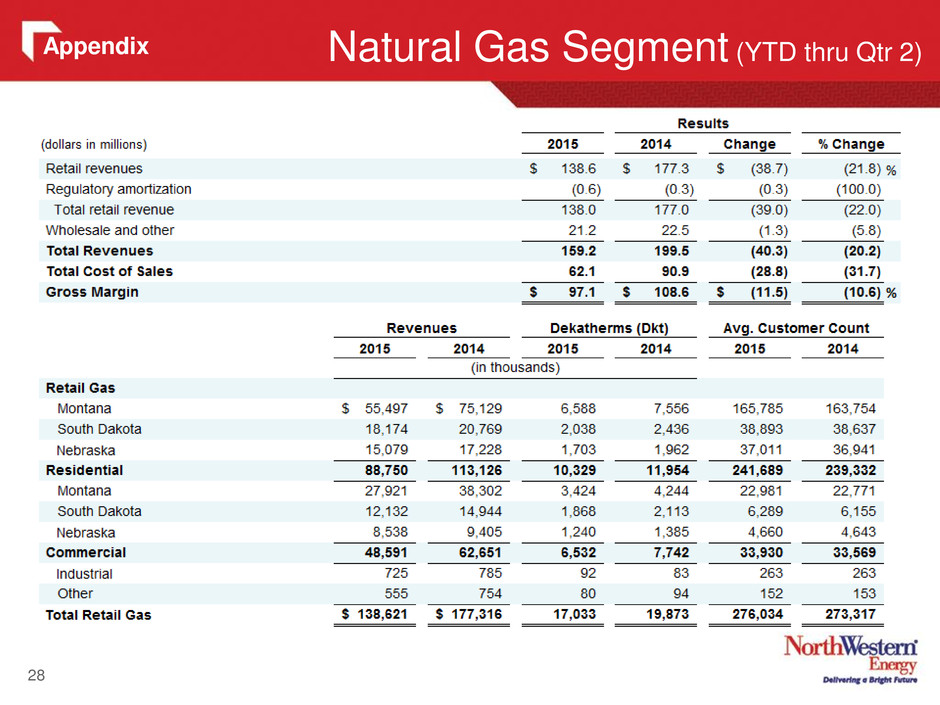
28 Natural Gas Segment (YTD thru Qtr 2) Appendix
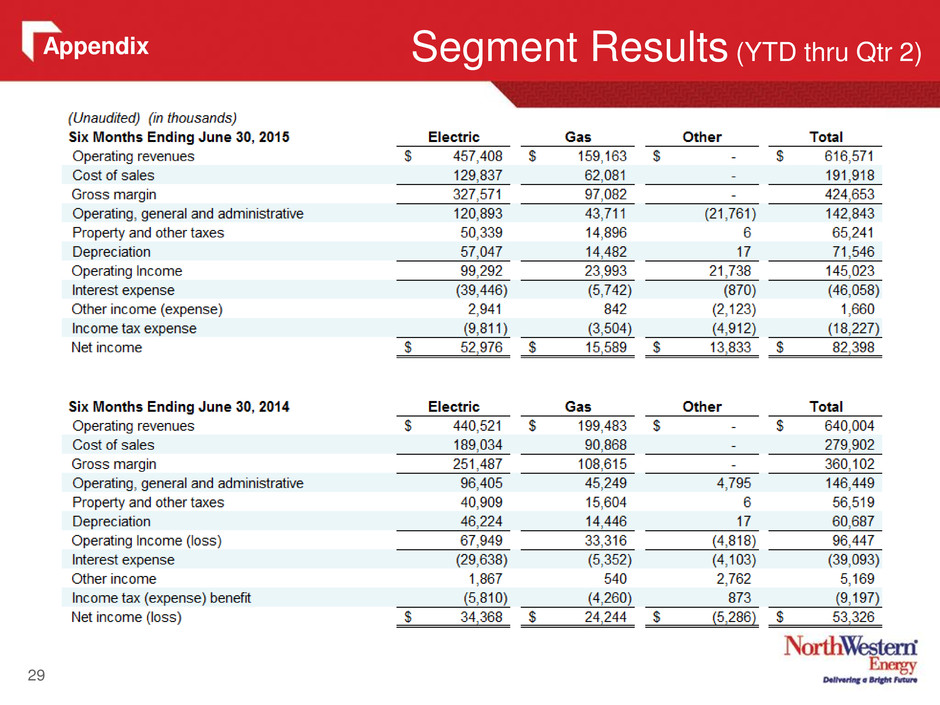
29 Segment Results (YTD thru Qtr 2) Appendix
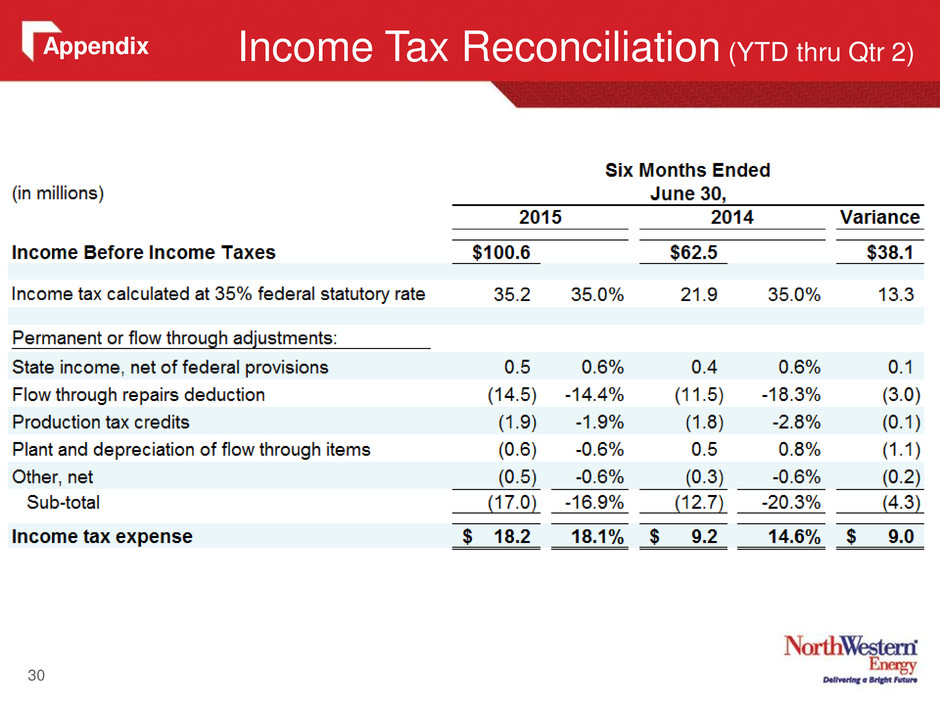
Income Tax Reconciliation (YTD thru Qtr 2) 30 Appendix
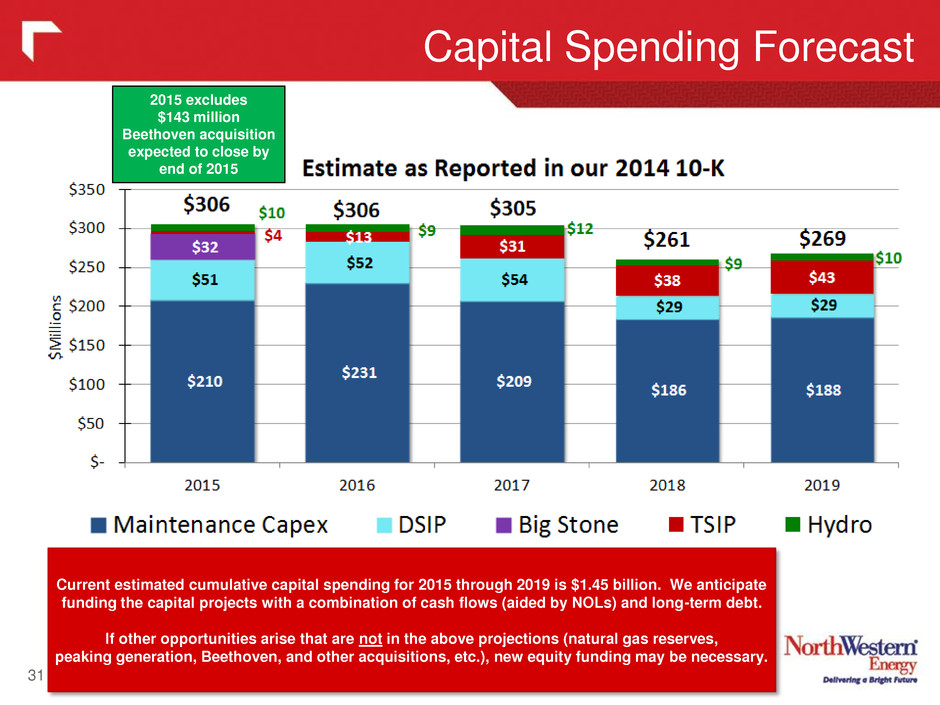
Capital Spending Forecast 31 Current estimated cumulative capital spending for 2015 through 2019 is $1.45 billion. We anticipate funding the capital projects with a combination of cash flows (aided by NOLs) and long-term debt. If other opportunities arise that are not in the above projections (natural gas reserves, peaking generation, Beethoven, and other acquisitions, etc.), new equity funding may be necessary. * 2015 excludes $143 million Beethoven acquisition expected to close by end of 2015
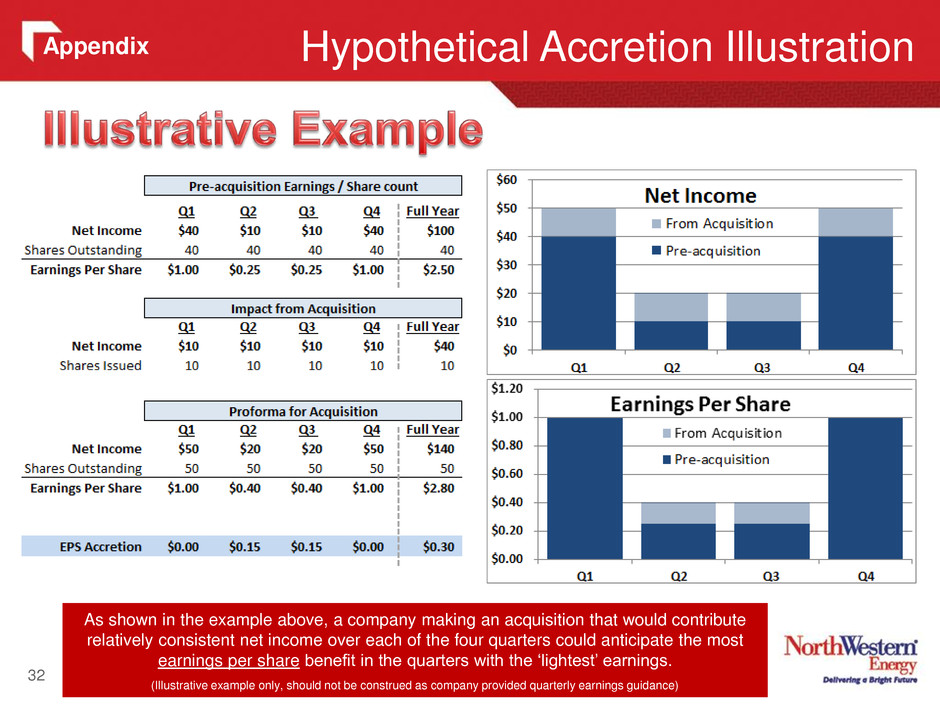
Hypothetical Accretion Illustration 32 As shown in the example above, a company making an acquisition that would contribute relatively consistent net income over each of the four quarters could anticipate the most earnings per share benefit in the quarters with the ‘lightest’ earnings. (Illustrative example only, should not be construed as company provided quarterly earnings guidance) Appendix
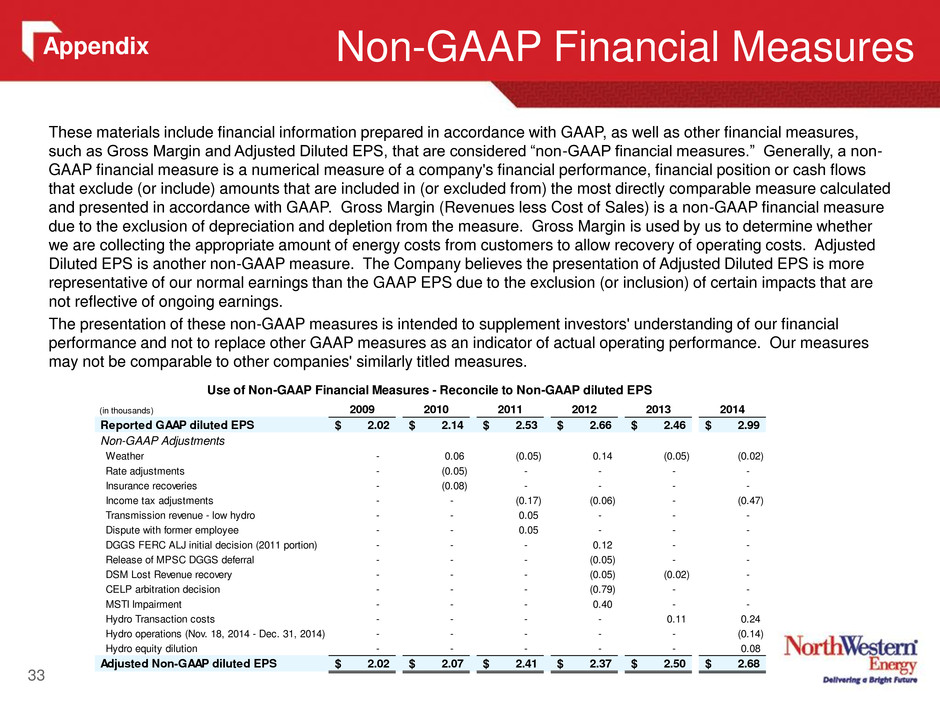
These materials include financial information prepared in accordance with GAAP, as well as other financial measures, such as Gross Margin and Adjusted Diluted EPS, that are considered “non-GAAP financial measures.” Generally, a non- GAAP financial measure is a numerical measure of a company's financial performance, financial position or cash flows that exclude (or include) amounts that are included in (or excluded from) the most directly comparable measure calculated and presented in accordance with GAAP. Gross Margin (Revenues less Cost of Sales) is a non-GAAP financial measure due to the exclusion of depreciation and depletion from the measure. Gross Margin is used by us to determine whether we are collecting the appropriate amount of energy costs from customers to allow recovery of operating costs. Adjusted Diluted EPS is another non-GAAP measure. The Company believes the presentation of Adjusted Diluted EPS is more representative of our normal earnings than the GAAP EPS due to the exclusion (or inclusion) of certain impacts that are not reflective of ongoing earnings. The presentation of these non-GAAP measures is intended to supplement investors' understanding of our financial performance and not to replace other GAAP measures as an indicator of actual operating performance. Our measures may not be comparable to other companies' similarly titled measures. Non-GAAP Financial Measures 33 (in thousands) 2009 2010 2011 2012 2013 2014 Reported GAAP diluted EPS 2.02$ 2.14$ 2.53$ 2.66$ 2.46$ 2.99$ Non-GAAP Adjustments Weather - 0.06 (0.05) 0.14 (0.05) (0.02) Rate adjustments - (0.05) - - - - Insurance recoveries - (0.08) - - - - Income tax adjustments - - (0.17) (0.06) - (0.47) Transmission revenue - low hydro - - 0.05 - - - Dispute with former employee - - 0.05 - - - DGGS FERC ALJ initial decision (2011 portion) - - - 0.12 - - Rel as o M SC DGGS deferral - - - (0.05) - - DSM L t R venue recovery - - - (0.05) (0.02) - CELP rbitrati decision - - - (0.79) - - MSTI Impairment - - - 0.40 - - Hydro Transaction costs - - - - 0.11 0.24 Hydro operations (Nov. 18, 2014 - Dec. 31, 2014) - - - - - (0.14) Hydro equity dilution - - - - - 0.08 Adjusted Non-GAAP diluted EPS 2.02$ 2.07$ 2.41$ 2.37$ 2.50$ 2.68$ Use of Non-GAAP Financial Measures - Reconcile to Non-GAAP diluted EPS Appendix
