Attached files
| file | filename |
|---|---|
| 8-K - 8-K - SOUTHWEST BANCORP INC | oksb-20150721x8k.htm |
| EX-99.1 - EX-99.1 - SOUTHWEST BANCORP INC | oksb-20150721ex99168aab2.htm |
 2015 Second Quarter Earnings Presentation July 22, 2015 NASDAQ: OKSB
 Forward Looking Statements 2 We make forward-looking statements in this presentation that are subject to risks and uncertainties. We intend these statements to be covered by the safe harbor provision for forward-looking statements contained in the Private Securities Litigation Reform Act of 1995. These forward-looking statements include: •Statements of Southwest's goals, intentions, and expectations; •Estimates of risks and of future costs and benefits; •Expectations regarding our future financial performance and the financial performance of our operating segments; •Expectations regarding regulatory actions; •Expectations regarding our ability to utilize tax loss benefits; •Expectations regarding our stock repurchase program; •Expectations regarding dividends; •Expectations regarding acquisitions and divestitures; •Assessments of loan quality, probable loan losses, and the amount and timing of loan payoffs; •Estimates of the value of assets held for sale or available for sale; and •Statements of our ability to achieve financial and other goals. These forward-looking statements are subject to significant uncertainties because they are based upon: the amount and timing of future changes in interest rates, market behavior, and other economic conditions; future laws, regulations, and accounting principles; changes in regulatory standards and examination policies, and a variety of other matters. These other matters include, among other things, the direct and indirect effects of economic conditions on interest rates, credit quality, loan demand, liquidity, and monetary and supervisory policies of banking regulators. Because of these uncertainties, the actual future results may be materially different from the results indicated by these forward-looking statements. In addition, Southwest's past growth and performance do not necessarily indicate our future results. For other factors, risks, and uncertainties that could cause actual results to differ materially from estimates and projections contained in forward-looking statements, please read the “Risk Factors” contained in Southwest’s reports to the Securities and Exchange Commission. We do not intend, or undertake no obligation, to update or revise any forward-looking statements contained in this presentation, whether as a result of differences in actual results, changes in assumptions, or changes in other factors affecting said statements, except as required by law.
 Investor Information 3 In connection with the proposed merger of First Commercial Bancshares, Inc. (“First Commercial”) into Southwest Bancorp, Inc. (“OKSB”), on July 7, 2015 OKSB filed with the Securities and Exchange Commission a Registration Statement on Form S-4 (File no. 333-205521) to register the shares of OKSB’s common stock to be issued to the shareholders of First Commercial. The registration statement includes a Prospectus of OKSB, a Proxy Statement of First Commercial, as well as other relevant documents concerning the proposed transaction, which will be sent to the shareholders of First Commercial seeking their approval of the proposed transaction. We urge investors and shareholders to read the Registration Statement on Form S-4, the Proxy Statement and Prospectus included with the Registration Statement on Form S-4, and any other relevant documents filed with the SEC, as well as any amendments or supplements to those documents, because they will contain important information relating to the proposed transaction. A free copy of these materials may be obtained on the SEC’s website at http://www.sec.gov. Alternatively, when available, these documents can be obtained free of charge from OKSB’s website at www.oksb.com under the tab “Investors” and then under the tab “SEC Filings.” OKSB, certain of its directors and executive officers and other persons may be deemed to be participants in the solicitation of proxies from the shareholders of First Commercial in connection with the proposed transaction under the rules of the SEC. Information about these participants is set forth in the proxy statement for OKSB’s 2015 annual meeting of shareholders, as filed with the SEC on a Schedule 14A on April 22, 2015. Additional information regarding the participants in the proxy solicitation and a description of their direct and indirect interests, by security holdings or otherwise, may be obtained by reading the definitive proxy statement and other relevant materials, when available, to be filed by OKSB with the SEC in conjunction with the proposed transaction. Free copies of this document may be obtained as described in the preceding paragraph.
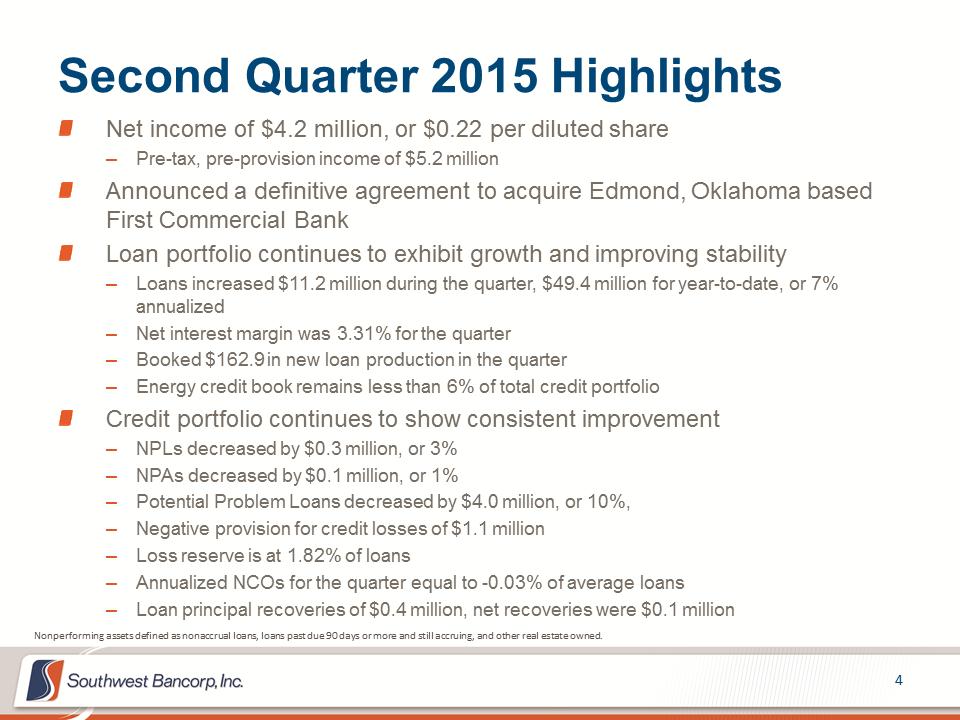 Net income of $4.2 million, or $0.22 per diluted share –Pre-tax, pre-provision income of $5.2 million Announced a definitive agreement to acquire Edmond, Oklahoma based First Commercial Bank Loan portfolio continues to exhibit growth and improving stability –Loans increased $11.2 million during the quarter, $49.4 million for year-to-date, or 7% annualized –Net interest margin was 3.31% for the quarter –Booked $162.9 in new loan production in the quarter –Energy credit book remains less than 6% of total credit portfolio Credit portfolio continues to show consistent improvement –NPLs decreased by $0.3 million, or 3% –NPAs decreased by $0.1 million, or 1% –Potential Problem Loans decreased by $4.0 million, or 10%, –Negative provision for credit losses of $1.1 million –Loss reserve is at 1.82% of loans –Annualized NCOs for the quarter equal to -0.03% of average loans –Loan principal recoveries of $0.4 million, net recoveries were $0.1 million Second Quarter 2015 Highlights 4 Nonperforming assets defined as nonaccrual loans, loans past due 90 days or more and still accruing, and other real estate owned.
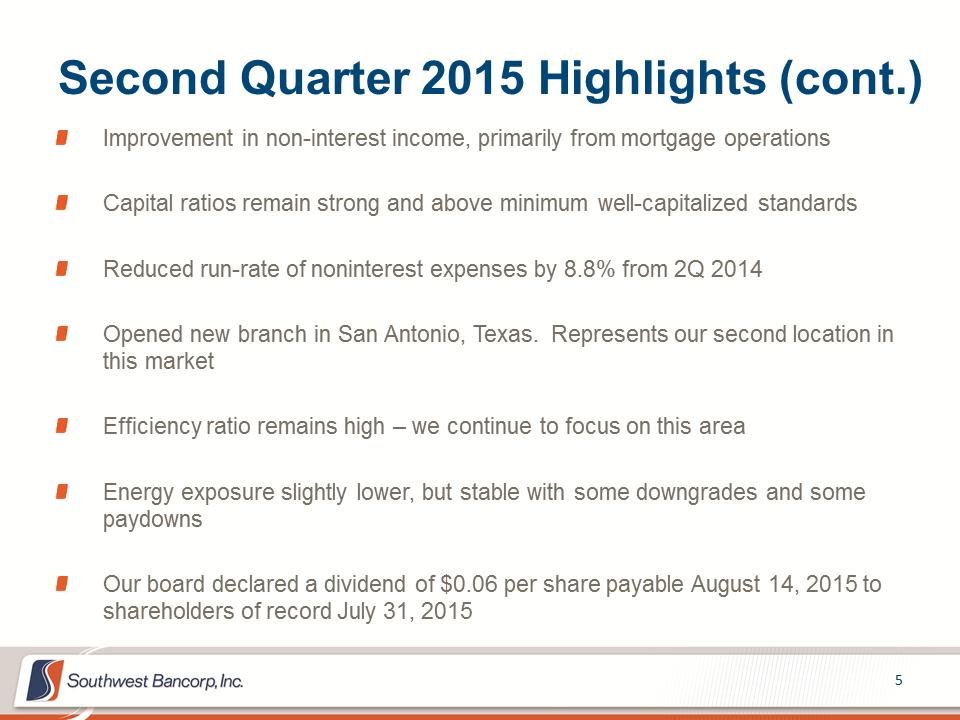 Second Quarter 2015 Highlights (cont.) Improvement in non-interest income, primarily from mortgage operations Capital ratios remain strong and above minimum well-capitalized standards Reduced run-rate of noninterest expenses by 8.8% from 2Q 2014 Opened new branch in San Antonio, Texas. Represents our second location in this market Efficiency ratio remains high – we continue to focus on this area Energy exposure slightly lower, but stable with some downgrades and some paydowns Our board declared a dividend of $0.06 per share payable August 14, 2015 to shareholders of record July 31, 2015 5
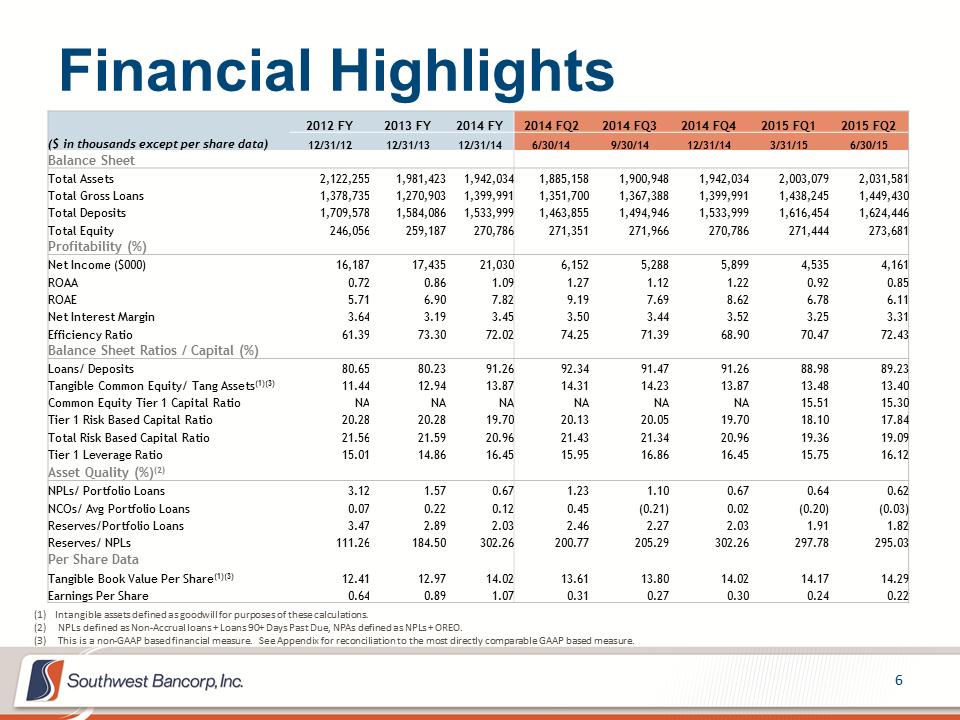 Financial Highlights 6 2012 FY 2013 FY 2014 FY 2014 FQ2 2014 FQ3 2014 FQ4 2015 FQ1 2015 FQ2 ($ in thousands except per share data) 12/31/12 12/31/13 12/31/14 6/30/14 9/30/14 12/31/14 3/31/15 6/30/15 Balance Sheet Total Assets 2,122,255 1,981,423 1,942,034 1,885,158 1,900,948 1,942,034 2,003,079 2,031,581 Total Gross Loans 1,378,735 1,270,903 1,399,991 1,351,700 1,367,388 1,399,991 1,438,245 1,449,430 Total Deposits 1,709,578 1,584,086 1,533,999 1,463,855 1,494,946 1,533,999 1,616,454 1,624,446 Total Equity 246,056 259,187 270,786 271,351 271,966 270,786 271,444 273,681 Profitability (%) Net Income ($000) 16,187 17,435 21,030 6,152 5,288 5,899 4,535 4,161 ROAA 0.72 0.86 1.09 1.27 1.12 1.22 0.92 0.85 ROAE 5.71 6.90 7.82 9.19 7.69 8.62 6.78 6.11 Net Interest Margin 3.64 3.19 3.45 3.50 3.44 3.52 3.25 3.31 Efficiency Ratio 61.39 73.30 72.02 74.25 71.39 68.90 70.47 72.43 Balance Sheet Ratios / Capital (%) Loans/ Deposits 80.65 80.23 91.26 92.34 91.47 91.26 88.98 89.23 Tangible Common Equity/ Tang Assets(1)(3) 11.44 12.94 13.87 14.31 14.23 13.87 13.48 13.40 Common Equity Tier 1 Capital Ratio NA NA NA NA NA NA 15.51 15.30 Tier 1 Risk Based Capital Ratio 20.28 20.28 19.70 20.13 20.05 19.70 18.10 17.84 Total Risk Based Capital Ratio 21.56 21.59 20.96 21.43 21.34 20.96 19.36 19.09 Tier 1 Leverage Ratio 15.01 14.86 16.45 15.95 16.86 16.45 15.75 16.12 Asset Quality (%)(2) NPLs/ Portfolio Loans 3.12 1.57 0.67 1.23 1.10 0.67 0.64 0.62 NCOs/ Avg Portfolio Loans 0.07 0.22 0.12 0.45 (0.21) 0.02 (0.20) (0.03) Reserves/Portfolio Loans 3.47 2.89 2.03 2.46 2.27 2.03 1.91 1.82 Reserves/ NPLs 111.26 184.50 302.26 200.77 205.29 302.26 297.78 295.03 Per Share Data Tangible Book Value Per Share(1)(3) 12.41 12.97 14.02 13.61 13.80 14.02 14.17 14.29 Earnings Per Share 0.64 0.89 1.07 0.31 0.27 0.30 0.24 0.22 (1) Intangible assets defined as goodwill for purposes of these calculations. (2)NPLs defined as Non-Accrual loans + Loans 90+ Days Past Due, NPAs defined as NPLs + OREO. (3)This is a non-GAAP based financial measure. See Appendix for reconciliation to the most directly comparable GAAP based measure.
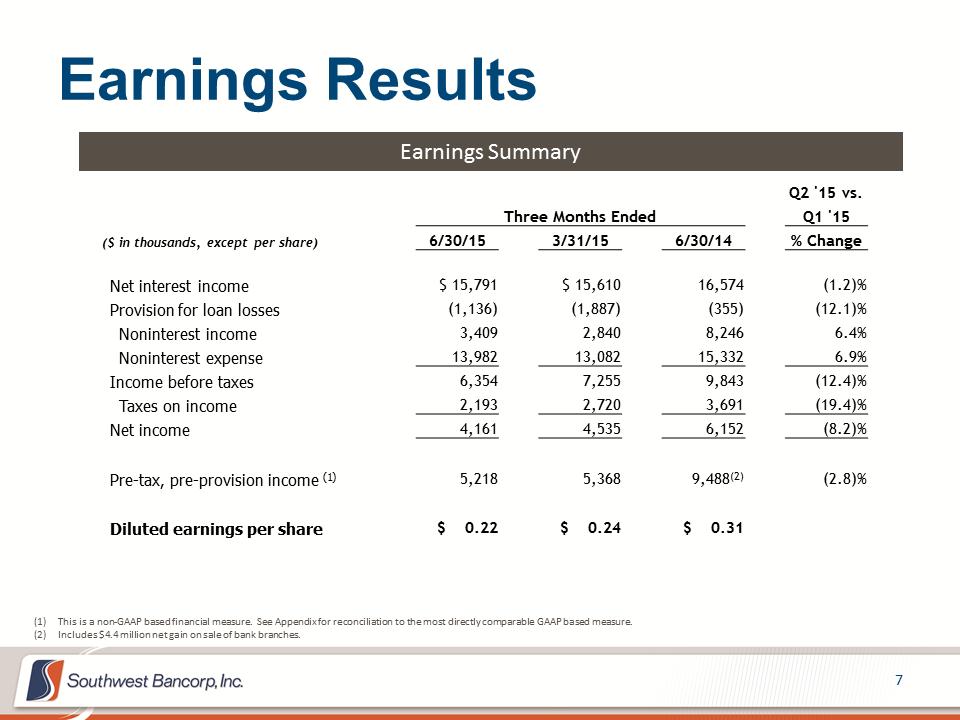 Earnings Results 7 Earnings Summary Q2 '15 vs. Three Months Ended Q1 '15 ($ in thousands, except per share) 6/30/15 3/31/15 6/30/14 % Change Net interest income $ 15,791 $ 15,610 16,574 (1.2)% Provision for loan losses (1,136) (1,887) (355) (12.1)% Noninterest income 3,409 2,840 8,246 6.4% Noninterest expense 13,982 13,082 15,332 6.9% Income before taxes 6,354 7,255 9,843 (12.4)% Taxes on income 2,193 2,720 3,691 (19.4)% Net income 4,161 4,535 6,152 (8.2)% Pre-tax, pre-provision income (1) 5,218 5,368 9,488(2) (2.8)% Diluted earnings per share $ 0.22 $ 0.24 $ 0.31 (1)This is a non-GAAP based financial measure. See Appendix for reconciliation to the most directly comparable GAAP based measure. (2)Includes $4.4 million net gain on sale of bank branches.
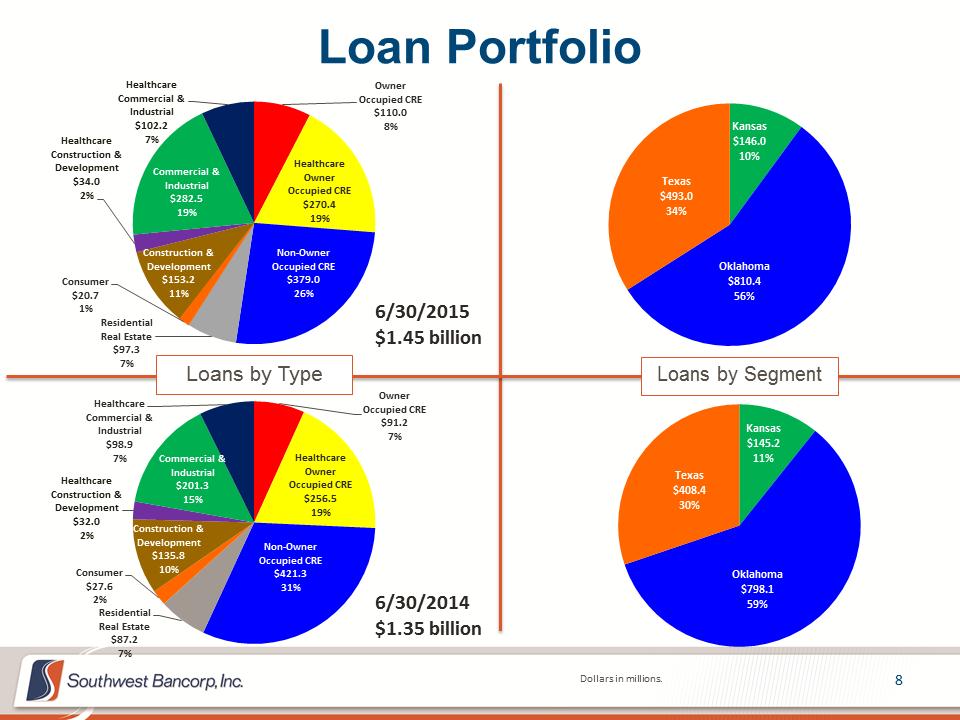 Owner Occupied CRE $110.0 8% Healthcare Owner Occupied CRE $270.4 19% Non-Owner Occupied CRE $379.0 26% Residential Real Estate $97.3 7% Consumer $20.7 1% Construction & Development $153.2 11% Healthcare Construction & Development $34.0 2% Commercial & Industrial $282.5 19% Healthcare Commercial & Industrial $102.2 7% Loan Portfolio 8 Dollars in millions. Loans by Type Loans by Segment Owner Occupied CRE $91.2 7% Healthcare Owner Occupied CRE $256.5 19% Non-Owner Occupied CRE $421.3 31% Residential Real Estate $87.2 7% Consumer $27.6 2% Construction & Development $135.8 10% Healthcare Construction & Development $32.0 2% Commercial & Industrial $201.3 15% Healthcare Commercial & Industrial $98.9 7% 6/30/2015 $1.45 billion 6/30/2014 $1.35 billion Kansas $146.0 10% Oklahoma $810.4 56% Texas $493.0 34% Kansas $145.2 11% Oklahoma $798.1 59% Texas $408.4 30%
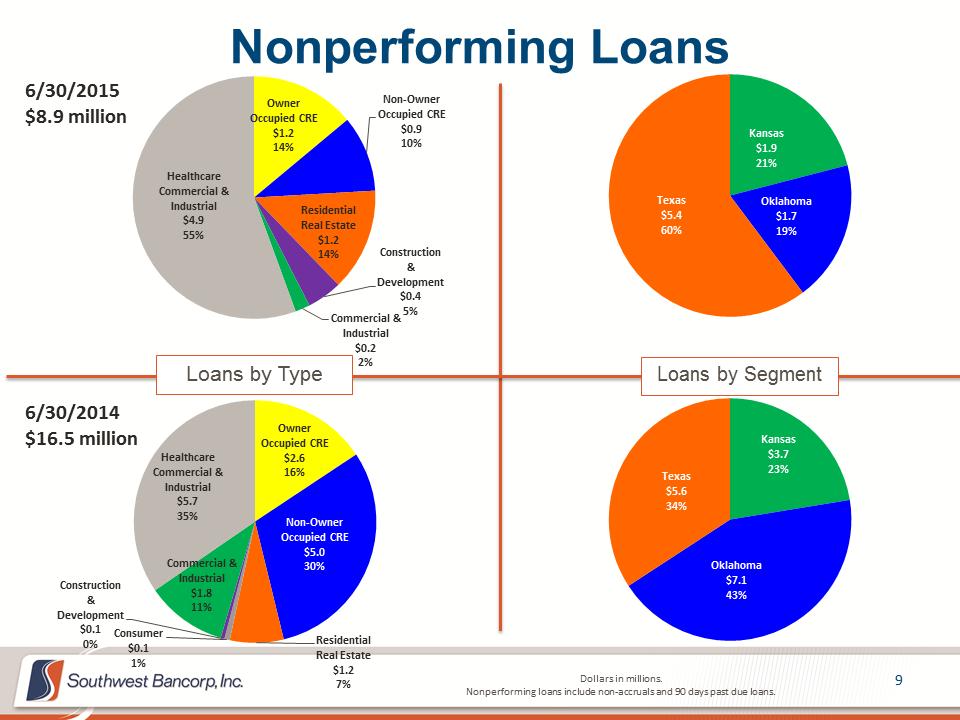 Owner Occupied CRE $1.2 14% Non-Owner Occupied CRE $0.9 10% Residential Real Estate $1.2 14% Construction & Development $0.4 5% Commercial & Industrial $0.2 2% Healthcare Commercial & Industrial $4.9 55% Nonperforming Loans 9 Dollars in millions. Nonperforming loans include non-accruals and 90 days past due loans. Loans by Type Loans by Segment Owner Occupied CRE $2.6 16% Non-Owner Occupied CRE $5.0 30% Residential Real Estate $1.2 7% Consumer $0.1 1% Construction & Development $0.1 0% Commercial & Industrial $1.8 11% Healthcare Commercial & Industrial $5.7 35% 6/30/2015 $8.9 million 6/30/2014 $16.5 million Kansas $1.9 21% Oklahoma $1.7 19% Texas $5.4 60% Kansas $3.7 23% Oklahoma $7.1 43% Texas $5.6 34%
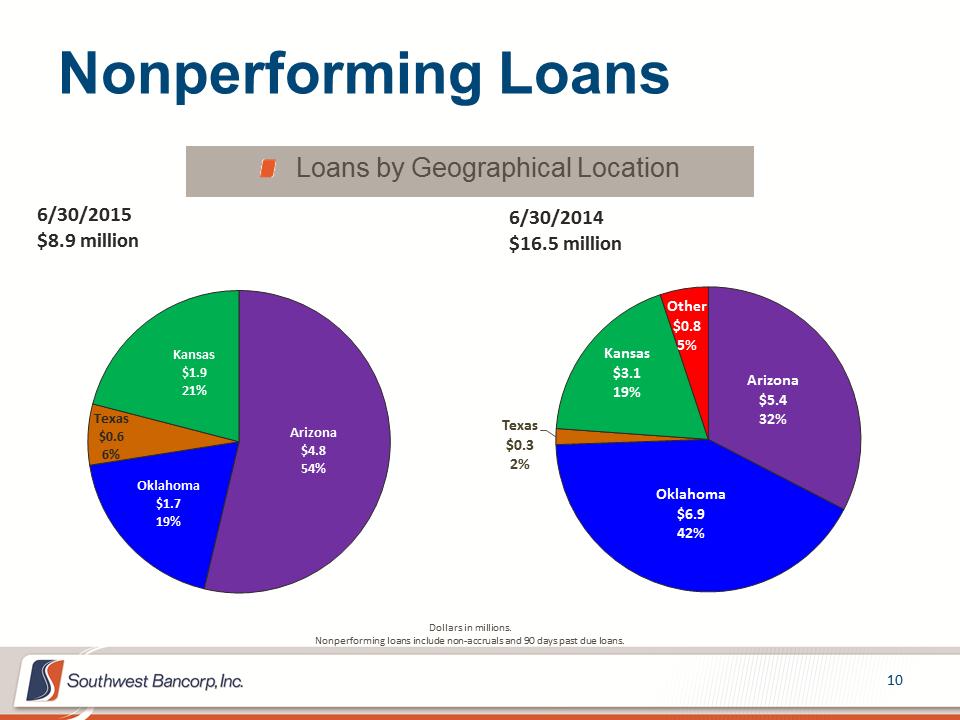 Nonperforming Loans Loans by Geographical Location Dollars in millions. Nonperforming loans include non-accruals and 90 days past due loans. Arizona $4.8 54% Oklahoma $1.7 19% Texas $0.6 6% Kansas $1.9 21% 10 Arizona $5.4 32% Oklahoma $6.9 42% Texas $0.3 2% Kansas $3.1 19% Other $0.8 5% 6/30/2015 $8.9 million 6/30/2014 $16.5 million
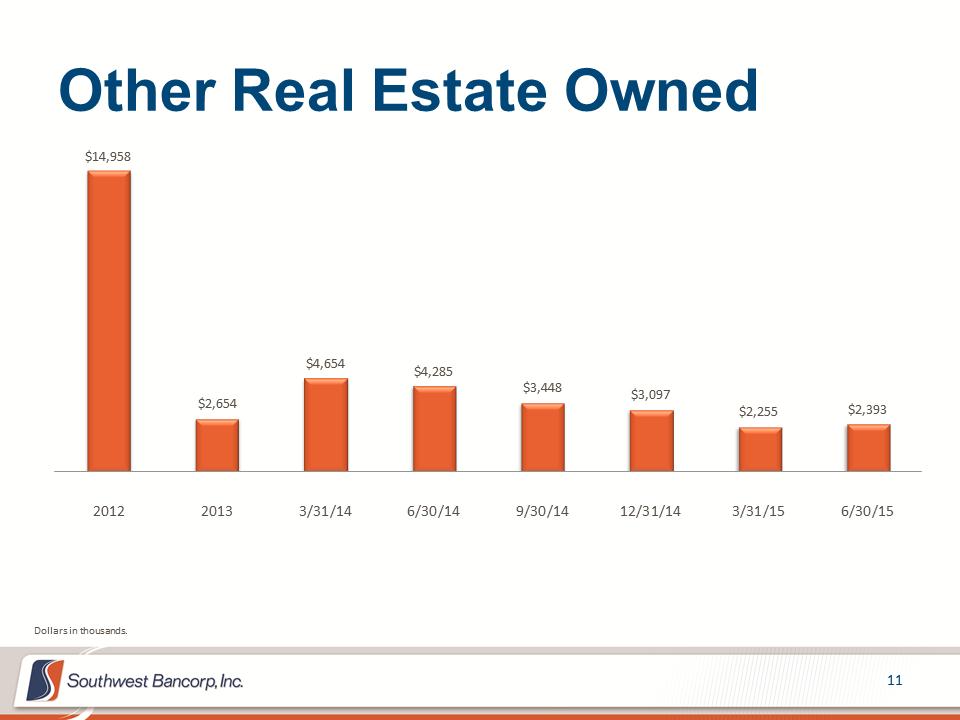 Other Real Estate Owned 11 $14,958 $2,654 $4,654 $4,285 $3,448 $3,097 $2,255 $2,393 201220133/31/146/30/149/30/1412/31/143/31/156/30/15Dollars in thousands.
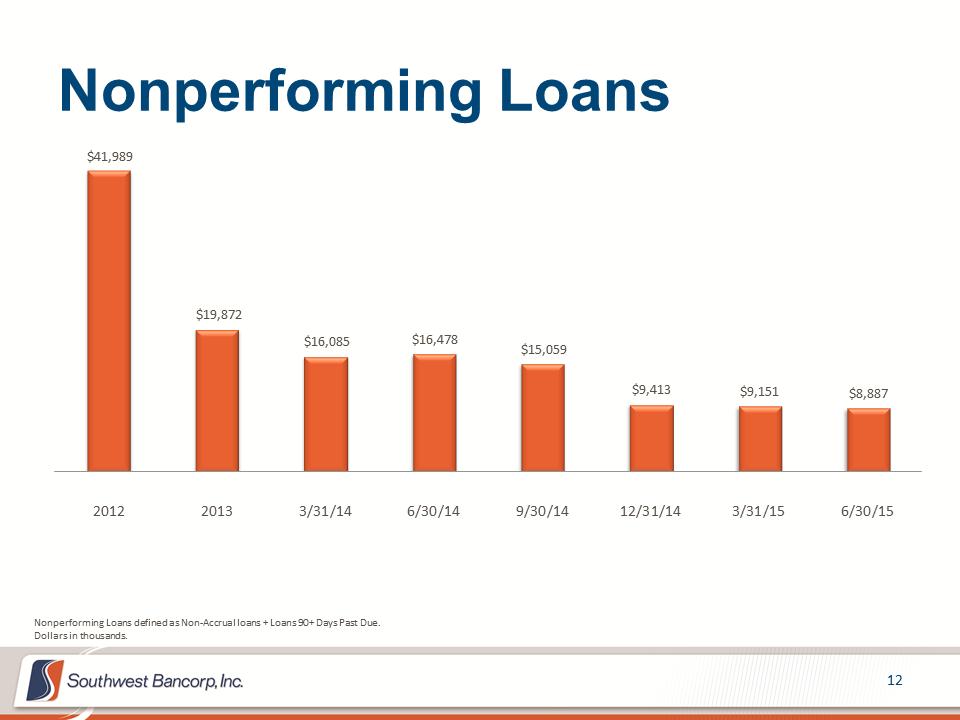 Nonperforming Loans 12 $41,989 $19,872 $16,085 $16,478 $15,059 $9,413 $9,151 $8,887 201220133/31/146/30/149/30/1412/31/143/31/156/30/15Nonperforming Loans defined as Non-Accrual loans + Loans 90+ Days Past Due. Dollars in thousands.
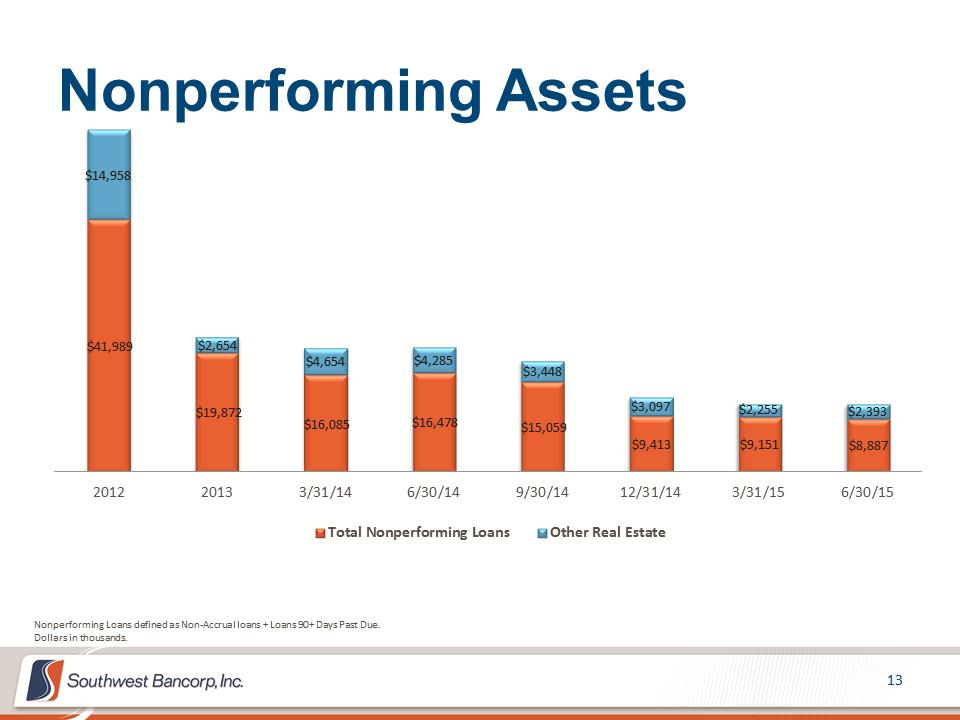 Nonperforming Assets 13 $41,989 $19,872 $16,085 $16,478 $15,059 $9,413 $9,151 $8,887 $14,958 $2,654 $4,654 $4,285 $3,448 $3,097 $2,255 $2,393 201220133/31/146/30/149/30/1412/31/143/31/156/30/15Total Nonperforming LoansOther Real EstateNonperforming Loans defined as Non-Accrual loans + Loans 90+ Days Past Due. Dollars in thousands.
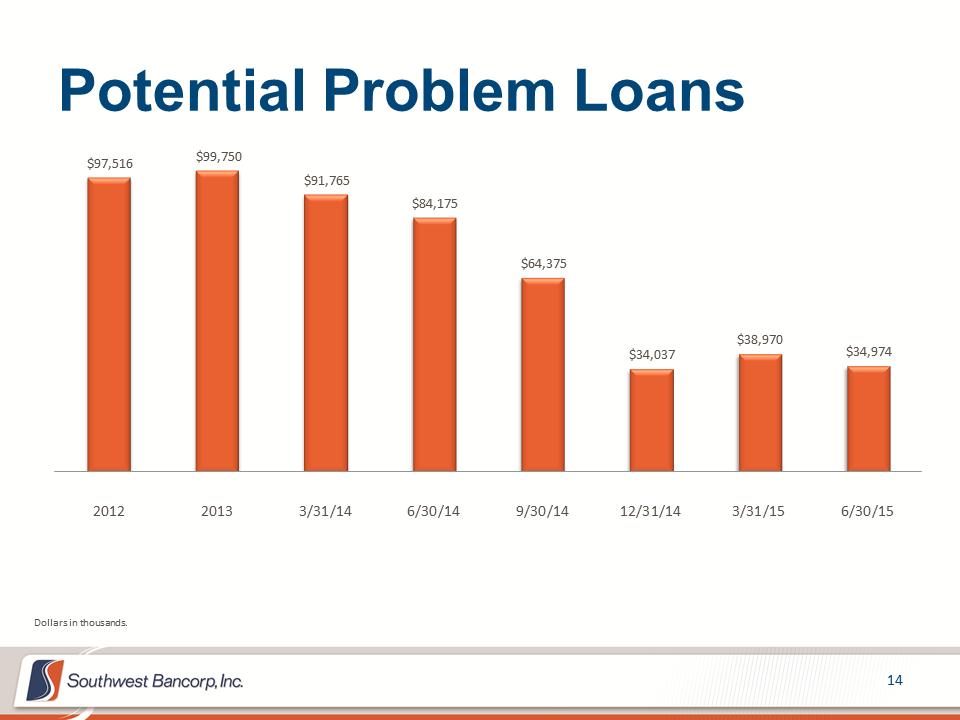 Potential Problem Loans 14 $97,516 $99,750 $91,765 $84,175 $64,375 $34,037 $38,970 $34,974 201220133/31/146/30/149/30/1412/31/143/31/156/30/15Dollars in thousands.
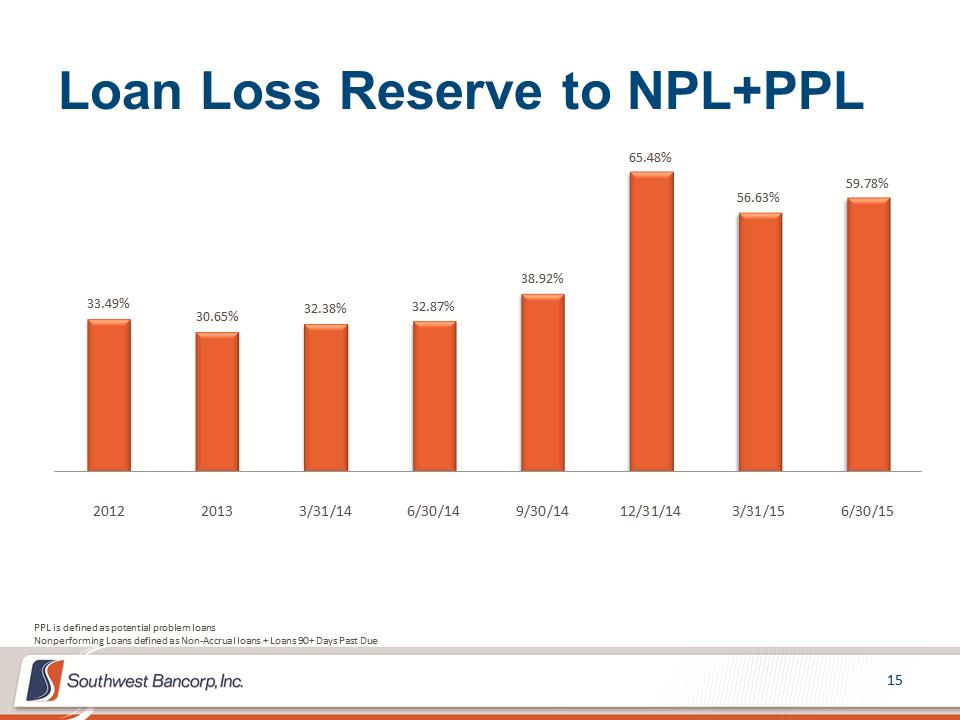 Loan Loss Reserve to NPL+PPL 15 33.49% 30.65% 32.38% 32.87% 38.92% 65.48% 56.63% 59.78% 201220133/31/146/30/149/30/1412/31/143/31/156/30/15PPL is defined as potential problem loans Nonperforming Loans defined as Non-Accrual loans + Loans 90+ Days Past Due
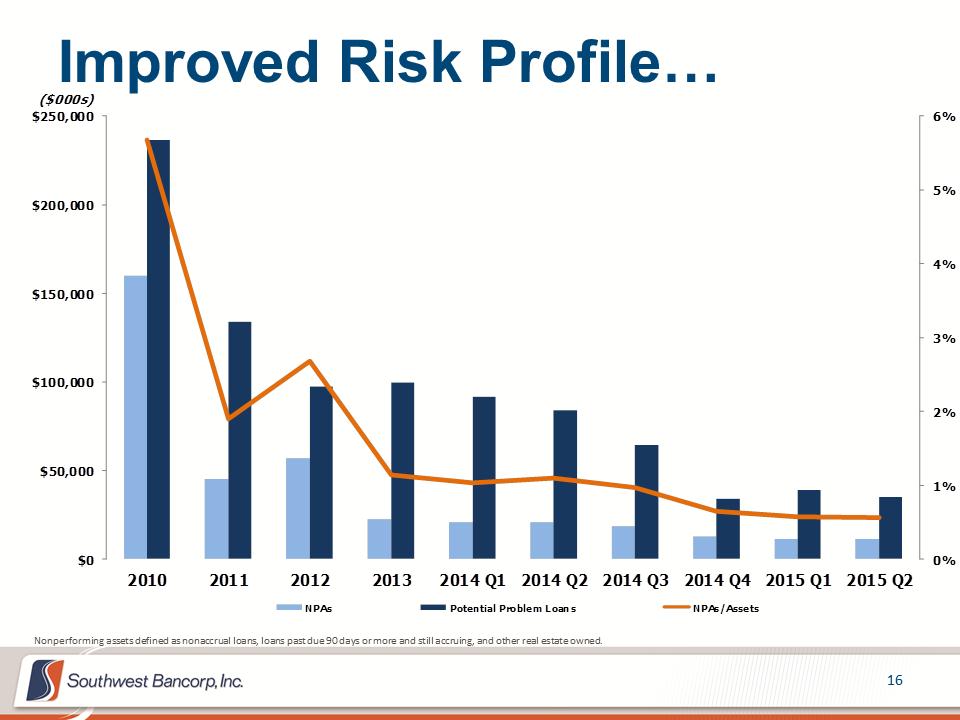 Improved Risk Profile… 16 Nonperforming assets defined as nonaccrual loans, loans past due 90 days or more and still accruing, and other real estate owned. 0%1%2%3%4%5%6%$0$50,000$100,000$150,000$200,000$250,00020102011201220132014 Q12014 Q22014 Q32014 Q42015 Q12015 Q2($000s)NPAsPotential Problem LoansNPAs/Assets
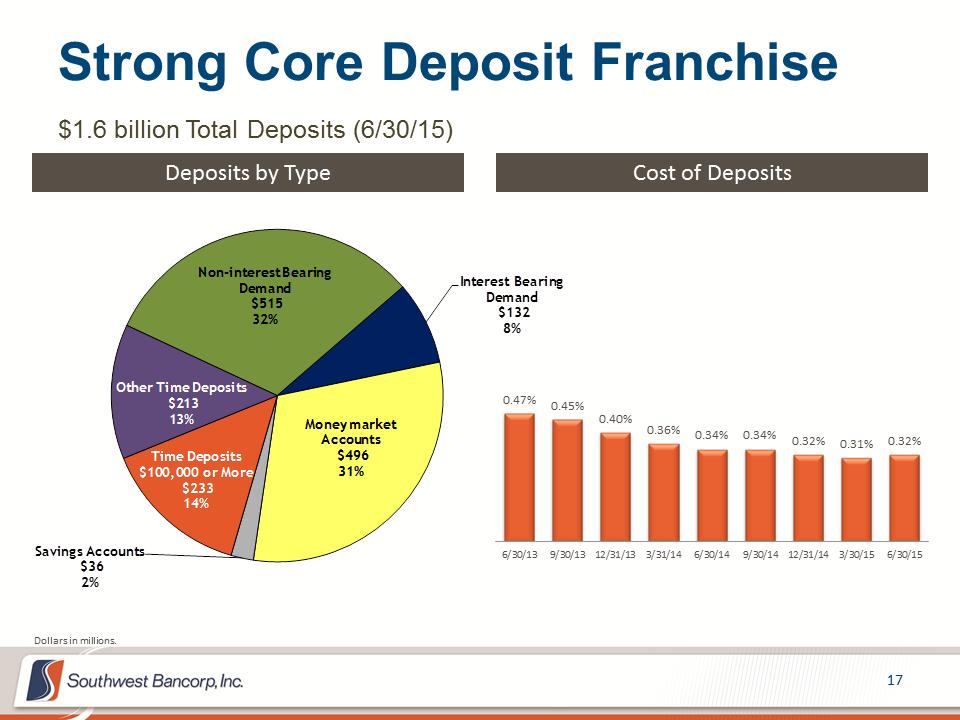 Strong Core Deposit Franchise 17 $1.6 billion Total Deposits (6/30/15) Deposits by Type Cost of Deposits 0.47% 0.45% 0.40% 0.36% 0.34% 0.34% 0.32% 0.31% 0.32% 6/30/139/30/1312/31/133/31/146/30/149/30/1412/31/143/30/156/30/15Non-interest Bearing Demand$515 32%Interest Bearing Demand$132 8%Money market Accounts$496 31%Savings Accounts$36 2%Time Deposits $100,000 or More$233 14%Other Time Deposits$213 13%Dollars in millions.
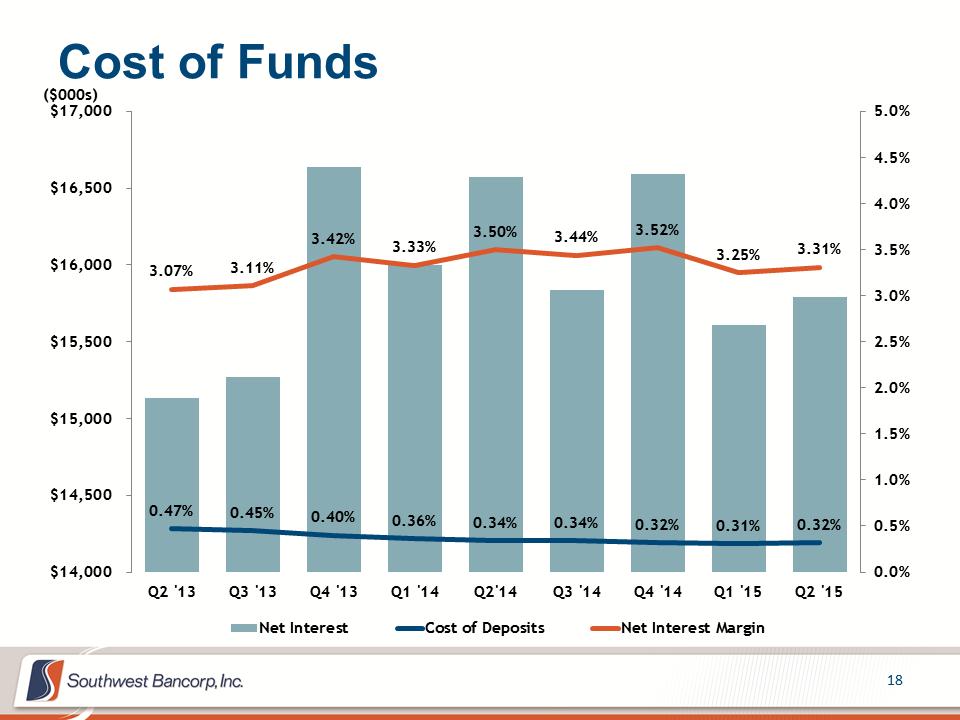 Cost of Funds 18 0.47% 0.45% 0.40% 0.36% 0.34% 0.34% 0.32% 0.31% 0.32% 3.07% 3.11% 3.42% 3.33% 3.50% 3.44% 3.52% 3.25% 3.31% 0.0%0.5%1.0%1.5%2.0%2.5%3.0%3.5%4.0%4.5%5.0% $14,000 $14,500 $15,000 $15,500 $16,000 $16,500 $17,000Q2 '13Q3 '13Q4 '13Q1 '14Q2'14Q3 '14Q4 '14Q1 '15Q2 '15($000s) Net InterestCost of DepositsNet Interest Margin
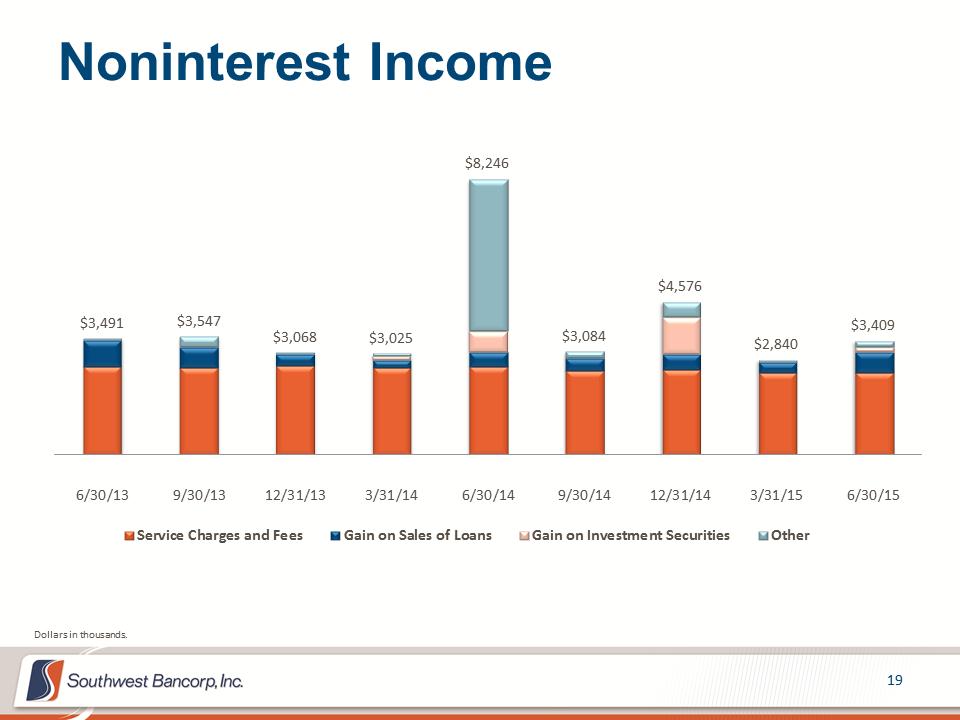 Noninterest Income 19 $3,491 $3,547 $3,068 $3,025 $8,246 $3,084 $4,576 $2,840 $3,409 6/30/139/30/1312/31/133/31/146/30/149/30/1412/31/143/31/156/30/15Service Charges and FeesGain on Sales of LoansGain on Investment SecuritiesOtherDollars in thousands.
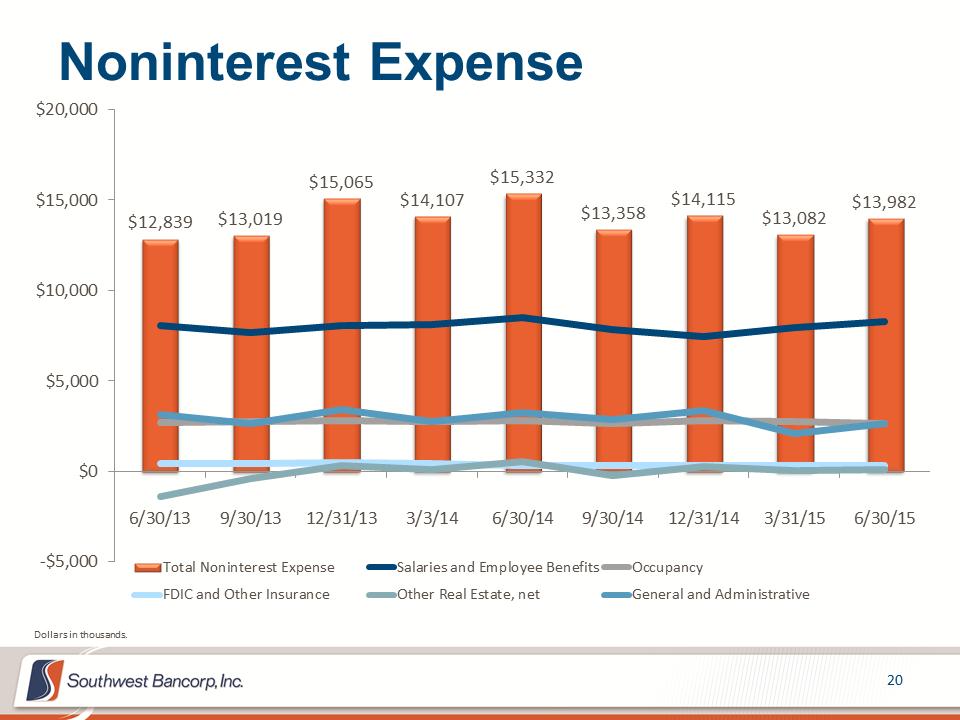 $12,839 $13,019 $15,065 $14,107 $15,332 $13,358 $14,115 $13,082 $13,982 -$5,000$0$5,000$10,000$15,000$20,0006/30/139/30/1312/31/133/3/146/30/149/30/1412/31/143/31/156/30/15Total Noninterest ExpenseSalaries and Employee BenefitsOccupancyFDIC and Other InsuranceOther Real Estate, netGeneral and AdministrativeNoninterest Expense 20 Dollars in thousands.
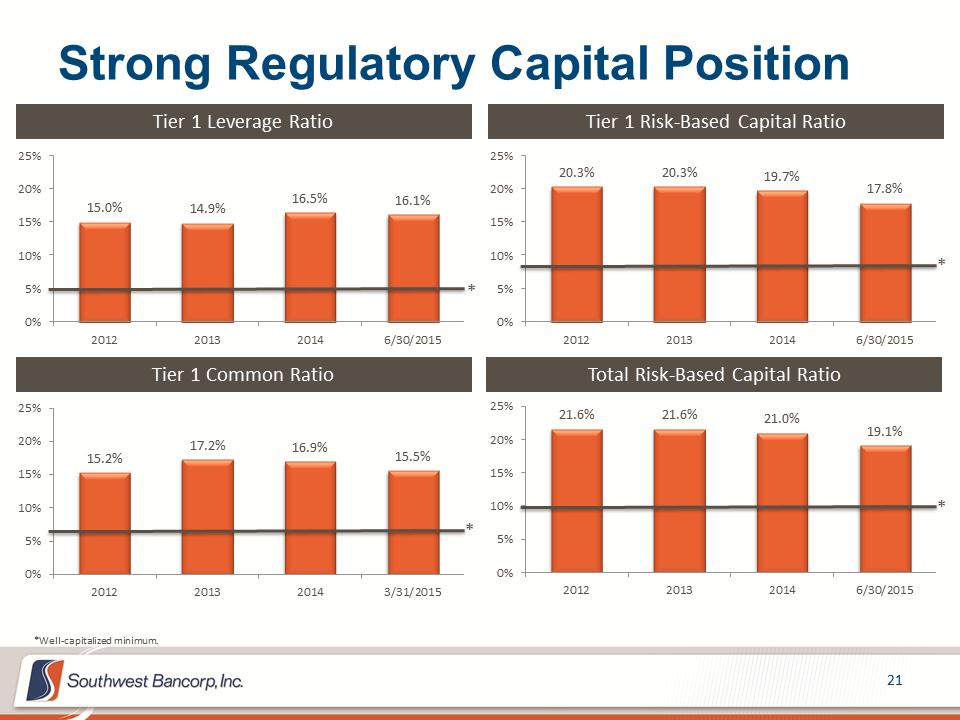 Strong Regulatory Capital Position 21 20.3% 20.3% 19.7% 17.8% 0%5%10%15%20%25%2012201320146/30/201515.0% 14.9% 16.5% 16.1% 0%5%10%15%20%25%2012201320146/30/2015Tier 1 Leverage Ratio Tier 1 Risk-Based Capital Ratio Total Risk-Based Capital Ratio Tier 1 Common Ratio 15.2% 17.2% 16.9% 15.5% 0%5%10%15%20%25%2012201320143/31/2015* * * * *Well-capitalized minimum. 21.6% 21.6% 21.0% 19.1% 0%5%10%15%20%25%2012201320146/30/2015
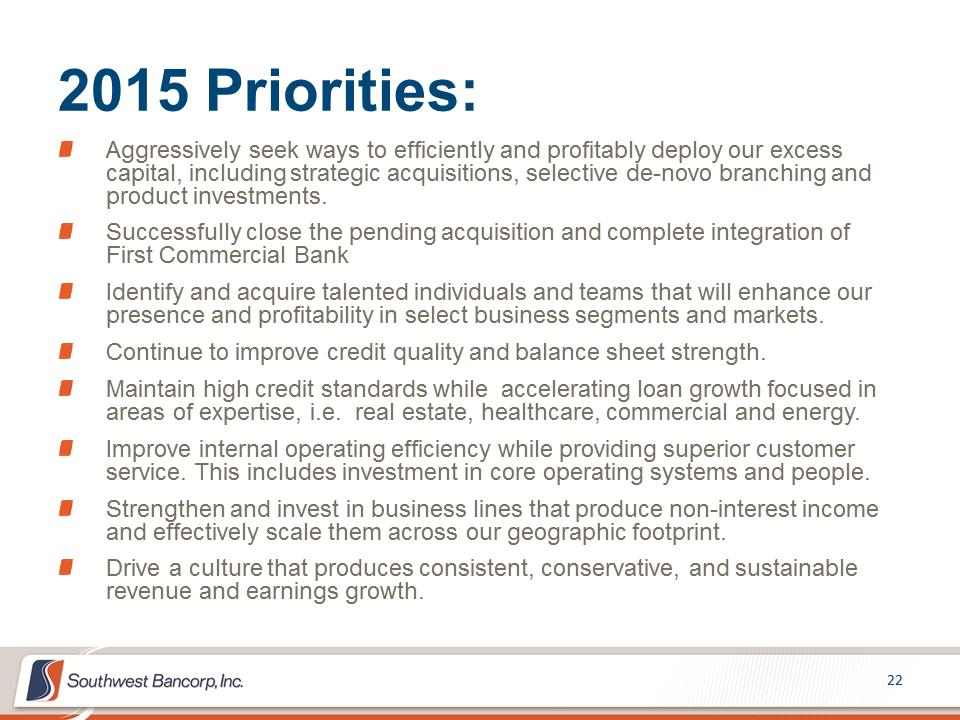 2015 Priorities: Aggressively seek ways to efficiently and profitably deploy our excess capital, including strategic acquisitions, selective de-novo branching and product investments. Successfully close the pending acquisition and complete integration of First Commercial Bank. Identify and acquire talented individuals and teams that will enhance our presence and profitability in select business segments and markets. Continue to improve credit quality and balance sheet strength. Maintain high credit standards while accelerating loan growth focused in areas of expertise, i.e. real estate, healthcare, commercial and energy. Improve internal operating efficiency while providing superior customer service. This includes investment in core operating systems and people. Strengthen and invest in business lines that produce non-interest income and effectively scale them across our geographic footprint. Drive a culture that produces consistent, conservative, and sustainable revenue and earnings growth. 22
 ADDITIONAL FINANCIAL INFORMATION 23
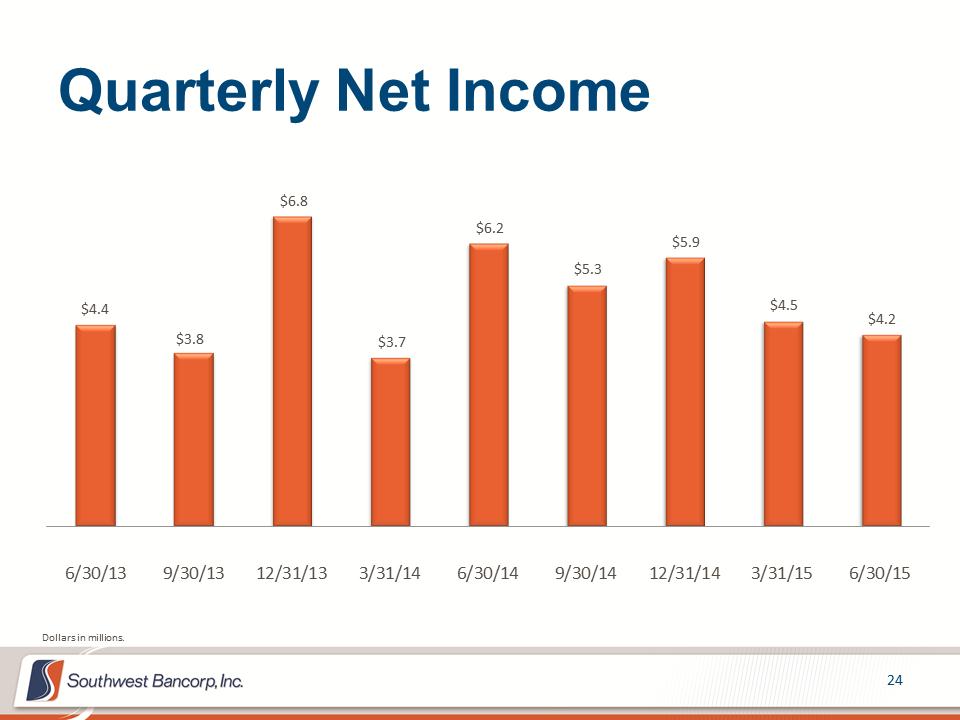 Quarterly Net Income 24 $4.4 $3.8 $6.8 $3.7 $6.2 $5.3 $5.9 $4.5 $4.2 6/30/139/30/1312/31/133/31/146/30/149/30/1412/31/143/31/156/30/15Dollars in millions.
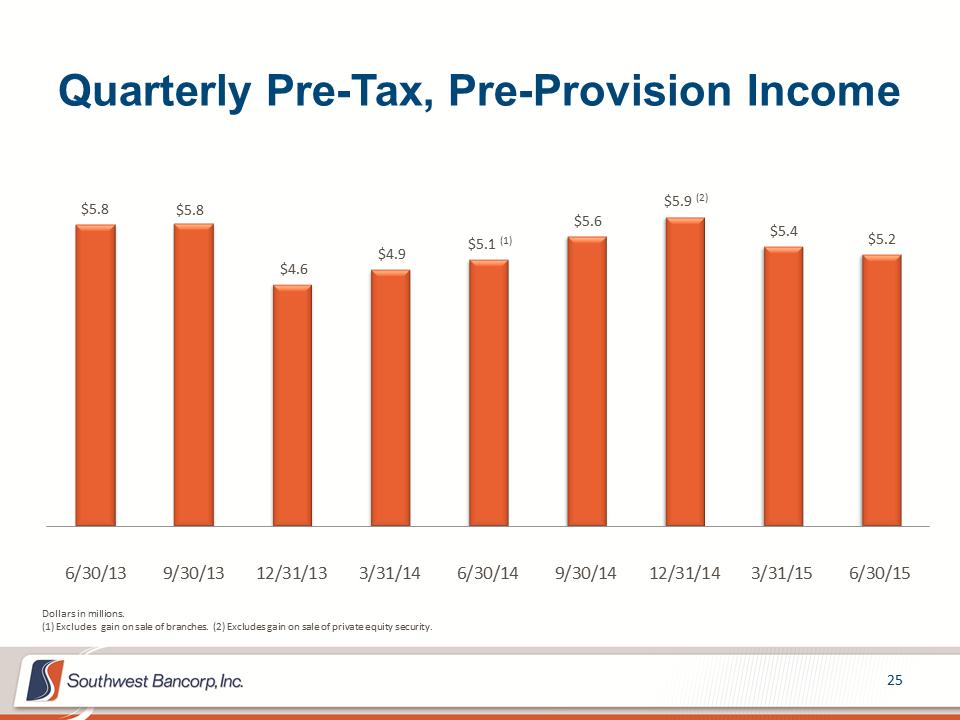 Quarterly Pre-Tax, Pre-Provision Income 25 $5.8 $5.8 $4.6 $4.9 $5.1 (1) $5.6 $5.9 (2) $5.4 $5.2 6/30/139/30/1312/31/133/31/146/30/149/30/1412/31/143/31/156/30/15Dollars in millions. (1) Excludes gain on sale of branches. (2) Excludes gain on sale of private equity security.
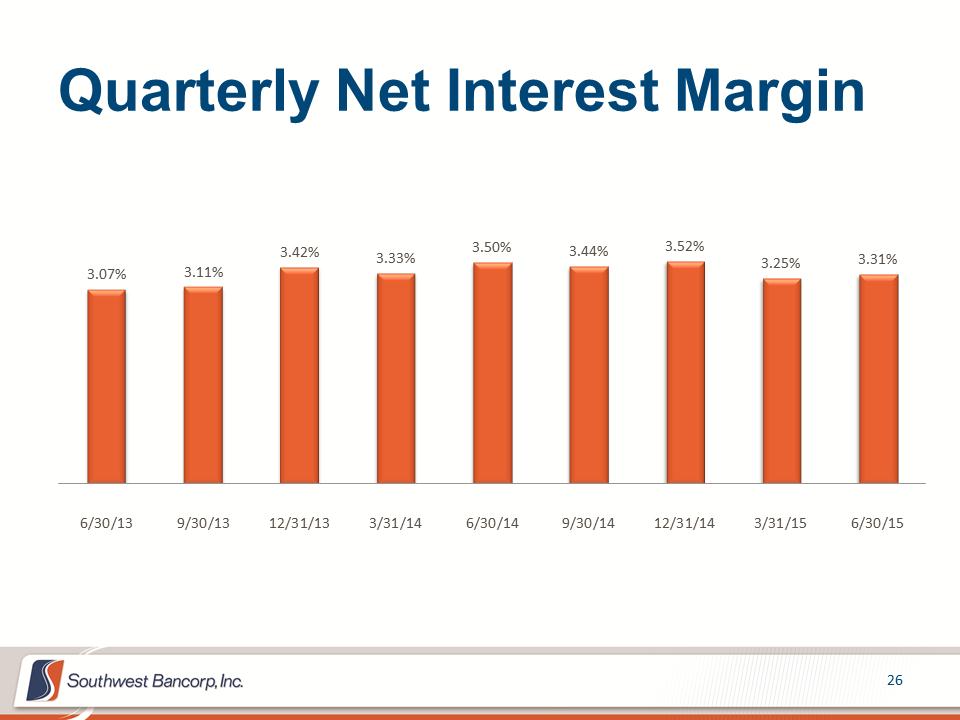 Quarterly Net Interest Margin 26 3.07% 3.11% 3.42% 3.33% 3.50% 3.44% 3.52% 3.25% 3.31% 6/30/139/30/1312/31/133/31/146/30/149/30/1412/31/143/31/156/30/15
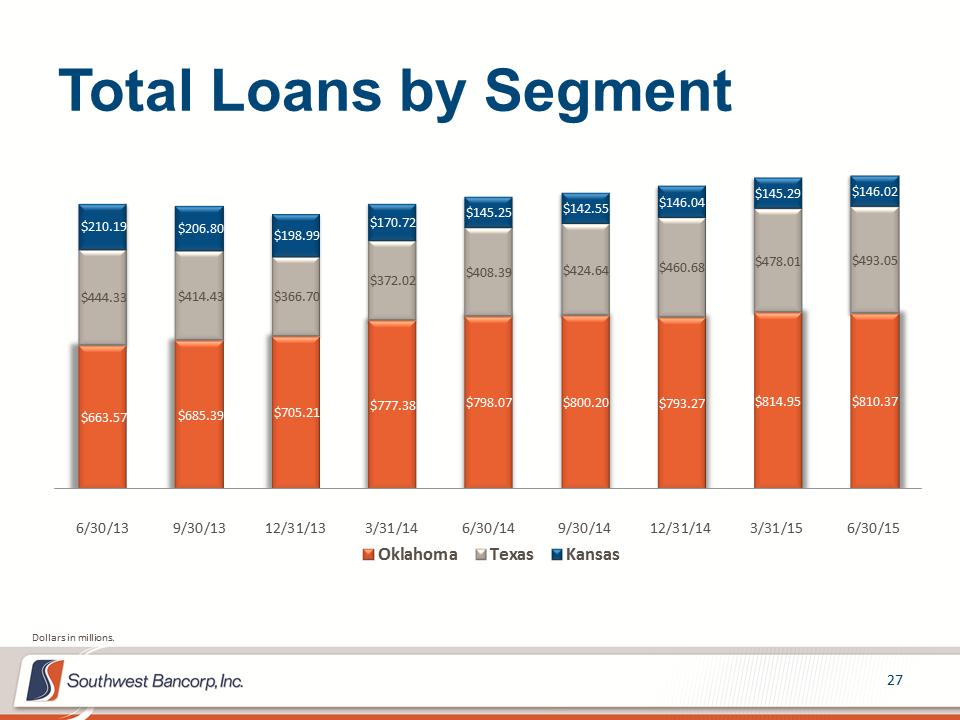 Total Loans by Segment 27 $663.57 $685.39 $705.21 $777.38 $798.07 $800.20 $793.27 $814.95 $810.37 $444.33 $414.43 $366.70 $372.02 $408.39 $424.64 $460.68 $478.01 $493.05 $210.19 $206.80 $198.99 $170.72 $145.25 $142.55 $146.04 $145.29 $146.02 6/30/139/30/1312/31/133/31/146/30/149/30/1412/31/143/31/156/30/15OklahomaTexasKansasDollars in millions.
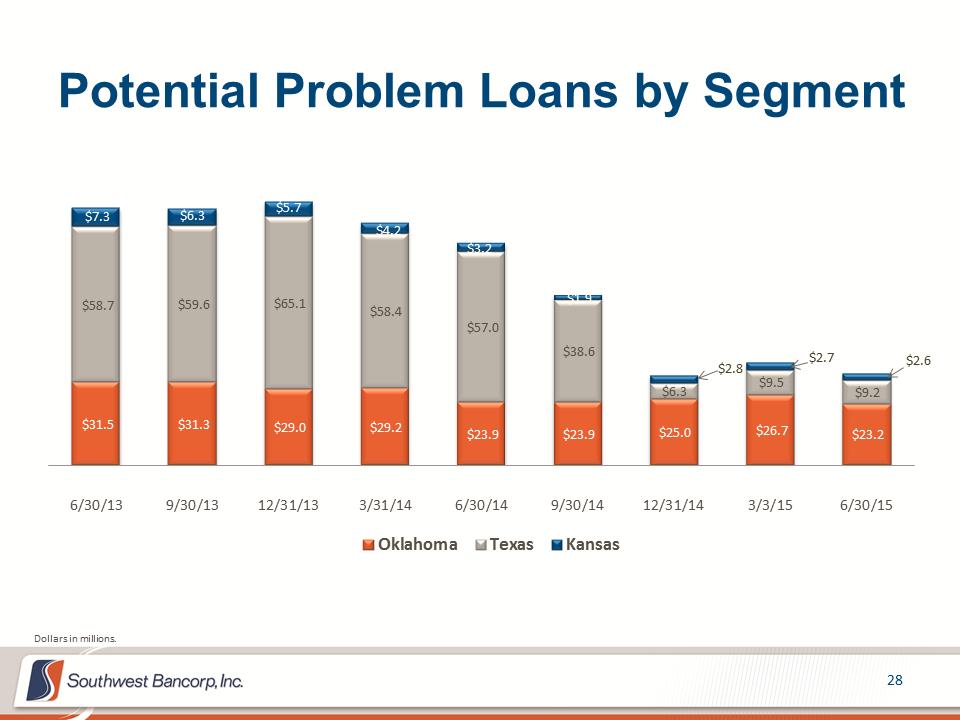 Potential Problem Loans by Segment 28 $31.5 $31.3 $29.0 $29.2 $23.9 $23.9 $25.0 $26.7 $23.2 $58.7 $59.6 $65.1 $58.4 $57.0 $38.6 $6.3 $9.5 $9.2 $7.3 $6.3 $5.7 $4.2 $3.2 $1.9 $2.8 $2.7 $2.6 6/30/139/30/1312/31/133/31/146/30/149/30/1412/31/143/3/156/30/15OklahomaTexasKansasDollars in millions.
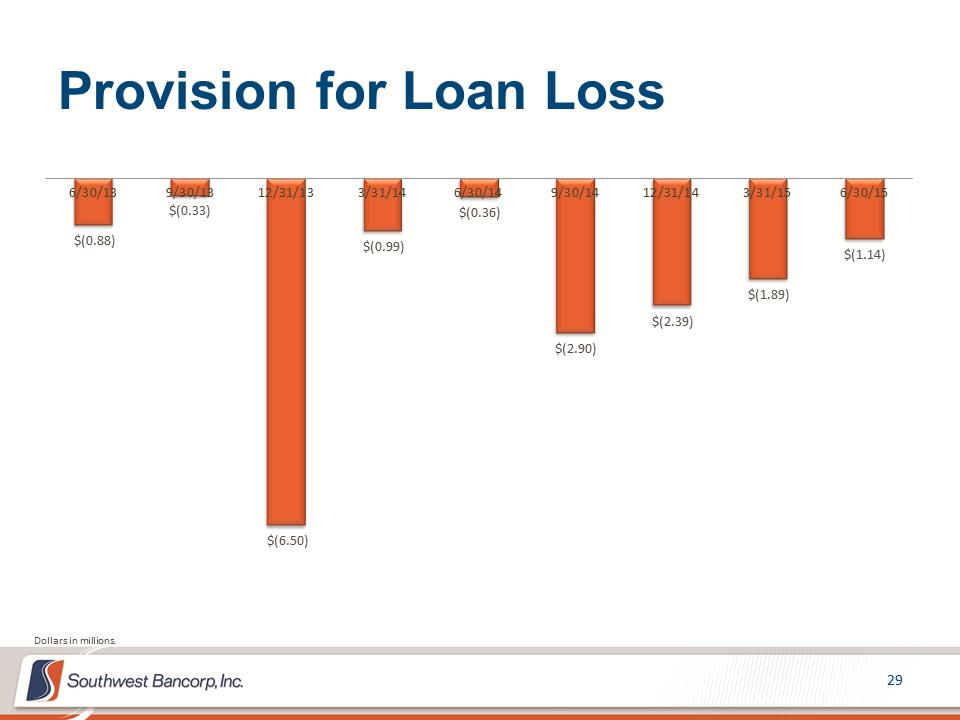 Provision for Loan Loss 29 $(0.88) $(0.33) $(6.50) $(0.99) $(0.36) $(2.90) $(2.39) $(1.89) $(1.14) 6/30/139/30/1312/31/133/31/146/30/149/30/1412/31/143/31/156/30/15Dollars in millions.
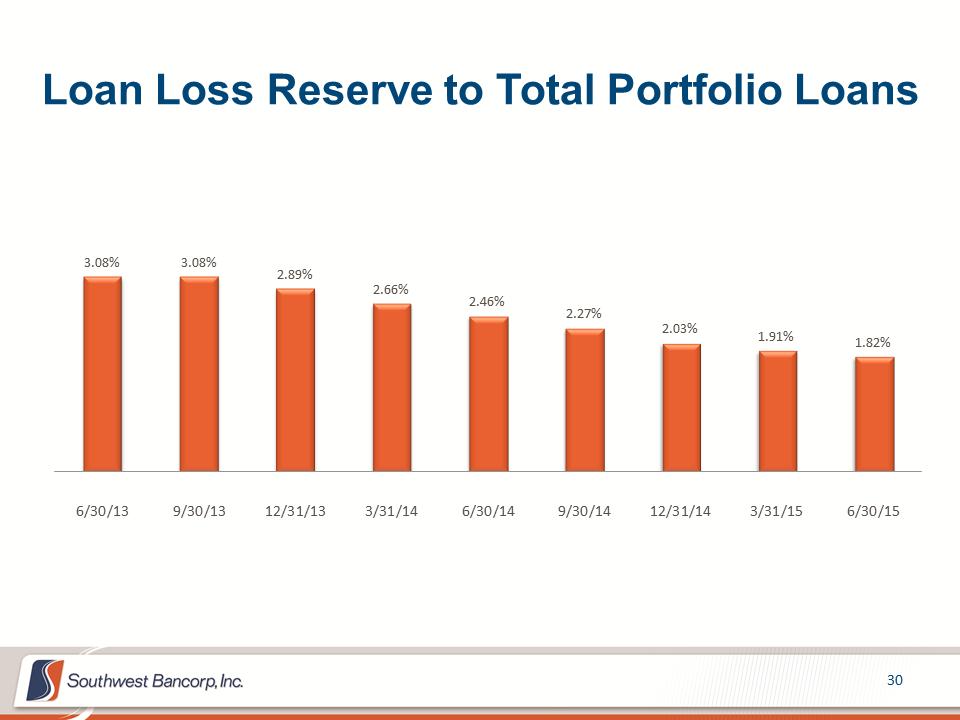 Loan Loss Reserve to Total Portfolio Loans 30 3.08% 3.08% 2.89% 2.66% 2.46% 2.27% 2.03% 1.91% 1.82% 6/30/139/30/1312/31/133/31/146/30/149/30/1412/31/143/31/156/30/15
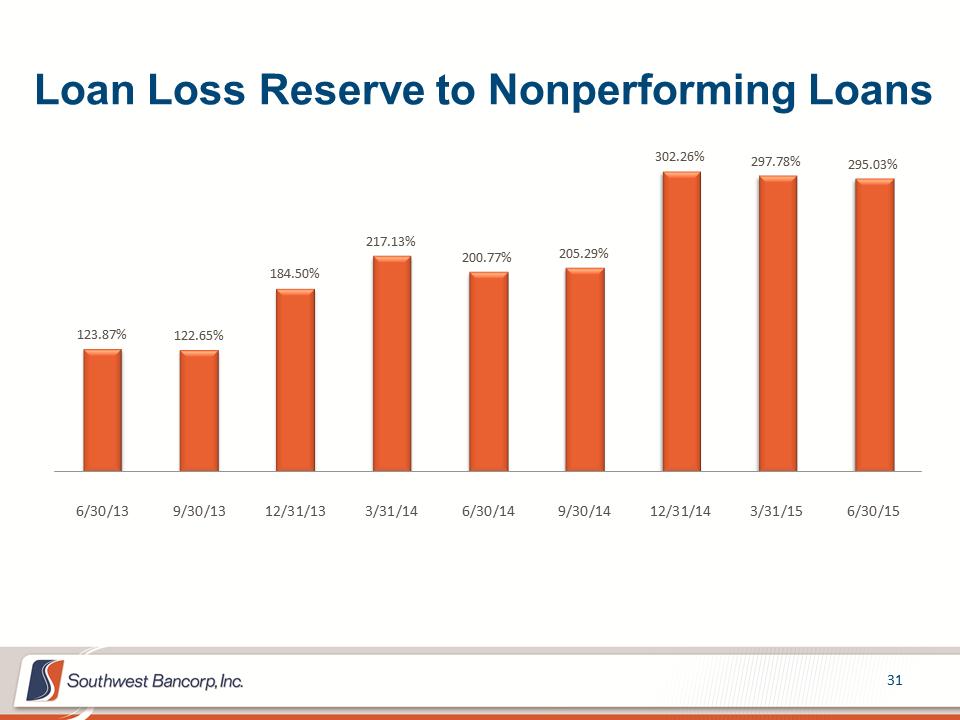 Loan Loss Reserve to Nonperforming Loans 31 123.87% 122.65% 184.50% 217.13% 200.77% 205.29% 302.26% 297.78% 295.03% 6/30/139/30/1312/31/133/31/146/30/149/30/1412/31/143/31/156/30/15
 APPENDIX 32
 The subsequent tables present non-GAAP reconciliations of the following calculations: –Tangible Common Equity (TCE) to Tangible Assets (TA) ratio –Tangible Book Value per Share –Pre-tax, Pre-provision Income 33
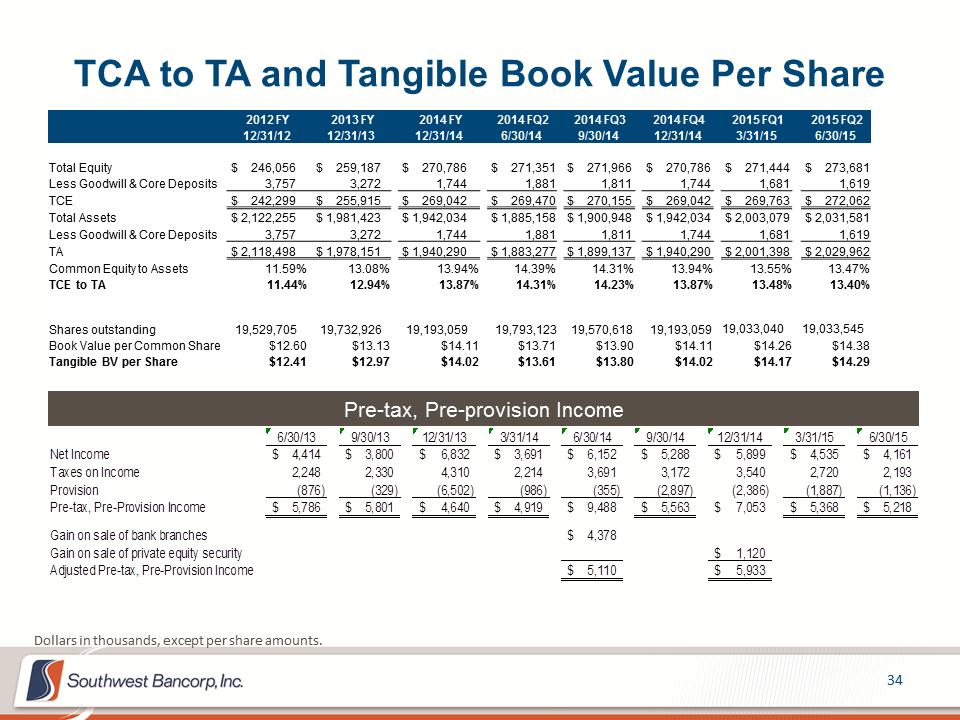 TCA to TA and Tangible Book Value Per Share 34 Dollars in thousands, except per share amounts. Pre-tax, Pre-provision Income 2012 FY 2013 FY 2014 FY 2014 FQ2 2014 FQ3 2014 FQ4 2015 FQ1 2015 FQ2 12/31/12 12/31/13 12/31/14 6/30/14 9/30/14 12/31/14 3/31/15 6/30/15 Total Equity $ 246,056 $ 259,187 $ 270,786 $ 271,351 $ 271,966 $ 270,786 $ 271,444 $ 273,681 Less Goodwill & Core Deposits 3,757 3,272 1,744 1,881 1,811 1,744 1,681 1,619 TCE $ 242,299 $ 255,915 $ 269,042 $ 269,470 $ 270,155 $ 269,042 $ 269,763 $ 272,062 Total Assets $ 2,122,255 $ 1,981,423 $ 1,942,034 $ 1,885,158 $ 1,900,948 $ 1,942,034 $ 2,003,079 $ 2,031,581 Less Goodwill & Core Deposits 3,757 3,272 1,744 1,881 1,811 1,744 1,681 1,619 TA $ 2,118,498 $ 1,978,151 $ 1,940,290 $ 1,883,277 $ 1,899,137 $ 1,940,290 $ 2,001,398 $ 2,029,962 Common Equity to Assets 11.59% 13.08% 13.94% 14.39% 14.31% 13.94% 13.55% 13.47% TCE to TA 11.44% 12.94% 13.87% 14.31% 14.23% 13.87% 13.48% 13.40% Shares outstanding 19,529,705 19,732,926 19,193,059 19,793,123 19,570,618 19,193,059 19,033,040 19,033,545 Book Value per Common Share $12.60 $13.13 $14.11 $13.71 $13.90 $14.11 $14.26 $14.38 Tangible BV per Share $12.41 $12.97 $14.02 $13.61 $13.80 $14.02 $14.17 $14.29 6/30/139/30/1312/31/133/31/146/30/149/30/1412/31/143/31/156/30/15Net Income4,414$ 3,800$ 6,832$ 3,691$ 6,152$ 5,288$ 5,899$ 4,535$ 4,161$ Taxes on Income2,248 2,330 4,310 2,214 3,691 3,172 3,540 2,720 2,193 Provision(876) (329) (6,502) (986) (355) (2,897) (2,386) (1,887) (1,136) Pre-tax, Pre-Provision Income5,786$ 5,801$ 4,640$ 4,919$ 9,488$ 5,563$ 7,053$ 5,368$ 5,218$ Gain on sale of bank branches4,378$ Gain on sale of private equity security1,120$ Adjusted Pre-tax, Pre-Provision Income5,110$ 5,933$
 2015 Second Quarter Earnings Presentation July 22, 2015 NASDAQ: OKSB