Attached files
| file | filename |
|---|---|
| 8-K - 8-K - MANHATTAN ASSOCIATES INC | manh-8k_20150721.htm |
Exhibit 99.1
|
|

|
Contact: |
|
Dennis Story |
|
Cameron Smith |
|
|
|
Chief Financial Officer |
|
Director, Corporate Communications |
|
|
|
Manhattan Associates, Inc. |
|
Manhattan Associates, Inc. |
|
|
|
770-955-7070 |
|
678-597-6841 |
|
|
|
dstory@manh.com |
|
camsmith@manh.com |
Manhattan Associates Reports Record Second Quarter 2015 Performance
Company raises full-year revenue and EPS guidance
ATLANTA – July 21, 2015 – Leading Supply Chain Commerce Solutions provider Manhattan Associates, Inc. (NASDAQ: MANH) today reported record non-GAAP adjusted diluted earnings per share for the second quarter ended June 30, 2015 of $0.37 compared to $0.29 in Q2 2014, on license revenue of $19.8 million and record total revenue of $139.1 million. GAAP diluted earnings per share for Q2 2015 was a record $0.35 compared to $0.27 in Q2 2014.
“We are very pleased with our financial performance in Q2 and the first half of 2015. We continue to execute well serving our customers and investing in commerce enablement from supply chain to point of sale,” said Eddie Capel, Manhattan Associates president and CEO. “Demand for our omni-channel, store and distribution management solutions is strong as we continue to lead with product innovation to enhance our market leadership position throughout 2015 and beyond.”
SECOND QUARTER 2015 FINANCIAL SUMMARY:
|
· |
Adjusted diluted earnings per share, a non-GAAP measure, was $0.37 in Q2 2015, compared to $0.29 in Q2 2014. |
|
· |
GAAP diluted earnings per share was $0.35 in Q2 2015, compared to $0.27 in Q2 2014. |
|
· |
Consolidated total revenue was $139.1 million in Q2 2015, compared to $122.5 million in Q2 2014. License revenue was $19.8 million in Q2 2015, compared to $18.0 million in Q2 2014. |
|
|

|
|
|
· |
Adjusted operating income, a non-GAAP measure, was $44.1 million in Q2 2015, compared to $34.9 million in Q2 2014. |
|
· |
GAAP operating income was $41.4 million in Q2 2015, compared to $32.5 million in Q2 2014. |
|
· |
Cash flow from operations was $27.5 million in Q2 2015, compared to $1.9 million in Q2 2014. Days Sales Outstanding was 54 days at June 30, 2015, compared to 56 days at March 31, 2015. |
|
· |
Cash and investments was $108.4 million at June 30, 2015, compared to $107.2 million at March 31, 2015. |
|
· |
During the three months ended June 30, 2015, the Company repurchased 458,397 shares of Manhattan Associates common stock under the share repurchase program authorized by the Board of Directors, for a total investment of $25.2 million. In July 2015, the Board of Directors approved raising the Company's share repurchase authority to an aggregate of $50.0 million of the Company’s outstanding common stock. |
SIX MONTH 2015 FINANCIAL SUMMARY:
|
· |
Adjusted diluted earnings per share, a non-GAAP measure, was $0.71 for the six months ended June 30, 2015, compared to $0.55 for the six months ended June 30, 2014. |
|
· |
GAAP diluted earnings per share for the six months ended June 30, 2015 was $0.66, compared to $0.51 for the six months ended June 30, 2014. |
|
· |
Consolidated revenue for the six months ended June 30, 2015 was $272.6 million, compared to $236.1 million for the six months ended June 30, 2014. License revenue was $39.1 million for the six months ended June 30, 2015, compared to $35.1 million for the six months ended June 30, 2014. |
|
|
|
|
|
· |
Adjusted operating income, a non-GAAP measure, was $84.2 million for the six months ended June 30, 2015, compared to $67.2 million for the six months ended June 30, 2014. |
|
· |
GAAP operating income was $78.2 million for the six months ended June 30, 2015, compared to $62.6 million for the six months ended June 30, 2014. |
|
· |
Cash flow from operations was $42.7 million in the six months ended June 30, 2015, compared to $21.0 million in the six months ended June 30, 2014. |
|
· |
During the six months ended June 30, 2015, the Company repurchased 982,060 shares of Manhattan Associates common stock under the share repurchase program authorized by the Board of Directors, for a total investment of $51.5 million. |
SALES ACHIEVEMENTS:
|
· |
Recognized license revenue on four contracts of $1.0 million or more during Q2 2015. |
|
· |
Completed software license wins with new customers such as: Banaja Holdings, Costa Del Mar, Gold City Footwear, Grupo Exito, Hy-Vee, IEH (Auto Parts Plus), M&D Wholesale Distributors, M Block and Sons, Order Nordic, PT Lion Super Indo, Stew Leonard’s Holdings, Tarsus Technology Group, Thirty One Gifts. |
|
· |
Expanded relationships with existing customers such as: Amplifier, Arcadia Group, Avery Dennison, Belk, Best Buy, Cdiscount, Cheney Brothers, Eileen Fisher, Exel, Five Below, Forever Direct, Groupe Dynamite, Guthy-Renker, Kane Warehousing, L Brands, Legacy Supply Chain Services, Maggy London International, Northern Safety, PVH Corp, Rite Aid, SamsonOpt, Schneider Electric, Speed Global Services, STD Petrovich, Thomas Cook Airlines, Toys “R” Us, Wolverine Worldwide. |
|
|
|
|
2015 GUIDANCE
Manhattan Associates provides the following updated revenue and diluted earnings per share guidance for the full year 2015:
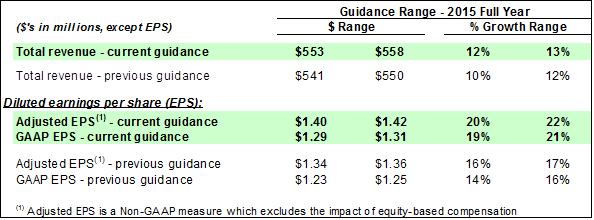
Manhattan Associates currently intends to publish, in each quarterly earnings release, certain expectations with respect to future financial performance. Those statements, including the guidance provided above, are forward looking. Actual results may differ materially, especially in the current uncertain economic environment. Those statements, including the guidance provided above, do not reflect the potential impact of mergers, acquisitions or other business combinations that may be completed after the date of the release.
Manhattan Associates will make its earnings release and published expectations available on its website (www.manh.com). Beginning the close of business on September 15, 2015, Manhattan Associates will observe a “Quiet Period” during which Manhattan Associates and its representatives will not comment concerning previously published financial expectations. Prior to the start of the Quiet Period, the public can continue to rely on the expectations published in this 2015 Guidance section as being Manhattan Associates’ current expectation on matters covered, unless Manhattan Associates publishes a notice stating otherwise. During the Quiet Period, previously published expectations should be considered historical only, speaking only as of or prior to the Quiet Period, and Manhattan Associates disclaims any obligation to update any previously published financial expectations during the Quiet Period. The Quiet Period will extend until publication of Manhattan Associates’ next quarterly earnings release, currently scheduled for the third full week of October 2015.
|
|
|
|
The Company’s conference call regarding its second quarter financial results will be held today, July 21, 2015, at 4:30 p.m. Eastern Daylight Time. Investors are invited to listen to a live webcast of the conference call through the investor relations section of Manhattan Associates' website at www.manh.com. To listen to the live webcast, please go to the website at least 15 minutes before the call to download and install any necessary audio software.
For those who cannot listen to the live broadcast, a replay can be accessed shortly after the call by dialing +1.855.859.2056 in the U.S. and Canada, or +1.404.537.3406 outside the U.S., and entering the conference identification number 69706218 or via the web www.manh.com. The phone replay will be available for two weeks after the call, and the Internet webcast will be available until Manhattan Associates’ third quarter 2015 earnings release.
GAAP VERSUS NON-GAAP PRESENTATION
The Company provides adjusted operating income, adjusted net income and adjusted diluted earnings per share in this press release as additional information regarding the Company’s operating results. These measures are not in accordance with – or an alternative to – GAAP, and may be different from non-GAAP operating income, non-GAAP net income and non-GAAP earnings per share measures used by other companies. The Company believes that the presentation of these non-GAAP financial measures facilitates investors’ ability to understand and compare the Company’s results and guidance, because the measures provide important supplemental information in evaluating the operating results of its business, as distinct from results that include items that are not indicative of ongoing operating results, and because the Company’s competitors and peers typically publish similar non-GAAP measures. This release should be read in conjunction with the Company’s Form 8-K earnings release filing for the quarter and six months ended June 30, 2015.
Non-GAAP adjusted operating income, adjusted net income and adjusted diluted earnings per share exclude the impact of equity-based compensation and acquisition-related costs and the amortization thereof – all net of income tax effects. Reconciliations of the Company’s GAAP
|
|
|
|
financial measures to non-GAAP adjustments are included in the supplemental information attached to this release.
ABOUT MANHATTAN ASSOCIATES
Manhattan Associates makes commerce-ready supply chains that bring all points of commerce together so you’re ready to sell and ready to execute. Across the store, through your network or from your fulfillment center, we design, build and deliver market-leading solutions that support both top-line growth and bottom-line profitability. By converging front-end sales with back-end supply chain execution, our software, platform technology and unmatched experience help our customers get commerce ready—and ready to reap the rewards of the omni-channel marketplace. For more information, please visit www.manh.com.
This press release contains “forward-looking statements” relating to Manhattan Associates, Inc. Forward-looking statements in this press release include the information set forth under “2015 Guidance.” Prospective investors are cautioned that any such forward-looking statements are not guarantees of future performance and involve risks and uncertainties, and that actual results may differ materially from those contemplated by such forward-looking statements. Among the important factors that could cause actual results to differ materially from those indicated by such forward-looking statements are: uncertainty about the global economy, delays in product development, competitive pressures, software errors, information security breaches and the additional risk factors set forth in Item 1A of the Company’s Annual Report on Form 10-K for the year ended December 31, 2014. Manhattan Associates undertakes no obligation to update or revise forward-looking statements to reflect changed assumptions, the occurrence of unanticipated events or changes in future operating results.
###
|
|
MANHATTAN ASSOCIATES, INC. AND SUBSIDIARIES
Condensed Consolidated Statements of Income
(in thousands, except per share amounts)
|
|
|
Three Months Ended June 30, |
|
|
Six Months Ended June 30, |
|
||||||||||
|
|
|
2015 |
|
|
2014 |
|
|
2015 |
|
|
2014 |
|
||||
|
|
|
(unaudited) |
|
|
(unaudited) |
|
|
(unaudited) |
|
|
(unaudited) |
|
||||
|
Revenue: |
|
|
|
|
|
|
|
|
|
|
|
|
|
|
|
|
|
Software license |
|
$ |
19,758 |
|
|
$ |
17,989 |
|
|
$ |
39,072 |
|
|
$ |
35,096 |
|
|
Services |
|
|
107,344 |
|
|
|
93,519 |
|
|
|
208,547 |
|
|
|
180,432 |
|
|
Hardware and other |
|
|
12,007 |
|
|
|
11,022 |
|
|
|
25,013 |
|
|
|
20,565 |
|
|
Total revenue |
|
|
139,109 |
|
|
|
122,530 |
|
|
|
272,632 |
|
|
|
236,093 |
|
|
Costs and expenses: |
|
|
|
|
|
|
|
|
|
|
|
|
|
|
|
|
|
Cost of license |
|
|
2,137 |
|
|
|
1,848 |
|
|
|
5,043 |
|
|
|
3,461 |
|
|
Cost of services |
|
|
46,464 |
|
|
|
41,457 |
|
|
|
91,248 |
|
|
|
79,917 |
|
|
Cost of hardware and other |
|
|
10,163 |
|
|
|
9,265 |
|
|
|
20,710 |
|
|
|
16,744 |
|
|
Research and development |
|
|
13,257 |
|
|
|
11,867 |
|
|
|
26,813 |
|
|
|
23,670 |
|
|
Sales and marketing |
|
|
11,889 |
|
|
|
12,848 |
|
|
|
23,736 |
|
|
|
24,868 |
|
|
General and administrative |
|
|
11,927 |
|
|
|
11,256 |
|
|
|
23,165 |
|
|
|
21,905 |
|
|
Depreciation and amortization |
|
|
1,898 |
|
|
|
1,489 |
|
|
|
3,679 |
|
|
|
2,977 |
|
|
Total costs and expenses |
|
|
97,735 |
|
|
|
90,030 |
|
|
|
194,394 |
|
|
|
173,542 |
|
|
Operating income |
|
|
41,374 |
|
|
|
32,500 |
|
|
|
78,238 |
|
|
|
62,551 |
|
|
Other income, net |
|
|
359 |
|
|
|
312 |
|
|
|
621 |
|
|
|
79 |
|
|
Income before income taxes |
|
|
41,733 |
|
|
|
32,812 |
|
|
|
78,859 |
|
|
|
62,630 |
|
|
Income tax provision |
|
|
15,729 |
|
|
|
12,218 |
|
|
|
29,651 |
|
|
|
23,324 |
|
|
Net income |
|
$ |
26,004 |
|
|
$ |
20,594 |
|
|
$ |
49,208 |
|
|
$ |
39,306 |
|
|
|
|
|
|
|
|
|
|
|
|
|
|
|
|
|
|
|
|
Basic earnings per share |
|
$ |
0.35 |
|
|
$ |
0.27 |
|
|
$ |
0.67 |
|
|
$ |
0.52 |
|
|
Diluted earnings per share |
|
$ |
0.35 |
|
|
$ |
0.27 |
|
|
$ |
0.66 |
|
|
$ |
0.51 |
|
|
|
|
|
|
|
|
|
|
|
|
|
|
|
|
|
|
|
|
Weighted average number of shares: |
|
|
|
|
|
|
|
|
|
|
|
|
|
|
|
|
|
Basic |
|
|
73,618 |
|
|
|
75,274 |
|
|
|
73,797 |
|
|
|
75,544 |
|
|
Diluted |
|
|
74,126 |
|
|
|
76,037 |
|
|
|
74,366 |
|
|
|
76,415 |
|
MANHATTAN ASSOCIATES, INC. AND SUBSIDIARIES
Reconciliation of Selected GAAP to Non-GAAP Measures
(in thousands, except per share amounts)
|
|
|
Three Months Ended June 30, |
|
|
Six Months Ended June 30, |
|
||||||||||
|
|
|
2015 |
|
|
2014 |
|
|
2015 |
|
|
2014 |
|
||||
|
|
|
|
|
|
|
|
|
|
|
|
|
|
|
|
|
|
|
Operating income |
|
$ |
41,374 |
|
|
$ |
32,500 |
|
|
$ |
78,238 |
|
|
$ |
62,551 |
|
|
Equity-based compensation (a) |
|
|
2,661 |
|
|
|
2,396 |
|
|
|
5,739 |
|
|
|
4,670 |
|
|
Purchase amortization (b) |
|
|
106 |
|
|
|
- |
|
|
|
212 |
|
|
|
1 |
|
|
Adjusted operating income (Non-GAAP) |
|
$ |
44,141 |
|
|
$ |
34,896 |
|
|
$ |
84,189 |
|
|
$ |
67,222 |
|
|
|
|
|
|
|
|
|
|
|
|
|
|
|
|
|
|
|
|
|
|
|
|
|
|
|
|
|
|
|
|
|
|
|
|
|
|
Income tax provision |
|
$ |
15,729 |
|
|
$ |
12,218 |
|
|
$ |
29,651 |
|
|
$ |
23,324 |
|
|
Equity-based compensation (a) |
|
|
1,004 |
|
|
|
889 |
|
|
|
2,158 |
|
|
|
1,733 |
|
|
Purchase amortization (b) |
|
|
40 |
|
|
|
- |
|
|
|
80 |
|
|
|
- |
|
|
Adjusted income tax provision (Non-GAAP) |
|
$ |
16,773 |
|
|
$ |
13,107 |
|
|
$ |
31,889 |
|
|
$ |
25,057 |
|
|
|
|
|
|
|
|
|
|
|
|
|
|
|
|
|
|
|
|
|
|
|
|
|
|
|
|
|
|
|
|
|
|
|
|
|
|
Net income |
|
$ |
26,004 |
|
|
$ |
20,594 |
|
|
$ |
49,208 |
|
|
$ |
39,306 |
|
|
Equity-based compensation (a) |
|
|
1,657 |
|
|
|
1,507 |
|
|
|
3,581 |
|
|
|
2,937 |
|
|
Purchase amortization (b) |
|
|
66 |
|
|
|
- |
|
|
|
132 |
|
|
|
1 |
|
|
Adjusted net income (Non-GAAP) |
|
$ |
27,727 |
|
|
$ |
22,101 |
|
|
$ |
52,921 |
|
|
$ |
42,244 |
|
|
|
|
|
|
|
|
|
|
|
|
|
|
|
|
|
|
|
|
|
|
|
|
|
|
|
|
|
|
|
|
|
|
|
|
|
|
Diluted EPS |
|
$ |
0.35 |
|
|
$ |
0.27 |
|
|
$ |
0.66 |
|
|
$ |
0.51 |
|
|
Equity-based compensation (a) |
|
|
0.02 |
|
|
|
0.02 |
|
|
|
0.05 |
|
|
|
0.04 |
|
|
Purchase amortization (b) |
|
|
- |
|
|
|
- |
|
|
|
- |
|
|
|
- |
|
|
Adjusted diluted EPS (Non-GAAP) |
|
$ |
0.37 |
|
|
$ |
0.29 |
|
|
$ |
0.71 |
|
|
$ |
0.55 |
|
|
|
|
|
|
|
|
|
|
|
|
|
|
|
|
|
|
|
|
Fully diluted shares |
|
|
74,126 |
|
|
|
76,037 |
|
|
|
74,366 |
|
|
|
76,415 |
|
|
(a) |
Adjusted results exclude all equity-based compensation, to facilitate comparison with our competitors and peers and for the other reasons explained in our Current Report on Form 8-K filed with the SEC on the date hereof. Equity-based compensation is included in the following GAAP operating expense lines for the three and six months ended June 30, 2015 and 2014: |
|
|
|
Three Months Ended June 30, |
|
|
Six Months Ended June 30, |
|
||||||||||
|
|
|
2015 |
|
|
2014 |
|
|
2015 |
|
|
2014 |
|
||||
|
|
|
|
|
|
|
|
|
|
|
|
|
|
|
|
|
|
|
Cost of services |
|
$ |
729 |
|
|
$ |
477 |
|
|
$ |
1,520 |
|
|
$ |
847 |
|
|
Research and development |
|
|
464 |
|
|
|
342 |
|
|
|
928 |
|
|
|
759 |
|
|
Sales and marketing |
|
|
489 |
|
|
|
395 |
|
|
|
880 |
|
|
|
705 |
|
|
General and administrative |
|
|
979 |
|
|
|
1,182 |
|
|
|
2,411 |
|
|
|
2,359 |
|
|
Total equity-based compensation |
|
$ |
2,661 |
|
|
$ |
2,396 |
|
|
$ |
5,739 |
|
|
$ |
4,670 |
|
|
(b) |
Adjustments represent purchased intangibles amortization from prior acquisition. Such amortization is excluded from adjusted results to facilitate comparison with our competitors and peers, to facilitate comparisons of the results of our core operations from period to period and for the other reasons explained in our Current Report on Form 8-K filed with the SEC on the date hereof. |
MANHATTAN ASSOCIATES, INC. AND SUBSIDIARIES
Condensed Consolidated Balance Sheets
(in thousands, except share and per share data)
|
|
|
June 30, 2015 |
|
|
December 31, 2014 |
|
||
|
|
|
(unaudited) |
|
|
|
|
|
|
|
ASSETS |
|
|
|
|
|
|
|
|
|
Current Assets: |
|
|
|
|
|
|
|
|
|
Cash and cash equivalents |
|
$ |
100,156 |
|
|
$ |
115,708 |
|
|
Short-term investments |
|
|
8,243 |
|
|
|
8,730 |
|
|
Accounts receivable, net of allowance of $8,222 and $4,164, respectively |
|
|
82,937 |
|
|
|
86,828 |
|
|
Deferred income taxes |
|
|
9,882 |
|
|
|
9,900 |
|
|
Prepaid expenses and other current assets |
|
|
9,451 |
|
|
|
8,695 |
|
|
Total current assets |
|
|
210,669 |
|
|
|
229,861 |
|
|
|
|
|
|
|
|
|
|
|
|
Property and equipment, net |
|
|
19,569 |
|
|
|
17,265 |
|
|
Goodwill, net |
|
|
62,235 |
|
|
|
62,250 |
|
|
Deferred income taxes |
|
|
270 |
|
|
|
270 |
|
|
Other assets |
|
|
7,559 |
|
|
|
8,524 |
|
|
Total assets |
|
$ |
300,302 |
|
|
$ |
318,170 |
|
|
|
|
|
|
|
|
|
|
|
|
LIABILITIES AND SHAREHOLDERS' EQUITY |
|
|
|
|
|
|
|
|
|
Current liabilities: |
|
|
|
|
|
|
|
|
|
Accounts payable |
|
$ |
9,357 |
|
|
$ |
12,483 |
|
|
Accrued compensation and benefits |
|
|
21,717 |
|
|
|
30,889 |
|
|
Accrued and other liabilities |
|
|
11,840 |
|
|
|
12,501 |
|
|
Deferred revenue |
|
|
57,400 |
|
|
|
58,968 |
|
|
Income taxes payable |
|
|
2,542 |
|
|
|
7,974 |
|
|
Total current liabilities |
|
|
102,856 |
|
|
|
122,815 |
|
|
|
|
|
|
|
|
|
|
|
|
Other non-current liabilities |
|
|
13,550 |
|
|
|
13,332 |
|
|
|
|
|
|
|
|
|
|
|
|
Shareholders' equity: |
|
|
|
|
|
|
|
|
|
Preferred stock, no par value; 20,000,000 shares authorized, no shares issued or outstanding in 2015 and 2014 |
|
|
- |
|
|
|
- |
|
|
Common stock, $0.01 par value; 200,000,000 shares authorized; 73,423,899 and 74,104,064 shares issued and outstanding at June 30, 2015 and December 31, 2014, respectively |
|
|
734 |
|
|
|
741 |
|
|
Retained earnings |
|
|
193,312 |
|
|
|
191,305 |
|
|
Accumulated other comprehensive loss |
|
|
(10,150 |
) |
|
|
(10,023 |
) |
|
Total shareholders' equity |
|
|
183,896 |
|
|
|
182,023 |
|
|
Total liabilities and shareholders' equity |
|
$ |
300,302 |
|
|
$ |
318,170 |
|
MANHATTAN ASSOCIATES, INC. AND SUBSIDIARIES
Condensed Consolidated Statements of Cash Flows
(in thousands)
|
|
|
Six Months Ended June 30, |
|
|||||
|
|
|
2015 |
|
|
2014 |
|
||
|
|
|
(unaudited) |
|
|
(unaudited) |
|
||
|
Operating activities: |
|
|
|
|
|
|
|
|
|
Net income |
|
$ |
49,208 |
|
|
$ |
39,306 |
|
|
Adjustments to reconcile net income to net cash provided by operating activities: |
|
|
|
|
|
|
|
|
|
Depreciation and amortization |
|
|
3,679 |
|
|
|
2,977 |
|
|
Equity-based compensation |
|
|
5,739 |
|
|
|
4,670 |
|
|
Gain on disposal of equipment |
|
|
(38 |
) |
|
|
(15 |
) |
|
Tax benefit of stock awards exercised/vested |
|
|
7,848 |
|
|
|
6,954 |
|
|
Excess tax benefits from equity-based compensation |
|
|
(7,825 |
) |
|
|
(6,916 |
) |
|
Deferred income taxes |
|
|
1,216 |
|
|
|
879 |
|
|
Unrealized foreign currency loss (gain) |
|
|
117 |
|
|
|
(174 |
) |
|
Changes in operating assets and liabilities: |
|
|
|
|
|
|
|
|
|
Accounts receivable, net |
|
|
3,002 |
|
|
|
(15,320 |
) |
|
Other assets |
|
|
(97 |
) |
|
|
(4,305 |
) |
|
Accounts payable, accrued and other liabilities |
|
|
(13,296 |
) |
|
|
(4,148 |
) |
|
Income taxes |
|
|
(5,428 |
) |
|
|
(8,786 |
) |
|
Deferred revenue |
|
|
(1,437 |
) |
|
|
5,910 |
|
|
Net cash provided by operating activities |
|
|
42,688 |
|
|
|
21,032 |
|
|
|
|
|
|
|
|
|
|
|
|
Investing activities: |
|
|
|
|
|
|
|
|
|
Purchase of property and equipment |
|
|
(5,769 |
) |
|
|
(3,580 |
) |
|
Net decrease (increase) in short-term investments |
|
|
447 |
|
|
|
(1,441 |
) |
|
Net cash used in investing activities |
|
|
(5,322 |
) |
|
|
(5,021 |
) |
|
|
|
|
|
|
|
|
|
|
|
Financing activities: |
|
|
|
|
|
|
|
|
|
Purchase of common stock |
|
|
(61,330 |
) |
|
|
(58,305 |
) |
|
Proceeds from issuance of common stock from options exercised |
|
|
535 |
|
|
|
829 |
|
|
Excess tax benefits from equity-based compensation |
|
|
7,825 |
|
|
|
6,916 |
|
|
Net cash used in financing activities |
|
|
(52,970 |
) |
|
|
(50,560 |
) |
|
|
|
|
|
|
|
|
|
|
|
Foreign currency impact on cash |
|
|
52 |
|
|
|
1,295 |
|
|
|
|
|
|
|
|
|
|
|
|
Net change in cash and cash equivalents |
|
|
(15,552 |
) |
|
|
(33,254 |
) |
|
Cash and cash equivalents at beginning of period |
|
|
115,708 |
|
|
|
124,375 |
|
|
Cash and cash equivalents at end of period |
|
$ |
100,156 |
|
|
$ |
91,121 |
|
SUPPLEMENTAL INFORMATION
|
1. |
GAAP and Adjusted earnings per share by quarter are as follows: |
|
|
|
2014 |
|
|
2015 |
|
||||||||||||||||||||||||||
|
|
|
1st Qtr |
|
|
2nd Qtr |
|
|
3rd Qtr |
|
|
4th Qtr |
|
|
Full Year |
|
|
1st Qtr |
|
|
2nd Qtr |
|
|
YTD |
|
||||||||
|
GAAP Diluted EPS |
|
$ |
0.24 |
|
|
$ |
0.27 |
|
|
$ |
0.30 |
|
|
$ |
0.27 |
|
|
$ |
1.08 |
|
|
$ |
0.31 |
|
|
$ |
0.35 |
|
|
$ |
0.66 |
|
|
Adjustments to GAAP: |
|
|
|
|
|
|
|
|
|
|
|
|
|
|
|
|
|
|
|
|
|
|
|
|
|
|
|
|
|
|
|
|
|
Equity-based compensation |
|
|
0.02 |
|
|
|
0.02 |
|
|
|
0.02 |
|
|
|
0.02 |
|
|
|
0.08 |
|
|
|
0.03 |
|
|
|
0.02 |
|
|
|
0.05 |
|
|
Purchase amortization |
|
|
- |
|
|
|
- |
|
|
|
- |
|
|
|
- |
|
|
|
- |
|
|
|
- |
|
|
|
- |
|
|
|
- |
|
|
Adjusted Diluted EPS |
|
$ |
0.26 |
|
|
$ |
0.29 |
|
|
$ |
0.32 |
|
|
$ |
0.30 |
|
|
$ |
1.16 |
|
|
$ |
0.34 |
|
|
$ |
0.37 |
|
|
$ |
0.71 |
|
|
Fully Diluted Shares |
|
|
76,795 |
|
|
|
76,037 |
|
|
|
75,466 |
|
|
|
75,034 |
|
|
|
75,841 |
|
|
|
74,607 |
|
|
|
74,126 |
|
|
|
74,366 |
|
|
2. |
Revenues and operating income by reportable segment are as follows (in thousands): |
|
|
|
2014 |
|
|
2015 |
|
||||||||||||||||||||||||||
|
|
|
1st Qtr |
|
|
2nd Qtr |
|
|
3rd Qtr |
|
|
4th Qtr |
|
|
Full Year |
|
|
1st Qtr |
|
|
2nd Qtr |
|
|
YTD |
|
||||||||
|
Revenue: |
|
|
|
|
|
|
|
|
|
|
|
|
|
|
|
|
|
|
|
|
|
|
|
|
|
|
|
|
|
|
|
|
|
Americas |
|
$ |
91,355 |
|
|
$ |
98,633 |
|
|
$ |
103,419 |
|
|
$ |
108,557 |
|
|
$ |
401,964 |
|
|
$ |
109,959 |
|
|
$ |
117,154 |
|
|
$ |
227,113 |
|
|
EMEA |
|
|
15,679 |
|
|
|
15,911 |
|
|
|
14,253 |
|
|
|
15,012 |
|
|
|
60,855 |
|
|
|
18,305 |
|
|
|
17,175 |
|
|
|
35,480 |
|
|
APAC |
|
|
6,529 |
|
|
|
7,986 |
|
|
|
7,936 |
|
|
|
6,834 |
|
|
|
29,285 |
|
|
|
5,259 |
|
|
|
4,780 |
|
|
|
10,039 |
|
|
|
|
$ |
113,563 |
|
|
$ |
122,530 |
|
|
$ |
125,608 |
|
|
$ |
130,403 |
|
|
$ |
492,104 |
|
|
$ |
133,523 |
|
|
$ |
139,109 |
|
|
$ |
272,632 |
|
|
|
|
|
|
|
|
|
|
|
|
|
|
|
|
|
|
|
|
|
|
|
|
|
|
|
|
|
|
|
|
|
|
|
|
GAAP Operating Income: |
|
|
|
|
|
|
|
|
|
|
|
|
|
|
|
|
|
|
|
|
|
|
|
|
|
|
|
|
|
|
|
|
|
Americas |
|
$ |
24,133 |
|
|
$ |
25,127 |
|
|
$ |
28,750 |
|
|
$ |
23,926 |
|
|
$ |
101,936 |
|
|
$ |
30,182 |
|
|
$ |
36,214 |
|
|
$ |
66,396 |
|
|
EMEA |
|
|
4,058 |
|
|
|
4,239 |
|
|
|
3,617 |
|
|
|
3,399 |
|
|
|
15,313 |
|
|
|
5,522 |
|
|
|
4,516 |
|
|
|
10,038 |
|
|
APAC |
|
|
1,860 |
|
|
|
3,134 |
|
|
|
3,134 |
|
|
|
1,747 |
|
|
|
9,875 |
|
|
|
1,160 |
|
|
|
644 |
|
|
|
1,804 |
|
|
|
|
$ |
30,051 |
|
|
$ |
32,500 |
|
|
$ |
35,501 |
|
|
$ |
29,072 |
|
|
$ |
127,124 |
|
|
$ |
36,864 |
|
|
$ |
41,374 |
|
|
$ |
78,238 |
|
|
|
|
|
|
|
|
|
|
|
|
|
|
|
|
|
|
|
|
|
|
|
|
|
|
|
|
|
|
|
|
|
|
|
|
Adjustments (pre-tax): |
|
|
|
|
|
|
|
|
|
|
|
|
|
|
|
|
|
|
|
|
|
|
|
|
|
|
|
|
|
|
|
|
|
Americas: |
|
|
|
|
|
|
|
|
|
|
|
|
|
|
|
|
|
|
|
|
|
|
|
|
|
|
|
|
|
|
|
|
|
Equity-based compensation |
|
$ |
2,274 |
|
|
$ |
2,396 |
|
|
$ |
2,297 |
|
|
$ |
2,704 |
|
|
$ |
9,671 |
|
|
$ |
3,078 |
|
|
$ |
2,661 |
|
|
$ |
5,739 |
|
|
Purchase amortization |
|
|
1 |
|
|
|
- |
|
|
|
58 |
|
|
|
106 |
|
|
|
165 |
|
|
|
106 |
|
|
|
106 |
|
|
|
212 |
|
|
|
|
$ |
2,275 |
|
|
$ |
2,396 |
|
|
$ |
2,355 |
|
|
$ |
2,810 |
|
|
$ |
9,836 |
|
|
$ |
3,184 |
|
|
$ |
2,767 |
|
|
$ |
5,951 |
|
|
|
|
|
|
|
|
|
|
|
|
|
|
|
|
|
|
|
|
|
|
|
|
|
|
|
|
|
|
|
|
|
|
|
|
Adjusted non-GAAP Operating Income: |
|
|
|
|
|
|
|
|
|
|
|
|
|
|
|
|
|
|
|
|
|
|
|
|
|
|
|
|
|
|
|
|
|
Americas |
|
$ |
26,408 |
|
|
$ |
27,523 |
|
|
$ |
31,105 |
|
|
$ |
26,736 |
|
|
$ |
111,772 |
|
|
$ |
33,366 |
|
|
$ |
38,981 |
|
|
$ |
72,347 |
|
|
EMEA |
|
|
4,058 |
|
|
|
4,239 |
|
|
|
3,617 |
|
|
|
3,399 |
|
|
|
15,313 |
|
|
|
5,522 |
|
|
|
4,516 |
|
|
|
10,038 |
|
|
APAC |
|
|
1,860 |
|
|
|
3,134 |
|
|
|
3,134 |
|
|
|
1,747 |
|
|
|
9,875 |
|
|
|
1,160 |
|
|
|
644 |
|
|
|
1,804 |
|
|
|
|
$ |
32,326 |
|
|
$ |
34,896 |
|
|
$ |
37,856 |
|
|
$ |
31,882 |
|
|
$ |
136,960 |
|
|
$ |
40,048 |
|
|
$ |
44,141 |
|
|
$ |
84,189 |
|
|
|
|
|
|
|
|
|
|
|
|
|
|
|
|
|
|
|
|
|
|
|
|
|
|
|
|
|
|
|
|
|
|
|
|
3. |
Our services revenue consists of fees generated from professional services and customer support and software enhancements related to our software products as follows (in thousands): |
|
|
|
2014 |
|
|
2015 |
|
||||||||||||||||||||||||||
|
|
|
1st Qtr |
|
|
2nd Qtr |
|
|
3rd Qtr |
|
|
4th Qtr |
|
|
Full Year |
|
|
1st Qtr |
|
|
2nd Qtr |
|
|
YTD |
|
||||||||
|
Professional services |
|
$ |
59,422 |
|
|
$ |
65,702 |
|
|
$ |
69,398 |
|
|
$ |
65,536 |
|
|
$ |
260,058 |
|
|
$ |
72,659 |
|
|
$ |
76,548 |
|
|
$ |
149,207 |
|
|
Customer support and software enhancements |
|
|
27,491 |
|
|
|
27,817 |
|
|
|
29,120 |
|
|
|
31,537 |
|
|
|
115,965 |
|
|
|
28,544 |
|
|
|
30,796 |
|
|
|
59,340 |
|
|
Total services revenue |
|
$ |
86,913 |
|
|
$ |
93,519 |
|
|
$ |
98,518 |
|
|
$ |
97,073 |
|
|
$ |
376,023 |
|
|
$ |
101,203 |
|
|
$ |
107,344 |
|
|
$ |
208,547 |
|
|
4. |
Hardware and other revenue includes the following items (in thousands): |
|
|
|
2014 |
|
|
2015 |
|
||||||||||||||||||||||||||
|
|
|
1st Qtr |
|
|
2nd Qtr |
|
|
3rd Qtr |
|
|
4th Qtr |
|
|
Full Year |
|
|
1st Qtr |
|
|
2nd Qtr |
|
|
YTD |
|
||||||||
|
Hardware revenue |
|
$ |
5,946 |
|
|
$ |
6,114 |
|
|
$ |
4,707 |
|
|
$ |
8,856 |
|
|
$ |
25,623 |
|
|
$ |
7,730 |
|
|
$ |
7,080 |
|
|
$ |
14,810 |
|
|
Billed travel |
|
|
3,597 |
|
|
|
4,908 |
|
|
|
5,438 |
|
|
|
4,932 |
|
|
|
18,875 |
|
|
|
5,276 |
|
|
|
4,927 |
|
|
|
10,203 |
|
|
Total hardware and other revenue |
|
$ |
9,543 |
|
|
$ |
11,022 |
|
|
$ |
10,145 |
|
|
$ |
13,788 |
|
|
$ |
44,498 |
|
|
$ |
13,006 |
|
|
$ |
12,007 |
|
|
$ |
25,013 |
|
|
5. |
Impact of Currency Fluctuation |
The following table reflects the increases (decreases) in the results of operations for each period attributable to the change in foreign currency exchange rates from the prior period as well as foreign currency gains (losses) included in other income, net for each period (in thousands):
|
|
|
2014 |
|
|
2015 |
|
||||||||||||||||||||||||||
|
|
|
1st Qtr |
|
|
2nd Qtr |
|
|
3rd Qtr |
|
|
4th Qtr |
|
|
Full Year |
|
|
1st Qtr |
|
|
2nd Qtr |
|
|
YTD |
|
||||||||
|
Revenue |
|
$ |
202 |
|
|
$ |
696 |
|
|
$ |
479 |
|
|
$ |
(1,397 |
) |
|
$ |
(20 |
) |
|
$ |
(3,426 |
) |
|
$ |
(3,599 |
) |
|
$ |
(7,025 |
) |
|
Costs and expenses |
|
|
(713 |
) |
|
|
73 |
|
|
|
522 |
|
|
|
(1,097 |
) |
|
|
(1,215 |
) |
|
|
(2,546 |
) |
|
|
(3,201 |
) |
|
|
(5,747 |
) |
|
Operating income |
|
|
915 |
|
|
|
623 |
|
|
|
(43 |
) |
|
|
(300 |
) |
|
|
1,195 |
|
|
|
(880 |
) |
|
|
(398 |
) |
|
|
(1,278 |
) |
|
Foreign currency (losses) gains in other income |
|
|
(516 |
) |
|
|
12 |
|
|
|
(415 |
) |
|
|
491 |
|
|
|
(428 |
) |
|
|
(86 |
) |
|
|
(4 |
) |
|
|
(90 |
) |
|
|
|
$ |
399 |
|
|
$ |
635 |
|
|
$ |
(458 |
) |
|
$ |
191 |
|
|
$ |
767 |
|
|
$ |
(966 |
) |
|
$ |
(402 |
) |
|
$ |
(1,368 |
) |
Manhattan Associates has a large research and development center in Bangalore, India. The following table reflects the increases (decreases) in the financial results for each period attributable to changes in the Indian Rupee exchange rate (in thousands):
|
|
|
2014 |
|
|
2015 |
|
||||||||||||||||||||||||||
|
|
|
1st Qtr |
|
|
2nd Qtr |
|
|
3rd Qtr |
|
|
4th Qtr |
|
|
Full Year |
|
|
1st Qtr |
|
|
2nd Qtr |
|
|
YTD |
|
||||||||
|
Operating income |
|
$ |
898 |
|
|
$ |
505 |
|
|
$ |
(171 |
) |
|
$ |
24 |
|
|
$ |
1,256 |
|
|
$ |
72 |
|
|
$ |
468 |
|
|
$ |
540 |
|
|
Foreign currency (losses) gains in other income |
|
|
(141 |
) |
|
|
(129 |
) |
|
|
191 |
|
|
|
342 |
|
|
|
263 |
|
|
|
45 |
|
|
|
182 |
|
|
|
227 |
|
|
Total impact of changes in the Indian Rupee |
|
$ |
757 |
|
|
$ |
376 |
|
|
$ |
20 |
|
|
$ |
366 |
|
|
$ |
1,519 |
|
|
$ |
117 |
|
|
$ |
650 |
|
|
$ |
767 |
|
|
|
|
2014 |
|
|
2015 |
|
||||||||||||||||||||||||||
|
|
|
1st Qtr |
|
|
2nd Qtr |
|
|
3rd Qtr |
|
|
4th Qtr |
|
|
Full Year |
|
|
1st Qtr |
|
|
2nd Qtr |
|
|
YTD |
|
||||||||
|
Interest income |
|
$ |
267 |
|
|
$ |
302 |
|
|
$ |
349 |
|
|
$ |
350 |
|
|
$ |
1,268 |
|
|
$ |
324 |
|
|
$ |
335 |
|
|
$ |
659 |
|
|
Foreign currency (losses) gains |
|
|
(516 |
) |
|
|
12 |
|
|
|
(415 |
) |
|
|
491 |
|
|
|
(428 |
) |
|
|
(86 |
) |
|
|
(4 |
) |
|
|
(90 |
) |
|
Other non-operating (expense) income |
|
|
16 |
|
|
|
(2 |
) |
|
|
11 |
|
|
|
9 |
|
|
|
34 |
|
|
|
24 |
|
|
|
28 |
|
|
|
52 |
|
|
Total other (loss) income |
|
$ |
(233 |
) |
|
$ |
312 |
|
|
$ |
(55 |
) |
|
$ |
850 |
|
|
$ |
874 |
|
|
$ |
262 |
|
|
$ |
359 |
|
|
$ |
621 |
|
|
7. |
Total equity-based compensation is as follows (in thousands except per share amounts): |
|
|
|
2014 |
|
|
2015 |
|
||||||||||||||||||||||||||
|
|
|
1st Qtr |
|
|
2nd Qtr |
|
|
3rd Qtr |
|
|
4th Qtr |
|
|
Full Year |
|
|
1st Qtr |
|
|
2nd Qtr |
|
|
YTD |
|
||||||||
|
Total equity-based compensation - restricted stock |
|
$ |
2,274 |
|
|
$ |
2,396 |
|
|
$ |
2,297 |
|
|
$ |
2,704 |
|
|
$ |
9,671 |
|
|
$ |
3,078 |
|
|
$ |
2,661 |
|
|
$ |
5,739 |
|
|
Income tax provision |
|
|
844 |
|
|
|
889 |
|
|
|
852 |
|
|
|
990 |
|
|
|
3,575 |
|
|
|
1,154 |
|
|
|
1,004 |
|
|
|
2,158 |
|
|
Net income |
|
$ |
1,430 |
|
|
$ |
1,507 |
|
|
$ |
1,445 |
|
|
$ |
1,714 |
|
|
$ |
6,096 |
|
|
$ |
1,924 |
|
|
$ |
1,657 |
|
|
$ |
3,581 |
|
|
Diluted earnings per share - restricted stock |
|
$ |
0.02 |
|
|
$ |
0.02 |
|
|
$ |
0.02 |
|
|
$ |
0.02 |
|
|
$ |
0.08 |
|
|
$ |
0.03 |
|
|
$ |
0.02 |
|
|
$ |
0.05 |
|
|
8. |
Capital expenditures are as follows (in thousands): |
|
|
|
2014 |
|
|
2015 |
|
||||||||||||||||||||||||||
|
|
|
1st Qtr |
|
|
2nd Qtr |
|
|
3rd Qtr |
|
|
4th Qtr |
|
|
Full Year |
|
|
1st Qtr |
|
|
2nd Qtr |
|
|
YTD |
|
||||||||
|
Capital expenditures |
|
$ |
1,156 |
|
|
$ |
2,424 |
|
|
$ |
3,096 |
|
|
$ |
2,739 |
|
|
$ |
9,415 |
|
|
$ |
3,098 |
|
|
$ |
2,671 |
|
|
$ |
5,769 |
|
|
9. |
Stock Repurchase Activity (in thousands): |
|
|
|
2014 |
|
|
2015 |
|
||||||||||||||||||||||||||
|
|
|
1st Qtr |
|
|
2nd Qtr |
|
|
3rd Qtr |
|
|
4th Qtr |
|
|
Full Year |
|
|
1st Qtr |
|
|
2nd Qtr |
|
|
YTD |
|
||||||||
|
Shares purchased under publicly-announced buy-back program |
|
695 |
|
|
|
782 |
|
|
|
504 |
|
|
|
639 |
|
|
|
2,620 |
|
|
|
524 |
|
|
|
458 |
|
|
|
982 |
|
|
|
Shares withheld for taxes due upon vesting of restricted stock |
|
235 |
|
|
|
1 |
|
|
|
10 |
|
|
|
3 |
|
|
|
249 |
|
|
|
212 |
|
|
|
2 |
|
|
|
214 |
|
|
|
Total shares purchased |
|
|
930 |
|
|
|
783 |
|
|
|
514 |
|
|
|
642 |
|
|
|
2,869 |
|
|
|
736 |
|
|
|
460 |
|
|
|
1,196 |
|
|
Total cash paid for shares purchased under publicly-announced buy-back program |
$ |
25,459 |
|
|
$ |
25,090 |
|
|
$ |
15,112 |
|
|
$ |
25,422 |
|
|
$ |
91,083 |
|
|
$ |
26,306 |
|
|
$ |
25,214 |
|
|
$ |
51,520 |
|
|
|
Total cash paid for shares withheld for taxes due upon vesting of restricted stock |
|
7,720 |
|
|
|
36 |
|
|
|
289 |
|
|
|
76 |
|
|
|
8,121 |
|
|
|
9,727 |
|
|
|
83 |
|
|
|
9,810 |
|
|
|
Total cash paid for shares repurchased |
|
$ |
33,179 |
|
|
$ |
25,126 |
|
|
$ |
15,401 |
|
|
$ |
25,498 |
|
|
$ |
99,204 |
|
|
$ |
36,033 |
|
|
$ |
25,297 |
|
|
$ |
61,330 |
|