Attached files
| file | filename |
|---|---|
| EX-23.1 - EXHIBIT 23.1 - MINDBODY, Inc. | d879972dex231.htm |
Table of Contents
As filed with the Securities and Exchange Commission on June 16, 2015.
Registration No. 333-204068
UNITED STATES
SECURITIES AND EXCHANGE COMMISSION
Washington, D.C. 20549
AMENDMENT NO. 3
TO
FORM S-1
REGISTRATION STATEMENT
UNDER
THE SECURITIES ACT OF 1933
MINDBODY, INC.
(Exact name of Registrant as specified in its charter)
| Delaware | 7372 | 20-1898451 | ||
| (State or other jurisdiction of incorporation or organization) |
(Primary Standard Industrial Classification Code Number) |
(I.R.S. Employer Identification Number) |
4051 Broad Street, Suite 220
San Luis Obispo, California 93401
(877) 755-4279
(Address, including zip code, and telephone number, including area code, of Registrant’s principal executive offices)
Richard L. Stollmeyer
President and Chief Executive Officer
MINDBODY, Inc.
4051 Broad Street, Suite 220
San Luis Obispo, California 93401
(877) 755-4279
(Name, address, including zip code, and telephone number, including area code, of agent for service)
Copies to:
| Jon Avina Wilson Sonsini Goodrich & Rosati, P.C. 650 Page Mill Road Palo Alto, California 94304 (650) 493-9300 |
Kimberly Lytikainen Senior Vice President, General Counsel and Secretary MINDBODY, Inc. 4051 Broad Street, Suite 220 San Luis Obispo, California 93401 (877) 755-4279 |
David Peinsipp Charles S. Kim Andrew S. Williamson Cooley LLP 1333 Second Street, Suite 400 Santa Monica, California 90401 (310) 883-6400 |
Approximate date of commencement of proposed sale to the public: As soon as practicable after this registration statement becomes effective.
If any of the securities being registered on this Form are to be offered on a delayed or continuous basis pursuant to Rule 415 under the Securities Act, check the following box: ¨
If this Form is filed to register additional securities for an offering pursuant to Rule 462(b) under the Securities Act, please check the following box and list the Securities Act registration statement number of the earlier effective registration statement for the same offering. ¨
If this Form is a post-effective amendment filed pursuant to Rule 462(c) under the Securities Act, check the following box and list the Securities Act registration statement number of the earlier effective registration statement for the same offering. ¨
If this Form is a post-effective amendment filed pursuant to Rule 462(d) under the Securities Act, check the following box and list the Securities Act registration statement number of the earlier effective registration statement for the same offering. ¨
Indicate by check mark whether the registrant is a large accelerated filer, an accelerated filer, a non-accelerated filer, or a smaller reporting company. See the definitions of “large accelerated filer,” “accelerated filer” and “smaller reporting company” in Rule 12b-2 of the Exchange Act. (Check one):
| Large accelerated filer | ¨ | Accelerated filer | ¨ | |||
| Non-accelerated filer | x (Do not check if a smaller reporting company) | Smaller reporting company | ¨ | |||
CALCULATION OF REGISTRATION FEE
|
| ||||||||
| Title of Each Class of Securities to be Registered |
Amount to be |
Proposed Maximum |
Proposed Maximum Offering Price (1)(2) |
Amount of Registration Fee (3) | ||||
| Class A common stock, $0.000004 par value per share |
8,222,500 | $15.00 | $123,337,500 | $14,332 | ||||
|
| ||||||||
|
| ||||||||
| (1) | Estimated solely for the purpose of computing the amount of the registration fee pursuant to Rule 457(a) under the Securities Act of 1933, as amended. |
| (2) | Includes the additional shares that the underwriters have the right to purchase to cover over-allotments, if any. |
| (3) | The Registrant previously paid the registration fee in connection with prior filings of the registration statement. |
The Registrant hereby amends this registration statement on such date or dates as may be necessary to delay its effective date until the Registrant shall file a further amendment which specifically states that this registration statement shall thereafter become effective in accordance with Section 8(a) of the Securities Act of 1933 or until the registration statement shall become effective on such date as the Securities and Exchange Commission, acting pursuant to said Section 8(a), may determine.
Table of Contents
The information in this preliminary prospectus is not complete and may be changed. These securities may not be sold until the registration statement filed with the Securities and Exchange Commission is effective. This preliminary prospectus is not an offer to sell nor does it seek an offer to buy these securities in any jurisdiction where the offer or sale is not permitted.
PROSPECTUS (Subject to Completion)
Issued June 16, 2015
7,150,000 Shares

CLASS A COMMON STOCK
MINDBODY, Inc. is offering 7,150,000 shares of its Class A common stock. This is our initial public offering, and no public market currently exists for our shares. We anticipate that the initial public offering price per share will be between $13.00 and $15.00.
Following this offering, we will have two classes of authorized common stock, Class A common stock and Class B common stock. The rights of the holders of our Class A common stock and Class B common stock will be identical, except with respect to voting and conversion rights. Each share of our Class A common stock will be entitled to one vote. Each share of our Class B common stock will be entitled to 10 votes and will be convertible at any time into one share of our Class A common stock.
All shares of our capital stock outstanding immediately prior to this offering, including all shares held by our executive officers, employees and directors, and their respective affiliates, will be reclassified into shares of our Class B common stock immediately prior to this offering. The holders of our outstanding Class B common stock will hold approximately 97.8% of the voting power of our outstanding capital stock immediately following this offering.
Our Class A common stock has been approved for listing on The NASDAQ Global Market under the symbol “MB.”
We are an “emerging growth company” as defined under the U.S. federal securities laws and, as such, are subject to reduced public company reporting requirements. Investing in our Class A common stock involves risks. See “Risk Factors” beginning on page 17.
PRICE $ A SHARE
| Price to Public |
Underwriting Discounts and Commissions(1) |
Proceeds to MINDBODY |
||||||||||
| Per Share |
$ | $ | $ | |||||||||
| Total |
$ | $ | $ | |||||||||
| (1) | See “Underwriting” beginning on page 153 for additional information regarding underwriting compensation. |
We have granted the underwriters the right to purchase up to an additional 1,072,500 shares of Class A common stock to cover over-allotments.
Certain entities associated with J.P. Morgan Investment Management Inc., one of our existing holders of greater than 5% of our common stock, have indicated an interest in purchasing up to $10.0 million of our Class A common stock in this offering, at the initial public offering price. Because these indications of interest are not binding agreements or commitments to purchase, such entities may elect to purchase fewer shares than they indicate an interest in purchasing or not to purchase any shares in this offering. In addition, the underwriters may elect to sell fewer shares or not to sell any shares in this offering to such entities. The underwriters will receive the same discount from any shares sold to such entities as they will from any other shares sold to the public in this offering.
Neither the Securities and Exchange Commission nor any other regulatory body has approved or disapproved of these securities or passed upon the accuracy or adequacy of this prospectus. Any representation to the contrary is a criminal offense.
The underwriters expect to deliver the shares of Class A common stock to purchasers on , 2015.
| MORGAN STANLEY | CREDIT SUISSE | UBS INVESTMENT BANK | ||
| PACIFIC CREST SECURITIES | JMP SECURITIES | |||
, 2015
Table of Contents

MINDBODY®
LEVERAGING TECHNOLOGY TO IMPORE THE WELLNESS OF THE WORLD
Table of Contents
|
|

THE LEADING ONLINE GLOBAL WELLNESS SERVICES MARKETPLACE
MORE BUSINESSES ATTRACT MORE CONSUMERS
MORE CORPORATE WELLNESS SUBSCRIBERS
MORE EMPLOYEES (CONSUMERS)
MORE LOCAL BUSINESSES
MORE CONSUMERS ATTRACT MORE BUSINESS
42,000 SUBSCRIBERS
$4.3 BILLION IN PAYMENTS VOLUME
250,000 PRACTITIONERS
24,000,000 ACTIVE CONSUMERS
LOGO MINDBODY(R) SOFTWARE AND PAYMENTS PLATFORM
LOGO MINDBODY connectTM
LOGO MINDBODY connect workplaceTM
For subscribers and practitioners, the data is as of March 31, 2015. For payments volume, the data is for the twelve-month period ended March 31, 2015. For active consumers, the data is meausred as of the two year period ended March 31, 2015.
Table of Contents
Through and including , 2015 (the 25th day after the date of this prospectus), all dealers effecting transactions in these securities, whether or not participating in this offering, may be required to deliver a prospectus. This is in addition to a dealer’s obligation to deliver a prospectus when acting as an underwriter and with respect to an unsold allotment or subscription.
We have not authorized anyone to provide any information or to make any representations other than those contained in this prospectus or in any free writing prospectuses we have prepared. We take no responsibility for, and can provide no assurance as to the reliability of, any other information that others may give you. This prospectus is an offer to sell only the shares offered hereby, but only under circumstances and in jurisdictions where it is lawful to do so. The information contained in this prospectus is current only as of its date. Our business, financial condition, results of operations and prospects may have changed since that date.
For investors outside of the United States: Neither we nor the underwriters have done anything that would permit this offering or possession or distribution of this prospectus in any jurisdiction where action for that purpose is required, other than in the United States. You are required to inform yourselves about and to observe any restrictions relating to this offering and the distribution of this prospectus outside of the United States.
-i-
Table of Contents
This summary highlights selected information that is presented in greater detail elsewhere in this prospectus. This summary does not contain all of the information you should consider before investing in our Class A common stock. You should read this entire prospectus carefully, including the sections titled “Risk Factors” and “Management’s Discussion and Analysis of Financial Condition and Results of Operations” and our consolidated financial statements and the related notes included elsewhere in this prospectus, before making an investment decision. Unless the context otherwise requires, the terms “MINDBODY,” “the company,” “we,” “us” and “our” in this prospectus refer to MINDBODY, Inc. and its consolidated subsidiaries.
MINDBODY, INC.
Our Vision
Our vision is to leverage technology to improve the wellness of the world.
Overview
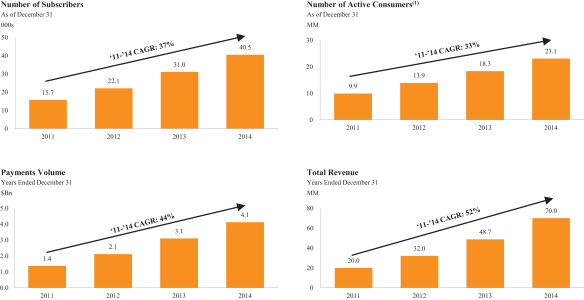
We are the leading online wellness services marketplace with over 42,000 local business subscribers on our platform in 124 countries and territories employing over 250,000 practitioners who provide a variety of wellness services to over 24 million active consumers. Our integrated cloud-based business management software and payments platform for the wellness services industry helps our subscribers simplify the way they run their businesses, attract and engage more consumers, boost their revenues and focus more on what they love to do – improving people’s lives. Moreover, we help consumers more easily evaluate, engage and transact with these subscribers, enabling them to live healthier and happier lives. We are also a leading payments platform dedicated to the wellness services industry. In the 12 months ended March 31, 2015, $6.3 billion in transactions occurred between consumers and subscribers within our marketplace, of which $4.3 billion flowed through our payments platform.
Our platform is specifically designed for the wellness services industry. Wellness encompasses multiple dimensions of a person’s well-being – physical, emotional, social, occupational and spiritual, among others. As a result, we include health and fitness, integrative health, salon and spa, fine arts and children’s activities as categories within the wellness services industry. According to a report that we commissioned from Frost and Sullivan, our addressable market is approximately 4.2 million wellness businesses worldwide. Based on their analysis, Frost and Sullivan estimates a $9.5 billion market for business management software solutions targeted at wellness businesses in 2015 and expects this market to grow to $15.3 billion in 2018, which implies a 17.1% compound annual growth rate, or CAGR. With over 42,000 local business subscribers, we estimate our current market penetration to be less than 1%.
We believe millions of wellness businesses around the world are looking for a simple, efficient and reliable way to manage their operations. Through our integrated cloud-based business management software and payments platform, we enable businesses to easily manage class and appointment schedules, staff members, client information, online bookings, inventory, payroll and retail sales – all in a cost-effective manner. At the same time, we connect consumers with local businesses through our MINDBODY Connect platform, which powers a mobile interface that allows consumers to discover, evaluate, book and pay for wellness services, whether they are near their homes or traveling.
As employers become increasingly focused on wellness programs to improve the health, fitness and productivity of their employees, our MINDBODY Connect Workplace offering combines the power of our software platform with the ease of our Connect platform to enable employees to choose from a wide variety of
1
Table of Contents
on-site and local wellness services. We believe Connect Workplace helps employees live healthier, happier and more productive lives, while allowing employers to benefit from greater staff productivity, lower attrition and reduced healthcare costs.
We have enabled a rich partner ecosystem of over 600 developers and partners who extend the value of our platform in powerful ways. These developers and partners have built applications that supplement our capabilities in areas such as automation, marketing, mobile and social interaction. Several of these partners have created significant consumer-facing businesses that rely on our unique inventory of classes, scheduling and payments capabilities. All of this is enabled by our application programming interface, or API, through which we grant access to approved developers and partners. We believe that the opportunities and technology provided by our partners enhance the power of our marketplace and contribute to the attractiveness and critical position of MINDBODY within the wellness ecosystem.
As more local wellness businesses adopt our business management and payments platform, more subscriber listings appear on Connect. A larger critical mass of local wellness services on Connect attracts more consumers, which in turn attracts more local wellness businesses that want to engage with these consumers, thereby creating powerful network effects that benefit the entire ecosystem. Similarly, as more corporate wellness subscribers adopt Connect Workplace, their employees begin using our platform, which leads to increased demand from local wellness businesses to be listed on Connect. As more local wellness businesses appear on Connect, more employees use our platform to redeem their corporate incentives, which in turn leads to more corporate wellness subscribers being attracted to our platform. Finally, as we add more subscribers, consumers and employees to our wellness ecosystem, we attract more technology developers and partners who can use our API to develop additional apps that extend the capabilities of our open platform.
| (1) | We define active consumers as all unique consumers of our subscribers’ services who have used our platform to transact with our subscribers during the immediately preceding two years. While we do not directly monetize consumers of our subscribers’ services, we believe that growth in the number of active consumers on our platform also contributes to our subscriber growth. |
Our financial performance reflects our significant subscriber growth and increasing revenue per subscriber. Our total revenue increased from $32.0 million in 2012, to $48.7 million in 2013 to $70.0 million in 2014, representing year-over-year increases of 52% and 44% in 2013 and 2014, respectively. For the three months ended March 31, 2014 and 2015, our revenue was $15.7 million and $22.3 million, respectively, representing a
2
Table of Contents
42% growth rate. Our net loss was $5.5 million, $16.2 million and $24.6 million for 2012, 2013 and 2014, respectively. For the three months ended March 31, 2014 and 2015, our net loss was $4.8 million and $7.9 million, respectively. Our Adjusted EBITDA was negative $2.5 million, negative $11.5 million and negative $18.8 million for 2012, 2013 and 2014, respectively. For the three months ended March 31, 2014 and 2015, our Adjusted EBITDA was negative $3.8 million and negative $5.3 million, respectively. For a reconciliation of Adjusted EBITDA to net loss, please see the section titled “Summary Consolidated Financial and Other Data—Non-GAAP Financial Measure.”
Industry Background
Increasing Focus on Personal Health and Beauty is Fueling Global Demand for Wellness Services
An increased focus on personal health and beauty represents a major global trend among consumers and is driving growth in wellness services worldwide. As the desire for longer, healthier lives, attractive appearance and overall physical and emotional well-being grows, more and more people are adopting a lifestyle that incorporates a healthier diet, regular physical exercise, integrative health, salon, spa and other wellness services.
While over 2.1 billion people or nearly 30% of the world’s population are overweight, consumers are becoming increasingly aware of the risks associated with obesity and the benefits of regular physical exercise and are therefore seeking to achieve a healthy weight and fitness level. In addition, while decades ago individual spending on exercise classes and spa and salon services was minimal, we believe consumers across generations today are increasingly willing to allocate a more significant portion of their disposable income to wellness services.
Moreover, people increasingly consume salon, spa and integrative health services to enhance emotional, social and physical wellness. We believe that while in developed markets, the aging population is demanding more salon, spa and integrative health services, in emerging markets, demand is driven by urbanization and the resulting increase in social interactions.
Growing Demand for Personalized Wellness Experiences has been Driving Industry Fragmentation
We believe consumers are increasingly seeking more personalized and effective wellness experiences and are opting for smaller businesses that are more conveniently located and cater to individual needs and preferences. As a result, the number of small wellness businesses has proliferated over the past decade, while all-inclusive facilities such as large health clubs now comprise only a small percentage of the wellness services industry’s aggregate revenue. Meanwhile, the market share of smaller businesses has been growing rapidly, which can be seen in the increasing number of businesses that specialize in practices such as yoga, Pilates, barre, Zumba and CrossFit.
Escalating Healthcare Costs are Driving Employers Worldwide to Develop Corporate Wellness Programs that Incentivize the Use of Wellness Services
Healthcare costs for employers have been increasing significantly: According to healthcare research foundation The Commonwealth Fund, from 2003 to 2013, the annual cost of family coverage for U.S. employers rose 73% to an average of $16,029. A 2010 study published in the Journal of Occupational and Environmental Medicine estimated that the cost of obesity among full-time employees reaches $73.1 billion each year. To reduce rising healthcare expenses and excessive absenteeism as well as to improve their employees’ productivity, more and more organizations are implementing corporate wellness and other incentive programs to encourage healthy behavior. A 2012 study by RAND Health found that participation in a wellness program is associated with lower health care costs.
3
Table of Contents
Despite the wide availability of corporate wellness programs, the actual participation of employees in such programs remains limited. According to the Business Journal, Gallup reported that although more than 85% of large employers offer wellness programs, only 24% of employees at these companies actually participate in the programs. We believe this is due to the fact that employers lack effective tools to incentivize participation in wellness programs and often fail to satisfy a broad range of employee preferences.
Consumers Need a Single, Mobile Enabled Interface for their Wellness Services Needs
Due to the fragmented nature of the wellness services industry, consumers often find it complicated and time consuming to find and book wellness services. Consumers increasingly expect to be able to identify, research and schedule the desired wellness services using their mobile devices in a manner that allows them to view class schedules, practitioner details and consumer reviews, make bookings conveniently outside business hours through web or mobile interfaces and pay for these services seamlessly online.
Wellness Businesses Need an Integrated Software and Payments Platform that is Designed to Meet their Industry-Specific Needs
Wellness businesses have to manage online bookings, staff scheduling and payroll, and resource allocation. They also need to promote their wellness services, attract new consumers and nurture consumer relationships. In addition, business owners need to keep track of key business performance indicators and take action to increase revenue and improve profitability. Many wellness businesses use basic tools like paper forms or Excel spreadsheets to perform some of these functions, which can be time consuming and distracting. We have observed that the inability of business owners to focus on their core business often leads to lost revenue and lower consumer retention. To succeed in the marketplace, wellness businesses need an easy-to-use and integrated cloud-based software and payments solution that is specifically designed for their needs, is cost effective and can be accessed anytime from anywhere and on any device.
The MINDBODY Solution
Our integrated cloud-based business management software and payments platform is specifically designed to address the unique requirements of the wellness services industry. We help our subscribers simplify their operations, focus on their consumers and grow their revenue by enabling them to attract and retain consumers.
Integrated Software and Payments Platform Designed Specifically for the Needs of Local Wellness Businesses
We have developed a cloud-based software and payments platform with powerful functionality that addresses key aspects of operating a wellness business, including:
| • | Client Scheduling and Online Booking. We believe we offer subscribers the most complete online client scheduling capability available on the market today. We are the only platform provider that enables all four different types of scheduling that wellness businesses typically encounter: appointments, open classes, enrollments and workshops and resource scheduling. |
| • | Staff Management. With our staff and resource scheduling software features, staff management is easy and organized. Subscribers keep the whole schedule in one place, allowing them to manage staff availability, hours, substitutions, commissions and other compensation, all of which is easily linked to payroll records. |
| • | Client Relationship Management. With our client relationship management features, subscribers have all their consumer information in one place and can take advantage of powerful consumer relationship and marketing tools. |
| • | Integrated Software and Payments. We offer our subscribers payment processing solutions at competitive rates. Our integrated payments platform allows for convenient and secure storage of consumer credit card |
4
Table of Contents
| information, which allows for seamless online bookings, recurring membership payments through our business management software and online store purchases through Connect. |
| • | Retail Point of Sale. Our point-of-sale capabilities help subscribers sell products and services, contracts and memberships, packages, workshops and store-branded gift cards. |
| • | Analytics and Reporting. We track key information that subscribers need to know to achieve their business goals, including revenue growth, contribution margin of classes, consumer retention rates, referral sources, return on investment for consumer retention campaigns and practitioner performance based on consumer loyalty and reviews by class or type of service. |
| • | Simple and Intuitive User Experience. We designed our business management software with a focus on developing a visually appealing interface that is simple, easy to use and requires little training, while offering subscribers powerful business management features. |
| • | Mobility. Our platform enables our subscribers to manage their operations anytime and anywhere via a number of mobile devices and operating systems, including Mac, iOS, Android and Windows. |
| • | Dynamic Cloud-Based Architecture. Our software platform is powered by a dynamic cloud-based architecture that requires low upfront investment and no maintenance and can easily scale with subscribers as their businesses grow. |
| • | Security and Compliance. We consistently earn a Level I Payment Card Industry Data Security Standard, or PCI DSS, and Health Insurance Portability and Accountability Act, or HIPAA, compliance rating. |
| • | Social Integration. Our platform integrates with popular social networks like Facebook and Twitter, allowing our subscribers to publish schedules on their Facebook page and enabling consumers to directly schedule appointments and classes via Facebook. |
MINDBODY Connect
A key component of our platform is Connect, our consumer-facing mobile app. With Connect, consumers have a unified account to manage all aspects of their wellness activities with a single log in. They can discover local wellness services using a geo-located map function, view class and appointment descriptions, schedules and real-time availability, read practitioner biographies and user reviews written by consumers who have actually received the service, and then book and pay for their desired services in a few taps from their mobile device.
MINDBODY Connect Workplace
Our Connect Workplace offering is designed to allow corporate wellness subscribers to encourage healthy habits for their employees and measure the results. Subscribers to Connect Workplace use our platform to manage on-site wellness services, incentivize employees to take advantage of the local wellness businesses in our network and analyze aggregate employee attendance data.
Rich Partner Ecosystem
We have enabled a rich partner ecosystem of over 600 developers and partners who extend the value of our platform in powerful ways.
| • | Open Platform for Third-Party App Development. We have built an open and extensible platform with an API that offers approved developers access to our unique inventory of classes, scheduling and payments capabilities. |
| • | Integration with Other Cloud-Based Partners. Our platform can be integrated with other cloud-based software that our subscribers may be using for critical business management tasks to extend the capabilities of our platform within a variety of focus areas such as automation, marketing, mobile and social. |
5
Table of Contents
Key Benefits to Marketplace Constituents
| • | Benefits to Subscribers and Practitioners. |
| • | Simplify business operations. |
| • | Focus more attention on clients and the quality of service they receive. |
| • | Grow loyal client base and recurring revenue. |
| • | Benefits to Consumers. |
| • | Convenient single interface that addresses their wellness services needs. |
| • | Time savings and excellent user experience increase engagement and achievement of wellness goals. |
| • | Central database for wellness activities facilitates fitness graph tracking. |
| • | Benefits to Employers. |
| • | Improve employee satisfaction and engagement by providing more personalized wellness options and built-in incentives. |
| • | Increase employee productivity and reduce long-term group healthcare costs with greater wellness activity participation. |
| • | Monitor and improve effectiveness by analyzing engagement and employee feedback. |
Our Market Opportunity
According to IBISWorld, in 2014, the total revenue of gyms, health and fitness clubs in the United States was expected to reach $26.5 billion, and the U.S. salon market, consisting of haircutting services, hair coloring services, nail care services, skin care services and other services, was expected to reach $50.2 billion. The global markets for these services are significantly larger. In addition, the U.S. corporate wellness services market was expected to reach $7.4 billion in 2014, according to IBISWorld. According to a report that we commissioned from Frost and Sullivan, our addressable market is approximately 4.2 million wellness businesses worldwide. Based on their analysis, Frost and Sullivan estimates that the market for business management software solutions targeted at wellness businesses will grow to $9.5 billion in 2015 and expects this market to grow to $15.3 billion in 2018, which implies a 17.1% CAGR. In addition, we believe there are a significant number of individual practitioners worldwide who are not included in the 4.2 million addressable market estimate and can benefit from our business management software and payments platform. With over 42,000 local business subscribers, we estimate our current market penetration to be less than 1%. While we expect competition in the industry to increase and evolve over time, given our current market leadership, we believe that we are well positioned to compete for and capture a significant portion of global software and payments spending in the wellness services industry.
Our Competitive Strengths
The Leading Online Wellness Services Marketplace. We are the leading online wellness services marketplace with over 42,000 local business subscribers on our platform in 124 countries and territories employing over 250,000 practitioners who provide a variety of wellness services to over 24 million active consumers. Due to our unmatched global wellness network, Connect has become the go-to destination for consumers to manage their wellness services activities.
Industry-Specific Expertise. Our team of experts understands the detailed workflows and needs of each type of business within the wellness services industry, and has designed our integrated cloud-based business management software and payments platform specifically to address the unique requirements of these businesses.
6
Table of Contents
Powerful Network Effects. As more local wellness businesses use our platform, more subscriber listings appear on Connect. A larger critical mass of local wellness services on Connect attracts more consumers, which in turn attracts more local wellness businesses that want to engage with these consumers, thereby creating powerful network effects that benefit the entire ecosystem. Similarly, as more corporate wellness subscribers adopt Connect Workplace, more employees use our platform to redeem their corporate incentives, which in turn attracts both wellness businesses and corporate wellness subscribers. Finally, as we add more subscribers, consumers and employees to our wellness ecosystem, we attract more technology developers and partners who can use our API to develop additional apps that extend the capabilities of our open platform.
Integrated Cloud-Based Business Management Software and Payments Platform. The seamless integration between our business management software and payments platform provides a convenient one-stop solution for our subscribers. Subscribers save time and resources by avoiding the use of a separate payments platform and the associated burdensome manual reconciliations of transactions that result from a lack of automation. We believe that this integrated software and payments capability leads to higher subscriber engagement with our platform and a larger recurring revenue stream for us.
Ability to Scale with Subscribers’ Businesses. Our feature-rich software scales from individual practitioners to large, international organizations that have hundreds of locations. It is possible for an independent mobile practitioner starting her small business to begin with our entry level software, upgrade to our more robust offerings as she opens her first brick-and-mortar location, then add locations and ultimately create a substantial chain on our platform. This type of inspirational story has happened many times.
Critical Position in the Wellness Ecosystem. We have enabled a rich partner ecosystem of over 600 developers and partners who extend the value of our platform in powerful ways. Many of our technology partners and API platform partners have built successful businesses, or have significantly expanded their existing businesses, to cater to our subscribers and consumers via our platform. We believe the time, effort and dollars spent by these businesses to integrate with our platform point to the critical position that MINDBODY has established in the ecosystem.
Proprietary Data and Analytics. Our software and payments platform collects and presents critical information that enables subscribers to fine tune their business operations and enables us to observe macro level wellness services industry trends that inform our business decisions. With our software, subscribers can analyze their consumer data, including demographics, type and frequency of activities and spending habits. In addition, we help subscribers assess the performance of their staff. We also collect and display consumer reviews to both subscribers and consumers. This enables consumers to make more informed buying decisions and helps our subscribers improve their businesses. Due to our market leadership position, we have access to more proprietary data than our competitors, which helps us improve our platform and allows us to provide unique insights and analytical capabilities.
Exceptional Company Culture that Drives Performance. The MINDBODY team shares an exceptional company culture that incorporates our core values of being purpose driven, humble and helpful, caring and happy, committed to wellness, environmentally conscious, continuously evolving and committed to leadership. According to a report from Mashable based on data from Glassdoor in December 2014, MINDBODY has been named one of the “Top 10 Best Tech Companies To Work For in 2015.” We believe our culture gives us a competitive advantage in recruiting and retaining talent, driving innovation, enhancing productivity and improving customer experience.
7
Table of Contents
Our Growth Strategy
Given the increasing demand for wellness services among consumers today and a largely untapped market, we believe our opportunity is significant and growing. Key elements of our growth strategy include:
| • | Continuing to expand our subscriber base, both domestically and internationally; |
| • | Deepening relationships with existing subscribers; |
| • | Growing consumer adoption of Connect; |
| • | Continuing to innovate and broaden our platform; |
| • | Further developing our partnerships and wellness ecosystem; |
| • | Increasing our presence in corporate wellness; |
| • | Making strategic investments and select acquisitions; and |
| • | Expanding our international reach via partnerships and investments in our salesforce. |
Risks Associated with Our Business
Our business is subject to numerous risks and uncertainties, including those highlighted in the section titled “Risk Factors” immediately following this prospectus summary. These risks include, but are not limited to, the following:
| • | We have a history of losses, and our revenue growth rate may not sustain the levels experienced in recent years. As our costs increase, we may not be able to generate sufficient revenue to achieve and sustain profitability. |
| • | We derive, and expect to continue to derive, a majority of our revenue and cash flows from our integrated cloud-based business management software and payments platform for the wellness services industry. If we fail to adapt this platform to changing market dynamics and subscriber preferences or to achieve increased market acceptance of our platform, our business, results of operations, financial condition and growth prospects would be adversely affected. |
| • | Our business depends substantially on our subscribers renewing their subscriptions to our platform. Any decline in the rate at which subscribers renew their subscriptions would harm our future operating results. |
| • | If we are not able to enhance our platform to achieve market acceptance and keep pace with technological developments, our business would be harmed. |
| • | Our payments platform is a core element of our business, and any failure to grow and develop our payment processing activities, or to anticipate changes in consumer behavior, could materially and adversely affect our business and financial results. |
| • | Our payment processing platform is subject to United States and international rules and regulations, many of which are still developing. If we fail to comply with such rules and regulations or if new laws, rules or practices applicable to payment systems restrict our ability to collect fees from our payment processing platform, our financial results could be materially and adversely effected. |
| • | If we incur an actual or perceived breach to our payment processing platform, we may incur significant liabilities and our brand and reputations may be damaged. |
| • | We are subject to risks related to our reliance on third-party processing partners to perform our payment processing services. |
8
Table of Contents
| • | We may undertake to directly perform certain payment processing services and expand the scope of payment processing services we provide, which may require a significant investment of time and resources, and expand our exposure to potential liabilities. |
| • | The dual class structure of our common stock has the effect of concentrating voting control with those stockholders who held our capital stock prior to the completion of this offering, including our executive officers, employees and directors and their affiliates, which will limit your ability to influence the outcome of important transactions, including a change in control. The holders of our outstanding Class B common stock will hold approximately 97.8% of the voting power of our outstanding capital stock following this offering. |
Corporate Information
We were organized as a California limited liability company in February 2001 and converted into a California corporation in October 2004. We were reincorporated in Delaware in March 2015. Our principal executive offices are located at 4051 Broad Street, Suite 220, San Luis Obispo, California 93401, and our telephone number is (877) 755-4279. Our website address is www.mindbodyonline.com. Information contained on, or that can be accessed through, our website does not constitute part of this prospectus and inclusions of our website address in this prospectus are inactive textual references only.
Unless expressly indicated or the context requires otherwise, the terms “MINDBODY,” “company,” “we,” “us,” and “our” in this prospectus refer to MINDBODY, Inc., a Delaware corporation, and, where appropriate, its wholly owned subsidiaries. The Enso design logo, “MINDBODY,” “MINDBODY Connect,” “Love Your Business,” “MINDBODY Connect Workplace” and our other registered and common law trade names, trademarks and service marks are the property of MINDBODY, Inc. Other trademarks and trade names referred to in this prospectus are the property of their respective owners.
Emerging Growth Company
The Jumpstart Our Business Startups Act, or the JOBS Act, was enacted in April 2012 with the intention of encouraging capital formation in the United States and reducing the regulatory burden on newly public companies that qualify as “emerging growth companies.” We are an emerging growth company within the meaning of the JOBS Act. As an emerging growth company, we may take advantage of certain exemptions from various public reporting requirements, including the requirement that our internal control over financial reporting be audited by our independent registered public accounting firm pursuant to Section 404 of the Sarbanes-Oxley Act of 2002, or the Sarbanes-Oxley Act, certain requirements related to the disclosure of executive compensation in this prospectus and in our periodic reports and proxy statements and the requirement that we hold a nonbinding advisory vote on executive compensation and any golden parachute payments. We may take advantage of these exemptions until we are no longer an emerging growth company.
We will remain an emerging growth company until the earliest to occur of (i) the last day of the fiscal year in which we have more than $1.0 billion in annual revenue; (ii) the date we qualify as a “large accelerated filer,” with at least $700 million of equity securities held by non-affiliates; (iii) the date on which we have issued, in any three-year period, more than $1.0 billion in non-convertible debt securities; and (iv) the last day of the fiscal year ending after the fifth anniversary of the completion of this offering.
See the section titled “Risk Factors—Risks Related to Ownership of Our Class A Common Stock and this Offering—We are an ‘emerging growth company’ and we cannot be certain if the reduced disclosure requirements applicable to emerging growth companies will make our common stock less attractive to investors” for certain risks related to our status as an emerging growth company.
9
Table of Contents
THE OFFERING
| Class A common stock offered by us |
7,150,000 shares | |
| Class A common stock to be outstanding after this offering |
7,150,000 shares | |
| Class B common stock to be outstanding after this offering |
31,967,544 shares | |
| Over-allotment option offered by us |
1,072,500 shares | |
| Total Class A common stock and Class B common stock to be outstanding after this offering |
39,117,544 shares (40,190,044 shares if the underwriters exercise their over-allotment option in full) | |
| Use of proceeds |
We estimate that the net proceeds from the sale of shares of our Class A common stock in this offering will be approximately $89.3 million (or approximately $103.3 million if the underwriters exercise their over-allotment option in full), based upon the assumed initial public offering price of $14.00 per share, which is the midpoint of the estimated offering price range set forth on the cover page of this prospectus, and after deducting estimated underwriting discounts and commissions and estimated offering expenses payable by us. | |
| The principal purposes of this offering are to increase our capitalization and financial flexibility, create a public market for our Class A common stock and enable access to the public equity markets for us and our stockholders. We intend to use the net proceeds from this offering for general corporate purposes, including working capital, operating expenses and capital expenditures. Additionally, we may use a portion of the net proceeds to acquire businesses, products, services or technologies. However, we do not have agreements or commitments for any material acquisitions at this time. See the section titled “Use of Proceeds” for additional information. | ||
| Voting rights |
Following this offering, we will have two classes of authorized common stock, Class A common stock and Class B common stock. The holders of our Class A common stock are entitled to one vote per share, and the holders of our Class B common stock are entitled to 10 votes per share, on all matters that are subject to a stockholder vote.
All shares of our capital stock outstanding immediately prior to this offering, including all shares held by our executive officers, employees and directors, and their respective affiliates, will be reclassified into shares of our Class B common stock immediately prior to this | |
10
Table of Contents
| offering. Holders of our Class A common stock and Class B common stock will generally vote together as a single class, unless otherwise required by law or our amended and restated certificate of incorporation. The holders of our outstanding Class B common stock will hold approximately 97.8% of the voting power of our outstanding capital stock following this offering and will have the ability to control the outcome of matters submitted to our stockholders for approval, including the election of our directors and the approval of any change in control transaction. See the sections titled “Principal Stockholders” and “Description of Capital Stock” for additional information. | ||
| Directed share program |
At our request, the underwriters have reserved up to 5% of the Class A common stock being offered by this prospectus for sale at the initial public offering price to certain of our subscribers, vendors and business partners as well as to certain friends and family of our management team. None of our directors or executive officers will participate in the directed share program. The sales will be made by UBS Financial Services Inc., a selected dealer affiliated with UBS Securities LLC, an underwriter of this offering, through a directed share program. If any of these persons purchases $500,000 or greater of our Class A common stock in the directed share program, such shares will be subject to the applicable lock-up restrictions described in the section titled “Shares Eligible for Future Sale.” We do not know if these persons will choose to purchase all or any portion of these reserved shares, but any purchases they do make will reduce the number of shares available to the general public. Any reserved shares not so purchased will be offered by the underwriters to the general public on the same terms as the other shares of Class A common stock. | |
| NASDAQ trading symbol |
“MB” | |
Certain entities associated with J.P. Morgan Investment Management Inc., one of our existing holders of greater than 5% of our common stock, have indicated an interest in purchasing up to $10.0 million of our Class A common stock in this offering, at the initial public offering price. Because these indications of interest are not binding agreements or commitments to purchase, such entities may elect to purchase fewer shares than they indicate an interest in purchasing or not to purchase any shares in this offering. In addition, the underwriters may elect to sell fewer shares or not to sell any shares in this offering to such entities. The underwriters will receive the same discount from any shares sold to such entities as they will from any other shares sold to the public in this offering. Any shares purchased by such entities will be subject to the applicable lock-up restrictions described in the section entitled “Shares Eligible for Future Sale.”
11
Table of Contents
The number of shares of our Class A common stock and Class B common stock that will be outstanding after this offering is based on no shares of our Class A common stock and 31,967,544 shares of our Class B common stock (including our redeemable convertible preferred stock on an as-converted basis) outstanding as of March 31, 2015, and excludes:
| • | 3,163,039 shares of our Class B common stock issuable upon the exercise of options to purchase shares of our Class B common stock outstanding as of March 31, 2015, with a weighted-average exercise price of $7.96 per share; |
| • | 89,177 shares of our Class B common stock, on an as-converted basis, issuable upon the exercise of a warrant to purchase shares of our redeemable convertible preferred stock outstanding as of March 31, 2015, with an aggregate exercise price of approximately $151,603; |
| • | 1,278,000 shares of our Class B common stock issuable upon the exercise of options to purchase shares of our Class B common stock granted after March 31, 2015, with an exercise price of $14.496 per share; and |
| • | 5,481,954 shares of our common stock reserved for future issuance under our equity compensation plans, consisting of: |
| • | 4,698,818 shares of our Class A common stock reserved for future issuance under our 2015 Equity Incentive Plan, or our 2015 Plan; and |
| • | 783,136 shares of our Class A common stock reserved for future issuance under our 2015 Employee Stock Purchase Plan, or our ESPP. |
Our 2015 Plan and ESPP each provide for annual automatic increases in the number of shares reserved thereunder, and our 2015 Plan also provides for increases to the number of shares that may be granted thereunder based on shares under our 2009 Plan that expire, are forfeited or otherwise repurchased by us, as more fully described in the section titled “Executive Compensation—Employee Benefit and Stock Plans.”
Except as otherwise indicated, all information in this prospectus assumes:
| • | the filing and effectiveness of our amended and restated certificate of incorporation in Delaware and the effectiveness of our amended and restated bylaws, each of which will occur immediately prior to the completion of this offering; |
| • | a 2.5-for-1 forward stock split of our common stock and our redeemable convertible preferred stock effected on June 4, 2015; |
| • | the reclassification of all outstanding shares of our common stock into an equivalent number of shares of our Class B common stock and the authorization of our Class A common stock, each of which will occur immediately prior to the completion of this offering; |
| • | the automatic conversion and reclassification of all outstanding shares of our redeemable convertible preferred stock into an aggregate of 20,673,680 shares of our Class B common stock, which will occur immediately prior to the completion of this offering; |
| • | the automatic conversion and reclassification of an outstanding warrant to purchase 87,500 shares of our redeemable convertible preferred stock into a warrant to purchase 89,177 shares of our Class B common stock, which will occur immediately prior to the completion of this offering; and |
| • | no exercise by the underwriters of their over-allotment option. |
12
Table of Contents
SUMMARY CONSOLIDATED FINANCIAL AND OTHER DATA
The summary consolidated statements of operations data for the years ended December 31, 2012, 2013, and 2014 are derived from audited consolidated financial statements included elsewhere in this prospectus. The summary consolidated statements of operations data for the three months ended March 31, 2014 and 2015 and the consolidated balance sheet data as of March 31, 2015 are derived from unaudited interim consolidated financial statements included elsewhere in this prospectus. The unaudited interim consolidated financial statements have been prepared on the same basis as the audited consolidated financial statements and reflect, in the opinion of management, all adjustments of a normal, recurring nature that are necessary for the fair presentation of the unaudited interim consolidated financial statements. Our historical results are not necessarily indicative of the results that may be expected in the future and are not necessarily indicative of results to be expected for the full year or any other period. The following summary consolidated financial and other data should be read with the section titled “Management’s Discussion and Analysis of Financial Condition and Results of Operations” and our consolidated financial statements and related notes included elsewhere in this prospectus.
| Year Ended December 31, | Three Months Ended March 31, |
|||||||||||||||||||
| 2012 | 2013 | 2014 | 2014 | 2015 | ||||||||||||||||
| (in thousands, except share and per share data) | ||||||||||||||||||||
| Consolidated Statements of Operations Data: |
||||||||||||||||||||
| Revenue |
$ | 31,999 | $ | 48,687 | $ | 70,010 | $ | 15,653 | $ | 22,263 | ||||||||||
| Cost of revenue(1) |
13,411 | 21,890 | 30,004 | 6,478 | 8,693 | |||||||||||||||
|
|
|
|
|
|
|
|
|
|
|
|||||||||||
| Gross profit |
18,588 | 26,797 | 40,006 | 9,175 | 13,570 | |||||||||||||||
|
|
|
|
|
|
|
|
|
|
|
|||||||||||
| Operating expenses: |
||||||||||||||||||||
| Sales and marketing(1) |
11,735 | 20,957 | 30,922 | 7,247 | 9,717 | |||||||||||||||
| Research and development(1) |
3,741 | 10,517 | 16,167 | 3,594 | 4,725 | |||||||||||||||
| General and administrative(1) |
8,111 | 10,730 | 18,422 | 3,530 | 6,780 | |||||||||||||||
| Change in fair value of contingent consideration |
— | 428 | (1,434 | ) | (423 | ) | — | |||||||||||||
|
|
|
|
|
|
|
|
|
|
|
|||||||||||
| Total operating expenses |
23,587 | 42,632 | 64,077 | 13,948 | 21,222 | |||||||||||||||
|
|
|
|
|
|
|
|
|
|
|
|||||||||||
| Loss from operations |
(4,999 | ) | (15,835 | ) | (24,071 | ) | (4,773 | ) | (7,652 | ) | ||||||||||
| Change in fair value of preferred stock warrant |
(515 | ) | (302 | ) | (283 | ) | (22 | ) | (150 | ) | ||||||||||
| Interest income |
6 | — | — | — | 3 | |||||||||||||||
| Interest expense |
(15 | ) | (21 | ) | (68 | ) | (20 | ) | (17 | ) | ||||||||||
| Other income (expense), net |
17 | (26 | ) | (68 | ) | 5 | (39 | ) | ||||||||||||
|
|
|
|
|
|
|
|
|
|
|
|||||||||||
| Loss before provision for income taxes |
(5,506 | ) | (16,184 | ) | (24,490 | ) | (4,810 | ) | (7,855 | ) | ||||||||||
| Provision for income taxes |
13 | 63 | 116 | 34 | 6 | |||||||||||||||
|
|
|
|
|
|
|
|
|
|
|
|||||||||||
| Net loss |
(5,519 | ) | (16,247 | ) | (24,606 | ) | (4,844 | ) | (7,861 | ) | ||||||||||
| Accretion of redeemable convertible preferred stock(2) |
(13,025 | ) | (27,892 | ) | (21,311 | ) | (5,831 | ) | (5,459 | ) | ||||||||||
| Deemed dividend—preferred stock modification |
— | — | — | — | 1,748 | |||||||||||||||
|
|
|
|
|
|
|
|
|
|
|
|||||||||||
| Net loss attributable to common stockholders(2) |
$ | (18,544 | ) | $ | (44,139 | ) | $ | (45,917 | ) | $ | (10,675 | ) | $ | (11,572 | ) | |||||
|
|
|
|
|
|
|
|
|
|
|
|||||||||||
| Net loss per share attributable to common stockholders, basic and diluted(2) |
$ | (1.84 | ) | $ | (4.10 | ) | $ | (4.17 | ) | $ | (0.97 | ) | $ | (1.03 | ) | |||||
|
|
|
|
|
|
|
|
|
|
|
|||||||||||
| Weighted-average shares used to compute net loss per share attributable to common stockholders, basic and diluted(2) |
10,102,216 | 10,757,938 | 11,013,658 | 10,968,167 | 11,201,755 | |||||||||||||||
|
|
|
|
|
|
|
|
|
|
|
|||||||||||
| Pro forma net loss per share attributable to common stockholders, basic and diluted(2) |
$ | (0.78 | ) | $ | (0.24 | ) | ||||||||||||||
|
|
|
|
|
|||||||||||||||||
| Weighted-average shares used to compute pro forma net loss per share attributable to common stockholders, basic and diluted(2) |
31,282,660 | 31,875,435 | ||||||||||||||||||
|
|
|
|
|
|||||||||||||||||
13
Table of Contents
| (1) | Includes stock-based compensation expense as follows: |
| Year Ended December 31, | Three Months Ended March 31, |
|||||||||||||||||||
| 2012 | 2013 | 2014 | 2014 | 2015 | ||||||||||||||||
| (in thousands) | ||||||||||||||||||||
| Cost of revenue |
$ | — | $ | 51 | $ | 220 | $ | 24 | $ | 100 | ||||||||||
| Sales and marketing |
— | 56 | 196 | 34 | 541 | |||||||||||||||
| Research and development |
— | 68 | 298 | 53 | 96 | |||||||||||||||
| General and administrative |
1,484 | 252 | 1,023 | 225 | 403 | |||||||||||||||
|
|
|
|
|
|
|
|
|
|
|
|||||||||||
| Total stock-based compensation expense |
$ | 1,484 | $ | 427 | $ | 1,737 | $ | 336 | $ | 1,140 | ||||||||||
|
|
|
|
|
|
|
|
|
|
|
|||||||||||
| (2) | See Note 13 to our consolidated financial statements included elsewhere in this prospectus for an explanation of the method used to calculate our actual and pro forma basic and diluted net loss per share attributable to common stockholders, and the weighted-average number of shares used in the computation of the per share amounts. |
The pro forma as adjusted information set forth in the table below is illustrative only and will be adjusted based on the actual initial public offering price and other terms of this offering determined at pricing.
| As of March 31, 2015 | ||||||||||||
| Actual | Pro Forma(1) | Pro Forma As Adjusted(2)(3) |
||||||||||
| (in thousands) | ||||||||||||
| Consolidated Balance Sheet Data: |
||||||||||||
| Cash and cash equivalents |
$ | 22,099 | $ | 22,099 | $ | 111,403 | ||||||
| Working capital |
14,142 | 14,142 | 103,446 | |||||||||
| Property and equipment, net |
32,487 | 32,487 | 32,847 | |||||||||
| Total assets |
71,077 | 71,077 | 160,381 | |||||||||
| Total deferred revenue |
2,865 | 2,865 | 2,865 | |||||||||
| Financing obligation on leases |
17,002 | 17,002 | 17,002 | |||||||||
| Preferred stock warrant |
1,338 | — | — | |||||||||
| Redeemable convertible preferred stock |
170,159 | — | — | |||||||||
| Total stockholders’ equity (deficit) |
(133,828 | ) | 37,669 | 126,973 | ||||||||
| (1) | The pro forma column gives effect to (i) the automatic conversion and reclassification of all outstanding shares of our redeemable convertible preferred stock into an aggregate of 20,673,680 shares of our Class B common stock, which conversion and reclassification will occur immediately prior to the completion of this offering, (ii) the resulting reclassification of the preferred stock warrant liability to stockholders’ equity, and (iii) the filing and effectiveness of our amended and restated certificate of incorporation in Delaware, as if such conversion, reclassification and effectiveness had occurred on March 31, 2015. |
| (2) | The pro forma as adjusted column gives effect to the pro forma adjustments set forth in footnote 1 above and the sale and issuance by us of 7,150,000 shares of our Class A common stock in this offering, based upon the assumed initial public offering price of $14.00 per share, which is the midpoint of the estimated offering price range set forth on the cover page of this prospectus, and after deducting estimated underwriting discounts and commissions and estimated offering expenses payable by us. |
| (3) | Each $1.00 increase or decrease in the assumed initial public offering price of our Class A common stock of $14.00 per share, which is the midpoint of the estimated offering price range set forth on the cover page of this prospectus, would increase or decrease, as applicable, the amount of each of our pro forma as adjusted cash and cash equivalents, working capital, total assets and total stockholders’ equity (deficit) by approximately $6.7 million, assuming that the number of shares offered by us, as set forth on the cover |
14
Table of Contents
| page of this prospectus, remains the same and after deducting estimated underwriting discounts and commissions and estimated offering expenses payable by us. An increase or decrease of 1.0 million shares in the number of shares offered by us would increase or decrease, as applicable, the amount of each of our pro forma as adjusted cash and cash equivalents, working capital, total assets and total stockholders’ equity (deficit) by approximately $13.0 million, assuming that the number of shares offered by us, as set forth on the cover page of this prospectus, remains the same and after deducting estimated underwriting discounts and commissions and estimated offering expenses payable by us. |
Key Metrics
We regularly review the following key metrics to measure our performance, identify trends affecting our business, formulate financial projections, make strategic business decisions and assess working capital needs.
| As of and for Year Ended December 31, | As of and for Three Months Ended March 31, 2015 |
|||||||||||||||
| 2012 | 2013 | 2014 | ||||||||||||||
| Subscribers (end of period)(1) |
22,062 | 31,043 | 40,517 | 42,700 | ||||||||||||
| Average monthly revenue per subscriber(2) |
$ | 131 | $ | 146 | $ | 155 | $ | 174 | ||||||||
| Payments volume (in millions)(3) |
$ | 2,113 | $ | 3,099 | $ | 4,121 | $ | 1,168 | ||||||||
| Dollar-based net expansion rate (end of period)(4) |
n/a | 103% | 109% | 109% | ||||||||||||
| (1) | Subscribers are defined as unique physical business locations or, in the case of our Solo software level, individual practitioners who have subscribed to our cloud-based business management software platform as of the end of the period. |
| (2) | Average monthly revenue per subscriber is calculated by dividing the subscription, services and payments revenue generated in a given month by the number of subscribers at the end of the previous month. For periods greater than one month, the average monthly revenue per subscriber is the sum of the average monthly revenue per subscriber for each month in the period, divided by the number of months in the period. |
| (3) | Payments volume is the total dollar volume of transactions between our subscribers and their consumers utilizing our payments platform. |
| (4) | Our dollar-based net expansion rate is based upon our monthly subscription, services and payments revenue for a set of subscriber accounts. We calculate our dollar-based net expansion rate by dividing our retained revenue net of contraction and churn by our base revenue. We define our base revenue as the aggregate monthly subscription, services and payments revenue of our subscriber base as of the date one year prior to the date of calculation. We define our retained revenue net of contraction and churn as the aggregate monthly subscription, services and payments revenue of the same subscriber base included in our measure of base revenue at the end of the annual period being measured. |
Non-GAAP Financial Measure
Adjusted EBITDA
To provide investors with additional information regarding our financial results prepared in accordance with U.S. generally accepted accounting principles, or GAAP, we have presented Adjusted EBITDA, which is a non-GAAP financial measure defined by us as our net loss before stock-based compensation expense, depreciation and amortization, change in fair value of contingent consideration, change in fair value of preferred stock warrant, impairment charges, provision for income taxes, and other income (expense), net, which consisted of interest income and expense, and other miscellaneous other income (expense). We have provided below a reconciliation of Adjusted EBITDA to net loss, the most directly comparable GAAP financial measure. We have
15
Table of Contents
presented Adjusted EBITDA in this prospectus because it is a key measure used by our management and board of directors to understand and evaluate our core operating performance and trends, to prepare and approve our annual budget, and to develop short and long-term operational plans. In particular, we believe that the exclusion of the amounts eliminated in calculating Adjusted EBITDA can provide a useful measure for period-to-period comparisons of our core business. Accordingly, we believe that Adjusted EBITDA provides useful information to investors and others in understanding and evaluating our operating results in the same manner as our management and board of directors.
Our use of Adjusted EBITDA has limitations as an analytical tool, and you should not consider it in isolation or as a substitute for analysis of our financial results as reported under GAAP. Some of these limitations are as follows:
| • | Although depreciation and amortization expense are non-cash charges, the assets being depreciated and amortized may have to be replaced in the future, and Adjusted EBITDA does not reflect cash capital expenditure requirements for such replacements or for new capital expenditure requirements; |
| • | Adjusted EBITDA does not reflect: (1) changes in, or cash requirements for, our working capital needs; (2) the potentially dilutive impact of stock-based compensation; or (3) tax payments that may represent a reduction in cash available to us; and |
| • | Other companies, including companies in our industry, may calculate Adjusted EBITDA or similarly titled measures differently, which reduces its usefulness as a comparative measure. |
Because of these and other limitations, you should consider Adjusted EBITDA along with other GAAP-based financial performance measures, including various cash flow metrics, net loss, and our GAAP financial results. The following table presents a reconciliation of Adjusted EBITDA to net loss for each of the periods indicated:
| Year Ended December 31, | Three Months Ended March 31, |
|||||||||||||||||||
| 2012 | 2013 | 2014 | 2014 | 2015 | ||||||||||||||||
| (in thousands) | ||||||||||||||||||||
| Net loss |
$ | (5,519 | ) | $ | (16,247 | ) | $ | (24,606 | ) | $ | (4,844 | ) | $ | (7,861 | ) | |||||
| Stock-based compensation expense |
1,484 | 427 | 1,737 | 336 | 1,140 | |||||||||||||||
| Depreciation and amortization |
1,004 | 3,479 | 4,574 | 1,034 | 1,218 | |||||||||||||||
| Change in fair value of contingent consideration |
— | 428 | (1,434 | ) | (423 | ) | — | |||||||||||||
| Change in fair value of preferred stock warrant |
515 | 302 | 283 | 22 | 150 | |||||||||||||||
| Impairment charges |
— | — | 426 | — | — | |||||||||||||||
| Provision for income taxes |
13 | 63 | 116 | 34 | 6 | |||||||||||||||
| Other (income) expense, net |
(8 | ) | 47 | 136 | 15 | 53 | ||||||||||||||
|
|
|
|
|
|
|
|
|
|
|
|||||||||||
| Adjusted EBITDA (unaudited) |
$ | (2,511 | ) | $ | (11,501 | ) | $ | (18,768 | ) | $ | (3,826 | ) | $ | (5,294 | ) | |||||
|
|
|
|
|
|
|
|
|
|
|
|||||||||||
16
Table of Contents
Investing in our Class A common stock involves a high degree of risk. You should carefully consider the following risks, together with all of the other information contained in this prospectus, including our financial statements and related notes, before making a decision to invest in our Class A common stock. Any of the following risks could have a material adverse effect on our business, operating results, and financial condition and could cause the trading price of our Class A common stock to decline, which would cause you to lose all or part of your investment.
Risks Related to Our Business
We have a history of losses, and our revenue growth rate may not sustain the levels experienced in recent years. As our costs increase, we may not be able to generate sufficient revenue to achieve and sustain profitability.
We have incurred a net loss in each year since our inception, including a net loss of $16.2 million and $24.6 million in the years ended December 31, 2013 and 2014, respectively, and $4.8 million and $7.9 million in the three months ended March 31, 2014 and 2015, respectively. For the year ended December 31, 2014 and the three months ended March 31, 2015, our Adjusted EBITDA was negative $18.8 million and negative $5.3 million, respectively. For the years ended December 31, 2013 and 2014, our revenue was $48.7 million and $70.0 million, respectively, representing a 44% growth rate. For the three months ended March 31, 2014 and 2015, our revenue was $15.7 million and $22.3 million, respectively, representing a 42% growth rate. In future years, our revenue growth rate may not sustain the levels reflected by our past performance. We may not be able to generate sufficient revenue to achieve and sustain profitability as we also expect our costs to increase in future periods. We expect to continue to expend substantial financial and other resources on:
| • | developing our platform, including investments in our research and development team, the development or acquisition of new products, features and functionality, and improvements to the scalability, availability and security of our platform; |
| • | expenses related to international expansion in an effort to increase our subscriber base; |
| • | improving our technology infrastructure and hiring additional employees for our sales, operations and customer support teams; |
| • | strategic acquisitions; |
| • | sales and marketing expenses, including a significant expansion of our direct sales organization; and |
| • | general and administrative expenses, including legal, accounting and other expenses related to being a public company. |
These investments may not result in increased revenue or growth of our business. If we fail to continue to grow our revenue, our operating results and business will be harmed.
We derive, and expect to continue to derive, a majority of our revenue and cash flows from our integrated cloud-based business management software and payments platform for the wellness services industry. If we fail to adapt this platform to changing market dynamics and subscriber preferences or to achieve increased market acceptance of our platform, our business, results of operations, financial condition and growth prospects would be adversely affected.
We derive, and expect to continue to derive, a majority of our revenue and cash flows from our integrated cloud-based business management software and payments platform for the wellness services industry. As such, market acceptance of this platform is critical to our success. Demand for our platform is affected by a number of factors, many of which are beyond our control, such as the timing of development and release of new products,
17
Table of Contents
features and functionality by our competitors, technological change and growth or contraction in our addressable market. If we are unable to meet the demands of our subscribers for products and services that meet their business needs and are easy to use and deploy, our ability to achieve widespread market acceptance of our platform will be undermined, and our business, results of operations, financial condition and growth prospects will be adversely affected.
Our business depends substantially on our subscribers renewing their subscriptions to our platform. Any decline in the rate at which subscribers renew their subscriptions would harm our future operating results.
The vast majority of our subscription revenue is derived from subscriptions to our platform that have monthly terms. For us to maintain or improve our operating results, it is important that our subscribers renew their subscriptions each month. In the past few years, we have expanded our platform beyond our core cloud-based business management software with the introduction of Connect and Connect Workplace, and in January 2015, we introduced a new tiered pricing model for our subscriptions. While significant planning has gone into the expansion of our platform and the revisions to our pricing model, these changes may adversely impact our ability to accurately predict the rate at which subscribers will renew their subscriptions, which may decline or fluctuate as a result of a number of factors, including our subscribers’ satisfaction with our platform, our customer support, our prices, the prices of competing software systems, system uptime, network performance, data breaches, mergers and acquisitions affecting our subscriber base, the effects of global economic conditions and reductions in our subscribers’ spending levels. If our subscribers do not renew their subscriptions or shift to less expensive software subscriptions, our revenue may decline and we may not realize improved operating results from our subscriber base.
If we are not able to enhance our platform to achieve market acceptance and keep pace with technological developments, our business would be harmed.
Our ability to attract new subscribers and increase revenue from existing subscribers depends in large part on our ability to enhance and improve our existing platform and to introduce new products and services, including products and services designed for a mobile user environment. To grow our business, we must develop products and services that reflect the changing nature of business management software and expand beyond our core scheduling and point-of-sale functionality to other areas of managing relationships with our subscribers, as well as their relationships with consumers. For example, in 2013, we expanded our platform to include Connect, and in 2015, we introduced Connect Workplace and began providing automated marketing functionality with our higher-priced subscriptions. The success of these and any other enhancements to our platform depends on several factors, including timely completion, adequate quality testing and sufficient demand. Any new product or service that we develop may not be introduced in a timely or cost-effective manner, may contain defects or may not achieve the market acceptance necessary to generate sufficient revenue. If we are unable to successfully develop new products or services, enhance our existing platform to meet subscriber requirements or otherwise gain market acceptance, our business and operating results will be harmed.
In addition, because our platform is available over the Internet, we need to continuously modify and enhance our platform to keep pace with changes in Internet-related hardware, software, communications and database technologies and standards. If we are unable to respond in a timely and cost-effective manner to these rapid technological developments and changes in standards, our platform may become less marketable, less competitive, or obsolete, and our operating results will be harmed. If new technologies emerge that are able to deliver competitive products and applications at lower prices, more efficiently, more conveniently or more securely, such technologies could adversely impact our ability to compete. Our platform must also integrate with a variety of network, hardware, mobile, and software platforms and technologies, and we need to continuously modify and enhance our products and services to adapt to changes and innovation in these technologies. Any failure of our platform to operate effectively with future infrastructure platforms and technologies could reduce the demand for our platform. If we are unable to respond to these changes in a cost-effective manner, our platform may become less marketable, less competitive or obsolete, and our operating results may be adversely affected.
18
Table of Contents
Our payments platform is a core element of our business, and any failure to grow and develop our payment processing activities, or to anticipate changes in consumer behavior, could materially and adversely affect our business and financial results.
Our payments platform is a core element of our business. For the years ended December 31, 2013 and 2014, our payments platform generated 35% and 37% of our total revenue, respectively. For the three months ended March 31, 2014 and 2015, our payments platform generated 38% and 36% of our total revenue, respectively. Our future success depends in large part on the continued growth and development of our payment processing activities. If such activities are limited, restricted, curtailed or degraded in any way, or if we fail to continue to grow and develop such activities, our business may be materially and adversely affected.
The continued growth and development of our payment processing activities will depend on our ability to anticipate and adapt to changes in consumer behavior. For example, consumer behavior may change regarding the use of credit card transactions, including the relative increased use of cash, crypto-currencies, other emerging or alternative payment methods and credit card systems that we or our processing partners do not adequately support or that do not provide adequate commissions to Independent Sales Organizations such as us. Any failure to timely integrate emerging payment methods (e.g. ApplePay or Bitcoin) into our software, anticipate consumer behavior changes, or contract with processing partners that support such emerging payment technologies could cause us to lose traction among our subscribers, resulting in a corresponding loss of revenue, in the event such methods become popular among their consumers.
Our payment processing platform is subject to United States and international rules and regulations, many of which are still developing. If we fail to comply with such rules and regulations or if new laws, rules or practices applicable to payment systems restrict our ability to collect fees from our payment processing platform, our financial results could be materially and adversely effected.
Payments processing is subject to extensive regulation in the United States and other countries where we operate, and presents a wide range of risks. We may encounter increased regulatory scrutiny and new regulatory compliance requirements brought about by evolving laws, rules and regulations. Our payment processing activities are subject to price controls within the United States and other countries, and may be subject to an increase of price controls, including controls limiting the amount we are allowed to charge subscribers for processing credit card and debit card transactions. Certain countries limit the ability of foreign payment companies like us to conduct processing activities, and restrict the transfer of funds out of such countries. Changes in the laws, rules or practices applicable to payment systems such as VISA, MasterCard or American Express, including changes resulting in increased costs that we or our subscribers must pay, may force changes to our payments platform that could adversely affect our business.
If we incur an actual or perceived breach to our payment processing platform, we may incur significant liabilities and our brand and reputation may be damaged.
We may suffer an attack on our payments platform that results in a breach of consumer cardholder data. We maintain payment information for tens of millions of consumers on our payments platform, and we are a potential target for hackers and other parties attempting to steal credit card data via cyber-attacks or other means. As we increase our consumer base and our brand becomes more widely known and recognized, we may become more of a target for these malicious third parties. If we experience any actual or perceived data breach as a result of third-party actions, employee negligence or error, or malfeasance, whether or not resulting in the unauthorized acquisition of or access to cardholder data, we could incur significant liability, our business may suffer and our brand and reputation may be damaged. We could be required to pay extensive fines and costs related to any such data breach, including costs incurred to replace credit cards and cardholder information and provide security monitoring services, and we could lose future sales and subscribers, any of which could harm our business and operating results. Such fines and costs could become due in one or two business days following such breach and exceed the amount of cash available to us, thereby impacting our ability to operate our business. In addition, a data breach or failure to comply with rules or regulations of payment systems could also result in the termination
19
Table of Contents
of our status as a registered Independent Sales Organization / Merchant Service Provider, thereby dramatically impairing our ability to continue doing business in the payments industry.
We are subject to risks related to our reliance on third-party processing partners to perform our payment processing services.
We depend on our third-party processing partners to perform payment processing services, which generate almost all of our payments revenue. Our processing partners may go out of business or otherwise be unable or unwilling to continue providing such services, which could significantly and materially reduce our payments revenue and disrupt our business. A number of our processing contracts require us to assume liability for any losses our processing partners may suffer as a result of losses caused by our subscribers, including losses caused by chargebacks and subscriber fraud. Thus, in the event of a significant loss by our processing partners, we may be required to pay-out a large amount of cash in one or two business days following such event and, if we do not have sufficient cash on hand, may be deemed in breach of such contracts. A contractual dispute with our processing partners could adversely impact our revenue. Certain contracts may expire or be terminated, and we may not be able to replicate the associated revenue through a new processing partner relationship for a considerable period of time. In addition, the failure of any third-party processing partner to provide accurate and timely reporting could adversely impact our ability to report accurate and timely revenue in accordance with GAAP.
We expect to initiate new third-party payment relationships or migrate to other third-party payment partners in the future. The initiation of these relationships and the transition from one relationship to another would require significant time and resources. New third-party payment processing relationships may not be as effective, efficient or well received by subscribers and their consumers, nor is there any assurance that we will be able to reach an agreement with such processing partners. Our contracts with such processing partners may be less lucrative. For instance, we may be required to pay more for payment processing or receive a less favorable revenue arrangement from our payment processing partners. We may also experience the termination of revenue streams due to such migrations.
We may undertake to directly perform certain payment processing services and expand the scope of payment processing services we provide, which may require a significant investment of time and resources, and expand our exposure to potential liabilities.
In the future, we may undertake to directly perform certain payment processing services that we currently depend upon our processing partners to perform, expand the scope of payment processing services we provide, offer additional payment processing services or otherwise undertake additional responsibilities and liabilities related to such payment processing services. For example, in the future, we may undertake to act as a registered payment facilitator or payment service provider of the payment systems, providing merchants with a suite of services, including payment processing and funding and accepting payments as the merchant of record on behalf of other merchants. Any of these endeavors would require a significant investment of time and effective management of resources before presenting any potential upside for us, and may dramatically expand the scope of our potential contractual liability or exposure in the event of a lawsuit. Further, we may fail to effectively execute in performing such an expansion of services.
If our network or computer systems are breached or unauthorized access to subscriber or consumer data is otherwise obtained, our platform may be perceived as insecure, we may lose existing subscribers or fail to attract new subscribers, and we may incur significant liabilities.
Use of our platform involves the storage, transmission and processing of our subscribers’ proprietary data, including personal or identifying information regarding their consumers or employees. Unauthorized access to or security breaches of our platform could result in the loss of data, loss of intellectual property or trade secrets, loss
20
Table of Contents
of business, reputational damage, regulatory investigations and orders, litigation, indemnity obligations, damages for contract breach, penalties for violation of applicable laws, regulations, or contractual obligations, and significant costs, fees and other monetary payments for remediation. For example, if our platform is breached in a way that constitutes a violation of HIPAA, we could face costs for remediation, criminal penalties, and/or monetary penalties up to $1.5 million per year for violations of an identical provision of the law.
If any unauthorized access to our systems or data or any other security breach occurs, or is believed to have occurred, our reputation and brand could be damaged, we could be required to expend significant capital and other resources to alleviate problems caused by such actual or perceived breaches and remediate our systems, we could be exposed to a risk of loss, litigation or regulatory action and possible liability, and our ability to operate our business may be impaired. If subscribers believe that our platform does not provide adequate security for the storage of personal or other sensitive information or its transmission over the Internet, our business will be harmed. Subscribers’ concerns about security or privacy may deter them from using our platform for activities that involve personal or other sensitive information. Additionally, actual, potential or anticipated attacks may cause us to incur increasing costs, including costs to deploy additional personnel and protection technologies, train employees and engage third-party experts and consultants. Our errors and omissions insurance policies covering certain security and privacy damages and claim expenses may not be sufficient to compensate for all potential liability. Although we maintain cyber liability insurance, we cannot be certain that our coverage will be adequate for liabilities actually incurred or that insurance will continue to be available to us on economically reasonable terms, or at all.
Because the techniques used to obtain unauthorized access or to sabotage systems change frequently and generally are not identified until they are launched against a target, we may be unable to anticipate these techniques or to implement adequate preventative measures. We may also experience security breaches that may remain undetected for extended periods of time.
Because data security is a critical competitive factor in our industry, we make statements in our privacy policies and terms of service, through our certifications to privacy standards, and in our marketing materials, describing the security of our platform, including descriptions of certain security measures we employ. Should any of these statements be untrue, become untrue, or be perceived to be untrue, even if through circumstances beyond our reasonable control, we may face claims, including claims of unfair or deceptive trade practices, brought by the U.S. Federal Trade Commission, state, local or foreign regulators and private litigants.
Because our platform can be used to collect and store personal information, domestic and international privacy and data security concerns could result in additional costs and liabilities to us or inhibit sales of our platform.
Personal privacy and data security are significant issues in the United States, Europe and many other jurisdictions where we offer our platform. The regulatory framework for privacy and security issues worldwide is rapidly evolving and is likely to remain uncertain for the foreseeable future. The U.S. federal and various state and foreign governments have adopted or proposed limitations on, or requirements regarding, the collection, distribution, use, security and storage of personally identifiable information and other data relating to individuals, and the Federal Trade Commission and numerous state attorneys general are applying federal and state consumer protection laws to enforce regulations related to the online collection, use and dissemination of personally identifiable information and other data. Some of these requirements include obligations on companies to notify individuals of security breaches involving particular personal information, which could result from breaches experienced by us or our service providers. Even though we may have contractual protections with our service providers, notifications related to a security breach could impact our reputation, harm customer confidence, hurt our sales and expansion into new markets or cause us to lose existing customers.
Further, many foreign countries and governmental bodies, including the European Union and Canada, have laws and regulations concerning the collection and use of personally identifiable information obtained from their residents or by businesses operating within their jurisdiction. These laws and regulations often are more
21
Table of Contents
restrictive than those in the United States. Laws and regulations in these jurisdictions apply broadly to the collection, use, storage, disclosure and security of data that identifies or may be used to identify or locate an individual, such as names, email addresses and, in some jurisdictions, Internet Protocol, or IP, addresses. We certify adherence to the U.S. Department of Commerce’s Safe Harbor Privacy Principles and comply with the U.S.-EU and U.S.-Swiss Safe Harbor Frameworks. However, it is not clear whether or for how long applicable data protection authorities in the European Union will continue to recognize such certification as a valid method of compliance with restrictions set forth in EU data protection legislation restricting the transfer of data outside of the European Economic Area. Such uncertainty has increased as a result of a vote by the EU Parliament to suspend the Safe Harbor.
We also expect that there will continue to be new proposed laws, regulations and industry standards concerning privacy, data protection and information security in the United States, the European Union and other jurisdictions, and we cannot yet determine the impact such future laws, regulations and standards may have on our business. Future laws, regulations, standards and other obligations, and changes in the interpretation of existing laws, regulations, standards and other obligations could impair our or our subscribers’ ability to collect, use or disclose information relating to consumers, which could decrease demand for our platform, increase our costs and impair our ability to maintain and grow our subscriber base and increase our revenue. New laws, amendments to or re-interpretations of existing laws and regulations, industry standards, contractual obligations and other obligations may require us to incur additional costs and restrict our business operations. In view of new or modified federal, state or foreign laws and regulations, industry standards, contractual obligations and other legal obligations, or any changes in their interpretation, we may find it necessary or desirable to fundamentally change our business activities and practices or to expend significant resources to modify our software or platform and otherwise adapt to these changes. Any failure or perceived failure by us to comply with federal, state or foreign laws or regulations, industry standards or other legal obligations, or any actual or suspected security incident, whether or not resulting in unauthorized access to, or acquisition, release or transfer of personally identifiable information or other data, may result in governmental enforcement actions and prosecutions, private litigation, fines and penalties or adverse publicity and could cause our subscribers to lose trust in us, which could have an adverse effect on our reputation and business. We may be unable to make such changes and modifications in a commercially reasonable manner or at all, and our ability to develop new products and features could be limited. Any of these developments could harm our business, financial condition and results of operations. Furthermore, the costs of compliance with, and other burdens imposed by, the laws, regulations, and policies that are applicable to the businesses of our subscribers may limit the use and adoption of, and reduce the overall demand for, our platform. Privacy and data security concerns, whether valid or not valid, may inhibit market adoption of our platform, particularly in certain industries and foreign countries.
We are subject to a number of legal requirements, industry standards and contractual obligations regarding security, data protection, and privacy and any failure to comply with these requirements, obligations or standards could have an adverse effect on our reputation, business, financial condition and operating results.
As a service provider to our subscribers, we must comply with a number of data protection, security, privacy and other government- and industry-specific requirements, including those that require companies to notify individuals of data security incidents involving certain types of personal data. For example, our solutions must conform, in certain circumstances, to requirements set forth in HIPAA, as amended by the Health Information Technology for Economic and Clinical Health Act, and the regulations promulgated thereunder, which collectively govern the privacy and security of protected health information. Through the provision of online scheduling services to certain of our clients, we may collect, access, use, maintain and transmit protected health information in ways that may be subject to certain of these laws and regulations. Any inability to adequately address privacy and security concerns, even if unfounded, or comply with applicable laws, regulations, policies, industry standards, contractual obligations or other legal obligations could result in additional cost and liability to us, damage our reputation, inhibit sales and adversely affect our business.
HIPAA applies to covered entities (e.g., health plans, health care clearinghouses and most health care providers) and to “business associates” of covered entities, which include individuals and entities that provide
22
Table of Contents
services for or on behalf of covered entities pursuant to which the service providers may access protected health information, as well as subcontractors of business associates who may access such information. We are a subcontractor to certain business associates of covered entities. Under the current HIPAA regulations promulgated by the United States Department of Health and Human Services, if we experience a breach of patient information, the liability rules for business associates and business associates’ subcontractors could result in substantial financial and reputational harm to our business.
The Standards for Privacy of Individually Identifiable Health Information, or Privacy Rule, and the Security Standards for the Protection of Electronic Protected Health Information, or Security Rule, which jointly govern the privacy and security of protected health information, could significantly affect our business. The Privacy Rule and the Security Rule require the development and implementation of policies, procedures and contracts to assure compliance. We have implemented certain compliance measures, but we may be required to make additional modifications or to document and implement additional policies and procedures to comply with evolving HIPAA rules and our subscribers’ business associate agreements with us. We may also be required to perform periodic audits and refinements as required by HIPAA and our subscribers’ business associate agreements with us.
Additionally, because we process a significant portion of our payments through debit or credit cards and enable our subscribers to engage in payments through our service, we are contractually required to maintain Payment Card Industry Data Security Standard, or PCI DSS, compliance as part of our information security program. We also may find it necessary or desirable to join industry or other self-regulatory bodies or other privacy or data protection-related organizations that require compliance with their rules pertaining to privacy and data protection. We also may be bound by additional, more stringent contractual obligations relating to our collection, use and disclosure of personal, financial and other data. If we cannot comply with or if we incur a violation of any of these regulations or requirements, we could incur significant liability through fines and penalties imposed by credit card associations or other organizations, breach of contracts with our payment processors, or our growth could be adversely impacted, either of which could have an adverse effect on our reputation, business, financial condition and operating results.
The market for business management software is intensely competitive, and if we do not compete effectively, our operating results could be harmed.
The market for business management software for the wellness services industry is fragmented and rapidly evolving, with relatively low barriers to entry. We face competition from in-house software systems, smaller companies offering alternative SaaS applications and traditional paper-based methods. Our competitors vary in size and in the breadth and scope of the products and services they offer. In addition, there are a number of companies that are not currently direct competitors but that could in the future shift their focus to the wellness services industry and offer competing products and services. Some of these companies, such as Intuit and Square, have or may in the future acquire greater financial and other resources than we do and could bundle competing products and services with their other offerings or offer such products and services at lower prices as part of a larger sale. There is also a risk that certain of our current business partners could terminate their relationships with us and use the insights they have gained from partnering with us to introduce their own competing products. Many of our current and potential competitors have greater name recognition, established marketing relationships, access to larger customer bases and pre-existing relationships with customers, consultants, system integrators and resellers. Additionally, some potential subscribers in the wellness services industry, particularly large organizations, have elected, and may in the future elect, to develop their own business management software. Certain of our competitors have partnered with, or have acquired, and may in the future partner with or acquire, other competitors to offer services, leveraging their collective competitive positions, which makes, or would make, it more difficult to compete with them.
Our competitors may be able to respond more quickly and effectively than we can to new or changing opportunities, technologies, standards or customer requirements. With the introduction of new technologies, the evolution of our platform and new market entrants, we expect competition to intensify in the future. Pricing
23
Table of Contents
pressures and increased competition generally could result in reduced sales, reduced margins, increased churn, reduced subscriber retention, further losses or the failure of our platform to achieve or maintain more widespread market acceptance, any of which could harm our business. For all of these reasons, we may fail to compete successfully against our current and future competitors, and if such failure occurs, our business will be harmed.
Interruptions or performance problems associated with our technology and infrastructure may adversely affect our business and operating results.
Our continued growth depends in part on the ability of our existing and potential subscribers to access our platform at any time and within an acceptable amount of time. Our platform is proprietary, and we rely on the expertise of members of our engineering, operations and software development teams for its continued performance. We have experienced, and may in the future experience, disruptions, outages and other performance problems due to a variety of factors, including infrastructure changes, introductions of new functionality, human or software errors, capacity constraints due to an overwhelming number of users accessing our platform simultaneously, denial of service attacks, or other security related incidents. For example, in 2011, we were subject to a denial-of-service attack that rendered our core software inaccessible for several hours. In addition, from time to time we experience limited periods of server downtime due to server failure or other technical difficulties. In some instances, we may not be able to identify the cause or causes of these performance problems within an acceptable period of time. It may become increasingly difficult to maintain and improve our performance, especially during peak usage times and as our platform becomes more complex and our user traffic increases. If our platform is unavailable or if our users are unable to access our platform within a reasonable amount of time, or at all, our business would be adversely affected and our brand could be harmed. In the event of any of the factors described above, or certain other failures of our infrastructure, subscriber or consumer data may be permanently lost. Moreover, our online subscription agreement includes a limited warranty that enables subscribers to be eligible for credits if cumulative service levels over a certain period of time drop below 99.9%. If we experience significant periods of service downtime in the future, we may be subject to claims by our subscribers against these warranties. To the extent that we do not effectively address capacity constraints, upgrade our systems as needed, and continually develop our technology and network architecture to accommodate actual and anticipated changes in technology, our business and operating results may be adversely affected.
Real or perceived errors, failures, or bugs in our platform could adversely affect our operating results and growth prospects.
Because our platform is complex, undetected errors, failures, vulnerabilities or bugs may occur, especially when updates are deployed. Our platform is often used in connection with computing environments with different operating systems, system management software, equipment and networking configurations, which may cause errors in or failures of our platform or other aspects of the computing environments. In addition, deployment of our platform into complicated, large-scale computing environments may expose undetected errors, failures, vulnerabilities or bugs in our platform. Despite testing by us, errors, failures, vulnerabilities or bugs may not be found in our platform until after it is deployed to our subscribers or their consumers. We have discovered, and expect to discover in the future, software errors, failures, vulnerabilities and bugs in our platform, and we anticipate that certain of these errors, failures, vulnerabilities and bugs will only be discovered and remediated after deployment to subscribers. Real or perceived errors, failures or bugs in our platform could result in negative publicity, loss of or delay in market acceptance of our platform, loss of competitive position or claims by subscribers for losses sustained by them. In such an event, we may be required, or may choose for subscriber relations or other reasons, to expend additional resources in order to help correct the problem.
We have limited experience with our expanded platform and revised pricing model, which makes it difficult to evaluate our prospects and future operating results.
Although we commenced our business in 2001 and began offering our integrated cloud-based business management software on a subscription basis in 2005, many of the products offered as part of our platform have
24
Table of Contents
been recently introduced. For example, in 2013, we released Connect, and in 2015, we introduced Connect Workplace and began offering automated marketing functionality with our higher-priced subscriptions. In addition, in January 2015, after careful deliberation, we introduced a new tiered pricing structure for new subscribers. Given the recent introduction of Connect Workplace and our new tiered pricing structure for new subscribers, their contribution to our total revenue has not been meaningful to our financial results to date. As we have a limited operating history with our expanded platform and updated pricing structure, our ability to forecast our future operating results and effectively assess our future prospects is subject to a number of uncertainties, including our ability to plan for and model future growth. Our historical revenue growth should not be considered indicative of our future performance. Further, in future periods, our revenue could decline for a number of reasons, including any further changes in our pricing structure, any reduction in demand for our platform, including our payments platform, decrease in payments processing volume, increase in competition, contraction of our overall market, or our failure, for any reason, to capitalize on growth opportunities. We have encountered and will continue to encounter risks and uncertainties frequently experienced by growing companies in rapidly changing industries, such as the risks and uncertainties described herein. If our assumptions regarding these risks and uncertainties, which we use to plan our business, are incorrect or change, or if we do not address these risks successfully, our operating and financial results could differ materially from our expectations, and our business could suffer.
Failure to effectively expand our sales capabilities could harm our ability to increase our subscriber base and achieve broader market acceptance of our platform.
Increasing our subscriber base and achieving broader market acceptance of our platform will depend, to a significant extent, on our ability to effectively expand our sales and marketing operations and activities, including internationally. We are substantially dependent on our online marketing efforts and on our direct sales force to obtain new subscribers. From December 31, 2013 to March 31, 2015, our sales and marketing organizations increased from 318 to 376 employees. We plan to continue to expand our direct sales force, both domestically and internationally, and to increase the number of our sales professionals who have experience in selling to larger organizations. We believe that there is significant competition for experienced sales professionals with the sales skills and technical knowledge that we require, and this competition is particularly acute for us given that our headquarters is located in San Luis Obispo, a small city with fewer resources than the San Francisco Bay Area, where many companies competing for talent are based. Our ability to achieve significant revenue growth in the future will depend, in part, on our success in recruiting, training and retaining a sufficient number of experienced sales professionals. New hires require significant training and time before they achieve full productivity, particularly in new sales segments and territories. Our recent and planned hires may not become productive as quickly as we expect, and we may be unable to hire or retain sufficient numbers of qualified individuals in the future in the markets where we do business. Because we do not have a long history of expanding our sales force, we cannot predict whether, or to what extent, our sales will increase as we expand our sales force or how long it will take for sales personnel to become productive. In addition, in January 2015, we introduced a new tiered pricing model for new subscribers. While we believe these changes are reasonable, there is a risk that these changes may impact the ability of our sales professionals to sell subscriptions to our platform. If our sales expansion efforts do not generate a significant increase in revenue, or if our sales team is unable to increase sales based on our new pricing model, our business and future growth prospects could be harmed.
Even if the market for our platform grows as expected, our ability to achieve long-term revenue growth will primarily depend on our ability to sell subscriptions to a large number of new small and medium-sized businesses on a consistent basis and in a cost-effective manner, with each sale constituting only a small portion of our overall revenue.
The market for our platform is highly fragmented. As a result, even if this market grows as expected, our ability to achieve long-term revenue growth will largely depend on our sales team’s ability to sell subscriptions to a large number of new small and medium-sized businesses on a consistent basis, with each sale constituting only a small portion of our overall revenue. To achieve this type of subscriber growth in a cost-effective manner, it is crucial that our platform is easy to use and implement without the need for excessive post-sale customer
25
Table of Contents
support. If we are unable to sell a large volume of subscriptions on a consistent basis, or if we are forced to incur excessive costs to provide post-sale customer support, our business, results of operations, financial condition and growth prospects will be adversely affected.
Any failure to offer high-quality customer support may adversely affect our relationships with our subscribers and our financial results.
In deploying and using our platform, our subscribers depend on our 24/7 customer support team to resolve complex technical and operational issues, including ensuring that our platform is implemented in a manner that integrates with a variety of third-party platforms, including Apple Pay and QuickBooks. We may be unable to respond quickly enough to accommodate short-term increases in subscriber demand for customer support. We also may be unable to modify the nature, scope and delivery of our customer support to compete with changes in customer support services provided by our competitors. Increased subscriber demand for customer support, without corresponding revenue, could increase costs and adversely affect our operating results. Our sales are highly dependent on our business reputation and on positive recommendations from our existing subscribers. Any failure to maintain high-quality customer support, or a market perception that we do not maintain high-quality customer support, could adversely affect our reputation and brand, our ability to sell our platform to existing and prospective subscribers, our business, operating results and financial position.
Our quarterly results may fluctuate for various reasons, and if we fail to meet the expectations of analysts or investors, our stock price and the value of your investment could decline substantially.
Our quarterly financial results may fluctuate as a result of a variety of factors, many of which are outside of our control. If our quarterly financial results fall below the expectations of investors or any securities analysts who follow our stock, the price of our Class A common stock could decline substantially. Some of the important factors that may cause our revenue, operating results and cash flows to fluctuate from quarter to quarter include:
| • | our ability to attract new subscribers, retain and increase sales to existing subscribers and satisfy our subscribers’ requirements; |
| • | the volume of transactions processed on our payments platform; |
| • | the number of new employees added; |
| • | the rate of expansion and productivity of our sales force; |
| • | the entrance of new competitors in our market, whether by established companies or new companies; |
| • | changes in our or our competitors’ pricing policies; |
| • | the amount and timing of operating costs and capital expenditures related to the expansion of our business, including our sales force; |
| • | new products, features or functionalities introduced by our competitors; |
| • | significant security breaches, technical difficulties or interruptions to our platform; |
| • | the timing of payments by subscribers and other payment processing partners and payment defaults by subscribers or other payment processing partners; |
| • | general economic conditions that may adversely affect either our subscribers’ ability or willingness to purchase additional subscriptions, delay a prospective subscriber’s purchasing decision, reduce the value of new subscription contracts or affect subscriber retention; |
| • | changes in the relative and absolute levels of customer support we provide; |
| • | changes in foreign currency exchange rates; |
| • | extraordinary expenses such as litigation or other dispute-related settlement payments; |
| • | the impact of new accounting pronouncements; and |
| • | the timing of the grant or vesting of equity awards to employees. |
26
Table of Contents
Many of these factors are outside of our control, and the occurrence of one or more of them might cause our revenue, operating results and cash flows to vary widely. As such, we believe that quarter-to-quarter comparisons of our revenue, operating results and cash flows may not be meaningful and should not be relied upon as an indication of future performance.
We have experienced rapid growth in recent periods. If we fail to manage our growth effectively, we may be unable to execute our business plan, maintain high levels of service or adequately address competitive challenges.
We have recently experienced a period of rapid growth in our operations and employee headcount. In particular, we grew from 806 employees as of December 31, 2013 to 1,100 employees as of March 31, 2015, and have also significantly increased the size of our subscriber base. You should not consider our recent growth in revenue as indicative of our future performance. However, we anticipate that we will significantly expand our operations and employee headcount in the near term, both domestically and internationally, particularly with respect to our sales force. This growth has placed, and future growth will place, a significant strain on our management, administrative, operational and financial infrastructure. Our success will depend in part on our ability to manage this growth effectively. To manage the expected growth of our operations and personnel, we will need to scale our technology infrastructure and continue to improve our operational, financial and management controls, and our reporting systems and procedures. Failure to effectively manage growth could result in difficulty or delays in onboarding new subscribers, declines in quality or subscriber satisfaction, increases in costs, difficulties in introducing new features or other operational difficulties. Any of these difficulties could adversely impact our business performance and operating results.
If we fail to effectively manage our growth in a manner that preserves the key aspects of our corporate culture, our business and operating results could be harmed.
We have experienced and may continue to experience rapid growth, which has placed, and may continue to place, significant demands on our management, operational and financial resources. For example, our headcount has grown from 806 employees as of December 31, 2013 to 1,100 employees as of March 31, 2015. In addition, since our inception in 2001, we have established subsidiaries in the United Kingdom and Australia. We plan to expand our international operations into other countries in the future, and such expansion may increase the risk that we over hire or over compensate our employees or fail to effectively integrate our rapidly expanding employee base into our organization. We have also experienced significant growth in the number of subscribers, consumers, transactions and data that our platform and our associated hosting infrastructure support. We will require significant capital expenditures and the allocation of valuable management resources to grow and change in these areas without undermining the core values of our corporate culture that have been critical to our growth so far. We believe that our corporate culture fosters innovation, creativity and teamwork. However, as our organization grows, we may find it increasingly difficult to maintain the beneficial aspects of such culture, and the failure to do so could adversely impact our ability to retain and attract the kind of employees necessary for our future success. If we are unable to manage our anticipated growth and change in a manner that preserves the key aspects of our culture, the quality of our products and services may suffer, which could adversely affect our brand and reputation and harm our ability to retain and attract subscribers.
We depend on our executive officers and other key employees, and the loss of one or more of these employees or an inability to attract and retain highly skilled employees could adversely affect our business.
Our success depends largely upon the continued services of our executive officers and other key employees, including our two founders, Richard L. Stollmeyer, our President and Chief Executive Officer, and Robert Murphy, our Chief Operating Officer. We rely on our leadership team in the areas of research and development, operations, security, marketing, sales, support, general and administrative functions, and on individual contributors in our research and development and operations. From time to time, there may be changes in our executive management team resulting from the hiring or departure of executives, which could disrupt our
27
Table of Contents
business. We do not have employment agreements with our executive officers or other key personnel that require them to continue to work for us for any specified period, and, therefore, they could terminate their employment with us at any time. The loss of one or more of our executive officers, especially our two founders or other key employees, could have an adverse effect on our business.
In addition, to execute our growth plan, we must attract and retain highly qualified personnel, particularly sales professionals and engineers experienced in designing and developing software and SaaS applications. Competition for these personnel in the locations where we maintain offices is intense, especially in the San Luis Obispo area, where our headquarters is located, due in part to the relatively close proximity to the San Francisco Bay Area. We have from time to time experienced, and we expect to continue to experience, difficulty in hiring and retaining employees with appropriate qualifications. In some cases, we have recruited employees from the San Francisco Bay Area and other regions with a greater supply of sales and engineering talent, and in such cases, we have sometimes found it necessary to offer compensation packages that were larger than would have been necessary if no relocation had been required. Many of the companies with which we compete for experienced personnel have greater resources than we have and are located in areas in which sales and engineering talent is more readily available. If we hire employees from competitors or other companies, their former employers may attempt to assert that these employees have breached their legal obligations, resulting in a diversion of our time and resources. In addition, job candidates and existing employees often consider the value of the equity awards they receive in connection with their employment. If the perceived value of our equity awards declines, our ability to recruit and retain highly skilled employees may be adversely impacted. If we fail to attract new personnel or fail to retain and motivate our current personnel, our business and future growth prospects could be adversely affected.
We do not have the history with our subscription or pricing models necessary to accurately predict optimal pricing necessary to attract new subscribers and retain existing subscribers.
We have limited experience with respect to determining the optimal prices for our platform. In January 2015, we introduced changes to our pricing model for new subscribers, and in the future we expect to make further changes to our pricing model from time to time. As the market for our platform matures, or as competitors introduce new products or services that compete with ours, we may be unable to attract new subscribers at the same price or based on the same pricing models that we have used historically. Moreover, we have limited experience selling subscriptions to larger organizations, which may demand substantial price concessions. As a result, in the future, we may be required to reduce our prices, which could adversely affect our revenue, gross margin, profitability, financial position and cash flow.
If we are not able to maintain and enhance our brand, our business, operating results, and financial condition may be adversely affected.
We believe that maintaining and enhancing our reputation as a differentiated and category-defining business management software company serving the wellness services industry is critical to our relationship with our existing subscribers and to our ability to attract new subscribers. The successful promotion of our brand attributes will depend on a number of factors, including our marketing efforts, our ability to continue to develop high-quality software, and our ability to successfully differentiate our platform from competitive products and services.
The promotion of our brand requires us to make substantial expenditures, and we anticipate that the expenditures will increase as our market becomes more competitive and as we seek to expand our platform. To the extent that these activities yield increased revenue, this revenue may not offset the increased expenses we incur. If we do not successfully maintain and enhance our brand, our business may not grow, we may have reduced pricing power relative to competitors, and we could lose subscribers or fail to attract potential subscribers, all of which would adversely affect our business, results of operations and financial condition.
Our financial results may fluctuate due to increasing variability in our sales cycles.
We plan our expenses based on certain assumptions about the length and variability of our sales cycle. These assumptions are based upon historical trends for sales cycles and conversion rates associated with our
28
Table of Contents
existing subscribers, many of whom to date have been small to medium-sized organizations. If we expand the focus of our sales efforts to larger organizations, our sales cycle could lengthen and become less predictable. Other factors that may influence the length and variability of our sales cycle include:
| • | our pricing terms, which were updated in January 2015 and will continue to vary over time; |
| • | the need to educate prospective subscribers about the uses and benefits of our platform; |
| • | the discretionary nature of purchasing and budget cycles and decisions; |
| • | the competitive nature of evaluation and purchasing processes; |
| • | evolving functionality demands; |
| • | announcements or planned introductions of new products, features or functionality by us or our competitors; and |
| • | lengthy purchasing approval processes, particularly among larger organizations. |
If we are unable to close one or more expected significant transactions with subscribers in a particular period, or if one or more expected transactions are delayed until a subsequent period, our operating results for that period, and for any future periods in which revenue from such transactions would otherwise have been recognized, may be adversely affected.
Unfavorable conditions in our industry or the global economy or reductions in information technology spending could limit our ability to grow our business and adversely affect our operating results.
Our operating results may vary based on the impact of changes in our industry or the global economy on us or our subscribers. The revenue growth and potential profitability of our business depend on demand for business management software generally and for business management software serving the wellness services industry in particular. Historically, during economic downturns, there have been reductions in spending on information technology as well as pressure for extended billing terms and other financial concessions. The adverse impact of economic downturns may be particularly acute among small and medium-sized businesses, which comprise the vast majority of our subscriber base. If economic conditions deteriorate, our current and prospective subscribers may elect to decrease their information technology budgets, which would limit our ability to grow our business and adversely affect our operating results.
The market for our integrated cloud-based business management software and payments platform is new and unproven and may not grow.
Our addressable market consists primarily of millions of small and medium-sized businesses in the wellness services industry, including businesses that offer yoga, Pilates, barre, indoor cycling, personal training, strength conditioning, martial arts and dance exercise, as well as spas, salons, music instruction studios, dance studios, children’s activity centers and integrative health centers. It is difficult to predict adoption and renewal rates, demand for our platform, the growth of this market, the entry of competitive products or services or the success of existing competitive products or services. Any expansion in this market depends on a number of factors, including the cost, performance and perceived value associated with our platform. You should consider our business and prospects in light of the risks and difficulties we encounter in this new and unproven market.
Expanding the focus of our sales efforts to include larger organizations could result in higher costs and longer and more unpredictable sales cycles.
In the future, we may expand the focus of our sales efforts to include larger organizations, which we believe would result in higher costs and longer and more unpredictable sales cycles. With larger organizations, the
29
Table of Contents
decision to subscribe to our platform may require the approval of more technical personnel and management levels within a potential subscriber’s organization than we have historically encountered, and if so, these types of sales would require us to invest more time educating these potential subscribers. In addition, larger organizations may demand more features and integration and customer support services. We have limited experience in developing and managing sales strategies for larger organizations and in successfully onboarding larger organizations as new subscribers. As a result of these factors, these sales opportunities may not prove to be successful or may require us to devote greater research and development, sales, customer support and professional services resources to individual subscribers, resulting in increased costs and reduced profitability, and will likely lengthen our typical sales cycle, which could strain our resources. Moreover, these larger transactions may require us to delay recognizing the associated revenue we derive from these subscribers until any technical or implementation requirements have been met, and larger subscribers may demand discounts to the prices they pay for our platform. If we are unsuccessful expanding sales to larger organizations, our business and results of operations could be adversely affected.
Our future performance depends in part on support from our partner ecosystem.
We depend on our partner ecosystem to create apps that will integrate with our platform. This presents certain risks to our business, including:
| • | these apps may not meet the same quality standards that we apply to our own development efforts, and to the extent they contain bugs or defects, they may create disruptions in our subscribers’ use of our platform or adversely affect our brand; |
| • | we do not currently provide substantive support for software apps developed by our partner ecosystem, and users may be left without adequate support and potentially cease using our platform if our partners do not provide adequate support for these apps; |
| • | our partners may not possess the appropriate intellectual property rights to develop and share their apps; |
| • | our relationship with our partners may change, which could adversely affect our revenue; and |
| • | some of our partners may use the insight they gain from integrating with our software and from information publicly available to develop competing products or product features. |
The number of actual consumers using our platform may be lower than the number we have estimated.
We estimate that 24 million active consumers used our platform in the two years ended December 31, 2014. While we do not directly monetize consumers of our subscribers’ services, we believe that growth in the number of active consumers on our platform also contributes to our subscriber growth. In calculating this number, we have attempted to avoid duplicative counting of consumers by identifying consumers who may have used our platform through different subscribers. However, in certain cases, a single consumer may have transacted with multiple subscribers under slightly different names, in which case there is a chance that we have counted the same consumer more than once. Given the challenges inherent in identifying whether a single consumer has engaged in transactions on our platform under different names, we do not have a reliable way of identifying the precise number of consumers using our platform. If the number of actual consumers is materially lower than our expectations, our business may not grow as fast as we expect, which could harm our operating and financial results and cause our stock price to decline.
Our international sales and operations subject us to additional risks that can adversely affect our business, operating results and financial condition.
In each of the years ended December 31, 2013 and 2014, we derived 14% and 16% of our revenue from subscribers located outside of the United States, respectively. In the three months ended March 31, 2014 and 2015, we derived 15% and 16% of our revenue from subscribers located outside of the United States, respectively. We are continuing to expand our international operations as part of our growth strategy. We currently have sales personnel
30
Table of Contents
and sales and customer support operations in the United States, the United Kingdom and Australia. Our sales organization outside the United States is substantially smaller than our sales organization in the United States. We believe our ability to convince new subscribers to subscribe to our platform or to convince existing subscribers to renew or expand their use of our platform is directly correlated to the level of engagement we obtain with the subscriber. To the extent we are unable to effectively engage with non-U.S. subscribers due to our limited sales force capacity, we may be unable to effectively grow in international markets.
Our international operations subject us to a variety of additional risks and challenges, including:
| • | increased management, travel, infrastructure and legal compliance costs associated with having multiple international operations; |
| • | longer payment cycles and difficulties in enforcing contracts, collecting accounts receivable or satisfying revenue recognition criteria, especially in emerging markets; |
| • | increased financial accounting and reporting burdens and complexities; |
| • | requirements or preferences for domestic products; |
| • | differing technical standards, existing or future regulatory and certification requirements and required features and functionality; |
| • | economic conditions in each country or region and general economic uncertainty around the world; |
| • | compliance with foreign privacy and security laws and regulations and the risks and costs of non-compliance; |
| • | compliance with laws and regulations for foreign operations, including anti-bribery laws (such as the U.S. Foreign Corrupt Practices Act of 1977, as amended, or the FCPA, the U.S. Travel Act, and the U.K. Bribery Act 2010), import and export control laws, tariffs, trade barriers, economic sanctions and other regulatory or contractual limitations on our ability to sell our platform in certain foreign markets, and the risks and costs of non-compliance; |
| • | heightened risks of unfair or corrupt business practices in certain geographies and of improper or fraudulent sales arrangements that may impact our financial results and result in restatements of our consolidated financial statements; |
| • | fluctuations in currency exchange rates and related effect on our operating results; |
| • | difficulties in repatriating or transferring funds from or converting currencies in certain countries; |
| • | communication and integration problems related to entering new markets with different languages, cultures and political systems; |
| • | differing labor standards, including restrictions related to, and the increased cost of, terminating employees in some countries; |
| • | the need for localized software and licensing programs; |
| • | the need for localized language support; |
| • | reduced protection for intellectual property rights in some countries and practical difficulties of enforcing rights abroad; and |
| • | compliance with the laws of numerous foreign taxing jurisdictions, including withholding obligations, and overlapping of different tax regimes. |
Any of these risks could adversely affect our international operations, reduce our international revenue or increase our operating costs, adversely affecting our business, operating results, financial condition and growth prospects.
31
Table of Contents
Compliance with laws and regulations applicable to our international operations substantially increases our cost of doing business in foreign jurisdictions. We may be unable to keep current with changes in government requirements as they change from time to time. Failure to comply with these regulations could have adverse effects on our business. In many foreign countries, it is common for others to engage in business practices that are prohibited by our internal policies and procedures or U.S. or other regulations applicable to us. Although we have implemented policies and procedures designed to ensure compliance with these laws and policies, there can be no assurance that all of our employees, contractors, partners and agents will comply with these laws and policies. Violations of laws or key control policies by our employees, contractors, partners, or agents could result in delays in revenue recognition, financial reporting misstatements, enforcement actions, disgorgement of profits, fines, civil and criminal penalties, damages, injunctions, other collateral consequences, or the prohibition of the importation or exportation of our platform and services and could adversely affect our business and results of operations.
If the market for SaaS business software applications develops more slowly than we expect or declines, our business would be adversely affected.
The market for SaaS business management software is less mature than the market for on-premise business software, and the adoption rate of SaaS business management software may be slower among subscribers in industries with heightened data security interests or business practices requiring highly customizable software solutions. Our success will depend to a substantial extent on the widespread adoption of SaaS business management software in general and for the wellness services industry in particular. Many organizations have invested substantial personnel and financial resources to integrate traditional on-premise business management software solutions into their businesses. As a result, such organizations may be reluctant or unwilling to migrate to SaaS-based solutions. It is difficult to predict subscriber adoption rates and demand for our platform, the future growth rate and size of the SaaS business software market or the entry of competitive solutions. The expansion of the SaaS business management software market depends on a number of factors, including the cost, performance, and perceived value associated with SaaS, as well as the ability of SaaS providers to address data security and privacy concerns. Additionally, government agencies have adopted, or may adopt, laws and regulations regarding the collection and use of personal information obtained from consumers and other individuals, or may seek to access information in our possession, either of which may reduce the overall demand for our platform. If we or other SaaS providers experience data security incidents, loss of subscriber data, disruptions in delivery, or other problems, the market for SaaS business management software, including our platform, may be adversely affected.
If SaaS business management software does not continue to achieve market acceptance, or there is a reduction in demand for SaaS business management software caused by a lack of subscriber acceptance, technological challenges, weakening economic conditions, data security or privacy concerns, governmental regulation, competing technologies and products, or decreases in information technology spending, our revenue could decrease and our business could be adversely affected.
We are subject to anti-corruption and anti-money laundering laws with respect to our operations and non-compliance with such laws can subject us to criminal and/or civil liability and harm our business.
We are subject to the FCPA, the U.S. domestic bribery statute contained in 18 U.S.C. § 201, the U.S. Travel Act, the USA PATRIOT Act, the U.K. Bribery Act 2010 and Proceeds of Crime Act 2002, and possibly other anti-bribery and anti-money laundering laws in countries in which we conduct activities. Anti-corruption laws are interpreted broadly and prohibit companies and their employees and third-party intermediaries from authorizing, offering, or providing, directly or indirectly, improper payments or benefits to recipients in the public or private sector. We use third-party representatives to sell our products and services abroad. In addition, as we increase our international sales and business, we may engage with additional business partners and third-party intermediaries to sell our products and services abroad and to obtain necessary permits, licenses, and other regulatory approvals. We or our third-party intermediaries may have direct or indirect interactions with officials and employees of government agencies or state-owned or affiliated entities. We can be held liable for the corrupt or other illegal activities of these third-party intermediaries, our employees, representatives, contractors, partners, and agents, even if we do not explicitly authorize such activities.
32
Table of Contents
Noncompliance with anti-corruption and anti-money laundering laws could subject us to whistleblower complaints, investigations, sanctions, settlements, prosecution, other enforcement actions, disgorgement of profits, significant fines, damages, other civil and criminal penalties or injunctions, suspension and/or debarment from contracting with certain persons, the loss of export privileges, reputational harm, adverse media coverage, and other collateral consequences. If any subpoenas or investigations are launched, or governmental or other sanctions are imposed, or if we do not prevail in any possible civil or criminal litigation, our business, results of operations and financial condition could be materially harmed. In addition, responding to any action will likely result in a materially significant diversion of management’s attention and resources and significant defense costs and other professional fees. Enforcement actions and sanctions could further harm our business, results of operations and financial condition.
Certain of our operating results and financial metrics may be difficult to predict as a result of seasonality.
We believe there are significant seasonal factors that may cause us to record higher revenue in some quarters compared with others. We believe this variability is largely due to our focus on the wellness services industry, as many of our subscribers experience an increase in demand for their services in the first quarter of each year due to their consumers becoming more motivated to pursue health and fitness goals in the new year. Our rapid growth rate over the last couple years may have made seasonal fluctuations more difficult to detect. If our rate of growth slows over time, seasonal or cyclical variations in our operations may become more pronounced, and our business, results of operations and financial position may be adversely affected.
Our business and growth depend in part on the success of our strategic relationships with third parties, including API platform partners, technology partners, payments partners and professional services partners.
We depend on, and anticipate that we will continue to depend on, various third-party relationships in order to sustain and grow our business. We are highly dependent upon partners for certain critical features and functionality of our platform, including data centers and third-party payment processors supporting our payments platform. Failure of these or any other technology provider to maintain, support or secure its technology platforms in general, and our integrations in particular, or errors or defects in its technology, could materially and adversely impact our relationship with our subscribers, damage our reputation and brand, and harm our business and operating results. Any loss of the right to use any of this hardware or software could result in delays or difficulties in our ability to provide our platform until equivalent technology is either developed by us or, if available, identified, obtained and integrated.
Identifying, negotiating and documenting relationships with strategic third parties such as API platform partners, payments partners and technology partners requires significant time and resources. In addition, integrating third-party technology is complex, costly and time-consuming. Our agreements with partners are typically limited in duration, non-exclusive and do not prohibit them from working with our competitors or from offering competing services. Our competitors may be effective in providing incentives to third parties to favor their products or services or to prevent or reduce subscriptions to our platform. In addition, our partners could develop competing products or services.
If we are unsuccessful in establishing or maintaining our relationships with these strategic third parties, our ability to compete in the marketplace or to grow our revenue could be impaired and our operating results could suffer. Even if we are successful, we cannot assure you that these relationships will result in improved operating results.
We depend and rely upon SaaS technologies from third parties and on technology systems and electronic communication networks that are supplied and managed by third parties to operate our business, and interruptions or performance problems with these technologies may adversely affect our business and operating results.
We rely heavily on hosted SaaS applications from third parties in order to operate critical functions of our business, including sales automation and pipeline management, billing and order management, enterprise
33
Table of Contents
resource planning, payroll and financial accounting services. If these services become unavailable due to extended outages, interruptions, or because they are no longer available on commercially reasonable terms, our expenses could increase, our ability to manage finances could be interrupted and our processes for managing sales of our platform and supporting our subscribers could be impaired until equivalent services, if available, are identified, obtained and implemented, all of which could adversely affect our business.
Our ability to provide services and solutions to our subscribers also depends on our ability to communicate with our subscribers through the public Internet and electronic networks that are owned and operated by third parties. In addition, in order to provide services on-demand and promptly, our computer equipment and network servers must be functional 24 hours per day, which requires access to telecommunications facilities managed by third parties and the availability of electricity, which we do not control. A severe disruption of one or more of these networks, including as a result of utility or third-party system interruptions, could impair our ability to process information, which could impede our ability to provide services to our subscribers, harm our reputation, result in a loss of subscribers and adversely affect our business and operating results.
We have in the past completed acquisitions, and we may in the future acquire or invest in other companies. Such acquisitions and investments divert our management’s attention and may in some cases result in additional dilution to our stockholders. In addition, we may be unable to integrate the acquired businesses and technologies successfully or achieve the expected benefits of such acquisitions.
We have in the past acquired other companies, and we may in the future evaluate and consider potential strategic transactions, including acquisitions of, or investments in, businesses, technologies, services, products and other assets in the future. We also may enter into relationships with other businesses to expand our platform, which could involve preferred or exclusive licenses, additional channels of distribution, discount pricing or investments in other companies.
Any acquisition, investment or business relationship may result in unforeseen operating difficulties and expenditures. In particular, we may encounter difficulties assimilating or integrating the businesses, technologies, products, personnel or operations of the acquired companies, particularly if the key personnel of the acquired company choose not to work for us, their software is not easily adapted to work with our platform or we have difficulty retaining the customers of any acquired business due to changes in ownership, management or otherwise. The pursuit of potential acquisitions may also disrupt our business, divert our resources and require significant management attention that would otherwise be available for development of our existing business, whether or not they are consummated. Moreover, the anticipated benefits of any acquisition, investment or business relationship may not be realized or we may be exposed to unknown risks or liabilities.
Negotiating these transactions can be time-consuming, difficult and expensive, and our ability to complete these transactions may be subject to approvals that are beyond our control. Consequently, these transactions, even if announced, may not be completed. For one or more of these transactions, we may:
| • | issue additional equity securities that would dilute our existing stockholders; |
| • | use cash that we may need in the future to operate our business; |
| • | incur large charges or substantial liabilities associated with the acquisition; |
| • | incur acquisition-related costs, which would be recognized as current period expenses; |
| • | encounter difficulties maintaining relationships with customers and partners of the acquired business; |
| • | encounter difficulties incorporating acquired technologies and rights into our platform and of maintaining quality and security standards consistent with our reputation and brand; |
| • | incur debt on terms unfavorable to us or that we are unable to repay; |
34
Table of Contents
| • | encounter difficulties retaining key employees of the acquired company, integrating diverse software codes or business cultures or coordinating organizations that are geographically diverse and that have different business cultures; and |
| • | become subject to adverse tax consequences, substantial depreciation or deferred compensation charges. |
We may be sued by third parties for alleged infringement of their proprietary rights.
There is considerable patent and other intellectual property development activity in our industry. Our future success depends in part on not infringing upon the intellectual property rights of others. From time to time, we may receive claims from third parties, including our competitors, that our platform and underlying technology infringe or violate a third party’s intellectual property rights, and we may be found to be infringing upon such rights. We may be unaware of the intellectual property rights of others that may cover some or all of our technology. Any claims or litigation could cause us to incur significant expenses and, if successfully asserted against us, could require that we pay substantial damages or ongoing royalty payments, prevent us from offering our platform, or require that we comply with other unfavorable terms. We may also be obligated to indemnify our subscribers or business partners in connection with any such litigation and to obtain licenses, modify our platform or refund subscription fees, which could further exhaust our resources. In addition, we may incur substantial costs to resolve claims or litigation, whether or not successfully asserted against us, which could include payment of significant settlement, royalty or license fees, modification of our platform or refunds to subscribers of subscription fees. Even if we were to prevail in the event of claims or litigation against us, any claim or litigation regarding our intellectual property could be costly and time-consuming and divert the attention of our management and other employees from our business operations.
Our use of “open source” software could adversely affect our ability to sell our platform and subject us to possible litigation.
We use open source software in our platform and expect to continue to use open source software in the future. We may face claims from others claiming ownership of, or seeking to enforce the terms of, an open source license, including by demanding release of the open source software, derivative works or our proprietary source code that was developed using such software. These claims could also result in litigation, require us to purchase a costly license or require us to devote additional research and development resources to change our platform, any of which would have a negative effect on our business and operating results. In addition, if the license terms for the open source software we utilize change, we may be forced to reengineer our platform or incur additional costs. Although we have implemented policies to regulate the use and incorporation of open source software into our platform, we cannot be certain that we have not incorporated open source software in our platform in a manner that is inconsistent with such policies.
Any failure to protect our intellectual property rights could impair our ability to protect our proprietary technology and our brand.
Our success and ability to compete depend in part upon our intellectual property. We currently have 16 pending patent applications, but there is no guarantee that such applications will result in issued patents. We primarily rely on copyright, trade secret and trademark laws, trade secret protection and confidentiality or license agreements with our employees, subscribers, partners and others to protect our intellectual property rights. However, the steps we take to protect our intellectual property rights may be inadequate.
To protect our intellectual property rights, we may be required to spend significant resources to monitor and protect these rights. Litigation brought to protect and enforce our intellectual property rights could be costly, time-consuming and distracting to management, and could result in the impairment or loss of portions of our intellectual property. Furthermore, our efforts to enforce our intellectual property rights may be met with
35
Table of Contents
defenses, counterclaims and countersuits attacking the validity and enforceability of our intellectual property rights. Our failure to secure, protect and enforce our intellectual property rights could adversely affect our brand and adversely impact our business.
Our subscribers may become dissatisfied with our platform if they receive negative reviews from consumers using Connect. In addition, we may face potential liability and expense for legal claims based on the content of such reviews on Connect.
Our subscribers consist of businesses in the wellness services industry, including studios that offer yoga, Pilates, barre, indoor cycling, personal training, strength conditioning, martial arts and dance exercise, as well as spas, salons, music instruction studios, dance studios, children’s activity centers and integrative health centers. In addition to the business management software we provide to our subscribers, we also offer Connect, which is a consumer-facing app that allows consumers to discover, book and pay for the wellness services offered by our subscribers. After receiving a service or taking a class booked through Connect, consumers can rate their experience by posting reviews. If consumers use Connect to post negative reviews regarding our subscribers or their practitioners, our subscribers may become dissatisfied with our platform and cancel their subscriptions or not use Connect to market their services to a broader group of consumers. In addition, there is a risk that consumers may post comments on the Connect platform that give rise to potential claims against us, including claims by our subscribers or other third parties for defamation, libel, negligence and copyright or trademark infringement. Any such claims could divert the time and attention of management away from our business and result in significant costs to investigate and defend, regardless of the merits of the claims. In some instances, we may elect or be compelled to remove reviews or other posted content and may be forced to pay substantial damages. If the reviews or other content posted by consumers on our Connect platform gives rise to the consequences described above, our business and financial performance could be adversely affected.
We may not be able to secure additional financing on favorable terms, or at all, to meet our future capital needs.
We have funded our operations since inception primarily through equity financings, loan facilities, financing agreements for software and license maintenance and subscription payments by our subscribers for use of our platform. We do not know when or if our operations will generate sufficient cash to fund our ongoing operations. In the future, we intend to continue to make investments to support our business growth, and we may require additional capital to respond to business opportunities, challenges, acquisitions, a decline in the level of subscriptions for our platform or unforeseen circumstances. We may not be able to timely secure additional debt or equity financing on favorable terms, or at all. Any debt financing obtained by us could involve restrictive covenants relating to financial and operational matters, which may make it more difficult for us to obtain additional capital and to pursue business opportunities, including potential acquisitions. If we raise additional funds through further issuances of equity, convertible debt securities or other securities convertible into equity, our existing stockholders could suffer significant dilution in their percentage ownership of our company, and any new equity securities we issue could have rights, preferences and privileges senior to those of holders of our Class A common stock. If we are unable to obtain adequate financing or financing on terms satisfactory to us, when we require it, our ability to continue to grow or support our business and to respond to business challenges could be significantly limited.
Our loan agreement contains operating and financial covenants that restrict our business and financing activities.
Borrowings under our loan agreement with Silicon Valley Bank are secured by substantially all of our assets, including our intellectual property. In addition, borrowings under our loan agreement are made based on a percentage of our monthly recurring revenue for the prior months, up to $20 million. If our revenue declines, our ability to draw under the loan agreement could be adversely affected.
36
Table of Contents
Our loan agreement also restricts our ability to, among other things:
| • | sell or otherwise dispose of our assets; |
| • | make material changes in our business; |
| • | enter into a transaction in which stockholders who were not stockholders immediately prior to such transaction own more than 40% of our voting stock after giving effect to such transaction (other than pursuant to an initial public offering and certain other exceptions); |
| • | consolidate, merge with, or acquire other entities; |
| • | incur additional indebtedness; |
| • | create liens on our assets; |
| • | pay dividends or make other distributions on our capital stock; |
| • | make investments; |
| • | enter into transactions with affiliates; and |
| • | pay off or redeem subordinated indebtedness. |
These restrictions are subject to certain exceptions. In addition, our loan agreement requires us to maintain a certain percentage of our projected revenue. The operating and financial restrictions and covenants in the loan agreement, as well as any future financing agreements that we may enter into, could restrict our ability to finance our operations and to engage in, expand or otherwise pursue business activities and strategies that we or our stockholders may consider beneficial. Our ability to comply with these covenants may be affected by events beyond our control, and future breaches of any of these covenants could result in a default under the loan agreement.
The loan agreement also contains customary events of default, subject to cure periods for certain defaults, including, among others, payment defaults, covenant defaults, the occurrence of a material adverse change in our business, defaults relating to certain legal processes affecting our assets or business, insolvency and bankruptcy defaults, cross-defaults to other material indebtedness, material judgment defaults, and material misrepresentations. Future defaults, if not waived, could cause all of the outstanding indebtedness under our loan agreement to become immediately due and payable and would permit Silicon Valley Bank to terminate all commitments to extend further credit and exercise remedies against the collateral in which we granted Silicon Valley Bank a security interest.
If we do not have or are unable to generate sufficient cash available to repay our debt obligations when they become due and payable, either upon maturity or in the event of a default, we may not be able to obtain additional debt or equity financing on favorable terms, if at all. This could materially and adversely affect our liquidity and financial condition and our ability to operate and continue our business as a going concern.
We have in the past identified material weaknesses in our internal controls over financial reporting that, if not properly remediated, could result in material misstatements in our financial statements in future periods and impair our ability to comply with the accounting and reporting requirements applicable to public companies.
Our independent registered public accounting firm has not conducted an audit of our internal controls over financial reporting. However, as described below, in connection with the audits of our consolidated financial statements, we identified material weaknesses in the design of our internal control over financial reporting, as defined in the standards established by the Public Company Accounting Oversight Board of the U.S. A material weakness is a deficiency, or a combination of deficiencies, in internal control over financial reporting such that there is a reasonable possibility that a material misstatement of our annual or interim financial statements will not be prevented or detected on a timely basis. In connection with the audit of our consolidated financial statements as of and for the year ended December 31, 2012, we discovered two material weaknesses that resulted from (i) a
37
Table of Contents
lack of a sufficient number of qualified personnel within our accounting department that possessed an appropriate level of expertise to perform certain accounting functions and (ii) the failure to establish proper access controls to our accounting software and proper controls to review and approve manual journal entries. In connection with the audit of our consolidated financial statements as of and for the year ended December 31, 2013, we discovered a material weakness related to the inadequate design and implementation of controls and procedures with respect to capitalization of development costs for internal use software. Finally, in connection with the audit of our consolidated financial statements as of and for the years ended December 31, 2013 and 2014, we identified a material weakness related to the inadequate design and implementation of controls and procedures with respect to the identification of and evaluation of accounting for certain features, including the related fair value computation, and transactions related to our redeemable convertible preferred stock. Please see “Management’s Discussion and Analysis of Financial Condition and Results of Operations—Internal Control Over Financial Reporting” for information regarding our remediation efforts. Our management and independent registered public accounting firm did not and were not required to perform an evaluation of our internal control over financial reporting as of and for the years ended December 31, 2013 and 2014 in accordance with the provisions of the JOBS Act.
We believe that we have remediated the material weaknesses from our 2012 audit and the material weakness from our 2013 audit related to capitalization of development costs for internal use software. Although the material weakness from our 2013 and 2014 audit related to the accounting for certain features of and transactions related to our redeemable convertible preferred stock had not been remediated as of December 31, 2014, all shares of redeemable convertible preferred stock will be automatically converted into shares of Class B common stock immediately prior to the completion of this offering. As a result, following the offering, we will no longer be subject to the accounting rules that gave rise to the material weakness. Nevertheless, we cannot be certain that other material weaknesses and control deficiencies will not be discovered in the future. If our remediation efforts are not successful or other material weaknesses or control deficiencies occur in the future, we may be unable to report our financial results accurately or on a timely basis, which could cause our reported financial results to be materially misstated and result in the loss of investor confidence or delisting and cause the trading price of our common stock to decline. As a result of such failures, we could also become subject to investigations by the stock exchange on which our securities are listed, the SEC, or other regulatory authorities, and become subject to litigation from investors and stockholders, which could harm our reputation, financial condition or divert financial and management resources from our core business.
We face exposure to foreign currency exchange rate fluctuations.
We conduct transactions in currencies other than the U.S. dollar. While we have primarily transacted with subscribers and vendors in U.S. dollars, we have transacted in foreign currencies for subscriptions to our platform and expect to significantly expand the number of transactions with subscribers for our platform that are denominated in foreign currencies in the future. As a result of such foreign currency exchange rate fluctuations, it could be more difficult to detect underlying trends in our business and results of operations. In addition, to the extent that fluctuations in currency exchange rates cause our results of operations to differ from our expectations or the expectations of our investors, the trading price of our Class A common stock could be adversely affected.
We do not currently maintain a program to hedge transactional exposures in foreign currencies. However, in the future, we may use derivative instruments, such as foreign currency forward and option contracts, to hedge certain exposures to fluctuations in foreign currency exchange rates. The use of such hedging activities may not offset any or more than a portion of the adverse financial effects of unfavorable movements in foreign exchange rates over the limited time the hedges are in place. Moreover, the use of hedging instruments may introduce additional risks if we are unable to structure effective hedges with such instruments.
We may be subject to additional tax liabilities in connection with our operations or due to future legislation, each of which could materially impact our financial position and results of operation.
We are subject to federal and state income, sales, use, value added and other taxes in the United States and other countries in which we conduct business, and such laws and rates vary by jurisdiction. We do not collect
38
Table of Contents
sales and use, value added and similar taxes in all jurisdictions in which we have sales, based on our belief that such taxes are not applicable. Certain jurisdictions in which we do not collect sales, use, value added or other taxes on our sales may assert that such taxes are applicable, which could result in tax assessments, penalties and interest, and we may be required to collect such taxes in the future.
Significant judgment is required in determining our worldwide provision for income taxes. We generally conduct our international operations through wholly owned subsidiaries and report our taxable income in various jurisdictions worldwide based upon our business operations in those jurisdictions. Our intercompany relationships are subject to complex transfer pricing regulations administered by taxing authorities in various jurisdictions. These determinations are highly complex and require detailed analysis of the available information and applicable statutes and regulatory materials. In the ordinary course of our business, there are many transactions and calculations where the ultimate tax determination is uncertain.
Although we believe our tax practices and provisions are reasonable, the final determination of tax audits and any related litigation could be materially different from our historical tax practices, provisions and accruals. If we receive an adverse ruling as a result of an audit, or we unilaterally determine that we have misinterpreted provisions of the tax regulations to which we are subject, there could be a material effect on our tax provision, net income or cash flows in the period or periods for which that determination is made, which could materially impact our financial results. Further, any changes in the taxation of our activities, including certain proposed changes in U.S. tax laws, may increase our worldwide effective tax rate and adversely affect our financial position and results of operations. In addition, liabilities associated with taxes are often subject to an extended or indefinite statute of limitations period. Therefore, we may be subject to additional tax liability (including penalties and interest) for a particular year for extended periods of time.
Our ability to use our net operating losses to offset future taxable income may be subject to certain limitations.
As of December 31, 2014, we had federal and state net operating loss carryforwards, or NOLs, of $58.8 million and $47.4 million, respectively, due to prior period losses, which, subject to the following discussion, are generally available to be carried forward to offset our future taxable income, if any, until such NOLs are used or expire. Our federal NOLs begin to expire in the year ending December 31, 2025, and our state NOLs begin to expire in the year ending December 31, 2015. In general, under Section 382 of the Internal Revenue Code of 1986, as amended, or the Code, a corporation that undergoes an “ownership change” is subject to limitations on its ability to utilize its NOLs to offset future taxable income. Similar rules may apply under state tax laws. Our existing NOLs may be subject to limitations arising from previous ownership changes, and if we undergo an ownership change in connection with or after this offering, our ability to utilize NOLs could be further limited by Section 382 of the Code. Future changes in our stock ownership, some of which are outside of our control, could result in an ownership change under Section 382 of the Code. Furthermore, our ability to utilize NOLs of companies that we have acquired or may acquire in the future may be subject to limitations. There is also a risk that due to regulatory changes, such as suspensions on the use of NOLs, or other unforeseen reasons, our existing NOLs could expire or otherwise be unavailable to offset future income tax liabilities. For these reasons, we may not be able to realize a tax benefit from the use of our NOLs, whether or not we attain profitability.
The estimates of market opportunity and forecasts of market growth included in this prospectus may prove to be inaccurate, and even if the market in which we compete achieves the forecasted growth, our business could fail to grow at similar rates, if at all.
Market opportunity estimates and growth forecasts are subject to significant uncertainty and are based on assumptions and estimates that may not prove to be accurate. The estimates and forecasts in this prospectus relating to the size and expected growth of the market for business management software serving the wellness services industry may prove to be inaccurate. Even if the market in which we compete meets the size estimates and growth forecasted in this prospectus, our business could fail to grow at similar rates, if at all. For more information regarding the estimates of market opportunity and the forecasts of market growth included in this prospectus, see the section titled “Market, Industry and Other Data.”
39
Table of Contents
Changes in laws and regulations related to the Internet or changes in the Internet infrastructure itself may diminish the demand for our platform, and could have a negative impact on our business.
The future success of our business depends upon the continued use of the Internet as a primary medium for commerce, communication and business applications. Federal, state or foreign government bodies or agencies have in the past adopted, and may in the future adopt, laws or regulations affecting the use of the Internet as a commercial medium. Changes in these laws or regulations could require us to modify our platform in order to comply with these changes. In addition, government agencies or private organizations have imposed and may impose additional taxes, fees or other charges for accessing the Internet or commerce conducted via the Internet. These laws or charges could limit the growth of Internet-related commerce or communications generally, or result in reductions in the demand for Internet-based platforms and services such as ours. In addition, the use of the Internet as a business tool could be adversely affected due to delays in the development or adoption of new standards and protocols to handle increased demands of Internet activity, security, reliability, cost, ease-of-use, accessibility and quality of service. The performance of the Internet and its acceptance as a business tool has been adversely affected by “viruses,” “worms” and similar malicious programs, and the Internet has experienced a variety of outages and other delays as a result of damage to portions of its infrastructure. If the use of the Internet is adversely affected by these issues, demand for our platform could decline.
Catastrophic events may disrupt our business.
Our corporate headquarters are located in San Luis Obispo, California, and we operate or utilize data centers that are located in North America. Key features and functionality of our platform are enabled by third parties that are headquartered in California and operate or utilize data centers in the United States. Additionally, we rely on our network and third-party infrastructure and enterprise applications, internal technology systems, and our website for our development, marketing, operational support, hosted services and sales activities. The west coast of the United States contains active earthquake zones. In addition, the Diablo Canyon nuclear power plant is located a short distance from San Luis Obispo. In the event of a major earthquake, hurricane or other natural disaster, or a catastrophic event such as a nuclear disaster, fire, power loss, telecommunications failure, cyber-attack, war or terrorist attack, we may be unable to continue our operations and may endure system interruptions, reputational harm, delays in our app development, lengthy interruptions in our platform, breaches of data security or data integrity and loss of critical data, all of which could have an adverse effect on our future operating results.
We are subject to governmental economic sanctions and export and import controls that could impair our ability to compete in international markets or subject us to liability if we are not in compliance with applicable laws.
As a U.S. company, we are subject to U.S. export control and economic sanctions laws and regulations, and we are required to export our technology, software, products and services in compliance with those laws and regulations, including the U.S. Export Administration Regulations and economic embargo and trade sanction programs administered by the Treasury Department’s Office of Foreign Assets Control. U.S. economic sanctions and export control laws and regulations prohibit the shipment of certain products and services to countries, governments and persons targeted by U.S. sanctions. While we are currently taking precautions to prevent doing any business, directly or indirectly, with countries, governments and persons targeted by U.S. sanctions and to ensure that our business management software is not exported or used by countries, governments and persons targeted by U.S. sanctions, such measures may be circumvented.
Furthermore, if we export our technology, hardware or software, the exports may require authorizations, including a license, a license exception or other appropriate government authorization. Complying with export control and sanctions regulations for a particular sale may be time-consuming and may result in the delay or loss of sales opportunities. Failure to comply with export control and sanctions regulations for a particular sale may expose us to government investigations and penalties, which could have an adverse effect on our business, operating results and financial condition.
40
Table of Contents
If we are found to be in violation of U.S. sanctions or export control laws, it could result in fines or penalties for us and for individuals, including civil penalties of up to $250,000 or twice the value of the transaction, whichever is greater, per violation, and in the event of conviction for a criminal violation for willful and knowing violations, fines of up to $1 million and possible incarceration for those responsible could be imposed against employees and managers. In addition, we may lose our export or import privileges and suffer reputational harm.
In addition, various countries regulate the import of certain encryption technology, including imposing import permitting and licensing requirements, and have enacted laws that could limit our ability to offer our platform or distribute our platform or could limit our subscribers’ ability to implement our platform in those countries. Changes in our platform or future changes in export and import regulations may create delays in the introduction of our platform in international markets or prevent our subscribers with international operations from deploying our platform globally. Any change in export or import regulations, economic sanctions or related legislation, or change in the countries, governments, persons, or technologies targeted by such regulations, could result in decreased use of our platform by, or in our decreased ability to export or sell our platform to, existing or potential subscribers with international operations. Any decreased use of our platform or limitation on our ability to export or sell our platform would likely adversely affect our business operations and financial results.
Risks Related to Ownership of Our Class A Common Stock and this Offering
The dual class structure of our common stock has the effect of concentrating voting control with those stockholders who held our capital stock prior to the completion of this offering, including our executive officers, employees and directors and their affiliates, which will limit your ability to influence the outcome of important transactions, including a change in control.
Our Class B common stock has 10 votes per share, and our Class A common stock, which is the stock we are offering in this offering, has one vote per share. All shares of our capital stock outstanding immediately prior to this offering, including all shares held by our executive officers, employees and directors, and their respective affiliates, will be reclassified into shares of our Class B common stock immediately prior to this offering. Upon the completion of this offering, holders of our outstanding Class B common stock will collectively hold approximately 97.8% of the voting power of our outstanding capital stock. Because of the ten-to-one voting ratio between our Class B common stock and Class A common stock, after the completion of this offering, the holders of our Class B common stock will collectively continue to control a majority of the combined voting power of our capital stock and therefore be able to control all matters submitted to our stockholders for approval so long as the shares of our Class B common stock represent at least 9.1% of all outstanding shares of our Class A common stock and Class B common stock. These holders of our Class B common stock may also have interests that differ from yours and may vote in a way with which you disagree and which may be adverse to your interests. This concentrated control may have the effect of delaying, preventing or deterring a change in control of our company, could deprive our stockholders of an opportunity to receive a premium for their capital stock as part of a sale of our company and might ultimately affect the market price of our Class A common stock.
Future transfers by holders of our Class B common stock will generally result in those shares converting into shares of our Class A common stock, subject to limited exceptions, such as certain transfers effected for tax or estate planning purposes. The conversion of shares of our Class B common stock into shares of our Class A common stock will have the effect, over time, of increasing the relative voting power of those holders of Class B common stock who retain their shares in the long term. If, for example, Messrs. Stollmeyer and Murphy retain a significant portion of their holdings of our Class B common stock for an extended period of time, they could control a significant portion of the voting power of our capital stock for the foreseeable future. In addition, Messrs. Stollmeyer and Murphy hold an irrevocable proxy to vote shares of our Class B common stock held by certain of our stockholders, as described in the section titled “Principal Stockholders.” As board members, Messrs. Stollmeyer and Murphy each owe a fiduciary duty to our stockholders and must act in good faith and in a manner they reasonably believe to be in the best interests of our stockholders. As stockholders, Messrs. Stollmeyer and Murphy are entitled to vote their shares in their own interests, which may not always be in the interests of our stockholders generally. For a description of the dual class structure, see the section titled “Description of Capital Stock.”
41
Table of Contents
Anti-takeover provisions contained in our amended and restated certificate of incorporation and amended and restated bylaws, as well as provisions of Delaware law, could impair a takeover attempt.
Our amended and restated certificate of incorporation, amended and restated bylaws and Delaware law contain or will contain provisions which could have the effect of rendering more difficult, delaying or preventing an acquisition deemed undesirable by our board of directors. Among other things, our amended and restated certificate of incorporation and amended and restated bylaws will include provisions:
| • | establishing a classified board of directors whose members serve staggered three-year terms; |
| • | authorizing “blank check” preferred stock, which could be issued by our board of directors without stockholder approval and may contain voting, liquidation, dividend and other rights superior to our common stock; |
| • | limiting the liability of, and providing indemnification to, our directors and officers; |
| • | limiting the ability of our stockholders to call and bring business before special meetings; |
| • | requiring advance notice of stockholder proposals for business to be conducted at meetings of our stockholders and for nominations of candidates for election to our board of directors; |
| • | controlling the procedures for the conduct and scheduling of board of directors and stockholder meetings; and |
| • | authorizing two classes of common stock, as discussed above. |
These provisions, alone or together, could delay or prevent hostile takeovers and changes in control or changes in our management.
As a Delaware corporation, we are also subject to provisions of Delaware law, including Section 203 of the Delaware General Corporation Law, which prevents certain stockholders holding more than 15% of our outstanding capital stock from engaging in certain business combinations without approval of the holders of at least two-thirds of our outstanding common stock not held by any such stockholder.
Any provision of our amended and restated certificate of incorporation, amended and restated bylaws or Delaware law that has the effect of delaying, preventing or deterring a change in control could limit the opportunity for our stockholders to receive a premium for their shares of our capital stock, and could also affect the price that some investors are willing to pay for our Class A common stock.
An active trading market for our Class A common stock may never develop or be sustained.
Our Class A common stock has been approved for listing on The NASDAQ Global Market under the symbol “MB.” However, we cannot assure you that an active trading market for our Class A common stock will develop on that exchange or elsewhere or, if developed, that any market will be sustained. Accordingly, we cannot assure you of the liquidity of any trading market, your ability to sell your shares of our Class A common stock when desired or the prices that you may obtain for your shares of our Class A common stock.
The market price of our Class A common stock may be volatile, and you could lose all or part of your investment.
Prior to the completion of this offering, there has been no public market for shares of our Class A common stock. The initial public offering price of our Class A common stock will be determined through negotiation between us and the underwriters. This price will not necessarily reflect the price at which investors in the market will be willing to buy and sell shares of our Class A common stock following this offering. In addition, the market price of our Class A common stock following this offering is likely to be highly volatile, may be higher or lower than the initial public offering price of our Class A common stock and could be subject to wide
42
Table of Contents
fluctuations in response to various factors, some of which are beyond our control and may not be related to our operating performance.
Fluctuations in the market price of our Class A common stock could cause you to lose all or part of your investment because you may not be able to sell your shares at or above the price you paid in this offering. Factors that could cause fluctuations in the market price of our Class A common stock include the following:
| • | price and volume fluctuations in the overall stock market from time to time; |
| • | volatility in the market prices and trading volumes of technology securities; |
| • | changes in operating performance and stock market valuations of other technology companies generally or those in our industry in particular; |
| • | sales of shares of our Class A common stock by us or our stockholders; |
| • | failure of securities analysts to maintain coverage of us, changes in financial estimates by securities analysts who follow us, or our failure to meet these estimates or the expectations of investors; |
| • | the financial projections we may provide to the public, any changes in those projections or our failure to meet those projections; |
| • | announcements by us or our competitors of new products or services; |
| • | the public’s reaction to our press releases, other public announcements and filings with the SEC; |
| • | rumors and market speculation involving us or other companies in our industry; |
| • | actual or anticipated changes in our operating results or fluctuations in our operating results; |
| • | actual or anticipated developments in our business, our competitors’ businesses or the competitive landscape generally; |
| • | litigation involving us, our industry or both, or investigations by regulators into our operations or those of our competitors; |
| • | developments or disputes concerning our intellectual property or other proprietary rights; |
| • | announced or completed acquisitions of businesses or technologies by us or our competitors; |
| • | new laws or regulations or new interpretations of existing laws or regulations applicable to our business; |
| • | changes in accounting standards, policies, guidelines, interpretations or principles; |
| • | any significant change in our management; and |
| • | general economic conditions and slow or negative growth of our markets. |
In addition, in the past, following periods of volatility in the overall market and the market price of a particular company’s securities, securities class action litigation has often been instituted against these companies. This litigation, if instituted against us, could result in substantial costs and a diversion of our management’s attention and resources.
A substantial number of the outstanding shares of our capital stock after this offering will be restricted from immediate resale but may be sold on a stock exchange in the near future. The large number of shares of our capital stock eligible for public sale or subject to rights requiring us to register them for public sale could depress the market price of our Class A common stock.
The market price of our Class A common stock could decline as a result of sales of a large number of shares of our Class A common stock in the market after this offering, and the perception that these sales could occur
43
Table of Contents
may also depress the market price of our Class A common stock. Based on shares of our capital stock outstanding as of March 31, 2015, we will have 39,117,544 shares of our capital stock outstanding after this offering. Our executive officers, directors and the holders of substantially all of our capital stock and securities convertible into or exchangeable for our capital stock have entered into market standoff agreements with us or lock-up agreements with the underwriters under which they have agreed, subject to specific exceptions, not to sell any of our capital stock for 180 days following the date of this prospectus. Morgan Stanley & Co. LLC, however, on behalf of the underwriters, may permit our officers, directors and other stockholders who are subject to these lock-up agreements to sell shares prior to the end of the lock-up period. As a result of these agreements and the provisions of Rule 144 or Rule 701 under the Securities Act of 1933, as amended, or the Securities Act, shares of our capital stock will be available for sale in the public market as follows:
| • | beginning on the date of this prospectus, all 7,150,000 shares of our Class A common stock sold in this offering will be immediately available for sale in the public market; and |
| • | beginning 180 days after the date of this prospectus, the remainder of the shares of our capital stock will be eligible for sale in the public market from time to time thereafter, subject in some cases to the volume and other restrictions of Rule 144 and our insider trading policy. |
However, if entities associated with J.P. Morgan Investment Management Inc., one of our existing holders of greater than 5% of our common stock, purchase shares of our Class A common stock in this offering, such shares will be subject to a lock-up agreement under which such entities will agree, subject to specific exceptions, not to sell such shares for 180 days following the date of this prospectus. If such entities were to purchase $10.0 million of our Class A common stock in this offering, based upon the assumed initial public offering price of $14.00 per share, which is the midpoint of the estimated offering price range set forth on the cover page of this prospectus, 6,435,715 shares of our Class A common stock sold in this offering will be immediately available for sale in the public market beginning on the date of this prospectus. In addition, if any of the participants in our directed share program purchases $500,000 or greater of our Class A common stock in the directed share program, such shares will be subject to a lock-up agreement under which such participants will agree, subject to specific exceptions, not to sell such shares for 90 days following the date of this prospectus. See the applicable lock-up restrictions described in the section titled “Shares Eligible for Future Sale” for additional information.
Following the expiration of the market standoff and lock-up agreements referred to above, stockholders owning an aggregate of up to 27,543,986 shares of our Class B common stock can require us to register shares of our capital stock owned by them for public sale in the United States. In addition, we intend to file a registration statement to register approximately 9,922,993 shares of our capital stock reserved for future issuance under our equity incentive plans. Upon effectiveness of that registration statement, subject to the satisfaction of applicable exercise periods and expiration of the market standoff agreements and lock-up agreements referred to above, the shares of our capital stock issued upon exercise of outstanding options to purchase shares of our Class B common stock will be available for immediate resale in the United States in the open market.
Sales of our Class A common stock as restrictions end or pursuant to registration rights may make it more difficult for us to sell equity securities in the future at a time and at a price that we deem appropriate. These sales also could cause the market price of our Class A common stock to decline and make it more difficult for you to sell shares of our Class A common stock.
In making your investment decision, you should understand that we and the underwriters have not authorized any other party to provide you with information concerning us or this offering.
You should carefully evaluate all of the information in this prospectus. We have in the past received, and may continue to receive, a significant degree of media coverage, including coverage that is not directly attributable to statements made by our officers or employees, that incorrectly reports on statements made by our officers or employees or that is misleading as a result of omitting information provided by us, our officers or employees. We and the underwriters have not authorized any other party to provide you with information concerning us or this offering.
44
Table of Contents
We may invest or spend the proceeds of this offering in ways with which you may not agree or in ways which may not yield a return.
Our net proceeds from the sale of shares of our Class A common stock in this offering will be used for general corporate purposes, including working capital, operating expenses and capital expenditures. Additionally, we may use a portion of the net proceeds to acquire businesses, products, services or technologies. However, we do not have agreements or commitments for any material acquisitions at this time. We will have broad discretion in using these proceeds, and you will not have the opportunity, as part of your investment decision, to assess whether the proceeds are being used appropriately. Until the net proceeds are used, they may be placed in investments that do not produce significant income or that may lose value.
The requirements of being a public company may strain our resources, divert management’s attention and affect our ability to attract and retain qualified board members.
As a public company, we will be subject to the reporting requirements of the Securities Exchange Act of 1934, as amended, or the Exchange Act, the listing requirements of the securities exchange on which our common stock will be traded and other applicable securities rules and regulations. Compliance with these rules and regulations will increase our legal and financial compliance costs, make some activities more difficult, time-consuming or costly, and increase demand on our systems and resources. Among other things, the Exchange Act requires that we file annual, quarterly and current reports with respect to our business and results of operations and maintain effective disclosure controls and procedures and internal control over financial reporting. In order to maintain and, if required, improve our disclosure controls and procedures and internal control over financial reporting to meet this standard, significant resources and management oversight may be required. As a result, management’s attention may be diverted from other business concerns, which could harm our business and results of operations. Although we have already hired additional employees to comply with these requirements, we may need to hire even more employees in the future, which will increase our costs and expenses.
In addition, changing laws, regulations and standards relating to corporate governance and public disclosure are creating uncertainty for public companies, increasing legal and financial compliance costs, and making some activities more time consuming. These laws, regulations and standards are subject to varying interpretations, in many cases due to their lack of specificity, and as a result, their application in practice may evolve over time as new guidance is provided by regulatory and governing bodies. This could result in continuing uncertainty regarding compliance matters and higher costs necessitated by ongoing revisions to disclosure and governance practices. We intend to invest resources to comply with evolving laws, regulations, and standards, and this investment will increase our general and administrative expense and a diversion of management’s time and attention from revenue-generating activities to compliance activities. If our efforts to comply with new laws, regulations, and standards are unsuccessful, regulatory authorities may initiate legal proceedings against us and our business may be harmed.
We also expect that being a public company and these new rules and regulations will make it more expensive for us to obtain director and officer liability insurance, and we may be required to accept reduced coverage or incur substantially higher costs to obtain coverage. These factors could also make it more difficult for us to attract and retain qualified executive officers and members of our board of directors, particularly to serve on our audit committee and compensation committee.
In addition, as a result of our disclosure obligations as a public company, we will have reduced strategic flexibility and will be under pressure to focus on short-term results, which may adversely impact our ability to achieve long-term profitability.
We are an “emerging growth company,” and we cannot be certain if the reduced disclosure requirements applicable to emerging growth companies will make our common stock less attractive to investors.
For so long as we remain an “emerging growth company,” as defined in the JOBS Act, we may take advantage of certain exemptions from various requirements that are applicable to public companies that are not
45
Table of Contents
“emerging growth companies,” including not being required to comply with the independent auditor attestation requirements of Section 404 of the Sarbanes-Oxley Act, reduced disclosure obligations regarding executive compensation in our periodic reports and proxy statements, and exemptions from the requirements of holding a nonbinding advisory vote on executive compensation and stockholder approval of any golden parachute payments not previously approved. We will remain an “emerging growth company” until the earliest of (i) the last day of the fiscal year following the fifth anniversary of the completion of this offering, (ii) the last day of the first fiscal year in which our annual gross revenue is $1 billion or more, (iii) the date on which we have, during the previous rolling three-year period, issued more than $1 billion in non-convertible debt securities or (iv) the date on which we are deemed to be a “large accelerated filer” as defined in the Exchange Act. We cannot predict if investors will find our common stock less attractive because we may rely on these exemptions. If some investors find our common stock less attractive as a result, there may be a less active trading market for our common stock, and our stock price may be more volatile and may decline.
In addition, the JOBS Act also provides that an “emerging growth company” can take advantage of an extended transition period for complying with new or revised accounting standards. However, we have chosen to “opt out” of such extended transition period, and as a result, we will comply with new or revised accounting standards on the relevant dates on which adoption of such standards is required for non-emerging growth companies. Our decision to opt out of the extended transition period for complying with new or revised accounting standards is irrevocable.
As a result of becoming a public company, we will be obligated to implement and maintain proper and effective internal control over financial reporting. We may not complete our analysis of our internal control over financial reporting in a timely manner, or these internal controls may not be determined to be effective, which may adversely affect investor confidence in our company and, as a result, the value of our common stock.
We will be required, pursuant to the Exchange Act, to furnish a report by management on, among other things, the effectiveness of our internal control over financial reporting for the first fiscal year beginning after the effective date of this offering. This assessment will need to include disclosure of any material weaknesses identified by our management in our internal control over financial reporting.
We are currently evaluating our internal controls, identifying and remediating deficiencies in those internal controls and documenting the results of our evaluation, testing and remediation. We may not be able to complete our evaluation, testing and any required remediation in a timely fashion. During the evaluation and testing process, if we identify one or more material weaknesses in our internal control over financial reporting that we are unable to remediate before the end of the same fiscal year in which the material weakness is identified, we will be unable to assert that our internal controls are effective. If we are unable to assert that our internal control over financial reporting is effective, or if our auditors, when required, are unable to attest to management’s report on the effectiveness of our internal controls, we could lose investor confidence in the accuracy and completeness of our financial reports, which would cause the price of our common stock to decline.
As a public company, we will be required to disclose material changes made in our internal control and procedures on a quarterly basis. However, our independent registered public accounting firm will not be required to formally attest to the effectiveness of our internal control over financial reporting pursuant to Section 404 of the Sarbanes-Oxley Act until the later of the year following our first annual report required to be filed with the SEC or the date we are no longer an “emerging growth company” as defined in the JOBS Act, if we take advantage of the exemptions contained in the JOBS Act. To comply with the requirements of being a public company, we may need to undertake various actions, such as implementing new internal controls and procedures and hiring accounting or internal audit staff.
Purchasers in this offering will experience immediate and substantial dilution in the book value of their investment.
The assumed initial public offering price of $14.00 per share, which is the midpoint of the estimated offering price range set forth on the cover page of this prospectus, is substantially higher than the pro forma net
46
Table of Contents
tangible book value per share of our outstanding capital stock upon the completion of this offering. Therefore, if you purchase shares of our Class A common stock in this offering, you will incur immediate dilution of $10.99 in the net tangible book value per share from the price you paid. In addition, investors purchasing shares of our Class A common stock from us in this offering will have contributed 49.5% of the total consideration paid to us by all stockholders who purchased shares of our common stock, in exchange for acquiring approximately 18.3% of the outstanding shares of our common stock as of March 31, 2015 after giving effect to this offering. The exercise of outstanding options to purchase shares of our Class B common stock or the warrant to purchase shares of our redeemable convertible preferred stock will result in further dilution.
If securities or industry analysts do not publish or cease publishing research or reports about us, our business, our market or our competitors, or if they adversely change their recommendations regarding our Class A common stock, the market price of our Class A common stock and trading volume could decline.
The trading market for our Class A common stock will be influenced by the research and reports that securities or industry analysts may publish about us, our business, our market or our competitors. If any of the analysts who cover us adversely change their recommendations regarding our Class A common stock or provide more favorable recommendations about our competitors, the market price of our Class A common stock would likely decline. If any of the analysts who cover us were to cease coverage of our company or fail to regularly publish reports on us, we could lose visibility in the financial markets, which in turn could cause the market price of our Class A common stock and trading volume to decline.
We do not expect to declare any dividends on our Class A common stock in the foreseeable future.
We do not anticipate declaring any cash dividends on our Class A common stock in the foreseeable future. In addition, our existing loan agreement with Silicon Valley Bank imposes restrictions on our ability to pay dividends. Consequently, investors may need to rely on sales of our Class A common stock after price appreciation, which may never occur, as the only way to realize any future gains on their investment. Investors seeking cash dividends should not purchase shares of our Class A common stock.
Prior to the completion of this offering, there has been limited trading of our securities at prices that may be higher than what our Class A common stock will trade at once it is listed.
Prior to the completion of this offering, our securities have not been listed on any stock exchange or other public trading market, but there has been some trading of our securities in private transactions. These transactions were speculative, and the trading prices of our securities in these transactions were privately negotiated. We cannot assure you that the market price of our Class A common stock will equal or exceed the price at which our securities have traded prior to the completion of this offering.
Participation in this offering by certain of our existing stockholders would reduce the available public float for shares of our Class A common stock.
Entities affiliated with J.P. Morgan Investment Management Inc., one of our existing holders of greater than 5% of our common stock, have indicated an interest in purchasing up to $10.0 million of our Class A common stock in this offering, at the initial public offering price. If these entities are allocated all or a portion of the shares in which they have indicated an interest in this offering and purchase any such shares, such purchases would reduce the available public float for shares of our Class A common stock because these entities would be restricted from selling the shares by a lock-up agreement entered into with the underwriters. In addition, if any of the participants in our directed share program purchases $500,000 or greater of our Class A common stock in the directed share program, such purchases would reduce the available public float for shares of our Class A common stock because these persons would be restricted from selling the shares by a lock-up agreement entered into with the underwriters. See the applicable lock-up restrictions described in the section titled “Shares Eligible for Future Sale” for additional information. As a result, any purchase of shares by these persons in this offering may reduce the liquidity of our Class A common stock relative to what it would have been had these shares been purchased by investors that were not existing stockholders or participants in our directed share program.
47
Table of Contents
SPECIAL NOTE REGARDING FORWARD-LOOKING STATEMENTS
This prospectus contains forward-looking statements within the meaning of the federal securities laws, which statements involve substantial risks and uncertainties. Forward-looking statements generally relate to future events or our future financial or operating performance. In some cases, you can identify forward-looking statements because they contain words such as “may,” “will,” “should,” “expects,” “plans,” “anticipates,” “could,” “intends,” “target,” “projects,” “contemplates,” “believes,” “estimates,” “predicts,” “potential” or “continue” or the negative of these words or other similar terms or expressions that concern our expectations, strategy, plans or intentions. Forward-looking statements contained in this prospectus include, but are not limited to, statements about:
| • | our ability to attract and retain subscribers; |
| • | our ability to deepen our relationships with existing subscribers; |
| • | our expectations regarding our subscriber growth rate and the usage of our payment platform; |
| • | our business plan and beliefs and objectives for future operations; |
| • | trends associated with our industry, target consumer behaviors and potential market; |
| • | benefits associated with use of our products and services; |
| • | our ability to develop or acquire new products and services, improve our existing products and services and increase the value of our products and services; |
| • | the network effects associated with our business; |
| • | our ability to further develop strategic relationships; |
| • | our ability to increase our presence in corporate wellness; |
| • | our ability to achieve positive returns on investments; |
| • | our plans to further invest in and grow our business, and our ability to effectively manage our growth and associated investments; |
| • | our ability to timely and effectively scale and adapt our existing technology; |
| • | our ability to increase our revenue and our revenue growth rate; |
| • | our future financial performance, including trends in revenue, cost of revenue, operating expenses, other income and expenses, income taxes, subscribers, average monthly volume per subscriber and payments volume; |
| • | the sufficiency of our cash and cash equivalents and cash generated from operations to meet our working capital and capital expenditure requirements; |
| • | the sufficiency of our efforts to remediate our material weaknesses; |
| • | our ability to attract and retain qualified employees and key personnel; |
| • | our ability to successfully identify, acquire and integrate companies and assets; |
| • | our ability to successfully enter new markets and manage our international expansion; |
| • | our ability to maintain, protect and enhance our intellectual property and not infringe upon others’ intellectual property; and |
| • | our anticipated uses of the net proceeds from this offering. |
We caution you that the foregoing list may not contain all of the forward-looking statements made in this prospectus.
48
Table of Contents
You should not rely upon forward-looking statements as predictions of future events. We have based the forward-looking statements contained in this prospectus primarily on our current expectations and projections about future events and trends that we believe may affect our business, financial condition, results of operations and prospects. The outcome of the events described in these forward-looking statements is subject to risks, uncertainties and other factors described in the section titled “Risk Factors” and elsewhere in this prospectus. Moreover, we operate in a very competitive and rapidly changing environment. New risks and uncertainties emerge from time to time and it is not possible for us to predict all risks and uncertainties that could have an impact on the forward-looking statements contained in this prospectus. We cannot assure you that the results, events and circumstances reflected in the forward-looking statements will be achieved or occur, and actual results, events or circumstances could differ materially from those described in the forward-looking statements.
The forward-looking statements made in this prospectus relate only to events as of the date on which the statements are made. We undertake no obligation to update any forward-looking statements made in this prospectus to reflect events or circumstances after the date of this prospectus or to reflect new information or the occurrence of unanticipated events, except as required by law. We may not actually achieve the plans, intentions or expectations disclosed in our forward-looking statements and you should not place undue reliance on our forward-looking statements. Our forward-looking statements do not reflect the potential impact of any future acquisitions, mergers, dispositions, joint ventures or investments we may make.
49
Table of Contents
MARKET, INDUSTRY AND OTHER DATA
Market and Industry Data
This prospectus contains estimates and information concerning our industry, including market size and growth rates of the markets in which we participate, that are based on industry publications and reports. This information involves a number of assumptions and limitations, and you are cautioned not to give undue weight to these estimates. The industry in which we operate is subject to a high degree of uncertainty and risk due to variety of factors, including those described in the section titled “Risk Factors.” These and other factors could cause results to differ materially from those expressed in these publications and reports.
Certain information in the text of this prospectus is contained in industry publications. The source of these industry publications is provided below:
| (1) | Frost & Sullivan, Analysis of the Global Wellness Business Management Solutions Market, March 2015. |
| (2) | IBISWorld, Gym, Health & Fitness Clubs in the US, September 2014. |
| (3) | IBISWorld, Hair & Nail Salons in the US, October 2014. |
| (4) | IBISWorld, Corporate Wellness Services in the US, December 2014. |
| (5) | Industrial Data Corporation, Worldwide Wearable Computing Device 2014-2018 Forecast Update: December 2014, December 2014. |
| (6) | The Commonwealth Fund, National Trends in the Cost of Employer Health Insurance Coverage, 2003-2013, December 2014. |
| (7) | Eric A. Finkelstein, et al., The Costs of Obesity in the Workplace, Journal of Occupational and Environmental Medicine, October 2010. |
| (8) | Institute for Health Metrics and Evaluation at the University of Washington, Global, regional, and national prevalence of overweight and obesity in children and adults during 1980-2013: a systematic analysis for the Global Burden of Disease Study 2013, May 2014. |
| (9) | American Society of Clinical Oncology, Media Fact Sheet – Obesity and Cancer: The Science behind the Connection. |
| (10) | Katherine M. Flegal, et al., Journal of the American Medical Association, Prevalence and Trends in Obesity among US Adults, 1999-2008, January 2010. |
| (11) | RAND Health, A Review of the U.S. Workplace Wellness Market, 2012. |
| (12) | National Business Group on Health and Fidelity Investments, Employer Investments in Improving Employee Health: Results from the Fifth Annual NBGH/Fidelity Investments Benefits Consulting Survey, February 2014. |
| (13) | Business Journal, Why Your Workplace Wellness Program Isn’t Working, May 2014. |
50
Table of Contents
Company Data
In this prospectus, when we use the term “active consumers” as of a given date, we are referring to the estimated number of unique consumers of our subscribers’ services who have used our platform to transact with our subscribers during the two years ending on such date. While we do not directly monetize consumers of our subscribers’ services, we believe that growth in the number of active consumers on our platform also contributes to our subscriber growth. In calculating this number, we have attempted to avoid duplicative counting of consumers by identifying consumers who may have used our platform through different subscribers. However, in certain cases, a single consumer may have transacted with multiple subscribers under different names or using different email addresses, in which cases they may be counted more than once. For a discussion of risks related to our calculation of active consumers, see the section titled “Risk Factors – The number of actual consumers using our platform may be lower than the number we have estimated.”
51
Table of Contents
We estimate that the net proceeds to us from the sale of shares of our Class A common stock in this offering will be approximately $89.3 million, based upon the assumed initial public offering price of $14.00 per share, which is the midpoint of the estimated offering price range set forth on the cover page of this prospectus, and after deducting estimated underwriting discounts and commissions and estimated offering expenses payable by us. If the underwriters’ over-allotment option is exercised in full, we estimate that the net proceeds to us would be approximately $103.3 million, after deducting estimated underwriting discounts and commissions and estimated offering expenses payable by us.
Each $1.00 increase or decrease in the assumed initial public offering price of $14.00 per share, which is the midpoint of the estimated offering price range set forth on the cover page of this prospectus, would increase or decrease the net proceeds that we receive from this offering by approximately $6.7 million, assuming that the number of shares offered by us, as set forth on the cover page of this prospectus, remains the same and after deducting the estimated underwriting discounts and commissions and estimated offering expenses payable by us. Similarly, each increase or decrease of 1.0 million in the number of shares of our Class A common stock offered by us would increase or decrease the net proceeds that we receive from this offering by approximately $13.0 million, assuming the assumed initial public offering price remains the same and after deducting the estimated underwriting discounts and commissions and estimated offering expenses payable by us.
The principal purposes of this offering are to increase our capitalization and financial flexibility, create a public market for our Class A common stock and enable access to the public equity markets for us and our stockholders.
We intend to use the net proceeds from this offering for general corporate purposes, including working capital, operating expenses and capital expenditures. Additionally, we may use a portion of the net proceeds to acquire businesses, products, services or technologies. However, we do not have agreements or commitments for any material acquisitions at this time. Accordingly, we will have broad discretion in using these proceeds. Pending the use of proceeds from this offering as described above, we plan to invest the net proceeds that we receive in this offering in short-term and long-term interest-bearing obligations, including government and investment-grade debt securities and money market funds.
52
Table of Contents
We have never declared or paid any cash dividends on our capital stock. We currently intend to retain any future earnings and do not expect to pay any dividends in the foreseeable future. In addition, our ability to pay dividends on our capital stock is subject to restrictions under the terms of our loan agreement with Silicon Valley Bank. Any future determination to declare cash dividends will be made at the discretion of our board of directors, subject to applicable laws, and will depend on a number of factors, including our financial condition, results of operations, capital requirements, contractual restrictions, general business conditions and other factors that our board of directors may deem relevant.
53
Table of Contents
The following table sets forth cash and cash equivalents, as well as our capitalization, as of March 31, 2015 as follows:
| • | on an actual basis; |
| • | on a pro forma basis, giving effect to (i) the automatic conversion and reclassification of all outstanding shares of our redeemable convertible preferred stock into an aggregate of 20,673,680 shares of our Class B common stock, which conversion and reclassification will occur immediately prior to the completion of this offering, (ii) the resulting reclassification of the preferred stock warrant liability to stockholders’ equity, and (iii) the filing and effectiveness of our amended and restated certificate of incorporation in Delaware, as if such conversion, reclassification and effectiveness had occurred on March 31, 2015; and |
| • | on a pro forma as adjusted basis, giving effect to the pro forma adjustments set forth above and the sale and issuance by us of shares of 7,150,000 our Class A common stock in this offering, based upon the assumed initial public offering price of $14.00 per share, which is the midpoint of the estimated offering price range set forth on the cover page of this prospectus, and after deducting estimated underwriting discounts and commissions and estimated offering expenses payable by us. |
The pro forma as adjusted information set forth in the table below is illustrative only and will be adjusted based on the actual initial public offering price and other terms of this offering determined at pricing. You should read this table together with our consolidated financial statements and related notes, and the sections titled “Selected Consolidated Financial and Other Data” and “Management’s Discussion and Analysis of Financial Condition and Results of Operations” that are included elsewhere in this prospectus.
| As of March 31, 2015 | ||||||||||||
| Actual | Pro Forma | Pro Forma As Adjusted(1) |
||||||||||
| (in thousands, except share and per share data) | ||||||||||||
| Cash and cash equivalents |
$ | 22,099 | $ | 22,099 | $ | 111,403 | ||||||
|
|
|
|
|
|
|
|||||||
| Financing obligation on leases |
$ | 17,002 | $ | 17,002 | $ | 17,002 | ||||||
| Preferred stock warrant |
1,338 | — | — | |||||||||
| Redeemable convertible preferred stock, par value $0.000004 per share: 20,542,012 shares authorized, 20,454,489 issued and outstanding, actual; no shares authorized, issued and outstanding, pro forma and pro forma as adjusted |
170,159 | — | — | |||||||||
| Stockholders’ equity (deficit): |
||||||||||||
| Preferred stock, par value $0.000004 per share: no shares authorized, issued and outstanding, actual; 100,000,000 shares authorized, no shares issued and outstanding, pro forma and pro forma as adjusted |
— | — | — | |||||||||
| Common stock, par value $0.000004 per share: 50,000,000 shares authorized, 11,293,864 shares issued and outstanding, actual; no shares authorized, issued and outstanding, pro forma and pro forma as adjusted |
— | — | — | |||||||||
| Class A common stock, par value $0.000004 per share: no shares authorized, issued and outstanding, actual; 1,000,000,000 shares authorized, no shares issued and outstanding, pro forma and 1,000,000,000 shares authorized, 7,150,000 shares issued and outstanding, pro forma as adjusted |
— | — | — | |||||||||
| Class B common stock, par value $0.000004 per share: no shares authorized, issued and outstanding, actual; 100,000,000 shares authorized, 31,967,544 shares issued and outstanding, pro forma and pro forma as adjusted |
— | — | — | |||||||||
| Additional paid-in capital |
— | 171,497 | 260,801 | |||||||||
54
Table of Contents
| As of March 31, 2015 | ||||||||||||
| Actual | Pro Forma | Pro Forma As Adjusted(1) |
||||||||||
| (in thousands, except share and per share data) | ||||||||||||
| Accumulated other comprehensive loss |
$ | (194 | ) | $ | (194 | ) | $ | (194 | ) | |||
| Accumulated deficit |
(133,634 | ) | (133,634 | ) | (133,634 | ) | ||||||
|
|
|
|
|
|
|
|||||||
| Total stockholders’ equity (deficit) |
(133,828 | ) | 37,669 | 126,973 | ||||||||
|
|
|
|
|
|
|
|||||||
| Total capitalization |
$ | 54,671 | $ | 54,671 | $ | 143,975 | ||||||
|
|
|
|
|
|
|
|||||||
| (1) | Each $1.00 increase or decrease in the assumed initial public offering price of our Class A common stock of $14.00 per share, which is the midpoint of the estimated offering price range set forth on the cover page of this prospectus, would increase or decrease, as applicable, the amount of each of our pro forma as adjusted cash and cash equivalents, working capital, total assets and total stockholders’ equity (deficit) by approximately $6.7 million, assuming that the number of shares offered by us, as set forth on the cover page of this prospectus, remains the same and after deducting estimated underwriting discounts and commissions and estimated offering expenses payable by us. An increase or decrease of 1.0 million shares in the number of shares offered by us would increase or decrease, as applicable, the amount of each of our pro forma as adjusted cash and cash equivalents, working capital, total assets and total stockholders’ equity (deficit) by approximately $13.0 million, assuming that the number of shares offered by us, as set forth on the cover page of this prospectus, remains the same and after deducting estimated underwriting discounts and commissions and estimated offering expenses payable by us. |
The pro forma and pro forma as adjusted columns in the table above are based on no shares of our Class A common stock and 31,967,544 shares of our Class B common stock (including our redeemable convertible preferred stock on an as-converted basis) outstanding as of March 31, 2015, and exclude:
| • | 3,163,039 shares of our Class B common stock issuable upon the exercise of options to purchase shares of our Class B common stock outstanding as of March 31, 2015, with a weighted-average exercise price of $7.96 per share; |
| • | 89,177 shares of our Class B common stock, on an as-converted basis, issuable upon the exercise of a warrant to purchase shares of our redeemable convertible preferred stock outstanding as of March 31, 2015, with an aggregate exercise price of approximately $151,603; |
| • | 1,278,000 shares of our Class B common stock issuable upon the exercise of options to purchase shares of our Class B common stock granted after March 31, 2015, with an exercise price of $14.496 per share; and |
| • | 5,481,954 shares of our common stock reserved for future issuance under our equity compensation plans which will become effective prior to the completion of this offering, consisting of: |
| • | 4,698,818 shares of our Class A common stock reserved for future issuance under our 2015 Plan; and |
| • | 783,136 shares of our Class A common stock reserved for future issuance under our ESPP. |
Our 2015 Plan and ESPP each provide for annual automatic increases in the number of shares reserved thereunder and our 2015 Plan also provides for increases to the number of shares that may be granted thereunder based on shares under our 2009 Plan that expire, are forfeited or otherwise repurchased by us, as more fully described in the section titled “Executive Compensation—Employee Benefit and Stock Plans.”
55
Table of Contents
If you invest in our Class A common stock in this offering, your ownership interest will be diluted to the extent of the difference between the initial public offering price per share of our Class A common stock and the pro forma as adjusted net tangible book value per share of our common stock immediately after this offering. Net tangible book value dilution per share to new investors represents the difference between the amount per share paid by purchasers of shares of our common stock in this offering and the pro forma as adjusted net tangible book value per share of our common stock immediately after completion of this offering.
Net tangible book value per share is determined by dividing our total tangible assets less our total liabilities by the number of shares of our common stock outstanding. Our historical net tangible book value as of March 31, 2015 was $27.1 million, or $2.40 per share. Our pro forma net tangible book value as of March 31, 2015 was $28.5 million, or $0.89 per share, based on the total number of shares of our Class A common stock and Class B common stock outstanding as of March 31, 2015, after giving effect to the automatic conversion and reclassification of all outstanding shares of our redeemable convertible preferred stock as of March 31, 2015 into an aggregate of 20,673,680 shares of our Class B common stock, and the resulting reclassification of the redeemable convertible preferred stock warrant liability to stockholders’ equity.
After giving effect to the sale by us of 7,150,000 shares of our Class A common stock in this offering at the assumed initial public offering price of $14.00 per share, which is the midpoint of the estimated offering price range set forth on the cover page of this prospectus, and after deducting estimated underwriting discounts and commissions and estimated offering expenses payable by us, our pro forma as adjusted net tangible book value as of March 31, 2015 would have been $117.8 million, or $3.01 per share. This represents an immediate increase in pro forma net tangible book value of $2.12 per share to our existing stockholders and an immediate dilution in pro forma net tangible book value of $10.99 per share to investors purchasing shares of our Class A common stock in this offering at the assumed initial public offering price. The following table illustrates this dilution:
| Assumed initial public offering price per share |
$ | 14.00 | ||||||
| Pro forma net tangible book value per share as of March 31, 2015 |
$ | 0.89 | ||||||
| Increase in pro forma net tangible book value (deficit) per share attributable to new investors in this offering |
2.12 | |||||||
|
|
|
|||||||
| Pro forma as adjusted net tangible book value per share immediately after this offering |
3.01 | |||||||
|
|
|
|||||||
| Dilution in pro forma net tangible book value per share to new investors in this offering |
$ | 10.99 | ||||||
|
|
|
Each $1.00 increase or decrease in the assumed initial public offering price of $14.00 per share, which is the midpoint of the estimated offering price range set forth on the cover page of this prospectus, would increase or decrease, as applicable, our pro forma as adjusted net tangible book value per share to new investors by $0.17, and would increase or decrease, as applicable, dilution per share to new investors in this offering by $0.83, assuming that the number of shares offered by us, as set forth on the cover page of this prospectus, remains the same and after deducting estimated underwriting discounts and commissions and estimated offering expenses payable by us. Similarly, each increase or decrease of 1.0 million shares in the number of shares offered by us would increase or decrease, as applicable, our pro forma as adjusted net tangible book value by approximately $0.25 per share and increase or decrease, as applicable, the dilution to new investors by $0.25 per share, assuming the assumed initial public offering price remains the same, and after deducting underwriting discounts and commissions and estimated offering expenses payable by us.
If the underwriters exercise their over-allotment option in full, the pro forma as adjusted net tangible book value per share of our common stock, as adjusted to give effect to this offering, would be $3.28 per share, and the dilution in pro forma net tangible book value per share to new investors in this offering would be $10.72 per share.
The following table presents, as of March 31, 2015, after giving effect to the automatic conversion and reclassification of all outstanding shares of our redeemable convertible preferred stock into an aggregate of
56
Table of Contents
20,673,680 shares of our Class B common stock immediately prior to the completion of this offering, the differences between the existing stockholders and the new investors purchasing shares of our Class A common stock in this offering with respect to the number of shares purchased from us, the total consideration paid or to be paid to us, which includes net proceeds received from the issuance of our common stock and preferred stock, cash received from the exercise of stock options and the average price per share paid or to be paid to us at the assumed initial public offering price of $14.00 per share, which is the midpoint of the estimated offering price range set forth on the cover page of this prospectus, before deducting estimated underwriting discounts and commissions and estimated offering expenses payable by us:
| Shares Purchased | Total Consideration | Average Price Per Share |
||||||||||||||||||
| Number | Percent | Amount | Percent | |||||||||||||||||
| Existing stockholders |
31,967,544 | 81.7 | % | $ | 102,230,497 | 50.5 | % | $ | 3.20 | |||||||||||
| New investors |
7,150,000 | 18.3 | 100,100,000 | 49.5 | $ | 14.00 | ||||||||||||||
|
|
|
|
|
|
|
|
|
|||||||||||||
| Totals |
39,117,544 | 100 | % | $ | 202,330,497 | 100 | % | |||||||||||||
|
|
|
|
|
|
|
|
|
|||||||||||||
Each $1.00 increase or decrease in the assumed initial public offering price of $14.00 per share, which is the midpoint of the estimated offering price range set forth on the cover page of this prospectus, would increase or decrease, as applicable, the total consideration paid by new investors and total consideration paid by all stockholders by approximately $7.2 million, assuming that the number of shares offered by us, as set forth on the cover page of this prospectus, remains the same and after deducting estimated underwriting discounts and commissions and estimated offering expenses payable by us.
Except as otherwise indicated, the above discussion and tables assume no exercise of the underwriters’ over-allotment option. If the underwriters exercise their over-allotment option in full, our existing stockholders would own 79.5% and our new investors would own 20.5% of the total number of shares of our common stock outstanding upon completion of this offering.
The number of shares of our Class A common stock and Class B common stock that will be outstanding after this offering is based on no shares of our Class A common stock and 31,967,544 shares of our Class B common stock (including our redeemable convertible preferred stock on an as-converted basis) outstanding as of March 31, 2015, and excludes:
| • | 3,163,039 shares of our Class B common stock issuable upon the exercise of options to purchase shares of our Class B common stock outstanding as of March 31, 2015, with a weighted-average exercise price of $7.96 per share; |
| • | 89,177 shares of our Class B common stock, on an as-converted basis, issuable upon the exercise of a warrant to purchase shares of our redeemable convertible preferred stock outstanding as of March 31, 2015, with an aggregate exercise price of approximately $151,603; |
| • | 1,278,000 shares of our Class B common stock issuable upon the exercise of options to purchase shares of our Class B common stock granted after March 31, 2015, with an exercise price of $14.496 per share; and |
| • | 5,481,954 shares of our common stock reserved for future issuance under our equity compensation plans which will become effective prior to the completion of this offering, consisting of: |
| • | 4,698,818 shares of our Class A common stock reserved for future issuance under our 2015 Plan; and |
| • | 783,136 shares of our Class A common stock reserved for future issuance under our ESPP. |
Our 2015 Plan and ESPP each provide for annual automatic increases in the number of shares reserved thereunder and our 2015 Plan also provides for increases to the number of shares that may be granted thereunder
57
Table of Contents
based on shares under our 2009 Plan that expire, are forfeited or otherwise repurchased by us, as more fully described in the section titled “Executive Compensation—Employee Benefit and Stock Plans.”
To the extent that any outstanding options to purchase shares of our Class B common stock or a warrant to purchase our redeemable convertible preferred stock are exercised, or new awards are granted under our equity compensation plans, there will be further dilution to investors participating in this offering.
58
Table of Contents
SELECTED CONSOLIDATED FINANCIAL AND OTHER DATA
The following selected consolidated statement of operations data for the years ended December 31, 2012, 2013 and 2014 and the consolidated balance sheet data as of December 31, 2013 and 2014 have been derived from our audited consolidated financial statements included elsewhere in this prospectus. The selected consolidated statements of operations data for the three months ended March 31, 2014 and 2015 and the consolidated balance sheet data as of March 31, 2015 have been derived from our unaudited interim consolidated financial statements included elsewhere in this prospectus. The unaudited interim consolidated financial statements have been prepared on the same basis as the audited consolidated financial statements and reflect, in the opinion of management, all adjustments of a normal, recurring nature that are necessary for the fair presentation of the unaudited interim consolidated financial statements. Our historical results are not necessarily indicative of the results that may be expected in the future and are not necessarily indicative of results to be expected for the full year or any other period. You should read the following selected consolidated financial and other data below in conjunction with the section titled “Management’s Discussion and Analysis of Financial Condition and Results of Operations” and our consolidated financial statements and related notes included elsewhere in this prospectus.
| Year Ended December 31, | Three Months Ended March 31, | |||||||||||||||||||
| 2012 | 2013 | 2014 | 2014 | 2015 | ||||||||||||||||
| (in thousands, except share and per share data) | ||||||||||||||||||||
| Consolidated Statements of Operations Data: |
||||||||||||||||||||
| Revenue |
$ | 31,999 | $ | 48,687 | $ | 70,010 | $ | 15,653 | $ | 22,263 | ||||||||||
| Cost of revenue(1) |
13,411 | 21,890 | 30,004 | 6,478 | 8,693 | |||||||||||||||
|
|
|
|
|
|
|
|
|
|
|
|||||||||||
| Gross profit |
18,588 | 26,797 | 40,006 | 9,175 | 13,570 | |||||||||||||||
|
|
|
|
|
|
|
|
|
|
|
|||||||||||
| Operating expenses: |
||||||||||||||||||||
| Sales and marketing(1) |
11,735 | 20,957 | 30,922 | 7,247 | 9,717 | |||||||||||||||
| Research and development(1) |
3,741 | 10,517 | 16,167 | 3,594 | 4,725 | |||||||||||||||
| General and administrative(1) |
8,111 | 10,730 | 18,422 | 3,530 | 6,780 | |||||||||||||||
| Change in fair value of contingent consideration |
— | 428 | (1,434 | ) | (423 | ) | — | |||||||||||||
|
|
|
|
|
|
|
|
|
|
|
|||||||||||
| Total operating expenses |
23,587 | 42,632 | 64,077 | 13,948 | 21,222 | |||||||||||||||
|
|
|
|
|
|
|
|
|
|
|
|||||||||||
| Loss from operations |
(4,999 | ) | (15,835 | ) | (24,071 | ) | (4,773 | ) | (7,652 | ) | ||||||||||
| Change in fair value of preferred stock warrant |
(515 | ) | (302 | ) | (283 | ) | (22 | ) | (150 | ) | ||||||||||
| Interest income |
6 | — | — | — | 3 | |||||||||||||||
| Interest expense |
(15 | ) | (21 | ) | (68 | ) | (20 | ) | (17 | ) | ||||||||||
| Other income (expense), net |
17 | (26 | ) | (68 | ) | 5 | (39 | ) | ||||||||||||
|
|
|
|
|
|
|
|
|
|
|
|||||||||||
| Loss before provision for income taxes |
(5,506 | ) | (16,184 | ) | (24,490 | ) | (4,810 | ) | (7,855 | ) | ||||||||||
| Provision for income taxes |
13 | 63 | 116 | 34 | 6 | |||||||||||||||
|
|
|
|
|
|
|
|
|
|
|
|||||||||||
| Net loss |
(5,519 | ) | (16,247 | ) | (24,606 | ) | (4,844 | ) | (7,861 | ) | ||||||||||
| Accretion of redeemable convertible preferred stock(2) |
(13,025 | ) | (27,892 | ) | (21,311 | ) | (5,831 | ) | (5,459 | ) | ||||||||||
| Deemed dividend—preferred stock modification |
— | — | — | — | 1,748 | |||||||||||||||
|
|
|
|
|
|
|
|
|
|
|
|||||||||||
| Net loss attributable to common stockholders(2) |
$ | (18,544 | ) | $ | (44,139 | ) | $ | (45,917 | ) | $ | (10,675 | ) | $ | (11,572 | ) | |||||
|
|
|
|
|
|
|
|
|
|
|
|||||||||||
| Net loss per share attributable to common stockholders, basic and diluted(2) |
$ | (1.84 | ) | $ | (4.10 | ) | $ | (4.17 | ) | $ | (0.97 | ) | $ | (1.03 | ) | |||||
|
|
|
|
|
|
|
|
|
|
|
|||||||||||
| Weighted-average shares used to compute net loss per share attributable to common stockholders, basic and diluted(2) |
10,102,216 | 10,757,938 | 11,013,658 | 10,968,167 | 11,201,755 | |||||||||||||||
|
|
|
|
|
|
|
|
|
|
|
|||||||||||
| Pro forma net loss per share attributable to common stockholders, basic and dilute(2) |
$ | (0.78 | ) | $ | (0.24 | ) | ||||||||||||||
|
|
|
|
|
|||||||||||||||||
| Weighted-average shares used to compute pro forma net loss per share attributable to common stockholders, basic and diluted(2) |
31,282,660 | 31,875,435 | ||||||||||||||||||
|
|
|
|
|
|||||||||||||||||
59
Table of Contents
| (1) | Includes stock-based compensation expense as follows: |
| Year Ended December 31, | Three Months Ended March 31, |
|||||||||||||||||||
| 2012 | 2013 | 2014 | 2014 | 2015 | ||||||||||||||||
| (in thousands) | ||||||||||||||||||||
| Cost of revenue |
$ | — | $ | 51 | $ | 220 | $ | 24 | $ | 100 | ||||||||||
| Sales and marketing |
— | 56 | 196 | 34 | 541 | |||||||||||||||
| Research and development |
— | 68 | 298 | 53 | 96 | |||||||||||||||
| General and administrative |
1,484 | 252 | 1,023 | 225 | 403 | |||||||||||||||
|
|
|
|
|
|
|
|
|
|
|
|||||||||||
| Total stock-based compensation expense |
$ | 1,484 | $ | 427 | $ | 1,737 | $ | 336 | $ | 1,140 | ||||||||||
|
|
|
|
|
|
|
|
|
|
|
|||||||||||
| (2) | See Note 13 to our consolidated financial statements included elsewhere in this prospectus for an explanation of the method used to calculate our actual and pro forma basic and diluted net loss per share attributable to common stockholders and the weighted-average number of shares used in the computation of the per share amounts. |
| As of December 31, | As of March 31, 2015 |
|||||||||||
| 2013 | 2014 | |||||||||||
| (in thousands) | ||||||||||||
| Consolidated Balance Sheet Data: |
||||||||||||
| Cash and cash equivalents |
$ | 9,545 | $ | 34,675 | $ | 22,099 | ||||||
| Restricted cash |
2,533 | 772 | — | |||||||||
| Working capital |
3,359 | 26,962 | 14,142 | |||||||||
| Property and equipment, net |
12,161 | 28,568 | 32,487 | |||||||||
| Total assets |
30,735 | 73,051 | 71,077 | |||||||||
| Total deferred revenue |
2,002 | 2,756 | 2,865 | |||||||||
| Total financing obligation |
3,872 | 15,654 | 17,002 | |||||||||
| Preferred stock warrant |
905 | 1,188 | 1,338 | |||||||||
| Redeemable convertible preferred stock |
95,224 | 166,448 | 170,159 | |||||||||
| Total stockholders’ deficit |
(81,115 | ) | (124,925 | ) | (133,828 | ) | ||||||
Key Metrics
We regularly review the following key metrics to measure our performance, identify trends affecting our business, formulate financial projections, make strategic business decisions and assess working capital needs.
| As of and for Year Ended December 31, | As of and
for Three Months Ended March 31, 2015 |
|||||||||||||||
| 2012 | 2013 | 2014 | ||||||||||||||
| Subscribers (end of period)(1) |
22,062 | 31,043 | 40,517 | 42,700 | ||||||||||||
| Average monthly revenue per subscriber(2) |
$ | 131 | $ | 146 | $ | 155 | $ | 174 | ||||||||
| Payments volume (in millions)(3) |
$ | 2,113 | $ | 3,099 | $ | 4,121 | $ | 1,168 | ||||||||
| Dollar-based net expansion rate (end of period)(4) |
n/a | 103 | % | 109 | % | 109 | % | |||||||||
| (1) | Subscribers are defined as unique physical business locations or, in the case of our Solo software level, individual practitioners who have subscribed to our cloud-based business management software platform as of the end of the period. |
| (2) | Average monthly revenue per subscriber is calculated by dividing the subscription, services and payments revenue generated in a given month by the number of subscribers at the end of the previous month. For periods greater than one month, the average monthly revenue per subscriber is the sum of the average monthly revenue per subscriber for each month in the period, divided by the number of months in the period. |
60
Table of Contents
| (3) | Payments volume is the total dollar volume of transactions between our subscribers and their consumers utilizing our payments platform. |
| (4) | Our dollar-based net expansion rate is based upon our monthly subscription, services and payments revenue for a set of subscriber accounts. We calculate our dollar-based net expansion rate by dividing our retained revenue net of contraction and churn by our base revenue. We define our base revenue as the aggregate monthly subscription, services and payments revenue of our subscriber base as of the date one year prior to the date of calculation. We define our retained revenue net of contraction and churn as the aggregate monthly subscription, services and payments revenue of the same subscriber base included in our measure of base revenue at the end of the annual period being measured. |
Non-GAAP Financial Measure
Adjusted EBITDA
To provide investors with additional information regarding our financial results prepared in accordance with U.S. generally acceptable accounting principles, or GAAP, we have presented Adjusted EBITDA, which is a non-GAAP financial measure defined by us as our net loss before stock-based compensation expense, depreciation and amortization, change in fair value of contingent consideration, change in fair value of preferred stock warrant, impairment charges, provision for income taxes and other income (expense), net, which consisted of interest income and expense and other miscellaneous other income (expense). We have provided below a reconciliation of Adjusted EBITDA to net loss, the most directly comparable GAAP financial measure. We have presented Adjusted EBITDA in this prospectus because it is a key measure used by our management and board of directors to understand and evaluate our core operating performance and trends, to prepare and approve our annual budget, and to develop short and long-term operational plans. In particular, we believe that the exclusion of the amounts eliminated in calculating Adjusted EBITDA can provide a useful measure for period-to-period comparisons of our core business. Accordingly, we believe that Adjusted EBITDA provides useful information to investors and others in understanding and evaluating our operating results in the same manner as our management and board of directors.
Our use of Adjusted EBITDA has limitations as an analytical tool, and you should not consider it in isolation or as a substitute for analysis of our financial results as reported under GAAP. Some of these limitations are as follows:
| • | Although depreciation and amortization expense is non-cash charges, the assets being depreciated and amortized may have to be replaced in the future, and Adjusted EBITDA does not reflect cash capital expenditure requirements for such replacements or for new capital expenditure requirements; |
| • | Adjusted EBITDA does not reflect: (1) changes in, or cash requirements for, our working capital needs; (2) the potentially dilutive impact of stock-based compensation; or (3) tax payments that may represent a reduction in cash available to us; and |
| • | Other companies, including companies in our industry, may calculate Adjusted EBITDA or similarly titled measures differently, which reduces its usefulness as a comparative measure. |
61
Table of Contents
Because of these and other limitations, you should consider Adjusted EBITDA along with other GAAP-based financial performance measures, including various cash flow metrics, net loss, and our GAAP financial results. The following table presents a reconciliation of Adjusted EBITDA to net loss for each of the periods indicated:
| Year Ended December 31, | Three Months Ended March 31, |
|||||||||||||||||||
| 2012 | 2013 | 2014 | 2014 | 2015 | ||||||||||||||||
| (in thousands) | ||||||||||||||||||||
| Net loss |
$ | (5,519 | ) | $ | (16,247 | ) | $ | (24,606 | ) | $ | (4,844 | ) | $ | (7,861 | ) | |||||
| Stock-based compensation expense |
1,484 | 427 | 1,737 | 336 | 1,140 | |||||||||||||||
| Depreciation and amortization |
1,004 | 3,479 | 4,574 | 1,034 | 1,218 | |||||||||||||||
| Change in fair value of contingent consideration |
— | 428 | (1,434 | ) | (423 | ) | — | |||||||||||||
| Change in fair value of preferred stock warrant |
515 | 302 | 283 | 22 | 150 | |||||||||||||||
| Impairment charges |
— | — | 426 | — | — | |||||||||||||||
| Provision for income taxes |
13 | 63 | 116 | 34 | 6 | |||||||||||||||
| Other (income) expense, net |
(8 | ) | 47 | 136 | 15 | 53 | ||||||||||||||
|
|
|
|
|
|
|
|
|
|
|
|||||||||||
| Adjusted EBITDA (unaudited) |
$ | (2,511 | ) | $ | (11,501 | ) | $ | (18,768 | ) | $ | (3,826 | ) | $ | (5,294 | ) | |||||
|
|
|
|
|
|
|
|
|
|
|
|||||||||||
62
Table of Contents
MANAGEMENT’S DISCUSSION AND ANALYSIS OF FINANCIAL CONDITION
AND RESULTS OF OPERATIONS
The following discussion and analysis of our financial condition and results of operations should be read in conjunction with the section titled “Selected Consolidated Financial and Other Data” and our consolidated financial statements and related notes included elsewhere in this prospectus. This discussion contains forward-looking statements that involve risks and uncertainties. Our actual results could differ materially from those discussed below. Factors that could cause or contribute to such differences include, but are not limited to, those identified below and those discussed in the section titled “Risk Factors” included elsewhere in this prospectus.
Overview
We are the leading online wellness services marketplace with over 42,000 local business subscribers on our platform in 124 countries and territories employing over 250,000 practitioners who provide a variety of wellness services to over 24 million active consumers as of March 31, 2015. Our integrated cloud-based business management software and payments platform for the wellness services industry helps our subscribers simplify the way they run their businesses, attract and engage more consumers, boost their revenues and focus more on what they love to do – improving people’s lives. Moreover, we help consumers more easily evaluate, engage and transact with these subscribers, enabling them to live healthier and happier lives. We are also a leading payments platform dedicated to the wellness services industry. In the 12 months ended March 31, 2015, $6.3 billion in transactions occurred between consumers and subscribers within our marketplace, of which $4.3 billion flowed through our payments platform.
We were founded in 2001 with a vision to address the vast and growing demand for business management software for the wellness services industry. We started as a hybrid desktop-web solution focused on yoga, Pilates and spinning businesses. In 2005, we released our software as a service platform and began to scale our business into adjacent fitness categories, increasing our total addressable market and fueling growth in consumer online bookings. Since then, we have made significant investments in our platform to enable increased penetration and continued growth in consumer online bookings. In 2009, we released MINDBODY Finder, enabling available classes and appointments to be aggregated for consumer search; released our API Platform, enabling developers and integration partners to build custom private apps and consumer-facing businesses on our platform; and released aggregated consumer facing-scheduling capabilities to our consumer-facing partners. In 2011, Fitness Mobile Apps used our API platform to build subscriber-branded apps that enabled consumers to search for and book classes easily from their mobile phones. In 2013, we launched our MINDBODY Express mobile app for businesses and our Connect mobile offering for consumers, thus connecting consumers with local businesses and allowing them to discover, evaluate, book and pay for wellness services nearby. When we released Connect in 2013, we introduced centralized consumer login, account management, consumer reviews and multiple credit card storage capabilities and released these capabilities exclusively on our own branded consumer app. All of these milestones accelerated consumer engagement and ultimately established us as a powerful consumer brand.
International expansion has been an important growth driver for us. In 2008, we completed our first integration of payments functionality into our platform for subscribers in Canada. In 2011, we opened our London sales office and integrated payments functionality into our platform for subscribers in the United Kingdom. In 2012, we opened a customer support office in the United Kingdom and integrated payments functionality into our platform for subscribers in Australia and New Zealand. In 2013, we opened our Sydney sales office, and by the end of 2014, we had complete payments integration in 41 countries and territories.
63
Table of Contents
The following graphic highlights key milestones in our history:
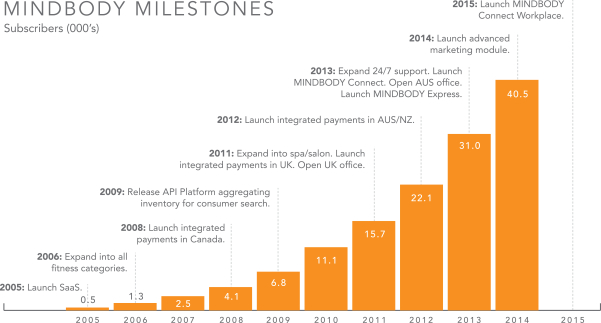
We primarily market and sell subscriptions to our integrated cloud-based business management software and payments platform to small and medium-sized businesses in the wellness services industry, including businesses that offer yoga, Pilates, barre, indoor cycling, personal training, martial arts and dance exercise, as well as spas, salons, music instruction studios, dance studios, children’s activity centers and integrative health centers.
We offer our software platform to our subscribers as a subscription-based service. Historically, our software subscription pricing was based on the number of professionals employed by our subscribers. In 2015, after substantial market testing and development, we began pricing our software subscriptions for new subscribers based on software functionality. The vast majority of our subscribers subscribe to our software platform through one month contracts that are billed in advance. We recognize software subscription revenue ratably over the term of the subscription period. Additionally, we earn revenue based on the value of transactions processed by our subscribers utilizing our payments platform, net of the costs charged to us by our processing partners.
We have achieved rapid subscriber growth through our effective sales model. We sell our subscriptions through a direct sales team with our primary sales operations in San Luis Obispo, California, New York, London and Sydney. Our sales team qualifies and manages prospective and current subscribers, aiming to initiate, retain, and expand their use of our platform over time. We benefit from organic search and positive word of mouth as well as network effects from practitioners who often recommend MINDBODY to their employers. In addition, through MINDBODY University events, subscriber conferences and webinars, we help our subscribers optimize their businesses and grow their revenue, which benefits us through improved subscriber retention and an increase in payments revenue. While we do not directly monetize consumers of our subscribers’ services, we believe that growth in the number of active consumers on our platform also contributes to subscriber growth.
As more local wellness businesses adopt our platform, more subscriber listings appear on MINDBODY Connect. A larger critical mass of local wellness services on Connect attracts more consumers, which in turn attracts more local wellness businesses that want to engage with these consumers, thereby creating powerful network effects that benefit the entire ecosystem. We believe these network effects have been enhanced by our recent introduction of MINDBODY Connect Workplace. As more corporate wellness subscribers adopt MINDBODY Connect Workplace, their employees begin using our platform, which leads to increased demand from local wellness businesses to be listed on Connect. As more local wellness businesses appear on Connect,
64
Table of Contents
more employees use our platform to redeem their corporate incentives, which in turn leads to more corporate wellness subscribers being attracted to our platform. Finally, as we add more subscribers, consumers and employees to our wellness ecosystem, we attract more technology developers and partners who can use our API to develop additional apps that extend the capabilities of our open platform.
We intend to continue scaling our organization in order to meet the needs of our growing subscriber base. We have invested and expect to continue to invest in our sales and marketing teams to sell our software and payments platform services globally. Our sales organization headcount grew at a compound annual growth rate of 39% from 2012 to 2014. A key element of our growth strategy is the continuous enhancement and expansion of our software and payments platform by developing and implementing new features and functionality. Through consistent innovation, we have increased both the number of subscribers and the revenue we generate from our subscribers over time. We plan to continue to enhance our software architecture and enhance and expand our platform through increased investments in research and development and by pursuing strategic acquisitions of complementary businesses and technologies that will enable us to continue to drive growth in the future. We also expect to continue to make significant investments in both our data center infrastructure and our customer service and subscriber onboarding teams to meet the needs of our growing user base. While these areas represent significant opportunities for us, we also face significant risks and challenges that we must successfully address in order to sustain the growth of our business and improve our operating results. Due to our continuing investments to grow our business, in advance of, and in preparation for, our expected increase in sales, we are continuing to incur expenses in the near term from which we may not realize any long-term benefit. In addition, any investments that we make in sales and marketing or other areas will occur in advance of our experiencing any benefits from such investments, so it may be difficult for us to determine if we are efficiently allocating our resources in these areas. As a result, we do not expect to be profitable in the current three-year planning window.
Our financial performance reflects our significant subscriber growth and increasing revenue per subscriber. Our total revenue increased from $32.0 million in 2012, to $48.7 million in 2013 to $70.0 million in 2014, representing year-over-year increases of 52% and 44%, respectively. Our total revenue increased from $15.7 million in the three months ended March 31, 2014 to $22.3 million in the three months ended March 31, 2015, representing an increase of 42%. Our net loss was $5.5 million, $16.2 million and $24.6 million in 2012, 2013 and 2014, respectively. Adjusted EBITDA was negative $2.5 million, negative $11.5 million and negative $18.8 million for 2012, 2013 and 2014, respectively. For the three months ended March 31, 2014 and 2015, our net loss was $4.8 million and $7.9 million, respectively, and Adjusted EBITDA was negative $3.8 million and negative $5.3 million, respectively. For a reconciliation of Adjusted EBITDA to net loss, please see the section titled “Summary Consolidated Financial and Other Data—Non-GAAP Financial Measure.” During 2014 and the three months ended March 31, 2015, approximately 84% of our revenue came from the United States. Our employee headcount has increased from 806 employees as of December 31, 2013 to 1,035 as of December 31, 2014, and to 1,100 as of March 31, 2015, of which approximately 28% are engaged in supporting existing subscribers and approximately 51% are engaged in increasing our subscriber base, growing our consumer brand or developing future products.
Our Business Model
Our business model focuses on maximizing the lifetime value of a subscriber relationship. We make significant investments in acquiring and onboarding new subscribers and believe that we will be able to achieve a positive return on these investments by retaining subscribers and expanding the revenue derived from our subscribers over the lifetime of the relationship. In connection with the acquisition of new subscribers, we incur and recognize significant upfront costs. These costs include sales; onboarding and marketing costs associated with acquiring new subscribers, such as sales commission expenses, which are expensed upfront; the cost of the onboarding personnel who provide the initial onboarding training to our new subscribers; marketing costs, which are expensed as incurred; and the cost associated with converting and importing subscriber data from competitors’ products. Due to our subscription model, we recognize software subscription revenue ratably over the monthly term of the subscription period, which commences when all of the revenue recognition criteria have been met. We recognize revenue from our payments platform on a net basis when the transactions occur.
65
Table of Contents
Although our objective is for each subscriber to be profitable for us over the duration of our relationship, the costs we incur with respect to any subscriber relationship, whether a new subscriber or an upsell to an existing subscriber, may exceed revenue in early periods of the relationship because we recognize those costs faster than we recognize the associated revenue. As a result, an increase in the mix of new subscribers as a percentage of total subscribers will initially have a negative impact on our operating results.
We realize different levels of profitability from our subscribers in large part depending on the fee level of their software subscription and the volume of transactions they process through our payments platform. For new subscribers, our associated sales, onboarding and marketing expenses typically exceed the first year revenue we recognize from those subscribers. For typical subscribers, their monthly subscriptions automatically renew each month. As a result, our sales and marketing expenses associated with renewals for our existing subscribers have been de minimis. Over the lifetime of the subscriber relationship, we incur sales and marketing costs to upsell the subscriber to higher levels of software functionality, to our payments platform, to our Premium Services and to our partners’ software offerings. However, these costs are significantly less than the costs initially incurred to acquire the subscriber. We believe that the lifetime value of our subscribers has consistently exceeded five times the cost of acquiring them.
To illustrate the economics of our subscriber relationships, we are providing an analysis of the subscribers we acquired in fiscal year 2011, which we will refer to as the 2011 Cohort. We selected the 2011 Cohort as a representative set of subscribers for this analysis because we believe the perspective of time is important to help investors understand the long-term value of our subscriber base and because we believe the 2011 Cohort is representative of our other cohorts. The 2011 Cohort includes all subscribers acquired in 2011. In fiscal year 2011, we recognized $3.7 million in subscription, services and payments revenue from the 2011 Cohort and incurred associated costs that resulted in a negative contribution margin for the 2011 Cohort. Since we acquired this 2011 Cohort of subscribers through the course of the year, less than a full year’s revenue is reflected in 2011. Starting in fiscal year 2012, our contribution margin from the 2011 Cohort turned positive, at 61%. By fiscal year 2014, we recognized $8.5 million in revenue from the 2011 Cohort, and our contribution margin grew to 75%. The contribution margin of our cohorts will fluctuate from one period to another depending upon various factors.
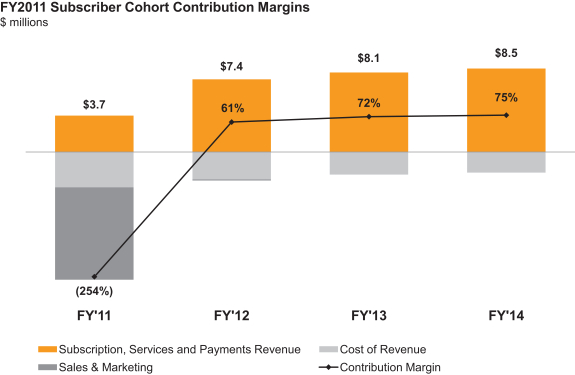
66
Table of Contents
Contribution margin is the subscription, services and payments revenue for a group of subscribers in excess of the estimated costs with respect to the same subscriber group, expressed as a percentage of associated revenue. Costs include sales and marketing costs incurred to acquire and upsell that subscriber, onboarding, operations, professional services subscriber support costs and costs associated with use of technology infrastructure. The expenses allocated to the subscriber include estimates for personnel costs such as salaries and commissions, direct costs, allocated overhead expenses and depreciation. We excluded stock-based compensation and amortization for purposes of this calculation. In addition, we exclude all research and development and general and administrative expenses from this analysis because these expenses support the overall growth of our business and benefit our subscribers, partners and consumers. We consider the sales and marketing costs we incur in any fiscal year to be primarily the cost of acquiring our new subscribers in that fiscal year, with the exception of estimated sales costs related to expanding our subscriber relationships and promoting our consumer brand, which are attributed to each fiscal year in accordance with internal estimates. The costs for subscriber onboarding, operations, professional services, and subscriber support are accounted for as cost of revenue.
We cannot assure you that we will experience similar financial outcomes from subscribers added in other years or in future periods. We believe the estimates and assumptions we used to allocate costs are reasonable, but the allocated costs could have varied significantly from the amounts disclosed above had we used different estimates and assumptions. You should not rely on the allocated expenses or relationship of expenses to subscription, services and payments revenue as being indicative of our current or future performance. We cannot predict whether revenue from the 2011 Cohort will continue to grow at the rate of growth experienced through December 31, 2014, or whether the growth rate of other cohorts will be similar to that of the 2011 Cohort. While the growth rate of revenue contribution from other cohorts has historically been similar to that of the 2011 Cohort, the growth rate may change as a result of our new tiered pricing model. We may not achieve profitability even if our revenue exceeds costs from our subscribers over time. We encourage you to read our consolidated financial statements that are included in this prospectus.
Key Metrics
We regularly review the following key metrics to measure our performance, identify trends affecting our business, formulate financial projections, make strategic business decisions and assess working capital needs.
| As of and for Year Ended December 31, | As of and for Three Months Ended March 31, 2015 |
|||||||||||||||
| 2012 | 2013 | 2014 | ||||||||||||||
| Subscribers (end of period) |
22,062 | 31,043 | 40,517 | 42,700 | ||||||||||||
| Average monthly revenue per subscriber |
$ | 131 | $ | 146 | $ | 155 | $ | 174 | ||||||||
| Payments volume (in millions) |
$ | 2,113 | $ | 3,099 | $ | 4,121 | $ | 1,168 | ||||||||
| Dollar-based net expansion rate (end of period) |
n/a | 103 | % | 109 | % | 109 | % | |||||||||
| • | Subscribers. Subscribers are defined as unique physical business locations or, in the case of our Solo software subscriptions, individual practitioners who have active subscriptions to our cloud-based business management software platform as of the end of the period. We believe the number of subscribers is a key indicator of the growth of our platform. Growth in the number of subscribers depends, in part, on our ability to successfully develop and market our platform to local wellness businesses and their consumers who have not yet become part of our network. While growth in the number of subscribers is an important indicator of expected revenue growth, it also informs our management’s decisions with respect to the areas of our business that will require further investment to support expected future subscriber growth. For example, as the number of subscribers increases, we will need to increase the headcount in our customer support organization and our IT infrastructure capital expenditures to maintain the effectiveness of our platform and the performance of our software for our subscribers and their consumers. The number of subscribers increased in 2013 and 2014, and we expect the number of subscribers to continue to increase in the future. The growth rate of the number of subscribers declined in 2013 and 2014 and may continue to do so in the future as the size of our subscriber base increases. |
67
Table of Contents
| • | Average Monthly Revenue per Subscriber. We believe that our ability to increase the average monthly revenue per subscriber is an indicator of our ability to increase the long-term value of our existing subscriber relationships. Average monthly revenue per subscriber is calculated by dividing the subscription and services and payments revenue generated in a given month by the number of subscribers at the end of the previous month. For periods greater than one month, the average monthly revenue per subscriber is the sum of the average monthly revenue per subscriber for each month in the period, divided by the number of months in the period. Average monthly revenue per subscriber increased in 2013 and 2014, and we expect it to continue to increase in the future, although we expect the growth rate to fluctuate over time. |
| • | Payments Volume. We believe that payments volume is an indicator of the underlying current health of our subscribers’ businesses and of consumer spending trends as well as being a major driver of our payments revenue. Payments volume is the total dollar volume of transactions between our subscribers and their consumers utilizing our payments platform. Payments volume increased in 2013 and 2014, and we expect it to continue to increase in the future. The growth rate declined in 2013 and 2014 and may continue to do so in the future due to the increasing base amount of payments volume. |
| • | Dollar-Based Net Expansion Rate. Our business model focuses on maximizing the lifetime value of a subscriber relationship. We can achieve this by focusing on delivering value and functionality that retains our existing subscribers and by expanding the revenue derived from our subscribers over the lifetime of the relationship by upselling the subscriber to higher priced subscription plans, utilization of our Premium Services, subscription to our technology partners’ software offerings and increasing the value of transactions that they process through our payments platform. We assess our performance in this area by measuring our dollar-based net expansion rate. Our dollar-based net expansion rate provides a measurement of our ability to increase revenue across our existing customer base, as offset by churn, downgrades in subscriptions, reduction in services utilization and reductions in the value of transactions that our subscribers process through our payments platform. Our dollar-based net expansion rate is based upon our monthly subscription, services and payments revenue for a set of subscriber accounts. We calculate our dollar-based net expansion rate by dividing our retained revenue net of contraction and churn by our base revenue. We define our base revenue as the aggregate monthly subscription, services and payments revenue of our subscriber base as of the date one year prior to the date of calculation. We define our retained revenue net of contraction and churn as the aggregate monthly subscription, services and payments revenue of the same subscriber base included in our measure of base revenue at the end of the annual period being measured. |
Components of Statements of Operations
Revenue
We generate revenue primarily from providing an integrated cloud-based business management software and payments platform for the wellness services industry. As discussed further in “Critical Accounting Policies and Estimates—Revenue Recognition” below, revenue is recognized when persuasive evidence of an arrangement exists, delivery has occurred, the fee is fixed or determinable and collectability is reasonably assured.
Our total revenue consists of the following:
| • | Subscription and services. Subscription and services revenue is generated primarily from sales of subscriptions to our cloud-based business management software for the wellness services industry. The majority of subscription fees are prepaid by subscribers on a monthly basis via a credit card and, to a lesser extent, billed to subscribers on an annual or quarterly basis. Additionally, our subscribers can choose to enter into a separate contract with the technology partners to purchase additional features and functionalities. We receive a revenue share from these arrangements from our technology partners, which is recorded when earned. We also earn revenue from API platform partners for subscriber site access, data query, and consumer bookings. The revenue from API platform partners is recorded when earned. Subscription revenue is recognized ratably over the term of the subscription agreement. Amounts invoiced in excess of revenue recognized are deferred. Service revenue is generated primarily through our premium customer support offering and is recognized in the period in which it is earned. |
68
Table of Contents
| • | Payments. We earn payments revenue from revenue share arrangements with third-party payment processors on transactions between our subscribers who utilize our payments platform and their consumers. These payment transactions are generally related to purchases of classes, goods or services through a subscriber’s website, at its business location or through Connect. These transaction fees are recorded as revenue on a net basis when the payment transactions occur. We expect our payments revenue to increase both in absolute dollars and as a percentage of total revenue as we add new subscribers who utilize our payments platform, as existing subscribers increase the volume of transactions that they process through our payments platform and as our aggregate volume of payments reduces our related costs and increases margins. |
| • | Product and other. We offer various point of sale system products and physical gift cards to our subscribers. Product and other revenue is recognized upon the delivery of these products to our subscribers. We expect product and other revenue to decline both in absolute dollars and as a percentage of total revenue as mobile point of sale systems and electronic gift cards become more prevalent in the marketplace. |
Cost of Revenue
Our cost of revenue primarily consists of costs associated with personnel and related infrastructure for operation of our cloud-based business management platform, global customer support and onboarding services, costs related to processing the payments of subscribers that pay via credit card and allocated overhead costs. Personnel costs consist of salaries, benefits, bonuses and stock-based compensation. Allocated overhead costs consist of certain facilities, depreciation and amortization of internally developed software costs.
Operating Expenses
Our operating expenses consist of sales and marketing, research and development, and general and administrative expenses, and the change in the fair value of contingent consideration.
| • | Sales and marketing. Sales and marketing expense consists primarily of personnel costs, including salaries, benefits, bonuses, stock-based compensation and commission costs for our sales and marketing personnel. Sales and marketing expense also includes costs for market development programs, advertising, promotional and other marketing activities, and allocated overhead. Sales and marketing expense is our largest operating expense, and we expect it to continue to increase in absolute dollars as we increase our sales and marketing efforts and expand our international operations, although such expense may fluctuate as a percentage of total revenue. |
| • | Research and development. Research and development expense consists primarily of personnel costs, including salaries, benefits, bonuses, and stock-based compensation for our development personnel. Research and development expense also includes outsourced software development costs and allocated overhead. We expect research and development expense to continue to increase in absolute dollars as we continue to invest in our research and product development efforts to enhance our product capabilities and access new markets, although such expense may fluctuate as a percentage of total revenue. |
| • | General and administrative. General and administrative expense consists primarily of personnel costs, including salaries, benefits, bonuses, and stock-based compensation for our executive, finance, legal, human resources, information technology, and other administrative personnel. General and administrative expense also includes consulting, legal and accounting services and allocated overhead. We expect general and administrative expense to continue to increase in absolute dollars as we grow our operations and prepare to operate as a public company, although such expense may fluctuate as a percentage of total revenue. |
| • | Change in fair value of contingent consideration. We recognized a contingent consideration liability related to an earn-out provision from our acquisition of Jill’s List in 2013, which was subsequently remeasured to fair value at each balance sheet date with a corresponding charge recorded within operating expenses. The period during which earn-out consideration can be earned will end in the second quarter of 2015, at which |
69
Table of Contents
| time the associated liability will be permanently extinguished and no longer be subject to fair value accounting. We do not expect to recognize significant changes in the fair value of the contingent consideration during 2015. |
Other Income and Expenses
Our other income and expenses line items consist of fair value remeasurement charges for our preferred stock warrant liability, interest income and expense, and other income (expense), net.
| • | Change in fair value of preferred stock warrant. The preferred stock warrant is classified as a liability on our consolidated balance sheet and remeasured to fair value at each balance sheet date with the corresponding charge recorded as change in fair value of preferred stock warrant. Upon the earlier of exercise of the outstanding warrant or the completion of a liquidation event, including the completion of this offering, the preferred stock warrant liability will be reclassified to stockholders’ equity, at which time it will no longer be subject to fair value accounting. |
| • | Interest income. Interest income consists of interest earned on our cash and cash equivalent balances. Interest income has not been material to our operations. |
| • | Interest expense. Interest expense consists primarily of the interest incurred on our financing obligations. Interest expense has not been material to our operations, but we expect it to increase in future periods as we recently entered into a build-to-suit lease agreement that includes an interest component. In addition, we entered into a line of credit agreement in January 2015, and any future draws on this agreement will incur interest expense and result in increased interest expense in future periods. |
| • | Other income (expense), net. Other income (expense), net consists primarily of gains and losses from foreign currency transaction and other income and expenses. |
Provision for Income Taxes
Provision for income taxes consists primarily of federal and state income taxes in the United States and income taxes in certain foreign jurisdictions in which we conduct business. We have a full valuation allowance for deferred tax assets, including net operating loss carryforwards, and tax credits related primarily to research and development. We expect to maintain this full valuation allowance for the foreseeable future.
70
Table of Contents
Results of Operations
The following tables set forth our results of operations data in dollars and as a percentage of revenue for those periods. The period-to-period comparison of results of operations is not necessarily indicative of results to be expected for future periods.
| Year Ended December 31, | Three Months Ended March 31, |
|||||||||||||||||||
| 2012 | 2013 | 2014 | 2014 | 2015 | ||||||||||||||||
| (in thousands) | ||||||||||||||||||||
| Consolidated Statements of Operations Data: |
||||||||||||||||||||
| Revenue |
$ | 31,999 | $ | 48,687 | $ | 70,010 | $ | 15,653 | $ | 22,263 | ||||||||||
| Cost of revenue |
13,411 | 21,890 | 30,004 | 6,478 | 8,693 | |||||||||||||||
|
|
|
|
|
|
|
|
|
|
|
|||||||||||
| Gross profit |
18,588 | 26,797 | 40,006 | 9,175 | 13,570 | |||||||||||||||
|
|
|
|
|
|
|
|
|
|
|
|||||||||||
| Operating expenses: |
||||||||||||||||||||
| Sales and marketing |
11,735 | 20,957 | 30,922 | 7,247 | 9,717 | |||||||||||||||
| Research and development |
3,741 | 10,517 | 16,167 | 3,594 | 4,725 | |||||||||||||||
| General and administrative |
8,111 | 10,730 | 18,422 | 3,530 | 6,780 | |||||||||||||||
| Change in fair value of contingent consideration |
— | 428 | (1,434 | ) | (423 | ) | — | |||||||||||||
|
|
|
|
|
|
|
|
|
|
|
|||||||||||
| Total operating expenses |
23,587 | 42,632 | 64,077 | 13,948 | 21,222 | |||||||||||||||
|
|
|
|
|
|
|
|
|
|
|
|||||||||||
| Loss from operations |
(4,999 | ) | (15,835 | ) | (24,071 | ) | (4,773 | ) | (7,652 | ) | ||||||||||
| Change in fair value of preferred stock warrant |
(515 | ) | (302 | ) | (283 | ) | (22 | ) | (150 | ) | ||||||||||
| Interest income |
6 | — | — | — | 3 | |||||||||||||||
| Interest expense |
(15 | ) | (21 | ) | (68 | ) | (20 | ) | (17 | ) | ||||||||||
| Other income (expense), net |
17 | (26 | ) | (68 | ) | 5 | (39 | ) | ||||||||||||
|
|
|
|
|
|
|
|
|
|
|
|||||||||||
| Loss before provision for income taxes |
(5,506 | ) | (16,184 | ) | (24,490 | ) | (4,810 | ) | (7,855 | ) | ||||||||||
| Provision for income taxes |
13 | 63 | 116 | 34 | 6 | |||||||||||||||
|
|
|
|
|
|
|
|
|
|
|
|||||||||||
| Net loss |
$ | (5,519 | ) | $ | (16,247 | ) | $ | (24,606 | ) | $ | (4,844 | ) | $ | (7,861 | ) | |||||
|
|
|
|
|
|
|
|
|
|
|
|||||||||||
| Year Ended December 31, | Three Months Ended March 31, |
|||||||||||||||||||
| 2012 | 2013 | 2014 | 2014 | 2015 | ||||||||||||||||
| (as a percentage of revenue) | ||||||||||||||||||||
| Consolidated Statements of Operations Data: |
||||||||||||||||||||
| Revenue |
100 | % | 100 | % | 100 | % | 100 | % | 100 | % | ||||||||||
| Cost of revenue |
42 | % | 45 | % | 43 | % | 41 | % | 39 | % | ||||||||||
|
|
|
|
|
|
|
|
|
|
|
|||||||||||
| Gross profit |
58 | % | 55 | % | 57 | % | 59 | % | 61 | % | ||||||||||
|
|
|
|
|
|
|
|
|
|
|
|||||||||||
| Operating expenses: |
||||||||||||||||||||
| Sales and marketing |
37 | % | 43 | % | 44 | % | 46 | % | 44 | % | ||||||||||
| Research and development |
12 | % | 22 | % | 23 | % | 23 | % | 21 | % | ||||||||||
| General and administrative |
25 | % | 22 | % | 26 | % | 23 | % | 30 | % | ||||||||||
| Change in fair value of contingent consideration |
— | 1 | % | (2 | )% | (3 | )% | — | ||||||||||||
|
|
|
|
|
|
|
|
|
|
|
|||||||||||
| Total operating expenses |
74 | % | 88 | % | 91 | % | 89 | % | 95 | % | ||||||||||
|
|
|
|
|
|
|
|
|
|
|
|||||||||||
| Loss from operations |
(16 | )% | (32 | )% | (34 | )% | (30 | )% | (34 | )% | ||||||||||
| Change in fair value of preferred stock warrant |
(1 | )% | (1 | )% | (1 | )% | — | (1 | )% | |||||||||||
| Interest income |
— | — | — | — | — | |||||||||||||||
| Interest expense |
— | — | — | — | — | |||||||||||||||
| Other income (expense), net |
— | — | — | — | — | |||||||||||||||
|
|
|
|
|
|
|
|
|
|
|
|||||||||||
| Loss before provision for income taxes |
(17 | )% | (33 | )% | (35 | )% | (30 | )% | (35 | )% | ||||||||||
| Provision for income taxes |
— | — | — | — | — | |||||||||||||||
|
|
|
|
|
|
|
|
|
|
|
|||||||||||
| Net loss |
(17 | )% | (33 | )% | (35 | )% | (30 | )% | (35 | )% | ||||||||||
|
|
|
|
|
|
|
|
|
|
|
|||||||||||
71
Table of Contents
Comparison of the Three Months Ended March 31, 2014 and 2015
Revenue
| Three Months Ended March 31, | Change | |||||||||||||||
| 2014 | 2015 | $ | % | |||||||||||||
| (dollars in thousands) | ||||||||||||||||
| Revenue: |
||||||||||||||||
| Subscription and services |
$ | 8,869 | $ | 13,461 | $ | 4,592 | 52 | % | ||||||||
| Payments |
5,902 | 8,022 | 2,120 | 36 | % | |||||||||||
| Product and other |
882 | 780 | (102 | ) | (12 | )% | ||||||||||
|
|
|
|
|
|
|
|||||||||||
| Total revenue |
$ | 15,653 | $ | 22,263 | $ | 6,610 | 42 | % | ||||||||
|
|
|
|
|
|
|
|||||||||||
Revenue increased $6.6 million, or 42%, in the three months ended March 31, 2015 compared to the three months ended March 31, 2014. Subscription and services revenue increased $4.6 million, or 52%, of which $3.3 million was due to a 26% increase in our number of subscribers from 33,951 as of March 31, 2014 to 42,700 as of March 31, 2015. In addition, revenue from arrangements with our API platform and technology partners increased $1.2 million. Payments revenue increased $2.1 million, or 36%, primarily due to an increase in the number of subscribers that utilize our payments platform.
Cost of Revenue and Gross Margin
| Three Months Ended March 31, | Change | |||||||||||||||
| 2014 | 2015 | $ | % | |||||||||||||
| (dollars in thousands) | ||||||||||||||||
| Costs of revenue |
$ | 6,478 | $ | 8,693 | $ | 2,215 | 34 | % | ||||||||
| Gross margin |
59 | % | 61 | % | ||||||||||||
Cost of revenue increased $2.2 million, or 34%, in the three months ended March 31, 2015 compared to the three months ended March 31, 2014. The increase in cost of revenue was primarily attributable to a $1.8 million increase in personnel-related expenses and infrastructure costs due to an increase in headcount to support our growing number of subscribers. As of March 31, 2015, we had 428 employees dedicated to data center operations, global customer support and onboarding services as compared to 321 employees as of March 31, 2014.
The increase in gross margin, or gross profit as a percentage of revenue, in the three months ended March 31, 2015 compared to the three months ended March 31, 2014 was primarily driven by our ability to efficiently increase our revenue while realizing cost efficiencies associated with such increase.
Operating Expenses
Sales and Marketing
| Three Months Ended March 31, | Change | |||||||||||||||
| 2014 | 2015 | $ | % | |||||||||||||
| (dollars in thousands) | ||||||||||||||||
| Sales and marketing |
$ | 7,247 | $ | 9,717 | $ | 2,470 | 34 | % | ||||||||
Sales and marketing expense increased $2.5 million, or 34%, in the three months ended March 31, 2015 compared to the three months ended March 31, 2014. The increase in sales and marketing expense was primarily attributable to a $2.2 million increase in personnel-related expenses due to an increase in headcount as we
72
Table of Contents
expanded our sales efforts and incurred additional personnel costs, such as sales commissions. As of March 31, 2015, we had 376 employees dedicated to sales and marketing as compared to 340 employees as of March 31, 2014.
Research and Development
| Three Months Ended March 31, | Change | |||||||||||||||
| 2014 | 2015 | $ | % | |||||||||||||
| (dollars in thousands) | ||||||||||||||||
| Research and development |
$ | 3,594 | $ | 4,725 | $ | 1,131 | 31 | % | ||||||||
Research and development expense increased $1.1 million, or 31%, in the three months ended March 31, 2015 compared to the three months ended March 31, 2014. The increase in research and development expense was primarily attributable to a $1.6 million increase in personnel-related expenses as we continued to add headcount to support our increased product development activities. The increase in personnel-related costs was partially offset by a $0.6 million decrease in outsourced development costs. As of March 31, 2015, we had 182 employees dedicated to research and development as compared to 137 employees as of March 31, 2014.
General and Administrative
| Three Months Ended March 31, | Change | |||||||||||||||
| 2014 | 2015 | $ | % | |||||||||||||
| (dollars in thousands) | ||||||||||||||||
| General and administrative |
$ | 3,530 | $ | 6,780 | $ | 3,250 | 92 | % | ||||||||
General and administrative expense increased $3.2 million, or 92%, in the three months ended March 31, 2015 compared to the three months ended March 31, 2014. The increase in general and administrative expense was primarily attributable to a $1.5 million increase in legal and other professional services, a $1.1 million increase in personnel-related expenses as we continued to add headcount, and a $0.6 million increase in facilities and other costs related to increases in headcount. As of March 31, 2015, we had 114 employees dedicated to general and administrative as compared to 68 employees as of March 31, 2014.
Change in Fair Value of Contingent Consideration
| Three Months Ended March 31, | Change | |||||||||||||||
| 2014 | 2015 | $ | % | |||||||||||||
| (dollars in thousands) | ||||||||||||||||
| Change in fair value of contingent consideration |
$ | (423 | ) | $ | — | $ | 423 | 100 | % | |||||||
There was no change in the fair value of the contingent consideration during the three months ended March 31, 2015 because the value of the contingent consideration as of December 31, 2014 and March 31, 2015 was immaterial.
73
Table of Contents
Other Income (Expense) and Income Taxes
| Three Months Ended March 31, | Change | |||||||||||||||
| 2014 | 2015 | $ | % | |||||||||||||
| (dollars in thousands) | ||||||||||||||||
| Change in fair value of preferred stock warrant |
(22 | ) | (150 | ) | (128 | ) | (582 | )% | ||||||||
| Interest income |
— | 3 | 3 | 100 | % | |||||||||||
| Interest expense |
(20 | ) | (17 | ) | 3 | (15 | )% | |||||||||
| Other income (expense), net |
5 | (39 | ) | (44 | ) | (880 | )% | |||||||||
| Provision for income taxes |
34 | 6 | (28 | ) | (82 | )% | ||||||||||
The changes in the fair value of the preferred stock warrant, interest income, interest expense, other income (expense), net, and the provision for income taxes in the three months ended March 31, 2015 compared to the three months ended March 31, 2014 were not significant.
Comparison of the Years Ended December 31, 2013 and 2014
Revenue
| Year Ended December 31, | Change | |||||||||||||||
| 2013 | 2014 | $ | % | |||||||||||||
| (dollars in thousands) | ||||||||||||||||
| Revenue: |
||||||||||||||||
| Subscription and services |
$ | 28,225 | $ | 40,501 | $ | 12,276 | 43 | % | ||||||||
| Payments |
17,122 | 26,060 | 8,938 | 52 | % | |||||||||||
| Product and other |
3,340 | 3,449 | 109 | 3 | % | |||||||||||
|
|
|
|
|
|
|
|||||||||||
| Total revenue |
$ | 48,687 | $ | 70,010 | $ | 21,323 | 44 | % | ||||||||
|
|
|
|
|
|
|
|||||||||||
Revenue increased $21.3 million, or 44%, in 2014 compared to 2013. Subscription and services revenue increased $12.3 million, or 43%, of which $10.2 million was due to a 31% increase in our number of subscribers from 31,043 as of December 31, 2013 to 40,517 as of December 31, 2014. In addition, revenue from arrangements with our technology partners increased $1.3 million and revenue from our premium support services increased $0.8 million. Payments revenue increased $8.9 million, or 52%, primarily due to an increase in the number of subscribers that utilize our payments platform.
Cost of Revenue and Gross Margin
| Year Ended December 31, | Change | |||||||||||||||
| 2013 | 2014 | $ | % | |||||||||||||
| (dollars in thousands) | ||||||||||||||||
| Costs of revenue |
$ | 21,890 | $ | 30,004 | $ | 8,114 | 37 | % | ||||||||
| Gross margin |
55 | % | 57 | % | ||||||||||||
Cost of revenue increased $8.1 million, or 37%, in 2014 compared to 2013. The increase in cost of revenue was primarily attributable to a $6.4 million increase in personnel-related expenses and infrastructure costs due to an increase in headcount to support our growing number of subscribers. As of December 31, 2014, we had 410 employees dedicated to data center operations, global customer support and onboarding services as compared to 301 employees as of December 31, 2013. In addition, we recognized a $1.1 million increase in depreciation and amortization expense during 2014 due to increased asset purchases primarily related to the expansion of our data centers.
The increase in the gross margin, or gross profit as a percentage of revenue, in 2014 was primarily driven by our ability to efficiently increase our revenue while realizing cost efficiencies associated with such increase.
74
Table of Contents
Operating Expenses
Sales and Marketing
| Year Ended December 31, | Change | |||||||||||||||
| 2013 | 2014 | $ | % | |||||||||||||
| (dollars in thousands) | ||||||||||||||||
| Sales and marketing |
$ | 20,957 | $ | 30,922 | $ | 9,965 | 48 | % | ||||||||
Sales and marketing expense increased $10.0 million, or 48%, in 2014 compared to 2013. The increase in sales and marketing expense was primarily attributable to a $7.3 million increase in personnel-related expenses due to an increase in headcount as we expanded our sales efforts and incurred additional personnel costs, such as sales commissions, as well as a $2.2 million increase in tradeshow and other marketing activities. As of December 31, 2014, we had 358 employees dedicated to sales and marketing as compared to 318 employees as of December 31, 2013.
Research and Development
| Year Ended December 31, | Change | |||||||||||||||
| 2013 | 2014 | $ | % | |||||||||||||
| (dollars in thousands) | ||||||||||||||||
| Research and development |
$ | 10,517 | $ | 16,167 | $ | 5,650 | 54 | % | ||||||||
Research and development expense increased $5.7 million, or 54%, in 2014 compared to 2013. The increase in research and development expense was primarily attributable to a $6.0 million increase in personnel-related expenses as we continued to add headcount to support our increased product development activities. As of December 31, 2014, we had 168 employees dedicated to research and development as compared to 122 employees as of December 31, 2013.
General and Administrative
| Year Ended December 31, | Change | |||||||||||||||
| 2013 | 2014 | $ | % | |||||||||||||
| (dollars in thousands) | ||||||||||||||||
| General and administrative |
$ | 10,730 | $ | 18,422 | $ | 7,692 | 72 | % | ||||||||
General and administrative expense increased $7.7 million, or 72%, in 2014 compared to 2013. The increase in general and administrative expense was primarily attributable to a $3.5 million increase in personnel-related expenses as we continued to add headcount, a $2.2 million increase in legal and other professional services, and a $1.6 million increase in facilities and other costs related to increases in headcount. As of December 31, 2014, we had 99 employees dedicated to general and administrative as compared to 65 employees as of December 31, 2013.
Change in Fair Value of Contingent Consideration
| Year Ended December 31, | Change | |||||||||||||||
| 2013 | 2014 | $ | % | |||||||||||||
| (dollars in thousands) | ||||||||||||||||
| Change in fair value of contingent consideration |
$ | 428 | $ | (1,434 | ) | $ | (1,862 | ) | (435 | )% | ||||||
The decrease in the change in fair value of contingent consideration was due to earn-out targets related to our acquisition of Jill’s List in 2013 not being met during 2014. Upon expiration of the contingency in April 2015, the associated liability will be permanently extinguished and we will no longer recognize any fair value remeasurements related to the contingent consideration.
75
Table of Contents
Other Income (Expense) and Income Taxes
| Year Ended December 31, | Change | |||||||||||||||
| 2013 | 2014 | $ | % | |||||||||||||
| (dollars in thousands) | ||||||||||||||||
| Change in fair value of preferred stock warrant |
302 | 283 | (19 | ) | (6 | )% | ||||||||||
| Interest expense |
21 | 68 | 47 | 22 | 4% | |||||||||||
| Other income (expense), net |
(26 | ) | (68 | ) | (42 | ) | 16 | 2% | ||||||||
| Provision for income taxes |
63 | 116 | 53 | 8 | 4% | |||||||||||
The changes in the fair value of the preferred stock warrant, interest income, interest expense, other income (expense), net, and the provision for income taxes in 2014 compared to 2013 were not significant.
Comparison of the Years Ended December 31, 2012 and 2013
Revenue
| Year Ended December 31, | Change | |||||||||||||||
| 2012 | 2013 | $ | % | |||||||||||||
| (dollars in thousands) | ||||||||||||||||
| Revenue: |
||||||||||||||||
| Subscription and services |
$ | 19,707 | $ | 28,225 | $ | 8,518 | 43 | % | ||||||||
| Payments |
9,515 | 17,122 | 7,607 | 80 | % | |||||||||||
| Product and other |
2,777 | 3,340 | 563 | 20 | % | |||||||||||
|
|
|
|
|
|
|
|||||||||||
| Total revenue |
$ | 31,999 | $ | 48,687 | $ | 16,688 | 52 | % | ||||||||
|
|
|
|
|
|
|
|||||||||||
Revenue increased $16.7 million, or 52%, in 2013 compared to 2012. Subscription and services revenue increased $8.5 million, or 43%, of which $7.1 million was due to a 41% increase in our number of subscribers from 22,062 as of December 31, 2012 to 31,043 as of December 31, 2013. In addition, revenue from arrangements with our technology partners increased $0.9 million. Payments revenue increased $7.6 million, or 80%, primarily due to the increase in the number of subscribers that utilize our payments platform. Product and other revenue increased $0.6 million, or 20%, primarily due to the increase in sales of various point-of-sale system products and physical gift cards to our subscribers in 2013.
Cost of Revenue and Gross Margin
| Year Ended December 31, | Change | |||||||||||||||
| 2012 | 2013 | $ | % | |||||||||||||
| (dollars in thousands) | ||||||||||||||||
| Costs of revenue |
$ | 13,411 | $ | 21,890 | $ | 8,479 | 63 | % | ||||||||
| Gross margin |
58 | % | 55 | % | ||||||||||||
Cost of revenue increased $8.5 million, or 63%, in 2013 compared to 2012. The increase in cost of revenue was primarily attributable to a $5.9 million increase in personnel-related expenses and infrastructure costs due to an increase in headcount to support our growing number of subscribers. As of December 31, 2013, we had 301 employees dedicated to data center operations, global customer support and onboarding services as compared to 199 employees as of December 31, 2012. In addition, we recognized a $1.8 million increase in depreciation and amortization expense during 2013 due to increased asset purchases primarily related to the expansion of our data centers in 2013. The decrease in the gross margin, or gross profit as a percentage of revenue, in 2013 was primarily driven by our investment in growing our customer support team in 2013 to support the growth of our subscriber base.
76
Table of Contents
Operating Expenses
Sales and Marketing
| Year Ended December 31, | Change | |||||||||||||||
| 2012 | 2013 | $ | % | |||||||||||||
| (dollars in thousands) | ||||||||||||||||
| Sales and marketing |
$ | 11,735 | $ | 20,957 | $ | 9,222 | 79 | % | ||||||||
Sales and marketing expenses increased $9.2 million, or 79%, in 2013 compared to 2012. The increase in sales and marketing expense was primarily attributable to a $6.7 million increase in personnel-related expenses due to an increase in headcount as we expanded our sales efforts and incurred additional personnel costs, such as sales commissions, a $0.9 million increase in tradeshow and other marketing activities, and a $0.4 million increase in allocated depreciation and amortization expenses due to increased headcount. As of December 31, 2013, we had 318 employees dedicated to sales and marketing as compared to 186 employees as of December 31, 2012.
Research and Development
| Year Ended December 31, | Change | |||||||||||||||
| 2012 | 2013 | $ | % | |||||||||||||
| (dollars in thousands) | ||||||||||||||||
| Research and development |
$ | 3,741 | $ | 10,517 | $ | 6,776 | 181 | % | ||||||||
Research and development expense increased $6.8 million, or 181%, in 2013 compared to 2012. The increase in research and development expense was primarily attributable to a $4.0 million increase in personnel-related expenses as we continued to add headcount to support our increased research and development activities and a $2.3 million increase in research and development cost. As of December 31, 2013, we had 122 employees dedicated to research and development as compared to 82 employees as of December 31, 2012.
General and Administrative
| Year Ended December 31, | Change | |||||||||||||||
| 2012 | 2013 | $ | % | |||||||||||||
| (dollars in thousands) | ||||||||||||||||
| General and administrative |
$ | 8,111 | $ | 10,730 | $ | 2,619 | 32 | % | ||||||||
General and administrative expense increased $2.6 million, or 32%, in 2013 compared to 2012. The increase in general and administrative expense was primarily attributable to a $1.1 million increase in personnel-related expenses as we continued to add headcount, a $1.1 million increase in facilities and other related costs due to the increase in headcount, a $0.7 million increase in legal and other professional service costs, partially offset by a $1.2 million decrease in stock-based compensation expense as in 2012 we incurred $1.4 million stock-based compensation expense related to sales of common stock by certain of our executive employees. As of December 31, 2013, we had 65 employees dedicated to general and administrative as compared to 36 employees as of December 31, 2012.
Change in Fair Value of Contingent Consideration
| Year Ended December 31, | Change | |||||||||||||||
| 2012 | 2013 | $ | % | |||||||||||||
| (dollars in thousands) | ||||||||||||||||
| Change in fair value of contingent consideration |
$ | — | $ | 428 | $ | 428 | 100 | % | ||||||||
77
Table of Contents
The increase in fair value of contingent consideration was related to an earn-out provision associated with the acquisition of Jill’s List in 2013.
Other Income (Expense) and Income Taxes
| Year Ended December 31, | Change | |||||||||||||||
| 2012 | 2013 | $ | % | |||||||||||||
| (dollars in thousands) | ||||||||||||||||
| Change in fair value of preferred stock warrant |
515 | 302 | (213 | ) | (41 | )% | ||||||||||
| Interest expense |
15 | 21 | 6 | 40 | % | |||||||||||
| Interest income |
6 | — | (6 | ) | (100 | )% | ||||||||||
| Other income (expense), net |
17 | (26 | ) | (43 | ) | (253 | )% | |||||||||
| Provision for income taxes |
13 | 63 | 50 | 385 | % | |||||||||||
The changes in the fair value of preferred stock warrant, interest income, interest expense, other income (expense), net, and the provision for income taxes were not significant during 2013.
Quarterly Results of Operations
The following tables set forth our unaudited consolidated statements of operations data for each of the nine quarters in the period ended March 31, 2015, as well as the percentage that each line item represents of total revenue for each quarter. The unaudited quarterly statements of operations data set forth below have been prepared on a basis consistent with our audited annual consolidated financial statements and include, in our opinion, all normal recurring adjustments necessary for a fair statement of the financial information contained in those statements. Our historical results are not necessarily indicative of the results that may be expected in the future. The following quarterly financial data should be read in conjunction with our audited consolidated financial statements and the related notes included elsewhere in this prospectus.
| Three Months Ended | ||||||||||||||||||||||||||||||||||||
| March 31, 2013 |
June 30, 2013 |
Sept. 30, 2013 |
Dec. 31, 2013 |
March 31, 2014 |
June 30, 2014 |
Sept. 30, 2014 |
Dec. 31, 2014 |
March 31, 2015 |
||||||||||||||||||||||||||||
| (in thousands) | ||||||||||||||||||||||||||||||||||||
| Revenue |
$ | 10,267 | $ | 11,291 | $ | 12,828 | $ | 14,301 | $ | 15,653 | $ | 16,571 | $ | 17,618 | $ | 20,168 | $ | 22,263 | ||||||||||||||||||
| Cost of revenue(1) |
4,670 | 5,122 | 5,653 | 6,445 | 6,478 | 6,998 | 8,146 | 8,382 | 8,693 | |||||||||||||||||||||||||||
|
|
|
|
|
|
|
|
|
|
|
|
|
|
|
|
|
|
|
|||||||||||||||||||
| Gross profit |
5,597 | 6,169 | 7,175 | 7,856 | 9,175 | 9,573 | 9,472 | 11,786 | 13,570 | |||||||||||||||||||||||||||
|
|
|
|
|
|
|
|
|
|
|
|
|
|
|
|
|
|
|
|||||||||||||||||||
| Operating expenses: |
||||||||||||||||||||||||||||||||||||
| Sales and marketing(1) |
4,362 | 4,957 | 5,665 | 5,973 | 7,247 | 7,047 | 8,451 | 8,177 | 9,717 | |||||||||||||||||||||||||||
| Research and development(1) |
2,004 | 2,377 | 2,916 | 3,220 | 3,594 | 4,033 | 4,416 | 4,124 | 4,725 | |||||||||||||||||||||||||||
| General and administrative(1) |
2,042 | 2,632 | 2,815 | 3,241 | 3,530 | 4,483 | 4,777 | 5,632 | 6,780 | |||||||||||||||||||||||||||
| Change in fair value of contingent consideration |
— | 176 | 155 | 97 | (423 | ) | (415 | ) | (543 | ) | (53 | ) | — | |||||||||||||||||||||||
|
|
|
|
|
|
|
|
|
|
|
|
|
|
|
|
|
|
|
|||||||||||||||||||
| Total operating expenses |
8,408 | 10,142 | 11,551 | 12,531 | 13,948 | 15,148 | 17,101 | 17,880 | 21,222 | |||||||||||||||||||||||||||
|
|
|
|
|
|
|
|
|
|
|
|
|
|
|
|
|
|
|
|||||||||||||||||||
| Loss from operations |
(2,811 | ) | (3,973 | ) | (4,376 | ) | (4,675 | ) | (4,773 | ) | (5,575 | ) | (7,629 | ) | (6,094 | ) | (7,652 | ) | ||||||||||||||||||
| Change in fair value of preferred stock warrant |
(56 | ) | (7 | ) | (165 | ) | (74 | ) | (22 | ) | 81 | (18 | ) | (324 | ) | (150 | ) | |||||||||||||||||||
| Interest income |
— | — | — | — | — | — | — | — | 3 | |||||||||||||||||||||||||||
| Interest expense |
(10 | ) | (1 | ) | (1 | ) | (9 | ) | (20 | ) | (5 | ) | (21 | ) | (22 | ) | (17 | ) | ||||||||||||||||||
| Other income (expense), net |
(26 | ) | (8 | ) | (8 | ) | 16 | 5 | 21 | (52 | ) | (42 | ) | (39 | ) | |||||||||||||||||||||
|
|
|
|
|
|
|
|
|
|
|
|
|
|
|
|
|
|
|
|||||||||||||||||||
| Income (loss) before provision for income taxes |
(2,903 | ) | (3,989 | ) | (4,550 | ) | (4,742 | ) | (4,810 | ) | (5,478 | ) | (7,720 | ) | (6,482 | ) | (7,855 | ) | ||||||||||||||||||
| Provision for income taxes |
3 | — | 12 | 48 | 34 | 29 | 24 | 29 | 6 | |||||||||||||||||||||||||||
|
|
|
|
|
|
|
|
|
|
|
|
|
|
|
|
|
|
|
|||||||||||||||||||
| Net income (loss) |
$ | (2,906 | ) | $ | (3,989 | ) | $ | (4,562 | ) | $ | (4,790 | ) | $ | (4,844 | ) | $ | (5,507 | ) | $ | (7,744 | ) | $ | (6,511 | ) | $ | (7,861 | ) | |||||||||
|
|
|
|
|
|
|
|
|
|
|
|
|
|
|
|
|
|
|
|||||||||||||||||||
78
Table of Contents
| (1) | Stock-based compensation expense included above was as follows: |
| Three Months Ended | ||||||||||||||||||||||||||||||||||||
| March 31, 2013 |
June 30, 2013 |
Sept. 30, 2013 |
Dec. 31, 2013 |
March 31, 2014 |
June 30, 2014 |
Sept. 30, 2014 |
Dec. 31, 2014 |
March 31, 2015 |
||||||||||||||||||||||||||||
| (in thousands) | ||||||||||||||||||||||||||||||||||||
| Cost of revenue |
$ | 6 | $ | 6 | $ | 20 | $ | 19 | $ | 24 | $ | 48 | $ | 73 | $ | 75 | $ | 100 | ||||||||||||||||||
| Sales and marketing |
4 | 4 | 24 | 24 | 34 | 45 | 58 | 59 | 541 | |||||||||||||||||||||||||||
| Research and development |
6 | 6 | 29 | 27 | 53 | 70 | 87 | 88 | 96 | |||||||||||||||||||||||||||
| General and administrative |
2 | 7 | 121 | 122 | 225 | 225 | 287 | 286 | 403 | |||||||||||||||||||||||||||
|
|
|
|
|
|
|
|
|
|
|
|
|
|
|
|
|
|
|
|||||||||||||||||||
| Total stock-based compensation expense |
$ | 18 | $ | 23 | $ | 194 | $ | 192 | $ | 336 | $ | 388 | $ | 505 | $ | 508 | $ | 1,140 | ||||||||||||||||||
|
|
|
|
|
|
|
|
|
|
|
|
|
|
|
|
|
|
|
|||||||||||||||||||
| Three Months Ended | ||||||||||||||||||||||||||||||||||||
| March 31, 2013 |
June 30, 2013 |
Sept. 30, 2013 |
Dec. 31, 2013 |
March 31, 2014 |
June 30, 2014 |
Sept. 30, 2014 |
Dec. 31, 2014 |
March 31, 2015 |
||||||||||||||||||||||||||||
| (percentage of revenue) | ||||||||||||||||||||||||||||||||||||
| Revenue |
100 | % | 100 | % | 100 | % | 100 | % | 100 | % | 100 | % | 100 | % | 100 | % | 100 | % | ||||||||||||||||||
| Cost of revenue |
45 | % | 45 | % | 44 | % | 45 | % | 41 | % | 42 | % | 46 | % | 42 | % | 39 | % | ||||||||||||||||||
|
|
|
|
|
|
|
|
|
|
|
|
|
|
|
|
|
|
|
|||||||||||||||||||
| Gross margin |
55 | % | 55 | % | 56 | % | 55 | % | 59 | % | 58 | % | 54 | % | 58 | % | 61 | % | ||||||||||||||||||
|
|
|
|
|
|
|
|
|
|
|
|
|
|
|
|
|
|
|
|||||||||||||||||||
| Operating expenses: |
||||||||||||||||||||||||||||||||||||
| Sales and marketing |
42 | % | 44 | % | 44 | % | 42 | % | 46 | % | 43 | % | 48 | % | 41 | % | 44 | % | ||||||||||||||||||
| Research and development |
20 | % | 21 | % | 23 | % | 23 | % | 23 | % | 24 | % | 25 | % | 20 | % | 21 | % | ||||||||||||||||||
| General and administrative |
20 | % | 23 | % | 22 | % | 23 | % | 23 | % | 27 | % | 27 | % | 28 | % | 30 | % | ||||||||||||||||||
| Change in fair value of contingent consideration |
— | 2 | % | 1 | % | 1 | % | (3 | )% | (3 | )% | (3 | )% | — | — | |||||||||||||||||||||
|
|
|
|
|
|
|
|
|
|
|
|
|
|
|
|
|
|
|
|||||||||||||||||||
| Total operating expenses |
82 | % | 90 | % | 90 | % | 89 | % | 89 | % | 91 | % | 97 | % | 89 | % | 95 | % | ||||||||||||||||||
|
|
|
|
|
|
|
|
|
|
|
|
|
|
|
|
|
|
|
|||||||||||||||||||
| Loss from operations |
(27 | )% | (35 | )% | (34 | )% | (33 | )% | (30 | )% | (33 | )% | (43 | )% | (30 | )% | (34 | )% | ||||||||||||||||||
| Change in fair value of preferred stock warrant |
(1 | )% | — | (1 | )% | — | — | — | — | (2 | )% | (1 | )% | |||||||||||||||||||||||
| Interest income |
— | — | — | — | — | — | — | — | — | |||||||||||||||||||||||||||
| Interest expense |
— | — | — | — | — | — | — | — | — | |||||||||||||||||||||||||||
| Other income (expense), net |
— | — | — | — | — | — | — | — | — | |||||||||||||||||||||||||||
|
|
|
|
|
|
|
|
|
|
|
|
|
|
|
|
|
|
|
|||||||||||||||||||
| Income (loss) before provision for income taxes |
(28 | )% | (35 | )% | (35 | )% | (33 | )% | (30 | )% | (33 | )% | (43 | )% | (32 | )% | (35 | )% | ||||||||||||||||||
| Provision for income taxes |
— | — | — | — | — | — | — | — | — | |||||||||||||||||||||||||||
|
|
|
|
|
|
|
|
|
|
|
|
|
|
|
|
|
|
|
|||||||||||||||||||
| Net income (loss) |
(28 | )% | (35 | )% | (35 | )% | (33 | )% | (30 | )% | (33 | )% | (43 | )% | (32 | )% | (35 | )% | ||||||||||||||||||
|
|
|
|
|
|
|
|
|
|
|
|
|
|
|
|
|
|
|
|||||||||||||||||||
Adjusted EBITDA
| Three Months Ended | ||||||||||||||||||||||||||||||||||||
| March 31, 2013 |
June 30, 2013 |
Sept. 30, 2013 |
Dec. 31, 2013 |
March 31, 2014 |
June 30, 2014 |
Sept. 30, 2014 |
Dec. 31, 2014 |
March 31, 2015 |
||||||||||||||||||||||||||||
| (in thousands) | ||||||||||||||||||||||||||||||||||||
| Net income (loss) |
$ | (2,906 | ) | $ | (3,989 | ) | $ | (4,562 | ) | $ | (4,790 | ) | $ | (4,844 | ) | $ | (5,507 | ) | $ | (7,744 | ) | $ | (6,511 | ) | $ | (7,861 | ) | |||||||||
| Stock-based compensation |
18 | 23 | 194 | 192 | 336 | 388 | 505 | 508 | 1,140 | |||||||||||||||||||||||||||
| Depreciation and amortization |
578 | 882 | 944 | 1,075 | 1,034 | 1,116 | 1,220 | 1,204 | 1,218 | |||||||||||||||||||||||||||
| Change in fair value of contingent consideration |
— | 176 | 155 | 97 | (423 | ) | (415 | ) | (543 | ) | (53 | ) | — | |||||||||||||||||||||||
| Change in fair value of preferred stock warrant |
56 | 7 | 165 | 74 | 22 | (81 | ) | 18 | 324 | 150 | ||||||||||||||||||||||||||
| Impairment changes |
— | — | — | — | — | — | 426 | — | — | |||||||||||||||||||||||||||
| Provision for income tax |
3 | — | 12 | 48 | 34 | 29 | 24 | 29 | 6 | |||||||||||||||||||||||||||
| Other (income) expense, net |
36 | 9 | 9 | (7 | ) | 15 | (16 | ) | 73 | 64 | 53 | |||||||||||||||||||||||||
|
|
|
|
|
|
|
|
|
|
|
|
|
|
|
|
|
|
|
|||||||||||||||||||
| Adjusted EBITDA |
$ | (2,215 | ) | $ | (2,892 | ) | $ | (3,083 | ) | $ | (3,311 | ) | $ | (3,826 | ) | $ | (4,486 | ) | $ | (6,021 | ) | $ | (4,435 | ) | $ | (5,294 | ) | |||||||||
|
|
|
|
|
|
|
|
|
|
|
|
|
|
|
|
|
|
|
|||||||||||||||||||
79
Table of Contents
Quarterly Trends
We have recently experienced rapid growth, which has resulted in a sequential increase in our revenue and a corresponding increase in our cost of revenue and operating expenses to support our growth. The sequential increases in quarterly revenue were mainly due to an increase in our number of subscribers, expansion of revenue sharing arrangements with our API platform partners and technology partners, an increase in premium support services and an increase in payments revenue from existing subscribers. The sequential increase in quarterly operating expenses was primarily due to increased expenses related to the continued expansion of our technical infrastructure and expenses related to increases in employee headcount.
Our historical results should not be considered a reliable indicator of our future results of operations.
Liquidity and Capital Resources
Since our incorporation in 2004, we have financed our operations and capital expenditures primarily through private sales of preferred stock, including through the receipt of proceeds in the amount of $74.7 million from the issuance of our Series F and G redeemable convertible preferred stock in the three year period ended December 31, 2014. As of December 31, 2014 and March 31, 2015, we had cash and cash equivalents of $34.7 million and $22.1 million, respectively. Cash and cash equivalents consist of cash on deposit and money market funds.
We believe that our existing cash and cash equivalents balance will be sufficient to meet our working capital requirements for at least the next 12 months. However, our liquidity assumptions may prove to be incorrect, and we could utilize our available financial resources sooner than we currently expect. Our future capital requirements and the adequacy of available funds will depend on many factors, including those set forth in the section of this prospectus entitled “Risk Factors.” We cannot assure you that we will be able to raise additional capital on acceptable terms or at all. In addition, if we fail to meet our operating plan during the next 12 months, our liquidity and ability to operate our business could be adversely affected.
In January 2015, we entered into a loan agreement with Silicon Valley Bank for a secured revolving credit facility that allows us to borrow up to $20.0 million for working capital and general business requirements. Borrowings under our loan agreement are available based on a percentage of our monthly recurring revenue for the prior months. Amounts outstanding under the credit facility will bear interest at the greater of the prime rate (3.25% as of January 12, 2015) plus 0.5%, or 3.25% with accrued interest payable on a monthly basis and outstanding and unpaid principal due upon maturity of the credit facility in January 2018. There are no prepayment penalties if we repay principal and interest prior to maturity. The credit facility is secured by substantially all of our corporate assets. We also granted and pledged a security interest to the lender in all rights, title, and interest in our intellectual property. We are also subject to certain reporting and financial performance covenants, which require us to meet certain revenue targets. We did not draw down any amounts under the loan agreement during the three months ended March 31, 2015.
The following table summarizes our cash flows for the periods presented:
| Year Ended December 31, | Three Months Ended March 31, |
|||||||||||||||||||
| 2012 | 2013 | 2014 | 2014 | 2015 | ||||||||||||||||
| (unaudited) | ||||||||||||||||||||
| (in thousands) |
||||||||||||||||||||
| Cash used in operating activities |
$ | (1,913 | ) | $ | (8,228 | ) | $ | (17,928 | ) | $ | (3,681 | ) | $ | (6,544 | ) | |||||
| Cash used in investing activities |
(5,031 | ) | (8,008 | ) | (5,668 | ) | (845 | ) | (5,616 | ) | ||||||||||
| Cash provided by (used in) financing activities |
25,270 | (48 | ) | 48,802 | 49,834 | (343 | ) | |||||||||||||
80
Table of Contents
Operating Activities
During the three months ended March 31, 2015, operating activities used $6.5 million, primarily as a result of our net loss of $7.9 million, partially offset by $2.7 million of non-cash charges, primarily consisting of $1.2 million of depreciation and amortization expense and $1.1 million of stock-based compensation expense, and a $1.4 million net decrease in our operating assets and liabilities. The net decrease in our net operating assets and liabilities was primarily a result of a $1.0 million increase in accounts receivable due to an increase in payments revenue and revenue from technology partner arrangements and a $0.5 million increase in prepaid expenses and other current assets, which was primarily due to the timing of payments to our vendors.
During the three months ended March 31, 2014, operating activities used $3.7 million, primarily as a result of our net loss of $4.8 million, partially offset by $1.1 million of non-cash charges, primarily consisting of depreciation and amortization expense.
During the year ended December 31, 2014, operating activities used $17.9 million, primarily as a result of our net loss of $24.6 million, partially offset by $6.1 million of non-cash charges, primarily consisting of depreciation and amortization expense of $4.6 million and stock-based compensation expense of $1.7 million. The net increase in operating assets and liabilities of $0.6 million was primarily a result of a $2.1 million increase in accounts payable due to a higher level of expenses consistent with the overall growth of our business, a $1.4 million increase in prepaid expenses and other current assets due to the timing of payments to our vendors, a $1.1 million increase in accounts receivable and a $0.7 million increase in deferred revenue. The increase in accounts receivable and deferred revenue was primarily due to increased sales of subscriptions.
During the year ended December 31, 2013, operating activities used $8.2 million, primarily as a result of our net loss of $16.2 million, offset by $4.8 million in non-cash charges, primarily consisting of depreciation and amortization expense of $3.5 million, and a $3.2 million net increase in our operating assets and liabilities. The net increase in operating assets and liabilities was primarily a result of a $1.8 million decrease in prepaid expenses and other current assets and a $1.4 million increase in accounts payable due to the timing of the payments to our vendors, partially offset by a $1.6 million increase in accounts receivable due to increased sales of subscriptions.
During the year ended December 31, 2012, operating activities used $1.9 million, primarily as a result of our net loss of $5.5 million, offset by $3.0 million of non-cash charges, primarily consisting of stock-based compensation of $1.5 million and depreciation and amortization expense of $1.0 million, and a $0.6 million net increase in our operating assets and liabilities. The net increase in operating assets and liabilities was primarily a result of a $2.4 million increase in accounts payable and accrued expenses and other current liabilities primarily due to increased expenses and the timing of payments to our vendors, partially offset by a $2.2 million increase in prepaid expenses due to increased expenses consistent with our business growth.
Investing Activities
During the three months ended March 31, 2015, investing activities used $5.6 million, primarily as a result of purchases of property and equipment of $3.4 million and cash paid to acquire a business of $3.0 million.
During the three months ended March 31, 2014, investing activities used $0.8 million, primarily as a result of purchases of property and equipment.
During the year ended December 31, 2014, investing activities used $5.7 million, primarily as a result of purchases of property and equipment of $7.3 million, which were partially offset by a decrease in restricted cash of $1.6 million.
81
Table of Contents
During the year ended December 31, 2013, investing activities used $8.0 million, primarily as a result of purchases of property and equipment of $5.1 million and an increase in restricted cash of $2.6 million.
During the year ended December 31, 2012, investing activities used $5.0 million, primarily as a result of purchases of property and equipment.
Financing Activities
During the three months ended March 31, 2015, financing activities used $0.3 million, primarily as a result of payment of deferred offering costs.
During the three months ended March 31, 2014, financing activities provided $49.8 million, primarily from proceeds of $49.9 million from the issuance of Series G redeemable convertible preferred stock.
During the year ended December 31, 2014, financing activities provided $48.8 million, primarily from proceeds of $49.9 million from the issuance of Series G redeemable convertible preferred stock.
During the year ended December 31, 2013, cash used in financing activities was not significant.
During the year ended December 31, 2012, financing activities provided $25.3 million, primarily from proceeds of $24.8 million from the issuance of Series F redeemable convertible preferred stock.
Contractual Obligations and Commitments
Our principal commitments consist of obligations under non-cancelable operating leases for our office space in San Luis Obispo, California. The following summarizes our contractual obligations and commitments as of December 31, 2014:
| Payment Due by Period | ||||||||||||||||||||
| Total | Less Than 1 Year |
1-3 Years | 3-5 Years | More Than 5 Years |
||||||||||||||||
| (in thousands) | ||||||||||||||||||||
| Operating leases(1) |
$ | 28,159 | $ | 3,442 | $ | 8,313 | $ | 4,464 | $ | 11,940 | ||||||||||
| Finance obligation, building leases(2) |
29,495 | 1,586 | 5,048 | 3,623 | 19,238 | |||||||||||||||
|
|
|
|
|
|
|
|
|
|
|
|||||||||||
| Total minimum payments |
$ | 57,654 | $ | 5,028 | $ | 13,361 | $ | 8,087 | $ | 31,178 | ||||||||||
|
|
|
|
|
|
|
|
|
|
|
|||||||||||
| (1) | We lease office facilities under various non-cancelable operating lease agreements. |
| (2) | For certain build-to-suit lease arrangements where we have concluded that we are the “deemed owner” of a building (for accounting purposes only) during the construction period, we are required to record an asset with a corresponding construction financing obligation for the costs incurred by the landlord. |
During the three months ended March 31, 2015, there were no significant changes to our contractual obligations and commitments.
Off Balance Sheet Arrangements
As of December 31, 2014 and March 31, 2015, we did not have any relationships with unconsolidated entities or financial partnerships, such as structured finance or special purpose entities, that were established for the purpose of facilitating off-balance sheet arrangements or other purposes.
Segment Information
We have one primary business activity and operate in one reportable segment.
82
Table of Contents
Quantitative and Qualitative Disclosures about Market Risk
We have operations both within the United States and internationally, and we are exposed to market risks in the ordinary course of our business. These risks primarily include interest rate and foreign exchange risks.
Interest Rate Risk
Our cash and cash equivalents consist of cash on deposit and money market accounts. The primary objective of our investment activities is to preserve principal while maximizing income without significantly increasing risk. Because our cash equivalents have a short maturity, our portfolio’s fair value is relatively insensitive to interest rate changes. We do not believe that an increase or decrease in interest rates of 100 basis points would have a material effect on our operating results or financial condition. In future periods, we will continue to evaluate our investment policy in order to ensure that we continue to meet our overall objectives.
Foreign Currency Exchange Risk
We have foreign currency risks related to our revenue and expenses denominated in currencies other than the U.S. Dollar, principally British Pounds Sterling, the Euro and Australian Dollar, which are subject to fluctuations due to changes in foreign currency exchange rates. Additionally, fluctuations in foreign currency exchange rates may cause us to recognize transaction gains and losses in our statements of operations. To date, foreign currency transaction gains and losses have not been material to our financial statements, and we have not engaged in any foreign currency hedging transactions. As our international operations grow, we will continue to reassess our approach to managing the risks relating to fluctuations in currency rates.
Internal Control Over Financial Reporting
Prior to this offering, we were a private company and had limited accounting and financial reporting personnel and other resources with which to address our internal controls and procedures. In connection with the audits of our consolidated financial statements, we identified material weaknesses in our internal control over financial reporting, as defined in the standards established by the Public Company Accounting Oversight Board of the U.S. A material weakness is a deficiency, or a combination of deficiencies, in internal control over financial reporting such that there is a reasonable possibility that a material misstatement of our financial statements will not be prevented or detected on a timely basis. In connection with the audit of our consolidated financial statements as of and for the year ended December 31, 2012, we discovered two material weaknesses that resulted from (i) a lack of a sufficient number of qualified personnel within our accounting department that possessed an appropriate level of expertise to perform certain accounting functions and (ii) the failure to establish proper access controls to our accounting software and proper controls to review and approve manual journal entries. In connection with the audit of our consolidated financial statements as of and for the year ended December 31, 2013, we discovered a material weakness related to the inadequate design and implementation of controls and procedures with respect to capitalization of development costs for internal use software. Finally, in connection with the audit of our consolidated financial statements as of and for the years ended December 31, 2013 and 2014, we identified a material weakness related to the inadequate design and implementation of controls and procedures with respect to the identification of and evaluation of accounting for certain features, including the related fair value computation, and transactions related to our redeemable convertible preferred stock. Our management and independent registered public accounting firm did not and were not required to perform an evaluation of our internal control over financial reporting as of and for the years ended December 31, 2013 and 2014 in accordance with the provisions of the JOBS Act.
We believe that we have remediated the material weaknesses from our 2012 audit. In addition, during 2013, we put in place additional controls over how our software is capitalized, and as such, we believe that we have remediated the material weakness from our 2013 audit related to capitalization of development costs for internal use software. Although the material weakness resulting from errors in the accounting for certain features of and
83
Table of Contents
transactions related to our redeemable convertible preferred stock had not been remediated as of December 31, 2014, all shares of redeemable convertible preferred stock will be automatically converted and reclassified into shares of Class B common stock immediately prior to the completion of this offering. As a result, following the offering, we will no longer be subject to the accounting rules that gave rise to the material weakness. Nevertheless, we cannot be certain that other material weaknesses and control deficiencies will not be discovered in the future. If our remediation efforts are not successful or other material weaknesses or control deficiencies occur in the future, we may be unable to report our financial results accurately or on a timely basis, which could cause our reported financial results to be materially misstated and result in the loss of investor confidence or delisting and cause the trading price of our Class A common stock to decline. As a result of such failures, we could also become subject to investigations by the stock exchange on which our securities are listed, the SEC, or other regulatory authorities, and become subject to litigation from investors and stockholders, which could harm our reputation, financial condition or divert financial and management resources from our core business. See “Risk Factors—We have in the past identified material weaknesses in our internal controls over financial reporting that, if not properly remediated, could result in material misstatements in our financial statements in future periods and impair our ability to comply with the accounting and reporting requirements applicable to public companies.”
Critical Accounting Policies and Estimates
Our consolidated financial statements are prepared in accordance with GAAP. The preparation of these consolidated financial statements requires us to make estimates and assumptions that affect the reported amounts of assets, liabilities, revenue, expenses, and related disclosures. We evaluate our estimates and assumptions on an ongoing basis. Our estimates are based on historical experience and various other assumptions that we believe to be reasonable under the circumstances. Our actual results could differ from these estimates.
We believe that the assumptions and estimates associated with revenue recognition, internal-use software development costs and the useful life of that software, income taxes, stock-based compensation expense and valuation assumptions have the greatest potential impact on our consolidated financial statements. Therefore, we consider these to be our critical accounting policies and estimates. For further information on all of our significant accounting policies, see the notes to our consolidated financial statements.
Revenue Recognition
We recognize revenue on a transaction when all of the following conditions have been satisfied:
| • | persuasive evidence of an agreement exists; |
| • | the service has been or is being provided to the subscriber or delivery of the product has occurred; |
| • | fees are fixed or determinable; and |
| • | the collection of the fees is reasonably assured. |
Our primary sources of revenue are derived from monthly subscription and support services and revenue share arrangements with the technology partners and third party payment processors. The subscription revenue for the monthly service fees is recognized on a straight-line basis over the term of the agreement, which is most often monthly but can be quarterly or annual. Our subscribers enter into separate arrangements with technology partners and third party payment processors. Revenue derived from revenue shares arrangements with technology partners and third party payment processors is recognized when earned on a net basis. We also earn revenue from API platform partners for subscriber site access, data query, and consumer bookings. The revenue from API platform partners is recorded when earned.
In certain circumstances, our arrangements include multiple elements which may consist of some or all of subscription services, support services, and hardware products, which are included in Product and other. When
84
Table of Contents
multiple-element arrangements exist, we evaluate whether any of these deliverables should be accounted for as separate units of accounting.
Our support services do not have standalone value because we and other vendors do not sell support services separately. Such support services are therefore combined with our subscription services as a single unit of accounting. Our hardware products, such as point of sale systems, have standalone value because we and other vendors sell the same products separately. Additionally, while there is a general right of return relative to our hardware products, which are generally delivered upfront, performance of the subscription and support services is considered probable and substantially in our control. Accordingly, we consider the separate units of accounting in our multiple-element arrangements to be the hardware products and subscription and support services. For arrangements with multiple elements which can be separated into different units of accounting, we allocate the arrangement fee to the separate units of accounting based on vendor-specific objective evidence, as demonstrated by separate sales with sufficient concentration in selling prices.
Capitalized Software Costs
We capitalize certain development costs incurred in connection with internal use software. Capitalization begins when the preliminary project stage is complete, management with the relevant authority authorizes and commits to the funding of the software project, it is probable the project will be completed, and the software will be used to perform the functions intended and certain functional and quality standards have been met. Capitalization of these costs ceases once the project is substantially complete and the software is ready for its intended purpose. Research and development costs incurred during the preliminary project stage or costs incurred for training, maintenance, and general and administrative or overhead costs are expensed as incurred. Capitalized software costs are amortized to cost of revenue using the straight-line method over an estimated useful life of the software of two to three years, commencing when the software is ready for its intended use.
Income Taxes
We account for income taxes under the asset and liability method of accounting for income taxes. Under this method, deferred taxes are recognized for the future tax consequences attributable to differences between the consolidated financial statement carrying amounts of existing assets and liabilities and their respective tax bases. Deferred tax assets and liabilities are measured using enacted tax rates expected to be applied to taxable income in the years in which those temporary differences are expected to be recovered or settled. A valuation allowance is recorded to reduce the carrying amount of deferred tax assets, unless it is more likely than not such assets will be realized.
We also apply the provisions for uncertainty of income taxes. This guidance prescribes a recognition threshold and measurement attribute for consolidated financial statement recognition and measurement of a tax position taken or expected to be taken in a tax return. For those benefits to be recognized, a tax position must be more likely than not to be sustained upon examination by taxing authorities. This guidance also applies to various related matters, such as derecognition, interest, penalties, and required disclosures. We recognize interest and penalties, if any, related to unrecognized tax benefits in our income tax provision.
Stock-Based Compensation
Stock-based compensation expense is measured and recognized in the financial statements based on the fair value of the awards granted. The fair value of each option award is estimated on the grant date using the Black-Scholes option-pricing model and a single option award approach. Stock-based compensation expense is recognized, net of forfeitures, over the requisite service period of the awards, which is generally four years.
Our use of the Black-Scholes option-pricing model requires the input of highly subjective assumptions, including the fair value of the underlying common stock, expected term of the option, expected volatility of the
85
Table of Contents
price of our common stock, risk-free interest rates, and the expected dividend yield of our common stock. The assumptions used in our option-pricing model represent management’s best estimates. These estimates involve inherent uncertainties and the application of management’s judgment. If factors change and different assumptions are used, our stock-based compensation expense could be materially different in the future.
These assumptions and estimates are as follows:
| • | Fair value of common stock. As our stock is not publicly traded, we must estimate the fair value of common stock, as discussed in “Common Stock Valuations” below. |
| • | Expected term. The expected term of employee stock options represents the weighted-average period that the stock options are expected to remain outstanding. |
| • | Volatility. As we do not have a trading history for our common stock, the expected stock price volatility for our common stock was estimated by taking the average historic price volatility for industry peers based on daily price observations over a period equivalent to the expected term of the stock option grants. Industry peers consist of several public companies in our industry which are similar in size, stage of life cycle, and financial leverage. We did not rely on implied volatilities of traded stock options in our industry peers’ common stock because the volume of activity was relatively low. We intend to continue to consistently apply this process using the same or similar public companies until a sufficient amount of historical information regarding the volatility of our own share price becomes available, or unless circumstances change such that the identified companies are no longer similar to us, in which case, more suitable companies whose share prices are publicly available would be used in the calculation. |
| • | Risk-free interest rate. We base the risk-free interest rate used in the Black-Scholes option-pricing model on the yields of U.S. Treasury securities with maturities appropriate for the term of employee stock option awards. |
| • | Dividend yield. We have never declared or paid any cash dividends and do not presently plan to pay cash dividends on our common stock in the foreseeable future. Consequently, we used an expected dividend yield of zero. |
The following table summarizes the assumptions used in the Black-Scholes option-pricing model to determine the fair value of our stock options as follows:
| Year Ended December 31, | Three Months Ended March 31, |
|||||||||||||||||||
| 2012 | 2013 | 2014 | 2014 | 2015 | ||||||||||||||||
| Expected term (in years) |
4.0 - 6.1 | 5.9 | 5.8 - 5.9 | 5.9 | 5.8 | |||||||||||||||
| Expected volatility |
55 | % | 55 | % | 48% - 51 | % | 50 | % | 46 | % | ||||||||||
| Risk-free interest rate |
0.5 - 0.9 | % | 1.6 | % | 1.7% - 1.9 | % | 1.7 | % | 1.4 | % | ||||||||||
| Expected dividend yield |
0 | % | 0 | % | 0 | % | 0 | % | 0 | % | ||||||||||
In addition to the assumptions used in the Black-Scholes option-pricing model, we must also estimate a forfeiture rate to calculate the stock-based compensation expense for our awards. Our forfeiture rate is based on historical experience and expected employee attrition rates. We will continue to evaluate the appropriateness of the forfeiture rate based on actual forfeiture experience, analysis of employee turnover, and other factors. Quarterly changes in the estimated forfeiture rate can have a significant impact on our stock-based compensation expense as the cumulative effect of adjusting the rate is recognized in the period the forfeiture estimate is changed. If a revised forfeiture rate is higher than the previously estimated forfeiture rate, an adjustment is made that will result in a decrease to the stock-based compensation expense recognized in the financial statements. If a revised forfeiture rate is lower than the previously estimated forfeiture rate, an adjustment is made that will result in an increase to the stock-based compensation expense recognized in the financial statements.
86
Table of Contents
We will continue to use judgment in evaluating the assumptions related to our stock-based compensation on a prospective basis. As we continue to accumulate additional data related to our common stock, we may have refinements to our estimates, which could materially impact our future stock-based compensation expense.
Common Stock Valuations
The fair value of the common stock underlying our stock options was determined by our board of directors, which intended all options granted to be exercisable at a price per share not less than the per share fair value of our common stock underlying those options on the date of grant. The valuations of our common stock were determined in accordance with the guidelines outlined in the American Institute of Certified Public Accountants Practice Aid, Valuation of Privately-Held-Company Equity Securities Issued as Compensation, or AICPA Practice Aid. The assumptions we use in the valuation model are based on future expectations combined with management judgment. In the absence of a public trading market, our board of directors, with input from management, exercised significant judgment and considered numerous objective and subjective factors to determine the fair value of our common stock as of the date of each option grant, including the following factors:
| • | contemporaneous valuations performed by unrelated third-party specialists; |
| • | the prices, rights, preferences, and privileges of our redeemable convertible preferred stock relative to those of our common stock; |
| • | the prices of our redeemable convertible preferred stock and common stock sold to outside investors in arm’s-length transactions; |
| • | the lack of marketability of our common stock; |
| • | our actual operating and financial performance; |
| • | current business conditions and projections; |
| • | our hiring of key personnel and the experience of our management; |
| • | our history and the timing of the introduction of new products and services; |
| • | our stage of development; |
| • | the likelihood of achieving a liquidity event, such as an initial public offering or a merger or acquisition of our company given prevailing market conditions; |
| • | the illiquidity of stock-based awards involving securities in a private company; |
| • | the market performance of comparable publicly traded companies; and |
| • | the U.S. and global capital market conditions. |
Historically, a third-party valuation firm has been engaged by our board of directors as needed to assist with the setting of the exercise price for our option grants. If a grant of options occurred between valuation report dates, the board of directors would assess if there had been any significant changes to the business and adjust the exercise price accordingly; however, historically our board of directors has determined that there has not been any significant changes and used the fair value of the common stock as of the date of the most recent, prior valuation as the exercise price for these grants.
In valuing the common stock, the fair value of our business, or Enterprise Value, was determined by using the value indications under a combination of valuation approaches, including an income approach and various market approaches, and under five different possible future scenarios: a high and low IPO scenario; a high and low M&A scenario; and a scenario in which we remain a private company. Prior to 2013, IPO and M&A scenario fair values were determined using the Guideline Public Company Method of the market approach. In 2013, we expanded our approach to include the Recent Transaction Method of the market approach for M&A
87
Table of Contents
scenarios. The Guideline Public Company Method of the market approach analyzes the financial performance of our Guideline Companies while utilizing selected multiples of market value of invested capital, or MVIC, compared to our twelve months trailing and projected revenue, as of the estimated IPO date. The Recent Transaction Method of the market approach analyzes recent acquisitions of companies similar to our business while utilizing selected multiples of MVIC compared to the twelve months trailing revenue, as of the estimated transaction date. Stay private scenario fair value was determined using a discounted cash flow analysis under the income approach.
Each of the above valuations was prepared on a minority, non-marketable interest basis.
The Enterprise Values determined above are then adjusted to: (1) add back cash on hand and (2) remove outstanding debt obligations; in order to determine an equity value, or Equity Value. The resulting Equity Values are then allocated to the common stock using an option pricing method, or OPM, and a Probability Weighted Expected Return Method, or PWERM. After the Equity Value is determined and allocated to the various classes, a discount for lack of marketability, or DLOM, is applied to arrive at the fair value of the common stock. A DLOM is applied based on the theory that as a private company an owner of the stock has limited opportunities to sell this stock and any such sale would involve significant transaction costs, thereby reducing overall fair market value.
The valuations are highly complex and subjective. Following the completion of this offering, common stock valuations will no longer be necessary as we will rely on market prices to determine the fair value of our common stock.
Summary of Options Granted
Our board of directors granted options to purchase common stock with the following exercise prices and deemed fair values since January 1, 2014:
| Grant Date |
Shares Underlying Options |
Exercise Price per Share | Deemed Fair Value per Share | |||||||||
| February 6, 2014 |
369,250 | $ | 11.52 | $ | 11.52 | |||||||
| May 14, 2014 |
421,250 | $ | 9.936 | $ | 9.936 | |||||||
| September 20, 2014 |
211,625 | $ | 10.616 | $ | 10.616 | |||||||
| November 6, 2014 |
7,500 | $ | 10.624 | $ | 10.624 | |||||||
| February 3, 2015 |
614,375 | $ | 14.476 | $ | 14.476 | |||||||
| April 6, 2015 |
270,000 | $ | 14.496 | $ | 15.496 | |||||||
| May 22, 2015 |
1,008,000 | $ | 14.496 | $ | 14.496 | |||||||
Our assessments of the fair value of our common stock for grant dates between the dates of the valuations were based in part on the current available financial and operational information and the common stock value provided in the most recent valuation as compared to the timing of each grant.
As of December 31, 2014 and March 31, 2015, we had $5.9 million and $9.2 million of unrecognized stock-based compensation, net of estimated forfeitures, that we expect to recognize over a weighted-average period of 3.0 and 3.1 years. In future periods, we expect our stock-based compensation to increase as we grant additional equity-based awards and as we recognize the remaining stock-based compensation from awards granted prior to this point.
Redeemable Convertible Preferred Stock
We record the carrying value of redeemable convertible preferred stock at fair value upon issuance, net of issuance costs, accreted to its estimated redemption value using the effective interest method. Accretion to the carrying value is being recorded as an increase in the carrying value of the redeemable convertible preferred stock and a reduction of stockholder’s deficit.
88
Table of Contents
We review the rights and preferences of our redeemable convertible preferred stock for any changes in terms, rights or preferences to determine if such change is a modification or an extinguishment. An amendment that, based on either quantitative or qualitative considerations, changes a substantive contractual term or fundamentally changes the nature of the preferred share is considered an extinguishment. We consider both expected economics as well as the business purpose of the amendment. If considered an extinguishment, we remove the carrying value of the old securities and recognize the new securities at their current fair value. If considered a modification, we recognize the change in the fair value of the security immediately before and after the amendment as either a deemed dividend or a deemed capital contribution.
Preferred Stock Warrant
We account for freestanding warrants to purchase shares of our redeemable convertible preferred stock as liabilities in the consolidated balance sheets at their estimated fair value. Our outstanding preferred stock warrant is subject to remeasurement at each balance sheet date, and any change in fair value is recognized as a component of other expense, net, in the consolidated statements of operations.
We will continue to adjust the liability for changes in fair value until the earlier of: (i) the exercise or expiration of the warrant, or (ii) the completion of a liquidation event, including the completion this offering, at which time the preferred stock warrant will be converted into a warrant to purchase common stock. Upon such an event, the fair value of the warrant will be remeasured one final time with the related liability being reclassified to stockholders’ equity.
Recently Issued and Adopted Accounting Pronouncements
In April 2015, the Financial Accounting Standards Board, or FASB, issued authoritative guidance, which changes the presentation of debt issuance costs in financial statements. Under this authoritative guidance, an entity presents such costs in the balance sheet as a direct deduction from the related debt liability rather than as an asset. Amortization of the costs is reported as interest expense. The new guidance is effective for us beginning January 1, 2016. Early adoption is permitted. The adoption of this guidance is not expected to have a material impact on our consolidated financial statements.
In November 2014, FASB issued authoritative guidance to clarify how current GAAP should be interpreted in evaluating the economic characteristics and risk of a host contract in a hybrid financial instrument that is issued in the form of a share. In addition, the new authoritative guidance was issued to clarify that in evaluating the nature of a host contract, an entity should assess the substance of the relevant terms and features (that is, the relative strength of the debt-like or equity-like terms and features given the facts and circumstances) when considering how to weight those terms and features. The effects of initially adopting the new authoritative guidance should be applied on a modified retrospective basis to existing hybrid financial instruments issued in a form of a share as of the beginning of the fiscal year for which the amendments are effective, with retrospective application permitted to all relevant prior periods. The new authoritative guidance is effective for the years beginning after December 15, 2015; however, early adoption is permitted. We elected to early adopt the new authoritative guidance on a retrospective basis for all periods presented with the earliest period being January 1, 2012. Under this new guidance, certain features embedded in certain series of preferred stock that were previously bifurcated and recognized as derivative liabilities within the consolidated financial statements are no longer bifurcated. We believe retrospective adoption provides users of the financial statements the most comparable and useful financial information and better reflects the underlying performance of our business.
In May 2014, FASB issued authoritative guidance that provides principles for recognizing revenue for the transfer of promised goods or services to customers with the consideration to which the entity expects to be entitled in exchange for those goods or services. The new guidance as currently issued is effective for us beginning January 1, 2017. On April 1, 2015, the FASB voted to propose a one-year deferral to the effective date, but to permit entities to adopt the original effective date if they choose. We are currently evaluating the impact of the adoption of this guidance.
89
Table of Contents
In August 2014, the FASB issued authoritative guidance that provides guidance on management’s responsibility in evaluating whether there is substantial doubt about an entity’s ability to continue as a going concern and by providing related footnote disclosure requirements. This new guidance is effective for us prospectively beginning January 1, 2016 with early adoption permitted. We are currently evaluating the impact of the adoption of this guidance but it is not expected to have a material impact on our consolidated financial statements.
90
Table of Contents
Dear Prospective Investor,
Bob Murphy and I first met on the phone in early 2002. I was running MINDBODY from my garage in San Luis Obispo, California. Bob and his wife Bev were running five yoga studios in New York. They were searching for software that could display integrated schedules for their five studios and help them simplify operations, better engage with consumers, boost revenues and improve profitability. Bob ordered the software on that first call and we met face to face soon thereafter. Over the next two years, we spent many hours together – on the phone and behind the front desks of the studios – troubleshooting the early desktop software and brainstorming ways to make it better. When MINDBODY needed growth capital in 2004, I approached Bob and we became business partners. Our unique experiences gained on the front lines of studio management software, combined with a shared vision for the future of the wellness services industry, led us to reimagine MINDBODY in the summer of 2004. We envisioned a different business model – one where all of the functionality of desktop software could be delivered via a web browser and sold by monthly subscription, rather than an up-front license. Thanks to the exceptional skills of our lead developer, and now Chief Product Officer, Chet Brandenburg, our first subscription software was released in February 2005. We didn’t fully realize it at the time, but we were among a small group of entrepreneurs pioneering a powerful new business model – Software as a Service (SaaS).
The SaaS vision we crafted in 2004 was fueled by our common belief that a global wellness revolution had started and that it would grow for many years to come. We further believed that the wellness revolution would cause the creation of millions of small fitness, spa, salon and integrative health businesses worldwide and that the owners of these businesses had a common set of complex business problems that we could solve with online software. We had personally met hundreds of these wellness business owners in the early years and understood that most of them were non-technical by nature and had the majority of their net worth at risk in their businesses. Understanding their high stakes, we concluded that we would need to build a highly engaged sales and customer service team to meet their expectations of service and support. Finally, we imagined a day when the collective offerings of this market could be made accessible in a single, online marketplace, and that this might become one of the most important business opportunities of our age.
With recent changes in healthcare, the proliferation of powerful mobile and wearable devices, and the advent of the cloud, everything we believed in 2004 is even truer today. We have created the leading online wellness services marketplace serving over 42,000 local business subscribers employing over 250,000 practitioners on our platform. These practitioners have delivered wellness services to 24 million active consumers in 124 countries and territories.
We’ve come a long way since the release of our first SaaS solution in 2005, but our mission is not yet complete. There are powerful applications and impactful connections yet to be made, millions of businesses to be served and hundreds of millions of additional consumers to be engaged to realize MINDBODY’s full potential. To achieve our goals and maximize our value, our team must keep its eyes on our long-term vision. If you share our long-term vision, it would be our pleasure to welcome you as a new stockholder of MINDBODY.
Sincerely,
Rick and Bob
91
Table of Contents
Our Vision
Our vision is to leverage technology to improve the wellness of the world.
Overview
We are the leading online wellness services marketplace with over 42,000 local business subscribers on our platform in 124 countries and territories employing over 250,000 practitioners who provide a variety of wellness services to over 24 million active consumers. Our integrated cloud-based business management software and payments platform for the wellness services industry helps our subscribers simplify the way they run their businesses, attract and engage more consumers, boost their revenues and focus more on what they love to do – improving people’s lives. Moreover, we help consumers more easily evaluate, engage and transact with these subscribers, enabling them to live healthier and happier lives. We are also a leading payments platform dedicated to the wellness services industry. In the 12 months ended March 31, 2015, $6.3 billion in transactions occurred between consumers and subscribers within our marketplace, of which $4.3 billion flowed through our payments platform.
Our platform is specifically designed for the wellness services industry. Wellness encompasses multiple dimensions of a person’s well-being – physical, emotional, social, occupational and spiritual, among others. As a result, we include health and fitness, integrative health, salon and spa, fine arts and children’s activities as categories within the wellness services industry. According to a report that we commissioned from Frost and Sullivan, our addressable market is approximately 4.2 million wellness businesses worldwide. Based on their analysis, Frost and Sullivan estimates a $9.5 billion market for business management software solutions targeted at wellness businesses in 2015 and expects this market to grow to $15.3 billion in 2018, which implies a 17.1% compound annual growth rate, or CAGR. With over 42,000 local business subscribers, we estimate our current market penetration to be less than 1%.
We believe millions of wellness businesses around the world are looking for a simple, efficient and reliable way to manage their operations. Management tasks are generally time consuming, preventing business owners from focusing on delivering their core services. This results in a loss of revenue-generating opportunities, lower client satisfaction and lower client retention. We founded MINDBODY to enable these business owners to focus on what they do best – whether it is creating beautiful hair, helping their clients lose weight and increase strength and flexibility, or teaching yoga, meditation, dance or music. Through our integrated cloud-based business management software and payments platform, we enable businesses to easily manage class and appointment schedules, staff members, client information, online bookings, inventory, payroll and retail sales – all in a cost-effective manner. We also offer advanced marketing and client retention capabilities to help businesses acquire and retain their clients, and analytics capabilities to help them improve their businesses and plan for the future. At the same time, we connect consumers with local businesses through our MINDBODY Connect platform, which powers a mobile interface that allows consumers to discover, evaluate, book and pay for wellness services, whether they are near their homes or traveling. Connect also gives these consumers a unified account that allows them to access and manage multiple wellness services with one sign in and provides them with access to authentic consumer reviews. The net effect of our Connect offering is to increase the number of wellness services purchased and used by consumers, thereby improving their lives while driving more business to our subscribers.
As employers become increasingly focused on wellness programs to improve the health, fitness and productivity of their employees, our MINDBODY Connect Workplace offering combines the power of our software platform with the ease of our Connect platform to enable employees to choose from a wide variety of on-site and local wellness services. Employees can book on-site classes and appointments, discover wellness services offered by MINDBODY subscribers in their area, and pay for those services using an employer-funded wellness debit card. Employers then use the Connect Workplace Corporate Dashboard to gain insights into employee engagement and analyze usage of corporate incentives and class participation at a macro level. We
92
Table of Contents
believe Connect Workplace helps employees live healthier, happier and more productive lives, while allowing employers to benefit from greater staff productivity, lower attrition and reduced healthcare costs.
We have enabled a rich partner ecosystem of over 600 developers and partners who extend the value of our platform in powerful ways. These developers and partners have built applications that supplement our capabilities in areas such as automation, marketing, mobile and social interaction. Several of these partners have created significant consumer-facing businesses that rely on our unique inventory of classes, scheduling and payments capabilities. All of this is enabled by our application programming interface, or API, through which we grant access to approved developers and partners. We also integrate with partners that provide email marketing, customer survey, events management and other functionality to augment the capabilities of our platform for the benefit of our subscribers. We believe that the opportunities and technology provided by our partners enhance the power of our marketplace and contribute to the attractiveness and critical position of MINDBODY within the wellness ecosystem.

As more local wellness businesses adopt our business management and payments platform, more subscriber listings appear on Connect. A larger critical mass of local wellness services on Connect attracts more consumers, which in turn attracts more local wellness businesses that want to engage with these consumers, thereby creating powerful network effects that benefit the entire ecosystem. Similarly, as more corporate wellness subscribers adopt Connect Workplace, their employees begin using our platform, which leads to increased demand from local wellness businesses to be listed on Connect. As more local wellness businesses appear on Connect, more employees use our platform to redeem their corporate incentives, which in turn leads to more corporate wellness subscribers being attracted to our platform. Finally, as we add more subscribers, consumers and employees to our wellness ecosystem, we attract more technology developers and partners who can use our API to develop additional apps that extend the capabilities of our open platform.
Over the last few years, we have significantly increased our subscriber base, the number of practitioners on our platform, the number of unique consumers engaged and the resulting volume of payments. We believe that
93
Table of Contents
we have the largest global database of wellness practitioners, including personal trainers, group exercise instructors, integrative health specialists, massage therapists, stylists, and dance and music instructors.
| (1) | We define active consumers as all unique consumers of our subscribers’ services who have used our platform to transact with our subscribers during the immediately preceding two years. While we do not directly monetize consumers of our subscribers’ services, we believe that growth in the number of active consumers on our platform also contributes to our subscriber growth. |
Our financial performance reflects our significant subscriber growth and increasing revenue per subscriber. Our total revenue increased from $32.0 million in 2012, to $48.7 million in 2013 to $70.0 million in 2014, representing year-over-year increases of 52% and 44% in 2013 and 2014, respectively. Our total revenue increased from $15.7 million in the three months ended March 31, 2014 to $22.3 million in the three months ended March 31, 2015, representing a quarter-over-quarter increase of 42%. Our net loss was $5.5 million, $16.2 million and $24.6 million for 2012, 2013 and 2014, respectively. Our Adjusted EBITDA was negative $2.5 million, negative $11.5 million and negative $18.8 million for 2012, 2013 and 2014, respectively. For the three months ended March 31, 2014 and 2015, our net loss was $4.8 million and $7.9 million, respectively, and Adjusted EBITDA was negative $3.8 million and negative $5.3 million, respectively. For a reconciliation of Adjusted EBITDA to net loss, please see the section titled “Summary of Consolidated Financial and Other Data—Non-GAAP Financial Measure.”
Industry Background
Increasing Focus on Personal Health and Beauty is Fueling Global Demand for Wellness Services
An increased focus on personal health and beauty represents a major global trend among consumers and is driving growth in wellness services worldwide. As the desire for longer, healthier lives, attractive appearance and overall physical and emotional well-being grows, more and more people are adopting a lifestyle that incorporates a healthier diet, regular physical exercise, integrative health, salon, spa and other wellness services.
| • | Improving physical fitness and nutrition is becoming a global imperative. Obesity, sedentary lifestyle and associated diseases have become some of the world’s most pressing public health concerns. According to the Institute for Health Metrics and Evaluation at the University of Washington, over 2.1 billion people or nearly 30% of the world’s population are overweight. The highest proportion of the world’s obese people, over 13%, live in the United States. Obesity significantly increases health risks such as cardiovascular disease, cancer, diabetes, osteoarthritis and chronic kidney disease. According to a policy statement issued |
94
Table of Contents
| by the American Society of Clinical Oncology, obesity is poised to overtake tobacco as the leading preventable cause of cancer in the United States. A number of public health initiatives have helped shed light on the central role that fitness plays in fighting obesity, diabetes and other health problems. As a result, we believe fitness is becoming a top priority in the modern world: people are becoming increasingly health conscious, recognizing the benefits of regular physical exercise and therefore seeking to achieve a healthy weight and fitness level, thus driving the demand for health and fitness services such as CrossFit, yoga, Pilates and various others contemporary workout methods. |
| • | Consumers are increasingly willing to spend more of their disposable income on wellness services. While decades ago individual spending on exercise classes and spa and salon services was minimal, we believe consumers across generations today are increasingly willing to allocate a more significant portion of their disposable income to wellness services. Spending habits have remained resilient even in recessionary environments. For example, during the recent economic downturn, the yoga and Pilates industry continued to exhibit strong growth. Similarly, we observed significant gains in CrossFit, barre, Zumba and other group exercise activities in the same period. |
| • | People increasingly consume salon, spa and integrative health services to enhance emotional, social and physical wellness. In addition to health and fitness, the global market for salon, spa and other wellness services is large and growing. In developed markets, we believe the aging population is demanding more of these services. In the United States, the aging baby boomer generation is expected to be a source of accelerating growth for the industry going forward. In emerging markets, we believe urbanization is driving demand for these services since there are more social interactions that result in greater spending on salon and spa services. Steady product innovation and the increased use of eco-friendly, non-toxic products represent additional growth drivers. Traditional salon and spa establishments have steadily broadened their product and service offerings to include facial products and services, Botox, hair and eyelash extensions, teeth whitening, and integrative health services like acupuncture, chiropractic and homeopathy. |
Growing Demand for Personalized Wellness Experiences has been Driving Industry Fragmentation
We believe consumers are increasingly seeking more personalized and effective wellness experiences and are opting for smaller businesses that are more conveniently located and cater to individual needs and preferences. As a result, the number of small wellness businesses has proliferated over the past decade, while all-inclusive facilities such as large health clubs now comprise only a small percentage of the wellness services industry’s aggregate revenue. For example, according to industry research firm IBISWorld, the top five national chains in the gym, health and fitness clubs industry comprised an estimated 15.7% of total health and fitness club revenue in 2014, with no single national chain holding more than a 5% market share. Meanwhile, the market share of smaller businesses has been growing rapidly. This trend can be seen in the popularity of practices such as yoga, Pilates, personal training, group exercise, indoor cycling, barre, Zumba and CrossFit. A large number of these smaller businesses either employ only one person or are single practitioner establishments, such as personal trainers and other mobile practitioners. According to IBISWorld, in the United States, 36% of health and fitness businesses were operated by single practitioners in 2014.
Escalating Healthcare Costs are Driving Employers Worldwide to Develop Corporate Wellness Programs that Incentivize the Use of Wellness Services
| • | Healthcare costs are increasing significantly and employers around the world are increasingly turning to corporate wellness programs as a way to reduce these costs. According to an article published in the Journal of the American Medical Association, 68% of American adults are either overweight or obese. According to healthcare research foundation The Commonwealth Fund, from 2003 to 2013, the annual cost U.S. employers paid for family coverage rose 73% to an average of $16,029. A 2010 study published in the Journal of Occupational and Environmental Medicine estimates that the cost of obesity among full-time employees reaches $73.1 billion each year. To reduce rising healthcare expenses and excessive absenteeism as well as to improve their employees’ productivity, more and more organizations are implementing |
95
Table of Contents
| corporate wellness and other incentive programs to encourage healthy behavior. Organizations can also receive a discount on insurance if they implement health and wellness programs. The Patient Protection and Affordable Care Act, or PPACA, also supports these initiatives with numerous provisions intended to leverage workplace health promotion and prevention as a means to reduce the burden of chronic illness and to limit the growth of health care costs. A 2012 study by RAND Health found that participation in a wellness program is associated with lower health care costs. As a result, over the last five years, employers have increased their investments in employee health and are becoming more willing to incentivize health improvements. In a Fidelity Investments Benefits Consulting Survey about employers’ investments in employee health, 74% of the 151 respondents across various industries reported that they will offer incentives for health improvement programs to employees in 2014 versus only 57% in 2009. The survey found that median incentive offered to employees increased to $500 per annum in 2014, up from $338 in 2010. According to IBISWorld, employers are expected to spend over $11 billion on corporate wellness by 2019. |
| • | Despite the wide availability of corporate wellness programs, the actual participation of employees in such programs remains limited. According to the Business Journal, Gallup reported that although more than 85% of large employers offer wellness programs, only 24% of employees at these companies actually participate in the programs. We believe that there are two principal reasons for this dynamic. First, most employers and their employees are lacking the right tools to incentivize participation in wellness programs. Rand Health found that making wellness activities convenient and accessible for all employees is a key success factor for corporate wellness programs. Second, many corporate wellness programs fail to provide access to offerings that would suit diverse preferences and instead offer one-dimensional incentives like gym membership subsidies, which may not appeal to the entire employee base. |
Consumers Need a Single, Mobile Enabled Interface for their Wellness Services Needs
Changes in technology have led to an evolution in consumer expectations. Over the last decade, advances in information technology have dramatically changed the way consumers interact with businesses. Consumers have more choices, are better informed and are more connected than ever before. Due to the proliferation of the mobile Internet, consumers have become accustomed to using their mobile phones to gain instant and convenient access to information about local businesses and the services they offer. Consumers increasingly take advantage of user reviews and recommendations and share information on social media sites. When it comes to online payments, consumers expect to have a complete set of payment options and a seamless process. However, consumers often find it complicated and time consuming to find and book wellness services due to the fragmented nature of the wellness services industry. Browsing through wellness businesses on search engines or physically comparing prices and quality of service as well as booking classes and appointments in person or over the phone can be frustrating. Consumers increasingly expect to be able to identify, research and schedule the desired wellness services using their mobile devices in a manner that allows them to view class schedules, practitioner details and consumer reviews, make bookings conveniently outside business hours through web or mobile interfaces and pay for these services seamlessly online.
In addition, consumers are increasingly leveraging technology to track their overall wellness. Over the last few years, there has been a proliferation of wearable devices that track users’ physical activity, heart rate, sleep quality and other health indicators throughout the day. According to IDC, the market for wrist-worn wearable devices is expected to grow rapidly, with units shipped growing by a 77% CAGR from 2013 to 2018. We believe that over the next few years a significant number of U.S. consumers will begin to wear devices to track diet, exercise, heart rate and other vital signs. Fuelled by advancements in fitness tracking technology, mobile apps within the health and fitness category grew faster than the overall market in 2014. The rise of consumer interest in improving wellness and tracking progress through wearable devices and mobile applications supports the need for a broad wellness services platform that can help consumers achieve their goals.
96
Table of Contents
Wellness Businesses Need an Integrated Software and Payments Platform that is Designed to Meet their Industry-Specific Needs
Wellness businesses have to manage online bookings, staff scheduling and payroll, and resource allocation. They also need to promote their wellness services, attract new consumers and nurture consumer relationships. In addition, business owners need to keep track of key business performance indicators and take action to increase revenue and improve profitability. Many wellness businesses use basic tools like paper forms or Excel spreadsheets to perform some of these functions, which can be time consuming and distracting. We have observed that the inability of business owners to focus on their core business often leads to lost revenue and lower consumer retention. Some of the specific challenges facing wellness businesses include:
| • | Consumer Scheduling. Many wellness businesses struggle with the complexity of scheduling appointments, enrolling participants in classes and managing cancellations and wait lists. |
| • | Staff Management. Managing staff, scheduling resources and tracking practitioner schedules, pay rates and commissions to accurately make payroll decisions is often challenging. |
| • | Payments. Wellness businesses often have to use different software, point of sale and payment processing solutions that do not integrate with each other, which requires time-consuming and cumbersome manual reconciliation between services delivered and payment records. |
| • | Analytics and Insights. To make critical business decisions, wellness businesses need to be able to track key performance indicators, such as the return rate of first-time consumers, consumer lifetime value, class popularity and staff performance. |
| • | Demand Generation. Small and medium-sized wellness businesses need effective but inexpensive marketing tools to promote their services in an increasingly competitive environment. |
| • | Consumer Engagement and Retention. For wellness businesses, keeping consumers coming back on a regular basis is essential for success. However, consumer relationship management is often time consuming and challenging. |
| • | Ability to Expand Business on Same Software Platform. Whether hiring more practitioners or opening new facilities, wellness businesses seek a business management solution that can support their growth with minimal time and financial investment. |
Wellness businesses need an easy-to-use and integrated cloud-based software and payments solution that is specifically designed for their needs, is cost effective and can be accessed anytime from anywhere and on any device.
Existing Offerings Do Not Address the Needs of Wellness Businesses and Consumers
Many wellness businesses still use basic tools like pen and paper and Excel spreadsheets to manage their operations. Legacy on-premise software vendors and emerging cloud software providers have developed tools that attempt to address the need for efficient business management, but these tools often lack the depth of functionality and industry expertise required to meet the unique needs of the wellness services industry. In addition, none of these tools feature a large consumer network that can help wellness businesses drive demand. At the same time, the process of discovering and booking wellness services for consumers is often time consuming and frustrating because consumers lack a single interface that can address their wellness service needs.
| • | Basic Management Tools: Pen, Paper and Excel Spreadsheets. Many wellness businesses today still use paper books and loose sign-in sheets to schedule appointments and classes along with Excel spreadsheets to track client data. The functionality of these legacy tools is limited – scheduling appointments and classes is manual, time consuming and static because the data cannot be easily updated and shared. Apart from scheduling, pen, paper and spreadsheets cannot effectively address any of the other business management tasks that modern wellness businesses require – such as staff management, client relationship management, marketing, analytics and payments integration. |
97
Table of Contents
| • | Legacy On-Premise Software Offerings. We believe that legacy on-premise software offerings do not adequately address the specific needs of wellness businesses because they are: |
| • | Difficult and expensive to deploy and use. Wellness businesses are often small or medium sized, have a limited number of practitioners and do not have an IT department in charge of managing complex software. The process to implement disparate on-premise software applications requires significant resources, including costs associated with training and performance maintenance. |
| • | Static and inflexible. The introduction of new features in on-premise software offerings is often cumbersome and inflexible, and such software does not easily scale with the dynamic growth and constantly evolving nature of these wellness businesses. In addition, legacy on-premise software offerings are also rarely adaptable or customizable to a variety of specific use cases, such as not being well suited for both fitness studios and salons. |
| • | Limited online booking and demand generation capabilities. It is difficult to integrate consumer online booking or synchronize multiple locations with an on-premise software offering. On-premise software offerings also tend to lack demand generation or marketing capabilities, which small wellness businesses need in order to succeed. |
| • | Not suited for mobile-only businesses. A large number of wellness practitioners are mobile practitioners who need a mobile-only, easy-to-use business management solution that legacy on-premise offerings do not provide. |
| • | Emerging Cloud-Based Software Offerings. There are a number of cloud-based offerings on the market today that address some of the pain points associated with legacy on-premise software. However, we believe that none of the existing offerings sufficiently address the needs of wellness businesses. |
| • | Lack of industry expertise and feature depth. There are a number of cloud-based appointment scheduling software offerings on the market today. However, few of them cater to the specific needs of wellness businesses, which include the ability to track different pay rates, commissions, and appointment length for each individual staff member to calculate payroll correctly. Another challenge is the tracking of pay and inventory used when staff members perform multiple services for different clients simultaneously, such as cutting and coloring hair. |
| • | Lack of large scale access to consumers looking to address their wellness service needs. Emerging cloud-based offerings do not offer wellness businesses access to consumers at scale and typically do not provide consumers with access to a variety of wellness services. Therefore, they are not positioned to be the go-to place for consumers to address their wellness service needs. |
| • | Lack of integration between demand generation, workflow management and point of sale. Some providers connect consumers and businesses through a local review platform. However, online booking and payments options are limited, while workflow management is non-existent. Some payments processing vendors have begun to offer basic online scheduling features, but the depth of these features is not sufficient for the complex operations of wellness businesses. Other software offerings provide business management tools but lack a proprietary payments processing solution, which makes manual and cumbersome reconciliations necessary. |
| • | Lack of social media integration and mobile applications. To attract consumers, wellness businesses are increasingly interested in using social networks to promote their services. However, many business management software offerings on the market today do not integrate with social media. For example, most wellness businesses are not able to connect their class schedules with their Facebook pages. In addition, while there are a large number of mobile practitioners who are looking for ways to manage their wellness business on the go, existing cloud-based solutions lack effective mobile applications. |
| • | Limitations of Consumer Facing Applications. Despite the increasing interest in wellness and the proliferation of wellness tracking devices and applications, consumers lack a single interface to connect |
98
Table of Contents
| them to local wellness services. Most consumers find wellness services through outdoor advertising, word-of-mouth or online search. Online search is often time consuming and frustrating since consumers have to click through different websites, evaluate services, prices and locations as well as call the front desk to schedule appointments or enroll in classes. In some cases, consumers use local business review platforms to help them evaluate and choose between wellness service providers. However, these platforms typically lack online booking and payment functionality. In addition, consumer reviews may lack credibility because users are able to post reviews without actually having consumed the service. |
The MINDBODY Solution
Our integrated cloud-based business management software and payments platform is specifically designed to address the unique requirements of the wellness services industry. We help our subscribers simplify their operations, focus on their consumers and grow their revenue by enabling them to attract and retain consumers. We have a deep understanding of the specific workflows that are required to operate various categories of wellness businesses. In addition, we help consumers find, evaluate, book and pay for the wellness services they need. Our Connect platform provides consumers with real-time class schedules, service descriptions, practitioner biographies and consumer reviews, thereby empowering them to make choices on an informed and efficient basis. Our Connect Workplace offering extends our platform to corporate employers. We help employees live healthier, happier and more productive lives, while enabling employers to reap greater staff productivity, lower attrition and reduced healthcare costs. In addition, we have developed a rich partner ecosystem with more than 600 developers and partners leveraging our platform to build unique and customized apps and services.
Integrated Software and Payments Platform Designed Specifically for the Needs of Local Wellness Businesses. We have developed a cloud-based software and payments platform with powerful functionality that addresses key aspects of operating a wellness business, including:
| • | Client Scheduling and Online Booking. We believe we offer subscribers the most complete online client scheduling capability available on the market today. Our subscribers can give their consumers the opportunity to book their next visit wherever and whenever it is most convenient for them, whether through the subscribers’ websites, which are powered by MINDBODY, or through Connect. We are the only platform provider that enables all four different types of scheduling that wellness businesses typically encounter: |
| • | Appointments. One-on-one appointments typically require preparation time before the appointment as well as finish-off time after the appointment. Our software can manage practitioner availability as well as gaps between appointments in a time-efficient manner. |
| • | Open classes. Open classes offer reserved or drop-in attendance on a first-come, first-serve basis. Our software can record different price points, send automatic check-in and cancellation confirmations, and manage waitlists. |
| • | Enrollments and workshops. Enrollments and workshops are pre-registered events or series of classes with the same group of attendees. Our software offers the ability to set separate pricing outside of pre-paid packages and track absences, make-ups and various payment plans. |
| • | Resource scheduling. To effectively manage their day-to-day business, wellness service providers need to manage and allocate their equipment and facilities. Our software can easily track, manage and allocate equipment and facilities for the classes and services these businesses provide. |
| • | Staff Management. With our staff and resource scheduling software features, staff management is easy and organized. Subscribers keep the whole schedule in one place, allowing them to manage staff availability, hours, substitutions, commissions and other compensation, all of which is easily linked to payroll records. The tracking features for hours worked and automatic payroll calculation facilitate efficient and accurate resource planning for our subscribers. |
99
Table of Contents
| • | Client Relationship Management. With our client relationship management features, subscribers have all their consumer information in one place and can take advantage of powerful consumer relationship and marketing tools. Subscribers can securely store their consumers’ personal information in a unique profile and keep track of account, visit and purchase history for more effective service. Our platform also helps subscribers target new consumers nearby, keep in touch with loyal members, and offer promotions and discounts to a targeted audience. |
| • | Integrated Software and Payments. We offer our subscribers payment processing solutions at competitive rates. The seamless integration between point of sale and payment processing saves our subscribers time by eliminating the need for error-prone manual reconciliations. In addition, our integrated payments platform allows for convenient and secure storage of consumer credit card information, which allows for seamless online bookings, recurring membership payments through our business management software and online store purchases through Connect. |
| • | Retail Point of Sale. Our point-of-sale capabilities help subscribers sell products and services, contracts and memberships, packages, workshops and store-branded gift cards. Our point-of-sale feature tracks product inventory levels and automatically issues purchase orders when product levels reach a re-order point. In addition, our point-of-sale capabilities can be used to track the cost of goods sold and gross margin for various products. |
| • | Analytics and Reporting. We track key information that subscribers need to know in order to achieve their business goals, including revenue growth, contribution margin of classes, consumer retention rates, referral sources, return on investment for consumer retention campaigns and practitioner performance based on consumer loyalty and reviews by class or type of service. Our platform also generates reports that help our subscribers allocate their resources, budget effectively and measure their success. By leveraging our analytics capabilities, subscribers are empowered to make smarter decisions. |
| • | Simple and Intuitive User Experience. We designed our business management software with a focus on developing a visually appealing interface that is simple, easy to use and meets the demands our subscribers have for modern web and mobile applications. Because we focus on a simple and intuitive user experience, our software platform requires little training and is easy to adopt for users across the entire organization, an important feature given the high employee turnover in the wellness services industry. At the same time, the intuitive interface of our platform is supported by complex underlying technology that powers efficient business management. |
| • | Mobility. Our platform enables our subscribers to manage their operations anytime and anywhere via a number of mobile devices and operating systems, including Mac, iOS, Android and Windows. |
| • | Dynamic Cloud-Based Architecture. Our software platform is powered by a dynamic cloud-based architecture that allows our subscribers to manage their operations as efficiently as possible, while requiring low upfront investment and no maintenance. This architecture allows for automatic software updates and rapid launch of new product features while also allowing our platform to easily scale with subscribers as their businesses grow. |
| • | Security and Compliance. Data security is one of our top priorities. We consistently pass our Level I Payment Card Industry Data Security Standard, or PCI DSS, audits, indicating our compliance with the most rigorous level of credit card security standard available. In addition, we in certain instances collect, access, use, maintain and/or transmit protected health information in connection with providing services to subscribers who are subject to the requirements of the Health Insurance Portability and Accountability Act, or HIPAA. Our platform is engineered to provide high reliability and availability. Our uptime service-level agreement (SLA) is 99.90%. We continually monitor our infrastructure for any sign of failure or pending failure and we take preemptive action to minimize or prevent downtime. We maintain the reliability of our service by utilizing redundant network infrastructure, clusters that tolerate failure of individual nodes, and deploying high availability server pairs. We also implement various disaster recovery measures, including full replication of hardware and data in our geographically distinct data centers, to minimize data loss in the event of a data center disaster. |
100
Table of Contents
| • | Social Integration. Our platform integrates with popular social networks like Facebook and Twitter, allowing our subscribers to publish schedules on their Facebook page and enabling consumers to directly schedule appointments and classes via Facebook. |
MINDBODY Connect
A key component of our platform is Connect, our consumer-facing offering. With Connect, consumers have a unified account to manage all aspects of their wellness activities with a single log in. They can discover local wellness services using a geo-located map function, view class and appointment descriptions, schedules and real-time availability, read practitioner biographies and user reviews written by consumers who have actually received the service, and then book and pay for their desired services in a few taps from their mobile devices. Through Connect, consumers can also receive appointment reminders and check in to classes before they arrive, receive real-time updates regarding changes in class schedules and access their account profile to review their class visit and payment history.
MINDBODY Connect Workplace
Our Connect Workplace offering is designed to allow corporate wellness subscribers to encourage healthy habits for their employees and measure the results. Subscribers to Connect Workplace use our platform to manage on-site wellness services, incentivize employees to take advantage of the local wellness businesses in our network, and analyze aggregate employee attendance data. Employers can offer their employees a subsidy – either by providing a MINDBODY debit card or an electronic direct debit option – to incentivize them to use wellness services. Employers can also use the Connect Workplace Corporate Dashboard to manage employee accounts, make changes to payment schedules and amounts, track employee participation to measure engagement either by individual or in the aggregate, and gain insight into employee preferences, frequency of use and reviews of local wellness businesses. Employees can search, evaluate, book and pay for services at any “green dot” business available on Connect. Green dot businesses are subscribers identified as being part of the employer’s wellness network and accept an employer-funded subsidy. While the number of corporate wellness subscribers has been immaterial to date, we believe that as more corporate wellness subscribers adopt Connect Workplace, their employees will begin using our platform, which will lead to increased demand from local wellness businesses to be listed on Connect.
Rich Partner Ecosystem
| • | Open Platform for Third-Party Application Development. We have built an open and extensible platform with an API that offers developers access to our inventory of classes, payments and scheduling capabilities. Approved developers can pull information from and post data to our platform and use that capability to create a variety of unique applications with custom interfaces. For example, some of our partners have leveraged our platform to create business models that enable wellness businesses to monetize their excess capacity. |
| • | Integration With Other Cloud-based Partners. Our platform can be integrated with other cloud-based software that our subscribers may be using for critical business management tasks to extend the capabilities of our platform within a variety of focus areas such as automation, marketing, mobile and social. |
Key Benefits to Marketplace Constituents
Benefits to Subscribers and Practitioners
| • | Simplify Operations. Our business management software and payments platform allows subscribers and practitioners to significantly streamline and simplify their operations. MINDBODY automates a large number of time-consuming workflows, thus dramatically reducing the administrative effort and time subscribers and their employees have to invest into business operations. The associated time savings enable greater staff productivity and more efficient allocation of resources, which can result in significant cost savings. Our subscription-based software is cost effective. We offer different pricing plans that are intended to accommodate the needs of our subscribers as they grow and provide full price transparency relative to legacy vendors by eliminating hidden fees for installation, training, ongoing maintenance or software updates. |
101
Table of Contents
| • | Focus on Clients. By simplifying the operations of wellness businesses, we enable subscribers and practitioners to focus on what they love to do – helping their clients achieve their goals, whether it is to lose weight, learn yoga or dance or reduce pain through acupuncture or chiropractic services. We give subscribers the freedom to focus on their consumers – and by serving their consumers better, subscribers can dramatically increase consumer satisfaction and loyalty. In addition, our powerful analytical tools provide critical insights that help subscribers focus on optimizing their business and achieving their goals. |
| • | Grow Client Base and Revenue. We help our subscribers increase their consumer base by taking advantage of a free listing on Connect, which makes them visible to a larger pool of local consumers. Moreover, by having the ability to send reminders, promotions and special offers to consumers based on a record of their past interactions, subscribers can significantly increase their consumer engagement and loyalty. We help subscribers sell their products and services through a variety of channels – an online store, their website or Connect, thus helping them to increase their revenue. Finally, as our subscribers’ businesses grow, MINDBODY scales with them by providing subscribers an opportunity to upgrade their subscription to access advanced features and functionality that are well suited to their growing business needs. |
Benefits to Consumers
| • | Convenient Single Interface that Addresses Wellness Services Needs for Consumers. We offer consumers a single platform to easily discover, evaluate and book wellness services for the entire family. Our subscribers include a large variety of wellness businesses such as fitness studios, yoga, Pilates, massage, salons, spas and more, to which we provide convenient “one-stop-shop” access through a single searchable interface. By being able to easily find and compare local wellness services, consumers feel informed and empowered to choose the services that suit them best. In addition, reviews on our platform can only be written by consumers who have actually participated in a class or used a service. As a result, consumers are able to access credible reviews that provide a basis for informed decisions. |
| • | Time Savings and Excellent Consumer Experience Lead to Higher Engagement and Achievement of Wellness Goals. We believe that our platform for seamlessly managing class or appointment bookings, cancellations, reminders and payments for wellness services from mobile devices saves consumers time that would otherwise be required to perform online searches, browse through numerous websites and make phone calls to schedule or manage their desired wellness services. Our ability to allow consumers to more easily manage their wellness routine and consume more wellness services on a regular basis, increases their engagement and brings them closer to their goal of living a healthy lifestyle. |
| • | Central Database for Wellness Activities Facilitates Fitness Graph Tracking. New technologies, including wearable fitness trackers provided by third parties and mobile apps within the health and fitness categories, are enabling consumers to track various aspects of their health and fitness. As part of this trend, Connect offers consumers a powerful way to track their fitness graph. On Connect, consumers can access their wellness activity history, such as class attendance frequency, class duration and more, thus providing valuable intelligence that empowers them to adjust their activities to meet their individual goals. |
Benefits to Employers
| • | Empower Employees and Offer Choices. Connect Workplace enables employees to access a wide variety of wellness services that can be subsidized by their employers. Employees are not limited to on-site services or receiving a subsidy at a local gym that has little appeal. With the wide variety of wellness businesses on our platform, employees have the freedom to select from a broad range of wellness services to fulfill their health and fitness objectives. |
| • | Analyze Engagement and Effectiveness. The Connect Workplace Corporate Dashboard enables employers to gain insights into employee engagement and aggregate usage of corporate incentives for further analysis. We believe our Connect Workplace offering helps employees live healthier, happier and more productive lives, while enabling employers to reap greater staff productivity, lower attrition and reduced healthcare costs. |
102
Table of Contents
Market Opportunity
According to IBISWorld, in 2014, the total revenue of gyms, health and fitness clubs in the United States was expected to reach $26.5 billion, and the U.S. salon market, consisting of haircutting services, hair coloring services, nail care services, skin care services and other services, was expected to reach $50.2 billion. The global markets for these services are significantly larger. In addition, the U.S. corporate wellness services market was expected to reach $7.4 billion in 2014, according to IBISWorld. According to a report that we commissioned from Frost and Sullivan, our addressable market is approximately 4.2 million wellness businesses worldwide. Based on their analysis, Frost and Sullivan estimates that the market for business management software solutions targeted at wellness businesses will grow to $9.5 billion in 2015 and expects this market to grow to $15.3 billion in 2018, which implies a 17.1% CAGR. In addition, we believe there are a significant number of individual practitioners worldwide who are not included in the 4.2 million addressable market estimate and can benefit from our business management software and payments platform. With over 42,000 local business subscribers, we estimate our current market penetration to be less than 1%. While we expect competition in the industry to increase and evolve over time, given our market leadership, we believe that we are well positioned to compete for and capture a significant portion of global software and payments spending in the wellness services industry.
Our Competitive Strengths
The Leading Online Wellness Services Marketplace. We are the leading online wellness services marketplace with over 42,000 local business subscribers on our platform in 124 countries and territories employing over 250,000 practitioners who provide a variety of wellness services to over 24 million active consumers. Due to our unmatched global wellness network, Connect has become the go-to destination for consumers to manage their wellness services activities. We are also a leading payments platform dedicated to the wellness services industry. In the 12 months ended March 31, 2015, $6.3 billion in transactions occurred between consumers and subscribers within our marketplace, of which $4.3 billion flowed through our payments platform.
Industry-Specific Expertise. We focus exclusively on the wellness services industry. Our team of experts understands the detailed workflows and needs of each type of business within the wellness services industry, and has designed our integrated cloud-based business management software and payments platform specifically to address the unique requirements of these businesses. In addition, we host MINDBODY University events, client conferences and webinars to help business owners navigate challenges and opportunities specific to their wellness category, optimize their business operations and maximize their profitability. Broad based solutions that do not focus on a particular industry lack the depth of understanding and functionality necessary to be able to meet the unique demands of wellness businesses.
Powerful Network Effects. As more local wellness businesses use our platform, more subscriber listings appear on Connect. A larger critical mass of local wellness services on Connect attracts more consumers, which in turn attracts more local wellness businesses that want to engage with these consumers, thereby creating powerful network effects that benefit the entire ecosystem. Similarly, as more corporate wellness subscribers adopt Connect Workplace, their employees begin using our platform, which leads to increased demand from local wellness businesses to be listed on Connect. As more local wellness businesses appear on Connect, more employees use our platform to redeem their corporate incentives, which in turn leads to more corporate wellness subscribers being attracted to our platform. Finally, as we add more subscribers, consumers and employees to our wellness ecosystem, we attract more technology developers and partners who can use our API to develop additional applications that extend the capabilities of our open platform.
103
Table of Contents

Integrated Cloud-Based Business Management Software and Payments Platform. The seamless integration between our business management software and payments platform provides a convenient one-stop solution for our subscribers. Subscribers save time and resources by avoiding the use of a separate payments platform and the associated burdensome manual reconciliations of transactions that result from a lack of automation. We believe that this integrated software and payments capability leads to higher subscriber engagement with our platform and a larger recurring revenue stream for us. Our payments platform enables swiped transactions at the front desk between consumers and subscribers, transactions with securely stored credit card data and ecommerce transactions through web and mobile interfaces. This integrated capability vastly simplifies back office administration and accounting, while enabling our subscribers to boost their revenue.
Ability to Scale with Our Subscribers’ Businesses. Our feature-rich software scales from individual practitioners to large, international organizations that have hundreds of locations. It is possible for an independent mobile practitioner starting her small business to begin with our entry level software, upgrade to our more robust offerings as she opens her first brick-and-mortar location, then add locations and ultimately create a substantial chain on our platform. This type of inspirational story has happened many times.
Critical Position in the Wellness Ecosystem. Over 42,000 wellness businesses use our platform to manage their business operations, attract and engage consumers, boost their revenue and focus on what they love to do. At the same time, we have enabled a rich partner ecosystem of over 600 developers and partners who extend the value of our platform in powerful ways. Many of our partners have also built successful businesses, or have significantly expanded their existing businesses, to cater to our subscribers and consumers via our platform. For example, some partners have developed business models that depend on our real-time inventory of classes and appointments to enable health and fitness businesses to monetize their excess capacity, while providing consumers with greater access to a variety of classes. We believe the time, effort and dollars spent by these businesses to integrate with our platform point to the critical position that MINDBODY has established in the ecosystem.
Proprietary Data and Analytics. Our software and payments platform collects and presents critical information that enables subscribers to fine tune their business operations. With our software, subscribers can analyze their consumer data, including demographics, type and frequency of activities and spending habits. In addition, we help subscribers assess the performance of their staff. For example, a subscriber can run client
104
Table of Contents
retention statistics to determine the effectiveness of a specific practitioner based upon location or types of services delivered. We also have unique insights into anonymized macro level data that indicate global preferences and trends in the wellness services industry by geography, which informs our business decisions. In addition, we collect and display consumer reviews to both subscribers and consumers. This enables consumers to make more informed buying decisions and helps our subscribers improve their businesses. Since only consumers who have purchased and attended a class or appointment can write a review, consumers rely on us for authentic and informative consumer review data. Due to our market leadership position, we have access to more proprietary data than our competitors in the wellness services industry, which helps us improve our platform and offer us the ability to provide unique insights and analytical capabilities.
Exceptional Company Culture that Drives Performance. The MINDBODY team shares an exceptional company culture that incorporates our core values of being purpose driven, humble and helpful, caring and happy, committed to wellness, environmentally conscious, continuously evolving and committed to “Five C” leadership. We believe that each team member may practice leadership, daily, regardless of position or title, and we promote people who best demonstrate:
| • | Competence – they make the effort to be true experts in what they do. |
| • | Character – they do the right thing, even when it is not convenient. |
| • | Compassion – they care as much about others as they do about themselves. |
| • | Catalyst – they remove obstacles and make things happen. |
| • | Courage – they stand up for what they believe in and take responsibility for their team. |
Our employees thrive in a nurturing environment that is driven by innovation, passion for health and wellness and dedication towards excellent subscriber experience. According to a report from Mashable based on data from Glassdoor in December 2014, MINDBODY has been named one of the “Top 10 Best Tech Companies To Work For in 2015.” In addition, Outside Magazine has named MINDBODY one of America’s best places to work for two years in a row. We believe our culture gives us a competitive advantage in recruiting and retaining talent, driving innovation, enhancing productivity and improving customer experience.
Growth Strategy
Given the increasing demand for wellness services among consumers today and a largely untapped market, we believe our opportunity is significant and growing. Key elements of our growth strategy include:
Continuing to Expand Our Subscriber Base, both Domestically and Internationally. We believe the global market for a cloud-based business management and payments platform within the wellness services industry is large and underserved. We will continue to make investments in our business to acquire more subscribers and expand our reach, both domestically and internationally.
Deepening Relationships with Existing Subscribers. We intend to deepen our relationships with existing subscribers by offering additional value-added functionality and upselling subscription plans that mirror the growth stage of their businesses. Moreover, we plan to convert more of our existing subscribers to our integrated payments capability and increase the percentage of their revenue that flows through our platform.
Growing Consumer Adoption of MINDBODY Connect. Connect has a critical position in our wellness ecosystem, yielding powerful network effects with increasing adoption among consumers. We are focused on attracting more consumers to our platform through word of mouth, referral marketing programs, social media and embedded community building features in Connect.
Continuing to Innovate and Broaden Our Platform. We will continue to make significant investments in research and development to strengthen our technology platform, and develop additional functionality to better serve the needs of subscribers and consumers, while striving to provide the best user experience possible.
105
Table of Contents
Further Developing Our Partnerships and Wellness Ecosystem. Through our numerous partners and developers who build third-party applications on our platform, we have built a flourishing ecosystem that creates value for subscribers and partners. We plan to continue to expand and further monetize our ecosystem by further developing existing strategic relationships and building new ones.
Increasing Our Presence in Corporate Wellness. We believe our Connect Workplace offering is well positioned to boost the success of corporate wellness programs worldwide. We plan to increase our subscriber footprint in corporate wellness and leverage these corporate relationships to further drive subscriber growth and Connect consumer engagement.
Making Strategic Investments and Select Acquisitions. We will continue to enhance our technology, accelerate our network effect and expand our leadership position by pursuing acquisitions of complementary businesses, technologies and teams.
Expanding Our International Reach via Partnerships and Investments in Our Salesforce. We are focused on growing our international offices and establishing partnerships that extend our reach and facilitate our entrance into new markets, in particular in Europe, Latin America and selected countries in Asia Pacific.
106
Table of Contents
The MINDBODY Software and Payments Platform
Our platform is designed to cater to the needs of subscribers, consumers, employers and partners.

Software and Payments Platform for Subscribers
Our integrated cloud-based business management software and payments platform for the wellness services industry helps our subscribers simplify the way they run their businesses, attract and engage more consumers, boost their revenues, and focus more on what they love to do – improve people’s lives. Until the end of 2014, our software subscription pricing was based on the number of professionals employed by our subscribers. However, because each of our subscribers is unique and at a different stage of their respective professional journey, in January 2015, we
107
Table of Contents
introduced a new tiered pricing model based upon four software functionality levels—Solo, Grow, Pro and Accelerate. Each of these levels has been carefully crafted to give just the functionality needed for subscribers to optimize their business at their respective stage in the journey. For the three months ended March 31, 2015, revenue from our new tiered pricing model did not constitute a material portion of our total revenue.
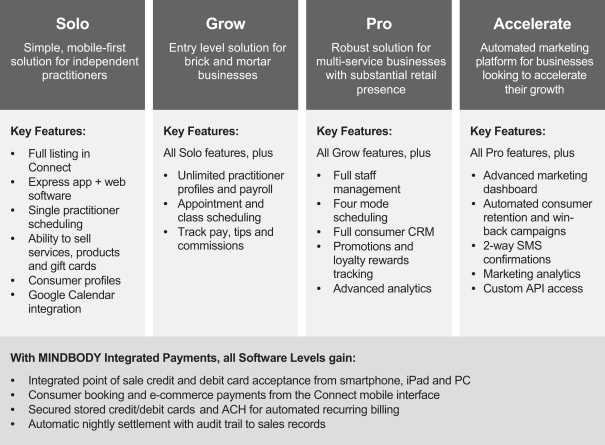
Scheduling
| • | Appointments. Refers to one-on-one appointments that typically require preparation time before the appointment as well as finish-off time after the appointment. Requires software features that can manage practitioner availability as well as gaps between appointments in a time-efficient manner. |
| • | Open Classes. Refers to recurring classes that offer reserved or drop-in attendance on a first-come, first-serve basis. Requires software features that can record different price points, send automatic check-in and cancellation confirmations and manage waitlists. |
| • | Enrollments and Workshops. Refers to pre-registered events or a series of classes with the same group of attendees. Requires software that offers the ability to set separate pricing outside of pre-paid packages and track absences, make-ups and various payment plans. |
| • | Resource Scheduling. With our business management software, subscribers can easily manage room and equipment allocations for the classes and services they provide. |
Staff Management
Subscribers can assign tasks, follow up and send notifications via the staff dashboard. By giving each staff member a unique login, subscribers can allow staff members to update their own availability on the
108
Table of Contents
schedule. Moreover, subscribers can have staff clock in and out through MINDBODY so their work hours and gross wages can be tracked automatically as well as their compensation for classes and appointments delivered and sales commissions. Subscribers and their managers can run analytics to assess individual productivity and make informed decisions.
Subscribers have the ability to set pay rates per class, per appointment, per hour, or by percentage of consumer payment for each individual staff member, as well as track and add tips a staff member receives into the payroll report. Additionally, subscribers can offer commissions to their staff for retail sales or promotions. Payroll is calculated automatically and exported to any of several popular payroll service formats, including ADP, Paychex and Exact Payroll Services.
Client Relationship Management
Subscribers can maintain a comprehensive client profile, including contact information, photos, birthdays, preferences, purchase and visit histories, payment information and future schedules. Subscribers can also track the sales cycle and conversion of prospective clients.
Clients have the ability to create accounts and log in directly, allowing them to browse products and services and make purchases from mobile devices and the web.
Point of Sale
Subscribers can sell products and services as well as memberships, monthly contracts and packages that combine products and services at their place of business and online. Subscribers can securely store consumer billing information to facilitate quicker transactions. Payments for classes or appointments can be applied before or after consumer check-in, and before or after the session is complete. Our point of sale functionality allows the easy assignment of staff commissions, whether to the staff member providing the service or to a different staff member who completes the sale.
Our payments platform provides instant authorization and nightly settlement of credit card, debit card and ACH transactions. Once a sale is complete, staff can void, edit or return the sale, and all of these changes are recorded in an auditable fashion. All consumer payment information is protected behind PCI Level I Data Security Standards, the most rigorous credit card certification standard available.
Subscribers have the ability to set inventory re-order points, automatically generate purchase orders and easily log arriving inventory. As a result, subscribers always know how much inventory is on hand and inbound and can easily calculate gross margin and inventory shrinkage.
Subscribers have the ability to accept any type of cash or non-cash equivalent payment method, including ACH, debit and credit cards. They can also set up payment plans and schedule recurring payments automatically from securely stored credit cards on file.
Marketing Capabilities
Subscribers can pull email addresses en masse, or pull targeted segments according to the demographics that matter to the individual business. They also have the option to sync to a Constant Contact account with MINDBODY, and create email lists that update automatically whenever client contact information changes in their site.
To reward consumers, subscribers can build a point-based client loyalty program, and set point values and minimum redemption requirements.
Similarly, subscribers can set up promotions to attract new consumers and give current ones an incentive to try something new.
Subscribers have the ability to sell products through an online store and ship them to consumers, or set them aside for consumers to pick up.
109
Table of Contents
Advanced marketing automation tools enable subscribers to manage automated win back campaigns and two way SMS and email confirmations.
Automation
MINDBODY empowers business owners to spend less time at the front desk. Subscribers can send text message alerts and reminders to consumers about upcoming classes, appointments and more. Further automation examples include sending purchase receipts directly to consumers’ email addresses, receiving notifications when consumers book an appointment, confirm, cancel, and more, tracking online orders as they come in, and print packing slips automatically as well as printing sign-in sheets for class, or use an iPad or tablet to set up a self check-in station.
MINDBODY offers businesses an easy way to manage their memberships. With MINDBODY’s automation tools, subscribers can manage membership contracts and waivers, collect membership fees automatically through recurring payments, offer special discounts for products and services as well as create membership tiers to extend rewards and perks to their most loyal consumers.
Analytics and Reporting Tools
Our platform enables subscribers to identify trends and opportunities for improvement in their businesses using the following analytics and marketing tools:
| • | Last Visit and No Return. Subscribers can pull the list of consumers who haven’t come back to the business for a given period of time designated by the business owner. |
| • | Best Sellers. Subscribers have the ability to view best-selling products and services, as well as profit margins. |
| • | Cancellations and No Shows. Subscribers can check which consumers cancel or do not arrive for a scheduled visit, charge cancellation fees, or suspend consumer scheduling privileges. |
| • | Referral Sources. Subscribers can gain valuable insights into their most effective marketing channels for attracting new consumers. |
| • | Sales Forecast. Gauge future sales revenue based on current prospects. |
| • | Attendance with Revenue. Break down revenue by each client visit, staff person, type of service, and date |
| • | Attendance Analysis. Determine busiest hours and the lulls in a day, too. |
| • | Gross Margin. See the gross margin for each product. |
| • | Promotions. Subscribers can tie every redeemed promotion code back to the client who used it, or analyze the overall success of any promotion effort. |
| • | Account Balances. Subscribers can see if consumers currently have a positive or negative balance, and create a statement for consumers with negative balances. |
| • | Retention. Subscribers can check client retention rate overall, or by individual staff member. |
| • | Memberships and New Members. Subscribers can find out how many consumers are members, which members are active, and how much revenue memberships generate, and how many new memberships have been sold. |
| • | Commission. See how much staff is owed for the sales they make. |
| • | Transactions. Sort all past transactions by what’s settled, pending, voided, and returned. |
110
Table of Contents
Apps & Add-ons
| • | MINDBODY Express. MINDBODY Express is our native business-subscriber facing mobile app that enhances our core offering by allowing our subscribers to easily run their business, book consumers and sell products and services while on the go. |
| • | Engage by MINDBODY Connect. Our Engage by MINDBODY Connect offering allows our subscribers to have their own native apps to create a unique branded experience for their consumers. |
MINDBODY Connect for Consumers
Connect is our consumer-facing mobile app with over 1.6 million unique users that lets consumers discover local wellness services, view class descriptions, read instructor bios and reviews, as well as book appointments and make payments right from the app.
MINDBODY Connect Workplace for Employers
The Connect Workplace platform utilizes MINDBODY software to enable the tracking of on-site corporate wellness programs, such as fitness classes and massage services, as well as Connect and Engage by Connect to promote those classes to their employees. Connect Workplace also utilizes an integrated debit card through which employers fund a monthly wellness stipend for their employees. Finally, Connect Workplace provides a web-based dashboard that summarizes and analyzes the resulting employee wellness activities.
MINDBODY API Platform for Partners
The MINDBODY API platform includes an extensive set of web services APIs that extend key functionality to credentialed partners. This enables our partners to access real-time inventory as well as specific subscriber data for the purpose of creating value-added solutions for our subscribers and consumers.
Subscriber Services and Support
We are passionate about supporting our subscribers from the moment we first engage with them and throughout the lifetime of their subscriptions with us. We have multiple teams within our customer support organization dedicated to maintaining a high level of subscriber satisfaction: welcome team, data conversion and import, direct technical support, self-service and client care. Our operations are structured with the subscriber experience in mind, and we strive to create smooth process for our subscribers. We believe that providing a premium level of support to our subscribers is critical to enhancing our brand as a superior provider of business management software for the wellness services industry.
| • | Subscriber Onboarding. MINDBODY typically boards new subscribers with live training sessions delivered by via telephone and web conference. These trainings are supplemented by self-service setup checklists, online help materials, and webinars. |
| • | Ongoing Subscriber Support. Inclusive with our base subscription fees, MINDBODY offers 24/7 customer service and support to all subscribers with in-house personnel who are invested in MINDBODY Core Values and closely connect to our Product Development team. We do not outsource our customer service. |
| • | Professional Services. Our premium support services enable subscribers to access dedicated, advanced product and business operations support from software and business experts. This service is usually chosen by our higher-end small businesses and multi-location chains or franchises. |
| • | MINDBODY University, or MBU. MBU is a multi-day advanced subscriber education event held multiple times per year in various destination locations around the world (i.e., London, New York, San Diego and Sydney). This high-impact business conference teaches advanced software skills and best business practices that help subscribers increase revenues and improve their bottom line. |
111
Table of Contents
| Ÿ | Hardware & Merchandise. We offer point of sale hardware, such as cash drawers, receipt printers and bar code scanners, as well as branded key chain tags and gift cards our clients require. We also offer smart phone and tablet credit card swipers, which are rapidly supplanting these legacy point of sale devices. |
Our Technology
We have developed our proprietary technology platform over the last decade, with a focus on delivering industry-leading breadth and flexibility of functionality. Demands and expectations are ever increasing and through continuous innovation and iteration we strive to delight our users. Our platform is built API first with a service oriented multi-tenant architecture, making it fully extensible to our business and consumer web and mobile applications, as well as complimentary technology partner integrations. Maintaining the integrity and security of our technology platform is mission critical to our business and our subscribers’ success.
| Ÿ | Reliable. Our platform is engineered to provide high reliability and availability. Our uptime service-level agreement (SLA) is 99.90%. Our infrastructure is hosted in two dual redundant Tier 4 (the highest rating available) data centers separately located in North America. Our network operations center provides 24/7 monitoring of hundreds of sensors on all systems, including global synthetic and real user monitoring to ensure we have complete visibility into our platform and instantly respond to any potential service issue. |
| Ÿ | Secure. Our platform hosts a large quantity of subscriber data and processes a large volume of business to consumer transactions. We therefore maintain a comprehensive security program designed to help safeguard the confidentiality, integrity and availability of our subscribers’ data, which includes both organizational and technical control measures. Our platform includes a host of third-party encryption, malware prevention, firewall and intrusion detection, data loss detection and patch management technologies to protect and maintain all systems. We routinely audit and review our security program. In addition, we regularly obtain third-party security audits of our technical operations and procedures covering data security to include the Payment Card Industry Data Security Standard, or PCI-DSS, as well as Statement on Standards for Attestation Engagements No. 16, or SSAE 16, and Service Organizations Controls 2, or SOC 2 Type I Attestation. |
| Ÿ | Scalable. We have developed a robust and scalable platform that processes more than 30 million queries per day. By leveraging best-in-breed technology components, server virtualization, and a service oriented architecture, we believe we can seamlessly scale our compute and storage capacity. |
Our Subscribers
We have a diverse subscriber base with over 42,000 subscribers located in 124 countries and territories across a variety of industries within the wellness services industry. No single subscriber represented more than 2% of our total revenue in 2012, 2013 or 2014. The following table sets forth a list of representative subscribers, organized by industry:
| Wellness Services Categories |
Types of Businesses Served |
Representative Subscribers | ||||
| Health & Fitness | • Barre • CrossFit • Health Clubs • Indoor cycling • Martial arts |
• Personal training • Pilates • Strength conditioning • Yoga • Zumba |
• Aspen Club & Spa • Orangetheory Fitness • Physique 57 • Pure Barre • The Bar Method | |||
| Integrative Health | • Acupuncture • Ayurveda • Chiropractic • Homeopathy • Nutrition education |
• Omni Wellness NYC • Tournesol Wellness • United Medical Gym | ||||
112
Table of Contents
| Salon / Spa | • Blow-dry bars • Day spas • Hair, nail and skincare salons • Hair waxing • Laser hair removal • Massage therapy • Medical spas |
• Cutler Salon in New York and Florida • Jonathan & George Salon in Beverly Hills • Lavish Salon & Spa • Mèche | ||||
| Fine Arts / Instruction | • Dance studios • Music instruction • Photography • Tutoring |
• ABC Academy of Music and Dance • Avalon School of Music • Broadway Dance Center • San Francisco Ballet Association • Street Heat Dance Studio • Tippi Toes | ||||
| Children’s Activities | • Camps, classes and play time for children |
• Romp n’ Roll Kids Gym • Young Chef’s Academy • Zoom Room | ||||
| Corporate Wellness (Connect Workplace) subscribers | • Corporate wellness programs that subscribers offer to their employees using Connect Workplace. |
• ProCore • Raleigh Orthopaedic Clinic | ||||
By using our software and payments platform, our subscribers achieve significant cost and time savings, as well as operational efficiencies that allow them to focus more on delivering an exceptional experience to their customers. As a result, our subscribers benefit from an increase in consumer satisfaction, consumer retention, revenue and profitability.
Case Studies
We believe that the following case studies are representative examples of how our subscribers have benefitted from our platform:
Cutler Salons
Situation: In 2011, Cutler Salons had three locations in New York City and one in Miami. Each location operated as a separate entity, which made remote management of the salons as a group incredibly difficult and time consuming for Cutler’s general manager. To run a report on any given salon, book an appointment or view client files, the general manager had to log in to each location’s server, pull the desired information, email it to himself and print it out to review. Cutler needed to link all of their locations together under a centralized management system.
Solution and benefits: After serving as the flagship beta tester for a competing management system, Cutler’s general manager chose to implement our platform across all of their locations. Our platform’s multi-location
113
Table of Contents
functionality and capabilities are able to adapt with the salon as it grows, adding new locations that can all be managed remotely. Previously, to add a new location, the manager had to request that a new client list and management system be created for each salon. Now, adding a location is just a matter of a few clicks in the software, with client lists and management preferences automatically transferred to the new location. In addition, performance metrics for each location can be viewed from anywhere, online or via the Express app, all in real time.
Our platform has made the client experience at Cutler more convenient as well. Stylists are able to access client notes from a master database that isn’t tied to one location, making it possible for them to work at any Cutler salon. Each stylist’s clientele can schedule an appointment with them at whichever location best suits their schedule. Customized email marketing through our platform also helps Cutler cut back on no-shows with automated email reminders, contributing to over 88% of clients showing up for their appointments. Cutler encourages return visits with incentive emails, contributing to a 52% client retention rate in 2014, which we believe is significantly higher than the salon industry average. Cutler has added a fourth location in New York since adopting our platform and did away with the front desk entirely at another, in favor of a fully mobile check in and check out experience, enabled by our Express app.
Orangetheory Fitness
Situation: In 2009, Orangetheory Fitness was just one gym looking to expand fast into a global franchise with over 200 locations. The chain’s primary service is quite simple: a workout regimen that includes intervals of cardio and weight lifting designed around a participant’s monitored heart rate, making the program safe for athletes of all levels. Rapid growth for a chain this big requires software that can scale just as rapidly, accommodating cross-regional needs and providing robust membership management and reporting features.
Solution and benefits: Orangetheory Fitness has used our platform since the beginning. Today the chain has over 220 locations in 41 states and 5 countries, all operating on the MINDBODY platform. To manage growth at this scale, the chain utilizes our API to create a customized corporate dashboard with unique reports that track the health of the business’s entire network, from sales and franchise royalties to conversion rates and membership terminations. These reports inform key management decisions at the highest level, helping the chain sustain rapid expansion that continues to drive impressive revenue growth, up 204% in 2014 from 2013.
Orangetheory also uses our platform to manage its payroll and class and instructor schedules, supporting hundreds of employees worldwide. Once a member, an athlete can visit any Orangetheory location, booking classes online via the chain’s main website or the Connect app. In 2014, 55% of all Orangetheory class bookings came from MINDBODY’s consumer web and mobile booking capability. In addition, with a majority of members enrolled in automatic monthly memberships via MINDBODY’s payments platform, recurring revenue accounted for 87% of the chain’s total revenue in 2014.
Crowdflower
Situation: Crowdflower, a crowd-sourced data mining and enrichment platform, operates out of San Francisco and competes with other high-tech companies in the area for top talent. Prior to implementing Connect Workplace, Crowdflower’s benefits package included traditional insurance benefits but little else to demonstrate the company’s commitment to employee wellness and work-life balance.
Solution and benefits: With Connect Workplace, Crowdflower is able to demonstrate to its current and potential employees its commitment to the well-being of each employee. Each employee receives a monthly wellness subsidy of $50 to spend at any wellness business in the MINDBODY wellness marketplace, redeemable through his or her MINDBODY Card. Employees can use the Connect app to find local businesses that accept their card, and use the app to book and pay for eligible services. Crowdflower has also brought a massage therapist from the MINDBODY wellness marketplace onsite who accepts payments through the MINDBODY card.
114
Table of Contents
Crowdflower’s Human Resources staff can track subsidy usage and identify popular activities and businesses through the Connect Workplace dashboard, providing them with valuable insight into the return on investment of their wellness program. Rather than purchasing monthly memberships to the local gym, Connect Workplace allows Crowdflower to offer its employees choice when it comes to their preferred method for staying healthy—whether that’s acupuncture, massage, yoga, indoor cycling, CrossFit, barre, martial arts, Pilates or Tai Chi. Moreover, because the MINDBODY marketplace is worldwide, employees are able to use their wellness benefits at home or while traveling.
Black Label Yoga
Situation: Black Label Yoga, a studio located in Gladbeck, Germany, is owned and operated by husband and wife team, Michael and Nina Klumpp. When they opened their studio in April 2013, the owners knew they needed a business management solution that could do everything they needed to run their business: class scheduling, online booking, sales reporting, automated payment processing and client management. They also wanted a retail point-of-sale system that would allow them to sell their line of organic clothing both in-studio and online.
Solution and benefits: We make Black Label Yoga’s class schedule accessible online via the studio’s website and on mobile devices using the Connect app. These online and mobile sites make it possible for consumers to book a class at any time of day or night—and the studio’s clientele appreciate the convenience: 45% of total class bookings in 2014 came through online sites or mobile devices. The owners also use our platform’s client management tools (e.g., client notes and customized email marketing) to better communicate with their clients, which contributed to a 55% client retention rate in 2014, which we believe is significantly higher than the industry average.
The owners use a reporting dashboard within our platform to track sales trends, best performing pricing points and inventory, as well as attendance and class popularity. They can view many of these reports on the Express app—allowing them to check in on the health of their business while away from the studio. The ability to analyze sales has allowed the owners to make more informed business decisions about what price points to set, what classes to offer and when. In addition, by using our payments platform to implement automatic payments for monthly dues, Black Label Yoga benefits from a steady and reliable cash flow that contributed to a 140% increase in total revenue for 2014 compared to 2013, with 46% of that revenue coming from recurring payments.
Avalon School of Music
Situation: The Avalon School of Music in Orlando, Florida serves approximately 800 students with a staff of nearly 60 across three separate locations. The school offers students a variety of services, including music lessons for over twenty instruments, voice lessons, instrument rentals, DJ lessons, piano tuning and studio recording. When the school opened, the owners (a father and son team) used spreadsheets and a combination of other programs to track student dues and class usage, and to manage teacher pay and class schedules. This disjointed system made it difficult to track student payments and the number of classes each student had already taken. The school’s rapid growth from roughly 50 to 200 students in just two months also demonstrated that this system could not effectively scale with the business.
Solution and benefits: With our platform, Avalon students and staff can easily go online to view their schedules and track the number of lessons taken. New students are encouraged to enroll in automated payments, which provide stable revenue and eliminate the need to manually track the status of any given student’s payments. This recurring revenue accounted for 82% of Avalon’s total revenue in 2014.
In addition, with our payments platform, alerts are automatically sent to students when their credit cards are about to expire, and students are automatically rebilled if initial transactions are not successful. This automation streamlines a number of time-consuming management tasks, eliminates the need to track down payments and provides seamless convenience for students—contributing to Avalon’s 47% retention rate in 2014, which we believe is significantly higher than the music industry average.
115
Table of Contents
Savvi Skin & Body Studio
Situation: When Savvi Skin & Body Studio opened in San Luis Obispo, CA in 2007, the owner took appointments over the phone, recording them in an appointment book. Much of her time was spent on the phone scheduling and confirming or rescheduling appointments. This made it difficult to find the time to track sales, inventory and client information (all by hand) while also performing the services her clients were paying for: facials, massage, lash extensions, spray tans, body scrubs, etc.
Solution and benefits: Since 2008, our platform has helped to streamline these day-to-day activities for Savvi, eliminating almost entirely the time spent scheduling appointments over the phone that plagued the owner in her early days. With online booking, Savvi’s clients can view her schedule and book and pay for appointments straight from the studio’s website or Facebook page. This helps to keep her schedule full, contributing to the 28% increase in revenue Savvi enjoyed in 2014 compared to 2013.
Client management and communication is also easier with a system that links every client’s purchase history and service preference to his or her profile where owner and staff can also track special occasions like birthdays and anniversaries. Savvi uses our email marketing tools to delight clients by automatically sending emails with special promotions to encourage them to celebrate their milestones with a visit to Savvi.
The studio’s owner attributes the growth of her business to her use of MINDBODY’s business management software, which helps her maintain continuous contact with her clients. In 2014, Savvi utilized the client data stored on our platform to better target email campaigns to specific client groups, promoting memberships, holiday gift cards, products or services based on a client’s past history. This has allowed Savvi to better target its marketing efforts and continue to grow its revenue.
Savvi also started a membership program in 2014 to stabilize revenue, implementing an automatic payment model for the first time via MINDBODY’s payments platform, which now represents nearly 5% of Savvi’s total revenue. That same year, Savvi became a practitioner within the MINDBODY Connect Workplace network. Participation in area wellness programs through this program has made it possible for the studio to reach more people in the local community. In addition, the Connect app has brought more visibility to Savvi among out-of-town visitors and made Savvi’s services more convenient to existing clients.
Our Culture and Employees
Our company and employees share an exceptional corporate culture that incorporates our core values of being purpose driven, humble and helpful, caring and happy, committed to wellness, environmentally conscious, continuously evolving and committed to “Five C” leadership. We believe that each team member may practice leadership, daily, regardless of position or title, and we promote people who best demonstrate:
| • | Competence – they make the effort to be true experts in what they do. |
| • | Character – they do the right thing, even when it is not convenient. |
| • | Compassion – they care as much about others as they do about themselves. |
| • | Catalyst – they remove obstacles and make things happen. |
| • | Courage – they stand up for what they believe in and take responsibility for their team. |
Our employees thrive in a nurturing environment that is driven by innovation, passion for health and wellness and dedication towards excellent subscriber experience. According to a report from Mashable based on data from Glassdoor in December 2014, MINDBODY has been named one of the “Top 10 Best Tech Companies To Work For in 2015.” In addition, Outside Magazine has named MINDBODY one of America’s best places to work for two years in a row. We believe our culture gives us a competitive advantage in recruiting and retaining talent, driving innovation, enhancing productivity and improving customer experience.
116
Table of Contents
As of December 31, 2014 and March 31, 2015, we had 1,035 and 1,100 employees, respectively. None of our employees is represented by a labor organization or is a party to any collective bargaining arrangement. We have never had a work stoppage, and we consider our relationship with our employees to be good.
Competition
The market for business management software and payments solutions for wellness businesses is highly competitive, fragmented and rapidly evolving due to technological innovations. We believe our competitors fall into the following primary categories:
| • | On-premise software providers and small cloud-based providers that typically focus on a specific vertical like salon or spa and not the full breadth of wellness services; and |
| • | Cloud-based software providers that offer generic scheduling and point-of sale capabilities like Intuit and payments providers with basic scheduling tools like Square. |
The principal competitive factors in our market include:
| • | Industry expertise |
| • | Depth of product functionality |
| • | Brand recognition and reputation |
| • | Ability to drive consumer demand via a large and rapidly growing consumer network |
| • | 24/7 customer service |
| • | Product extensibility via APIs |
| • | Integration with mobile devices |
| • | Integration with payments processing |
| • | Marketing capabilities and analytics |
| • | Strong company culture |
| • | Security and reliability |
| • | Global presence |
We believe that we compete favorably on the factors described above. However, many of our competitors have greater financial, technical and other resources, greater name recognition and larger sales and marketing budgets, therefore we may not always compare favorably with respect to some or all of the factors above.
Sales and Marketing
We deploy a direct sales approach driven by an inside sales team based in San Luis Obispo, California, East Hampton, New York, London, United Kingdom, and Sydney, Australia. Our sales team qualifies and manages prospective and current subscribers, aiming to initiate, retain, and expand their use of our platform over time. Our sales team partners with sales engineers to provide consultation and product demonstration to prospects to accelerate the onboarding of new subscribers.
Since the introduction of Connect Workplace, we have begun to develop and expand a field sales team responsible for discovery, qualification, and account management for larger organizations.
Our marketing efforts are focused on generating awareness of our platform, creating sales leads, establishing and promoting our brand, and cultivating a community of successful and vocal subscribers and consumers. We utilize both online and offline marketing initiatives, including search engine and email marketing, online display and print advertising, participation in trade shows, events and conferences, permission marketing, social media and media outreach, and strategic partnerships and endorsements.
117
Table of Contents
Our sales prospecting, lead qualification and lead development functions are performed by sales associates, the majority of whom work part-time schedules. Our full-time equivalent sales and marketing headcount as of December 31, 2014 and March 31, 2015 was 319 and 340, respectively. Our sales and marketing expenses were $21.0 million, $30.9 million, $7.2 million and $9.7 million for the years ended December 31, 2013 and 2014, and for the three months ended March 31, 2014 and 2015, respectively.
Research and Development
Our research and development organization is responsible for the ideation, research, design, development and testing of all aspects of our platform. To create a roadmap that meets the needs of our subscribers, we emphasize collaboration during the development process. Subscribers provide direct input through dialog with our customer support, product management, and user experience teams, as well as our community forum and feature utilization data. We deploy new features, functionality, and technologies for our platform through monthly software releases or updates to minimize disruption and deliver continuous improvement.
As of December 31, 2014 and March 31, 2015, we had 168 and 182 employees, respectively, in our research and development organization, which is based in San Luis Obispo, California. Our research and development expenses were $3.7 million, $10.5 million, $16.2 million, $3.6 million and $4.7 million for the years ended December 31, 2012, 2013 and 2014, and for the three months ended March 31, 2014 and 2015, respectively.
Intellectual Property
We rely on a combination of trade secret, copyright, and trademark laws, a variety of contractual arrangements, such as license agreements, assignment agreements, confidentiality and non-disclosure agreements, and confidentiality procedures and technical measures to gain rights to and protect the intellectual property used in our business.
We have also developed a patent program and a strategy to identify, apply for, and secure patents for innovative aspects of our platform and technology. We have 11 U.S. patent applications pending. We also have five pending patent applications in jurisdictions outside of the United States. We intend to pursue additional patent protection to the extent we believe it would be beneficial and cost-effective.
We actively pursue registration of our trademarks, logos, service marks, and domain names in the United States and in other key jurisdictions. We are the registered holder of a variety of U.S. and international domain names that include the term MINDBODY and similar variations. We use several trademarks for our products and services, including “MINDBODY,” “Connect,” “Connect Workplace” and several logos and images, such as the Enso logo, as well as the slogan “Love Your Business.”
We also rely on certain intellectual property rights that we license from third parties, including under certain open source licenses. Though such third-party technologies may not continue to be available to us on commercially reasonable terms, we believe that alternative technologies would be available to us if needed.
Our policy is to require employees and independent contractors to sign agreements assigning to us any inventions, trade secrets, works of authorship, developments and other processes generated by them on our behalf and agreeing to protect our confidential information. All of our key employees and contractors have done so. In addition, we generally enter into confidentiality agreements with our vendors and subscribers. We also control and monitor access to, and distribution of our software, documentation, and other proprietary information.
Despite our precautions, it may be possible for unauthorized third parties to copy our products and use information that we regard as proprietary to create products and services that compete with ours.
118
Table of Contents
Some license provisions protecting against unauthorized use, copying, transfer and disclosures of our products may be unenforceable under the laws of certain jurisdictions and foreign countries. In addition, the laws of some countries do not protect proprietary rights to as great of an extent as the laws of the United States, and many foreign countries do not enforce these laws as diligently as government agencies and private parties in the United States. To the extent that we expand our international activities, our exposure to unauthorized copying and use of our products and misappropriation of our proprietary information may increase.
We expect that software and other solutions in our industry may be increasingly subject to third-party infringement claims as the number of competitors grows and the functionality of products in different industry segments overlap.
Government Regulation
Our business is subject to extensive, complex and rapidly changing federal and state laws and regulations.
HIPAA, Privacy and Data Security Regulations
In connection with providing online scheduling services for certain subscribers, we may be subject to specific compliance obligations under privacy and data security laws, including but not limited to the Health Insurance Portability and Accountability Act of 1996, or HIPAA, and similar state laws that govern the collection, use, protection, and disclosure of personally identifiable information. HIPAA imposes specific requirements regarding data privacy and security on covered entities (providers, health plans, and health care clearinghouses); business associates (entities that may perform services for covered entities, pursuant to which they may access personal information); and business associates’ subcontractors, including us. We are therefore required to adopt certain practices and enter into certain contracts agreeing to protect personal information in specific ways. There may be civil and criminal penalties, as well as contractual ramifications, for violating HIPAA.
Facilities
Our corporate headquarters are located in San Luis Obispo, California, where we operate under various leases for an aggregate of approximately 170,000 square feet of space. These leases expire between January 2017 and June 2030.
We also lease office space in New York, the United Kingdom and Australia. We lease all of our facilities and do not own any real property. We intend to procure additional space as we add employees and expand geographically. We believe our facilities are adequate and suitable for our current needs and that, should it be needed, suitable additional or alternative space will be available to accommodate any such expansion of our operations.
Legal Proceedings
From time to time, we may be subject to legal proceedings and claims in the ordinary course of business. We may in the future receive claims from third parties asserting, among other things, infringement of their intellectual property rights. Future litigation may be necessary to defend ourselves, our partners and our subscribers by determining the scope, enforceability and validity of third-party proprietary rights, or to establish our proprietary rights. The results of any current or future litigation cannot be predicted with certainty, and regardless of the outcome, litigation can have an adverse impact on us because of defense and settlement costs, diversion of management resources, and other factors.
119
Table of Contents
Executive Officers and Directors
The following table provides information regarding our executive officers and directors as of March 31, 2015:
| Name |
Age |
Position | ||
| Executive Officers: | ||||
| Richard L. Stollmeyer |
49 | President, Chief Executive Officer and Chairman of the Board of Directors | ||
| Robert Murphy |
58 | Chief Operating Officer and Director | ||
| Brett White |
52 | Chief Financial Officer | ||
| Chet Brandenburg |
37 | Chief Product Officer | ||
| William Donohue |
58 | Chief Information Officer | ||
| Bradford L. Wills |
38 | Chief Strategy Officer | ||
| Kimberly Lytikainen |
48 | Senior Vice President, General Counsel and Secretary | ||
| Non-Employee Directors: |
||||
| Katherine Blair Christie(1)(3) |
43 | Director | ||
| Jeremy Levine(1) |
41 | Director | ||
| Eric Liaw(1)(2) |
37 | Director | ||
| Tyler Newton(2)(3) |
42 | Director | ||
| Graham Smith(2)(3) |
55 | Director | ||
| (1) | Member of our nominating and corporate governance committee. |
| (2) | Member of our audit committee. |
| (3) | Member of our compensation committee. |
Executive Officers
Richard L. Stollmeyer. Mr. Stollmeyer is one of our founders and has served as our President and Chief Executive Officer and as Chairman of our board of directors since October 2004. Mr. Stollmeyer holds a B.S. degree in Political Science and Russian Language, with a concentration in International Relations, from the United States Naval Academy.
Mr. Stollmeyer was selected to serve on our board of directors because of the perspective and experience he brings as our President and Chief Executive Officer. As one of our founders, Mr. Stollmeyer also brings historical knowledge, operational expertise and continuity to our board of directors.
Robert Murphy. Mr. Murphy is one of our founders and has served as our Chief Operating Officer since November 2011, and as a member of our board of directors since October 2004. Mr. Murphy also served as our Chief Financial Officer from October 2004 to August 2010. Prior to joining our company, Mr. Murphy owned and operated several yoga studios in the New York City area. Mr. Murphy holds a B.S. degree in Communications from Boston University.
Mr. Murphy was selected to serve on our board of directors because of the perspective and experience he brings as our Chief Operating Officer and his background in the health and wellness services industry. As one of our co-founders, Mr. Murphy also brings historical knowledge, operational expertise and continuity to our board of directors.
Brett White. Mr. White has served as our Chief Financial Officer since July 2013. From January 2008 to July 2013, Mr. White served as Chief Financial Officer at Meru Networks, Inc., a provider of Wi-Fi solutions.
120
Table of Contents
From November 2005 to December 2007, Mr. White served as Chief Financial Officer at Fortinet, Inc., a provider of network security solutions. Mr. White holds a B.A. degree in Business Economics from the University of California, Santa Barbara.
Chet Brandenburg. Mr. Brandenburg has served as our Chief Product Officer since July 2011. Mr. Brandenburg also served as our Chief Technology Officer from May 2006 to July 2011 and as our Vice President, Development from October 2004 to May 2006. Mr. Brandenburg holds a B.S. degree in Computer Science from California Polytechnic State University, San Luis Obispo.
William Donohue. Mr. Donohue has served as our Chief Information Officer since September 2011. From March 2010 to September 2011, Mr. Donohue provided technology consulting services for several companies, including ours. From February 2005 to March 2010, Mr. Donohue served as Senior Vice President and Chief Information Officer at 24 Hour Fitness, Inc., a privately owned commercial health club company. Mr. Donohue holds a B.S. degree in Biology from the University of La Verne.
Bradford L. Wills. Mr. Wills has served as our Chief Strategy Officer since November 2014. From May 2013 to November 2014, Mr. Wills served as our Senior Vice President of Corporate Development. From July 2006 to May 2013, Mr. Wills served as Vice President, Corporate Development, Mergers and Acquisitions at Active Network, a software-as-a-service company. Mr. Wills holds a B.S. degree in Finance and International Business from Georgetown University and an M.B.A. degree from the University of Texas at Austin.
Kimberly Lytikainen. Ms. Lytikainen has served as our Senior Vice President, General Counsel since July 2014 and as our Secretary since March 2015. From June 2013 to July 2014, Ms. Lytikainen served as Associate General Counsel at Pivotal Software, Inc., a provider of computer software. From April 2006 to June 2013, Ms. Lytikainen served as Vice President, Assistant General Counsel at NVIDIA Corporation, a visual computing company. Ms. Lytikainen holds a B.A. degree in Political Science and Government from Florida State University and a J.D. degree from Loyola Law School, Loyola Marymount University.
Non-Employee Directors
Katherine Blair Christie. Ms. Christie has served as a member of our board of directors since March 2015. Since January 2011, Ms. Christie has served as the Chief Marketing Officer at Cisco Systems, Inc., a networking equipment company. From January 2008 to January 2011, Ms. Christie served as Senior Vice President, Global Corporate Communications at Cisco Systems. Ms. Christie holds a B.S. degree in Marketing and Business Administration and an M.B.A. degree from Drexel University.
Ms. Christie was selected to serve on our board of directors because of her operating and management experience in the technology industry.
Jeremy Levine. Mr. Levine has served as a member of our board of directors since August 2010. Since January 2007, Mr. Levine has served as a Partner at Bessemer Venture Partners, a venture capital firm he joined in May 2001. Mr. Levine currently serves on the board of directors of Yelp Inc., a local directory and user review service, and a number of privately held companies. Mr. Levine holds a B.S. degree in Computer Science from Duke University.
Mr. Levine was selected to serve on our board of directors because of his experience in the venture capital industry and as a director of both publicly and privately held technology companies.
Eric Liaw. Mr. Liaw has served as a member of our board of directors since February 2014. Since March 2011, Mr. Liaw has served in several roles at Institutional Venture Partners, a venture capital firm, where he currently serves as a General Partner. From August 2003 to January 2011, Mr. Liaw served in several roles at Technology Crossover Ventures, a venture capital firm, including most recently as a Vice President. Mr. Liaw
121
Table of Contents
serves on the boards of directors of a number of privately held companies. Mr. Liaw holds a B.A. degree in Economics with a minor in Computer Science and an M.S. degree in Management Science and Engineering from Stanford University.
Mr. Liaw was selected to serve on our board of directors because of his experience in the venture capital industry and as a director of high growth technology companies.
Tyler Newton. Mr. Newton has served as a member of our board of directors since March 2009. Since December 2006, Mr. Newton has served as a Partner at Catalyst Investors, a growth equity investment firm he joined in April 2000. Mr. Newton has also served on the boards of directors of a number of privately held companies. Mr. Newton holds a B.A. degree in Economics from Middlebury College and is a CFA Charter holder.
Mr. Newton was selected to serve on our board of directors because of his growth investing experience as a director of numerous technology companies.
Graham Smith. Mr. Smith has served as a member of our board of directors since January 2015. From March 2008 to August 2014, Mr. Smith served as the Chief Financial Officer of salesforce.com, inc., a global cloud computing company, where he currently serves as Executive Vice President of Finance. Mr. Smith currently serves on the board of directors of Splunk Inc., a provider of data analytics software. Mr. Smith holds a B.Sc. degree in Economics and Politics from Bristol University in England and qualified as a member of the Institute of Chartered Accountants in England and Wales.
Mr. Smith was selected to serve on our board of directors because of his financial expertise and extensive experience in the software industry.
Code of Business Conduct and Ethics
Our board of directors has adopted a code of business conduct and ethics that applies to all of our employees, officers and directors, including our President and Chief Executive Officer, Chief Financial Officer and other executive and senior financial officers. The full text of our code of business conduct and ethics will be posted on the investor relations page on our website. We intend to disclose any amendments to our code of business conduct and ethics, or waivers of its requirements, on our website or in filings under the Exchange Act.
Board of Directors
Our business and affairs are managed under the direction of our board of directors. Our board of directors consists of seven directors, five of whom qualify as “independent” under the listing standards of the NASDAQ Stock Market. Pursuant to our current amended and restated voting agreement, our current directors were elected as follows:
| • | Richard L. Stollmeyer, Robert Murphy and Graham Smith were elected as the designees nominated by holders of our common stock; |
| • | Tyler Newton was elected as the designee nominated by holders of our Series C redeemable convertible preferred stock; |
| • | Jeremy Levine was elected as the designee nominated by holders of our Series D redeemable convertible preferred stock; |
| • | Eric Liaw was elected as the designee nominated by holders of our Series F redeemable convertible preferred stock; and |
| • | Katherine Blair Christie was elected by holders of our capital stock. |
122
Table of Contents
Our amended and restated voting agreement will terminate in connection with this offering. After the completion of this offering, the number of directors will be fixed by our board of directors, subject to the terms of our amended and restated certificate of incorporation and amended and restated bylaws that will become effective immediately prior to the completion of this offering. Each of our current directors will continue to serve as a director until the election and qualification of his or her successor, or until his or her earlier death, resignation or removal.
Classified Board of Directors
Our amended and restated certificate of incorporation that will become effective immediately prior to the completion of this offering will provide that, immediately after the completion of this offering, our board of directors will be divided into three classes with staggered three-year terms. Only one class of directors will be elected at each annual meeting of stockholders, with the other classes continuing for the remainder of their respective three-year terms. Upon the completion of this offering, our current directors will be divided among the three classes as follows:
| • | The Class I directors will be Jeremy Levine and Tyler Newton, and their terms will expire at the annual meeting of stockholders to be held in 2016; |
| • | The Class II directors will be Eric Liaw and Robert Murphy, and their terms will expire at the annual meeting of stockholders to be held in 2017; and |
| • | The Class III directors will be Katherine Blair Christie, Graham Smith and Richard L. Stollmeyer, and their terms will expire at the annual meeting of stockholders to be held in 2018. |
Each director’s term will continue until the election and qualification of his or her successor, or his or her earlier death, resignation or removal. Any increase or decrease in the number of directors will be distributed among the three classes so that, as nearly as possible, each class will consist of one-third of our directors.
This classification of our board of directors may have the effect of delaying or preventing changes in control of our company.
Director Independence
Our board of directors has undertaken a review of the independence of each director. Based on information provided by each director concerning his or her background, employment and affiliations, our board of directors has determined that Katherine Blair Christie, Jeremy Levine, Eric Liaw, Tyler Newton and Graham Smith do not have relationships that would interfere with the exercise of independent judgment in carrying out the responsibilities of a director and that each of these directors is “independent” as that term is defined under the listing standards of the NASDAQ Stock Market. In making these determinations, our board of directors considered the current and prior relationships that each non-employee director has with our company and all other facts and circumstances our board of directors deemed relevant in determining their independence, including the beneficial ownership of our capital stock by each non-employee director, and the transactions involving them described in the section titled “Certain Relationships and Related Party Transactions.”
Lead Independent Director
Our board of directors has adopted corporate governance guidelines that provide that one of our independent directors will serve as our Lead Independent Director at any time when our Chief Executive Officer serves as the Chairman of our board of directors or if the Chairman is not otherwise independent. Because Richard L. Stollmeyer is our Chairman and Chief Executive Officer, our board of directors has appointed Graham Smith to serve as our Lead Independent Director. As Lead Independent Director, Mr. Smith will preside over periodic meetings of our independent directors, serve as a liaison between our Chairman and our independent directors and perform such additional duties as our board of directors may otherwise determine and delegate.
123
Table of Contents
Committees of Our Board of Directors
Our board of directors has established an audit committee, a compensation committee and a nominating and corporate governance committee. The composition and responsibilities of each of the committees of our board of directors are described below. Members serve on these committees until their resignation or removal or until otherwise determined by our board of directors.
Audit Committee
Our audit committee is comprised of Eric Liaw, Tyler Newton and Graham Smith, each of whom satisfies the requirements for independence and financial literacy under the applicable rules and regulations of the SEC and listing standards of the NASDAQ Stock Market. Mr. Smith serves as the chair of our audit committee, qualifies as an “audit committee financial expert” as defined in the rules of the SEC, and satisfies the financial sophistication requirements under the listing standards of the NASDAQ Stock Market. Following the completion of this offering, our audit committee will, among other things, be responsible for:
| • | selecting a qualified firm to serve as the independent registered public accounting firm to audit our financial statements; |
| • | helping to ensure the independence and performance of the independent registered public accounting firm; |
| • | discussing the scope and results of the audit with the independent registered public accounting firm, and reviewing, with management and the independent registered public accounting firm, our interim and year-end operating results; |
| • | developing procedures for employees to submit concerns anonymously about questionable accounting or audit matters; |
| • | reviewing our policies on risk assessment and risk management; |
| • | reviewing related party transactions; and |
| • | approving or, as required, pre-approving, all audit and all permissible non-audit services, other than de minimis non-audit services, to be performed by the independent registered public accounting firm. |
Upon the completion of this offering, our audit committee will operate under a written charter that satisfies the applicable rules and regulations of the SEC and the listing standards of the NASDAQ Stock Market.
Compensation Committee
Our compensation committee is comprised of Katherine Blair Christie, Tyler Newton and Graham Smith, each of whom satisfies the requirements for independence under the applicable rules and regulations of the SEC and listing standards of the NASDAQ Stock Market. Mr. Newton serves as the chair of our compensation committee. Each member of our compensation committee is also a non-employee director, as defined pursuant to Rule 16b-3 promulgated under the Exchange Act, and an outside director, as defined pursuant to Section 162(m) of the Internal Revenue Code. Upon the completion of this offering, our compensation committee will, among other things, be responsible for:
| • | reviewing, approving and determining, or making recommendations to our board of directors regarding, the compensation of our executive officers; |
| • | administering our equity compensation plans; |
| • | reviewing, approving and making recommendations to our board of directors regarding incentive compensation and equity compensation plans; and |
| • | establishing and reviewing general policies relating to compensation and benefits of our employees. |
124
Table of Contents
Upon the completion of this offering, our compensation committee will operate under a written charter that satisfies the applicable rules and regulations of the SEC and the listing standards of the NASDAQ Stock Market.
Nominating and Corporate Governance Committee
Our nominating and corporate governance committee consists of Katherine Blair Christie, Jeremy Levine and Eric Liaw, each of whom satisfies the requirements for independence and financial literacy under the applicable rules and regulations of the SEC and listing standards of the NASDAQ Stock Market. Mr. Levine serves as the chair of our nominating and corporate governance committee. Following the completion of this offering, our nominating and corporate governance committee will, among other things, be responsible for:
| • | identifying, evaluating and selecting, or making recommendations to our board of directors regarding, nominees for election to our board of directors and its committees; |
| • | evaluating the performance of our board of directors and of individual directors; |
| • | considering and making recommendations to our board of directors regarding the composition of our board of directors and its committees; |
| • | reviewing developments in corporate governance practices; |
| • | evaluating the adequacy of our corporate governance practices and reporting; and |
| • | developing and making recommendations to our board of directors regarding corporate governance guidelines and matters. |
Upon the completion of this offering, our nominating and corporate governance committee will operate under a written charter that satisfies the applicable listing standards of the NASDAQ Stock Market.
Compensation Committee Interlocks and Insider Participation
During 2014, our compensation committee was comprised of Jeremy Levine, Robert Murphy and Tyler Newton. None of the current members of our compensation committee is or has been an officer or employee of our company. However, during 2014, Robert Murphy was an officer of our company. None of our executive officers currently serves, or in the past year has served, as a member of the board of directors or compensation committee (or other board committee performing equivalent functions) of any entity that has one or more of its executive officers serving on our board of directors or compensation committee.
During October 2012, we sold 537,199 shares and 386,783 shares of our Series F redeemable convertible preferred stock to entities affiliated with Bessemer Venture Partners and Catalyst Investors, respectively, for an aggregate purchase price of approximately $5,000,000 and $3,600,009, respectively. Jeremy Levine is a Partner at Bessemer Venture Partners and Tyler Newton is a Partner at Catalyst Investors. The sale of our Series F redeemable convertible preferred stock to Bessemer Venture Partners and Catalyst Investors was made in connection with our Series F redeemable convertible preferred stock financing and on substantially the same terms and conditions as all other sales of our Series F redeemable convertible preferred stock by us.
During February 2014, we sold 777,984 shares and 147,580 shares of our Series G redeemable convertible preferred stock to entities affiliated with Bessemer Venture Partners and Catalyst Investors, respectively, for an aggregate purchase price of approximately $10,543,253 and $2,000,004, respectively. Jeremy Levine is a Partner at Bessemer Venture Partners and Tyler Newton is a Partner at Catalyst Investors. The sale of our Series G redeemable convertible preferred stock to Bessemer Venture Partners and Catalyst Investors was made in connection with our Series G redeemable convertible preferred stock financing and on substantially the same terms and conditions as all other sales of our Series G redeemable convertible preferred stock by us.
125
Table of Contents
During February 2014, we entered into a letter agreement, which was amended in March 2014, with certain holders of our capital stock, pursuant to which we agreed to waive certain transfer restrictions in connection with, and assist in the administration of, a tender offer that such holders proposed to commence. In February 2014, these holders commenced a tender offer to purchase shares of our capital stock from certain of our security holders, including Robert Murphy. In addition, Mr. Murphy and entities affiliated with Messrs. Levine and Newton are party to our investors’ rights agreement, right of first refusal and co-sale agreement and voting agreement. See the section titled “Certain Relationships and Related Party Transactions” for additional information about these transactions.
Non-Employee Director Compensation
Our non-employee directors do not currently receive, and did not receive in 2014, any cash compensation for their service on our board of directors and committees of our board of directors. As of December 31, 2014, none of our non-employee directors held shares of our Class B common stock or options to purchase shares of our Class B common stock.
Directors who are also our employees receive no additional compensation for their service as directors. During 2014, Messrs. Stollmeyer and Murphy were our employees. See the section titled “Executive Compensation” for additional information about their compensation.
Outside Director Compensation Policy
On May 22, 2015, our board of directors adopted our Outside Director Compensation Policy. Members of our board of directors who are not employees are eligible for awards under our Outside Director Compensation Policy. Our Outside Director Compensation Policy is effective as of the effective date of the registration statement of which this prospectus forms a part.
Under our Outside Director Compensation Policy, outside directors will receive compensation in the form of equity and cash, as described below:
Cash Compensation
Effective as of our first annual meeting of our stockholders following the effectiveness of our Outside Director Compensation Policy, non-employee directors will receive annual cash retainers for service in the following positions:
| Position |
Annual Cash Retainer |
|||
| Board member |
$ | 32,000 | ||
| Lead independent director |
10,000 | |||
| Chairperson of the board |
20,000 | |||
| Audit committee chair |
20,000 | |||
| Audit committee member other than chair |
7,500 | |||
| Compensation committee chair |
10,500 | |||
| Compensation committee member other than chair |
5,000 | |||
| Nominating and corporate governance committee chair |
6,500 | |||
| Nominating and corporate governance committee member other than chair |
3,000 | |||
Cash retainers will be paid quarterly in arrears on pro-rated basis. A non-employee director may elect that payment of the cash retainers under our Outside Director Compensation Policy be paid in the form of fully-vested restricted stock under our 2015 Plan.
126
Table of Contents
Equity Compensation
Non-employee directors are eligible to receive all types of equity awards (except incentive stock options) under our 2015 Plan, including discretionary awards not covered under our Outside Director Compensation Policy. All grants of awards under our Outside Director Compensation Policy will be automatic and non-discretionary.
Upon joining our board, and beginning with our first annual meeting of our stockholders following the effectiveness of our Outside Director Compensation Policy, each newly-elected non-employee director will receive an initial equity award, or the initial award, under our 2015 Plan with a value of $350,000. This award will vest in approximately equal installments annually over a four-year period, subject to continued service through each vesting date. The initial award will be in the form of restricted stock units, unless otherwise determined by our board of directors or our compensation committee.
On the date of each annual meeting of our stockholders following the effective date of our Outside Director Compensation Policy, each non-employee director who is continuing as a director following the applicable meeting will be granted an annual equity award, or the annual award, or a pro-rated annual award under our 2015 Plan with a value of $180,000. If the non-employee director had not been a non-employee director as of the previous annual meeting of our stockholders, then the annual award will be pro-rated based on the number of months served as a non-employee director for the previous year. Each annual award will fully vest on the earlier to occur of: (i) the day prior to the next annual meeting following the date of grant or (ii) the first anniversary of the grant date, in each case, subject to continued service through the vesting date. The annual award will be in the form of restricted stock units, unless otherwise determined by our board of directors or our compensation committee.
For purposes of our Outside Director Compensation Policy, value means generally (x) with respect to any award of restricted stock units, the fair market value of the shares on the grant date of the award, or (y) with respect to a stock option, the grant date fair value calculated in accordance with ASC Topic 718.
Notwithstanding the vesting schedules described above, the vesting of all equity awards granted to a non-employee director, including any award granted outside of our Outside Director Compensation Policy, will vest in full upon a “change in control” (as defined in our 2015 Plan) if the non-employee director’s service as a director terminates on or following the change in control other than pursuant to a voluntary resignation.
As described in “Executive Compensation—Employee Benefit and Stock Plans” below, our 2015 Plan contains maximum limits, which will be approved by our stockholders prior to the 2015 Plan becoming effective, on the size of the equity awards that can be granted to each of our non-employee directors in any fiscal year, but those maximum limits do not reflect the intended size of any potential grants or a commitment to make any equity award grants to our non-employee directors in the future.
127
Table of Contents
Summary Compensation Table
The following table provides information regarding the total compensation for services rendered in all capacities that was earned by each individual who served as our principal executive officer at any time in 2014, and our two other most highly compensated executive officers who were serving as executive officers as of December 31, 2014. These individuals are our named executive officers for 2014.
| Name and Principal Position |
Year | Salary ($) | Bonus ($) | Option Awards ($)(1) |
Non-Equity Incentive Plan Compensation ($)(2) |
All Other Compensation ($) |
Total ($) | |||||||||||||||||||||
| Richard L. Stollmeyer |
2014 | 360,000 | — | 699,668 | 89,734 | 16,750 | (3) | 1,166,152 | ||||||||||||||||||||
| Robert Murphy |
2014 | 330,000 | — | 699,668 | 89,734 | 10,541 | (4) | 1,129,943 | ||||||||||||||||||||
| Kimberly Lytikainen |
2014 | 121,314 | 31,460 | (5) | 803,071 | 16,257 | 2,654 | (6) | 974,756 | |||||||||||||||||||
| (1) | The amounts reported represent the aggregate grant-date fair value of the stock options awarded to the named executive officer in 2014, calculated in accordance with ASC Topic 718. Such grant-date fair value does not take into account any estimated forfeitures related to service-vesting conditions. |
| (2) | The amounts reported represent the amounts earned in 2014 under our Executive Bonus Plan. |
| (3) | Consists of Health Savings Account contributions and 401(k) matching contributions. |
| (4) | Consists of 401(k) matching contributions. |
| (5) | Consists of a sign-on bonus of $22,717 awarded in connection with Ms. Lytikainen’s hiring in 2014 and a discretionary bonus of $8,743 awarded for her performance in 2014. The discretionary bonus was not paid in accordance with any formal plan document. |
| (6) | Consists of 401(k) matching contributions. |
Non-Equity Incentive Plan Compensation
Our compensation committee has adopted our Executive Bonus Plan. See the disclosure under “Executive Bonus Plan” for a description of this plan.
2014 Performance Targets under our Executive Bonus Plan
For 2014, our compensation committee approved the performance targets under our Executive Bonus Plan for Richard L. Stollmeyer, Robert Murphy and Kimberly Lytikainen. Incentives under our Executive Bonus Plan were payable based on our achievement of targets related to certain performance metrics, including revenue growth, sales efficiency, certain subscriber-related measures and earnings before interest, taxes, depreciation and amortization. Subject to achieving the applicable performance targets, each participant was eligible to receive a target incentive payment. For 2014, the target incentive was $130,000 for each of Messrs. Stollmeyer and Murphy and $25,000 for Ms. Lytikainen. For Messrs. Stollmeyer and Murphy, half of the target incentive was to be paid in equal installments on a quarterly basis during the year, subject to the achievement of the applicable quarterly performance targets. The other half of the target incentive was to be payable at the end of the year, subject to the achievement of the applicable annual performance targets. For Ms. Lytikainen, the target incentive was to be paid in equal installments over the last two quarters of the year. Performance in excess of the performance targets was to result in payments in excess of the target incentive, subject to a cap of 200% of the target incentive. During 2014, we achieved the performance targets at a level that triggered the payments set forth in the Summary Compensation Table under the column “Non-Equity Incentive Plan Compensation.”
128
Table of Contents
Named Executive Officer Employment Arrangements
Richard L. Stollmeyer
We entered into an employment agreement with Richard L. Stollmeyer, our President and Chief Executive Officer, effective as of May 22, 2015. The employment agreement has a term of three years, with automatic renewals for additional three-year terms, unless either party provides notice not to renew the agreement within 90 days of the end of such three-year term. Mr. Stollmeyer’s employment is at-will. Mr. Stollmeyer’s current annual base salary is $370,000, and he is currently eligible to earn annual incentive compensation with a target equal to 50% of his base salary, based upon achievement of milestones determined by our board of directors or compensation committee for each fiscal year. Pursuant to his employment agreement, effective July 1, 2015, Mr. Stollmeyer’s annual base salary will be $410,000, and he will be eligible to earn annual incentive compensation with a target no less than 90% of his base salary, or target bonus. Mr. Stollmeyer will be eligible to earn up to 200% of the target bonus for 2015.
Mr. Stollmeyer’s employment agreement provides that if his employment is terminated by us or our successor without “cause” (as defined below), by Mr. Stollmeyer for “good reason” (as defined below) or on account of death or disability (each, a “qualifying termination”), upon his executing a general release and waiver of claims against us (or our successor) in the form provided by us or our successor that becomes effective and irrevocable within the time period prescribed in his employment agreement, Mr. Stollmeyer will receive (1) continuing payments of severance equal to 18 months of Mr. Stollmeyer’s annual base salary as then in effect; (2) a lump-sum amount equal to Mr. Stollmeyer’s target annual incentive compensation, pro-rated for the days served during the year of employment; (3) reimbursement of COBRA continuation premiums for up to 18 months for Mr. Stollmeyer and his eligible dependents (provided he is eligible for and timely elects COBRA continuation coverage), or cash payments in lieu thereof; and (4) acceleration of 100% of the then-unvested shares subject to Mr. Stollmeyer’s equity awards granted prior to May 22, 2015. If the qualifying termination occurs during the period that commences upon a change in control (as defined in the 2015 Plan) and ends on the first anniversary following a change in control, then in addition to the benefits described above, 100% of Mr. Stollmeyer’s equity awards granted on or after May 22, 2015 will vest. Additionally, notwithstanding the standard vesting schedule of each applicable stock option, Mr. Stollmeyer’s stock option grant (x) on June 23, 2013 covering 25,000 shares vests as to 100% of the shares on a sale of the company (as defined in the option agreement) and (y) on February 6, 2014 covering 125,000 shares vests as to 100% of the shares on the date that is six months following our initial public offering.
In the event any of the payments provided for under the employment agreement or otherwise payable to Mr. Stollmeyer would constitute “parachute payments” within the meaning of Section 280G of the Internal Revenue Code and could be subject to the related excise tax under Section 4999 of the Internal Revenue Code, he would be entitled to receive either full payment of benefits or such lesser amount that would result in no portion of the benefits being subject to the excise tax, whichever results in the greater amount of after-tax benefits to him. This employment agreement does not require us to provide any tax gross-up payments.
Subsequent to the end of fiscal 2014, Mr. Stollmeyer received the following additional stock option grants: (1) an option to purchase up to 162,500 shares of our Class B common stock in February 2015 at an exercise price of $14.476 per share; and (2) an option to purchase up to 100,000 shares of our Class B common stock in May 2015 at an exercise price of $14.496 per share.
Robert Murphy
We entered into an employment agreement with Robert Murphy, our Chief Operating Officer, effective as of May 22, 2015. The employment agreement has a term of three years, with automatic renewals for additional three-year terms, unless either party provides notice not to renew the agreement within 90 days of the end of such three-year term. Mr. Murphy’s employment is at-will. Mr. Murphy’s current annual base salary is $340,000, and he is currently eligible to earn annual incentive compensation with a target equal to 56% of his base salary, based
129
Table of Contents
upon achievement of milestones determined by our board of directors or compensation committee for each fiscal year. Pursuant to his employment agreement, effective July 1, 2015, Mr. Murphy’s annual base salary will be $350,000, he will be eligible to earn annual incentive compensation with a target no less than 65% of his base salary, or target bonus. Mr. Murphy will be eligible to earn up to 200% of the target bonus for 2015.
Mr. Murphy’s employment agreement provides that if his employment is terminated by us or our successor without “cause” (as defined below), by Mr. Murphy for “good reason” (as defined below) or on account of death or disability (each, a “qualifying termination”), upon his executing a general release and waiver of claims against us (or our successor) in the form provided by us or our successor that becomes effective and irrevocable within the time period prescribed in his employment agreement, Mr. Murphy will receive (1) continuing payments of severance equal to 18 months of Mr. Murphy’s annual base salary as then in effect; (2) a lump-sum amount equal to Mr. Murphy’s target annual incentive compensation, pro-rated for the days served during the year of employment; (3) reimbursement of COBRA continuation premiums for up to 18 months for Mr. Murphy and his eligible dependents (provided he is eligible for and timely elects COBRA continuation coverage), or cash payments in lieu thereof; and (4) acceleration of 100% of the then-unvested shares subject to Mr. Murphy’s equity awards granted prior to May 22, 2015. If the qualifying termination occurs during the period that commences upon a change in control and ends on the first anniversary following a change in control, then in addition to the benefits described above, 100% of Mr. Murphy’s equity awards granted on or after May 22, 2015 will vest. Additionally, notwithstanding the standard vesting schedule of each applicable stock option, Mr. Murphy’s stock option grant (x) on June 23, 2013 covering 25,000 vests as to 100% of the shares on a sale of the company (as defined in the option agreement) and (y) on February 6, 2014 covering 125,000 shares vests as to 100% of the shares on the date that is six months following our initial public offering.
In the event any of the payments provided for under the employment agreement or otherwise payable to Mr. Murphy would constitute “parachute payments” within the meaning of Section 280G of the Internal Revenue Code and could be subject to the related excise tax under Section 4999 of the Internal Revenue Code, he would be entitled to receive either full payment of benefits or such lesser amount that would result in no portion of the benefits being subject to the excise tax, whichever results in the greater amount of after-tax benefits to him. This employment agreement does not require us to provide any tax gross-up payments.
Subsequent to the end of fiscal 2014, Mr. Murphy received the following additional stock option grants: (1) an option to purchase up to 81,250 shares of our Class B common stock in February 2015 at an exercise price of $14.476 per share; and (2) an option to purchase up to 25,000 shares of our Class B common stock in May 2015 at an exercise price of $14.496 per share.
Kimberly Lytikainen
We entered into an employment agreement with Kimberly Lytikainen, our Senior Vice President, General Counsel and Secretary, effective as of May 22, 2015. The employment agreement has a term of three years, with automatic renewals for additional three-year terms, unless either party provides notice not to renew the agreement within 90 days of the end of such three-year term. Ms. Lytikainen’s employment is at-will. Ms. Lytikainen’s current annual base salary is $263,000, and she is currently eligible to earn annual incentive compensation with a target equal to 19% of her base salary, based upon achievement of milestones determined by our board of directors or compensation committee for each fiscal year. Pursuant to her employment agreement, effective July 1, 2015, Ms. Lytikainen’s annual base salary will be $290,000, and she will be eligible to earn annual incentive compensation with a target equal to 50% of her base salary.
Ms. Lytikainen’s employment agreement provides that if her employment is terminated by us or our successor without “cause” (as defined below), by Ms. Lytikainen for “good reason” (as defined below) or on account of death or disability (each, a “qualifying termination”), upon her executing a general release and waiver of claims against us (or our successor) in the form provided by us or our successor that becomes effective and irrevocable within the time period prescribed in her employment agreement, Ms. Lytikainen will receive
130
Table of Contents
(1) continuing payments of severance equal to 18 months of Ms. Lytikainen’s annual base salary as then in effect; (2) reimbursement for all reasonable relocation costs; (3) reimbursement of COBRA continuation premiums for up to 18 months for Ms. Lytikainen and her eligible dependents (provided she is eligible for and timely elects COBRA continuation coverage), or cash payments in lieu thereof; and (4) acceleration of 50% of the then-unvested shares subject to Ms. Lytikainen’s equity awards granted prior to May 22, 2015. If the qualifying termination occurs during the period that commences upon a change in control and ends on the first anniversary following a change in control, then in addition to the benefits described above, 100% of all of Ms. Lytikainen’s equity awards will vest.
In the event any of the payments provided for under the employment agreement or otherwise payable to Ms. Lytikainen would constitute “parachute payments” within the meaning of Section 280G of the Internal Revenue Code and could be subject to the related excise tax under Section 4999 of the Internal Revenue Code, she would be entitled to receive either full payment of benefits or such lesser amount which would result in no portion of the benefits being subject to the excise tax, whichever results in the greater amount of after-tax benefits to her. This employment agreement does not require us to provide any tax gross-up payments.
Subsequent to the end of fiscal 2014, Ms. Lytikainen received the following additional stock option grants: (1) an option to purchase up to 12,500 shares of our Class B common stock in February 2015 at an exercise price of $14.476 per share; and (2) an option to purchase up to 75,000 shares of our Class B common stock in May 2015 at an exercise price of $14.496 per share.
For purposes of the employment agreements with our named executive officers, “cause” means generally:
| • | executive’s conviction of, or plea of nolo contendere, to a felony (excluding negligent driving offenses or driving offenses solely related to the speed limit) and which has an adverse effect on our business or affairs; |
| • | executive’s gross and willful misconduct; |
| • | executive’s unauthorized and intentional use or disclosure of any of our proprietary information or trade secrets or any other party to whom executive owes an obligation of nondisclosure; |
| • | executive’s willful breach of any material obligations under any material written agreement or covenant with us; |
| • | executive’s refusal to perform his or her employment duties after receiving notice and an opportunity to cure; or |
| • | a failure to cooperate in good faith with a governmental or internal investigation. |
No termination for cause is effective unless executive is given written notice from the board of the condition that could constitute cause and, if capable of being cured, at least 30 days to cure.
For purposes of the employment agreements with our named executive officers, “good reason” means generally a resignation within 30 days following the expiration of any cure period following the occurrence of one or more of the following, without executive’s consent:
| • | a material reduction of executive’s duties, authority or responsibilities; |
| • | a material reduction in executive’s base salary (except where there is a reduction to the management team generally, not to exceed 15%); |
| • | a material change in the geographic location of executive’s work location (a relocation of less than 30 miles will not be considered material). |
A resignation for good reason requires informing us within 90 days of the initial existence of the grounds for good reason and a cure period of 30 days following the date we receive such notice.
131
Table of Contents
Outstanding Equity Awards at 2014 Year-End
The following table sets forth information regarding outstanding stock options held by our named executive officers as of December 31, 2014:
| Option Awards | ||||||||||||||||||||
| Name |
Grant Date(1) | Number of Securities Underlying Unexercised Options (#) Exercisable |
Number of Securities Underlying Unexercised Options (#) Unexercisable |
Option Exercise Price ($)(2) |
Option Expiration Date |
|||||||||||||||
| Richard L. Stollmeyer |
11/19/2010 | (3) | 358,252 | — | 0.544 | 11/18/2020 | ||||||||||||||
| 11/15/2011 | (3) | 197,017 | — | 1.392 | 11/14/2021 | |||||||||||||||
| 6/23/2013 | (4) | 9,375 | 15,625 | 7.708 | 6/23/2023 | |||||||||||||||
| 2/6/2014 | (5) | — | 125,000 | 11.52 | 2/5/2024 | |||||||||||||||
| Robert Murphy |
11/15/2011 | (3) | 196,727 | — | 1.392 | 11/14/2021 | ||||||||||||||
| 6/23/2013 | (4) | 9,375 | 15,625 | 7.708 | 6/23/2023 | |||||||||||||||
| 2/6/2014 | (5) | — | 125,000 | 11.52 | 2/5/2024 | |||||||||||||||
| Kimberly Lytikainen |
9/20/2014 | (6) | — | 162,500 | 10.616 | 9/19/2024 | ||||||||||||||
| (1) | Each of the outstanding equity awards was granted pursuant to our 2009 Plan. |
| (2) | This column represents the fair market value of a share of our common stock on the date of grant, as determined by our board of directors. |
| (3) | 100% of the shares subject to the option were vested as of December 31, 2014. |
| (4) | 25% of the shares subject to the option vested on June 27, 2014, and 2.0833% of the shares subject to the option vest monthly thereafter, subject to continued service with us on each such vesting date. This option includes accelerated vesting, as described in the section titled “Named Executive Officer Employment Arrangements” above. |
| (5) | 10% of the shares subject to the option vested on January 1, 2015, 20% of the shares subject to the option will vest on January 1, 2016, 30% of the shares subject to the option will vest on January 1, 2017, and 40% of the shares subject to the option will vest on January 1, 2018, subject to continued service with us on each such vesting date. This option includes accelerated vesting, as described in the section titled “Named Executive Officer Employment Arrangements” above. |
| (6) | 25% of the shares subject to the option will vest on July 7, 2015, and 2.0833% of the shares will vest monthly thereafter, subject to continued service with us on each such vesting date. |
Employee Benefit and Stock Plans
2015 Equity Incentive Plan
In June 2015, our board of directors adopted and our stockholders approved our 2015 Plan. Our 2015 Plan will be effective one business day prior to the effective date of the registration statement of which this prospectus forms a part. Our 2015 Plan will provide for the grant of incentive stock options, within the meaning of Section 422 of the Code, to our employees and any parent and subsidiary corporations’ employees, and for the grant of nonstatutory stock options, restricted stock, restricted stock units, stock appreciation rights, performance units and performance shares to our employees, directors and consultants and our parent and subsidiary corporations’ employees and consultants.
Authorized Shares. A total of (i) 4,698,818 shares of our Class A common stock will be reserved for issuance pursuant to our 2015 Plan plus (ii) shares of our Class B common stock returned to our 2009 Plan as the result of expiration or termination of awards after the effective date of the registration statement of which this prospectus forms a part (provided that the maximum number of shares that may be added to our 2015 Plan pursuant to (ii) is 4,439,615 shares). Any such shares under the provision above that had covered shares under our 2009 Plan as shares of Class B common stock will, under our 2015 Plan, become issuable instead as Class A
132
Table of Contents
common stock on a one-for-one basis. The number of shares available for issuance under our 2015 Plan will also include an annual increase on the first day of each fiscal year beginning in 2016, equal to the least of:
| • | 3,915,682 shares; |
| • | 5% of the outstanding shares of common stock as of the last day of our immediately preceding fiscal year; or |
| • | such other amount as our board of directors or compensation committee may determine. |
Plan Administration. Our board of directors or one or more committees appointed by our board of directors, will administer our 2015 Plan. We currently anticipate that our board of directors will delegate authority to administer the 2015 Plan to our compensation committee, which will have full but non-exclusive authority to administer and interpret the terms of the 2015 Plan. In the case of awards intended to qualify as “performance-based compensation” within the meaning of Section 162(m) of the Code, our compensation committee will consist of two or more “outside directors” within the meaning of Section 162(m) of the Code. In addition, if we determine it is desirable to qualify transactions under our 2015 Plan as exempt under Rule 16b-3 of the Securities Exchange Act of 1934, as amended, or Rule 16b-3, such transactions will be structured to satisfy the requirements for exemption under Rule 16b-3. Subject to the provisions of our 2015 Plan, the administrator will have the power to administer the plan, including but not limited to, the power to interpret the terms of the 2015 Plan and awards granted thereunder, to create, amend and revoke rules relating to our 2015 Plan, including creating sub-plans, and to determine the terms of the awards, including the exercise price, the number of shares subject to each such award, the exercisability of the awards, and the form of consideration, if any, payable upon exercise. The administrator will also have the authority to amend existing awards to reduce or increase their exercise price, to allow participants the opportunity to transfer outstanding awards to a financial institution or other person or entity selected by the administrator, and to institute an exchange program by which outstanding awards may be surrendered in exchange for awards of the same type, which may have a higher or lower exercise price or different terms, awards of a different type and/or cash.
Stock Options. Stock options may be granted under our 2015 Plan. The exercise price of options granted under our 2015 Plan must at least be equal to the fair market value of our Class A common stock on the date of grant. The term of an incentive stock option may not exceed 10 years, except that with respect to any participant who owns more than 10% of the voting power of all classes of our outstanding stock, the term must not exceed five years and the exercise price must equal at least 110% of the fair market value on the grant date. The administrator will determine the methods of payment of the exercise price of an option, which may include cash, shares or other property acceptable to the administrator, as well as other types of consideration permitted by applicable law. After the termination of service of an employee, director or consultant, he or she may exercise his or her option for the period of time stated in his or her option agreement. Generally, if termination is due to death or disability, the option will remain exercisable for 12 months. In all other cases, the option will generally remain exercisable for three months following the termination of service. However, in no event may an option be exercised after the expiration of its term. Subject to the provisions of our 2015 Plan, the administrator determines the other terms of options.
Stock Appreciation Rights. Stock appreciation rights may be granted under our 2015 Plan. Stock appreciation rights allow the recipient to receive the appreciation in the fair market value of our Class A common stock between the exercise date and the date of grant. Stock appreciation rights may not have a term exceeding 10 years. After the termination of service of an employee, director or consultant, he or she may exercise his or her stock appreciation right for the period of time stated in his or her stock appreciation right agreement. However, in no event may a stock appreciation right be exercised after the expiration of its term. Subject to the provisions of our 2015 Plan, the administrator determines the other terms of stock appreciation rights, including when such rights become exercisable and whether to pay any increased appreciation in cash or with shares of our common stock, or a combination thereof, except that the per share exercise price for the shares to be issued pursuant to the exercise of a stock appreciation right will be no less than 100% of the fair market value per share on the date of grant.
133
Table of Contents
Restricted Stock. Restricted stock may be granted under our 2015 Plan. Restricted stock awards are grants of shares of our common stock that vest in accordance with terms and conditions established by the administrator. The administrator will determine the number of shares of restricted stock granted to any employee, director or consultant and, subject to the provisions of our 2015 Plan, will determine the terms and conditions of such awards. The administrator may impose whatever conditions to vesting it determines to be appropriate. For example, the administrator may set restrictions based on the achievement of specific performance goals or continued service to us; provided, however, that the administrator, in its sole discretion, may accelerate the time at which any restrictions will lapse or be removed. Recipients of restricted stock awards generally will have voting and dividend rights with respect to such shares upon grant without regard to vesting, unless the administrator provides otherwise. Shares of restricted stock that do not vest are subject to our right of repurchase or forfeiture.
Restricted Stock Units. Restricted stock units may be granted under our 2015 Plan. Restricted stock units are bookkeeping entries representing an amount equal to the fair market value of one share of our Class A common stock. Subject to the provisions of our 2015 Plan, the administrator will determine the terms and conditions of restricted stock units, including the vesting criteria, which may include accomplishing specified performance criteria or continued service to us, and the form and timing of payment. Notwithstanding the foregoing, the administrator, in its sole discretion, may accelerate the time at which any restrictions will lapse or be removed.
Performance Units and Performance Shares. Performance units and performance shares may be granted under our 2015 Plan. Performance units and performance shares are awards that will result in a payment to a participant only if performance goals established by the administrator are achieved or the awards otherwise vest. The administrator will establish organizational or individual performance goals or other vesting criteria in its discretion, which, depending on the extent to which they are met, will determine the number and the value of performance units and performance shares to be paid out to participants. After the grant of a performance unit or performance share, the administrator, in its sole discretion, may reduce or waive any performance criteria or other vesting provisions for such performance unit or performance share. Performance units shall have an initial dollar value established by the administrator prior to the grant date. Performance shares shall have an initial value equal to the fair market value of our Class A common stock on the grant date. The administrator, in its sole discretion, may pay earned performance units or performance shares in the form of cash, in shares or in some combination thereof.
Outside Directors. Our 2015 Plan will provide that all non-employee directors will be eligible to receive all types of awards, except for incentive stock options, under our 2015 Plan. During any fiscal year, a non-employee director may not be granted (1) cash-settled awards with a grant date fair value (determined in accordance with generally accepted accounting principles) of more than $500,000, increased to $1,000,000 in connection with his or her initial service, or (2) stock-settled awards with a grant date fair value of more than $500,000, increased to $1,000,000 in connection with his or her initial service.
Non-Transferability. Unless the administrator provides otherwise, our 2015 Plan generally will not allow for the transfer of awards and only the recipient of an award may exercise an award during his or her lifetime.
Certain Adjustments. In the event of certain changes in our capitalization, to prevent diminution or enlargement of the benefits or potential benefits available under our 2015 Plan, the administrator will adjust the number and class of shares that may be delivered under our 2015 Plan and the number, class, and price of shares covered by each outstanding award, and the numerical share limits set forth in our 2015 Plan. In the event of our proposed liquidation or dissolution, the administrator will notify participants as soon as practicable, and all awards will terminate immediately prior to the consummation of such proposed transaction.
Merger or Change in Control. Our 2015 Plan will provide that in the event of a “merger” or “change in control,” as defined under our 2015 Plan, each outstanding award will be treated as the administrator determines, except that if a successor corporation or its parent or subsidiary does not assume or substitute an equivalent
134
Table of Contents
award for any outstanding award, then such award will fully vest, all restrictions on such award will lapse, all performance goals or other vesting criteria applicable to such award will be deemed achieved at 100% of target levels, and such award will become fully exercisable, if applicable, for a specified period prior to the transaction. The award will then terminate upon the expiration of the specified period of time. If the service of an outside director is terminated on or following a change in control, other than pursuant to a voluntary resignation, his or her options, restricted stock units and stock appreciation rights, if any, will vest fully and become immediately exercisable, all restrictions on his or her restricted stock will lapse, and all performance goals or other vesting requirements for his or her performance shares and units will be deemed achieved at 100% of target levels, and all other terms and conditions met.
Amendment, Termination. The administrator will have the authority to amend, suspend or terminate our 2015 Plan, provided such action does not impair the existing rights of any participant. Our 2015 Plan will automatically terminate in 2025, unless we terminate it sooner.
2015 Employee Stock Purchase Plan
In June 2015, our board of directors adopted and our stockholders approved our ESPP. Our ESPP will be effective as of the date it is adopted by our board of directors. We believe that allowing our employees to participate in our ESPP will provide them with a further incentive towards ensuring our success and accomplishing our corporate goals.
Authorized Shares. A total of 783,136 shares of our common stock are available for sale under our ESPP. The number of shares of our common stock available for sale under our ESPP also includes an annual increase on the first day of each fiscal year beginning in 2016, equal to the least of:
| • | 783,136 shares; |
| • | 1% of the outstanding shares of our common stock as of the last day of the immediately preceding fiscal year; or |
| • | such other amount as our board of directors or compensation committee may determine. |
Plan Administration. Our compensation committee will administer our ESPP and have full but non-exclusive authority to interpret the terms of our ESPP and determine eligibility to participate, subject to the conditions of our ESPP, as described below.
Eligibility. Generally, all of our employees will be eligible to participate if they are employed by us, or any participating subsidiary, for at least 20 hours per week and more than five months in any calendar year. However, an employee may not be granted rights to purchase shares of our Class A common stock under our ESPP if such employee:
| • | immediately after the grant would own capital stock possessing 5% or more of the total combined voting power or value of all classes of our capital stock; or |
| • | holds rights to purchase shares of our common stock under all of our employee stock purchase plans that accrue at a rate that exceeds $25,000 worth of shares of our common stock for each calendar year. |
Offering Periods. Our ESPP includes a component that allows us to make offerings intended to qualify under Section 423 of the Code and a component that allows us to make offerings not intended to qualify under Section 423 of the Code to designated companies, as described in our ESPP. Our ESPP provides for 24-month offering periods. The offering periods are scheduled to start on the first trading day on or after February 21 and August 21 of each year, except for the first offering period, which will commence on the first trading day on or after completion of this offering and will end on the first trading day on or after August 21, 2017. Each offering period will include purchase periods, which will be the approximately six-month period commencing with one exercise date and ending with the next exercise date.
135
Table of Contents
Contributions. Our ESPP permits participants to purchase shares of our Class A common stock through payroll deductions of up to 15% of their eligible compensation. A participant may purchase a maximum of 2,500 shares of our Class A common stock during a purchase period.
Exercise of Purchase Right. Amounts deducted and accumulated by the participant are used to purchase shares of our Class A common stock at the end of each six-month purchase period. The purchase price of the shares will be 85% of the lower of the fair market value of our Class A common stock on the first trading day of each offering period or on the exercise date. If the fair market value of our Class A common stock on the exercise date is less than the fair market value on the first trading day of the offering period, participants will be withdrawn from the current offering period following their purchase of shares of our Class A common stock on the purchase date and will be automatically re-enrolled in a new offering period. Participants may end their participation at any time during an offering period and will be paid their accrued contributions that have not yet been used to purchase shares of our Class A common stock. Participation ends automatically upon termination of employment with us.
Non-Transferability. A participant may not transfer rights granted under our ESPP. If our compensation committee permits the transfer of rights, it may only be done by will, the laws of descent and distribution or as otherwise provided under our ESPP.
Merger or Change in Control. Our ESPP provides that in the event of a merger or change in control, as defined under our ESPP, a successor corporation may assume or substitute each outstanding purchase right. If the successor corporation refuses to assume or substitute for the outstanding purchase right, the offering period then in progress will be shortened, and a new exercise date will be set. The administrator will notify each participant that the exercise date has been changed and that the participant’s option will be exercised automatically on the new exercise date unless prior to such date the participant has withdrawn from the offering period.
Amendment; Termination. The administrator has the authority to amend, suspend or terminate our ESPP, except that, subject to certain exceptions described in our ESPP, no such action may adversely affect any outstanding rights to purchase shares of our common stock under our ESPP. Our ESPP automatically will terminate in 2035, unless we terminate it sooner.
2009 Stock Option Plan
Our board of directors adopted, and our stockholders approved our 2009 Plan, in March 2009.
Authorized Shares. Our 2009 Plan will be terminated in connection with this offering and, accordingly, no shares will be available for issuance under our 2009 Plan after that time. Our 2009 Plan will continue to govern outstanding awards granted thereunder. As of March 31, 2015, 4,967,447 shares of our Class B common stock were reserved for issuance under our 2009 Plan. Until its termination in connection with this offering, our 2009 Plan provides for the grant of incentive stock options, nonstatutory stock options, and restricted stock. As of March 31, 2015, options to purchase 3,163,039 shares of our Class B common stock remained outstanding under our 2009 Plan.
Plan Administration. Our board of directors or one or more committees appointed by our board of directors administers our 2009 Plan. Following this offering, we anticipate that our compensation committee will administer awards that remain outstanding under our 2009 Plan. Subject to the provisions of our 2009 Plan, the administrator has the power to administer the plan, including but not limited to, the power to: (1) determine the fair market value of our common stock; (2) select recipients of awards; (3) determine the number of shares covered by each award; (4) approve form agreements under our 2009 Plan; (5) determine the terms and conditions of awards; (6) amend outstanding awards or any agreements related to such awards; (7) determine when an option may be settled in cash; (8) implement an option exchange program; (9) in accordance with applicable laws, grant awards to non-U.S. recipients and modify the terms of such grants; and (10) construe and
136
Table of Contents
interpret our 2009 Plan and any award agreement. The administrator may also at any time offer to buy out any option for a payment in cash or shares.
Stock Options. The exercise price per share of all options must equal at least 100% of the fair market value per share of our Class B common stock on the date of grant. The term of an option does not exceed 10 years. An incentive stock option held by a participant who owned more than 10% of the total combined voting power of all classes of our stock, or any parent or subsidiary corporations, does not have a term in excess of five years and has an exercise price of at least 110% of the fair market value per share of our Class B common stock on the date of grant. After the termination of service, the participant may generally exercise his or her option, to the extent vested as of such date of termination, for 12 months following a termination due to disability or death or for three months following any other termination without cause (or such other time periods set forth in the option agreement). If termination is for cause, the option will be immediately forfeited. However, in no event may an option be exercised later than the expiration of its term.
Restricted Stock. The administrator determined the number of shares of restricted stock granted to any participant and the terms and conditions of such awards. The administrator could impose whatever conditions to vesting it determined to be appropriate. Recipients of restricted stock awards generally have voting and dividend rights with respect to such shares upon grant without regard to vesting, unless the administrator provided otherwise. Shares of restricted stock that do not vest are subject to our right of repurchase or forfeiture.
Non-Transferability. Our 2009 Plan generally does not allow for the transfer of options, and only the recipient of an option may exercise such an award during his or her lifetime.
Certain Adjustments. In the event of certain changes in our capitalization without our receipt of consideration, the number of shares of our Class B common stock covered by each outstanding award, the exercise price per share of each outstanding option, and the number of shares available for issuance under our 2009 Plan will be appropriately adjusted. In the event of our proposed liquidation or dissolution, all outstanding awards terminate immediately prior to such event unless otherwise determined by the administrator.
Corporate Transaction. Our 2009 Plan provides that in the event of a corporate transaction (as defined in our 2009 Plan), which generally includes a merger, consolidation or sale of all or substantially all of our assets, each outstanding award will either be (1) assumed or substituted for an equivalent award or (2) terminated in exchange for a payment for the vested portion of the award (less any exercise price for that portion of the award). In the event that the successor corporation does not agree to such assumption, substitution, or exchange, the awards will terminate upon the consummation of the transaction. Certain stock options accelerate in full upon a sale of the company (as defined in the applicable stock option agreement).
Amendment; Termination. Our board of directors may amend our 2009 Plan at any time, provided that such amendment generally may not materially and adversely affect the rights of any holder of outstanding awards without the award holder’s consent. As noted above, in connection with this offering, our 2009 Plan will be terminated, and no further awards will be granted thereunder. All outstanding awards will continue to be governed by their existing terms.
Executive Bonus Plan
Our Executive Bonus Plan was adopted by our compensation committee in December 2014. Our Executive Bonus Plan allows our compensation committee to provide cash incentive awards to employees selected by our compensation committee, including our named executive officers, which may but need not be based upon performance goals established by our compensation committee.
Under our Executive Bonus Plan, our compensation committee determines the performance goals (if any) applicable to any award or portion of an award, which goals may include, without limitation, the attainment of
137
Table of Contents
research and development milestones, bookings, business divestitures and acquisitions, cash flow, cash position, operating results and operating metrics, product defect measures, product release timelines, productivity, return on assets, return on capital, return on equity, return on investment, return on sales, sales results, sales growth, stock price, time to market, total stockholder return, working capital and individual objectives such as peer reviews or other subjective or objective criteria. The performance goals may differ from participant to participant and from award to award.
Our compensation committee currently administers our Executive Bonus Plan. The administrator of our Executive Bonus Plan may, in its sole discretion and at any time, increase, reduce or eliminate a participant’s actual award, and/or increase, reduce or eliminate the amount allocated to the bonus pool for a particular performance period. The actual award may be below, at or above a participant’s target award, in the discretion of the administrator. The administrator may determine the amount of any increase, reduction, or elimination on the basis of such factors as it deems relevant, and it is not required to establish any allocation or weighting with respect to the factors it considers.
Actual awards are paid in cash only after they are earned, which usually requires continued employment through the last day of the performance period and the date the actual award is paid. Payment of awards occurs as soon as administratively practicable after they are earned, but no later than the dates set forth in our Executive Bonus Plan.
Our board of directors and our compensation committee in their sole discretion have the authority to amend, suspend or terminate our Executive Bonus Plan, provided such action does not impair the existing rights of any participant with respect to any earned awards.
401(k) Plan
We maintain a tax-qualified retirement plan, or our 401(k) plan, that provides eligible employees with an opportunity to save for retirement on a tax-advantaged basis. Eligible employees are able to participate in our 401(k) plan as of the first day of the month following the date they meet our 401(k) plan’s eligibility requirements, and participants are able to defer up to 100% of their eligible compensation subject to applicable annual Code limits. All participants’ interests in their deferrals are 100% vested when contributed. Our 401(k) plan permits us to make matching contributions and discretionary contributions to eligible participants. We make a safe harbor matching contribution of 100% of each eligible employee’s elective deferral that does not exceed 3% of compensation, plus 50% of the elective deferral that exceeds 3% of compensation but does not exceed 5% of compensation.
138
Table of Contents
CERTAIN RELATIONSHIPS AND RELATED PARTY TRANSACTIONS
In addition to the compensation arrangements, including employment, equity awards, termination of employment and change in control arrangements, discussed in the sections titled “Management” and “Executive Compensation,” the following is a description of each transaction since January 1, 2012 and each currently proposed transaction in which:
| • | we have been or will be a participant; |
| • | the amount involved exceeded or exceeds $120,000; and |
| • | any of our directors, executive officers or holders of more than 5% of any class of our outstanding capital stock, or any immediate family member of, or person sharing the household with, any of these individuals or entities, had or will have a direct or indirect material interest. |
Equity Financings
Series F Redeemable Convertible Preferred Stock Financing
During October 2012, we sold an aggregate of 2,685,997 shares of our Series F redeemable convertible preferred stock for an aggregate purchase price of $24,999,999. The following table summarizes purchases of our Series F redeemable convertible preferred stock by holders of more than 5% of any class of our outstanding capital stock:
| Stockholder |
Shares of Series F Redeemable Convertible Preferred Stock |
Total Purchase Price |
||||||
| Institutional Venture Partners XIII, L.P.(1) |
1,762,015 | $ | 16,399,990 | |||||
| Entities affiliated with Bessemer Venture Partners(2)(3) |
537,199 | 5,000,000 | ||||||
| Entities affiliated with Catalyst Investors(4)(5) |
386,783 | 3,600,009 | ||||||
| (1) | Eric Liaw, a member of our board of directors, is a General Partner at Institutional Venture Partners. |
| (2) | Affiliates of Bessemer Venture Partners holding our securities whose shares are aggregated for purposes of reporting share ownership information are BVP VII Special Opportunity Fund L.P., Bessemer Venture Partners VII L.P. and Bessemer Venture Partners VII Institutional L.P. |
| (3) | Jeremy Levine, a member of our board of directors, is a Partner at Bessemer Venture Partners. |
| (4) | Affiliates of Catalyst Investors holding our securities whose shares are aggregated for purposes of reporting share ownership information are Catalyst Investors QP II, L.P. and Catalyst Investors II, L.P. |
| (5) | Tyler Newton, a member of our board of directors, is a Partner at Catalyst Investors. |
139
Table of Contents
Series G Redeemable Convertible Preferred Stock Financing
During February 2014, we sold an aggregate of 3,692,684 shares of our Series G redeemable convertible preferred stock for an aggregate purchase price of $50,043,267. The following table summarizes purchases of our Series G redeemable convertible preferred stock by holders of more than 5% of any class of our outstanding capital stock:
| Stockholder |
Shares of Series G Redeemable Convertible Preferred Stock |
Total Purchase Price |
||||||
| W Capital Partners III, L.P. |
1,807,850 | $ | 24,499,983 | |||||
| Entities affiliated with Bessemer Venture Partners(1)(2) |
777,984 | 10,543,253 | ||||||
| Institutional Venture Partners XIII, L.P.(3) |
368,950 | 5,000,010 | ||||||
| Entities affiliated with Catalyst Investors(4)(5) |
147,580 | 2,000,004 | ||||||
| (1) | Affiliates of Bessemer Venture Partners holding our securities whose shares are aggregated for purposes of reporting share ownership information are BVP VII Special Opportunity Fund L.P., Bessemer Venture Partners VII L.P. and Bessemer Venture Partners VII Institutional L.P. |
| (2) | Jeremy Levine, a member of our board of directors, is a Partner at Bessemer Venture Partners. |
| (3) | Eric Liaw, a member of our board of directors, is a General Partner at Institutional Venture Partners. |
| (4) | Affiliates of Catalyst Investors holding our securities whose shares are aggregated for purposes of reporting share ownership information are Catalyst Investors QP II, L.P. and Catalyst Investors II, L.P. |
| (5) | Tyler Newton, a member of our board of directors, is a Partner at Catalyst Investors. |
2014 Third-Party Tender Offer
In February 2014, we entered into a letter agreement, which was amended in March 2014, with certain holders of our capital stock, including W Capital Partners III, L.P., pursuant to which we agreed to waive certain transfer restrictions in connection with, and assist in the administration of, a tender offer that such holders proposed to commence. In February 2014, these holders commenced a tender offer to purchase shares of our capital stock from certain of our security holders. Richard L. Stollmeyer and Robert Murphy, each of whom is one of our directors and executive officers, their affiliated trusts, and Chet Brandenburg, one of our executive officers, sold shares of our capital stock in the tender offer. An aggregate of 1,361,787 shares of our capital stock, including 736,068 shares held by the directors and executive officers referenced in the preceding sentence, were tendered pursuant to the tender offer at a price of $11.52 per share.
Investors’ Rights Agreement
We are party to an investors’ rights agreement which provides, among other things, that certain holders of our capital stock, including entities affiliated with Bessemer Venture Partners, entities affiliated with Catalyst Investors, Institutional Venture Partners XIII, L.P., entities affiliated with J.P. Morgan, W Capital Partners III, L.P., Richard L. Stollmeyer and Robert Murphy, have the right to demand that we file a registration statement or request that their shares of our capital stock be covered by a registration statement that we are otherwise filing. See the section titled “Description of Capital Stock—Registration Rights” for additional information regarding these registration rights.
Right of First Refusal
Pursuant to certain of our equity compensation plans and agreements, including a right of first refusal and co-sale agreement with certain holders of our capital stock, including entities affiliated with Bessemer Venture Partners, entities affiliated with Catalyst Investors, Institutional Venture Partners XIII, L.P., entities affiliated with J.P. Morgan, W Capital Partners III, L.P., Richard L. Stollmeyer and Robert Murphy, we or our assignees
140
Table of Contents
have a right to purchase shares of our capital stock that certain stockholders propose to sell to other parties. This right will terminate upon completion of this offering. Since January 1, 2012, we have waived our right of first refusal in connection with the sale of certain shares of our capital stock in a series of transactions, including sales by Richard L. Stollmeyer, his affiliated trust, Robert Murphy, and Chet Brandenburg, and purchases by Richard L. Stollmeyer, entities affiliated with Catalyst Investors, Institutional Venture Partners XIII, L.P. and entities affiliated with J.P. Morgan. See the section titled “Principal Stockholders” for additional information regarding beneficial ownership of our capital stock.
Voting Agreement
We are party to a voting agreement under which certain holders of our capital stock, including entities affiliated with Bessemer Venture Partners, entities affiliated with Catalyst Investors, Institutional Venture Partners XIII, L.P., entities affiliated with J.P. Morgan, W Capital Partners III, L.P., Richard L. Stollmeyer and Robert Murphy, have agreed to vote their shares of our capital stock on certain matters, including with respect to the election of directors. Upon completion of this offering, the voting agreement will terminate and none of our stockholders will have any special rights regarding the election or designation of members of our board of directors.
Loan to Executive Officer
In September 2010, we loaned Richard L. Stollmeyer $300,000 pursuant to a secured non-recourse promissory note and pledge and security agreement. This loan bore interest at the rate per annum of 1.94%, compounded annually. As of October 2012, the outstanding principal amount of this loan was $300,000, which was the largest aggregate amount of principal outstanding during the last three fiscal years. The balance of the loan was repaid in full by Mr. Stollmeyer in October 2012.
Office Maintenance and Construction Services
During 2012, 2013, 2014 and the three months ended March 31, 2015, we incurred approximately $68,000, $101,000, $121,000 and $31,600 of expense for janitorial services rendered to us by KS Services. Karen Stollmeyer, the sister-in-law of Richard L. Stollmeyer, is the sole proprietor of KS Services.
During 2012, 2013, 2014 and the three months ended March 31, 2015, we incurred approximately $13,000, $54,000, $212,000 and $40,000 of expense for lighting services rendered to us by Stollmeyer Lighting, LLC. Richard L. Stollmeyer and his brother, Ken Stollmeyer, are members of Stollmeyer Lighting, LLC.
During 2014, we incurred approximately $292,000 of expense for construction services rendered to us by Jack Handley Construction. Shauna Wills, the spouse of Bradford L. Wills, one of our executive officers, was a greater than 10% stockholder of Jack Handley Construction during 2014.
Participation in Our Initial Public Offering
Certain entities associated with J.P. Morgan Investment Management Inc., one of our existing holders of greater than 5% of our common stock, have indicated an interest in purchasing up to $10.0 million of our Class A common stock in this offering, at the initial public offering price. Because these indications of interest are not binding agreements or commitments to purchase, such entities may elect to purchase fewer shares than they indicate an interest in purchasing or not to purchase any shares in this offering. In addition, the underwriters may elect to sell fewer shares or not to sell any shares in this offering to such entities. The underwriters will receive the same discount from any shares sold to such entities as they will from any other shares sold to the public in this offering. Any shares purchased by such entities will be subject to the applicable lock-up restrictions described in the section entitled “Shares Eligible for Future Sale.”
141
Table of Contents
Limitation of Liability and Indemnification of Officers and Directors
We expect to adopt an amended and restated certificate of incorporation, which will become effective immediately prior to the completion of this offering, and which will contain provisions that limit the liability of our directors for monetary damages to the fullest extent permitted by Delaware law. Consequently, our directors will not be personally liable to us or our stockholders for monetary damages for any breach of fiduciary duties as directors, except liability for the following:
| • | any breach of their duty of loyalty to our company or our stockholders; |
| • | any act or omission not in good faith or that involves intentional misconduct or a knowing violation of law; |
| • | unlawful payments of dividends or unlawful stock repurchases or redemptions as provided in Section 174 of the Delaware General Corporation Law; or |
| • | any transaction from which they derived an improper personal benefit. |
Any amendment to, or repeal of, these provisions will not eliminate or reduce the effect of these provisions in respect of any act, omission or claim that occurred or arose prior to that amendment or repeal. If the Delaware General Corporation Law is amended to provide for further limitations on the personal liability of directors of corporations, then the personal liability of our directors will be further limited to the greatest extent permitted by the Delaware General Corporation Law.
In addition, we expect to adopt amended and restated bylaws, which will become effective immediately prior to the completion of this offering, and which will provide that we will indemnify, to the fullest extent permitted by law, any person who is or was a party or is threatened to be made a party to any action, suit or proceeding by reason of the fact that he or she is or was one of our directors or officers or is or was serving at our request as a director or officer of another corporation, partnership, joint venture, trust or other enterprise. Our amended and restated bylaws are expected to provide that we may indemnify to the fullest extent permitted by law any person who is or was a party or is threatened to be made a party to any action, suit or proceeding by reason of the fact that he or she is or was one of our employees or agents or is or was serving at our request as an employee or agent of another corporation, partnership, joint venture, trust or other enterprise. Our amended and restated bylaws will also provide that we must advance expenses incurred by or on behalf of a director or officer in advance of the final disposition of any action or proceeding, subject to limited exceptions.
Further, we have entered into indemnification agreements with each of our directors and executive officers that may be broader than the specific indemnification provisions contained in the Delaware General Corporation Law. These indemnification agreements require us, among other things, to indemnify our directors and executive officers against liabilities that may arise by reason of their status or service. These indemnification agreements also require us to advance all expenses incurred by the directors and executive officers in investigating or defending any such action, suit or proceeding. We believe that these agreements are necessary to attract and retain qualified individuals to serve as directors and executive officers.
The limitation of liability and indemnification provisions that are expected to be included in our amended and restated certificate of incorporation and amended and restated bylaws and are included in the indemnification agreements that we have entered into with our directors and executive officers may discourage stockholders from bringing a lawsuit against our directors and executive officers for breach of their fiduciary duties. They may also reduce the likelihood of derivative litigation against our directors and executive officers, even though an action, if successful, might benefit us and other stockholders. Further, a stockholder’s investment may be adversely affected to the extent that we pay the costs of settlement and damage awards against directors and executive officers as required by these indemnification provisions. At present, we are not aware of any pending litigation or proceeding involving any person who is or was one of our directors, officers, employees or other agents or is or was serving at our request as a director, officer, employee or agent of another corporation, partnership, joint
142
Table of Contents
venture, trust or other enterprise, for which indemnification is sought, and we are not aware of any threatened litigation that may result in claims for indemnification.
Prior to the completion of the offering, we will obtain insurance policies under which, subject to the limitations of the policies, coverage will be provided to our directors and executive officers against losses arising from claims made by reason of breach of fiduciary duty or other wrongful acts as a director or executive officer, including claims relating to public securities matters, and to us with respect to payments that may be made by us to these directors and executive officers pursuant to our indemnification obligations or otherwise as a matter of law.
Certain of our non-employee directors may, through their relationships with their employers, be insured and/or indemnified against certain liabilities incurred in their capacity as members of our board of directors.
The underwriting agreement will provide for indemnification by the underwriters of us and our officers and directors for certain liabilities arising under the Securities Act or otherwise.
Insofar as indemnification for liabilities arising under the Securities Act may be permitted to directors, officers or persons controlling our company pursuant to the foregoing provisions, we have been informed that, in the opinion of the SEC, such indemnification is against public policy as expressed in the Securities Act and is therefore unenforceable.
Policies and Procedures for Related Party Transactions
Our audit committee has adopted a formal written policy providing that our audit committee will be responsible for reviewing “related party transactions,” which are transactions between us and related persons in which the aggregate amount involved exceeds or may be expected to exceed $120,000 and in which a related person has or will have a direct or indirect material interest. For purposes of this policy, a related person is defined as a director, executive officer, nominee for director or greater than 5% beneficial owner of any class of our common stock, in each case since the beginning of the most recently completed year, and any of their immediate family members. In determining whether to approve or ratify any such transaction, our audit committee will take into account, among other factors it deems appropriate, (i) whether the transaction is on terms no less favorable than terms generally available to unaffiliated third parties under the same or similar circumstances and (ii) the extent of the related party’s interest in the transaction. The policy will grant standing pre-approval of certain transactions, including (i) certain compensation arrangements of executive officers, (ii) certain director compensation arrangements, (iii) transactions with another company at which a related party’s only relationship is as a non-executive employee, director or beneficial owner of less than 10% of that company’s shares and the aggregate amount involved does not exceed the greater of $200,000 or 2% of the company’s total annual revenue, (iv) transactions where a related party’s interest arises solely from the ownership of our common stock and all holders of our common stock received the same benefit on a pro rata basis, and (v) transactions available to all U.S. employees generally.
143
Table of Contents
The following table sets forth certain information with respect to the beneficial ownership of our capital stock as of April 30, 2015, and as adjusted to reflect the sale of our Class A common stock offered by us in this offering, assuming no exercise of the underwriters’ over-allotment option, for:
| • | each of our named executive officers; |
| • | each of our directors; |
| • | all of our current directors and executive officers as a group; and |
| • | each person known by us to be the beneficial owner of more than 5% of our Class A common stock or Class B common stock. |
We have determined beneficial ownership in accordance with the rules of the SEC, and the information is not necessarily indicative of beneficial ownership for any other purpose. Unless otherwise indicated below, to our knowledge, the persons and entities named in the table had sole voting and sole investment power with respect to all shares that they beneficially owned, subject to community property laws where applicable.
We have based our calculation of the percentage of beneficial ownership prior to this offering on no shares of our Class A common stock and 31,977,397 shares of our Class B common stock outstanding as of April 30, 2015, assuming the automatic conversion and reclassification of all outstanding shares of our redeemable convertible preferred stock into 20,673,680 shares of our Class B common stock. We have based our calculation of the percentage of beneficial ownership after this offering on 7,150,000 shares of our Class A common stock and 31,977,397 shares of our Class B common stock outstanding immediately after the completion of this offering, assuming that the underwriters will not exercise their over-allotment option. We have deemed shares of our capital stock subject to stock options that are currently exercisable or exercisable within 60 days of April 30, 2015 to be outstanding and to be beneficially owned by the person holding the stock option for the purpose of computing the percentage ownership of that person. However, we did not deem these shares outstanding for the purpose of computing the percentage ownership of any other person.
Unless otherwise indicated, the address of each beneficial owner listed in the table below is c/o MINDBODY, Inc., 4051 Broad Street, Suite 220, San Luis Obispo, California 93401.
| Beneficial Ownership Prior to the Offering |
Beneficial Ownership After the Offering |
Percent of Total Voting Power After the Offering |
||||||||||||||||||
| Name of Beneficial Owner |
Number | Percent | Number | Percent | ||||||||||||||||
| Named Executive Officers and Directors: |
||||||||||||||||||||
| Richard L. Stollmeyer(1) |
3,404,547 | 10.5 | % | 3,404,547 | 8.6 | % | 10.2 | % | ||||||||||||
| Robert Murphy(2) |
2,258,252 | 7.0 | % | 2,258,252 | 5.7 | % | 6.9 | % | ||||||||||||
| Kimberly Lytikainen(3) |
2,605 | * | 2,605 | * | * | |||||||||||||||
| Katherine Blair Christie |
— | — | — | — | — | |||||||||||||||
| Jeremy Levine(4) |
6,480,027 | 20.3 | % | 6,480,027 | 16.6 | % | 19.8 | % | ||||||||||||
| Eric Liaw |
— | — | — | — | — | |||||||||||||||
| Tyler Newton |
— | — | — | — | — | |||||||||||||||
| Graham Smith |
— | — | — | — | — | |||||||||||||||
| All executive officers and directors as a group (12 persons)(5) |
11,773,485 | 35.6 | % | 11,773,485 | 29.3 | % | 31.5 | % | ||||||||||||
| 5% Stockholders: |
||||||||||||||||||||
| Entities affiliated with Bessemer Venture Partners(6) |
6,480,027 | 20.3 | % | 6,480,027 | 16.6 | % | 19.8 | % | ||||||||||||
| Entities affiliated with Catalyst Investors(7) |
4,951,943 | 15.5 | % | 4,951,943 | 12.7 | % | 15.2 | % | ||||||||||||
| Institutional Venture Partners XIII, L.P.(8) |
3,205,365 | 10.0 | % | 3,205,365 | 8.2 | % | 9.8 | % | ||||||||||||
| W Capital Partners III, L.P.(9) |
2,829,842 | 8.9 | % | 2,829,842 | 7.2 | % | 8.7 | % | ||||||||||||
| Entities affiliated with J.P. Morgan(10) |
3,228,880 | 10.1 | % | 3,228,880 | 8.3 | % | 9.9 | % | ||||||||||||
144
Table of Contents
| * | Represents beneficial ownership of less than one percent. |
| (1) | Consists of (i) 1,184,657 shares held of record by Mr. Stollmeyer, (ii) 1,250 shares held of record by Mr. Stollmeyer as custodian for the benefit of his minor child, (iii) 23,750 shares held of record by Mr. Stollmeyer’s spouse, (iv) 1,250 shares held of record by Mr. Stollmeyer’s spouse as custodian for the benefit of her minor child, (v) 774,700 shares held of record by Lori Stollmeyer, (vi) 595,894 shares issuable pursuant to outstanding stock options held by Mr. Stollmeyer which are exercisable within 60 days of April 30, 2015, and (vii) 823,046 shares held pursuant to the proxy described below. Lori Stollmeyer has granted Mr. Stollmeyer a proxy to vote the shares held of record by her pursuant to a voting agreement, which will terminate upon the earlier of (i) the ten year anniversary of the completion of this offering, (ii) a change of control of our company and (iii) the agreement of the parties. Mr. Stollmeyer and Mr. Murphy hold an irrevocable proxy to vote an aggregate of 921,796 shares of our Class B common stock held of record by certain of our stockholders. |
| (2) | Consists of (i) 994,937 shares held of record by Mr. Murphy, (ii) 13,750 shares held of record by Mr. Murphy’s spouse, (iii) 187,500 shares held of record by the Robert John Murphy Family Trust, for which Mr. Murphy’s spouse serves as co-trustee, (iv) 229,019 shares issuable pursuant to outstanding stock options held by Mr. Murphy which are exercisable within 60 days of April 30, 2015, and (v) 833,046 shares held pursuant to the proxy described below. Mr. Stollmeyer and Mr. Murphy hold an irrevocable proxy to vote an aggregate of 921,796 shares of our Class B common stock held of record by certain of our stockholders. |
| (3) | Consists of 2,605 shares issuable pursuant to outstanding stock options held by Ms. Lytikainen which are exercisable within 60 days of April 30, 2015. |
| (4) | Consists of the shares listed in footnote 6 below, which are held of record by the Bessemer Venture Partners Entities (as defined below). Each of Deer VII L.P. (as defined below), the general partner of the Bessemer Venture Partners Entities, and Deer VII Ltd. (as defined below), the general partner of Deer VII L.P., may be deemed to have voting and dispositive power over the shares held by the Bessemer Venture Partners Entities. J. Edmund Colloton, David J. Cowan, Byron B. Deeter, Robert P. Goodman, Jeremy S. Levine and Robert M. Stavis are the directors of Deer VII Ltd. Investment and voting decisions with respect to the shares held by the Bessemer Venture Partners Entities are made by the directors of Deer VII Ltd. acting as an investment committee. The address for each of these entities is c/o Bessemer Venture Partners, 1865 Palmer Avenue, Suite 104, Larchmont, New York 10538. |
| (5) | Consists of (i) 10,646,197 shares beneficially owned by our current executive officers and directors, and (ii) 1,127,288 shares subject to options exercisable within 60 days of April 30, 2015. |
| (6) | Consists of (i) 3,499,215 shares held of record by BVP VII Special Opportunity Fund L.P., (ii) 2,073,610 shares held of record by Bessemer Venture Partners VII L.P., and (iii) 907,202 shares held of record by Bessemer Venture Partners VII Institutional L.P. (collectively, the “Bessemer Venture Partners Entities”). Each of Deer VII & Co. L.P. (“Deer VII L.P.”), the general partner of the Bessemer Venture Partners Entities, and Deer VII & Co. Ltd. (“Deer VII Ltd.”), the general partner of Deer VII L.P., may be deemed to have voting and dispositive power over the shares held by the Bessemer Venture Partners Entities. J. Edmund Colloton, David J. Cowan, Byron B. Deeter, Robert P. Goodman, Jeremy S. Levine and Robert M. Stavis are the directors of Deer VII Ltd. Investment and voting decisions with respect to the shares held by the Bessemer Venture Partners Entities are made by the directors of Deer VII Ltd. acting as an investment committee. The address for each of these entities is c/o Bessemer Venture Partners, 1865 Palmer Avenue, Suite 104, Larchmont, New York 10538. |
| (7) | Consists of (i) 4,080,288 shares held of record by Catalyst Investors QP II, L.P. and (ii) 871,655 shares held of record by Catalyst Investors II, L.P. (collectively, the “Catalyst Entities”). Catalyst Investors Partners II, L.P. is the general partner of each of the Catalyst Entities. Catalyst Investors Partners, L.L.C. is the general partner of Catalyst Investors Partners II, L.P. Brian A. Rich, D. Ryan McNally and Christopher J. Shipman are the managing members of Catalyst Investors Partners, L.L.C. and share voting and dispositive power over the shares held by the Catalyst Entities. The address for these entities is 711 Fifth Avenue, Suite 600, New York, New York 10022. |
145
Table of Contents
| (8) | Consists of 3,205,365 shares held of record by Institutional Venture Partners XIII, L.P. Institutional Venture Management XIII, LLC is the general partner of Institutional Venture Partners XIII, L.P. Todd C. Chaffee, Norman A. Fogelsong, Stephen J. Harrick, J. Sanford Miller and Dennis B. Phelps are the managing directors of Institutional Venture Management XIII, LLC and share voting and dispositive power over the shares held by Institutional Venture Partners XIII, L.P. The address for these entities is c/o Institutional Venture Partners, 3000 Sand Hill Road, Building 2, Suite 250, Menlo Park, California 94025. |
| (9) | Consists of 2,829,842 shares held of record by W Capital Partners III, L.P. WCP GP III, L.P. is the sole general partner of W Capital Partners III, L.P. WCP GP III, LLC is the sole general partner of WCP GP III, L.P. Robert J. Migliorino, David S. Wachter and Stephen Wertheimer are the managing members of WCP GP III, LLC and share voting and dispositive power over the shares held by W Capital Partners III, L.P. The address for these entities is c/o W Capital Management, LLC, 400 Park Avenue, Suite 910, New York, New York 10022. |
| (10) | Consists of (i) 2,712,259 shares held of record by PEG Digital Growth Fund II L.P. and (ii) 516,621 shares held of record by PEG Secondary Private Equity Investors II L.P. (collectively, the “JPM Entities”). J.P. Morgan Investment Management Inc. (“JPMIM”) is the investment advisor of each of the JPM Entities and holds voting and dispositive power over the shares held by the JPM Entities. JPMIM acts in respect of the shares through a committee of over 30 individuals in its Private Equity Group, each with an equal vote. Certain entities associated with JPMIM have indicated an interest in purchasing up to $10.0 million of our Class A common stock in this offering, at the initial public offering price. Because these indications of interest are not binding agreements or commitments to purchase, such entities may elect to purchase fewer shares than they indicate an interest in purchasing or not to purchase any shares in this offering. In addition, the underwriters may elect to sell fewer shares or not to sell any shares in this offering to such entities. However, because indications of interest are not binding agreements or commitments to purchase, the foregoing table does not reflect the potential purchase of any shares in this offering by entities associated with JPMIM. If any shares are purchased by such entities, the number of shares of our capital stock beneficially owned by the entities affiliated with JPMIM after this offering and the percentage of our capital stock beneficially owned by the entities affiliated with JPMIM after this offering will differ from that set forth in the foregoing table. If such entities were to purchase an aggregate of $10.0 million of our Class A common stock in this offering, based upon the assumed initial public offering price of $14.00 per share, which is the midpoint of the estimated offering price range set forth on the cover page of this prospectus, entities affiliated with JPMIM would beneficially own 3,943,165 shares, or 10.1%, of our capital stock after this offering, which would constitute 10.1% of the total voting power after this offering. The address for these entities is 320 Park Avenue, 15th Floor, NY1-U016, New York, New York 10022. |
146
Table of Contents
General
The following description summarizes certain important terms of our capital stock, as they are expected to be in effect as of immediately prior to the completion of this offering. We have adopted an amended and restated certificate of incorporation and amended and restated bylaws that will become effective immediately prior to the completion of this offering, and this description summarizes the provisions that are included in such documents. Because it is only a summary, it does not contain all the information that may be important to you. For a complete description of the matters set forth in this section titled “Description of Capital Stock,” you should refer to our amended and restated certificate of incorporation, amended and restated bylaws and Amended and Restated Investors’ Rights Agreement, or our IRA, dated as of February 10, 2014, as amended, which are included as exhibits to the registration statement of which this prospectus forms a part, and to the applicable provisions of Delaware law. Immediately following the completion of this offering, our authorized capital stock will consist of 1,200,000,000 shares of capital stock, $0.000004 par value per share, of which:
| • | 1,000,000,000 shares are designated as Class A common stock |
| • | 100,000,000 shares are designated as Class B common stock; and |
| • | 100,000,000 shares are designated as preferred stock. |
Assuming the conversion and reclassification of all outstanding shares of our redeemable convertible preferred stock into shares of our Class B common stock, which will occur immediately prior to the completion of this offering, as of March 31, 2015, there were no outstanding shares of our Class A common stock and 31,967,544 outstanding shares of our Class B common stock, held by 190 stockholders of record, and no outstanding shares of our preferred stock.
Class A Common Stock and Class B Common Stock
Voting Rights
The holders of our Class A common stock are entitled to one vote per share, and the holders of our Class B common stock are entitled to 10 votes per share. The holders of our Class A common stock and Class B common stock will generally vote together as a single class on all matters submitted to a vote of our stockholders, unless otherwise required by Delaware law or our amended and restated certificate of incorporation. Delaware law could require either holders of our Class A common stock or Class B common stock to vote separately as a single class in the following circumstances:
| • | if we were to seek to amend our amended and restated certificate of incorporation to increase or decrease the par value of a class of our capital stock, then that class would be required to vote separately to approve the proposed amendment; and |
| • | if we were to seek to amend our amended and restated certificate of incorporation in a manner that alters or changes the powers, preferences or special rights of a class of our capital stock in a manner that affected its holders adversely, then that class would be required to vote separately to approve the proposed amendment. |
Our stockholders do not have the ability to cumulate votes for the election of directors. Our amended and restated certificate of incorporation and amended and restated bylaws provide for a classified board of directors consisting of three classes of approximately equal size, each class serving staggered three-year terms. Only one will be elected at each annual meeting of our stockholders, with the other classes continuing for the remainder of their respective three-year terms.
No Preemptive or Similar Rights
Our common stock is not entitled to preemptive rights and is not subject to conversion, redemption or sinking fund provisions.
147
Table of Contents
Right to Receive Liquidation Distributions
Upon our dissolution, liquidation or winding-up, the assets legally available for distribution to our stockholders are distributable ratably among the holders of our common stock, subject to prior satisfaction of all outstanding debt and liabilities and the preferential rights and payment of liquidation preferences, if any, on any outstanding shares of preferred stock.
Conversion
Each share of our Class B common stock is convertible at any time at the option of the holder into one share of our Class A common stock. In addition, each share of our Class B common stock will convert automatically into one share of our Class A common stock upon any transfer, whether or not for value, except for certain transfers described in our amended and restated certificate of incorporation, including transfers for tax and estate planning purposes so long as the transferring holder of Class B common stock continues to hold exclusive voting and dispositive power with respect to the shares transferred.
All outstanding shares of Class B common stock shall automatically convert to Class A common stock on the seventh anniversary of the completion of this offering. Once transferred and converted into a share of our Class A common stock, the converted share of our Class B common stock will not be reissued. In addition, following the conversion of all outstanding shares of our Class B common stock into Class A common stock, no further shares of our Class B common stock will be issued.
Preferred Stock
Our board of directors is authorized, subject to limitations prescribed by Delaware law, to issue preferred stock in one or more series, to establish from time to time the number of shares to be included in each series and to fix the designation, powers, preferences and rights of the shares of each series and any of its qualifications, limitations or restrictions, in each case without further vote or action by our stockholders. Our board of directors can also increase or decrease the number of shares of any series of preferred stock, but not below the number of shares of that series then outstanding, without any further vote or action by our stockholders. Our board of directors may authorize the issuance of preferred stock with voting or conversion rights that could adversely affect the voting power or other rights of the holders of our common stock. The issuance of preferred stock, while providing flexibility in connection with possible acquisitions and other corporate purposes, could, among other things, have the effect of delaying, deferring or preventing a change in control of our company and might adversely affect the market price of our common stock and the voting and other rights of the holders of our common stock. We have no current plan to issue any shares of preferred stock.
Options
As of March 31, 2015, we had outstanding options to purchase an aggregate of 3,163,039 shares of our Class B common stock, with a weighted-average exercise price of approximately $7.96 per share, under our 2009 Plan.
Warrant
As of March 31, 2015, we had an outstanding warrant to purchase up to 87,500 shares of our redeemable convertible preferred stock, with an aggregate exercise price of approximately $151,603. Immediately prior to the completion of this offering, this warrant will be converted and reclassified into a warrant to purchase up to 89,177 shares of our Class B common stock. This warrant is exercisable at any time on or before June 23, 2020.
Registration Rights
After the completion of this offering, certain holders of our Class B common stock will be entitled to rights with respect to the registration of their shares under the Securities Act. These registration rights are contained in
148
Table of Contents
our IRA. We and certain holders of our redeemable convertible preferred stock are parties to the IRA. We will pay the registration expenses (other than underwriting discounts and commissions and stock transfer taxes) of the holders of the shares registered pursuant to the registrations described below. In an underwritten offering, the underwriters have the right, subject to specified conditions, to limit the number of shares such holders may include. We expect that our stockholders who have registration rights will waive their rights under the IRA (i) to receive notice of this offering and (ii) to include their registrable shares in this offering. In addition, in connection with this offering, we expect that each stockholder that has registration rights will agree not to sell or otherwise dispose of any securities without the prior written consent of the underwriters for a period of 180 days after the date of this prospectus, subject to certain terms and conditions and early release of certain holders in specified circumstances. See the section titled “Underwriting” for additional information regarding such restrictions.
Demand Registration Rights
After the completion of this offering, the holders of up to 27,454,809 shares of our Class B common stock will be entitled to certain demand registration rights. At any time beginning six months after the effective date of this offering, certain groups of stockholders can request that we register the offer and sale of their shares. We are obligated to effect only two such registrations for each group of stockholders. Such request for registration must cover securities the anticipated aggregate public offering price of which, before payment of underwriting discounts and commissions, is at least $5,000,000. If we determine that it would be seriously detrimental to us and our stockholders to effect such a demand registration, we have the right to defer such registration, not more than once in any 12-month period, for a period of up to 120 days.
Piggyback Registration Rights
After the completion of this offering, if we propose to register the offer and sale of our capital stock under the Securities Act, in connection with the public offering of such capital stock, the holders of up to 27,543,986 shares of our Class B common stock (including 89,177 shares of our Class B common stock, on an as-converted basis, issuable upon the exercise of a warrant to purchase redeemable convertible preferred stock that was outstanding as of March 31, 2015) will be entitled to certain “piggyback” registration rights allowing the holders to include their shares in such registration, subject to certain marketing and other limitations. As a result, whenever we propose to file a registration statement under the Securities Act, other than with respect to (i) a demand registration, (ii) a Form S-3 registration, (iii) a registration related to a company stock plan or a transaction covered by Rule 145 promulgated under the Securities Act, (iv) a registration of common stock issuable upon conversion of debt securities that are also being registered, or (v) a registration on any form which does not include substantially the same information as would be required to be included in a registration statement covering the sale of the registrable shares, the holders of these shares are entitled to notice of the registration and have the right, subject to certain limitations, to include their shares in the registration.
S-3 Registration Rights
After the completion of this offering, the holders of up to 27,454,809 shares of our Class B common stock will be entitled to certain Form S-3 registration rights. Holders of these shares then outstanding may make a written request that we register the offer and sale of their shares on a registration statement on Form S-3 if we are eligible to file a registration statement on Form S-3 so long as the request covers securities the anticipated aggregate public offering price of which, after payment of underwriting discounts and commissions, is at least $1,000,000. These stockholders may make an unlimited number of requests for registration on Form S-3; however, we will not be required to effect a registration on Form S-3 during the period ending six months after the effective date of a “piggyback” registration or if we have effected a Form S-3 registration within the 12-month period preceding the date of the request. Additionally, if we determine that it would be seriously detrimental to us and our stockholders to effect such a registration, we have the right to defer such registration, not more than once in any 12-month period, for a period of up to 120 days.
149
Table of Contents
Anti-Takeover Provisions
The provisions of Delaware law, our amended and restated certificate of incorporation and our amended and restated bylaws, which are summarized below, may have the effect of delaying, deferring or discouraging another person from acquiring control of our company. They are also designed, in part, to encourage persons seeking to acquire control of us to negotiate first with our board of directors. We believe that the benefits of increased protection of our potential ability to negotiate with an unfriendly or unsolicited acquirer outweigh the disadvantages of discouraging a proposal to acquire us because negotiation of these proposals could result in an improvement of their terms.
Delaware Law
We will be governed by the provisions of Section 203 of the Delaware General Corporation Law. In general, Section 203 prohibits a public Delaware corporation from engaging in a “business combination” with an “interested stockholder” for a period of three years after the date of the transaction in which the person became an interested stockholder, unless:
| • | the transaction was approved by the board of directors prior to the time that the stockholder became an interested stockholder; |
| • | upon consummation of the transaction which resulted in the stockholder becoming an interested stockholder, the interested stockholder owned at least 85% of the voting stock of the corporation outstanding at the time the transaction commenced, excluding shares owned by directors who are also officers of the corporation and shares owned by employee stock plans in which employee participants do not have the right to determine confidentially whether shares held subject to the plan will be tendered in a tender or exchange offer; or |
| • | at or subsequent to the time the stockholder became an interested stockholder, the business combination was approved by the board of directors and authorized at an annual or special meeting of the stockholders, and not by written consent, by the affirmative vote of at least two-thirds of the outstanding voting stock which is not owned by the interested stockholder. |
In general, Section 203 defines a “business combination” to include mergers, asset sales and other transactions resulting in financial benefit to a stockholder and an “interested stockholder” as a person who, together with affiliates and associates, owns, or within three years did own, 15% or more of the corporation’s outstanding voting stock. These provisions may have the effect of delaying, deferring or preventing changes in control of our company.
Amended and Restated Certificate of Incorporation and Amended and Restated Bylaw Provisions
Our amended and restated certificate of incorporation and our amended and restated bylaws will include a number of provisions that could deter hostile takeovers or delay or prevent changes in control of our board of directors or management team, including the following:
Board of Directors Vacancies. Our amended and restated certificate of incorporation and amended and restated bylaws will authorize only our board of directors to fill vacant directorships, including newly created seats. In addition, the number of directors constituting our board of directors will be permitted to be set only by a resolution adopted by a majority vote of our entire board of directors. These provisions would prevent a stockholder from increasing the size of our board of directors and then gaining control of our board of directors by filling the resulting vacancies with its own nominees. This will make it more difficult to change the composition of our board of directors and will promote continuity of management.
Classified Board. Our amended and restated certificate of incorporation and amended and restated bylaws will provide that our board of directors is classified into three classes of directors. A third party may be discouraged from making a tender offer or otherwise attempting to obtain control of us as it is more difficult and
150
Table of Contents
time consuming for stockholders to replace a majority of the directors on a classified board of directors. See the section titled “Management—Classified Board of Directors.”
Stockholder Action; Special Meeting of Stockholders. Our amended and restated certificate of incorporation will provide that our stockholders may not take action by written consent, but may only take action at annual or special meetings of our stockholders. As a result, a holder controlling a majority of our capital stock would not be able to amend our amended and restated bylaws or remove directors without holding a meeting of our stockholders called in accordance with our amended and restated bylaws. Our amended and restated bylaws will further provide that special meetings of our stockholders may be called only by a majority of our board of directors, the chairman of our board of directors, our Chief Executive Officer or our President, thus prohibiting a stockholder from calling a special meeting. These provisions might delay the ability of our stockholders to force consideration of a proposal or for stockholders controlling a majority of our capital stock to take any action, including the removal of directors.
Advance Notice Requirements for Stockholder Proposals and Director Nominations. Our amended and restated bylaws will provide advance notice procedures for stockholders seeking to bring business before our annual meeting of stockholders or to nominate candidates for election as directors at our annual meeting of stockholders. Our amended and restated bylaws will also specify certain requirements regarding the form and content of a stockholder’s notice. These provisions might preclude our stockholders from bringing matters before our annual meeting of stockholders or from making nominations for directors at our annual meeting of stockholders if the proper procedures are not followed. We expect that these provisions may also discourage or deter a potential acquirer from conducting a solicitation of proxies to elect the acquirer’s own slate of directors or otherwise attempting to obtain control of our company.
No Cumulative Voting. The Delaware General Corporation Law provides that stockholders are not entitled to cumulate votes in the election of directors unless a corporation’s certificate of incorporation provides otherwise. Our amended and restated certificate of incorporation does not provide for cumulative voting.
Directors Removed Only for Cause. Our amended and restated certificate of incorporation will provide that stockholders may remove directors only for cause.
Amendment of Charter Provisions. Any amendment of the above provisions in our amended and restated certificate of incorporation would require approval by holders of at least 66 2⁄3% of our then outstanding capital stock.
Issuance of Undesignated Preferred Stock. Our board of directors will have the authority, without further action by our stockholders, to issue up to 100,000,000 shares of undesignated preferred stock with rights and preferences, including voting rights, designated from time to time by our board of directors. The existence of authorized but unissued shares of preferred stock would enable our board of directors to render more difficult or to discourage an attempt to obtain control of us by means of a merger, tender offer, proxy contest or other means.
Transfer Agent and Registrar
Upon completion of this offering, the transfer agent and registrar for our Class A common stock and Class B common stock will be Computershare Trust Company, N.A. The transfer agent and registrar’s address is 250 Royall Street, Canton, Massachusetts 02021.
Limitations of Liability and Indemnification
See the section titled “Certain Relationships and Related Party Transactions—Limitation of Liability and Indemnification of Officers and Directors.”
Listing
Our Class A common stock has been approved for listing on The NASDAQ Global Market under the symbol “MB.”
151
Table of Contents
SHARES ELIGIBLE FOR FUTURE SALE
Prior to this offering, there has been no public market for our capital stock, and we cannot predict the effect, if any, that market sales of shares of our Class A common stock or the availability of shares of our Class A common stock for sale will have on the market price of our Class A common stock prevailing from time to time. Future sales of our Class A common stock in the public market, or the availability of such shares for sale in the public market, could adversely affect market prices prevailing from time to time. As described below, only a limited number of shares of our Class A common stock will be available for sale shortly after the completion of this offering due to contractual and legal restrictions on resale. Nevertheless, sales of our Class A common stock in the public market after such restrictions lapse, or the perception that those sales may occur, could adversely affect the prevailing market price at such time and our ability to raise equity capital in the future.
Following the completion of this offering, based on the number of shares of our capital stock outstanding as of March 31, 2015, we will have a total of 7,150,000 shares of our Class A common stock and 31,967,544 shares of our Class B common stock outstanding. Of these outstanding shares, all 7,150,000 shares of our Class A common stock sold in this offering will be freely tradable, except that any shares purchased in this offering by our affiliates, as that term is defined in Rule 144 under the Securities Act, would only be able to be sold in compliance with the Rule 144 limitations described below. However, if entities associated with J.P. Morgan Investment Management Inc., one of our existing holders of greater than 5% of our common stock, purchase shares of our Class A common stock in this offering, such shares will be subject to a lock-up agreement, described further below, that provides that such entities will not, for a period of 180 days after the date of this prospectus, sell any such shares purchased in this offering without the prior written consent of Morgan Stanley & Co. LLC on behalf of the underwriters.
The remaining outstanding shares of our Class B common stock will be deemed “restricted securities” as defined in Rule 144 under the Securities Act. Restricted securities may be sold in the public market only if they are registered or if they qualify for an exemption from registration under Rule 144 or Rule 701 under the Securities Act, which rules are summarized below. Subject to the lock-up agreements described below, the applicable conditions of Rule 144 or Rule 701, and our insider trading policy, these restricted securities will be eligible for sale in the public market from time to time beginning 181 days after the date of this prospectus.
Lock-Up Agreements
We, our executive officers, directors and the holders of substantially all of our capital stock and securities convertible into or exchangeable for our capital stock have entered into lock-up agreements with the underwriters of this offering under which we and they have agreed that, subject to certain exceptions, for a period of 180 days after the date of this prospectus, we and they will not, without the prior written consent of Morgan Stanley & Co. LLC on behalf of the underwriters:
| • | offer, pledge, sell, contract to sell, sell any option or contract to purchase, lend, or otherwise transfer or dispose of, directly or indirectly, any shares of our Class A or Class B common stock or any other securities convertible into or exercisable or exchangeable for shares of our Class A or Class B common stock; |
| • | file any registration statement with SEC relating to the offering of any shares of our Class A or Class B common stock; or |
| • | enter into any swap or other arrangement that transfers to another, in whole or in part, any of the economic consequences of ownership of our Class A or Class B common stock; |
whether any such transaction described above is to be settled by delivery of shares of our Class A or Class B common stock or such other securities, in cash or otherwise. See the section titled “Underwriting” for a description of certain exceptions to this agreement.
152
Table of Contents
In addition, if any of the participants in our directed share program, which is described further in the section titled “Underwriting,” purchases $500,000 or greater of our Class A common stock in the directed share program, such shares will be subject to a lock-up agreement that provides that such persons will not, for a period of 90 days after the date of this prospectus, sell any such shares purchased in this offering without the prior written consent of Morgan Stanley & Co. LLC on behalf of the underwriters.
Rule 144
In general, under Rule 144 as currently in effect, once we have been subject to the public company reporting requirements of Section 13 or Section 15(d) of the Exchange Act for at least 90 days, a person who is not deemed to have been one of our affiliates for purposes of the Securities Act at any time during the 90 days preceding a sale and who has beneficially owned the shares of our common stock proposed to be sold for at least six months is entitled to sell those shares without complying with the manner of sale, volume limitation or notice provisions of Rule 144, subject to our compliance with the public information requirements of Rule 144. If such a person has beneficially owned the shares proposed to be sold for at least one year, including the holding period of any prior owner other than our affiliates, then that person would be entitled to sell those shares without complying with any of the requirements of Rule 144.
In general, under Rule 144, as currently in effect, our affiliates or persons selling shares of our common stock on behalf of our affiliates are entitled to sell upon expiration of the market standoff agreements and lock-up agreements described above, within any three-month period, a number of shares that does not exceed the greater of:
| • | 1% of the number of shares of our capital stock then outstanding, which will equal shares immediately after this offering; or |
| • | the average weekly trading volume of our common stock during the four calendar weeks preceding the filing of a notice on Form 144 with respect to that sale. |
Sales under Rule 144 by our affiliates or persons selling shares of our common stock on behalf of our affiliates are also subject to certain manner of sale provisions and notice requirements and to the availability of current public information about us.
Rule 701
Rule 701 generally allows a stockholder who purchased shares of our capital stock pursuant to a written compensatory plan or contract and who is not deemed to have been an affiliate of our company during the immediately preceding 90 days to sell these shares in reliance upon Rule 144, but without being required to comply with the public information, holding period, volume limitation or notice provisions of Rule 144. Rule 701 also permits affiliates of our company to sell their Rule 701 shares under Rule 144 without complying with the holding period requirements of Rule 144. All holders of Rule 701 shares, however, are required to wait until 90 days after the date of this prospectus before selling those shares pursuant to Rule 701.
Registration Rights
Pursuant to our IRA, the holders of up to 27,543,986 shares of our Class B common stock (including 89,177 shares of our Class B common stock, on an as-converted basis, issuable upon the exercise of a warrant to purchase redeemable convertible preferred stock that was outstanding as of March 31, 2015), or their transferees, will be entitled to certain rights with respect to the registration of the offer and sale of those shares under the Securities Act. See the section titled “Description of Capital Stock—Registration Rights” for a description of these registration rights. If the offer and sale of these shares of our common stock are registered, the shares will be freely tradable without restriction under the Securities Act, subject to the Rule 144 limitations applicable to affiliates, and a large number of shares may be sold into the public market.
153
Table of Contents
Registration Statement
We intend to file a registration statement on Form S-8 under the Securities Act promptly after the completion of this offering to register shares of our Class A common stock and Class B common stock subject to options outstanding, as well as reserved for future issuance, under our equity compensation plans. The registration statement on Form S-8 is expected to become effective immediately upon filing, and shares covered by the registration statement will then become eligible for sale in the public market, subject to the Rule 144 limitations applicable to affiliates, vesting restrictions and any applicable market standoff agreements and lock-up agreements. See the section titled “Executive Compensation—Employee Benefit and Stock Plans” for a description of our equity compensation plans.
154
Table of Contents
MATERIAL U.S. FEDERAL INCOME AND ESTATE TAX CONSEQUENCES TO NON-U.S. HOLDERS OF OUR CLASS A COMMON STOCK
The following is a summary of the material U.S. federal income and estate tax consequences to non-U.S. holders (as defined below) of their ownership and disposition of our Class A common stock, but does not purport to be a complete analysis of all the potential tax considerations relating thereto. This summary is based upon the provisions of Internal Revenue Code of 1986, as amended, or the Code, Treasury regulations promulgated thereunder, administrative rulings and judicial decisions, all as of the date hereof. These authorities may be changed, possibly retroactively, so as to result in U.S. federal income and estate tax consequences different from those set forth below. We have not obtained, and do not intend to obtain, any opinion of counsel or ruling from the Internal Revenue Service, or the IRS, with respect to the statements made and the conclusions reached in the following summary, and there can be no assurance that the IRS will agree with such statements and conclusions.
This summary also does not address the tax considerations arising under the laws of any non-U.S., state or local jurisdiction or under any non-income tax laws, including U.S. federal gift and estate tax laws, except to the limited extent set forth below. In addition, this discussion does not address the potential application of the tax on net investment income, the alternative minimum tax or any tax considerations applicable to an investor’s particular circumstances or to investors that may be subject to special tax rules, including, without limitation:
| • | banks, insurance companies or other financial institutions; |
| • | tax-exempt organizations; |
| • | controlled foreign corporations, passive foreign investment companies and corporations that accumulate earnings to avoid U.S. federal income tax; |
| • | brokers or dealers in securities or currencies; |
| • | traders in securities that elect to use a mark-to-market method of accounting for their securities holdings; |
| • | persons that own, or are deemed to own, more than 5% of our capital stock (except to the extent specifically set forth below); |
| • | certain former citizens or long-term residents of the United States; |
| • | partnerships, other pass-through entities or other entities classified as partnerships for U.S. federal income tax purposes (and partners or investors therein); |
| • | persons who hold our Class A common stock as a position in a hedging transaction, “straddle,” “conversion transaction” or other risk reduction transaction; |
| • | persons who hold or receive our Class A common stock pursuant to the exercise of any employee stock option or otherwise as compensation; |
| • | persons who do not hold our Class A common stock as a capital asset within the meaning of Section 1221 of the Code; or |
| • | persons deemed to sell our Class A common stock under the constructive sale provisions of the Code. |
In addition, if a partnership or entity classified as a partnership for U.S. federal income tax purposes holds our Class A common stock, the tax treatment of a partner generally will depend on the status of the partner and upon the activities of the partnership. Accordingly, partnerships that hold our Class A common stock, and partners in such partnerships, should consult their tax advisors.
YOU ARE URGED TO CONSULT YOUR TAX ADVISOR WITH RESPECT TO THE APPLICATION OF THE U.S. FEDERAL INCOME TAX LAWS TO YOUR PARTICULAR SITUATION, AS WELL AS ANY TAX CONSEQUENCES OF THE PURCHASE, OWNERSHIP AND
155
Table of Contents
DISPOSITION OF OUR CLASS A COMMON STOCK ARISING UNDER THE U.S. FEDERAL ESTATE OR GIFT TAX RULES OR UNDER THE LAWS OF ANY STATE, LOCAL, NON-U.S. OR OTHER TAXING JURISDICTION OR UNDER ANY APPLICABLE TAX TREATY.
Non-U.S. Holder Defined
For purposes of this discussion, you are a non-U.S. holder if you are any holder other than a partnership or other entity classified as a partnership for U.S. federal income tax purposes, or:
| • | an individual citizen or resident of the United States (for tax purposes); |
| • | a corporation or other entity taxable as a corporation created or organized in the United States or under the laws of the United States or any political subdivision thereof; |
| • | an estate whose income is subject to U.S. federal income tax regardless of its source; or |
| • | a trust (x) whose administration is subject to the primary supervision of a U.S. court and which has one or more U.S. persons (within the meaning of Section 7701(a)(3) of the Code) who have the authority to control all substantial decisions of the trust or (y) which has made a valid election to be treated as a U.S. person. |
Distributions
As described in the section titled “Dividend Policy,” we have never declared or paid any cash dividends on our Class A common stock and do not anticipate paying any cash dividends or other distributions on our Class A common stock. However, if we do make distributions on our Class A common stock, those payments will constitute dividends for U.S. tax purposes to the extent paid from our current or accumulated earnings and profits, as determined under U.S. federal income tax principles. To the extent those distributions exceed both our current and our accumulated earnings and profits, the excess will constitute a return of capital and will first reduce your basis in our Class A common stock, but not below zero, and then will be treated as gain from the sale of stock as described below under “—Gain on Disposition of Our Class A Common Stock.”
Subject to the discussion below on effectively connected income, any dividend paid to you generally will be subject to U.S. withholding tax either at a rate of 30% of the gross amount of the dividend or such lower rate as may be specified by an applicable income tax treaty. In order to receive a reduced treaty rate, you must provide us with an IRS Form W-8BEN, IRS Form W-8BEN-E or other appropriate version of IRS Form W-8 (or successor form), including a U.S. taxpayer identification number, certifying qualification for the reduced rate. These forms must be updated periodically. A non-U.S. holder of shares of our Class A common stock eligible for a reduced rate of U.S. withholding tax pursuant to an income tax treaty may obtain a refund of any excess amounts withheld by filing an appropriate claim for refund with the IRS. If the non-U.S. holder holds our Class A common stock through a financial institution or other agent acting on the non-U.S. holder’s behalf, the non-U.S. holder will be required to provide appropriate documentation to the agent, which then will be required to provide certification to us or our paying agent, either directly or through other intermediaries.
Dividends received by you that are effectively connected with your conduct of a U.S. trade or business (and, if required by an applicable income tax treaty, that are attributable to a permanent establishment or a fixed base maintained by you in the United States), are exempt from such withholding tax if you satisfy certain certification and disclosure requirements. In order to obtain this exemption, you must provide us with an IRS Form W-8ECI (or successor form) or other applicable IRS Form W-8 (or successor form) properly certifying such exemption. Such effectively connected dividends, although not subject to withholding tax, generally are taxed at the same graduated U.S. federal income tax rates applicable to U.S. persons, net of certain deductions and credits. In addition, if you are a corporate non-U.S. holder, dividends you receive that are effectively connected with your conduct of a U.S. trade or business may also be subject to a branch profits tax at a rate of 30% or such lower rate as may be specified by an applicable income tax treaty. You should consult your tax advisor regarding any applicable tax treaties that may provide for different rules.
156
Table of Contents
Gain on Disposition of Our Class A Common Stock
Subject to the discussion below regarding backup withholding and foreign accounts, you generally will not be required to pay U.S. federal income tax on any gain realized upon the sale, exchange or other disposition of our Class A common stock unless:
| • | the gain is effectively connected with your conduct of a U.S. trade or business (and, if required by an applicable income tax treaty, the gain is attributable to a permanent establishment or a fixed base maintained by you in the United States); |
| • | you are a non-resident alien individual who is present in the United States for a period or periods aggregating 183 days or more during the calendar year in which the sale or disposition occurs and certain other conditions are met; or |
| • | our Class A common stock constitutes a U.S. real property interest by reason of our status as a “United States real property holding corporation” (USRPHC) for U.S. federal income tax purposes at any time within the shorter of the five-year period preceding your disposition of, or your holding period for, our Class A common stock. |
We believe that we are not currently and will not become a USRPHC and the remainder of this discussion so assumes. However, because the determination of whether we are a USRPHC depends on the fair market value of our U.S. real property relative to the fair market value of our other business assets, there can be no assurance that we will not become a USRPHC in the future. Even if we become a USRPHC, however, as long as our Class A common stock is regularly traded on an established securities market, such Class A common stock will be treated as U.S. real property interests only if you actually or constructively hold more than 5% of such regularly traded Class A common stock at any time during the shorter of the five-year period preceding your disposition of, or your holding period for, our Class A common stock.
If you are a non-U.S. holder described in the first bullet above, you will be required to pay tax on the net gain derived from the sale under regular graduated U.S. federal income tax rates, and a corporate non-U.S. holder described in the first bullet above also may be subject to the branch profits tax at a 30% rate, or such lower rate as may be specified by an applicable income tax treaty. If you are an individual non-U.S. holder described in the second bullet above, you will be required to pay a flat 30% tax (or such lower rate specified by an applicable income tax treaty) on the gain derived from the sale, which gain may be offset by U.S.-source capital losses for the year (provided you have timely filed U.S. federal income tax returns with respect to such losses). You should consult your tax advisor regarding any applicable income tax or other treaties that may provide for different rules.
Federal Estate Tax
Our Class A common stock beneficially owned by an individual who is not a citizen or resident of the United States (as defined for U.S. federal estate tax purposes) at the time of their death will generally be includable in the decedent’s gross estate for U.S. federal estate tax purposes, unless an applicable estate tax treaty provides otherwise. Such stock, therefore, may be subject to U.S. federal estate tax, unless an applicable estate tax or other treaty provides otherwise.
Backup Withholding and Information Reporting
Generally, we must report annually to the IRS the amount of dividends paid to you, your name and address, and the amount of tax withheld, if any. A similar report will be sent to you. Pursuant to applicable income tax treaties or other agreements, the IRS may make these reports available to tax authorities in your country of residence.
Payments of dividends on or of proceeds from the disposition of our Class A common stock made to you may be subject to additional information reporting and backup withholding at a current rate of 28% unless you
157
Table of Contents
establish an exemption, for example, by properly certifying your non-U.S. status on an IRS Form W-8BEN, IRS Form W-8BEN-E or another appropriate version of IRS Form W-8 (or successor form). Notwithstanding the foregoing, backup withholding and information reporting may apply if either we or our paying agent has actual knowledge, or reason to know, that you are a U.S. person.
Backup withholding is not an additional tax; rather, the U.S. income tax liability of persons subject to backup withholding will be reduced by the amount of tax withheld. If withholding results in an overpayment of taxes, a refund or credit may generally be obtained from the IRS, provided that the required information is furnished to the IRS in a timely manner.
Foreign Accounts
The Foreign Account Tax Compliance Act, or FATCA, generally imposes a U.S. federal withholding tax of 30% on dividends on and the gross proceeds from the sale or other disposition of our Class A common stock, paid to a “foreign financial institution” (as specifically defined under these rules), unless such institution enters into an agreement with the U.S. government to, among other things, withhold on certain payments and to collect and provide to the U.S. tax authorities substantial information regarding the U.S. account holders of such institution (which includes certain equity and debt holders of such institution, as well as certain account holders that are foreign entities with U.S. owners) or otherwise establishes an exemption. FATCA also generally imposes a U.S. federal withholding tax of 30% on dividends on and the gross proceeds from the sale or other disposition of our Class A common stock paid to a “non-financial foreign entity” (as specifically defined for purposes of these rules) unless such entity provides the withholding agent with a certification identifying certain substantial direct and indirect U.S. owners of the entity, certifies that there are none or otherwise establishes an exemption. The withholding provisions under FATCA generally apply to dividends on our Class A common stock and, under current transitional rules, are expected to apply with respect to the gross proceeds from a sale or other disposition of our Class A common stock on or after January 1, 2017. Under certain circumstances, a non-U.S. holder might be eligible for refunds or credits of such taxes. An intergovernmental agreement between the United States and an applicable foreign country may modify the requirements described in this paragraph. Prospective investors are encouraged to consult with their own tax advisors regarding the possible implications of this legislation on their investment in our Class A common stock.
EACH PROSPECTIVE INVESTOR SHOULD CONSULT ITS OWN TAX ADVISOR REGARDING THE PARTICULAR U.S. FEDERAL, STATE AND LOCAL AND NON-U.S. TAX CONSEQUENCES OF PURCHASING, HOLDING AND DISPOSING OF OUR CLASS A COMMON STOCK, INCLUDING THE CONSEQUENCES OF ANY PROPOSED CHANGE IN APPLICABLE LAWS.
158
Table of Contents
Under the terms and subject to the conditions in an underwriting agreement dated the date of this prospectus, the underwriters named below, for whom Morgan Stanley & Co. LLC, Credit Suisse Securities (USA) LLC and UBS Securities LLC are acting as representatives, have severally agreed to purchase, and we have agreed to sell to them, severally, the number of shares indicated below:
| Name |
Number of |
|||
| Morgan Stanley & Co. LLC |
||||
| Credit Suisse Securities (USA) LLC |
||||
| UBS Securities LLC |
||||
| Pacific Crest Securities, a division of KeyBanc Capital Markets Inc. |
||||
| JMP Securities LLC |
||||
| Total: |
7,150,000 | |||
|
|
|
|||
The underwriters and the representatives are collectively referred to as the “underwriters” and the “representatives,” respectively. The underwriters are offering the shares of Class A common stock subject to their acceptance of the shares from us and subject to prior sale. The underwriting agreement provides that the obligations of the several underwriters to pay for and accept delivery of the shares of Class A common stock offered by this prospectus are subject to the approval of certain legal matters by their counsel and to certain other conditions. The underwriters are obligated to take and pay for all of the shares of Class A common stock offered by this prospectus if any such shares are taken. However, the underwriters are not required to take or pay for the shares covered by the underwriters’ over-allotment option described below.
The underwriters initially propose to offer part of the shares of Class A common stock directly to the public at the offering price listed on the cover page of this prospectus and part to certain dealers. After the initial offering of the shares of common stock, the offering price and other selling terms may from time to time be varied by the representatives.
We have granted to the underwriters an option, exercisable for 30 days from the date of this prospectus, to purchase up to 1,072,500 additional shares of Class A common stock at the public offering price listed on the cover page of this prospectus, less underwriting discounts and commissions. The underwriters may exercise this option solely for the purpose of covering over-allotments, if any, made in connection with the offering of the shares of Class A common stock offered by this prospectus. To the extent the option is exercised, each underwriter will become obligated, subject to certain conditions, to purchase about the same percentage of the additional shares of Class A common stock as the number listed next to the underwriter’s name in the preceding table bears to the total number of shares of common stock listed next to the names of all underwriters in the preceding table.
Certain entities associated with J.P. Morgan Investment Management Inc., one of our existing holders of greater than 5% of our common stock, have indicated an interest in purchasing up to $10.0 million of our Class A common stock in this offering, at the initial public offering price. Because these indications of interest are not binding agreements or commitments to purchase, such entities may elect to purchase fewer shares than they indicate an interest in purchasing or not to purchase any shares in this offering. In addition, the underwriters may elect to sell fewer shares or not to sell any shares in this offering to such entities. The underwriters will receive the same discount from any shares sold to such entities as they will from any other shares sold to the public in this offering. Any shares purchased by such entities will be subject to the applicable lock-up restrictions described in the section titled “Shares Eligible for Future Sale.”
159
Table of Contents
The following table shows the per share and total public offering price, underwriting discounts and commissions, and proceeds before expenses to us. These amounts are shown assuming both no exercise and full exercise of the underwriters’ over-allotment option.
| Total | ||||||||||||
| Per Share | No Exercise | Full Exercise | ||||||||||
| Public offering price |
$ | $ | $ | |||||||||
| Underwriting discounts and commissions to be paid by us |
$ | $ | $ | |||||||||
| Proceeds, before expenses, to us |
$ | $ | $ | |||||||||
The estimated offering expenses payable by us, exclusive of the underwriting discounts and commissions, are approximately $3.8 million. We have also agreed to reimburse the underwriters for certain FINRA-related expenses in an amount up to $30,000.
The underwriters have informed us that they do not intend sales to discretionary accounts to exceed 5% of the total number of shares of Class A common stock offered by them.
Our Class A common stock has been approved for listing on The NASDAQ Global Market under the trading symbol “MB.”
At our request, the underwriters have reserved up to 5% of the Class A common stock being offered by this prospectus for sale at the initial public offering price to certain of our subscribers, vendors and business partners as well as to certain friends and family of our management team. None of our directors or executive officers will participate in the directed share program. The sales will be made by UBS Financial Services Inc., a selected dealer affiliated with UBS Securities LLC, an underwriter of this offering, through a directed share program. If any of these persons purchases $500,000 or greater of our Class A common stock in the directed share program, such shares will be subject to the applicable lock-up restrictions described in the section titled “Shares Eligible for Future Sale.” We do not know if these persons will choose to purchase all or any portion of these reserved shares, but any purchases they do make will reduce the number of shares available to the general public. Any reserved shares not so purchased will be offered by the underwriters to the general public on the same terms as the other shares of Class A common stock.
We and all directors and officers and the holders of substantially all of our outstanding capital stock have agreed that, without the prior written consent of Morgan Stanley & Co. LLC on behalf of the underwriters, we and they will not, during the period ending 180 days after the date of this prospectus (the “restricted period”):
| • | offer, pledge, sell, contract to sell, sell any option or contract to purchase, purchase any option or contract to sell, grant any option, right or warrant to purchase, lend or otherwise transfer or dispose of, directly or indirectly, any shares of our Class A or Class B common stock or any securities convertible into or exercisable or exchangeable for shares of our Class A or Class B common stock; |
| • | file any registration statement with the Securities and Exchange Commission relating to the offering of any shares of our Class A or Class B common stock or any securities convertible into or exercisable or exchangeable for our Class A or Class B common stock; or |
| • | enter into any swap or other arrangement that transfers to another, in whole or in part, any of the economic consequences of ownership of our Class A or Class B common stock; |
whether any such transaction described above is to be settled by delivery of common stock or such other securities, in cash or otherwise. In addition, we and each such person agrees that, without the prior written consent of Morgan Stanley & Co. LLC on behalf of the underwriters, we or such other person will not, during the restricted period, make any demand for, or exercise any right with respect to, the registration of any shares of our Class A or Class B common stock or any security convertible into or exercisable or exchangeable for our Class A or Class B common stock.
160
Table of Contents
The restrictions described in the immediately preceding paragraph do not apply to our directors, officers and other holders of substantially all of our outstanding securities with respect to:
| • | transactions relating to shares of our Class A or Class B common stock or other securities acquired in open market transactions after the completion of this offering; provided that no public reports or filings will be required or voluntarily made in connection with subsequent sales of our Class A or Class B common stock or other securities acquired in such open market transactions; |
| • | transfers of shares of our Class A or Class B common stock or any security convertible into or exercisable or exchangeable for our Class A or Class B common stock (i) by bona fide gift, will or intestacy, (ii) to an immediate family member of the security holder or to a trust formed for the benefit of the security holder or of an immediate family member of the security holder, (iii) if the security holder is a corporation, partnership, limited liability company or other business entity (A) to another corporation, partnership, limited liability company or other business entity that controls, is controlled by or is under common control with the security holder or (B) as part of a disposition, transfer or distribution without consideration by the security holder to its equity holders, or (iv) if the security holder is a trust, to a trustee or beneficiary of the trust; provided that, in the case of any such transfer or distribution, each transferee, donee or distributee (A) shall sign and deliver a lock-up agreement, (B) no public reports or filings reporting a reduction of beneficial ownership of shares of our Class A or Class B common stock will be required or voluntarily made during the restricted period and (C) such transfer shall not involve a disposition for value; |
| • | the receipt by the security holder of shares of our Class A or Class B common stock upon the exercise of stock options pursuant to an employee benefit plan described in this prospectus; provided that such shares of Class A or Class B common stock are subject to the restrictions described above and that no public reports or filings will be required or voluntarily made within 90 days after the date of this prospectus, and after such 90th day, any such public reports or filings shall clearly indicate in the footnotes thereto that (i) the filing relates to an exercise of a stock option, (ii) the shares of our Class A or Class B common stock received upon exercise of the stock option are subject to a lock-up agreement and (iii) no securities were sold by the reporting person; |
| • | the transfer of shares of Class A or Class B common stock or any security convertible into Class A or Class B common stock to the Company upon a vesting event or upon the exercise of options or warrants pursuant to an employee benefit plan or warrant disclosed in this prospectus to satisfy tax withholding obligations of the security holder in connection with the vesting or exercise of such options or warrants; provided no public reports or filings shall be required or voluntarily made; |
| • | the transfer of shares of our Class A or Class B common stock or any security convertible into or exercisable or exchangeable for our Class A or Class B common stock to us pursuant to agreements disclosed in this prospectus under which (i) such securities were issued or (ii) the Company has the option to repurchase such securities or a right of first refusal with respect to transfers of such securities; provided that no public reports or filings will be required or voluntarily made; |
| • | the establishment of a trading plan pursuant to Rule 10b5-1 under the Exchange Act for the transfer of shares of Class A or Class B common stock, provided that (i) such plan does not provide for the transfer of Class A or Class B common stock during the restricted period and (ii) to the extent a public announcement or filing under the Exchange Act, if any, is required or voluntarily made regarding the establishment of such plan, such announcement or filing shall include a statement to the effect that no transfer of Class A or Class B common stock may be made under such plan during the restricted period; |
| • | the conversion or reclassification of the outstanding shares of preferred stock or other classes of common stock into shares of Class A or Class B common stock in connection with this offering; provided that such shares of Class A or Class B common stock remain subject to the terms of the lock-up agreement; or |
161
Table of Contents
| • | the transfer of shares of Class A or Class B common stock or any security convertible into or exercisable or exchangeable for Class A or Class B common stock that occurs solely by operation of law or by order of a court of competent jurisdiction, provided that (i) the transferee signs and delivers a lock-up agreement, (ii) no public announcement shall be voluntarily made during the restricted period and, if the security holder is required to file a report under the Exchange Act during the restricted period, the undersigned shall include a statement in such report to the effect that such transfer was made pursuant to the above described circumstances. |
In order to facilitate the offering of the Class A common stock, the underwriters may engage in transactions that stabilize, maintain or otherwise affect the price of the Class A common stock. Specifically, the underwriters may sell more shares than they are obligated to purchase under the underwriting agreement, creating a short position. A short sale is covered if the short position is no greater than the number of shares available for purchase by the underwriters under the over-allotment option. The underwriters can close out a covered short sale by exercising the over-allotment option or purchasing shares in the open market. In determining the source of shares to close out a covered short sale, the underwriters will consider, among other things, the open market price of shares compared to the price available under the over-allotment option. The underwriters may also sell shares in excess of the over-allotment option, creating a naked short position. The underwriters must close out any naked short position by purchasing shares in the open market. A naked short position is more likely to be created if the underwriters are concerned that there may be downward pressure on the price of the common stock in the open market after pricing that could adversely affect investors who purchase in this offering. As an additional means of facilitating this offering, the underwriters may bid for, and purchase, shares of Class A common stock in the open market to stabilize the price of the Class A common stock. These activities may raise or maintain the market price of the Class A common stock above independent market levels or prevent or retard a decline in the market price of the Class A common stock. The underwriters are not required to engage in these activities and may end any of these activities at any time.
We and the underwriters have agreed to indemnify each other against certain liabilities, including liabilities under the Securities Act.
A prospectus in electronic format may be made available on websites maintained by one or more underwriters, or selling group members, if any, participating in this offering. The representatives may agree to allocate a number of shares of Class A common stock to underwriters for sale to their online brokerage account holders. Internet distributions will be allocated by the representatives to underwriters that may make Internet distributions on the same basis as other allocations.
The underwriters and their respective affiliates are full service financial institutions engaged in various activities, which may include securities trading, commercial and investment banking, financial advisory, investment management, investment research, principal investment, hedging, financing and brokerage activities. Certain of the underwriters and their respective affiliates have, from time to time, performed, and may in the future perform, various financial advisory and investment banking services for us, for which they received or will receive customary fees and expenses.
In addition, in the ordinary course of their various business activities, the underwriters and their respective affiliates make or hold a broad array of investments and actively trade debt and equity securities (or related derivative securities) and financial instruments (including bank loans) for their own account and for the accounts of their customers and may at any time hold long and short positions in such securities and instruments. Such investment and securities activities may involve our securities and instruments. The underwriters and their respective affiliates may also make investment recommendations or publish or express independent research views in respect of such securities or instruments and may at any time hold, or recommend to clients that they acquire, long or short positions in such securities and instruments.
162
Table of Contents
Pricing of the Offering
Prior to this offering, there has been no public market for our Class A common stock. The initial public offering price will be determined by negotiations between us and the representatives. Among the factors considered in determining the initial public offering price were our future prospects and those of our industry in general, our sales, earnings and certain other financial and operating information in recent periods, and the price-earnings ratios, price-sales ratios, market prices of securities, and certain financial and operating information of companies engaged in activities similar to ours.
Selling Restrictions
European Economic Area
In relation to each Member State of the European Economic Area which has implemented the Prospectus Directive, which we refer to as a Relevant Member State, an offer to the public of any shares of our Class A common stock may not be made in that Relevant Member State, except that an offer to the public in that Relevant Member State of any shares of our Class A common stock may be made at any time under the following exemptions under the Prospectus Directive, if they have been implemented in that Relevant Member State:
(a) to any legal entity which is a qualified investor as defined in the Prospectus Directive;
(b) to fewer than 100 or, if the Relevant Member State has implemented the relevant provision of the 2010 PD Amending Directive, 150, natural or legal persons (other than qualified investors as defined in the Prospectus Directive), as permitted under the Prospectus Directive, subject to obtaining the prior consent of the representatives for any such offer; or
(c) in any other circumstances falling within Article 3(2) of the Prospectus Directive, provided that no such offer of shares of our common stock shall result in a requirement for the publication by us or any underwriter of a prospectus pursuant to Article 3 of the Prospectus Directive.
For the purposes of this provision, the expression an “offer to the public” in relation to any shares of our common stock in any Relevant Member State means the communication in any form and by any means of sufficient information on the terms of the offer and any shares of our common stock to be offered so as to enable an investor to decide to purchase any shares of our Class A common stock, as the same may be varied in that Member State by any measure implementing the Prospectus Directive in that Member State, the expression “Prospectus Directive” means Directive 2003/71/EC (and amendments thereto, including the 2010 PD Amending Directive, to the extent implemented in the Relevant Member State), and includes any relevant implementing measure in the Relevant Member State, and the expression “2010 PD Amending Directive” means Directive 2010/73/EU.
United Kingdom
Each underwriter has represented and agreed that:
(a) it has only communicated or caused to be communicated and will only communicate or cause to be communicated an invitation or inducement to engage in investment activity (within the meaning of Section 21 of the FSMA) received by it in connection with the issue or sale of the shares of our Class A common stock in circumstances in which Section 21(1) of the FSMA does not apply to us; and
(b) it has complied and will comply with all applicable provisions of the FSMA with respect to anything done by it in relation to the shares of our common stock in, from or otherwise involving the United Kingdom.
163
Table of Contents
Hong Kong
The shares may not be offered or sold by means of any document other than (i) in circumstances which do not constitute an offer to the public within the meaning of the Companies Ordinance (Cap.32, Laws of Hong Kong), or (ii) to “professional investors” within the meaning of the Securities and Futures Ordinance (Cap.571, Laws of Hong Kong) and any rules made thereunder, or (iii) in other circumstances which do not result in the document being a “prospectus” within the meaning of the Companies Ordinance (Cap.32, Laws of Hong Kong), and no advertisement, invitation, or document relating to the shares may be issued or may be in the possession of any person for the purpose of issue (in each case whether in Hong Kong or elsewhere), which is directed at, or the contents of which are likely to be accessed or read by, the public in Hong Kong (except if permitted to do so under the laws of Hong Kong) other than with respect to shares which are or are intended to be disposed of only to persons outside Hong Kong or only to “professional investors” within the meaning of the Securities and Futures Ordinance (Cap. 571, Laws of Hong Kong) and any rules made thereunder.
Singapore
This prospectus has not been registered as a prospectus with the Monetary Authority of Singapore. Accordingly, this prospectus and any other document or material in connection with the offer or sale, or invitation for subscription or purchase, of the shares may not be circulated or distributed, nor may the shares be offered or sold, or be made the subject of an invitation for subscription or purchase, whether directly or indirectly, to persons in Singapore other than (i) to an institutional investor under Section 274 of the Securities and Futures Act, Chapter 289 of Singapore, or the SFA, (ii) to a relevant person, or any person pursuant to Section 275(1A), and in accordance with the conditions, specified in Section 275 of the SFA, or (iii) otherwise pursuant to, and in accordance with the conditions of, any other applicable provision of the SFA.
Where the shares are subscribed or purchased under Section 275 by a relevant person which is: (a) a corporation (which is not an accredited investor) the sole business of which is to hold investments and the entire share capital of which is owned by one or more individuals, each of whom is an accredited investor; or (b) a trust (where the trustee is not an accredited investor) whose sole purpose is to hold investments and each beneficiary is an accredited investor, shares, debentures and units of shares, and debentures of that corporation, or the beneficiaries’ rights and interest in that trust shall not be transferable for six months after that corporation or that trust has acquired the shares under Section 275 except: (1) to an institutional investor under Section 274 of the SFA or to a relevant person, or any person pursuant to Section 275(1A), and in accordance with the conditions, specified in Section 275 of the SFA; (2) where no consideration is given for the transfer; or (3) by operation of law.
Japan
The securities have not been and will not be registered under the Financial Instruments and Exchange Law of Japan (the Financial Instruments and Exchange Law) and each underwriter has agreed that it will not offer or sell any securities, directly or indirectly, in Japan or to, or for the benefit of, any resident of Japan (which term as used herein means any person resident in Japan, including any corporation or other entity organized under the laws of Japan), or to others for re-offering or resale, directly or indirectly, in Japan or to a resident of Japan, except pursuant to an exemption from the registration requirements of, and otherwise in compliance with, the Financial Instruments and Exchange Law and any other applicable laws, regulations and ministerial guidelines of Japan.
Switzerland
The shares may not be publicly offered in Switzerland and will not be listed on the SIX Swiss Exchange, or SIX, or on any other stock exchange or regulated trading facility in Switzerland. This document has been prepared without regard to the disclosure standards for issuance prospectuses under art. 652a or art. 1156 of the Swiss Code of Obligations or the disclosure standards for listing prospectuses under art. 27 ff. of the SIX Listing Rules or the listing rules of any other stock exchange or regulated trading facility in Switzerland. Neither this
164
Table of Contents
document nor any other offering or marketing material relating to the shares or the offering may be publicly distributed or otherwise made publicly available in Switzerland.
Neither this document nor any other offering or marketing material relating to the offering, the company, or the shares have been or will be filed with or approved by any Swiss regulatory authority. In particular, this document will not be filed with, and the offer of shares will not be supervised by, the Swiss Financial Market Supervisory Authority FINMA, and the offer of shares has not been and will not be authorized under the Swiss Federal Act on Collective Investment Schemes, or CISA. The investor protection afforded to acquirers of interests in collective investment schemes under the CISA does not extend to acquirers of the shares.
Dubai International Financial Centre
This prospectus relates to an Exempt Offer in accordance with the Offered Securities Rules of the Dubai Financial Services Authority, or DFSA. This prospectus is intended for distribution only to persons of a type specified in the Offered Securities Rules of the DFSA. It must not be delivered to, or relied on by, any other person. The DFSA has no responsibility for reviewing or verifying any documents in connection with Exempt Offers. The DFSA has not approved this prospectus nor taken steps to verify the information set forth herein and has no responsibility for the prospectus. The shares to which this prospectus relates may be illiquid and/or subject to restrictions on their resale. Prospective purchasers of the shares offered should conduct their own due diligence on the shares. If you do not understand the contents of this prospectus you should consult an authorized financial advisor.
165
Table of Contents
Wilson Sonsini Goodrich & Rosati, P.C., Palo Alto, California, which has acted as our counsel in connection with this offering, will pass upon the validity of the shares of our Class A common stock being offered by this prospectus. The underwriters have been represented by Cooley LLP, Santa Monica, California.
The consolidated financial statements of MINDBODY, Inc. as of December 31, 2013 and 2014 and for each of the three years in the period ended December 31, 2014 included in this prospectus have been audited by Deloitte & Touche LLP, an independent registered public accounting firm, as stated in their report appearing herein. Such financial statements are included in reliance upon the report of such firm given upon their authority as experts in accounting and auditing.
WHERE YOU CAN FIND ADDITIONAL INFORMATION
We have filed with the SEC a registration statement on Form S-1 under the Securities Act with respect to the shares of our common stock offered by this prospectus. This prospectus, which constitutes a part of the registration statement, does not contain all of the information set forth in the registration statement, some of which is contained in exhibits to the registration statement as permitted by the rules and regulations of the SEC. For further information with respect to us and our common stock, we refer you to the registration statement, including the exhibits filed as a part of the registration statement. Statements contained in this prospectus concerning the contents of any contract or any other document is not necessarily complete. If a contract or document has been filed as an exhibit to the registration statement, please see the copy of the contract or document that has been filed. Each statement is this prospectus relating to a contract or document filed as an exhibit is qualified in all respects by the filed exhibit. You may obtain copies of this information by mail from the Public Reference Section of the SEC, 100 F Street, N.E., Room 1580, Washington, D.C. 20549, at prescribed rates. You may obtain information on the operation of the public reference rooms by calling the SEC at 1-800-SEC-0330. The SEC also maintains an Internet website that contains reports, proxy statements and other information about issuers, like us, that file electronically with the SEC. The address of that website is www.sec.gov.
As a result of this offering, we will become subject to the information and reporting requirements of the Exchange Act and, in accordance with this law, will file periodic reports, proxy statements and other information with the SEC. These periodic reports, proxy statements and other information will be available for inspection and copying at the SEC’s public reference facilities and the website of the SEC referred to above. We also maintain a website at www.mindbodyonline.com. Upon completion of this offering, you may access these materials free of charge as soon as reasonably practicable after they are electronically filed with, or furnished to, the SEC. Information contained on our website is not a part of this prospectus and the inclusion of our website address in this prospectus is an inactive textual reference only.
166
Table of Contents
MINDBODY, INC.
INDEX TO CONSOLIDATED FINANCIAL STATEMENTS
| Page | ||||
| F-2 | ||||
| F-3 | ||||
| F-4 | ||||
| F-5 | ||||
| Consolidated Statements of Redeemable Convertible Preferred Stock and Stockholders’ Deficit |
F-6 | |||
| F-7 | ||||
| F-8 | ||||
F-1
Table of Contents
REPORT OF INDEPENDENT REGISTERED PUBLIC ACCOUNTING FIRM
To the Board of Directors and Stockholders of
MINDBODY, Inc.
San Luis Obispo, California
We have audited the accompanying consolidated balance sheets of MINDBODY, Inc. and subsidiaries (the “Company”) as of December 31, 2013 and 2014, and the related consolidated statements of operations, comprehensive loss, redeemable convertible preferred stock and stockholders’ deficit, and cash flows for each of the three years in the period ended December 31, 2014. These financial statements are the responsibility of the Company’s management. Our responsibility is to express an opinion on these financial statements based on our audits.
We conducted our audits in accordance with the standards of the Public Company Accounting Oversight Board (United States). Those standards require that we plan and perform the audit to obtain reasonable assurance about whether the financial statements are free of material misstatement. The Company is not required to have, nor were we engaged to perform, an audit of its internal control over financial reporting. Our audits included consideration of internal control over financial reporting as a basis for designing audit procedures that are appropriate in the circumstances, but not for the purpose of expressing an opinion on the effectiveness of the Company’s internal control over financial reporting. Accordingly, we express no such opinion. An audit also includes examining, on a test basis, evidence supporting the amounts and disclosures in the financial statements, assessing the accounting principles used and significant estimates made by management, as well as evaluating the overall financial statement presentation. We believe that our audits provide a reasonable basis for our opinion.
In our opinion, such consolidated financial statements present fairly, in all material respects, the financial position of the Company as of December 31, 2013 and 2014, and the results of its operations and its cash flows for each of the three years in the period ended December 31, 2014, in conformity with accounting principles generally accepted in the United States of America.
/s/ DELOITTE & TOUCHE LLP
San Jose, California
March 26, 2015 (June 5, 2015 as to Note 17)
F-2
Table of Contents
MINDBODY, INC.
(in thousands, except share and per share data)
| December 31, | March 31, 2015 |
Pro Forma as of March 31, 2015 |
||||||||||||||
| 2013 | 2014 | |||||||||||||||
| (unaudited) | ||||||||||||||||
| ASSETS |
||||||||||||||||
| Current assets: |
||||||||||||||||
| Cash and cash equivalents |
$ | 9,545 | $ | 34,675 | $ | 22,099 | ||||||||||
| Accounts receivable, net of allowance for doubtful accounts of $90, $79 and $128 as of December 31, 2013 and 2014 and March 31, 2015 |
2,553 | 3,193 | 4,015 | |||||||||||||
| Prepaid expenses and other current assets |
1,157 | 2,562 | 3,107 | |||||||||||||
|
|
|
|
|
|
|
|||||||||||
| Total current assets |
13,255 | 40,430 | 29,221 | |||||||||||||
| Restricted cash |
2,533 | 772 | — | |||||||||||||
| Property and equipment, net |
12,161 | 28,568 | 32,487 | |||||||||||||
| Intangible assets, net |
665 | 60 | 873 | |||||||||||||
| Goodwill |
1,827 | 1,827 | 5,396 | |||||||||||||
| Other noncurrent assets |
294 | 1,394 | 3,100 | |||||||||||||
|
|
|
|
|
|
|
|||||||||||
| TOTAL ASSETS |
$ | 30,735 | $ | 73,051 | $ | 71,077 | ||||||||||
|
|
|
|
|
|
|
|||||||||||
| LIABILITIES, REDEEMABLE CONVERTIBLE PREFERRED STOCK, AND STOCKHOLDERS’ EQUITY (DEFICIT) |
||||||||||||||||
| Current liabilities: |
||||||||||||||||
| Accounts payable |
$ | 3,237 | $ | 5,406 | $ | 6,268 | ||||||||||
| Accrued expenses and other liabilities |
3,602 | 5,219 | 5,873 | |||||||||||||
| Deferred revenue, current portion |
1,728 | 2,396 | 2,493 | |||||||||||||
| Contingent consideration related to acquisition, current portion |
771 | 11 | 11 | |||||||||||||
| Other current liabilities |
558 | 436 | 434 | |||||||||||||
|
|
|
|
|
|
|
|||||||||||
| Total current liabilities |
9,896 | 13,468 | 15,079 | |||||||||||||
| Deferred rent, noncurrent portion |
638 | 988 | 1,108 | |||||||||||||
| Contingent consideration related to acquisition, noncurrent portion |
1,236 | — | — | |||||||||||||
| Financing obligation on leases, noncurrent portion |
3,659 | 15,496 | 16,790 | |||||||||||||
| Preferred stock warrant |
905 | 1,188 | 1,338 | — | ||||||||||||
| Other noncurrent liabilities |
292 | 388 | 431 | |||||||||||||
|
|
|
|
|
|
|
|
|
|||||||||
| Total liabilities |
16,626 | 31,528 | 34,746 | 33,408 | ||||||||||||
|
|
|
|
|
|
|
|
|
|||||||||
| Commitments and contingencies (Note 7) |
||||||||||||||||
| Redeemable convertible preferred stock, par value of $0.000004 per share, issuable in Series A, B, C, D, E, F, and G; 16,849,327, 20,542,012 and 20,542,012 shares authorized as of December 31, 2013 and 2014 and March 31, 2015 (unaudited); 16,761,805, 20,454,489 and 20,454,489 shares issued and outstanding as of December 31, 2013 and 2014 and March 31, 2015 (unaudited); aggregate liquidation preference of $60,836, $117,636 and $119,394 as of December 31, 2013 and 2014 and March 31, 2015 (unaudited), actual; no shares issued and outstanding, pro forma (unaudited) |
95,224 | 166,448 | 170,159 | — | ||||||||||||
| Stockholders’ equity (deficit): |
||||||||||||||||
| Common stock, par value of $0.000004 per share; 50,000,000 shares authorized as of December 31, 2013 and 2014 and March 31, 2015 (unaudited); 11,154,388, 11,189,360 and 11,293,864 shares issued and outstanding as of December 31, 2013 and 2014 and March 31, 2015 (unaudited), actual; no shares issued and outstanding, pro forma (unaudited) |
— | — | — | |||||||||||||
| Class B common stock, par value of $0.000004 per share; no shares authorized, issued and outstanding as of December 31, 2013 and 2014 and March 31, 2015 (unaudited), actual; 31,967,544 shares issued and outstanding, pro forma (unaudited) |
— | — | — | |||||||||||||
| Additional paid-in capital |
— | — | — | 171,497 | ||||||||||||
| Accumulated other comprehensive loss |
(66 | ) | (132 | ) | (194 | ) | (194 | ) | ||||||||
| Accumulated deficit |
(81,049 | ) | (124,793 | ) | (133,634 | ) | (133,634 | ) | ||||||||
|
|
|
|
|
|
|
|
|
|||||||||
| Total stockholders’ equity (deficit) |
(81,115 | ) | (124,925 | ) | (133,828 | ) | 37,669 | |||||||||
|
|
|
|
|
|
|
|
|
|||||||||
| TOTAL LIABILITIES, REDEEMABLE CONVERTIBLE PREFERRED STOCK, AND STOCKHOLDERS’ EQUITY (DEFICIT) |
$ | 30,735 | $ | 73,051 | $ | 71,077 | $ | 71,077 | ||||||||
|
|
|
|
|
|
|
|
|
|||||||||
The accompanying notes are an integral part of these consolidated financial statements.
F-3
Table of Contents
MINDBODY, INC.
Consolidated Statements of Operations
(in thousands, except share and per share data)
| Year Ended December 31, | Three Months Ended March 31, |
|||||||||||||||||||
| 2012 | 2013 | 2014 | 2014 | 2015 | ||||||||||||||||
| (unaudited) | ||||||||||||||||||||
| Revenue |
$ | 31,999 | $ | 48,687 | $ | 70,010 | $ | 15,653 | $ | 22,263 | ||||||||||
| Cost of revenue |
13,411 | 21,890 | 30,004 | 6,478 | 8,693 | |||||||||||||||
|
|
|
|
|
|
|
|
|
|
|
|||||||||||
| Gross profit |
18,588 | 26,797 | 40,006 | 9,175 | 13,570 | |||||||||||||||
|
|
|
|
|
|
|
|
|
|
|
|||||||||||
| Operating expenses: |
||||||||||||||||||||
| Sales and marketing |
11,735 | 20,957 | 30,922 | 7,247 | 9,717 | |||||||||||||||
| Research and development |
3,741 | 10,517 | 16,167 | 3,594 | 4,725 | |||||||||||||||
| General and administrative |
8,111 | 10,730 | 18,422 | 3,530 | 6,780 | |||||||||||||||
| Change in fair value of contingent consideration |
— | 428 | (1,434 | ) | (423 | ) | — | |||||||||||||
|
|
|
|
|
|
|
|
|
|
|
|||||||||||
| Total operating expenses |
23,587 | 42,632 | 64,077 | 13,948 | 21,222 | |||||||||||||||
|
|
|
|
|
|
|
|
|
|
|
|||||||||||
| Loss from operations |
(4,999 | ) | (15,835 | ) | (24,071 | ) | (4,773 | ) | (7,652 | ) | ||||||||||
| Change in fair value of preferred stock warrant |
(515 | ) | (302 | ) | (283 | ) | (22 | ) | (150 | ) | ||||||||||
| Interest income |
6 | — | — | — | 3 | |||||||||||||||
| Interest expense |
(15 | ) | (21 | ) | (68 | ) | (20 | ) | (17 | ) | ||||||||||
| Other income (expense), net |
17 | (26 | ) | (68 | ) | 5 | (39 | ) | ||||||||||||
|
|
|
|
|
|
|
|
|
|
|
|||||||||||
| Loss before provision for income taxes |
(5,506 | ) | (16,184 | ) | (24,490 | ) | (4,810 | ) | (7,855 | ) | ||||||||||
| Provision for income taxes |
13 | 63 | 116 | 34 | 6 | |||||||||||||||
|
|
|
|
|
|
|
|
|
|
|
|||||||||||
| Net loss |
(5,519 | ) | (16,247 | ) | (24,606 | ) | (4,844 | ) | (7,861 | ) | ||||||||||
| Accretion of redeemable convertible preferred stock |
(13,025 | ) | (27,892 | ) | (21,311 | ) | (5,831 | ) | (5,459 | ) | ||||||||||
| Deemed dividend—preferred stock modification |
— | — | — | — | 1,748 | |||||||||||||||
|
|
|
|
|
|
|
|
|
|
|
|||||||||||
| Net loss attributable to common stockholders |
$ | (18,544 | ) | $ | (44,139 | ) | $ | (45,917 | ) | $ | (10,675 | ) | $ | (11,572 | ) | |||||
|
|
|
|
|
|
|
|
|
|
|
|||||||||||
| Net loss per share attributable to common stockholders, basic and diluted |
$ | (1.84 | ) | $ | (4.10 | ) | $ | (4.17 | ) | $ |
(0.97 |
) |
$ | (1.03 | ) | |||||
|
|
|
|
|
|
|
|
|
|
|
|||||||||||
| Weighted-average shares used to compute net loss per share attributable to common stockholders, basic and diluted |
10,102,216 | 10,757,938 | 11,013,658 | 10,968,167 | 11,201,755 | |||||||||||||||
|
|
|
|
|
|
|
|
|
|
|
|||||||||||
| Pro forma net loss per share attributable to common stockholders, basic and diluted (unaudited) |
$ | (0.78 | ) | $ | (0.24 | ) | ||||||||||||||
|
|
|
|
|
|||||||||||||||||
| Weighted-average shares used to compute pro forma net loss per share attributable to common stockholders, basic and diluted (unaudited) |
31,282,660 | 31,875,435 | ||||||||||||||||||
|
|
|
|
|
|||||||||||||||||
The accompanying notes are an integral part of these consolidated financial statements.
F-4
Table of Contents
MINDBODY, INC.
Consolidated Statements of Comprehensive Loss
(in thousands)
| Year Ended December 31, | Three Months Ended March 31, |
|||||||||||||||||||
| 2012 | 2013 | 2014 | 2014 | 2015 | ||||||||||||||||
| (unaudited) | ||||||||||||||||||||
| Net loss |
$ | (5,519 | ) | $ | (16,247 | ) | $ | (24,606 | ) | $ | (4,844 | ) | $ | (7,861 | ) | |||||
| Other comprehensive loss, net of taxes: |
||||||||||||||||||||
| Change in cumulative translation adjustment |
(23 | ) | (43 | ) | (66 | ) | 10 | (62 | ) | |||||||||||
|
|
|
|
|
|
|
|
|
|
|
|||||||||||
| Comprehensive loss |
$ | (5,542 | ) | (16,290 | ) | $ | (24,672 | ) | $ | (4,834 | ) | $ | (7,923 | ) | ||||||
|
|
|
|
|
|
|
|
|
|
|
|||||||||||
The accompanying notes are an integral part of these consolidated financial statements.
F-5
Table of Contents
Consolidated Statements of Redeemable Convertible Preferred Stock and Stockholders’ Deficit
(in thousands, except share data)
| Redeemable Convertible Preferred Stock |
Common Stock | Additional Paid-In Capital |
Notes Receivable from Stockholder |
Accumulated Other Comprehensive Loss |
Accumulated Deficit |
Total Stockholder’s Deficit |
||||||||||||||||||||||||||||||
| Shares | Amount | Shares | Amount | |||||||||||||||||||||||||||||||||
| Balance as of December 31, 2011 |
14,075,808 | $ | 29,392 | 10,688,978 | $ | — | $ | — | $ | (300 | ) | $ | — | $ | (24,170 | ) | $ | (24,470 | ) | |||||||||||||||||
| Cumulative effect of change in accounting principle (Note 1) |
— | 109 | — | — | — | — | — | 2,716 | 2,716 | |||||||||||||||||||||||||||
|
|
|
|
|
|
|
|
|
|
|
|
|
|
|
|
|
|
|
|||||||||||||||||||
| Balance as of January 1, 2012 |
14,075,808 | 29,501 | 10,688,978 | — | — | (300 | ) | — | (21,454 | ) | (21,754 | ) | ||||||||||||||||||||||||
| Issuance of Series F redeemable convertible preferred stock (net of issuance cost of $194) |
2,685,997 | 24,806 | — | — | — | — | — | — | — | |||||||||||||||||||||||||||
| Repurchases of common stock from employees |
— | — | (38,257 | ) | — | (30 | ) | — | — | — | (30 | ) | ||||||||||||||||||||||||
| Reclassification of restricted stock award liability to common stock |
— | — | — | — | 113 | — | — | — | 113 | |||||||||||||||||||||||||||
| Accretion of redeemable convertible preferred stock to redemption value |
— | 13,025 | — | — | (1,761 | ) | — | — | (11,264 | ) | (13,025 | ) | ||||||||||||||||||||||||
| Stock-based compensation expense |
— | — | — | — | 1,484 | — | — | — | 1,484 | |||||||||||||||||||||||||||
| Exercise of common stock warrants |
— | — | 55,785 | — | — | — | — | — | — | |||||||||||||||||||||||||||
| Exercise of stock options |
— | — | 357,724 | — | 194 | — | — | — | 194 | |||||||||||||||||||||||||||
| Collection of notes receivable from stockholder |
— | — | — | — | — | 300 | — | — | 300 | |||||||||||||||||||||||||||
| Foreign currency translation adjustment |
— | — | — | — | — | — | (23 | ) | — | (23 | ) | |||||||||||||||||||||||||
| Net loss |
— | — | — | — | — | — | — | (5,519 | ) | (5,519 | ) | |||||||||||||||||||||||||
|
|
|
|
|
|
|
|
|
|
|
|
|
|
|
|
|
|
|
|||||||||||||||||||
| Balance as of December 31, 2012 |
16,761,805 | 67,332 | 11,064,230 | — | — | — | (23 | ) | (38,237 | ) | (38,260 | ) | ||||||||||||||||||||||||
| Repurchases of common stock from employees |
— | — | (7,007 | ) | — | (7 | ) | — | — | — | (7 | ) | ||||||||||||||||||||||||
| Reclassification of restricted stock award liability to common stock |
— | — | — | — | 100 | — | — | — | 100 | |||||||||||||||||||||||||||
| Accretion of redeemable convertible preferred stock to redemption value |
— | 27,892 | — | — | (1,327 | ) | — | — | (26,565 | ) | (27,892 | ) | ||||||||||||||||||||||||
| Stock-based compensation expense |
— | — | — | — | 427 | — | — | — | 427 | |||||||||||||||||||||||||||
| Issuance of common stock for business acquisition |
— | — | 93,190 | — | 782 | — | — | — | 782 | |||||||||||||||||||||||||||
| Payment for services in common stock |
— | — | 2,905 | — | 24 | — | — | — | 24 | |||||||||||||||||||||||||||
| Exercise of stock options |
— | — | 1,070 | — | 1 | — | — | — | 1 | |||||||||||||||||||||||||||
| Foreign currency translation adjustment |
— | — | — | — | — | — | (43 | ) | — | (43 | ) | |||||||||||||||||||||||||
| Net loss |
— | — | — | — | — | — | — | (16,247 | ) | (16,247 | ) | |||||||||||||||||||||||||
|
|
|
|
|
|
|
|
|
|
|
|
|
|
|
|
|
|
|
|||||||||||||||||||
| Balance as of December 31, 2013 |
16,761,805 | 95,224 | 11,154,388 | — | — | — | (66 | ) | (81,049 | ) | (81,115 | ) | ||||||||||||||||||||||||
| Issuance of Series G redeemable convertible preferred stock (net of issuance cost of $130) |
3,692,684 | 49,913 | — | — | — | — | — | — | — | |||||||||||||||||||||||||||
| Issuance of common stock for contingent consideration payment |
— | — | 29,900 | — | 322 | — | — | — | 322 | |||||||||||||||||||||||||||
| Reclassification of restricted stock award liability to common stock |
— | — | — | — | 102 | — | — | — | 102 | |||||||||||||||||||||||||||
| Accretion of redeemable convertible preferred stock to redemption value |
— | 21,311 | — | — | (2,173 | ) | — | — | (19,138 | ) | (21,311 | ) | ||||||||||||||||||||||||
| Stock-based compensation expense |
— | — | — | — | 1,737 | — | — | — | 1,737 | |||||||||||||||||||||||||||
| Repurchases of common stock from employees |
— | — | (2,000 | ) | — | (1 | ) | — | — | — | (1 | ) | ||||||||||||||||||||||||
| Exercise of stock options |
— | — | 7,072 | — | 13 | — | — | — | 13 | |||||||||||||||||||||||||||
| Foreign currency translation adjustment |
— | — | — | — | — | — | (66 | ) | — | (66 | ) | |||||||||||||||||||||||||
| Net loss |
— | — | — | — | — | — | — | (24,606 | ) | (24,606 | ) | |||||||||||||||||||||||||
|
|
|
|
|
|
|
|
|
|
|
|
|
|
|
|
|
|
|
|||||||||||||||||||
| Balance as of December 31, 2014 |
20,454,489 | $ | 166,448 | 11,189,360 | $ | — | $ | — | $ | — | $ | (132 | ) | $ | (124,793 | ) | $ | (124,925 | ) | |||||||||||||||||
| Reclassification of restricted stock award liability to common stock (unaudited) |
— | — | — | — | 88 | — | — | — | 88 | |||||||||||||||||||||||||||
| Deemed dividend—preferred stock modification (Note 9) (unaudited) |
— | (1,748 | ) | — | — | — | — | — | 1,748 | 1,748 | ||||||||||||||||||||||||||
| Accretion of redeemable convertible preferred stock to redemption value (unaudited) |
— | 5,459 | — | — | (2,731 | ) | — | — | (2,728 | ) | (5,459 | ) | ||||||||||||||||||||||||
| Stock-based compensation expense (unaudited) |
— | — | — | — | 1,140 | — | — | — | 1,140 | |||||||||||||||||||||||||||
| Exercise of stock options (unaudited) |
— | — | 887 | — | 3 | — | — | — | 3 | |||||||||||||||||||||||||||
| Issuance of stock for business acquisition (unaudited) |
— | — | 103,617 | — | 1,500 | — | — | — | 1,500 | |||||||||||||||||||||||||||
| Foreign currency translation adjustment (unaudited) |
— | — | — | — | — | — | (62 | ) | — | (62 | ) | |||||||||||||||||||||||||
| Net loss (unaudited) |
— | — | — | — | — | — | — | (7,861 | ) | (7,861 | ) | |||||||||||||||||||||||||
|
|
|
|
|
|
|
|
|
|
|
|
|
|
|
|
|
|
|
|||||||||||||||||||
| Balance as of March 31, 2015 (unaudited) |
20,454,489 | $ | 170,159 | 11,293,864 | $ | — | $ | — | $ | — | $ | (194 | ) | $ | (133,634 | ) | $ | (133,828 | ) | |||||||||||||||||
|
|
|
|
|
|
|
|
|
|
|
|
|
|
|
|
|
|
|
|||||||||||||||||||
The accompanying notes are an integral part of these consolidated financial statements.
F-6
Table of Contents
MINDBODY, INC.
Consolidated Statements of Cash Flows
(in thousands)
| Year Ended December 31, | Three Months Ended March 31, |
|||||||||||||||||||
| 2012 | 2013 | 2014 | 2014 | 2015 | ||||||||||||||||
| (unaudited) | ||||||||||||||||||||
| CASH FLOWS FROM OPERATING ACTIVITIES: |
||||||||||||||||||||
| Net loss |
$ | (5,519 | ) | $ | (16,247 | ) | $ | (24,606 | ) | $ | (4,844 | ) | $ | (7,861 | ) | |||||
| Adjustments to reconcile net loss to net cash used in operating activities: |
||||||||||||||||||||
| Depreciation and amortization |
1,004 | 3,479 | 4,574 | 1,034 | 1,218 | |||||||||||||||
| Stock-based compensation expense |
1,484 | 427 | 1,737 | 336 | 1,140 | |||||||||||||||
| Change in fair value of preferred stock warrant |
515 | 302 | 283 | 22 | 150 | |||||||||||||||
| Change in fair value of contingent consideration |
— | 428 | (1,434 | ) | (422 | ) | — | |||||||||||||
| Impairment of technology |
— | — | 426 | — | — | |||||||||||||||
| Other |
20 | 172 | 473 | 138 | 162 | |||||||||||||||
| Changes in operating assets and liabilities net of effects of the acquisitions: |
||||||||||||||||||||
| Accounts receivable |
(540 | ) | (1,560 | ) | (1,122 | ) | (186 | ) | (969 | ) | ||||||||||
| Prepaid expenses and other current assets |
(2,176 | ) | 1,781 | (1,405 | ) | (628 | ) | (545 | ) | |||||||||||
| Other assets |
(36 | ) | (85 | ) | (99 | ) | (114 | ) | 18 | |||||||||||
| Accounts payable |
1,164 | 1,370 | 2,081 | 75 | 202 | |||||||||||||||
| Accrued expenses and other current liabilities |
1,211 | 933 | 146 | 654 | (276 | ) | ||||||||||||||
| Deferred revenue |
507 | 662 | 668 | 163 | 97 | |||||||||||||||
| Deferred rent |
453 | 110 | 350 | 91 | 120 | |||||||||||||||
|
|
|
|
|
|
|
|
|
|
|
|||||||||||
| Net cash used in operating activities |
(1,913 | ) | (8,228 | ) | (17,928 | ) | (3,681 | ) | (6,544 | ) | ||||||||||
|
|
|
|
|
|
|
|
|
|
|
|||||||||||
| CASH FLOWS FROM INVESTING ACTIVITIES: |
||||||||||||||||||||
| Purchase of property and equipment |
(5,031 | ) | (5,125 | ) | (7,311 | ) | (966 | ) | (3,396 | ) | ||||||||||
| Disposal of property and equipment |
— | — | 20 | — | — | |||||||||||||||
| Change in restricted cash and deposits |
— | (2,633 | ) | 1,623 | 121 | 780 | ||||||||||||||
| Acquisition of business |
— | (250 | ) | — | — | (3,000 | ) | |||||||||||||
|
|
|
|
|
|
|
|
|
|
|
|||||||||||
| Net cash used in investing activities |
(5,031 | ) | (8,008 | ) | (5,668 | ) | (845 | ) | (5,616 | ) | ||||||||||
|
|
|
|
|
|
|
|
|
|
|
|||||||||||
| CASH FLOWS FROM FINANCING ACTIVITIES: |
||||||||||||||||||||
| Repayment on financing and capital lease obligations |
— | (42 | ) | (239 | ) | (85 | ) | (10 | ) | |||||||||||
| Proceeds from bank term loan |
1,648 | — | — | — | — | |||||||||||||||
| Repayment of bank term loan |
(1,648 | ) | — | — | — | — | ||||||||||||||
| Payment of deferred offering cost |
— | — | (644 | ) | — | (263 | ) | |||||||||||||
| Proceeds from issuance of redeemable convertible preferred stock, net |
24,806 | — | 49,913 | 49,913 | — | |||||||||||||||
| Payments on contingent consideration |
— | — | (240 | ) | — | — | ||||||||||||||
| Net proceeds from employee stock-based transactions |
164 | (6 | ) | 12 | 6 | 3 | ||||||||||||||
| Collection of notes receivable from stockholder |
300 | — | — | — | — | |||||||||||||||
| Payments of debt issuance cost |
— | — | — | — | (73 | ) | ||||||||||||||
|
|
|
|
|
|
|
|
|
|
|
|||||||||||
| Net cash provided by (used in) financing activities |
25,270 | (48 | ) | 48,802 | 49,834 | (343 | ) | |||||||||||||
|
|
|
|
|
|
|
|
|
|
|
|||||||||||
| Effect of exchange rate changes on cash and cash equivalents |
(23 | ) | (43 | ) | (76 | ) | 10 | (73 | ) | |||||||||||
| NET INCREASE (DECREASE) IN CASH AND CASH EQUIVALENTS |
18,303 | (16,327 | ) | 25,130 | 45,318 | (12,576 | ) | |||||||||||||
| CASH AND CASH EQUIVALENTS, BEGINNING OF PERIOD |
7,569 | 25,872 | 9,545 | 9,545 | 34,675 | |||||||||||||||
|
|
|
|
|
|
|
|
|
|
|
|||||||||||
| CASH AND CASH EQUIVALENTS, END OF PERIOD |
$ | 25,872 | $ | 9,545 | $ | 34,675 | $ | 54,863 | $ | 22,099 | ||||||||||
|
|
|
|
|
|
|
|
|
|
|
|||||||||||
| SUPPLEMENTAL DISCLOSURE OF CASH FLOW INFORMATION: |
||||||||||||||||||||
| Cash paid for income taxes |
$ | — | $ | 28 | $ | 47 | $ | — | $ | 7 | ||||||||||
| Cash paid for interest |
$ | 15 | $ | 11 | $ | 15 | $ | — | $ | 12 | ||||||||||
| SUPPLEMENTAL DISCLOSURE OF NONCASH INVESTING AND FINANCING ACTIVITIES: |
||||||||||||||||||||
| Accretion of redeemable convertible preferred stock to redemption value |
$ | 13,025 | $ | 27,892 | $ | 21,311 | $ | 5,831 | $ | 5,459 | ||||||||||
| Deemed dividend—preferred stock modification |
$ | — | $ | — | $ | — | $ | — | $ | 1,748 | ||||||||||
| Unpaid equipment purchases |
$ | 10 | $ | 469 | $ | 1,939 | $ | 279 | $ | 2,208 | ||||||||||
| Reclassification of restricted stock award liability to common stock |
$ | 113 | $ | 100 | $ | 102 | $ | 8 | $ | 88 | ||||||||||
| Property and equipment acquired with financing obligations and leases |
$ | — | $ | 3,914 | $ | 12,021 | $ | 3,281 | $ | 1,358 | ||||||||||
| Initial fair value of contingent consideration at acquisition date |
$ | — | $ | 1,579 | $ | — | $ | — | $ | — | ||||||||||
| Stock issued in business acquisition |
$ | — | $ | 782 | $ | — | $ | — | $ | 1,500 | ||||||||||
| Unpaid deferred offering cost |
$ | — | $ | — | $ | 219 | $ | — | $ | 1,549 | ||||||||||
| Payment of contingent consideration in common stock |
$ | — | $ | — | $ | 322 | $ | — | $ | — | ||||||||||
The accompanying notes are an integral part of these consolidated financial statements.
F-7
Table of Contents
1. SUMMARY OF BUSINESS AND SIGNIFICANT ACCOUNTING POLICIES
Description of Business
MINDBODY, Inc. (MINDBODY or the Company) was incorporated in California in 2004 and reincorporated in Delaware in March 2015. MINDBODY is headquartered in San Luis Obispo, California and has operations in California, New York, London, and Australia. MINDBODY is a provider of an integrated cloud-based business management software and payments platform for the wellness services industry. MINDBODY enables its consumers to evaluate, connect, and transact with local businesses in its marketplace.
The Company reincorporated in Delaware in March 2015. As a result, and as required as a Delaware corporation, the Company’s common and redeemable convertible preferred stock now have a par value of $0.000004 per share. The carrying value of the outstanding shares of redeemable convertible preferred stock and common stock have been adjusted within these financial statements, on a retroactive basis, to reflect the reincorporation.
Basis of Presentation and Consolidation
The consolidated financial statements are presented in accordance with United States generally accepted accounting principles (U.S. GAAP) which include the accounts of MINDBODY and its wholly owned foreign subsidiaries. All intercompany balances and transactions have been eliminated in consolidation. Subsequent events were evaluated from the balance sheet date of December 31, 2014 through the annual audited consolidated financial statements’ original issuance date of March 26, 2015 and re-issuance date of June 5, 2015. For the three months ended March 31, 2015, subsequent events were evaluated through April 28, 2015, the date on which the unaudited interim consolidated financial statements were issued, and the re-issuance date of June 5, 2015.
Prior Period Reclassifications
Certain reclassifications have been made to the prior years consolidated statement of operations to conform to the current period presentation.
Use of Estimates
The preparation of consolidated financial statements in conformity with U.S. GAAP requires management to make estimates and assumptions that affect the reported amounts of assets and liabilities and disclosure of contingent assets and liabilities at the date of the consolidated financial statements and the reported amounts of revenue and expenses during the reporting period. Significant items subject to such estimates and assumptions include the capitalization and estimated useful life of our capitalized internal-use software, useful lives of property and equipment, the determination of fair value of common stock, stock options, and preferred stock warrants, including a valuation allowance for deferred tax assets, and contingencies. The Company bases its estimates on historical experience and on various other assumptions that it believes to be reasonable under the circumstances. Changes in facts or circumstances may cause the Company to change its assumptions and estimates in future periods, and it is possible that actual results could differ from current or future estimates.
Unaudited Pro Forma Information
Upon the consummation of the initial public offering contemplated by the Company, all of the outstanding shares of redeemable convertible preferred stock will automatically convert and be reclassified into shares of Class B common stock. The March 31, 2015 unaudited consolidated pro forma stockholders’ equity has been prepared assuming the conversion and reclassification of the outstanding shares of redeemable convertible preferred stock into 20,673,680 shares of Class B common stock, the resulting conversion and reclassification of the redeemable convertible preferred stock underlying outstanding warrants, which results in the reclassification of the warrant liability to stockholders’ equity.
F-8
Table of Contents
Unaudited Interim Consolidated Financial Information
The accompanying consolidated balance sheet as of March 31, 2015, the consolidated statements of operations, statements of comprehensive loss, and statements of cash flows for the three months ended March 31, 2014 and 2015, the consolidated statements of redeemable convertible preferred stock and stockholders’ deficit for the three months ended March 31, 2015 and the related footnote disclosures are unaudited. The unaudited interim consolidated financial statements have been prepared on the same basis as the annual consolidated financial statements and, in the opinion of management, reflect all adjustments, which include only normal recurring adjustments, necessary to present fairly the Company’s financial position as of March 31, 2015 and results of operations, comprehensive loss, and cash flows for the three months ended March 31, 2014 and 2015. The results for the three months ended March 31, 2015 are not necessarily indicative of the results to be expected for the year ending December 31, 2015 or for any other periods.
Cash and Cash Equivalents
Cash and cash equivalents consist of cash and money market accounts. The Company considers all highly liquid short-term investments with original maturities of three months or less at the time of purchase to be cash equivalents.
Restricted Cash
Restricted cash is related to the Company’s facility lease agreements and consists of certificates of deposit held with a financial institution. The Company classifies certain restricted cash balances within long-term assets on the accompanying balance sheets based upon the term of the remaining restrictions.
Accounts Receivable and Allowance for Doubtful Accounts
The Company’s accounts receivable are derived from client obligations due under normal trade terms and are reported at the principal amount outstanding, net of the allowance for doubtful accounts. The Company maintains an allowance for doubtful accounts that is based upon historical experience and a review in each period of the number of days that billings are past due and an evaluation of the potential risk of loss associated with delinquent accounts.
Concentration of Credit Risk
As of March 31, 2015, one customer represented 11.4% of the accounts receivable balance. As of December 31, 2013 and 2014, no single customer accounted for more than 10% of total accounts receivable. No single customer represented over 10% of revenue for any of the periods presented in the consolidated statements of operations.
Fair Value of Financial Instruments
Fair value is defined as the exchange price that would be received for an asset or paid to transfer a liability (an exit price) in the principal or most advantageous market for the asset or liability in an orderly transaction between market participants on the measurement date. Valuation techniques used to measure fair value must maximize the use of observable inputs and minimize the use of unobservable inputs. Fair value measurements are based on a fair value hierarchy, based on three levels of inputs, of which the first two are considered observable and the last unobservable, that may be used to measure fair value as follows:
| • | Level 1—Quoted prices (unadjusted) in active markets for identical assets or liabilities that the Company has the ability to access at the measurement date. |
| • | Level 2—Inputs other than quoted prices included within Level 1 that are observable for the asset or liability, either directly or indirectly, such as quoted market prices for similar assets and liabilities; |
F-9
Table of Contents
| quoted prices in markets that are not active; or other inputs that are observable or can be corroborated by observable market data for substantially the full term of the asset or liability. |
| • | Level 3—Unobservable inputs that are supported by little or no market activity and that are significant to the fair value of the assets or liabilities. |
The Company carries its cash equivalents, accounts receivable, accounts payable, other accrued expenses, and preferred stock warrant liability at fair value. The carrying amounts of the Company’s accounts receivable, accounts payable, and other accrued expenses approximate fair value due to their short maturities. The Company classifies its cash equivalents, which are made up of money market accounts, within Level 1 because the Company values these investments using quoted market prices. The Company classifies its preferred stock warrant liability within Level 3 because it is valued using inputs that are unobservable in the market as discussed further in Note 2.
Property and Equipment
Property and equipment, including leasehold improvements, are recorded at cost less accumulated depreciation and amortization. Repairs and maintenance are charged to expense when incurred. Depreciation expense is calculated using the straight-line method over the useful lives of the related assets or leasehold improvements as follows:
| Property and Equipment |
Estimated Useful Life | |
| Property (Building) |
15 years | |
| Office equipment |
5 years | |
| Computer equipment |
3 years | |
| Servers |
3 years | |
| Software licenses |
4 years | |
| Capitalized software costs |
2-3 years | |
| Leasehold improvements |
Lesser of estimated useful life or remaining lease term |
Useful lives of significant assets are periodically reviewed and adjusted prospectively to reflect the Company’s current estimates of the respective assets’ expected utility.
In the event the Company has been deemed the owner for accounting purposes of construction projects in build-to-suit lease arrangements, the estimated construction costs incurred to date are recorded as assets in Property and Equipment, net. Upon occupancy of facilities under build-to-suit leases, the Company assesses whether arrangements qualify for sales recognition under the sale-leaseback accounting guidance. If the Company continues to be the deemed owner for accounting purposes, the cost of the building is depreciated over its estimated useful life or lease term, whichever is shorter.
Capitalized Software Development Costs
Certain development costs incurred in connection with internal use software are capitalized. Capitalization begins when the preliminary project stage is complete, management with the relevant authority authorizes and commits to the funding of the software project, it is probable the project will be completed, and the software will be used to perform the functions intended and certain functional and quality standards have been met. Capitalization of these costs ceases once the project is substantially complete and the software is ready for its intended purpose. Research and development costs incurred during the preliminary project stage or costs incurred for training, maintenance, and general and administrative or overhead costs are expensed as incurred. Capitalized software development costs are amortized to cost of revenue using the straight-line method over an estimated useful life of the software of two to three years, commencing when the software is ready for its intended use.
F-10
Table of Contents
Business Combinations
As discussed further in Note 5 of these consolidated financial statements, the Company acquired the Fitness Mobile Apps business of Petrol Designs LLC during the three months ended March 31, 2015 and Jill’s List during the year ended December 31, 2013. The Company performs valuations of assets acquired and liabilities assumed for acquisitions and allocates the purchase price to its respective net tangible and intangible assets. Any residual purchase price is recorded as goodwill. Determining the fair value of assets acquired and liabilities assumed requires management to use significant judgment and estimates including the selection of valuation methodologies, estimates of future revenue and cash flows, discount rates and selection of comparable companies. During the measurement period, the Company may record certain adjustments to the assets acquired and liabilities assumed with the corresponding offset to goodwill. After the measurement period, which could be up to one year after the transaction date, all adjustments are recorded to the Company’s consolidated statements of operations. Contingent payments that are dependent upon post-combination services, if any, are considered separate transactions outside of the business combination and therefore included in the post-combination operating results.
Goodwill and Other Intangible Assets
The Company records goodwill when the consideration paid in a purchase acquisition exceeds the fair value of the net tangible assets and the identified intangible assets acquired. Goodwill is not amortized, but rather is tested for impairment. The Company performs testing for impairment of goodwill on October 1st or as events occur or circumstances change that would more likely than not reduce the fair value of a reporting unit below its carrying amount. When testing goodwill for impairment, the Company first performs an assessment of qualitative factors, including but not limited to, macroeconomic conditions, industry and market conditions, company-specific events, changes in circumstances, and after-tax cash flows. If qualitative factors indicate that it is more likely than not that the fair value of the relevant reporting unit is less than its carrying amount, the Company tests goodwill for impairment at the reporting unit level using a two-step approach. In step one, the Company determines if the fair value of the reporting unit exceeds the unit’s carrying value. If step one indicates that the fair value of the reporting unit is less than its carrying value, the Company performs step two, determining the fair value of goodwill and, if the carrying value of goodwill exceeds the implied fair value, recording an impairment charge. The Company has determined that there is a single reporting unit for the purpose of goodwill impairment tests.
Intangible assets consist of identifiable intangible assets, primarily developed technology and customer relationships. These intangible assets have been determined to have definite lives and are carried at cost, less accumulated amortization. The Company amortizes the intangible assets with finite lives using the straight-line method over the estimated economic lives of the assets, which is normally two to three years. The amortization expense for acquired technology and capitalized software development costs is recorded in cost of revenues. The amortization expense for acquired network list is recorded in sales and marketing expense.
Impairment of Long-Lived Assets
Long-lived assets, primarily consisting of property and equipment and intangible assets other than goodwill are reviewed for impairment whenever events or changes in circumstances indicate that the carrying value of an asset group may not be recoverable. Recoverability of asset groups to be held and used is measured by a comparison of the carrying value of an asset group to the estimated undiscounted future cash flows expected to be generated from use of such assets. If the undiscounted future cash flows is less than the carrying value of an asset group, an impairment loss is recognized based on the amount by which the carrying value exceeds the estimated fair value of the asset group. During the year ended December 31, 2014, the Company recorded an impairment charge in the amount of $426,000 related to acquired technology from a recent acquisition and internal costs incurred to integrate this technology. The impairment charge during the year ended December 31, 2014 was included in costs of revenue in the statements of operations. There were no such impairment losses identified or recorded during the years ended December 31, 2012 and 2013 or the three months ended March 31, 2014 and 2015.
F-11
Table of Contents
Deferred Offering Costs
Deferred offering costs, consisting of legal, accounting, outside services, and filing fees related to the initial public offering are capitalized. The deferred offering costs will be offset against proceeds from the initial public offering upon the effectiveness of the offering. In the event the offering is terminated, all capitalized deferred offering costs will be expensed. As of December 31, 2014 and March 31, 2015, deferred offering costs were $863,000 and $2,456,000 included in other non-current assets.
Operating Leases and Financing Obligations
The Company leases office facilities under various non-cancelable operating lease agreements. Certain lease agreements contain free or escalating rent payment provisions. The Company recognizes rent expense under such leases on a straight-line basis over the term of the lease with the difference between the expense and the payments recorded as deferred rent on the consolidated balance sheets. Lease renewal periods are considered on a lease-by-lease basis in determining the lease term.
For certain build-to-suit lease arrangements where the Company has concluded that it is the “deemed owner” of the building (for accounting purposes only) during the construction period, the Company is required to record an asset with a corresponding construction financing obligation for the costs incurred by the landlord. The financing obligation is recorded as a component of other non-current liabilities in the consolidated balance sheets. The Company will increase the asset and financing obligation as additional building costs are incurred by the landlord during the construction period. Once construction is complete, the Company will evaluate whether the asset qualifies for sale-leaseback accounting treatment. If the lease meets the sale-leaseback criteria, the Company will remove the asset and the related liability from its consolidated balance sheet and treat the lease as either an operating or capital lease based on an assessment of the accounting guidance. If the arrangement does not qualify for sale-leaseback treatment, the Company will reduce the obligation over the lease term as payments are made and will depreciate the asset over its estimated useful life or lease term, whichever is shorter. Future lease payments associated with the build-to-suit lease where the Company is the deemed owner are allocated between the land and building components. Payments attributable to the land are recognized as rent expense on a straight-line basis upon commencement of the contract. The Company does not report rent expense for the portion of the rent payment allocated to the buildings, which are owned for accounting purposes. Rather, this portion of the rent payment under the lease is recognized as a reduction of the financing obligation and as interest expense.
Revenue Recognition
The Company has three primary sources of revenue consisting of (i) subscription and support services, (ii) payments, and (iii) product and other sales.
The Company commences revenue recognition when all of the following conditions have been satisfied:
| • | persuasive evidence of an agreement exists; |
| • | the service has been or is being provided to the customer or delivery of the product has occurred; |
| • | fees are fixed or determinable; and |
| • | the collection of the fees is reasonably assured. |
Software revenue recognition arrangements that do not give the subscriber the option to take possession of the software are service arrangements and are outside the scope of the specific industry rules for software recognition. This applies to the Company’s cloud-based business management software, and as such, the Company accounts for the subscription and support services as service arrangements. Amounts invoiced in excess of revenue recognized are deferred. The majority of the fees are prepaid by subscribers on a monthly basis, and to a lesser extent, for certain subscribers on an annual or quarterly basis. The subscription revenue is recognized ratably over the term of the agreement.
F-12
Table of Contents
The customer support offering is delivered together with the subscription services, and the term of the customer support is the same as the related subscription services arrangement. Accordingly, the Company recognizes customer support revenue in the same manner as the associated subscription service. The Company’s subscribers enter into separate arrangements with the technology partners. Revenue derived from revenue share arrangements with the technology partners is recognized when earned on a net basis. The Company also earns revenue from API platform partners for subscriber site access, data query, and consumer bookings. The revenue from API platform partners is recorded when earned.
The Company collects a revenue share from third-party payment processors on all transactions between its subscribers who utilize the MINDBODY payment platform and their consumers. These payment transactions are generally for purchasing classes, goods, or services through a subscriber’s website, at their business location or through the MINDBODY Connect platform, which includes a mobile interface that enables consumers to discover, evaluate, book, and pay for wellness services. Transaction fees are recorded as payments revenue on a net basis.
Product revenues are recognized when all revenue recognition criteria have been met, which is upon delivery.
In certain circumstances, the Company’s arrangements include multiple elements which may consist of some or all of subscription services, support services, and hardware products, which are included in Product and other. When multiple-element arrangements exist, the Company evaluates whether any of these deliverables should be accounted for as separate units of accounting.
The Company’s support services do not have standalone value because it and other vendors do not sell support services separately. Such support services are therefore combined with the Company’s subscription services as a single unit of accounting. The Company’s hardware products, such as point of sale systems, have standalone value because it and other vendors sell the same products separately. Additionally, while there is a general right of return relative to the Company’s hardware products, which are generally delivered upfront, performance of the subscription and support services is considered probable and substantially in the Company’s control. Accordingly, the Company considers the separate units of accounting in its multiple-element arrangements to be the hardware products and subscription and support services. For arrangements with multiple elements which can be separated into different units of accounting, the Company allocates the arrangement fee to the separate units of accounting based on vendor-specific objective evidence, as demonstrated by separate sales with sufficient concentration in selling prices.
Cost of Revenue
Cost of revenue primarily consists of costs associated with personnel costs and related expenses for data center operations, global customer support and onboarding services personnel, infrastructure costs for operation of our cloud-based business management software, and costs related to processing the payments of subscribers that pay via credit cards. Personnel costs consist of salaries, benefits, bonuses, commission costs and stock-based compensation. Overhead costs consist of certain facilities, depreciation, amortization of capitalized software costs, information technology costs, and impairment charges for acquired technology and capitalized software costs.
Advertising Expense
Advertising and sales promotion costs are expensed when incurred and are included in sales and marketing expenses in the accompanying consolidated statements of operations. The Company’s advertising expenses, which include print and online advertising were $423,000, $508,000, and $588,000 during the years ended December 31, 2012, 2013, and 2014, and $175,000 and $145,000 during the three months ended March 31, 2014 and 2015.
F-13
Table of Contents
Research and Development
Research and development costs are expensed when incurred. The Company incurs costs in connection with the development of software for its platform and software used in operations. These costs are expensed unless they meet the requirement for capitalization.
Stock-Based Compensation
Stock-based compensation expense associated with stock option awards is measured and recognized in the financial statements based on the fair value of the awards granted. The fair value of the stock options is estimated on the grant date using the Black-Scholes option pricing model. This model requires the Company to estimate the grant date fair value of the underlying common stock, the expected life of options, the expected volatility of the price of the underlying common stock, risk-free interest rates, and expected dividend yield of the common stock. The stock-based compensation expense for stock options, net of forfeitures, is recognized using a straight-line basis over the requisite service periods of the awards, which is generally four years. The forfeiture rate is based on historical experience and expected employee attrition rates. Changes in estimated forfeitures will be recognized through a cumulative catch-up adjustment in the period of change and will also affect the amount of compensation expense to be recognized in future periods.
The valuation of restricted stock awards (RSAs) is determined as the fair value of the underlying shares on the date of grant as determined by the board of directors. Stock-based compensation expense for an RSA grant is recognized as expense on the grant date and as an RSA liability on the consolidated balance sheets. RSAs are subject to a repurchase option of the Company whereby the Company has the right to repurchase the stock from the employee at the grant-date fair value if the employee ceases continuous full-time employment with the Company for any reason. The Company’s repurchase right lapses as follows:
| Grant Date Anniversary (Years) |
Percentage of Total Shares Subject to Repurchase |
|||
| One |
100 | % | ||
| Two |
80 | |||
| Three |
60 | |||
| Four |
40 | |||
| Five |
— | |||
To the extent the repurchase option for an RSA lapses, the Company reclassifies the grant-date fair value attributable to the related shares from RSA liability to common stock. To the extent the Company exercises its right to repurchase and pays cash for the RSA shares, RSA liability is reduced by the cash paid. There were no RSAs issued during the years ended December 31, 2012, 2013, and 2014 and the three months ended March 31, 2015.
Redeemable Convertible Preferred Stock
The carrying value of redeemable convertible preferred stock is recorded at fair value upon issuance, net of issuance costs, accreted to its estimated redemption value using the effective interest method. Accretion to the carrying value is being recorded as an increase in the carrying value of the redeemable convertible preferred stock and a reduction of stockholder’s equity.
The Company reviews the rights and preferences of its preferred stock for any changes in terms, rights or preferences to determine if such change is a modification or an extinguishment. An amendment that, based on either quantitative or qualitative considerations, changes a substantive contractual term or fundamentally changes the nature of the preferred share is considered an extinguishment. The Company considers both expected economics as well as the business purpose of the amendment. If considered an extinguishment, the Company removes the carrying value of the old securities and recognizes the new securities at their current fair value. If considered a modification, the Company recognizes the change in the fair value of the security immediately before and after the amendment as either a deemed dividend or a deemed capital contribution.
F-14
Table of Contents
Preferred Stock Warrant
The Company accounts for freestanding warrants to purchase shares of redeemable convertible preferred stock as liabilities in the consolidated balance sheets at their estimated fair value. The preferred stock warrants are subject to remeasurement at each balance sheet date, and any change in fair value is recognized in the consolidated statements of operations.
The Company will continue to adjust the liability for changes in fair value until the earlier of: (i) the exercise or expiration of the warrants or (ii) the completion of a liquidation event, including the completion of an initial public offering, at which time all preferred stock warrants will be converted into warrants to purchase common stock. Upon such an event, the fair value of the warrants will be remeasured one final time with the related liability being reclassified to stockholders’ equity.
Segments
The Company’s chief operating decision maker reviews financial information on a consolidated basis to make decisions about how to allocate resources and to measure the Company’s performance. Accordingly, the Company has determined that it operates in one segment.
Income Taxes
The Company accounts for income taxes under the asset and liability method of accounting for income taxes. Under this method, deferred taxes are recognized for the future tax consequences attributable to differences between the consolidated financial statement carrying amounts of existing assets and liabilities and their respective tax bases. Deferred tax assets and liabilities are measured using enacted tax rates expected to be applied to taxable income in the years in which those temporary differences are expected to be recovered or settled. A valuation allowance is recorded to reduce the carrying amount of deferred tax assets, unless it is more likely than not such assets will be realized.
The Company also applies the provisions for uncertainty of income taxes. This guidance prescribes a recognition threshold and measurement attribute for consolidated financial statement recognition and measurement of a tax position taken or expected to be taken in a tax return. For those benefits to be recognized, a tax position must be more likely than not to be sustained upon examination by taxing authorities. This guidance also applies to various related matters, such as derecognition, interest, penalties, and required disclosures. The Company recognizes interest and penalties, if any, related to unrecognized tax benefits in its income tax provision.
Net Income (Loss) and Pro Forma Net Income (Loss) Per Share Attributable to Common Stockholders
The Company applies the two-class method in calculating the net income (loss) per share amounts which requires net income (loss) to be allocated between the common and preferred stockholders based on their respective right to receive dividends. Accordingly, the Company’s basic net income (loss) per share attributable to common stockholders is calculated by dividing the net income (loss) attributable to common stockholders by the weighted-average number of shares of common stock outstanding during the period. Net income (loss) attributable to common stockholders is equal to the Company’s net income (loss) as adjusted for accretion of cumulative preferred stock dividends of the related series of redeemable convertible preferred stock to their redemption value. Diluted income (loss) per share attributable to common stockholders adjusts the basic weighted-average number of shares of common stock outstanding for the potential dilution that could occur if stock options, warrants, and redeemable convertible preferred stock were exercised or converted into common stock. For purposes of this calculation, redeemable convertible preferred stock, options to purchase common stock, and preferred stock warrants are considered common stock equivalents but have been excluded from the calculation of diluted net loss per share attributable to common stockholders as their effect is anti-dilutive.
In contemplation of an initial public offering, the Company has presented unaudited pro forma basic and diluted net income (loss) per share amounts, which have been calculated assuming the conversion and
F-15
Table of Contents
reclassification of all series of the Company’s redeemable convertible preferred stock (using the as-if converted method) into shares of Class B common stock as though the conversion and reclassification had occurred as of the beginning of the period or the original date of issuance, if later, and the conversion and reclassification of the preferred stock warrants into Class B common stock warrants upon an initial public offering. As a result, the Company has removed the change in fair value of preferred stock warrant liability from the numerator in the pro forma basic and diluted net income (loss) per share calculation.
Foreign Currency Translation
The functional currency of the Company’s foreign subsidiaries, which were established during the years ended December 31, 2012 and 2013, are their local currencies. The assets and liabilities of the foreign subsidiaries are translated using exchange rates in effect at the balance sheet date. Revenues and expenses are translated using the average exchange rates prevailing during the period. Exchange rate differences resulting from translation adjustments are accounted for as a component of accumulated other comprehensive income (loss).
Comprehensive Loss
Comprehensive loss is composed of two components: net loss and other comprehensive loss. Other comprehensive loss refers to expenses and losses that under GAAP are recorded as an element of stockholders’ deficit, but are excluded from the Company’s net loss. For all periods presented, the Company’s other comprehensive loss is made up of foreign currency translation adjustments related to the Company’s foreign subsidiaries.
Recently Issued and Adopted Accounting Pronouncements
In April 2015, the Financial Accounting Standards Board (FASB) issued authoritative guidance, which changes the presentation of debt issuance costs in financial statements. Under this authoritative guidance, an entity presents such costs in the balance sheet as a direct deduction from the related debt liability rather than as an asset. Amortization of the costs is reported as interest expense. The new guidance is effective for the Company beginning January 1, 2016. Early adoption is permitted. The guidance is not expected to have a material impact on the consolidated financial statements.
In November 2014, the FASB issued authoritative guidance to clarify how current U.S. GAAP should be interpreted in evaluating the economic characteristics and risk of a host contract in a hybrid financial instrument that is issued in the form of a share. In addition, the new authoritative guidance was issued to clarify that in evaluating the nature of a host contract, an entity should assess the substance of the relevant terms and features (that is, the relative strength of the debt-like or equity-like terms and features given the facts and circumstances) when considering how to weight those terms and features. The effects of initially adopting the new authoritative guidance should be applied on a modified retrospective basis to existing hybrid financial instruments issued in a form of a share as of the beginning of the fiscal year for which the amendments are effective, with retrospective application permitted to all relevant prior periods. The new authoritative guidance is effective for the years beginning after December 15, 2015; however, early adoption is permitted. The Company elected to early adopt the new authoritative guidance on a retrospective basis for all periods presented with the earliest period being January 1, 2012. Under this new guidance, certain features embedded in certain series of preferred stock that were previously bifurcated. The Company believes retrospective adoption provides users of the financial statements the most comparable and useful financial information and better reflects the underlying performance of the Company’s business.
In May 2014, the FASB issued authoritative guidance that provides principles for recognizing revenue for the transfer of promised goods or services to customers with the consideration to which the entity expects to be entitled in exchange for those goods or services. The new guidance as currently issued is effective for the Company beginning January 1, 2017. On April 1, 2015, the FASB voted to propose a one-year deferral to the effective date, but to permit entities to adopt the original effective date if they choose. The Company is currently evaluating the impact of the adoption of this guidance.
F-16
Table of Contents
In August 2014, the FASB issued authoritative guidance that provides guidance on management’s responsibility in evaluating whether there is substantial doubt about an entity’s ability to continue as a going concern and by providing related footnote disclosure requirements. This new guidance is effective for the Company prospectively beginning January 1, 2016 with early adoption permitted. The Company is currently evaluating the impact of the adoption of this guidance but it is not expected to have a material impact on the consolidated financial statements.
| 2. | FAIR VALUE MEASUREMENTS |
The Company measures and reports its cash equivalents and preferred stock warrant at fair value on a recurring basis. The Company’s cash equivalents are invested in money market funds. The following table sets forth the fair value of the Company’s financial assets and liabilities remeasured on a recurring basis, by level within the fair value hierarchy (in thousands):
| December 31, 2013 | ||||||||||||||||
| Level 1 | Level 2 | Level 3 | Total | |||||||||||||
| Financial Assets: |
||||||||||||||||
| Money market funds(1) |
$ | 140 | $ | — | $ | — | $ | 140 | ||||||||
|
|
|
|
|
|
|
|
|
|||||||||
| Financial Liabilities: |
||||||||||||||||
| Contingent consideration related to acquisition(2) |
$ | — | $ | — | $ | 2,007 | $ | 2,007 | ||||||||
| Preferred stock warrant(3) |
— | — | 905 | 905 | ||||||||||||
|
|
|
|
|
|
|
|
|
|||||||||
| Total financial liabilities |
$ | — | $ | — | $ | 2,912 | $ | 2,912 | ||||||||
|
|
|
|
|
|
|
|
|
|||||||||
| December 31, 2014 | ||||||||||||||||
| Level 1 | Level 2 | Level 3 | Total | |||||||||||||
| Financial Assets: |
||||||||||||||||
| Money market funds(1) |
$ | 28,036 | $ | — | $ | — | $ | 28,036 | ||||||||
|
|
|
|
|
|
|
|
|
|||||||||
| Financial Liabilities: |
||||||||||||||||
| Contingent consideration related to acquisition(2) |
$ | — | $ | — | $ | 11 | $ | 11 | ||||||||
| Preferred stock warrant(3) |
— | — | 1,188 | 1,188 | ||||||||||||
|
|
|
|
|
|
|
|
|
|||||||||
| Total financial liabilities |
$ | — | $ | — | $ | 1,199 | $ | 1,199 | ||||||||
|
|
|
|
|
|
|
|
|
|||||||||
| March 31, 2015 | ||||||||||||||||
| Level 1 | Level 2 | Level 3 | Total | |||||||||||||
| (Unaudited) | ||||||||||||||||
| Financial Assets: |
||||||||||||||||
| Money market funds(1) |
$ | 20,987 | $ | — | $ | — | $ | 20,987 | ||||||||
|
|
|
|
|
|
|
|
|
|||||||||
| Financial Liabilities: |
||||||||||||||||
| Contingent consideration related to acquisition(2) |
$ | — | $ | — | $ | 11 | $ | 11 | ||||||||
| Preferred stock warrant(3) |
— | — | 1,338 | 1,338 | ||||||||||||
|
|
|
|
|
|
|
|
|
|||||||||
| Total financial liabilities |
$ | — | $ | — | $ | 1,349 | $ | 1,349 | ||||||||
|
|
|
|
|
|
|
|
|
|||||||||
| (1) | The Company held certain assets that are required to be measured at fair value on a recurring basis, included in cash equivalents, which are held in money market funds. All such assets as of December 31, 2013 and 2014 and March 31, 2015 were recorded based on Level 1 inputs. |
| (2) | Contingent consideration related to the Jill’s List acquisition (discussed further in Note 5) is classified within Level 3 because the liability is valued using significant unobservable inputs. The Company estimated the fair value of the acquisition-related contingent consideration using a risk-neutral Monte Carlo simulation model. |
F-17
Table of Contents
| The model assigned payout probabilities to each of the earn-out periods and simulated 50,000 target revenue paths using median volatility of comparable companies. The revenue growth was adjusted to a risk neutral framework and earn-out value was discounted using risk-free rate as of the valuation date. The change in fair value related to changes in estimated contingent consideration was recorded in the results of operations. The fair value of contingent consideration as of March 31, 2015 was not material. |
Quantitative information for the significant inputs used in valuing the contingent consideration during the years ended December 31, 2013 and 2014 is summarized as follows:
| Year Ended December 31, | ||||||||
| 2013 | 2014 | |||||||
| Probability of achieving target revenue |
74% – 95% | 0% – 50% | ||||||
| Risk-free rate |
0.1% – 0.2% | 0.02% – 0.2% | ||||||
| Volatility |
10% – 25% | 10% – 24% | ||||||
| (3) | The preferred stock warrant was valued using a hybrid between a probability-weighted expected return method (PWERM) and option pricing method (OPM), estimating the probability weighted value across multiple scenarios, while using an OPM to estimate the allocation of value within one or more of those scenarios. Under a PWERM, the value of the Company’s various equity securities were estimated based upon an analysis of future values for the Company assuming various future outcomes, including two initial public offering (IPO) scenarios, two transaction scenarios contemplating a sale or merger transaction, and a scenario contemplating the continued operation of the Company as a privately-held enterprise. Guideline public company (GPC) multiples were used to value the Company under the IPO and transaction scenarios. The discounted cash flow (DCF) method was used to value the Company under the staying private scenario. Share value for each class of security was based upon the probability-weighted present value of expected future investment returns, considering each of these possible future outcomes, as well as the rights of each share class. |
The significant unobservable inputs into the valuation model used to estimate the fair value of the preferred stock warrant include the timing of potential liquidity events (IPO, transaction, staying private) and their probability of occurring, the selection of GPC multiples, a discount for the lack of marketability of the preferred and common stock, the projected future cash flows, and the discount rate used to calculate the present-value of the estimated equity value allocated to each share class.
Quantitative information for the significant inputs used in valuing the warrant as of December 31, 2013 and 2014 and March 31, 2015 is summarized in the following table:
| December 31, | March 31, | |||||||||||
| 2013 | 2014 | 2015 | ||||||||||
| (unaudited) | ||||||||||||
| Input Ranges |
||||||||||||
| Time to liquidity (years) |
1.25-1.83 | 0.5-1.16 | 0.25-0.92 | |||||||||
| Probability of each liquidity event: |
||||||||||||
| IPO |
65 | % | 75 | % | 80 | % | ||||||
| Transaction |
30 | % | 20 | % | 15 | % | ||||||
| Staying private |
5 | % | 5 | % | 5 | % | ||||||
| Discount for lack of marketability |
20 | % | 11 | % | 7 | % | ||||||
| Discount rate |
20 | % | 17 | % | 9 | % | ||||||
Generally, increases (decreases) in the fair value of the underlying stock or IPO probabilities would result in a directionally similar impact to the fair value measurement while increases (decreases) in the related discount rates or time to liquidity would result in a directionally opposing impact to the fair value measurement.
The management and the board of directors engages a third-party valuation firm to assist with the valuation of the Level 3 instruments.
F-18
Table of Contents
The following table provides a summary of changes in fair value of the Level 3 financial liabilities during the years ended December 31, 2012, 2013, and 2014 and the three months ended March 31, 2015 as follows (in thousands):
| Preferred Stock Warrant |
Contingent Consideration |
Total | ||||||||||
| Balance – January 1, 2012 |
$ | 88 | $ | — | $ | 88 | ||||||
| Change in fair value |
515 | — | 515 | |||||||||
|
|
|
|
|
|
|
|||||||
| Balance – December 31, 2012 |
603 | — | 603 | |||||||||
| Fair value at issuance date |
— | 1,579 | 1,579 | |||||||||
| Change in fair value |
302 | 428 | 730 | |||||||||
|
|
|
|
|
|
|
|||||||
| Balance – December 31, 2013 |
905 | 2,007 | 2,912 | |||||||||
| Payment of contingent consideration in cash |
— | (240 | ) | (240 | ) | |||||||
| Payment of contingent consideration in common stock |
— | (322 | ) | (322 | ) | |||||||
| Change in fair value |
283 | (1,434 | ) | (1,151 | ) | |||||||
|
|
|
|
|
|
|
|||||||
| Balance – December 31, 2014 |
$ | 1,188 | $ | 11 | $ | 1,199 | ||||||
|
|
|
|
|
|
|
|||||||
| Change in fair value (unaudited) |
150 | — | 150 | |||||||||
|
|
|
|
|
|
|
|||||||
| Balance – March 31, 2015 (unaudited) |
$ | 1,338 | $ | 11 | $ | 1,349 | ||||||
|
|
|
|
|
|
|
|||||||
There were no transfers of financial instruments between the three levels of the fair value hierarchy during the years ended December 31, 2012, 2013, or 2014 and the three months ended March 31, 2015. As of and for the years ended December 31, 2013 and 2014, and the three months ended March 31, 2015, the Company did not have any assets or liabilities that were required to be measured at fair value on a nonrecurring basis.
3. BALANCE SHEET COMPONENTS
Prepaid Expenses and Other Current Assets
Prepaid expenses and other current assets consisted of the following (in thousands):
| December 31, | March 31, 2015 |
|||||||||||
| 2013 | 2014 | |||||||||||
| (unaudited) | ||||||||||||
| Prepaid expenses |
$ | 875 | $ | 2,020 | $ | 2,656 | ||||||
| Other |
282 | 542 | 451 | |||||||||
|
|
|
|
|
|
|
|||||||
| Prepaid expenses and other current assets |
$ | 1,157 | $ | 2,562 | $ | 3,107 | ||||||
|
|
|
|
|
|
|
|||||||
Property and Equipment, net
Property and equipment consisted of the following (in thousands):
| December 31, | March 31, 2015 |
|||||||||||
| 2013 | 2014 | |||||||||||
| (unaudited) | ||||||||||||
| Computer equipment |
$ | 7,517 | $ | 11,590 | $ | 12,461 | ||||||
| Leasehold improvements |
2,423 | 6,121 | 8,015 | |||||||||
| Capitalized software costs |
2,121 | 1,754 | 1,792 | |||||||||
| Office equipment |
999 | 1,402 | 2,006 | |||||||||
| Software licenses |
527 | 963 | 1,215 | |||||||||
| Construction in progress – Building, leased |
3,659 | 15,583 | 16,941 | |||||||||
|
|
|
|
|
|
|
|||||||
| Property and equipment – gross |
17,246 | 37,413 | 42,430 | |||||||||
| Less: accumulated depreciation and amortization |
(5,085 | ) | (8,845 | ) | (9,943 | ) | ||||||
|
|
|
|
|
|
|
|||||||
| Property and equipment – net |
$ | 12,161 | $ | 28,568 | $ | 32,487 | ||||||
|
|
|
|
|
|
|
|||||||
F-19
Table of Contents
Depreciation and amortization expense, excluding amortization of capitalized software and intangible assets, for the years ended December 31, 2012, 2013, and 2014 was $826,000, $2,371,000, and $3,444,000 and for the three months ended March 31, 2014 and 2015 was $714,000 and $1,035,000.
The Company capitalized software development costs of $1,372,000, $907,000, and $185,000 for the years ended December 31, 2012, 2013, and 2014 and $74,000 and $39,000 for the three months ended March 31, 2014 and 2015. Amortization of capitalized software development costs totaled $143,000, $835,000, and $791,000 during the years ended December 31, 2012, 2013, and 2014 and $213,000 and $40,000 during the three months ended March 31, 2014 and 2015. During the year ended December 31, 2014, the Company wrote off $160,000 of cost incurred to integrate acquired technology. The net book value of capitalized software development costs was $1,301,000 and $535,000 as of December 31, 2013 and 2014 and $491,000 as of March 31, 2015.
During the year ended December 31, 2013, the Company executed a lease for a new 64,000 square foot office building in San Luis Obispo, California. This facility will provide additional capacity to accommodate continued growth, and became operational in the second quarter of 2015. Both the landlord and the Company incurred costs to construct the facility according to the Company’s operating specifications, and as a result, the Company has concluded that it is the “deemed owner” of the building (for accounting purposes only) during the construction period. During the year ended December 31, 2013 and 2014, and the three months ended March 31, 2015, the landlord incurred building construction costs of $3,659,000, $11,924,000, and $1,358,000 which the Company has recorded as an asset, with a corresponding construction financing obligation. The Company will increase the asset and financing obligation as additional building costs are incurred by the landlord during the construction period. The total expected financing obligation associated with this lease upon completion of the construction of the building, inclusive of the amounts currently recorded, is $29,495,000 (See Note 7 for future commitment details). The obligation will be settled through monthly lease payments to the landlord once the construction is complete and the office space is ready for occupancy. The lease has an original term of 15 years and the Company also has an option to extend the term of the lease for three consecutive terms of five years each. The base rent for the initial year will be equal to 8.5% of the landlord’s actual development costs to deliver a “vanilla shell” premise to the Company, with such costs not to exceed $20,643,000 for the purposes of this computation, with the base rent subject to an annual 3% escalation clause thereafter. Further, the Company is responsible to pay landlord’s insurance costs, real property taxes, and operating expenses related to the premises as additional rent. The Company is also responsible for all tenant improvements and, at inception, was required to deposit $2,533,000 into a restricted account to pay for these improvements. As of December 31, 2014 and March 31, 2015, the remaining balance in the deposit account was $772,000 and zero, respectively.
Accrued Expenses and Other Liabilities
Accrued expenses and other liabilities consisted of the following (in thousands):
| December 31, | March 31, 2015 |
|||||||||||
| 2013 | 2014 | |||||||||||
| (unaudited) | ||||||||||||
| Accrued payroll |
$ | 2,285 | $ | 3,353 | $ | 3,692 | ||||||
| Accrued vacation |
878 | 1,323 | 1,631 | |||||||||
| Other liabilities |
439 | 543 | 550 | |||||||||
|
|
|
|
|
|
|
|||||||
| Total accrued expenses and other liabilities |
$ | 3,602 | $ | 5,219 | $ | 5,873 | ||||||
|
|
|
|
|
|
|
|||||||
4. BUSINESS COMBINATION
Fitness Mobile Apps
On February 2, 2015, the Company completed the acquisition of the Fitness Mobile Apps business of Petrol Designs LLC (Fitness Mobile Apps), a privately held technology partner that creates tailored mobile apps for the
F-20
Table of Contents
Company’s subscribers. The Company accounted for the acquisition of Fitness Mobile Apps as a business combination. The Company acquired all of the assets that were used in, or otherwise benefit, the mobile apps business for 103,617 shares of the Company’s common stock with a fair value of $14.476 per share, of which 74,260 shares have been issued and 29,357 shares are held with an escrow agent and will be released on the first anniversary of the closing date, and $3,000,000 in cash, resulting in an aggregate preliminary purchase price of $4,500,000. The acquisition also included an obligation to issue up to 207,235 shares of the Company’s common stock to certain former employees of Fitness Mobile Apps, contingent upon their continuous employment with the Company. As such, compensation expense will be recorded ratably over the respective service period.
The fair value of the Company’s common stock issued for Fitness Mobile Apps was based on the Company’s valuation of its common stock as of February 2, 2015. Given the absence of a public trading market, the Company’s board of directors considered numerous objective and subjective factors to determine the fair value of the Company’s common stock. These factors included, but were not limited to (i) contemporaneous third-party valuations of common stock; (ii) the rights and preferences of convertible preferred stock relative to common stock; (iii) the lack of marketability of common stock; (iv) developments in the business; and (v) the likelihood of achieving a liquidity event, such as an IPO or sale of the Company, given prevailing market conditions. The aggregate enterprise value was determined using a combination of the income approach and two market approaches in order to estimate an Enterprise Value under five different possible future scenarios, which were weighted as follows:
| Weighting | ||||
| IPO |
75 | % | ||
| Transaction |
20 | % | ||
| Private company (DCF) |
5 | % | ||
The Company allocated the total purchase consideration to tangible assets acquired and identifiable intangible assets acquired based on their estimated fair values with the excess of the purchase consideration over the aggregate fair values recorded as goodwill allocated to the Company’s one operating segment. Goodwill of $3,569,000 represents 80% of the total purchase consideration and is primarily attributable to the value of acquired personnel, and the Company’s ability to expand the MINDBODY Connect consumer base by transitioning Fitness Mobile Apps onto the Connect platform.
The internally developed software/technology with a remaining useful life of three years represents the tools to create consumer facing customized mobile apps for the Company’s subscribers. The fair values of the acquired intangible assets were determined based on the income approach and relief of royalty method approach and the identifiable intangible assets are subject to amortization on a straight-line basis over their remaining useful lives.
The Company incurred and expensed $150,000 in acquisition-related costs, which are included within general and administrative expenses on the consolidated statements of operations.
The following table summarizes the consideration paid and the fair values of the assets acquired and liabilities assumed at the acquisition date (in thousands):
| Amount | ||||
| Tangible assets acquired |
$ | 18 | ||
| Intangible asset – developed software/technology |
913 | |||
| Goodwill |
3,569 | |||
|
|
|
|||
| Fair value of total purchase consideration |
$ | 4,500 | ||
|
|
|
|||
F-21
Table of Contents
The results of Fitness Mobile Apps included in our consolidated statements of operations since the acquisition date, including revenues and net loss, were not material. Pro forma results of operations have not been presented because the acquisition was not material to our results of operations.
Jill’s List
In April 2013, the Company acquired 100% of the issued and outstanding capital stock of Jill’s List, Inc., an online platform that enables referrals of patients to over 4,000 certified integrative health practitioners and companies. The acquisition marked the launch of the Company’s new wellness network, which connects consumers, employees, and doctors with integrative network practitioners. Subsequent to the close of the acquisition, the Company rebranded Jill’s List as Connect Workplace. The Company accounted for the acquisition of Jill’s List as a purchase of a business. The total purchase consideration was $2,611,000, consisting of $250,000 in cash, the issuance of 93,190 shares of the Company’s common stock with a fair value of $8.39 per share on the acquisition date, and future earn-out consideration with a fair value of $1,579,000 on the acquisition date. The Company withheld 37,275 shares as escrow shares to provide for undisclosed claims or damages to be released 18 months after the acquisition date. All escrow shares were released in October 2014. The earn-out consideration is contingent upon the achievement of certain recurring minimum revenue and maximum expense targets within and over a period of two years after the acquisition date with the maximum payment equal to $1,000,000 in cash and an additional 124,255 shares of the Company’s common stock.
The fair value of the Company’s common stock issued for Jill’s List was based on the Company’s valuation of its common stock as of March 31, 2013. Given the absence of a public trading market, the Company’s board of directors considered numerous objective and subjective factors to determine the fair value of the Company’s common stock. These factors included, but were not limited to (i) contemporaneous third-party valuations of common stock; (ii) the rights and preferences of convertible preferred stock relative to common stock; (iii) the lack of marketability of common stock; (iv) developments in the business; and (v) the likelihood of achieving a liquidity event, such as an IPO or sale of the Company, given prevailing market conditions. The aggregate enterprise value was determined using a combination of the income approach and two market approaches in order to estimate an Enterprise Value under five different possible future scenarios, which were weighted as follows:
| Weighting | ||||
| IPO |
40 | % | ||
| Transaction |
55 | % | ||
| Private company (DCF) |
5 | % | ||
The Company estimated the fair value of the acquisition-related contingent consideration using a risk-neutral Monte Carlo simulation valuation model. The model assigned payout probabilities to each of the earn-out periods and simulated 50,000 target revenue paths using median volatility of comparable companies. The revenue growth was adjusted to a risk neutral framework and earn-out value was discounted using risk-free rate as of the valuation date.
The Company allocated the total purchase consideration to tangible assets acquired, liabilities assumed and identifiable intangible assets acquired based on their estimated fair values with the excess of the purchase consideration over the aggregate fair values recorded as goodwill. The value of goodwill was 70% of the total purchase consideration and is primarily attributable to the expected synergies and increased revenue opportunities resulting from unifying Jill’s List network of practitioners with the Company’s wellness software. The goodwill is not deductible for tax purposes.
The acquisition provided the Company with two acquired intangible assets of value, internally developed software/technology with a remaining useful life of three years and network list with remaining useful life of two years. The internally developed software/technology represents the online platform that allows the Jill’s List
F-22
Table of Contents
network of doctors, patients, practitioners, and corporate clients to understand and access a suite of integrative healthcare and payment options. The network list represents the contact information for over 4,000 integrative health practitioners and companies. The fair values of the acquired intangible assets were based on the cost approach and the identifiable intangible assets are subject to amortization on a straight-line basis over their remaining useful lives.
The Company incurred and expensed $82,000 in acquisition-related costs, which are included within general and administrative expenses on the consolidated statements of operations for the year ended December 31, 2013.
The following table summarizes the consideration paid and the fair values of the assets acquired and liabilities assumed at the acquisition date (in thousands):
| Amount | ||||
| Tangible assets acquired |
$ | 10 | ||
| Intangible asset – internally developed software/technology |
518 | |||
| Intangible asset – network list |
420 | |||
| Goodwill |
1,827 | |||
| Liabilities assumed |
(164 | ) | ||
|
|
|
|||
| Fair value of total purchase consideration |
$ | 2,611 | ||
|
|
|
|||
The results of Jill’s List included in our consolidated statements of operations since the acquisition date, including revenues and net loss, were not material. Pro forma results of operations have not been presented because the acquisition was not material to our results of operations.
5. GOODWILL AND OTHER INTANGIBLE ASSETS
Goodwill represents the excess of the purchase price in a business combination over the fair value of net tangible and intangible assets acquired. Goodwill amounts are not amortized, but rather tested for impairment at least annually on October 1st. The Company’s goodwill balance is solely attributable to the acquisition of Petrol Designs LLC and Jill’s List. The goodwill balance was $1,827,000 as of December 31, 2013 and 2014, and $5,396,000 as of March 31, 2015. There was no impairment charge recorded against goodwill during the years ended December 31, 2013 and 2014 and the three months ended March 31, 2015.
The Company’s intangible assets consisted of the following (in thousands):
| December 31, 2013 | ||||||||||||||||
| Useful Life (Years) |
Gross Carrying Amount |
Accumulated Amortization |
Net Carrying Amount |
|||||||||||||
| Network list |
2 | $ | 420 | $ | (150 | ) | $ | 270 | ||||||||
| Technology |
3 | 518 | (123 | ) | 395 | |||||||||||
|
|
|
|
|
|
|
|||||||||||
| Total intangible assets |
$ | 938 | $ | (273 | ) | $ | 665 | |||||||||
|
|
|
|
|
|
|
|||||||||||
| December 31, 2014 | ||||||||||||||||
| Useful Life (Years) |
Gross Carrying Amount |
Accumulated Amortization |
Net Carrying Amount |
|||||||||||||
| Network list |
2 | $ | 420 | $ | (360 | ) | $ | 60 | ||||||||
|
|
|
|
|
|
|
|||||||||||
| Total intangible assets |
$ | 420 | $ | (360 | ) | $ | 60 | |||||||||
|
|
|
|
|
|
|
|||||||||||
F-23
Table of Contents
| March 31, 2015 | ||||||||||||||||
| Useful Life (Years) |
Gross Carrying Amount |
Accumulated Amortization |
Net Carrying Amount |
|||||||||||||
| (unaudited) | ||||||||||||||||
| Network list |
2 | $ | 420 | $ | (412 | ) | $ | 8 | ||||||||
| Technology |
3 | 913 | (48 | ) | 865 | |||||||||||
|
|
|
|
|
|
|
|||||||||||
| Total intangible assets |
$ | 1,333 | $ | (460 | ) | $ | 873 | |||||||||
|
|
|
|
|
|
|
|||||||||||
Amortization expense for intangible assets with finite lives was $35,000, $273,000, and $339,000 during the years ended December 31, 2012, 2013, and 2014, and $107,000 and $143,000 during the three months ended March 31, 2014 and 2015. As of December 31, 2014, the remaining $60,000 of the net book value related to the acquired intangible assets is expected to be fully amortized during the year ended December 31, 2015. Estimated future amortization expense as of March 31, 2015 was $237,000 for the remaining nine months of 2015, and $305,000, $304,000, and $27,000 for the years ending December 31, 2016, 2017, and 2018, respectively. During the year ended December 31, 2014, the Company recorded an impairment charge of $266,000 related to the acquired technology.
6. DEBT
Credit Facility
On January 12, 2015, the Company entered into an agreement with Silicon Valley Bank to provide a secured revolving credit facility that allows the Company to borrow up to $20,000,000 for working capital and general business requirements. Amounts outstanding under the credit facility will bear interest at the greater of the prime rate plus 0.5% or 3.25% with accrued interest payable on a monthly basis and outstanding and unpaid principal due upon maturity of the credit facility in January 2018. The credit facility is secured by substantially all of accounts receivable and other corporate assets of the Company. The Company also granted and pledged a security interest to the lender in all of its right, title, and interest in intellectual properties. The Company is also subject to certain reporting and financial performance covenants as well which require it to meet certain revenue targets. The Company did not draw down any amounts under the credit agreement during the three months ended March 31, 2015.
The Company entered into a credit facility with a bank during the year ended December 31, 2010 consisting of a revolving line of credit that was originally set to expire on February 1, 2013. In January 2013, the credit facility was amended to extend the expiration date to April 15, 2013. The revolving line of credit allowed for principal borrowings up to $2,000,000, had an interest rate comprised of the bank’s prime rate plus 1.75%, and was secured by all of the Company’s assets. The line was available for working capital and general business needs and amounts were available to be borrowed and repaid as needed. There were no amounts outstanding under the credit facility as of December 31, 2012 and the credit facility expired during the year ended December 31, 2013 with no amounts outstanding against the line of credit.
7. COMMITMENTS AND CONTINGENCIES
Operating Lease
The Company leases office facilities under various non-cancelable operating lease agreements with an original lease period expiring between 2015 and 2026. Rent expense during the years ended December 31, 2012, 2013, and 2014 was $1,131,000, $2,433,000, and $3,240,000 and during the three months ended March 31, 2014 and 2015 was $657,000 and $1,026,000.
Financing Obligation
The Company entered into a 15 year non-cancelable lease agreement for additional office space in San Luis Obispo, California in October 2013 with an anticipated lease commencement date in the second quarter
F-24
Table of Contents
of the year ending December 31, 2015. For accounting purposes only, the Company has concluded that it is the “deemed owner” of the building during the construction period. Therefore, the Company is required to record an asset with a corresponding construction financing obligation. Financing Obligation, Building – Leased represents the total payment obligations under the lease agreement described in Note 3. Payments under the lease will commence upon completion of construction. The portion of the lease obligations allocated to the land is being treated for accounting purposes as an operating lease that commenced in October 2013. The Company has not recognized any rent expense related to the financing obligation during the years ended December 31, 2012, 2013, and 2014 or the three months ended March 31, 2015.
Future Minimum Lease Payments
Future minimum lease payments under these non-cancelable lease agreements as of December 31, 2014 are as follows (in thousands):
| Year Ending December 31, |
Operating Leases |
Financing Obligation, Building- Leased |
Total | |||||||||
| 2015 |
$ | 3,442 | $ | 1,586 | $ | 5,028 | ||||||
| 2016 |
3,095 | 1,633 | 4,728 | |||||||||
| 2017 |
2,705 | 1,682 | 4,387 | |||||||||
| 2018 |
2,513 | 1,733 | 4,246 | |||||||||
| 2019 |
2,297 | 1,785 | 4,082 | |||||||||
| Thereafter |
14,107 | 21,076 | 35,183 | |||||||||
|
|
|
|
|
|
|
|||||||
| Total minimum lease payments |
$ | 28,159 | $ | 29,495 | $ | 57,654 | ||||||
|
|
|
|
|
|
|
|||||||
Litigation
From time to time, the Company may become involved in legal proceedings, claims, and litigation arising in the ordinary course of business. Management is not currently aware of any matters that it expects will have a material adverse effect on the consolidated financial position, results of operations, or cash flows of the Company.
8. STOCKHOLDERS’ DEFICIT
Common Stock
As of December 31, 2013 and 2014 and March 31, 2015, the Company had authorized 50,000,000 shares of common stock for issuance.
Common Stock Reserved for Issuance
The Company had reserved shares of common stock, on an as-if converted basis, for future issuance as follows:
| December 31, | March 31, 2015 |
|||||||||||
| 2013 | 2014 | |||||||||||
| (unaudited) | ||||||||||||
| Conversion of outstanding redeemable convertible preferred stock |
16,761,805 | 20,454,489 | 20,673,680 | |||||||||
| Exercise and conversion of preferred stock warrants |
87,500 | 87,500 | 89,177 | |||||||||
| Exercise of outstanding stock options |
1,604,434 | 2,568,781 | 3,163,039 | |||||||||
| Shares reserved for future option grants |
606,060 | 414,640 | 819,492 | |||||||||
|
|
|
|
|
|
|
|||||||
| Total |
19,059,799 | 23,525,410 | 24,745,388 | |||||||||
|
|
|
|
|
|
|
|||||||
F-25
Table of Contents
9. REDEEMABLE CONVERTIBLE PREFERRED STOCK
Redeemable convertible preferred stock as of December 31, 2013 and 2014 and March 31, 2015 consisted of the following (in thousands, except share data):
| December 31, 2013 | ||||||||||||||||
| Redeemable Convertible Preferred Stock: |
Shares Authorized |
Shares Issued and Outstanding |
Net Carrying Value |
Aggregate Liquidation Preference with Cumulative Dividends |
||||||||||||
| Series A |
1,319,942 | 1,319,940 | $ | 827 | $ | 836 | ||||||||||
| Series B |
988,420 | 988,411 | 1,198 | 1,214 | ||||||||||||
| Series C |
4,107,025 | 4,019,524 | 19,375 | 7,477 | ||||||||||||
| Series D |
5,308,880 | 5,308,875 | 29,350 | 13,612 | ||||||||||||
| Series E |
2,439,060 | 2,439,058 | 16,694 | 10,591 | ||||||||||||
| Series F |
2,686,000 | 2,685,997 | 27,780 | 27,106 | ||||||||||||
|
|
|
|
|
|
|
|
|
|||||||||
| Total |
16,849,327 | 16,761,805 | $ | 95,224 | $ | 60,836 | ||||||||||
|
|
|
|
|
|
|
|
|
|||||||||
| December 31, 2014 | ||||||||||||||||
| Redeemable Convertible Preferred Stock: |
Shares Authorized |
Shares Issued and Outstanding |
Net Carrying Value |
Aggregate Liquidation Preference with Cumulative Dividends |
||||||||||||
| Series A |
1,319,942 | 1,319,940 | $ | 836 | $ | 873 | ||||||||||
| Series B |
988,420 | 988,411 | 1,212 | 1,273 | ||||||||||||
| Series C |
4,107,025 | 4,019,524 | 25,025 | 7,869 | ||||||||||||
| Series D |
5,308,880 | 5,308,875 | 36,865 | 14,382 | ||||||||||||
| Series E |
2,439,060 | 2,439,058 | 19,789 | 11,221 | ||||||||||||
| Series F |
2,686,000 | 2,685,997 | 30,029 | 28,856 | ||||||||||||
| Series G |
3,692,685 | 3,692,684 | 52,692 | 53,162 | ||||||||||||
|
|
|
|
|
|
|
|
|
|||||||||
| Total |
20,542,012 | 20,454,489 | $ | 166,448 | $ | 117,636 | ||||||||||
|
|
|
|
|
|
|
|
|
|||||||||
| March 31, 2015 | ||||||||||||||||
| (unaudited) | ||||||||||||||||
| Redeemable Convertible Preferred Stock: |
Shares Authorized |
Shares Issued and Outstanding |
Net Carrying Value |
Aggregate Liquidation Preference with Cumulative Dividends |
||||||||||||
| Series A |
1,319,942 | 1,319,940 | $ | 824 | $ | 881 | ||||||||||
| Series B |
988,420 | 988,411 | 1,145 | 1,285 | ||||||||||||
| Series C |
4,107,025 | 4,019,524 | 25,814 | 7,966 | ||||||||||||
| Series D |
5,308,880 | 5,308,875 | 37,623 | 14,572 | ||||||||||||
| Series E |
2,439,060 | 2,439,058 | 20,585 | 11,376 | ||||||||||||
| Series F |
2,686,000 | 2,685,997 | 30,684 | 29,288 | ||||||||||||
| Series G |
3,692,685 | 3,692,684 | 53,484 | 54,026 | ||||||||||||
|
|
|
|
|
|
|
|
|
|||||||||
| Total |
20,542,012 | 20,454,489 | $ | 170,159 | $ | 119,394 | ||||||||||
|
|
|
|
|
|
|
|
|
|||||||||
During the year ended December 31, 2014, the Company issued 3,692,684 shares of Series G redeemable convertible preferred stock to investors for aggregate proceeds of $49,913,000, net of $130,000 of issuance costs.
The Company’s shares of redeemable convertible preferred stock (referred to individually within this Note as Series A, Series B, Series C, Series D, Series E, Series F, and Series G, or, collectively, as redeemable convertible preferred stock) have the following rights, preferences, privileges, and restrictions.
F-26
Table of Contents
Accretion of Redeemable Convertible Preferred Stock
Redeemable convertible preferred stock is accreted from its carrying value to its estimated redemption value as defined below using the effective interest method. Accretion to the carrying value is being recorded as an increase in the carrying value of the redeemable convertible preferred stock and a reduction of stockholder’s equity.
Dividends
The holders of shares of Series D, Series E, Series F, and Series G are entitled to receive annual cumulative dividends at a rate of $0.1450 per share with respect to Series D, $0.2582 per share with respect to Series E, $0.6515 per share with respect to Series F, and $0.9486 per share with respect to the Series G, when, as and if declared by the board of directors and prior and in preference to any declaration or payment of any dividend on the Series A, Series B, Series C, and common stock. However, the dividends for the Series E, Series F, and Series G are only payable upon a redemption of each respective series or in the event that each respective series elects to receive its liquidation preference in connection with a liquidation event.
After payment of dividends on the Series D, Series E, Series F, and Series G, the holders of shares of Series C are entitled to receive annual cumulative dividends at a rate of $0.0975 per share when, as and if declared by the board of directors and prior and in preference to any declaration or payment of any dividend on the Series A, Series B, and common stock.
Prior to the amendment described under the caption “Amendment and Restatement of Certificate of Incorporation” in Note 9, the dividends for the Series C and Series D were only payable (i) upon a redemption of each respective series, (ii) in the event that the holders of each respective series elected to receive their liquidation preference in connection with a liquidation event, or (iii) in connection with the conversion of each respective series into common stock, including in connection with an initial public offering.
After payment of dividends on the Series C, Series D, Series E, Series F, and Series G, the holders of shares of Series A and Series B are entitled to receive annual cumulative dividends at a rate of $0.0280 per share with respect to Series A and $0.0594 per share with respect to Series B when, as and if declared by the board of directors and prior and in preference to any declaration or payment of any dividend on the common stock. However, the dividends for the Series A and Series B will cease to accrue after March 20, 2015. After March 20, 2015, no dividends may be declared or paid on the Series A and Series B, except for dividends that accrued and were unpaid prior to March 20, 2015.
Prior to the amendment described under the caption “Amendment and Restatement of Certificate of Incorporation” in Note 9, the dividends for the Series A and Series B were only payable (i) upon a redemption of each respective series or (ii) in connection with the conversion of each respective series into common stock, including in connection with an initial public offering.
After payment of dividends on the Series A, Series B, Series C, Series D, Series E, Series F, and Series G, any additional dividends will be distributed among the holders of all series of redeemable convertible preferred stock and common stock pro rata based on the number of shares of common stock then held by each holder on an as-if-converted basis.
Voting Rights
The holders of Series A, Series B, Series C, Series D, Series E, Series F, and Series G vote on an as-if-converted basis with common stockholders on all matters.
Liquidation Rights
Prior to the amendment described under the caption “Subsequent Amendment and Restatement of Certificate of Incorporation” in Note 9, in the event of a liquidation, dissolution or winding up of the Company,
F-27
Table of Contents
either voluntary or involuntary, the holders of Series D, Series E, Series F, and Series G were entitled to receive an amount equal to $2.0720, $3.6880, $9.3075, and $13.5520 per share, plus any declared, accumulated, or accrued but unpaid dividends, prior and in preference to any distribution to the holders of Series A, Series B, Series C, and common stock. After payment to the holders of Series D, Series E, Series F, and Series G, the holders of Series C were entitled to receive an amount equal to $1.3932 per share, plus any declared, accumulated, or accrued but unpaid dividends, prior and in preference to any distribution to the holders of Series A, Series B, and common stock. After payment to the holders of Series C, the holders of Series B are entitled to receive an amount equal to $0.8480 per share, prior and in preference to any distribution to the holders of Series A and common stock. After payment to the holders of Series B, the holders of Series A are entitled to receive an amount equal to $0.4000 per share, prior and in preference to any distribution to the holders of common stock. After payment of all of the above amounts, any remaining amounts will be distributed among the holders of Series A, Series B, Series C, Series D, and common stock ratably on an as-if-converted basis until the holders of Series D have received an aggregate of $4.8692 per share of Series D then held by them, which shall increase by $0.7252 on January 1 of each year commencing January 1, 2013, until the date of the liquidity event. After payment of all such amounts, any remaining amounts will be distributed among the holders of Series A, Series B, Series C, and common stock ratably on an as-if-converted basis. However, each holder of Series D, Series E, Series F, and Series G will be deemed to have converted such holder’s shares of such series into shares of common stock immediately prior to the liquidation event if, as a result of such conversion, such holder would receive an amount greater than the amount such holder would have received if such holder did not convert such shares into shares of common stock.
Conversion Rights
Prior to the amendment described under the caption “Subsequent Amendment and Restatement of Certificate of Incorporation” in Note 9, each share of Series A, Series B, Series C, Series D, Series E, Series F, and Series G was convertible into one share of common stock at the option of the holder at any time. Each share of redeemable convertible preferred stock will be converted automatically upon the earlier of (i) the closing of a firm commitment underwritten public offering pursuant to a registration statement under the Securities Act of 1933, as amended, that results in aggregate gross proceeds to the Company of at least $50 million, or (ii) on the date specified by written consent or vote by the holders of a majority of then outstanding shares of redeemable convertible preferred stock, voting as a single class on an as-if-converted basis, provided that the Series G will not be converted automatically pursuant to such written consent or vote without the written consent or vote of at least 55% of the then outstanding shares of Series G in connection with a liquidation event where the amount of proceeds that the Series G would receive in such liquidation event after such conversion would be less than the amount of proceeds that the Series G would receive if no such conversion had occurred. Prior to the amendment described under the caption “Subsequent Amendment and Restatement of Certificate of Incorporation” in Note 9, upon conversion into common stock, the Series A, Series B, Series C and Series D were entitled to receive any unpaid cumulative dividends to which they were entitled as of the conversion date.
Redemption Rights
At any time after February 7, 2019, the holders of a majority of the then outstanding shares of Series C, Series D, or Series E can request redemption of all of the shares of the specific series electing redemption. After any such election to redeem the Series C, Series D, or Series E, additional series can elect redemption as follows: (i) the holders of a majority of the then outstanding shares of Series C, Series D or Series E that did not elect redemption can elect to redeem all shares of their respective series; (ii) the holders of a majority of the then outstanding shares of Series F can elect to redeem all shares of Series F, and (iii) the holders of 55% of the then outstanding shares of Series G can elect to redeem all shares of Series G. After notice of redemption of any of the Series C, Series D, Series E, Series F, or Series G, the holders of a majority of the then outstanding shares of each of Series A and Series B can request redemption of all of the shares of the Series A and Series B. The redemption price for each share of Series C, Series D, Series E, Series F, or Series G will be equal to the greater of (i) the original issue price plus declared or accrued but unpaid dividends and (ii) the amount such holders would receive
F-28
Table of Contents
if the Company were sold in a manner intended to achieve the highest equity value available. The redemption price for each share of Series A and Series B will be equal to the original issue price plus accumulated but unpaid dividends.
The Company may elect to pay the redemption price in full or in no more than three equal annual installments following the redemption election notice. If the Company elects to redeem shares of any series of redeemable convertible preferred stock in installments, then all other series of redeemable convertible preferred stock junior to such series must be redeemed in installments. If the Company retained earnings in excess of $300 million in the prior year, then the redemption price must be paid in one installment. If the funds of the Company available for redemption are insufficient to redeem the total number of shares of redeemable convertible preferred stock to be redeemed on that date, then legally available funds will be used to redeem the maximum possible number of shares the Series D, Series E, Series F, and Series G to be redeemed on that date, ratably among the holders of such shares. The remaining legally available funds will be used to redeem the maximum possible number of shares of the Series C to be redeemed on that date, ratably among the holders of such shares. Any remaining legally available funds will be used to redeem the maximum possible number of shares of the Series A and Series B to be redeemed on that date, ratably among the holders of such shares.
Based on the terms, the shares of Series A, Series B, Series C, Series D, Series E, Series F, and Series G are conditionally redeemable, but not mandatorily redeemable.
Amendment and Restatement of Certificate of Incorporation
In March 2015, the Company amended and restated its certificate of incorporation to modify the dividend, conversion and liquidation rights of the Series A, Series B, Series C and Series D redeemable convertible preferred stock. Under the amended and restated certificate of incorporation (the Restated Certificate), the Series C and Series D are no longer entitled to cumulative dividends upon a liquidation of the Company, and the Series A, Series B, Series C, and Series D are no longer entitled to receive cumulative dividends upon conversion into common stock, including in connection with an initial public offering. In addition, under the Restated Certificate, the conversion ratio of each series of redeemable convertible preferred stock, which was 1-to-1 for all series prior to the amendment, was adjusted to 1.088 for Series A, 1.0148 for Series B, 1.0192 for Series C, and 1.0218 for Series D. As a result of this amendment, the redeemable convertible preferred stock would convert into shares of common stock upon a qualifying event, including completion of an initial public offering, as follows:
| Preferred Stock |
Number of Shares, Actual |
Conversion Rate |
Number of Shares, As Converted |
|||||||||
| Series A |
1,319,940 | 1.0088 | 1,331,507 | |||||||||
| Series B |
988,411 | 1.0148 | 1,003,071 | |||||||||
| Series C |
4,019,524 | 1.0192 | 4,096,561 | |||||||||
| Series D |
5,308,875 | 1.0218 | 5,424,802 | |||||||||
| Series E |
2,439,058 | 1.0000 | 2,439,058 | |||||||||
| Series F |
2,685,997 | 1.0000 | 2,685,997 | |||||||||
| Series G |
3,692,684 | 1.0000 | 3,692,684 | |||||||||
|
|
|
|
|
|||||||||
| Total |
20,454,489 | 20,673,680 | ||||||||||
|
|
|
|
|
|||||||||
The Company has determined that the changes to the rights underlying the Series A, Series B, Series C and Series D preferred stock resulted in a modification, for accounting purposes, of these shares. The change in the fair value of the Series A, Series B, Series C, and Series D immediately before and after the amendment was recognized as a deemed dividend of $1,748,000 from the Series A, Series B, Series C and Series D preferred stock holders, which was recorded as a reduction of accumulated deficit during the three months ended March 31, 2015.
F-29
Table of Contents
The fair value of the Series A, Series B, Series C, and Series D preferred stock immediately before and after the amendment was estimated by the Company’s board of directors with assistance from a third-party valuation that utilized methodologies and assumptions consistent with the Company’s most recent common stock valuations, including on a minority, nonmarketable interest basis. The Company’s aggregate enterprise value was determined using a combination of valuation approaches, including an income approach and various market approaches, and under five different possible future scenarios.
10. PREFERRED STOCK WARRANT
In connection with entering into a credit facility during the year ended December 31, 2010, the Company issued a warrant to purchase 87,500 shares of Series C redeemable convertible preferred stock to the lender. The warrant was fully vested and exercisable upon issuance, expires in June 2020, and has an exercise price of $2.54 per share. During the three months ended March 31, 2015, the exercise price for the warrant was modified to $1.732 per share. The impact of this modification was not material. As of December 31, 2013 and 2014 and March 31, 2015, the warrant has not been exercised and is still outstanding. The warrant is required to be treated as a liability and recorded at estimated fair value, with changes in fair value at each reporting date recognized in the consolidated statements of operations, since the warrant is exercisable into conditionally redeemable shares of preferred stock. During the years ended December 31, 2012, 2013, and 2014, and the three months ended March 31, 2014 and 2015 $515,000, $302,000, $283,000, $22,000 and $150,000 were recognized in the consolidated statements of operations for changes in the fair value of the warrant. The Company estimated the fair value of the warrant using the methods described in Note 2.
11. STOCK-BASED COMPENSATION
Total stock-based compensation expenses were allocated as follows (in thousands):
| Year Ended December 31, | Three Months Ended March 31, |
|||||||||||||||||||
| 2012 | 2013 | 2014 | 2014 | 2015 | ||||||||||||||||
| (Unaudited) | ||||||||||||||||||||
| Cost of revenue |
$ | — | $ | 51 | $ | 220 | $ | 24 | $ | 100 | ||||||||||
| Sales and marketing |
— | 56 | 196 | 34 | 541 | |||||||||||||||
| Research and development |
— | 68 | 298 | 53 | 96 | |||||||||||||||
| General and administrative |
1,484 | 252 | 1,023 | 225 | 403 | |||||||||||||||
|
|
|
|
|
|
|
|
|
|
|
|||||||||||
| Total stock-based compensation expense |
$ | 1,484 | $ | 427 | $ | 1,737 | $ | 336 | $ | 1,140 | ||||||||||
|
|
|
|
|
|
|
|
|
|
|
|||||||||||
2009 Stock Option Plan
As of December 31, 2014 and March 31, 2015, there were 414,640 and 819,492 shares, respectively, available for issuance under the Company’s 2009 Stock Option Plan (2009 Plan), which provides for the grant of incentive stock options, nonstatutory stock options, and restricted stock to employees, directors, and consultants.
The exercise price of stock options under the 2009 Plan may not be less than 100% of the fair market value per share of the common stock on the date of grant. All stock options under the 2009 Plan have a term of no greater than 10 years from the date of grant. Incentive stock options held by an optionee who owned more than 10% of the total combined voting power of all classes of the Company’s stock have a term no greater than five years and an exercise price of not less than 110% of the fair market value per share of the common stock on the date of grant. Vesting of stock options is determined by the board of directors. No stock option may be exercised subsequent to its termination date.
The purchase price of a right to purchase common stock and the termination date of the offer under the 2009 Plan is determined by the board of directors. If the participant ceases to be an employee or other service provider
F-30
Table of Contents
of the Company, the Company has the right to repurchase all or a portion of the restricted stock from the participant at the original purchase price.
Determination of Fair Value
During the years ended December 31, 2012, 2013, and 2014 and the three months ended March 31, 2014 and 2015, the fair value of each stock option granted was estimated on the date of grant using the Black-Scholes option pricing model with the following assumptions:
| Year Ended December 31, | Three Months Ended March 31, | |||||||||
| 2012 | 2013 | 2014 | 2014 | 2015 | ||||||
| (Unaudited) | ||||||||||
| Expected term (in years) |
4.0 - 6.1 | 5.9 | 5.8 - 5.9 | 5.9 | 5.8 | |||||
| Expected volatility |
55% | 55% | 48% - 51% | 50% | 46% | |||||
| Risk-free interest rate |
0.5% - 0.9% | 1.6% | 1.7% - 1.9% | 1.7% | 1.4% | |||||
| Dividend yield |
0% | 0% | 0% | 0% | 0% | |||||
Compensation expense related to stock-based transactions is measured and recognized in the consolidated financial statements based on the fair value of the awards granted. The stock-based compensation expense, net of forfeitures, is recognized on a straight-line basis over the requisite service periods of the awards, which is generally four years.
Use of the Black-Scholes option-pricing model requires the input of highly subjective assumptions, including the fair value of the underlying common stock, expected term of the option, expected volatility of the price of the common stock, risk-free interest rates, and expected dividend yield of the common stock. The assumptions used in our option-pricing model represent management’s best estimates.
These assumptions and estimates are as follows:
Fair Value of Common Stock
The fair value of the common stock underlying our stock-based awards were determined by the Company’s board of directors, with input from management and a third-party valuation firm.
Expected Term
The expected term of employee stock options represents the weighted-average period that the stock options are expected to remain outstanding. The expected term assumptions were determined based on the vesting terms, exercise terms, and contractual lives of the options.
Expected Volatility
The expected volatility of stock options is estimated based upon the historical volatility of a number of publicly traded companies in similar stages of development and comparable industries for a period commensurate with the expected life.
Risk-Free Interest Rate
The risk-free interest rate is based on the U.S. Treasury yield curve in effect at the time of grant for zero-coupon U.S. Treasury notes with maturities approximately equal to the option’s expected term.
F-31
Table of Contents
Dividend Yield
The Company has never declared or paid any cash dividends and does not presently plan to pay cash dividends in the foreseeable future. Consequently, an expected dividend yield of zero was utilized.
Restricted Stock Awards
The Company has granted restricted stock awards (RSAs) under its stock plans to certain executives and nonexecutive employees. During the years ended December 31, 2012, 2013, and 2014 and the three months ended March 31, 2015, the Company did not grant any RSAs, and consequently, there was not any stock-based compensation expense associated with RSAs in those years.
A summary of RSA activity and related information is as follows:
| Number of RSAs |
Weighted- Average Grant Date Fair Value |
|||||||
| Subject to repurchase – January 1, 2012 |
1,093,390 | $ | 0.37 | |||||
| Repurchase right lapsed |
(393,640 | ) | 0.29 | |||||
| Awards repurchased and cancelled |
(38,257 | ) | 0.39 | |||||
|
|
|
|||||||
| Subject to repurchase – December 31, 2012 |
661,493 | $ | 0.41 | |||||
| Repurchase right lapsed |
(391,486 | ) | 0.41 | |||||
| Awards repurchased and cancelled |
(7,007 | ) | 0.54 | |||||
|
|
|
|||||||
| Subject to repurchase – December 31, 2013 |
263,000 | $ | 0.56 | |||||
| Repurchase right lapsed |
(144,000 | ) | 0.58 | |||||
| Awards repurchased and cancelled |
(2,000 | ) | 0.54 | |||||
|
|
|
|||||||
| Subject to repurchase – December 31, 2014 |
117,000 | $ | 0.54 | |||||
|
|
|
|||||||
| Repurchase right lapsed (unaudited) |
(117,000 | ) | $ | 0.54 | ||||
|
|
|
|||||||
| Subject to repurchase – March 31, 2015 (unaudited) |
— | |||||||
|
|
|
|||||||
As of December 31, 2013 and 2014 and March 31, 2015, the total RSA liability was $190,000, $88,000 and $0.
F-32
Table of Contents
The following table summarizes the stock option activity under the 2009 Plan and related information:
| Options Outstanding | ||||||||||||||||
| Number of Shares Underlying Outstanding Options |
Weighted- Average Exercise Price |
Weighted- Average Remaining Contractual Life (Years) |
Aggregate Intrinsic Value |
|||||||||||||
| Outstanding – January 1, 2012 |
1,321,597 | 0.93 | 9.4 | |||||||||||||
| Granted |
59,161 | 4.00 | 9.7 | |||||||||||||
| Exercised |
(357,724 | ) | 0.54 | — | ||||||||||||
| Forfeited or cancelled |
(13,745 | ) | 1.50 | — | ||||||||||||
|
|
|
|||||||||||||||
| Outstanding – December 31, 2012 |
1,009,289 | 1.24 | 8.6 | |||||||||||||
| Granted |
613,029 | 7.71 | 9.5 | |||||||||||||
| Exercised |
(1,070 | ) | 1.39 | — | ||||||||||||
| Forfeited or cancelled |
(16,814 | ) | 3.56 | — | ||||||||||||
|
|
|
|||||||||||||||
| Outstanding – December 31, 2013 |
1,604,434 | 3.69 | 8.3 | |||||||||||||
| Granted |
1,009,625 | 10.66 | 9.2 | |||||||||||||
| Exercised |
(7,072 | ) | 1.82 | — | ||||||||||||
| Forfeited or cancelled |
(38,206 | ) | 6.88 | — | ||||||||||||
|
|
|
|||||||||||||||
| Outstanding – December 31, 2014 |
2,568,781 | $ | 6.39 | 8.1 | $ | 20,773 | ||||||||||
|
|
|
|||||||||||||||
| Granted (unaudited) |
614,375 | 14.48 | 9.9 | |||||||||||||
| Exercised (unaudited) |
(887 | ) | 3.90 | — | ||||||||||||
| Forfeited or cancelled (unaudited) |
(19,230 | ) | 6.96 | — | ||||||||||||
|
|
|
|||||||||||||||
| Outstanding – March 31, 2015 (unaudited) |
3,163,039 | $ | 7.96 | 8.2 | $ | 20,682 | ||||||||||
|
|
|
|||||||||||||||
| Exercisable – March 31, 2015 (unaudited) |
1,344,196 | $ | 3.57 | 6.9 | $ | 14,683 | ||||||||||
|
|
|
|||||||||||||||
| Vested and expected to vest – March 31, 2015 (unaudited) |
3,098,025 | $ | 7.89 | 8.2 | $ | 20,470 | ||||||||||
|
|
|
|||||||||||||||
| Exercisable – December 31, 2014 |
1,225,655 | $ | 2.99 | 7.0 | $ | 14,076 | ||||||||||
|
|
|
|||||||||||||||
| Vested and expected to vest – December 31, 2014 |
2,515,143 | $ | 6.32 | 8.0 | $ | 20,510 | ||||||||||
|
|
|
|||||||||||||||
The weighted-average grant-date fair value of options granted during the years ended December 31, 2012, 2013, and 2014 and the three months ended March 31, 2014 and 2015 was $2.05, $4.64, $5.17, $5.62 and $6.50 per share, respectively. Total intrinsic value of stock options exercised during the years ended December 31, 2012, 2013, and 2014 and the three months ended March 31, 2014 and 2015 was $8,000, $5,000, $90,000, $40,000 and $9,000, respectively. The total fair value of options vested during the years ended December 31, 2012, 2013, and 2014 and the three months ended March 31, 2014 and 2015 was $43,000, $73,000, $1,546,000, $424,000 and $588,000, respectively.
As of December 31, 2013 and 2014 and March 31, 2015, the total unrecognized stock-based compensation expense for unvested stock options, net of expected forfeitures, was $2,616,000, $5,948,000 and $9,233,000, respectively, which is expected to be recognized over a weighted-average period of 3.4 years, 3.0 years and 3.1 years, respectively.
Other Stock-Based Compensation
During the three months ended March 31, 2015, the Company recorded stock-based compensation expense of $468,000 related to the contingent bonus payable to certain former employees of Fitness Mobile Apps in shares of the Company’s common stock for the post-combination employment services. Certain new investors of the Company purchased common stock from certain stockholders who are also executive employees of the Company for
F-33
Table of Contents
consideration in excess of the estimated fair value of common stock, which resulted in stock-based compensation expense of $1,436,000 during the year ended December 31, 2012. There were no stock transactions, other than stock option grants in the Company’s normal practice, that resulted in stock-based compensation expense during the years ended December 31, 2013 and 2014.
12. INCOME TAXES
The following table presents domestic and foreign components of loss before income taxes for the periods presented (in thousands):
| Year Ended December 31, | ||||||||||||
| 2012 | 2013 | 2014 | ||||||||||
| Domestic |
$ | (5,676 | ) | $ | (16,569 | ) | $ | (24,841 | ) | |||
| Foreign |
170 | 385 | 351 | |||||||||
|
|
|
|
|
|
|
|||||||
| Loss before provision for income taxes |
$ | (5,506 | ) | $ | (16,184 | ) | $ | (24,490 | ) | |||
|
|
|
|
|
|
|
|||||||
The components of income tax expense were as follows (in thousands):
| Year Ended December 31, |
||||||||||||
| 2012 | 2013 | 2014 | ||||||||||
| Current provisions for income taxes: |
||||||||||||
| Federal |
$ | — | $ | — | $ | — | ||||||
| State |
— | 5 | 5 | |||||||||
| Foreign |
13 | 32 | 67 | |||||||||
|
|
|
|
|
|
|
|||||||
| Total current |
13 | 37 | 72 | |||||||||
|
|
|
|
|
|
|
|||||||
| Deferred tax provision (benefit): |
||||||||||||
| Foreign |
— | 26 | 44 | |||||||||
|
|
|
|
|
|
|
|||||||
| Total provision for income taxes |
$ | 13 | $ | 63 | $ | 116 | ||||||
|
|
|
|
|
|
|
|||||||
The tax effects of temporary differences and related deferred tax assets and liabilities as of December 31, 2013 and 2014 are as follows (in thousands):
| Year Ended December 31, |
||||||||
| 2013 | 2014 | |||||||
| Deferred tax assets: |
||||||||
| Net operating losses carryforwards |
$ | 14,057 | $ | 22,317 | ||||
| Accrued expenses and reserves |
448 | 554 | ||||||
| Nonqualified stock options |
196 | 479 | ||||||
| Deferred rent |
251 | 388 | ||||||
| Depreciation |
82 | |
286 |
| ||||
| Other |
131 | 222 | ||||||
|
|
|
|
|
|||||
| Total deferred tax assets |
15,165 | 24,246 | ||||||
| Deferred tax liabilities: |
||||||||
| Amortization |
(759 | ) | (230 | ) | ||||
| Other |
(82 | ) | (74 | ) | ||||
|
|
|
|
|
|||||
| Total deferred tax liabilities |
(841 | ) | (304 | ) | ||||
|
|
|
|
|
|||||
| Valuation allowance |
(14,351 | ) | (24,013 | ) | ||||
|
|
|
|
|
|||||
| Net deferred tax liabilities |
$ | (27 | ) | $ | (71 | ) | ||
|
|
|
|
|
|||||
F-34
Table of Contents
The following table presents a reconciliation of statutory federal rate and the Company’s effective tax rate for the periods presented:
| Year Ended December 31, |
||||||||||||
| 2012 | 2013 | 2014 | ||||||||||
| Tax at statutory federal rate |
34 | % | 34 | % | 34 | % | ||||||
| State tax – net of federal benefit |
5.6 | 5.3 | 5.4 | |||||||||
| Change in fair value of preferred stock warrant |
(3.7 | ) | (0.7 | ) | (0.5 | ) | ||||||
| Change in fair value of contingent consideration |
— | (1 | ) | 2.3 | ||||||||
| Change in valuation allowance |
(34.9 | ) | (36.4 | ) | (39.5 | ) | ||||||
| Other |
(1.2 | ) | (1.6 | ) | (2.2 | ) | ||||||
|
|
|
|
|
|
|
|||||||
| Effective tax rate |
(0.2 | )% | (0.4 | )% | (0.5 | )% | ||||||
It is the Company’s intention to reinvest undistributed earnings of its foreign subsidiaries and thereby indefinitely postpone their remittance. Accordingly, no provision has been made for foreign withholding taxes or United States income taxes, which may become payable if undistributed earnings of the foreign subsidiary were paid as dividends to the Company. Should the Company decide to no longer indefinitely reinvest such earnings outside the United States, the Company would have to adjust the income tax provision in the period management makes such determination.
As of December 31, 2013 and 2014, respectively, deferred tax assets included federal net operating loss carryforwards of $37,469,000 and $58,846,000, and state net operating loss carryforwards of $30,381,000 and $47,386,000. The federal net operating loss carryforwards start to expire in the year ending December 31, 2025. The state net operating loss carryforwards start to expire in the year ending December 31, 2015.
As of December 31, 2013 and 2014, the Company had no assurance that future taxable income would be sufficient to fully utilize the net operating loss carryforwards and other deferred tax assets in the future. Consequently, the Company determined that a valuation allowance of $14,351,000 and $24,013,000 as of the years ended December 31, 2013 and 2014, respectively, was needed to offset the deferred tax assets resulting mainly from the net operating loss carryforwards. The net change in the valuation allowance during the years ended December 31, 2013 and 2014 was an increase of $5,890,000 and $9,662,000, respectively.
As a result of certain realization requirements related to stock-based compensation expense, the table of deferred tax assets and liabilities shown above does not include certain deferred tax assets as of December 31, 2013 and 2014, that arose directly from (or the use of which was postponed by) tax deductions related to equity compensation that are greater than the compensation recognized for financial reporting. Equity will be increased by $485,000 if and when such deferred tax assets are ultimately realized.
Section 382 of the Internal Revenue Code of 1986, as amended, places a limitation on the realizability of NOLs in future periods if the ownership of the Company has changed more than 50% within a three-year period. The Company is performing a study to determine whether NOL limitations exist under Section 382. As such, the Company’s existing NOLs may be subject to limitations arising from previous ownership changes, and if the Company did undergo an ownership change in connection with or after this offering, its ability to utilize NOLs could be further limited by Section 382 of the Code. However, any limitations would not have impacted the results of its operations and cash flows because the Company has recorded a valuation allowance against its net deferred tax assets as of December 31, 2013 and 2014.
The Company evaluates tax positions for recognition using a more-likely-than-not recognition threshold, and those tax positions eligible for recognition are measured as the largest amount of tax benefit that is greater than 50% likely of being realized upon the effective settlement with a taxing authority that has full knowledge of all relevant information. As of December 31, 2014 and 2013, the Company has not identified any unrecognized income tax benefits and uncertain tax positions, as well as any associated interest and penalties.
F-35
Table of Contents
The Company’s 2011 to 2014 tax years remain subject to examination by the U.S. federal tax authorities and the Company’s 2010 to 2014 tax years remain subject to examination by the state tax authorities.
13. NET INCOME (LOSS) AND PRO FORMA NET INCOME (LOSS) PER SHARE ATTRIBUTABLE TO COMMON STOCKHOLDERS
The following table sets for the computation of the Company’s basic and diluted net loss per share attributable to common stockholders for the periods presented (in thousands, except share and per share data):
| Year Ended December 31, | Three Months Ended March 31, | |||||||||||||||||||
| 2012 | 2013 | 2014 | 2014 | 2015 | ||||||||||||||||
| (unaudited) | ||||||||||||||||||||
| Net loss attributable to common stockholders |
$ | (18,544 | ) | $ | (44,139 | ) | $ | (45,917 | ) | $ | (10,675 | ) | $ | (11,572 | ) | |||||
|
|
|
|
|
|
|
|
|
|
|
|||||||||||
| Net loss per share attributable to common stockholders, basic and diluted |
$ | (1.84 | ) | $ | (4.10 | ) | $ | (4.17 | ) | $ | (0.97 | ) | $ |
(1.03 |
) | |||||
|
|
|
|
|
|
|
|
|
|
|
|||||||||||
| Weighted-average shares used to compute net loss per share attributable to common stockholders, basic and diluted |
10,102,216 | 10,757,938 | 11,013,658 | 10,968,167 | 11,201,755 | |||||||||||||||
|
|
|
|
|
|
|
|
|
|
|
|||||||||||
The following shares have been excluded from the calculation of diluted net loss per share attributable to common stockholders for each period presented because they are anti-dilutive:
| Year Ended December 31, | Three Months Ended March 31, |
|||||||||||||||||||
| 2012 | 2013 | 2014 | 2014 | 2015 | ||||||||||||||||
| (unaudited) | ||||||||||||||||||||
| Redeemable convertible preferred stock |
16,761,805 | 16,761,805 | 20,454,489 | 20,454,489 | 20,454,489 | |||||||||||||||
| Options to purchase common stock |
1,009,289 | 1,604,434 | 2,568,781 | 1,957,119 | 3,163,039 | |||||||||||||||
| Common stock subject to repurchase |
661,493 | 263,000 | 117,000 | 181,000 | — | |||||||||||||||
| Preferred stock warrant |
87,500 | 87,500 | 87,500 | 87,500 | 87,500 | |||||||||||||||
|
|
|
|
|
|
|
|
|
|
|
|||||||||||
| Total |
18,520,087 | 18,716,739 | 23,227,770 | 22,680,108 | 23,617,528 | |||||||||||||||
|
|
|
|
|
|
|
|
|
|
|
|||||||||||
F-36
Table of Contents
Unaudited Pro Forma Net Income (Loss) Per Share Attributable to Common Stockholders
The following table sets forth the computation of the Company’s unaudited pro forma basic and diluted net loss per share attributable to common stockholders (in thousands, except share and per share data):
| Year ended December 31, 2014 |
Three Months Ended March 31, 2015 |
|||||||
| Net loss attributable to common stockholders |
$ | (45,917 | ) | $ | (11,572 | ) | ||
| Accretion of redeemable convertible preferred stock |
21,311 | 5,459 | ||||||
| Deemed dividend—preferred stock modification |
— | (1,748 | ) | |||||
| Change in fair value of preferred stock warrant |
283 | 150 | ||||||
|
|
|
|
|
|||||
| Net loss used in computing pro forma net loss attributable to common stockholders, basic and diluted |
$ | (24,323 | ) | $ | (7,711 | ) | ||
|
|
|
|
|
|||||
| Weighted-average shares of common stock used in computing net loss attributable to common stockholders, basic and diluted |
11,013,658 | 11,201,755 | ||||||
| Pro forma adjustment to reflect assumed conversion of redeemable convertible preferred stock |
20,269,002 | 20,673,680 | ||||||
|
|
|
|
|
|||||
| Weighted-average shares of common stock used in computing pro forma net loss per share attributable to common stockholders, basic and diluted |
31,282,660 | 31,875,435 | ||||||
|
|
|
|
|
|||||
| Pro forma net loss per share attributable to common stockholders, basic and diluted |
$ | (0.78 | ) | $ | (0.24 | ) | ||
|
|
|
|
|
|||||
14. SEGMENTS AND INFORMATION BY GEOGRAPHIC LOCATION
Operating segments are components of an enterprise for which separate financial information is available and is evaluated regularly by the Company’s chief operating decision maker in deciding how to allocate resources and assessing performance. The Company’s chief operating decision maker is its Chief Executive Officer.
The Chief Executive Officer reviews financial information presented on a consolidated basis for purposes of allocating resources and evaluating financial performance. Accordingly, the Company has a single reporting segment.
Revenue
The following table presents the Company’s total revenue by product line (in thousands):
| Year Ended December 31, | Three Months Ended March 31, |
|||||||||||||||||||
| 2012 | 2013 | 2014 | 2014 | 2015 | ||||||||||||||||
| (unaudited) | ||||||||||||||||||||
| Subscription and services |
$ | 19,707 | $ | 28,225 | $ | 40,501 | $ | 8,869 | $ | 13,461 | ||||||||||
| Payments |
9,515 | 17,122 | 26,060 | 5,902 | 8,022 | |||||||||||||||
| Product and other |
2,777 | 3,340 | 3,449 | 882 | 780 | |||||||||||||||
|
|
|
|
|
|
|
|
|
|
|
|||||||||||
| Total |
$ | 31,999 | $ | 48,687 | $ | 70,010 | $ | 15,653 | $ | 22,263 | ||||||||||
|
|
|
|
|
|
|
|
|
|
|
|||||||||||
The following table presents the Company’s total revenue by geography based on the billing address of the customer (in thousands):
| Year Ended December 31, | Three Months Ended March 31, |
|||||||||||||||||||
| 2012 | 2013 | 2014 | 2014 | 2015 | ||||||||||||||||
| (unaudited) | ||||||||||||||||||||
| United States |
$ | 27,964 | $ | 41,723 | $ | 58,802 | $ | 13,295 | $ | 18,666 | ||||||||||
| Other |
4,035 | 6,964 | 11,208 | 2,358 | 3,597 | |||||||||||||||
|
|
|
|
|
|
|
|
|
|
|
|||||||||||
| Total |
$ | 31,999 | $ | 48,687 | $ | 70,010 | $ | 15,653 | $ | 22,263 | ||||||||||
|
|
|
|
|
|
|
|
|
|
|
|||||||||||
F-37
Table of Contents
Substantially all of our assets were attributable to operations in the United States as of December 31, 2013 and 2014 and March 31, 2015.
15. PROFIT SHARING PLAN
The Company has a 401(k) profit sharing plan (401(k) Plan) that covers all eligible employees. Each participant may elect to contribute up to the maximum limit by federal law. The Company makes a 3% safe harbor contribution, and may also make discretionary contributions. The Company’s chief executive officer, chief operating officer and chief financial officer are trustees of the 401(k) Plan. Employer contributions totaled $474,000, $685,000, $812,000, $260,000 and $376,000 during the years ended December 31, 2012, 2013, and 2014 and the three months ended March 31, 2014 and 2015.
16. RELATED-PARTY TRANSACTIONS
The Company has employment agreements with the chief executive officer and chief operating officer of the Company, both of whom are stockholders, which have been extended until December 31, 2015. The agreements provide for annual compensation as determined and approved by the board of directors. The Company’s obligation under the employment contracts accrues only as the services are rendered.
The Company incurred $130,000, $216,000, $554,000, $104,000 and $82,000 in office repair, maintenance, building fixtures and other professional services expenses with related parties during the years ended December 31, 2012, 2013, and 2014 and the three months ended March 31, 2014 and 2015.
During the year ended December 31, 2012, the Company’s chief executive officer repaid the full amount due on a note receivable, which had been issued in 2010 in exchange for a cash loan in the amount of $300,000. The note was repaid with interest according to the terms of the agreement.
17. STOCK SPLIT
In June 2015, the Company’s board of directors approved the amendment and restatement of the Company’s certificate of incorporation to give effect to a 2.5-for-1 stock split of the Company’s common stock and redeemable convertible preferred stock (collectively, the “Capital Stock”), which became effective on June 4, 2015. Accordingly, (i) each one share of outstanding Capital Stock was split into 2.5 shares of Capital Stock of the same class and series, as applicable; (ii) the number of shares of Capital Stock issuable on the exercise of each outstanding warrant or option to purchase Capital Stock was proportionately increased on a 2.5-for-1 basis; (iii) the exercise price of each outstanding warrant or option to purchase Capital Stock was proportionately reduced on a 2.5-for-1 basis; (iv) the authorized number of each class and series of Capital Stock was proportionally increased in accordance with the 2.5-for-1 stock split; and (v) the par value of each class of Capital Stock was proportionately reduced in accordance with the 2.5-for-1 stock split. All of the share numbers, share prices, and exercise prices have been adjusted within these financial statements, on a retroactive basis, to reflect this 2.5-for-1 stock split.
F-38
Table of Contents

MINDBODY®
LOVE YOUR BUSINESS
Current map area
Search This Area
Sign Up Now Sara Pritchard Growing up in Thousand Oaks, constantly running
around, riding Description Power Flow will held create an opp inward and become persent on a Explore your edges as you build tone, balance and detoxify you
Table of Contents

MINDBODY
LOVE YOUR BUSINESS
Table of Contents
PART II
INFORMATION NOT REQUIRED IN PROSPECTUS
ITEM 13. OTHER EXPENSES OF ISSUANCE AND DISTRIBUTION.
The following table sets forth all expenses to be paid by the Registrant, other than underwriting discounts and commissions, upon completion of this offering. All amounts shown are estimates except for the SEC registration fee, the FINRA filing fee and the exchange listing fee.
| SEC registration fee |
$ | 14,332 | ||
| FINRA filing fee |
19,001 | |||
| Exchange listing fee |
125,000 | |||
| Printing and engraving expenses |
300,000 | |||
| Legal fees and expenses |
1,527,000 | |||
| Accounting fees and expenses |
1,435,000 | |||
| Transfer agent and registrar fees |
3,500 | |||
| Miscellaneous expenses |
365,000 | |||
|
|
|
|||
| Total |
$ | 3,788,833 | ||
|
|
|
ITEM 14. INDEMNIFICATION OF DIRECTORS AND OFFICERS.
Section 145 of the Delaware General Corporation Law authorizes a corporation’s board of directors to grant, and authorizes a court to award, indemnity to officers, directors and other corporate agents.
The Registrant expects to adopt an amended and restated certificate of incorporation, which will become effective immediately prior to the completion of this offering, and which will contain provisions that limit the liability of its directors for monetary damages to the fullest extent permitted by Delaware law. Consequently, the Registrant’s directors will not be personally liable to it or its stockholders for monetary damages for any breach of fiduciary duties as directors, except liability for the following:
| • | any breach of their duty of loyalty to the Registrant or its stockholders; |
| • | any act or omission not in good faith or that involves intentional misconduct or a knowing violation of law; |
| • | unlawful payments of dividends or unlawful stock repurchases or redemptions as provided in Section 174 of the Delaware General Corporation Law; or |
| • | any transaction from which they derived an improper personal benefit. |
Any amendment to, or repeal of, these provisions will not eliminate or reduce the effect of these provisions in respect of any act, omission or claim that occurred or arose prior to that amendment or repeal. If the Delaware General Corporation Law is amended to provide for further limitations on the personal liability of directors of corporations, then the personal liability of the Registrant’s directors will be further limited to the greatest extent permitted by the Delaware General Corporation Law.
In addition, the Registrant expects to adopt amended and restated bylaws, which will become effective immediately prior to the completion of this offering, and which will provide that it will indemnify, to the fullest extent permitted by law, any person who is or was a party or is threatened to be made a party to any action, suit or proceeding by reason of the fact that he or she is or was one of its directors or officers or is or was serving at its request as a director or officer of another corporation, partnership, joint venture, trust or other enterprise. The Registrant’s amended and restated bylaws are expected to provide that it may indemnify to the fullest extent
II-1
Table of Contents
permitted by law any person who is or was a party or is threatened to be made a party to any action, suit or proceeding by reason of the fact that he or she is or was one of its employees or agents or is or was serving at its request as an employee or agent of another corporation, partnership, joint venture, trust or other enterprise. The Registrant’s amended and restated bylaws will also provide that the Registrant must advance expenses incurred by or on behalf of a director or officer in advance of the final disposition of any action or proceeding, subject to limited exceptions.
Further, the Registrant has entered into or will enter into indemnification agreements with each of its directors and executive officers that may be broader than the specific indemnification provisions contained in the Delaware General Corporation Law. These indemnification agreements require the Registrant, among other things, to indemnify its directors and executive officers against liabilities that may arise by reason of their status or service. These indemnification agreements also require the Registrant to advance all expenses incurred by the directors and executive officers in investigating or defending any such action, suit or proceeding. The Registrant believes that these agreements are necessary to attract and retain qualified individuals to serve as directors and executive officers.
The limitation of liability and indemnification provisions that are expected to be included in the Registrant’s amended and restated certificate of incorporation, amended and restated bylaws and in indemnification agreements that the Registrant has entered into or will enter into with its directors and executive officers may discourage stockholders from bringing a lawsuit against its directors and executive officers for breach of their fiduciary duties. They may also reduce the likelihood of derivative litigation against the Registrant’s directors and executive officers, even though an action, if successful, might benefit the Registrant and other stockholders. Further, a stockholder’s investment may be adversely affected to the extent that the Registrant pays the costs of settlement and damage awards against directors and executive officers as required by these indemnification provisions. At present, the Registrant is not aware of any pending litigation or proceeding involving any person who is or was one of its directors, officers, employees or other agents or is or was serving at its request as a director, officer, employee or agent of another corporation, partnership, joint venture, trust or other enterprise, for which indemnification is sought, and the Registrant is not aware of any threatened litigation that may result in claims for indemnification.
The Registrant has obtained insurance policies under which, subject to the limitations of the policies, coverage is provided to its directors and executive officers against loss arising from claims made by reason of breach of fiduciary duty or other wrongful acts as a director or executive officer, including claims relating to public securities matters, and to the Registrant with respect to payments that may be made by it to these directors and executive officers pursuant to its indemnification obligations or otherwise as a matter of law.
Certain of the Registrant’s non-employee directors may, through their relationships with their employers, be insured and/or indemnified against certain liabilities incurred in their capacity as members of the Registrant’s board of directors.
The underwriting agreement filed as Exhibit 1.1 to this registration statement will provide for indemnification by the underwriters of the Registrant and its officers and directors for certain liabilities arising under the Securities Act or otherwise.
ITEM 15. RECENT SALES OF UNREGISTERED SECURITIES.
Since January 1, 2012, the Registrant issued the following unregistered securities:
Preferred Stock Issuances
On October 19, 2012, the Registrant sold an aggregate of 2,685,997 shares of its Series F redeemable convertible preferred stock to six accredited investors for an aggregate purchase price of $24,999,998.72.
II-2
Table of Contents
On February 12, 2014, the Registrant sold an aggregate of 3,692,684 shares of its Series G redeemable convertible preferred stock to eight accredited investors for an aggregate purchase price of $50,043,267.12.
Common Stock Issuance
On July 2, 2013, the Registrant issued to a service provider 2,905 shares of its common stock in consideration for placement services that resulted in the hiring of an executive officer of the Registrant.
Option Issuances
Since January 1, 2012, the Registrant granted to its directors, officers, employees, consultants and other service providers options to purchase an aggregate of 3,538,565 shares of its common stock under its 2009 Stock Option Plan at exercise prices ranging from approximately $4.00 to $14.496 per share.
Since January 1, 2012, the Registrant issued and sold to its directors, officers, employees, consultants and other service providers an aggregate of 378,245 shares of its common stock upon the exercise of options under its 2009 Stock Option Plan at exercise prices ranging from approximately $0.544 to $9.936 per share, for an aggregate exercise price of $268,381.93.
None of the foregoing transactions involved any underwriters, underwriting discounts or commissions, or any public offering. The Registrant believes the offers, sales and issuances of the above securities were exempt from registration under the Securities Act by virtue of Section 4(a)(2) of the Securities Act (or Regulation D promulgated thereunder) because the issuance of securities to the recipients did not involve a public offering, or in reliance on Rule 701 because the transactions were pursuant to compensatory benefit plans or contracts relating to compensation as provided under such rule. The recipients of the securities in each of these transactions represented their intentions to acquire the securities for investment only and not with a view to or for sale in connection with any distribution thereof, and appropriate legends were placed upon the stock certificates issued in these transactions. All recipients had adequate access, through their relationships with the Registrant, to information about the Registrant. The sales of these securities were made without any general solicitation or advertising.
On April 6, 2015, the Registrant granted to a director an option to purchase an aggregate of 60,000 shares of its common stock under its 2009 Stock Option Plan at an exercise price of $14.496 per share. The Registrant believes the offer, sale and issuance of these securities were exempt from registration under the Securities Act by virtue of Regulation D promulgated under Section 4(a)(2) of the Securities Act because the recipient of the securities was an accredited investor.
Shares Issued in Connection with Acquisitions
Since January 1, 2012, the Registrant issued an aggregate of 123,090 shares of its common stock to one individual in connection with its acquisition of a company.
Since January 1, 2012, the Registrant issued an aggregate of 103,617 shares of its common stock to one entity in connection with its acquisition of substantially all of such entity’s assets.
None of the foregoing transactions involved any underwriters, underwriting discounts or commissions, or any public offering. The Registrant believes the offers, sales and issuances of the securities in the first acquisition above were exempt from registration under the Securities Act by virtue of Section 4(a)(2) of the Securities Act because (i) the sale of these securities was made without any general solicitation or advertising, (ii) there was one offeree, (iii) the recipient of the securities represented her intention to acquire the securities for investment only and not with a view to or for sale in connection with any distribution thereof, (iv) the recipient of the securities
II-3
Table of Contents
had adequate access to information about the Registrant, and (v) appropriate legends were placed upon the stock certificates issued in this transaction. The Registrant believes the offers, sales and issuances of the securities in the second acquisition above were exempt from registration under the Securities Act by virtue of Regulation D promulgated under Section 4(a)(2) of the Securities Act because the recipient of the securities was an accredited investor.
ITEM 16. EXHIBITS AND FINANCIAL STATEMENT SCHEDULES.
(a) Exhibits.
The Registrant has filed the exhibits listed on the accompanying Exhibit Index of this Registration Statement.
(b) Financial Statement Schedules.
All financial statement schedules are omitted because the information called for is not required or is shown either in the consolidated financial statements or in the notes thereto.
ITEM 17. UNDERTAKINGS.
The undersigned Registrant hereby undertakes to provide to the underwriters at the closing specified in the underwriting agreement certificates in such denominations and registered in such names as required by the underwriters to permit prompt delivery to each purchaser.
Insofar as indemnification for liabilities arising under the Securities Act of 1933 may be permitted to directors, officers and controlling persons of the registrant pursuant to the foregoing provisions, or otherwise, the registrant has been advised that in the opinion of the Securities and Exchange Commission such indemnification is against public policy as expressed in the Act and is, therefore, unenforceable. In the event that a claim for indemnification against such liabilities (other than the payment by the registrant of expenses incurred or paid by a director, officer or controlling person of the registrant in the successful defense of any action, suit or proceeding) is asserted by such director, officer or controlling person in connection with the securities being registered, the registrant will, unless in the opinion of its counsel the matter has been settled by controlling precedent, submit to a court of appropriate jurisdiction the question whether such indemnification by it is against public policy as expressed in the Act and will be governed by the final adjudication of such issue.
The undersigned Registrant hereby undertakes that:
| (1) | For purposes of determining any liability under the Securities Act of 1933, the information omitted from the form of prospectus filed as part of this registration statement in reliance upon Rule 430A and contained in a form of prospectus filed by the Registrant pursuant to Rule 424(b)(1) or (4) or 497(h) under the Securities Act shall be deemed to be part of this registration statement as of the time it was declared effective. |
| (2) | For the purpose of determining any liability under the Securities Act of 1933, each post-effective amendment that contains a form of prospectus shall be deemed to be a new registration statement relating to the securities offered therein, and the offering of such securities at that time shall be deemed to be the initial bona fide offering thereof. |
II-4
Table of Contents
SIGNATURES
Pursuant to the requirements of the Securities Act of 1933, the Registrant has duly caused this registration statement on Form S-1 to be signed on its behalf by the undersigned, thereunto duly authorized, in San Luis Obispo, California, on the 16th day of June, 2015.
| MINDBODY, INC. | ||
| By: | /s/ Richard L. Stollmeyer | |
| Richard L. Stollmeyer | ||
| President and Chief Executive Officer | ||
Pursuant to the requirements of the Securities Act of 1933, this registration statement on Form S-1 has been signed by the following persons in the capacities and on the dates indicated.
| Signature |
Title |
Date | ||
| /s/ Richard L. Stollmeyer | President, Chief Executive Officer and Director | June 16, 2015 | ||
|
Richard L. Stollmeyer |
(Principal Executive Officer) | |||
| /s/ Brett White | Chief Financial Officer | June 16, 2015 | ||
|
Brett White |
(Principal Financial and Accounting Officer) | |||
| * | Director | June 16, 2015 | ||
|
Katherine Blair Christie |
||||
| * | Director | June 16, 2015 | ||
|
Jeremy Levine |
||||
| * |
Director | June 16, 2015 | ||
|
Eric Liaw |
||||
| * |
Director | June 16, 2015 | ||
|
Robert Murphy |
||||
| * |
Director | June 16, 2015 | ||
|
Tyler Newton |
||||
| * |
Director | June 16, 2015 | ||
|
Graham Smith |
||||
| *By: | /s/ Richard L. Stollmeyer | |
| Richard L. Stollmeyer Attorney-in-Fact | ||
II-5
Table of Contents
EXHIBIT INDEX
| Exhibit Number |
Description | |
| 1.1** | Form of Underwriting Agreement. | |
| 3.1** | Third Amended and Restated Certificate of Incorporation of the Registrant, as currently in effect. | |
| 3.2** | Form of Amended and Restated Certificate of Incorporation of the Registrant, to be in effect upon completion of this offering. | |
| 3.3** | Bylaws of the Registrant, as currently in effect. | |
| 3.4** | Form of Amended and Restated Bylaws of the Registrant, to be in effect upon completion of this offering. | |
| 4.1** | Form of common stock certificate of the Registrant. | |
| 4.2** | Amended and Restated Investors’ Rights Agreement among the Registrant and certain holders of its capital stock, dated as of February 10, 2014, as amended. | |
| 5.1** | Opinion of Wilson Sonsini Goodrich & Rosati, P.C. | |
| 10.1+** | Form of Indemnification Agreement between the Registrant and each of its directors and executive officers. | |
| 10.2+** | MINDBODY, Inc. 2015 Equity Incentive Plan and related form agreements. | |
| 10.3+** | MINDBODY, Inc. 2015 Employee Stock Purchase Plan and related form agreements. | |
| 10.4+** | MINDBODY, Inc. 2009 Stock Option Plan and related form agreements. | |
| 10.5+** | MINDBODY, Inc. Executive Bonus Plan. | |
| 10.6+** | Employment Agreement between the Registrant and Richard L. Stollmeyer. | |
| 10.7+** | Employment Agreement between the Registrant and Robert Murphy. | |
| 10.8+** | Employment Agreement between the Registrant and Brett White. | |
| 10.9+** | Employment Agreement between the Registrant and Chet Brandenburg. | |
| 10.10+** | Employment Agreement between the Registrant and William Donohue. | |
| 10.11+** | Employment Agreement between the Registrant and Bradford L. Wills. | |
| 10.12+** | Employment Agreement between the Registrant and Kimberly Lytikainen. | |
| 10.13** | Warrant to purchase shares of Series C redeemable convertible preferred stock issued to Silicon Valley Bank, dated as of June 23, 2010, as amended. | |
| 10.14** | Loan and Security Agreement between the Registrant and Silicon Valley Bank, dated as of January 12, 2015, as amended. | |
| 10.15** | Agreements for Lease of Real Property between the Registrant, Tank Farm Office Park, LLC and the other parties therein. | |
| 10.16** | SLO Tech Campus Triple Net Lease between the Registrant and SLO Tech Campus, LLC, dated as of October 11, 2013. | |
| 10.17+** | MINDBODY, Inc. Outside Director Compensation Policy. | |
| 21.1** | List of subsidiaries of the Registrant. | |
| 23.1 | Consent of Deloitte & Touche LLP, Independent Registered Public Accounting Firm. | |
| 23.2** | Consent of Wilson Sonsini Goodrich & Rosati, P.C. (included in Exhibit 5.1). | |
| 23.3** | Consent of Frost & Sullivan. | |
| 24.1** | Power of Attorney (see page II-5 of the original filing of this Registration Statement on Form S-1). | |
| ** | Previously filed. |
| + | Indicates management contract or compensatory plan. |