Attached files
| file | filename |
|---|---|
| 8-K - 8-K - INDEPENDENCE REALTY TRUST, INC. | d938088d8k.htm |
Exhibit 99.1
Independence Realty Trust
Creating a leading regional multifamily platform
June 2015
Disclaimer
SAFE HARBOR
STATEMENT UNDER THE PRIVATE LITIGATION REFORM ACT OF 1995
This presentation may include “forward-looking statements” within the meaning of
Section 27A of the Securities Act of 1933, as amended, and Section 21E of the Securities Exchange Act of 1934, as amended. These forward-looking statements which are based on current expectations, estimates and projections about the
industry and markets in which Independence Realty Trust, Inc. (“IRT”) and Trade Street Residential, Inc. (“TSRE”) operate and beliefs of and assumptions made by IRT management and TSRE management, involve uncertainties that could
significantly affect the financial results of IRT or TSRE or the combined company. Words such as “expects,” “anticipates,” “intends,” “plans,” “believes,” “seeks,” “estimates,”
variations of such words and similar expressions are intended to identify such forward-looking statements, which generally are not historical in nature. Such forward-looking statements include, but are not limited to, statements about the
anticipated benefits of the business combination transaction involving IRT and TSRE, including future financial and operating results (such as FFO), and the combined company’s plans, objectives, expectations and intentions. All statements that
address operating performance, events or developments that we expect or anticipate will occur in the future – including statements relating to expected synergies, improved liquidity and balance sheet strength – are forward-looking
statements. These statements are not guarantees of future performance and involve certain risks, uncertainties and assumptions that are difficult to predict. Although we believe the expectations reflected in any forward-looking statements are based
on reasonable assumptions, we can give no assurance that our expectations will be attained and therefore, actual outcomes and results may differ materially from what is expressed or forecasted in such forward-looking statements. Some of the factors
that may affect outcomes and results include, but are not limited to: (i) national, regional and local economic climates, (ii) changes in financial markets and interest rates, or to the business or financial condition of either company or
business (iii) changes in market demand for rental apartment homes and competitive pricing, (iv) risks associated with acquisitions, including the integration of the combined companies’ businesses, (v) maintenance of real estate
investment trust (“REIT”) status, (vi) availability of financing and capital, (vii) risks associated with achieving expected revenue synergies or cost savings, (viii) risks associated with the companies’ ability to
consummate the merger on the terms described or at all and the timing of the closing of the merger; (ix) dividends are subject to the discretion of our Board of Directors, and will depend on our financial condition, results of operations,
capital requirements, compliance with applicable laws and agreements and any other factors deemed relevant by our Board, (x) risks associated with pursuing additional strategic acquisitions, including risks associated with the need to raise
large amounts of additional capital to fund the acquisitions, and (xi) those additional risks and factors discussed in reports filed with the Securities and Exchange Commission (“SEC”) by IRT and TSRE from time to time, including
those discussed under the heading “Risk Factors” in their respective most recently filed reports on Forms 10-K and 10-Q. Neither IRT nor TSRE undertakes any duty to update any forward-looking statements appearing in this presentation.
IMPORTANT INFORMATION FOR INVESTORS AND STOCKHOLDERS
This communication does
not constitute an offer to buy or sell or the solicitation of an offer to buy or sell any securities or a solicitation of any vote or approval. No offer of securities shall be made except by means of a prospectus meeting the requirements of
Section 10 of the Securities Act of 1933, as amended. This communication relates to a proposed business combination between IRT and TSRE. In connection with the above described transactions, IRT and TSRE have filed a joint proxy
statement-prospectus on Form S-4, as amended, and other materials with the SEC and IRT and TSRE may file other documents with respect to the proposed transaction. BEFORE MAKING ANY VOTING OR INVESTMENT DECISION SECURITY HOLDERS ARE URGED TO READ
THESE MATERIALS BECAUSE THEY CONTAIN IMPORTANT INFORMATION. This communication is not a substitute for any proxy statement, registration statement, proxy statement/prospectus or other document IRT and/or TSRE may file with the SEC in connection with
the proposed transaction. The definitive joint proxy statement (if and when available) will be mailed to stockholders of TSRE and/or IRT, as applicable. Investors and security holders will be able to obtain free copies of these documents (if and
when available) and other documents filed with the SEC by IRT and/or TSRE through the website maintained by the SEC at http://www.sec.gov. Copies of the documents filed with the SEC by IRT will be available free of charge on IRT’s internet
website at http://www.irtreit.com or by contacting IRT’s Investor Relations Department by email at aviroslav@irtreit.com or by phone at +1-215-243-9000. Copies of the documents filed with the SEC by TSRE will be available free of charge on
TSRE’s internet website at http://www.tradestreetresidential.com or by contacting TSRE’s Investor Relations Department by email at ir@trade-street.com or by phone at +1-786-248-6099.
PARTICIPANTS IN SOLICITATIONS
IRT, TSRE, Independence Realty Advisors, LLC (“IRA”)
which serves as IRT’s advisor, and RAIT Financial Trust which is the parent of IRA and a shareholder of IRT, and their respective directors and certain of their respective executive officers may be considered participants in the solicitation of
proxies in connection with the proposed transaction. Information about these persons is set forth in is set forth in the preliminary joint proxy statement-prospectus on Form S-4, as amended, and will be set forth in the definitive joint proxy
statement-prospectus, filed with the SEC by IRT and TSRE. You can find additional information about the directors and executive officers of IRT in its Annual Report on Form 10-K for the year ended December 31, 2014, which was filed with the SEC
on March 16, 2015, and its proxy statement for its 2015 annual meeting of stockholders, which was filed with the SEC on April 7, 2015. You can find additional information about the directors and executive officers of TSRE Information about
the directors and executive officers of TSRE is set forth in its Annual Report on Form 10-K/A for the year ended December 31, 2014, which was filed with the SEC on March 25, 2015. These documents can be obtained free of charge from the
sources indicated above. Additional information regarding the participants in the proxy solicitations and a description of their direct and indirect interests, by security holdings or otherwise, will be contained in the proxy statement/prospectus
and other relevant materials to be filed with the SEC when they become available.
Independence Realty Trust
2
Who are we?
IRT is an
apartment REIT focused on building a portfolio of well-located apartment properties which generate attractive current returns, stable occupancy and the potential for rent increases and improved operating efficiency
– Listed on the NYSE MKT in August 2013 – “IRT”
– Targets markets
with strong demographic and employment trends with limited new supply
– Focused on delivering strong risk-adjusted returns
– IRT is externally managed by a subsidiary of RAIT Financial Trust (NYSE: RAS) – a multi-strategy commercial real estate company with a vertically integrated platform
and significant experience owning, operating and lending against apartment properties
– Seasoned external manager with significant resources for IRT’s
benefit
On May 11, 2015, IRT entered into a definitive agreement to acquire Trade Street Residential, Inc. (“TSRE”) for approximately $655 million
through a combination of cash, IRT stock and debt assumption
TSRE is listed on the NASDAQ Global Market – “TSRE”
IRT’s pro forma asset base after the transaction will be 50 properties in 24 markets representing 14,044 units
The transaction is expected to close during Q3 2015, subject to customary closing conditions including stockholder approval of both IRT and TSRE shareholders
Independence Realty Trust
3
Management team
Scott F.
Schaeffer
Chairman and CEO – Independence Realty Trust, Inc.
Chairman
and CEO – RAIT Financial Trust
Been with RAIT Financial Trust for 15 years serving in a variety of roles
Extensive real estate experience (30 years) specializing in acquiring and financing investments in apartment properties
Previously, led the real estate group at Resource America, Inc., a specialty finance company
Farrell M. Ender
President – Independence Realty Trust, Inc.
Served in a variety of roles at RAIT Financial Trust dating back to 2002
Over 15 years of
experience in the acquisition/disposition, property management, and construction management of apartment properties
James J. Sebra
CFO and Treasurer – Independence Realty Trust, Inc. and CFO and Treasurer – RAIT Financial Trust
Joined RAIT Financial Trust in December 2006
17 years of real estate experience
Independence Realty Trust
4
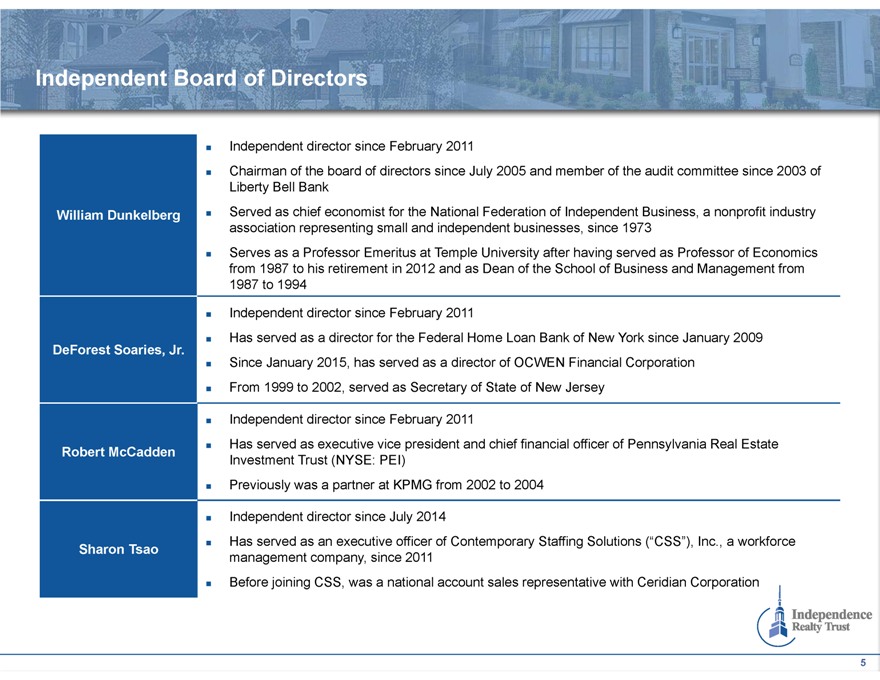
Independent Board of Directors
William Dunkelberg
Independent director since February 2011
Chairman of the board of directors since July 2005 and member of the audit committee since 2003 of Liberty Bell Bank
Served as chief economist for the National Federation of Independent Business, a nonprofit industry association representing small and independent businesses, since 1973
Serves as a Professor Emeritus at Temple University after having served as Professor of Economics from 1987 to his retirement in 2012 and as Dean of the School of
Business and Management from 1987 to 1994
DeForest Soaries, Jr.
Independent
director since February 2011
Has served as a director for the Federal Home Loan Bank of New York since January 2009
Since January 2015, has served as a director of OCWEN Financial Corporation
From 1999 to 2002,
served as Secretary of State of New Jersey
Robert McCadden
Independent
director since February 2011
Has served as executive vice president and chief financial officer of Pennsylvania Real Estate Investment Trust (NYSE: PEI)
Previously was a partner at KPMG from 2002 to 2004
Sharon Tsao
Independent director since July 2014
Has served as an executive officer of Contemporary
Staffing Solutions (“CSS”), Inc., a workforce
management company, since 2011
Before joining CSS, was a national account sales representative with Ceridian Corporation
Independence Realty Trust
5
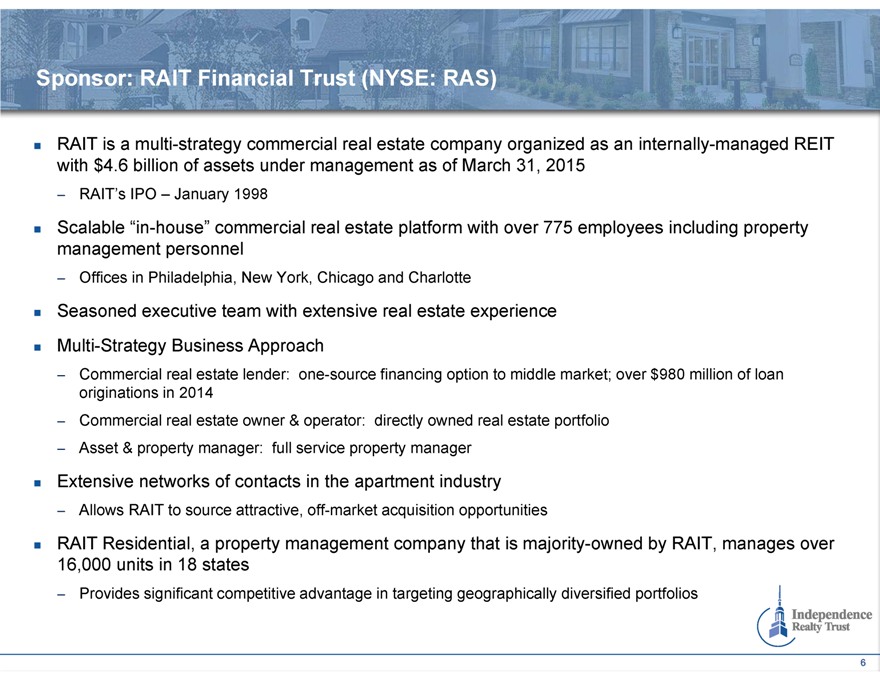
Sponsor: RAIT Financial Trust (NYSE: RAS)
RAIT is a multi-strategy commercial real estate company organized as an internally-managed REIT with $4.6 billion of assets under management as of March 31, 2015
– RAIT’s IPO – January 1998
Scalable “in-house” commercial real
estate platform with over 775 employees including property management personnel
– Offices in Philadelphia, New York, Chicago and Charlotte
Seasoned executive team with extensive real estate experience
Multi-Strategy Business Approach
– Commercial real estate lender: one-source financing option to middle market; over $980 million of loan originations in 2014
– Commercial real estate owner & operator: directly owned real estate portfolio
– Asset & property manager: full service property manager
Extensive networks of contacts in the apartment industry
– Allows RAIT
to source attractive, off-market acquisition opportunities
RAIT Residential, a property management company that is majority-owned by RAIT, manages over 16,000
units in 18 states
– Provides significant competitive advantage in targeting geographically diversified portfolios
Independence Realty Trust
6
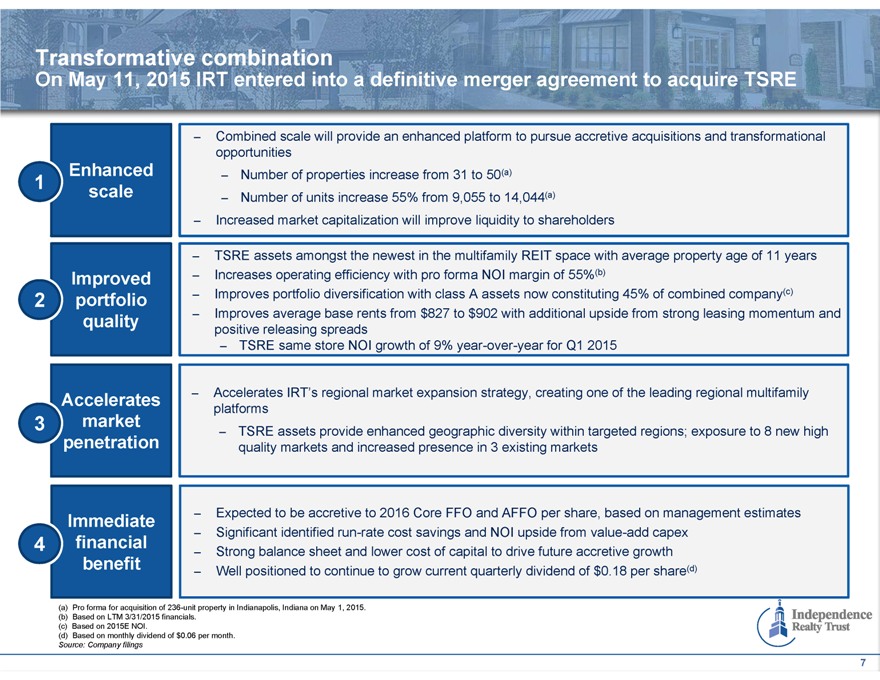
Transformative combination
On May 11, 2015 IRT entered into a definitive merger agreement to acquire TSRE
1 Enhanced scale
– Combined scale will provide an enhanced platform to pursue accretive
acquisitions and transformational opportunities
– Number of properties increase from 31 to 50(a)
– Number of units increase 55% from 9,055 to 14,044(a)
– Increased market
capitalization will improve liquidity to shareholders
2 Improved portfolio quality
– TSRE assets amongst the newest in the multifamily REIT space with average property age of 11 years
– Increases operating efficiency with pro forma NOI margin of 55%(b)
– Improves
portfolio diversification with class A assets now constituting 45% of combined company(c)
– Improves average base rents from $827 to $902 with additional
upside from strong leasing momentum and positive releasing spreads
– TSRE same store NOI growth of 9% year-over-year for Q1 2015
3 Accelerates market penetration
– Accelerates IRT’s regional market expansion
strategy, creating one of the leading regional multifamily platforms
– TSRE assets provide enhanced geographic diversity within targeted regions; exposure to
8 new high quality markets and increased presence in 3 existing markets
4 Immediate financial benefit
– Expected to be accretive to 2016 Core FFO and AFFO per share, based on management estimates
– Significant identified run-rate cost savings and NOI upside from value-add capex
–
Strong balance sheet and lower cost of capital to drive future accretive growth
– Well positioned to continue to grow current quarterly dividend of $0.18 per
share(d)
(a) Pro forma for acquisition of 236-unit property in Indianapolis, Indiana on May 1, 2015.
(b) Based on LTM 3/31/2015 financials.
(c) Based on 2015E NOI.
(d) Based on monthly dividend of $0.06 per month.
Source: Company filings
Independence Realty Trust
7
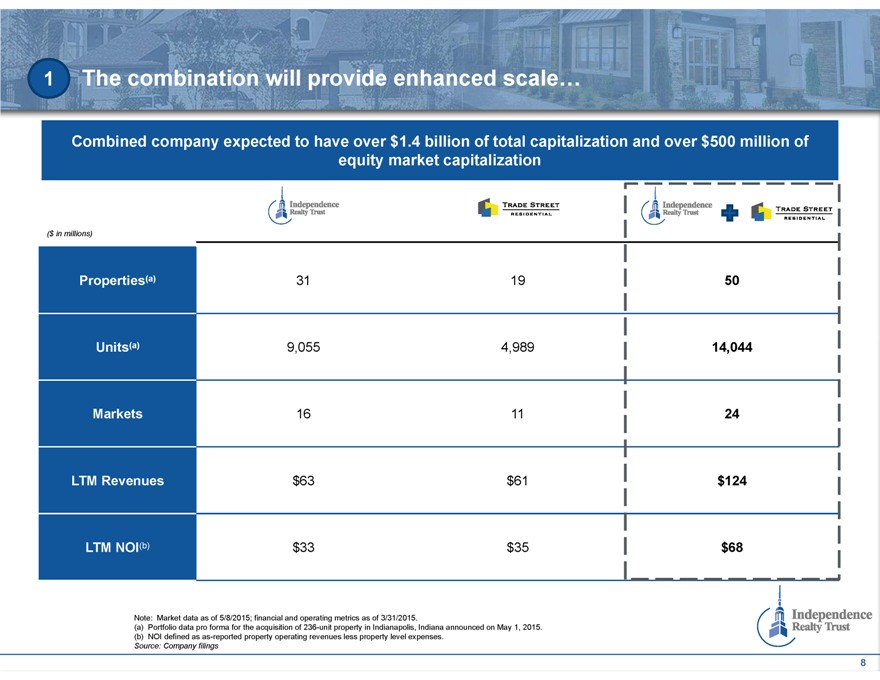
1 The combination will provide enhanced scale…
Combined company expected to have over $1.4 billion of total capitalization and over $500 million of equity market capitalization
($ in millions) Independence Realty Trust Trade Street Residential Independence Realty Trust Trade Street Residential
Properties(a) 31 19 50
Units(a) 9,055 4,989 14,044
Markets 16 11 24
LTM Revenues $63 $61 $124
LTM NOI(b) $33 $35 $68
Note: Market data as of 5/8/2015; financial and operating metrics as of
3/31/2015.
(a) Portfolio data pro forma for the acquisition of 236-unit property in Indianapolis, Indiana announced on May 1, 2015.
(b) NOI defined as as-reported property operating revenues less property level expenses.
Source: Company filings
Independence Realty Trust
8
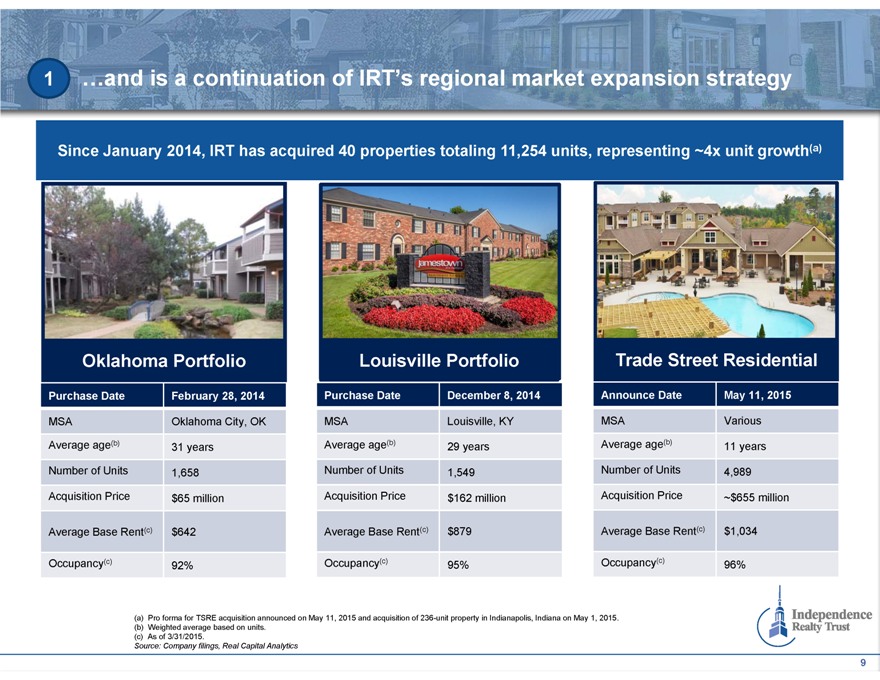
1 …and is a continuation of IRT’s regional market expansion strategy
Since January 2014, IRT has acquired 40 properties totaling 11,254 units, representing ~4x unit growth(a)
Oklahoma Portfolio Louisville Portfolio Trade Street Residential
Purchase Date
February 28, 2014 Purchase Date December 8, 2014 Announce Date May 11, 2015
MSA Oklahoma City, OK MSA Louisville, KY MSA Various
Average age(b) 31 years Average age(b) 29 years Average age(b) 11 years
Number of Units 1,658
Number of Units 1,549 Number of Units 4,989
Acquisition Price $65 million Acquisition Price $162 million Acquisition Price ~$655 million
Average Base Rent(c) $642 Average Base Rent(c) $879 Average Base Rent(c) $1,034
Occupancy(c)
92% Occupancy(c) 95% Occupancy(c) 96%
(a) Pro forma for TSRE acquisition announced on May 11, 2015 and acquisition of 236-unit property in Indianapolis,
Indiana on May 1, 2015.
(b) Weighted average based on units.
(c) As
of 3/31/2015.
Source: Company filings, Real Capital Analytics
Independence
Realty Trust
9
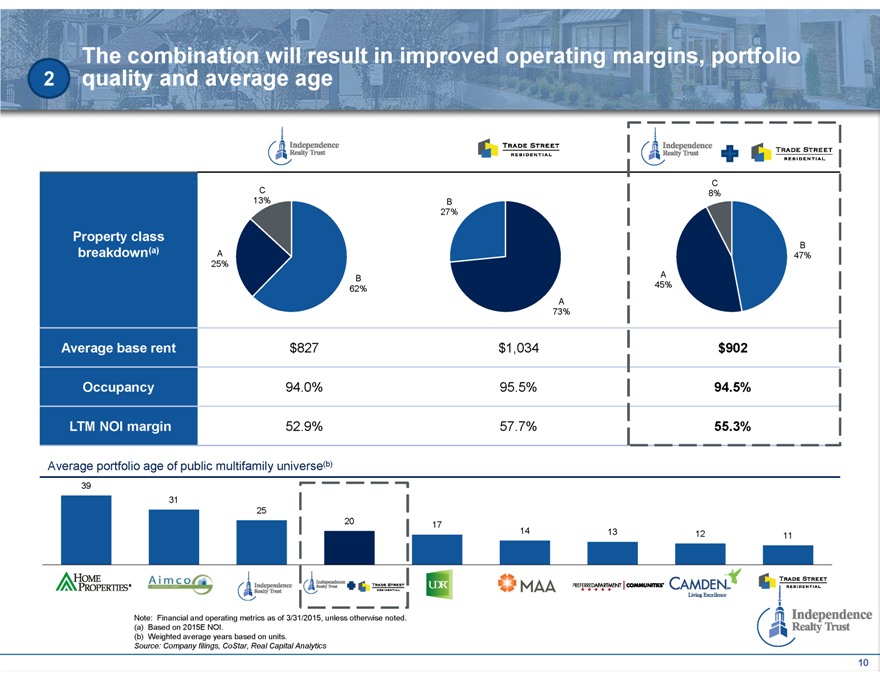
2 The combination will result in improved operating margins, portfolio quality and average age
Independence Realty Trust Trade Street Residential Independence Realty Trust Trade Street Residential
C 13%
B 27%
C 8%
Property class breakdown(a) A 25% B 62% A 73% A 45% B 47%
Average base rent $827 $1,034 $902
Occupancy 94.0% 95.5% 94.5%
LTM NOI margin 52.9% 57.7% 55.3%
Average portfolio age of public multifamily universe(b)
39
31
25
20 17 14 13 12 11
Home Properties Aimco Independence Realty Trust Independence Realty Trust Trade Street Residential UDR MAA PREFERRED APARTMENT COMMUNITIES CamdenSM Living Excellence Trade Street
Residential
Note: Financial and operating metrics as of 3/31/2015, unless otherwise noted.
(a) Based on 2015E NOI.
(b) Weighted average years based on units.
Source: Company filings, CoStar, Real Capital Analytics
Independence Realty Trust
10
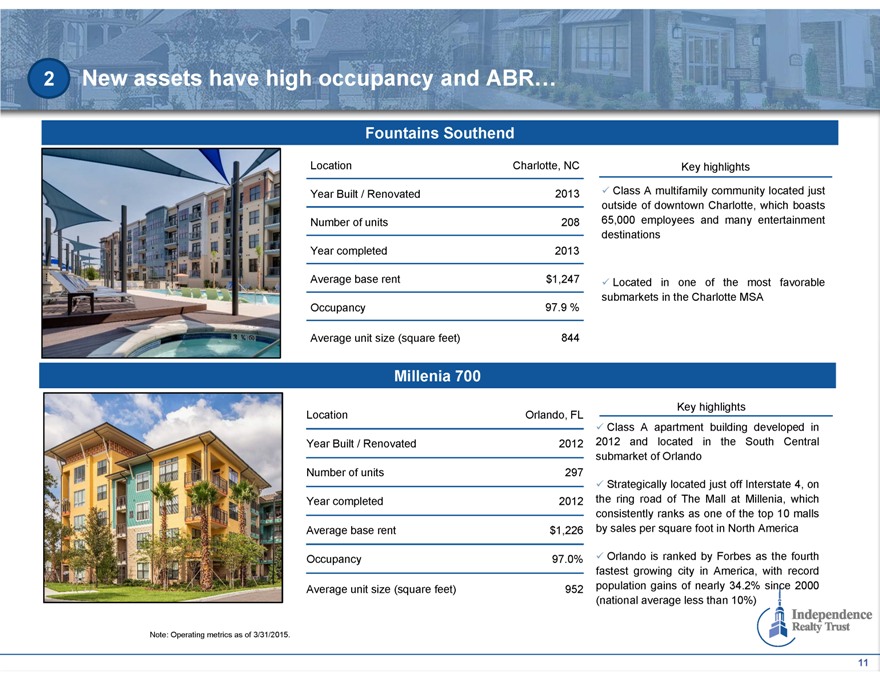
2 New assets have high occupancy and ABR…
Fountains Southend
Location Charlotte, NC
Year Built / Renovated 2013
Number of units 208
Year completed 2013
Average base rent $1,247
Occupancy 97.9%
Average unit size (square feet) 844
Key highlights
Class A multifamily community located just outside of downtown Charlotte,
which boasts 65,000 employees and many entertainment destinations
Located in one of the most favorable submarkets in the Charlotte MSA
Millenia 700
Location Orlando, FL
Year Built / Renovated 2012
Number of units 297
Year completed 2012
Average base rent $1,226
Occupancy 97.0%
Average unit size (square feet) 952
Key highlights
Class A apartment building developed in 2012 and located in the South
Central submarket of Orlando
Strategically located just off Interstate 4, on the ring road of The Mall at Millenia, which consistently ranks as one of the top 10
malls by sales per square foot in North America
Orlando is ranked by Forbes as the fourth fastest growing city in America, with record population gains of nearly
34.2% since 2000 (national average less than 10%)
Note: Operating metrics as of 3/31/2015.
Independence Realty Trust
11
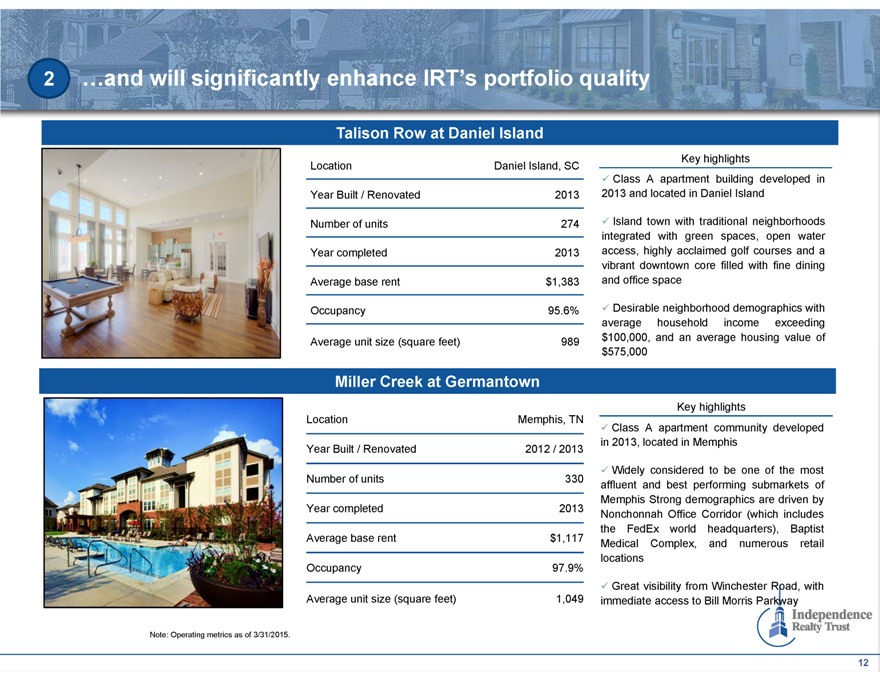
2 …and will significantly enhance IRT’s portfolio quality
Talison Row at Daniel Island
Location Daniel Island, SC
Year Built / Renovated 2013
Number of units 274
Year completed 2013
Average base rent $1,383
Occupancy 95.6%
Average unit size (square feet) 989
Key highlights
Class A apartment building developed in 2013 and located in Daniel Island
Island town with traditional neighborhoods integrated with green spaces, open water access, highly acclaimed golf courses and a vibrant downtown core filled with
fine dining and office space
Desirable neighborhood demographics with average household income exceeding $100,000, and an average housing value of $575,000
Miller Creek at Germantown
Location Memphis, TN
Year Built / Renovated 2012 / 2013
Number of units 330
Year completed 2013
Average base rent $1,117
Occupancy 97.9%
Average unit size (square feet) 1,049
Key highlights
Class A apartment community developed in 2013, located in Memphis
Widely considered to be one of the most affluent and best performing submarkets of Memphis Strong demographics are driven by Nonchonnah Office Corridor (which
includes the FedEx world headquarters), Baptist Medical Complex, and numerous retail locations
Great visibility from Winchester Road, with immediate access to Bill
Morris Parkway
Note: Operating metrics as of 3/31/2015.
Independence Realty
Trust
12
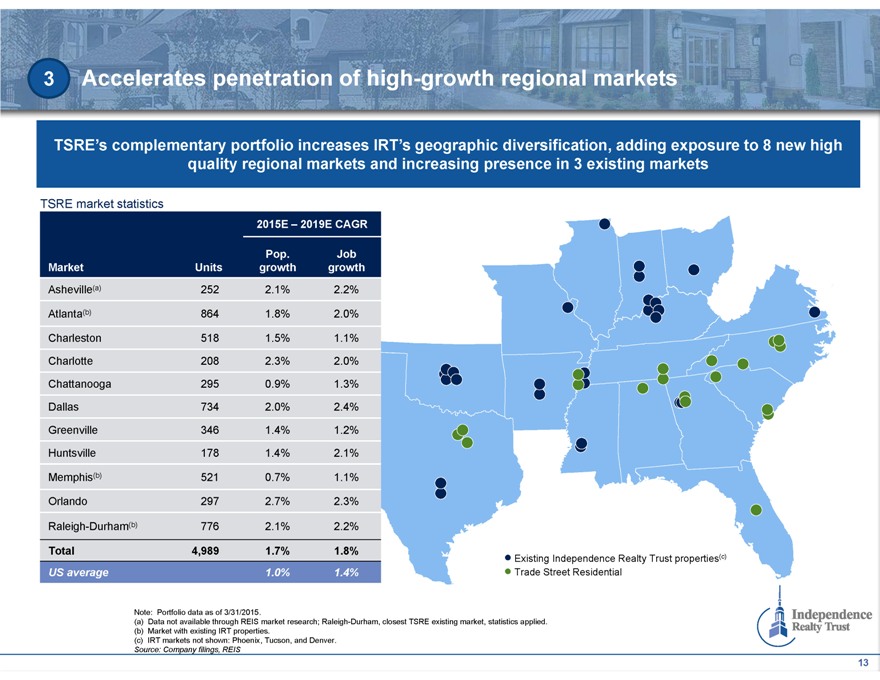
3 Accelerates penetration of high-growth regional markets
TSRE’s complementary portfolio increases IRT’s geographic diversification, adding exposure to 8 new high quality regional markets and increasing presence in 3 existing
markets
TSRE market statistics
2015E – 2019E CAGR
Market Units Pop. growth Job growth
Asheville(a) 252 2.1% 2.2%
Atlanta(b) 864 1.8% 2.0%
Charleston 518 1.5% 1.1%
Charlotte 208 2.3% 2.0%
Chattanooga 295 0.9% 1.3%
Dallas 734 2.0% 2.4%
Greenville 346 1.4% 1.2%
Huntsville 178 1.4% 2.1%
Memphis(b) 521 0.7% 1.1%
Orlando 297 2.7% 2.3%
Raleigh-Durham(b) 776 2.1% 2.2%
Total 4,989 1.7% 1.8%
US average 1.0% 1.4%
Existing Independence Realty Trust properties(c)
Trade Street Residential
Note: Portfolio data as of 3/31/2015.
(a) Data not available through REIS market research;
Raleigh-Durham, closest TSRE existing market, statistics applied.
(b) Market with existing IRT properties.
(c) IRT markets not shown: Phoenix, Tucson, and Denver.
Source: Company filings, REIS
Independence Realty Trust
13
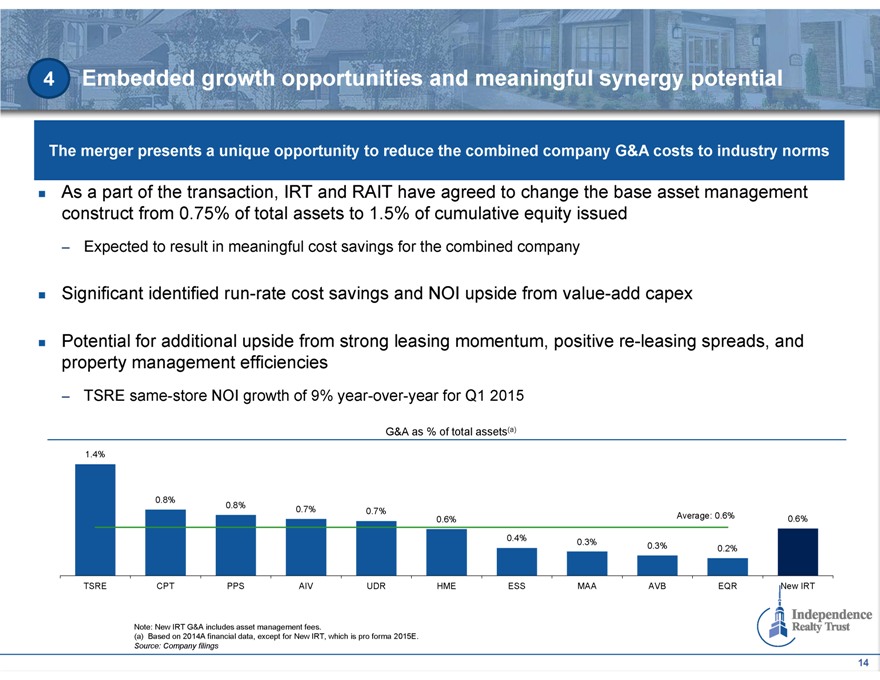
4 Embedded growth opportunities and meaningful synergy potential
The merger presents a unique opportunity to reduce the combined company G&A costs to industry norms
As a part of the transaction, IRT and RAIT have agreed to change the base asset management construct from 0.75% of total assets to 1.5% of cumulative equity issued
– Expected to result in meaningful cost savings for the combined company
Significant
identified run-rate cost savings and NOI upside from value-add capex
Potential for additional upside from strong leasing momentum, positive re-leasing spreads, and
property management efficiencies
– TSRE same-store NOI growth of 9% year-over-year for Q1 2015
G&A as % of total assets(a)
1.4%
0.8%
0.8% 0.7% 0.7% Average: 0.6%
0.6% 0.6%
0.4% 0.3%
0.3% 0.2%
TSRE CPT PPS AIV UDR HME ESS MAA AVB EQR New IRT
Note: New IRT G&A includes asset management fees.
(a) Based on 2014A financial data,
except for New IRT, which is pro forma 2015E.
Source: Company filings
Independence Realty Trust
14
Transformative combination
Enhanced scale
Improved portfolio quality
Accelerates market penetration
Immediate financial benefit
Independence Realty Trust
15

Independence Realty Trust
Appendix
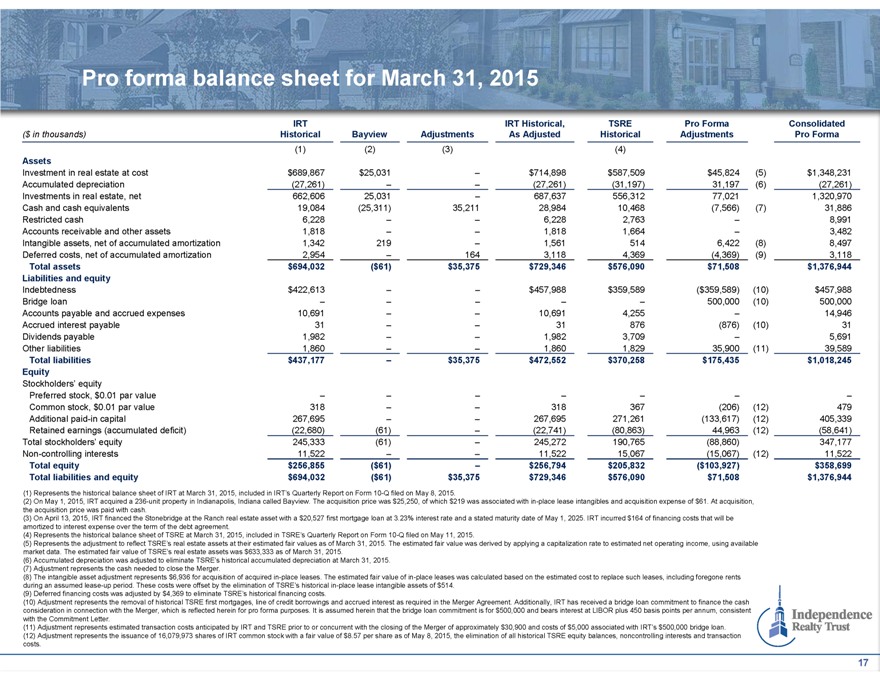
Pro forma balance sheet for March 31, 2015
($ in thousands) IRT Historical Bayview Adjustments IRT Historical, As Adjusted TSRE Historical Pro Forma Adjustments Consolidated Pro Forma
(1) (2) (3) (4)
Assets
Investment in real estate at cost $689,867 $25,031 – $714,898 $587,509 $45,824 (5) $1,348,231
Accumulated depreciation (27,261) – – (27,261) (31,197) 31,197 (6) (27,261)
Investments in real estate, net 662,606 25,031 – 687,637 556,312 77,021 1,320,970
Cash and cash equivalents 19,084 (25,311) 35,211 28,984 10,468 (7,566) (7) 31,886
Restricted
cash 6,228 – – 6,228 2,763 – 8,991
Accounts receivable and other assets 1,818 – – 1,818 1,664 – 3,482
Intangible assets, net of accumulated amortization 1,342 219 – 1,561 514 6,422 (8) 8,497
Deferred costs, net of accumulated amortization 2,954 – 164 3,118 4,369 (4,369) (9) 3,118
Total assets $694,032 ($61) $35,375 $729,346 $576,090 $71,508 $1,376,944
Liabilities and
equity
Indebtedness $422,613 – – $457,988 $359,589 ($359,589) (10) $457,988
Bridge loan – – – – – 500,000 (10) 500,000
Accounts payable and
accrued expenses 10,691 – – 10,691 4,255 – 14,946
Accrued interest payable 31 – – 31 876 (876) (10) 31
Dividends payable 1,982 – – 1,982 3,709 – 5,691
Other liabilities 1,860 –
– 1,860 1,829 35,900 (11) 39,589
Total liabilities $437,177 – $35,375 $472,552 $370,258 $175,435 $1,018,245
Equity
Stockholders’ equity
Preferred stock, $0.01 par value – – – – – – –
Common
stock, $0.01 par value 318 – – 318 367 (206) (12) 479
Additional paid-in capital 267,695 – – 267,695 271,261 (133,617) (12) 405,339
Retained earnings (accumulated deficit) (22,680) (61) – (22,741) (80,863) 44,963 (12) (58,641)
Total stockholders’ equity 245,333 (61) – 245,272 190,765 (88,860) 347,177
Non-controlling interests 11,522 – – 11,522 15,067 (15,067) (12) 11,522
Total equity $256,855 ($61) – $256,794 $205,832 ($103,927) $358,699
Total liabilities and
equity $694,032 ($61) $35,375 $729,346 $576,090 $71,508 $1,376,944
(1) Represents the historical balance sheet of IRT at March 31, 2015, included in IRT’s
Quarterly Report on Form 10-Q filed on May 8, 2015.
(2) On May 1, 2015, IRT acquired a 236-unit property in Indianapolis, Indiana called Bayview. The acquisition
price was $25,250, of which $219 was associated with in-place lease intangibles and acquisition expense of $61. At acquisition, the acquisition price was paid with cash.
(3) On April 13, 2015, IRT financed the Stonebridge at the Ranch real estate asset with a $20,527 first mortgage loan at 3.23% interest rate and a stated maturity date of May 1,
2025. IRT incurred $164 of financing costs that will be amortized to interest expense over the term of the debt agreement.
(4) Represents the historical balance
sheet of TSRE at March 31, 2015, included in TSRE’s Quarterly Report on Form 10-Q filed on May 11, 2015.
(5) Represents the adjustment to reflect TSRE’s
real estate assets at their estimated fair values as of March 31, 2015. The estimated fair value was derived by applying a capitalization rate to estimated net operating income, using available market data. The estimated fair value of TSRE’s
real estate assets was $633,333 as of March 31, 2015.
(6) Accumulated depreciation was adjusted to eliminate TSRE’s historical accumulated depreciation at
March 31, 2015. (7) Adjustment represents the cash needed to close the Merger.
(8) The intangible asset adjustment represents $6,936 for acquisition of acquired
in-place leases. The estimated fair value of in-place leases was calculated based on the estimated cost to replace such leases, including foregone rents during an assumed lease-up period. These costs were offset by the elimination of TSRE’s
historical in-place lease intangible assets of $514.
(9) Deferred financing costs was adjusted by $4,369 to eliminate TSRE’s historical financing costs.
(10) Adjustment represents the removal of historical TSRE first mortgages, line of credit borrowings and accrued interest as required in the Merger Agreement.
Additionally, IRT has received a bridge loan commitment to finance the cash consideration in connection with the Merger, which is reflected herein for pro forma purposes. It is assumed herein that the bridge loan commitment is for $500,000 and bears
interest at LIBOR plus 450 basis points per annum, consistent with the Commitment Letter.
(11) Adjustment represents estimated transaction costs anticipated by IRT
and TSRE prior to or concurrent with the closing of the Merger of approximately $30,900 and costs of $5,000 associated with IRT’s $500,000 bridge loan. (12) Adjustment represents the issuance of 16,079,973 shares of IRT common stock with a fair
value of $8.57 per share as of May 8, 2015, the elimination of all historical TSRE equity balances, noncontrolling interests and transaction costs.
Independence
Realty Trust
17
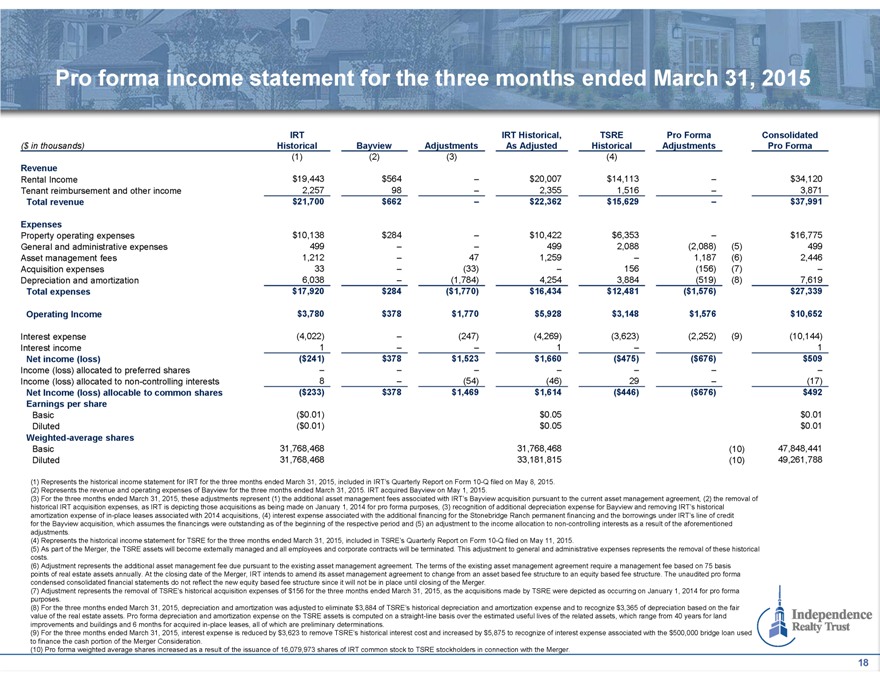
Pro forma income statement for the three months ended March 31, 2015
($ in thousands) IRT Historical Bayview Adjustments IRT Historical, As Adjusted TSRE Historical Pro Forma Adjustments Consolidated Pro Forma
(1) (2) (3) (4)
Revenue
Rental Income $19,443 $564 – $20,007 $14,113 – $34,120
Tenant reimbursement and
other income 2,257 98 – 2,355 1,516 – 3,871
Total revenue $21,700 $662 – $22,362 $15,629 – $37,991
Expenses
Property operating expenses $10,138 $284 – $10,422 $6,353 – $16,775
General and administrative expenses 499 – – 499 2,088 (2,088) (5) 499
Asset management fees 1,212 – 47 1,259 – 1,187 (6) 2,446
Acquisition expenses 33 – (33) – 156 (156) (7) –
Depreciation
and amortization 6,038 – (1,784) 4,254 3,884 (519) (8) 7,619
Total expenses $17,920 $284 ($1,770) $16,434 $12,481 ($1,576) $27,339
Operating Income $3,780 $378 $1,770 $5,928 $3,148 $1,576 $10,652
Interest expense (4,022)
– (247) (4,269) (3,623) (2,252) (9) (10,144)
Interest income 1 – – 1 – 1
Net income (loss) ($241) $378 $1,523 $1,660 ($475) ($676) $509
Income (loss) allocated to
preferred shares – – – – – – –
Income (loss) allocated to non-controlling interests 8 – (54) (46) 29 – (17)
Net Income (loss) allocable to common shares ($233) $378 $1,469 $1,614 ($446) ($676) $492
Earnings per share
Basic ($0.01) $0.05 $0.01
Diluted ($0.01) $0.05 $0.01
Weighted-average shares
Basic 31,768,468 31,768,468 (10) 47,848,441
Diluted 31,768,468 33,181,815 (10) 49,261,788
(1) Represents the historical income statement for IRT for the three months ended March 31, 2015, included in IRT’s Quarterly Report on Form 10-Q filed on May
8, 2015. (2) Represents the revenue and operating expenses of Bayview for the three months ended March 31, 2015. IRT acquired Bayview on May 1, 2015.
(3) For the
three months ended March 31, 2015, these adjustments represent (1) the additional asset management fees associated with IRT’s Bayview acquisition pursuant to the current asset management agreement, (2) the removal of historical IRT acquisition
expenses, as IRT is depicting those acquisitions as being made on January 1, 2014 for pro forma purposes, (3) recognition of additional depreciation expense for Bayview and removing IRT’s historical amortization expense of in-place leases
associated with 2014 acquisitions, (4) interest expense associated with the additional financing for the Stonebridge Ranch permanent financing and the borrowings under IRT’s line of credit for the Bayview acquisition, which assumes the
financings were outstanding as of the beginning of the respective period and (5) an adjustment to the income allocation to non-controlling interests as a result of the aforementioned adjustments.
(4) Represents the historical income statement for TSRE for the three months ended March 31, 2015, included in TSRE’s Quarterly Report on Form 10-Q filed on May 11, 2015.
(5) As part of the Merger, the TSRE assets will become externally managed and all employees and corporate contracts will be terminated. This adjustment to general
and administrative expenses represents the removal of these historical costs.
(6) Adjustment represents the additional asset management fee due pursuant to the
existing asset management agreement. The terms of the existing asset management agreement require a management fee based on 75 basis points of real estate assets annually. At the closing date of the Merger, IRT intends to amend its asset management
agreement to change from an asset based fee structure to an equity based fee structure. The unaudited pro forma condensed consolidated financial statements do not reflect the new equity based fee structure since it will not be in place until closing
of the Merger.
(7) Adjustment represents the removal of TSRE’s historical acquisition expenses of $156 for the three months ended March 31, 2015, as the
acquisitions made by TSRE were depicted as occurring on January 1, 2014 for pro forma purposes.
(8) For the three months ended March 31, 2015, depreciation and
amortization was adjusted to eliminate $3,884 of TSRE’s historical depreciation and amortization expense and to recognize $3,365 of depreciation based on the fair value of the real estate assets. Pro forma depreciation and amortization expense
on the TSRE assets is computed on a straight-line basis over the estimated useful lives of the related assets, which range from 40 years for land improvements and buildings and 6 months for acquired in-place leases, all of which are preliminary
determinations.
(9) For the three months ended March 31, 2015, interest expense is reduced by $3,623 to remove TSRE’s historical interest cost and increased
by $5,875 to recognize of interest expense associated with the $500,000 bridge loan used to finance the cash portion of the Merger Consideration.
(10) Pro forma
weighted average shares increased as a result of the issuance of 16,079,973 shares of IRT common stock to TSRE stockholders in connection with the Merger.
Independence Realty Trust
18
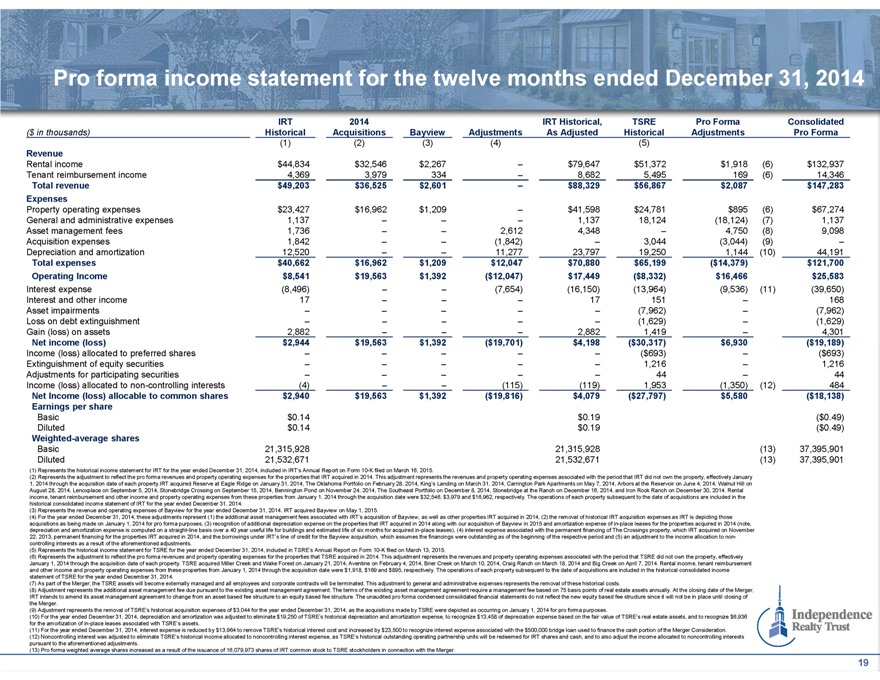
Pro forma income statement for the twelve months ended December 31, 2014
($ in thousands) IRT Historical 2014 Acquisitions Bayview Adjustments IRT Historical, As Adjusted TSRE Historical Pro Forma Adjustments Consolidated Pro Forma
(1) (2) (3) (4) (5)
Revenue
Rental income $44,834 $32,546 $2,267 – $79,647 $51,372 $1,918 (6) $132,937
Tenant
reimbursement income 4,369 3,979 334 – 8,682 5,495 169 (6) 14,346
Total revenue $49,203 $36,525 $2,601 – $88,329 $56,867 $2,087 $147,283
Expenses
Property operating expenses $23,427 $16,962 $1,209 – $41,598 $24,781 $895 (6)
$67,274
General and administrative expenses 1,137 – – – 1,137 18,124 (18,124) (7) 1,137
Asset management fees 1,736 – – 2,612 4,348 – 4,750 (8) 9,098
Acquisition
expenses 1,842 – – (1,842) – 3,044 (3,044) (9) –
Depreciation and amortization 12,520 – – 11,277 23,797 19,250 1,144 (10) 44,191
Total expenses $40,662 $16,962 $1,209 $12,047 $70,880 $65,199 ($14,379) $121,700
Operating Income $8,541 $19,563 $1,392 ($12,047) $17,449 ($8,332) $16,466 $25,583
Interest
expense (8,496) – – (7,654) (16,150) (13,964) (9,536) (11) (39,650)
Interest and other income 17 – – – 17 151 – 168
Asset impairments – – – – – (7,962) – (7,962)
Loss on debt
extinguishment – – – – – (1,629) – (1,629)
Gain (loss) on assets 2,882 – – – 2,882 1,419 – 4,301
Net income (loss) $2,944 $19,563 $1,392 ($19,701) $4,198 ($30,317) $6,930 ($19,189)
Income
(loss) allocated to preferred shares – – – – – ($693) – ($693)
Extinguishment of equity securities – – – – –
1,216 – 1,216
Adjustments for participating securities – – – – – 44 – 44
Income (loss) allocated to non-controlling interests (4) – – (115) (119) 1,953 (1,350) (12) 484
Net Income (loss) allocable to common shares $2,940 $19,563 $1,392 ($19,816) $4,079 ($27,797) $5,580 ($18,138)
Earnings per share
Basic $0.14 $0.19 ($0.49)
Diluted $0.14 $0.19 ($0.49)
Weighted-average shares
Basic 21,315,928 21,315,928 (13) 37,395,901
Diluted 21,532,671 21,532,671 (13) 37,395,901
(1) Represents the historical income statement for IRT for the year ended December 31, 2014, included in IRT’s Annual Report on Form 10-K filed on March 16,
2015.
(2) Represents the adjustment to reflect the pro forma revenues and property operating expenses for the properties that IRT acquired in 2014. This adjustment
represents the revenues and property operating expenses associated with the period that IRT did not own the property, effectively January 1, 2014 through the acquisition date of each property.IRT acquired Reserve at Eagle Ridge on January 31, 2014,
The Oklahoma Portfolio on February 28, 2014, King’s Landing on March 31, 2014, Carrington Park Apartments on May 7, 2014, Arbors at the Reservoir on June 4, 2014, Walnut Hill on August 28, 2014, Lenoxplace on September 5, 2014, Stonebridge
Crossing on September 15, 2014, Bennington Pond on November 24, 2014, The Southeast Portfolio on December 8, 2014, Stonebridge at the Ranch on December 16, 2014, and Iron Rock Ranch on December 30, 2014. Rental income, tenant reimbursement and other
income and property operating expenses from these properties from January 1, 2014 through the acquisition date were $32,546, $3,979 and $16,962, respectively. The operations of each property subsequent to the date of acquisitions are included in the
historical consolidated income statement of IRT for the year ended December 31, 2014.
(3) Represents the revenue and operating expenses of Bayview for the year
ended December 31, 2014. IRT acquired Bayview on May 1, 2015.
(4) For the year ended December 31, 2014, these adjustments represent (1) the additional asset
management fees associated with IRT’s acquisition of Bayview, as well as other properties IRT acquired in 2014, (2) the removal of historical IRT acquisition expenses as IRT is depicting those acquisitions as being made on January 1, 2014 for
pro forma purposes, (3) recognition of additional depreciation expense on the properties that IRT acquired in 2014 along with our acquisition of Bayview in 2015 and amortization expense of in-place leases for the properties acquired in 2014 (note,
depreciation and amortization expense is computed on a straight-line basis over a 40 year useful life for buildings and estimated life of six months for acquired in-place leases), (4) interest expense associated with the permanent financing of The
Crossings property, which IRT acquired on November 22, 2013, permanent financing for the properties IRT acquired in 2014, and the borrowings under IRT’s line of credit for the Bayview acquisition, which assumes the financings were outstanding
as of the beginning of the respective period and (5) an adjustment to the income allocation to non-controlling interests as a result of the aforementioned adjustments.
(5) Represents the historical income statement for TSRE for the year ended December 31, 2014, included in TSRE’s Annual Report on Form 10-K filed on March 13, 2015.
(6) Represents the adjustment to reflect the pro forma revenues and property operating expenses for the properties that TSRE acquired in 2014. This adjustment
represents the revenues and property operating expenses associated with the period that TSRE did not own the property, effectively January 1, 2014 through the acquisition date of each property. TSRE acquired Miller Creek and Wake Forest on January
21, 2014, Aventine on February 4, 2014, Brier Creek on March 10, 2014, Craig Ranch on March 18, 2014 and Big Creek on April 7, 2014. Rental income, tenant reimbursement and other income and property operating expenses from these properties from
January 1, 2014 through the acquisition date were $1,918, $169 and $895, respectively. The operations of each property subsequent to the date of acquisitions are included in the historical consolidated income statement of TSRE for the year ended
December 31, 2014.
(7) As part of the Merger, the TSRE assets will become externally managed and all employees and corporate contracts will be terminated. This
adjustment to general and administrative expenses represents the removal of these historical costs.
(8) Adjustment represents the additional asset management fee
due pursuant to the existing asset management agreement. The terms of the existing asset management agreement require a management fee based on 75 basis points of real estate assets annually. At the closing date of the Merger, IRT intends to amend
its asset management agreement to change from an asset based fee structure to an equity based fee structure. The unaudited pro forma condensed consolidated financial statements do not reflect the new equity based fee structure since it will not be
in place until closing of the Merger.
(9) Adjustment represents the removal of TSRE’s historical acquisition expenses of $3,044 for the year ended December
31, 2014, as the acquisitions made by TSRE were depicted as occurring on January 1, 2014 for pro forma purposes.
(10) For the year ended December 31, 2014,
depreciation and amortization was adjusted to eliminate $19,250 of TSRE’s historical depreciation and amortization expense, to recognize $13,458 of depreciation expense based on the fair value of TSRE’s real estate assets, and to recognize
$6,936 for the amortization of in-place leases associated with TSRE’s assets.
(11) For the year ended December 31, 2014, interest expense is reduced by
$13,964 to remove TSRE’s historical interest cost and increased by $23,500 to recognize interest expense associated with the $500,000 bridge loan used to finance the cash portion of the Merger Consideration.
(12) Noncontrolling interest was adjusted to eliminate TSRE’s historical income allocated to noncontrolling interest expense, as TSRE’s historical outstanding operating
partnership units will be redeemed for IRT shares and cash, and to also adjust the income allocated to noncontrolling interests pursuant to the aforementioned adjustments.
(13) Pro forma weighted average shares increased as a result of the issuance of 16,079,973 shares of IRT common stock to TSRE stockholders in connection with the Merger.
Independence Realty Trust
19
Independence Realty Trust
Cira Centre 2929 Arch Street, 17th Floor Philadelphia, PA 19104 (215) 243-9000
Independence Realty Trust
20