Attached files
| file | filename |
|---|---|
| 8-K - 8-K - WAYNE SAVINGS BANCSHARES INC /DE/ | form8k-14120_wayn.htm |

Annual Shareholders’ Meeting May 28, 2015
In addition to the historical information contained herein, the following discussion contains forward - looking statements that involve risks and uncertainties . Economic circumstances, the Company’s operations, and actual results could differ significantly from those discussed in forward - looking statements . Some of the factors that could cause or contribute to such differences are discussed herein but also include changes in the economy and interest rates in the nation and the Company’s general market area . The forward - looking statements contained herein include, but are not limited to, those with respect to the following matters : ( 1 ) management’s determination of the amount and adequacy of the allowance for loan losses ; ( 2 ) the effect of changes in interest rates ; ( 3 ) management’s opinion as to the effects of recent accounting pronouncements on the Company’s consolidated financial statements ; and ( 4 ) management’s opinion as to the Bank’s ability to maintain regulatory capital at current levels . Forward Looking Statements

Call To Order Peggy J. Schmitz Chair, Board of Directors

Directors Peggy J. Schmitz, Chair, Board of Directors Daniel R. Buehler Jonathan Ciccotelli, CPA Stewart Fitz Gibbon, President & CEO ( nominee for election)

Directors David L. Lehman (nominee for a new term) Debra A. Marthey Glenn W. Miller, CPA (nominee for a new term)

Stewart Fitz Gibbon – President and CEO Joel Beckler – SVP, Senior Loan Officer Myron Swartzentruber, CPA – SVP, CFO Ursula Lehman – SVP, Director of Human Resources and Training Jeff King – SVP, Chief Information Officer Donna Knack – SVP, Director of Customer Service and Sales Senior Management Team

Also Present Becky Rose – VP, Internal Audit, Inspector of Election Brittany Hartzler – AVP , Corporate Secretary Scott Hopf, CPA – Senior Manager, BKD LLP Steve Wuchnick , CPA – Senior Associate , BKD LLP Francis Grady – Grady & Associates
Instructions on Procedures

Opening of Polls

Closing of Polls

Business Overview Stewart Fitz Gibbon President and CEO
We will fulfill our communities’ banking needs while expanding opportunities for our staff and increasing value for our stakeholders. Mission/Vision/Values/Outcome Objectives □ An independent dynamic financial services organization □ A top performing community bank □ The bank of choice for customers, staff and investors

Mission/Vision/Values/Outcome Objectives (continued) Neighbors serving neighbors to achieve financial goals. □ Integrity □ Commitment □ Accountability □ Relationships □ Diligence
□ Profitability – increase shareholder value □ Create opportunities for our staff □ Give back to our communities Mission/Vision/Values/Outcome Objectives (continued)

□ 10 - K Strategic Initiatives and Board Chair’s Letter. □ New CEO, eliminate the former COO position, reallocate resources to information technology, human resources, internal audit and risk management. □ Continued remixing of balance sheet assets to increase higher yielding, on a risk adjusted basis, commercial and consumer loans, while maintaining a residential mortgage loan portfolio and reducing, subject to liquidity constraints, the investment securities portfolio. Strategic Initiatives
□ Continued transition from a transaction oriented thrift culture to a relationship oriented commercial bank culture through new position descriptions, activity goals, performance reviews and compensation structures consistent with regulatory guidance. In addition, turnover in the existing staff is being used as an opportunity to recruit experienced talent to further change the culture of the organization. □ Continued progress on technology upgrades begun in 2014 and scheduled through 2016 to facilitate more efficient customer service and operations. Strategic Initiatives (continued)
□ Continued focus on enterprise risk management and regulatory compliance. The focus of the ERM program is to ensure the identification, measurement and management of risks, and the pricing of risk to produce acceptable returns to shareholders. As part of ERM and coordinated with internal audit, regulatory compliance is a particular area of attention to facilitate the continued generation of returns to shareholders while avoiding the costs of remedial actions for compliance deficiencies commensurate with the risks assumed in those activities and consistent with legal requirements, regulatory requirements and general economic conditions. Strategic Initiatives (continued)
Implementing the Strategy Technology & Marketing Developing New Mobile - Friendly , Relevant Website □ 2015 Summer launch □ KEY sales & marketing channel □ Online “branch” location □ Internet is now the primary source of information . . . before coming into the branch to do business
Mobile Responsive – O ne W ebsite, Multiple D evices

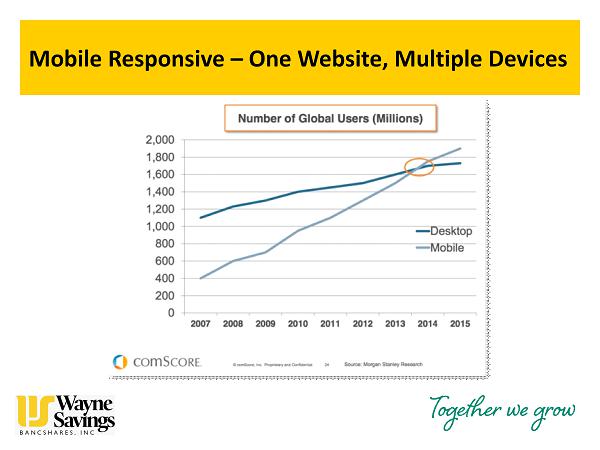
□ Mobile usage has now surpassed desktop. □ Websites must now have dynamic content that is optimized to drive new customers to us. □ We understand that as a community bank, we have to show that we have the technology customers need, just like the big banks. □ While customers value the personalized service in our branches, we know that banking needs to be accessible 24 - hours a day. Mobile Responsive – O ne W ebsite, Multiple D evices

Website – BEFORE BEFORE


Ashland drive - thru building closure □ Low transaction volume □ Little disruption to customers ▪ ATM and night drop will remain open ▪ Main office 300 feet away ▪ Sugarbush office and drive - thru 2.14 miles away ▪ Mobile check deposit available □ Savings of 2 full - time staff and utilities Implementing the Strategy Managing Overhead Expenses

Managing Overhead Expense ( continued) Branch Transaction Study Jul-14 Aug-14 Oct-14 Jan-15 Feb-15 Mar-15 Average

□ 11 offices in 5 counties □ Core lines of business include: □ Mortgage lending □ Consumer and commercial lending □ Deposit products and services □ Retirement accounts □ Merchant credit card services □ As of December 31, 2014 □ Assets of $417.7 million □ Net loans of $265.6 million □ Deposits of $348.9 million □ Shareholders’ equity of $40.0 million or 9.6% of total assets Wayne Savings at a Glance
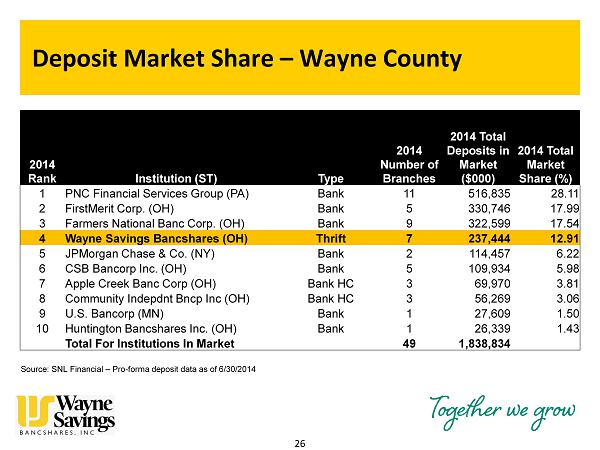
26 Deposit Market Share – Wayne County 2014 Rank Institution (ST) Type 2014 Number of Branches 2014 Total Deposits in Market ($000) 2014 Total Market Share (%) 1 PNC Financial Services Group (PA) Bank 11 516,835 28.11 2 FirstMerit Corp. (OH) Bank 5 330,746 17.99 3 Farmers National Banc Corp. (OH) Bank 9 322,599 17.54 4 Wayne Savings Bancshares (OH) Thrift 7 237,444 12.91 5 JPMorgan Chase & Co. (NY) Bank 2 114,457 6.22 6 CSB Bancorp Inc. (OH) Bank 5 109,934 5.98 7 Apple Creek Banc Corp (OH) Bank HC 3 69,970 3.81 8 Community Indepdnt Bncp Inc (OH) Bank HC 3 56,269 3.06 9 U.S. Bancorp (MN) Bank 1 27,609 1.50 10 Huntington Bancshares Inc. (OH) Bank 1 26,339 1.43 Total For Institutions In Market 49 1,838,834 Source: SNL Financial – Pro - forma deposit data as of 6/30/2014

27 Deposit Market Share – Ashland County 2014 Rank Institution (ST) Type 2014 Number of Branches 2014 Total Deposits in Market ($000) 2014 Total Market Share (%) 1 PNC Financial Services Group (PA) Bank 2 111,805 18.57 2 Huntington Bancshares Inc. (OH) Bank 1 104,241 17.31 3 Park National Corp. (OH) Bank 3 87,074 14.46 4 FirstMerit Corp. (OH) Bank 3 76,607 12.72 5 Sutton Bancshares Inc. (OH) Bank HC 2 60,609 10.07 6 JPMorgan Chase & Co. (NY) Bank 2 59,689 9.91 7 Wayne Savings Bancshares (OH) Thrift 2 42,685 7.09 8 Community Indepdnt Bncp Inc (OH) Bank HC 2 29,170 4.84 9 United Community Finl Corp. (OH) Thrift 1 28,452 4.73 10 Woodforest Financial Grp Inc. (TX) Bank HC 1 1,774 0.29 Total For Institutions In Market 19 602,106 Source: SNL Financial – Pro - forma deposit data as of 6/30/2014

28 Deposit Market Share – Stark County 2014 Rank Institution (ST) Type 2014 Number of Branches 2014 Total Deposits in Market ($000) 2014 Total Market Share (%) 1 Huntington Bancshares Inc. (OH) Bank 26 1,513,948 26.26 2 FirstMerit Corp. (OH) Bank 16 1,415,340 24.55 3 JPMorgan Chase & Co. (NY) Bank 13 756,351 13.12 4 Royal Bank of Scotland Group Bank 14 567,697 9.85 5 KeyCorp (OH) Bank 12 541,944 9.40 6 PNC Financial Services Group (PA) Bank 10 321,982 5.59 7 Consumers Bancorp Inc. (OH) Bank 7 166,338 2.89 8 Ohio Legacy Corp (OH) Bank 2 154,599 2.68 9 Fifth Third Bancorp (OH) Bank 5 99,031 1.72 10 Magnolia Bancorp Inc. (OH) Bank HC 3 68,804 1.19 13 Wayne Savings Bancshares (OH) Thrift 1 24,850 0.43 Total For Institutions In Market 124 5,764,858 Source: SNL Financial – Pro - forma deposit data as of 6/30/2014
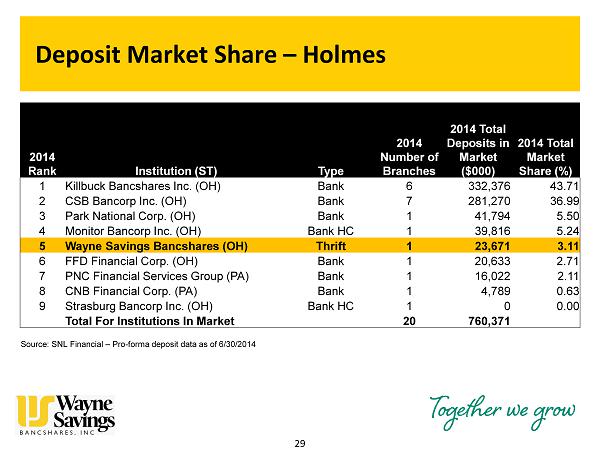
29 Deposit Market Share – Holmes 2014 Rank Institution (ST) Type 2014 Number of Branches 2014 Total Deposits in Market ($000) 2014 Total Market Share (%) 1 Killbuck Bancshares Inc. (OH) Bank 6 332,376 43.71 2 CSB Bancorp Inc. (OH) Bank 7 281,270 36.99 3 Park National Corp. (OH) Bank 1 41,794 5.50 4 Monitor Bancorp Inc. (OH) Bank HC 1 39,816 5.24 5 Wayne Savings Bancshares (OH) Thrift 1 23,671 3.11 6 FFD Financial Corp. (OH) Bank 1 20,633 2.71 7 PNC Financial Services Group (PA) Bank 1 16,022 2.11 8 CNB Financial Corp. (PA) Bank 1 4,789 0.63 9 Strasburg Bancorp Inc. (OH) Bank HC 1 0 0.00 Total For Institutions In Market 20 760,371 Source: SNL Financial – Pro - forma deposit data as of 6/30/2014

30 Deposit Market Share - Medina County 2014 Rank Institution (ST) Type 2014 Number of Branches 2014 Total Deposits in Market ($000) 2014 Total Market Share (%) 1 FirstMerit Corp. (OH) Bank 12 880,998 27.27 2 Ohio Farmers Insurance Co. (OH) Thrift HC 3 488,620 15.12 3 TFS Financial Corp (MHC) (OH) Thrift 2 352,281 10.90 4 PNC Financial Services Group (PA) Bank 6 283,783 8.78 5 JPMorgan Chase & Co. (NY) Bank 4 232,695 7.20 6 Fifth Third Bancorp (OH) Bank 5 218,269 6.76 7 Huntington Bancshares Inc. (OH) Bank 5 185,618 5.75 8 Farmers Savings Bank (OH) Comm'l Bank 1 151,088 4.68 9 U.S. Bancorp (MN) Bank 5 121,383 3.76 10 Royal Bank of Scotland Group Bank 3 96,053 2.97 15 Wayne Savings Bancshares (OH) Thrift 1 22,243 0.69 Total For Institutions In Market 54 3,230,815 Source: SNL Financial – Pro - forma deposit data as of 6/30/2014
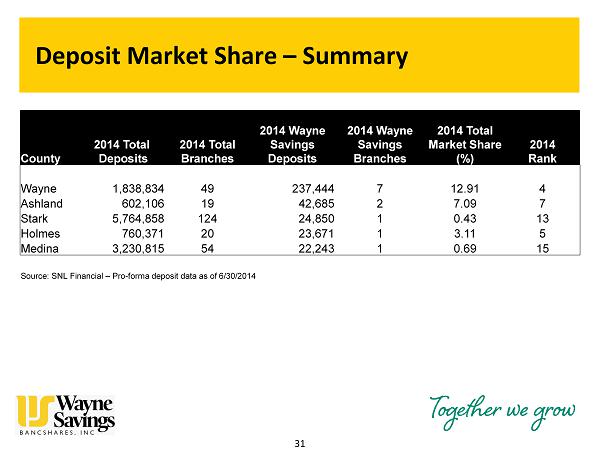
31 Deposit Market Share – Summary County 2014 Total Deposits 2014 Total Branches 2014 Wayne Savings Deposits 2014 Wayne Savings Branches 2014 Total Market Share (%) 2014 Rank Wayne 1,838,834 49 237,444 7 12.91 4 Ashland 602,106 19 42,685 2 7.09 7 Stark 5,764,858 124 24,850 1 0.43 13 Holmes 760,371 20 23,671 1 3.11 5 Medina 3,230,815 54 22,243 1 0.69 15 Source: SNL Financial – Pro - forma deposit data as of 6/30/2014

Experienced Board & Management 32 Name Age Peggy Schmitz 63 Chair of the Board 2008 Dan Buehler 60 Director 2005 Jonathan Ciccotelli, CPA 49 Lead Director 2010 David Lehman 68 Director 2012 Debi Marthey 60 Director 2011 Glenn Miller, CPA 51 Director 2012 Stewart Fitz Gibbon 58 Director, President and CEO 2014 Board of Directors Director SincePosition Held at Wayne Executive Management Age Title Wayne Stewart Fitz Gibbon 58 President and Chief Executive Officer 9 Joel Beckler 53 SVP and Senior Loan Officer 10 Myron Swartzentruber, CPA 47 SVP and Chief Financial Officer 14

5 Year Stock Price Performance (4/30/10 – 4/30/15) 33 Source: SNL Financial as of April 30, 2015
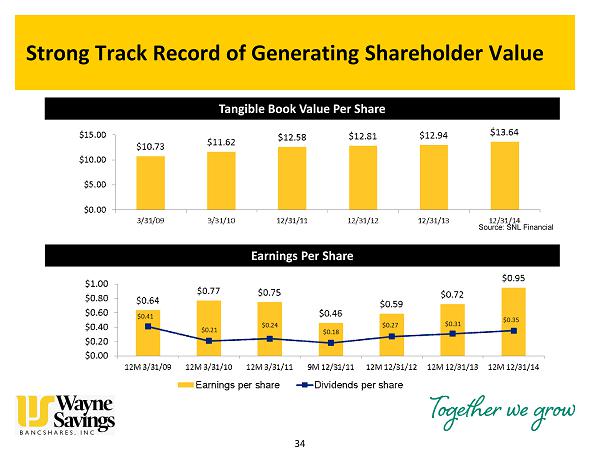
Strong Track Record of Generating Shareholder Value 34 Tangible Book Value Per Share Earnings Per Share Source: SNL Financial

□ Capital managed to align with realized growth rate through cash dividend increase and stock repurchase. □ Improved Asset Quality. Impaired loans reduced. Real Estate Owned up from $0 last year, but still low by historical standards. □ Increased Earnings, mainly through expense control, but also through loan growth. □ Continued pressure on the Net Interest Margin due to low interest rate environment. WAYN: 2014 Financial Highlights 35

0 2 4 6 8 10 12 14 Equity to Assets at Period End (%) C - CAPITAL

A - ASSET QUALITY

A - ASSET QUALITY

A - ASSET QUALITY

A - ASSET QUALITY
□ Everything not in C, A, E, L or S □ Strategy , Reputation, Operations , Compliance □ Information/ Cybersecurity – top regulatory and consumer concern □ Some acronyms you might have heard – CRA (Community Reinvestment Act) – BSA (Bank Secrecy Act) – GLBA (Gramm - Leach - Bliley Act) M - MANAGEMENT
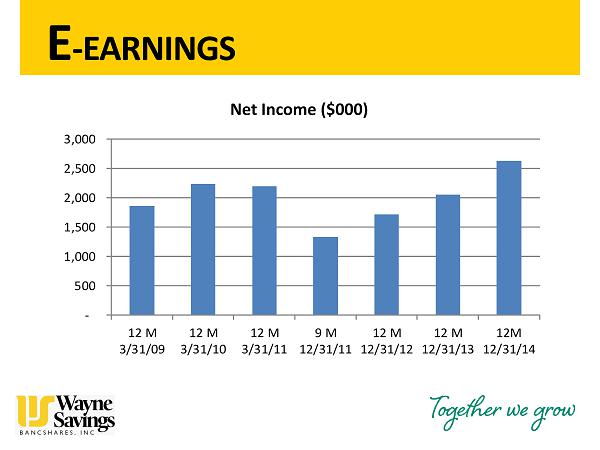
- 500 1,000 1,500 2,000 2,500 3,000 12 M 3/31/09 12 M 3/31/10 12 M 3/31/11 9 M 12/31/11 12 M 12/31/12 12 M 12/31/13 12M 12/31/14 E - EARNINGS Net Income ($000)

L - LIQUIDITY □ Deposits are our principal source of funds. □ Two principal types – low - cost transaction accounts for everyday use by consumers and businesses and higher - cost time deposits, mainly by consumers. □ Liquidity is our ability to fund loans or deposit withdrawals when they occur. – Investment Portfolio – Borrowed Funds
Interest Rate Risk □ Hard to measure due to lots of assumptions required to run models to estimate IRR. □ Falling rates - borrowers refinance loans at lower rates and securities pay down faster with reinvestment at lower rates. Asset yields generally fall faster than the cost of funds , reducing net income . S - SENSITIVITY
S - SENSITIVITY □ Rising rates – depositors move into higher yielding accounts. Cost of funds generally rises faster than asset yields, reducing net income. Another top regulatory concern.

S - SENSITIVITY □ Interest rates are low and have been low for an extended period since the financial crisis of 2008. □ When will rates go up? □ The Federal Reserve is holding rates down through monetary policy. Future policy decisions are “data dependent.”
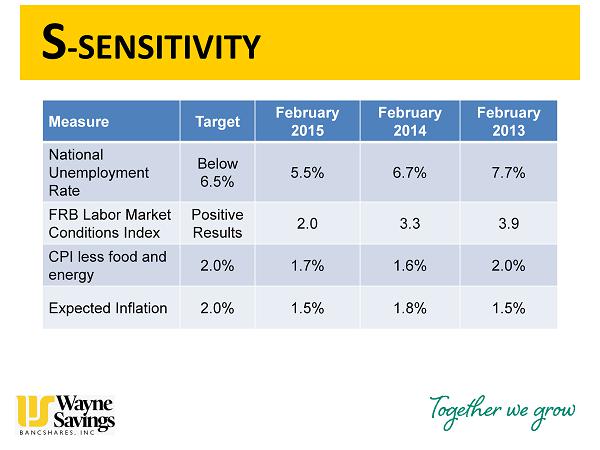
S - SENSITIVITY Measure Target February 2015 February 2014 February 2013 National Unemployment Rate Below 6.5% 5.5% 6.7% 7.7% FRB Labor Market Conditions Index Positive Results 2.0 3.3 3.9 CPI less food and energy 2.0% 1.7% 1.6% 2.0% Expected Inflation 2.0% 1.5% 1.8% 1.5%
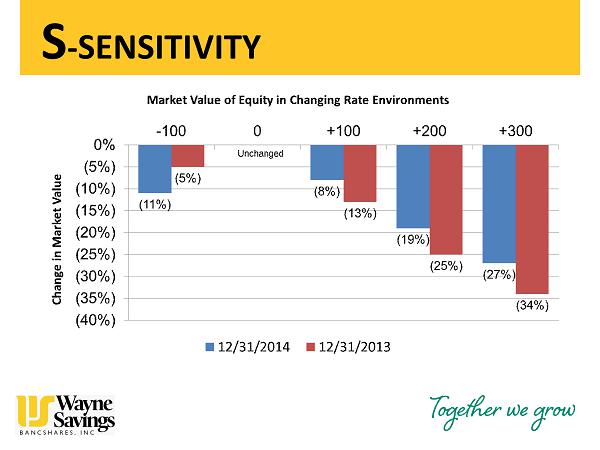
S - SENSITIVITY

□ Press release and 10 - Q filed at www.sec.gov. □ Earnings per share of $0.16 for the quarter, compared to $0.24 in the prior year quarter. □ Decrease mainly due to a $233,000 provision for loan losses as a group of nonperforming loans continues to be worked out and an increase in loan balances. First Quarter 2015 Highlights

□ Increase of 1% in total loans compared to 12/31/14 despite another difficult winter reflected in 0.2% reported growth in Gross Domestic Product (GDP) and strong competition on pricing and loan terms. □ Decrease of 3% in total securities compared to 12/31/14 as lower yielding securities balances are reinvested in higher yielding loan balances. □ Decrease of 20% in nonperforming assets compared to 12/31/14. First Quarter 2015 Highlights (continued)
REPORT OF THE INSPECTOR OF ELECTION Becky Rose, VP, Internal Audit

Adjournment Thank you for your support. Management will answer questions following the meeting.