Attached files
| file | filename |
|---|---|
| 8-K - 8-K - CMS ENERGY CORP | cms-20150529x8k.htm |
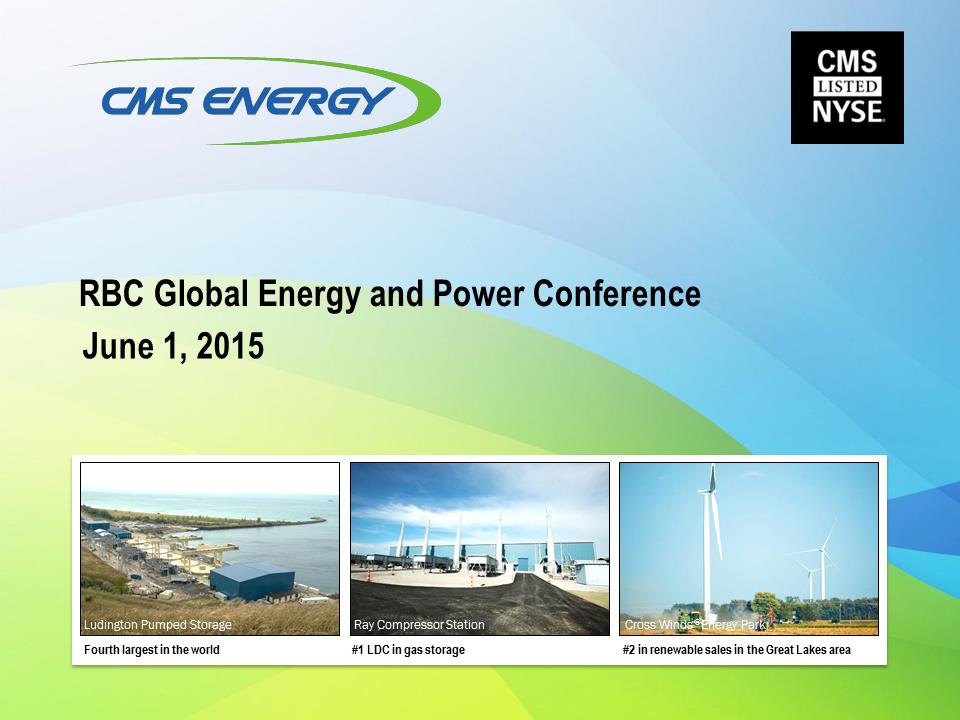 CMS Energy CMS Listed NYSE American Gas Association May 18 RBC Global Energy and Power Conference June 1,& 19, 2015 Ludington Pumped Storage Fourth Largest in the world Ray Compressor Station #1 LDC in gas storage Cross Winds® Energy Park #2 in renewable sales in the Great Lakes area
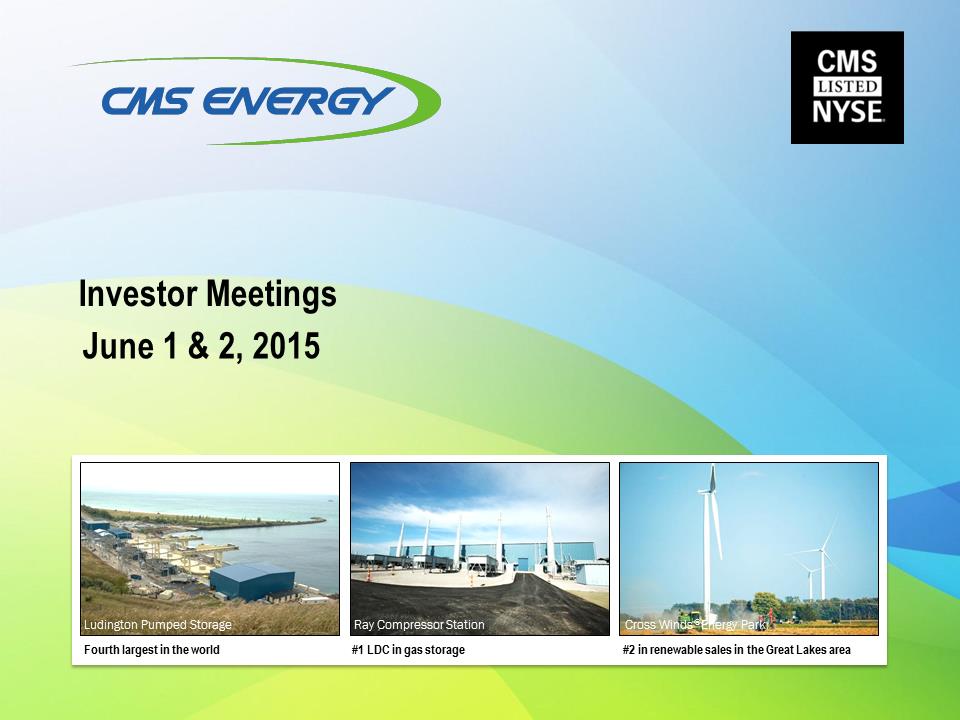 CMS Energy CMS Listed NYSE Investor Meetings June 1 & 2, 2015 Ludington Pumped Storage Fourth Largest in the world Ray Compressor Station #1 LDC in gas storage Cross Winds® Energy Park #2 in renewable sales in the Great Lakes area
 This presentation is made as of the date hereof and contains “forward-looking statements” as defined in Rule 3b-6 of the Securities Exchange Act of 1934, Rule 175 of the Securities Act of 1933, and relevant legal decisions. The forward-looking statements are subject to risks and uncertainties. All forward-looking statements should be considered in the context of the risk and other factors detailed from time to time in CMS Energy’s and Consumers Energy’s Securities and Exchange Commission filings. Forward-looking statements should be read in conjunction with “FORWARD-LOOKING STATEMENTS AND INFORMATION” and “RISK FACTORS” sections of CMS Energy’s and Consumers Energy’s Form 10-K for the year ended December 31, 2014 and as updated in subsequent 10-Qs. CMS Energy’s and Consumers Energy’s “FORWARD-LOOKING STATEMENTS AND INFORMATION” and “RISK FACTORS” sections are incorporated herein by reference and discuss important factors that could cause CMS Energy’s and Consumers Energy’s results to differ materially from those anticipated in such statements. CMS Energy and Consumers Energy undertake no obligation to update any of the information presented herein to reflect facts, events or circumstances after the date hereof. The presentation also includes non-GAAP measures when describing CMS Energy’s results of operations and financial performance. A reconciliation of each of these measures to the most directly comparable GAAP measure is included in the appendix and posted on our website at www.cmsenergy.com. CMS Energy provides historical financial results on both a reported (Generally Accepted Accounting Principles) and adjusted (non-GAAP) basis and provides forward-looking guidance on an adjusted basis. Management views adjusted earnings as a key measure of the company’s present operating financial performance, unaffected by discontinued operations, asset sales, impairments, regulatory items from prior years, or other items. These items have the potential to impact, favorably or unfavorably, the company's reported earnings in future periods. Investors and others should note that CMS Energy and Consumers Energy post important financial information using the investor relations section of the CMS Energy website, www.cmsenergy.com and Securities and Exchange Commission filings.
 .Best track record of consistent, high-end EPS growth? .Biggest O&M cost reduction track record? .Highest capital investment growth? .No need for block equity (dilution) over five years? .“World-class” regulation and energy law? Who Has the. . . .
 CMS Energy
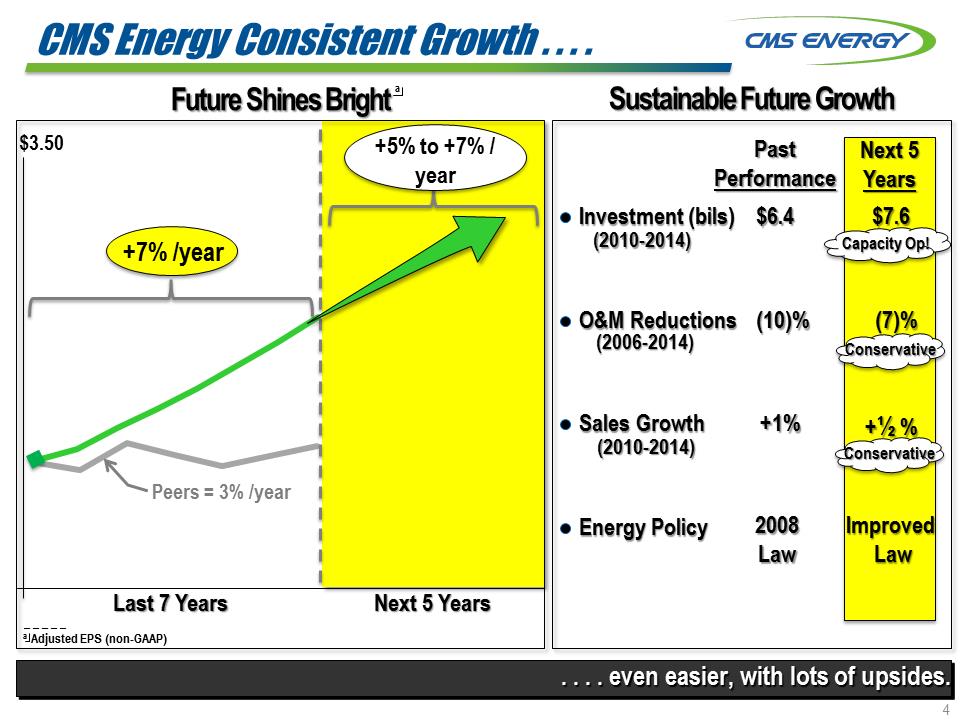 CMS Energy Consistent Growth . . . . . . . . even easier, with lots of upsides. Sustainable Future Growth Investment (bils) O&M Reductions Sales Growth Energy Policy Future Shines Bright $6.4 (10)% +1% $7.6 (7)% +½ % Past Performance Next 5 Years Improved Law (2010-2014) (2006-2014) (2010-2014) 2008 Law Next 5 Years +7% /year +5% to +7% / year _ _ _ _ _ a Adjusted EPS (non-GAAP) $3.50 Conservative Conservative Capacity Op! a Peers = 3% /year
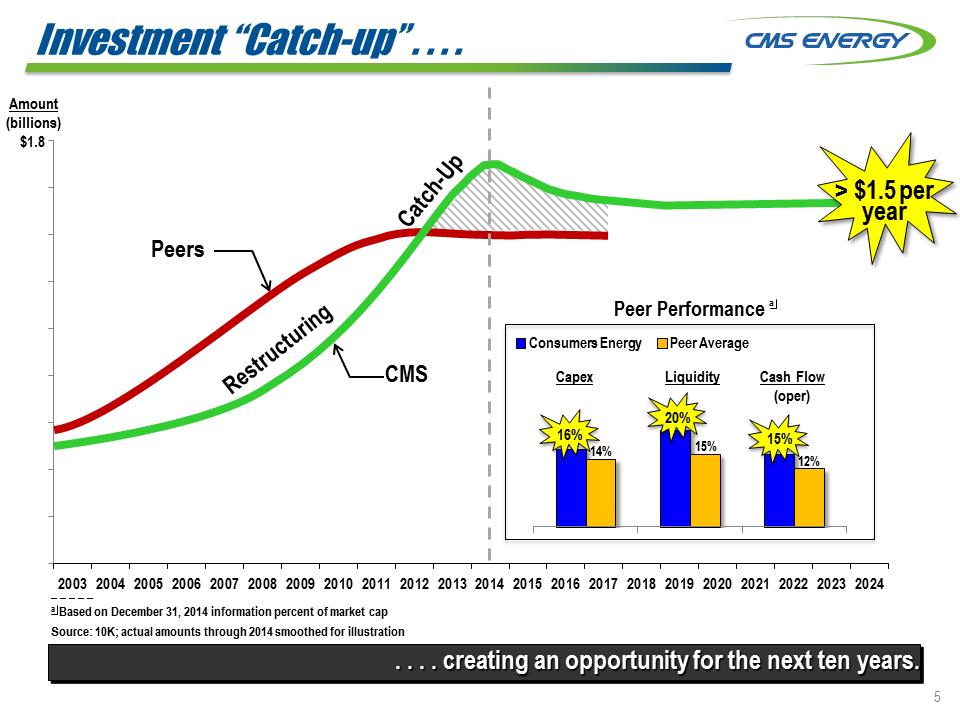 2003200420052006200720082009201020112012201320142015201620172018201920202021202220232024. . . . creating an opportunity for the next ten years. Amount (billions) $1.8 CMS Peers _ _ _ _ _ a Based on December 31, 2014 information percent of market cap Source: 10K; actual amounts through 2014 smoothed for illustration Investment “Catch-up” . . . . > $1.5 per year 14% 15% 16% 12% 20% 15% Capex Cash Flow (oper) Consumers Energy Peer Average Peer Performance a
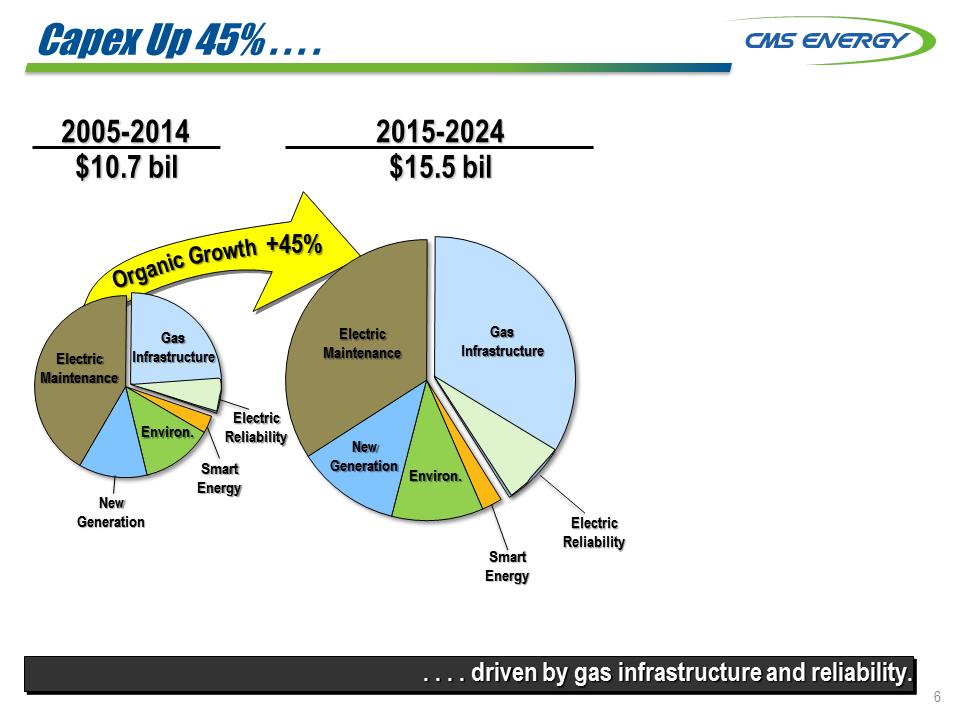 Capex Up 45% . . . . . . . . driven by gas infrastructure and reliability. 2015-2024 2005-2014 $10.7 bil $15.5 bil +45% Capex Up 45% . . . . . . . . driven by gas infrastructure and reliability.Electric Maintenance New Generation Environ. Smart Energy Electric Reliability Electric Maintenance Gas Infrastructure Environ. New Generation Smart Energy Electric Reliability
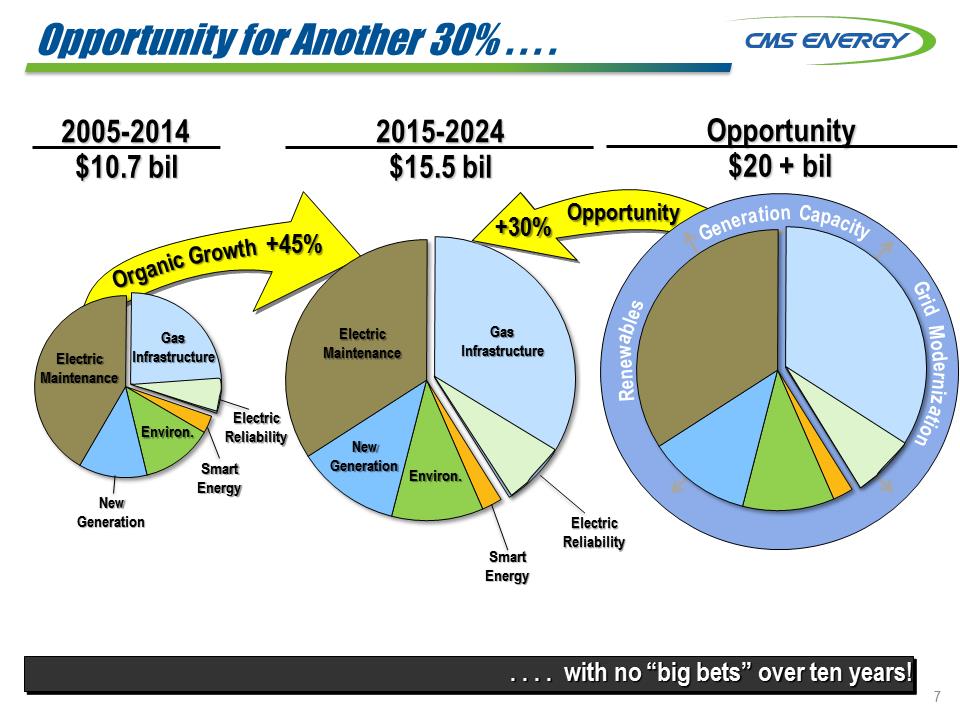 Opportunity for Another 30% . . . . . . . . with no “big bets” over ten years! 2015-2024 2005-2014 $10.7 bil $15.5 bil +45% Opportunity for Another 30% . . . . . . . . with no “big bets” over ten years!+30% Electric Maintenance Gas Infrastructure New Generation Environ. Smart Energy Electric Reliability Electric Maintenance Gas Infrastructure Environ. New Generation Smart Energy Electric Reliability Opportunity $20 + bil OrganicGrowth+30%OpportunityElectric MaintenanceGas InfrastructureNew GenerationEnviron.Smart EnergyElectric ReliabilityElectric Maintenance
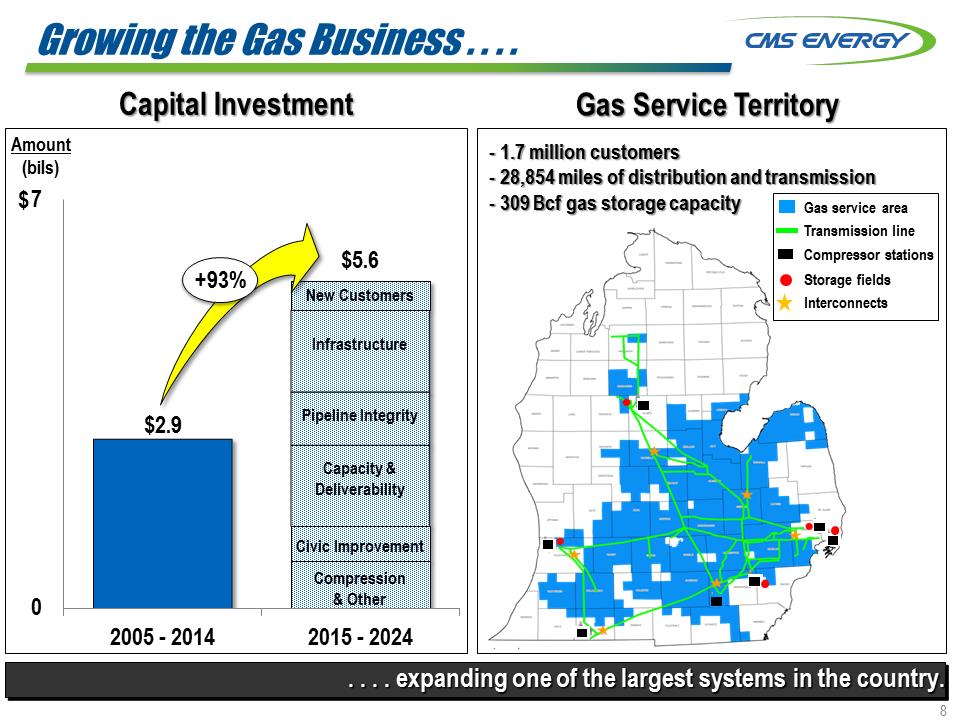 Growing the Gas Business . . . . . . . . expanding one of the largest systems in the country. Amount (bils) $5.6 Capital Investment $ +93% Pipeline Integrity Civic Improvement Capacity & Deliverability Compression & Other Infrastructure New Customers Gas service area Transmission line Compressor stations Storage fields Interconnects Gas Service Territory - 1.7 million customers - 28,854 miles of distribution and transmission - 309 Bcf gas storage capacity
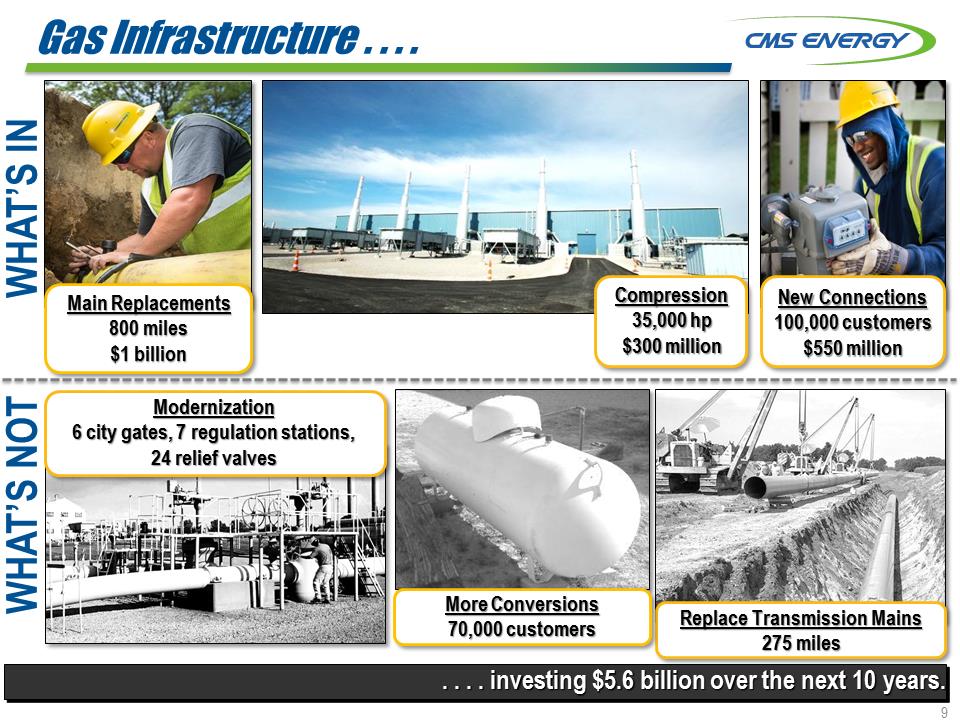 Gas Infrastructure . . . . . . . . investing $5.6 billion over the next 10 years. Main Replacements 800 miles $1 billion Modernization 6 city gates, 7 regulation stations, 24 relief valves New Connections 100,000 customers $550 million Replace Transmission Mains 275 miles WHAT’S IN WHAT’S NOT More Conversions 70,000 customers Compression 35,000 hp $300 million
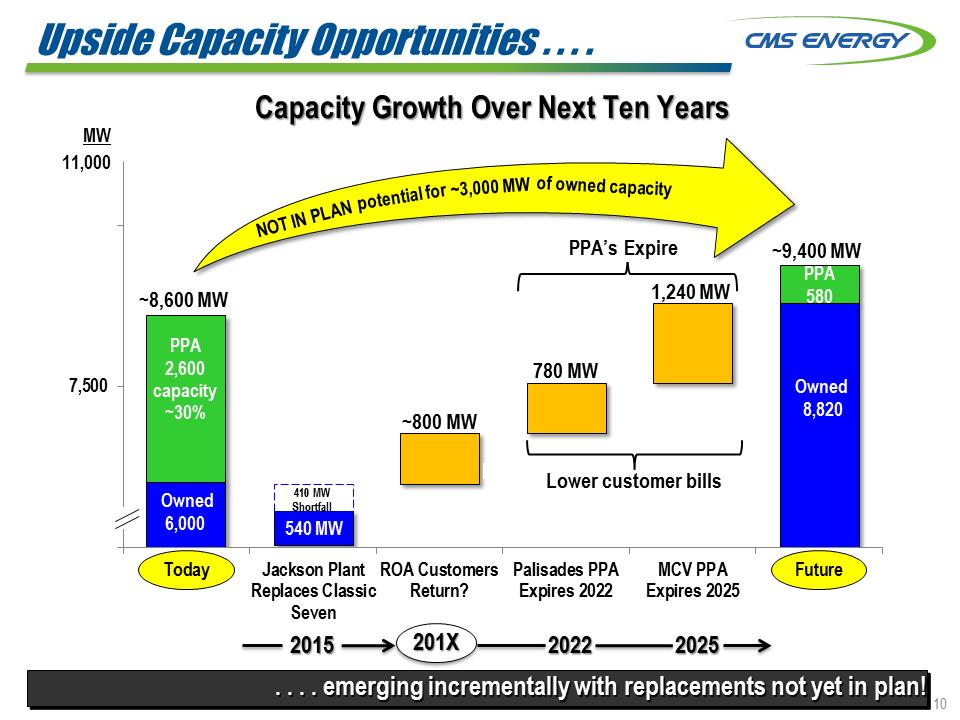 . . . . emerging incrementally with replacements not yet in plan! 7,50010,000TodayJackson PlantReplaces ClassicSevenROA CustomersReturn?Palisades PPAExpires 2022MCV PPAExpires 2025Future~800 MW 1,240 MW MW PPA 2,600 capacity ~30% ~8,600 MW 540 MW 410 MW Shortfall Owned 6,000 780 MW ~9,400 MW 11,000 Owned 8,820 PPA 580 Capacity Growth Over Next Ten Years Lower customer bills 2015 2022 2025 201X Upside Capacity Opportunities . . . . Upside Capacity Opportunities . . . . ~3,000 MWNOT IN PLANpotential for
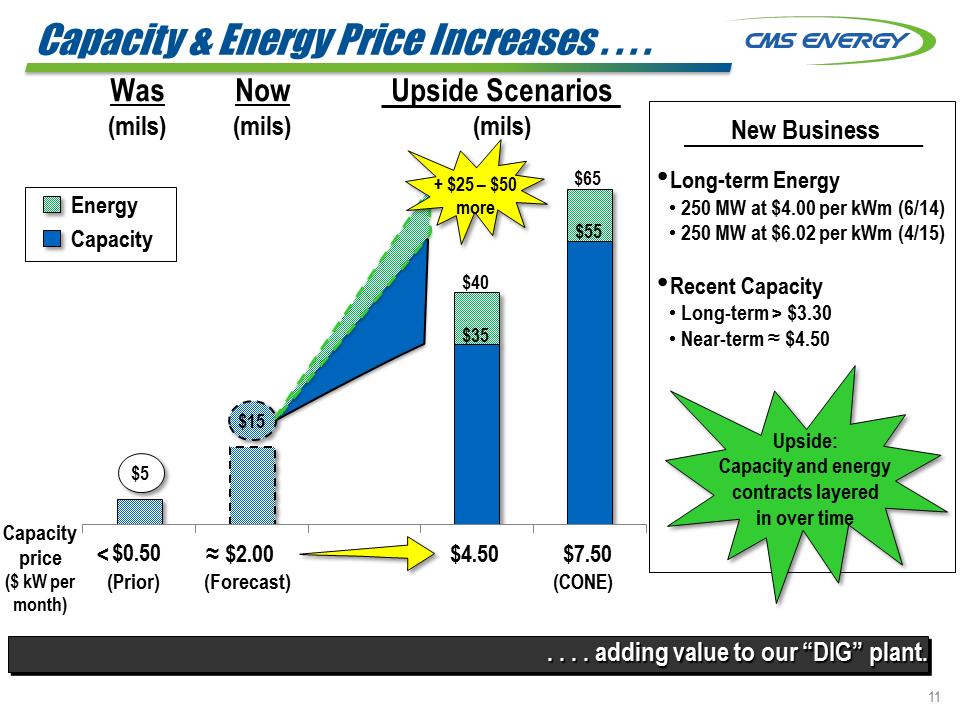 Capacity & Energy Price Increases . . . . . . . . adding value to our “DIG” plant. $0.50$2.00$4.50$7.50Capacity price ($ kW per month) Was (mils) Upside Scenarios (mils) $55 $35 New Business •Long-term Energy •250 MW at $4.00 per kWm (6/14) •250 MW at $6.02 per kWm (4/15) •Recent Capacity •Long-term > $3.30 •Near-term ˜ $4.50 Upside: Capacity and energy contracts layered in over time (CONE) $15 ˜ $5 (Forecast) (Prior) Capacity Energy $65 $40 + $25 – $50 more $0.50
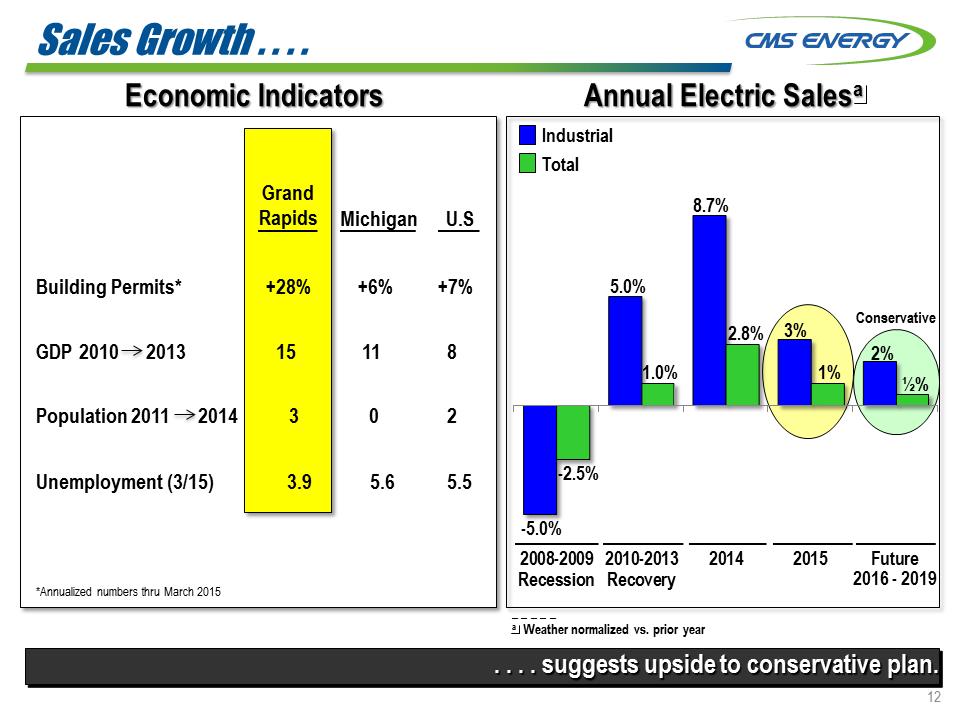 Sales Growth . . . . . . . . suggests upside to conservative plan. Annual Electric Salesa 2008-2009Recession2010-2013Recovery20142015Future -5.0% -2.5% 5.0% 8.7% 2.8% 3% 1% Industrial Total _ _ _ _ _ a Weather normalized vs. prior year ½% 2% Conservative 2016 - 2019 Economic Indicators Grand Rapids Michigan U.S Building Permits* +28% +6% +7% GDP 2010 2013 15 11 8 Population 2011 2014 3 0 2 Unemployment (3/15) 3.9 5.6 5.5 *Annualized numbers thru March 2015
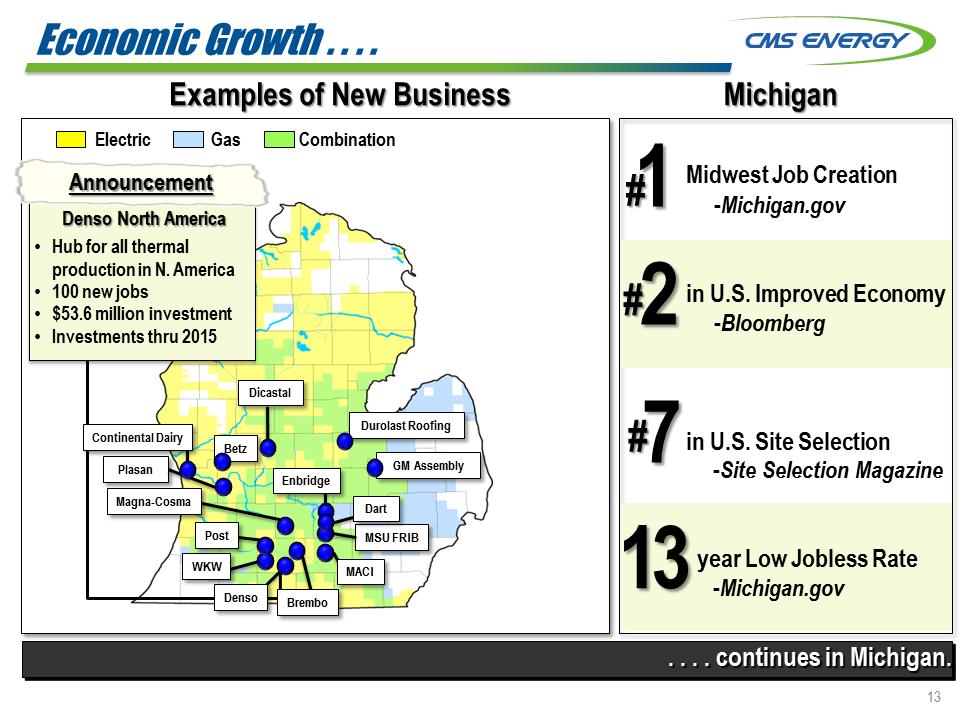 Mich_Map. . . . continues in Michigan. Electric Gas Combination Betz MSU FRIB Durolast Roofing GM Assembly Examples of New Business Michigan Denso North America •Hub for all thermal production in N. America •100 new jobs •$53.6 million investment •Investments thru 2015 Announcement Enbridge MACI Dart Brembo Denso WKW Post Magna-Cosma Economic Growth . . . . Midwest Job Creation -Michigan.gov in U.S. Improved Economy -Bloomberg in U.S. Site Selection -Site Selection Magazine year Low Jobless Rate -Michigan.gov # Dicastal Plasan Continental Dairy 1 # 2 # 7 13
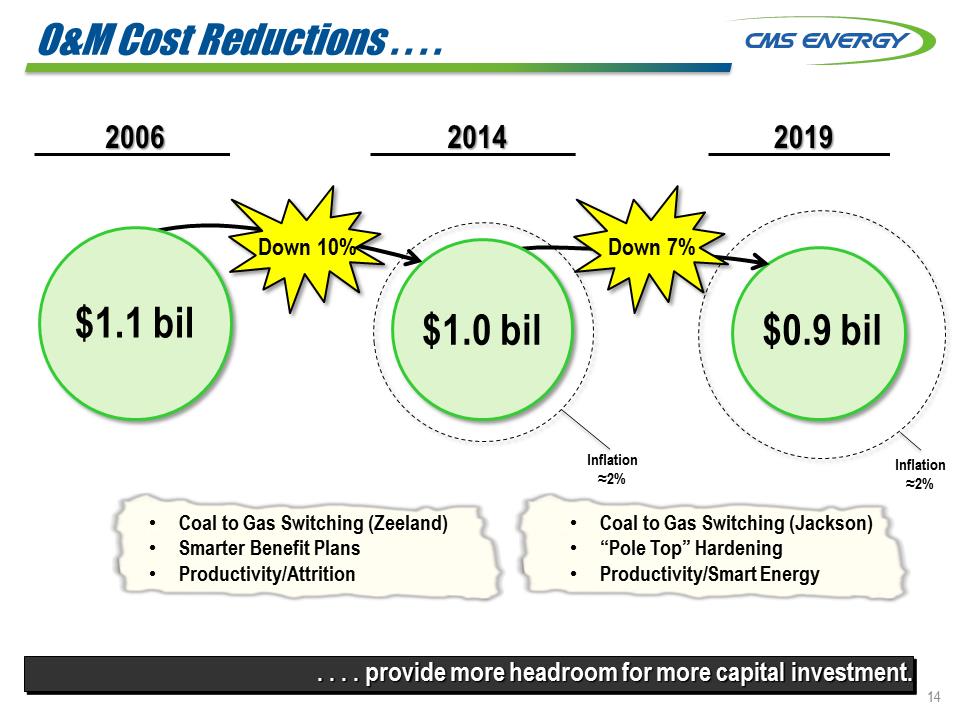 O&M Cost Reductions . . . . . . . . provide more headroom for more capital investment. Down 10% $1.1 bil $0.9 bil 2006 2014 2019 $1.0 bil •Coal to Gas Switching (Zeeland) •Smarter Benefit Plans •Productivity/Attrition •Coal to Gas Switching (Jackson) •“Pole Top” Hardening •Productivity/Smart Energy Down 7% Inflation ˜2% Inflation ˜2%
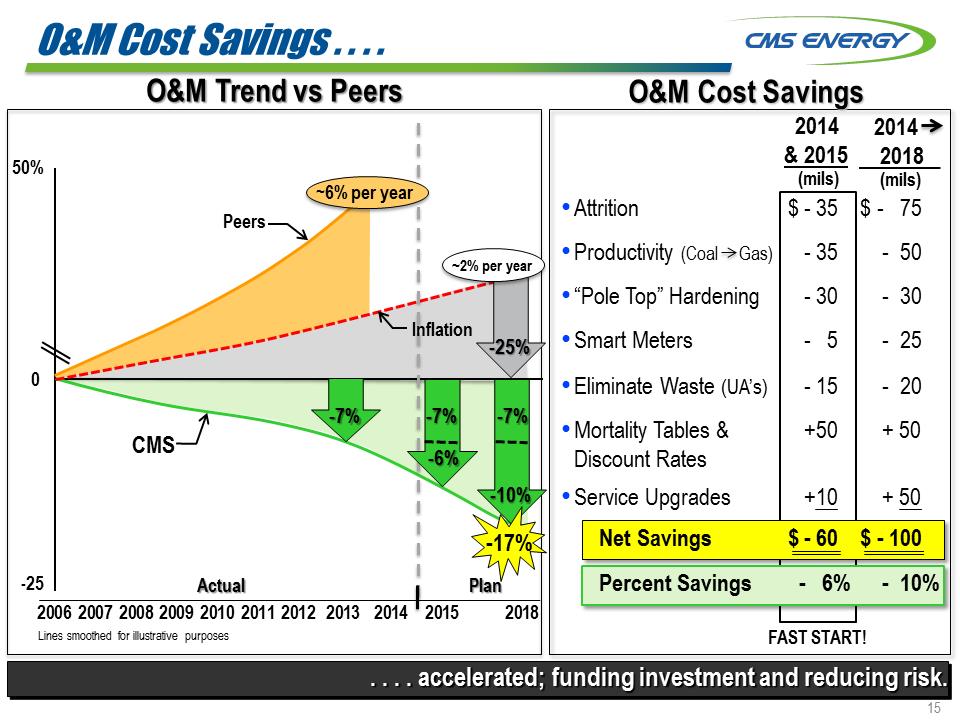 20062007200820092010201120122013. . . . accelerated; funding investment and reducing risk. 50% -25 Lines smoothed for illustrative purposes O&M Trend vs Peers 2014 Actual Plan O&M Cost Savings Peers CMS 0 -10% ~2% per year -25% -7% O&M Cost Savings . . . . 2018 ~6% per year Inflation 2015 FAST START! -17% 2013 -7% -6% -7% •Attrition $ - 35 $ - 75 •Productivity (Coal Gas) - 35 - 50 •“Pole Top” Hardening - 30 - 30 •Smart Meters - 5 - 25 •Eliminate Waste (UA’s) - 15 - 20 •Mortality Tables & Discount Rates +50 + 50 •Service Upgrades +10 + 50 Net Savings $ - 60 $ - 100 Percent Savings - 6% - 10% 2014 & 2015 2014 2018 (mils) (mils)
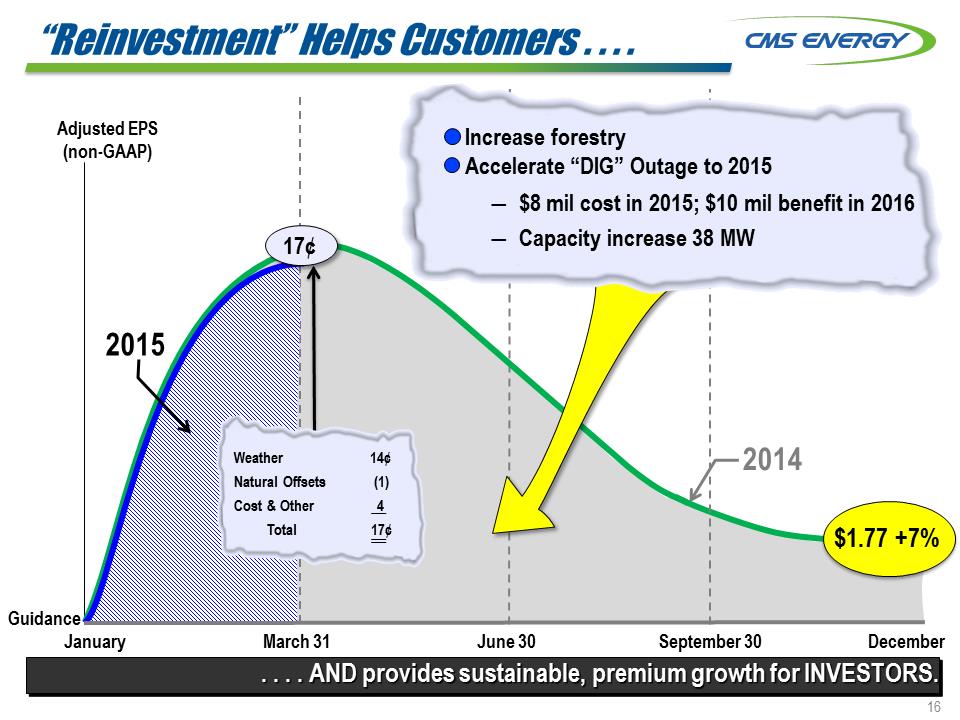 . . . . AND provides sustainable, premium growth for INVESTORS. 2014 Adjusted EPS (non-GAAP) Guidance January March 31 June 30 September 30 December $1.77 +7% 2015 “Reinvestment” Helps Customers . . . . 17¢ Weather 14¢ Natural Offsets (1) Cost & Other 4 Total 17¢ Increase forestry Accelerate “DIG” Outage to 2015 .$8 mil cost in 2015; $10 mil benefit in 2016 .Capacity increase 38 MW
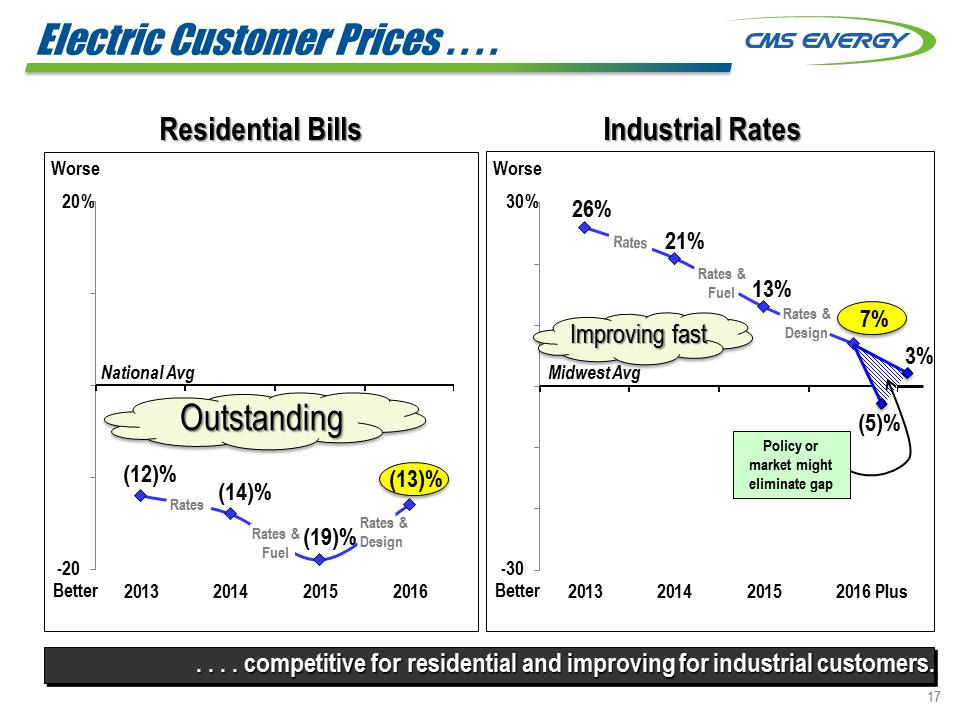 . . . . competitive for residential and improving for industrial customers. -2013201420152016Industrial Rates (12)% (14)% (19)% (13)% National Avg % Better Worse Rates Rates & Fuel Rates & Design -201320142015201626% 21% 13% Midwest Avg % 7% Better Worse BetterRates & Fuel Rates & Design 3% (5)% Policy or market might eliminate gap Plus Electric Customer Prices . . . . Outstanding Improving fast
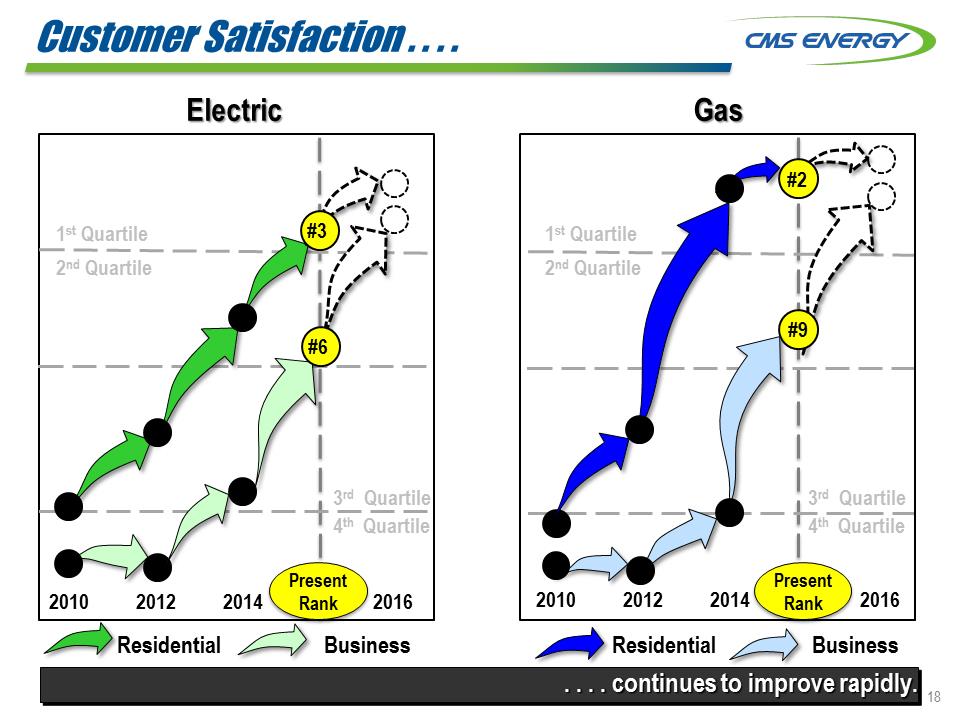 Customer Satisfaction . . . . Electric 1st Quartile 2nd Quartile 4th Quartile 2010 2012 2014 2016 Residential3rd Quartile . . . . continues to improve rapidly. Gas 1st Quartile 2nd Quartile 4th Quartile 3rd Quartile 2010 2012 2014 2016 Present Rank Present Rank Residential Business Residential Business #6 #3 #2 #9
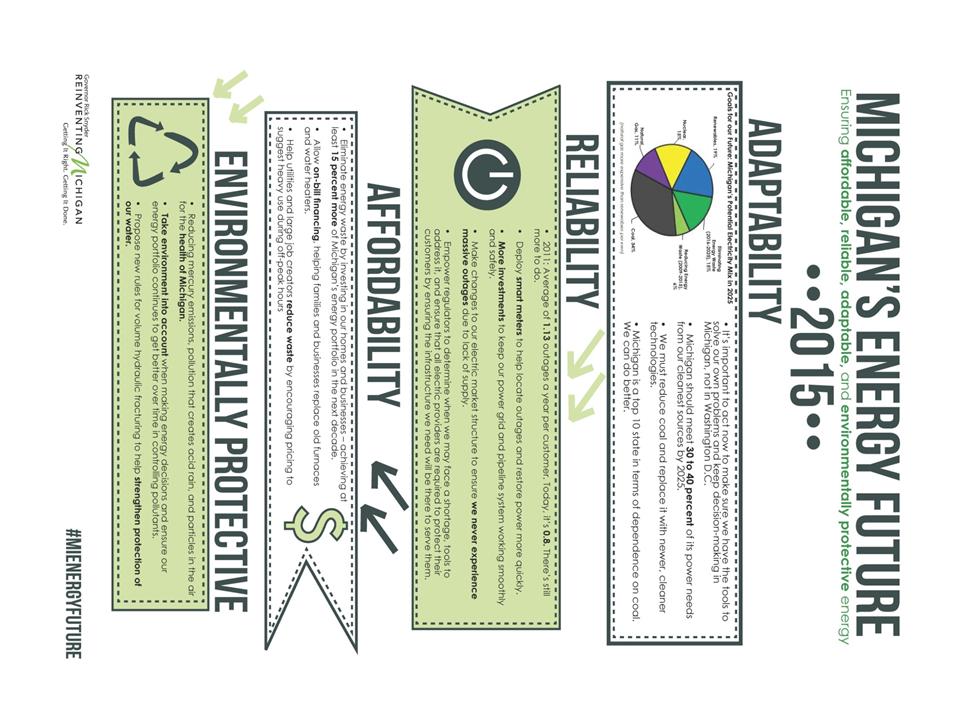
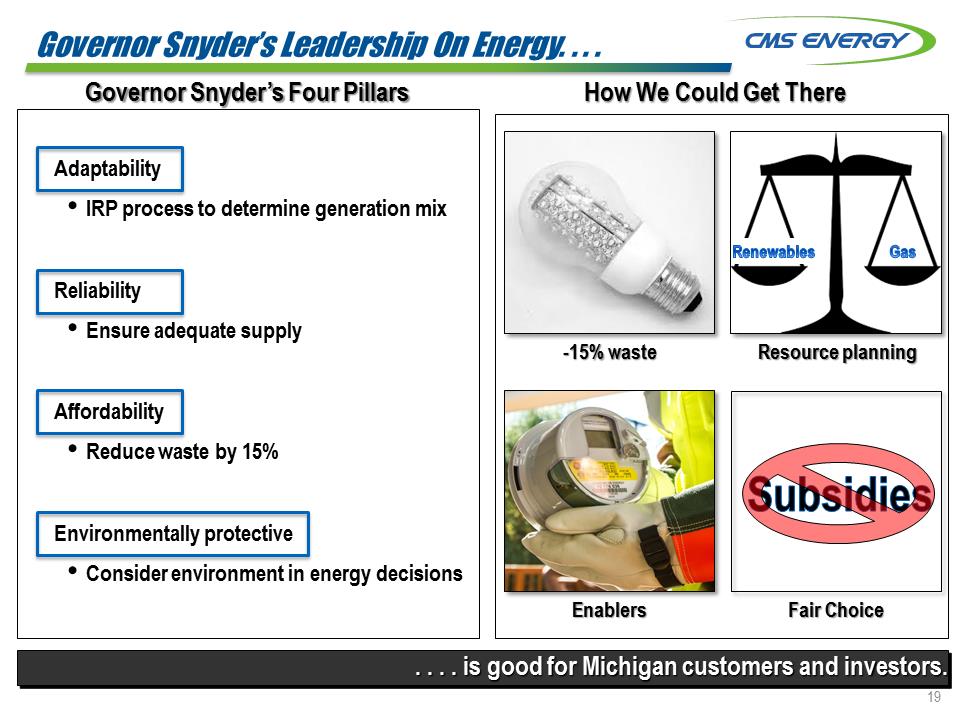 . . . is good for Michigan customers and investors. Governor Snyder’s Leadership On Energy. . . . How We Could Get There Governor Snyder’s Four Pillars GasRenewablesSubsidies-15% waste Resource planning Enablers Fair Choice Adaptability •IRP process to determine generation mix Reliability •Ensure adequate supply Affordability •Reduce waste by 15% Environmentally protective •Consider environment in energy decisions
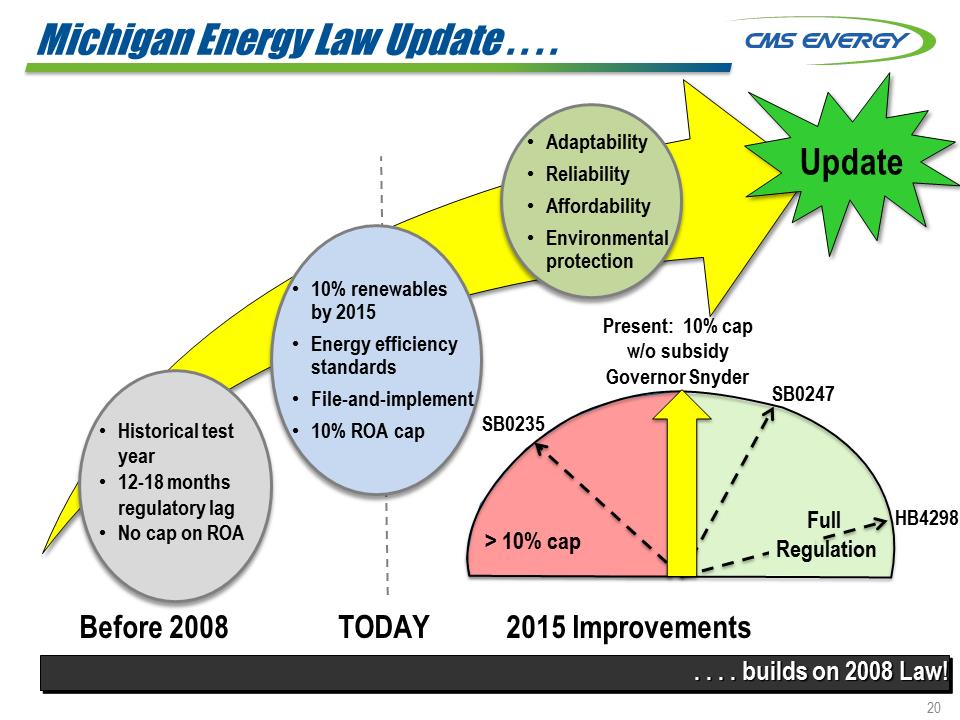 Michigan Energy Law Update . . . . •Historical test year •12-18 months regulatory lag •No cap on ROA •10% renewables by 2015 •Energy efficiency standards •File-and-implement •10% ROA cap Adaptability Reliability Affordability Environmental protection Before 2008 TODAY 2015 Improvements . . . . builds on 2008 Law! Update Present: 10% cap w/o subsidy Governor Snyder > 10% cap SB0247 HB4298 SB0235 Full Regulation
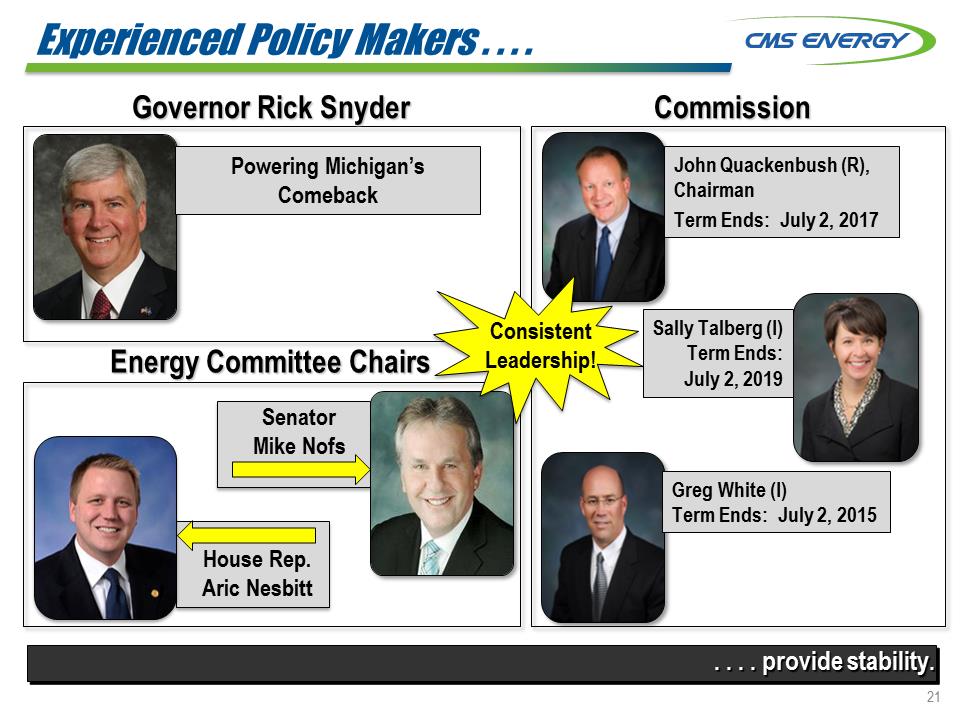 . . . . provide stability. John Quackenbush (R), Chairman Term Ends: July 2, 2017 Greg White (I) Term Ends: July 2, 2015 Sally Talberg (I) Term Ends: July 2, 2019 Commission Powering Michigan’s Comeback Governor Rick Snyder Energy Committee Chairs Senator Mike Nofs House Rep. Aric Nesbitt Consistent Leadership! Experienced Policy Makers . . . .
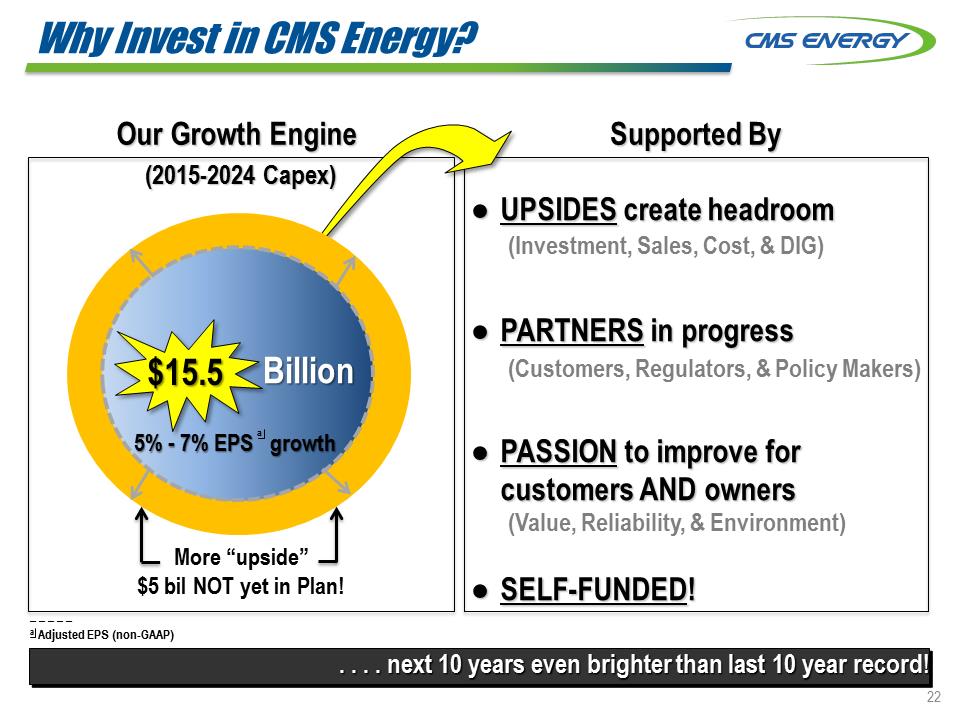 . . . next 10 years even brighter than last 10 year record! Supported By .UPSIDES create headroom .PARTNERS in progress .PASSION to improve for customers AND owners .SELF-FUNDED! Our Growth Engine Billion $15.5 More “upside” $5 bil NOT yet in Plan! (2015-2024 Capex) 5% - 7% EPS growth (Investment, Sales, Cost, & DIG) (Customers, Regulators, & Policy Makers) (Value, Reliability, & Environment) Why Invest in CMS Energy? _ _ _ _ _ a Adjusted EPS (non-GAAP)
 Appendix
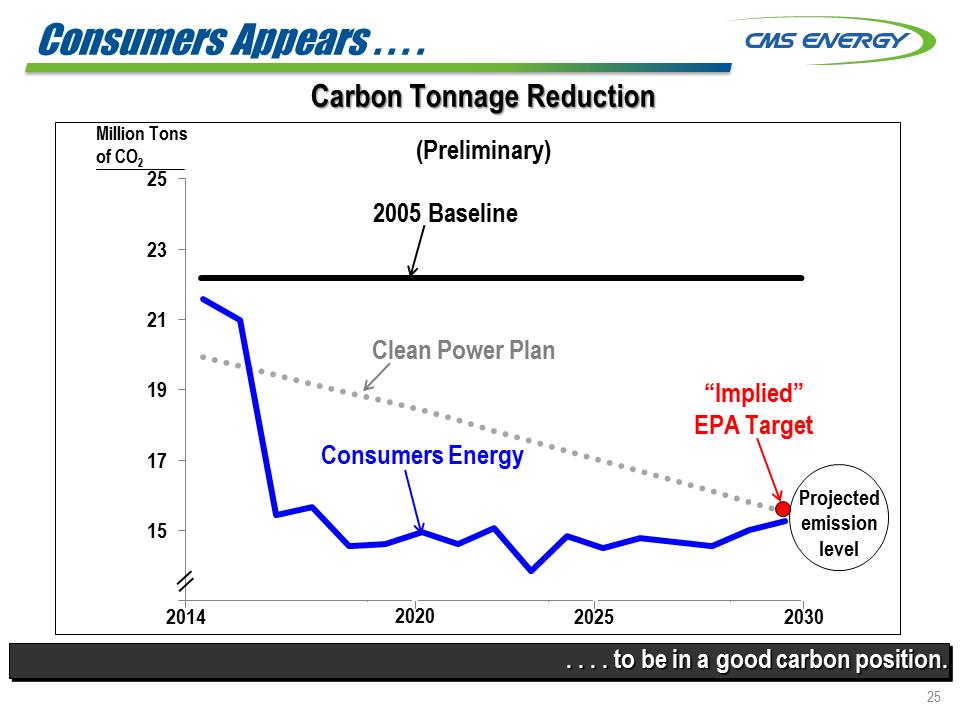 . . . to be in a good carbon position. Carbon Tonnage Reduction (Preliminary) 131517192123252005 Baseline Million Tons of CO2 Consumers Energy 2014 2030 2020 2025 2029 Clean Power Plan Projected emission level “Implied” EPA Target Consumers Appears . . . .
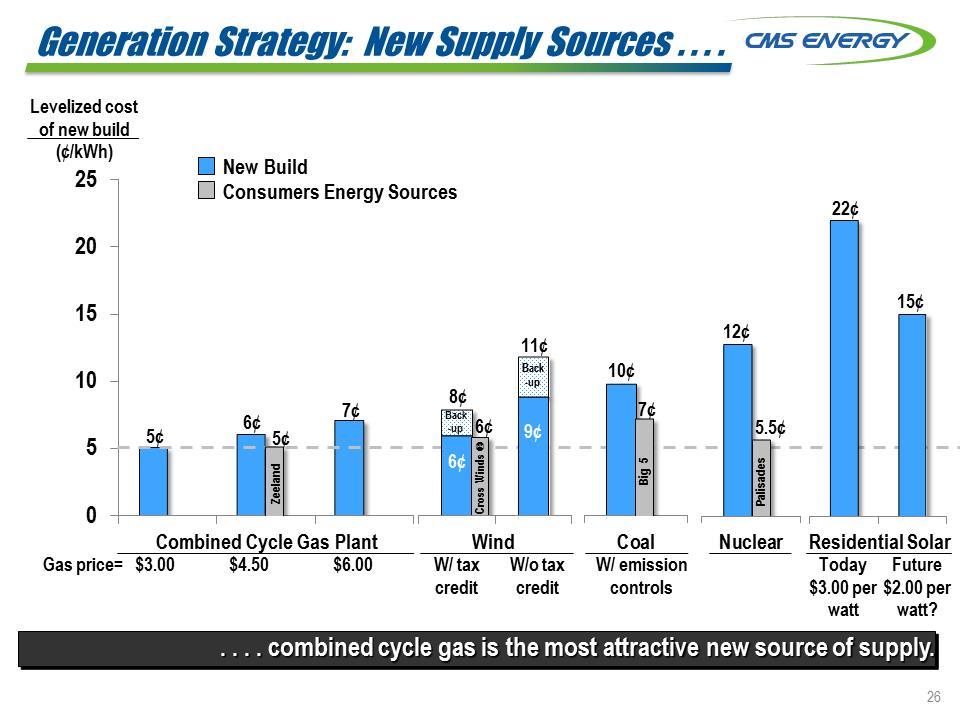 Generation Strategy: New Supply Sources . . . . 0510152025CoalNuclear. . . . combined cycle gas is the most attractive new source of supply. Levelized cost of new build (¢/kWh) Gas price= $3.00 $4.50 $6.00 W/ tax credit W/o tax credit W/ emission controls Today $3.00 per watt 5¢ 6¢ 7¢ 6¢ 9¢ 10¢ 12¢ 22¢ 8¢ Back -up 11¢ Back -up 6¢ Wind Combined Cycle Gas Plant Residential Solar 15¢ Future $2.00 per watt? Consumers Energy Sources 5¢ 7¢ 5.5¢ New Build Zeeland Cross Winds . 6¢ Big 5 Palisades
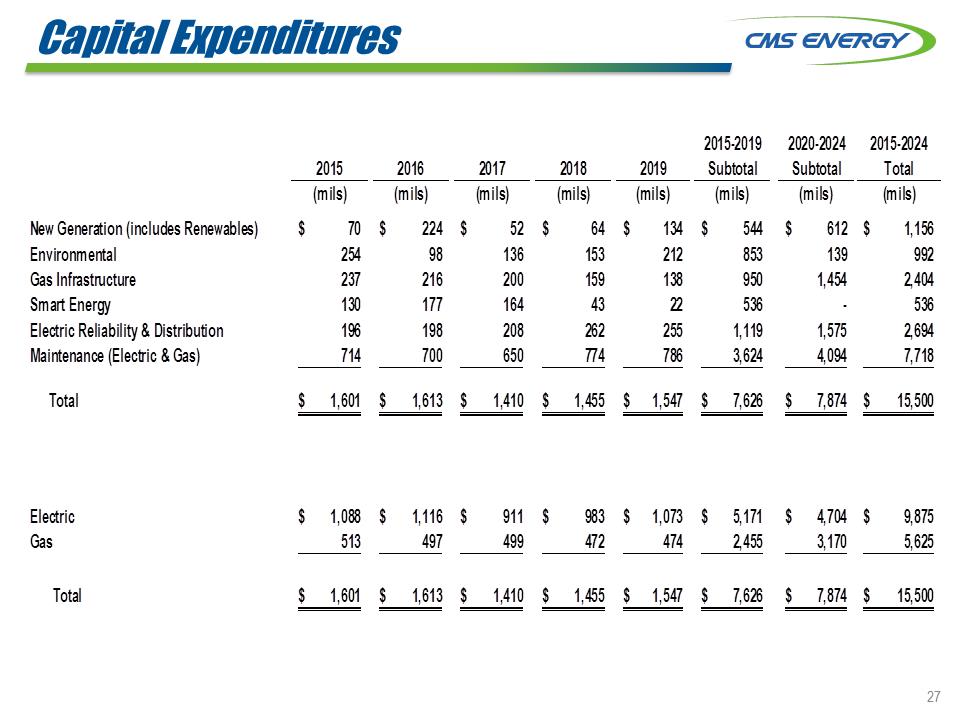 Capital Expenditures 2015-20192020-20242015-202420152016201720182019SubtotalSubtotalTotal(mils)(mils)(mils)(mils)(mils)(mils)(mils)(mils)New Generation (includes Renewables) 70$ 224$ 52$ 64$ 134$ 544$ 612$ 1,156$ Environmental254 98 136 153 212 853 139 992 Gas Infrastructure237 216 200 159 138 950 1,454 2,404 Smart Energy130 177 164 43 22 536 - 536 Electric Reliability & Distribution196 198 208 262 255 1,119 1,575 2,694 Maintenance (Electric & Gas)714 700 650 774 786 3,624 4,094 7,718 Total1,601$ 1,613$ 1,410$ 1,455$ 1,547$ 7,626$ 7,874$ 15,500$ Electric1,088$ 1,116$ 911$ 983$ 1,073$ 5,171$ 4,704$ 9,875$ Gas513 497 499 472 474 2,455 3,170 5,625 Total1,601$ 1,613$ 1,410$ 1,455$ 1,547$ 7,626$ 7,874$ 15,500
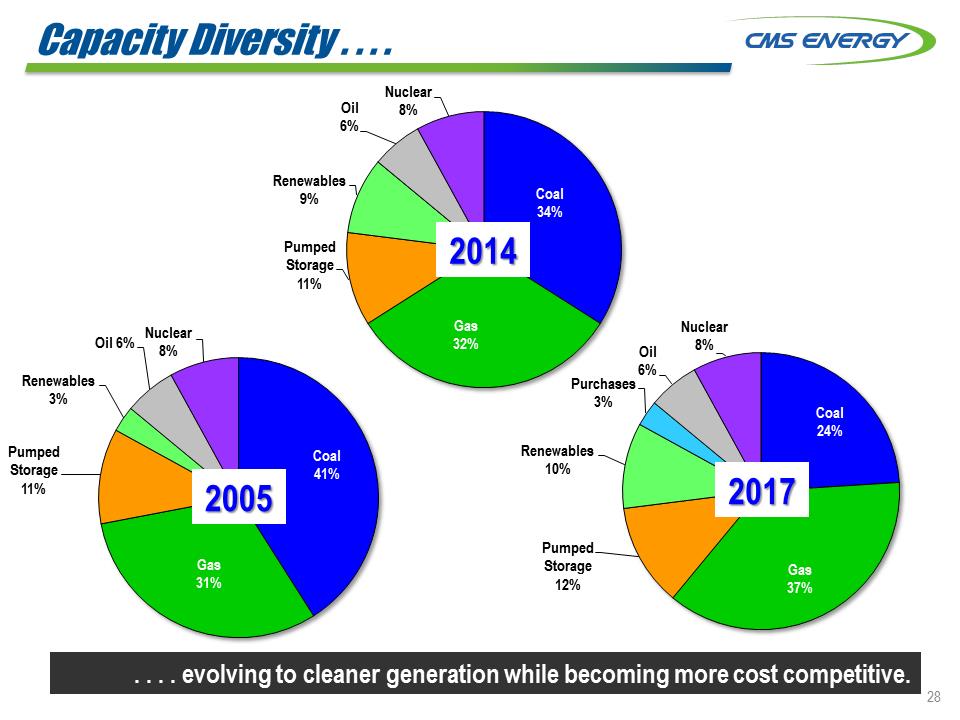 Capacity Diversity . . . . Coal 34% Gas 32% Pumped Storage 11% Renewables 9% Oil 6% Nuclear 8% Coal 24% Gas 37% Pumped Storage 12% Renewables 10% Purchases 3% Oil 6% Nuclear 8% . . . . evolving to cleaner generation while becoming more cost competitive. Coal 41% Gas 31% Pumped Storage 11% Renewables 3% Oil 6% Nuclear 8% 2005 2017 2014
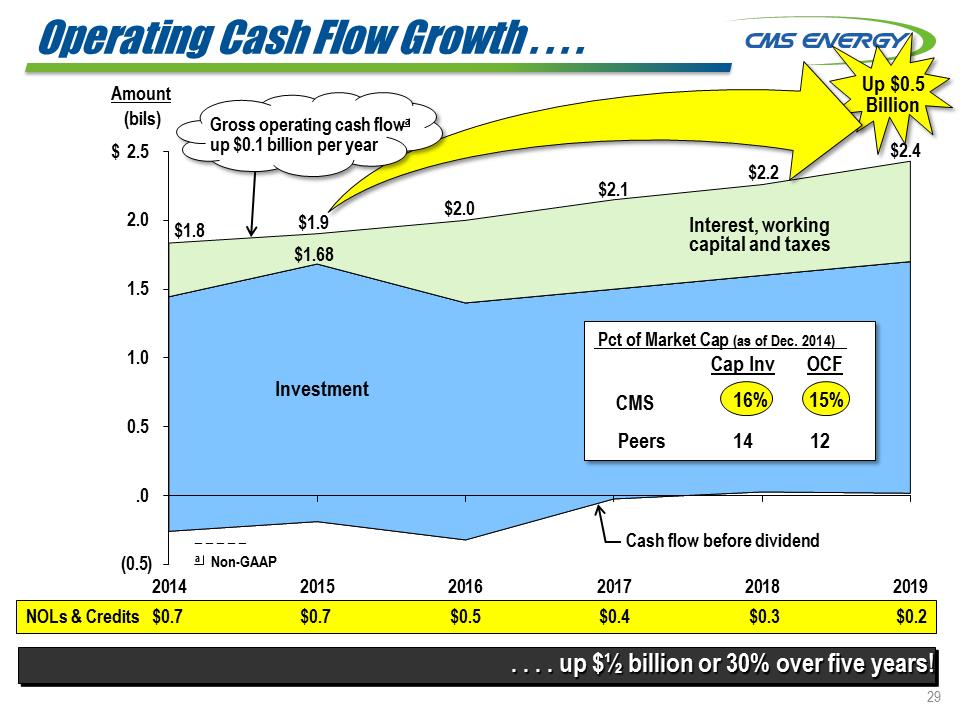 Operating Cash Flow Growth . . . . (0.5)0.00.51.01.52.02.5201420152016201720182019Amount (bils) $ Cash flow before dividend a Non-GAAP NOLs & Credits $0.7 $0.7 $0.5 $0.4 $0.3 $0.2 up $½ billion or 30% over five years! $2.2 Interest, working capital and taxes $1.8 $2.4 $1.68 Pct of Market Cap (as of Dec. 2014) Cap Inv OCF CMS Peers 14 12 16% 15% Up $0.5 Billion $2.0 $2.1 $1.9 Gross operating cash flow up $0.1 billion per year
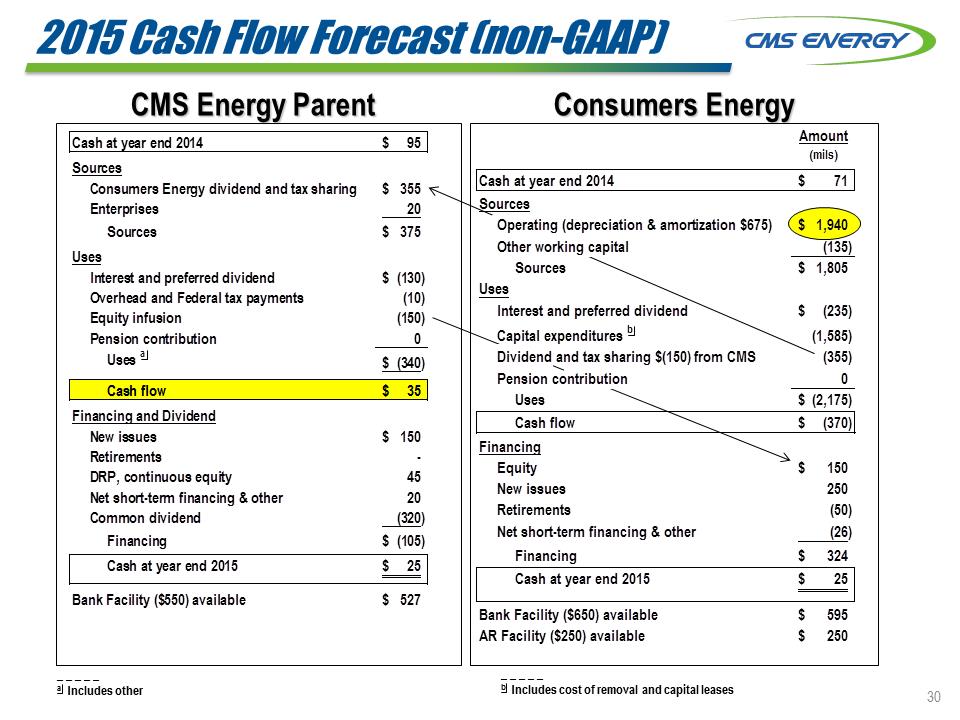 2015 Cash Flow Forecast (non-GAAP) CMS Energy Parent Cash at year end 201495$ SourcesConsumers Energy dividend and tax sharing355$ Enterprises20 Sources375$ UsesInterest and preferred dividend(130)$ Overhead and Federal tax payments(10) Equity infusion(150) Pension contribution0Uses a(340)$ Cash flow35$ Financing and DividendNew issues150$ Retirements - DRP, continuous equity45 Net short-term financing & other20 Common dividend(320) Financing(105)$ Cash at year end 201525$ Bank Facility ($550) available527$ Consumers Energy _ _ _ _ _ a Includes other _ _ _ _ _ b Includes cost of removal and capital leases Cash at year end 201471$ SourcesOperating (depreciation & amortization $675)1,940$ Other working capital(135)Sources1,805$ UsesInterest and preferred dividend(235)$ Capital expenditures b(1,585) Dividend and tax sharing $(150) from CMS(355) Pension contribution0Uses(2,175)$ Cash flow(370)$ FinancingEquity150$ New issues250 Retirements(50) Net short-term financing & other(26) Financing324$ Cash at year end 201525$ Bank Facility ($650) available595$ AR Facility ($250) available250$ Amount(mils)
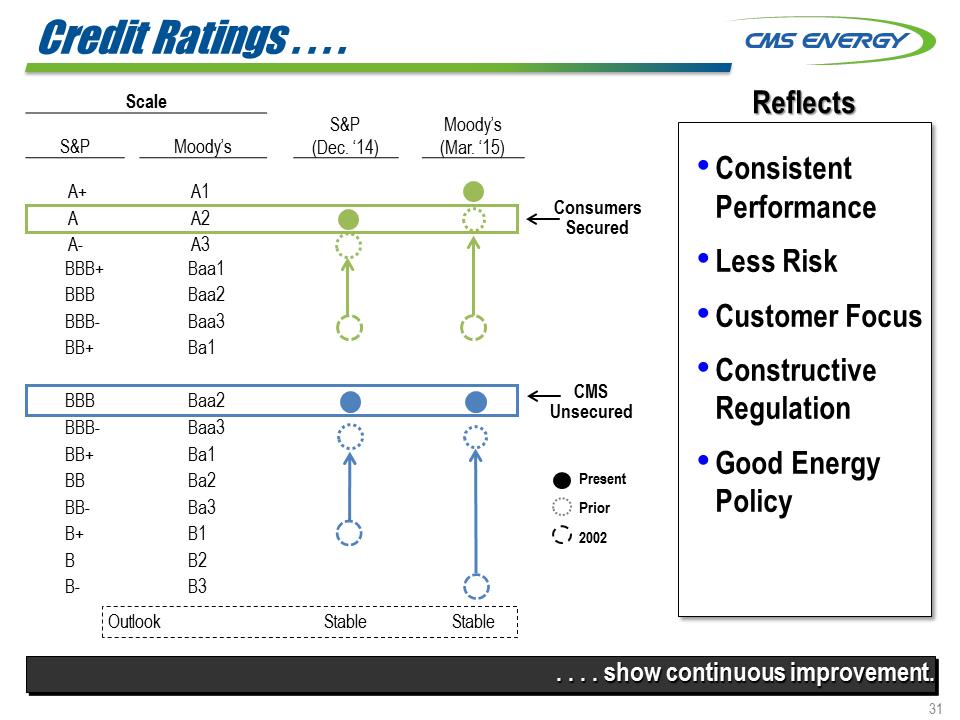 Credit Ratings . . . . . . . . show continuous improvement. •Consistent Performance •Less Risk •Customer Focus •Constructive Regulation •Good Energy Policy Reflects Present Prior 2002 Scale S&P Moody’s S&P (Dec. ‘14) Moody’s (Mar. ‘15) A+ A1 A A2 A- A3 BBB+ Baa1 BBB Baa2 BBB- Baa3 BB+ Ba1 BBB Baa2 BBB- Baa3 BB+ Ba1 BB Ba2 BB- Ba3 B+ B1 B B2 B- B3 Outlook Stable Stable Consumers Secured CMS Unsecured
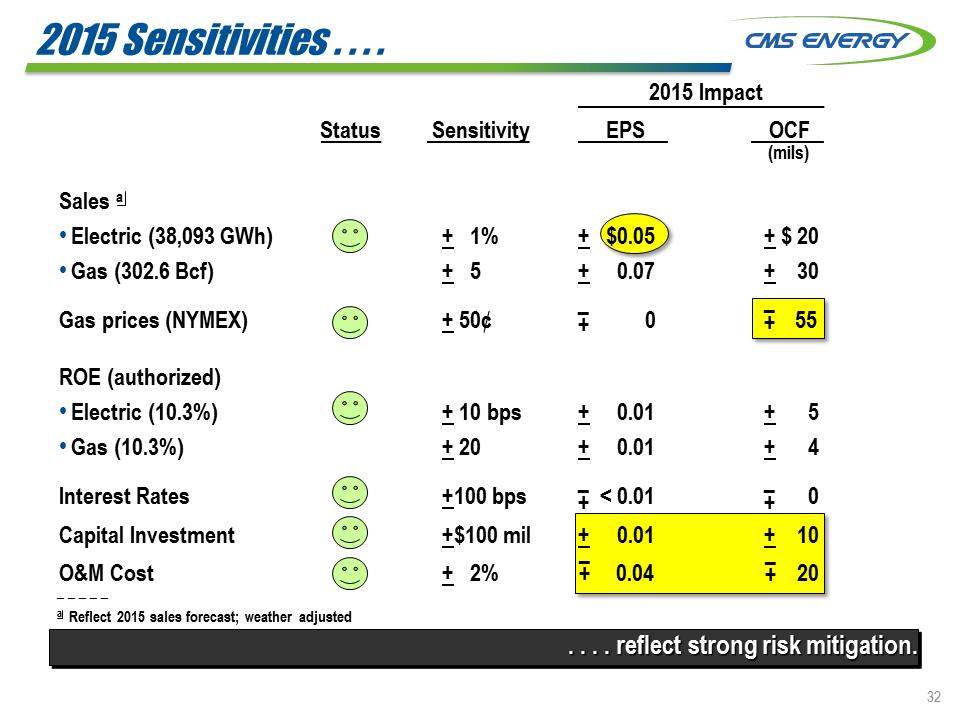 2015 Sensitivities . . . . _ _ _ _ _ a Reflect 2015 sales forecast; weather adjusted 2015 Impact Status Sensitivity EPS OCF Sales a •Electric (38,093 GWh) •Gas (302.6 Bcf) + 1% + 5 + $0.05 + 0.07 + $ 20 + 30 Gas prices (NYMEX) + 50¢ 0 55 ROE (authorized) •Electric (10.3%) •Gas (10.3%) + 10 bps + 20 + 0.01 + 0.01 + 5 + 4 Interest Rates Capital Investment O&M Cost +100 bps +$100 mil + 2% < 0.01 + 0.01 0.04 0 + 10 20 – + . . . . reflect strong risk mitigation. – + – + – + (mils) – +
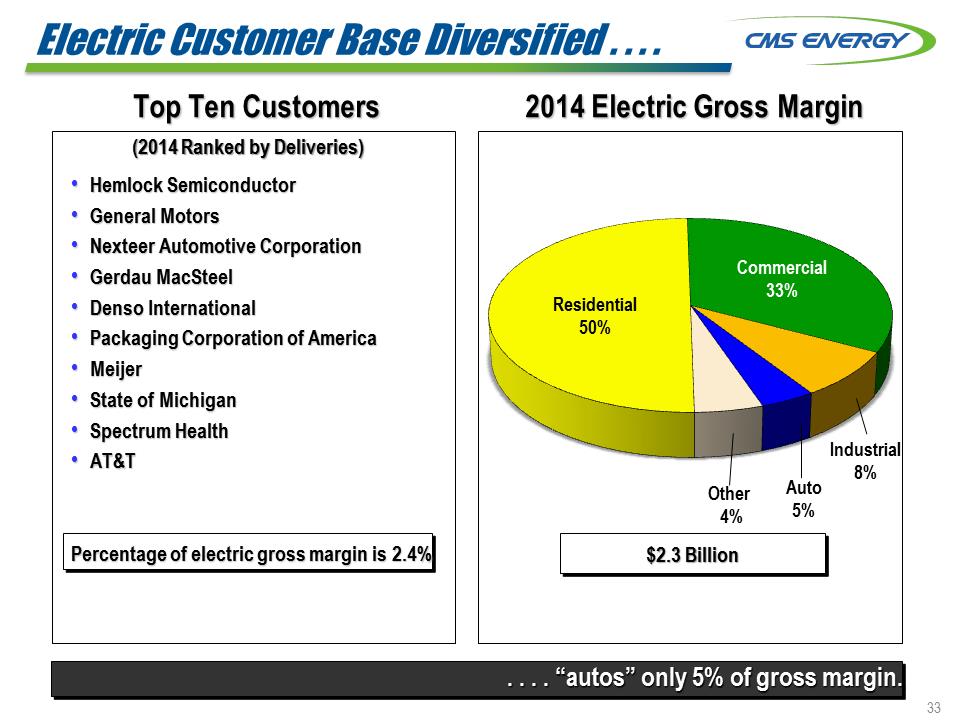 . . . . “autos” only 5% of gross margin. •Hemlock Semiconductor •General Motors •Nexteer Automotive Corporation •Gerdau MacSteel •Denso International •Packaging Corporation of America •Meijer •State of Michigan •Spectrum Health •AT&T Percentage of electric gross margin is 2.4% Top Ten Customers $2.3 Billion 2014 Electric Gross Margin Other 4% Industrial 8% Commercial 33% Residential 50% (2014 Ranked by Deliveries) Auto 5% Electric Customer Base Diversified . . . .
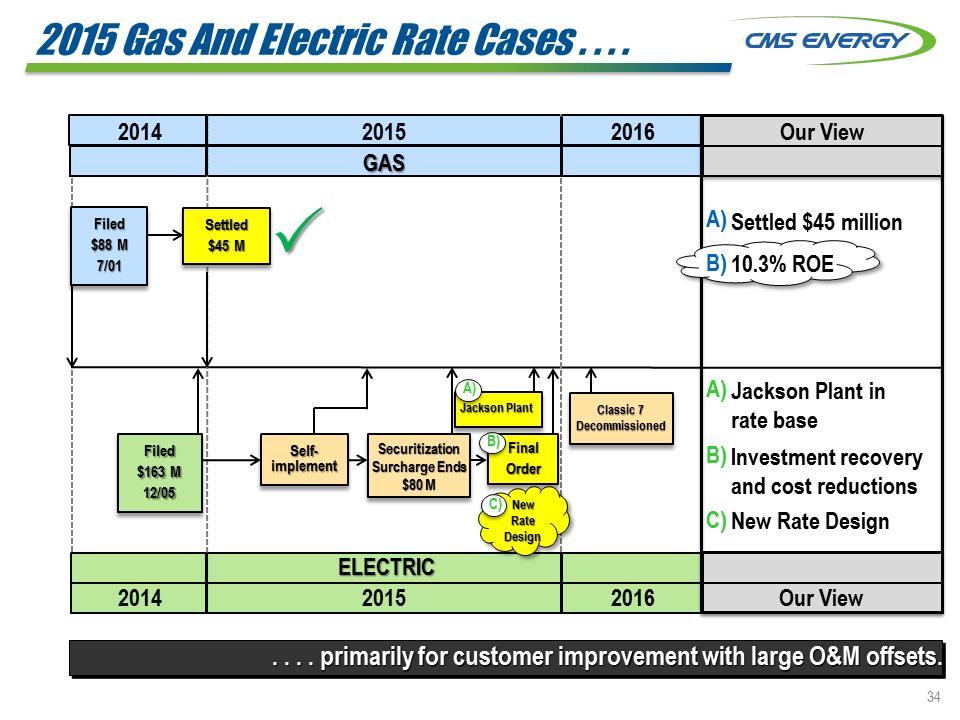 2016 2015 2014 Filed $88 M 7/01 . . . . primarily for customer improvement with large O&M offsets. ELECTRIC GAS Our View Our View Filed $163 M 12/05 Securitization Surcharge Ends $80 M 2016 2015 2014 Jackson Plant in rate base Investment recovery and cost reductions New Rate Design A) B) C) Settled $45 M Final Order New Rate Design Jackson Plant Classic 7 Decommissioned Self-implement B) C) A) Settled $45 million 10.3% ROE A) B) . 2015 Gas And Electric Rate Cases . . . .
 GAAP Reconciliation
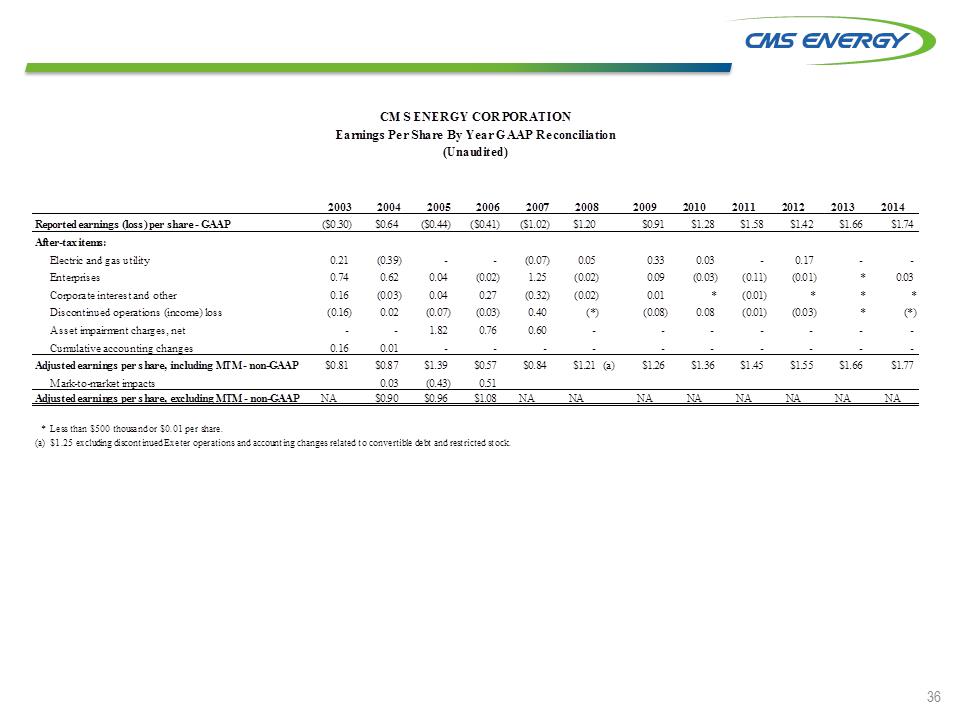 200320042005200620072008200920102011201220132014Reported earnings (loss) per share - GAAP($0.30)$0.64($0.44)($0.41)($1.02)$1.20$0.91$1.28$1.58$1.42$1.66$1.74After-tax items:Electric and gas utility0.21(0.39)- - (0.07)0.050.330.03- 0.17- - Enterprises0.740.620.04(0.02)1.25(0.02)0.09(0.03)(0.11)(0.01)*0.03Corporate interest and other0.16(0.03)0.040.27(0.32)(0.02)0.01*(0.01)***Discontinued operations (income) loss(0.16)0.02(0.07)(0.03)0.40(*)(0.08)0.08(0.01)(0.03)*(*)Asset impairment charges, net- - 1.820.760.60- - - - - - - Cumulative accounting changes0.160.01- - - - - - - - - - Adjusted earnings per share, including MTM - non-GAAP$0.81$0.87$1.39$0.57$0.84$1.21(a)$1.26$1.36$1.45$1.55$1.66$1.77Mark-to-market impacts0.03(0.43)0.51Adjusted earnings per share, excluding MTM - non-GAAPNA$0.90$0.96$1.08NANANANANANANANA*Less than $500 thousand or $0.01 per share.(a) $1.25 excluding discontinued Exeter operations and accounting changes related to convertible debt and restricted stock.CMS ENERGY CORPORATIONEarnings Per Share By Year GAAP Reconciliation(Unaudited)
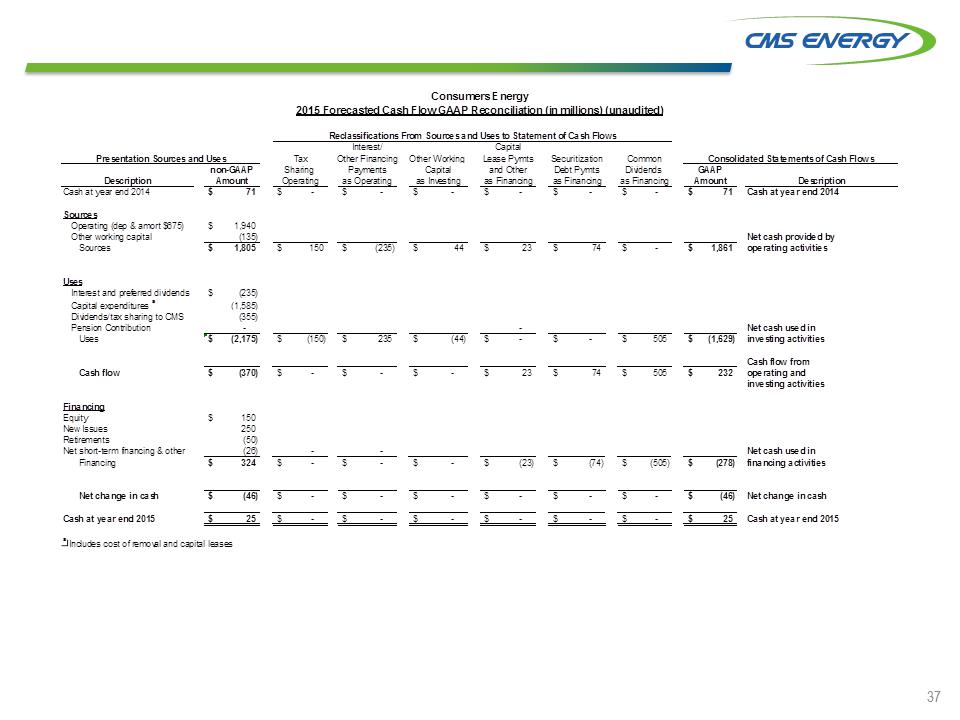 Interest/CapitalTaxOther FinancingOther Working Lease PymtsSecuritizationCommonnon-GAAPSharing PaymentsCapitaland OtherDebt PymtsDividends GAAPAmountOperatingas Operatingas Investingas Financingas Financingas FinancingAmountDescriptionCash at year end 201471$ -$ -$ -$ -$ -$ -$ 71$ Cash at year end 2014SourcesOperating (dep & amort $675)1,940$ Other working capital(135) Net cash provided bySources1,805$ 150$ (235)$ 44$ 23$ 74$ -$ 1,861$ operating activitiesUsesInterest and preferred dividends(235)$ Capital expenditures a(1,585) Dividends/tax sharing to CMS(355) Pension Contribution- - Net cash used inUses(2,175)$ (150)$ 235$ (44)$ -$ -$ 505$ (1,629)$ investing activitiesCash flow fromCash flow(370)$ -$ -$ -$ 23$ 74$ 505$ 232$ operating andinvesting activitiesFinancingEquity150$ New Issues250 Retirements(50) Net short-term financing & other(26) - - Net cash used inFinancing324$ -$ -$ -$ (23)$ (74)$ (505)$ (278)$ financing activitiesNet change in cash(46)$ -$ -$ -$ -$ -$ -$ (46)$ Net change in cashCash at year end 201525$ -$ -$ -$ -$ -$ -$ 25$ Cash at year end 2015a Includes cost of removal and capital leasesDescriptionConsumers Energy2015 Forecasted Cash Flow GAAP Reconciliation (in millions) (unaudited)Reclassifications From Sources and Uses to Statement of Cash FlowsPresentation Sources and UsesConsolidated Statements of Cash Flows
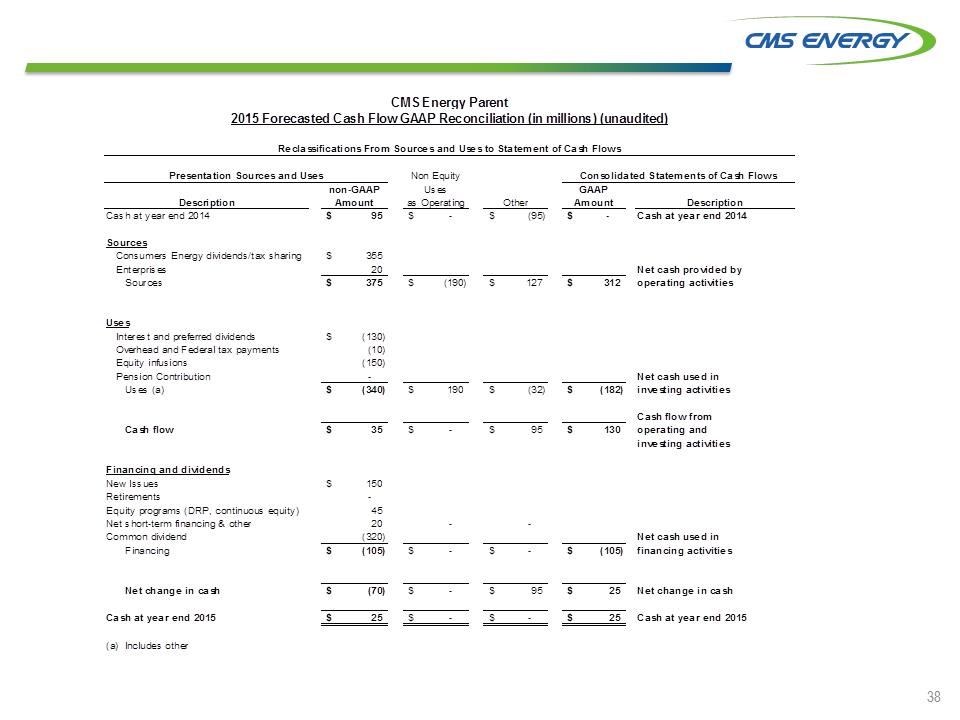 Non Equitynon-GAAPUsesGAAPAmountas OperatingOtherAmountDescriptionCash at year end 201495$ -$ (95)$ -$ Cash at year end 2014SourcesConsumers Energy dividends/tax sharing355$ Enterprises20 Net cash provided bySources375$ (190)$ 127$ 312$ operating activitiesUsesInterest and preferred dividends(130)$ Overhead and Federal tax payments(10) Equity infusions(150) Pension Contribution- Net cash used inUses (a)(340)$ 190$ (32)$ (182)$ investing activitiesCash flow fromCash flow35$ -$ 95$ 130$ operating andinvesting activitiesFinancing and dividendsNew Issues150$ Retirements- Equity programs (DRP, continuous equity)45 Net short-term financing & other20 - - Common dividend(320) Net cash used inFinancing(105)$ -$ -$ (105)$ financing activitiesNet change in cash(70)$ -$ 95$ 25$ Net change in cashCash at year end 201525$ -$ -$ 25$ Cash at year end 2015(a) Includes other DescriptionCMS Energy Parent2015 Forecasted Cash Flow GAAP Reconciliation (in millions) (unaudited)Reclassifications From Sources and Uses to Statement of Cash FlowsPresentation Sources and UsesConsolidated Statements of Cash Flows
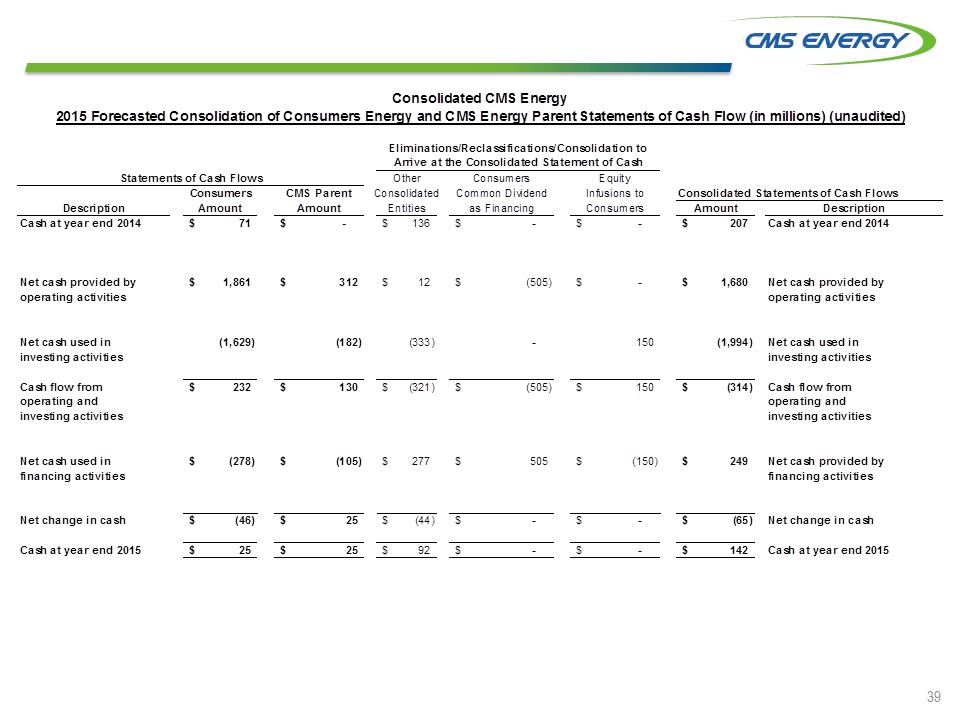 OtherConsumersEquityConsumersCMS ParentConsolidatedCommon DividendInfusions toConsolidated Statements of Cash FlowsDescriptionAmountAmountEntitiesas FinancingConsumersAmountDescriptionCash at year end 201471$ -$ 136$ -$ -$ 207$ Cash at year end 2014Net cash provided by1,861$ 312$ 12$ (505)$ -$ 1,680$ Net cash provided byoperating activitiesoperating activitiesNet cash used in(1,629) (182) (333) - 150 (1,994) Net cash used ininvesting activitiesinvesting activitiesCash flow from232$ 130$ (321)$ (505)$ 150$ (314)$ Cash flow fromoperating andoperating andinvesting activitiesinvesting activitiesNet cash used in(278)$ (105)$ 277$ 505$ (150)$ 249$ Net cash provided byfinancing activitiesfinancing activitiesNet change in cash(46)$ 25$ (44)$ -$ -$ (65)$ Net change in cashCash at year end 201525$ 25$ 92$ -$ -$ 142$ Cash at year end 2015Consolidated CMS Energy2015 Forecasted Consolidation of Consumers Energy and CMS Energy Parent Statements of Cash Flow (in millions) (unaudited)Eliminations/Reclassifications/Consolidation to Arrive at the Consolidated Statement of Cash Statements of Cash Flows
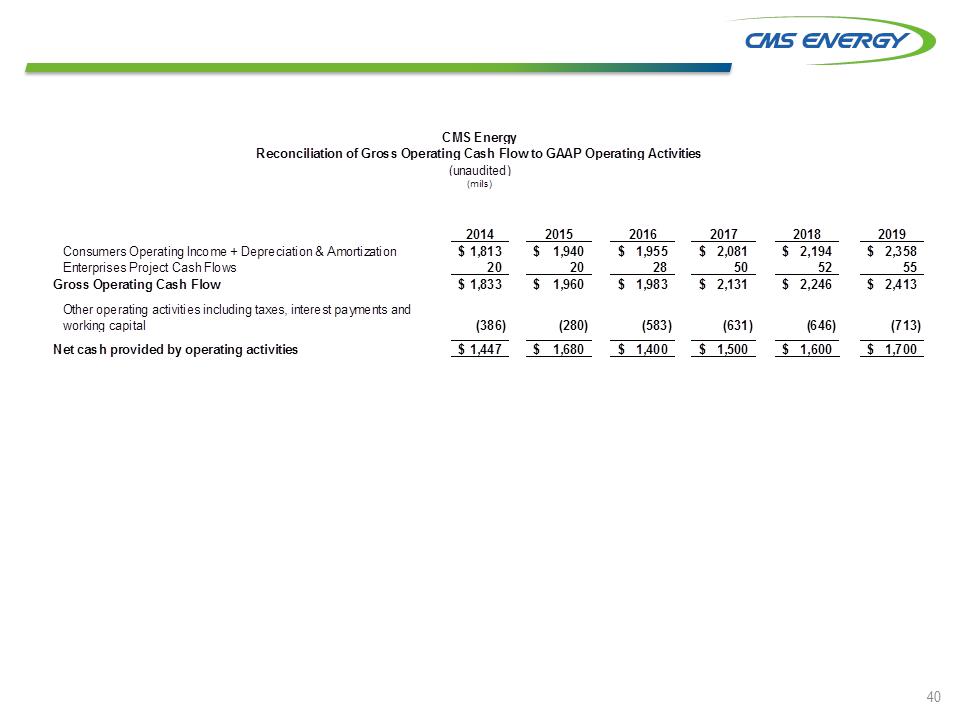 201420152016201720182019Consumers Operating Income + Depreciation & Amortization1,813$ 1,940$ 1,955$ 2,081$ 2,194$ 2,358$ Enterprises Project Cash Flows20 20 28 50 52 55 Gross Operating Cash Flow1,833$ 1,960$ 1,983$ 2,131$ 2,246$ 2,413$ (386) (280) (583) (631) (646) (713) Net cash provided by operating activities1,447$ 1,680$ 1,400$ 1,500$ 1,600$ 1,700$ CMS EnergyReconciliation of Gross Operating Cash Flow to GAAP Operating Activities(unaudited)(mils)Other operating activities including taxes, interest payments and working capital
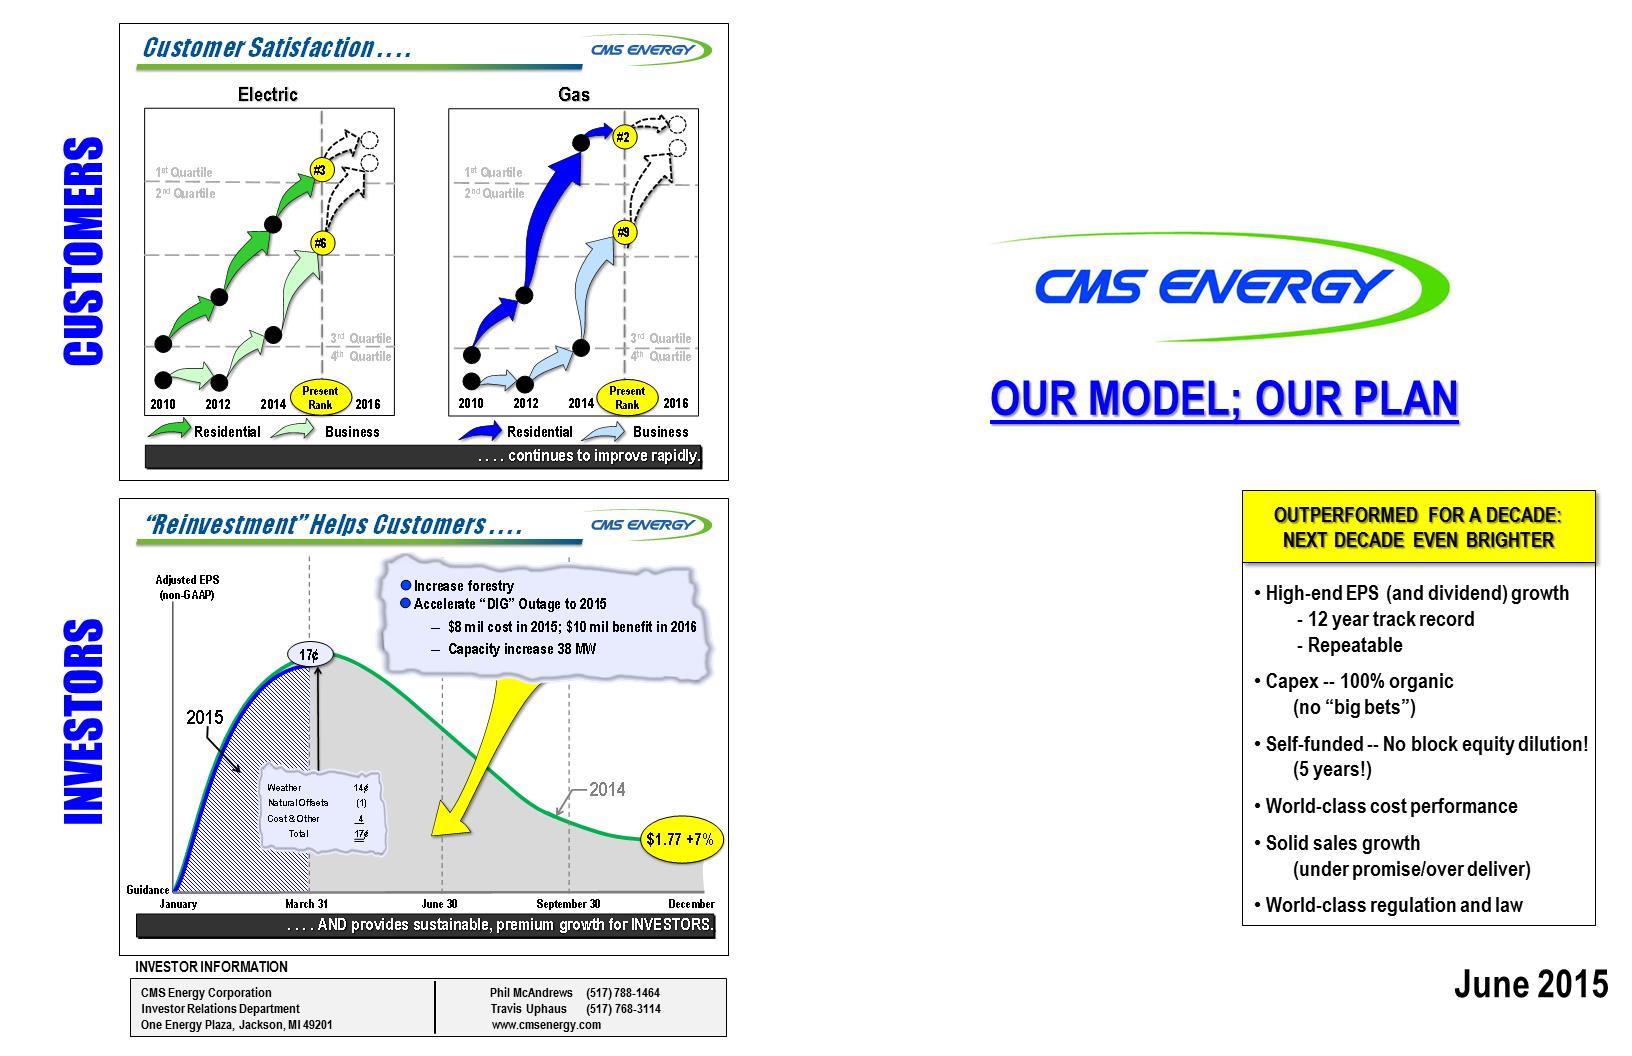 June 2015 OUR MODEL; OUR PLAN INVESTOR INFORMATION CMS Energy Corporation Phil McAndrews 517 7881464 Investor Relations Department Travis Uphaus 517 7683114 One Energy Plaza, Jackson, MI 49201 www.cmsenergy.com CUSTOMERS INVESTORS 12. . . . AND provides sustainable, premium growth for INVESTORS.2014Adjusted EPS(non-GAAP)GuidanceJanuaryMarch 31 June 30 September 30 December$1.77 +7%2015“Reinvestment” Helps Customers . . . . 17¢Weather 14¢Natural Offsets (1)Cost & Other 4Total 17¢Increase forestryAccelerate “DIG” Outage to 2015.$8 mil cost in 2015; $10 mil benefit in 2016.Capacity increase 38 MWCustomer Satisfaction . . . . Electric1stQuartile2ndQuartile4thQuartile2010 2012 2014 20163rdQuartile. . . . continues to improve rapidly. Gas1stQuartile2ndQuartile4thQuartile3rdQuartile2010 2012 2014 2016PresentRankPresentRankResidentialBusinessResidentialBusiness#6#3#214#9 •High-end EPS (and dividend) growth - 12 year track record - Repeatable •Capex -- 100% organic (no “big bets”) •Self-funded -- No block equity dilution! (5 years!) •World-class cost performance •Solid sales growth (under promise/over deliver) •World-class regulation and law OUTPERFORMED FOR A DECADE: NEXT DECADE EVEN BRIGHTER
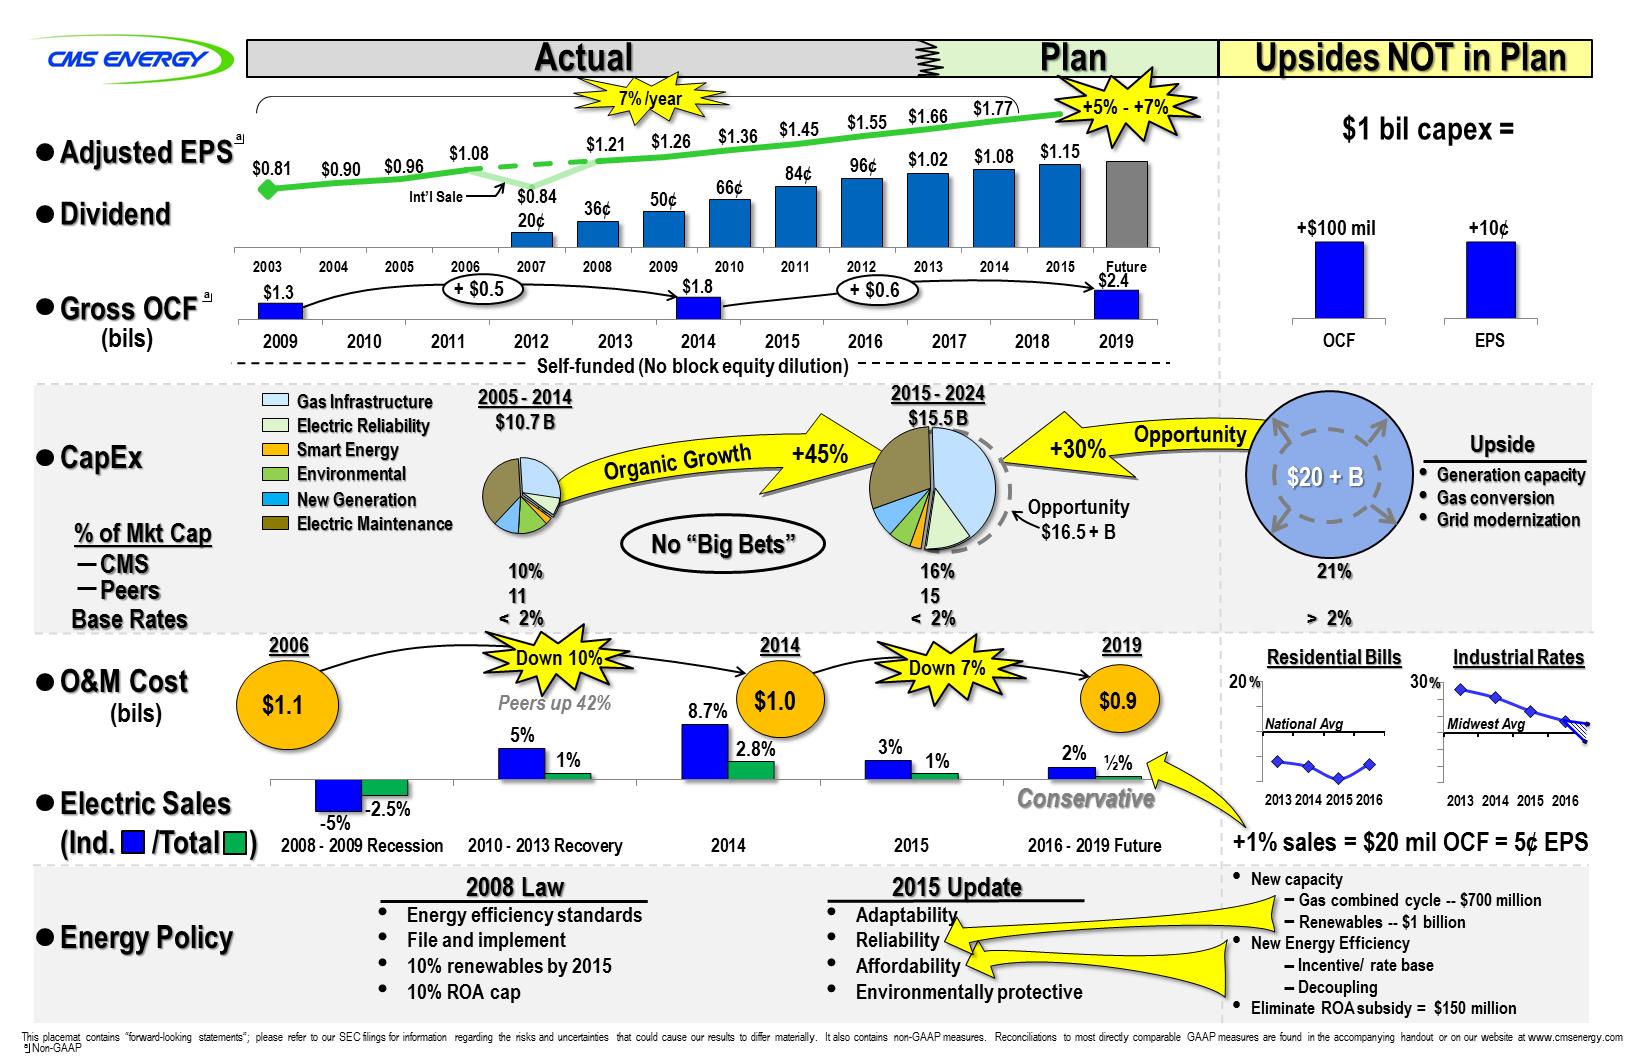 Adjusted EPS Gross OCF Dividend CapEx CMS O&M Cost Electric Sales (Ind. /Total ) Energy Policy 10% 11 16% 15 21% •Energy efficiency standards •File and implement •10% renewables by 2015 •10% ROA cap •Adaptability •Reliability •Affordability •Environmentally protective 2015 Update 2008 Law 200920102011201220132014201520162017201820192008 - 2009 Recession2010 - 2013 Recovery201420152016 - 2019 FutureOCF+$100 mil $1 bil capex = +1% sales = $20 mil OCF = 5¢ EPS Self-funded (No block equity dilution) 20¢ 36¢ 50¢ 66¢ 84¢ 96¢ $1.02 $1.08 $1.15 $0.81 $0.90 $0.96 $1.08 $0.84 $1.21 $1.26 $1.36 $1.45 $1.55 $1.66 2003200420052006200720082009201020112012201320142015Future+ $0.6 $1.8 $2.4 Base Rates < 2% 2005 - 2014 $10.7 B 2015 - 2024 $15.5 B Opportunity $16.5 + B +30% +45% Down 10% Down 7% -5% -2.5% 5% 1% 3% 1% 2% ½% $1.1 $0.9 $1.3 > 2% < 2% $1.77 Conservative Opportunity •Generation capacity •Gas conversion •Grid modernization No “Big Bets” Gas Infrastructure Electric Reliability Smart Energy Environmental New Generation Electric Maintenance 2006 2014 2019 -20-10010202013201420152016-30-20-1001020302013201420152016Residential Bills Industrial Rates National Avg Midwest Avg EPS+10¢ (bils) (bils) % of Mkt Cap % % Peers •New capacity •Gas combined cycle -- $700 million •Renewables -- $1 billion •New Energy Efficiency •Incentive/ rate base •Decoupling •Eliminate ROA subsidy = $150 million $20 + B Upside Peers up 42% Actual Plan Upsides NOT in Plan +5% - +7% Int’l Sale $1.0 2.8% 8.7% 7% /year + $0.5 This placemat contains “forward-looking statements”; please refer to our SEC filings for information regarding the risks and uncertainties that could cause our results to differ materially. It also contains non-GAAP measures. Reconciliations to most directly comparable GAAP measures are found in the accompanying handout or on our website at www.cmsenergy.com a a a Non-GAAP