Attached files
| file | filename |
|---|---|
| EXCEL - IDEA: XBRL DOCUMENT - UQM TECHNOLOGIES INC | Financial_Report.xls |
| EX-31.2 - EX-31.2 - UQM TECHNOLOGIES INC | uqm-20150331xex312.htm |
| EX-32 - EX-32 - UQM TECHNOLOGIES INC | uqm-20150331xex32.htm |
| EX-23 - EX-23 - UQM TECHNOLOGIES INC | uqm-20150331xex23.htm |
| EX-21.1 - EX-21.1 - UQM TECHNOLOGIES INC | uqm-20150331xex211.htm |
| EX-31.1 - EX-31.1 - UQM TECHNOLOGIES INC | uqm-20150331xex311.htm |
|
UNITED STATES SECURITIES AND EXCHANGE COMMISSION |
||||||||||||||
|
WASHINGTON, D.C. 20549 |
||||||||||||||
|
_____________________ |
||||||||||||||
|
FORM 10-K |
||||||||||||||
|
_____________________ |
||||||||||||||
|
[X] |
ANNUAL REPORT PURSUANT TO SECTION 13 OR 15(d) OF THE SECURITIES EXCHANGE ACT OF 1934 |
|||||||||||||
|
|
For the fiscal year ended March 31, 2015 |
|||||||||||||
|
OR |
||||||||||||||
|
[ ] |
TRANSITION REPORT PURSUANT TO SECTION 13 OR 15(d) OF THE SECURITIES EXCHANGE ACT OF 1934 |
|||||||||||||
|
|
For the transition period from to |
|||||||||||||
|
Commission file number 1-10869 |
||||||||||||||
|
|
||||||||||||||
|
UQM TECHNOLOGIES, INC. |
||||||||||||||
|
(Exact name of registrant as specified in its charter) |
||||||||||||||
|
______________________ |
||||||||||||||
|
|
Colorado |
|
84-0579156 |
|
||||||||||
|
|
(State or other jurisdiction |
|
(I.R.S. Employer |
|
||||||||||
|
|
of incorporation or organization) |
|
Identification No.) |
|
||||||||||
|
|
4120 Specialty Place, Longmont, Colorado |
|
80504 |
|
||||||||||
|
|
(Address of principal executive offices) |
|
(Zip Code) |
|
||||||||||
|
Registrant’s telephone number, including area code: (303) 682-4900 |
||||||||||||||
|
SECURITIES REGISTERED PURSUANT TO SECTION 12(b) OF THE ACT: |
||||||||||||||
|
|
|
|
|
|
||||||||||
|
|
|
|
Name of each exchange on which registered |
|
||||||||||
|
|
Title of each class |
|
NYSE MKT |
|
||||||||||
|
|
Common Stock |
|
Chicago Stock Exchange |
|
||||||||||
|
|
|
|
|
|
|
|||||||||
|
|
|
|
|
|
||||||||||
|
SECURITIES REGISTERED PURSUANT TO SECTION 12(g) OF THE ACT: |
||||||||||||||
|
None. |
||||||||||||||
|
Indicate by check mark if the registrant is a well-known seasoned issuer, as defined in Rule 405 of the Securities Act. |
Yes [ ] No [X] |
|||||||||||||
|
Indicate by check mark if the registrant is not required to file reports pursuant to Section 13 or 15(d) of the Act. |
Yes [ ] No [X] |
|||||||||||||
|
Indicate by check mark whether the registrant: (1) has filed all reports required to be filed by Section 13 or 15(d) of the Securities Exchange Act of 1934 during the preceding 12 months (or for such shorter period that the registrant was required to file such reports), |
||||||||||||||
|
and (2) has been subject to such filing requirements for the past 90 days. |
Yes [X] No [ ] |
|||||||||||||
|
Indicate by check mark whether the registrant has submitted electronically and posted on its corporate website, if any, every interactive data file required to be submitted and posted pursuant to Rule 405 of Regulation S-T during the preceding 12 months (or for such |
||||||||||||||
|
shorter period that the registrant was required to submit and post such files). |
Yes [X] No [ ] |
|||||||||||||
|
|
||||||||||||||
|
Indicate by check mark if disclosure of delinquent filers pursuant to Item 405 of Regulation S-K is not contained herein, and will not be contained, to the best of registrant’s knowledge, in definitive proxy or information statements incorporated by reference in Part III of this Form 10-K or any amendment to this Form 10-K. [ ] |
||||||||||||||
|
|
||||||||||||||
|
Indicate by check mark whether the registrant is a large accelerated filer, an accelerated filer, a non-accelerated filer, or a smaller reporting company. See the definitions of “large accelerated filer,” “accelerated filer” and “smaller reporting company” in Rule 12b-2 of the Exchange Act. (Check one): |
||||||||||||||
|
[ ] Large accelerated filer |
[ ] Accelerated filer |
[X] Non-accelerated filer |
[ ] Smaller reporting company |
|||||||||||
|
Indicate by check mark whether the registrant is a shell company (as defined in Rule 12b-2 of the Exchange Act). (Do not check if a smaller reporting company) |
Yes [ ] No [X] |
|||||||||||||
|
The aggregate market value of the registrant’s common stock (“Common Stock”) held by non-affiliates as of September 30, 2014, based on the closing price of the Common Stock as reported by the NYSE MKT on such date was approximately $55,478,927. As of May 26, 2015, there were 40,501,993 shares of the registrant’s Common Stock outstanding. |
||||||||||||||
|
DOCUMENTS INCORPORATED BY REFERENCE |
||||||||||||||
|
Document |
|
Parts Into Which Incorporated |
||||||||||||
|
Portions of the Proxy Statement for the 2015 Annual Meeting of Shareholders. |
|
Part III |
||||||||||||
i
This page intentionally left blank
ii
This Report contains statements that constitute “forward-looking statements” within the meaning of Section 27A of the Securities Act and Section 21E of the Securities Exchange Act. These could be statements regarding our plans, beliefs or current expectations; including those plans, beliefs and expectations of our officers and directors with respect to, among other things, new product developments, future orders to be received from our customers, sales of products from inventory, future financial results, liquidity and the continued growth of the electric-powered vehicle industry. Important Risk Factors that could cause actual results to differ from those contained in the forward-looking statements are listed below in Part I, Item 1A. Risk Factors.
UQM Technologies, Inc., (“UQM”, “Company”, “we”, “our”, or “us”) develops, manufactures and sells power dense, high efficiency electric motors, generators and power electronic controllers for the commercial truck, bus, automobile, marine and military markets. Our primary focus is incorporating our advanced technology as propulsion systems for electric, hybrid electric, plug-in hybrid electric and fuel cell electric vehicles, delivering the heart of the electric vehicle.
We believe our proprietary permanent magnet propulsion motor and motor control technology delivers exceptional performance at a competitive cost. Our principal products include propulsion motors and generators with power ratings from 50 kilowatts to 250 kilowatts, auxiliary motors and electronic controls and DC-to-DC converters. The principal attributes that we believe differentiate our proprietary products are compact size, high torque delivery, high power density (the ratio of power output to weight), design and manufacture of integrated motor/controller systems, and superior energy efficiency with full system ratings as high as 95%.
We have assembled a management team with significant experience in the automotive and electric propulsion market segments with critical experience in state of the art design and high quality production. We are ISO/TS 16949 certified, the highest level of quality certification in the automotive supplier industry, and ISO 14001 certified, the highest environmental standards. We have an approximately 130,000 square foot combined headquarters and manufacturing facility located in Longmont, Colorado. We were incorporated in 1967 as a Colorado corporation.
The Market
The global electrified vehicle market is an emerging market with high growth potential being driven by several factors. In China the market is driven by strong government pressure to deal with the staggering pollution that is choking citizens in its major cities. The government has a number of initiatives to encourage electric vehicle market growth including mandates for purchases of New Energy Vehicles by municipalities, incentives and other tools. We are seeing strong demand for electric buses across several cities and regions. We are also seeing demand for electric delivery vans, and trucks, and taxi fleets. In other global markets, including the United States, the drivers for growth in the commercial truck and bus market include the demand for zero tailpipe emissions from full electric vehicles or during the electric only range for hybrids, improved operating costs due to a more efficient powertrain on a gas equivalent basis and reduced maintenance costs for the powertrain system and other systems, such as improved brake life. Moreover, there is community support for cleaner buses and trucks operating in congested areas, along with government incentives and requirements to purchase electric and hybrid vehicles. In the automotive market, these same growth drivers exist, as well as tremendous consumer acceptance of electric vehicles due to their excellent performance, quiet operation, zero or reduced tailpipe emissions and improved operating cost. In addition, significant Corporate Average Fuel Economy (“CAFE”) standards in the United States are expected to accelerate further electrification of the fleet. The major impediment to electrification of vehicles has been total vehicle cost, of which a substantial part is due to the cost of batteries. Battery cost has decreased considerably and is projected to continue to improve. Government incentives have helped to offset these early additional costs and generate the volume and momentum that should further reduce these incremental costs through scale economies.
1
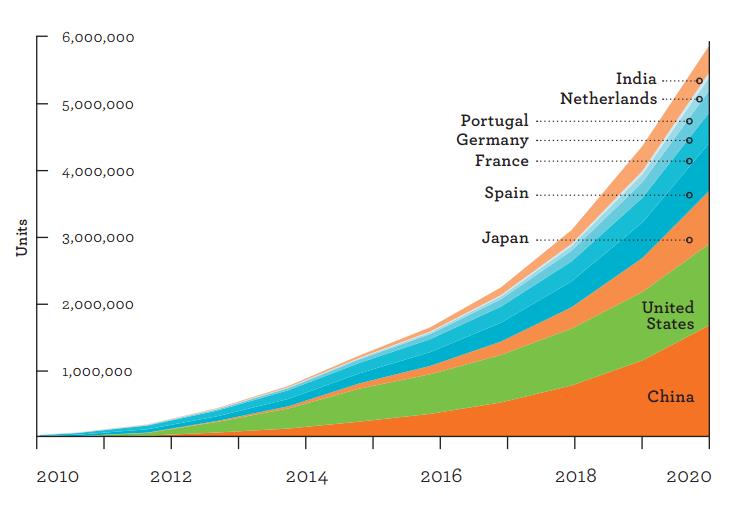
Many studies have been conducted indicating the potential for electric vehicles to capture significant market share over the next several years. For example, in 2015, The International Energy Agency forecasted that 6 million electric vehicles will be on the road by 2020, as shown in the chart below:
Governments around the world have implemented financial incentives to promote the sales of electric vehicles. For example, the U.S. federal government currently offers a $7,500 federal tax credit for the purchase of an electric passenger vehicle, and there are additional tax credits and other benefits such as HOV lane access in various states for purchasers of qualifying vehicles. In China, the country’s National Development and Reform Commission and three other ministries jointly announced in September 2013, a new round of New Energy Vehicle supportive policies for the years 2013 - 2015. Various levels of government subsidies for electric vehicles were announced, including subsidies for pure electric buses of RMB 500,000 each (approximately $80,000), electric trucks of RMB 150,000 each (approximately $24,000) and plug-in electric and fuel cell passenger vehicles of RMB 60,000 each (approximately $9,600). In Europe, a majority of European Union member states provide tax incentives for electrically chargeable passenger vehicles, with Norway providing the most generous package of subsidies totaling almost EUR 17,000 (approximately $19,000).
We believe that the trend toward increasing electrification of vehicles coupled with the government subsidies offered world-wide provide a substantial opportunity for the broad commercial application of our products.
Business Strategy
We are focused primarily on the transportation markets, with a strong emphasis on the commercial truck and bus space, followed by automotive and then marine, military and other. We have developed two basic frame size propulsion systems: the PowerPhase® Pro for passenger car, light commercial applications, light duty marine and other lighter duty applications and the PowerPhase® HD lineup of products for heavier commercial bus and truck applications and heavier duty marine and other HD applications. We also utilize these products, customized versions of these products and all new custom solutions in these markets to meet various customer requirements. We provide motor and controller systems for full-electric, hybrid electric, plug-in hybrid and fuel cell applications. We also provide units for non-automotive markets including the energy management market, auxiliary systems and motor and controller systems for aircraft. We have recently expanded into the fuel cell business by assuming the complete fuel cell air compressor business from Roush Performance Products to address that market directly.
We sell to the following markets:
|
· |
Commercial Trucks, Vans and Shuttles - We supply electric propulsion systems to Electric Vehicles International (“EVI”), a developer and manufacturer of all-electric medium-duty delivery trucks, under a multi-year supply agreement. EVI is also developing a range extended electric vehicle (“REEV”) for PG&E to convert their truck fleet from gasoline engines to electric. We are also the sole supplier of powertrain systems to Zenith Motors, LLC for their electric shuttle vans. |
2
|
· |
Passenger Buses – Electric and hybrid passenger buses can have large positive impacts on the environment and many municipalities around the world are demanding more of these vehicles on the road. For example, we supply electric propulsion systems to Proterra, Inc., a developer and manufacturer of all-electric composite transit buses, under a multi-year supply agreement. We also provide electric propulsion systems for Hino Bus, a subsidiary of Toyota Motor Corporation, for their electric city-buses. PT Sarimas Ahmadi Pratama of Jakarta, Indonesia is using our motors and controllers for their all-electric 17-passenger bus. We have signed a Memorandum of Understanding with one major Chinese company for the development and marketing of UQM electric propulsion systems for New Energy Vehicles in China. In addition, we are in discussions with other potential Chinese customers to supply our products for both all-electric and hybrid-electric vehicles, and we have shipped a small number of electric motor and controller systems into China for prototype testing in buses. |
|
· |
Mining vehicles – In January 2015, we announced a long-term supply agreement with the KESHI Group, a Chinese market leader that manufactures vehicles for the mining industry in China. KESHI will manufacture under license explosion proof electric mining vehicles using UQM’s designs and parts supplied by UQM to Keshi. This first phase is for the vehicles that move the coal from the mines. We are also under discussions for additional usage for the vehicles that move the people in and out of the mines and other potential applications. |
|
· |
Marine – The marine market is a new and growing market for the Company. In January 2014, Research and Markets announced that marine electric vehicles are now a rapidly growing market due to new capability, affordability and legislation banning or restricting internal combustion engines. Their research found that the market for electric water craft, including those on and under water, is expected to increase rapidly from $2.6 billion to $6.3 billion in 2023. In addition, there is a market for electric outboard motors that will more than triple in value as high power pure electric versions become increasingly viable. We are seeing demand for electric solutions for both the clean and quiet operation afforded by full electric and hybrid electric solutions. We supply ReGen Nautic with UQM motors and controllers used in a variety of applications and for a variety of customers. ReGen Nautic has several versions of electric outboard motors utilizing our propulsion systems and also full electric and hybrid inboard solutions utilizing our propulsion systems. We believe the marine market will be a growing segment of electrified vehicles. |
|
· |
Fuel Cell Compressors – In February 2015, we announced that the Company would be expanding into the fuel cell business. This fuel cell compressor is an integral component of hydrogen powered fuel cell vehicles designed for light duty automotive and commercial bus applications for 75kW to 150kW fuel cell stacks. We will commence production in July 2015. |
|
· |
Military - The U.S. military purchases a wide-range of ground vehicles each year, including combat vehicles such as tanks, self-propelled artillery and armored personnel carriers, as well as a variety of light, medium and heavy-duty trucks for convoy and supply operations and for the transport of fuel used on the battlefield. We have in the past worked with a number of military contractors and vehicle makers on prototype hybrid electric vehicles, high export power generators, and electric auxiliaries. There are a number of initiatives to reduce the carbon footprint of military bases that may drive additional efforts in this area. Although this market has not yet emerged, we believe that it may, driven by the availability of electric components in the commercial truck market that operate at similar power levels as those required by many military vehicles. |
|
· |
Automobiles – Government mandates for fuel economy and clean air emissions are accelerating the demand for electric passenger cars. In the United States, for example, CAFE standards will increase the average fuel economy of each manufacturer’s passenger car and light truck model offerings to 35.5 miles per gallon by 2016 and 54.5 miles per gallon by 2025. We have in the past provided electric propulsion systems to many original equipment manufacturers (“OEMs”) for testing and product development. |
|
· |
Other – We supply an automotive qualified DC-to-DC converter which can be used in medium and heavy-duty hybrid trucks. We provide small motors and controllers for aircraft HVAC usage to AirComm. We also supply systems to a customer in the energy management market for a stationary application for electric motors. |
Our business strategy is also comprised of the following:
|
· |
Highly qualified and experienced management – We have a management team with significant experience in the automotive industry and the requirements for high quality production programs and very deep technical knowledge of the motor and controller business. |
3
|
· |
State of the art manufacturing facility – Our headquarters and manufacturing plant are located in an approximately 130,000 square foot facility with fifteen adjacent acres for future expansion. We have designed, installed and qualified volume production lines for our motors and their related electronic controllers. |
|
· |
Manufacturing capacity – We currently have the capacity to build motor/controller systems, in quantities sufficient to meet demands of our current and future customers for the foreseeable future. |
|
· |
Highest production quality standards – Our Company is certified under the ISO/TS 16949 standards, the highest level of automotive quality standards in the industry and ISO 14001, the highest environmental standards. |
|
· |
Leading edge technology – Our technology base includes a number of proprietary technologies and patents related to brushless permanent magnet motors, generators and power electronic controllers, together with software code to intelligently manage the operation of our systems. We continue to launch next generation products to achieve improved performance and efficiency, smaller package sizes and lower production costs. |
Products
We offer a full range motors and controllers for electric, hybrid electric, plug-in hybrid electric and fuel cell electric commercial trucks, vans, buses and automobiles. Our current core electric propulsion products are:
|
· |
PowerPhase HD® 220: Designed for medium and heavy duty trucks and buses. |
|
· |
PowerPhase HD® 950T: A high torque version designed for heavy duty trucks and buses that require additional torque due to higher GVW or more challenging hilly terrain, this product delivers especially high torque performance compared to the PowerPhase HD® 220. |
|
· |
PowerPhase HD® 250: A high voltage version designed for buses and medium and heavy duty trucks . |
|
· |
PowerPhase Pro® 100: Designed for passenger vehicles and light duty truck or van applications. |
|
· |
PowerPhase Pro® 135: The PP 135 offers higher performance for those applications that require it versus our PowerPhase Pro® 100. |
|
· |
Auxiliary Motor Systems: Multiple products are offered for compressor, pump and fan applications, including a family of motor/controller systems for fuel cell air compressors, an integrated motor/controller for aircraft air conditioning compressors, and an integrated motor/controller for aircraft air conditioning condenser fans. |
|
· |
Custom Solutions: We offer variations of the above motors in custom configurations as well as custom hybrid solutions to meet individual customer specifications. |
|
· |
R340 and R410 Fuel Cell Compressor Motor and Controller Assembly: These fuel cell compressors are used in hydrogen powered fuel cell vehicles. |
We also sell four types of DC to DC converters at 1.6 kW and 2.2 kW levels, each available at two different voltage output ranges.
Product Development Activities
We continue to develop new variations of our product lineup to meet expanding customer requirements and work on custom solutions for new prospective customers meeting their precise specifications. We are also developing the next generation of PowerPhase Pro® products designed to be smaller, lighter weight, more energy efficient and producible at lower cost with equal or better performance than our current PowerPhase Pro® systems. This development effort is expected to take more than two years. Development targets include a substantial size reduction of the motor controller. Adopting new generation components and control strategies are also elements of this development. Target applications include automotive and light commercial truck and bus markets.
4
We are also pursuing an advanced motor design technology that eliminates the need for rare-earth elements in the magnets. The technology incorporates permanent magnets of an alternate chemistry, arranged in a unique way that maintains performance benefits. A patent application has been submitted to protect this innovation. We have a $4.0 million program with the Department of Energy (“DOE”) to develop non-rare-earth magnet electric motors for use in electric and hybrid vehicles. The DOE is providing $3.0 million of funding for this program and the Company is providing $1.0 million of cost-share contribution. This award was announced in August 2011 and is a multi-year technology development program.
Competition
All of the markets in which we operate are highly competitive and are characterized by rapid changes due to technological advances that could render existing technologies and products obsolete, although we are not currently aware of any such advances that could render our current product portfolio obsolete. We believe our competitors are large automotive OEMs, Tier 1 suppliers to OEMs, Chinese electric motor manufacturers offering lower cost options, and numerous other competitors in nearly every region of the world
As a result, additional vehicle makers in both on-road and off-road markets are expected to develop and introduce a variety of hybrid electric and all-electric vehicles as market acceptance of these vehicles continues to grow. We cannot assure that we will be able to compete successfully in this market or any other market that now exists or may develop in the future. There are numerous companies developing products that do or soon will compete with our systems. Some of these companies possess significantly greater financial, personnel and other resources than we do, including established supply arrangements, volume manufacturing operations and access to governmental incentive programs.
Customers and Suppliers
We derive our revenue from two principal sources: 1) the sale of products designed, engineered and manufactured by us primarily to OEMs, Tier 1 suppliers of OEMs, and vehicle integrators; and 2) funded contract research and development services performed for strategic partners, customers and the U.S. government directed toward either the advancement of our proprietary technology portfolio or the application of our proprietary technology to customers’ products.
Our business is subject to revenue fluctuation based on the buying cycles of our customers. Specific customers that reach 10% or more of revenues in any given fiscal quarter or year will also vary depending on these buying cycles. In fiscal year ending March 31, 2015, three customers individually comprised 10% or more of our total revenues. Any loss of business with these customers could have a material adverse effect on our business, financial condition and results of operation.
Principal raw materials and components purchased by us include iron, steel, electronic components, rare-earth magnets and copper wire. Most of these items are available from several suppliers. Certain components used by us are custom designs and if our current supplier no longer made them available to us, we could experience production delays.
We can experience significant price fluctuation in the cost of magnets used in our motors, which contain the rare-earth elements neodymium and dysprosium and are primarily sourced from China. We have not experienced any disruption in supply of magnets and magnet prices may continue to be volatile until mining operations outside of China increase or restart.
5
Financial Information about Geographic Areas
The following summarizes total revenue by geographic area:
|
Fiscal Year Ended March 31, |
||||||||
|
2015 |
2014 |
2013 |
||||||
|
United States |
$ |
3,442,050 |
$ |
5,694,144 |
$ |
5,695,623 | ||
|
Foreign Countries |
573,694 | 1,352,056 | 1,483,086 | |||||
|
$ |
4,015,744 |
$ |
7,046,200 |
$ |
7,178,709 | |||
Classification of geographic area is determined based upon the country where the purchase transaction originated.
U.S. Government Contracts
We had a Grant from the DOE under the American Recovery and Reinvestment Act. The Grant provided funds to facilitate the manufacture and deployment of electric drive vehicles, batteries and electric drive vehicle components in the United States. Under the terms of our Grant Agreement, the DOE reimbursed us 50 percent of qualifying costs incurred for the purchase of facilities, tooling and manufacturing equipment, and for engineering expenditures related to product qualification and testing of our electric propulsion systems and other products. The Grant ended on January 12, 2015.
As of March 31, 2015, we had received cumulative reimbursements from the DOE of $27.1 million and had no funds receivable.
We also have a $4.0 million program with the DOE to develop non-rare-earth magnet electric motors for use in electric and hybrid vehicles. The DOE is providing $3.0 million of funding for this three-year program and the Company is providing $1.0 million of cost-share contribution. The objective of the program is to identify and evaluate magnet materials and technology that can deliver performance comparable to our rare-earth magnet motors, broaden our product portfolio, potentially lower magnet costs and limit our exposure to price and supply concerns associated with rare-earth magnets. At March 31, 2015, we had received reimbursements from the DOE under this program of $1.9 million. In January 2015, we announced that we were granted a U.S. patent for our electric and hybrid electric vehicle motor design using non-rare earth magnets.
Backlog
Our order backlog for products at April 30, 2015 was approximately $1.8 million versus $2.3 million at April 30, 2014. Certain orders are blanket purchase orders which are subject to the issuance of subsequent release orders directing the number and timing of actual deliveries. We had backlog of service contracts from customers, which will provide future revenue upon completion, totaling approximately $1.2 million at April 30, 2015 versus $0.4 million at April 30, 2014. Substantially all of the backlog amounts at April 30, 2015 and 2014 are subject to amendment, modification or cancellation. We expect to ship motor and controller backlog products over the next twelve months and complete all service contracts in backlog over the next thirteen months.
Intellectual Property
We have numerous patents in the United States and in other countries to protect our intellectual property.
We determine if our intellectual property should be handled as a trade secret or submitted to the patent application process by deciding whether a technology successfully passes through three evaluation gates. The first gate is an assessment of whether the expected breadth of the patent would offer a high level of protection or whether it will serve as an educational tool for competitors. Based upon a patent and literature search, if the expected coverage is broad, the evaluation moves to the second gate, which is an assessment of infringement detection. This is a review of whether or not it will be possible to detect patent infringement if a competitor were to adopt the technology. Difficulty in detection reduces the value of a patent and will lead us to handle the technology as a trade secret rather than a patent. The last gate is an assessment of whether the technology will have value for many years or whether the technology is a stepping stone to a different technology. The patent process is a multi-year endeavor from
6
the initial disclosure to the granted patent, which leads to the importance of this gate. A technology that is expected to have value for five or more years will pass the final gate and the patent application process will then commence.
We also implement measures to protect our intellectual property, including the guarding of source code, nondisclosure of control techniques, and protection of product design details, drawings and documentation.
Trademarks
We have registered the letters "UQM" in the U.S. Patent and Trademark Office. Counterpart applications have been filed in numerous countries throughout the world, most of which have granted registrations or indicated them to be allowable. We own three U.S. Trademark Registrations for "UQM" (International Class 7 for power transducers, Class 12 for utility land vehicles, and Class 16 for publications). The foreign trademark registrations and applications include major markets where we are doing business or establishing business contacts.
We have also registered the trademark "POWERPHASE" which we use in conjunction with certain of our propulsion systems. The trademark is registered in the European Community and several other foreign countries.
As of April 30, 2015, we had 58 total employees, of whom 56 are full-time employees. We have entered into employment agreements with our executive officers. The employment agreements expire on August 31, 2015. We believe our relationship with employees has been generally satisfactory.
In addition to our full-time staff, we from time to time engage the services of outside consultants and contract employees to meet peak workload or specialized program requirements. We do not anticipate any difficulty in locating additional qualified engineers, technicians and production workers, if so required, to meet expanded research and development or manufacturing operations.
Available Information
We file annual, quarterly and current reports, proxy statements and other information with the Securities and Exchange Commission (“SEC”). Anyone seeking information about our business can receive copies of our Fiscal Year 2015 Annual Report on Form 10-K, Quarterly Reports on Form 10-Q, Current Reports on Form 8-K, all amendments to those reports and other documents, filed with the SEC at the public reference section of the SEC at 100 F Street, NE, Room 1580, Washington, D.C. 20549. These documents also may be obtained, free of charge, by: contacting our Investor Relations office by e-mail at investor@uqm.com; by phone at (303) 682-4900; writing to UQM Technologies, Inc., Investor Relations, 4120 Specialty Place, Longmont, CO 80504-5400; or accessing our website at www.uqm.com. We make our Annual Report on Form 10-K, Quarterly Reports on Form 10-Q, Current Reports on Form 8-K and amendments to those reports filed or furnished pursuant to Section 13(a) or 15(d) of the Securities Exchange Act of 1934, available on our website as soon as reasonably practicable after we file or furnish the materials electronically with the SEC. To obtain any of this information, go to www.uqm.com, select “Investor Relations” and select the form you would like to access. Our website also includes our Audit Committee Charter and Code of Business Conduct and Ethics as well as the procedures for reporting a violation of business ethics. Information on our website does not constitute part of this Annual Report.
7
ITEM 1A.RISK FACTORS
We operate in a challenging and changing environment that involves numerous known and unknown risks and uncertainties that could materially affect our operations. The risks, uncertainties and other factors set forth below may cause our actual results, performances or achievements to be materially different from those expressed or implied by our forward-looking statements. If any of these risks or events occur, our business, financial condition or results of operations may be adversely affected.
We have incurred significant losses and may continue to do so.
We have incurred significant net losses as shown in the following tables:
|
Fiscal Year Ended March 31, |
||||||||
|
2015 |
2014 |
2013 |
||||||
|
Net loss |
$ |
5,988,530 |
$ |
2,773,244 |
$ |
10,688,312 | ||
As of March 31, 2015, we had an accumulated deficit of $99,937,075.
In the future, we plan to make additional investments in product development, facilities and equipment and other costs related to the commercialization of our products. As a result, we expect to continue to incur net losses for the foreseeable future.
Our operating losses, anticipated capital expenditures and working capital requirements in the longer term may exceed our current cash balances.
Our net loss for the fiscal year ended March 31, 2015 was $5,988,530 versus a net loss for the fiscal years ended March 31, 2014 and 2013 of $2,773,244 and $10,688,312, respectively. At March 31, 2015, our cash and short-term investments totaled $6,585,703. We expect our losses to continue for the foreseeable future. Our existing cash resources, together with cash generated from reductions in our inventories of PowerPhase Pro propulsion systems, are expected to be sufficient to complete our business plan for at least the next twelve months. Should those resources be insufficient, we may need to secure additional debt or equity funding, which may not be available on terms acceptable to us, if at all.
Our business depends, in part, on the expansion of the market for all-electric and hybrid electric vehicles.
Although our electric propulsion systems may be used in a wide variety of products, the market for electric and hybrid vehicles is fairly new. At the present time, batteries used to power electric motors have limited life and require several hours to charge, and charging stations for electric motors are not widely available. Electric and hybrid vehicles also tend to be priced higher than comparable gasoline-powered vehicles. As a result, consumers may experience concerns about driving range limitations, battery charging time and higher purchase costs of electric or hybrid vehicles. If consumer preferences shift to vehicles powered by other alternative methods, or if concerns about the availability of charging stations cannot be overcome, the market for all-electric vehicles, and therefore our electric propulsion systems, may be limited. In addition, our electric propulsion systems are incorporated in buses used for mass transit in several U.S. cities. If passenger traffic in these mass transit systems declines or government funding to transportation districts declines from current levels, demand for our products may also decrease.
The popularity of alternative fuel based vehicles and “green energy” initiatives are highly dependent on macro-economic conditions, including oil prices and the overall health of the economy. When oil prices fall, interest in and resources allocated to the development of advanced technology vehicles and propulsion systems may diminish. We cannot predict how and the extent to which the recent substantial decrease of oil prices will affect the domestic interest in electric and hybrid vehicles. Downturns in the world economy may also have a severe impact on the automotive industry, slowing the demand for vehicles generally and reducing consumers' willingness to pay more for environmentally friendly technology.
8
If our products do not achieve market acceptance, our business may not grow.
Although we believe our proprietary systems are suited for a wide-range of vehicle electrification applications, our business and financial plan relies heavily on our introduction of new products that have limited testing in the marketplace. We have made substantial investments in manufacturing facilities and equipment, production and application engineering, among other things, to increase our production capacity in order to capitalize on the anticipated expansion in demand for electric propulsion systems and generators in the commercial truck, bus and automobile markets. We are not certain that our existing products will achieve broad market acceptance, or that we will be able to develop new products or product enhancements that will achieve broad market acceptance.
Our sales cycle is inherently long.
We must go through lengthy processes to achieve supply contracts with our customers. Our products must conform to the technical specifications of the customer and meet design requirements of the electric vehicle. Typically prototype testing is required to ensure consistent system performance on an ongoing basis. These steps can often take many months to multiple years until decisions are made on whether or not to take a vehicle to production. We may spend considerable financial and human resources over an extended period of time and not end up with a completed supply contract. Failure to secure volume production levels within a reasonable period of time could have an adverse effect on our results of operations and our liquidity.
CODA Automotive filed for bankruptcy protection on May 1, 2013 and it is unlikely we will be able to recover more than insignificant amounts due to us under our Supply Agreement, including substantial amounts due for accounts receivable, inventory purchases and guaranteed minimum payments.
We executed a ten-year Supply Agreement with CODA in July, 2009 which provided a framework for CODA, or its manufacturing partner, to purchase from us electric propulsion systems for use in automobiles to be manufactured by CODA. On May 1, 2013, CODA filed for bankruptcy protection. Amounts due from CODA at March 31, 2015 totaled $3,838,092, all of which had been written off as uncollectible. In addition, CODA was obligated under the Supply Agreement for inventory purchases totaling approximately $8.2 million and for a guaranteed minimum payment of $2 million due to their failure to purchase at least 15,000 units. It is likely that we will recover only an insignificant amount of the balance owed to us under the Supply Agreement, if any.
We carry a large inventory balance originally acquired for CODA and may not be able to sell this inventory.
At March 31, 2015, we had aged inventory of $7.7 million of PowerPhase Pro® systems on our books originally acquired for now-bankrupt CODA. We believe the PowerPhase Pro® system is right sized for many medium-duty truck, marine, passenger vehicle and stationary power applications, and this inventory is now for sale to other customers. While we believe that there continues to be a strong market for these products, a change in market conditions or technology advancements could make this inventory obsolete, causing a material adverse effect on our results of operations.
We entered into purchase contracts with our supply base to support the CODA program, some of which are non-cancellable by their terms. Our actual liability under these contracts may vary from our current estimates.
We have recorded a liability as of March 31, 2015 of $774,974 representing the amount we expect to pay to settle non-cancellable contracts with certain suppliers to the CODA program that will not be fulfilled due to the bankruptcy filing by CODA. This liability is lower than the original amount we recorded of $1,050,000 as of March 31, 2013 as a result of negotiations and settlements we reached with some vendors during fiscal year 2014. The amount of this liability represents management’s current estimate and may be subject to further adjustment based on future negotiations or litigation. Settlements in excess of our estimates or any upward revision in our settlement estimate could result in a material change in our results of operations and financial condition.
All funding from our DOE Grant ended as of January 12, 2015 when the Grant expired.
Funds from the DOE Grant were very useful in supporting our growth initiatives and reducing our losses over the past several years. We believe that we have adequate cash resources for at least the next twelve months. However, if anticipated revenues are not realized and other cash resources are unavailable, the end of the DOE Grant funding could significantly impact our ability to sustain operations.
9
The reduction or elimination of government subsidies and economic incentives for alternative energy technologies, including our electric vehicle motor technology, could reduce demand for our products and services, lead to a reduction in our revenues and adversely impact our operating results.
We believe that the near-term growth of alternative energy technologies, including our electric vehicle motor technology, relies on the availability and size of government and economic incentives both in the United States and in other countries. Many of these government incentives expire, phase out over time, exhaust the allocated funding, require renewal by the applicable authority, and/or could be reduced or discontinued for other reasons. The reduction, elimination, or expiration of government subsidies and economic incentives may result in the diminished demand from our customers and could materially and adversely affect our future operating results.
We are subject to risks inherent in international operations.
Since we market our products both inside and outside the United States, our success depends in part, on our ability to secure international customers and our ability to manufacture products that meet foreign regulatory and commercial requirements in target markets. In addition, we are subject to tariff regulations and requirements for export licenses. We can face numerous challenges in our international growth plans, including unexpected changes in regulatory requirements, potential conflicts or disputes that countries may have to deal with, fluctuations in currency exchange rates, longer accounts receivable requirements and collections, difficulties in managing international operations, potentially adverse tax consequences, restrictions on repatriation of earnings and the burdens of complying with a wide variety of international laws. Any of these factors could adversely affect our results of operations and financial condition.
Our revenue is highly concentrated among a small number of customers.
A large percentage of our revenue is typically derived from a small number of customers, and we expect this trend to continue.
Our customer arrangements generally are non-exclusive, have no long-term volume commitments and are often done on a purchase order basis. We cannot be certain that customers that have accounted for significant revenue in past periods will continue to purchase our products. Accordingly, our revenue and results of operations may vary substantially from period to period. We are also subject to credit risk associated with the concentration of our accounts receivable from our customers. If one or more of our significant customers were to cease doing business with us, significantly reduce or delay its purchases from us or fail to pay us on a timely basis, our business, financial condition and results of operations could be materially adversely affected.
Our business relies on third parties, whose success we cannot predict.
As a manufacturer of motors, generators, and other component parts, our business model depends on the ability of third parties in our industry to develop, produce and market products that include or are compatible with our technology and then to sell these products into the marketplace. Our ability to generate revenue depends significantly on the commercial success of our customers and partners. Failure of these third parties to achieve significant sales of products incorporating our products and fluctuations in the timing and volume of such sales could have a material adverse effect on our business, financial condition and results of operations.
Our electric propulsion systems use rare-earth minerals and unavailability or limited supply of these minerals could prevent us from manufacturing our products in production quantities or increase our costs.
Neodymium and dysprosium, rare-earth minerals, are key elements used in the production of magnets that are components of our electric propulsion systems. We currently source our magnets from China, and China has indicated its intent to retain more of this mineral for China use, rather than exporting it. During calendar year 2011, for example, we experienced significant price escalation in the cost of magnets used in our motors. This price escalation was primarily due to rare-earth government policy in China. Rare-earth prices have decreased substantially since peaking in the summer of 2011, and are now approaching the baseline prices (defined as the beginning of calendar year 2011). We have implemented a magnet surcharge process to recover these additional costs in the event of another price escalation. Although rare-earth magnets are available from other sources, these alternative sources are currently more costly. Reduced availability of neodymium and dysprosium from China could adversely affect our ability to obtain magnets in sufficient quantities, in a timely manner, or at a commercially reasonable cost. In the event that China's actions cause us to seek alternate sources of supply for magnets, it could cause an increase in our product costs, thereby reducing or eliminating our profit margin on electric propulsion systems if we are unable to pass the increase
10
on to our customers. Increasing prices to our customers due to escalating magnet costs may reduce demand for our motors and make it difficult or impossible to compete with other motor manufacturers whose motors do not use rare-earth minerals.
Some of our contracts can be cancelled with little or no notice and could restrict our ability to commercialize our technology.
Our contracts with government agencies are subject to the risk of termination at the convenience of the contracting agency and in some cases grant "march-in" rights to the government. March-in rights are the right of the United States government or the applicable government agency, under limited circumstances, to exercise a non-exclusive, royalty-free, irrevocable worldwide license to any technology developed under contracts funded by the government to facilitate commercialization of technology developed with government funding. March-in rights can be exercised if we fail to commercialize the developed technology. The exercise of march-in rights by the government or an agency of the government could restrict our ability to commercialize our technology.
Some of our orders for the future delivery of products are placed under blanket purchase orders which may be cancelled by our customers at any time. The amount payable to us, if any, upon cancellation by the customer varies by customer. Accordingly, we may not recognize as revenue all or any portion of the amount of outstanding order backlog we have reported.
We face intense competition and may be unable to compete successfully.
In developing electric motors for use in vehicles and other applications, we face competition from very large domestic and international companies, including the world's largest automobile manufacturers. Many of our competitors have far greater resources to apply to research and development efforts than we have, and they may independently develop motors that are technologically more advanced than ours. These competitors also have much greater experience in and resources for marketing their products. For these reasons, potential customers may choose to purchase electric motors from our competitors rather than from us.
Changes in environmental policies could hurt the market for our products.
The market for electric and other alternative fuel vehicles and equipment and the demand for our products are influenced, to a degree, by federal, state and local regulations relating to air quality, greenhouse gases and pollutants. These laws and regulations may change, which could result in transportation or equipment manufacturers abandoning or delaying their interest in electric or hybrid electric vehicles or equipment. In addition, a failure by authorities to enforce current laws and regulations or to adopt additional environmental laws or regulations could limit the demand for our products.
Although many governments have identified as a significant priority the development of alternative energy sources, governments may change their priorities, and any change they make could materially affect our revenue or the development of our products.
If we are unable to protect our patents and other proprietary technology, we will be unable to prevent third parties from using our technology, which would impair our competitiveness and ability to commercialize our products. In addition, the cost of enforcing our proprietary rights may be expensive and result in increased losses.
Our ability to compete effectively against other companies in our industry will depend, in part, on our ability to protect our proprietary technology. Although we have attempted to safeguard and maintain our proprietary rights, we do not know whether we have been or will be successful in doing so. We have historically pursued patent protection in the United States and a limited number of foreign countries where we believe significant markets for our products exist or where potentially significant competitors have operations. It is possible that a substantial market could develop in a country where we have not received patent protection and under such circumstances our proprietary products would not be afforded legal protection in these markets. Further, our competitors may independently develop or patent technologies that are substantially equivalent or superior to ours. We cannot assure that additional patents will be issued to us or, if they are issued, as to the scope of their protection. Patents granted may not provide meaningful protection from competitors. Even if a competitor's products were to infringe patents owned by us, it would be costly for us to pursue our rights in an enforcement action, it would divert funds and resources which otherwise could be used in our operations and we may not be successful in enforcing our intellectual property rights. In addition, effective patent, trademark, service mark, copyright and trade secret protection may not be available in
11
every country where we may operate or sell our products in the future. If third parties assert technology infringement claims against us, the defense of the claims could involve significant legal costs and require our management to divert time and attention from our business operations. If we are unsuccessful in defending any claims of infringement, we may be forced to obtain licenses or to pay royalties to continue to use our technology. We may not be able to obtain any necessary licenses on commercially reasonable terms or at all. If we fail to obtain necessary licenses or other rights, or if these licenses are costly, our results of operations may suffer either from reductions in revenues through our inability to serve customers or from increases in costs to license third-party technologies. Finally, patents may not deter third parties from attempting to reverse engineer our products and discovering our intellectual property.
We rely, in part, on contractual provisions to protect our trade secrets and proprietary knowledge, the adequacy of which may not be sufficient.
Confidentiality agreements to which we are party may be breached, and we may not have adequate remedies for any breach. Our trade secrets may also be known without breach of such agreements or may be independently developed by competitors. Our inability to maintain the proprietary nature of our technology and processes could allow our competitors to limit or eliminate any competitive advantages we may have.
Use of our motors in vehicles could subject us to product liability claims or product recalls, and product liability insurance claims could cause an increase in our insurance rates or could exceed our insurance limits, which could impair our financial condition, results of operations and liquidity.
The automotive industry experiences significant product liability claims. As a supplier of electric propulsion systems or other products to vehicle OEMs, we face an inherent business risk of exposure to product liability claims in the event that our products, or the equipment into which our products are incorporated, malfunction and result in personal injury or death. We may be named in product liability claims even if there is no evidence that our systems or components caused an accident. Product liability claims could result in significant losses as a result of expenses incurred in defending claims or the award of damages. The sale of systems and components for the transportation industry entails a high risk of these claims, which may increase as our production and sales increase. In addition, we may be required to participate in recalls involving these systems if any of our systems prove to be defective, or we may voluntarily initiate a recall or make payments related to such claims as a result of various industry or business practices or the need to maintain good customer relationships.
We carry product liability insurance of $10 million covering most of our products. If we were to experience a large insured loss, it might exceed our coverage limits, or our insurance carriers could decline to further cover us or raise our insurance rates to unacceptable levels, any of which could impair our financial position and results of operations. Any product liability claim brought against us also could have a material adverse effect on our reputation.
We may be subject to warranty claims, and our provision for warranty costs may not be sufficient.
We may be subject to warranty claims for defects or alleged defects in our products, and the risk of such claims arising will increase as our production and sales increase. In addition, in response to consumer demand, vehicle manufacturers have been providing, and may continue to provide, increasingly longer warranty periods for their products. As a consequence, these manufacturers may require their suppliers, such as us, to provide correspondingly longer product warranties. As a result, we could incur substantially greater warranty claims in the future.
Our future success will depend on our ability to attract and retain qualified management and technical personnel.
Our future success is substantially dependent on the continued services and on the performance of our executive officers and other key management, engineering, manufacturing and operating personnel. The loss of the services of any executive officer, or other key management, engineering, manufacturing and operating personnel, could materially adversely affect our business. Our ability to achieve our growth plans will also depend on our ability to attract and retain additional qualified management and technical personnel, and we do not know whether we will be able to be successful in these regards. Our inability to attract and retain additional qualified management and technical personnel, or the departure of key employees, could materially and adversely affect our growth plans and, therefore, our business prospects, results of operations and financial condition.
Our stock price has been and could remain volatile.
12
The market price for our common stock has been and may continue to be volatile and subject to extreme price and volume fluctuations in response to market and other factors, including the following, some of which are beyond our control:
|
· |
failure to meet growth expectations; |
|
· |
variations in our quarterly operating results from the expectations of investors; |
|
· |
downward changes in general market conditions; |
|
· |
announcements of new products or services by our competitors; |
|
· |
announcements by our competitors of significant acquisitions, strategic partnerships, joint ventures or capital commitments; |
|
· |
additions or departures of key personnel; |
|
· |
investor perception of our industry or our prospects; |
|
· |
insider selling or buying; |
|
· |
demand for our common stock; and |
|
· |
general technological or economic trends. |
In the past, following periods of volatility in the market price of their stock, many companies have been the subjects of securities class action litigation. If we became involved in securities class action litigation in the future, it could result in substantial costs and diversion of management’s attention and resources and could harm our stock price, business prospects, results of operations and financial condition.
The maintenance and security of our information systems are critical to our operations.
We rely on our information systems to be functioning at all times, and that the data in those systems is protected and secure from viruses, illegal access and any other form of unauthorized use. Should our information systems be compromised in any way, our business operations could be severely impacted.
13
ITEM 1B.UNRESOLVED STAFF COMMENTS
None.
We own our offices and manufacturing facility and believe the facility to be well maintained, adequately insured and suitable for its present and intended uses. Information concerning our facility as of March 31, 2015 is set forth in the table below:
|
Ownership or |
|||
|
Location |
Square Feet |
Expiration Date of Lease |
Use |
|
Longmont, Colorado |
129,304 |
Own |
Manufacturing, laboratories and offices |
Litigation
We are involved in various claims and legal actions arising in the ordinary course of business. In the opinion of management, and based on current available information, the ultimate disposition of these matters is not expected to have a material adverse effect on our financial position, results of operations or cash flow.
ITEM 4.MINE SAFETY DISCLOSURES
Not applicable.
14
Part II
ITEM 5. MARKET FOR REGISTRANT’S COMMON EQUITY, RELATED STOCKHOLDER MATTERS AND ISSUER PURCHASES OF EQUITY SECURITIES
Our common stock trades on the NYSE MKT and Chicago Stock Exchange under the symbol UQM. The high and low trade prices, by fiscal quarter, as reported by the NYSE MKT Stock Exchange for the last two fiscal years are as follows:
|
2015 |
High |
Low |
||
|
Fourth Quarter |
$ 1.32 |
$ 0.71 |
||
|
Third Quarter |
$ 1.44 |
$ 0.76 |
||
|
Second Quarter |
$ 2.30 |
$ 1.18 |
||
|
First Quarter |
$ 2.96 |
$ 1.72 |
||
|
2014 |
High |
Low |
||
|
Fourth Quarter |
$ 3.45 |
$ 1.56 |
||
|
Third Quarter |
$ 2.49 |
$ 1.40 |
||
|
Second Quarter |
$ 2.20 |
$ 1.00 |
||
|
First Quarter |
$ 1.55 |
$ 0.68 |
On May 26, 2015 the closing price of our common stock, as reported on the NYSE MKT, was $1.00 per share and there were 559 holders of record of our common stock.
We have not paid any cash dividends on our common stock since inception and we intend for the foreseeable future to retain any earnings to finance the growth of our business. Future dividend policy will be determined by our Board of Directors based upon consideration of our earnings, capital needs and other factors then relevant.
15
PERFORMANCE GRAPH 1
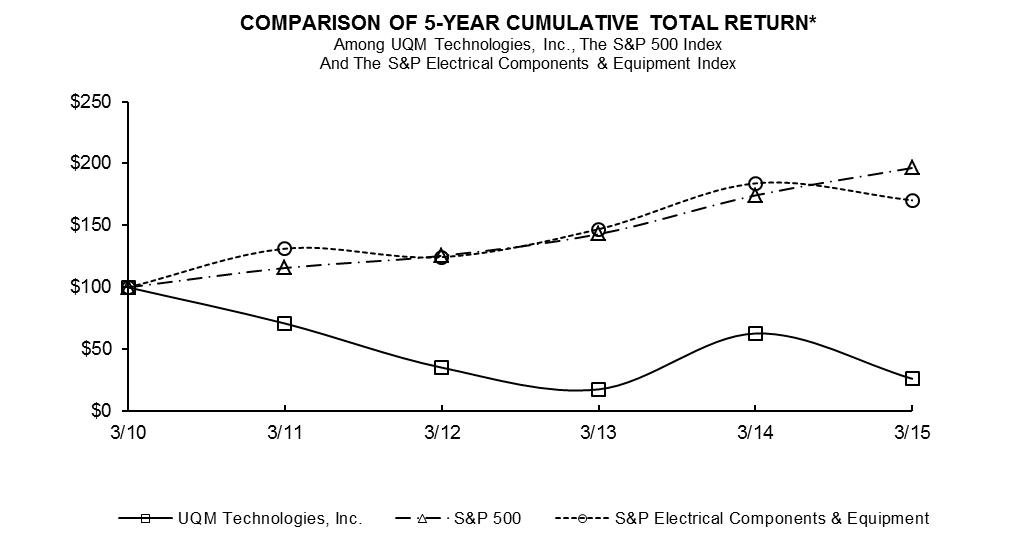
The following graph represents the yearly percentage change in the cumulative total return on the common stock of UQM Technologies, Inc., the group of companies comprising the S&P Electrical Equipment Index, and those companies comprising the S&P 500 Index for the five year period from March 31, 2010 through March 31, 2015:
|
3/10 |
3/11 |
3/12 |
3/13 |
3/14 |
3/15 |
|
|
UQM Technologies, Inc. |
100.00 | 70.78 | 35.15 | 17.58 | 62.71 | 26.13 |
|
S&P 500 |
100.00 | 115.65 | 125.52 | 143.05 | 174.31 | 196.51 |
|
S&P Electrical Components & Equipment |
100.00 | 131.26 | 124.37 | 147.03 | 184.03 | 170.31 |
|
*$100 invested on 3/31/10 in stock or index, including reinvestment of dividends |
||||||
|
Fiscal year ending March 31. |
||||||
1 The stock price performance graph depicted is not “soliciting material,” is not deemed "filed" with the SEC, and is not to be incorporated by reference into any filing of the Company under the Securities Act of 1933, as amended, or the Exchange Act, whether made before or after the date hereof and irrespective of any general incorporation contained in such filing.
16
ITEM 6.SELECTED FINANCIAL DATA
The selected consolidated financial data presented below should be read in conjunction with our consolidated financial statements and related notes included elsewhere in this document.
|
UQM Technologies, Inc. |
||||||||||||||
|
Selected Consolidated Financial Data |
||||||||||||||
|
Years Ended March 31, |
||||||||||||||
|
2015 |
2014 |
2013 |
2012 |
2011 |
||||||||||
|
Product sales |
$ |
3,218,616 |
$ |
6,136,305 |
$ |
5,910,153 |
$ |
9,358,388 |
$ |
8,413,098 | ||||
|
Contract services revenue |
$ |
797,128 |
$ |
909,895 |
$ |
1,268,556 |
$ |
785,068 |
$ |
608,204 | ||||
|
Loss before other income |
||||||||||||||
|
(expense) |
$ |
(6,859,891) |
$ |
(2,782,503) |
$ |
(10,707,432) |
$ |
(4,953,336) |
$ |
(2,349,174) | ||||
|
Net loss |
$ |
(5,988,530) |
$ |
(2,773,244) |
$ |
(10,688,312) |
$ |
(4,928,520) |
$ |
(1,992,358) | ||||
|
Net loss per common share - |
||||||||||||||
|
basic and diluted |
$ |
(0.15) |
$ |
(0.07) |
$ |
(0.29) |
$ |
(0.14) |
$ |
(0.06) | ||||
|
Total assets |
$ |
24,801,993 |
$ |
29,835,133 |
$ |
28,608,715 |
$ |
39,655,601 |
$ |
41,803,920 | ||||
|
Long-term obligations (1) |
$ |
445,024 |
$ |
182,100 |
$ |
627,412 |
$ |
715,107 |
$ |
1,316,372 | ||||
|
Cash dividend declared per |
||||||||||||||
|
common share |
- |
- |
- |
- |
- |
|||||||||
|
(1) Includes current portion of long-term obligations. |
||||||||||||||
17
ITEM 7.MANAGEMENT’S DISCUSSION AND ANALYSIS OF FINANCIAL CONDITION AND
RESULTS OF OPERATIONS
This Report contains statements that constitute “forward-looking statements” within the meaning of Section 27A of the Securities Act and Section 21E of the Securities Exchange Act. These could be statements regarding our plans, beliefs or current expectations; including those plans, beliefs and expectations of our officers and directors with respect to, among other things, new product developments, future orders to be received from our customers, sales of products from inventory, future financial results, liquidity and the continued growth of the electric-powered vehicle industry. Important Risk Factors that could cause actual results to differ from those contained in the forward-looking statements are listed above in Part I, Item 1A. Risk Factors.
UQM is a developer and manufacturer of power dense, high efficiency electric motors, generators and power electronic controllers for the commercial truck, bus, automotive, marine and military markets. We generate revenue from two principal activities: 1) the sale of motors, generators and electronic controls; and 2) research, development and application engineering contract services. Our product sales consist of annually recurring volume production, prototype low volume sales, and revenues derived from the sale of refurbished and serviced products. The sources of engineering revenue typically vary from year to year and individual projects may vary substantially in their periods of performance and aggregate dollar value.
We have invested considerable financial and human resources into the development of our technology and manufacturing operations. We have developed and production-validated a full range of products for use in full-electric, hybrid electric, plug-in-hybrid and fuel cell applications for the commercial bus and truck, automotive, marine and military markets. These products are all highly efficient permanent magnet designs and feature outstanding performance, package size and weight valued by our customers. Our production capabilities and capacity are sufficient to meet the demands of our current and future customers for the foreseeable future. We are certified as an ISO/TS 16949 quality supplier, which is the highest level of quality standards in the automotive industry, and we are ISO 14001 certified, meeting the highest environmental standards. We have a management team with significant experience in the automotive industry and the requirements for high quality production programs and very deep technical knowledge of the motor and controller business. This team has the ability and background to grow the business to significantly higher levels, and we believe we have adequate cash balances to fund our operations for at least the next twelve months.
Our most important strategic initiative going forward is to develop customer relationships that lead to longer-term supply contracts. Volume production is the key to our ongoing operations. We are driving business development in the following ways:
|
· |
We have created a well-defined, structured process to target potential customers of vehicle electric motor technology in the commercial truck/van and shuttles, passenger buses, automotive, marine, military and other targeted markets both domestically and internationally. |
|
· |
We have developed a customer pipeline where identified potential customers are synergistic and strategic in nature for longer-term growth potential. |
|
· |
We are building long term quantifiable and sustainable relationships within the identified target markets. |
|
· |
We provide service and support to our customers from pilot and test activities through commissioning processes and then ultimately to volume production operations. |
|
· |
We improve our purchasing and manufacturing processes to develop competitive costs to ensure that our pricing to customers is market competitive. |
|
· |
We provide customized solutions to meet specification requirements that some customers require. |
|
· |
We participate in trade show events globally to demonstrate our products and engage with users of electric motor technology. |
18
|
· |
We actively involve all functional groups within the Company to support the requests of our customers. |
We believe that the successful execution of these activities will lead us to secure volume production commitments from customers, so that our operations will become cash flow positive and ultimately profitable.
In February 2015, we announced the signing of a ten-year cooperative production and supply agreement with the KESHI GROUP in Changzhou, China. KESHI is a major manufacturer of vehicles used in the mining industry in China. Under the supply agreement, UQM will supply the core component parts and KESHI will source the unique explosion-proof components and perform final assembly and test in Changzhou under a license agreement with UQM. The relationship between the two companies is exclusive for explosion proof systems in China. Production is expected to begin in fiscal year 2015 and will ramp over the next few years. We worked with KESHI for more than one year to develop their explosion-proof component requirement which lead to the signing of the long-term agreement.
In February 2015, we announced that we had achieved China Certification on our PowerPhase HD® 250 electric propulsion system that meets the Chinese General Specifications for electrical machines and controllers for electric vehicles. The PowerPhase HD 250 is optimized for transit bus and commercial vehicle applications, and the certification enables us to supply this system to vehicle manufacturers throughout China. The testing, conducted over a three month period at the China Automotive Technology & Research Center in Tianjin, included extensive system performance analysis for power and torque, environmental examinations including vibration, salt spray and sealing performance and electrical testing.
In February 2015, we announced a business relationship with Power Plaza Co. Ltd., a South Korean electric vehicle manufacturer, to provide PowerPhase Pro® 100 electric motor and controller systems for the rapidly growing Korean 1-ton truck EV market. Power Plaza is working with the Seoul city government and other key partners on a program to convert 1-ton diesel trucks – which are the primary commercial truck used in Seoul – to electric vehicles. One of the key partners in the program is the South Korean conglomerate CJ which has a total fleet of 18,000 1-ton vehicles used for short-haul delivery, and is evaluating electrifying a portion of their fleet.
In February 2015, we also announced expansion into the fuel cell business by taking over the fuel cell compressor module business from another company. These compressor modules are an integral component of hydrogen powered fuel cell vehicles. We previously provided motor/controller components to customers who manufactured fuel cell compressors. We believe that our expertise in manufacturing electric motor and controller systems makes this a natural extension of our existing product lines. We further believe that our revenue and gross profits will be improved over time as a result of this addition to our business.
In November 2014, we signed a long-term supply agreement to provide electric power systems for industrial and commercial applications to an energy management company. UQM PowerPhase® electric motors and controllers will be incorporated with this partner’s proprietary technology to create new solutions to address the needs of its global customer base in a wide range of large industrial and commercial facilities. Pilot shipments are expected to begin in calendar 2015, followed by a second purchase order for 500 units once certification is complete and follow-on customer orders are received. These initial production units are expected to available to start shipping in late calendar year 2015.
The Department of Energy grant that was awarded to us in 2010 expired on January 12, 2015. Since the beginning of the grant program, we were reimbursed a total of $27.1 million through March 31, 2015. These cumulative reimbursements have allowed us to achieve many milestones to support our business development efforts that we believe will lead to volume production opportunities. First, we were able to relocate our headquarters and production operations to an approximate 130,000 square foot facility with fifteen adjacent acres of land for future expansion. Within this modern facility, we were able to develop and install manufacturing capacity and infrastructure to build and test our state-of-the-art traction motors and controllers. We have installed a flexible manufacturing footprint that allows us to build both the large and smaller frame size motors and controllers at production capacity levels consistent with the growth targets of our current and potential customers. Throughout the program, the DOE grant supported product validation and release activities for both passenger vehicle and heavy duty truck and bus platforms. In addition, the grant assisted us in implementing all of the required processes and systems to certify our facility to the ISO/TS 16949 quality standard that is a requirement to be a supplier to the automotive industry.
With the expiration of the Grant, we launched and re-deployed resources from production engineering activities to several new internally funded projects aimed at developing and significantly improving our product portfolio. This led to a significant increase in research and development expenditures in the fourth quarter of fiscal year 2015, and we expect those resources to continue to be deployed on similar research and development activities in the future.
19
The funding from the DOE grant brought us to a position of strength with regards to product validation and manufacturing capabilities. This, in addition to the business development activities in place and the cash reserves we have to fund the operations for at least the next twelve months, makes us optimistic about the future of the Company.
Financial Condition
Cash and cash equivalents and short-term investments at March 31, 2015 were $6,585,703 and working capital was $15,605,555 compared with $10,310,141 and $20,052,187, respectively, at March 31, 2014. The decrease in cash and short-term investments and working capital is primarily attributable to operating losses.
Accounts receivable decreased $438,002 to $522,417 at March 31, 2015 from $960,419 at March 31, 2014. The decrease is primarily due to a reduction in billings outstanding under our DOE Grant. Our sales are conducted through acceptance of customer purchase orders or in some cases through supply agreements. For credit qualified customers, our standard terms are net 30 days. For international customers and customers without an adequate credit rating or history, our typical terms are irrevocable letter of credit or cash payment in advance of delivery. At March 31, 2015 and 2014, we had an allowance for uncollectible accounts of zero, respectively.
Other receivable increased to $855,000 at March 31, 2015 from zero at March 31, 2014 resulting from insurance proceeds due and recorded under a key-man life insurance policy following the death of one of our executives in the fourth quarter of fiscal year 2015.
Costs and estimated earnings on uncompleted contracts decreased to $49,917 at March 31, 2015 versus $341,255 at March 31, 2014. The decrease is due to timing of billings on certain contracts in process at March 31, 2015 versus March 31, 2014.
Inventories decreased $700,369 to $9,354,053 at March 31, 2015 compared to $10,054,422 at March 31, 2014, reflecting shipments of PowerPhase Pro® and PowerPhase HD® propulsion systems.
Prepaid expenses and other current assets increased to $266,448 at March 31, 2015 from $263,988 at March 31, 2014, primarily due to higher levels of prepayments on software licenses outstanding at the end of the current fiscal year versus the prior fiscal year end.
We invested $558,755 for the acquisition of property and equipment during the fiscal year ended March 31, 2015 before reimbursements from the DOE Grant versus $377,224 during the fiscal year ended March 31, 2014. The increase in capital expenditures is primarily attributable to increased levels of investments in production equipment during the current fiscal year. Cash reimbursements for capital assets under the Grant during the fiscal years ended March 31, 2015 and March 31, 2014 were $371,140 and $215,754, respectively.
Patent costs increased to $239,043 at March 31, 2015 compared to $227,015 at March 31, 2014 primarily due to capitalized costs associated with a new patent application partially offset by the amortization of capitalized patent costs.
Trademark costs decreased to $102,823 at March 31, 2015 compared to $107,123 at March 31, 2014 due to the amortization of capitalized trademark costs.
Other assets decreased to zero at March 31, 2015 from $2,997 at March 31, 2014 due to lower levels of long-term investments at the end of the current fiscal year versus the prior fiscal year end.
Accounts payable increased $12,275 to $398,568 at March 31, 2015 from $386,293 at March 31, 2014, primarily due to the timing of vendor payments.
Other current liabilities increased $53,226 to $1,544,971 at March 31, 2015 from $1,491,745 at March 31, 2014. The increase is primarily attributable to increased levels of customer deposits and accrued payroll and employee benefits at March 31, 2015.
Other long-term liabilities increased $262,924 to $445,024 at March 31, 2015 from $182,100 at March 31, 2014 due to a license fee received from a customer under a ten-year cooperation agreement and periodic accruals of future severance obligations under executive employment agreements.
20
Common stock and additional paid-in capital increased to $400,000 and $121,866,061, respectively, at March 31, 2015 compared to $397,778 and $121,325,762 at March 31, 2014. The increases in common stock and additional paid-in capital were primarily attributable to the issuance of shares under the Employee Stock Purchase Plan and the Stock Bonus Plan, and the periodic expensing of non-cash share-based payments associated with grants under our Equity Incentive Plan and Stock Bonus Plan.
Revenue
Product sales this fiscal year decreased 48 percent to $3,218,616 compared to $6,136,305 for the fiscal year ended March 31, 2014, reflecting a slow domestic market resulting in reduced orders from our customers. Product sales for the fiscal year ended March 31, 2014 increased 4 percent to $6,136,305 compared to $5,910,153 for the fiscal year ended March 31, 2013. The increase is primarily due to increased shipments of PowerPhase HD® and PowerPhase Pro® propulsion systems, partially offset by decreased levels of PowerPhase Select® propulsion systems.
Revenue from contract services decreased $112,767, or 12 percent, to $797,128 for the fiscal year ended March 31, 2015 versus $909,895 for the fiscal year ended March 31, 2014. This was driven by a change in mix of contracts in process during the current fiscal year and by decreased levels of customer funded research activities, which vary from period to period. Revenue from contract services decreased $358,661, or 28 percent, to $909,895 for the fiscal year ended March 31, 2014 versus $1,268,556 for the fiscal year ended March 31, 2013. This was driven by a change in mix of contracts in process during the fiscal year ended March 31, 2014 and by a change in our cumulative estimate of reimbursable rates under a cost-reimbursement type contract which resulted in a decrease in contract services revenue recognized during the fiscal year ended March 31, 2014 of $79,400.
Gross Profit Margin
Gross profit margins on product sales this fiscal year decreased to 35 percent compared to 41 percent for fiscal 2014. The decrease is primarily due to decreased overhead absorption as a result of lower volumes shipped during the current fiscal year. Gross profit margins on product sales for the fiscal year ended March 31, 2014 increased to 41 percent compared to 27 percent for fiscal 2013. The increase is primarily due to favorable changes in product mix and ramp-up costs during the fiscal year ended March 31, 2013 associated with the launch of our PowerPhase HD® propulsion system. Gross profit margins on contract services decreased to nil this fiscal year compared to 18 percent for the fiscal year ended March 31, 2014, reflecting a change in the mix of contracts in process in the current fiscal year. Gross profit margins on contract services for the fiscal year ended March 31, 2014 decreased to 18 percent compared to 44 percent for the fiscal year ended March 31, 2013, reflecting a change in the mix of contracts in process and the change in our cumulative estimate of reimbursable rates noted above.
Costs and Expenses
Research and development expenditures for the fiscal year ended March 31, 2015 were $1,131,159 compared to $219,887 and $96,905 for the fiscal years ended March 31, 2014 and 2013, respectively. Coincident with the contractual end of the DOE Grant on January 12, 2015, we launched and re-deployed resources to several new internally funded projects aimed at developing and significantly improving our product portfolio. This led to the significant increase in research and development expenditures for the fiscal year ended March 31, 2015. The increase in research and development expenditures for the fiscal year ended March 31, 2014 was primarily attributable to increased levels of cost-sharing government research programs.
Production engineering costs were $3,406,923 for the fiscal year ended March 31, 2015 versus $4,644,646 and $4,921,970 for the prior two fiscal years, respectively. With the expiration of the Grant, we re-deployed resources from production engineering activities to several new internally funded research and development activities, which led to a significant reduction in production engineering costs for the current fiscal year. The decrease for the fiscal year ended March 31, 2014 was attributable to decreased levels of product qualification and testing activities.
Reimbursement of costs under the DOE Grant were $1,901,109 versus $3,625,853 and $4,205,678 for each of the two prior fiscal years, respectively. The decrease for the current fiscal is attributable to the expiration of the Grant which occurred during the fourth quarter of the fiscal year. During the fiscal year ended March 31, 2014, we changed our cumulative estimate of reimbursable rates under the Grant which resulted in an increase in our reimbursement recorded for the year of $958,000. Excluding this adjustment, reimbursements recorded during the current fiscal year were 57 percent of production engineering expenditures versus 85 percent for the fiscal year ended March 31, 2013, reflecting a decrease in our estimated reimbursable overhead costs.
21
Selling, general and administrative expenses this fiscal year were $5,337,795 compared to $5,143,864 and $7,022,112 for the fiscal years ended March 31, 2014 and 2013, respectively. The increase this fiscal year is attributable to higher marketing and business development expenses. The decrease for the fiscal year ended March 31, 2014 is attributable to cost reduction efforts implemented in the fourth quarter of fiscal year 2014.
Other
Recovery of impaired assets was zero for the fiscal year ended March 31, 2015 compared to recovery of assets of $868,475 and impairment of assets of $4,980,117 for the fiscal years ended March 31, 2014 and 2013, respectively. During the fiscal year ended March 31, 2014, we recorded a reduction to our accrued import duties liability of $726,640 as a result of the ruling from the Department of Commerce that significantly reduced the amount of duties owed, and we reduced the carrying value of the accrued vendor settlement liability by $141,835, due to settlements with certain vendors during the year which were below the originally estimated amounts. During the fiscal year ended March 31, 2013, we recorded a reserve for impairments as a result of the CODA bankruptcy.
Interest income increased to $12,306 for the current fiscal year compared to $1,787 and $15,743 for the fiscal years ended March 31, 2014 and 2013, respectively. The increase this fiscal year versus fiscal year 2014 is attributable to higher yields on invested cash balances. The decrease for fiscal 2014 compared to fiscal 2013 is attributable to lower yields and lower levels of invested cash balances.
Other income for the fiscal year ended March 31, 2015 was $859,055 versus $7,472 and $3,377 for the fiscal years ended March 31, 2014 and 2013, respectively. The increase for fiscal year 2015 compared to fiscal year 2014 and 2013 is attributable to insurance proceeds recorded under a key-man life insurance policy following the death of one of our executives in the fourth quarter of fiscal year 2015.
Net Loss
As a result, net loss for the fiscal year ended March 31, 2015 was $5,988,530, or $0.15 per common share, compared to a net loss of $2,773,244, or $0.07 per common share, and $10,688,312, or $0.29 per common share, for the fiscal years ended March 31, 2014 and 2013, respectively.
Liquidity and Capital Resources
Our cash balances and liquidity throughout the fiscal year ended March 31, 2015 were adequate to meet operating needs. At March 31, 2015, we had cash and short-term investments of $6,585,703 and working capital of $15,605,555 compared to $10,310,141and $20,052,187at March 31, 2014, respectively.
For the year ended March 31, 2015, net cash used in operating activities was $3,363,094 compared to net cash used in operating activities of $622,732 and $7,259,552 for the years ended March 31, 2014 and 2013, respectively. The increase in cash used in operating activities for the current fiscal year versus fiscal 2014 is primarily attributable to increased net losses due to lower product sales revenue during the current fiscal year and an adjustment recorded last year to our cumulative estimate of reimbursable rates under the Grant which resulted in a one-time pick-up of $958,000. These changes were partially offset by decreased levels of inventory and decreased levels of costs and estimated earnings in excess of billings on uncompleted contracts. The decrease in cash used in operating activities for fiscal 2014 compared to fiscal 2013 is associated with decreased net losses, significantly driven by lower operating costs as a result of a reduction in force and other strategic cost reductions, decreased levels of inventory purchases and decreased levels of accounts receivable, partially offset by decreases in accounts payable and deferred compensation under executive employment agreements.
Net cash used in investing activities for the fiscal year ended March 31, 2015 was $153,127 compared to cash provided by investing activities of $1,348,248 and $114,556 for the fiscal years ended March 31, 2014 and 2013, respectively. The change for the current fiscal year is primarily due to higher levels of net investments in property and equipment during the current year, and proceeds from the sale of our former facility during fiscal 2014. The increase in cash provided for the fiscal year ended March 31, 2014 versus fiscal 2013 was primarily due to cash proceeds from the sale of our former facility, partially offset by decreased levels of net short-term investment maturities versus the prior fiscal year and increased levels of net capital expenditures.
Net cash used in financing activities was $145,188 for the fiscal year ended March 31, 2015 versus cash provided by financing activities of $4,993,697 and $34,955 for the fiscal years ended March 31, 2014 and 2013, respectively. The change in cash provided in the current fiscal year was primarily attributable to the completion of a follow-on offering
22
which resulted in net cash proceeds of $4.9 million during the prior fiscal year. The increase in cash provided in fiscal year 2014 was primarily attributable to proceeds from the follow-on offering
We expect to fund our operations over the next year from existing cash and short-term investment balances, the reduction of inventories and from bank financing, if available. Although we expect to manage our operations and working capital requirements to minimize the future level of operating losses and working capital usage, our working capital requirements may increase in the future. If customer demand accelerates substantially, our working capital requirements may also increase substantially.
If our existing financial resources are not sufficient to execute our business plan, we may issue equity or debt securities in the future, although we cannot assure that we will be able to secure additional capital should it be required to implement our current business plan. In the event financing or equity capital to fund future growth is not available on terms acceptable to us, or at all, we will modify our strategy to align our operations with then available financial resources. Based on our current level of operations, we believe we have sufficient cash and short-term investments to fund our operations for at least the next twelve months.
Contractual Obligations
The following table presents information about our contractual obligations and commitments as of March 31, 2015:
|
Payments due by Period |
||||||||||||||
|
Less Than |
More than |
|||||||||||||
|
Total |
1 Year |
2 - 3 Years |
4 - 5 Years |
5 Years |
||||||||||
|
Purchase obligations |
$ |
329,675 |
$ |
329,675 |
$ |
- |
$ |
- |
$ |
- |
||||
|
Executive employment agreements (1) |
268,357 |
- |
- |
- |
268,357 | |||||||||
|
Total |
$ |
598,032 |
$ |
329,675 |
$ |
- |
$ |
- |
$ |
268,357 | ||||
|
(1) |
Includes severance pay obligations under executive employment agreements contingently payable upon six months’ notice by executive officers of the Company, but not annual cash compensation under the agreements. This is reflected in other long-term liabilities in the accompanying Consolidated Balance Sheets because no executives are expected to retire within the next twelve months. |
|||||||||
Off-Balance Sheet Arrangements
We have no off-balance sheet arrangements.
Critical Accounting Policies and Estimates
The preparation of financial statements and related disclosures in conformity with accounting principles generally accepted in the United States of America requires management to make judgments, assumptions and estimates that affect the dollar values reported in the consolidated financial statements and accompanying notes. Note 1 to our consolidated financial statements describes the significant accounting policies and methods used in preparation of the consolidated financial statements. Estimates are used for, but not limited to, allowance for uncollectible accounts receivables, costs to complete contracts, the recoverability of inventories and the fair value of financial and long-lived assets. Actual results could differ materially from these estimates. The following critical accounting policies are impacted significantly by judgments, assumptions and estimates used in preparation of the consolidated financial statements.
Inventories
We maintain raw material inventories of electronic components, motor parts and other materials to meet our expected manufacturing needs for proprietary products and for products manufactured to the design specifications of our customers. Some of these components may become obsolete or impaired due to bulk purchases in excess of customer requirements. Accordingly, we periodically assesses our raw material inventory for potential impairment of value based on then available information, expectations and estimates and establish impairment reserves as appropriate.
As of March 31, 2015, we had approximately $7.7 million of PowerPhase Pro® inventory originally purchased or manufactured for a former customer who subsequently filed for bankruptcy protection. We evaluate PowerPhase Pro® inventory separately from our other inventory to determine whether the inventory is impaired. We considered the
23
following factors in our evaluation of the need for a reserve of the PowerPhase Pro® inventory as of March 31, 2015, 2014 and 2013:
|
· |
Demand from customers who had purchased the system in the past and the prospects for future purchases. |
|
· |
Potential demand for the system from identified customers who were considering purchasing the system, but had not yet done so. |
|
· |
The potential to identify additional customers for the system who were not currently engaged with the Company in the sales cycle. |
|
· |
Our ability to sell this inventory as is or with only minor modifications. |
|
· |
Our ability to sell the systems at prices above our inventory cost. |
|
· |
The risk of technical obsolescence for the system over the expected selling period. |
We believe the PowerPhase Pro® system is right sized for many medium-duty truck, marine, passenger vehicle and stationary power applications, and this inventory is now being sold to other customers. We have analyzed sales forecasts of current and potential customers for this product and believe that there is sufficient market demand to consume the balance of the PowerPhase Pro® inventory currently on hand. We continue to sell this product at selling prices in excess of inventory cost and believe that we will be able to do so in the future.
During the fiscal years ended March 31, 2015, 2014 and 2013, we recorded inventory impairments for obsolescence other than PowerPhase Pro® inventory of $44,451, $5,047and $8,928, respectively.
It is reasonably possible that future events or changes in circumstances could cause the realizable value of our inventories to decline materially, resulting in material impairment losses.
Accounts Receivable
Our trade accounts receivable are subject to credit risks associated with the financial condition of our customers and their liquidity. We evaluate all customers periodically to assess their financial condition and liquidity and set appropriate credit limits based on this analysis. As a result, the collectability of accounts receivable may change due to changing general economic conditions and factors associated with each customer’s particular business. During the fiscal year ended March 31, 2013, we established an allowance for bad debts of $3,838,092, principally due to the bankruptcy filing of CODA. At March 31, 2015, the accounts receivable balance due from CODA and the associated allowance for bad debts had been written off. In light of current economic conditions, we may need to maintain an allowance for bad debts in the future. It is also reasonably possible that future events or changes in circumstances could cause the realizable value of our trade accounts receivable to decline materially, resulting in material losses.
Percentage of Completion Revenue Recognition on Long-term Contracts: Costs and Estimated Earnings in Excess of Billings on Uncompleted Contracts
We recognize revenue on development projects funded by our customers using the percentage-of-completion method. Under this method, contract services revenue is based on the percentage that costs incurred to date bear to management’s best estimate of the total costs to be incurred to complete the project. Many of these contracts involve the application of our technology to customers’ products and other applications with demanding specifications. Estimated costs for each project are developed by our engineering staff based upon a progression of technical tasks required to attain the project's objectives. These estimates typically include the number of hours of work required by each category of personnel, the cost of subcontracts, materials and components, as well as costs for consultants and project related travel. These estimated costs are reviewed throughout the project and revised quarterly, if necessary, to accurately reflect our best estimate of the remaining costs necessary to complete the project. Management’s best estimates have sometimes been adversely impacted by unexpected technical challenges requiring additional analysis and redesign, failure of electronic components to operate in accordance with manufacturers published performance specifications, unexpected prototype failures requiring the purchase of additional parts, changes in actual overhead costs versus estimated overhead costs and a variety of other factors that may cause unforeseen delays and additional costs. It is reasonably likely that estimated project costs to complete the projects in process at March 31, 2015 could change materially in the future, and any modification of management’s current estimate of total project costs to be incurred could result in material changes in the profitability of affected projects or result in material losses on any affected projects.
Fair Value Measurements and Asset Impairment
Some of our assets and liabilities may be subject to analysis as to whether the asset or liability should be marked to fair value and some assets may be evaluated for potential impairment in value. The determination of fair value for
24
those assets that do not have quoted prices in active markets is highly judgmental. These estimates and judgments may include fair value determinations based upon the extrapolation of quoted prices for similar assets and liabilities in active or inactive markets, for observable items other than the asset or liability itself, for observable items by correlation or other statistical analysis, or from our assumptions about the assumptions market participants would use in valuing an asset or liability when no observable market data is available. Similarly, management evaluates both tangible and intangible assets for potential impairments in value. In conducting this evaluation, management may rely on a number of factors to value anticipated future cash flows including operating results, business plans and present value techniques. Rates used to value and discount cash flows may include assumptions about interest rates and the cost of capital at a point in time. There are inherent uncertainties related to these factors and management’s judgment in applying them to the analysis of asset impairment. Changes in any of the foregoing estimates and assumptions or a change in market conditions could result in a material change in the value of an asset or liability resulting in a material adverse change in our operating results.
ITEM 7A.QUANTITATIVE AND QUALITATIVE DISCLOSURES ABOUT MARKET RISK
Market risk is the potential loss arising from adverse changes in market rates and prices, such as foreign currency exchange and interest rates. One component of interest rate risk involves the short term investment of excess cash in short term, investment grade interest-bearing securities. If there are changes in interest rates, those changes would affect the investment income we earn on these investments and, therefore, impact our cash flows and results of operations, although we expect that the impact would be immaterial. We do not use financial instruments to any degree to manage these risks and do not hold or issue financial instruments for trading purposes. All of our product sales and related receivables are payable in U.S. dollars.
25
This page intentionally left blank
26
ITEM 8.FINANCIAL STATEMENTS AND SUPPLEMENTARY DATA
|
REPORT OF INDEPENDENT REGISTERED PUBLIC ACCOUNTING FIRM |
Board of Directors and Shareholders
UQM Technologies, Inc.
We have audited the accompanying consolidated balance sheets of UQM Technologies, Inc. (a Colorado corporation) and subsidiaries (the “Company”) as of March 31, 2015 and 2014, and the related consolidated statements of operations, stockholders’ equity, and cash flows for each of the three years in the period ended March 31, 2015. These financial statements are the responsibility of the Company’s management. Our responsibility is to express an opinion on these financial statements based on our audits.
We conducted our audits in accordance with the standards of the Public Company Accounting Oversight Board (United States). Those standards require that we plan and perform the audit to obtain reasonable assurance about whether the financial statements are free of material misstatement. We were not engaged to perform an audit of the Company’s internal control over financial reporting. Our audits included consideration of internal control over financial reporting as a basis for designing audit procedures that are appropriate in the circumstances, but not for the purpose of expressing an opinion on the effectiveness of the Company’s internal control over financial reporting. Accordingly, we express no such opinion. An audit also includes examining, on a test basis, evidence supporting the amounts and disclosures in the financial statements, assessing the accounting principles used and significant estimates made by management, as well as evaluating the overall financial statement presentation. We believe that our audits provide a reasonable basis for our opinion.
In our opinion, the consolidated financial statements referred to above present fairly, in all material respects, the financial position of UQM Technologies, Inc. and subsidiaries as of March 31, 2015 and 2014, and the results of their operations and their cash flows for each of the three years in the period ended March 31, 2015, in conformity with accounting principles generally accepted in the United States of America.
/s/ GRANT THORNTON LLP
Denver, Colorado
May 28, 2015
27
UQM TECHNOLOGIES, INC. AND SUBSIDIARIES
Consolidated Balance Sheets
|
March 31, 2015 |
March 31, 2014 |
||||
|
Assets |
|||||
|
Current assets: |
|||||
|
Cash and cash equivalents |
$ |
6,585,703 |
$ |
10,247,112 | |
|
Short-term investments |
- |
63,029 | |||
|
Accounts receivable |
522,417 | 960,419 | |||
|
Other receivable |
855,000 |
- |
|||
|
Costs and estimated earnings in excess of billings on |
|||||
|
uncompleted contracts |
49,917 | 341,255 | |||
|
Inventories |
9,354,053 | 10,054,422 | |||
|
Prepaid expenses and other current assets |
266,448 | 263,988 | |||
|
Total current assets |
17,633,538 | 21,930,225 | |||
|
Property and equipment, at cost: |
|||||
|
Land |
1,683,330 | 1,683,330 | |||
|
Building |
4,516,301 | 4,516,301 | |||
|
Machinery and equipment |
7,037,200 | 7,706,066 | |||
| 13,236,831 | 13,905,697 | ||||
|
Less accumulated depreciation |
(6,410,242) | (6,337,924) | |||
|
Net property and equipment |
6,826,589 | 7,567,773 | |||
|
Patent costs, net of accumulated amortization of $895,227 and $878,707, |
|||||
|
respectively |
239,043 | 227,015 | |||
|
Trademark costs, net of accumulated amortization of $73,018 and $68,718, |
|||||
|
respectively |
102,823 | 107,123 | |||
|
Other assets |
- |
2,997 | |||
|
Total assets |
$ |
24,801,993 |
$ |
29,835,133 | |
See accompanying notes to consolidated financial statements.
28
UQM TECHNOLOGIES, INC. AND SUBSIDIARIES
Consolidated Balance Sheets, Continued
|
March 31, 2015 |
March 31, 2014 |
||||
|
Liabilities and Stockholders’ Equity |
|||||
|
Current liabilities: |
|||||
|
Accounts payable |
$ |
398,568 |
$ |
386,293 | |
|
Other current liabilities |
1,544,971 | 1,491,745 | |||
|
Billings in excess of costs and estimated earnings on |
|||||
|
uncompleted contracts |
84,444 |
- |
|||
|
Total current liabilities |
2,027,983 | 1,878,038 | |||
|
Other long-term liabilities |
445,024 | 182,100 | |||
|
Total liabilities |
2,473,007 | 2,060,138 | |||
|
Commitments and contingencies |
|||||
|
Stockholders’ equity: |
|||||
|
Common stock, $0.01 par value, 50,000,000 shares |
|||||
|
authorized; 39,999,984 and 39,777,767 shares |
|||||
|
issued and outstanding, respectively |
400,000 | 397,778 | |||
|
Additional paid-in capital |
121,866,061 | 121,325,762 | |||
|
Accumulated deficit |
(99,937,075) | (93,948,545) | |||
|
Total stockholders’ equity |
22,328,986 | 27,774,995 | |||
|
Total liabilities and stockholders’ equity |
$ |
24,801,993 |
$ |
29,835,133 | |
See accompanying notes to consolidated financial statements.
29
UQM TECHNOLOGIES, INC. AND SUBSIDIARIES
Consolidated Statements of Operations
|
Year Ended |
Year Ended |
Year Ended |
|||||||
|
March 31, 2015 |
March 31, 2014 |
March 31, 2013 |
|||||||
|
Revenue: |
|||||||||
|
Product sales |
$ |
3,218,616 |
$ |
6,136,305 |
$ |
5,910,153 | |||
|
Contract services |
797,128 | 909,895 | 1,268,556 | ||||||
| 4,015,744 | 7,046,200 | 7,178,709 | |||||||
|
Operating costs and expenses: |
|||||||||
|
Costs of product sales |
2,101,610 | 3,609,028 | 4,333,005 | ||||||
|
Costs of contract services |
798,038 | 743,068 | 715,225 | ||||||
|
Research and development |
1,131,159 | 219,887 | 96,905 | ||||||
|
Production engineering |
3,406,923 | 4,644,646 | 4,921,970 | ||||||
|
Reimbursement of costs under DOE grant |
(1,901,109) | (3,625,853) | (4,205,678) | ||||||
|
Selling, general and administrative |
5,337,795 | 5,143,864 | 7,022,112 | ||||||
|
(Recovery) impairment of assets |
- |
(868,475) | 4,980,117 | ||||||
|
(Gain) loss on disposal of long-lived assets |
1,219 | (37,462) | 22,485 | ||||||
| 10,875,635 | 9,828,703 | 17,886,141 | |||||||
|
Loss before other income |
(6,859,891) | (2,782,503) | (10,707,432) | ||||||
|
Other income: |
|||||||||
|
Interest income |
12,306 | 1,787 | 15,743 | ||||||
|
Other |
859,055 | 7,472 | 3,377 | ||||||
| 871,361 | 9,259 | 19,120 | |||||||
|
Net loss |
$ |
(5,988,530) |
$ |
(2,773,244) |
$ |
(10,688,312) | |||
|
Net loss per common share - basic and diluted |
$ |
(0.15) |
$ |
(0.07) |
$ |
(0.29) | |||
|
Weighted average number of shares |
|||||||||
|
of common stock outstanding - |
|||||||||
|
basic and diluted |
39,940,795 | 37,253,066 | 36,564,952 | ||||||
See accompanying notes to consolidated financial statements.
30
UQM TECHNOLOGIES, INC. AND SUBSIDIARIES
Consolidated Statements of Stockholders’ Equity
|
Number of |
|||||||||||||
|
common |
Additional |
Total |
|||||||||||
|
shares |
Common |
paid-in |
Accumulated |
stockholders’ |
|||||||||
|
issued |
stock |
capital |
deficit |
equity |
|||||||||
|
Balances at April 1, 2012 |
36,356,177 |
$ |
363,562 |
$ |
114,371,106 |
$ |
(80,486,989) |
$ |
34,247,679 | ||||
|
Issuance of common stock under |
|||||||||||||
|
employee stock purchase plan |
85,550 | 855 | 74,530 |
- |
75,385 | ||||||||
|
Purchase of treasury stock |
(41,321) | (413) | (40,017) |
- |
(40,430) | ||||||||
|
Issuance of common stock under |
|||||||||||||
|
stock bonus plan |
263,691 | 2,637 | 145,115 |
- |
147,752 | ||||||||
|
Compensation expense from |
|||||||||||||
|
employee and director stock |
|||||||||||||
|
option and common stock grants |
- |
- |
1,022,597 |
- |
1,022,597 | ||||||||
|
Net loss |
- |
- |
- |
(10,688,312) | (10,688,312) | ||||||||
|
Balances at March 31, 2013 |
36,664,097 |
$ |
366,641 |
$ |
115,573,331 |
$ |
(91,175,301) |
$ |
24,764,671 | ||||
|
Issuance of common stock under |
|||||||||||||
|
employee stock purchase plan |
62,421 | 624 | 60,065 |
- |
60,689 | ||||||||
|
Issuance of common stock in follow-on |
|||||||||||||
|
offering, net of offering costs |
2,864,872 | 28,649 | 4,883,284 |
- |
4,911,933 | ||||||||
|
Issuance of common stock under |
|||||||||||||
|
stock bonus plan |
166,231 | 1,663 | 34,836 |
- |
36,499 | ||||||||
|
Issuance of common stock upon exercise |
|||||||||||||
|
of employee options |
20,146 | 201 | 20,874 |
- |
21,075 | ||||||||
|
Compensation expense from |
|||||||||||||
|
employee and director stock |
|||||||||||||
|
option and common stock grants |
- |
- |
753,372 |
- |
753,372 | ||||||||
|
Net loss |
- |
- |
- |
(2,773,244) | (2,773,244) | ||||||||
|
Balances at March 31, 2014 |
39,777,767 |
$ |
397,778 |
$ |
121,325,762 |
$ |
(93,948,545) |
$ |
27,774,995 | ||||
|
Issuance of common stock under |
|||||||||||||
|
employee stock purchase plan |
12,052 | 120 | 21,935 |
- |
22,055 | ||||||||
|
Issuance of common stock under |
|||||||||||||
|
stock bonus plan |
288,051 | 2,881 | 29,563 |
- |
32,444 | ||||||||
|
Issuance of common stock upon exercise |
|||||||||||||
|
of employee options |
5,053 | 50 | 4,447 |
- |
4,497 | ||||||||
|
Retirement of vested shares |
(82,939) | (829) | (170,911) |
- |
(171,740) | ||||||||
|
Compensation expense from |
|||||||||||||
|
employee and director stock |
|||||||||||||
|
option and common stock grants |
- |
- |
655,265 |
- |
655,265 | ||||||||
|
Net loss |
- |
- |
- |
(5,988,530) | (5,988,530) | ||||||||
|
Balances at March 31, 2015 |
39,999,984 |
$ |
400,000 |
$ |
121,866,061 |
$ |
(99,937,075) |
$ |
22,328,986 | ||||
See accompanying notes to consolidated financial statements.
31
Table of Contents
UQM TECHNOLOGIES, INC. AND SUBSIDIARIES
Consolidated Statements of Cash Flows
|
Year Ended |
Year Ended |
Year Ended |
|||||||
|
March 31, 2015 |
March 31, 2014 |
March 31, 2013 |
|||||||
|
Cash flows from operating activities: |
|||||||||
|
Net loss |
$ |
(5,988,530) |
$ |
(2,773,244) |
$ |
(10,688,312) | |||
|
Adjustments to reconcile net loss to net cash used in |
|||||||||
|
operating activities: |
|||||||||
|
Depreciation and amortization |
1,061,312 | 1,136,021 | 1,252,834 | ||||||
|
Non-cash equity based compensation |
687,709 | 789,871 | 1,170,349 | ||||||
|
(Recovery) impairment of assets |
- |
(868,475) | 4,980,117 | ||||||
|
(Gain) loss on disposal of long-lived assets |
1,219 | (37,462) | 22,485 | ||||||
|
Impairment of inventories |
44,451 | 5,047 | 8,928 | ||||||
|
Change in operating assets and liabilities: |
|||||||||
|
Accounts receivable |
328,080 | 1,218,971 | (1,099,813) | ||||||
|
Other receivable |
(855,000) |
- |
- |
||||||
|
Costs and estimated earnings on uncompleted contracts |
291,338 | (162,991) | (99,888) | ||||||
|
Inventories |
655,918 | 938,992 | (1,796,309) | ||||||
|
Prepaid expenses and other current assets |
(2,460) | 45,969 | 135,758 | ||||||
|
Accounts payable and other current liabilities |
65,501 | (470,119) | (1,050,805) | ||||||
|
Billings in excess of costs and estimated earnings on |
|||||||||
|
uncompleted contracts |
84,444 |
- |
(7,201) | ||||||
|
Other long-term liabilities |
262,924 | (445,312) | (87,695) | ||||||
|
Net cash used in operating activities |
(3,363,094) | (622,732) | (7,259,552) | ||||||
|
Cash flows from investing activities: |
|||||||||
|
Purchases of short-term investments |
- |
(593) | (245,950) | ||||||
|
Maturities of short-term investments |
63,029 |
- |
728,859 | ||||||
|
Increase in other long-term assets |
- |
- |
(583) | ||||||
|
Acquisition of property and equipment |
(558,755) | (377,224) | (561,669) | ||||||
|
Property and equipment reimbursements received from DOE |
|||||||||
|
under grant |
371,140 | 215,754 | 208,032 | ||||||
|
Increase in patent and trademark costs |
(28,541) | (54,721) | (14,158) | ||||||
|
Cash proceeds from the sale of building and equipment |
- |
1,565,032 | 25 | ||||||
|
Net cash (used in) provided by investing activities |
(153,127) | 1,348,248 | 114,556 | ||||||
|
See accompanying notes to consolidated financial statements. |
|||||||||
32
UQM TECHNOLOGIES, INC. AND SUBSIDIARIES
Consolidated Statements of Cash Flows, Continued
|
Year Ended |
Year Ended |
Year Ended |
|||||||
|
March 31, 2015 |
March 31, 2014 |
March 31, 2013 |
|||||||
|
Cash flows from financing activities: |
|||||||||
|
Issuance of common stock upon exercise of employee stock options |
4,497 | 21,075 |
- |
||||||
|
Issuance of common stock under employee stock purchase plan |
22,055 | 60,689 | 75,385 | ||||||
|
Issuance of common stock in follow-on offering, |
|||||||||
|
net of offering costs |
- |
4,911,933 |
- |
||||||
|
Cash paid for retirement of vested shares |
(171,740) |
- |
(40,430) | ||||||
|
Net cash (used in) provided by financing activities |
(145,188) | 4,993,697 | 34,955 | ||||||
|
Increase (decrease) in cash and cash equivalents |
(3,661,409) | 5,719,213 | (7,110,041) | ||||||
|
Cash and cash equivalents at beginning of period |
10,247,112 | 4,527,899 | 11,637,940 | ||||||
|
Cash and cash equivalents at end of period |
$ |
6,585,703 |
$ |
10,247,112 |
$ |
4,527,899 | |||
|
See accompanying notes to consolidated financial statements. |
|||||||||
33
UQM TECHNOLOGIES, INC. AND SUBSIDIARIES
Notes to Consolidated Financial Statements
(1) Summary of Significant Accounting Policies
(a) Description of Business
UQM Technologies, Inc. and our wholly-owned subsidiaries are engaged in the research, development and manufacture of permanent magnet electric motors and the electronic controls for such motors. Our facility is located in Longmont, Colorado. Our revenue is derived primarily from product sales to customers in the commercial truck, bus, automotive, marine and military markets, and from contract research and development services. We are impacted by other factors such as the continued receipt of contracts from industrial and governmental parties, our ability to protect and maintain the proprietary nature of our technology, continued product and technological advances and our ability, together with our partners, to commercialize our products and technology.
(b) Principles of Consolidation
The consolidated financial statements include the accounts of UQM Technologies, Inc. and those of all majority-owned or controlled subsidiaries. All intercompany accounts and transactions have been eliminated in consolidation.
(c) Cash and Cash Equivalents and Short-term Investments
We consider cash on hand and investments with original maturities of three months or less to be cash and cash equivalents. Investments with original maturities of greater than three months and less than one year from the balance sheet date are classified as short-term.
We limit our cash and cash equivalents and investments to high quality financial institutions in order to minimize our credit risk. We maintain cash and cash equivalent balances with financial institutions that exceed federally insured limits. We have not experienced any losses related to these balances and management believes our credit risk to be minimal.
(d) Investments
We have an investment policy approved by the Board of Directors that governs the quality, acceptability and dollar concentration of our investments. Under the policy, we may invest in marketable securities consisting primarily of commercial paper, asset-backed and mortgage-backed notes and bank certificates of deposits with original maturities beyond three months. All marketable securities are held in our name at two major financial institutions that hold custody of the investments. All of our investments are held-to-maturity investments as we have the positive intent and ability to hold until maturity. These securities are recorded at amortized cost.
We had no investments outstanding as of March 31, 2015. The amortized cost and unrealized gain or loss on our investments at March 31, 2014 was $63,029 and zero, respectively.
34
UQM TECHNOLOGIES, INC. AND SUBSIDIARIES
Notes to Consolidated Financial Statements, Continued
(e) Accounts Receivables
We extend unsecured credit to many of our customers following a review of the customers’ financial condition and credit history. Our sales are conducted through acceptance of customer purchase orders or in some cases through supply agreements. For credit qualified customers, our standard terms are net 30 days. For international customers without an adequate credit rating, our typical terms are irrevocable letter of credit or cash payment in advance of delivery. We establish an allowance for uncollectable accounts based upon a number of factors including the length of time trade receivables are past due, the customer’s ability to pay its obligation to us, the condition of the general economy, estimates of credit risk, historical trends and other information. We write off accounts receivable when they become uncollectible against our allowance for doubtful accounts receivable. At both March 31, 2015 and 2014, we had no an allowance for doubtful accounts receivable. The following represents activity under our allowance for doubtful accounts receivable for the fiscal years ended March 31, 2015, 2014 and 2013:
|
Additions |
|||||||||||||||
|
Balance at |
Charged to |
Charged to |
|||||||||||||
|
Beginning |
Costs and |
Other |
Balance at |
||||||||||||
|
of Year |
Expenses |
Accounts |
Deductions |
End of Year |
|||||||||||
|
Year ended March 31, 2015 |
|||||||||||||||
|
Allowance for doubtful accounts- deducted |
|||||||||||||||
|
from accounts receivable |
$ |
- |
- |
- |
- |
$ |
- |
||||||||
|
Year ended March 31, 2014 |
|||||||||||||||
|
Allowance for doubtful accounts- deducted |
|||||||||||||||
|
from accounts receivable |
$ |
3,838,092 |
- |
- |
3,838,092 |
$ |
- |
||||||||
|
Year ended March 31, 2013 |
|||||||||||||||
|
Allowance for doubtful accounts- deducted |
- |
||||||||||||||
|
from accounts receivable |
$ |
127,697 | 3,838,092 |
- |
127,697 |
$ |
3,838,092 | ||||||||
(f) Inventories
Inventories are stated at the lower of cost or market. Cost is determined by the first-in, first-out method. We analyze slow-moving and excess inventory on a periodic basis and we charge directly to expense obsolete inventory items during the period we assess the value of such inventory to be impaired. For the fiscal years ended March 31, 2015, 2014 and 2013, we impaired inventory of $44,451, $5,047 and $8,928, respectively.
(g) Property and Equipment
Property and equipment are stated at cost, unless the asset was acquired, in part, with U.S. Department of Energy (“DOE”) grant funds, in which case it is stated at cost net of DOE reimbursements. Depreciation is computed using the straight-line method over the estimated useful lives of the assets, which range from three to five years, except for buildings, which are depreciated over 27.5 years. Maintenance and repairs are charged to expense as incurred. Depreciation expense for the fiscal years ended March 31, 2015, 2014 and 2013 was $1,040,499, $1,098,622 and $1,218,812, respectively, and was reported in operating costs and expenses on the Consolidated Statements of Operations.
(h) Patent and Trademark Costs
Patent and trademark costs consist primarily of legal expenses, and represent those costs incurred by us for the filing of patent and trademark applications. Amortization of patent and trademark costs is computed using the straight-line method over the estimated useful life of the asset, typically 13 years for patents, and 40 years for trademarks. Amortization expense for the fiscal years ended March 31, 2015, 2014 and 2013 was $20,813, $37,399, and $34,022, respectively.
(i) Impairment of Long-Lived Assets
35
UQM TECHNOLOGIES, INC. AND SUBSIDIARIES
Notes to Consolidated Financial Statements, Continued
We periodically evaluate whether circumstances or events have affected the recoverability of long-lived assets including intangible assets with finite useful lives. The assessment of possible impairment is based on our ability to recover the carrying value of the asset or groups of assets from expected future cash flows (undiscounted and without interest charges) estimated by management. If expected future cash flows are less than the carrying value, an impairment loss is recognized to adjust the asset to fair value as determined by expected discounted future cash flows.
(j) Product Warranties
Our warranty policy generally provides three months to three years of coverage depending on the product. We record a liability for estimated warranty obligations at the date products are sold. The estimated cost of warranty coverage is based on our actual historical experience with our current products or similar products. For new products, the required reserve is based on historical experience of similar products until sufficient historical data has been collected on the new product. Adjustments are made as new information becomes available. The following is a summary of warranty activity for the fiscal years ended March 31, 2015, 2014 and 2013:
|
Additions |
|||||||||||||||
|
Balance at |
Charged to |
Charged to |
|||||||||||||
|
Beginning |
Costs and |
Other |
Balance at |
||||||||||||
|
of Year |
Expenses |
Accounts |
Deductions |
End of Year |
|||||||||||
|
Year ended March 31, 2015 |
|||||||||||||||
|
Accrued warranty cost |
$ |
175,661 | 73,678 |
- |
64,419 |
(A) |
$ |
184,920 | |||||||
|
Year ended March 31, 2014 |
|||||||||||||||
|
Accrued warranty cost |
$ |
77,393 | 164,567 |
- |
66,299 |
(A) |
$ |
175,661 | |||||||
|
Year ended March 31, 2013 |
|||||||||||||||
|
Accrued warranty cost |
$ |
154,978 | 58,676 |
- |
136,261 |
(A) |
$ |
77,393 | |||||||
|
Note (A) Represents actual warranty payments for units covered under warranty |
|||||||||||||||
(k) Revenue and Cost Recognition
Revenue from sales of products is generally recognized at the time title to the goods and the benefits and risks of ownership passes to the customer, which is typically when products are shipped based on the terms of the customer purchase agreement.
Revenue relating to long-term fixed price contracts is recognized using the percentage of completion method. Under the percentage of completion method, contract revenues and related costs are recognized based on the percentage that costs incurred to date bear to total estimated costs. Changes in job performance, estimated profitability and final contract settlements may result in revisions to cost and revenue, and are recognized in the period in which the revisions are determined. Contract costs include all direct materials, subcontract and labor costs and other indirect costs. Selling, general and administrative costs are charged to expense as incurred. At the time a loss on a contract becomes known, the entire amount of the estimated loss is accrued.
The aggregate of costs incurred and estimated earnings recognized on uncompleted contracts in excess of related billings is shown as a current asset, and billings on uncompleted contracts in excess of costs incurred and estimated earnings is shown as a current liability.
(l) Government Grants
The Company recognizes revenue and cost reimbursements from government grants when it is probable that the Company will comply with the conditions attached to the grant arrangement and the grant proceeds will be received. Government grants are recognized in the Consolidated Statements of Operations on a systematic basis over the periods in which the Company recognizes the related costs for which the government grant is intended to compensate. Specifically, when government grants are related to reimbursements for cost of revenues or operating expenses, the government grants are recognized as a reduction of the related expense in the
36
UQM TECHNOLOGIES, INC. AND SUBSIDIARIES
Notes to Consolidated Financial Statements, Continued
Consolidated Statements of Operations. For government grants related to reimbursements of capital expenditures, the government grants are recognized as a reduction of the basis of the asset and recognized in the Consolidated Statements of Operations over the estimated useful life of the depreciable asset as reduced depreciation expense.
The Company records government grants receivable in the Consolidated Balance Sheets in accounts receivable.
(m) Income Taxes
The Company accounts for income taxes under the asset and liability method. Deferred tax assets and liabilities are recognized for the future tax consequences attributable to differences between the financial statement carrying amounts of existing assets and liabilities and their respective tax basis and operating loss and tax credit carry-forwards. Deferred tax assets and liabilities are measured using enacted tax rates expected to apply to taxable income in the years in which those temporary differences are expected to be recovered or settled. The valuation of deferred tax assets may be reduced if future realization is not assured. The effect of a change in tax rates on deferred tax assets and liabilities is recognized in income tax expense or benefit in the period that includes the enactment date. The Company has unexpired net operating losses and research and development credits carrying forward into current years that date from the tax year 1999 and 2001, respectively. As such, all federal tax returns from 1999 to the present are subject to audit.
(n) Research and Development
Costs of researching and developing new technology, or significantly altering existing technology, are expensed as incurred.
(o) Loss Per Common Share
The following table sets forth the computation of basic and diluted net loss per share for the fiscal years ended March 31, 2015, 2014 and 2013:
|
Year Ended |
Year Ended |
Year Ended |
|||||||
|
March 31, 2015 |
March 31, 2014 |
March 31, 2013 |
|||||||
|
Numerator: |
|||||||||
|
Net loss |
$ |
(5,988,530) |
$ |
(2,773,244) |
$ |
(10,688,312) | |||
|
Denominator for basic and diluted net loss per common |
|||||||||
|
share: |
|||||||||
|
Weighted average number of shares of common |
|||||||||
|
stock outstanding - basic and diluted |
39,940,795 | 37,253,066 | 36,564,952 | ||||||
|
Net loss per common share - basic and diluted |
$ |
(0.15) |
$ |
(0.07) |
$ |
(0.29) | |||
The following table sets forth the potential shares of common stock that are not included in the calculation of diluted net loss per share because to do so would be anti-dilutive as of the end of each period presented:
|
March 31, |
|||||||||
|
2015 |
2014 |
2013 |
|||||||
|
Non-vested stock bonus plan shares |
432,039 | 640,979 | 358,855 | ||||||
|
Stock options outstanding |
3,006,009 | 3,342,627 | 4,282,001 | ||||||
|
Warrants to purchase common stock |
1,489,733 | 1,489,733 |
- |
||||||
37
UQM TECHNOLOGIES, INC. AND SUBSIDIARIES
Notes to Consolidated Financial Statements, Continued
(p) Use of Estimates
The preparation of financial statements in conformity with accounting principles generally accepted in the United States of America requires management to make estimates and assumptions that affect the reported amounts of assets and liabilities and disclosure of contingent assets and liabilities at the date of the financial statements and the reported amounts of revenue and expenses during the reporting period. Actual results could differ from those estimates.
(q) New Accounting Pronouncements
In May 2014, the Financial Accounting Standards Board (“FASB”) issued a new standard to achieve a consistent application of revenue recognition within the U.S., resulting in a single revenue model to be applied by reporting companies under U.S. generally accepted accounting principles. Under the new model, recognition of revenue occurs when a customer obtains control of promised goods or services in an amount that reflects the consideration to which the entity expects to be entitled in exchange for those goods or services. In addition, the new standard requires that reporting companies disclose the nature, amount, timing, and uncertainty of revenue and cash flows arising from contracts with customers. The new standard is effective for us beginning in the first quarter of fiscal year 2018; early adoption is prohibited. The new standard is required to be applied retrospectively to each prior reporting period presented or retrospectively with the cumulative effect of initially applying it recognized at the date of initial application. We are in the process of determining the impact on our financial statements.
In August 2014, the FASB issued guidance on determining when and how to disclose going-concern uncertainties in the financial statements. The new standard provides guidance around management's responsibility to evaluate whether there is substantial doubt about an entity's ability to continue as a going concern and to provide related footnote disclosures. The new guidance applies to all entities and is effective for annual periods ending after December 15, 2016, and interim periods thereafter, with early adoption permitted. We expect the new standard to increase the disclosures we provide regarding our liquidity and cash obligations.
(2) Costs and Estimated Earnings in Excess of Billings on Uncompleted Contracts and Billings in Excess of Costs and Estimated Earnings on Uncompleted Contracts
At March 31, 2015 and March 31, 2014, the estimated period to complete contracts in process ranged from one to thirteen months and one to twenty-one months, respectively. We expect to collect all accounts receivable arising from these contracts within sixty days of billing.
The following summarizes contracts in process:
|
March 31, 2015 |
March 31, 2014 |
||||||
|
Costs incurred on uncompleted contracts |
$ |
2,327,816 |
$ |
1,549,313 | |||
|
Estimated earnings |
626,075 | 670,596 | |||||
| 2,953,891 | 2,219,909 | ||||||
|
Less billings to date |
(2,988,418) | (1,878,654) | |||||
|
Contracts in process |
$ |
(34,527) |
$ |
341,255 | |||
|
Included in the accompanying balance sheets as follows: |
|||||||
|
Costs and estimated earnings in excess of billings |
|||||||
|
on uncompleted contracts |
$ |
49,917 |
$ |
341,255 | |||
|
Billings in excess of costs and estimated earnings |
|||||||
|
on uncompleted contracts |
(84,444) |
- |
|||||
|
Contracts in process |
$ |
(34,527) |
$ |
341,255 | |||
38
UQM TECHNOLOGIES, INC. AND SUBSIDIARIES
Notes to Consolidated Financial Statements, Continued
(3) Inventories
Inventories consist of:
|
March 31, 2015 |
March 31, 2014 |
|||||
|
Raw materials |
$ |
7,261,568 |
$ |
7,537,189 | ||
|
Work-in-process |
25,842 | 84,178 | ||||
|
Finished products |
2,066,643 | 2,433,055 | ||||
|
$ |
9,354,053 |
$ |
10,054,422 | |||
(4) Patents and Trademarks
Patents owned by the Company had a gross carrying amount of $1,134,270 and $1,105,722, accumulated amortization of $895,227 and $878,707, and a net carrying amount of $239,043 and $227,015, at March 31, 2015 and 2014, respectively. Trademarks owned by the Company had a gross carrying amount of $175,841 and $175,841, accumulated amortization of $73,018 and $68,718, and a net carrying value of $102,823 and $107,123 at March 31, 2015 and 2014, respectively. Patents and trademarks are amortized on a straight-line basis over the estimated useful life of the asset. The weighted-average period of amortization is 13 years for patents, and 40 years for trademarks.
Estimated future amortization of these intangible assets by fiscal year is as follows:
|
Patents |
Trademarks |
||||
|
2016 |
$ |
14,867 |
$ |
4,299 | |
|
2017 |
13,212 | 4,299 | |||
|
2018 |
13,212 | 4,299 | |||
|
2019 |
12,871 | 4,299 | |||
|
2020 |
9,991 | 4,299 | |||
|
Thereafter |
174,890 | 81,328 | |||
|
$ |
239,043 |
$ |
102,823 | ||
(5) Government Grant
We had a grant (the “Grant”) with the DOE under the American Recovery and Reinvestment Act. The Grant provided funds to facilitate the manufacture and deployment of electric drive vehicles, batteries and electric drive vehicle components in the United States. Under the terms of the Agreement, the DOE reimbursed us for 50 percent of qualifying costs for the purchase of facilities, tooling and manufacturing equipment, and for engineering related to product qualification and testing of our electric propulsion systems and other products. The Grant ended on January 12, 2015.
The Grant was also subject to our compliance with certain reporting requirements. The American Recovery and Reinvestment Act imposed minimum construction wages and labor standards for projects funded by the Grant. If we dispose of assets acquired using Grant funding, we may be required to reimburse the DOE upon such sale date if the fair value of the asset on the date of disposition exceeds $5,000. The amount of any such reimbursement shall be equal to 50 percent of the fair value of the asset on the date of disposition.
At March 31, 2015, we had received reimbursements from the DOE under the Grant totaling approximately $27.1 million.
The application of grant funds to the recorded value of eligible capital asset purchases under the Grant as of March 31, 2015 and March 31, 2014 are as follows:
39
UQM TECHNOLOGIES, INC. AND SUBSIDIARIES
Notes to Consolidated Financial Statements, Continued
|
March 31, 2015 |
|||||||||
|
Purchase Cost |
Grant Funding |
Recorded Value |
|||||||
|
Land |
$ |
896,388 |
$ |
448,194 |
$ |
448,194 | |||
|
Building |
9,906,736 | 4,953,368 | 4,953,368 | ||||||
|
Machinery and equipment |
8,462,961 | 4,231,480 | 4,231,481 | ||||||
|
$ |
19,266,085 |
$ |
9,633,042 |
$ |
9,633,043 | ||||
|
March 31, 2014 |
|||||||||
|
Purchase Cost |
Grant Funding |
Recorded Value |
|||||||
|
Land |
$ |
896,388 |
$ |
448,194 |
$ |
448,194 | |||
|
Building |
9,906,736 | 4,953,368 | 4,953,368 | ||||||
|
Machinery and equipment |
7,946,910 | 3,973,455 | 3,973,455 | ||||||
|
$ |
18,750,034 |
$ |
9,375,017 |
$ |
9,375,017 | ||||
(6) Other Current Liabilities
Other current liabilities consist of:
|
March 31, 2015 |
March 31, 2014 |
|||||
|
Accrued payroll and employee benefits |
$ |
183,245 |
$ |
164,334 | ||
|
Accrued personal property and real estate taxes |
208,162 | 227,022 | ||||
|
Accrued warranty costs |
184,920 | 175,661 | ||||
|
Unearned revenue |
37,000 | 5,416 | ||||
|
Accrued royalties |
48,336 | 48,336 | ||||
|
Accrued import duties |
87,100 | 87,100 | ||||
|
Accrued vendor settlements |
774,974 | 774,974 | ||||
|
Other |
21,234 | 8,902 | ||||
|
$ |
1,544,971 |
$ |
1,491,745 | |||
(7) Commitments and Contingencies
Employment Agreements
The Company has entered into employment agreements with five of its officers for a term expiring on August 31, 2015. The aggregate future base salary payable to the executive officers over their remaining terms is $533,750. In addition, we have recorded a liability of $268,357 and $182,100 at March 31, 2015 and March 31, 2014, respectively, representing the potential future compensation payable under the retirement and voluntary termination provisions of the employment agreements of the Company’s current officers. The value of the liability was determined using a discounted cash flow model with a discount rate of 14 percent. A 1 percent change in this discount rate would result in approximately a $1,700 change in the recorded value of the liability as of March 31, 2015.
The employment agreements provide for severance payments under the conditions and for the amounts specified in the agreements.
Lease Commitments
At March 31, 2015, there were no operating leases and there was no rental expense during the years ended March 31, 2015, 2014 and 2013.
40
UQM TECHNOLOGIES, INC. AND SUBSIDIARIES
Notes to Consolidated Financial Statements, Continued
Litigation
We are involved in various claims and legal actions arising in the ordinary course of business. In the opinion of management, and based on current available information, the ultimate disposition of these matters is not expected to have a material adverse effect on our financial position, results of operations or cash flow.
(8) Fair Value of Financial Instruments
The carrying amounts of cash and cash equivalents, accounts receivable and accounts payable approximate fair value because of the short maturity of these instruments. The carrying value of investments is the amortized cost of the investments which approximates fair value.
(9) Stockholders’ Equity
In February, 2014, we completed a follow-on offering consisting of 2,864,872 shares of our common stock, and common stock purchase warrants to purchase 1,432,436 shares of our common stock. The warrants have an exercise price of $2.1275 per whole share of common stock and are exercisable on or after August 6, 2014 and on or before August 5, 2018. In addition, the placement agent was issued warrants to purchase 57,297 shares of common stock, on substantially the same terms as the warrants issued to the purchasers. Cash proceeds, net of offering costs, were $4,911,933. The fair value of the warrants at the time of issuance was $1,832,943, and was recorded as additional paid-in capital. This fair value was determined using the Black-Scholes option pricing model with the following assumptions: a term of four and a half years, risk-free interest rate of 1.5%, volatility of 78.3%, and dividend yield of zero. Warrants to acquire 1,489,733 shares of our common stock were outstanding at both March 31, 2015 and 2014.
(10) Stock-Based Compensation
Stock Option Plans
As of March 31, 2015, we had 2,100,000 shares of common stock authorized and 723,002 shares of common stock available for future grant to employees and consultants under our 2012 Equity Incentive Plan (“Plan”). The term of the 2012 Plan is ten years. Under the 2012 Plan, the exercise price of each option is set at the fair value of the common stock on the date of grant and the maximum term of the option is ten years from the date of grant. Options granted to employees generally have a ten year term and vest ratably over a three-year period. The maximum number of options that may be granted to an employee under the Plan in any calendar year is 500,000 options. Forfeitures under the Plan are available for re-issuance at any time prior to expiration of the Plan in 2022. Options granted under the Plan to employees require the option holder to abide by certain Company policies, which restrict their ability to sell the underlying common stock. Prior to the adoption of the 2012 Plan, we issued stock options under our 2002 Equity Incentive Plan. Forfeitures under the 2002 Equity Incentive Plan may not be re-issued.
We also have a Stock Option Plan for Non-Employee Directors (“Directors Plan”) pursuant to which Directors may elect to receive stock options in lieu of cash compensation for their services as directors. As of March 31, 2015, we had 1,000,000 shares of common stock authorized and 239,841 shares of common stock available for future grant under the Directors Plan. Option terms range from three to ten years from the date of grant. Option exercise prices are equal to the fair value of the common shares on the date of grant. Options granted under the plan vest immediately. Forfeitures under the Directors Plan are available for re-issuance at a future date.
Stock Bonus Plan
We have a Stock Bonus Plan (“Stock Plan”) administered by the Board of Directors. As of March 31, 2015, we had 2,254,994 shares of common stock authorized and there were 252,227 shares of common stock available for future grant under the Stock Plan. Under the Stock Plan, shares of common stock may be granted to employees, key consultants, and directors who are not employees as additional compensation for services rendered. Vesting requirements for grants under the Stock Plan, if any, are determined by the Board of Directors at the time of grant.
Stock Purchase Plan
41
UQM TECHNOLOGIES, INC. AND SUBSIDIARIES
Notes to Consolidated Financial Statements, Continued
We have established a Stock Purchase Plan under which eligible employees may contribute up to 10 percent of their compensation to purchase shares of our common stock at 85 percent of the fair market value at specified dates. At March 31, 2015, we had 700,000 shares of common stock authorized and 295,598 shares of common stock available for issuance under the Stock Purchase Plan.
Share-Based Compensation Expense
We use the straight-line attribution method to recognize share-based compensation costs over the requisite service period of the award. The exercise price of options is equal to the market price of our common stock (defined as the closing price reported by the NYSE MKT) on the date of grant. We adjust share-based compensation on a quarterly basis for changes to the estimate of expected equity award forfeitures based on actual forfeiture experience. The effect of adjusting the forfeiture rate for all expense amortization is recognized in the period the forfeiture estimate is changed. The effect of forfeiture adjustments during the years ended March 31, 2015, 2014 and 2013 was insignificant.
We use the Black-Scholes-Merton option pricing model for estimating the fair value of stock option awards. The expected volatility and the expected life of options granted are based on historical experience, and the risk free interest rate is obtained from the U.S. Department of the Treasury daily yield curve rates. The weighted average estimated values of employee and director stock option grants, as well as the weighted average assumptions that were used in calculating such values during the years ended March 31, 2015, 2014 and 2013, were based on estimates at the date of grant as follows:
|
Year Ended March 31, |
||||||||||||
|
2015 |
2014 |
2013 |
||||||||||
|
Weighted average estimated |
||||||||||||
|
fair value of grant |
$ |
1.12 |
per option |
$ |
0.68 |
per option |
$ |
0.56 |
per option |
|||
|
Expected life (in years) |
6.5 |
years |
4.8 |
years |
6.3 |
years |
||||||
|
Risk free interest rate |
2.18 |
% |
2.30 |
% |
1.30 |
% |
||||||
|
Expected volatility |
74.66 |
% |
73.91 |
% |
72.80 |
% |
||||||
|
Expected dividend yield |
0.00 |
% |
0.00 |
% |
0.00 |
% |
||||||
Total share-based compensation expense and the classification of these expenses for the last three fiscal years were as follows:
|
Year Ended March 31, |
||||||||||
|
2015 |
2014 |
2013 |
||||||||
|
Costs of contract services |
$ |
17,626 |
$ |
18,738 |
$ |
19,898 | ||||
|
Costs of product sales |
27,696 | 40,559 | 42,313 | |||||||
|
Research and development |
14,255 | 8,981 | 2,998 | |||||||
|
Production engineering |
72,712 | 140,811 | 146,317 | |||||||
|
Selling, general and administrative |
555,420 | 580,782 | 958,823 | |||||||
|
$ |
687,709 |
$ |
789,871 |
$ |
1,170,349 | |||||
42
UQM TECHNOLOGIES, INC. AND SUBSIDIARIES
Notes to Consolidated Financial Statements, Continued
Stock Option Plans Activity
Additional information with respect to stock option activity during the year ended March 31, 2015 under our Stock Option Plans is as follows:
|
Weighted- |
||||||||||
|
Weighted- |
Average |
|||||||||
|
Shares |
Average |
Remaining |
Aggregate |
|||||||
|
Under |
Exercise |
Contractual |
Intrinsic |
|||||||
|
Option |
Price |
Life |
Value |
|||||||
|
Outstanding at April 1, 2014 |
3,330,575 |
$ |
1.98 |
4.8 years |
$ |
2,931,885 | ||||
|
Granted |
369,287 |
$ |
1.71 | |||||||
|
Exercised |
(5,053) |
$ |
0.89 |
$ |
6,720 | |||||
|
Forfeited and expired |
(725,734) |
$ |
2.60 | |||||||
|
Outstanding at March 31, 2015 |
2,969,075 |
$ |
1.79 |
5.5 years |
$ |
311,101 | ||||
|
Exercisable at March 31, 2015 |
2,391,625 |
$ |
1.91 |
4.6 years |
$ |
251,329 | ||||
|
Vested and expected to vest at March 31, 2015 |
2,948,647 |
$ |
1.79 |
5.5 years |
$ |
309,935 | ||||
Additional information with respect to stock option activity during the year ended March 31, 2014 under our Stock Option Plans is as follows:
|
Weighted- |
||||||||||
|
Weighted- |
Average |
|||||||||
|
Shares |
Average |
Remaining |
Aggregate |
|||||||
|
Under |
Exercise |
Contractual |
Intrinsic |
|||||||
|
Option |
Price |
Life |
Value |
|||||||
|
Outstanding at April 1, 2013 |
4,251,695 |
$ |
2.14 |
4.7 years |
$ |
- |
||||
|
Granted |
89,340 |
$ |
1.11 | |||||||
|
Exercised |
(20,146) |
$ |
1.05 |
$ |
27,462 | |||||
|
Forfeited and expired |
(990,314) |
$ |
2.62 | |||||||
|
Outstanding at March 31, 2014 |
3,330,575 |
$ |
1.98 |
4.8 years |
$ |
2,931,885 | ||||
|
Exercisable at March 31, 2014 |
2,634,589 |
$ |
2.21 |
3.9 years |
$ |
1,848,784 | ||||
|
Vested and expected to vest at March 31, 2014 |
3,306,339 |
$ |
1.98 |
4.8 years |
$ |
2,891,654 | ||||
Additional information with respect to stock option activity during the year ended March 31, 2013 under our Stock Option Plans is as follows:
|
Weighted- |
||||||||||
43
UQM TECHNOLOGIES, INC. AND SUBSIDIARIES
Notes to Consolidated Financial Statements, Continued
|
Weighted- |
Average |
|||||||||
|
Shares |
Average |
Remaining |
Aggregate |
|||||||
|
Under |
Exercise |
Contractual |
Intrinsic |
|||||||
|
Option |
Price |
Life |
Value |
|||||||
|
Outstanding at April 1, 2012 |
3,228,210 |
$ |
2.78 |
3.9 years |
$ |
- |
||||
|
Granted |
1,418,792 |
$ |
0.87 | |||||||
|
Exercised |
- |
$ |
- |
$ |
- |
|||||
|
Forfeited and expired |
(395,307) |
$ |
2.83 | |||||||
|
Outstanding at March 31, 2013 |
4,251,695 |
$ |
2.14 |
4.7 years |
$ |
- |
||||
|
Exercisable at March 31, 2013 |
3,098,868 |
$ |
2.48 |
3.2 years |
$ |
- |
||||
|
Vested and expected to vest at March 31, 2013 |
4,194,686 |
$ |
2.15 |
4.7 years |
$ |
- |
||||
The weighted-average grant date fair value of options granted during the years ended March 31, 2015, 2014 and 2013 was $1.12, $0.68 and $0.56, respectively.
As of March 31, 2015, there was $314,189 of total unrecognized compensation costs related to stock options granted under our Stock Option Plans. The unrecognized compensation cost is expected to be recognized over a weighted-average period of fifteen months. The total fair value of stock options that vested during the years ended March 31, 2015, 2014 and 2013 was $377,375, $493,271 and $885,916, respectively.
Cash received by us upon the exercise of stock options for the years ended March 31, 2015, 2014 and 2013 was $4,497, $21,075 and zero, respectively. The source of shares of common stock issuable upon the exercise of stock options is from authorized and previously unissued common shares.
Stock Bonus Plan Activity
Activity with respect to non-vested shares under the Stock Bonus Plan as of March 31, 2015, 2014 and 2013 and changes during the years ended March 31, 2015, 2014 and 2013 are presented below:
|
Year Ended March 31, |
|||||||||||||||
|
2015 |
2014 |
2013 |
|||||||||||||
|
Shares |
Weighted-Average |
Shares |
Weighted-Average |
Shares |
Weighted-Average |
||||||||||
|
Under |
Grant Date |
Under |
Grant Date |
Under |
Grant Date |
||||||||||
|
Contract |
Fair Value |
Contract |
Fair Value |
Contract |
Fair Value |
||||||||||
|
Non-vested at April 1 |
640,979 |
$ |
1.17 | 358,855 |
$ |
1.22 | 167,680 |
$ |
2.44 | ||||||
|
Granted |
136,144 |
$ |
1.71 | 452,195 |
$ |
1.18 | 454,866 |
$ |
0.87 | ||||||
|
Vested |
(303,862) |
$ |
1.21 | (166,231) |
$ |
1.34 | (263,691) |
$ |
1.39 | ||||||
|
Forfeited |
(41,222) |
$ |
1.28 | (3,840) |
$ |
1.25 |
- |
$ |
- |
||||||
|
Non-vested at March 31 |
432,039 |
$ |
1.26 | 640,979 |
$ |
1.17 | 358,855 |
$ |
1.22 | ||||||
As of March 31, 2015, there was $335,331 of total unrecognized compensation costs related to common stock granted under our Stock Bonus Plan. The unrecognized compensation cost at March 31, 2015 is expected to be recognized over a weighted-average period of sixteen months.
Stock Purchase Plan Activity
During the years ended March 31, 2015, 2014 and 2013, we issued 12,052, 62,421 and 85,550 shares of common stock, respectively, under the Stock Purchase Plan. Cash received by us upon the purchase of shares under the
44
UQM TECHNOLOGIES, INC. AND SUBSIDIARIES
Notes to Consolidated Financial Statements, Continued
Stock Purchase Plan for the years ended March 31, 2015, 2014 and 2013 was $22,055, $60,689 and $75,385, respectively.
(11) Significant Customers
We have historically derived significant revenue from a few key customers. The following table summarizes revenue and percent of total revenue from significant customers for the fiscal years ended March 31, 2015, 2014 and 2013:
|
Fiscal Year Ended March 31, |
|||||||||||||||||
|
2015 |
2014 |
2013 |
|||||||||||||||
|
Customer A |
$ |
822,929 | 20 |
% |
$ |
615,081 | 9 |
% |
$ |
816,779 | 11 |
% |
|||||
|
Customer B |
$ |
479,678 | 12 |
% |
$ |
880,145 | 12 |
% |
$ |
1,078,930 | 15 |
% |
|||||
|
Customer C |
$ |
394,922 | 10 |
% |
$ |
727,683 | 10 |
% |
$ |
1,494,024 | 21 |
% |
|||||
|
Customer D |
$ |
- |
- |
% |
$ |
50,050 | 1 |
% |
$ |
728,000 | 10 |
% |
|||||
The following table summarizes accounts receivable from significant customers as of March 31, 2015 and 2014:
|
March 31, 2015 |
March 31, 2014 |
|||||
|
Customer A |
24 |
% |
10 |
% |
||
|
Customer B |
- |
% |
71 |
% |
||
|
Customer C |
2 |
% |
2 |
% |
||
|
Customer D |
1 |
% |
- |
% |
(12) Income Taxes
Income tax benefit attributable to loss from operations differed from the amounts computed by applying the U.S. federal income tax rate of 34 percent as a result of the following:
|
Year Ended |
Year Ended |
Year Ended |
||||||
|
March 31, 2015 |
March 31, 2014 |
March 31, 2013 |
||||||
|
Computed "expected" tax benefit |
$ |
(2,036,100) |
$ |
(942,903) |
$ |
(3,634,026) | ||
|
Increase (decrease) in taxes resulting from: |
||||||||
|
Adjustment of expiring net operating loss |
||||||||
|
carry-forwards |
- |
- |
1,364,055 | |||||
|
Increase (decrease) in valuation allowance for |
||||||||
|
net deferred tax assets |
2,489,012 | 875,016 | 2,295,702 | |||||
|
Other, net |
(452,912) | 67,887 | (25,731) | |||||
|
Income tax expense |
$ |
- |
$ |
- |
$ |
- |
||
45
UQM TECHNOLOGIES, INC. AND SUBSIDIARIES
Notes to Consolidated Financial Statements, Continued
The tax effects of temporary difference that give rise to significant portions of the net deferred tax asset are presented below:
|
March 31, 2015 |
March 31, 2014 |
|||||
|
Deferred tax assets: |
||||||
|
Research and development credit carry-forwards |
$ |
4,073 |
$ |
4,073 | ||
|
Net operating loss carry-forwards |
26,742,134 | 24,328,101 | ||||
|
Deferred compensation |
104,559 | 75,384 | ||||
|
Property and equipment |
131,440 | 108,314 | ||||
|
Stock Compensation |
993,216 | 952,978 | ||||
|
Other |
653,578 | 666,505 | ||||
|
Total deferred tax assets |
28,629,000 | 26,135,355 | ||||
|
Deferred tax liabilities: |
||||||
|
Intangible assets |
53,023 | 48,390 | ||||
|
Total deferred tax liabilities |
53,023 | 48,390 | ||||
|
Net deferred tax assets |
28,575,977 | 26,086,965 | ||||
|
Less valuation allowance |
(28,575,977) | (26,086,965) | ||||
|
Deferred tax assets, net of valuation allowance |
$ |
- |
$ |
- |
||
As of March 31, 2015 and March 31, 2014, respectively, we had net operating loss (“NOL”) carry-forwards of approximately $77.4 million and $70.9 million for U.S. income tax purposes that expire in varying amounts through 2035. Approximately $5.3 million of the net operating loss carry-forwards are attributable to stock options, the benefit of which will be credited to additional paid-in capital if realized. However, due to the provisions of Section 382 of the Internal Revenue Code, the utilization of a portion of these NOLs may be limited. Future ownership changes under Section 382 could occur that would result in additional Section 382 limitations, which could further restrict the use of NOLs. In addition, any Section 382 limitation could reduce our ability for utilization to zero if we fail to satisfy the continuity of business enterprise requirement for the two-year period following an ownership change.
The valuation allowance for deferred tax assets of $28.6 million and $26.1 million at March 31, 2015 and 2014, respectively, relates principally to the uncertainty of the utilization of deferred tax assets in various tax jurisdictions. The Company continually assesses both positive and negative evidence to determine whether it is more-likely-than-not that the deferred tax assets can be realized prior to their expiration. Based on the Company’s assessment it has determined the deferred tax assets are not currently realizable.
We have not recorded any potential liability for uncertain tax positions taken on our tax returns.
We may, from time to time, be assessed interest or penalties by major tax jurisdictions, although any such assessments historically have been minimal and immaterial to our financial results. Penalties are recorded in selling, general and administrative expenses and interest paid or received is recorded in interest expense or interest income, respectively, in the consolidated statements of operations.
(13) 401(k) Employee Benefit Plan
We have established a 401(k) Savings Plan (“401K Plan”) under which eligible employees may contribute up to 15 percent of their compensation. Employees over the age of 18 are eligible immediately upon hire to participate in the 401K Plan. At the direction of the participants, contributions are invested in several investment options offered by the 401K Plan. We currently match 33 percent of participants’ contributions, subject to certain limitations. These matching contributions vest ratably over a three-year period. Matching contributions to the 401K Plan were $117,222, $132,471, and $149,311, for the years ended March 31, 2015, 2014, and 2013, respectively.
46
UQM TECHNOLOGIES, INC. AND SUBSIDIARIES
Notes to Consolidated Financial Statements, Continued
(14) Interim Financial Data (Unaudited)
|
Quarters Ended |
||||||||||||
|
June 30 |
September 30 |
December 31 |
March 31 |
|||||||||
|
Fiscal year 2015 |
||||||||||||
|
Sales |
$ |
1,019,548 |
$ |
1,116,779 |
$ |
835,635 |
$ |
1,043,782 | ||||
|
Gross profit |
$ |
407,286 |
$ |
399,631 |
$ |
174,165 |
$ |
135,014 | ||||
|
Net loss |
$ |
(1,310,037) |
$ |
(1,990,714) |
$ |
(1,371,465) |
$ |
(1,316,314) | ||||
|
Net loss per common share basic and diluted: |
$ |
(0.03) |
$ |
(0.05) |
$ |
(0.03) |
$ |
(0.04) | ||||
|
Quarters Ended |
||||||||||||
|
June 30 |
September 30 |
December 31 |
March 31 |
|||||||||
|
Fiscal year 2014 |
||||||||||||
|
Sales |
$ |
1,948,511 |
$ |
2,041,958 |
$ |
2,040,249 |
$ |
1,015,482 | ||||
|
Gross profit |
$ |
662,242 |
$ |
848,563 |
$ |
832,886 |
$ |
350,413 | ||||
|
Net loss |
$ |
(916,354) |
$ |
(412,269) |
$ |
(65,913) |
$ |
(1,378,708) | ||||
|
Net loss per common share basic and diluted: |
$ |
(0.02) |
$ |
(0.01) |
$ |
- |
$ |
(0.04) | ||||
47
Table of Contents
ITEM 9.CHANGE IN AND DISAGREEMENTS WITH INDEPENDENT ACCOUNTANTS ON
ACCOUNTING AND FINANCIAL DISCLOSURE
None.
ITEM 9A.CONTROLS AND PROCEDURES
Controls Evaluation
We conducted an evaluation of the effectiveness of the design and operation of our disclosure controls and procedures as of March 31, 2015 under the supervision and with the participation of management, including our Chief Executive Officer (“CEO”) and Chief Financial Officer (“CFO”).
Based on their evaluation as of March 31, 2015, our CEO and CFO have concluded that our disclosure controls and procedures (as defined in Rules 13a-15(e) and 15d-15(e) under the Securities Exchange Act of 1934, as amended) were effective to ensure that the information required to be disclosed by our management in the reports that it files or submits under the Securities Exchange Act of 1934 is (i) recorded, processed, summarized and reported within the time periods specified in the SEC’s rules and forms, and (ii) accumulated and communicated to our management, including our CEO and CFO, to allow timely decisions regarding required disclosure.
Management Report on Internal Control Over Financial Reporting
Our management is responsible for all aspects of the business, including the preparation of the consolidated financial statements in this annual report. Management prepared the consolidated financial statements using accounting principles generally accepted in the United States. Management has also prepared the other information in this annual report and is responsible for its accuracy and consistency with the consolidated financial statements.
Management is responsible for establishing and maintaining an adequate system of internal control over financial reporting, including safeguarding of assets against unauthorized acquisition, use or disposition. This system is designed to provide reasonable assurance to management and the board of directors regarding preparation of reliable published financial statements and safeguarding of our assets. This system is supported with written policies and procedures and contains self-monitoring mechanisms. Appropriate actions are taken by management to correct deficiencies as they are identified. All internal control systems have inherent limitations, including the possibility of circumvention and overriding of controls, and, therefore, can provide only reasonable assurance as to the reliability of financial statement preparation and such asset safeguarding.
Management has assessed the effectiveness of our internal control over financial reporting as of March 31, 2015. In making this assessment, it used the criteria described in the 1992 “Internal Control-Integrated Framework” issued by the Committee of Sponsoring Organizations of the Treadway Commission (“COSO”). Based on this assessment, management has concluded that, as of March 31, 2015, our internal control over financial reporting is effective. Management reviewed the results of its assessment with the Audit Committee of our Board of Directors who oversees the financial reporting process.
Changes in Internal Control Over Financial Reporting
There were no changes to our internal control over financial reporting (as defined in Rules 13a-15(f) and 15d-15(f) under the Exchange Act) that occurred during the fiscal year ended March 31, 2015 that have materially affected, or are reasonably likely to materially affect, our internal control over financial reporting.
May 28, 2015
|
|
|
|
|
Eric R. Ridenour |
|
David I. Rosenthal |
|
President and Chief Executive Officer |
|
Treasurer, Secretary and |
|
|
|
Chief Financial Officer |
48
ITEM 9B.OTHER INFORMATION
None.
49
ITEM 10.DIRECTORS, EXECUTIVE OFFICERS AND CORPORATE GOVERNANCE
Additional information required by Item 10 is incorporated by reference from and contained under the headings “Election of Directors”, “Management” “Section 16(a) Beneficial Ownership Reporting Compliance” and “Code of Ethics” in our Definitive Proxy Statement for the 2015 Annual Meeting of Shareholders.
|
|
|
ITEM 11.EXECUTIVE COMPENSATION
The information required by Item 11 is incorporated by reference from and contained under the headings “Executive Compensation”, “Option Grants during Fiscal Year 2014,” “Aggregate Option Exercises During Fiscal Year 2014,” “Option Values at the End of Fiscal Year 2014,” “Director Compensation,” “Compensation discussion and Analysis,” “Compensation and Benefits Committee Report,” and “Compensation Committee Interlocks” in our definitive Proxy Statement for the 2015 Annual Meeting of Shareholders.
|
|
|
ITEM 12.SECURITY OWNERSHIP OF CERTAIN BENEFICIAL OWNERS AND MANAGEMENT AND RELATED STOCKHOLDER MATTERS
The information required by Item 12 is incorporated by reference from and contained under the heading “Security Ownership of Certain Owners and Management” and “Equity Compensation Plan Information” in our definitive Proxy Statement for the 2015 Annual Meeting of Shareholders.
|
|
|
ITEM 13.CERTAIN RELATIONSHIPS AND RELATED TRANSACTIONS AND DIRECTOR INDEPENDENCE
The information required by Item 13 is incorporated by reference from and contained under the headings “Certain Relationships and Related Transactions” in our definitive Proxy Statement for the 2015 Annual Meeting of Shareholders.
|
|
ITEM 14.PRINCIPAL ACCOUNTANT FEES AND SERVICES.
The information required by Item 14 is incorporated by reference from and contained under the heading “Ratification of Selection of Independent Auditors” in our definitive Proxy Statement for the 2015 Annual Meeting of Shareholders.
50
PART IV
ITEM 15.EXHIBITS AND FINANCIAL STATEMENT SCHEDULES
|
(a) |
1. |
Financial Statements |
|
|
|
|
|
|
|
UQM Technologies, Inc. (included in Part II): |
|
|
|
|
|
|
|
Report of Independent Registered Public Accounting Firm. |
|
|
|
|
|
|
|
Consolidated Balance Sheets, March 31, 2015 and March 31, 2014. |
|
|
|
Consolidated Statements of Operations for the Years Ended March 31, 2015, 2014, and 2013. |
|
|
|
|
|
|
|
Consolidated Statements of Stockholders’ Equity for the Years Ended March 31, 2015, 2014, and 2013. |
|
|
|
|
|
|
|
Consolidated Statements of Cash Flows for the Years Ended March 31, 2015, 2014, and 2013. |
|
|
|
|
|
|
|
Notes to Consolidated Financial Statements. |
|
|
|
|
|
|
2. |
Financial Statement Schedules: |
|
|
|
|
|
|
|
Valuation and Qualifying Accounts. See note 1(e) to the Consolidated Financial Statements above. |
|
|
|
|
|
|
3. |
Exhibits: |
|
|
|
|
|
3.1 |
|
Restated Articles of Incorporation. Reference is made to Exhibit 3.1 of our Annual Report on Form 10-K filed May 30, 2014, which is incorporated herein by reference. |
|
|
|
|
|
3.2 |
|
Bylaws, as amended. Reference is made to Exhibit 3.2 of our Annual Report on Form 10-K filed May 30, 2014, which is incorporated herein by reference. |
|
|
|
|
|
4.1 |
|
Specimen Stock Certificate. Reference is made to Exhibit 3.1 of our Registration Statement on Form 10 dated February 27, 1980, which is incorporated herein by reference. |
|
|
|
|
|
4.2 |
|
Form of Common Stock Purchase Warrant. Reference is made to Exhibit 4.1 of our current report on Form 8-K, filed February 5, 2014, which is incorporated herein by reference. |
|
|
|
|
|
10.1 |
|
Assistance Agreement between the Company and the U.S. DOE/NETL. Reference is made to Exhibit 10.1 of our Current Report on Form 8-K filed on January 20, 2010, which is incorporated herein by reference. |
|
|
|
|
|
10.2 |
|
Modification Number One to the Assistance Agreement between the Company and the U.S. DOE/NETL. Reference is made to Exhibit 10.1 of our Current Report on Form 8-K, filed on May 17, 2010, which is incorporated herein by reference. |
|
10.3 |
|
Modification Number Two to the Assistance Agreement between the Company and the U.S. DOE/NETL. Reference is made to Exhibit 10.1 of our current report on Form 8-K, filed on June 28, 2010, which is incorporated herein by reference. |
|
|
|
|
|
10.4 |
|
Modification Number Three to the Assistance Agreement between the Company and the U.S. DOE/NETL. Reference is made to Exhibit 10.1 of our current report on Form 8-K, filed August 26, 2010, which is incorporated herein by reference. |
|
|
|
|
|
10.5 |
|
Modification Number Four to the Assistance Agreement between the Company and the U.S. DOE/NETL. Reference is made to Exhibit 10.1 of our current report on Form 8-K, filed September 9, 2010, which is incorporated herein by reference. |
51
|
|
|
|
||
|
10.6 |
|
Modification Number Six to the Assistance Agreement between the Company and the U.S. DOE/NETL. Reference is made to Exhibit 10.1 of our current report on Form 8-K, filed June 29, 2011, which is incorporated herein by reference. |
||
|
|
|
|
||
|
10.7 |
|
Modification Number Seven to the Assistance Agreement between the Company and the U.S. DOE/NETL. Reference is made to Exhibit 10.1 of our current report on Form 8-K, filed April 17, 2012, which is incorporated herein by reference. |
||
|
|
|
|
||
|
10.8 |
|
Modification Number Nine to the Assistance Agreement between the Company and the U.S. DOE/NETL. Reference is made to Exhibit 10.1 of our current report on Form 8-K, filed December 6, 2013, which is incorporated herein by reference. |
||
|
|
|
|
||
|
10.9 |
|
Amended and Restated UQM Technologies, Inc. Employee Stock Purchase Plan. ** Reference is made to Exhibit 4.1 to the Company’s Registration Statement on Form S-8 (No. 333-164705) filed on February 5, 2010, which is incorporated herein by reference. |
||
|
10.10
10.11
10.12
10.13
10.14
|
|
Stock Bonus Plan. ** Reference is made to Exhibit 10.2 of our Current Report on Form 8-K filed on August 12, 2005, which is incorporated herein by reference.
Amendment to UQM Technologies, Inc. Stock Bonus Plan dated May 9, 2012. ** Reference is made to Exhibit 10.22 of our Form 10-K filed May 24, 2012, which is incorporated herein by reference.
Amendment to UQM Technologies, Inc. Stock Bonus Plan adopted August 13, 2014.** Reference is made to Appendix B of our Proxy Statement filed July 2, 2014, which is incorporated herein by reference.
UQM Technologies, Inc. Outside Director Stock Option Plan amended November 2, 2011. ** Reference is made to Exhibit 10.21 of our Form 10-K filed May 24, 2012, which is incorporated herein by reference.
UQM Technologies, Inc. 2012 Equity Incentive Plan adopted April 11, 2012.** Reference is made to Exhibit 10.19 of our Form 10-K filed May 24, 2012, which is incorporated herein by reference. |
||
|
10.15 |
|
Amendment to UQM Technologies, Inc. 2012 Equity Incentive Plan adopted August 13, 2014.** Reference is made to Appendix A of our Proxy Statement filed July 2, 2014, which is incorporated herein by reference. |
||
|
10.16 |
|
Form of Incentive Stock Option Agreement. ** Reference is made to Exhibit 10.6 of our Annual Report on Form 10-K, filed on May 22, 2008, which is incorporated herein by reference. |
||
|
|
|
|
||
|
10.17 |
|
Form of Non-Qualified Stock Option Agreement. ** Reference is made to Exhibit 10.7 of our Annual Report on Form 10-K, filed on May 22, 2008, which is incorporated herein by reference. |
||
|
|
|
|
||
|
10.18 |
|
Form of Restricted Stock Agreement, amended May 9, 2012. ** Reference is made to Exhibit 10.20 of our Form 10-K filed May 24, 2012, which is incorporated herein by reference. |
||
|
|
|
|
||
|
10.19 |
|
Amended employment agreement with Eric. R Ridenour dated April 30, 2013.** Reference is made to Exhibit 10.2 of our current report on Form 8-K, filed May 1, 2013, which is incorporated herein by reference. |
||
|
|
|
|
||
|
10.20 |
|
Amended Restricted Stock Grant Agreement with Mr. Ridenour dated October 20, 2010.** Reference is made to Exhibit 10.1 to our current report on Form 8-K filed October 22, 2010, which is incorporated herein by reference. |
||
|
|
|
|
||
|
10.21 |
|
Employment Agreement with David I. Rosenthal. ** Reference is made to Exhibit 10.1 to our current report on Form 8-K, filed on May 1, 2013, which is incorporated herein by reference. |
||
|
|
|
|
||
|
10.22 |
|
Amended Employment Agreement with Adrian Schaffer dated April 30, 2013.** Reference is made to Exhibit 10.4 of our current report on Form 8-K, filed May 1, 2013, which is incorporated herein by reference. |
||
|
|
|
|
||
52
|
10.23 |
Amended Employment Agreement with Joseph Mitchell dated April 30, 2013.** Reference is made to Exhibit 10.5 of our current report on Form 8-K, filed May 1, 2013, which is incorporated herein by reference. |
|||
|
21.1 |
|
Subsidiaries of the Company. |
||
|
|
|
|
||
|
23.1 |
|
Consent of Grant Thornton LLP. |
||
|
31.1 |
|
Certification of the Chief Executive Officer pursuant to Section 302 of the Sarbanes-Oxley Act of 2002. |
||
|
|
|
|
||
|
31.2 |
|
Certification of the Chief Financial Officer pursuant to Section 302 of the Sarbanes-Oxley Act of 2002. |
||
|
|
|
|
||
|
32.1 |
|
Certification Pursuant to 18 U.S.C. Section 1350, as adopted pursuant to section 906 of the Sarbanes-Oxley Act 2002. |
||
|
|
|
|||
|
|
** management contract or compensation plan. |
|||
53
SIGNATURES
Pursuant to the requirements of Section 13 or 15(d) of the Securities Exchange Act of 1934, UQM Technologies, Inc. has duly caused this Annual Report on Form 10-K to be signed on its behalf by the undersigned, thereunto duly authorized, in Longmont, Colorado on the 28th day of May, 2015.
UQM TECHNOLOGIES, INC.,
a Colorado Corporation
|
|
|
By: |
/s/ ERIC R. RIDENOUR |
|
|
|
|
Eric R. Ridenour |
|
|
|
|
President and |
|
|
|
|
Chief Executive Officer |
Pursuant to the requirements of the Securities Exchange Act of 1934, this Annual Report on Form 10-K has been signed below by the following persons on behalf of UQM Technologies, Inc., in the capacities indicated and on the date indicated.
|
|
|
|
|
Signature |
Title |
Date |
|
/s/ DONALD W. VANLANDINGHAM Donald W. Vanlandingham |
Chairman of the Board of Directors |
May 28, 2015 |
|
/s/ERIC R. RIDENOUR Eric R. Ridenour |
President and Chief Executive Officer |
May 28, 2015 |
|
/s/DAVID I. ROSENTHAL David I. Rosenthal |
Treasurer and Secretary (Principal Financial and Accounting Officer) |
May 28, 2015 |
|
/s/STEPHEN J. ROY Stephen J. Roy |
Director |
May 26, 2015 |
|
s/JOSEPH P. SELLINGER Joseph P. Sellinger |
Director |
May 26, 2015 |
|
/s/JOHN E. SZTYKIEL John E. Sztykiel |
Director |
May 27, 2015 |
54
55