Attached files
UNITED STATES
SECURITIES AND EXCHANGE COMMISSION
Washington, D.C. 20549
FORM 10-K
(Mark one) | |
x | ANNUAL REPORT PURSUANT TO SECTION 13 OR 15(d) OF THE SECURITIES EXCHANGE ACT OF 1934 |
For the Fiscal Year Ended March 29, 2015 | |
or | |
¨ | TRANSITION REPORT PURSUANT TO SECTION 13 OR 15(d) OF THE SECURITIES EXCHANGE ACT OF 1934 |
For the Transition Period From to | |
Commission File Number 1-10348
PRECISION CASTPARTS CORP.
(Exact name of registrant as specified in its charter)
Oregon | 93-0460598 |
(State or other jurisdiction of incorporation or organization) | (I.R.S. Employer Identification No.) |
4650 S.W. Macadam Ave., Suite 400 Portland, OR | 97239-4262 |
(Address of principal executive offices) | (Zip Code) |
Registrant’s telephone number, including area code: (503) 946-4800 | |
Securities registered pursuant to Section 12(b) of the Act: | |
Title of each class | Name of each exchange on which registered |
Common Stock, without par value | New York Stock Exchange |
Series A Preferred Stock Purchase Rights | New York Stock Exchange |
Securities registered pursuant to Section 12(g) of the Act: None
Indicate by check mark if the registrant is a well-known seasoned issuer, as defined in Rule 405 of the Securities Act. Yes x No ¨
Indicate by check mark if the registrant is not required to file reports pursuant to Section 13 or Section 15(d) of the Act. Yes ¨ No x
Indicate by check mark whether the registrant (1) has filed all reports required to be filed by Section 13 or 15(d) of the Securities Exchange Act of 1934 during the preceding 12 months (or for such shorter period that the Registrant was required to file such reports), and (2) has been subject to such filing requirements for the past 90 days. Yes x No ¨
Indicate by check mark whether the registrant has submitted electronically and posted on its corporate Web site, if any, every Interactive Data File required to be submitted and posted pursuant to Rule 405 of Regulation S-T during the preceding 12 months (or for such shorter period that the registrant was required to submit and post such files). Yes x No ¨
Indicate by check mark if disclosure of delinquent filers pursuant to Item 405 of Regulation S-K is not contained herein, and will not be contained, to the best of registrant’s knowledge, in definitive proxy or information statements incorporated by reference in Part III of this Form 10-K or any amendment to this Form 10-K. x
Indicate by check mark whether the registrant is a large accelerated filer, an accelerated filer, a non-accelerated filer, or a smaller reporting company. See the definitions of “large accelerated filer,” “accelerated filer” and “smaller reporting company” in Rule 12b-2 of the Exchange Act.
Large accelerated filer x Accelerated filer ¨ Non-accelerated filer ¨ Smaller reporting company ¨
Indicate by check mark whether the registrant is a shell company (as defined in Rule 12b-2 of the Act). Yes ¨ No x
The aggregate market value of common equity held by non-affiliates of the Registrant as of September 26, 2014, was $34,132,467,040.
As of the close of business on May 19, 2015, the Registrant had 138,228,926 shares of Common Stock, without par value, outstanding.
Portions of the Registrant’s Proxy Statement to be filed in connection with the 2015 Annual Meeting of Shareholders are incorporated by reference in Part III.
TABLE OF CONTENTS
Page | |
PART I
ITEM 1. | BUSINESS |
Precision Castparts Corp. (“PCC”, “the Company”, or “we”), a worldwide manufacturer of complex metal components and products, provides high-quality investment castings, forgings, fasteners/fastener systems and aerostructures for critical aerospace and power applications. We also provide seamless pipe for coal-fired, industrial gas turbine ("IGT") and nuclear power plants; downhole casing, clad pipe, fittings and various mill forms in a variety of nickel and steel alloys for severe-service oil and gas environments; investment castings and forgings for general industrial, armament, medical and other applications; nickel and titanium alloys in all standard mill forms from large ingots and billets to plate, foil, sheet, strip, tubing, bar, rod, extruded shapes, rod-in-coil, wire and welding consumables, as well as cobalt alloys, for the aerospace, chemical processing, oil and gas, pollution control and other industries; revert management solutions; fasteners for automotive and general industrial markets; specialty alloys for the investment casting and forging industries; heat treating and destructive testing services for the investment cast products and forging industries; refiner plates, screen cylinders and other products for the pulp and paper industry; grinder pumps and affiliated components for low-pressure sewer systems; critical auxiliary equipment and gas monitoring systems for the power generation industry; and metalworking tools for the fastener market and other applications.
Products and Markets
We manufacture complex metal components and products in three principal business segments: Investment Cast Products, Forged Products and Airframe Products. Each of these three business segments is described below.
Investment Cast Products
Our Investment Cast Products segment manufactures investment castings for aircraft engines, IGT engines, airframes, medical implants, armament, unmanned aerial vehicles and other industrial applications. The segment also provides alloys to PCC’s investment casting operations, as well as to other investment casting companies. The Investment Cast Products segment accounted for approximately 25 percent of our sales in fiscal 2015.
We are the market leader in manufacturing large, complex, structural investment castings, and we are the leading manufacturer of airfoil investment castings used in jet aircraft engines. We manufacture investment castings for every jet aircraft engine program in production or under development by our key customers. We are also the market leader in manufacturing structural and airfoil investment castings for IGT and aeroderivative engines used for electric power generation and other applications, and we have expanded into the structural airframe and armament markets. In addition, we make investment castings for use in the medical implant, satellite launch vehicle and general industrial markets.
Investment casting technology involves a multi-step process that uses ceramic molds in the manufacture of metal components with more complex shapes, closer tolerances and finer surface finishes than parts manufactured using other casting methods. The investment casting process begins with the creation of a wax pattern of the part to be cast, along with wax gates and risers to create pathways through which molten metal can flow throughout the ceramic mold. A ceramic shell is then formed around the wax pattern, followed by melting and draining the wax from the shell. Finally, molten metal is poured into the shell, which is removed after the metal cools, and the part undergoes final processing and inspection.
Because of the complexity of the manufacturing process and the application of proprietary technologies, we are currently one of the few manufacturers that can consistently produce the largest, complex, structural investment castings in quantities sufficient to meet our customers’ quality and delivery requirements. Our emphasis on low-cost, high-quality products and timely delivery has enabled us to become the leading supplier of structural and airfoil castings for jet aircraft and IGT engines and to expand into the structural airframe and armament markets.
Large jet aircraft engines are manufactured by a limited number of suppliers, including General Electric (“GE”), Pratt & Whitney (a division of United Technologies Co.), Rolls-Royce and several joint venture partners. With this highly concentrated and sophisticated customer base, we believe customer service and long-term customer relationships will continue to be important to achieving our goals. We have been supplying castings for jet engines to GE, Pratt & Whitney and Rolls-Royce for several decades. As we have been able to cast larger and more complex parts, manufacturers of large jet aircraft engines have increased their use of our structural castings.
Aerospace Structural Castings
Our structural castings business manufactures the largest-diameter, nickel-based superalloy, titanium and stainless steel investment castings in the world, as well as a variety of medium and small structural castings in these same alloys and in aluminum. The nickel, titanium and steel castings are stationary components that form portions of the fan, compressor,
1
combustor and turbine sections of a jet aircraft engine, where strength and structural integrity are critical. Aluminum structural castings are used in such applications as doors and thrust reversers. Structural investment castings are sold primarily as original equipment to jet aircraft engine manufacturers.
We believe that trends in the design of aircraft jet engines will continue to increase our revenue per engine. As the design of new-generation aircraft engines has emphasized increased thrust, higher fuel efficiency and reduction of noise and exhaust emissions, engine operating temperatures and pressures have increased. These conditions require the use of engine parts made of alloys that are able to withstand extreme operating conditions and provide an optimum strength-to-weight ratio. Many of these alloys are particularly suited for use in the investment castings we manufacture. In addition, titanium, a metal with a lower melting temperature than stainless steel or superalloys, is used for structural castings in all but the hottest parts of the engine because of its high mechanical properties and considerable weight savings. Titanium is a challenging metal to cast because of its reaction with other elements. However, we have developed the advanced technology and manufacturing processes to cast large, complex investment castings in a variety of titanium alloys. Many new-generation engines, which are expected to be built through the next decade and beyond, make significantly greater use of our products than did previous engine designs.
We have also expanded into the structural airframes market through the production of components manufactured primarily from titanium and aluminum alloys. Aircraft manufacturers have shown substantial interest in using investment castings for airframe applications such as titanium aileron and flap hinges, pylons (engine mounts), heat shields, wing spars and wing ribs, as well as aluminum alloy nacelle segments (thrust reversers), cascades, aircraft access doors, electronic boxes and pump housings for hydraulic and fuel systems.
Aerospace Airfoil Castings
We manufacture precision cast airfoils, such as the stationary vanes and rotating blades used in the turbine section of jet aircraft engines. This part of the engine is considered the “hot section,” where temperatures may exceed 2,400 degrees Fahrenheit. These conditions require use of special nickel-based superalloys and state-of-the-art casting techniques to manufacture airfoil castings with internal cooling passages that enable the airfoils to operate in an environment with temperatures higher than the melting point of the metal of which they are made.
We use various casting technologies to manufacture turbine airfoils. A conventional casting process enables us to produce equiaxed airfoil castings, in which the metal grains are oriented randomly throughout the casting. A more advanced process enables us to produce directionally solidified (“DS”) airfoil castings, in which the metal grains are aligned longitudinally. This alignment decreases the internal stress on the weakest portion of a metal part where the various grains adjoin, thereby providing increased strength and improved efficiencies in engine performance over equiaxed parts. An even more advanced process enables us to produce single crystal (“SX”) airfoil castings, which consist of one crystal without grain boundaries. SX castings provide greater strength and performance characteristics than either equiaxed or DS castings, as well as longer engine life. In addition, we have developed a process to cast titanium aluminide blades, the first use of lightweight titanium in the hot section of an aircraft engine. These airfoils are incorporated into the GEnX engine for the Boeing 787.
As engines continue to target increased fuel efficiency and lower emissions, the turbine sections of these engines must burn hotter. As a result, the major aircraft engine manufacturers have increasingly been designing their engines with a greater number of DS and SX blades and vanes. The DS and SX cast airfoils we produce, with their complex cooling passages, have been instrumental in enabling these engines to operate at higher temperatures. SX cast airfoils are used in both new and redesigned engines where performance requirements are higher.
The demand for aerospace airfoil castings is determined primarily by the number and type of engines required for new jet aircraft; the intervals between hot section maintenance, which are driven by engine cycles (takeoffs and landings); and the inventory levels of replacement parts maintained by the principal jet aircraft engine manufacturers, repair centers and airlines. A jet engine’s airfoil components have shorter useful lives than structural investment castings and are replaced periodically during engine maintenance. As a result, our sales of aerospace airfoil castings are less affected by the cyclical patterns of the aerospace industry than are our sales of structural investment castings. The timing for replacement of aerospace airfoil castings principally depends on engine cycles and the expected life of the airfoil casting. We believe that approximately 30 percent of our sales of airfoil castings used in aircraft turbine engines are replacement parts.
IGT Castings
We are the leading supplier of investment castings used in IGT engines. IGTs have been a preferred power source for several decades, and original equipment manufacturers ("OEM") expect that trend to continue due to the availability of natural gas, overall efficiency of operation and relative speed/ease of installation. Most sales growth is anticipated in turbines of 180MW and above, which have higher PCC dollar content. In addition to IGT components, we manufacture structural and
2
airfoil castings for aeroderivative gas turbine engines, which are also used for power generation, as well as for other commercial and military land- and marine-based applications.
IGT manufacturers have significantly improved the efficiency and reduced the emissions profiles of industrial gas turbines, principally by incorporating advanced components in new engines as well as in refurbished and upgraded turbines in the field. We have leveraged our DS and SX airfoil casting knowledge from the aerospace market into the IGT market to produce blades and vanes that are better able to withstand the extreme heat and stresses of new, higher-temperature gas turbines. IGT engines are built with investment castings that are similar, but much larger, than the blades and vanes we manufacture for the aerospace market. Because of their size, IGT airfoils are usually more difficult to cast than smaller aerospace airfoils with the same properties.
Since industrial gas turbines are primarily used in electrical power generation, castings sales for new IGT engines are tied to the growth of global electricity consumption, while spares demand depends on the size and utilization rate of the installed base.
Other Investment Casting Products
Our strategy for profitable growth also includes the pursuit of other opportunities for our existing investment casting technology. We have expanded the application of our investment casting technology in the medical prosthesis, unmanned aerial vehicles (“UAV”) and general industrial markets by manufacturing such products as artificial hips and knees, landing gear struts and engine inlets for UAVs and impellers for pumps and compressors. In addition, we manufacture large titanium components for armament systems.
Internal Alloy-Making Capability
An operation within our Investment Cast Products segment produces alloys used by PCC and other manufacturers of investment castings. Several of these alloys are patented and trademarked, and specifically formulated for the casting of DS and SX airfoils that operate in high-temperature, high-stress engine environments. This operation supplements our other ingot-making furnaces located in Portland, Oregon, and Minerva, Ohio, and our internal supply of nickel-based alloy for investment casting is managed through this group of facilities. The alloys produced also serve such diverse markets as medical, recreational and general industrial.
Forged Products
We are among the leading manufacturers of forged components for the aerospace and power generation markets. Forged Products’ aerospace and IGT sales are primarily derived from the same large engine customers served by the Investment Cast Products segment, with additional aerospace sales to manufacturers of landing gear and airframes. Therefore, the dynamics of the aerospace and IGT markets, as described in the Investment Cast Products section above, are virtually the same for Forged Products, with the exception that Forged Products' IGT sales are mainly for OEM new equipment. We also produce seamless pipe for coal-fired, industrial gas turbine and nuclear power plants, as well as downhole casings and clad pipe for severe service oil and gas environments. In addition, we manufacture high-performance, nickel-based alloys used to produce forged components for aerospace and non-aerospace applications in such markets as oil and gas, chemical processing and pollution control. Our titanium products are used to manufacture components for the commercial and military aerospace, power generation, energy, and industrial end markets. The Forged Products segment accounted for approximately 43 percent of our sales in fiscal 2015.
Forged Components
We manufacture forged components from titanium and nickel-based alloys for commercial and military aircraft engines and IGT power plants, including fan discs, compressor discs, turbine discs, seals, spacers, shafts, hubs and cases. Our airframe structural components are used on both commercial and military aircraft and include landing gear beams, bulkheads, wing structures, engine mounts, struts and tail flaps, and housings. We also produce a variety of mechanical and structural tubular products from steel and nickel alloys, primarily in the form of extruded seamless pipe, for domestic and international energy markets, which include coal, IGT and nuclear power plants and co-generation projects, as well as nickel-alloy casing and tubular products for exploration and production by the oil and gas industry. For naval defense applications, we supply forged components for propulsion systems on nuclear submarines and aircraft carriers, as well as forgings for pumps, valves and structural applications.
Our forged component operations, which employ nine different manufacturing processes, involve heating high-temperature nickel alloys, titanium or steel and then shaping the metal through pressing or extrusion, using hydraulic and
3
mechanical presses with capacities ranging up to 50,000 tons. The process employed is determined based on the raw materials and the product application. The nine manufacturing processes are summarized below:
Open-Die Forging—In this process, the metal is pressed between dies that never completely surround the metal, thus allowing it to be observed during the process. This manufacturing method is used to create relatively simple, preliminary shapes to be processed further by other die forging processes.
Closed-Die Forging—Closed-die forging involves pressing heated metal into shapes and sizes determined by machined impressions in specially prepared dies that completely surround the metal. This process enables the metal to flow more easily within the die cavity and thus produces forgings with superior surface finish, tighter tolerances and unique shapes, with enhanced repeatability of the part shape.
Hammer Forging—This form of closed-die forging uses multiple impact blows to shape a component between specially contoured dies. Forging hammers can be classified into two main types: single action and counterblow. Our counterblow hammers, which couple upper- and lower-ram movement to produce the impact forces required for large components, can offer improved near-net-shape capability compared to conventional press forging. Hammer forging is one of the oldest forging processes; however, computer-controlled technology has enabled the process to meet modern manufacturing requirements.
Conventional/Multi-Ram—The closed-die, multi-ram process enables us to produce complex forgings with multiple cavities, such as valve bodies, in a single heating and pressing cycle. Dies may be split on either a vertical or a horizontal plane, and shaped punches may be operated by side rams, piercing rams or both. This process also optimizes grain flow and uniformity of deformation and reduces machining requirements.
Isothermal Forging—Isothermal forging is a closed-die process in which the dies are heated to the same temperature as the metal being forged, typically in excess of 1,900 degrees Fahrenheit. Because the dies may oxidize at these elevated temperatures, this process is performed in a vacuum or inert gas atmosphere. Our isothermal press produces near-net-shape components, requiring less machining by our customers.
Extrusion—The extrusion process is capable of producing thick-wall, seamless pipe, with outside diameters of up to 48 inches and a wall thickness from 0.5 inches to 7 inches for applications in the power generation and oil and gas industries, including main steam lines, hot re-treat lines and other high-stress/high-temperature fluid transmission systems. Our 35,000-ton vertical extrusion press is one of the largest and most advanced in the world. In addition to solid metals, powdered metals can be compacted and extruded into forging billets with this press.
Ring Rolling—The radial ring-rolling process thins the wall thickness and thus enlarges the inside and outside diameter of a rough ring blank, which is generally made by piercing a solid piece of metal in an open or closed-die forging press. In the ring-rolling process, tonnage is applied to the wall of the blank between a mandrel on the inside diameter and a work-roll on the outside diameter. The outer work-roll rotates the ring and progressively reduces the wall thickness. In radial-axial ring rolling, two additional rollers apply tonnage on the end faces of the ring to control the ring height.
Flash Welding Rings—The process involves taking a shaped or rectangular cross-sectional bar and bending it into a hoop to form a ring. The ring is clamped in the flash-welding machine, which heats the ends of the bar to form a molten metal interface and then forges the ends together. After the ends are forged together, the expelled molten metal from the weld joint (flash) is ground down to match the parent material surface. Following the welding process, the rings are finished by rounding and flattening.
Tru-Form Process—Tru-Form is a near-net-shaped, cold-rolling process, which starts with flash-welded or seamless, rolled rings. The high-tonnage rolls of the Tru-Form process apply point contact to thin the wall thickness of a ring and grow the axial height. The rolling tools are programmed to follow profiles unique to the finished product definition. After the rolling process, additional forming operations are performed to transform the rolled ring into a finished near-net-shape contour.
We believe that we are the world leader in producing forged rotating components for use in jet aircraft engines. These parts are forged from billets (ingots converted in our cogging and extrusion presses) and from metal powders (primarily nickel alloys) that are produced, consolidated and extruded into billets entirely in our own facilities. In addition, we purchase billets from outside metal suppliers.
High-Performance Alloys
We believe that we are the world’s largest and most diversified producer of high-performance, nickel-based alloys, supplying more than 5,000 customers. Our alloys, which provide high-temperature strength and corrosion resistance, as well as toughness and strength in certain embrittling environments, are used to manufacture components required in the most technically demanding industries and applications. Power (primarily oil & gas) and commercial and military aerospace represent the largest markets served; other markets served include chemical and petrochemical processing, thermal processing, electrical and heating elements, and marine and welding applications.
Our alloying processes utilize electric arc, air induction and vacuum induction melting furnaces, while a few specialized alloys are made using a mechanical alloying process. Refining facilities include furnaces for argon/oxygen decarburization, vacuum arc remelting and electroslag remelting. Our major hot finishing processes include rotary forging, plate rolling, bar
4
rolling, press forging and extrusion of seamless tubulars and shapes. Cold finishing processes include cold rolled sheet and strip, tube and pipe pilgering, cold drawing of bar and wire, and cold drawing and rolling of pipe and tubulars. We produce nickel alloys in all standard mill forms from large ingots and billets to plate, sheet, strip, tubing, bar and wire, the latter of which includes core and filler wires for welding products. Our alloys are classified into unique families recognized worldwide and are sold under such trademarks as INCONEL®, INCOLOY®, MONEL®, NIMONIC®, UDIMET®, BRIGHTRAY® and NILO®.
Titanium Alloys
We are one of the world's leading producers of titanium melted and mill products. Our titanium products, which have uniquely high strength-to-weight and corrosion-resistance properties, are used to manufacture components for the commercial and military aerospace, power generation, energy and industrial end markets. Commercial aerospace represents our largest market, and new generations of fuel-efficient aircraft, including the Boeing 787 and Airbus A350, are increasing the content of titanium in airframe and engine applications.
As a fully integrated titanium component manufacturer, our breadth of production capabilities enable us to start with titanium-bearing sands and deliver a finished titanium shape to our end customer. Our titanium sponge production employs a vacuum distillation process and combines a titanium-containing feedstock ore with chlorine and petroleum coke to produce titanium tetrachloride, which is then reacted with magnesium to produce sponge. Melted products (ingot, electrode and slab) are produced by melting sponge, titanium scrap and alloying agents to produce various grades of titanium products. Mill products are produced by forging or rolling melt products into smaller gauge materials, including billet, bar, plate, sheet, strip and pipe. Our melting processes employ vacuum arc remelting (VAR) and electron-beam cold-hearth melting (EBCHM) single melt and EBCHM plus VAR; in addition, we have installed and are seeking qualification for plasma cold-hearth melting plus VAR capability. Our mill product processes include open die forging, vacuum annealing, rotary/radial forging, vacuum creep flattening and rolling mills. We also operate a global network of service centers that sell value-added and customized mill products.
Revert Management
We are the market leader in providing nickel superalloy and titanium revert management solutions for the aerospace, oil and gas, and energy markets. Revert includes metal chips, casting gates, bar ends, forging flash and other byproducts from forging, casting, fasteners and aerostructures manufacturing processes that can be re-melted and reused. Our infrastructure and capabilities create a closed loop system for the retention and reuse of internally-generated revert. We also provide metallurgical processing solutions and services worldwide for our use and for other companies that require the melting and processing of specialty alloys. Major markets include specialty alloy producers, foundries and other industries with special metallurgical requirements.
Airframe Products
We are a leading developer and manufacturer of highly engineered fasteners, fastener systems, aerostructures and precision components, primarily for critical aerospace applications. Much of our Airframe Products sales come from the same aerospace customer base served by our Investment Cast Products and Forged Products segments, with the exception that our aerostructures business is primarily driven by original equipment demand. In this regard, Airframe Products is subject to many of the same market forces as these other two segments. The balance of the segment’s sales is derived from construction, automotive, heavy truck and general industrial markets, including farm machinery, mining and construction equipment, shipbuilding, machine tools, medical equipment, appliances and recreation. The Airframe Products segment accounted for approximately 32 percent of our sales in fiscal 2015.
In general, fastener manufacturing begins with metal alloy wire or bar of various diameters, which is cut into fastener blanks of prescribed lengths, formed by highly engineered tools into complex head shapes and dimensional configurations, heat-treated to desired properties and then thread-rolled to meet exacting customer requirements.
Our aerospace fasteners and related components are manufactured from a variety of nickel, titanium, aluminum and steel alloys and are used on airframes, jet engines, aircraft wheels and brakes, landing gear assemblies, floor boards and hydraulic systems. They are found in critical areas of an aircraft, including wing-to-fuselage, stabilizer-to-fuselage and the engine-to-wing joints, as well as airfoil-to-disc and disc-to-shaft connections on a jet engine. These fasteners and related components are not only incorporated in new aircraft builds, but are also integrally involved in the maintenance and replacement cycle, particularly in aircraft engine and wheel and brake applications. The product line includes a variety of bolts, sleeved fastening systems, nuts, nut plates, latches, expandable diameter fasteners, quick release pins, hydraulic fittings, bushings, inserts, collars and other precision components, including but not limited to metallic and composite assemblies, and precision-machined components for airframe applications. While the fasteners and related components are predominantly produced to demanding
5
customer designs, we continue to be active in developing trademarked alloys for applications requiring high strength, elevated temperature, corrosion resistance and/or lighter weight including AEREX®, MULTIPHASE®, MP35N® and MP159® high-temperature, nickel-based alloys.
We have also developed a variety of fasteners, fittings, related components and installation tools for use in aerospace and industrial applications requiring proven strength, close dimensional tolerances and high reliability. These technically-advanced, proprietary products are marketed under the brand names of AVILOK®, BALL-LOK®, CHERRYBUCK®, CHERRYMAX®, CHERRYLOCK®, E-NUT®, FLEXLOC®, FLEXMATE®, FORCEMATE®, FORCETEC®, GROMEX®, HI-LIFE®, MAKE FROM SOLIDTM, MAXIBOLT®, PERMALITE®, PERMASWAGE®, SLEEVbolt®, STA-LOK®, TELLEP® and TUKLOC®. We also hold licenses to use various, well-recognized trademarks and technology in the manufacture of our fasteners and related components. These licensed trademarks include HI-LITE®, HI-LOK®, HI-TIGUE®, TORX®, TORX-PLUS®, TAPTITE®, MORTORQ® and MAThread®.
Our aerostructures facilities manufacture complex components and structural assemblies, including three- to five-axis prismatic and long-bed machined aluminum and titanium components, complex sheet metal fabrications, and composite and metal-bonded components. In addition, we have the capability to machine castings in a range of sizes, provide full-service chemical processing and metal finishing, and to kit, assemble and integrate multiple component parts.
Product applications include wing and fuselage structural parts; engine pylon-related assemblies; engine lock-plates and bracketry; complete passenger and exit doors; major flap support and actuation structures; spars, skins, and bulkheads up to 60 meters; swaged control rods, cables, and actuation and flight control assemblies; and complex latches, quick release BALL-LOK® pins, and specialized fasteners.
The Airframe Products segment also includes businesses that produce refiner plates for use in the pulp and paper industry; grinder pumps and affiliated components for low-pressure sewer systems for residential and commercial applications; critical auxiliary equipment and gas monitoring systems utilized in the power generation industry; critical engineered fasteners and cold-formed parts for the automotive and general industrial market; and a broad range of thread-rolling dies, trimming dies, pins and steel and carbide forging tools for fastener production, principally for aerospace, automotive, and general industrial and other applications.
In fiscal 2015, we acquired two businesses in the Airframe Products segment, including Aerospace Dynamics International ("ADI"). ADI is one of the premier suppliers in the aerospace industry, operating a wide range of high-speed machining centers. ADI has developed particular expertise in large complex components, hard-metal machining, and critical assemblies. ADI is located in Valencia, California, and employs approximately 625 people.
6
Sales and Distribution
We sell our complex metal components and products into three major market areas: aerospace, power, and general industrial and other. The percentage of sales to these markets is shown below for fiscal 2015, 2014 and 2013.
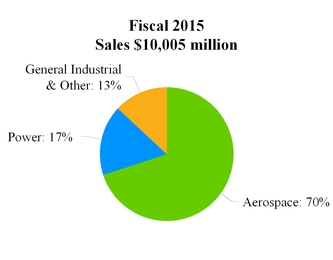

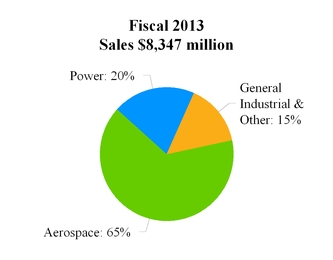
Our sales to the aerospace market of $6,961 million in fiscal 2015 increased 6 percent from $6,547 million in fiscal 2014. Sales to the aerospace market as a percentage of total net sales increased from 69 percent in fiscal 2014 to 70 percent in fiscal 2015, principally reflecting our strong positions on key growth commercial aerospace platforms, including the Boeing 787, Airbus A350 and the next-generation narrow-bodies. Our sales to the aerospace market of $6,547 million in fiscal 2014 increased 20 percent from $5,472 million in fiscal 2013. Sales to the aerospace market as a percentage of total net sales increased from 65 percent in fiscal 2013 to 69 percent in fiscal 2014, principally reflecting stable aircraft schedules and continued share gains on new airframe and engine development programs, and sales from acquired businesses.
Our sales of investment cast products and forged products are made through direct sales personnel located in each business operation and through field sales representatives located at U.S. and international locations near our major customers, as well as through distributors. Our airframe products and services are sold through a worldwide network of distributors and independent sales representatives and by a direct sales and marketing staff. Industrial metalworking tools and other metal products are sold by both internal sales forces and sales representatives in the U.S., Europe, Asia, Australia and Latin America. Due to the sophisticated nature of our products, our sales efforts require technical personnel to work closely with customers to identify and assist in the development of new and modified products and to provide other services that are necessary to obtain new and repeat orders.
For information on revenue from external customers, profit or loss and total assets for each segment, refer to Part II, Item 8. Financial Statements and Supplementary Data, Note 19—Segment information.
7
Major Customers
Net direct sales to General Electric Company were approximately 13 percent, 13 percent and 15 percent of total sales in fiscal 2015, 2014 and 2013, respectively, as follows:
2015 | 2014 | 2013 | |||||||||
Investment Cast Products | $ | 828 | $ | 736 | $ | 697 | |||||
Forged Products | 435 | 412 | 540 | ||||||||
Airframe Products | 36 | 66 | 39 | ||||||||
$ | 1,299 | $ | 1,214 | $ | 1,276 | ||||||
No other customer directly accounted for more than 10 percent of total sales; however, The Boeing Company, Airbus, Rolls-Royce plc, United Technologies Corporation, and Spirit AeroSystems are also considered key customers, and the loss of their business could have a material adverse effect on our financial results.
Backlog
The backlog of unfilled orders believed to be firm at the end of each of our last three fiscal years was $8.1 billion as of March 29, 2015, $7.3 billion as of March 30, 2014, and $6.8 billion as of March 31, 2013. The majority of the backlog is for sales to aerospace and power market customers in the Investment Cast Products, Forged Products and Airframe Products segments. The increase in backlog during fiscal 2015 reflects sales of machined parts mainly for the commercial aerospace market. The increase in backlog during fiscal 2014 reflects the continued growth in commercial aerospace and power markets, including interconnect pipe. Approximately 72 percent of our backlog is expected to be filled within the 2016 fiscal year.
The majority of sales to customers are made on individual purchase orders generated from long-term agreements. Most of our orders are subject to termination by the customer upon payment of the cost of work in process, plus a related profit factor. We typically do not experience significant order cancellations, although we periodically receive requests for delays in delivery schedules.
Competition
We are subject to substantial competition in all of the markets we serve. Components and products similar to those we make can be produced by competitors using either the same types of manufacturing processes or other forms of manufacturing. Although we believe our manufacturing processes, technology and experience provide advantages to our customers, such as high quality, competitive prices and physical properties that often meet more stringent demands, alternative forms of manufacturing can be used to produce many of the components and products we make. Despite intense competition, we believe we are the number one or two supplier in most of our principal markets. Several factors, including long-standing customer relationships, technical expertise, state-of-the-art facilities and dedicated employees, aid us in maintaining our competitive advantages.
In the Investment Cast Products segment, our principal competitor is Alcoa Inc. ("Alcoa"). Alcoa produces superalloy, titanium, stainless steel and aluminum investment castings principally for the aerospace and IGT markets. We believe that Alcoa is capable of producing investment castings comparable to all but the largest and most complex of our structural investment castings. We also believe Alcoa has the financial and technical resources to produce structural castings as large and complex as those produced by us, should they decide to do so. In addition, Allegheny Technologies, Inc. ("ATI"), manufactures large titanium investment castings for jet engine and airframe applications. Many other companies throughout the world also produce superalloy, titanium, stainless steel and aluminum investment castings, and some of these companies currently compete with us in the aerospace and other markets. Others are capable of competing with us if they choose to do so.
In the Forged Products segment, our largest competitors are ATI, Aubert & Duval SAS, and Otto Fuchs KG for aerospace turbine products, Alcoa for aerospace structural products, Vallourec SA and Nippon Steel Sumitomo Metal Corporation for energy products and ATI, Carpenter Technology Corporation, and ThyssenKrupp AG for nickel-based alloys and superalloys. We also face increased competition from international companies as customers seek lower cost sources of supply.
Our principal competitors in the aerospace titanium market are ATI and RTI International Metals, Inc. ("RTI"), both based in the U.S., and Verkhnaya Salda Metallurgical Production Organization ("VSMPO"), based in Russia. UNITI (a joint venture between ATI and VSMPO), RTI and certain Japanese producers are our principal competitors in the industrial and emerging markets.
8
International competition in the forging and casting processes may also increase in the future as a result of strategic alliances among aircraft prime contractors and overseas companies, particularly where “offset” or “local content” requirements create purchase obligations with respect to products manufactured in or directed to a particular country. Competition is often intense among the companies currently involved in the industry. We continue to strive to maintain competitive advantages with high-quality products, low-cost manufacturing, excellent customer service and expertise in engineering and production.
Our Airframe Products operations compete with a large number of companies based primarily on technology, price, service, product quality, product performance and delivery performance. Of these companies, our largest competitors are Alcoa, LISI, and TransDigm Group, Inc., in fastener products, and GKN PLC, Triumph Group, Inc., Mitsubishi Heavy Industries, Ltd., Kawasaki Heavy Industries, Ltd., and the internal machining operations of certain of our OEM customers in aerostructures products. We believe that we maintain our strong market position through our high-quality product performance, service to our customers and competitive synergies with other PCC business units.
Research and Development
We have departments involved in research and development in all three of our reportable segments. The research and development effort at these operations is primarily directed at the technical aspects of developing new and improved manufacturing processes. In addition, a substantial amount of our technological capability is the result of engineering work and experimentation performed on the shop floor in connection with process development and production of new parts. This engineering work and experimentation are charged to the cost of production.
Employees
At March 29, 2015, we had approximately 30,100 employees, including nearly 7,750 employees in the Investment Cast Products segment, approximately 9,450 employees in the Forged Products segment, approximately 12,550 employees in the Airframe Products segment, approximately 150 employees in corporate functions, and approximately 200 employees in discontinued operations. Approximately 22 percent of our employees are affiliated with unions or covered by collective bargaining agreements. We expect to negotiate 13 collective bargaining agreements affecting approximately 7 percent of the workforce during fiscal 2016. Management believes that labor relations in the Company have generally been satisfactory.
Patents and Trademarks
From time to time, we seek U.S. and foreign patent protection on certain of our processes and products. We have also federally registered several of our trademarks in the U.S. and foreign countries. We do not view patents or trademarks as materially important to our business as a whole. We also have rights and obligations under various license agreements. We receive no significant royalty income from patents.
Materials & Supplies
We use a number of raw materials in our products, including certain metals such as nickel, titanium, cobalt, tantalum and molybdenum, which are found in only a few parts of the world. These metals are required for the alloys used or manufactured in our Investment Cast, Forged and Airframe Product segments. The availability and costs of these metals may be influenced by private or governmental cartels, changes in world politics, labor relations between the metal producers and their work forces, and/or unstable governments in exporting nations and inflation. Supplies of the tool-grade steel we use may similarly be subject to variations in availability and cost. We have escalation clauses for nickel and other metals in certain of our long-term contracts with major customers, and we employ “price-in-effect” metal pricing in our alloy production businesses to lock in the current cost of metal at the time of production or shipment. We also enter into long-term supply agreements to fix the purchase price of strategic raw materials. Shortages of and price increases for certain raw materials we use have occurred in the past and may occur in the future. Future shortages or price fluctuations in raw materials could have a material adverse effect on us.
Government Regulations
Certain of our products are manufactured and sold under U.S. government contracts or subcontracts. Consequently, we are directly and indirectly subject to various federal rules, regulations and orders applicable to government contractors. Violation of applicable government rules and regulations could result in civil liability, in cancellation or suspension of existing contracts or in ineligibility for future contracts or subcontracts funded in whole or in part with federal funds.
9
International Operations
We purchase products from and supply products to businesses located outside the U.S. We have also been expanding our international activities during the past several years, primarily through acquisitions and the development of overseas subsidiaries. This expansion is part of our strategy to acquire and develop businesses that complement our core competencies, provide low-cost manufacturing, have strong growth prospects and maintain leading positions in their respective market niches. Certain risks are inherent in international operations, including the risk of government-financed competition, changes in trade policies, tariff regulations, the relative stability of certain foreign currencies and difficulties in obtaining U.S. export and import licenses. Information with respect to sales and assets by geographic location is included in Part II, Item 8. Financial Statements and Supplementary Data, Note 19—Segment information.
Environmental Compliance
We are subject to various federal, state and foreign environmental laws concerning, among other things, water discharges, air emissions, waste management, toxic use reduction and environmental cleanup. Environmental laws and regulations continue to evolve, and it is likely we will be subject to increasingly stringent environmental standards in the future, particularly under air quality and water quality laws and standards related to climate change issues, such as reporting of greenhouse gas emissions. It is also likely that we will be required to make additional expenditures, which could be significant, relating to environmental matters on an ongoing basis. We also own properties, or conduct or have conducted operations at properties, where hazardous materials have been used for many years, including during periods before careful management of these materials was required or generally believed to be necessary. Consequently, we are subject to environmental laws that impose liability for historical releases of hazardous substances.
Our financial statements include estimated liabilities for future costs arising from environmental issues relating to our properties and operations. At March 29, 2015, we had accrued environmental liabilities of approximately $448 million. We believe these liabilities are adequate to cover the cost of remedial measures that may eventually be required by environmental authorities with respect to known environmental matters. Our liabilities represent our best estimate of probable future obligations for the investigation and remediation of known contaminated sites. The liabilities include potential costs associated with asserted and unasserted claims. Our actual future expenditures, however, relating to compliance and cleanup of environmental conditions at our properties cannot be conclusively determined. The estimate of our environmental costs is based on currently available facts, present laws and regulations, and current technology and take into consideration our prior experience in site investigation and remediation, the data available for each site and the professional judgment of our environmental specialists and consultants. Although recorded liabilities include our best estimate of all probable costs, our total costs for the final settlement of each site cannot be predicted with certainty due to the variety of factors that make potential costs associated with contaminated sites inherently uncertain, such as the nature and extent of site contamination, available remediation alternatives, the extent to which remedial actions will be required, the time period over which costs will be incurred, the number and economic viability of other responsible parties and whether we have any opportunity of contribution from third parties, including recovery from insurance policies. Further, sites that are in the early stages of investigation are subject to greater uncertainties than mature sites that are close to completion. Although the sites we have identified vary across the spectrum, many of our sites could be considered at an early stage of the investigation and remediation process. Therefore, our cost estimates, and our accruals associated with those sites, are subject to greater uncertainties. Environmental contingent liabilities are often resolved over a long period of time, and the timing of expenditures depends on a number of factors that vary by site. We expect that we will expend present accruals over many years, and that remediation of all currently known sites will be completed within an estimated 41 years.
We have been named as a potentially responsible party (“PRP”) at sites identified by the Environmental Protection Agency (“EPA”) and state regulatory agencies for investigation and remediation under the Comprehensive Environmental Response, Compensation and Liability Act (“CERCLA”) and similar state statutes. In the environmental remediation context, PRPs may be subject to an allocation process to assess liability, and therefore the Company may be potentially liable to the government or third parties for an allocated portion or full cost of remediating contamination at our facilities or former facilities or at third-party sites where we have been designated a PRP. In estimating our current liabilities for environmental matters, we have assumed that we will not bear the entire cost of remediation of every site to the exclusion of other PRPs who may also be liable for contributing to the cost of cleanup. We are a party to various cost-sharing arrangements with other PRPs at certain sites. Our estimates of current liabilities factor in these cost-sharing arrangements and an assessment of the likelihood that such parties will fulfill their obligations at such sites. In the unlikely event that we are required to fully fund the remediation of a site, the statutory framework would allow us to pursue rights of contribution from other PRPs. We are identified as a PRP at the following federally designated Superfund sites: Boarhead Farms, Bridgeton, Pennsylvania; Operating Industries, Monterey Park, California; Casmalia Resources Site, Casmalia, California; Pasco Sanitary Landfill, Pasco, Washington; Quanta Resources Corp., Edgewater, New Jersey; and Peterson-Puritan Site, Cumberland, Rhode Island. Generally, these Superfund sites are mature, and almost all of the sites are in the remedial implementation phase and, as a consequence, are subject to less
10
uncertainty than newly discovered sites. These Superfund sites constitute approximately $2 million, or less than 1 percent, of our estimated environmental liabilities.
We have notified our insurers of potential environmental cleanup liabilities at various facilities, including the Superfund sites identified above, and have asserted that we are entitled to recover the defense and indemnity costs incurred, and to be incurred, under certain historic insurance policies. Our accruals include our best estimate of all probable costs, without reduction for anticipated recovery from insurance or third parties unless collection is probable. We have also asserted indemnity claims against third-parties for certain sites, and we expect to recover a portion of our losses with respect to these sites.
The Financial Accounting Standards Board (“FASB”) issued guidance on asset retirement and environmental obligations that clarifies the term "conditional asset retirement obligation" and requires a liability to be recorded if the fair value of the obligation can be reasonably estimated. Asset retirement obligations covered by this guidance include those for which an entity has an obligation to perform an asset retirement activity. However, the timing or method of settling the obligation are conditional on a future event that may not be within the control of the entity. This guidance also clarifies when an entity would have sufficient information to reasonably estimate the fair value of an asset retirement obligation.
In accordance with the asset retirement and environmental obligations guidance, we record all known asset retirement obligations for which the liability can be reasonably estimated. Currently, we have identified known asset retirement obligations associated with environmental contamination at several of our manufacturing facilities and have accrued approximately $5 million to satisfy these asset retirement obligations. However, we have not recognized a liability for an asset retirement obligation at two of our manufacturing facilities, because the fair value of the retirement obligation at these sites cannot be reasonably estimated since the settlement date is unknown at this time. The settlement date is unknown because the retirement obligation (remediation of contamination) of these sites is not required until production ceases, and we have no current or future plans to cease production. These asset retirement obligations, when estimable, are not expected to have a material adverse effect on our consolidated financial position, results of operations, cash flows or business.
Forward-looking Statements
Information included within this Form 10-K describing the projected growth and future results and events constitutes forward-looking statements, within the meaning of the Private Securities Litigation Reform Act of 1995. Actual results in future periods may differ materially from the forward-looking statements because of a number of risks and uncertainties, including but not limited to fluctuations in the aerospace, power generation, and general industrial cycles; the relative success of our entry into new markets; competitive pricing; the financial viability of our significant customers; the concentration of a substantial portion of our business with a relatively small number of key customers; the impact on the Company of customer or supplier labor disputes; demand, timing, and market acceptance of new commercial and military programs, and our ability to accelerate production levels to meet order increases on new or existing programs in a timely fashion; the availability and cost of energy, raw materials, supplies, and insurance; the cost of pension and postretirement medical benefits; equipment failures; product liability claims; changes in inventory valuations; cybersecurity threats; relations with our employees; our ability to manage our operating costs and to integrate acquired businesses in an effective manner, including the ability to realize expected synergies; the timing of new acquisitions; misappropriation of our intellectual property rights; governmental regulations and environmental matters; risks associated with international operations and world economies; the relative stability of certain foreign currencies; fluctuations in oil & gas prices and production; the impact of adverse weather conditions or natural disasters; the availability and cost of financing; and the implementation of new technologies and process improvements. Any forward-looking statements should be considered in light of these factors. We undertake no obligation to update any forward-looking information to reflect anticipated or unanticipated events or circumstances after the date of this document.
Available Information
Our Annual Report on Form 10-K, quarterly reports on Form 10-Q, proxy statement, current reports on Form 8-K and amendments to these reports filed with the Securities and Exchange Commission, as well as the annual report to shareholders, quarterly earnings releases, the Audit Committee Charter, the Nominating and Corporate Governance Committee Charter, the Compensation Committee Charter, Corporate Governance Guidelines and the Code of Conduct may be received free of charge by calling Investor Relations at (503) 946-4850 or sending an email to info@precastcorp.com. This information may also be downloaded from the PCC Corporate Center at www.precast.com.
11
ITEM 1A. | RISK FACTORS |
Our growth strategy includes business and capital equipment acquisitions with associated risks.
Our growth strategy includes the acquisition of strategic operations and capital equipment. We have completed a number of acquisition transactions in recent years. We expect that we will continue to seek acquisitions of complementary businesses, products, capital equipment and technologies to add products and services for our core customer base and for related markets, and will also continue to expand each of our businesses geographically. The success of the completed transactions will depend on our ability to integrate assets and personnel and to apply our manufacturing processes and controls to the acquired businesses. Although our acquisition strategy generally emphasizes the retention of key management of the acquired businesses and an ability of the acquired business to continue to operate independently, various changes may be required to integrate the acquired businesses into our operations, to assimilate new employees and to implement reporting, monitoring and forecasting procedures. Business and capital equipment acquisitions entail a number of other risks, including as applicable:
• | inaccurate assessment of liabilities; |
• | entry into markets in which we may have limited or no experience; |
• | diversion of management's attention from our existing businesses; |
• | difficulties in realizing projected efficiencies, synergies, installation schedules and cost savings; |
• | decrease in our cash or an increase in our indebtedness and a limitation in our ability to access additional capital |
when needed; and |
• | risks associated with investments where we do not have full operational control. |
Our failure to adequately address these acquisition risks could cause us to incur increased expenses or to fail to realize the benefits we anticipated from the transactions.
We operate in cyclical markets.
A significant portion of our revenues are derived from the highly cyclical aerospace and power generation markets. Our sales to the aerospace industry constituted 70 percent of our total sales in fiscal 2015. Our sales to the power market constituted 17 percent of our total sales in fiscal 2015.
The commercial aerospace industry is historically driven by the demand from commercial airlines for new aircraft. The U.S. and international commercial aviation industries continue to face challenges arising from competitive pressures and fuel costs. Demand for commercial aircraft is influenced by airline industry profitability, trends in airline passenger traffic, the state of U.S. and world economies, the ability of aircraft purchasers to obtain required financing and numerous other factors including the effects of terrorism, health and safety concerns and environmental constraints imposed upon aircraft operators. The military aerospace cycle is highly dependent on U.S. and foreign government funding; however, it is also driven by the effects of terrorism, a changing global political environment, U.S. foreign policy, the retirement of older aircraft and technological improvements to new engines. Accordingly, the timing, duration and severity of cyclical upturns and downturns cannot be forecast with certainty. Downturns or reductions in demand could have a material adverse effect on our business.
The power generation market is also cyclical in nature. Demand for power generation products is global and is affected by the state of the U.S. and world economies, the availability of financing to power generation project sponsors, the political environments of numerous countries and environmental constraints imposed upon power project operators. The availability of fuels and related prices also have a large impact on demand. Reductions in demand for our power generation products could have a material adverse effect on our business.
We also sell products and services to customers in the oil and gas, automotive, chemical and petrochemical, medical, industrial process, and other general industrial markets. Each of these markets is cyclical in nature, and the market for oil and gas products can be particularly volatile. Customer demand for our products or services in these markets may fluctuate widely depending upon U.S. and world economic conditions, the availability of financing and industry-specific factors, which for the oil and gas market include the levels of exploration, development, and production activity of oil and natural gas companies and the trends in oil and natural gas prices. Cyclical declines or sustained weakness in any of these markets could have a material adverse effect on our business.
Our business is dependent on a small number of direct and indirect customers.
A substantial portion of our business is conducted with a relatively small number of large direct and indirect customers, including General Electric Company, United Technologies Corporation, Rolls Royce plc, Airbus, Spirit AeroSystems, and The Boeing Company. General Electric accounted for approximately 13 percent of our total sales for fiscal 2015. No other customer directly accounted for more than 10 percent of total sales; however, Boeing, Airbus, Rolls Royce, Spirit AeroSystems, and United Technologies are also considered key customers. A financial hardship experienced by any one of these key customers,
12
the loss of any of them or a reduction in or substantial delay of orders from any of them could have a material adverse effect on our business.
In addition, a significant portion of our aerospace products are ultimately used in the production of new commercial aircraft. There are only two primary manufacturers of large commercial aircraft in the world, Boeing and Airbus. A significant portion of our aerospace sales are dependent on the number of new aircraft built by these two manufacturers, which is in turn dependent on a number of factors over which we have little or no control. Those factors include the demand for new aircraft from airlines around the globe and factors that impact manufacturing capabilities, such as the availability of raw materials and manufactured components, changes in the regulatory environment and labor relations between the aircraft manufacturers and their work forces. A significant interruption or slowdown in the number of new aircraft built by aircraft manufacturers could have a material adverse effect on our business.
Sales to the military sector constituted approximately 10 percent of our fiscal 2015 sales. Defense spending is subject to appropriations and to political pressures that influence which programs are funded and which are canceled. Reductions in domestic or foreign defense budgets or military aircraft procurement, delays in funding or reprioritization of government spending away from defense programs in which we participate could adversely affect our business.
Our business depends, in part, on the success of new commercial and military aircraft programs.
The success of our business will depend, in part, on the success of new commercial and military aircraft programs including the Boeing 787, Boeing 737Max, Boeing 777X, Airbus A350, Airbus A320neo, Airbus A330neo and F-35 programs. We are currently under contract to supply components for a number of new commercial, general aviation and military aircraft programs. These new programs as well as certain existing aircraft programs are scheduled to have production increases over the next several years. Our failure to accelerate production levels to timely match these order increases could have a material adverse effect on our business. Cancellation, reductions or delays of orders or contracts by our customers on any of these programs, or regulatory or certification-related groundings or other delays to any new aircraft programs or to the scheduled production increases for existing aircraft programs, could also have a material adverse effect on our business.
The competitive nature of our business results in pressure for price concessions to our customers and increased pressure to reduce our costs.
We are subject to substantial competition in all of the markets we serve, and we expect this competition to continue. As a result, we have made significant long-term price concessions to our customers in the aerospace and power generation markets from time to time, and we expect customer pressure for further long-term price concessions to continue. Maintenance of our market share will depend, in part, on our ability to sustain a cost structure that enables us to be cost-competitive. If we are unable to adjust our costs relative to our pricing, our profitability will suffer. Our effectiveness in managing our cost structure will be a key determinant of future profitability and competitiveness.
Our business is dependent on a number of raw materials that are subject to volatility in price and availability.
We use a number of raw materials in our products, including certain metals such as nickel, titanium, cobalt, tantalum and molybdenum, various rare earth elements, and titanium-containing feedstock ore (natural rutile and upgraded ilmenite), which are found in only a few parts of the world, are available from a limited number of suppliers and, in some cases, are considered conflict minerals for U.S. regulatory purposes if originating in certain countries. The availability and costs of these metals and elements may be influenced by private or government cartels, changes in world politics or regulatory requirements, labor relations between the producers and their work forces, unstable governments in exporting nations, export quotas imposed by governments in countries with rare earth element supplies, market forces of supply and demand, and inflation. These raw materials are required for the alloys or processes used or manufactured in our investment cast products, forged products and airframe products segments. We have escalation clauses for nickel, titanium and other metals in a number of our long-term contracts with major customers, but we are not usually able to fully offset the effects of changes in raw material costs. We also employ “price-in-effect” metal pricing in our alloy production businesses to lock-in the current cost of metal at the time of production or time of shipment. The ability of key metal suppliers to meet quality and delivery requirements can also impact our ability to meet commitments to customers. Future shortages (either to us or our customers) or price fluctuations in raw materials could result in decreased sales or margins or otherwise adversely affect our business. The enactment of new or increased import duties on raw materials imported by us could also increase the costs to us of obtaining the raw materials and might adversely affect our business.
Our business is affected by federal rules, regulations and orders applicable to government contractors.
A number of our products are manufactured and sold under U.S. government contracts or subcontracts. Consequently, we are directly and indirectly subject to various federal rules, regulations and orders applicable to government contractors. From time to time, we are also subject to government inquiries and investigations of our business practices due to our participation in
13
government programs. These inquiries and investigations are costly and consuming of internal resources. Violation of applicable government rules and regulations could result in civil liability, in cancellation or suspension of existing contracts or in ineligibility for future contracts or subcontracts funded in whole or in part with federal funds, any of which could have a material adverse effect on our business.
Our business is subject to environmental regulations and related liabilities and liabilities associated with chemicals and substances in the workplace.
We are subject to various federal, state and foreign environmental laws and regulations concerning, among other things, water discharges, air emissions, hazardous material and waste management and environmental cleanup. Environmental laws and regulations continue to evolve and we may become subject to increasingly stringent environmental standards in the future, particularly under air quality and water quality laws and standards related to climate change issues, such as reporting of greenhouse gas emissions. We are required to comply with environmental laws and the terms and conditions of environmental permits required for our operations. Failure to comply with these laws or permits could result in fines and penalties, interruption of manufacturing operations or the need to install pollution control equipment that could be costly. We also may be required to make additional expenditures, which could be significant, relating to environmental matters on an ongoing basis. We also own properties, or conduct or have conducted operations at properties, where hazardous materials have been used for many years, including during periods before careful management of these materials was required or generally believed to be necessary. Consequently, we will continue to be subject to environmental laws that impose liability for historical releases of hazardous substances.
Our financial statements include estimated liabilities for future costs arising from environmental issues relating to our properties and operations. Our accruals for known environmental liabilities represent our best estimate of our probable future obligations for the investigation and remediation of known contaminated sites. Our accruals include asserted and unasserted claims. The estimates of our environmental costs are based on currently available facts, present laws and regulations and current technology and take into consideration our prior experience in site investigation and remediation, the data available for each site and the professional judgment of our environmental specialists and consultants. Although recorded liabilities include our best estimate of all probable costs, our total costs for the final settlement of each site cannot be predicted with certainty due to the variety of factors that make potential costs associated with contaminated sites inherently uncertain, such as the nature and extent of site contamination, available remediation alternatives, the extent to which remedial actions will be required, the time period over which costs will be incurred, the number and economic viability of other responsible parties and whether we have any opportunity of contribution from third parties, including recovery from insurance policies. In addition, sites that are in the early stages of investigation are subject to greater uncertainties than mature sites that are close to completion. Although the sites we identify vary across the spectrum, a majority of our sites could be considered at an early stage of the investigation and remediation process. Therefore, our cost estimates and the accruals associated with those sites are subject to greater uncertainties. Environmental contingent liabilities are often resolved over a long period of time, and the timing of expenditures depends on a number of factors that vary by site. We expect that we will expend present accruals over many years, and that remediation of all currently known sites will be completed within an estimated 41 years. We cannot ensure that our estimated liabilities are adequate to cover the total cost of remedial measures that may eventually be required by environmental authorities with respect to known environmental matters or the cost of claims that may be asserted in the future with respect to environmental matters about which we are not yet aware. Accordingly, the costs of environmental remediation or claims may exceed the amounts accrued.
We have been named as a PRP at sites identified by the EPA and state regulatory agencies for investigation and remediation under CERCLA and similar state statutes. In the environmental remediation context, potentially responsible parties may be subject to an allocation process to determine liability, and therefore we may be potentially liable to the government or third parties for an allocated portion or full cost of remediating contamination at our facilities or former facilities or at third-party sites where we have been designated a PRP. In estimating our current liabilities for environmental matters, we have assumed that we will not bear the entire cost of remediation of every site to the exclusion of other PRPs who may also be liable. It is also possible that we will be designated a PRP at additional sites in the future.
Like many other industrial companies in recent years, we are defendants in lawsuits alleging personal injury as a result of exposure to chemicals and substances in the workplace, including asbestos. To date, we have been dismissed from a number of these suits and have settled a number of others. The outcome of litigation such as this is difficult to predict, and a judicial decision unfavorable to us could be rendered, possibly having a material adverse effect on our business.
Our business is subject to risks associated with international operations.
We purchase products from and supply products to businesses located outside of the U.S. We also have significant operations located outside the U.S. In fiscal 2015, approximately 17 percent of our total sales were attributable to our non-U.S.
14
subsidiaries. A number of risks inherent in international operations could have a material adverse effect on our results of operations, including:
• | fluctuations in U.S. dollar value arising from transactions denominated in foreign currencies and the translation of certain foreign currency subsidiary balances; |
• | difficulties in staffing and managing multi-national operations; |
• | general economic and political uncertainties and potential for social unrest in countries in which we or our customers operate; |
• | limitations on our ability to enforce legal rights and remedies; |
• | restrictions on the repatriation of funds; |
• | changes in trade policies; |
• | tariff regulations; |
• | difficulties in obtaining export and import licenses; |
• | the risk of government financed competition; and |
• | compliance with a variety of international laws as well as U.S. and other laws affecting the activities of companies abroad. |
A majority of our sales of extruded pipe for the power generation market have been exported to power generation customers in China. These sales are subject to the risks associated with international sales generally. In addition, changes in demand could result from a reduction of power plant build rates in China due to economic conditions or otherwise, or increased competition from local manufacturers who have cost advantages or who may be preferred suppliers, or effects of anti-dumping or other import duties. Also, Chinese commercial laws, regulations and interpretations applicable to non-Chinese market participants such as us are rapidly changing. These laws, regulations and interpretations could impose restrictions on our ownership or operations of our interests in China and have a material adverse effect on our business.
Any lower-than-expected rating of our bank debt and debt securities could adversely affect our business.
Two rating agencies, Moody's and Standard & Poor's, rate our debt securities. If the rating agencies were to reduce their current ratings, our interest expense may increase, our access to short-term commercial paper markets may be restricted, and the terms of future borrowing arrangements may become more stringent or require additional credit support. Our ability to comply with covenants contained in the instruments governing our existing and future indebtedness may be affected by events and circumstances beyond our control. If we breach any of these covenants, one or more events of default, including cross-defaults between multiple components of our indebtedness, could result. These events of default could permit our creditors to declare all amounts owing to be immediately due and payable and terminate any commitments to make further extensions of credit, or could otherwise have a material adverse effect on our business.
Our production may be interrupted due to equipment failures or other events affecting our factories.
Our manufacturing processes depend on certain sophisticated and high-value equipment, such as some of our forging presses for which there may be only limited or no production alternatives. Unexpected failures of this equipment could result in production delays, revenue loss and significant repair costs. In addition, our factories rely on the availability of electrical power and natural gas, transportation for raw materials and finished products and employee access to our workplace that are subject to interruption in the event of severe weather conditions or other natural or manmade events. While we maintain backup resources to the extent practicable, a severe or prolonged equipment outage or other interruptive event affecting areas where we have significant manufacturing operations may result in loss of manufacturing or shipping days, which could have a material adverse effect on our business. Natural or manmade events that interrupt significant manufacturing operations of our customers also could have a material adverse effect on our business.
Failure to protect our intellectual property rights could adversely affect our business.
We rely on a combination of confidentiality, invention assignment and other types of agreements and trade secret, trademark, and patent law to establish, maintain, protect and enforce our intellectual property rights. Our efforts in regard to these measures may be inadequate, however, to prevent others from misappropriating our intellectual property rights. In addition, laws in some non-U.S. countries affecting intellectual property are uncertain in their application, which can affect the scope or enforceability of our intellectual property rights. Any of these events or factors could diminish or cause us to lose the competitive advantages associated with our intellectual property, which could have a material adverse effect on our business.
15
We could be faced with labor shortages, disruptions or stoppages if our relations with our employees were to deteriorate.
Our operations rely heavily on our skilled employees. Any labor shortage, disruption or stoppage caused by any deterioration in employee relations or difficulties in the renegotiation of labor contracts could reduce our operating margins and income. Approximately 22 percent of our employees are affiliated with unions or covered by collective bargaining agreements. Failure to negotiate a new labor agreement when required could result in a work stoppage. Although we believe that our labor relations have generally been satisfactory, it is possible that we could become subject to additional work rules imposed by agreements with labor unions, or that work stoppages or other labor disturbances could occur in the future, any of which could reduce our operating margins and income and place us at a disadvantage relative to non-union competitors.
Cybersecurity threats could disrupt our business and result in the loss of critical and confidential information.
We have experienced, and expect to continue to experience, cybersecurity threats, including threats to our information technology infrastructure and attempts to gain access to our confidential and proprietary information. Although we maintain information security policies and procedures to prevent, detect, and mitigate these threats, cybersecurity incidents, depending on their nature and scope, could potentially result in the misappropriation, destruction, corruption or unavailability of critical data and confidential or proprietary information (our own or that of third parties) and the disruption of business operations. The potential consequences of a material cybersecurity incident include reputational damage, litigation with third parties, theft of intellectual property, and increased cybersecurity protection and remediation costs, which in turn could have a material adverse effect on our business.
Product liability and contractual liability risks could adversely affect our operating results.
We produce many critical parts for commercial and military aircraft, for high-pressure applications in power plants and for oil and gas applications. Failure of our parts could give rise to substantial product liability claims. We maintain insurance addressing the risk of product liability claims arising from bodily injury or property damage (which generally does not include damages for pollution or environmental liability), but there can be no assurance that the insurance coverage will be adequate or will continue to be available on terms acceptable to us. We manufacture most of our parts to strict contractually-established standards, tolerances and delivery schedules using complex manufacturing processes. If we fail to meet the contractual requirements for a product we may be subject to contractual liability costs and claims. Contractual liability costs are generally not insured.
Our inventories could be subject to significant valuation changes due to our use of the last-in, first-out ("LIFO") inventory valuation method.
The cost for the majority of our inventories is determined on a LIFO basis. Under the LIFO valuation method for inventories, changes in the cost inputs to produce inventories, including raw materials, labor and fixed costs, are recognized in cost of goods sold in the current period. Accordingly, the carrying value of our LIFO inventories may be higher or lower than current replacement costs for such inventory. When LIFO cost is greater than current cost, there is an increased likelihood that our inventories could be subject to write-downs to market value. As of March 29, 2015, the LIFO cost of our inventories exceeds the current cost by $679 million. The key drivers that are causing our LIFO costs to exceed current costs are discussed in Part II, Item 7. Management’s Discussion and Analysis of Financial Condition and Results of Operations under the heading of “Critical accounting policies” and the sub-heading “Valuation of inventories.” If actual demand is significantly less than the future demand that we have projected, inventory write-downs may be required, which could have a material adverse effect on the value of our inventories and reported operating results.
We could be required to make additional contributions to our defined benefit pension and postretirement benefit plans as a result of adverse changes in interest rates and pension investments.
Our estimates of liabilities and expenses for pensions and other postretirement benefits incorporate significant assumptions including the rate used to discount the future estimated liability, the long-term rate of return on plan assets and assumptions relating to the employee workforce including salary increases, medical costs, retirement age and mortality. Our results of operations, liquidity or shareholders' equity in a particular period could be affected by a decline in the rate of return on plan assets, the rate used to discount the future estimated liabilities or changes in employee workforce assumptions. We may have to contribute more cash to various pension plans and record higher pension-related expenses in future periods as a result of decreases in the value of investments held by these plans or changes in discount rates or other pension assumptions.
A global recession or disruption in global financial markets could adversely affect us.
A global recession or disruption in the global financial markets presents risks and uncertainties that we cannot predict. During the recent recession, we saw a moderate decline in demand for our products due to global economic conditions. However, our access to credit to finance our operations was not materially limited. If recessionary economic conditions or financial market disruptions were to return, we would face risks that may include:
16
• | declines in revenues and profitability from reduced or delayed orders by our customers; |
• | supply problems associated with any financial constraints faced by our suppliers; |
• | restrictions on our access to short-term commercial paper borrowings or other credit sources; |
• | reductions to our banking group or to our committed credit availability due to combinations or failures of financial institutions; and |
• | increases in corporate tax rates to finance government spending programs. |
ITEM 1B. | UNRESOLVED STAFF COMMENTS |
None.
ITEM 2. | PROPERTIES |
Our manufacturing plants and administrative offices, along with certain information concerning the products and facilities are described below:
Building Space (sq. ft.) | |||||||||||
Division | No. of Facilities | Leased | Owned | Total | |||||||
Executive & Corporate Offices | |||||||||||
Domestic | 1 | — | 42,118 | 42,118 | |||||||
International | 1 | 1,312 | — | 1,312 | |||||||
Investment Cast Products | |||||||||||
Domestic | 50 | 783,520 | 2,519,127 | 3,302,647 | |||||||
International | 4 | — | 404,856 | 404,856 | |||||||
Forged Products | |||||||||||
Domestic | 87 | 2,481,706 | 9,623,890 | 12,105,596 | |||||||
International | 33 | 998,068 | 2,083,465 | 3,081,533 | |||||||
Airframe Products | |||||||||||
Domestic | 79 | 1,753,133 | 3,871,063 | 5,624,196 | |||||||
International | 28 | 596,066 | 1,092,836 | 1,688,902 | |||||||
Discontinued Operations | |||||||||||
Domestic | 2 | — | 120,200 | 120,200 | |||||||
International | 4 | 295,576 | 44,882 | 340,458 | |||||||
Total Company | |||||||||||
Domestic | 219 | 5,018,359 | 16,176,398 | 21,194,757 | |||||||
International | 70 | 1,891,022 | 3,626,039 | 5,517,061 | |||||||
Total | 289 | 6,909,381 | 19,802,437 | 26,711,818 | |||||||
We believe our principal properties include facilities suitable and adequate for our present needs for the manufacture of our products; see Item 7. Management’s Discussion and Analysis.
ITEM 3. | LEGAL PROCEEDINGS |
For a general description of environmental matters, see Item 1. Business—Environmental Compliance.
As of March 29, 2015, there were approximately 117 lawsuits pending against the Company alleging personal injury as the result of exposure to particulates, including asbestos, integrated into our premises or processes or into certain historical products. It is frequently not possible at the outset of a case to determine which of the plaintiffs actually will pursue a claim against the Company. Typically, that can only be determined through discovery after a case has been filed. Thus, in a case involving multiple plaintiffs, unless otherwise expressed in the pleadings, the Company accounts for the lawsuit as one claim against it. Provided below is a chart showing the number of new claims filed (as described above), the number of claims disposed of (settled or otherwise dismissed) and the approximate dollar amount paid by or on behalf of (including through insurance) the Company in settlement of these claims:
17
Fiscal | 2015 | 2014 | |||||
New Claims Filed | 44 | 42 | |||||
Claims Disposed Of | 21 | 12 | |||||
Dollars Paid in Settlement (in millions) | $ | — | $ | — | |||
The Company considers that all such claims are tort claims while noting that some claims, such as those filed in West Virginia, were historically common law “employer liability” cases and are now based on a statutory definition of requisite intent.
The particulates in question are no longer incorporated into our products, and we have implemented safety protocols to reduce exposure to remaining particulates in the workplace. Based on the information available to us at the date of filing of this report, we believe, based on our review of the facts and law, that the potential exposure from the resolution of any or all of these matters will not have a material adverse effect on our consolidated financial position, results of operations, cash flows or business.
Various claims and lawsuits arising during the normal course of business are pending against us. In the opinion of management, the outcome of these lawsuits will not have a material adverse effect on our consolidated financial position, results of operations, cash flows or business.
ITEM 4. | MINE SAFETY DISCLOSURES |
Not applicable.
ITEM 4A. | EXECUTIVE OFFICERS OF THE REGISTRANT (a) |
Name | Officer Since | Age | Position Held With the Registrant |
Mark Donegan | (b) 1992 | 58 | Chairman and Chief Executive Officer |
Shawn R. Hagel | (c) 1997 | 49 | Executive Vice President, Chief Financial Officer and Assistant Secretary |
Ruth A. Beyer | (d) 2013 | 59 | Senior Vice President, General Counsel and Secretary |
Steven G. Hackett | (e) 2004 | 57 | Executive Vice President |
Andrew V. Masterman | (f) 2012 | 47 | Executive Vice President and President - Wyman-Gordon |
James R. Pieron | (g) 2015 | 60 | Senior Vice President and President - TIMET and Special Metals |
Alan J. Power | (h) 2015 | 52 | Senior Vice President and President - Airframe Products |
Kirk G. Pulley | (i) 2004 | 46 | Vice President - Strategic Planning and Corporate Development |
_________________________
(a) | The above information is reported as of May 21, 2015. The officers serve for a term of one year and until their successors are elected. Unless otherwise indicated, all positions have been held for the last five years. |
(b) | Elected Chairman in 2003 and Chief Executive Officer in 2002. Previously was elected Executive Vice President in 1992. Named President - Wyman-Gordon in 1999. Previously served as President - PCC Structurals. |
(c) | Elected Executive Vice President in 2012 and Chief Financial Officer and Assistant Secretary in 2008. Previously was elected Vice President and Corporate Controller in 2000. |
(d) | Elected Senior Vice President, General Counsel and Secretary in 2013. Prior to joining PCC, she was a Partner at Stoel Rives LLP. |
(e) | Elected Executive Vice President in 2013 and previously served as Senior Vice President and President of TIMET. Prior to that he served in various roles as Senior Vice President, New Business Integration; Executive Vice President and President of Investment Cast Products; Executive Vice President and President of Fastener Products; and Vice President in charge of PCC Structurals’ Small Structural Business Operations. |
(f) | Elected Executive Vice President and President - Wyman-Gordon in May 2015. Previously elected Executive Vice President and President - Airframe Products in November 2013. He became Senior Vice President in August 2013 and President - PCC Fastener Products and a PCC Vice President in April 2012. Prior to joining PCC, he served as President & CEO of ESAB North America. |
(g) | Elected Senior Vice President and President - TIMET and Special Metals in May 2015. He became President of TIMET in October 2013 and prior to that served as TIMET’s Executive Vice President of Global Operations. |
(h) | Elected Senior Vice President and President - Airframe Products in May 2015. Prior to joining PCC, he was President and Chief Operating Officer from 2009 to 2013 of the Industrial & Automotive and Gates Corporation divisions of Tomkins plc. |
(i) | Elected Vice President - Strategic Planning and Corporate Development in 2004. Prior to joining PCC, he was a Vice President in investment banking with Goldman Sachs & Co. |
18
PART II
ITEM 5. | MARKET FOR REGISTRANT’S COMMON EQUITY, RELATED STOCKHOLDER MATTERS AND ISSUER PURCHASES OF EQUITY SECURITIES |
As of March 29, 2015, there were 793 shareholders of record of our common stock. The principal market for our common stock is the New York Stock Exchange, where it trades under the symbol PCP. For information concerning the quarterly high and low sales prices of PCC common stock and dividend data, refer to the Quarterly Financial Information table in Item 8. Financial Statements and Supplementary Data. We expect to continue to pay quarterly cash dividends, subject to our earnings, financial condition and other factors.
Return to Shareholders Performance Graph
The following line graph provides a comparison of the annual percentage change in the Company’s cumulative total shareholder return on its common stock to the cumulative total return of the S&P 500 Index and the S&P 500 Aerospace and Defense Index. The comparison assumes that $100 was invested on March 31, 2010 in PCC common stock and in each of the foregoing indices and, in each case, assumes the reinvestment of dividends.

MEASUREMENT PERIOD
(by fiscal year)
2010 | 2011 | 2012 | 2013 | 2014 | 2015 | ||||||||||||
S&P 500 | 100.00 | 116.50 | 125.82 | 143.39 | 173.35 | 196.29 | |||||||||||
S&P 500 Aerospace & Defense | 100.00 | 111.27 | 115.76 | 134.28 | 189.54 | 218.50 | |||||||||||
Precision Castparts Corp. | 100.00 | 120.94 | 139.87 | 153.51 | 200.53 | 171.95 | |||||||||||
19
Issuer Purchases of Equity Securities
The following table provides information about purchases of our common stock during the quarter ended March 29, 2015:
Period | Total Number of Shares Purchased | Average Price Paid per Share | Total Number of Shares Purchased as Part of Publicly Announced Plans or Programs (1) | Maximum Dollar Value that May Yet Be Purchased Under the Plans or Programs (1) (in millions) | |||||||||
12/29/14-2/1/15 | 2,339,368 | $ | 208.29 | 8,670,835 | $ | 556 | |||||||
2/2/15-3/1/15 | 863,798 | $ | 212.30 | 9,534,633 | $ | 372 | |||||||
3/2/15-3/29/15 | 277,461 | $ | 209.09 | 9,812,094 | $ | 314 | |||||||
Total | 3,480,627 | $ | 209.35 | 9,812,094 | $ | 314 | |||||||
(1) | On January 24, 2013, we publicly announced that our Board of Directors had authorized a program for the Company to purchase up to $750 million of our Company's common stock. On August 13, 2013, the Board of Directors approved an additional $750 million for use in the Company's stock repurchase program. On August 13, 2014, the Board of Directors approved an additional $1.0 billion, effective immediately and continuing through September 30, 2016. |
* | On May 13, 2015, the Board of Directors approved a $2.0 billion expansion to the Company's existing program to repurchase shares of the Company’s common stock, effective immediately and continuing through June 30, 2017. The Company intends to repurchase outstanding shares from time to time in the open market, subject to market conditions. |
20
ITEM 6. | SELECTED FINANCIAL DATA |
Five-Year Summary of Selected Financial Data
(Unaudited) (In millions, except employee, shareholder and per share data) | |||||||||||||||||||
Fiscal | 2015 | 2014 | 2013 | 2012 | 2011 | ||||||||||||||
Net sales | $ | 10,005 | $ | 9,533 | $ | 8,347 | $ | 7,202 | $ | 6,209 | |||||||||
Net income | $ | 1,533 | $ | 1,784 | $ | 1,430 | $ | 1,226 | $ | 1,015 | |||||||||
Net income attributable to PCC shareholders: | |||||||||||||||||||
Continuing operations | $ | 1,545 | $ | 1,752 | $ | 1,431 | $ | 1,230 | $ | 1,009 | |||||||||
Net income attributable to PCC shareholders | $ | 1,530 | $ | 1,777 | $ | 1,427 | $ | 1,224 | $ | 1,014 | |||||||||
Return on sales from continuing operations | 15.4 | % | 18.4 | % | 17.1 | % | 17.1 | % | 16.3 | % | |||||||||
Return on beginning shareholders’ equity from continuing operations | 13.5 | % | 17.9 | % | 17.1 | % | 17.2 | % | 17.1 | % | |||||||||
Net income per common share attributable to PCC (basic): | |||||||||||||||||||
Continuing operations | $ | 10.83 | $ | 12.03 | $ | 9.82 | $ | 8.52 | $ | 7.07 | |||||||||
Net income | $ | 10.73 | $ | 12.20 | $ | 9.79 | $ | 8.48 | $ | 7.10 | |||||||||
Net income per common share attributable to PCC (diluted): | |||||||||||||||||||
Continuing operations | $ | 10.77 | $ | 11.95 | $ | 9.75 | $ | 8.45 | $ | 7.01 | |||||||||
Net income | $ | 10.66 | $ | 12.12 | $ | 9.72 | $ | 8.41 | $ | 7.04 | |||||||||
Weighted average shares of common stock outstanding | |||||||||||||||||||
Basic | 142.6 | 145.6 | 145.7 | 144.4 | 142.7 | ||||||||||||||
Diluted | 143.5 | 146.6 | 146.7 | 145.6 | 143.9 | ||||||||||||||
Cash dividends declared per common share | $ | 0.12 | $ | 0.12 | $ | 0.12 | $ | 0.12 | $ | 0.12 | |||||||||
Working capital | $ | 3,145 | $ | 3,899 | $ | 3,368 | $ | 2,715 | $ | 2,709 | |||||||||
Total assets | $ | 19,428 | $ | 18,586 | $ | 16,896 | $ | 10,559 | $ | 8,956 | |||||||||
Total debt(1) | $ | 4,587 | $ | 3,572 | $ | 3,807 | $ | 208 | $ | 237 | |||||||||
Total equity | $ | 10,957 | $ | 11,413 | $ | 9,804 | $ | 8,365 | $ | 7,164 | |||||||||
Total debt as a percent of total debt and equity | 29.5 | % | 23.8 | % | 28.0 | % | 2.4 | % | 3.2 | % | |||||||||
Book value per share | $ | 79.05 | $ | 78.66 | $ | 67.06 | $ | 57.57 | $ | 49.85 | |||||||||
Capital expenditures(1) | $ | 457 | $ | 355 | $ | 323 | $ | 194 | $ | 121 | |||||||||
Number of employees(1) | 30,106 | 29,085 | 28,510 | 21,480 | 18,308 | ||||||||||||||
Number of shareholders of record | 793 | 848 | 933 | 1,068 | 1,206 | ||||||||||||||
____________________________________________
(1) | Includes discontinued operations |
21
ITEM 7. | MANAGEMENT’S DISCUSSION AND ANALYSIS OF FINANCIAL CONDITION AND RESULTS OF OPERATIONS |
(in millions, except per share data)
Business overview
Fiscal 2015 presented Precision Castparts Corp. ("PCC") with a number of opportunities as well as challenges. We continued to be well-positioned in the core commercial aerospace and industrial gas turbine ("IGT") markets, which provided us with sales and earnings growth throughout the fiscal year. However, beginning late in the third quarter, we experienced demand softness in our oil & gas and pipe markets, with customers deferring decisions on large projects and distribution demand falling almost to zero. Despite these dynamics, we believe the combination of our strong technical capabilities and improved cost structure places us in a solid position to serve our customers now and when increased demand returns.
In the first quarter of fiscal 2015, we saw both solid operating results and a significant shift in customer order dynamics in our major end markets. Commercial aerospace activity was the biggest driver of growth as base aircraft production continued. We also saw an upward shift in orders from our customers in power markets. Continued expansion in interconnect pipe demand provided further upside. In the oil & gas market, we won sizeable new orders that leveraged our unique capabilities.
We continued to grow total year-over-year sales and earnings in the second quarter of fiscal 2015, demonstrating solid leverage of our strong market share position in primary end markets. Commercial aerospace sales continued a steady upward trajectory fueled by the segment's strong presence on all major aircraft/engine platforms, both in production and in development. IGT orders also steadily improved as a result of solid positions on upgrade programs, higher content on new production turbines and higher spares requirements.
The third quarter of fiscal 2015 included some clear achievements, but we also faced some real challenges in several of our end markets. On the plus side, we made solid progress on our production and development aircraft and engine programs. In addition, our growth in IGT outpaced the market, given our higher content on new and upgrade platforms, and provided a steady supply of spares to the installed base. On the other hand, the third quarter also presented us with rapid declines in demand from our oil & gas customers and continued destocking from one of our large aerospace customers.
We continued to face sizable challenges in our oil & gas and pipe markets in the fourth quarter of fiscal 2015, which had a negative impact on our financial results. In response, we took multiple actions to adjust our operations to the realities of the demand environment by right-sizing our operations, evaluating our inventory positions, and making decisions to exit underperforming investments. We recognized $127 million in pre-tax charges related to asset and inventory valuation adjustments and $8 million related to restructuring activities. In addition, we recognized $174 million, pre-tax, of impairment charges primarily associated with the company’s ownership interest in Yangzhou Chengde Steel Tube Co., Ltd. (Chengde).
Our capital allocation framework supports a multi-pronged strategy that prioritizes internal investment and value-creating acquisitions, with excess cash returned to shareholders in the form of share repurchases once the first two criteria are met. During fiscal 2015, we acquired two businesses for a total of approximately $637 million. The larger acquisition, Aerospace Dynamics International, broadens our large gantry capabilities and provides us with significant additional share on the Airbus A350 program. Subsequent to year-end, we acquired two small businesses, which expand our vertical integration capabilities. We continue to be very active on the acquisition front, with several potential opportunities in front of us. We delivered on our share repurchase program during fiscal 2015, returning $1.6 billion of cash to shareholders. During May 2015, the PCC Board of Directors added an additional $2.0 billion to our share repurchase authorization, which we expect to complete in the next 12 to 18 months, subject to market conditions, with the objective of lowering our share count over time. We remain committed to our value-creating capital deployment strategy, focused on growing the business organically and through acquisitions and on returning excess cash to shareholders via share repurchases.
22
Fiscal Year | % Increase/(Decrease) | ||||||||||||||||
2015 | 2014 | 2013 | 2015 vs. 2014 | 2014 vs. 2013 | |||||||||||||
Net sales | $ | 10,005 | $ | 9,533 | $ | 8,347 | 5 | % | 14 | % | |||||||
Costs and expenses: | |||||||||||||||||
Cost of goods sold | 6,752 | 6,253 | 5,654 | 8 | % | 11 | % | ||||||||||
Selling and administrative expenses | 641 | 621 | 534 | 3 | % | 16 | % | ||||||||||
Restructuring expense | 8 | — | — | 100 | % | — | % | ||||||||||
Interest expense, net | 65 | 71 | 31 | (8 | )% | 129 | % | ||||||||||
Total costs and expenses | 7,466 | 6,945 | 6,219 | ||||||||||||||
Income before income tax expense and equity in earnings of unconsolidated affiliates | 2,539 | 2,588 | 2,128 | (2 | )% | 22 | % | ||||||||||
Income tax expense | (816 | ) | (830 | ) | (695 | ) | (2 | )% | 19 | % | |||||||
Equity in (loss) earnings of unconsolidated affiliates | (175 | ) | 1 | 1 | (17,600 | )% | — | % | |||||||||
Net income from continuing operations | 1,548 | 1,759 | 1,434 | (12 | )% | 23 | % | ||||||||||
Net (loss) income from discontinued operations | (15 | ) | 25 | (4 | ) | (160 | )% | 725 | % | ||||||||
Net income | 1,533 | 1,784 | 1,430 | (14 | )% | 25 | % | ||||||||||
Net income attributable to noncontrolling interest | (3 | ) | (7 | ) | (3 | ) | (57 | )% | 133 | % | |||||||
Net income attributable to PCC | $ | 1,530 | $ | 1,777 | $ | 1,427 | (14 | )% | 25 | % | |||||||
Net income per common share attributable to PCC shareholders (basic): | |||||||||||||||||
Net income per share from continuing operations | $ | 10.83 | $ | 12.03 | $ | 9.82 | (10 | )% | 23 | % | |||||||
Net (loss) income per share from discontinued operations | (0.10 | ) | 0.17 | (0.03 | ) | (159 | )% | 667 | % | ||||||||
Net income per share (basic) | $ | 10.73 | $ | 12.20 | $ | 9.79 | (12 | )% | 25 | % | |||||||
Net income per common share attributable to PCC shareholders (diluted): | |||||||||||||||||
Net income per share from continuing operations | $ | 10.77 | $ | 11.95 | $ | 9.75 | (10 | )% | 23 | % | |||||||
Net (loss) income per share from discontinued operations | (0.11 | ) | 0.17 | (0.03 | ) | (165 | )% | 667 | % | ||||||||
Net income per share (diluted) | $ | 10.66 | $ | 12.12 | $ | 9.72 | (12 | )% | 25 | % | |||||||
Fiscal Year | % Increase/(Decrease) | ||||||||||||||||
Sales by Market | 2015 | 2014 | 2013 | 2015 vs. 2014 | 2014 vs. 2013 | ||||||||||||
Aerospace | $ | 6,961 | $ | 6,547 | $ | 5,472 | 6 | % | 20 | % | |||||||
% of total | 70 | % | 69 | % | 65 | % | |||||||||||
Power | 1,722 | 1,668 | 1,633 | 3 | % | 2 | % | ||||||||||
% of total | 17 | % | 17 | % | 20 | % | |||||||||||
General Industrial & Other | 1,322 | 1,318 | 1,242 | — | % | 6 | % | ||||||||||
% of total | 13 | % | 14 | % | 15 | % | |||||||||||
Total Sales | $ | 10,005 | $ | 9,533 | $ | 8,347 | 5 | % | 14 | % | |||||||
% of total | 100 | % | 100 | % | 100 | % | |||||||||||
23
Average market price of key metals (per pound) | Fiscal Year | Increase/(Decrease) | |||||||||||||||||||||||
2015 | 2014 | 2013 | 2015 vs. 2014 | 2014 vs. 2013 | |||||||||||||||||||||
$ | % | $ | % | ||||||||||||||||||||||
Nickel | $ | 7.67 | $ | 6.54 | $ | 7.71 | $ | 1.13 | 17 | % | $ | (1.17 | ) | (15 | )% | ||||||||||
London Metals Exchange (1) | |||||||||||||||||||||||||
Titanium | $ | 2.97 | $ | 1.98 | $ | 2.82 | $ | 0.99 | 50 | % | $ | (0.84 | ) | (30 | )% | ||||||||||
Ti 6-4 bulk, Metalprices.com | |||||||||||||||||||||||||
Cobalt | $ | 14.37 | $ | 13.63 | $ | 13.33 | $ | 0.74 | 5 | % | $ | 0.30 | 2 | % | |||||||||||
Metal Bulletin COFM.8 Index (1) | |||||||||||||||||||||||||
_________________________
(1) | Source: Bloomberg |
Fiscal 2015 compared with fiscal 2014
Total sales for fiscal 2015 were $10,005 million, an increase of $472 million, or 5 percent, from fiscal 2014 sales of $9,533 million. Fiscal 2015 includes the contribution from seven businesses acquired after the beginning of fiscal 2014 and two businesses acquired in fiscal 2015. These acquisitions contributed more than $350 million of additional sales in fiscal 2015 compared to fiscal 2014. Excluding the impact of acquisitions and metal pricing, organic sales growth on a constant currency basis year-over-year was approximately 2 percent, despite the continuing impact of an aerospace customer's inventory actions and challenges in oil & gas and pipe markets. Lower market-driven pricing of raw material inputs negatively impacted external sales year-over-year as raw material input prices were approximately $50 million lower than a year ago. The cost of rutile (a primary raw material in titanium production) decreased approximately 12 percent; purchased titanium sponge decreased approximately 13 percent; and titanium revert decreased approximately 8 percent over the prior year. Although the market price of titanium 6-4 bulk increased 50 percent, as reported on metalprices.com, compared to the same period last year, our actual titanium prices decreased due to buy forwards and order lead times. Contractual material pass-through pricing increased sales by approximately $239 million in fiscal 2015 versus approximately $265 million in fiscal 2014, a decrease of $26 million. Contractual material pass-through pricing adjustments are calculated based on market prices such as those shown in the above table in trailing periods from one to twelve months.
Including the impact of acquisitions, aerospace sales increased approximately $414 million, or 6 percent, over fiscal 2014, primarily within our Airframe Products segment. Commercial aircraft production rates continue to drive steady demand for airframe and engine components. Commercial and regional/business jet aerospace sales improved, while military demand declined. Aerospace sales increased from 69 percent of total sales in fiscal 2014 to 70 percent of total sales in fiscal 2015. Sales to our power markets increased approximately $54 million, or 3 percent, over the prior year, primarily as a result of further growth in IGT sales throughout the year and seamless interconnect pipe sales in the first half of fiscal 2015. IGT orders have steadily increased as a result of higher content on new and upgrade platforms and higher spares requirements. Partially offsetting this growth was declining demand from our oil & gas customers, particularly over the last half of the year. Sales to our power markets remained constant at 17 percent of total sales in both fiscal 2014 and 2015. General industrial and other sales were essentially flat when compared to the prior year, primarily due to higher sales to the industrial processing and automotive sectors, offset by lower sales to the mining and construction sectors. General industrial and other sales decreased from 14 percent of total sales in fiscal 2014 to 13 percent of total sales in fiscal 2015.
Cost of goods sold was $6,752 million, or 67 percent of sales, in fiscal 2015, compared to $6,253 million, or 66 percent of sales, in fiscal 2014. Cost of goods sold was negatively impacted by inventory valuation adjustments and other asset impairment charges recognized during the fourth quarter of fiscal 2015 totaling $127 million. Contractual material pass-through pricing diluted gross margin by 0.8 percentage points in fiscal 2015 compared to 1.0 percentage point in fiscal 2014.
Selling and administrative expenses were $641 million, or 6 percent of sales, in fiscal 2015, compared to $621 million, or 7 percent of sales, in fiscal 2014. The slightly lower year-over-year percentage was primarily due to lower legal expenses.
Net income from continuing operations attributable to PCC for fiscal 2015 was $1,545 million, or $10.77 per share (diluted). By comparison, net income from continuing operations attributable to PCC for fiscal 2014 was $1,752 million, or $11.95 per share (diluted). Fiscal 2015 net income includes net charges of $265 million, or $1.85 per share (diluted), related to inventory valuation adjustments, asset impairment charges and restructuring activities. Fiscal 2015 net income attributable to PCC including discontinued operations was $1,530 million, or $10.66 per share (diluted), compared with net income of $1,777 million, or $12.12 per share (diluted) in fiscal 2014. Fiscal 2015 results include a net loss of $15 million, or $0.11 per share (diluted), from discontinued operations, compared to net income of $25 million, or $0.17 per share (diluted), in the prior year.
24
Fiscal 2014 compared with fiscal 2013
Total sales for fiscal 2014 were $9,533 million, an increase of $1,186 million, or 14 percent, from fiscal 2013 sales of $8,347 million. Fiscal 2014 sales include the contribution from eleven businesses acquired after the beginning of fiscal 2013 and seven businesses acquired in fiscal 2014 that were not fully included in the prior year. These acquisitions contributed more than $1.2 billion of additional sales in fiscal 2014 compared to fiscal 2013. Contractual pass-through pricing and other changes in metal/revert pricing offset organic growth by approximately 3 percent year over year. Nickel prices decreased 15 percent, as reported on the London Metal Exchange (LME) compared to the same period last year. Lower external selling prices of nickel alloy from the Forged Products segment’s three primary nickel conversion mills reduced top-line revenues by approximately $142 million in fiscal 2014 versus fiscal 2013 and the falling price of revert and other alloys negatively impacted sales by approximately $55 million. Contractual material pass-through pricing increased sales by approximately $265 million in fiscal 2014 versus approximately $279 million in fiscal 2013, a decrease of $14 million. Contractual material pass-through pricing adjustments are calculated based on market prices such as those shown in the above table in trailing periods from one to twelve months.
Including the impact of acquisitions, aerospace sales increased approximately $1,075 million, or 20 percent, over fiscal 2013, primarily within our Forged Products and Airframe Products segments. Commercial aircraft production rates continue to drive steady demand for airframe and engine components. The increase in commercial aerospace sales was partially offset by a decline in regional/business jet sales, while military aerospace sales were relatively flat. Aerospace sales increased from 65 percent of total sales in fiscal 2013 to 69 percent of total sales in fiscal 2014. Sales to our power markets increased approximately $35 million, or 2 percent, over the prior year, primarily as a result of higher seamless interconnect pipe sales, improved oil and gas shipments, and solid IGT sales performance. Sales to our power markets decreased from 20 percent of total sales in fiscal 2013 to 17 percent of total sales in fiscal 2014. General industrial and other sales increased approximately $76 million, or 6 percent, over fiscal 2013, primarily due to the contribution from TIMET, which was acquired in the third quarter of fiscal 2013. General industrial and other sales decreased from 15 percent of total sales in fiscal 2013 to 14 percent of total sales in fiscal 2014.
Cost of goods sold was $6,253 million, or 66 percent of sales, in fiscal 2014 as compared to $5,654 million, or 68 percent of sales, in fiscal 2013. The improvement in the year-over-year percentage reflects the impact of lower raw material costs due to lower metal/revert pricing, and operational efficiencies, most notably at our TIMET facilities. Contractual material pass-through pricing diluted gross margin by 1.0 percentage point in fiscal 2014 compared to 1.1 percentage points in fiscal 2013.
Selling and administrative expenses were $621 million, or 7 percent of sales, in fiscal 2014 compared to $534 million, or 6 percent of sales, in fiscal 2013. The higher year-over-year percentage was primarily due to higher stock-based compensation expense.
Net income from continuing operations attributable to PCC for fiscal 2014 was $1,752 million, or $11.95 per share (diluted). By comparison, net income from continuing operations attributable to PCC for fiscal 2013 was $1,431 million, or $9.75 per share (diluted). Fiscal 2014 net income attributable to PCC including discontinued operations was $1,777 million, or $12.12 per share (diluted), compared with net income of $1,427 million, or $9.72 per share (diluted) in fiscal 2013. Fiscal 2014 results include net income of $25 million, or $0.17 per share (diluted), from discontinued operations, compared to a net loss of $4 million, or $0.03 per share (diluted), in fiscal 2013.
Acquisitions
Fiscal 2015
• | On April 25, 2014, we acquired Aerospace Dynamics International ("ADI") for approximately $625 million. ADI is one of the premier suppliers in the aerospace industry, operating a wide range of high-speed machining centers. ADI has developed particular expertise in large complex components, hard-metal machining, and critical assemblies. ADI is located in Valencia, California, and employs approximately 625 people. The ADI acquisition was an asset purchase for tax purposes and operates as part of the Airframe Products segment. |
• | During the second quarter of fiscal 2015, we completed a small acquisition in the Airframe Products segment. |
Fiscal 2014
• | During the second quarter of fiscal 2014, we completed two small acquisitions in the Airframe Products segment. |
25
• | On October 31, 2013, we acquired Permaswage, a world-leading designer and manufacturer of aerospace fluid fittings, for approximately $600 million in cash, funded by commercial paper borrowings. Permaswage's primary focus is the design and manufacture of permanent fittings used in fluid conveyance systems for airframe applications, as well as related installation tooling. The company operates manufacturing locations in Gardena, California; Paris, France; and Suzhou, China. The Permaswage acquisition was a stock purchase for tax purposes and operates as part of the Airframe Products segment. |
• | During the third quarter of fiscal 2014, we completed two small acquisitions in the Forged Products segment. |
• | During the fourth quarter of fiscal 2014, we completed a small acquisition in the Forged Products segment and a small acquisition in the Airframe Products segment. |
Fiscal 2013
• | On April 2, 2012, we acquired RathGibson, LLC ("RathGibson"). RathGibson manufactures precision thin-wall, nickel-alloy and stainless steel welded and seamless tubing, with broad capabilities in length, wall thickness, and diameter. RathGibson's products are used in a multitude of oil & gas, chemical/petrochemical processing, and power generation applications, as well as in other commercial markets. RathGibson operates three facilities in Janesville, Wisconsin; North Branch, New Jersey; and Clarksville, Arkansas. The RathGibson acquisition was an asset purchase for tax purposes and operates as part of the Forged Products segment. |
• | On May 18, 2012, we acquired Centra Industries, a state-of-the art aerostructures manufacturer located in Cambridge, Ontario, Canada. Centra manufactures a range of machined airframe components and assemblies, in both aluminum and hard metals. Core competencies include the high-speed machining of complex, high-precision structures, sub-assembly and kit integration. The Centra acquisition was a stock purchase for tax purposes and operates as part of the Airframe Products segment. |
• | On June 15, 2012, we acquired Dickson Testing Company ("Dickson") and Aerocraft Heat Treating Company ("Aerocraft"). Dickson offers a full range of destructive testing services including: mechanical properties, metallurgical and chemical analyses and low-cycle fatigue testing. Dickson is located in South Gate, California. Aerocraft provides precision heat treating services for titanium and nickel alloy forgings and castings used in the aerospace industry, as well as other related services including straightening, de-twisting and forming. Aerocraft is located in Paramount, California. The acquisitions were asset purchases for tax purposes and operate as part of the Forged Products segment. |
• | On August 7, 2012, we acquired Klune Industries ("Klune"), a manufacturer of complex aluminum, nickel, titanium and steel aerostructures. Klune focuses on complex forming, machining and assembly of aerostructure parts, in addition to offering significant expertise in a range of cold-formed sheet metal components. Klune operates facilities in North Hollywood, California; Spanish Fork, Utah; and Kent, Washington. The Klune acquisition was a stock purchase for tax purposes and operates as part of the Airframe Products segment. |
• | On August 31, 2012, we acquired certain aerostructures business units from Heroux-Devtek Inc. (collectively referred to as "Progressive"). These aerostructures operations manufacture a wide variety of components and assemblies from aluminum, aluminum-lithium and titanium, such as bulkheads, wing ribs, spars, frames and engine mounts. The aerostructures operations include Progressive Incorporated in Arlington, Texas, as well as plants in Dorval (Montreal), Canada, and Queretaro, Mexico. The Progressive acquisition was an asset purchase for tax purposes and operates as part of the Airframe Products segment. |
• | On October 24, 2012, we acquired Texas Honing, Inc. ("THI"). THI provides precision, tight-tolerance pipe processing services, including honing, boring, straightening and turning. THI's products are used in oil & gas drilling, completion and production applications, as well as other commercial markets. THI operates three facilities in the Houston, Texas area. The THI acquisition was a stock purchase for tax purposes and operates as part of the Forged Products segment. |
• | On December 12, 2012, we acquired Synchronous Aerospace Group ("Synchronous"), a leading build-to-print supplier of highly complex mechanical assemblies for commercial aerospace and defense markets. Synchronous manufactures such mechanical assemblies as high-lift mechanisms and secondary flight controls, as well as structural components, including wing ribs, bulkheads, and track and beam assemblies. Synchronous has four primary locations: Santa Ana, California; Kent, Washington; Wichita, Kansas; and Tulsa, Oklahoma. The Synchronous acquisition was a stock purchase for tax purposes and operates as part of the Airframe Products segment. |
26
• | On December 21, 2012, we completed the initial cash tender offer (the "Offer") for all of the outstanding shares of common stock of TIMET for $16.50 per share. Approximately 150,520,615 shares (representing approximately 86% of the outstanding shares) were validly tendered and not withdrawn from the Offer. The transaction resulted in a payment for such shares of approximately $2.5 billion in cash. On December 17, 2012, we issued $3.0 billion of senior, unsecured notes, and the majority of the proceeds were used to purchase the shares noted above. On January 7, 2013, we completed the acquisition of TIMET. Each remaining share of TIMET common stock not tendered in PCC's previous tender offer for TIMET shares (other than shares as to which holders properly exercise appraisal rights) was converted in the merger into the right to receive $16.50 per share without interest. As a result of the merger, TIMET common stock ceased to be traded on the New York Stock Exchange. TIMET, the largest titanium manufacturer in the U.S., offers a full range of titanium products, including ingot and slab, forging billet and mill forms. TIMET operates seven primary melting or mill facilities in Henderson, Nevada; Toronto, Ohio; Morgantown, Pennsylvania; Vallejo, California; Witton, England; Waunarlwydd, Wales; and Savoie, France. The TIMET acquisition was a stock purchase for tax purposes and operates as part of the Forged Products segment. |
• | Over the course of fiscal 2013, we completed several additional minor acquisitions that provide us with expanded manufacturing capabilities. |
The above business acquisitions were accounted for under the acquisition method of accounting and, accordingly, the results of operations have been included in the Consolidated Statements of Income since the acquisition date.
Discontinued operations
Our financial statements were impacted by activities relating to the planned or completed divestiture of certain of our businesses. These businesses have been accounted for under discontinued operations guidance. Accordingly, any operating results of these businesses are presented in our Consolidated Statements of Income as discontinued operations, net of income tax, and all prior periods have been reclassified.
Fiscal 2015
During the fourth quarter of fiscal 2015, we recognized a goodwill impairment charge of $13 million, pre-tax, related to three of our discontinued operations held for sale as the fair value, as determined by expected net proceeds, did not exceed the carrying value. We also recognized $3 million, pre-tax, of other asset impairment charges.
During the fourth quarter of fiscal 2015, we decided to divest a small non-core business in the Forged Products segment and reclassified it to discontinued operations.
During the second quarter of fiscal 2015, we decided to divest a small non-core business in the Forged Products segment and reclassified it to discontinued operations.
Fiscal 2014
During the first quarter of fiscal 2014, we decided to divest a small non-core business in the Airframe Products segment and reclassified it to discontinued operations.
During the fourth quarter of fiscal 2012, we decided to divest a small non-core business in the Airframe Products segment and reclassified it to discontinued operations. The sale of the business was completed in the first quarter of fiscal 2014. The transaction resulted in a gain of approximately $14 million (net of tax) and cash proceeds of $63 million. For tax purposes, the sale generated a capital loss that was offset by a valuation allowance.
Fiscal 2013
During the second quarter of fiscal 2013, we decided to divest a small non-core business in the Forged Products segment and reclassified it to discontinued operations. The sale of the business was completed in the second quarter of fiscal 2013. The transaction resulted in a gain of approximately $2 million (net of tax) and cash proceeds of $6 million.
During the first quarter of fiscal 2011, we decided to divest a small non-core business in the Airframe Products segment and reclassified it to discontinued operations. The sale of the business was completed in the second quarter of fiscal 2013. The transaction resulted in a loss of less than $1 million (net of tax) and proceeds of $25 million in cash and an unsecured, subordinated, convertible promissory note in the principal amount of $18 million. The promissory note was due on August 7, 2017 and paid interest quarterly based on the 5-year Treasury Note Constant Maturity Rate. The note, which allowed for early payment, was repaid in the first quarter of fiscal 2015.
27
Subsequent events
• | During the first quarter of fiscal 2016, we completed two small acquisitions in the Forged Products segment. |
• | On May 13, 2015, the Board of Directors approved a $2.0 billion expansion to the Company's existing program to repurchase shares of the Company’s common stock, effective immediately and continuing through June 30, 2017. The Company intends to repurchase outstanding shares from time to time in the open market, subject to market conditions. |
Fiscal 2016 outlook
Based on data from The Airline Monitor as of February 2015, Boeing and Airbus aircraft deliveries are expected to moderately increase through calendar year 2015 as compared to 2014. Due to manufacturing lead times and scheduled build rates, our production volumes are approximately three to six months ahead of aircraft deliveries for mature programs. The Airline Monitor is projecting further growth in aircraft deliveries in calendar year 2016, and therefore we anticipate that our aerospace sales will continue to increase in fiscal 2016 compared to fiscal 2015.
Looking at the key end market drivers for this fiscal 2016 plan, we expect mid-single digit revenue growth in commercial aerospace, driven by higher build rates on the Boeing 787 and Airbus A350, as well as growing activity on the LEAP engine, and share gains in our aerostructures operations. We have also factored in the announced build rate cuts on the Airbus A330. In military, we see fiscal 2016 looking much like fiscal 2015, with stable build rates and also stable activity in our spares sales. On the regional/business jet side, we anticipate continued healthy demand for mid to large cabin sizes, which will drive continued growth. We have a number of new platforms starting to ramp in fiscal 2016 and that are expected to yield a high single digit growth rate for the regional/business jet end market. In IGT, we expect continued strong growth driven by our position on the H-class platform and upgrade programs. Given the weak global oil & gas demand, we are anticipating volume and price pressures and expect declines in excess of 30 percent in this market for fiscal 2016. Within our general industrial and other markets, we are expecting fiscal 2016 to be similar to fiscal 2015, with risk of derivative impacts due to weakness in the oil & gas markets. We believe our plan for fiscal 2016 is balanced and achievable, targeting growth and margin expansion in the Investment Cast Products and Airframe Products segments over fiscal 2015 levels, while we expect the Forged Products segment will experience low single-digit sales decline with modest margin expansion.
28
Financial results by segment
We analyze our operating segments and manage our business across three reportable segments: Investment Cast Products, Forged Products and Airframe Products.
Fiscal Year | % Increase/(Decrease) | ||||||||||||||||
2015 | 2014 | 2013 | 2015 vs. 2014 | 2014 vs. 2013 | |||||||||||||
Net sales: | |||||||||||||||||
Investment Cast Products | $ | 2,536 | $ | 2,462 | $ | 2,480 | 3 | % | (1 | )% | |||||||
Forged Products | 4,259 | 4,189 | 3,552 | 2 | % | 18 | % | ||||||||||
Airframe Products | 3,210 | 2,882 | 2,315 | 11 | % | 24 | % | ||||||||||
Consolidated net sales | $ | 10,005 | $ | 9,533 | $ | 8,347 | 5 | % | 14 | % | |||||||
Segment operating income: | |||||||||||||||||
Investment Cast Products | $ | 913 | $ | 874 | $ | 838 | 4 | % | 4 | % | |||||||
% of sales | 36.0 | % | 35.5 | % | 33.8 | % | |||||||||||
Forged Products | 1,008 | 1,075 | 779 | (6 | )% | 38 | % | ||||||||||
% of sales | 23.7 | % | 25.7 | % | 21.9 | % | |||||||||||
Airframe Products | 968 | 863 | 687 | 12 | % | 26 | % | ||||||||||
% of sales | 30.2 | % | 29.9 | % | 29.7 | % | |||||||||||
Corporate expense | (150 | ) | (153 | ) | (145 | ) | (2 | )% | 6 | % | |||||||
Restructuring and inventory and other asset impairment | (135 | ) | — | — | 100 | % | — | % | |||||||||
Total segment operating income | 2,604 | 2,659 | 2,159 | (2 | )% | 23 | % | ||||||||||
% of sales | 26.0 | % | 27.9 | % | 25.9 | % | |||||||||||
Interest expense, net | 65 | 71 | 31 | ||||||||||||||
Consolidated income before income tax expense and equity in earnings of unconsolidated affiliates | $ | 2,539 | $ | 2,588 | $ | 2,128 | |||||||||||
Fiscal Year | % Increase/(Decrease) | ||||||||||||||||
2015 | 2014 | 2013 | 2015 vs. 2014 | 2014 vs. 2013 | |||||||||||||
Contractual material pass-through: | |||||||||||||||||
Investment Cast Products | $ | 55 | $ | 63 | $ | 75 | (13 | )% | (16 | )% | |||||||
Forged Products | 175 | 192 | 194 | (9 | )% | (1 | )% | ||||||||||
Airframe Products | 9 | 10 | 10 | (10 | )% | — | % | ||||||||||
Total contractual material pass-through | $ | 239 | $ | 265 | $ | 279 | (10 | )% | (5 | )% | |||||||
Fiscal Year | % Increase/(Decrease) | ||||||||||||||||
2015 | 2014 | 2013 | 2015 vs. 2014 | 2014 vs. 2013 | |||||||||||||
Intercompany sales activity:(1) | |||||||||||||||||
Investment Cast Products(2) | $ | 273 | $ | 276 | $ | 303 | (1 | )% | (9 | )% | |||||||
Forged Products(3) | 1,857 | 1,770 | 991 | 5 | % | 79 | % | ||||||||||
Airframe Products(4) | 272 | 203 | 149 | 34 | % | 36 | % | ||||||||||
Total intercompany sales activity | $ | 2,402 | $ | 2,249 | $ | 1,443 | 7 | % | 56 | % | |||||||
_________________________
(1) | Intercompany sales activity consists of each segment’s total intercompany sales activity, including intercompany sales activity within a segment and between segments. |
(2) | Investment Cast Products: Includes intersegment sales activity of $39 million, $44 million and $52 million for fiscal 2015, 2014 and 2013, respectively. |
(3) | Forged Products: Includes intersegment sales activity of $123 million, $128 million and $102 million for fiscal 2015, 2014 and 2013, respectively. |
(4) | Airframe Products: Includes intersegment sales activity of $6 million, $7 million and $6 million for fiscal 2015, 2014 and 2013, respectively. |
29
Investment Cast Products
The Investment Cast Products segment manufactures investment castings and provides related investment casting materials and alloys, for aircraft engines, IGT engines, airframes, armaments, medical prostheses, unmanned aerial vehicles and other industrial applications.
Fiscal Year | % Increase/(Decrease) | ||||||||||||||||
2015 | 2014 | 2013 | 2015 vs. 2014 | 2014 vs. 2013 | |||||||||||||
Sales by Market: | |||||||||||||||||
Aerospace | $ | 1,605 | $ | 1,572 | $ | 1,579 | 2 | % | — | % | |||||||
% of total | 63 | % | 64 | % | 64 | % | |||||||||||
Power | 768 | 714 | 718 | 8 | % | (1 | )% | ||||||||||
% of total | 30 | % | 29 | % | 29 | % | |||||||||||
General Industrial & Other | 163 | 176 | 183 | (7 | )% | (4 | )% | ||||||||||
% of total | 7 | % | 7 | % | 7 | % | |||||||||||
Total Sales | $ | 2,536 | $ | 2,462 | $ | 2,480 | 3 | % | (1 | )% | |||||||
Operating income | $ | 913 | $ | 874 | $ | 838 | 4 | % | 4 | % | |||||||
% of sales | 36.0 | % | 35.5 | % | 33.8 | % | |||||||||||
Fiscal 2015 compared with fiscal 2014
Investment Cast Products' segment sales were $2,536 million for fiscal 2015, an increase of 3 percent from fiscal 2014 sales of $2,462 million. Commercial aerospace sales increased approximately 2 percent year-over-year, continuing a steady upward trajectory fueled by the segment's strong presence on all major aircraft/engine platforms, both in production and in development. Improved regional/business jet sales positively impacted segment sales; however, growth was partially offset by continued weak demand in military markets. In addition, the segment saw growth of approximately 8 percent in its power business, driven by higher content on IGT upgrade programs and new turbine designs, and growing spares demand. General industrial and other sales declined approximately 7 percent, primarily as a result of lower sales to the non-aerospace military sector. Fiscal 2015 sales also include $55 million of contractual pricing related to pass-through of raw material costs compared to $63 million in fiscal 2014, a decrease of $8 million.
Operating income for the Investment Cast Products segment was $913 million or 36.0 percent of sales in fiscal 2015, compared to $874 million, or 35.5 percent of sales, in fiscal 2014. The segment's operating income as a percent of sales increased by 0.5 percentage points year-over-year. The segment's operations continued to deliver solid operating margins by effectively leveraging higher volumes. Contractual material pass-through pricing diluted operating margins by 0.8 percentage points in fiscal 2015 compared to 0.9 percentage points in fiscal 2014.
The Investment Cast Products segment has solid content on most major aircraft production platforms. Fiscal 2016 sales gains are expected to be driven by the next step-up in commercial build rates on platforms such as the Boeing 787 and Airbus A350 and narrow-body re-engining. We expect to leverage higher commercial aerospace volumes by adding incremental capacity to meet higher demand and at the same time, improve our overall efficiency and cost structure. We expect IGT growth to continue into fiscal 2016 due to growth in high-efficiency, large-capacity new IGT platforms, IGT upgrade programs and higher spares activity. Overall, we expect mid-single digit sales growth with incremental operating margins above our typical 35 to 40 percent.
Fiscal 2014 compared with fiscal 2013
Investment Cast Products' segment sales were $2,462 million for fiscal 2014, a decrease of 1 percent from fiscal 2013 sales of $2,480 million. Large commercial aerospace sales increased approximately 8 percent as the segment continued to see solid schedules in line with the current levels of base commercial aircraft production rates. However, growth was tempered by a double-digit decline in regional/business jet and military shipments. The segment's power business continued to see strong demand, driven by IGT upgrade programs, share gains, and spares sales. General industrial and other sales declined approximately 4 percent as a result of lower sales to the non-aerospace military sector. Fiscal 2014 sales also include $63 million of contractual pricing related to pass-through of raw material costs compared to $75 million in fiscal 2013, a decrease of $12 million.
30
Operating income for the Investment Cast Products segment was $874 million or 35.5 percent of sales in fiscal 2014, compared to $838 million, or 33.8 percent of sales, in fiscal 2013. The segment's operating income as a percent of sales increased by 1.7 percentage points year-over-year despite a slight decline in sales. The segment's operations improved operating margins by consistently implementing new initiatives to reduce costs and improve productivity on steady, high-volume production. Contractual material pass-through pricing diluted operating margins by 0.9 percentage points in fiscal 2014 compared to 1.1 percentage points in fiscal 2013.
Forged Products
The Forged Products segment manufactures forged components from titanium and nickel-based alloys principally for the aerospace and power markets and manufactures nickel, titanium and cobalt-based alloys used to produce forged components for aerospace and non-aerospace markets which include products for oil and gas, chemical processing and pollution control applications. The segment also provides nickel superalloy and titanium revert management solutions, re-melting various material byproducts to be reused in casting, forging and fastener manufacturing processes. Forged Products’ sales to the aerospace and power markets are derived primarily from the same large engine customers served by the Investment Cast Products segment, with additional aerospace sales to manufacturers of landing gear and other airframe components. The Forged Products segment also produces interconnect pipe and downhole casings for the oil and gas industries.
Fiscal Year | % Increase/(Decrease) | ||||||||||||||||
2015 | 2014 | 2013 | 2015 vs. 2014 | 2014 vs. 2013 | |||||||||||||
Sales by Market: | |||||||||||||||||
Aerospace | $ | 2,498 | $ | 2,478 | $ | 1,960 | 1 | % | 26 | % | |||||||
% of total | 58 | % | 59 | % | 55 | % | |||||||||||
Power | 921 | 920 | 891 | — | % | 3 | % | ||||||||||
% of total | 22 | % | 22 | % | 25 | % | |||||||||||
General Industrial & Other | 840 | 791 | 701 | 6 | % | 13 | % | ||||||||||
% of total | 20 | % | 19 | % | 20 | % | |||||||||||
Total Sales | $ | 4,259 | $ | 4,189 | $ | 3,552 | 2 | % | 18 | % | |||||||
Operating income | $ | 1,008 | $ | 1,075 | $ | 779 | (6 | )% | 38 | % | |||||||
% of sales | 23.7 | % | 25.7 | % | 21.9 | % | |||||||||||
Fiscal 2015 compared with fiscal 2014
Forged Products segment sales were $4,259 million in fiscal 2015, an increase of 2 percent from fiscal 2014 sales of $4,189 million. Results for fiscal 2015 include contributions from three small acquisitions late in fiscal 2014 that were included in the prior year results. The segment experienced stable aerospace sales, increasing approximately $20 million, or 1 percent, year-over-year, with growth in regional/business jet sales offset by decreased military sales. Commercial aerospace sales were flat due to the continued destocking at a single aerospace customer. Sales to the power markets were also flat when compared to the prior year, driven by higher interconnect pipe sales in the first half of the year, offset by lower oil & gas demand in the last half of the year and lower IGT demand. General industrial and other sales increased approximately $49 million, or 6 percent, during fiscal 2015, primarily due to higher sales to the industrial process and marine equipment sectors, partially offset by lower sales to the mining sector. Lower market-driven pricing of raw material inputs negatively impacted external sales year-over-year as raw material input prices were approximately $50 million lower than a year ago. The cost of rutile decreased approximately 12 percent; purchased titanium sponge decreased approximately 13 percent; and titanium revert decreased approximately 8 percent over the prior year. Although the market price of titanium 6-4 bulk increased 50 percent, as reported on metalprices.com, compared to the same period last year, our actual titanium prices decreased due to buy forwards and order lead times. Fiscal 2015 sales also include $175 million of contractual pricing related to pass-through of raw material costs compared to $192 million in fiscal 2014, a decrease of $17 million (also included in market increases discussed above).
Operating income for the Forged Products segment was $1,008 million, or 23.7 percent of sales, in fiscal 2015, compared to $1,075 million, or 25.7 percent of sales, in fiscal 2014. Operating income as a percent of sales decreased 2.0 percentage points compared to a year ago as a result of negative volume leverage and a weaker product mix in oil & gas markets, magnified by lower throughput associated with the decline in oil & gas and other distribution channels, which resulted in higher levels of inflation in year-end inventory balances. The contractual pass-through of raw material costs diluted operating margins by 1.0 percentage point in fiscal 2015 compared to 1.2 percentage points in fiscal 2014.
31
Similar to the Investment Cast Products segment, the Forged Products segment is aligned with large commercial aerospace build rates. We expect increased demand in fiscal 2016 in aerospace and IGT markets, with TIMET share gains favorably impacting sales, partially offset by foreign currency headwinds. However, given the continued uncertainty in the oil and gas market, we cannot predict when this market will recover, and further sales reductions may occur. All those inputs net to our expectation for a low-single digit sales decline versus fiscal 2015. Furthermore, in March 2015, the TIMET Morgantown facility suffered a serious incident and an electron beam furnace will be out of commission for an extended period of time. We anticipate this will have a $25 million to $30 million negative impact to operating income in fiscal 2016. The segment will benefit from the impact of restructuring actions taken at the end of fiscal 2015. As is the case every year, we will perform maintenance during the second quarter, and in fiscal 2016, we have a planned press upgrade, which will result in an extended outage occurring at our Wyman-Gordon UK facility. Taking into consideration all of the factors above, we expect modest margin expansion at Forged Products versus fiscal 2015.
Fiscal 2014 compared with fiscal 2013
Forged Products segment sales were $4,189 million in fiscal 2014, an increase of 18 percent from fiscal 2013 sales of $3,552 million. Results for fiscal 2013 include the benefit from the acquisitions of Aerocraft and Dickson for more than nine months, THI for five months, and TIMET for three months, versus a full year in fiscal 2014. The segment experienced aerospace sales growth of approximately $518 million, or 26 percent, year over year, driven primarily by the inclusion of TIMET and higher commercial aerospace demand. Similar to the Investment Cast Products segment, aerospace OEM business continued to be aligned with current commercial aircraft production rates. However, the reduced capacity and subsequent repair of the 29,000-ton press in Wyman-Gordon's Houston facility created a drag on sales in fiscal 2014. Sales to power markets improved approximately $29 million, or 3 percent, compared to fiscal 2013, driven by increased demand for seamless interconnect pipe and higher oil and gas shipments. General industrial and other sales increased approximately $90 million, or 13 percent, during fiscal 2014, driven almost entirely by the addition of TIMET. Lower market-driven pricing of raw material inputs had a significant negative impact on the segment's year-over-year sales. Nickel prices decreased 15 percent, as reported on the LME, compared to the same period in fiscal 2013. The decline in external selling prices of nickel alloy sales from the segment’s three primary nickel conversion mills reduced top-line revenues by approximately $142 million in fiscal 2014 versus fiscal 2013 and the falling price of revert and other alloys negatively impacted sales by approximately $55 million. Fiscal 2014 sales also include $192 million of contractual pricing related to pass-through of increased raw material costs compared to $194 million in fiscal 2013, a decrease of $2 million (also included in market increases discussed above).
Operating income for the Forged Products segment was $1,075 million, or 25.7 percent of sales, in fiscal 2014, compared to $779 million, or 21.9 percent of sales, in fiscal 2013. Operating income as a percent of sales increased 3.8 percentage points compared to fiscal 2013, driven by higher seamless pipe shipments and operational improvements at TIMET as well as the base businesses. TIMET continued its rapid integration, aggressively improving its cost models and delivering significant value across its operations. The Forged Products segment achieved these results while also successfully rebuilding the 29,000-ton forging press in Houston. The contractual pass-through of raw material costs diluted operating margins by 1.2 percentage points in both fiscal 2014 and 2013.
Airframe Products
The Airframe Products segment manufactures highly engineered fasteners, fastener systems, fluid fittings, aerostructures and precision components, primarily for critical aerospace applications. The balance of the segment’s sales is derived from construction, automotive, heavy truck and general industrial markets.
Fiscal Year | % Increase/(Decrease) | ||||||||||||||||
2015 | 2014 | 2013 | 2015 vs. 2014 | 2014 vs. 2013 | |||||||||||||
Sales by Market: | |||||||||||||||||
Aerospace | $ | 2,858 | $ | 2,497 | $ | 1,933 | 14 | % | 29 | % | |||||||
% of total | 89 | % | 87 | % | 84 | % | |||||||||||
Power | 33 | 34 | 24 | (3 | )% | 42 | % | ||||||||||
% of total | 1 | % | 1 | % | 1 | % | |||||||||||
General Industrial & Other | 319 | 351 | 358 | (9 | )% | (2 | )% | ||||||||||
% of total | 10 | % | 12 | % | 15 | % | |||||||||||
Total Sales | $ | 3,210 | $ | 2,882 | $ | 2,315 | 11 | % | 24 | % | |||||||
Operating income | $ | 968 | $ | 863 | $ | 687 | 12 | % | 26 | % | |||||||
% of sales | 30.2 | % | 29.9 | % | 29.7 | % | |||||||||||
32
Fiscal 2015 compared with fiscal 2014
Airframe Products segment sales were $3,210 million in fiscal 2015, an 11 percent increase from fiscal 2014 sales of $2,882 million. Results for fiscal 2015 include contributions from Permaswage and three small acquisitions in fiscal 2014 and the results of ADI for nearly a full year. This segment experienced strong growth in aerospace sales of approximately $361 million, or 14 percent. Commercial aerospace sales, the chief driver of this segment, showed approximately 17 percent growth relative to the prior year. The fastener operations continue to maintain a high level of activity to meet aerospace production schedules and to benefit from the rapid integration of the most recent acquisitions. Similarly, the aerostructures operations saw further demand from a broad aerospace customer base, while ramping up production to support new contracts. General industrial and other sales decreased approximately $32 million, or 9 percent, when compared to the prior year, primarily due to lower sales to the construction and industrial process sectors, partially offset by higher sales to the automotive sector.
Operating income for the Airframe Products segment was $968 million, or 30.2 percent of sales, in fiscal 2015, compared to $863 million, or 29.9 percent of sales, in fiscal 2014. Operating income as a percent of sales increased 0.3 percentage points compared to fiscal 2014. Airframe Products' continued to achieve strong operational drop-through as a result of focused integration of its most recent acquisitions, effective leverage of increased assets, and strategic deployment of production assets.
Airframe Products is expecting a strong fiscal 2016 year, with sales up mid-single digits, reflecting higher aerospace build rates, share gains, and further contributions from recent acquisitions, partially offset by foreign currency headwinds. Demand to support current build rates is expected to drive sales in the fasteners operations in fiscal 2016. New business wins have secured market share for the aerostructures operations, and we anticipate that the contracts in place will lead to increased production in the second half of fiscal 2016. Build rate increases on platforms such as the Boeing 787 and Airbus A350 and narrow-body re-engining should provide further upside over the next 24 months. We expect the segment to deliver strong leverage on its growth, with incremental margins above the typical 35 to 40 percent level.
Fiscal 2014 compared with fiscal 2013
Airframe Products segment sales were $2,882 million in fiscal 2014, a 24 percent increase from fiscal 2013 sales of $2,315 million. Results for fiscal 2013 include contributions from Centra for nearly ten months, Klune for eight months, Progressive for seven months, and Synchronous for three months, versus a full year in fiscal 2014. In addition, fiscal 2014 includes the results of Permaswage for five months. This segment experienced strong growth in aerospace sales of approximately $564 million, or 29 percent, due to solid contributions from new acquisitions coupled with organic sales expansion. The base aerostructures businesses grew year-over-year aerospace sales by approximately 14 percent, due to market growth and share gains, and shipped Boeing 787 content at approximately ten shipsets per month. Critical aerospace fasteners shipments improved 6 percent year over year, and continued to close the gap with commercial aircraft production schedules. General industrial and other sales decreased approximately $7 million, or 2 percent when compared to fiscal 2013 primarily due to a decrease in non-aerospace military sales, partially offset by an increase in the mining sector.
Operating income for the Airframe Products segment was $863 million, or 29.9 percent of sales, in fiscal 2014, compared to $687 million, or 29.7 percent of sales, in fiscal 2013. Operating income as a percent of sales increased 0.2 percentage points compared to fiscal 2013 despite the inclusion of several lower-margin acquisitions due to continued achievement of strong incremental margins on base sales and organic growth. Airframe Products' operating income improved due to the leverage of increased throughput over an improving cost structure and variable cost improvements in the base businesses.
Restructuring and asset impairment
In the fourth quarter of fiscal 2015, we recognized a non-cash inventory and other asset impairment charge of $127 million, pre-tax, primarily in our oil & gas, pipe and associated raw material operations, reflecting the more challenging environment, declines in market value, and size or quality characteristics that impact marketability. In addition, to improve our cost structure and in response to the current market conditions, we implemented headcount reductions at impacted operations, which resulted in a pre-tax charge of $8 million in the fourth quarter of fiscal 2015. These restructuring plans provided for terminations of approximately 490 employees in the fourth quarter of fiscal 2015 and the first quarter of fiscal 2016. The restructuring and asset impairment charges recorded by segment are as follows:
Fiscal | 2015 | ||
Investment Cast Products | $ | 4 | |
Forged Products | 127 | ||
Airframe Products | 4 | ||
$ | 135 | ||
33
Interest and taxes
Net interest expense during fiscal 2015 was $65 million, compared with $71 million during fiscal 2014. On September 30, 2013, we exercised the make-whole early prepayment option and redeemed all $200 million of the 5.60% Senior Notes then outstanding, and therefore incurred interest expense associated with that debt in the prior year. Interest income was $4 million for fiscal 2015 compared to $5 million in fiscal 2014. The decrease was a result of lower interest rates on cash balances invested outside the U.S.
Net interest expense during fiscal 2014 was $71 million, compared with $31 million in fiscal 2013. The significant increase was due to debt associated with the acquisition of TIMET. Near the end of the third quarter of fiscal 2013, we issued $3.0 billion of debt to finance the acquisition of TIMET. In fiscal 2014, we incurred additional interest expense associated with that debt as it was outstanding for the full year. Interest income for fiscal 2014 was $5 million compared to $7 million in fiscal 2013. The decrease was a result of lower cash balances invested outside the U.S., which generally earn higher rates of return.
The effective tax rate for both fiscal 2015 and 2014 was 32.1 percent. In fiscal 2015, we realized a tax benefit from remeasuring our domestic deferred tax assets and liabilities due to a reduction in our state effective tax rate This tax benefit was offset by reduced benefits in the current year from nonrecurring changes in tax assets and liabilities compared to fiscal 2014.
The effective tax rate for fiscal 2014 was 32.1 percent, 0.6 percentage points lower than the 32.7 percent effective tax rate in fiscal 2013. The lower effective tax rate is primarily due to an increase in earnings taxed at rates lower than the U.S. statutory rate, the impact of the U.K. statutory rate reduction on deferred tax liabilities, and the settlement of a federal environmental penalty by TIMET that resulted in pre-tax income but not taxable income.
Liquidity and capital resources
Total assets of $19,428 million at March 29, 2015 represented an $842 million increase from the $18,586 million balance at March 30, 2014. The increase in total assets principally reflects cash generated from operations during fiscal 2015 totaling $1,702 million and tangible and intangible assets acquired with the purchase of ADI, which was funded by commercial paper borrowings, partially offset by the repurchase of common stock totaling $1,598 million.
Total capitalization at March 29, 2015 was $15,516 million, consisting of $4,587 million of total debt and $10,929 million of PCC shareholders' equity. The debt-to-capitalization ratio increased to 29.6% at March 29, 2015 from 23.9% at the end of fiscal 2014, reflecting additional commercial paper borrowings to fund the acquisition of ADI and common stock repurchases, and lower cumulative translation adjustments, partially offset by the impact of increased equity from net income.
Cash as of March 29, 2015 was $474 million, an increase of $113 million from the end of fiscal 2014, and total debt was $4,587 million, an increase of $1,015 million since the end of fiscal 2014. The net change in cash and debt primarily reflects stock repurchases of $1,598 million, cash paid to acquire businesses (net of cash acquired) of $637 million, and capital expenditures of $455 million, partially offset by cash generated from operations of $1,702 million and common stock issuances of $102 million.
Capital spending of $455 million in fiscal 2015 principally provided for new buildings and facility expansions to increase capacity, and new equipment purchases and refurbishments, primarily in the Forged Products and Airframe Products segments. We expect capital expenditures for fiscal 2016 to increase to approximately $550 million based on our current forecasts. These expenditures will be targeted for facility expansions to increase capacity and reduce costs, equipment upgrades and press refurbishments, primarily in the Forged Products and Airframe Products segments.
During fiscal 2015, we contributed $34 million to our defined benefit pension plans, of which $8 million was voluntary. In the first quarter of fiscal 2016, we made $31 million of voluntary contributions to our U.S. defined benefit pension plans. We expect to contribute approximately $20 million of required contributions in fiscal 2016, for total contributions to the defined benefit pension plans of approximately $51 million in fiscal 2016. In addition, we contributed $8 million to other postretirement benefit plans during fiscal 2015. We expect to contribute approximately $7 million to these other postretirement benefit plans during fiscal 2016.
Our international operations hold cash that is denominated in foreign currencies. We manage our worldwide cash requirements by evaluating the available funds from our various subsidiaries and the cost effectiveness of accessing those funds. The repatriation of cash from our foreign subsidiaries could have an adverse effect on our effective tax rate. As discussed in Item 8. Financial Statements and Supplementary Data, Note 10—Income taxes, U.S. taxes have not been provided on the cumulative earnings of non-U.S. affiliates and associated companies. Our intention is to reinvest these earnings indefinitely.
34
Historically, we have issued commercial paper as a method of raising short-term liquidity. We believe we will continue to have the ability to issue commercial paper and have issued commercial paper to fund acquisitions and short-term cash requirements in recent years. As of March 29, 2015, the amount of commercial paper borrowings outstanding was $1,587 million and the weighted average interest rate was 0.2%. As of March 30, 2014, the amount of commercial paper borrowings outstanding was $570 million and the weighted average interest rate was 0.2%. During fiscal 2015, the average amount of commercial paper borrowings outstanding was $1,315 million and the weighted average interest rate was 0.2%. During fiscal 2014, the average amount of commercial paper borrowings outstanding was $674 million and the weighted average interest rate was 0.2%. During fiscal 2015 and 2014, the largest daily balance of outstanding commercial paper borrowings was $1,737 million and $1,151 million, respectively.
On December 15, 2014, we entered into a 364-day, $1.0 billion revolving credit facility maturing December 2015 (the “364-Day Credit Agreement”), unless converted into a one-year term loan at the option of the Company at the end of the revolving period. The 364-Day Credit Agreement replaces the prior 364-day credit agreement that expired in December 2014. The 364-Day Credit Agreement contains customary representations and warranties, events of default, and financial and other covenants.
On December 16, 2013, we entered into a five-year, $1.0 billion revolving credit facility (the "New Credit Agreement") (with a $500 million increase option, subject to approval of the lenders) maturing December 2018, unless extended pursuant to two 364-day extension options. On the same day, we terminated the prior credit agreement maturing November 30, 2016. The New Credit Agreement contains customary representations and warranties, events of default, and financial and other covenants. The 364-Day and New Credit Agreements may be referred to collectively as the "Credit Agreements." We had not borrowed funds under the Credit Agreements as of March 29, 2015.
We do not anticipate any changes in our ability to borrow under our current credit facilities, but changes in the financial
condition of the participating financial institutions could negatively impact our ability to borrow funds in the future. Should
that circumstance arise, we believe that we would be able to arrange any needed financing, although we are not able to predict
what the terms of any such borrowings would be, or the source of the borrowed funds.
On December 17, 2012, we issued $3.0 billion aggregate principal amount of notes (collectively, the “Notes”) as follows: $500 million of 0.70% Senior Notes due 2015 (the "2015 Notes"); $1.0 billion of 1.25% Senior Notes due 2018 (the "2018 Notes"); $1.0 billion of 2.50% Senior Notes due 2023 (the "2023 Notes"); and $500 million of 3.90% Senior Notes due 2043 (the "2043 Notes").
The Notes are unsecured senior obligations of the Company and rank equally with all of the other existing and future senior, unsecured and unsubordinated debt of the Company. The Company pays interest on the 2015 Notes on June 20 and December 20 of each year and pays interest on the 2018 Notes, the 2023 Notes and the 2043 Notes on January 15 and July 15 of each year.
The maximum amount that can be borrowed under our Credit Agreements and commercial paper program is $2.0 billion. Our unused borrowing capacity as of March 29, 2015 was $413 million due to our outstanding commercial paper borrowings of $1,587 million.
Our financial covenant requirement and actual ratio as of March 29, 2015 was as follows:
Covenant Requirement | Actual | ||||
Consolidated leverage ratio(1) | 65.0 | % | (maximum) | 29.6 | % |
_________________________
(1) | Terms are defined in the Credit Agreements. |
As of March 29, 2015, we were in compliance with the financial covenant in the Credit Agreements.
We believe we will be able to meet our short and longer-term liquidity needs for working capital, pension and other postretirement benefit obligations, capital spending, cash dividends, environmental remediation, scheduled repayment of debt and potential acquisitions with the cash generated from operations, borrowing from our Credit Agreements or new bank credit facilities, the issuance of public or privately placed debt securities, or the issuance of equity instruments.
Off-balance sheet arrangements
There are currently no off-balance sheet arrangements that are, or are reasonably likely to have, a current or future material effect on our financial condition.
35
Contractual obligations and commercial commitments
We are obligated to make future payments under various contracts such as debt agreements and lease agreements. The following table represents our contractual payment obligations as of March 29, 2015 and the estimated timing of future cash payments:
Contractual Cash Obligations | Total | 2016 | 2017 | 2018 | 2019 | 2020 | Thereafter | ||||||||||||||||||||
Long-term debt | $ | 4,595 | $ | 1,093 | $ | 1 | $ | 1,001 | $ | 1,000 | $ | — | $ | 1,500 | |||||||||||||
Operating leases(1) | 173 | 42 | 33 | 27 | 20 | 14 | 37 | ||||||||||||||||||||
Cash contributions to qualified pension plans | 128 | 51 | 20 | 19 | 19 | 19 | — | ||||||||||||||||||||
Environmental remediation | 12 | 12 | — | — | — | — | — | ||||||||||||||||||||
Interest on fixed-rate debt | 778 | 61 | 58 | 55 | 45 | 45 | 514 | ||||||||||||||||||||
Interest on variable-rate debt(2) | 12 | 4 | 3 | 3 | 2 | — | — | ||||||||||||||||||||
Total | $ | 5,698 | $ | 1,263 | $ | 115 | $ | 1,105 | $ | 1,086 | $ | 78 | $ | 2,051 | |||||||||||||
_________________________
(1) | Operating lease obligations attributable to operations held-for-sale were $8 million. |
(2) | Interest on variable-rate debt is based on current prevailing interest rates. |
Our reserve for uncertain tax positions at March 29, 2015 was $16 million. Due to the uncertainties associated with settling these liabilities, we are unable to make reasonable estimates of the period of cash settlement. As a result, our reserve for unrecognized tax benefits is excluded from the table above. See Item 8. Financial Statements and Supplementary Data, Note 10—Income taxes for additional information regarding our reserve for uncertain tax positions.
We also have benefit payments due under our non-qualified pension and other post-retirement benefit plans that are not required to be funded in advance, but are paid in the same period that benefits are provided. See Item 8. Financial Statements and Supplementary Data, Note 18—Pension and other postretirement benefit plans for additional information.
As of March 29, 2015, we had accrued environmental liabilities of $448 million for future costs arising from environmental issues relating to our properties and operations. Only contractual payment obligations for environmental remediation are included in the table above. Our total future expenditures, however, relating to compliance and cleanup of environmental conditions at our properties cannot be conclusively determined and are excluded from the table above. See Item 8. Financial Statements and Supplementary Data, Note 13—Commitments and contingencies for additional information.
Critical accounting policies
We have identified the policies below as critical to our business operations and the understanding of our results of operations. The impact and any associated risks related to these policies on our business operations are discussed throughout Management’s Discussion and Analysis where such policies affect reported and expected financial results. For a detailed discussion on the application of these and other significant accounting policies, see the Notes to the Consolidated Financial Statements of this Annual Report. Note that the preparation of this Annual Report requires management to make estimates and assumptions that affect the reported amount of assets and liabilities, disclosure of contingent assets and liabilities at the date of the financial statements, and the reported amounts of revenue and expenses during the reporting period. Actual results may differ from those estimates.
Revenue recognition
We recognize revenue when the earnings process is complete. This occurs when products are delivered in accordance with the contract or purchase order, ownership and risk of loss have passed to the customer, collectability is reasonably assured, and pricing is fixed and determinable. In instances where title does not pass to the customer upon shipment, we recognize revenue upon delivery or customer acceptance, depending on terms of the sales agreement. Service sales, representing maintenance and engineering activities, are recognized as services are performed. Shipping and handling costs billed to customers are included in revenue.
Valuation of inventories
All inventories are stated at the lower of their cost or market value, with the market value being determined based on sales in the ordinary course of business. Cost for inventories at a significant number of our operations is determined on a last-in,
36
first-out (“LIFO”) basis. The average inventory cost method is utilized for most other inventories. We regularly review inventory quantities on hand and record a provision for excess or obsolete inventory equal to the difference between the cost of the inventory and the estimated market value based on the age, historical usage or assumptions about future demand for the inventory.
We also regularly review inventory balances on a LIFO basis to ensure the balances are stated at the lower of cost or market as of the balance sheet date. For those inventories valued using LIFO, their carrying value may be higher or lower than current replacement costs for such inventory, since the LIFO costing assumption matches current costs with current sales, not with current inventory values. When the LIFO cost is greater than the current cost, there is an increased likelihood that our inventories could be subject to write-downs to market value. As of March 29, 2015, the LIFO cost of our inventories exceeds the current cost by $679 million. If actual demand is significantly less than the future demand that we have projected, inventory write-downs may be required, which could have a material adverse effect on the value of our inventories and reported operating results. In the fourth quarter of fiscal 2015, we recognized a non-cash inventory impairment charge of $120 million, pre-tax, primarily in our oil & gas, pipe and associated raw material operations, reflecting the more challenging environment, declines in market value, and size or quality characteristics that impact marketability. The projections of future demand by management are based upon firm orders (including long-term agreements), forecasted demand from customers, and macro-economic industry data.
The key drivers that are causing our LIFO inventory costs to exceed current costs are as follows:
• | Decreases in raw material prices in recent fiscal years, including nickel, titanium, cobalt, rutile, titanium sponge and revert |
• | Reduced variable manufacturing costs as a result of operational efficiencies and improved labor productivity |
• | Decreased fixed costs per unit of inventory due to cost controls and increasing production volumes |
• | Inventory added through acquisitions that are valued at fair market value (typically higher than historical cost) that remains in the LIFO cost basis unless liquidated through quantity reductions |
As we acquire additional businesses, management first determines if the acquired business should account for inventory on a LIFO basis due to the nature of the business and materiality of the inventory balances. If LIFO treatment is deemed appropriate, management then determines whether to incorporate the acquired inventories into existing LIFO pools or create a new LIFO pool based on several factors. Those factors include, but are not limited to:
• | Similarity or dissimilarity of nature of operations, including raw materials used, product produced and cost structure, to existing businesses. The more similar businesses are, the more likely they will have common LIFO pools |
• | Location of the business as LIFO pools do not typically include operations in more than one country for tax, functional currency and other reasons |
• | The size of the acquisition in relation to the existing pool(s). Smaller businesses are often incorporated into existing LIFO pools |
Acquisition accounting
We account for acquired businesses using the acquisition method of accounting. This requires that we make various assumptions and estimates regarding the fair value of assets, liabilities, and contractual and non-contractual contingencies at the date of acquisition. These assumptions can have a material impact on our balance sheet valuations and the related amount of depreciation and amortization expense that will be recognized in the future.
Goodwill and acquired intangibles
We regularly acquire businesses in purchase transactions that typically result in the recognition of goodwill and other intangible assets, which may affect the amount of future period amortization expense and possible impairment charges. The determination of the value of such intangible assets requires management to make estimates and assumptions that affect the consolidated financial statements.
We recognize indefinite-lived intangible assets when circumstances are identified whereby there is no foreseeable limit on the period of time over which the asset is expected to contribute to the cash flows of the acquired entity. We evaluate many criteria and factors when determining whether an asset life is either indefinite or limited. Among the most significant factors are: the economic effects of competition, obsolescence and demand; the relative cost to the customer for terminating the relationship; the forecasted customer turnover rate and whether there are legal, regulatory, contractual, or other factors that limit the useful life of the asset. If no factors are identified that would limit the asset life then it is considered indefinite.
37
Goodwill and indefinite-lived intangible assets related to our continuing operations are tested for impairment at a minimum each fiscal year at the end of the second month in the second quarter or when events or circumstances indicate that the carrying value of these assets are more likely than not to exceed their fair value. For fiscal 2015, our reporting units consisted of two reporting units within our Investment Cast Products reportable operating segment, three reporting units within our Forged Products reportable operating segment, as well as five reporting units in our Airframe Products reportable operating segment.
In the fourth quarter of fiscal 2015, we recognized a goodwill impairment charge of $13 million, pre-tax, related to three of our discontinued operations held for sale as the fair value, as determined by expected net proceeds, did not exceed the carrying value.
Testing for goodwill impairment involves the estimation of the fair value of the reporting units. Discounted cash flow and market-based valuation multiple models are typically used in these valuations. Such models require the use of significant estimates and assumptions primarily based on such factors as future cash flows, expected market growth rates, estimates of sales volumes, market valuation multiples, sales prices and related costs, and discount rates, which reflect the weighted average cost of capital. Management uses the best available information at the time fair values of the reporting units are estimated; however, estimates could be materially impacted by such factors as changes in growth trends and specific industry conditions, with the potential for a corresponding adverse effect on the consolidated financial statements which could potentially result in an impairment of goodwill. The discounted cash flow models used to determine fair value are sensitive to the expected future cash flows and the discount rate for each reporting unit. The discount rate used in the cash flow models for the fiscal 2015 goodwill impairment analysis ranged from 8% to 14% depending on the reporting unit. The annual growth rate for earnings before interest and taxes varied by reporting unit and ranged from 7% to 15% over the initial five-year forecast period. We used a terminal value growth rate of 3.5% and found that the reporting unit that would be most sensitive to worsening economic conditions has $1.6 billion of goodwill recorded as of March 29, 2015. We performed additional sensitivity analysis and determined that the forecast for future earnings before interest and taxes used in the cash flow model could decrease by more than 11% or the discount rate utilized could increase by approximately 1 percentage point, and the goodwill of our reporting units would not require additional impairment testing.
The impairment test for indefinite-lived intangible assets encompasses calculating the fair value of an indefinite-lived intangible asset and comparing the fair value to its carrying value. The testing methodology utilizes a discounted cash flow model, consistent with goodwill impairment testing. Indefinite-lived intangible asset testing is performed at the same business unit or division level as the initial asset value determination. If the carrying value exceeds the estimated fair value, impairment is recorded. For fiscal 2015 and 2014, it was determined that the fair value of indefinite-lived intangible assets was greater than the carrying value.
Environmental costs
Total environmental liabilities accrued at March 29, 2015 and March 30, 2014 were $448 million and $525 million, respectively. The estimated future costs for known environmental remediation requirements are accrued on an undiscounted basis when it is probable that a liability has been incurred, and the amount of remediation costs can be reasonably estimated. When only a range of amounts is established, and no amount within the range is better than another, the minimum amount of the range is recorded. The estimated upper end of the range of reasonably possible environmental costs exceeded amounts accrued by approximately $360 million at March 29, 2015. Actual future losses may be lower or higher given the uncertainties regarding the status of laws, regulations, enforcement policies, the impact of potentially responsible parties, technology and information related to individual sites.
Recoveries of environmental remediation costs from other parties are recorded as assets when collection is probable. Adjustments to our accruals may be necessary to reflect new information as investigation and remediation efforts proceed. The amounts of any such adjustments could have a material adverse effect on our results of operations in a given period.
Due to the nature of its historical operations, TIMET has significant environmental liabilities at its titanium manufacturing plants. It has for many years, under the oversight of government agencies, conducted investigations of the soil and groundwater contamination at its plant sites. TIMET has initiated remedial actions at its properties, including the capping of former on-site landfills, removal of contaminated sediments from on-site surface impoundments, remediation of contaminated soils and the construction of a slurry wall and groundwater extraction system to treat contaminated groundwater as well as other remedial actions. Although it is anticipated that significant remediation will be completed within the next two to three years, it is expected that a substantial portion of the TIMET environmental accruals will be expended within an estimated 41 years. Expenditures related to these remedial actions and for resolving TIMET's other environmental liabilities will be applied against existing liabilities. As the remedial actions are implemented at these sites, the liabilities will be adjusted based on the progress made in determining the extent of contamination and the extent of required remediation. While the
38
existing liability generally represents our current best estimate of the costs or range of costs of resolving the identified environmental liabilities, these costs may change substantially due to factors such as the nature and extent of contamination, changes in legal and remedial requirements, the allocation of costs among potentially responsible parties as well as other third parties, and technological changes, among others.
Guidance on asset retirement and environmental obligations clarifies the term "conditional asset retirement obligation" and requires a liability to be recorded if the fair value of the obligation can be reasonably estimated. Asset retirement obligations covered by this guidance include those for which an entity has a significant obligation to perform an asset retirement activity; however, the timing or method of settling the obligation are conditional on a future event that may not be within the control of the entity. This guidance also clarifies when an entity would have sufficient information to reasonably estimate the fair value of an asset retirement obligation.
In accordance with the asset retirement and environmental obligations guidance, we record all known asset retirement obligations for which the liability can be reasonably estimated. Currently, we have identified known asset retirement obligations associated with environmental contamination at several of our manufacturing facilities and have accrued approximately $5 million to satisfy these asset retirement obligations. However, we have not recognized a liability for an asset retirement obligations at two of our manufacturing facilities because the fair value retirement obligation at these sites cannot be reasonably estimated since the settlement date is unknown at this time. The settlement date is unknown because the retirement obligation (remediation of contamination) of these sites is not required until production ceases, and we have no current or future plans to cease production. These asset retirement obligations, when estimable, are not expected to have a material adverse effect on our consolidated financial position, results of operations, cash flows or business.
Unconsolidated affiliates
We have equity interests in various businesses, which we account for under the equity method as we do not exercise control of the major operating and financial policies. The carrying value of these investments as of March 29, 2015 and March 30, 2014 was $238 million and $416 million, respectively. We regularly assess the profitability and valuation of our investments for any potential impairment. At various times, we may be in discussions with the other owners of these businesses on a variety of topics, including status of the jointly owned entities. In the fourth quarter of fiscal 2015, we decided to sell our 50 percent ownership of Yangzhou Chengde Steel Tube Co. Ltd., a large-diameter pipe manufacturing joint venture in China. At that time, we concluded we no longer had the intent to retain our partial ownership and improve the operations of the facility and therefore, an impairment of the investment was warranted. Based on the estimated fair value of the investment, we recognized a non-cash impairment charge of $174 million, pre-tax, in the fourth quarter of fiscal 2015, which also includes a small impairment associated with an unrelated joint venture.
Available for sale securities
Available for sale securities consist of investments in shares of publicly traded companies, which we account for at fair value. The carrying value of our investments as of March 29, 2015 and March 30, 2014 was $32 million and $46 million, respectively. We regularly assess the valuation of our investments for potential impairment. While we consider the recent decline in the valuation to be temporary, persistent low valuations could cause us to reevaluate whether our investments are impaired.
Income taxes
Provisions for federal, state and foreign income taxes are calculated on reported pre-tax earnings based on current tax law and also include, in the current period, the cumulative effect of any changes in tax rates from those used previously in determining deferred tax assets and liabilities. Such provisions differ from the amounts currently receivable or payable, because certain items of income and expense are recognized in different time periods for financial reporting purposes than for income tax purposes. Significant judgment is required in determining income tax provisions and evaluating tax positions. Valuation allowances are recorded to reduce deferred tax assets when it is more likely than not that a tax benefit will not be realized. Tax benefits arising from uncertain tax positions are recognized when it is more likely than not that the position will be sustained upon examination by the relevant tax authorities. The amount recognized in the financial statements is the largest amount of tax benefit that is greater than 50 percent likely of being realized upon ultimate settlement with a taxing authority that has full knowledge of all relevant information. We recognize interest and penalties, if any, related to uncertain tax positions in income tax expense.
Pension and other postretirement benefit plans
We sponsor many U.S. and non-U.S. defined benefit pension plans. Our pension and postretirement benefit plans are accounted for in accordance with defined benefit pension and other postretirement plans accounting guidance. Plan assets have
39
been valued at fair value in accordance with this guidance. Pension and postretirement expense and liability amounts are derived from several significant assumptions, including the discount rate, expected return on plan assets and health care cost trend rate. For valuation of our pension liabilities, we derive a market-based discount rate from yields on high quality, liquid fixed income securities at the end of our fiscal year. We use only highly-rated bonds (AA/Aa or higher) to estimate the interest rate at which our pension benefits could be effectively settled. For our U.S. Plans, we used a discount rate assumption of 4.05% for the total benefit obligation of our pension plans at our March 29, 2015 measurement date. For our non-U.S. Plans, we used a discount rate assumption of 3.54% for the total benefit obligation of our pension plans at our March 29, 2015 measurement date.
In developing the long-term rate of return on plan assets assumptions, we evaluate input from third-party investment consultants and actuaries, and review asset allocation and investment strategies, ranges of projected and historical returns, and inflation and economic assumptions. The expected return assumptions are derived from asset allocations within the Company's target asset allocation ranges consistent with our diversified investment approach. As the assumed rate of return on plan assets is a long-term assumption, it is not anticipated to be as volatile as the discount rate, which is a point-in-time measurement. For our U.S. Plans, we used a long-term rate of return assumption of 7.75% to calculate the 2015 net periodic pension cost. For our non-U.S. Plans, we used a long-term rate of return assumption of 7.25% to calculate the 2015 net periodic pension cost. For fiscal 2016, we will use a long-term rate of return assumption of 7.75% for our U.S. plans and 7.00% for our non-U.S. plans to calculate the net periodic pension cost. For fiscal 2015, our U.S. net periodic pension expense was $44 million and non-U.S. net periodic pension expense was $2 million. We estimate that for fiscal 2016, our U.S. net periodic pension expense will be approximately $46 million and non-U.S. net periodic pension expense will be approximately $2 million. Our U.S. net postretirement benefit cost was $6 million for fiscal 2015, and we estimate that for fiscal 2016, our U.S. net postretirement benefit cost will be $6 million.
The table below quantifies the approximate impact, as of March 29, 2015, of a one-quarter percentage point decrease in our assumptions for discount rate and expected return on assets, holding other assumptions constant.
0.25 Percentage Point Decrease | |||
Increase in annual costs: | |||
Discount rate | $ | 8 | |
Expected long-term rate of return | $ | 6 | |
Increase in projected benefit obligation: | |||
Discount rate | $ | 111 | |
The approximate impact, as of March 29, 2015, of a one percentage point increase in our assumption for the health care cost trend rate, holding other assumptions constant, on our total service and interest cost components and accumulated postretirement benefit obligation is not significant.
Recently issued accounting standards
In January 2015, the Financial Accounting Standards Board (“FASB”) issued guidance which eliminates the concept of an extraordinary item. As a result, entities will no longer segregate an extraordinary item from the results of ordinary operations; separately present an extraordinary item on its income statement, net of tax, after income from continuing operations; and disclose income taxes and earnings per share data applicable to an extraordinary item. The guidance is effective for the Company beginning the first quarter of fiscal 2017 with early adoption permitted. The adoption of this guidance is not expected to have a significant impact on our consolidated financial position, results of operations, or cash flows.
In May 2014, the FASB issued guidance on revenue from contracts with customers. The guidance outlines a single comprehensive model for entities to use in accounting for revenue arising from contracts with customers and supersedes the most current revenue recognition guidance. The guidance is effective for the Company beginning the first quarter of fiscal 2018. In April 2015, the FASB issued a proposal that would defer the effective date by one year. The Company is in the process of determining the impact of this guidance on our consolidated financial positions, results of operations, and cash flows.
In April 2014, the FASB issued guidance that changes the criteria for reporting discontinued operations while enhancing disclosures in this area. Under the new guidance, only disposals representing a strategic shift in operations should be presented as discontinued operations. The guidance is effective for the Company beginning the first quarter of fiscal 2016. The adoption
40
of this guidance is not expected to have a significant impact on our consolidated financial position, results of operations, or cash flows.
In July 2013, the FASB issued guidance on the presentation of unrecognized tax benefits when a net operating loss carryforward, a similar tax loss, or a tax credit carryforward exists. The guidance requires entities to present an unrecognized tax benefit netted against certain deferred tax assets when specific requirements are met. The guidance was effective for the Company beginning the first quarter of fiscal 2015. The adoption of this guidance did not have a significant impact on our consolidated financial position, results of operations, or cash flows.
In March 2013, the FASB issued guidance to address the accounting for the cumulative translation adjustment when a parent entity sells or transfers either a subsidiary or a group of assets within a foreign entity. The guidance was effective for the Company beginning the first quarter of fiscal 2015 and was applied prospectively. The adoption of this guidance did not have a significant impact on our consolidated financial position, results of operations, or cash flows.
ITEM 7A. | QUANTITATIVE AND QUALITATIVE DISCLOSURES ABOUT MARKET RISK |
At various times, we use derivative financial instruments to limit exposure to changes in foreign currency exchange rates, interest rates and prices of strategic raw materials. Because derivative instruments are used solely as hedges and not for speculative trading purposes, fluctuations in the market values of such derivative instruments are generally offset by reciprocal changes in the underlying economic exposures that the instruments are intended to hedge. For further discussion of derivative financial instruments, refer to Item 8. Financial Statements and Supplementary Data, Note 17—Derivatives and hedging activities.
Interest Rate Risk
We have variable rate debt obligations that expose us to interest rate risk. If market interest rates had averaged 10 percent higher than actual levels in fiscal 2015 or 2014, the effect on our interest expense and net income would not have been material.
Foreign Currency Risk
The majority of our revenue, expense and capital purchasing activities are transacted in U.S. dollars; however, we are exposed to fluctuations in foreign currencies for transactions denominated in other currencies. As discussed in Item 8. Financial Statements and Supplementary Data, Note 1—Summary of significant accounting policies, we had foreign currency hedges in place at March 29, 2015 and March 30, 2014 to reduce such exposure. The estimated loss in fair value on foreign currency hedges outstanding as of March 29, 2015, from a hypothetical 10 percent adverse change in exchange rates, would not have been material.
Material Cost Risk
We have entered into long-term supply agreements to fix the purchase price of certain strategic raw materials as of March 29, 2015 and March 30, 2014. In addition, we had escalation clauses related to raw material pricing in certain of our sales contracts at March 29, 2015 and March 30, 2014. If market rates had averaged 10 percent higher than actual levels in either fiscal 2015 or 2014, the effect on our cost of sales and net earnings, after considering the effects of these supply agreements and related sales contracts, would not have been material.
41
ITEM 8. | FINANCIAL STATEMENTS AND SUPPLEMENTARY DATA |
Consolidated Statements of Income
Fiscal Years Ended | |||||||||||
(In millions, except per share data) | March 29, 2015 | March 30, 2014 | March 31, 2013 | ||||||||
Net sales | $ | 10,005 | $ | 9,533 | $ | 8,347 | |||||
Costs and expenses: | |||||||||||
Cost of goods sold | 6,752 | 6,253 | 5,654 | ||||||||
Selling and administrative expenses | 641 | 621 | 534 | ||||||||
Restructuring expense | 8 | — | — | ||||||||
Interest expense | 69 | 76 | 38 | ||||||||
Interest income | (4 | ) | (5 | ) | (7 | ) | |||||
Total costs and expenses | 7,466 | 6,945 | 6,219 | ||||||||
Income before income tax expense and equity in earnings of unconsolidated affiliates | 2,539 | 2,588 | 2,128 | ||||||||
Income tax expense | (816 | ) | (830 | ) | (695 | ) | |||||
Equity in (loss) earnings of unconsolidated affiliates | (175 | ) | 1 | 1 | |||||||
Net income from continuing operations | 1,548 | 1,759 | 1,434 | ||||||||
Net (loss) income from discontinued operations | (15 | ) | 25 | (4 | ) | ||||||
Net income | 1,533 | 1,784 | 1,430 | ||||||||
Net income attributable to noncontrolling interests | (3 | ) | (7 | ) | (3 | ) | |||||
Net income attributable to Precision Castparts Corp. (“PCC”) | $ | 1,530 | $ | 1,777 | $ | 1,427 | |||||
Net income (loss) per common share attributable to PCC shareholders— basic: | |||||||||||
Net income per share from continuing operations | $ | 10.83 | $ | 12.03 | $ | 9.82 | |||||
Net (loss) income per share from discontinued operations | (0.10 | ) | 0.17 | (0.03 | ) | ||||||
Net income per share (basic) | $ | 10.73 | $ | 12.20 | $ | 9.79 | |||||
Net income (loss) per common share attributable to PCC shareholders— diluted: | |||||||||||
Net income per share from continuing operations | $ | 10.77 | $ | 11.95 | $ | 9.75 | |||||
Net (loss) income per share from discontinued operations | (0.11 | ) | 0.17 | (0.03 | ) | ||||||
Net income per share (diluted) | $ | 10.66 | $ | 12.12 | $ | 9.72 | |||||
Weighted average common shares outstanding: | |||||||||||
Basic | 142.6 | 145.6 | 145.7 | ||||||||
Diluted | 143.5 | 146.6 | 146.7 | ||||||||
See Notes to Consolidated Financial Statements.
42
Consolidated Statements of Comprehensive Income
Fiscal Years Ended | |||||||||||
(In millions) | March 29, 2015 | March 30, 2014 | March 31, 2013 | ||||||||
Net income | $ | 1,533 | $ | 1,784 | $ | 1,430 | |||||
Other comprehensive income (loss) ("OCI"), net of tax: | |||||||||||
Foreign currency translation adjustments | (353 | ) | 148 | (99 | ) | ||||||
Gain (loss) on available-for-sale securities: | |||||||||||
Unrealized (losses) gains on available-for-sales securities (net of income tax benefit (expense) of $2, $13, and $(8) respectively) | (12 | ) | (22 | ) | 15 | ||||||
Less: reclassification adjustment for gains included in net income (net of income tax expense of $0, $1, and $0 respectively) | — | (2 | ) | — | |||||||
Gain (loss) on derivatives: | |||||||||||
Unrealized (losses) gains due to periodic revaluations (net of income tax benefit (expense) of $6, $(2), and $1 respectively) | (17 | ) | 7 | 1 | |||||||
Less: reclassification adjustment for gains included in net income (net of income tax expense of $0 in all periods) | (1 | ) | (2 | ) | (1 | ) | |||||
Pension and post retirement obligations (net of income tax benefit (expense) of $56, $(29), and $23 respectively) | (154 | ) | 6 | (27 | ) | ||||||
Other comprehensive (loss) income, net of tax | (537 | ) | 135 | (111 | ) | ||||||
Total comprehensive loss (income) attributable to noncontrolling interests | 18 | (13 | ) | — | |||||||
Total comprehensive income attributable to PCC | $ | 1,014 | $ | 1,906 | $ | 1,319 | |||||
See Notes to Consolidated Financial Statements.
43
Consolidated Balance Sheets
(In millions, except share data) | March 29, 2015 | March 30, 2014 | |||||
Assets | |||||||
Current assets: | |||||||
Cash and cash equivalents | $ | 474 | $ | 361 | |||
Receivables, net of allowance of $12 in 2015 and $7 in 2014 | 1,710 | 1,568 | |||||
Inventories | 3,640 | 3,426 | |||||
Prepaid expenses and other current assets | 81 | 105 | |||||
Income tax receivable | 37 | 5 | |||||
Deferred income taxes | 2 | 13 | |||||
Discontinued operations | 28 | 29 | |||||
Total current assets | 5,972 | 5,507 | |||||
Property, plant and equipment: | |||||||
Land | 192 | 169 | |||||
Buildings and improvements | 578 | 523 | |||||
Machinery and equipment | 3,234 | 2,988 | |||||
Construction in progress | 324 | 298 | |||||
4,328 | 3,978 | ||||||
Accumulated depreciation | (1,854 | ) | (1,678 | ) | |||
Net property, plant and equipment | 2,474 | 2,300 | |||||
Goodwill | 6,661 | 6,613 | |||||
Acquired intangible assets, net | 3,744 | 3,440 | |||||
Investment in unconsolidated affiliates | 238 | 416 | |||||
Other assets | 311 | 262 | |||||
Discontinued operations | 28 | 48 | |||||
$ | 19,428 | $ | 18,586 | ||||
Liabilities and Equity | |||||||
Current liabilities: | |||||||
Long-term debt currently due and short-term borrowings | $ | 1,093 | $ | 2 | |||
Accounts payable | 1,162 | 1,039 | |||||
Accrued liabilities | 559 | 554 | |||||
Discontinued operations | 13 | 13 | |||||
Total current liabilities | 2,827 | 1,608 | |||||
Long-term debt | 3,493 | 3,569 | |||||
Pension and other postretirement benefit obligations | 678 | 442 | |||||
Other long-term liabilities | 546 | 598 | |||||
Deferred income taxes | 924 | 950 | |||||
Discontinued operations | 3 | 6 | |||||
Commitments and contingencies (See Notes) | |||||||
Equity: | |||||||
Preferred stock, no par, 1,000,000 shares authorized and unissued in 2015 and 2014 | — | — | |||||
Common stock, $1 stated value, authorized: 450,000,000 shares; issued and outstanding: 138,586,810 and 145,084,877 shares in 2015 and 2014 | 139 | 145 | |||||
Paid-in capital | 60 | 1,487 | |||||
Retained earnings | 11,685 | 10,172 | |||||
Accumulated other comprehensive loss | (955 | ) | (418 | ) | |||
Total PCC shareholders’ equity | 10,929 | 11,386 | |||||
Noncontrolling interest | 28 | 27 | |||||
Total equity | 10,957 | 11,413 | |||||
$ | 19,428 | $ | 18,586 | ||||
See Notes to Consolidated Financial Statements.
44
Consolidated Statements of Cash Flows
Fiscal Years Ended | |||||||||||
(In millions) | March 29, 2015 | March 30, 2014 | March 31, 2013 | ||||||||
Operating Activities: | |||||||||||
Net income | $ | 1,533 | $ | 1,784 | $ | 1,430 | |||||
Net loss (income) from discontinued operations | 15 | (25 | ) | 4 | |||||||
Non-cash items: | |||||||||||
Depreciation and amortization | 325 | 292 | 214 | ||||||||
Deferred income taxes | 147 | 177 | 133 | ||||||||
Stock-based compensation expense | 57 | 60 | 52 | ||||||||
Excess tax benefits from share-based payment arrangements | (13 | ) | (22 | ) | (35 | ) | |||||
Restructuring and inventory and other asset impairment | 309 | — | — | ||||||||
Other non-cash adjustments | (9 | ) | (28 | ) | (10 | ) | |||||
Changes in assets and liabilities, excluding effects of acquisitions and dispositions of businesses: | |||||||||||
Receivables | (137 | ) | 8 | (52 | ) | ||||||
Inventories | (292 | ) | (361 | ) | (216 | ) | |||||
Prepaid expenses and other current assets | 12 | 15 | (6 | ) | |||||||
Income tax receivable and payable | (15 | ) | 6 | 34 | |||||||
Payables and accruals | — | 31 | 78 | ||||||||
Pension and other postretirement benefit plans | 23 | 27 | (38 | ) | |||||||
Dividends from equity method investments | — | 29 | — | ||||||||
Other non-current assets and liabilities | (253 | ) | (132 | ) | (99 | ) | |||||
Net cash provided (used) by operating activities of discontinued operations | — | 21 | (30 | ) | |||||||
Net cash provided by operating activities | 1,702 | 1,882 | 1,459 | ||||||||
Investing Activities: | |||||||||||
Acquisitions of businesses, net of cash acquired | (637 | ) | (1,012 | ) | (5,065 | ) | |||||
Capital expenditures | (455 | ) | (351 | ) | (320 | ) | |||||
Dispositions of businesses | 24 | 64 | 31 | ||||||||
Sale of marketable securities | — | 40 | — | ||||||||
Other investing activities, net | 59 | 19 | 11 | ||||||||
Net cash used by investing activities of discontinued operations | — | (4 | ) | (3 | ) | ||||||
Net cash used by investing activities | (1,009 | ) | (1,244 | ) | (5,346 | ) | |||||
Financing Activities: | |||||||||||
Net change in commercial paper borrowings | 1,017 | (30 | ) | 601 | |||||||
Proceeds from issuance of long-term debt | — | — | 2,993 | ||||||||
Repayments of long-term debt | — | (203 | ) | (131 | ) | ||||||
Payments for debt issuance costs | — | — | (23 | ) | |||||||
Common stock issued | 102 | 114 | 129 | ||||||||
Excess tax benefits from share-based payment arrangements | 13 | 22 | 35 | ||||||||
Repurchase of common stock | (1,598 | ) | (487 | ) | (93 | ) | |||||
Cash dividends | (17 | ) | (18 | ) | (17 | ) | |||||
Other financing activities, net | (2 | ) | (1 | ) | (2 | ) | |||||
Net cash (used) provided by financing activities | (485 | ) | (603 | ) | 3,492 | ||||||
Effect of exchange rate changes on cash and cash equivalents | (95 | ) | 46 | (24 | ) | ||||||
Net increase (decrease) in cash and cash equivalents | 113 | 81 | (419 | ) | |||||||
Cash and cash equivalents at beginning of year | 361 | 280 | 699 | ||||||||
Cash and cash equivalents at end of year | $ | 474 | $ | 361 | $ | 280 | |||||
Supplemental Disclosures | |||||||||||
Cash paid during the year for: | |||||||||||
Interest | $ | 66 | $ | 80 | $ | 20 | |||||
Income taxes, net of refunds received | $ | 651 | $ | 624 | $ | 532 | |||||
Non-cash investing and financing activities: | |||||||||||
Debt assumed in connection with business acquisitions | $ | — | $ | — | $ | 137 | |||||
Dividends declared but not paid | $ | 4 | $ | 4 | $ | 4 | |||||
See Notes to Consolidated Financial Statements.
45
Consolidated Statements of Equity
PCC Shareholders | Non-controlling Interest | Total Equity | ||||||||||||||||||||||||
Common Stock Outstanding | Paid-in Capital | Retained Earnings | Accumulated Other Comprehensive (Loss) / Income | |||||||||||||||||||||||
(In millions, except per share data) | Shares | Amount | ||||||||||||||||||||||||
Balance at April 1, 2012 | 145.3 | $ | 146 | $ | 1,654 | $ | 7,003 | $ | (442 | ) | $ | 4 | $ | 8,365 | ||||||||||||
Common stock issued pursuant to stock plans | 1.4 | 1 | 128 | — | — | — | 129 | |||||||||||||||||||
Repurchase of common stock | (0.5 | ) | (1 | ) | (92 | ) | — | — | — | (93 | ) | |||||||||||||||
Stock-based compensation expense | — | — | 53 | — | — | — | 53 | |||||||||||||||||||
Tax benefit from stock-based compensation | — | — | 33 | — | — | — | 33 | |||||||||||||||||||
Cash dividends ($0.12 per share) | — | — | — | (17 | ) | — | — | (17 | ) | |||||||||||||||||
Distributions to noncontrolling interests | — | — | — | — | — | (2 | ) | (2 | ) | |||||||||||||||||
Assumptions of additional noncontrolling interests | — | — | — | — | — | 421 | 421 | |||||||||||||||||||
Purchases from noncontrolling interests | — | — | 1 | — | — | (405 | ) | (404 | ) | |||||||||||||||||
Net income | — | — | — | 1,427 | — | 3 | 1,430 | |||||||||||||||||||
Other comprehensive loss | — | — | — | — | (111 | ) | — | (111 | ) | |||||||||||||||||
Balance at March 31, 2013 | 146.2 | 146 | 1,777 | 8,413 | (553 | ) | 21 | 9,804 | ||||||||||||||||||
Common stock issued pursuant to stock plans | 1.0 | 1 | 113 | — | — | — | 114 | |||||||||||||||||||
Repurchase of common stock | (2.1 | ) | (2 | ) | (485 | ) | — | — | — | (487 | ) | |||||||||||||||
Stock-based compensation expense | — | — | 60 | — | — | — | 60 | |||||||||||||||||||
Tax benefit from stock-based compensation | — | — | 22 | — | — | — | 22 | |||||||||||||||||||
Cash dividends ($0.12 per share) | — | — | — | (18 | ) | — | — | (18 | ) | |||||||||||||||||
Distributions to noncontrolling interests | — | — | — | — | — | (1 | ) | (1 | ) | |||||||||||||||||
Net income | — | — | — | 1,777 | — | 7 | 1,784 | |||||||||||||||||||
Other comprehensive income | — | — | — | — | 135 | — | 135 | |||||||||||||||||||
Balance at March 30, 2014 | 145.1 | 145 | 1,487 | 10,172 | (418 | ) | 27 | 11,413 | ||||||||||||||||||
Common stock issued pursuant to stock plans | 0.7 | 1 | 101 | — | — | — | 102 | |||||||||||||||||||
Repurchase of common stock | (7.2 | ) | (7 | ) | (1,599 | ) | — | — | — | (1,606 | ) | |||||||||||||||
Stock-based compensation expense | — | — | 58 | — | — | — | 58 | |||||||||||||||||||
Tax benefit from stock-based compensation | — | — | 13 | — | — | — | 13 | |||||||||||||||||||
Cash dividends ($0.12 per share) | — | — | — | (17 | ) | — | — | (17 | ) | |||||||||||||||||
Distributions to noncontrolling interests | — | — | — | — | — | (2 | ) | (2 | ) | |||||||||||||||||
Net income | — | — | — | 1,530 | — | 3 | 1,533 | |||||||||||||||||||
Other comprehensive loss | — | — | — | — | (537 | ) | — | (537 | ) | |||||||||||||||||
Balance at March 29, 2015 | 138.6 | $ | 139 | $ | 60 | $ | 11,685 | $ | (955 | ) | $ | 28 | $ | 10,957 | ||||||||||||
See Notes to Consolidated Financial Statements.
46
NOTES TO CONSOLIDATED FINANCIAL STATEMENTS
(In millions, except option share and per share data)
1. Summary of significant accounting policies
Principles of consolidation
The consolidated financial statements include the accounts of Precision Castparts Corp. (“PCC”, the “Company”, or “we”) and subsidiaries after elimination of intercompany accounts and transactions. Subsidiaries include majority-owned companies and other companies which are fully consolidated based on PCC having a controlling financial interest or an obligation to consolidate under accounting principles generally accepted in the United States of America (“GAAP”). Investments in affiliated companies are accounted for using the equity method when PCC has a non-controlling ownership interest, generally between twenty and fifty percent, giving us significant influence; and investments are accounted for using the cost method when PCC has a non-controlling ownership interest of less than 20 percent. Unless otherwise noted, disclosures herein pertain to our continuing operations. Our fiscal year is based on a 52-53 week year ending the Sunday closest to March 31.
Certain reclassifications have been made to prior year amounts to conform to the current year presentation. Such reclassifications had no effect on previously reported shareholders’ equity or net income.
Cash and cash equivalents
Cash and cash equivalents include cash on hand and highly liquid short-term instruments with maturities of three months or less at the time of purchase. These investments are available for sale with market values approximating cost.
Inventories
All inventories are stated at the lower of cost or current market values. Cost for inventories at the majority of our operations is determined on a last-in, first-out (“LIFO”) basis. The average inventory cost method is utilized for most other inventories. Costs utilized for inventory valuation purposes include material, labor and manufacturing overhead.
Property, plant and equipment
Property, plant and equipment are stated at cost. Depreciation of plant and equipment is computed using the straight-line method based on the estimated service lives of the assets. Estimated service lives are generally 20 to 40 years for buildings and improvements, 20 to 25 years for furnaces, 3 to 12 years for machinery and equipment and 3 to 7 years for computer hardware and software. Depreciation expense was $275 million, $246 million and $186 million in fiscal 2015, 2014 and 2013, respectively. Gains and losses from the disposal of property, plant and equipment are included in the consolidated statements of income and were not material for any year presented. Expenditures for routine maintenance, repairs and minor improvements are charged to expense as incurred.
Acquisition accounting
We account for acquired businesses using the acquisition method of accounting. This requires that we make various assumptions and estimates regarding the fair value of assets, liabilities, and contractual and non-contractual contingencies at the date of acquisition. These assumptions can have a material impact on our balance sheet valuations and the related amount of depreciation and amortization expense that will be recognized in the future.
Goodwill and acquired intangible assets
Goodwill represents costs in excess of fair values assigned to the underlying net assets of acquired businesses, and acquired intangible assets represent items such as patents, proprietary technology, tradenames, backlog and customer relationships that are assigned a fair value at the date of acquisition. Goodwill and other intangible assets deemed to have indefinite lives are not subject to amortization in accordance with accounting guidance provided by GAAP through the Accounting Standards Codification ("guidance"). Goodwill and intangible assets with indefinite lives are tested for impairment at a minimum each fiscal year in the second quarter, or when impairment indicators exist, using the guidance and criteria described in the guidance. This testing compares the carrying values of each intangible asset or reporting unit to estimated fair values. If the carrying value of these assets is in excess of estimated fair value, the carrying value is reduced to their estimated fair value or, in the case of goodwill, implied fair value.
Acquired intangible assets with finite lives are amortized using the straight-line method and include the following: patents, 1 to 19 years; proprietary technology, 15 years; customer relationships, 5 to 26 years; and backlog, 0 to 5 years.
47
Long-lived assets
Long-lived assets held for use are subject to an impairment assessment upon certain triggering events. If the carrying value is no longer recoverable based upon the undiscounted future cash flows, an impairment is recorded for the difference between the carrying amount and the fair value of the asset. Long-lived assets considered held for sale are stated at the lower of carrying value or fair value less the cost to sell.
Revenue recognition
We recognize revenue when the earnings process is complete. This occurs when products are delivered in accordance with the contract or purchase order, ownership and risk of loss have passed to the customer, collectability is reasonably assured, and pricing is fixed and determinable. In instances where title does not pass to the customer upon shipment, we recognize revenue upon delivery or customer acceptance, depending on terms of the sales agreement. Service sales, representing maintenance and engineering activities, are recognized as services are performed.
Shipping and handling fees and costs
Shipping and handling fees and costs charged to customers are reflected in net revenues and cost of goods sold as appropriate.
Environmental costs
We own, or previously owned, properties that may require environmental remediation or action. We estimate the range of loss for environmental liabilities based on current remediation technology, enacted laws and regulations, industry experience gained at similar sites and an assessment of the probable level of involvement and financial condition of other potentially responsible parties. Due to the numerous uncertainties surrounding the course of environmental remediation and the preliminary nature of some site investigations, in some cases, we may not be able to reasonably estimate the high end of the range of possible loss. The estimated future costs for known environmental remediation requirements are accrued on an undiscounted basis when it is probable that a liability has been incurred and the amount of remediation costs can be reasonably estimated. When only a range of amounts is established, and no estimated amount within the range is better than another, the minimum amount of the range is recorded. Recoveries of environmental remediation costs from other parties are recorded as assets when collection is probable. Adjustments to our accruals may be necessary to reflect new information as investigation and remediation efforts proceed. The amounts of any such adjustments could have a material adverse effect on our results of operations in a given period, but any amounts are not reasonably estimable at this time. Total environmental liabilities accrued at March 29, 2015 and March 30, 2014 were $448 million and $525 million, respectively. The decrease in environmental liabilities during fiscal 2015 was primarily due to remediation of TIMET environmental liabilities that existed as of the acquisition date.
In accordance with the asset retirement and environmental obligations guidance, we record all known asset retirement obligations for which the liability can be reasonably estimated. Currently, we have identified known asset retirement obligations associated with environmental contamination at several of our manufacturing facilities and have accrued approximately $5 million to satisfy these asset retirement obligations. However, we have not recognized a liability under guidance for asset retirement obligations at two of our manufacturing facilities because the fair value retirement obligation at these sites cannot be reasonably estimated since the settlement date is unknown at this time. The settlement date is unknown because the retirement obligation (remediation of contamination) of these sites is not required until production ceases, and we have no current or future plans to cease production. These asset retirement obligations, when estimable, are not expected to have a material adverse effect on our consolidated financial position, results of operations, cash flows or business.
Foreign currency translation
Assets and liabilities of our foreign affiliates are translated at current foreign currency exchange rates, while income and expenses are translated at average rates for the period. Translation gains and losses are reported as a component of shareholders’ equity.
Transaction gains and losses that arise from exchange rate fluctuations on transactions denominated in a currency other than the functional currency, except those transactions that have been designated as hedges of identifiable foreign currency commitments or investment positions, are included in the results of operations as incurred. Transaction gains and losses had no material impact on our results of operations for any year presented.
Financial instruments
Our financial instruments include cash and cash equivalents, marketable securities, debt, and derivative instruments, including foreign currency forward contracts and options, commodity swap and interest rate swap contracts, where applicable.
48
Because of their short maturity, the carrying amounts of cash and cash equivalents and short-term bank debt approximate fair value. Available for sale securities consist of investments in shares of publicly traded companies. All available for sale securities are carried at fair value using quoted prices in active markets. Any unrealized gains or losses are recognized through other comprehensive income.
Fair value of long-term debt is based on quoted market prices or estimated using our borrowing rate at year-end for similar types of borrowing arrangements. Refer to Note 12—Fair value measurements.
At various times, we use derivative financial instruments to limit exposure to changes in foreign currency exchange rates, interest rates and prices of strategic raw materials. We account for derivatives pursuant to derivative instruments and hedging activities accounting guidance. This guidance requires that all derivative financial instruments be recorded in the financial statements and measured at fair value. Changes in the fair value of derivative financial instruments are either recognized periodically in income or shareholders’ equity (as a component of accumulated other comprehensive income (loss)) depending on whether the derivative is being used to hedge designated changes in fair value or cash flows. Refer to Note 17—Derivatives and hedging activities.
Stock-based compensation
We account for our stock based compensation plans in accordance with stock-based compensation guidance, which requires that the compensation cost relating to share-based payment transactions be recognized in the financial statements, with the cost measured based on the estimated fair value of the equity or liability instruments issued. Our stock-based employee compensation plans are described more fully in Note 15—Stock-based compensation plans. We recognize the compensation costs related to stock options on a straight-line basis over the requisite service period of the award, which is generally the option vesting term of four years.
Income taxes
Provisions for federal, state and foreign income taxes are calculated on reported pre-tax earnings based on current tax law and also include, in the current period, the cumulative effect of any changes in tax rates from those previously used in determining deferred tax assets and liabilities. Such provisions differ from the amounts currently receivable or payable because certain items of income and expense are recognized in different time periods for financial reporting purposes than for income tax purposes. Significant judgment is required in determining income tax provisions and evaluating tax positions. Valuation allowances are recorded to reduce deferred tax assets when it is more likely than not that a tax benefit will not be realized. Tax benefits arising from uncertain tax positions are recognized when it is more likely than not that the position will be sustained upon examination by the relevant tax authorities. The amount recognized in the financial statements is the largest amount of tax benefit that is greater than 50 percent likely of being realized upon ultimate settlement with a taxing authority that has full knowledge of all relevant information. We recognize interest and penalties, if any, related to uncertain tax positions in income tax expense.
Retirement and other postretirement benefit plans
We sponsor various defined benefit and defined contribution plans covering substantially all employees. We also sponsor postretirement benefit plans other than pensions, consisting principally of health care coverage to eligible retirees and qualifying dependents, covering approximately 15% of our workforce. The liabilities and net periodic cost of our defined benefit pension and other post-retirement plans are determined using methodologies that involve several actuarial assumptions, the most significant of which are the discount rate, the rate of return on plan assets, and medical trend rate (rate of growth for medical costs). For the United States ("U.S.") plans, the discount rate was determined based on the results of a bond matching model that constructed a portfolio of bonds with credit ratings of AA/Aa or higher that match our expected pension benefit cash flows. The discount rate was determined on the basis of the internal rate of return on the bond portfolio. For the non-U.S. plans, Aon Hewitt, Merrill Lynch and other long-term Corporate bond indices were used as the primary basis for determining discount rates. A portion of net periodic pension cost is included in production costs, which are included in inventories and subsequently recognized in net earnings as inventories are liquidated and charged to cost of sales. We amortize gains and losses, which occur when actual experience differs from actuarial assumptions, over the average future service period of employees. Our funding policy for pension plans is to contribute, at a minimum, the amounts required by applicable laws. During fiscal 2015, 2014 and 2013, we made voluntary contributions to pension plans totaling $8 million, $50 million, and $50 million, respectively.
Related party transactions
The business transactions with our equity investees were not considered significant.
49
Use of estimates
The preparation of financial statements in conformity with GAAP requires management to make estimates and assumptions that affect the reported amounts of assets and liabilities and disclosure of contingent assets and liabilities at the date of the financial statements and the reported amounts of revenues and expenses during the reporting period. Actual results could differ from those estimates.
2. Recently issued accounting standards
In January 2015, the Financial Accounting Standards Board (“FASB”) issued guidance which eliminates the concept of an extraordinary item. As a result, entities will no longer segregate an extraordinary item from the results of ordinary operations; separately present an extraordinary item on its income statement, net of tax, after income from continuing operations; and disclose income taxes and earnings per share data applicable to an extraordinary item. The guidance is effective for the Company beginning the first quarter of fiscal 2017 with early adoption permitted. The adoption of this guidance is not expected to have a significant impact on our consolidated financial position, results of operations, or cash flows.
In May 2014, the FASB issued guidance on revenue from contracts with customers. The guidance outlines a single comprehensive model for entities to use in accounting for revenue arising from contracts with customers and supersedes the most current revenue recognition guidance. The guidance is effective for the Company beginning the first quarter of fiscal 2018. In April 2015, the FASB issued a proposal that would defer the effective date by one year. The Company is in the process of determining the impact of this guidance on our consolidated financial positions, results of operations, and cash flows.
In April 2014, the FASB issued guidance that changes the criteria for reporting discontinued operations while enhancing disclosures in this area. Under the new guidance, only disposals representing a strategic shift in operations should be presented as discontinued operations. The guidance is effective for the Company beginning the first quarter of fiscal 2016. The adoption of this guidance is not expected to have a significant impact on our consolidated financial position, results of operations, or cash flows.
In July 2013, the FASB issued guidance on the presentation of unrecognized tax benefits when a net operating loss carryforward, a similar tax loss, or a tax credit carryforward exists. The guidance requires entities to present an unrecognized tax benefit netted against certain deferred tax assets when specific requirements are met. The guidance was effective for the Company beginning the first quarter of fiscal 2015. The adoption of this guidance did not have a significant impact on our consolidated financial position, results of operations, or cash flows.
In March 2013, the FASB issued guidance to address the accounting for the cumulative translation adjustment when a parent entity sells or transfers either a subsidiary or a group of assets within a foreign entity. The guidance was effective for the Company beginning the first quarter of fiscal 2015 and was applied prospectively. The adoption of this guidance did not have a significant impact on our consolidated financial position, results of operations, or cash flows.
3. Acquisitions
Fiscal 2015
• | On April 25, 2014, we acquired Aerospace Dynamics International ("ADI") for approximately $625 million. ADI is one of the premier suppliers in the aerospace industry, operating a wide range of high-speed machining centers. ADI has developed particular expertise in large complex components, hard-metal machining, and critical assemblies. ADI is located in Valencia, California, and employs approximately 625 people. The ADI acquisition was an asset purchase for tax purposes and operates as part of the Airframe Products segment. |
• | During the second quarter of fiscal 2015, we completed a small acquisition in the Airframe Products segment. |
The purchase price allocations for certain acquisitions noted above are subject to further refinement. The impact of the acquisitions above is not material to our consolidated results of operations; consequently, pro forma information has not been included.
Fiscal 2014
• | During the second quarter of fiscal 2014, we completed two small acquisitions in the Airframe Products segment. |
• | On October 31, 2013, we acquired Permaswage SAS ("Permaswage"), a world-leading designer and manufacturer of aerospace fluid fittings, for approximately $600 million in cash, funded by commercial paper borrowings. Permaswage's primary focus is the design and manufacture of permanent fittings used in fluid conveyance systems for airframe applications, as well as related installation tooling. The company operates manufacturing locations in |
50
Gardena, California; Paris, France; and Suzhou, China. The Permaswage acquisition was a stock purchase for tax purposes and operates as part of the Airframe Products segment.
• | During the third quarter of fiscal 2014, we completed two small acquisitions in the Forged Products segment. |
• | During the fourth quarter of fiscal 2014, we completed a small acquisition in the Forged Products segment and a small acquisition in the Airframe Products segment. |
Fiscal 2013
• | On April 2, 2012, we acquired RathGibson LLC ("RathGibson"). RathGibson manufactures precision thin-wall, nickel-alloy and stainless steel welded and seamless tubing, with broad capabilities in length, wall thickness, and diameter. RathGibson's products are used in a multitude of oil & gas, chemical/petrochemical processing and power generation applications, as well as in other commercial markets. RathGibson operates three facilities in Janesville, Wisconsin; North Branch, New Jersey; and Clarksville, Arkansas. The RathGibson acquisition was an asset purchase for tax purposes and operates as part of the Forged Products segment. |
• | On May 18, 2012, we acquired Centra Industries ("Centra"), a state-of-the art aerostructures manufacturer located in Cambridge, Ontario, Canada. Centra manufactures a range of machined airframe components and assemblies, in both aluminum and hard metals. Core competencies include the high-speed machining of complex, high-precision structures, sub-assembly and kit integration. The Centra acquisition was a stock purchase for tax purposes and operates as part of the Airframe Products segment. |
• | On June 15, 2012, we acquired Dickson Testing Company ("Dickson") and Aerocraft Heat Treating Company ("Aerocraft"). Dickson offers a full range of destructive testing services including: mechanical properties; metallurgical and chemical analyses and low-cycle fatigue testing. Dickson is located in South Gate, California. Aerocraft provides precision heat treating services for titanium and nickel alloy forgings and castings used in the aerospace industry, as well as other related services including straightening, de-twisting and forming. Aerocraft is located in Paramount, California. The acquisitions were asset purchases for tax purposes and operate as part of the Forged Products segment. |
• | On August 7, 2012, we acquired Klune Industries ("Klune"), a manufacturer of complex aluminum, nickel, titanium and steel aerostructures. Klune focuses on complex forming, machining, and assembly of aerostructure parts, in addition to offering significant expertise in a range of cold-formed sheet metal components. Klune operates facilities in North Hollywood, California; Spanish Fork, Utah; and Kent, Washington. The Klune acquisition was a stock purchase for tax purposes and operates as part of the Airframe Products segment. |
• | On August 31, 2012, we acquired certain aerostructures business units from Heroux-Devtek Inc. (collectively referred to as "Progressive"). These aerostructures operations manufacture a wide variety of components and assemblies from aluminum, aluminum-lithium and titanium, such as bulkheads, wing ribs, spars, frames and engine mounts. The aerostructures operations include Progressive Incorporated in Arlington, Texas, as well as plants in Dorval (Montreal), Canada, and Queretaro, Mexico. The Progressive acquisition was an asset purchase for tax purposes and operates as part of the Airframe Products segment. |
• | On October 24, 2012, we acquired Texas Honing, Inc. ("THI"). THI provides precision, tight tolerance pipe processing services, including honing, boring, straightening and turning. THI's products are used in oil & gas drilling, completion and production applications, as well as other commercial markets. THI operates three facilities in the Houston, Texas area. The THI acquisition was a stock purchase for tax purposes and operates as part of the Forged Products segment. |
• | On December 12, 2012, we acquired Synchronous Aerospace Group ("Synchronous"), a leading build-to-print supplier of highly complex mechanical assemblies for commercial aerospace and defense markets. Synchronous manufactures such mechanical assemblies as high-lift mechanisms and secondary flight controls, as well as structural components, including wing ribs, bulkheads, and track and beam assemblies. Synchronous has four primary locations: Santa Ana, California; Kent, Washington; Wichita, Kansas; and Tulsa, Oklahoma. The Synchronous acquisition was a stock purchase for tax purposes and operates as part of the Airframe Products segment. |
• | On December 21, 2012, we completed the initial cash tender offer (the "Offer") for all of the outstanding shares of common stock of Titanium Metals Corporation ("TIMET") for $16.50 per share. Approximately 150,520,615 shares (representing approximately 86% of the outstanding shares) were validly tendered and not withdrawn from the Offer. The transaction resulted in a payment for such shares of approximately $2.5 billion in cash. On December 17, 2012, |
51
we issued $3.0 billion of senior, unsecured notes, and the majority of the proceeds were used to purchase the shares noted above. On January 7, 2013, we completed the acquisition of TIMET. Each remaining share of TIMET common stock not tendered in PCC's previous tender offer for TIMET shares (other than shares as to which holders properly exercise appraisal rights) was converted in the merger into the right to receive $16.50 per share without interest. As a result of the merger, TIMET common stock ceased to be traded on the New York Stock Exchange. TIMET, the largest titanium manufacturer in the United States, offers a full range of titanium products, including ingot and slab, forging billet and mill forms. TIMET operates seven primary melting or mill facilities in Henderson, Nevada; Toronto, Ohio; Morgantown, Pennsylvania; Vallejo, California; Witton, England; Waunarlwydd, Wales; and Savoie, France. The TIMET acquisition was a stock purchase for tax purposes and operates as part of the Forged Products segment.
The assets purchased and liabilities assumed for TIMET have been reflected in our consolidated balance sheet as of March 29, 2015 and March 30, 2014, and the results of operation are included in our consolidated statement of income since the closing date of the acquisition. Included in the following table in other long-term liabilities and accrued liabilities are $404 million and $82 million, respectively, of estimated liabilities related to environmental remediation. Refer to Note 13—Commitments and contingencies for further discussion of environmental matters. In addition, the following table includes noncontrolling interest as we owned approximately 86% of TIMET's outstanding shares at the acquisition date. Consistent with guidance for acquisition accounting, we have completed our analysis of the purchase price allocation, including environmental liabilities, as allowed within the measurement period. The measurement period adjustments did not have a material impact on our financial position and results of operations and therefore, we did not retrospectively adjust the consolidated financial statements. The following table summarizes the estimates of fair values of assets acquired and liabilities assumed (except for estimated liabilities related to environmental remediation, which are recorded as loss contingencies):
12/21/12 | |||
Cash and cash equivalents | $ | 22 | |
Receivables, net | 138 | ||
Inventories | 787 | ||
Prepaid expenses and other current assets | 101 | ||
Current deferred income taxes | 95 | ||
Property, plant and equipment, net | 386 | ||
Goodwill | 1,666 | ||
Acquired intangible assets, net | 827 | ||
Other assets | 50 | ||
Long-term debt currently due and short-term borrowings | (1 | ) | |
Accounts payable | (53 | ) | |
Accrued liabilities | (220 | ) | |
Long-term debt | (123 | ) | |
Pension and other postretirement benefit obligations | (128 | ) | |
Other long-term liabilities | (502 | ) | |
Long-term deferred income taxes | (139 | ) | |
Noncontrolling interest | (422 | ) | |
Total purchase price | $ | 2,484 | |
• | Over the course of fiscal 2013, we completed several additional minor acquisitions that provide us with expanded manufacturing capabilities. |
The above business acquisitions were accounted for under the acquisition method of accounting and, accordingly, the results of operations have been included in the Consolidated Statements of Income since the acquisition date.
52
4. Discontinued operations
Fiscal 2015
During the fourth quarter of fiscal 2015, we recognized a goodwill impairment charge of $13 million, pre-tax, related to three of our discontinued operations held for sale as the fair value, as determined by expected net proceeds, did not exceed the carrying value. We also recognized $3 million, pre-tax, of other asset impairment charges.
During the fourth quarter of fiscal 2015, we decided to divest a small non-core business in the Forged Products segment and reclassified it to discontinued operations.
During the second quarter of fiscal 2015, we decided to divest a small non-core business in the Forged Products segment and reclassified it to discontinued operations.
Fiscal 2014
During the first quarter of fiscal 2014, we decided to divest a small non-core business in the Airframe Products segment and reclassified it to discontinued operations.
During the fourth quarter of fiscal 2012, we decided to divest a small non-core business in the Airframe Products segment and reclassified it to discontinued operations. The sale of the business was completed in the first quarter of fiscal 2014. The transaction resulted in a gain of approximately $14 million (net of tax) and cash proceeds of $63 million. For tax purposes, the sale generated a capital loss that was offset by a valuation allowance.
Fiscal 2013
During the second quarter of fiscal 2013, we decided to divest a small non-core business in the Forged Products segment and reclassified it to discontinued operations. The sale of the business was completed in the second quarter of fiscal 2013. The transaction resulted in a gain of approximately $2 million (net of tax) and cash proceeds of $6 million.
During the first quarter of fiscal 2011, we decided to divest a small non-core business in the Airframe Products segment and reclassified it to discontinued operations. The sale of the business was completed in the second quarter of fiscal 2013. The transaction resulted in a loss of less than $1 million (net of tax) and proceeds of $25 million in cash and an unsecured, subordinated, convertible promissory note in the principal amount of $18 million. The promissory note was due on August 7, 2017 and paid interest quarterly based on the 5-year Treasury Note Constant Maturity Rate. The note, which allowed for early payment, was repaid in the first quarter of fiscal 2015.
The components of discontinued operations for the periods presented are as follows:
Fiscal | 2015 | 2014 | 2013 | ||||||||
Net sales | $ | 51 | $ | 107 | $ | 116 | |||||
Cost of goods sold | 48 | 87 | 102 | ||||||||
Selling and administrative expenses | 6 | 9 | 17 | ||||||||
Restructuring and asset impairment | 16 | — | — | ||||||||
Net (loss) gain from operations before income taxes | (19 | ) | 11 | (3 | ) | ||||||
Income tax benefit | 3 | 1 | — | ||||||||
Net (loss) gain from operations | (16 | ) | 12 | (3 | ) | ||||||
Gain (loss) on disposal and other expenses, net of tax benefit (expense) of $0, $2 and $(3) respectively | 1 | 13 | (1 | ) | |||||||
Net (loss) income from discontinued operations | $ | (15 | ) | $ | 25 | $ | (4 | ) | |||
53
Included in the Consolidated Balance Sheets are the following major classes of assets and liabilities associated with the discontinued operations:
March 29, 2015 | March 30, 2014 | ||||||
Assets of discontinued operations: | |||||||
Current assets | $ | 28 | $ | 29 | |||
Net property, plant and equipment | 20 | 23 | |||||
Other assets | 8 | 25 | |||||
$ | 56 | $ | 77 | ||||
Liabilities of discontinued operations: | |||||||
Current liabilities | $ | 13 | $ | 13 | |||
Long-term debt | 1 | 1 | |||||
Other long-term liabilities | 2 | 5 | |||||
$ | 16 | $ | 19 | ||||
5. Concentration of credit risk
Approximately 70 percent, 69 percent and 65 percent of business activity was with companies in the aerospace industry in fiscal 2015, 2014 and 2013, respectively. Approximately 13 percent, 13 percent and 15 percent of total sales were directly to General Electric Company in fiscal 2015, 2014 and 2013, respectively. Accordingly, we are exposed to a concentration of credit risk for this portion of receivables. We have long-standing relationships with our aerospace customers, and management considers the credit risk to be low.
6. Inventories
Inventories consisted of the following:
March 29, 2015 | March 30, 2014 | ||||||
Finished goods | $ | 544 | $ | 498 | |||
Work-in-process | 1,262 | 1,325 | |||||
Raw materials and supplies | 1,155 | 1,037 | |||||
2,961 | 2,860 | ||||||
Excess of LIFO cost over current cost | 679 | 566 | |||||
Total | $ | 3,640 | $ | 3,426 | |||
Approximately 96 percent of total inventories were valued on a LIFO basis at March 29, 2015 and March 30, 2014. During fiscal 2015 and 2014, certain LIFO inventory quantities were reduced. The liquidation of LIFO inventory quantities carried at costs paid in prior years increased cost of goods sold by $13 million in fiscal 2015 and $8 million in fiscal 2014. Refer to Note 20—Restructuring, asset impairment and other non-recurring charges for discussion of a non-cash inventory impairment charge recognized in fiscal 2015.
7. Goodwill and acquired intangibles
We perform our annual goodwill and indefinite-lived intangible assets impairment test during the second quarter of each fiscal year. During fiscal 2015, we added a reporting unit to our annual impairment test. For fiscal 2015, 2014 and 2013, it was determined that the fair value of the related reporting units was greater than book value and that there was no impairment of goodwill. Furthermore, it was determined that the fair value of indefinite-lived intangible assets was greater than the carrying value and that there was no impairment of indefinite-lived intangible assets. We considered the impact of the restructuring and asset impairment charges recorded during fiscal 2015 on related goodwill and intangible assets and concluded that no impairment was indicated. There were no other changes during the fiscal year requiring a goodwill or indefinite-lived intangible assets impairment test in accordance with goodwill and other intangible assets accounting guidance.
54
The changes in the carrying amount of goodwill by reportable segment for fiscal 2015 and 2014 were as follows:
March 31, 2013 | Acquired | Currency translation and other | March 30, 2014 | Acquired | Currency translation and other (1) | March 29, 2015 | |||||||||||||||||||||
Investment Cast Products | $ | 337 | $ | — | $ | 2 | $ | 339 | $ | — | $ | (2 | ) | $ | 337 | ||||||||||||
Forged Products | 3,256 | 60 | 350 | (2) | 3,666 | — | (113 | ) | 3,553 | ||||||||||||||||||
Airframe Products | 2,300 | 343 | (35 | ) | 2,608 | 211 | (48 | ) | 2,771 | ||||||||||||||||||
Total | $ | 5,893 | $ | 403 | $ | 317 | $ | 6,613 | $ | 211 | $ | (163 | ) | $ | 6,661 | ||||||||||||
(1) | Includes adjustments to the purchase price allocations of Permaswage and several other small acquisitions. |
(2) | Primarily due to revisions to estimated environmental liabilities at TIMET. |
The gross carrying amount and accumulated amortization of our acquired intangible assets were as follows:
March 29, 2015 | March 30, 2014 | ||||||||||||||||||||||
Gross Carrying Amount | Accumulated Amortization | Net Carrying Amount | Gross Carrying Amount | Accumulated Amortization | Net Carrying Amount | ||||||||||||||||||
Amortizable intangible assets: | |||||||||||||||||||||||
Patents | $ | 13 | $ | (11 | ) | $ | 2 | $ | 13 | $ | (10 | ) | $ | 3 | |||||||||
Proprietary technology | 2 | (2 | ) | — | 2 | (2 | ) | — | |||||||||||||||
Long-term customer relationships | 482 | (85 | ) | 397 | 499 | (63 | ) | 436 | |||||||||||||||
Backlog | 56 | (41 | ) | 15 | 56 | (32 | ) | 24 | |||||||||||||||
Revenue sharing agreements | 29 | (3 | ) | 26 | 29 | (2 | ) | 27 | |||||||||||||||
$ | 582 | $ | (142 | ) | 440 | $ | 599 | $ | (109 | ) | 490 | ||||||||||||
Indefinite-lived intangible assets: | |||||||||||||||||||||||
Tradenames | 699 | 657 | |||||||||||||||||||||
Long-term customer relationships | 2,605 | 2,293 | |||||||||||||||||||||
Acquired intangibles, net | $ | 3,744 | $ | 3,440 | |||||||||||||||||||
Amortization expense for finite-lived acquired intangible assets was $42 million, $41 million and $26 million for fiscal 2015, 2014 and 2013, respectively. In fiscal 2015, we removed $9 million of fully amortized intangible assets from the gross carrying amount and accumulated amortization. Projected amortization expense for finite-lived intangible assets for the succeeding five fiscal years is as follows:
Fiscal | Estimated Amortization Expense | ||
2016 | $ | 41 | |
2017 | 34 | ||
2018 | 27 | ||
2019 | 28 | ||
2020 | 27 | ||
The amortization will change in future periods if other intangible assets are acquired, existing intangibles are disposed, impairments are recognized or the preliminary valuations as part of our purchase price allocations are refined.
55
8. Accrued liabilities
Accrued liabilities consisted of the following:
March 29, 2015 | March 30, 2014 | ||||||
Salaries and wages payable | $ | 204 | $ | 211 | |||
Other accrued liabilities | 355 | 343 | |||||
Total | $ | 559 | $ | 554 | |||
9. Financing arrangements
Long-term debt is summarized as follows:
March 29, 2015 | March 30, 2014 | ||||||
0.70% Senior Notes due fiscal 2016 ($500 face value less unamortized discount of $0 and $0) | $ | 500 | $ | 500 | |||
1.25% Senior Notes due fiscal 2018 ($1,000 face value less unamortized discount of $1 and $1) | 999 | 999 | |||||
2.50% Senior Notes due fiscal 2023 ($1,000 face value less unamortized discount of $5 and $5) | 995 | 995 | |||||
3.90% Senior Notes due fiscal 2043 ($500 face value less unamortized discount of $3 and $3) | 497 | 497 | |||||
Commercial paper | 1,587 | 570 | |||||
Other | 8 | 10 | |||||
4,586 | 3,571 | ||||||
Less: Long-term debt currently due | 1,093 | 2 | |||||
Total | $ | 3,493 | $ | 3,569 | |||
Long-term debt maturing in each of the next five fiscal years, excluding the discount and premium, is as follows:
Fiscal | Debt | ||
2016 | $ | 1,093 | |
2017 | 1 | ||
2018 | 1,001 | ||
2019 | 1,000 | ||
2020 | — | ||
Thereafter | 1,500 | ||
Total | $ | 4,595 | |
On December 15, 2014, we entered into a 364-day, $1.0 billion revolving credit facility maturing December 2015 (the “364-Day Credit Agreement”), unless converted into a one-year term loan at the option of the Company at the end of the revolving period. The 364-Day Credit Agreement replaces the prior 364-day credit agreement that expired December 2014. The 364-Day Credit Agreement contains customary representations and warranties, events of default, and financial and other covenants.
On December 16, 2013, we entered into a five-year, $1.0 billion revolving credit facility (the "New Credit Agreement") (with a $500 million increase option, subject to approval of the lenders) maturing December 2018, unless extended pursuant to two 364-day extension options. On the same day, we terminated the prior credit agreement maturing November 30, 2016. The New Credit Agreement contains customary representations and warranties, events of default, and financial and other covenants. The 364-Day and New Credit Agreements may be referred to collectively as the "Credit Agreements." We had not borrowed funds under the Credit Agreements as of March 29, 2015.
On December 17, 2012, we issued $3.0 billion aggregate principal amount of notes (collectively, the “Notes”) as follows: $500 million of 0.70% Senior Notes due 2015 (the "2015 Notes"); $1.0 billion of 1.25% Senior Notes due 2018 (the "2018 Notes"); $1.0 billion of 2.50% Senior Notes due 2023 (the "2023 Notes"); and $500 million of 3.90% Senior Notes due 2043 (the "2043 Notes").
56
The Notes are unsecured senior obligations of the Company and rank equally with all of the other existing and future senior, unsecured and unsubordinated debt of the Company. The Company pays interest on the 2015 Notes on June 20 and December 20 of each year and pays interest on the 2018 Notes, the 2023 Notes and the 2043 Notes on January 15 and July 15 of each year.
Historically, we have issued commercial paper as a method of raising short-term liquidity. We believe we continue to have the ability to issue commercial paper and have issued commercial paper to cover acquisitions and short-term cash requirements in recent quarters. As of March 29, 2015, the amount of commercial paper borrowings outstanding was $1,587 million and the weighted average interest rate was 0.2%. As of March 30, 2014, the amount of commercial paper borrowings outstanding was $570 million and the weighted average interest rate was 0.2%. During fiscal 2015, the average amount of commercial paper borrowings outstanding was $1,315 million and the weighted average interest rate was 0.2%. During fiscal 2014, the average amount of commercial paper borrowings outstanding was $674 million and the weighted average interest rate was 0.2%. During fiscal 2015 and 2014, the largest daily balance of outstanding commercial paper borrowings was $1,737 million and $1,151 million, respectively.
The maximum amount that can be borrowed under our Credit Agreements and commercial paper program is $2.0 billion. Our unused borrowing capacity as of March 29, 2015 was $413 million due to our outstanding commercial paper borrowings of $1,587 million.
Our financial covenant requirement and actual ratio as of March 29, 2015 was as follows:
Covenant Requirement | Actual | ||||
Consolidated leverage ratio(1) | 65.0 | % | (maximum) | 29.6 | % |
_________________________
(1) | Terms are defined in the Credit Agreements. |
As of March 29, 2015, we were in compliance with the financial covenant in the Credit Agreements.
10. Income taxes
Total pre-tax income before equity in earnings of unconsolidated affiliates was:
Fiscal | 2015 | 2014 | 2013 | ||||||||
Domestic | $ | 2,154 | $ | 2,197 | $ | 1,812 | |||||
Foreign | 385 | 391 | 316 | ||||||||
Total pretax income | $ | 2,539 | $ | 2,588 | $ | 2,128 | |||||
The provision for income taxes consisted of the following:
Fiscal | 2015 | 2014 | 2013 | ||||||||
Current taxes: | |||||||||||
Federal | $ | 526 | $ | 510 | $ | 450 | |||||
Foreign | 90 | 96 | 63 | ||||||||
State | 44 | 42 | 42 | ||||||||
660 | 648 | 555 | |||||||||
Deferred income taxes: | |||||||||||
Federal | $ | 148 | $ | 159 | $ | 121 | |||||
Foreign | 10 | 13 | 13 | ||||||||
State | (2 | ) | 10 | 6 | |||||||
156 | 182 | 140 | |||||||||
Provision for income taxes | $ | 816 | $ | 830 | $ | 695 | |||||
57
We have not provided U.S. income taxes on cumulative earnings of non-U.S. affiliates and associated companies that have been reinvested indefinitely. These earnings relate to ongoing operations and at March 29, 2015, were approximately $1,482 million. Most of these earnings have been reinvested in active non-U.S. business operations, and we do not intend to use these earnings as a source of funding for U.S. operations. Because of the availability of U.S. foreign tax credits, it is not practicable to determine the U.S. federal income tax liability that would be payable if such earnings were not reinvested indefinitely.
A reconciliation of the U.S. federal statutory rate to the effective income tax rate follows:
Fiscal | 2015 | 2014 | 2013 | |||||
Statutory federal rate | 35.0 | % | 35.0 | % | 35.0 | % | ||
Effect of: | ||||||||
State taxes, net of federal benefit | 1.0 | % | 1.8 | % | 1.9 | % | ||
Domestic manufacturing deduction | (2.1 | )% | (2.1 | )% | (2.1 | )% | ||
Earnings taxed at different rates in foreign jurisdictions | (1.6 | )% | (1.8 | )% | (1.5 | )% | ||
Other | (0.2 | )% | (0.8 | )% | (0.6 | )% | ||
Effective rate | 32.1 | % | 32.1 | % | 32.7 | % | ||
Deferred income tax balances reflect the effects of temporary differences between the carrying amounts of assets and liabilities and their tax basis, as well as net operating loss and tax credit carryforwards, and are stated at enacted tax rates expected to be in effect when taxes are actually paid or recovered. Deferred income tax assets and liabilities represent amounts available to reduce or increase taxes payable on taxable income in future years. We evaluate the recoverability of these future tax deductions and credits by assessing the adequacy of future expected taxable income from all sources, including carrybacks (if applicable), reversal of taxable temporary differences, forecasted operating earnings and available tax planning strategies. To the extent we do not consider it more likely than not that a deferred tax asset will be recovered, a valuation allowance is established.
Significant components of our deferred tax assets and liabilities were as follows:
March 29, 2015 | March 30, 2014 | ||||||
Deferred tax assets arising from: | |||||||
Environmental reserves and other expense accruals | $ | 227 | $ | 272 | |||
Acquired loss contracts liabilities | 66 | 38 | |||||
Stock options | 49 | 41 | |||||
Post-retirement benefits other than pensions | 115 | 102 | |||||
Pension accruals | 108 | 53 | |||||
Net operating and capital loss carryforwards | 67 | 71 | |||||
Tax credit carryforwards | 7 | 7 | |||||
Valuation allowances | (51 | ) | (54 | ) | |||
Gross deferred tax assets | 588 | 530 | |||||
Deferred tax liabilities arising from: | |||||||
Depreciation/amortization | (218 | ) | (193 | ) | |||
Goodwill | (324 | ) | (283 | ) | |||
Acquired intangible assets | (844 | ) | (883 | ) | |||
Inventory basis differences | (124 | ) | (108 | ) | |||
Gross deferred tax liabilities | (1,510 | ) | (1,467 | ) | |||
Net deferred tax liabilities | $ | (922 | ) | $ | (937 | ) | |
The valuation allowances for deferred tax assets as of March 29, 2015 were $51 million. The net change for total valuation allowances for the year ended March 29, 2015 was a decrease of $3 million, including a $5 million decrease from foreign company tax losses, partially offset by a $2 million increase from U.S. capital losses. As of March 29, 2015, we had net capital and operating loss carryforward benefits of approximately $4 million that expire in the fiscal years ending March 2019 through March 2036. Valuation allowances of $2 million were recognized to offset the deferred tax asset relating to those carryforward deferred tax benefits.
58
Uncertain Tax Positions
The following table summarizes the activity related to our reserve for unrecognized tax benefits:
March 29, 2015 | March 30, 2014 | March 31, 2013 | |||||||||
Beginning Balance | $ | 14 | $ | 24 | $ | 13 | |||||
Gross increases related to prior period tax positions | 3 | 10 | 30 | ||||||||
Gross decreases related to prior period tax positions | — | (6 | ) | (15 | ) | ||||||
Gross increases related to current period tax positions | — | 2 | 1 | ||||||||
Decreases related to settlements with tax authorities | (1 | ) | (15 | ) | (5 | ) | |||||
Expiration of the statute of limitations for assessment of taxes | — | (1 | ) | — | |||||||
Ending Balance | $ | 16 | $ | 14 | $ | 24 | |||||
Our policy is to recognize interest and penalties accrued on uncertain tax positions as part of the provision for income taxes. During the years ended March 29, 2015, March 30, 2014 and March 31, 2013, the amount of tax expense recognized related to interest and penalties was not significant. The reserve for uncertain tax positions as of March 29, 2015, March 30, 2014 and March 31, 2013 included an accrual for interest and penalties of $4 million, $3 million, and $4 million, respectively.
We file income tax returns in the U.S. federal jurisdiction, the United Kingdom, and other state, local, and foreign jurisdictions. As of March 29, 2015, the U.S. Internal Revenue Service has completed examinations of tax years through April 3, 2011. We are no longer subject to examination in the United Kingdom for fiscal years through 2011. For other state, local, and foreign jurisdictions, with few exceptions, the statutes of limitation are closed for all tax years through March 29, 2009.
Included in the reserve for uncertain tax positions at March 29, 2015 and March 30, 2014 are $13 million and $12 million, respectively, of unrecognized tax benefits that, if recognized, would impact the effective tax rate. We estimate that within the next twelve months, the reserve for uncertain tax positions could change by $0 to $1 million. The tax matters associated with these uncertain tax positions primarily relate to state tax positions in various states. These tax matters are under audit, but we cannot reasonably predict the timing or the ultimate outcome of these matters.
11. Earnings per share
Net income and weighted average number of shares outstanding used to compute earnings per share were as follows:
Fiscal | 2015 | 2014 | 2013 | ||||||||
Amounts attributable to PCC shareholders: | |||||||||||
Net income from continuing operations | $ | 1,545 | $ | 1,752 | $ | 1,431 | |||||
Net (loss) income from discontinued operations | (15 | ) | 25 | (4 | ) | ||||||
Net income attributable to PCC shareholders | $ | 1,530 | $ | 1,777 | $ | 1,427 | |||||
Fiscal | 2015 | 2014 | 2013 | |||||
Weighted average shares outstanding-basic | 142.6 | 145.6 | 145.7 | |||||
Effect of dilutive stock-based compensation plans | 0.9 | 1.0 | 1.0 | |||||
Weighted average shares outstanding-diluted | 143.5 | 146.6 | 146.7 | |||||
Basic earnings per share are calculated based on the weighted average number of shares outstanding. Diluted earnings per share are computed based on that same number of shares plus additional dilutive shares representing stock distributable under stock option, phantom stock, deferred stock unit and employee stock purchase plans computed using the treasury stock method.
Options to purchase 1.5 million, 0.4 million and 1.4 million shares of common stock were outstanding during fiscal 2015, 2014 and 2013, respectively, and were not included in the computation of diluted earnings per share because to do so would have been antidilutive. These options could be dilutive in the future.
59
12. Fair value measurements
Fair value guidance defines fair value, establishes a framework for measuring fair value in accordance with GAAP, and expands disclosures about fair value measurements. Fair value guidance defines fair value as the exchange price that would be received to sell an asset or paid to transfer a liability (an exit price) in the principal or most advantageous market for the asset or liability in an orderly transaction between market participants on the measurement date. Fair value guidance also establishes a fair value hierarchy which requires an entity to maximize the use of observable inputs and minimize the use of unobservable inputs when measuring fair value. The standard describes three levels of inputs that may be used to measure fair value:
Level 1 | Quoted prices in active markets for identical assets or liabilities. |
Level 2 | Observable inputs other than Level 1 prices, such as quoted prices for similar assets or liabilities; quoted prices in markets that are not active; or other inputs that are observable or can be corroborated by observable market data for substantially the full term of the assets or liabilities. |
Level 3 | Unobservable inputs that are supported by little or no market activity and that are significant to the fair value of the assets or liabilities. |
The following table presents the assets and liabilities measured at fair value on a recurring basis as of March 29, 2015:
Fair Value Measurements Using | |||||||||||||||
Level 1 | Level 2 | Level 3 | Assets/Liabilities at Fair Value | ||||||||||||
Assets: | |||||||||||||||
Available for sale securities | $ | 32 | $ | — | $ | — | $ | 32 | |||||||
Derivative instruments | $ | — | $ | 4 | $ | — | $ | 4 | |||||||
Liabilities: | |||||||||||||||
Derivative instruments | $ | — | $ | 30 | $ | — | $ | 30 | |||||||
The following table presents the assets and liabilities measured at fair value on a recurring basis as of March 30, 2014:
Fair Value Measurements Using | |||||||||||||||
Level 1 | Level 2 | Level 3 | Assets/Liabilities at Fair Value | ||||||||||||
Assets: | |||||||||||||||
Trading securities | $ | 52 | $ | — | $ | — | $ | 52 | |||||||
Available for sale securities | $ | 46 | $ | — | $ | — | $ | 46 | |||||||
Derivative instruments | $ | — | $ | 9 | $ | — | $ | 9 | |||||||
Liabilities: | |||||||||||||||
Derivative instruments | $ | — | $ | 4 | $ | — | $ | 4 | |||||||
Trading securities consist of money market funds, commercial paper, and other highly liquid short-term instruments with maturities of three months or less at the time of purchase. These investments are readily convertible to cash with market value approximating cost. There were no transfers between Level 1 and Level 2 fair value measurements during fiscal 2015 or 2014.
Available for sale securities consist of investments in shares of publicly traded companies. All available for sale securities are carried at fair value using quoted prices in active markets. Any unrealized gains or losses on these securities are recognized through other comprehensive income.
Derivative instruments consist of fair value hedges, net investment hedges, and cash flow hedges. At various times, we use derivative financial instruments to limit exposure to changes in foreign exchange rates, interest rates and prices of strategic raw materials. Foreign exchange, interest rate and commodity derivative instruments' fair values are determined using pricing models with inputs that are observable in the market or can be derived principally from, or corroborated by, observable market data. There were no changes in our valuation techniques used to measure assets and liabilities at fair value on a recurring basis.
60
We estimate that the fair value of our long-term fixed rate debt instruments was $3,013 million compared to a book value of $2,997 million at March 29, 2015. At March 30, 2014, the estimated fair value of our long-term fixed rate debt instruments was $2,900 million compared to a book value of $2,996 million. The fair value of long-term fixed rate debt was estimated using a combination of observable trades and quoted prices on such debt, as well as observable market data for comparable instruments. Long-term fixed rate debt would be classified as Level 2 within the fair value hierarchy if it were measured at fair value. The estimated fair value of our miscellaneous long-term debt approximates book value.
13. Commitments and contingencies
We lease certain facilities, office space and equipment under operating leases for varying periods. Future minimum rental payments under non-cancelable operating leases with initial or remaining terms of one year or more at March 29, 2015 are as follows:
Fiscal Year | |||
2016 | $ | 42 | |
2017 | 33 | ||
2018 | 27 | ||
2019 | 20 | ||
2020 | 14 | ||
Thereafter | 37 | ||
Total | $ | 173 | |
Operating lease obligations attributable to operations held-for-sale were $8 million. Total rent expense for all operating leases was $45 million, $46 million and $43 million for fiscal 2015, 2014 and 2013, respectively.
Various lawsuits arising during the normal course of business are pending against us. In the opinion of management, the outcome of these lawsuits, either individually or in the aggregate, will not have a material effect on our consolidated financial position, results of operations, cash flows or business.
In the ordinary course of business, we warrant that our products will conform to contractually established standards and tolerances over various time periods. The warranty accrual as of March 29, 2015 and March 30, 2014, and the change in the accrual for fiscal 2015, 2014 and 2013, is not material to our consolidated financial position, results of operations or cash flows.
In connection with certain transactions, primarily divestitures, we may provide routine indemnifications (e.g., retention of previously existing environmental and tax liabilities) with terms that range in duration and often are not explicitly defined. Where appropriate, an obligation for such indemnifications is recorded as a liability. Because the obligated amounts of these types of indemnifications often are not explicitly stated, the overall maximum amount of the obligation under such indemnifications cannot be reasonably estimated. Other than obligations recorded as liabilities at the time of divestiture, we have not historically made significant payments for these indemnifications.
Environmental Matters
The Company continues to participate in environmental assessments and cleanups at several locations. These include currently owned and/or operating facilities and adjoining properties, previously owned or operated facilities and adjoining properties and waste sites, including Superfund (Comprehensive Environmental Response, Compensation and Liability Act ("CERCLA")) sites.
A liability is recorded for environmental remediation on an undiscounted basis when a cleanup program becomes probable and the costs or damages can be reasonably estimated. As assessments and cleanups proceed, the liability is adjusted based on progress made in determining the extent of remedial actions and related costs and damages. The liability can change substantially due to factors such as the nature and extent of contamination, changes in remedial requirements, the allocation of costs among potentially responsible parties as well as other third parties, and technological changes, among others. The amounts of any such adjustments could have a material adverse effect on our results of operations in a given period.
The Company's environmental liability balance was $448 million and $525 million at March 29, 2015 and March 30, 2014, of which $95 million and $61 million was classified as a current liability, respectively, and generally reflects the best estimate of the costs to remediate identified environmental conditions for which costs can reasonably be estimated. If no point in a range of costs is a better estimate than others, the low end of the range of costs is accrued. The estimated upper end of the
61
range of reasonably possible environmental costs exceeded amounts accrued by approximately $360 million at March 29, 2015. Actual future losses may be lower or higher given the uncertainties regarding the status of laws, regulations, enforcement policies, the impact of potentially responsible parties, technology and information related to individual sites.
Due to the nature of its historical operations, TIMET has significant environmental liabilities at its titanium manufacturing plants. It has for many years, under the oversight of government agencies, conducted investigations of the soil and groundwater contamination at its plant sites. TIMET has initiated remedial actions at its properties, including the capping of former on-site landfills, removal of contaminated sediments from on-site surface impoundments, remediation of contaminated soils and the construction of a slurry wall and groundwater extraction system to treat contaminated groundwater as well as other remedial actions. Although it is anticipated that significant remediation will be completed within the next two to three years, it is expected that a substantial portion of the TIMET environmental accruals will be expended within an estimated 41 years. Expenditures related to these remedial actions and for resolving TIMET's other environmental liabilities will be applied against existing liabilities. As the remedial actions are implemented at these sites, the liabilities will be adjusted based on the progress made in determining the extent of contamination and the extent of required remediation. While the existing liability generally represents our current best estimate of the costs or range of costs of resolving the identified environmental liabilities, these costs may change substantially due to factors such as the nature and extent of contamination, changes in legal and remedial requirements, the allocation of costs among potentially responsible parties as well as other third parties, and technological changes, among others.
14. Shareholders’ equity
Authorized shares of common stock, with no par value and $1 stated value, consisted of 450.0 million shares at March 29, 2015 and March 30, 2014. Authorized and unissued no par serial preferred stock consisted of 1.0 million shares at March 29, 2015 and March 30, 2014.
Shareholder rights plan
The rights agreement, which was adopted in 1998, was renewed on December 16, 2008. The agreement is intended to protect the Company and its shareholders from potentially coercive takeover practices or takeover bids that are inconsistent with the interests of the Company and its shareholders. The agreement is not intended to deter offers that are fair and otherwise in the best interest of the Company’s shareholders. Under the renewed rights agreement, each holder of the common stock of the Company at the close of business on December 16, 2008, received a dividend of one right for each share of common stock held entitling the holder to purchase from the Company one one-thousandth of a share of Series A No Par Serial Preferred Stock. Initially, the rights will be represented by the common stock certificates of the Company and will not be exercisable or traded separately from the common stock of the Company. In the absence of further board action, the rights will generally become exercisable if a person or group (i) acquires 15 percent or more of the outstanding common stock of the Company, or (ii) announces or commences a tender or exchange offer that would result in the person or group acquiring 15 percent or more of the outstanding common stock of the Company. Rights held by those that exceed the 15 percent threshold will be void.
In the event that any person or group acquires 15 percent or more of the outstanding common stock of the Company, and the rights are exercisable, each holder of a right (other than holders of rights that have become void) will have the right to receive upon exercise of the right, in lieu of shares of preferred stock, a number of shares of common stock of the Company having a market value of two times the exercise price of the right. If, after a person or group acquires 15 percent or more of the outstanding common stock of the Company, and while the rights are exercisable, (i) the Company is acquired in a merger or other business combination transaction in which the Company is not the surviving corporation or in which shares of the common stock are exchanged for stock or other securities or property, or (ii) 50 percent or more of the Company’s assets or earning power is sold or transferred, each holder of a right (other than holders of rights that have become void) shall thereafter have the right to receive, upon exercise of the right, common stock of the acquiring company having a value equal to two times the purchase price of the right.
The rights agreement also includes an exchange option. In general, after a person or group acquires 15 percent or more of the outstanding common stock of the Company and while the rights are exercisable, the board of directors may, at its option, effect an exchange of part or all of the rights (other than rights that have become void) for shares of the common stock or preferred stock of the Company. Under this option, the Company would issue one share of common stock of the Company for each right or one one-thousandth of a share of preferred stock for each right, subject to adjustment in certain circumstances.
The Board of Directors may, at its option, redeem all outstanding rights for $0.001 per right at any time prior to the later of the Stock Acquisition Date and the Distribution Date (as these terms are defined in the Rights Agreement). The rights will expire on December 15, 2018, unless earlier redeemed, exchanged, or amended by the board of directors. The rights do not have voting or dividend rights and, until they become exercisable, have no dilutive effect on our earnings.
62
Share repurchase program
On January 24, 2013, the Board of Directors approved a $750 million program to repurchase shares of the Company's common stock. On August 13, 2013, the Board of Directors approved an additional $750 million for the Company's stock repurchase program. On August 13, 2014, the Board of Directors approved an additional $1.0 billion, effective immediately and continuing through September 30, 2016. Repurchases under the Company's program may be made in open market or privately negotiated transactions in compliance with Securities and Exchange Commission Rule 10b-18, subject to market conditions, applicable legal requirements, and other relevant factors. This share repurchase plan does not obligate PCC to acquire any particular amount of common stock, and it may be suspended at any time at the Company's discretion.
During the year ended March 29, 2015, the Company repurchased 7,213,594 shares under this program at an average price paid per share of $222.64 for an aggregate purchase price of approximately $1,606 million, of which $8 million was settled after year-end. As of March 29, 2015, the Company had repurchased a total of 9,812,094 shares under this program for an aggregate purchase price of $2,186 million. Refer to Note 21—Subsequent events for discussion of an expansion to the share repurchase authorization.
15. Stock-based compensation plans
We account for our stock based compensation plans in accordance with stock-based compensation guidance, which requires that the compensation cost relating to share-based payment transactions be recognized in the financial statements over the vesting period, with the cost measured based on the estimated fair value of the equity or liability instruments issued.
We have three stock incentive plans for certain officers, key salaried employees and directors: the 1994 Stock Incentive Plan, the 1999 Nonqualified Stock Option Plan, and the 2001 Stock Incentive Plan. Shares authorized under these plans totaled approximately 35,192,000 shares at the time of inception. The plans allow for the grant of stock options, stock bonuses, stock appreciation rights, cash bonus rights and restricted stock.
Stock option awards
The Compensation Committee of the Board of Directors determines awards granted under officer and employee stock option plans. To date, all stock option awards under the stock incentive plans have been nonqualified stock option grants. The Compensation Committee fixes the time limit within which options may be exercised and other stock option terms. To date, option grant prices under the three stock incentive plans have been at the fair market value on the date of grant. Generally, options become exercisable at a rate of 25% each year over four years from the date of grant and expire ten years from the date of grant. Total expense recognized was $48 million, $50 million, and $43 million for fiscal 2015, 2014 and 2013, respectively.
Deferred stock unit awards
The Deferred Stock Unit Award Program provides for the grant of deferred stock units (“DSUs”) to non-employee directors pursuant to the 2001 Stock Incentive Plan. At a date immediately following the Annual Meeting of Shareholders, each director was granted DSUs in an amount equal to $140,000 in fiscal 2015 and 2014 and $125,000 in fiscal 2013, divided by the closing price of PCC common stock on that date. Under the terms of the program, the units vest over three years, with provisions for accelerated vesting in certain circumstances. The DSUs are settled in shares of common stock equal to the number of units in a director’s account at the time of settlement, which is no earlier than upon cessation of board service. At the time of the annual grant, the director will receive the value of the dividends that would have been paid on the stock underlying the DSUs during the year. The value of the dividends is divided by the closing price of PCC common stock to determine the number of units granted. The cost of these awards is determined as the market value of the shares at the date of grant. Total expense recognized was $1 million for each fiscal 2015, 2014 and 2013.
Employee stock purchase plan
We have an Employee Stock Purchase Plan (“ESPP”) whereby we are authorized to issue shares of common stock to our full-time employees, nearly all of whom are eligible to participate. Under the terms of the plan, employees can choose to have up to 10 percent of their annual base earnings and bonus withheld to purchase PCC common stock subject to limitations established in the Internal Revenue Code. Employees then have the option to use the withheld funds to purchase shares of PCC common stock at the lower of 85 percent of the fair market value of the stock on the date of grant or on the date of purchase. Total expense recognized was $8 million for each fiscal 2015, 2014 and 2013.
Deferred compensation plan
We have a deferred compensation plan whereby eligible executives may elect to defer up to 100% of their regular cash compensation and cash incentive awards, and non-employee Board members may elect to defer up to 100% of their cash
63
compensation for Board service. The compensation deferred under this plan is credited with earnings and losses as determined by the rate of return on investments selected by the plan participants. Each participant is fully vested in all deferred compensation and those earnings that have been credited to their individual accounts. Our promise to pay amounts deferred under this plan is an unsecured obligation. Balances at March 29, 2015 and March 30, 2014 of $75 million and $73 million, respectively, are reflected in pension and other postretirement benefit obligations in the Consolidated Balance Sheets.
One investment election of the deferred compensation plan is Phantom Stock Units, an investment that tracks the value of PCC common stock. Investments in Phantom Stock Units are permanent for the remaining period of employment at PCC. Payment of investments in Phantom Stock Units following retirement or termination of employment is made only in shares of PCC common stock and therefore, Phantom Stock Units are accounted for as equity awards. The stock-based compensation expense is calculated at the date of purchase of Phantom Stock Units and recorded as additional paid in capital. At March 29, 2015 and March 30, 2014, there was $11 million and $10 million, respectively, of deferred compensation related to Phantom Stock Units included in additional paid-in capital.
The total amount of cash received from the exercise of stock options was $69 million, $84 million, and $100 million in fiscal 2015, 2014 and 2013, respectively. The related tax benefit was $20 million, $32 million, and $40 million in fiscal 2015, 2014 and 2013, respectively.
The outstanding options for stock incentive plan shares have expiration dates ranging from fiscal 2016 to fiscal 2025. At March 29, 2015, approximately 5,743,000 stock incentive plan shares were available for future grants.
There were approximately 159,000 shares issued under the 2008 ESPP during the year ended March 29, 2015. At March 29, 2015, there were approximately 1,199,000 shares available for issuance under the 2008 Employee Stock Purchase Plan.
The following table sets forth total stock-based compensation expense and related tax benefit recognized in the Consolidated Statements of Income:
Fiscal | 2015 | 2014 | 2013 | ||||||||
Cost of goods sold | $ | 16 | $ | 17 | $ | 16 | |||||
Selling and administrative expenses | 41 | 43 | 36 | ||||||||
Stock-based compensation expense before income taxes | 57 | 60 | 52 | ||||||||
Income tax benefit | (17 | ) | (19 | ) | (16 | ) | |||||
Total stock-based compensation expense after income taxes | $ | 40 | $ | 41 | $ | 36 | |||||
No stock-based compensation expense was capitalized in fiscal 2015, 2014 or 2013 as it was not material. As of March 29, 2015, we had $112 million of total unrecognized stock-based compensation expense, net of estimated forfeitures, to be recognized over a weighted average period of 2.9 years.
The fair value of the stock-based awards, as determined under the Black-Scholes valuation model, was estimated using the weighted-average assumptions outlined below:
Fiscal | 2015 | 2014 | 2013 | |||||||||||
Stock option plans: | ||||||||||||||
Risk-free interest rate | 1.4 | % | 1.1 | % | 0.5 | % | ||||||||
Expected dividend yield | 0.1 | % | 0.1 | % | 0.1 | % | ||||||||
Expected volatility | 23.7 | % | 26.3 | % | 38.5 | % | ||||||||
Expected life (in years) | 3.3 | – | 4.4 | 3.2 | – | 4.4 | 3.0 | – | 4.4 | |||||
Employee Stock Purchase Plan: | ||||||||||||||
Risk-free interest rate | 0.2 | % | 0.1 | % | 0.1 | % | ||||||||
Expected dividend yield | 0.1 | % | 0.1 | % | 0.1 | % | ||||||||
Expected volatility | 19.8 | % | 20.2 | % | 28.5 | % | ||||||||
Expected life (in years) | 1.0 | 1.0 | 1.0 | |||||||||||
We use the U.S. Treasury (constant maturity) interest rate as the risk-free interest rate, and we use 4-year historical volatility for stock option plans and 1-year historical volatility for the Employee Stock Purchase Plan as the expected volatility. Our determination of expected terms and estimated pre-vesting forfeitures is based on an analysis of historical and expected patterns.
64
The weighted-average fair value of stock-based compensation awards granted and the intrinsic value of options exercised during the period were:
Fiscal | 2015 | 2014 | 2013 | ||||||||
Stock option plans: | |||||||||||
Grant date fair value per share | $ | 48.74 | $ | 56.71 | $ | 54.92 | |||||
Total fair value of awards granted (in millions) | $ | 72 | $ | 63 | $ | 73 | |||||
Total intrinsic value of options exercised (in millions) | $ | 64 | $ | 104 | $ | 125 | |||||
Employee Stock Purchase Plan: | |||||||||||
Grant date fair value per share | $ | 53.22 | $ | 45.44 | $ | 42.83 | |||||
Total fair value (in millions) | $ | 8 | $ | 8 | $ | 8 | |||||
Additional information with respect to stock option activity is as follows:
Option Shares | Weighted Average Exercise Price | Weighted Average Remaining Contractual Term (years) | Aggregate Intrinsic Value (in millions) | |||||||||
Outstanding at April 1, 2012 | 4,735,000 | $ | 111.29 | 7.29 | $ | 292 | ||||||
Granted | 1,333,000 | 174.55 | ||||||||||
Exercised | (1,256,000 | ) | 79.68 | |||||||||
Forfeited or expired | (250,000 | ) | 145.47 | |||||||||
Outstanding at March 31, 2013 | 4,562,000 | 136.70 | 7.50 | 242 | ||||||||
Granted | 1,115,000 | 245.91 | ||||||||||
Exercised | (774,000 | ) | 108.42 | |||||||||
Forfeited or expired | (167,000 | ) | 179.06 | |||||||||
Outstanding at March 30, 2014 | 4,736,000 | 165.57 | 7.30 | 389 | ||||||||
Granted | 1,484,000 | 226.49 | ||||||||||
Exercised | (552,000 | ) | 125.70 | |||||||||
Forfeited or expired | (358,000 | ) | 204.85 | |||||||||
Outstanding at March 29, 2015 | 5,310,000 | 184.19 | 7.21 | 203 | ||||||||
Vested or expected to vest at March 29, 2015 (1) | 2,528,000 | 217.61 | 8.81 | 27 | ||||||||
Exercisable at March 29, 2015 | 2,491,000 | 145.71 | 5.37 | 174 | ||||||||
(1) | Represents outstanding options reduced by expected forfeitures |
16. Accumulated other comprehensive income (loss)
Accumulated other comprehensive income (loss) ("AOCI") consists of cumulative unrealized foreign currency translation adjustments, pension and postretirement obligations, unrealized gains (losses) on certain derivative instruments, and unrealized gains (losses) on available-for-sale securities.
The components of AOCI (net of tax) for the year ended March 29, 2015 were as follows :
Cumulative unrealized foreign currency translation gains (losses) | Pension and postretirement obligations | Unrealized gain (loss) on derivatives | Unrealized gain (loss) on available-for-sale securities | Total | |||||||||||||||
Balance at March 30, 2014 | $ | 69 | $ | (483 | ) | $ | 6 | $ | (10 | ) | $ | (418 | ) | ||||||
OCI before reclassifications | (353 | ) | (185 | ) | (17 | ) | (12 | ) | (567 | ) | |||||||||
Amounts reclassified from AOCI | — | 31 | (1 | ) | — | 30 | |||||||||||||
Net current period OCI | (353 | ) | (154 | ) | (18 | ) | (12 | ) | (537 | ) | |||||||||
Balance at March 29, 2015 | $ | (284 | ) | $ | (637 | ) | $ | (12 | ) | $ | (22 | ) | $ | (955 | ) | ||||
65
The components of AOCI (net of tax) for the year ended March 30, 2014 were as follows:
Cumulative unrealized foreign currency translation gains (losses) | Pension and postretirement obligations | Unrealized gain (loss) on derivatives | Unrealized gain (loss) on available-for-sale securities | Total | |||||||||||||||
Balance at March 31, 2013 | $ | (79 | ) | $ | (489 | ) | $ | 1 | $ | 14 | $ | (553 | ) | ||||||
OCI before reclassifications | 148 | (29 | ) | 7 | (22 | ) | 104 | ||||||||||||
Amounts reclassified from AOCI | — | 35 | (2 | ) | (2 | ) | 31 | ||||||||||||
Net current period OCI | 148 | 6 | 5 | (24 | ) | 135 | |||||||||||||
Balance at March 30, 2014 | $ | 69 | $ | (483 | ) | $ | 6 | $ | (10 | ) | $ | (418 | ) | ||||||
Reclassifications from AOCI for the years ended March 29, 2015 and March 30, 2014 are summarized in the following table:
Details about Accumulated Other Comprehensive Income Components | March 29, 2015 | March 30, 2014 | Affected Line Item in Statement Where Net Income Is Presented | |||||||
Amount Reclassified from Accumulated Other Comprehensive Income | ||||||||||
Gain (loss) on cash flow hedges: | ||||||||||
Foreign exchange contracts | $ | 1 | $ | 3 | Sales | |||||
Foreign exchange contracts | — | (1 | ) | Cost of goods sold | ||||||
1 | 2 | Total before tax | ||||||||
— | — | Tax expense | ||||||||
$ | 1 | $ | 2 | Net of tax | ||||||
Unrealized gain (loss) on available for sale securities | $ | — | $ | 3 | Selling and administrative | |||||
— | (1 | ) | Tax expense | |||||||
$ | — | $ | 2 | Net of tax | ||||||
Amortization of defined benefit pension items: | ||||||||||
Prior-service cost | $ | (3 | ) | $ | (3 | ) | (a) | |||
Net actuarial loss | (45 | ) | (52 | ) | (a) | |||||
(48 | ) | (55 | ) | Total before tax | ||||||
17 | 20 | Tax benefit | ||||||||
$ | (31 | ) | $ | (35 | ) | Net of tax | ||||
Total reclassifications for the period | $ | (30 | ) | $ | (31 | ) | Net of tax | |||
(a) These AOCI components are included in the computation of net periodic pension cost (see Note 18 for additional details). The net periodic pension cost is included in cost of sales and selling and administrative line items in the Consolidated Statements of Income.
17. Derivatives and hedging activities
We hold and issue derivative financial instruments for the purpose of hedging the risks of certain identifiable and anticipated transactions and to protect our investments in foreign subsidiaries. In general, the types of risks hedged are those relating to the variability of future earnings and cash flows caused by movements in foreign currency exchange rates and changes in commodity prices and interest rates. We document our risk management strategy and hedge effectiveness at the inception of and during the term of each hedge.
Derivative financial instruments are recorded in the financial statements and measured at fair value. Changes in the fair value of derivative financial instruments are either recognized periodically in income or shareholders' equity (as a component of accumulated other comprehensive income (loss)) depending on whether the derivative is being used to hedge changes in fair value, cash flows, or a net investment in a foreign operation. In the normal course of business, we execute the following types of hedge transactions:
66
Fair value hedges
We have sales and purchase commitments denominated in foreign currencies. Foreign currency forward contracts are used to hedge against the risk of change in the fair value of these commitments attributable to fluctuations in exchange rates. We also have exposure to fluctuations in interest rates. Interest rate swaps are used to hedge against the risk of changes in the fair value of fixed rate borrowings attributable to changes in interest rates. Changes in the fair value of the derivative instrument are offset in the income statement by changes in the fair value of the item being hedged.
Net investment hedges
We may use foreign currency derivative instruments to hedge net investments in certain foreign subsidiaries whose functional currency is the local currency. The effective portion of the gains and losses on net investment hedge transactions are reported in cumulative translation adjustment as a component of shareholders' equity.
Cash flow hedges
We have exposure to fluctuations in foreign currency exchange rates. Foreign currency forward contracts and options are used to hedge the variability in cash flows from forecast receipts or expenditures denominated in currencies other than the functional currency. We also have exposure to fluctuations in commodity prices. Commodity swaps may be used to hedge against the variability in cash flows from forecasted commodity purchases. For cash flow hedge transactions, changes in the fair value of the derivative instruments are reported in accumulated other comprehensive income (loss). The gains and losses on cash flow hedge transactions that are reported in accumulated other comprehensive income (loss) are reclassified to earnings in the periods in which earnings are affected by the variability of the cash flows of the hedged item. The ineffective portions of all hedges are recognized in current period earnings.
We formally assess, both at the hedge's inception and on an ongoing basis, whether the derivatives that are designated as hedging instruments have been highly effective in offsetting changes in the cash flows of hedged items and whether those derivatives may be expected to remain highly effective in future periods. When it is determined that a derivative is not, or has ceased to be, highly effective as a hedge, we discontinue hedge accounting prospectively.
As of March 29, 2015, there were $18 million of deferred net losses (pre-tax) relating to derivative activity in accumulated other comprehensive loss that are expected to be transferred to net earnings over the next twelve months when the forecasted transactions actually occur. As of March 29, 2015, the maximum term over which we are hedging exposures to the variability of cash flows for all forecasted and recorded transactions is 15 months. As of March 29, 2015, the amount of net notional foreign exchange and interest rate contracts outstanding was approximately $695 million and $250 million, respectively. We believe that there is no significant credit risk associated with the potential failure of any counterparty to perform under the terms of any derivative financial instrument.
Derivative instruments are measured at fair value within the consolidated balance sheet either as assets or liabilities. As of March 29, 2015, accounts receivable included foreign exchange contracts of $4 million and accounts payable included foreign exchange contracts of $29 million and interest rate contracts of $1 million. As of March 30, 2014, accounts receivable included foreign exchange contracts of $9 million and accounts payable included foreign exchange contracts of $4 million.
For the years ended March 29, 2015, March 30, 2014 and March 31, 2013, we recognized less than $1 million of losses, $5 million and $3 million of gains, respectively, in the consolidated statements of income for derivatives designated as hedging instruments. For the years ended March 29, 2015, March 30, 2014 and March 31, 2013, we recognized $31 million of losses, $39 million of gains, and $2 million of losses, respectively, in the consolidated statements of income for derivatives not designated as hedging instruments. Gains and losses on derivatives not designated as hedging instruments are primarily offset by losses or gains arising from the revaluation of foreign currency denominated assets and liabilities. The ineffective portion of gains and losses relating to derivatives designated as hedging instruments in fiscal 2015, 2014 or 2013 was not significant.
18. Pension and other postretirement benefit plans
We sponsor many U.S. and non-U.S. defined benefit pension plans. Benefits provided by these plans are generally based on years of service and compensation. Our general funding policy for qualified pension plans is to contribute amounts at least sufficient to satisfy regulatory funding standards. We also provide postretirement medical benefits for certain eligible employees who have satisfied plan eligibility provisions, which include age and/or service requirements.
67
Pension and postretirement benefit obligations and funded status
Pension Benefits | Other Postretirement Benefits | ||||||||||||||
Fiscal | 2015 | 2014 | 2015 | 2014 | |||||||||||
Change in plan assets: | |||||||||||||||
Beginning fair value of plan assets | $ | 2,267 | $ | 2,119 | $ | — | $ | — | |||||||
Actual return on plan assets | 232 | 96 | — | — | |||||||||||
Company contributions | 34 | 78 | 8 | 8 | |||||||||||
Plan participants’ contributions | 2 | 2 | — | — | |||||||||||
Benefits paid | (102 | ) | (112 | ) | (8 | ) | (8 | ) | |||||||
Exchange rate and other | (108 | ) | 84 | — | — | ||||||||||
Ending fair value of plan assets | $ | 2,325 | $ | 2,267 | $ | — | $ | — | |||||||
Change in projected benefit obligations: | |||||||||||||||
Beginning projected benefit obligations | $ | 2,553 | $ | 2,466 | $ | 94 | $ | 106 | |||||||
Service cost | 45 | 50 | 1 | 1 | |||||||||||
Interest cost | 112 | 112 | 4 | 5 | |||||||||||
Plan participants’ contributions | 2 | 2 | — | — | |||||||||||
Amendments/curtailments/settlement | (1 | ) | (1 | ) | — | — | |||||||||
Actuarial losses (gains) | 353 | (51 | ) | 6 | (10 | ) | |||||||||
Benefits paid | (102 | ) | (112 | ) | (8 | ) | (8 | ) | |||||||
Exchange rate and other | (119 | ) | 87 | — | — | ||||||||||
Ending projected pension and postretirement benefit obligations | $ | 2,843 | $ | 2,553 | $ | 97 | $ | 94 | |||||||
Funded Status: | |||||||||||||||
Fair value of plan assets less than projected pension and postretirement benefit obligations | $ | (518 | ) | $ | (286 | ) | $ | (97 | ) | $ | (94 | ) | |||
Amounts recognized in the balance sheets: | |||||||||||||||
Noncurrent asset | $ | — | $ | 3 | $ | — | $ | — | |||||||
Current liabilities | (7 | ) | (6 | ) | (7 | ) | (7 | ) | |||||||
Noncurrent liabilities | (511 | ) | (283 | ) | (90 | ) | (87 | ) | |||||||
Net amount recognized | $ | (518 | ) | $ | (286 | ) | $ | (97 | ) | $ | (94 | ) | |||
Amounts recognized in accumulated other comprehensive loss consist of: | |||||||||||||||
Net actuarial loss | $ | 908 | $ | 698 | $ | 14 | $ | 9 | |||||||
Prior service cost | 8 | 11 | — | 1 | |||||||||||
Net amount recognized, before tax effect | $ | 916 | $ | 709 | $ | 14 | $ | 10 | |||||||
Of the total amounts included in accumulated other comprehensive loss as of March 29, 2015, we estimate that we will recognize amortization of the following amounts as components of net periodic pension and postretirement benefit cost in fiscal 2016: net actuarial loss of $58 million and prior service cost of $3 million. Several of our defined benefit pension plans have accumulated benefit obligations in excess of plan assets. As of March 29, 2015, the aggregate projected benefit obligation was $2,133 million, the aggregate accumulated benefit obligation was $1,995 million, and the aggregate fair value of plan assets was $1,682 million associated with these defined benefit pension plans.
68
Components of net periodic pension cost
The net periodic pension cost for our pension plans consisted of the following components:
Fiscal | 2015 | 2014 | 2013 | ||||||||
Service cost | $ | 47 | $ | 52 | $ | 46 | |||||
Interest cost | 112 | 112 | 96 | ||||||||
Expected return on plan assets | (160 | ) | (171 | ) | (137 | ) | |||||
Amortization of prior service cost | 3 | 3 | 3 | ||||||||
Amortization of net actuarial loss | 44 | 51 | 45 | ||||||||
Net periodic pension cost | $ | 46 | $ | 47 | $ | 53 | |||||
The net postretirement benefit cost of our postretirement benefit plans consisted of the following components:
Fiscal | 2015 | 2014 | 2013 | ||||||||
Service cost | $ | 1 | $ | 1 | $ | 1 | |||||
Interest cost | 4 | 5 | 4 | ||||||||
Amortization of net actuarial loss | 1 | 1 | 1 | ||||||||
Net postretirement benefit cost | $ | 6 | $ | 7 | $ | 6 | |||||
Components of amounts recognized in other comprehensive income
The changes in plan assets and benefit obligations recognized in other comprehensive income for our pension plans consisted of the following:
Fiscal | 2015 | 2014 | 2013 | ||||||||
Net actuarial loss (gain) | $ | 232 | $ | (23 | ) | $ | 62 | ||||
Amortization of net actuarial loss | (11 | ) | (7 | ) | (8 | ) | |||||
Amortization of prior service cost | (3 | ) | (3 | ) | (3 | ) | |||||
Exchange rate (gain) loss | (11 | ) | 10 | (7 | ) | ||||||
Total recognized in OCI | $ | 207 | $ | (23 | ) | $ | 44 | ||||
The changes in plan assets and benefit obligations recognized in other comprehensive income for our postretirement benefit plans consisted of net actuarial loss (gain) of $4 million, $(12) million and $5 million for fiscal 2015, 2014 and 2013, respectively.
Weighted-average assumptions
The weighted-average assumptions used in determining the pension and postretirement benefit obligations in our pension and postretirement plans in fiscal 2015 and 2014 were as follows:
U.S. Plans | Pension Benefits | Other Postretirement Benefits | |||||||||
Fiscal | 2015 | 2014 | 2015 | 2014 | |||||||
Discount rate | 4.05 | % | 4.70 | % | 4.05 | % | 4.70 | % | |||
Rate of compensation increase | 3.00 | % | 3.00 | % | 3.00 | % | 3.00 | % | |||
Non-U.S. Plans | Pension Benefits | ||||||||||
Fiscal | 2015 | 2014 | |||||||||
Discount rate | 3.54 | % | 4.67 | % | |||||||
Rate of compensation increase | 2.74 | % | 2.98 | % | |||||||
69
As of March 29, 2015, the projected U.S. pension benefit obligation was $1,715 million and the non-U.S. pension benefit obligation was $1,128 million.
The weighted-average assumptions used in determining the net periodic pension and postretirement benefit cost in our pension and postretirement plans in fiscal 2015, 2014 and 2013 were as follows:
U.S. Plans | Pension Benefits | Other Postretirement Benefits | |||||||||||||||
Fiscal | 2015 | 2014 | 2013 | 2015 | 2014 | 2013 | |||||||||||
Discount rate | 4.70 | % | 4.25 | % | 4.80 | % | 4.70 | % | 4.25 | % | 4.85 | % | |||||
Expected return on plan assets | 7.75 | % | 8.00 | % | 8.00 | % | — | — | — | ||||||||
Rate of compensation increase | 3.00 | % | 3.00 | % | 3.00 | % | 3.00 | % | 3.00 | % | 3.00 | % | |||||
Non-U.S. Plans | Pension Benefits | ||||||||||||||||
Fiscal | 2015 | 2014 | 2013 | ||||||||||||||
Discount rate | 4.67 | % | 4.76 | % | 4.98 | % | |||||||||||
Expected return on plan assets | 7.25 | % | 7.50 | % | 7.50 | % | |||||||||||
Rate of compensation increase | 2.98 | % | 2.98 | % | 2.91 | % | |||||||||||
For the year ended March 29, 2015, our U.S. net periodic pension cost was $44 million and our non-U.S. net periodic pension cost was $2 million.
Health care trend rates
The health care cost trend rates used in fiscal 2015 and 2014 were as follows:
Other Postretirement Benefits | |||||
Fiscal | 2015 | 2014 | |||
Health care cost trend assumed for next year | 5.71 | % | 6.62 | % | |
Ultimate trend rate | 4.30 | % | 4.30 | % | |
Year ultimate rate is reached | 2094 | 2092 | |||
A one-percentage-point change in assumed health care cost trend rates would have the following effects:
1 percentage point increase | 1 percentage point decrease | ||||||
Effect on total of service and interest cost components | $ | — | $ | — | |||
Effect on postretirement benefit obligation | $ | 3 | $ | (3 | ) | ||
During fiscal 2015, we contributed $34 million to our defined benefit pension plans, of which $8 million was voluntary. In the first quarter of fiscal 2016, we made $31 million of voluntary contributions to our U.S. defined benefit pension plans. We expect to contribute approximately $20 million of required contributions in fiscal 2016, for total contributions to the defined benefit pension plans of approximately $51 million in fiscal 2016. In addition, we contributed $8 million to the other postretirement benefit plans during fiscal 2015. We expect to contribute approximately $7 million to these other postretirement benefit plans during fiscal 2016.
70
Estimated future benefit payments for our pension and other postretirement benefit plans are expected to be:
Fiscal Year | Pension Benefits | Other Postretirement Benefits | |||||
2016 | $ | 121 | $ | 7 | |||
2017 | 113 | 7 | |||||
2018 | 118 | 7 | |||||
2019 | 124 | 7 | |||||
2020 | 129 | 7 | |||||
2021-2025 | 738 | 31 | |||||
Plan asset allocations
The Company’s asset allocation strategy is designed to balance the objectives of achieving the asset return assumption consistently over the long-term in order to fund future payment obligations and broadly diversifying investments across financial markets to protect investment values against adverse movements. In addition, we seek to minimize the volatility of the plans’ funded status and the Company’s pension expense. Asset classes with differing expected rates of return, return volatility and correlations are utilized to control risk and provide diversification. The asset categories are described below, along with the investment level classification under fair value guidance as defined in Note 12—Fair value measurements.
Public Equity Securities (Long/Hedged)
Long equity investments consist of publicly traded equity securities that are well diversified across managers, styles, sectors and countries. Hedged equity investments typically add short positions in equities or equity futures in order to generate absolute returns regardless of equity market direction. Public equity investments made directly through managed (separate) account structures and valued based upon closing prices reported in active trading markets are classified as Level 1. Equity investments made indirectly via pooled funds offering daily to quarterly liquidity and valued at the net asset value ("NAV") of the fund are classified as Level 2. Such investments are typically valued at the most recently published NAV of the fund, which may be derived from underlying investment values one quarter earlier, unless management believes an adjustment to NAV is warranted based on changes in observable inputs or an expectation that an investment will be sold at a value other than NAV.
Private Equity
Private equity investments consist of investments in limited partnerships or commingled vehicles with managers who purchase interests in non-public companies. Sub-categories of private equity may include venture capital, early stage, special situations or restructuring funds. Private equity funds typically have low liquidity, a 10 year or longer investment commitment, and valuation methodologies that require the use of significant unobservable inputs. Private equity investments are classified as Level 3 and are typically valued at the most recently published NAV of the fund, unless management believes an adjustment is warranted as described above. For the years ended March 29, 2015 and March 30, 2014, no material adjustments were made to fund NAVs. As of March 29, 2015, unfunded capital commitments to private equity investments were $16 million.
Absolute Return (Market Sectors/Arbitrage)
Absolute return strategies are investments with managers who seek specified levels of absolute returns with minimal correlation to market movements. Absolute return managers typically invest in futures, forwards or options on a variety of asset classes. Market sector strategies seek to capitalize on movements in commodity, currency, interest rate and/or other traditional markets while arbitrage strategies focus on credit, volatility or other alternative asset classes. Investments are typically made in limited partnerships and classified as Level 2 when funds offer daily to quarterly liquidity at fund NAVs and reported values are based on significant observable inputs. All other investments are classified as Level 3 and are typically valued at the most recently published NAV of the fund, unless management believes an adjustment is warranted as described above. As of March 29, 2015, unfunded capital commitments to absolute return investments were $3 million.
Royalty Investments
Royalty investments are made through a limited partnership which purchases income-producing royalties derived from sales of pharmaceutical products. Valuation of the fund is determined from an independent appraisal process whereby significant observable inputs are used in determining the fund’s NAV. Liquidity is typically arranged in the secondary market with trades occurring at the most recent published NAV. Royalty investments are classified as Level 2 and are typically valued at the most recently published NAV of the fund, unless management believes an adjustment is warranted as described above.
71
Fixed Income (Investment/Non-Investment Grade)
Fixed income investments consist of public and private fixed income securities of U.S. and non-U.S. government and corporate issuers, fixed income mutual funds and interest rate derivatives intended to hedge a portion of the pension plan's sensitivity to interest changes. Fixed income investments made directly through managed (separate) account structures and valued based upon closing prices reported in the active trading markets are classified as Level 1. Over-the-counter derivatives and fixed income investments made indirectly via pooled funds offering daily to quarterly liquidity and valued at the NAV of the fund are classified as Level 2. Fixed income investments with low liquidity and valuation methodologies that require the use of significant unobservable inputs are classified as Level 3. As of March 29, 2015, unfunded capital commitments to fixed income investments were $18 million.
The fair value methods employed by PCC as noted above may not be validated at the time of sale and may not reflect future fair value measurements. The use of different assumptions of valuation methodologies may lead to different fair value measurements.
Cash/Other
Cash and other investments include highly liquid money market securities, demand deposits and other cash equivalents.
The table below sets forth our target asset allocation for fiscal 2015 and the actual allocations at March 29, 2015 and March 30, 2014:
Target Allocation | Actual Allocation | Actual Allocation | ||||||||
2015 | March 29, 2015 | March 30, 2014 | ||||||||
Equity | 25 | % | – | 60% | 46 | % | 47 | % | ||
Fixed Income | 5 | % | – | 50% | 23 | % | 23 | % | ||
Absolute Return | 5 | % | – | 40% | 16 | % | 18 | % | ||
Royalties | 0 | % | – | 15% | 12 | % | 8 | % | ||
Cash/Other | 1 | % | – | 10% | 3 | % | 4 | % | ||
Total | 100 | % | 100 | % | ||||||
The fair value of our pension plan assets at March 29, 2015 by asset category are as follows:
Fair Value Measurements Using | |||||||||||||||
Level 1 | Level 2 | Level 3 | Total | ||||||||||||
Equity: | |||||||||||||||
Long | $ | 327 | $ | 182 | $ | — | $ | 509 | |||||||
Hedged | 50 | 197 | 1 | 248 | |||||||||||
Private Equity | — | — | 316 | 316 | |||||||||||
Total Equity | 377 | 379 | 317 | 1,073 | |||||||||||
Absolute Return: | |||||||||||||||
Market Sectors | 24 | 196 | — | 220 | |||||||||||
Arbitrage | — | 149 | 2 | 151 | |||||||||||
Total Absolute Return | 24 | 345 | 2 | 371 | |||||||||||
Royalties | — | 277 | — | 277 | |||||||||||
Fixed Income: | |||||||||||||||
Investment Grade | 360 | 34 | — | 394 | |||||||||||
Non-Investment Grade | 4 | 51 | 95 | 150 | |||||||||||
Total Fixed Income | 364 | 85 | 95 | 544 | |||||||||||
Cash/Other | 59 | 1 | — | 60 | |||||||||||
Total | $ | 824 | $ | 1,087 | $ | 414 | $ | 2,325 | |||||||
72
The table below sets forth a summary of changes in the fair value of the pension plan’s Level 3 assets for the year ended March 29, 2015:
Investment | |||||||||||||||||||
Hedge Equity | Private Equity | Arbitrage | Fixed Income - Non-Investment Grade | Total | |||||||||||||||
March 30, 2014 | $ | 1 | $ | 226 | $ | 3 | $ | 66 | $ | 296 | |||||||||
Realized Gain | — | — | — | 2 | 2 | ||||||||||||||
Unrealized Gain/(Loss) | — | 3 | (1 | ) | 3 | 5 | |||||||||||||
Contributions | — | 91 | — | 34 | 125 | ||||||||||||||
Redemptions | (1 | ) | (4 | ) | — | (10 | ) | (15 | ) | ||||||||||
Transfers Into Level 3 | 1 | — | — | — | 1 | ||||||||||||||
March 29, 2015 | $ | 1 | $ | 316 | $ | 2 | $ | 95 | $ | 414 | |||||||||
The fair value of our pension plan assets at March 30, 2014 by asset category are as follows:
Fair Value Measurements Using | |||||||||||||||
Level 1 | Level 2 | Level 3 | Total | ||||||||||||
Equity: | |||||||||||||||
Long | $ | 404 | $ | 224 | $ | — | $ | 628 | |||||||
Hedged | 65 | 136 | 1 | 202 | |||||||||||
Private Equity | — | — | 226 | 226 | |||||||||||
Total Equity | 469 | 360 | 227 | 1,056 | |||||||||||
Absolute Return: | |||||||||||||||
Market Sectors | — | 223 | — | 223 | |||||||||||
Arbitrage | — | 195 | 3 | 198 | |||||||||||
Total Absolute Return | — | 418 | 3 | 421 | |||||||||||
Royalties | — | 178 | — | 178 | |||||||||||
Fixed Income: | |||||||||||||||
Investment Grade | 371 | 40 | — | 411 | |||||||||||
Non-Investment Grade | — | 48 | 66 | 114 | |||||||||||
Total Fixed Income | 371 | 88 | 66 | 525 | |||||||||||
Cash/Other | 86 | 1 | — | 87 | |||||||||||
Total | $ | 926 | $ | 1,045 | $ | 296 | $ | 2,267 | |||||||
The table below sets forth a summary of changes in the fair value of the pension plan’s Level 3 assets for the year ended March 30, 2014:
Investment | |||||||||||||||||||
Hedge Equity | Private Equity | Arbitrage | Fixed Income - Non-Investment Grade | Total | |||||||||||||||
March 31, 2013 | $ | 1 | $ | 241 | $ | 6 | $ | 49 | $ | 297 | |||||||||
Realized Gain/(Loss) | 1 | — | (2 | ) | 2 | 1 | |||||||||||||
Unrealized (Loss)/Gain | — | (18 | ) | 2 | 4 | (12 | ) | ||||||||||||
Contributions | — | 9 | — | 38 | 47 | ||||||||||||||
Redemptions | (1 | ) | (6 | ) | (3 | ) | (27 | ) | (37 | ) | |||||||||
Transfers Into/(Out of) Level 3 | — | — | — | — | — | ||||||||||||||
March 30, 2014 | $ | 1 | $ | 226 | $ | 3 | $ | 66 | $ | 296 | |||||||||
73
Multi-employer pension plans
We are a participating employer in several trustee-managed multiemployer, defined benefit pension plans for employees who participate in collective bargaining agreements. The risks of participating in these multiemployer plans are different from single-employer plans in that (i) assets contributed to the multiemployer plan by one employer may be used to provide benefits to employees of other participating employers; (ii) if a participating employer stops contributing to the plan, the unfunded obligations of the plan may be required to be assumed by the remaining participating employers; and (iii) if we choose to stop participating in any of our multiemployer plans, we may be required to pay those plans a withdrawal amount based on the underfunded status of the plan. The following table outlines our participation in multiemployer plans:
Pension Protection Act Zone Status (a) | Contributions of PCC | |||||||||||||||||||||||
Pension Fund | EIN/Pension Plan Number | FY2015 | FY2014 | FIP/RP Status (b) | FY2015 | FY2014 | FY2013 | Surcharge Imposed | Expiration Date of Collective Bargaining Agreement | |||||||||||||||
IAM National Pension Plan | 51-6031295/ 002 (c) | Green | Green | Not Applicable | $ | 1 | $ | 1 | $ | 1 | No | 6/30/2017 8/15/2016 2/29/2016 | ||||||||||||
Steelworkers Pension Trust | 23-6648508/ 499 | Green | Green | Not Applicable | 4 | 4 | 3 | No | 8/7/2015 9/17/2017 | |||||||||||||||
Boilermaker-Blacksmith National Pension Trust | 48-6168020/ 001 (c)(d) | Yellow | Yellow | Implemented | 1 | 1 | 1 | No | 7/15/2015 7/15/2017 | |||||||||||||||
Total Contributions: | $ | 6 | $ | 6 | $ | 5 | ||||||||||||||||||
(a) Unless otherwise noted in the table, the most recent Pension Protection Act zone status available in fiscal 2015 and fiscal 2014 is for the plan's year-end at December 31, 2014 and 2013, respectively. The zone status is based on the latest information that we received from the plan and is certified by the plan's actuary.
(b) The “FIP/RP Status” column indicates plans for which a Funding Improvement Plan (“FIP”) or a Rehabilitation Plan (“RP”) is either pending or has been implemented.
(c) The plan's zone status was calculated after taking into account IRS approval for an "amortization extension", adjusting future benefit accruals, and electing other funding relief measures made available under the Pension Relief Act of 2010.
(d) Beginning on January 1, 2010, the minimum contribution rate required to be paid by the employers is equal to the base contribution rate in effect, for the collective bargaining agreement in effect on September 30, 2008, multiplied by the following factors over the following calendar years: 2012 - 205%; 2013 - 240%; after 01/01/2014 - 275%.
Defined contribution plans
The expense related to employer contributions to our defined contribution plans was $38 million, $35 million and $23 million in fiscal 2015, 2014 and 2013, respectively.
74
19. Segment information
Information regarding segments is presented in accordance with segment disclosure guidance. Based on the criteria outlined in this guidance, our operations are classified into three reportable operating segments: Investment Cast Products, Forged Products and Airframe Products.
Investment Cast Products
The Investment Cast Products segment manufactures investment castings, and provides related investment casting materials and alloys, for aircraft engines, industrial gas turbine engines, airframes, armaments, medical prostheses and other industrial applications.
Forged Products
The Forged Products segment manufactures forged components from sophisticated titanium and nickel-based alloys principally for the aerospace and power markets, and manufactures metal alloys used to produce forged components for aerospace and non-aerospace markets which include products for oil and gas, chemical processing, and pollution control applications. The segment also provides nickel superalloy and titanium revert management solutions, re-melting various material byproducts to be reused in casting, forging, and fastener manufacturing processes. The Forged Products segment also produces seamless pipe for the power and the oil and gas industries.
Airframe Products
The Airframe Products segment primarily produces highly engineered fasteners, fastener systems, fluid fittings, aerostructures, and precision components for critical applications in the aerospace, automotive and industrial machinery markets. The majority of our Airframe Products sales come from the same aerospace customer base served by our Investment Cast Products and Forged Products segments. The balance of the segment’s sales is derived from automotive and general industrial markets, including farm machinery, construction equipment, machine tools, medical equipment, appliances and recreation.
75
Our chief operating decision maker evaluates performance and allocates resources based on revenues, operating income and net assets employed. The accounting policies of the reportable segments are the same as those described in Note 1—Summary of significant accounting policies. Segment results are as follows:
Fiscal | 2015 | 2014 | 2013 | ||||||||
Net sales: | |||||||||||
Investment Cast Products | $ | 2,536 | $ | 2,462 | $ | 2,480 | |||||
Forged Products | 4,259 | 4,189 | 3,552 | ||||||||
Airframe Products | 3,210 | 2,882 | 2,315 | ||||||||
Consolidated net sales | $ | 10,005 | $ | 9,533 | $ | 8,347 | |||||
Intercompany sales activity (1): | |||||||||||
Investment Cast Products (2) | $ | 273 | $ | 276 | $ | 303 | |||||
Forged Products (3) | 1,857 | 1,770 | 991 | ||||||||
Airframe Products (4) | 272 | 203 | 149 | ||||||||
Total intercompany sales activity | $ | 2,402 | $ | 2,249 | $ | 1,443 | |||||
Segment operating income (loss): | |||||||||||
Investment Cast Products | $ | 913 | $ | 874 | $ | 838 | |||||
Forged Products | 1,008 | 1,075 | 779 | ||||||||
Airframe Products | 968 | 863 | 687 | ||||||||
Corporate expense | (150 | ) | (153 | ) | (145 | ) | |||||
Restructuring and inventory and other asset impairment (5) | (135 | ) | — | — | |||||||
Total segment operating income | 2,604 | 2,659 | 2,159 | ||||||||
Interest expense, net | 65 | 71 | 31 | ||||||||
Consolidated income before income taxes and equity in earnings of unconsolidated affiliates | $ | 2,539 | $ | 2,588 | $ | 2,128 | |||||
Depreciation and amortization expense: | |||||||||||
Investment Cast Products | $ | 42 | $ | 39 | $ | 36 | |||||
Forged Products | 190 | 171 | 116 | ||||||||
Airframe Products | 82 | 71 | 56 | ||||||||
Corporate | 11 | 11 | 6 | ||||||||
Consolidated depreciation and amortization expense | $ | 325 | $ | 292 | $ | 214 | |||||
Capital expenditures: | |||||||||||
Investment Cast Products | $ | 54 | $ | 49 | $ | 46 | |||||
Forged Products | 260 | 231 | 163 | ||||||||
Airframe Products | 137 | 69 | 57 | ||||||||
Corporate | 4 | 2 | 54 | ||||||||
Consolidated capital expenditures | $ | 455 | $ | 351 | $ | 320 | |||||
Total assets: | |||||||||||
Investment Cast Products | $ | 1,577 | $ | 1,516 | |||||||
Forged Products (6) | 10,209 | 10,436 | |||||||||
Airframe Products | 6,958 | 6,140 | |||||||||
Corporate (7) | 628 | 417 | |||||||||
Discontinued operations | 56 | 77 | |||||||||
Consolidated total assets | $ | 19,428 | $ | 18,586 | |||||||
(1) | Intercompany sales activity consists of each segment’s total intercompany sales activity, including intercompany sales activity within a segment and between segments. |
(2) | Investment Cast Products: Includes intersegment sales activity of $39 million, $44 million and $52 million for fiscal 2015, 2014 and 2013, respectively. |
(3) | Forged Products: Includes intersegment sales activity of $123 million, $128 million and $102 million for fiscal 2015, 2014 and 2013, respectively. |
(4) | Airframe Products: Includes intersegment sales activity of $6 million, $7 million and $6 million for fiscal 2015, 2014 and 2013, respectively. |
(5) | See Note 20 for detail of restructuring and inventory and other asset impairment charges by segment. |
(6) | Forged Products assets include $235 million and $414 million in fiscal 2015 and 2014, respectively, related to investments in unconsolidated affiliates. |
(7) | Corporate assets consist principally of cash and cash equivalents, property, plant & equipment and other assets. |
76
Net direct sales to General Electric were 13 percent, 13 percent and 15 percent of total sales in fiscal 2015, 2014 and 2013, respectively, as follows:
Fiscal | 2015 | 2014 | 2013 | ||||||||
Investment Cast Products | $ | 828 | $ | 736 | $ | 697 | |||||
Forged Products | 435 | 412 | 540 | ||||||||
Airframe Products | 36 | 66 | 39 | ||||||||
$ | 1,299 | $ | 1,214 | $ | 1,276 | ||||||
No other customer directly accounted for more than 10 percent of net sales.
Our business is conducted on a global basis with manufacturing, service and sales undertaken in various locations throughout the world. Net sales are attributed to geographic areas based on the location of the assets producing the revenues. Long-lived assets consist of net property, plant and equipment and certain other tangible long-term assets of continuing operations. Geographic information regarding our net sales and long-lived assets is as follows:
Fiscal | 2015 | 2014 | 2013 | ||||||||
United States | $ | 8,258 | $ | 7,742 | $ | 6,832 | |||||
United Kingdom | 968 | 1,087 | 873 | ||||||||
Other countries | 779 | 704 | 642 | ||||||||
Net sales | $ | 10,005 | $ | 9,533 | $ | 8,347 | |||||
United States | $ | 2,247 | $ | 2,097 | |||||||
United Kingdom | 233 | 261 | |||||||||
Other countries | 206 | 153 | |||||||||
Assets of discontinued operations | 20 | 24 | |||||||||
Total tangible long-lived assets (1) | $ | 2,706 | $ | 2,535 | |||||||
(1) | Long-lived assets exclude $238 million and $416 million in fiscal 2015 and 2014, respectively, related to investments in unconsolidated affiliates. |
20. Restructuring, asset impairment and other non-recurring charges
In the fourth quarter of fiscal 2015, we recognized a non-cash inventory and other asset impairment charge of $127 million, pre-tax, primarily in our oil & gas, pipe and associated raw material operations, reflecting the more challenging environment, declines in market value, and size or quality characteristics that impact marketability. In addition, to improve our cost structure and in response to the current market conditions, we implemented headcount reductions at impacted operations, which resulted in a pre-tax charge of $8 million in the fourth quarter of fiscal 2015. These restructuring plans provided for terminations of approximately 490 employees in the fourth quarter of fiscal 2015 and the first quarter of fiscal 2016. The restructuring and asset impairment charges recorded by segment are as follows:
Fiscal | 2015 | ||
Investment Cast Products | $ | 4 | |
Forged Products | 127 | ||
Airframe Products | 4 | ||
$ | 135 | ||
In addition, in the fourth quarter of fiscal 2015, we decided to sell our 50 percent ownership of Yangzhou Chengde Steel Tube Co. Ltd., a large-diameter pipe manufacturing joint venture in China. At that time, we concluded we no longer had the intent to retain our partial ownership and improve the operations of the facility and therefore, an impairment of the investment was warranted. Based on the estimated fair value of the investment, we recognized a non-cash impairment charge of $174 million, pre-tax, in the fourth quarter of fiscal 2015, which also includes a small impairment associated with an unrelated joint venture.
77
Restructuring, inventory and other asset impairment, and other non-recurring charges incurred in fiscal 2015 were recorded in the Consolidated Statement of Income as follows:
Fiscal | 2015 | ||
Cost of goods sold | $ | 127 | |
Restructuring expense | 8 | ||
Equity in loss of unconsolidated affiliates | 174 | ||
$ | 309 | ||
21. Subsequent events
• | During the first quarter of fiscal 2016, we completed two small acquisitions in the Forged Products segment. |
• | On May 13, 2015, the Board of Directors approved a $2.0 billion expansion to the Company's existing program to repurchase shares of the Company’s common stock, effective immediately and continuing through June 30, 2017. The Company intends to repurchase outstanding shares from time to time in the open market, subject to market conditions. |
78
REPORT OF INDEPENDENT REGISTERED PUBLIC ACCOUNTING FIRM
To the Board of Directors and Shareholders of Precision Castparts Corp.
Portland, Oregon
We have audited the accompanying consolidated balance sheets of Precision Castparts Corp. and subsidiaries (the "Company") as of March 29, 2015 and March 30, 2014, and the related consolidated statements of income, comprehensive income, stockholders' equity, and cash flows for each of the three years in the period ended March 29, 2015. These financial statements are the responsibility of the Company's management. Our responsibility is to express an opinion on these financial statements based on our audits.
We conducted our audits in accordance with the standards of the Public Company Accounting Oversight Board (United States). Those standards require that we plan and perform the audit to obtain reasonable assurance about whether the financial statements are free of material misstatement. An audit includes examining, on a test basis, evidence supporting the amounts and disclosures in the financial statements. An audit also includes assessing the accounting principles used and significant estimates made by management, as well as evaluating the overall financial statement presentation. We believe that our audits provide a reasonable basis for our opinion.
In our opinion, such consolidated financial statements present fairly, in all material respects, the financial position of Precision Castparts Corp. and subsidiaries as of March 29, 2015 and March 30, 2014, and the results of their operations and their cash flows for each of the three years in the period ended March 29, 2015, in conformity with accounting principles generally accepted in the United States of America.
We have also audited, in accordance with the standards of the Public Company Accounting Oversight Board (United States), the Company's internal control over financial reporting as of March 29, 2015, based on the criteria established in Internal Control - Integrated Framework (2013) issued by the Committee of Sponsoring Organizations of the Treadway Commission and our report dated May 28, 2015 expressed an unqualified opinion on the Company's internal control over financial reporting.
/s/ DELOITTE & TOUCHE LLP
Portland, Oregon
May 28, 2015
79
Quarterly Financial Information (1)
(Unaudited) (In millions, except per share data) | |||||||||||||||
2015 | 1st Quarter | 2nd Quarter | 3rd Quarter | 4th Quarter | |||||||||||
Net sales | $ | 2,520 | $ | 2,522 | $ | 2,459 | $ | 2,504 | |||||||
Gross profit | $ | 893 | $ | 864 | $ | 831 | $ | 665 | |||||||
Net income | $ | 482 | $ | 468 | $ | 446 | $ | 137 | |||||||
Net income (loss) attributable to PCC shareholders: | |||||||||||||||
Continuing operations | $ | 485 | $ | 468 | $ | 443 | $ | 149 | |||||||
Discontinued operations | (2 | ) | (1 | ) | 2 | (14 | ) | ||||||||
$ | 483 | $ | 467 | $ | 445 | $ | 135 | ||||||||
Net income (loss) per share-basic: | |||||||||||||||
Continuing operations | $ | 3.35 | $ | 3.27 | $ | 3.11 | $ | 1.07 | |||||||
Discontinued operations | (0.02 | ) | (0.01 | ) | 0.02 | (0.11 | ) | ||||||||
$ | 3.33 | $ | 3.26 | $ | 3.13 | $ | 0.96 | ||||||||
Net income (loss) per share-diluted: | |||||||||||||||
Continuing operations | $ | 3.32 | $ | 3.24 | $ | 3.09 | $ | 1.06 | |||||||
Discontinued operations | (0.01 | ) | — | 0.02 | (0.10 | ) | |||||||||
$ | 3.31 | $ | 3.24 | $ | 3.11 | $ | 0.96 | ||||||||
Cash dividends per share | $ | 0.03 | $ | 0.03 | $ | 0.03 | $ | 0.03 | |||||||
Common stock prices: | |||||||||||||||
High | $ | 275.09 | $ | 261.49 | $ | 245.05 | $ | 242.96 | |||||||
Low | $ | 238.01 | $ | 226.38 | $ | 215.09 | $ | 186.17 | |||||||
End | $ | 254.36 | $ | 239.50 | $ | 241.26 | $ | 212.18 | |||||||
2014 | 1st Quarter | 2nd Quarter | 3rd Quarter | 4th Quarter | |||||||||||
Net sales | $ | 2,337 | $ | 2,340 | $ | 2,337 | $ | 2,519 | |||||||
Gross profit | $ | 790 | $ | 800 | $ | 805 | $ | 885 | |||||||
Net income | $ | 438 | $ | 425 | $ | 435 | $ | 486 | |||||||
Net income attributable to PCC shareholders: | |||||||||||||||
Continuing operations | $ | 420 | $ | 423 | $ | 431 | $ | 478 | |||||||
Discontinued operations | 16 | 1 | 2 | 6 | |||||||||||
$ | 436 | $ | 424 | $ | 433 | $ | 484 | ||||||||
Net income per share-basic: | |||||||||||||||
Continuing operations | $ | 2.87 | $ | 2.91 | $ | 2.97 | $ | 3.29 | |||||||
Discontinued operations | 0.11 | — | 0.01 | 0.04 | |||||||||||
$ | 2.98 | $ | 2.91 | $ | 2.98 | $ | 3.33 | ||||||||
Net income per share-diluted: | |||||||||||||||
Continuing operations | $ | 2.86 | $ | 2.89 | $ | 2.94 | $ | 3.27 | |||||||
Discontinued operations | 0.10 | — | 0.02 | 0.04 | |||||||||||
$ | 2.96 | $ | 2.89 | $ | 2.96 | $ | 3.31 | ||||||||
Cash dividends per share | $ | 0.03 | $ | 0.03 | $ | 0.03 | $ | 0.03 | |||||||
Common stock prices: | |||||||||||||||
High | $ | 226.94 | $ | 270.00 | $ | 271.99 | $ | 274.96 | |||||||
Low | $ | 180.06 | $ | 210.79 | $ | 225.00 | $ | 243.18 | |||||||
End | $ | 226.01 | $ | 228.09 | $ | 268.72 | $ | 247.58 | |||||||
____________________
(1) | Historical amounts have been restated to present certain businesses as discontinued operations. |
80
ITEM 9. | CHANGES IN AND DISAGREEMENTS WITH ACCOUNTANTS ON ACCOUNTING AND FINANCIAL DISCLOSURE |
None.
ITEM 9A. | CONTROLS AND PROCEDURES |
Evaluation of Controls and Procedures
We maintain disclosure controls and procedures that are designed with the objective of providing reasonable assurance that information required to be disclosed in the reports we file or submit under the Securities Exchange Act of 1934, as amended, is recorded, processed, summarized and reported within the time periods specified in the SEC’s rules and forms, and that such information is accumulated and communicated to our management, including our Chief Executive Officer and Chief Financial Officer, as appropriate, to allow timely decisions regarding required disclosure. In designing and evaluating our disclosure controls and procedures, our management recognizes that any controls and procedures, no matter how well designed and operated, can provide only reasonable assurance of achieving the desired control objectives, and our management is required to apply their judgment in evaluating the cost-benefit relationship of possible controls and procedures.
Under the supervision and with the participation of our management, including our Chief Executive Officer and Chief Financial Officer, an evaluation was performed on the effectiveness of the design and operation of our disclosure controls and procedures as of the end of the period covered by this annual report. Based on that evaluation, our management, including our Chief Executive Officer and Chief Financial Officer, concluded that our disclosure controls and procedures were effective at the reasonable assurance level as of March 29, 2015.
Changes in Internal Control Over Financial Reporting
There has been no change in our internal control over financial reporting during our most recent fiscal year that has materially affected, or is reasonably likely to materially affect, our internal controls over financial reporting.
Chief Executive Officer and Chief Financial Officer Certifications
The certifications of our Chief Executive Officer and Chief Financial Officer required under Section 302 of the Sarbanes-Oxley Act have been filed as Exhibits 31.1 and 31.2 to this report.
Management’s Report on Internal Control Over Financial Reporting
Our management is responsible for establishing and maintaining adequate internal control over financial reporting, as this term is defined in Exchange Act Rule 13a-15(f). Our internal control over financial reporting process is designed to provide reasonable assurance regarding the reliability of financial reporting and the preparation of financial statements for external purposes in accordance with generally accepted accounting principles. Our internal control over financial reporting includes those policies and procedures that (1) pertain to the maintenance of records that, in reasonable detail, accurately and fairly reflect the transactions and dispositions of the assets of the Company; (2) provide reasonable assurance that transactions are recorded as necessary to permit preparation of financial statements in accordance with generally accepted accounting principles, and that receipts and expenditures of the Company are being made only in accordance with authorizations of management and directors of the Company; and (3) provide reasonable assurance regarding prevention or timely detection of unauthorized acquisition, use, or disposition of the Company’s assets that could have a material effect on the financial statements. Because of its inherent limitations, internal control over financial reporting may not prevent or detect misstatements. Also, projections of any evaluation of effectiveness to future periods are subject to the risk that controls may become inadequate because of changes in conditions, or that the degree of compliance with the policies or procedures may deteriorate.
Under the supervision and with the participation of our management, including our Chief Executive Officer and Chief Financial Officer, we conducted an evaluation of the effectiveness of our internal control over financial reporting based on the criteria set forth by the Committee of Sponsoring Organizations of the Treadway Commission in Internal Control— Integrated Framework (2013). Based on our assessment using that criteria, our management concluded that, as of March 29, 2015, the Company’s internal control over financial reporting was effective.
During fiscal 2015, PCC acquired two businesses. Management has excluded these businesses from its assessment of internal control over financial reporting as of March 29, 2015 as it was determined that management could not complete an assessment of the internal control over financial reporting of the acquired businesses in the period between the acquisition date and the date of management's assessment date. Total assets and revenues of these acquisitions represent approximately 4.2% and 1.9%, respectively, of the related consolidated financial statement amounts as of and for the fiscal year ended March 29, 2015.
81
Our internal control over financial reporting as of March 29, 2015 has been audited by Deloitte & Touche LLP, an independent registered public accounting firm, as stated in their report which is included herein.
82
REPORT OF INDEPENDENT REGISTERED PUBLIC ACCOUNTING FIRM
To the Board of Directors and Shareholders of Precision Castparts Corp.
Portland, Oregon
We have audited the internal control over financial reporting of Precision Castparts Corp. and subsidiaries (the "Company") as of March 29, 2015, based on criteria established in Internal Control - Integrated Framework (2013) issued by the Committee of Sponsoring Organizations of the Treadway Commission. As described in Management’s Report on Internal Control Over Financial Reporting, management excluded from its assessment the internal control over financial reporting at two businesses, which were acquired during the year ended March 29, 2015, and whose financial statements constitute, in aggregate, 4.2% of total assets and 1.9% of revenues of the consolidated financial statement amounts as of and for the year ended March 29, 2015. Accordingly, our audit did not include the internal control over financial reporting at such businesses. The Company's management is responsible for maintaining effective internal control over financial reporting and for its assessment of the effectiveness of internal control over financial reporting, included in the accompanying Management’s Report on Internal Control over Financial Reporting. Our responsibility is to express an opinion on the Company's internal control over financial reporting based on our audit.
We conducted our audit in accordance with the standards of the Public Company Accounting Oversight Board (United States). Those standards require that we plan and perform the audit to obtain reasonable assurance about whether effective internal control over financial reporting was maintained in all material respects. Our audit included obtaining an understanding of internal control over financial reporting, assessing the risk that a material weakness exists, testing and evaluating the design and operating effectiveness of internal control based on the assessed risk, and performing such other procedures as we considered necessary in the circumstances. We believe that our audit provides a reasonable basis for our opinion.
A company's internal control over financial reporting is a process designed by, or under the supervision of, the company's principal executive and principal financial officers, or persons performing similar functions, and effected by the company's board of directors, management, and other personnel to provide reasonable assurance regarding the reliability of financial reporting and the preparation of financial statements for external purposes in accordance with generally accepted accounting principles. A company's internal control over financial reporting includes those policies and procedures that (1) pertain to the maintenance of records that, in reasonable detail, accurately and fairly reflect the transactions and dispositions of the assets of the company; (2) provide reasonable assurance that transactions are recorded as necessary to permit preparation of financial statements in accordance with generally accepted accounting principles, and that receipts and expenditures of the company are being made only in accordance with authorizations of management and directors of the company; and (3) provide reasonable assurance regarding prevention or timely detection of unauthorized acquisition, use, or disposition of the company's assets that could have a material effect on the financial statements.
Because of the inherent limitations of internal control over financial reporting, including the possibility of collusion or improper management override of controls, material misstatements due to error or fraud may not be prevented or detected on a timely basis. Also, projections of any evaluation of the effectiveness of the internal control over financial reporting to future periods are subject to the risk that the controls may become inadequate because of changes in conditions, or that the degree of compliance with the policies or procedures may deteriorate.
In our opinion, the Company maintained, in all material respects, effective internal control over financial reporting as of March 29, 2015, based on the criteria established in Internal Control - Integrated Framework (2013) issued by the Committee of Sponsoring Organizations of the Treadway Commission.
We have also audited, in accordance with the standards of the Public Company Accounting Oversight Board (United States), the consolidated financial statements as of and for the year ended March 29, 2015 of the Company and our report dated May 28, 2015 expressed an unqualified opinion on those financial statements.
/s/ DELOITTE & TOUCHE LLP
Portland, Oregon
May 28, 2015
83
ITEM 9B. | OTHER INFORMATION |
None.
PART III
ITEM 10. | DIRECTORS, EXECUTIVE OFFICERS AND CORPORATE GOVERNANCE |
Information with respect to Directors of the Company is incorporated herein by reference to “Proposal 1: Election of Directors” continuing through “Board of Directors and Committee Meetings and Board Leadership Structure” and to “Audit Committee” and “Report of the Audit Committee” in our Proxy Statement to be filed for the 2015 Annual Meeting of Shareholders of the Registrant. The information required by this item with respect to our executive officers follows Part I, Item 4(a) of this document.
Information with respect to compliance with Section 16(a) of the Exchange Act is incorporated herein by reference to “Section 16(a) Beneficial Ownership Reporting Compliance” in our Proxy Statement to be filed for the 2015 Annual Meeting of Shareholders of the Registrant.
The Company has adopted a code of ethics that applies to the Registrant’s principal executive officer, principal financial officer, principal accounting officer or controller, or persons performing similar functions. The Company has posted this Code of Conduct on the PCC Corporate Center at www.precast.com/PCC/Governance.html. A copy may also be received free of charge by calling Investor Relations at (503) 946-4700 or sending an email to info@precastcorp.com.
ITEM 11. | EXECUTIVE COMPENSATION |
Information with respect to Executive Compensation is incorporated herein by reference to “Compensation Committee Interlocks and Insider Participation,” “Compensation of Executive Officers,” “Compensation Discussion and Analysis” and “Director Compensation” in the Proxy Statement to be filed for the 2015 Annual Meeting of Shareholders of the Registrant.
ITEM 12. | SECURITY OWNERSHIP OF CERTAIN BENEFICIAL OWNERS AND MANAGEMENT AND RELATED STOCKHOLDER MATTERS |
Information with respect to Security Ownership of Certain Beneficial Owners and Management and Related Stockholder Matters is incorporated herein by reference to “Security Ownership of Certain Beneficial Owners,” “Security Ownership of Directors and Executive Officers” and “Equity Compensation Plan Information” in the Proxy Statement to be filed for the 2015 Annual Meeting of Shareholders of the Registrant.
ITEM 13. | CERTAIN RELATIONSHIPS AND RELATED TRANSACTIONS, AND DIRECTOR INDEPENDENCE |
Information with respect to Certain Relationships and Related Transactions and Director Independence is incorporated herein by reference to “Proposal 1: Election of Directors, Corporate Governance” and continuing through “Director Independence” and to “Transactions with Related Persons” in the Proxy Statement to be filed for the 2015 Annual Meeting of Shareholders of the Registrant.
ITEM 14. | PRINCIPAL ACCOUNTING FEES AND SERVICES |
Information with respect to Principal Accounting Fees and Services is incorporated herein by reference to “Proposal 2: Ratification of Appointment of Independent Registered Public Accounting Firm” in the Proxy Statement to be filed for the 2015 Annual Meeting of Shareholders of the Registrant.
84
PART IV
ITEM 15. | EXHIBITS AND FINANCIAL STATEMENT SCHEDULES |
(a)(1) Financial Statements
The following consolidated financial statements of Precision Castparts Corp. are included in Item 8. Financial Statements and Supplementary Data.
Consolidated Statements of Income
Consolidated Statements of Comprehensive Income
Consolidated Balance Sheets
Consolidated Statements of Cash Flows
Consolidated Statements of Equity
Notes to Consolidated Financial Statements
Report of Independent Registered Public Accounting Firm
(a)(2) Financial Statement Schedules
None.
(a)(3) Exhibits
3.1 | Restated Articles of Incorporation of Precision Castparts Corp. (Incorporated herein by reference to Exhibit 3.1 to the Form 10-K filed May 29, 2014.) |
3.2 | Bylaws of Precision Castparts Corp. (Incorporated herein by reference to Exhibit 3.2 to the Form 8-K filed February 18, 2011.) |
4.1 | Indenture dated December 17, 1997 between J.P. Morgan Trust Company, National Association (as successor to Bank One Trust Company, N.A., which was the successor to The First National Bank of Chicago) as Trustee and PCC (Incorporated herein by reference to Exhibit (4)A to the Form 10-K filed June 26, 1998.) |
4.2 | Rights Agreement, dated as of December 12, 2008, between Precision Castparts Corp. and the Bank of New York Mellon (Incorporated herein by reference to Exhibit 4.1 to the Form 8-K filed December 16, 2008.) |
4.3 | Twenty-Sixth Supplemental Indenture dated December 20, 2012 between Precision Castparts Corp. and U.S. Bank National Association (including forms of Notes) (Incorporated herein by reference to Exhibit 4.1 to the Form 8-K filed December 20, 2012.) |
10.1 | Credit Agreement, dated December 16, 2013, by and among Precision Castparts Corp., Bank of America, N.A., as Administrative Agent, Citibank, N.A. and Wells Fargo Bank, National Association, as Syndication Agents, Mizuho Bank (USA), PNC Bank, National Association, The Bank of Tokyo-Mitsubishi UFJ, Ltd., and U.S. Bank National Association, as Co-Documentation Agents, Merrill Lynch, Pierce, Fenner & Smith Incorporated, Citigroup Global Markets Inc., and Wells Fargo Securities, LLC, as Joint Lead Arrangers and Joint Book Managers, and other lenders from time to time party thereto (Incorporated herein by reference to Exhibit 10.1 to the Form 8-K filed December 18, 2013.) |
10.2 | Credit Agreement, dated December 15, 2014, by and among Precision Castparts Corp., Bank of America, N.A., as Administrative Agent, Citibank, N.A. and Wells Fargo Bank, National Association, as Syndication Agents, Mizuho Bank, Ltd., PNC Bank, National Association, The Bank of Tokyo-Mitsubishi UFJ, Ltd., and U.S. Bank National Association, as Co-Documentation Agents, Merrill Lynch, Pierce, Fenner & Smith Incorporated, Citigroup Global Markets Inc., and Wells Fargo Securities, LLC, as Joint Lead Arrangers and Joint Book Managers, and other lenders from time to time party thereto (Incorporated herein by reference to Exhibit 10.1 to the Form 8-K filed December 17, 2014.) |
10.3 | Amendment No. 1 to Credit Agreement, dated April 1, 2015 among Precision Castparts Corp., Bank of America, N.A., and the financial institutions party thereto, to that certain Credit Agreement, dated December 16, 2013. |
10.4 | Amendment No. 1 to Credit Agreement, dated April 1, 2015 among Precision Castparts Corp., Bank of America, N.A., and the financial institutions party thereto, to that certain Credit Agreement, dated December 15, 2014. |
10.5 | 1994 Stock Incentive Plan, as amended (Incorporated herein by reference to Exhibit 10.2 to the Form 8-K filed November 19, 2007.)* |
10.6 | 1999 Non-Qualified Stock Option Plan, as amended (Incorporated herein by reference to Exhibit 10.3 to the Form 8-K filed November 19, 2007.)* |
85
10.7 | 2001 Stock Incentive Plan, as amended (Incorporated herein by reference to Exhibit 10.1 to the Form 8-K filed August 15, 2013.)* |
10.8 | 2008 Employee Stock Purchase Plan (Incorporated herein by reference to Exhibit 10.1 to the Form 10-Q filed February 5, 2010)* |
10.9 | Non-Employee Directors Deferred Stock Units Program (Incorporated herein by reference to Exhibit 10.8 to the Form 10-K filed May 29, 2014.)* |
10.10 | Form of Nonstatutory Stock Option Agreement for SERP Level One and Level Two Participants (Incorporated herein by reference to Exhibit 10.1 to the Form 8-K filed August 14, 2009.)* |
10.11 | Form of Deferred Stock Units Award Agreement (Incorporated herein by reference to Exhibit 10.12 to the Form 10-K filed May 27, 2010)* |
10.12 | Executive Performance Incentive Plan (Incorporated herein by reference to Exhibit 10.1 to the Form 10-Q filed November 9, 2012.)* |
10.13 | Incentive Compensation Program for Human Capital Planning Performance (Incorporated herein by reference to Exhibit 10.15 to the Form 10-K filed May 28, 2009.)* |
10.14 | Executive Deferred Compensation Plan, 2005 Restatement, as amended through Amendment No. 5 (Incorporated herein by reference to Exhibit 10.13 to the Form 10-K filed May 29, 2014.)* |
10.15 | Nonemployee Directors’ Deferred Compensation Plan, 2005 Restatement, as amended through Amendment No. 5(Incorporated herein by reference to Exhibit 10.14 to the Form 10-K filed May 29, 2014.)* |
10.16 | Frozen Supplemental Executive Retirement Program, December 31, 2004 Restatement (Incorporated herein by reference to Exhibit 10.2 to the Form 8-K filed December 19, 2006.)* |
10.17 | Supplemental Executive Retirement Program—Level One Plan—Ongoing, as amended through Amendment No. 3(Incorporated herein by reference to Exhibit 10.16 to the Form 10-K filed May 29, 2014.)* |
10.18 | Supplemental Executive Retirement Program—Level Two Plan—Ongoing, as amended through Amendment No. 3(Incorporated herein by reference to Exhibit 10.17 to the Form 10-K filed May 29, 2014.)* |
10.19 | Form of Amended and Restated Change of Control Agreement for Executives of Precision Castparts Corp. (Incorporated herein by reference to Exhibit 10.20 to the Form 10-K filed June 2, 2011.)* |
10.20 | Form of Indemnity Agreement for Executives of Precision Castparts Corp. (Incorporated herein by reference to Exhibit (10)M to the Form 10-K filed June 12, 2001.)* |
10.21 | Amended and Restated Time Sharing Agreement, dated May 27, 2014, between Precision Castparts Corp. and Mark Donegan (Incorporated herein by reference to Exhibit 10.20 to the Form 10-K filed May 29, 2014.)* |
12.1 | Computation of Ratio of Earnings to Fixed Charges |
21 | Subsidiaries of Precision Castparts Corp. |
23.1 | Consent of Independent Registered Public Accounting Firm, Deloitte & Touche LLP |
31.1 | Certification of Chief Executive Officer pursuant to Section 302 of the Sarbanes-Oxley Act of 2002 |
31.2 | Certification of Chief Financial Officer pursuant to Section 302 of the Sarbanes-Oxley Act of 2002 |
32.1 | Certification of Chief Executive Officer pursuant to Section 906 of the Sarbanes-Oxley Act of 2002 |
32.2 | Certification of Chief Financial Officer pursuant to Section 906 of the Sarbanes-Oxley Act of 2002 |
101.INS | XBRL Instance Document. |
101.SCH | XBRL Taxonomy Extension Schema Document. |
101.CAL | XBRL Taxonomy Extension Calculation Linkbase Document. |
101.DEF | XBRL Taxonomy Extension Definition Linkbase Document. |
101.LAB | XBRL Taxonomy Extension Label Linkbase Document. |
101.PRE | XBRL Taxonomy Extension Presentation Linkbase Document. |
* | Management contract or compensatory plan or arrangement. |
86
(b) See a(3) above.
(c) See a(2) above.
SIGNATURES
Pursuant to the requirements of Section 13 or 15(d) of the Securities Exchange Act of 1934, the Registrant has duly caused this report to be signed on its behalf by the undersigned, thereunto duly authorized.
PRECISION CASTPARTS CORP. | ||
BY: | /S/ MARK DONEGAN | |
Mark Donegan Chairman and Chief Executive Officer | ||
Dated: May 28, 2015
Pursuant to the requirements of the Securities Exchange Act of 1934, this report has been signed below by the following persons on behalf of the Registrant and in the capacities and on the dates indicated.
Signature | Title | Date | ||
As officers or directors of PRECISION CASTPARTS CORP. | ||||
/S/ MARK DONEGAN | Chairman and Chief Executive Officer | May 28, 2015 | ||
Mark Donegan | ||||
/S/ SHAWN R. HAGEL | Executive Vice President and Chief Financial Officer (Principal Financial and Accounting Officer) | May 28, 2015 | ||
Shawn R. Hagel | ||||
/S/ DON R. GRABER | Director | May 28, 2015 | ||
Don R. Graber | ||||
/S/ LESTER L. LYLES | Director | May 28, 2015 | ||
Lester L. Lyles | ||||
/S/ DANIEL J. MURPHY | Director | May 28, 2015 | ||
Daniel J. Murphy | ||||
/S/ VERNON E. OECHSLE | Director | May 28, 2015 | ||
Vernon E. Oechsle | ||||
/S/ ULRICH SCHMIDT | Director | May 28, 2015 | ||
Ulrich Schmidt | ||||
/S/ RICHARD L. WAMBOLD | Director | May 28, 2015 | ||
Richard L. Wambold | ||||
/S/ TIMOTHY A. WICKS | Director | May 28, 2015 | ||
Timothy A. Wicks | ||||
87