Attached files
| file | filename |
|---|---|
| EXCEL - IDEA: XBRL DOCUMENT - MAGNACHIP SEMICONDUCTOR Corp | Financial_Report.xls |
| EX-31.1 - EX-31.1 - MAGNACHIP SEMICONDUCTOR Corp | d834273dex311.htm |
| EX-10.29.1 - EX-10.29-1 - MAGNACHIP SEMICONDUCTOR Corp | d834273dex10291.htm |
| EX-31.2 - EX-31.2 - MAGNACHIP SEMICONDUCTOR Corp | d834273dex312.htm |
| EX-32.1 - EX-32.1 - MAGNACHIP SEMICONDUCTOR Corp | d834273dex321.htm |
| EX-12.1 - EX-12.1 - MAGNACHIP SEMICONDUCTOR Corp | d834273dex121.htm |
| EX-23.1 - EX-23.1 - MAGNACHIP SEMICONDUCTOR Corp | d834273dex231.htm |
| EX-32.2 - EX-32.2 - MAGNACHIP SEMICONDUCTOR Corp | d834273dex322.htm |
| EX-10.28.1 - EX-10.28-1 - MAGNACHIP SEMICONDUCTOR Corp | d834273dex10281.htm |
Table of Contents
Index to Financial Statements
UNITED STATES
SECURITIES AND EXCHANGE COMMISSION
WASHINGTON, D.C. 20549
FORM 10-K
(Mark One)
| x | ANNUAL REPORT PURSUANT TO SECTION 13 OR 15(d) OF THE SECURITIES EXCHANGE ACT OF 1934 |
For the fiscal year ended December 31, 2014
or
| ¨ | TRANSITION REPORT PURSUANT TO SECTION 13 OR 15(d) OF THE SECURITIES EXCHANGE ACT OF 1934 |
For the transition period from to
Commission File Number 001-34791

MagnaChip Semiconductor Corporation
(Exact name of registrant as specified in its charter)
| Delaware | 83-0406195 | |
| (State or Other Jurisdiction of Incorporation or Organization) |
(I.R.S. Employer Identification No.) |
c/o MagnaChip Semiconductor S.A.
1, Allée Scheffer, L-2520
Luxembourg, Grand Duchy of Luxembourg
(Address of principal executive offices) (Zip Code)
Registrant’s telephone number, including area code: (352) 45-62-62
Securities registered pursuant to Section 12(b) of the Act:
| Title of each class |
Name of each exchange on which registered | |
| Common Stock, par value $0.01 per share Preferred Stock Purchase Rights |
New York Stock Exchange New York Stock Exchange |
Securities registered pursuant to Section 12(g) of the Act: None
Indicate by check mark if the registrant is a well-known seasoned issuer, as defined in Rule 405 of the Securities Act. ¨ Yes x No
Indicate by check mark if the registrant is not required to file reports pursuant to Section 13 or Section 15(d) of the Act. ¨ Yes x No
Indicate by check mark whether the registrant (1) has filed all reports required to be filed by Section 13 or 15(d) of the Securities Exchange Act of 1934 during the preceding 12 months (or for such shorter period that the registrant was required to file such reports), and (2) has been subject to such filing requirements for the past 90 days. ¨ Yes x No
Indicate by check mark whether the registrant has submitted electronically and posted on its corporate Website, if any, every Interactive Data File required to be submitted and posted pursuant to Rule 405 of Regulation S-T (§232.405 of this chapter) during the preceding 12 months (or for such shorter period that the registrant was required to submit and post such files. ¨ Yes x No
Indicate by check mark if disclosure of delinquent filers pursuant to Item 405 of Regulation S-K (§229.405 of this chapter) is not contained herein, and will not be contained, to the best of registrant’s knowledge, in definitive proxy or information statements incorporated by reference in Part III of this Form 10-K or any amendment to this Form 10-K. x
Indicate by check mark whether the registrant is a large accelerated filer, an accelerated filer, a non-accelerated filer or a smaller reporting company. See the definitions of “large accelerated filer,” “accelerated filer” and “smaller reporting company” in Rule 12b-2 of the Exchange Act.
| Large Accelerated Filer | ¨ | Accelerated Filer | x | |||
| Non-Accelerated Filer | ¨ (Do not check if a smaller reporting company) | Smaller Reporting Company | ¨ |
Indicate by check mark whether the registrant is a shell company (as defined in Rule 12b-2 of the Act). ¨ Yes x No
State the aggregate market value of the voting and non-voting common equity held by non-affiliates computed by reference to the price at which the common equity was last sold, or the average bid and asked price of such common equity, as of the last business day of the registrant’s most recently completed second fiscal quarter. $419,416,273
As of May 1, 2015, the registrant had 34,056,468 shares of common stock outstanding.
Table of Contents
Index to Financial Statements
MAGNACHIP SEMICONDUCTOR CORPORATION AND SUBSIDIARIES
FORM 10-K FOR THE YEAR ENDED DECEMBER 31, 2014
TABLE OF CONTENTS
| Page | ||||||||
| PART I |
||||||||
| Item 1. | 2 | |||||||
| Item 1A. | 16 | |||||||
| Item 1B. | 34 | |||||||
| Item 2. | 34 | |||||||
| Item 3. | 34 | |||||||
| Item 4. | 36 | |||||||
| PART II |
||||||||
| Item 5. | 37 | |||||||
| Item 6. | 40 | |||||||
| Item 7. | Management’s Discussion and Analysis of Financial Condition and Results of Operations |
42 | ||||||
| Item 7A. | 62 | |||||||
| Item 8. | 63 | |||||||
| Item 9. | Changes in and Disagreements with Accountants on Accounting and Financial Disclosure |
103 | ||||||
| Item 9A. | 103 | |||||||
| Item 9B. | 105 | |||||||
| PART III |
||||||||
| Item 10. | 106 | |||||||
| Item 11. | 110 | |||||||
| Item 12. | Security Ownership of Certain Beneficial Owners and Management and Related Stockholder Matters |
127 | ||||||
| Item 13. | Certain Relationships and Related Transactions, and Director Independence |
132 | ||||||
| Item 14. | 133 | |||||||
| PART IV |
||||||||
| Item 15. | 134 | |||||||
| 139 | ||||||||
| A-1 | ||||||||
Table of Contents
Index to Financial Statements
PART I
INDUSTRY AND MARKET DATA
We have made statements in this Annual Report on Form 10-K for the year ended December 31, 2014 (this “2014 Form 10-K” or this “Report”) regarding our industry and our position in the industry based on our experience in the industry and our own views of market conditions, but we have not independently verified those statements. We do not have any obligation to announce or otherwise make publicly available updates or revisions to forecasts contained in these documents.
Statements made in this Report, unless the context otherwise requires, include the use of the terms “us,” “we,” “our,” the “Company” and “MagnaChip” to refer to MagnaChip Semiconductor Corporation and its consolidated subsidiaries. The term “Korea” refers to the Republic of Korea or South Korea.
SPECIAL NOTE REGARDING FORWARD-LOOKING STATEMENTS
We have made certain “forward-looking” statements in this Report within the meaning of Section 21E of the Securities Exchange Act of 1934, as amended (the “Exchange Act”), and Section 27A of the Securities Act of 1933, as amended (the “Securities Act”), that involve risks and uncertainties. Forward-looking statements give our current expectations and projections relating to our financial condition, results of operations, plans, objectives, future performance and business. You can identify these statements by the fact that they do not relate strictly to historical or current facts. These statements may include words such as “anticipate,” “estimate,” “expect,” “project,” “intend,” “plan,” “believe” and other words and terms of similar meaning in connection with any discussion of the timing or nature of future operating or financial performance or other events. All statements other than statements of historical facts included in this Report that address activities, events or developments that we expect, believe or anticipate will or may occur in the future are forward-looking statements.
These forward-looking statements are largely based on our expectations and beliefs concerning future events, which reflect estimates and assumptions made by our management. These estimates and assumptions reflect our best judgment based on currently known market conditions and other factors relating to our operations and business environment, all of which are difficult to predict and many of which are beyond our control. Although we believe our estimates and assumptions to be reasonable, they are inherently uncertain and involve a number of risks and uncertainties that are beyond our control. In addition, management’s assumptions about future events may prove to be inaccurate. Management cautions all readers that the forward-looking statements contained in this Report are not guarantees of future performance, and we cannot assure any reader that those statements will be realized or the forward-looking events and circumstances will occur. Actual results may differ materially from those anticipated or implied in the forward-looking statements due to the factors listed in the “Risk Factors,” “Management’s Discussion and Analysis of Financial Condition and Results of Operations” and “Business” sections and elsewhere in this Report.
All forward-looking statements speak only as of the date of this Report. We do not intend to publicly update or revise any forward-looking statements as a result of new information or future events or otherwise, except as required by law. These cautionary statements qualify all forward-looking statements attributable to us or persons acting on our behalf.
“MagnaChip” is a registered trademark of us and our subsidiaries and “MagnaChip Everywhere” is our registered trademark and service mark. All other product, service and company names mentioned in this Report are the service marks or trademarks of their respective owners.
1
Table of Contents
Index to Financial Statements
General
We are a Korea-based designer and manufacturer of analog and mixed-signal semiconductor products for consumer, computing, communication, industrial, automotive and Internet of Things (“IoT”) applications. We provide technology platforms for analog, mixed-signal, power, high voltage, non-volatile memory, and RF applications. We have a proven record of 30-year operating history, large portfolio of approximately 2,917 registered novel patents and 141 pending novel patent applications and extensive engineering and manufacturing process expertise. Our business is comprised of three key business lines: Display Solutions, Power Solutions and Semiconductor Manufacturing Services. Our Display Solution products provide flat panel display solutions to major suppliers of large and small flat panel display. Our Power Solutions products include discrete, high-power modules and integrated circuit solutions for power management in consumer, computing, communication and industrial applications. Our Semiconductor Manufacturing Services provide specialty analog and mixed-signal foundry services mainly for fabless and certain Integrated Device Manufacturer (“IDM”) semiconductor companies that serve the consumer, computing, communication, industrial, automotive and IoT applications.
Our wide variety of analog and mixed-signal semiconductor products and manufacturing services combined with our matured technology platform allow us to address multiple high-growth end markets and to rapidly develop and introduce new products and services in response to market demands. Our design center and substantial manufacturing operations in Korea place us at the core of the global electronics device supply chain. We believe this enables us to quickly and efficiently respond to our customers’ needs and allows us to better serve and capture additional demand from existing and new customers.
We have a long history of supplying and collaborating on product and technology development with leading innovators in the consumer electronics market. As a result, we have been able to strengthen our technology platform and develop products and services that are in high demand by our customers and end consumers. We sold over 2,000 distinct products in each of the years ended December 31, 2014 and December 31, 2013, with a substantial portion of our revenues derived from a concentrated number of customers. Our largest Semiconductor Manufacturing Services customers include some of the leading semiconductor companies that design analog and mixed-signal products for the consumer, computing, communication, industrial, automotive and IoT applications.
Our business is largely driven by innovation in the consumer electronics markets and the growing adoption by consumers worldwide of electronic devices for use in their daily lives. The consumer electronics market is large and growing rapidly, largely due to consumers increasingly accessing a wide variety of rich media content, such as high definition audio and video, mobile television and games on advanced consumer electronic devices. Electronics manufacturers are continuously implementing advanced technologies in new generations of electronic devices using analog and mixed-signal semiconductor components, such as display drivers that enable display of high resolution images, encoding and decoding devices that allow playback of high definition audio and video, and power management semiconductors that increase power efficiency, thereby improving heat dissipation and extending battery life.
For the year ended December 31, 2014, we generated net sales of $698.2 million, net loss of $117.2 million, Adjusted EBITDA of $9.6 million and Adjusted Net Loss of $36.9 million. See “Item 6. Selected Financial Data” and “Item 7. Management’s Discussion and Analysis of Financial Condition and Results of Operations” elsewhere in this Report for an explanation of our use of Adjusted EBITDA and Adjusted Net Income and a reconciliation to net income (loss) prepared in accordance with United States generally accepted accounting principles (“US GAAP”).
2
Table of Contents
Index to Financial Statements
Our History
Our business was named “MagnaChip Semiconductor” when it was acquired from SK Hynix Inc., formerly known as Hynix Semiconductor, Inc. (“SK Hynix”), in October 2004. We refer to this acquisition as the “Original Acquisition.”
On March 10, 2011, we completed our initial public offering, which we refer to as the “MagnaChip IPO.” Prior to the MagnaChip IPO, MagnaChip Semiconductor LLC, a Delaware limited liability company, was converted to MagnaChip Semiconductor Corporation, a Delaware corporation. In order to consummate such a conversion, a certificate of conversion was filed with the Secretary of State of the State of Delaware prior to the effectiveness of the MagnaChip IPO registration statement. In connection with the corporate conversion, outstanding common units of MagnaChip Semiconductor LLC were automatically converted into shares of common stock of MagnaChip Semiconductor Corporation, outstanding options to purchase common units of MagnaChip Semiconductor LLC were automatically converted into options to purchase shares of common stock of MagnaChip Semiconductor Corporation and outstanding warrants to purchase common units of MagnaChip Semiconductor LLC were automatically converted into warrants to purchase shares of common stock of MagnaChip Semiconductor Corporation, all at a ratio of one share of common stock for eight common units. We refer to such transactions as the “corporate conversion.”
Avenue Capital Management II, L.P., or Avenue Capital Management, is a global investment management firm, and it and its affiliated funds specialize in investing in high yield debt, debt of insolvent or financially distressed companies and equity of companies undergoing financial or operational turnarounds or reorganizations. In this Report, we refer to funds affiliated with Avenue Capital Management collectively as “Avenue.” Avenue was a holder of a significant portion of our indebtedness which was outstanding prior to our 2009 reorganization proceedings under Chapter 11 of the United States Bankruptcy Code, which we refer to as our “reorganization proceedings.” In connection with our emergence from our reorganization proceedings, Avenue became our majority unitholder as a result of its participation in our rights offering in our reorganization proceedings.
As of May 1, 2015, Avenue beneficially owned 4,088,978 shares, or approximately 12.0%, of our outstanding common stock. On November 9, 2014, all warrants to purchase our common stock previously held by Avenue expired.
Our Products and Services
Our Display Solutions line of products provide flat panel display solutions to all major suppliers of large and small flat panel displays, and include MagnaChip sensor products for mobile applications and industrial applications. These products include source and gate drivers and timing controllers that cover a wide range of flat panel displays used in ultra high definition (UHD), high definition (HD), full high definition (FHD), light emitting diode (LED), 3D and organic light emitting diodes (OLED) televisions and displays, notebooks and mobile communications and entertainment devices. Our Display Solutions line of products support the industry’s most advanced display technologies, such as active matrix organic light emitting diodes (AMOLEDs), and low temperature polysilicons thin film transistor (LTPS TFT), as well as high-volume display technologies such as thin film transistors (a-Si TFTs). MagnaChip provides a range of intelligent sensor product families featuring 0.18 micron analog and mixed-signal technology with low power consumption. The MagnaChip sensor families target the growing market for applications ranging from smartphone, tablet PC and other consumer electronics to industrial devices. The MagnaChip sensor families include e-Compass and digital hall sensors. Our Display Solutions products represented 28.6%, 27.6% and 35.4% of our net sales for the fiscal years ended December 31, 2014, 2013 and 2012, respectively.
We expanded our business and market opportunity by establishing our Power Solutions product line in late 2007. We have introduced a number of products for power management applications, including metal oxide semiconductor field effect transistors (MOSFETs), insulated gate bipolar mode transistor (IGBTs), power modules, AC-DC converters, DC-DC converters, LED driver, switching regulators and linear regulators for a range of devices, including liquid crystal display (LCD), LED, 3D televisions, smartphones, mobile phones, desktop PCs, notebooks, tablet PCs, other consumer electronics, consumer appliance and industrial applications such as power suppliers, LED lighting and motor control. Our Power Solutions products represented 19.7%, 18.4% and 15.5% of our net sales for the fiscal years ended December 31, 2014, 2013 and 2012, respectively.
We also offer semiconductor manufacturing services to fabless analog and mixed-signal semiconductor companies and IDMs that require differentiated, specialty analog and mixed-signal process technologies. Our process technologies are optimized for analog and mixed-signal devices and include standard complementary metal-oxide semiconductor (CMOS), high voltage CMOS, ultra-low leakage high voltage CMOS and bipolar complementary double-diffused metal oxide semiconductor (BCDMOS) and electronically erasable programmable read only memory (EEPROM). Our Semiconductor Manufacturing Services customers use us to manufacture a wide range of products, including display drivers, LED drivers, audio encoding and decoding devices, microcontrollers, touch screen controllers, RF switches, park distance control sensors for automotive, electronic tag memories and power management semiconductors. Our Semiconductor Manufacturing Services business represented 51.6%, 53.9% and 49.0% of our net sales for the fiscal years ended December 31, 2014, 2013 and 2012, respectively.
We manufacture the majority of our products at our three fabrication facilities located in Korea. We have approximately 459 proprietary process flows we can utilize for our products and offer to our Semiconductor Manufacturing Services customers. Our
3
Table of Contents
Index to Financial Statements
manufacturing base serves both our display driver and power management businesses and Semiconductor Manufacturing Services customers, allowing us to optimize our asset utilization and leverage our investments across our product and service offerings. Analog and mixed-signal manufacturing facilities and processes are typically distinguished by design and process implementation expertise rather than the use of the most advanced equipment. These processes also tend to migrate more slowly to smaller geometries due to technological barriers and increased costs. For example, some of our products use high-voltage technology that requires larger geometries and that may not migrate to smaller geometries for several years, if at all. As a result, our manufacturing base and strategy do not require substantial investment in leading edge process equipment, allowing us to utilize our facilities and equipment over an extended period of time with moderate required capital investments.
On December 4, 2014, our Board of Directors approved a plan to close the Company’s six-inch fabrication facility in Cheongju, Korea (the “6-inch fab”). This plan is expected to be substantially implemented and the 6-inch fab is expected to be closed by the end of fiscal year 2015. The Company currently plans to transfer certain 6-inch fab employees to the Company’s other facilities.
Market Opportunity
The semiconductor market is large and is expanding its applications. Growth in this market is being driven by consumers seeking to enjoy a wide variety of rich media content, such as high definition audio and video, mobile television and games. Electronics device manufacturers recognize that the consumer entertainment experience plays a critical role in differentiating their products. To address and further stimulate consumer demand, electronics manufacturers have been driving rapid advances in the technology, functionality, form factor, cost, quality, reliability and power consumption of their products. Electronics manufacturers are continuously implementing advanced technologies in new generations of electronic devices using analog and mixed-signal semiconductor components, such as display drivers that enable display of high resolution images, encoding and decoding devices that allow playback of high definition audio and video, and power management semiconductors that increase power efficiency, thereby improving heat dissipation and extending battery life. These advanced generations of consumer devices are growing faster than the overall electronics device market.
The user experience delivered by a consumer electronic device is substantially driven by the quality of the display, audio and video processing capabilities and power efficiency of the device. Analog and mixed-signal semiconductors enable and enhance these capabilities. Examples of these analog and mixed-signal semiconductors include display drivers, timing controllers, audio encoding and decoding devices, or codecs, and interface circuits, as well as power management semiconductors such as voltage regulators, converters and switches.
Requirements of Leading Electronic Devices Manufacturers
We believe our target customers view the following characteristics and capabilities as key differentiating factors among available analog and mixed-signal semiconductor suppliers and manufacturing service providers:
| • | Broad Offering of Differentiated Products with Advanced System-Level Features and Functions. Leading electronic devices manufacturers seek to differentiate their products by incorporating innovative semiconductor products that enable unique system-level functionality and enhance performance. These consumer electronics manufacturers seek to closely collaborate with semiconductor solutions providers that continuously develop new and advanced products, technologies, and manufacturing processes that enable state of the art features and functions, such as bright and thin displays, small form factor and energy efficiency. |
| • | Fast Time-to-Market with New Products. As a result of rapid technological advancements and short product lifecycles, our target customers typically prefer suppliers who have a compelling pipeline of new products and can leverage a substantial intellectual property and technology base to accelerate product design and manufacturing when needed. |
| • | Nimble, Stable and Reliable Manufacturing Services. Fabless semiconductor providers who rely on external manufacturing services often face rapidly changing product cycles. If these fabless companies are unable to meet the demand for their products due to issues with their manufacturing services providers, their profitability and market share can be significantly impacted. As a result, they prefer semiconductor manufacturing service providers that can increase production quickly and meet demand consistently through periods of constrained industry capacity. Furthermore, many fabless semiconductor providers serving the consumer electronics and industrial sectors need specialized analog and mixed-signal manufacturing capabilities to address their product performance and cost requirements. |
| • | Ability to Deliver Cost Competitive Solutions. Electronics manufacturers are under constant pressure to deliver cost-competitive solutions. To accomplish this objective, they need strategic semiconductor suppliers that have the ability to provide system-level solutions, highly integrated products and a broad product offering at a range of price points and have the design and manufacturing infrastructure and logistical support to deliver cost competitive products. |
| • | Focus on Delivering Highly Energy-Efficient Products. Consumers increasingly seek longer run-time, environmentally friendly and energy-efficient consumer electronic products. In addition, there is increasing regulatory focus on reducing energy consumption of consumer electronic products. As a result of global focus on more environmentally friendly products, our customers are seeking analog and mixed-signal semiconductor suppliers that have the technological expertise to deliver solutions that satisfy these ever increasing regulatory and consumer power efficiency demands. |
4
Table of Contents
Index to Financial Statements
Our Competitive Strengths
Designing and manufacturing analog and mixed-signal semiconductors capable of meeting the evolving functionality requirements for electronics devices is challenging. In order to grow and succeed in the industry, we believe semiconductor suppliers must have a broad, advanced intellectual property portfolio, product design expertise, comprehensive product offerings and specialized manufacturing process technologies and capabilities. Our competitive strengths enable us to offer our customers solutions to solve their key challenges. We believe our strengths include:
| • | Advanced Analog and Mixed-Signal Semiconductor Technology and Intellectual Property Platform. We believe we have one of the broadest and deepest analog and mixed-signal semiconductor technology platforms in the industry. Our long operating history, large patent portfolio, extensive engineering and manufacturing process expertise and wide selection of analog and mixed-signal intellectual property libraries allow us to leverage our technology and develop new products across multiple end markets. Our product development efforts are supported by a team of approximately 471 engineers. Our platform allows us to develop and introduce new products quickly as well as to integrate numerous functions into a single product. For example, we were one of the first companies to introduce a commercial AMOLED display driver for mobile phones. |
| • | Established Relationships and Close Collaboration with Leading Global Electronics Companies. We have a long history of supplying and collaborating on product and technology development with leading innovators in the consumer electronics market. Our close customer relationships have been built based on many years of close collaborative product development which provides us with deep system level knowledge and key insights into our customers’ needs. As a result, we are able to continuously strengthen our technology platform in areas of strategic interest for our customers and focus on those products and services that our customers and end consumers demand the most. |
| • | Longstanding Presence in Asia and Proximity to Global Electronics Devices Supply Chain. Our presence in Asia facilitates close contact with our customers and fast response to their needs, and enhances our visibility into new product opportunities, markets and technology trends. Our design center and substantial manufacturing operations in Korea place us close to many of our largest customers and to the core of the global electronics devices supply chain. We have active applications, engineering, product design and customer support resources, as well as senior management and marketing resources, in geographic locations close to our customers. This allows us to strengthen our relationship with customers through better service, faster turnaround time and improved product design collaboration. We believe this also helps our customers to deliver products faster than their competitors and to solve problems more efficiently than would be possible with other suppliers. |
| • | Broad Portfolio of Product and Service Offerings Targeting Large, High-Growth Markets. We continue to develop a wide variety of analog and mixed-signal semiconductor solutions for multiple high-growth electronics device end markets. We believe our expanding product and service offerings allow us to provide additional products to new and existing customers and to cross-sell our products and services to our established customers. For example, we have leveraged our technology expertise and customer relationships to develop and grow power management solutions to customers. Our power management solutions enable our customers to increase system stability and improve heat dissipation and energy use, resulting in cost savings for our customers, as well as environmental benefits. We have been able to sell these new products to our existing customers as well as expand our customer base. |
| • | Distinctive Analog and Mixed-Signal Process Technology Expertise and Manufacturing Capabilities. We have developed specialty analog and mixed-signal manufacturing processes such as high voltage CMOS, power and embedded memory. These processes enable us to flexibly ramp mass production of display, power and mixed-signal products, and shorten the duration from design to delivery of highly integrated, high-performance analog and mixed-signal semiconductors. |
| • | Highly Efficient Manufacturing Capabilities. Our manufacturing strategy is focused on optimizing our asset utilization across our display driver and power management products as well as our semiconductor manufacturing services, which enables us to maintain the price competitiveness of our products and services through our low-cost operating structure and improve our operational efficiency. We believe the location of our primary manufacturing and research and development facilities in Asia and the relatively low need for ongoing capital expenditures provide us with a number of cost advantages. We offer specialty analog process technologies that do not require substantial investment in leading edge, smaller geometry process equipment. We are able to utilize our manufacturing base over an extended period of time and thereby minimize our capital expenditure requirements. |
Our Strategy
Our objective is to grow our business, our cash flow and profitability and to establish our position as a leading provider of analog and mixed-signal semiconductor products and services for high-volume markets. Our business strategy emphasizes the following key elements:
| • | Leverage Our Advanced Analog and Mixed-Signal Technology Platform to Innovate and Deliver New Products and Services. We intend to continue to utilize our extensive patent and technology portfolio, analog and mixed-signal design and |
5
Table of Contents
Index to Financial Statements
| manufacturing expertise and specific end-market applications and system-level design expertise to deliver products with high levels of performance by utilizing our systems expertise and leveraging our deep knowledge of our customers’ needs. For example, in Power Solutions, we have utilized our extensive patent portfolio, process technologies and analog and mixed-signal technology platform to develop low power consumption solutions for AC-DC offline switches to address more of our customers’ needs. In Display Solutions, we continue to invest in research and development to introduce new technologies to support our customers’ technology roadmaps. In Semiconductor Manufacturing Services, we are developing cost-effective processes that substantially reduce die size using deep trench isolation. |
| • | Increase Business with Existing Customers. We have a global customer base consisting of leading consumer electronics OEMs that sell into multiple end markets. We intend to continue to strengthen our relationships with our customers by collaborating on critical design and product development in order to improve our design-win rates. We seek to increase our customer penetration by more closely aligning our product roadmap with those of our key customers and take advantage of our broad product portfolio, our deep knowledge of customer needs and existing relationships to sell more existing and new products. For example, two of our largest display driver customers have display modules in production using our power management products. These power management products have been purchased and evaluated via their key subcontractors for LCD backlight units and LCD integrated power supplies. |
| • | Broaden Our Customer Base. We expect to continue to expand our global design centers, local application engineering support and sales presence, particularly in China, Hong Kong, Taiwan and Macau, or collectively, Greater China, and other high-growth geographies, to penetrate new accounts. In addition, we intend to introduce new products and variations of existing products to address a broader customer base. In order to broaden our market penetration, we are complementing our direct customer relationships and sales with an improved base of distributors, especially to aid the growth of our power management business. We expect to continue to strengthen our distribution channels as we broaden our power management penetration beyond existing customers. |
| • | Aggressively Grow the Power Business. We have utilized our extensive patent portfolio, process technologies, captive manufacturing facilities and analog and mixed-signal technology platform to develop power management solutions that expand our market opportunity and address more of our customers’ needs. We intend to increase the pace of our new power product introductions by continuing to collaborate closely with our industry-leading customers. We also intend to capitalize on the market needs and regulatory requirements for power management products that reduce energy consumption of consumer electronic products by introducing products that are more energy efficient than those of competitors. We believe our integrated designs, low-cost process technologies and deep customer relationships will enable us to increase sales of our power solutions to our current Power Solutions customers, and as an extension of our other product offerings, to our other customers. |
| • | Drive Execution Excellence. We intend to improve our execution through a number of management initiatives, new processes for product development, customer service and personnel development. We expect these ongoing initiatives will contribute to improvement of our new product development and customer service as well as enhance our commitment to a culture of quick action and execution by our workforce. In addition, we have focused on improving our manufacturing efficiency during the past several years. |
| • | Optimize Asset Utilization, Return on Capital Investments and Cash Flow Generation. We intend to keep our capital expenditures relatively low by maintaining our focus on specialty process technologies that do not require substantial investment in frequent upgrades to the latest manufacturing equipment. By utilizing our manufacturing facilities for both our Display Solutions and Power Solutions products and our Semiconductor Manufacturing Services customers, we seek to maximize return on our capital investments and our cash flow generation. |
6
Table of Contents
Index to Financial Statements
Our Technology
We continuously strengthen our advanced analog and mixed-signal semiconductor technology platform by developing innovative technologies and integrated circuit building blocks that enhance the functionality of electronics devices through brighter, thinner displays, enhanced image quality, smaller form factor and longer battery life. We seek to further build our technology platform through proprietary processes and selective licensing and acquisition of complementary technologies, as well as disciplined process improvements in our manufacturing operations. Our goal is to leverage our experience and development initiatives across multiple end markets and utilize our understanding of system-level issues our customers face to introduce new technologies that enable our customers to develop more advanced, higher performance products.
For example, in 2013, we introduced a range of intelligent sensor product families featuring 0.18 micron analog and mixed-signal technology with low power consumption. The MagnaChip sensor families include e-Compass and digital hall sensors. MagnaChip’s intelligent sensors provide cost-effective features such as small form-factor, multi-function integration and low power consumption as a result of its use of 0.18 micron analog and mixed-signal technology and advanced design capabilities.
Our display technology portfolio includes building blocks for display drivers and timing controllers, processor and interface technologies, as well as sophisticated production techniques, such as chip-on-glass (COG), which enables the manufacture of thinner displays. Our advanced display drivers incorporate LTPS TFT and AMOLED panel technologies that enable the highest resolution displays. Furthermore, we are developing a broad intellectual property portfolio to improve the power efficiency of displays, including the development of our contents-based automatic brightness control (CABC) and automatic current limit (ACL).
We have a long history of specialized process technology development and have a number of distinctive process implementations. We have approximately 459 process flows we can utilize for our products and offer to our Semiconductor Manufacturing Services customers. Our process technologies include standard CMOS, high voltage CMOS, ultra-low leakage high voltage CMOS, low noise CMOS with embedded BCD and BCDMOS and radio frequency silicon on insulator (RFSOI). Our manufacturing processes incorporate embedded memory solutions, such as static random access memory (SRAM), one-time programmable (OTP) memory, multiple-time programmable (MTP) memory, electrical fuse, EEPROM and single-transistor random access memory (1TRAM). More broadly, we focus extensively on processes that reduce die size across all of the products we manufacture, in order to deliver cost-effective solutions to our customers.
Expertise in ultra-high voltage (UHV), high voltage and deep trench BCDMOS process technologies, low power analog and mixed-signal design capabilities and packaging know-how are key requirements in the power management market. We are currently leveraging our capabilities in these areas with products such as AC-DC converters, DC-DC converters, linear regulators, regulators and analog switches and power MOSFETs. We believe our system-level understanding of applications such as LCD televisions and mobile phones will allow us to more quickly develop and customize power management solutions for our customers in these markets.
Products and Services by Business Line
Our broad portfolio of products and services addresses multiple high-growth, consumer-focused end markets. A key component of our product strategy is to supply multiple related product and service offerings to each of the end markets that we serve.
Display Solutions
Display Driver Characteristics. Display drivers deliver defined analog voltages and currents that activate pixels to exhibit images on displays. The following key characteristics determine display driver performance and end-market application:
| • | Resolution and Number of Channels. Resolution determines the level of detail displayed within an image and is defined by the number of pixels per line multiplied by the number of lines on a display. For large displays, higher resolution typically requires more display drivers for each panel. Display drivers that have a greater number of channels, however, generally require fewer display drivers for each panel and command a higher selling price per unit. Mobile displays, conversely, are typically single chip solutions designed to deliver a specific resolution. We cover resolutions ranging from VGA (640 x 480) to UHD (3840 x 2160). |
| • | Color Depth. Color depth is the number of colors that can be displayed on a panel. For example, for TFT-LCD panels, 262 thousand colors are supported by 6-bit source drivers; 16 million colors are supported by 8-bit source drivers; and 1 billion colors are supported by 10-bit source drivers. |
| • | Operational Voltage. Display drivers are characterized by input and output voltages. Source drivers typically operate at input voltages from 1.62 to 3.6 volts and output voltages between 9 and 18 volts. Gate drivers typically operate at input voltages from 1.62 to 3.6 volts and output voltages from 30 to 45 volts. Lower input voltage results in lower power consumption and electromagnetic interference (EMI). |
| • | Gamma Curve. The relationship between the light passing through a pixel and the voltage applied to the pixel by the source driver is referred to as the gamma curve. The gamma curve of the source driver can correct some imperfections in picture quality in a process generally known as gamma correction. Some advanced display drivers feature up to three independent gamma curves to facilitate this correction. |
7
Table of Contents
Index to Financial Statements
| • | Driver Interface. Driver interface refers to the connection between the timing controller and the display drivers. Display drivers increasingly require higher bandwidth interface technology to address the larger data transfer rate necessary for higher definition images. The principal types of interface technologies are embedded clock point to point interface (EPI), advanced intra panel interface (AIPI), mini-low voltage differential signaling (m-LVDS), unified standard interface (USI), unified standard interface for TV (USI-T) and mobile industry processor interface (MIPI). |
| • | Package Type. The assembly of display drivers typically uses chip-on-film (COF) and COG package types. |
Large Display Solutions. We provide display solutions for a wide range of flat panel display sizes used in LCD televisions, including ultra-high definition televisions, or UHD TVs, FHD TVs, HD TVs, LED TVs, 3D TVs, OLED TVs, LCD monitors, notebooks, tablet PCs, public information displays and automotive.
Our large display solutions include source and gate drivers and timing controllers with a variety of interfaces, voltages, frequencies and packages to meet customers’ needs. These products include advanced technologies such as high channel count, with products in mass production to provide up to 1,440 channels. Our large display solutions are designed to allow customers to cost-effectively meet the increasing demand for high resolution displays. We focus extensively on reducing the die size of our large display drivers and other solutions products to reduce costs without having to migrate to smaller geometries. For example, we have implemented several solutions to reduce die size in large display drivers, such as optimizing design schemes and design rules and applying specific technologies that we have developed internally. We have recently introduced a number of new large display drivers with reduced die size.
The table below sets forth the features of our products, both in mass production and in customer qualification, which is the final stage of product development, for large-sized displays:
| Product |
Key Features |
Applications | ||
| TFT-LCD Source Drivers |
• 480 to 1440 output channels • 6-bit (262 thousand colors), 8-bit (16 million colors), 10-bit (1 billion colors) • Output voltage ranging from 9V to 18V • Low power consumption and low EMI • COF package types • EPI, m-LVDS, AIPI, USI interface technologies |
• UHD/HD/LED/3D TVs • Notebooks • LCD/LED monitors | ||
| TFT-LCD Gate Drivers |
• 272 to 960* output channels • Output voltage ranging from 30V to 45V • COF and COG package types |
• Tablet PCs • HD/LED/3D TVs • Notebooks • Automotive* | ||
| Timing Controllers |
• Wide range of resolutions • EPI, m-LVDS, AIPI, MIPI, USI-T* interface technologies • Input voltage ranging from 1.6V to 3.6V |
• Tablet PCs • Notebooks • LCD/3D monitors • Public information display* | ||
| AMOLED Source Drivers |
• 960* output channels • 10 bit (1 billion colors) • Output voltage: 18V • COF package type • EPI interface technology |
• OLED TVs | ||
| * | In customer qualification stage |
Mobile Display Solutions. Our mobile display solutions incorporate the industry’s most advanced display technologies, such as AMOLED and LTPS, as well as high-volume technologies such as a-Si (amorphous silicon) TFT. Our mobile display products offer specialized capabilities, including high speed serial interfaces, such as mobile display digital interface (MDDI), MIPI, reduced swing differential signaling interface (RSDS) and logic-based OTP memory. We focus extensively on reducing the die size of our mobile display drivers and other solutions products to reduce costs without having to migrate to smaller geometries. For example, we have implemented several solutions to reduce die size in mobile display drivers, such as optimizing design schemes and design rules and applying specific technologies that we have developed internally. Further, we are building a distinctive intellectual property portfolio that allows us to provide features that reduce power consumption, such as CABC and ACL. This intellectual property portfolio will also support our power management product development initiatives, as we leverage our system level understanding of power efficiency.
8
Table of Contents
Index to Financial Statements
The following table summarizes the features of our products, both in mass production and in customer qualification, which is the final stage of product development, for mobile displays:
| Product |
Key Features |
Applications | ||
| AMOLED |
• Resolutions of WVGA, QHD, HD720, WXGA and FHD • Color depth of 16 million • MIPI, eRVDS interface • Logic-based OTP • ABC, ACL |
• Smartphones • Game consoles • Digital still cameras • Tablet PCs | ||
| LTPS |
• Resolutions of VGA, WSVGA, WVGA and DVGA • Color depth of 16 million • MDDI, MIPI interface • Logic-based OTP • Separated gamma control |
• Smartphones • Game consoles • Digital still cameras | ||
| a-Si TFT |
• Resolutions of WQVGA, HVGA and WVGA • Color depth of 16 million • RSDS, MDDI, MIPI interface • CABC • Separated gamma control |
• Smartphones • Mobile phones • Game consoles • Digital still cameras • Automotive | ||
Sensor IC Solutions. We provide a range of intelligent sensor product families featuring 0.18 micron analog and mixed-signal technology with low power consumption. The MagnaChip sensor families target the growing market for applications ranging from smartphone, tablet PC and other consumer electronics to industrial devices. The MagnaChip sensor families include e-Compass and digital Hall sensors. MagnaChip’s intelligent sensors provide cost-effective features such as small form-factor and multi-function integration as a result of its use of 0.18 micron analog and mixed-signal technology and advanced design capabilities, as compared to currently available products.
Sensors are used for many applications and their use is growing rapidly. Furthermore, today’s increasingly sophisticated devices require an emerging class of intelligent sensors in mass volume. For instance, in handheld devices magnetic sensors are essential to implement compass-functionality and to detect the timing of opening and closing of a flip cover. MagnaChip’s intelligent sensor families address these magnetic sensor requirements with a new style of design made possible by integrating multiple functions.
The following table summarizes the features of our products, both in mass production and in customer qualification, which is the final stage of product development, for sensor IC:
| Product |
Key Features |
Applications | ||
| Electronic Compass IC |
• 0.18 micron low-noise technology • Compass algorithm and magnetic field scanning • 16-bit sigma-delta analog-digital convertor • I2C bus interface |
• Smartphones • Tablet PCs | ||
| Digital Hall Sensor IC |
• 0.18 micron low-noise mixed-signal technology • Proprietary Hall technology • 10-bit analog-digital converter and embedded logic controller • I2C digital interface |
• Smartphones • Tablet PCs • Other consumer electronics* • Industrial applications* |
| * | In customer qualification stage |
9
Table of Contents
Index to Financial Statements
Power Solutions
We develop, manufacture and market power management solutions for a wide range of end-market customers. The products include MOSFETs, IGBTs, power modules, AC-DC converters, DC-DC converters, LED drivers, switching regulators and linear regulators, for a range of devices, including LCD, LED, 3D televisions, smartphones, mobile phones, desktop PCs, notebooks, tablet PCs, other consumer electronics, consumer appliances and industrial applications such as power suppliers, LED lighting and motor control.
| • | MOSFETs. Our MOSFETs include low-voltage Trench MOSFETs, 20V to 150V, high-voltage Planar MOSFETs, 200V through 700V, and super junction MOSFETs, 500V through 800V. MOSFETs are used in applications to switch, shape or transfer electricity under varying power requirements. The key application segments are smartphones, mobile phones, LCD, LED and 3D televisions, desktop PCs, notebooks, tablet PCs, servers, lighting and power supplies for consumer electronics and industrial equipment. MOSFETs allow electronics manufacturers to achieve specific design goals of high efficiency and low standby power consumption. For example, computing solutions focus on delivering efficient controllers and MOSFETs for power management in VCORE, DDR and chipsets for audio, video and graphics processing systems. |
| • | IGBTs. Our IGBTs include 650V to 1200V field stop trench IGBTs. IGBTs are used in high power industrial applications, such as UPSs, power supplies, motor drives, solar inverters, welding machines and consumer appliances. |
| • | Power Modules. Power modules are used in broad range of medium-to-high power industrial and consumer applications such as UPSs, power supplies, motor drives, solar inverters, welding machines and consumer appliances. |
| • | AC-DC Converters and DC-DC Converters. We offer AC-DC and DC-DC converters targeting mobile applications and high power applications like LCD televisions, notebooks, smartphones, mobile phones set-top boxes and display modules. We expect our AC-DC and DC-DC converters will meet customer green power requirements by featuring wide input voltage ranges, high efficiency and small size. |
| • | LED Drivers. LED backlighting drivers serve the fast-growing LCD panel backlighting market for LCD, LED and 3D televisions, LCD monitors, notebooks, smartphones and tablet PCs. Our products are designed to provide high efficiency and wide input voltage range, as well as pulse width modulation (PWM) dimming for accurate white LED dimming control. LED lighting drivers have a wide input voltage range applicable to incandescent bulb and fluorescent lamp replacement. |
| • | Switching Regulation and Linear Regulators. We also provide analog switching and linear regulators for mobile and consumer applications. Our products are designed for high efficiency and low power consumption in mobile applications. |
Our power management solutions enable customers to increase system stability and improve heat dissipation and energy use, resulting in cost savings for our customers and consumers, as well as environmental benefits. Our in-house process technology capabilities and eight-inch wafer production lines increase efficiency and contribute to the competitiveness of our products.
The following table summarizes the features of our products, both in mass production and in customer qualification, which is the final stage of product development:
| Product |
Key Features |
Applications | ||
| Low Voltage MOSFET |
• Voltage options of 20V-150V • Advanced Trench MOSFET Process • High cell density • Advanced packages to enable reduction of PCB mounting area |
• Smartphones and mobile phones • Tablet PCs • Notebooks • LCD/LED/3D TVs • Desktop PCs • Servers | ||
| High Voltage MOSFET |
• Voltage options of 200V-700V • R2FET (rapid recovery) option to shorten reverse diode recovery time • Zenor FET option for MOSFET protection for abnormal input • Advanced Planar MOSFET Process • Advanced packages to enable reduction of PCB mounting area |
• Adaptors for tablet PC/mobile phone/smartphone • Power supplies • Lighting (ballast, HID, LED) • Industrial applications • LCD/LED/3D TVs | ||
10
Table of Contents
Index to Financial Statements
| Product |
Key Features |
Applications | ||
| Super Junction MOSFET |
• Voltage options of 500V-800V • Low RDS(ON) • Epi stack process |
• LCD/LED/3D TVs • Lightings applications (ballast, HID, LED) • Smartphones • Power supplies • Servers* • Industrial applications | ||
| IGBTs |
• Voltage options of 650V/1200V • Field Stop Trench IGBT • Current options from 25A to 50A |
• Industrial applications • Consumer appliances | ||
| Power Modules |
• Voltage options of 400V/600V/ 1200V • IGBT modules/FRD modules • Current options from 50A to 400A |
• Industrial applications • Consumer appliances | ||
| LED Backlighting Drivers |
• High efficiency, wide input voltage range • Advanced BCDMOS process • OCP, SCP, OVP and UVLO protections • Accurate LED current control and multi-channel matching • Programmable current limit, boost up frequency |
• Tablet PCs • Notebooks • Smartphones • LED/3D TVs • LED monitors | ||
| LED Lighting Drivers |
• High efficiency, wide input voltage range • Simple solutions with external components fully integrated • Advanced high voltage BCDMOS process • Accurate LED current control and high power factor and low THB |
• AC and DC LED lighting | ||
| AC-DC Converter |
• Wide control range for high power application (>150W) • Advanced BCDMOS process • High Precision Voltage Reference • Very low startup current consumption |
• LCD/LED/3D TVs
• Power supplies | ||
| DC-DC Converters |
• High efficiency, wide input voltage range • Advanced BCDMOS process • Fast load and line regulation • Accurate output voltage • OCP, SCP and thermal protections |
• LCD/LED/3D TVs • Smartphones • Mobile phones • Notebooks • Set-top boxes | ||
| Switching Regulators and Linear Regulators |
• Single and multi-regulators • Low Noise Output regulators • Wide range of input voltage and various output current • CMOS and BCDMOS processes |
• Mobile phones | ||
| * | In customer qualification stage |
Semiconductor Manufacturing Services
We provide semiconductor manufacturing services to analog and mixed-signal semiconductor companies. We have approximately 459 process flows we offer to our Semiconductor Manufacturing Services customers. We also partner with key customers to jointly develop or customize specialized processes that enable our customers to improve their products and allow us to develop unique manufacturing expertise.
11
Table of Contents
Index to Financial Statements
Our Semiconductor Manufacturing Services are targeted at customers who require differentiated, specialty analog and mixed-signal process technologies such as high voltage CMOS, embedded memory and power. We refer to our approach of delivering specialized services to our customers as our application-specific technology strategy. We differentiate ourselves through the depth of our intellectual property portfolio, ability to customize process technology to meet the customers’ requirements effectively, long history in this business and reputation for excellence.
Our Semiconductor Manufacturing Services customers vary from small fabless companies to large IDMs who serve consumer, computing, communication, industrial, automotive and IoT applications.
Process Technology Overview
| • | Mixed-Signal. Mixed-signal process technology is used in devices that require conversion of light and sound into electrical signals for processing and display. Our mixed-signal processes include advanced technologies such as low-noise process using triple gate, which uses less power at any given performance level. |
| • | Power. Power process technology, such as BCD, includes high-voltage capabilities as well as the ability to integrate functionalities, such as self-regulation, internal protection and other intelligent features. Unique process features, such as deep trench isolation, are suited for chip shrink and device performance enhancement. |
| • | High Voltage CMOS. High-voltage CMOS process technology facilitates the use of high-voltage levels in conjunction with smaller transistor sizes. This process technology includes several variations, such as bipolar processes, which use transistors with qualities well suited for amplifying and switching applications, mixed-mode processes, which incorporate denser, more power efficient FETs, and thick metal processes. |
| • | Non-Volatile Memory. Non-volatile memory (NVM), process technology enables the integration of non-volatile memory cells that allow retention of the stored information even when power is removed from the circuit. This type of memory is typically used for long-term persistent storage. |
The table below sets forth the key process technologies in Semiconductor Manufacturing Services that we currently offer to customers:
| Process |
Technology |
Device |
Application | |||
| Mixed-Signal |
• 0.13-0.8µm • Low noise • Ultra low power • Triple gate |
• Analog to digital converter • Digital to analog converter • Audio codec • Chipset • RF switch • Digital tunable capacitor |
• Smartphones • Tablet PCs • Notebooks • PC peripherals • DVD players | |||
| Power |
• 0.18-0.5µm • BCD 30V-80V • Deep trench isolation • MOSFET • Schottky diode • Zener diode • Ultra high voltage 700V • Thick metal |
• Power management • LED driver • High power audio amp • Power Over Ethernet • DC/DC converter |
• Smartphones • Tablet PCs • Notebooks • LCD TVs • LED lighting • LCD monitors • Automotive | |||
| High-Voltage CMOS |
• 0.11-2.0µm • 5V-200V • Bipolar |
• Display driver • CSTN driver |
• Smartphones • Tablet PCs • LCD TVs • Desktop PCs • LCD monitors | |||
| NVM |
• 0.13-0.5µm • EEPROM • eFlash • OTP |
• Microcontroller • Touch screen controller • Electronic tag memory • Hearing aid controller |
• Smartphones • Tablet PCs • Industrial applications • Medical equipment • Automotive | |||
12
Table of Contents
Index to Financial Statements
Sales and Marketing
We focus our sales and marketing strategy on continuing to grow and leverage our existing relationships with leading consumer electronics OEMs, while expanding into industrial and automotive end markets. For Semiconductor Manufacturing Services foundry, we focus on analog and mixed-signal semiconductor companies who see the benefit of our innovative technology and cost structure. We believe our close collaboration with customers allows us to align our product and process technology development with our customers’ existing and future needs. Because our customers often service multiple end markets, our product sales teams are organized by customers within the major geographies. We believe this facilitates the sale of products that address multiple end-market applications to each of our customers. Our Semiconductor Manufacturing Services sales teams focus on marketing our services to analog and mixed-signal semiconductor companies that require specialty manufacturing processes.
We sell our products through a direct sales force and a network of authorized agents and distributors. We have strategically located our sales and technical support offices near our customers. Our direct sales force consists primarily of representatives co-located with our design center in Korea, as well as our local sales and support offices in the United States, Japan, Greater China and Europe. We have a network of agents and distributors in Korea, the United States, Japan, Greater China and Europe. For the years ended December 31, 2014 and 2013, we derived 76% and 65% of net sales through our direct sales force, respectively, and 24% and 35% of net sales through our network of authorized agents and distributors, respectively.
Research and Development
Our research and development efforts focus on intellectual property, design methodology and process technology for our complex analog and mixed-signal semiconductor products and services. Research and development expenses for the years ended December 31, 2014, 2013 and 2012, were $92.8 million, $87.9 million and $76.3 million, respectively, representing 13.3%, 12.0% and 9.4% of net sales, respectively.
Customers
We sell our Display Solutions and Power Solutions products and Sensor solutions to consumer, computing and industrial electronics OEMs, original design manufacturers and electronics manufacturing services companies, as well as subsystem designers. We sell our semiconductor manufacturing services to analog and mixed-signal semiconductor companies. For the years ended December 31, 2014, 2013 and 2012, our ten largest customers accounted for 61%, 59% and 61% of our net sales, respectively. For the year ended December 31, 2014, sales to Samsung Display Corporation represented 11.4% of the Company’s net sales and 39.9% of our Display Solutions division’s net sales, and sales to LG Display represented 10.7% of the Company’s net sales and 37.5% of our Display Solutions division’s net sales. For the year ended December 31, 2013, sales to Samsung Display Corporation represented 11.3% of the Company’s net sales and 40.9% of our Display Solutions division’s net sales. For the year ended December 31, 2012, sales to LG Display represented 11.5% of the Company’s net sales and 31.9% of our Display Solutions division’s net sales. For the year ended December 31, 2014, we recorded revenues of $91.3 million from customers in the United States and $606.9 million from all foreign countries, of which 43.9% was from Korea, 19.2% from Taiwan, 4.3% from Japan and 22.7% from Greater China. For the year ended December 31, 2013, we recorded revenues of $100.8 million from customers in the United States and $633.4 million from all foreign countries, of which 49.5% was from Korea, 23.4% from Taiwan, 3.4% from Japan and 15.2% from Greater China. For the year ended December 31, 2012, we recorded revenues of $124.5 million from customers in the United States and $682.9 million from all foreign countries, of which 53.6% was from Korea, 19.0% from Taiwan, 3.5% from Japan and 15.0% from Greater China.
Intellectual Property
As of December 31, 2014, our portfolio of intellectual property assets included approximately 3,787 registered patents and 436 pending patent applications. Approximately 2,917 and 141 of our patents and pending patents are novel in that they are not a foreign counterpart of an existing patent or patent application. Because we file patents in multiple jurisdictions, we additionally have approximately 1,165 registered and pending patents that relate to identical technical claims in our base patent portfolio. Our patents expire at various times approximately over the next 18 years. While these patents are in the aggregate important to our competitive position, we do not believe that any single registered or pending patent is material to us.
We have entered into exclusive and non-exclusive licenses and development agreements with third parties relating to the use of intellectual property of the third parties in our products and design processes, including licenses related to embedded memory technology, design tools, process simulation tools, circuit designs and processor cores. Some of these licenses, including our agreements with Silicon Works Co., Ltd. and ARM Limited, are material to our business and may be terminated by the licensors prior to the expiration of these licenses should we fail to cure any breach under such licenses. Our license with Silicon Works Co., Ltd. relates to our large display drivers, and our license from ARM Limited primarily relates to product lines in our Semiconductor Manufacturing Services business. The loss of either license could have a material adverse impact on our results of operations. Additionally, in connection with the Original Acquisition, SK Hynix retained a perpetual license to use the intellectual property that we acquired from SK Hynix in the Original Acquisition. Under this license, SK Hynix and its subsidiaries are free to develop products that may incorporate or embody intellectual property developed by us prior to October 2004.
13
Table of Contents
Index to Financial Statements
Competition
We operate in highly competitive markets characterized by rapid technological change and continually advancing customer requirements. Although no one company competes with us in all of our product lines, we face significant competition in each of our market segments. Our competitors include other independent and captive manufacturers and designers of analog and mixed-signal integrated circuits, including display driver and power management semiconductor devices, as well as companies providing specialty manufacturing services.
We compete based on design experience, manufacturing capabilities, the ability to service customer needs from the design phase through the shipping of a completed product, length of design cycle and quality of technical support and sales personnel. Our ability to compete successfully will depend on internal and external variables, both within and outside of our control. These variables include the timeliness with which we can develop new products and technologies, product performance and quality, manufacturing yields, capacity availability, customer service, pricing, industry trends and general economic trends.
Employees
Our worldwide workforce consisted of 3,399 employees (full- and part-time) as of December 31, 2014, of which 415 were involved in sales, marketing, general and administrative, 471 in research and development (including 252 with advanced degrees), 115 in quality, reliability and assurance and 2,398 in manufacturing (comprised of 372 in engineering and 2,026 in operations). As of December 31, 2014, our workforce consisted of 3,399 employees, of which 2,144 employees, or approximately 63% of our workforce, were represented by the MagnaChip Semiconductor Labor Union.
Environmental
We are subject to a variety of environmental, health and safety laws and regulations in each of the jurisdictions in which we operate, governing, among other things, air emissions, wastewater discharges, the generation, use, handling, storage and disposal of, and exposure to, hazardous substances (including asbestos) and waste, soil and groundwater contamination and employee health and safety. These laws and regulations are complex, change frequently and have tended to become more stringent over time. For example, the Korean government’s Enforcement Decree to the Framework Act on Low Carbon Green Growth became effective in April 2010. Certain designated businesses, including our Korean subsidiary, were required to submit plans to reduce greenhouse emissions and energy consumption. Our Korean subsidiary set emissions and consumption targets and in 2011 negotiated an implementation plan with Korean governmental authorities. Each year thereafter, our Korean subsidiary was required to agree on emissions and consumption targets with Korean governmental authorities and submit an independently verified report of prior year’s compliance. Beginning in 2015, our Korean subsidiary became subject to a new set of greenhouse gas emissions regulation, the Korean Emissions Trading Scheme, or K-ETS, under the Act on Allocation and Trading of Greenhouse Gas Emission Allowances. Under K-ETS, our Korean subsidiary was allocated a certain amount of emissions allowance in accordance with the National Allocation Plan prepared by the Korean government and is required to meet its allocated target by either reducing the emission or purchasing the allowances from other participants in the emission trading market. Another example is the newly reinforced regulations on chemicals under Chemicals Control Act and K-REACH, which came into effect on January 1, 2015. Under these laws, our Korean subsidiary is required to comply with various requirements to report, evaluate, manage and ensure the safe usage of the chemicals used in its facilities. There can be no assurance that we have been or will be in compliance with all of these laws and regulations, or that we will not incur material costs or liabilities in connection with these laws and regulations in the future. The adoption of new environmental, health and safety laws and the failure to comply with new or existing laws or issues relating to hazardous substances could subject us to material liability (including substantial fines or penalties), impose the need for additional capital equipment or other process requirements upon us, curtail our operations or restrict our ability to expand operations.
Raw Materials
We use processes that require specialized raw materials that are generally available from a limited number of suppliers. We continue to attempt to qualify additional suppliers for our raw materials. The Securities and Exchange Commission (the “SEC”), as mandated by the Dodd-Frank Wall Street Reform and Consumer Protection Act of 2010, adopted new disclosure regulations for public companies that manufacture products containing certain minerals that are mined from the Democratic Republic of Congo and adjoining countries. These “conflict minerals” are commonly found in metals used in the manufacture of semiconductors. The implementation of these new requirements could adversely affect the sourcing, availability and pricing of metals used in the manufacture of our products. See “Item 1A. Risk Factors—Risks Related to Our Business—Compliance with new regulations regarding the use of “conflict minerals” could limit the supply and increase the cost of certain raw materials used in manufacturing our products.”
Geographic Financial Information
For a description of the distribution of our net sales by geographic region, see “Item 7. Management’s Discussion and Analysis of Financial Condition and Results of Operations—Results of Operations—Comparison of Years Ended December 31, 2014 and 2013—Net Sales by Geographic Region,” “Item 7. Management’s Discussion and Analysis of Financial Condition and Results of
14
Table of Contents
Index to Financial Statements
Operations—Results of Operations—Comparison of Years Ended December 31, 2013 and December 31, 2012—Net Sales by Geographic Region” and “Note 17. Geographic and Segment Information” to our consolidated financial statements under “Item 8. Financial Statements and Supplementary Data” included elsewhere in this Report.
Available Information
Our principal executive offices are located at: c/o MagnaChip Semiconductor S.A., 1, Allée Scheffer, L-2520 Luxembourg, Grand Duchy of Luxembourg, and our telephone number is (352) 45-62-62. Our website address is www.magnachip.com. Our annual, quarterly and current reports on Forms 10-K, 10-Q or 8-K, respectively, and all amendments thereto filed or furnished pursuant to Section 13(a) or 15(d) of the Exchange Act, can be accessed, free of charge, at our website as soon as practicable after such reports are filed with the SEC. In addition, our Corporate Governance Guidelines, Code of Business Conduct and Ethics, Audit Committee Charter, Compensation Committee Charter, Nominating and Governance Committee Charter and Risk Committee Charter are available on our website. Information contained on our website does not constitute, and shall not be deemed to constitute, part of this Report and shall not be deemed to be incorporated by reference into this Report.
You may read and copy any materials we file with the SEC at the SEC’s Public Reference Room at 100 F Street, NE, Washington, DC 20549. You may obtain information on the operation of the Public Reference Room by calling the SEC at 1-800-SEC-0330. In addition, the SEC maintains an internet site, www.sec.gov, from which you can access our annual, quarterly and current reports on Forms 10-K, 10-Q and 8-K, respectively, and all amendments to these materials after such reports and amendments are filed with the SEC. In addition, you may request a copy of any of these filings, at no cost, by writing or telephoning us at the following address or phone number: c/o MagnaChip Semiconductor, Inc., 20400 Stevens Creek Boulevard, Suite 370, Cupertino, CA 95014, Attention: General Counsel and Secretary; the telephone number at that address is (408) 625-5999.
15
Table of Contents
Index to Financial Statements
You should carefully consider the risk factors set forth below as well as the other information contained in this Report. Any of the following risks could materially and adversely affect our business, financial condition or results of operations. As a result, the price of our common stock could decline and you could lose all or part of your investment in our common stock. Additional risks and uncertainties not currently known to us or those currently viewed by us to be immaterial may also materially and adversely affect our business, financial condition or results of operations.
Risks Related to Our Restatement of Prior Period Financial Data, Failure to File Timely Periodic Reports with the SEC and Our Internal Control Over Financial Reporting
We face risks related to our restatement of prior period financial data and being delayed in our SEC reporting obligations if we are unable to resume a timely filing schedule.
As discussed in our Annual Report on Form 10-K for the year ended December 31, 2013 (the “2013 Form 10-K”) in Note 2 to our consolidated financial statements under “Item 8. Financial Statements and Supplementary Data” in our 2013 Form 10-K, our Audit Committee concluded that certain of our previously issued financial statements should no longer be relied upon because of certain errors in those financial statements. The 2013 Form 10-K restated and corrected the following financial statements of the Company (the “Restatement”): (i) the audited consolidated balance sheets as of December 31, 2012 and 2011 and consolidated statements of operations, comprehensive income, changes in stockholders’ equity and cash flows for each of the years ended December 31, 2012 and 2011; and (ii) the five year selected financial data presented in 2013 Form 10-K.
As a result of the Restatement, our SEC reporting obligations have been delayed. We filed our 2013 Form 10-K and 2014 Form 10-Qs on February 12, 2015, and the filing of this Report is not timely. While we expect to resume a timely filing schedule with respect to our Form 10-Q for the second quarter of 2015, we can provide no assurances as to when we will resume a timely filing schedule with respect to our future SEC reports. Even if we resume a timely filing schedule, we expect to continue to face many of the risks and challenges related to the Restatement, including the following:
| • | we may fail to remediate material weaknesses in our internal control over financial reporting and other material weaknesses may be identified in the future, which would adversely affect the accuracy and timing of our financial reporting; |
| • | the processes undertaken to effect the Restatement may not have been adequate to identify and correct all errors in our historical financial statements and, as a result, we may discover additional errors and our financial statements remain subject to the risk of future restatement; |
| • | our failure to have current financial information available; |
| • | the risks associated with the failure to timely file all of our SEC reports and consequences of prior or future defaults arising under our bond indenture related to our reporting obligations contained therein; |
| • | the risk that the delay in filing our annual report and any failure to satisfy other New York Stock Exchange (“NYSE”) listing requirements could cause the NYSE to commence suspension or delisting procedures with respect to our common stock; |
| • | the outcome of litigation and claims as well as regulatory examinations, investigations, proceedings and orders arising out of the Restatement and our failure to file SEC reports on a timely basis; |
| • | further downgrades or withdrawals of our debt or financial strength credit ratings, which could adversely affect our relationships with distributors and reduce new sales and would increase our costs of, or reduce our access to, future borrowings; |
| • | our limitations in entering into certain foreign exchange hedging contracts due to our credit ratings or other issues related to the Restatement; |
| • | the incurrence of significant Restatement-related expenses; |
| • | diversion of management and other human resources attention from the operation of our business; and |
| • | the possible unavailability or higher costs of financing options to fund our ongoing operations or refinance existing indebtedness resulting from the Restatement and the delayed filing of the 2013 Form 10-K, our 2014 Form 10-Qs, this Report and our Form 10-Q for the first quarter of fiscal 2015 (the “2015 Q1 10-Q”). |
We cannot assure that all of the risks and challenges described above will be eliminated and that lost business opportunities can be recaptured or that general reputational harm will not persist. If one or more of the foregoing risks or challenges persist, our business, operations and financial condition are likely to be materially and adversely affected.
16
Table of Contents
Index to Financial Statements
We concluded that there were material weaknesses in our internal control over financial reporting as of December 31, 2014, which adversely affected our ability to timely and accurately report our results of operations and financial condition. These material weaknesses have not been fully remediated as of the filing date of this Report and we cannot assure that other material weaknesses will not be identified in the future. If we fail to maintain an effective system of internal control over financial reporting, the accuracy and timing of our financial reporting may be adversely affected.
As reported in “Item 9A. Controls and Procedures” of this Report, we have concluded that there are material weaknesses in our internal control over financial reporting and that our disclosure controls and procedures were ineffective as of December 31, 2014. It is necessary for us to maintain effective internal control over financial reporting to prevent fraud and errors and to maintain effective disclosure controls and procedures so that we can provide timely and reliable financial and other information. A failure to maintain adequate internal controls may adversely affect our ability to provide financial statements that accurately reflect our financial condition and report information on a timely basis. This could cause investors to lose confidence in our reported financial and other information, cause our securities to trade at a decreased price and cause an adverse effect on our business and results of operations. A failure to remediate material weaknesses in our internal control over financial reporting could result in further restatements of financial statements and correction of other information filed with the SEC or otherwise made publicly available.
The processes undertaken to effect the Restatement may not have been adequate to identify and correct all errors in our historical financial statements and, as a result, we may discover additional errors and our financial statements remain subject to the risk of future restatement.
The completion of our Restatement involved many months of review and analysis, including highly technical analyses of our contracts and business practices, estimates and assumptions made by management, tax accounting and the proper application of relevant accounting rules and pronouncements. Many of the enhancements and changes to our processes are ongoing as of the filing date of this Report, and we continue to integrate the complex changes we have already made. Given the complexity and scope of these exercises, and notwithstanding the extensive time, effort and expense that went into them, we cannot assure that these processes were adequate to identify and correct all errors in our historical financial statements or that additional accounting errors will not come to light in the future in these or other areas.
While we have performed additional analyses and other procedures, and either implemented or plan to implement and test remediation measures as of the filing date of this Report, the previously identified material weaknesses have not been fully addressed and remediated. We continue to improve our internal control over financial reporting and disclosure controls and procedures by, among other things:
| • | implementing and maintaining a strong control environment, high ethical standards and financial reporting integrity, and communicating these enhanced standards to our employees through various means, including mandatory ethical compliance trainings for all employees; |
| • | building an environment that prioritizes compliance across the enterprise, placing special emphasis on improving internal audits and compliance with the Sarbanes-Oxley Act of 2002 (the “Sarbanes-Oxley Act”); |
| • | improving our risk assessment process to identify, evaluate and report on risks related to the Company’s preparation and fair presentation of the financial statements; |
| • | implementing additional review of period-end adjusting entries with a detailed checklist, including the involvement of finance and operational executives, in order to strengthen controls over the completeness and accuracy of both recurring and non-recurring journal entries; |
| • | improving procedures with respect to the communication, approval, documentation and accounting review of deviations from written sales contracts, including by creating and implementing a new sub-certification process with our management group in order to identify (i) any sales transaction of which terms deviate from written sales contracts, (ii) concessions, and (iii) revisions to contractual terms and conditions; and |
| • | strengthening our accounting, finance and internal audit teams by hiring permanent personnel with extensive US GAAP experience, including by facilitating US GAAP training programs for relevant employees. |
As a result, we cannot assure that we will not discover additional errors, that future financial reports will not contain misstatements or omissions, that future restatements will not be required, or that we will be able to timely comply with our reporting obligations in the future.
We may also be required to amend this Report and/or file other amended reports related to the Restatement. This would require us to devote substantial internal and external resources and cause us to incur significant fees and expenses for additional audit services as well as accounting and other consulting services. These fees and expenses, as well as the substantial time devoted by our management to make such filings with the SEC, could have a material adverse effect on our business, profitability and financial condition.
17
Table of Contents
Index to Financial Statements
The Restatement has caused delays in filing this Report, which may result in future delays in our SEC reporting.
Our ability to resume a timely filing schedule with respect to our SEC reports is subject to a number of contingencies, including whether we continue to identify errors in our consolidated financial statements and effective remediation of the identified material weaknesses in our internal control over financial reporting, including processes and training related thereto.
If we become delayed again in our SEC reporting obligations, investors would need to evaluate certain decisions with respect to our securities in light of a lack of current financial information. Accordingly, if in the future we are not current in our SEC reporting obligations, any investment in our securities would involve a greater degree of risk. Any such lack of current public information may have an adverse impact on investor confidence, which could lead to a reduction in our stock price and market capitalization and an increase in our cost of capital. In addition, if we become delayed again in our SEC reporting obligations, we will be precluded from registering our securities with the SEC for offer and sale. This may preclude us from raising debt or equity financing in the public markets and limit our access to the private markets and could also limit our ability to use stock options and other equity-based awards to attract, retain and provide incentives to our employees.
If we fail to timely file our future SEC reports, we may incur additional interest charges under the indenture governing our senior notes and/or our bondholders may seek to accelerate the principal amount of our senior notes, which would likely have a material adverse effect on our business, results of operations and financial condition.
The reporting covenant contained in the indenture relating to our outstanding 6.625% senior notes due 2021 (the “2021 Notes”) requires us to file certain quarterly, annual and current reports with the SEC within the time periods specified in the SEC’s rules and regulations applicable to such reports (subject in some cases to applicable extension periods). Additionally, under the Indenture, the trustee or the holders of 25% or more of the outstanding principal amount of the 2021 Notes have the right to notify us if they believe we have breached a covenant under the Indenture and may, following any applicable cure periods, declare an event of default under the Indenture and cause the outstanding principal amount of the 2021 Notes to become immediately due and payable.
Because of the delay in filing our 2013 Form 10-K and certain of our other SEC reports, the trustee under the indenture relating to the 2021 Notes sent notices of default under the indenture initiating the 60-day cure periods thereunder. Pursuant to the terms of the indenture, we elected, for a period of up to 180 days after the initial event of default related to a breach of the reporting covenant, to pay additional interest on the 2021 Notes of 0.25% per annum. We also received a notice of default from the trustee as a result of our failure to timely file this Report. If we fail to timely file our future SEC reports, we could again be subject to conditional interest charges in the future. If any such future reporting failure continued past the 60-day cure period and the 180-day additional interest period, the 2021 Notes could be subject to acceleration by the trustee or the holders of 25% or more of the outstanding principal amount thereof. Any such acceleration would likely have a material adverse effect on our business, results of operations, and financial condition.
The delay in filing this Report with the SEC and any failure to satisfy other NYSE listing requirements could cause the NYSE to commence suspension or delisting procedures with respect to our common stock.
The Company was notified by the NYSE that, as a result of its failure to timely file this Report for the fiscal year ended December 31, 2014 with the SEC, it was subject to the procedures specified in Section 802.01E (SEC Annual Report Timely Filing Criteria) of the Listed Company Manual of the NYSE. We believe that the filing of this Report satisfied the NYSE’s requirement to file an Annual Report on Form 10-K for the fiscal year ended December 31, 2014.
Any other failure to satisfy NYSE listing requirements, including delays in the failure to file the 2015 Q1 10-Q or timely file future SEC reports, if not waived by the NYSE, could cause the NYSE to commence suspension or delisting procedures with respect to our common stock. The commencement of any suspension or delisting procedures and any actual suspension or delisting of our common stock by the NYSE remains, at all times, at the discretion of the NYSE and would be publicly announced by the NYSE. The delisting of our common stock from the NYSE may have a material adverse effect on us by, among other things, causing investors to dispose of our shares and limiting:
| • | the liquidity of our common stock; |
| • | the market price of our common stock; |
| • | the number of institutional and other investors that will consider investing in our common stock; |
| • | the availability of information concerning the trading prices and volume of our common stock; |
| • | the number of broker-dealers willing to execute trades in shares of our common stock; and |
| • | our ability to obtain equity or debt financing for the continuation of our operations. |
18
Table of Contents
Index to Financial Statements
The outcome of litigation and other claims as well as regulatory examinations, investigations, proceedings and orders arising out of the Restatement and the failure by the Company to file SEC reports on a timely basis are unpredictable, and any orders, actions or rulings not in our favor could have a material adverse effect on our financial condition, liquidity or results of operations.
The circumstances which gave rise to the Restatement and the related SEC filing delays continue to create the risk of litigation and claims by investors and examinations, investigations, proceedings and orders by regulatory authorities, which could be expensive and damaging to our business and financial condition.
For example, following the Company’s initial announcement of the Restatement on March 12, 2014, a purported class action was filed against the Company and certain of the Company’s now-former officers. On March 16, 2015, a second amended complaint in this same action was filed against the Company, certain of the Company’s current directors and former and now-former officers, and a stockholder of the Company on behalf of a putative class consisting of all persons other than the defendants who purchased or acquired the Company’s securities between February 1, 2012 and February 12, 2015. The second amended complaint asserts claims for (i) alleged violations of Section 10(b) of the Exchange Act and Rule 10b-5 promulgated thereunder by the Company and certain of the Company’s current directors and former and now-former officers, (ii) alleged violations of Section 20(a) of the Exchange Act by certain of the Company’s current directors and former and now-former officers, and (iii) alleged violations of Sections 20(a) and 20(A) of the Exchange Act by a stockholder.
Similarly, on April 21, 2015, a related purported class action lawsuit was filed against the Company, certain of the Company’s current directors and former and now-former officers, a shareholder of the Company, and certain financial firms that acted as underwriters of the Company’s public stock offerings on behalf of a putative class consisting of all persons other than the defendants who purchased or acquired the Company’s securities between February 1, 2012 and February 12, 2015, including all purchasers of the Company’s common stock pursuant to or traceable to a shelf registration statement and prospectus issued in connection with the Company’s February 6, 2013 public stock offering. The complaint asserts claims for (i) alleged violations of Section 11 of the Securities Act by the Company, certain of the Company’s current directors and former and now-former officers, and certain financial firms that acted as underwriters of the Company’s public stock offerings, (ii) alleged violations of Section 12 of the Securities Act by the Company, certain of the Company’s former and now-former officers, a shareholder of the Company, and certain financial firms that acted as underwriters of the Company’s public stock offerings, (iii) alleged violations of Section 15 of the Securities Act by the Company, certain of the Company’s former and now-former officers, and a shareholder of the Company, (iv) alleged violations of Section 10(b) of the Exchange Act and Rule 10b-5 promulgated thereunder by the Company and certain of the Company’s former and now-former officers, (v) alleged violations of Section 20(a) of the Exchange Act by the Company, certain of the Company’s former and now-former officers, and a shareholder of the Company.
Moreover, a shareholder derivative action, styled Hemmingson et al. v. Elkins et al., Case No. 1-15-cv-278614, was filed in the Superior Court of the State of California in and for Santa Clara County on March 25, 2015, naming as defendants certain of the Company’s current directors and former and now-former officers, as well as a shareholder of the Company, and naming the Company as a nominal defendant. The complaint in this action asserts claims for (i) alleged breaches of fiduciary duty by certain of the Company’s current directors and former and now-former officers for purportedly knowingly failing to maintain adequate internal controls over its accounting and reporting functions and disseminating to shareholders certain alleged materially false and misleading statements, (ii) alleged breaches of fiduciary duty by certain of the Company’s current directors and a current shareholder of the Company for purported insider trading, and (iii) alleged unjust enrichment by a shareholder of the Company for purported insider trading.
Thereafter, on May 13, 2015, a purported shareholder provided notice to the Company and the Board of Directors of a shareholder derivative action styled as Bushansky v. Norby, et al. that the purported shareholder proposes to file in the Superior Court of the State of California, Santa Clara County. The proposed action names as defendants certain of the Company’s current directors and former officers, and a shareholder of the Company, with the Company being named as a nominal defendant. The complaint asserts claims for (i) alleged breaches of fiduciary duties by certain of the Company’s current directors and former officers for knowingly failing to maintain adequate internal controls over the Company’s accounting and reporting functions and disseminating to shareholders certain alleged materially false and misleading statements, and (ii) alleged aiding and abetting of such breaches of fiduciary duties by all defendants.
In addition, in March 2014, the Company voluntarily reported to the SEC that the Audit Committee had determined that the Company incorrectly recognized revenue on certain transactions and as a result would restate its financial statements, and that the Audit Committee had commenced the independent investigation. Over the course of 2014 and in the first quarter of 2015, the Company voluntarily produced documents to the SEC regarding the various accounting issues identified during the independent investigation, and whether the Company’s hiring of an accountant from the Company’s independent registered public accounting firm impacted that accounting firm’s independence. On July 22, 2014, the Staff of the SEC’s Division of Enforcement obtained a Formal Order of Investigation. On March 12, 2015, the SEC issued a subpoena for documents to the Company in connection with its investigation. The Company will continue to cooperate with the SEC in this investigation. See “Item 3. Legal Proceedings.”
19
Table of Contents
Index to Financial Statements
The Restatement and the failure by the Company to timely file certain of its SEC reports, as well as the reported material weaknesses in internal control over financial reporting, may subject the Company to a broad range of potential actions that may be taken against the Company by the staff of the SEC, including a cease and desist order, suspension of trading of our securities, deregistration of our securities and/or the assessment of possible civil monetary penalties.
Any orders, actions or rulings relating to any of the foregoing that are not in our favor could have a material adverse effect on our financial condition, liquidity or results of operations.
The events that caused the need for the Restatement and the failure to timely file this Report and certain of our other SEC reports have resulted in certain rating agencies downgrading our credit and debt ratings, and further credit rating downgrades of our debt or financial strength ratings or withdrawal of these ratings are possible. These downgrades or withdrawals could adversely affect our relationships with customers, suppliers and distributors, adversely affect our operating results, and increase our costs of, or reduce our access to, future borrowings.
Rating agencies assign us debt ratings, based in each case on their opinions of the Company’s ability to meet its respective financial obligations.
Our ratings relative to our competitors may affect our competitive position. The Company and its debt securities have been placed on negative credit ratings watch and/or downgraded by certain rating agencies in connection with the events that caused the need for the Restatement and the failure to timely file our 2013 Form 10-K and other SEC reports. These recent developments and any future rating downgrades or withdrawals of ratings may cause reputational damage, which could materially and adversely affect our relationships with our customers, suppliers and distributors, as well as our ability to borrow. At this time we cannot predict what further actions rating agencies may take, or what actions we may take in response, but these downgrades and/or future downgrades and withdrawals could have a material adverse effect on our results of operations, hedging activities, cost of capital and liquidity.
We have incurred and expect to continue to incur significant expenses related to the Restatement, the remediation of deficiencies in our internal control over financial reporting and disclosure controls and procedures, preparation of this Report and our other SEC reports and related investigation and defense costs.
We have devoted and expect to continue to devote substantial internal and external resources to remediation efforts relating to the Restatement and the preparation and filing of the 2013 Form 10-K, this Report and our other SEC reports. As a result of these efforts, we have incurred and expect that we will continue to incur significant incremental fees and expenses for additional auditor services, financial and other consulting services, legal services and additional interest payments, as well as the implementation and maintenance of systems and processes that will need to be updated, supplemented or replaced. These expenses, as well as the substantial time devoted by our management towards identifying and addressing any internal weaknesses and legal defense costs related to the litigation, claims and other actions related to the Restatement, could have a material adverse effect on our business, profitability and financial condition.
The Restatement process has diverted management and other human resources from the operation of our business. The absence of timely and accurate financial information has hindered and may in the future hinder our ability to effectively manage the business of the Company.
The Restatement process has diverted, and continues to divert, management and other human resources from the operation of our business. The Board of Directors, members of management, and the accounting, legal, administrative and other staff of the Company have spent, and continue to spend, significant time on the Restatement, related disclosures and remediation of disclosure controls and procedures and internal control over financial reporting of the Company and its subsidiaries. These resources have been, and will likely continue to be, diverted from the strategic and day-to-day management of our business and may have an adverse effect on our ability to accomplish the strategic objectives of the Company.
The Restatement and the delayed filing of this Report could adversely impact our ability to access the capital markets and other financing arrangements.
Our ability to obtain financing, if needed, depends upon many factors, including our business prospects and creditworthiness as well as external economic conditions and general liquidity in the credit and capital markets. In light of the Restatement and the delay in filing this Report, we may be unable, if needed, to secure outside financing to fund ongoing operations and for other capital needs, including the refinancing of our 2021 Notes if necessary. Any sources of financing that may be available to us could also be at higher costs and require us to satisfy more restrictive covenants, which could limit or restrict our operations, cash flows and earnings. We cannot assure that additional financing would be available to us, or be sufficient or available on satisfactory terms. In addition, unless all current periodic reports and financial statements are filed with the SEC, we will be precluded from registering our securities with the SEC for offer and sale, and the failure to timely file our SEC reports will limit our ability to use “short-form” Form S-3 registration statements for registering our securities for sale with the SEC until we again meet the timely filing requirements of those forms.
20
Table of Contents
Index to Financial Statements
Our current credit ratings may also limit our access to external sources of liquidity and financing. Our ongoing needs for liquidity include interest payments on our 2021 Notes and our operating and capital expenses. In addition, we may from time to time have discrete or unexpected needs for liquidity. Our principal sources of liquidity are cash and cash equivalents on hand, cash from operations and financing activities. We do not have in place credit facilities or letters of credit that we could draw upon to meet our liquidity requirements. Without sufficient liquidity, we could be forced to realize investment losses, deplete capital or curtail capital expenditures or certain of our operations, which would adversely impact our results of operations and financial condition.
Risks Related to Our Business
We operate in the highly cyclical semiconductor industry, which is subject to significant downturns that may negatively impact our results of operations.
The semiconductor industry is highly cyclical and is characterized by constant and rapid technological change and price erosion, evolving technical standards, short product life cycles (for semiconductors and for the end-user products in which they are used) and wide fluctuations in product supply and demand. From time to time, these and other factors, together with changes in general economic conditions, cause significant upturns and downturns in the industry in general and in our business in particular. Periods of industry downturns have been characterized by diminished demand for end-user products, high inventory levels, underutilization of manufacturing capacity, changes in revenue mix and accelerated erosion of average selling prices. We have experienced these conditions in our business in the past and may experience renewed, and possibly more severe and prolonged, downturns in the future as a result of such cyclical changes. This may reduce our results of operations.
We base our planned operating expenses in part on our expectations of future revenue, and a significant portion of our expenses is relatively fixed in the short term. If revenue for a particular quarter is lower than we expect, we likely will be unable to proportionately reduce our operating expenses for that quarter, which would harm our operating results for that quarter.
Our restructuring activities and dispositions of assets and businesses could result in lost business and other costs that could have a material adverse effect on our results of operations.
From time to time, we may choose to sell assets, restructure business operations, shut down manufacturing lines or otherwise dispose of assets and businesses as part of management’s strategies to better align our product offerings with market demands and our customers’ needs. In connection with these activities, we face risks that we will disrupt service to our customers, lose business and incur significant costs related to such activities. These risks include potential damage to our reputation and customer relationships if we are unable to effectively transition such customer relationships to other production lines or products or if we cannot effectively manage our supplier and vendor relationships during such activities. In addition, we may also face claims or costs associated with transitioning or eliminating certain employee positions and modifying or terminating vendor relationships in connection with those exit activities.
For example, in December 2014, we announced a plan to close our 6-inch fab, which is expected to be substantially implemented by the end of fiscal year 2015. We currently expect to incur costs associated with customer transition, equipment transfer, clean-up and other costs in the range of $4.0 million to $5.0 million in connection with the closure of the 6-inch fab (excluding potential proceeds from sale of equipment), and incurred a non-cash impairment charge of approximately $10.3 million related to the asset impairment related to such assets. While we currently anticipate transitioning affected employees and certain customers to other production facilities, such activities may result in significant disruption on our business and the loss of customers and revenue during such transition, which could result in lost revenue and have a material adverse effect on our results of operations, both during such transition and after the 6-inch fab closure is completed. In addition, the closure of the 6-inch fab could create management distractions and business disruptions affecting our other manufacturing facilities in connection with the transition, including, among other things, reduced employee morale, increased employee training cost and reduced productivity.
If we fail to develop new products and process technologies or enhance our existing products and services in order to react to rapid technological change and market demands, our business will suffer.
Our industry is subject to constant and rapid technological change and product obsolescence as customers and competitors create new and innovative products and technologies. Products or technologies developed by other companies may render our products or technologies obsolete or noncompetitive, and we may not be able to access advanced process technologies, including smaller geometries, or to license or otherwise obtain essential intellectual property required by our customers.
We must develop new products and services and enhance our existing products and services to meet rapidly evolving customer requirements. We design products for customers who continually require higher performance and functionality at lower costs. We must, therefore, continue to enhance the performance and functionality of our products. The development process for these advancements is lengthy and requires us to accurately anticipate technological changes and market trends. Developing and enhancing these products is uncertain and can be time-consuming, costly and complex. If we do not continue to develop and maintain process technologies that are in demand by our Semiconductor Manufacturing Services customers, we may be unable to maintain existing customers or attract new customers.
21
Table of Contents
Index to Financial Statements
Customer and market requirements can change during the development process. There is a risk that these developments and enhancements will be late, fail to meet customer or market specifications or not be competitive with products or services from our competitors that offer comparable or superior performance and functionality. Any new products, such as our expanding line of power management solutions, or product or service enhancements, may not be accepted in new or existing markets. Our business will suffer if we fail to develop and introduce new products and services or product and service enhancements on a timely and cost-effective basis.
We manufacture our products based on our estimates of customer demand, and if our estimates are incorrect, our financial results could be negatively impacted.
We make significant decisions, including determining the levels of business that we will seek and accept, production schedules, component procurement commitments, personnel needs and other resource requirements, based on our estimates of customer demand and expected demand for and success of their products. The short-term nature of commitments by many of our customers and the possibility of rapid changes in demand for their products reduces our ability to estimate accurately future customer demand for our products. On occasion, customers may require rapid increases in supply, which can challenge our production resources and reduce margins. We may not have sufficient capacity at any given time to meet our customers’ increased demand for our products. Conversely, downturns in the semiconductor industry have caused and may in the future cause our customers to reduce significantly the amount of products they order from us. Because many of our costs and operating expenses are relatively fixed, a reduction in customer demand would decrease our results of operations, including our gross profit.
Our customers may cancel their orders, reduce quantities or delay production, which would adversely affect our margins and results of operations.
We generally do not obtain firm, long-term purchase commitments from our customers. Customers may cancel their orders, reduce quantities or delay production for a number of reasons. Cancellations, reductions or delays by a significant customer or by a group of customers, which we have experienced as a result of periodic downturns in the semiconductor industry, or failure to achieve design-wins, have affected and may continue to affect our results of operations adversely. These risks are exacerbated because many of our products are customized, which hampers our ability to sell excess inventory to the general market. We may incur charges resulting from the write-off of obsolete inventory. In addition, while we do not obtain long-term purchase commitments, we generally agree to the pricing of a particular product over a set period of time. If we underestimate our costs when determining pricing, our margins and results of operations would be adversely affected.
We depend on high utilization of our manufacturing capacity, a reduction of which could have a material adverse effect on our business, financial condition and the results of our operations.
An important factor in our success is the extent to which we are able to utilize the available capacity in our fabrication facilities. As many of our costs are fixed, a reduction in capacity utilization, as well as changes in other factors, such as reduced yield or unfavorable product mix, could reduce our profit margins and adversely affect our operating results. A number of factors and circumstances may reduce utilization rates, including periods of industry overcapacity, low levels of customer orders, operating inefficiencies, mechanical failures and disruption of operations due to expansion or relocation of operations, power interruptions and fire, flood or other natural disasters or calamities. The potential delays and costs resulting from these steps could have a material adverse effect on our business, financial condition and results of operations.
A significant portion of our sales comes from a relatively limited number of customers, the loss of which would adversely affect our financial results.
Historically, we have relied on a limited number of customers for a substantial portion of our total revenue. If we were to lose key customers or if customers cease to place orders for our high-volume products or services, our financial results would be adversely affected. For the years ended December 31, 2014, 2013 and 2012, our ten largest customers accounted for 61%, 59% and 61% of our net sales, respectively. For the year ended December 31, 2014, sales to Samsung Display Corporation represented 11.4% of the Company’s net sales and 39.9% of our Display Solutions division’s net sales. For the year ended December 31, 2013, sales to Samsung Display Corporation represented 11.3% of the Company’s net sales and 40.9% of our Display Solutions division’s net sales. For the year ended December 31, 2012, sales to LG Display represented 11.5% of the Company’s net sales and 31.9% of our Display Solutions division’s net sales. Significant reductions in sales to any of these customers, especially our few largest customers, the loss of other major customers or a general curtailment in orders for our high-volume products or services within a short period of time would adversely affect our business.
The average selling prices of our semiconductor products have at times declined rapidly and will likely do so in the future, which could harm our revenue and gross profit.
The semiconductor products we develop and sell are subject to rapid declines in average selling prices. From time to time, we have had to reduce our prices significantly to meet customer requirements, and we may be required to reduce our prices in the future. This would cause our gross profit to decrease. Our financial results will suffer if we are unable to offset any reductions in our average selling prices by increasing our sales volumes, reducing our costs or developing new or enhanced products on a timely basis with higher selling prices or gross profit.
22
Table of Contents
Index to Financial Statements
Our industry is highly competitive, and our ability to compete could be negatively impacted by a variety of factors.
The semiconductor industry is highly competitive and includes hundreds of companies, a number of which have achieved substantial market share within both our product categories and end markets. Current and prospective customers for our products and services evaluate our capabilities against the merits of our competitors. Some of our competitors are well established as independent companies and have substantially greater market share and manufacturing, financial, research and development and marketing resources than we do. We also compete with emerging companies that are attempting to sell their products in certain of our end markets and with the internal semiconductor design and manufacturing capabilities of many of our significant customers. We expect to experience continuing competitive pressures in our markets from existing competitors and new entrants.
Any consolidation among our competitors could enhance their product offerings and financial resources, further enhancing their competitive position. Our ability to compete will depend on a number of factors, including the following:
| • | our ability to offer cost-effective and high quality products and services on a timely basis using our technologies; |
| • | our ability to accurately identify and respond to emerging technological trends and demand for product features and performance characteristics; |
| • | our ability to continue to rapidly introduce new products that are accepted by the market; |
| • | our ability to adopt or adapt to emerging industry standards; |
| • | the number and nature of our competitors and competitiveness of their products and services in a given market; |
| • | entrance of new competitors into our markets; |
| • | our ability to enter the highly competitive power management market; and |
| • | our ability to continue to offer in demand semiconductor manufacturing services at competitive prices. |
Many of these factors are outside of our control. In the future, our competitors may replace us as a supplier to our existing or potential customers, and our customers may satisfy more of their requirements internally. As a result, we may experience declining revenues and results of operations.
Changes in demand for consumer electronics in our end markets can impact our results of operations.
Demand for our products will depend in part on the demand for various consumer electronics products, in particular, mobile phones and multimedia devices, digital televisions, flat panel displays, mobile PCs and digital cameras, which in turn depends on general economic conditions and other factors beyond our control. If our customers fail to introduce new products that employ our products or component parts, demand for our products will suffer. To the extent that we cannot offset periods of reduced demand that may occur in these markets through greater penetration of these markets or reduction in our production and costs, our sales and gross profit may decline, which would negatively impact our business, financial condition and results of operations.
If we fail to achieve design-wins for our semiconductor products, we may lose the opportunity for sales to customers for a significant period of time and be unable to recoup our investments in our products.
We expend considerable resources on winning competitive selection processes, known as design-wins, to develop semiconductor products for use in our customers’ products. These selection processes are typically lengthy and can require us to incur significant design and development expenditures. We may not win the competitive selection process and may never generate any revenue despite incurring significant design and development expenditures. Once a customer designs a semiconductor into a product, that customer is likely to continue to use the same semiconductor or enhanced versions of that semiconductor from the same supplier across a number of similar and successor products for a lengthy period of time due to the significant costs associated with qualifying a new supplier and potentially redesigning the product to incorporate a different semiconductor. If we fail to achieve initial design-wins in a customer’s qualification process, we may lose the opportunity for significant sales to that customer for a number of products and for a lengthy period of time. This may cause us to be unable to recoup our investments in our semiconductor products, which would harm our business.
We have lengthy and expensive design-to-mass production and manufacturing process development cycles that may cause us to incur significant expenses without realizing meaningful sales, the occurrence of which would harm our business.
The cycle time from the design stage to mass production for some of our products is long and requires the investment of significant resources with many potential customers without any guarantee of sales. Our design-to-mass production cycle typically begins with a three-to-twelve month semiconductor development stage and test period followed by a three-to-twelve month end-product qualification period by our customers. The fairly lengthy front end of our sales cycle creates a risk that we may incur
23
Table of Contents
Index to Financial Statements
significant expenses but may be unable to realize meaningful sales. Moreover, prior to mass production, customers may decide to cancel their products or change production specifications, resulting in sudden changes in our product specifications, increasing our production time and costs. Failure to meet such specifications may also delay the launch of our products or result in lost sales.
In addition, we collaborate and jointly develop certain process technologies and manufacturing process flows customized for certain of our Semiconductor Manufacturing Services customers. To the extent that our Semiconductor Manufacturing Services customers fail to achieve market acceptance for their products, we may be unable to recoup our engineering resources commitment and our investment in process technology development, which would harm our business.
Research and development investments may not yield profitable and commercially viable product and service offerings and thus will not necessarily result in increases in revenues for us.
We invest significant resources in our research and development. Our research and development efforts, however, may not yield commercially viable products or enhance our Semiconductor Manufacturing Services offerings. During each stage of research and development, there is a substantial risk that we will have to abandon a potential product or service offering that is no longer marketable and in which we have invested significant resources. In the event we are able to develop viable new products or service offerings, a significant amount of time will have elapsed between our investment in the necessary research and development effort and the receipt of any related revenues.
We face numerous challenges relating to executing our growth strategy, and if we are unable to execute our growth strategy effectively, our business and financial results could be materially and adversely affected.
Our growth strategy is to leverage our advanced analog and mixed-signal technology platform, continue to innovate and deliver new products and services, increase business with existing customers, broaden our customer base, aggressively grow our power business, drive execution excellence and focus on specialty process technologies. If we are unable to execute our growth strategy effectively, we may not be able to take advantage of market opportunities, execute our business plan or respond to competitive pressures. Moreover, if our allocation of resources does not correspond with future demand for particular products, we could miss market opportunities and our business and financial results could be materially and adversely affected.
We are subject to risks associated with currency fluctuations, and changes in the exchange rates of applicable currencies could impact our results of operations.
Historically, a portion of our revenues and greater than the majority of our operating expenses and costs of sales have been denominated in non-U.S. currencies, principally the Korean won, and we expect that this will remain true in the future. Because we report our results of operations in U.S. dollars, changes in the exchange rate between the Korean won and the U.S. dollar could materially impact our reported results of operations and distort period to period comparisons. In particular, because of the difference in the amount of our consolidated revenues and expenses that are in U.S. dollars relative to Korean won, a depreciation in the U.S. dollar relative to the Korean won could result in a material increase in reported costs relative to revenues, and therefore could cause our profit margins and operating income to appear to decline materially, particularly relative to prior periods. The converse is true if the U.S. dollar were to appreciate relative to the Korean won. For example, foreign currency fluctuations had an unfavorable impact on our reported profit margins and operating income from operations for the fiscal years ended December 31, 2014 compared to the fiscal year ended December 31, 2013. Moreover, our foreign currency gain or loss would be affected by changes in the exchange rate between the Korean won and the U.S. dollar as a substantial portion of non-cash translation gain or loss is associated with the intercompany long-term loans to our Korean subsidiary, which is denominated in U.S. dollars. As of December 31, 2014, the outstanding intercompany loan balance including accrued interests between the Korean subsidiary and the Dutch subsidiary was $766 million. As a result of foreign currency fluctuations, it could be more difficult to detect underlying trends in our business and results of operations. In addition, to the extent that fluctuations in currency exchange rates cause our results of operations to differ from our expectations or the expectations of our investors, the trading price of our stock or the price of the 2021 Notes could be adversely affected.
From time to time, we may engage in exchange rate hedging activities in an effort to mitigate the impact of exchange rate fluctuations. Our Korean subsidiary enters into foreign currency forward and zero cost collar contracts in order to mitigate a portion of the impact of U.S. dollar-Korean won exchange rate fluctuations on our operating results. These foreign currency forward and zero cost collar contracts typically require us to sell specified notional amounts in U.S. dollars and provide us the option to sell specified notional amounts in U.S. dollars during successive months to our counterparty in exchange for Korean won at specified exchange rates. Obligations under these foreign currency forward and zero cost collar contracts must be cash collateralized if our exposure exceeds certain specified thresholds. These forward and zero cost collar contracts may be terminated by the counterparty in a number of circumstances, including if our total cash and cash equivalents is less than $30 million at the end of a fiscal quarter. We cannot assure that any hedging technique we implement will be effective. If our hedging activities are not effective, changes in currency exchange rates may have a more significant impact on our results of operations. See “Item 7. Management’s Discussion and Analysis of Financial Condition and Results of Operations—Factors Affecting our Results of Operations” for further details.
The loss of our key employees would materially adversely affect our business, and we may not be able to attract or retain the technical or management employees necessary to compete in our industry.
Our key executives have substantial experience and have made significant contributions to our business, and our continued success is dependent upon the retention of our key management executives. The loss of such key personnel would have a material
24
Table of Contents
Index to Financial Statements
adverse effect on our business. In addition, our future success depends on our ability to attract and retain skilled technical and managerial personnel. We do not know whether we will be able to retain all of these employees as we continue to pursue our business strategy. The loss of the services of key employees, especially our key design and technical personnel, or our inability to retain, attract and motivate qualified design and technical personnel, could have a material adverse effect on our business, financial condition and results of operations. This could hinder our research and product development programs or otherwise have a material adverse effect on our business.
If we encounter future labor problems, we may fail to deliver our products and services in a timely manner, which would adversely affect our revenues and profitability.
As of December 31, 2014, 2,144 employees, or approximately 63% of our employees, were represented by the MagnaChip Semiconductor Labor Union. We can offer no assurance that any issues with the labor union and other employees will be resolved favorably for us in the future, that we will not experience work stoppages or other labor problems in future years or that we will not incur significant expenses related to such issues.
We may incur costs to engage in future business combinations or strategic investments, and we may not realize the anticipated benefits of those transactions.
As part of our business strategy, we may seek to enter into business combinations, investments, joint ventures and other strategic alliances with other companies in order to maintain and grow revenue and market presence as well as to provide us with access to technology, products and services. Any such transaction would be accompanied by risks that may harm our business, such as difficulties in assimilating the operations, personnel and products of an acquired business or in realizing the projected benefits, disruption of our ongoing business, potential increases in our indebtedness and contingent liabilities and charges if the acquired company or assets are later determined to be worth less than the amount paid for them in an earlier original acquisition. In addition, our indebtedness may restrict us from making acquisitions that we may otherwise wish to pursue.
The failure to achieve acceptable manufacturing yields could adversely affect our business.
The manufacture of semiconductors involves highly complex processes that require precision, a highly regulated and sterile environment and specialized equipment. Defects or other difficulties in the manufacturing process can prevent us from achieving acceptable yields in the manufacture of our products or those of our Semiconductor Manufacturing Services customers, which could lead to higher costs, a loss of customers or delay in market acceptance of our products. Slight impurities or defects in the photomasks used to print circuits on a wafer or other factors can cause significant difficulties, particularly in connection with the production of a new product, the adoption of a new manufacturing process or any expansion of our manufacturing capacity and related transitions. We may also experience manufacturing problems in achieving acceptable yields as a result of, among other things, transferring production to other facilities, upgrading or expanding existing facilities or changing our process technologies. Yields below our target levels can negatively impact our gross profit and may cause us to eliminate underperforming products.
We rely on a number of independent subcontractors and the failure of any of these independent subcontractors to perform as required could adversely affect our operating results.
A substantial portion of our net sales are derived from semiconductor devices assembled in packages or on film. The packaging and testing of semiconductors require technical skill and specialized equipment. For the portion of packaging and testing that we outsource, we use subcontractors located in Korea, China, Philippines, Malaysia and Thailand. We rely on these subcontractors to package and test our devices with acceptable quality and yield levels. We could be adversely affected by political disorders, labor disruptions and natural disasters where our subcontractors are located. If our semiconductor packagers and test service providers experience problems in packaging and testing our semiconductor devices, experience prolonged quality or yield problems or decrease the capacity available to us, our operating results could be adversely affected.
We depend on successful parts and materials procurement for our manufacturing processes, and a shortage or increase in the price of these materials could interrupt our operations and result in a decline of revenues and results of operations.
We procure materials and electronic and mechanical components from international sources and original equipment manufacturers. We use a wide range of parts and materials in the production of our semiconductors, including silicon, processing chemicals, processing gases, precious metals and electronic and mechanical components, some of which, such as silicon wafers, are specialized raw materials that are generally only available from a limited number of suppliers. We do not have long-term agreements providing for all of these materials; thus, if demand increases or supply decreases for any reason, the costs of our raw materials could significantly increase. For example, worldwide supplies of silicon wafers, an important raw material for the semiconductors we manufacture, were constrained in recent years due to an increased demand for silicon. Silicon is also a key raw material for solar cells, the demand for which has increased in recent years. Although supplies of silicon have recently improved due to the entrance of additional suppliers and capacity expansion by existing suppliers, we cannot assure that such supply increases will match demand increases. If we cannot obtain adequate materials in a timely manner or on favorable terms for the manufacture of our products, revenues and results of operations will decline.
25
Table of Contents
Index to Financial Statements
Compliance with new regulations regarding the use of “conflict minerals” could limit the supply and increase the cost of certain raw materials used in manufacturing our products.
The SEC, as mandated by the Dodd-Frank Wall Street Reform and Consumer Protection Act of 2010, adopted new disclosure regulations for public companies that manufacture products containing certain minerals that are mined from the Democratic Republic of Congo and adjoining countries. These “conflict minerals” are commonly found in metals used in the manufacture of semiconductors. Manufacturers are also required to disclose their efforts to prevent the sourcing of such minerals and metals produced from them. The implementation of these new requirements could adversely affect the sourcing, availability and pricing of metals used in the manufacture of our products. We may also incur additional costs to comply with the disclosure requirements, including costs related to determining the source of any of the relevant minerals used in our products. We may also face difficulties in satisfying customers who may require that our products be certified as free of “conflict materials,” which could harm our relationships with these customers and lead to a loss of revenue.
We face warranty claims, product return, litigation and liability risks and the risk of negative publicity if our products fail.
Our semiconductors are incorporated into a number of end products, and our business is exposed to product return, warranty and product liability risk and the risk of negative publicity if our products fail. Although we maintain insurance for product liability claims, the amount and scope of our insurance may not be adequate to cover a product liability claim that is asserted against us. In addition, product liability insurance could become more expensive and difficult to maintain and, in the future, may not be available on commercially reasonable terms, or at all.
In addition, we are exposed to the product liability risk and the risk of negative publicity affecting our customers. Our sales may decline if any of our customers are sued on a product liability claim. We also may suffer a decline in sales from the negative publicity associated with such a lawsuit or with adverse public perceptions in general regarding our customers’ products. Further, if our products are delivered with impurities or defects, we could incur additional development, repair or replacement costs, and our credibility and the market’s acceptance of our products could be harmed.
We could suffer adverse tax and other financial consequences as a result of changes in, or differences in the interpretation of, applicable tax laws.
Our company organizational structure was created in part based on certain interpretations and conclusions regarding various tax laws, including withholding tax and other tax laws of applicable jurisdictions. Our interpretations and conclusions regarding tax laws, however, are not binding on any taxing authority and, if these interpretations and conclusions are incorrect, if our business were to be operated in a way that rendered us ineligible for tax exemptions or caused us to become subject to incremental tax, or if the authorities were to change, modify or have a different interpretation of the relevant tax laws, we could suffer adverse tax and other financial consequences, and the anticipated benefits of our organizational structure could be materially impaired.
Our ability to compete successfully and achieve future growth will depend, in part, on our ability to protect our proprietary technology and know-how, as well as our ability to operate without infringing the proprietary rights of others.
We seek to protect our proprietary technologies and know-how through the use of patents, trade secrets, confidentiality agreements and other security measures. The process of seeking patent protection takes a long time and is expensive. There can be no assurance that patents will issue from pending or future applications or that, if patents issue, they will not be challenged, invalidated or circumvented, or that the rights granted under the patents will provide us with meaningful protection or any commercial advantage. Some of our technologies are not covered by any patent or patent application. The confidentiality agreements on which we rely to protect these technologies may be breached and may not be adequate to protect our proprietary technologies. We cannot assure that other countries in which we market our services will protect our intellectual property rights to the same extent as the United States. In particular, the validity, enforceability and scope of protection of intellectual property in China, where we derive a significant portion of our net sales, and certain other countries where we derive net sales, are uncertain and still evolving and historically have not protected, and may not protect in the future, intellectual property rights to the same extent as do the laws and enforcement procedures in the United States.
26
Table of Contents
Index to Financial Statements
Our ability to compete successfully depends on our ability to operate without infringing the proprietary rights of others. We have no means of knowing what patent applications have been filed in the United States until they are published. In addition, the semiconductor industry is characterized by frequent litigation regarding patent and other intellectual property rights. We may need to file lawsuits to enforce our patents or intellectual property rights, and we may need to defend against claimed infringement of the rights of others. Any litigation could result in substantial costs to us and divert our resources. Despite our efforts in bringing or defending lawsuits, we may not be able to prevent third parties from infringing upon or misappropriating our intellectual property. In the event of an adverse outcome in any such litigation, we may be required to:
| • | pay substantial damages or indemnify customers or licensees for damages they may suffer if the products they purchase from us or the technology they license from us violate the intellectual property rights of others; |
| • | stop our manufacture, use, sale or importation of infringing products; |
| • | expend significant resources to develop or acquire non-infringing technologies; |
| • | discontinue processes; or |
| • | obtain licenses to the intellectual property we are found to have infringed. |
There can be no assurance that we would be successful in such development or acquisition or that such licenses would be available under reasonable terms, or at all. The termination of key third-party licenses relating to the use of intellectual property in our products and our design processes, such as our agreements with Silicon Works Co., Ltd. and ARM Limited, would materially and adversely affect our business.
Our competitors may develop, patent or gain access to know-how and technology similar to our own. In addition, many of our patents are subject to cross licenses, several of which are with our competitors.
Our expenses could increase if SK Hynix were unwilling or unable to provide certain services related to our shared facilities with SK Hynix, and if SK Hynix were to become insolvent, we could lose certain of our leases.
We are party to a land lease and easement agreement with SK Hynix pursuant to which we lease the land for our facilities in Cheongju, Korea. If this agreement were terminated for any reason, including the insolvency of SK Hynix, we would have to renegotiate new lease terms with SK Hynix or the new owner of the land. We cannot assure that we will be able to negotiate new lease terms on favorable terms or at all. Because we share certain facilities with SK Hynix, several services that are essential to our business are provided to us by or through SK Hynix under our general service supply agreement with SK Hynix. These services include electricity, bulk gases and de-ionized water, campus facilities and housing, wastewater and sewage management, environmental safety and certain utilities and infrastructure support services. If any of our agreements with SK Hynix were terminated or if SK Hynix were unwilling or unable to fulfill its obligations to us under the terms of these agreements, we would have to procure these services on our own and as a result may experience an increase in our expenses.
We are subject to many environmental laws and regulations that could affect our operations or result in significant expenses.
We are subject to a variety of environmental, health and safety laws and regulations in each of the jurisdictions in which we operate, governing, among other things, air emissions, wastewater discharges, the generation, use, handling, storage and disposal of, and exposure to, hazardous substances (including asbestos) and wastes, soil and groundwater contamination and employee health and safety. These laws and regulations are complex, change frequently and have tended to become more stringent over time. There can be no assurance that we have been, or will be, in compliance with all such laws and regulations or that we will not incur material costs or liabilities in connection with these laws and regulations in the future. The adoption of new environmental, health and safety laws, the failure to comply with new or existing laws, or issues relating to hazardous substances could subject us to material liability (including substantial fines or penalties), impose the need for additional capital equipment or other process requirements upon us, curtail our operations or restrict our ability to expand operations.
Our Korean subsidiary has been designated as a regulated business under Korean environmental law, and such designation could have an adverse effect on our financial position and results of operations.
In April 2010, the Korean government’s Enforcement Decree to the Framework Act on Low Carbon Green Growth became effective. Certain designated businesses, including our Korean subsidiary, were required to submit plans to reduce greenhouse emissions and energy consumption. Our Korean subsidiary first set emissions and consumption targets in 2011 and negotiated an implementation plan with Korean governmental authorities. Each year thereafter, our Korean subsidiary was required to agree on emissions and consumption targets with Korean governmental authorities and submit an independently verified report of prior year’s compliance. Beginning in 2015, our Korean subsidiary became subject to K-ETS, a new set of greenhouse gas emissions regulation, under the Act on Allocation and Trading of Greenhouse Gas Emission Allowances. Under K-ETS, our Korean subsidiary was allocated a certain amount of emissions allowance in accordance with the National Allocation Plan prepared by the Korean government, and is required to meet its allocated target by either reducing the emission or purchasing the allowances from other
27
Table of Contents
Index to Financial Statements
participants in the emission trading market. Reduction of our emissions or energy consumption may result in additional and potentially costly compliance or remediation expenses, including potentially the installation of equipment and changes in the type of materials we use in manufacturing, as well as cost of procuring emission allowances to cover the excess emissions, which could adversely affect our financial position and results of operations.
We may need additional capital in the future, and such capital may not be available on acceptable terms or at all, which would have a material adverse effect on our business, financial condition and results of operations.
We may require more capital in the future from equity or debt financings to fund operating expenses, such as research and development costs, finance investments in equipment and infrastructure, acquire complementary businesses and technologies, and respond to competitive pressures and potential strategic opportunities. If we raise additional funds through further issuances of equity or other securities convertible into equity, our existing stockholders could suffer significant dilution, and any new shares we issue could have rights, preferences or privileges senior to those of the holders of our common stock. Also, additional capital may not be available when needed or, if available, may not be available on favorable terms. In addition, our indebtedness limits our ability to incur additional indebtedness under certain circumstances. If we are unable to obtain capital on favorable terms, or if we are unable to obtain capital at all, we may have to reduce our operations or forego opportunities, and this may have a material adverse effect on our business, financial condition and results of operations.
Our business depends on international customers, suppliers and operations in Asia, and as a result we are subject to regulatory, operational, financial and political risks, which could adversely affect our financial results.
We rely on, and expect to continue to rely on, suppliers, subcontractors and operations located primarily in Asia. As a result, we face risks inherent in international operations, such as unexpected changes in regulatory requirements, tariffs and other market barriers, political, social and economic instability, adverse tax consequences, war, civil disturbances and acts of terrorism, difficulties in accounts receivable collection, extended payment terms and differing labor standards, enforcement of contractual obligations and protection of intellectual property. These risks may lead to increased costs or decreased revenue growth, or both. Although we do not derive any revenue from, nor sell any products in, North Korea, any future increase in tensions between South Korea and North Korea that may occur, such as an outbreak of military hostilities, would adversely affect our business, financial condition and results of operations.
Tensions with North Korea could have an adverse effect on us and the market value of our shares.
Relations between South Korea and North Korea have been tense throughout Korea’s modern history. The level of tension between the two Koreas has fluctuated and may increase abruptly as a result of current and future events. In particular, since the death of Kim Jong-il, the former North Korean ruler, in mid-December 2011, there has been increased uncertainty with respect to the future of North Korea’s political leadership and concern regarding its implications for political and economic stability in the region. In addition, in recent years, there have been heightened security concerns stemming from North Korea’s nuclear weapon and long-range missile programs and increased uncertainty regarding North Korea’s actions and possible responses from the international community. North Korea’s economy also faces severe challenges, and any adverse economic developments may further aggravate social and political tensions within North Korea.
Although we do not derive any revenue from, nor sell any products in, North Korea, any future increase in tensions between South Korea and North Korea that may occur, for example, if North Korea experiences a leadership crisis, high-level contacts between South Korea and North Korea break down, or military hostilities occur, could have a material adverse effect on the South Korean economy and on our business, financial condition, results of operations and the market value of our common stock.
You may not be able to bring an action or enforce any judgment obtained in United States courts, or bring an action in any other jurisdiction, against us or our subsidiaries or our directors, officers or independent auditors that are organized or residing in jurisdictions other than the United States.
Most of our subsidiaries are organized or incorporated outside of the United States and some of our executive officers as well as our independent auditors are organized or reside outside of the United States. Most of our and our subsidiaries’ assets are located outside of the United States and in particular, in Korea. Accordingly, any judgment obtained in the United States against us or our subsidiaries may not be collectible in the United States. As a result, it may not be possible for you to effect service of process within the United States upon these persons or to enforce against them or us court judgments obtained in the United States that are predicated upon the civil liability provisions of the federal securities laws of the United States or of the securities laws of any state of the United States. In particular, there is doubt as to the enforceability in Korea or any other jurisdictions outside the United States, either in original actions or in actions for enforcement of judgments of United States courts, of civil liabilities predicated on the federal securities laws of the United States or the securities laws of any state of the United States.
28
Table of Contents
Index to Financial Statements
Our level of indebtedness is substantial, and we may not be able to generate sufficient cash to service all of our indebtedness and may be forced to take other actions to satisfy our obligations under our indebtedness, which may not be successful. A decline in the ratings of our existing or future indebtedness may make the terms of any new indebtedness we choose to incur more costly.
As of December 31, 2014, our total indebtedness was $224.0 million, net of unamortized discount of $1.0 million. We are permitted under the indenture governing our outstanding 2021 Notes to incur additional debt under certain conditions, including additional secured debt. If new debt were to be incurred in the future, the related risks that we now face could intensify. Our substantial debt could have important consequences, including:
| • | resulting in an event of default if we fail to satisfy our obligations under our outstanding 2021 Notes or our other debt or fail to comply with the financial or other restricted covenants contained in the indenture governing our outstanding 2021 Notes or agreements governing our other indebtedness, which event of default could result in all of our debt becoming immediately due and payable and could permit our lenders to foreclose on the assets securing any such debt; |
| • | increasing our vulnerability to general economic and industry conditions; |
| • | requiring a substantial portion of our cash flow from operations to be dedicated to the payment of principal and interest on our indebtedness, therefore reducing our ability to use our cash flow to fund our operations, capital expenditures and future business opportunities; |
| • | limiting our ability to obtain additional financing for working capital, capital expenditures, debt service requirements, acquisitions and general corporate or other purposes; |
| • | limiting our ability to adjust to changing market conditions and placing us at a competitive disadvantage compared to our competitors who have less debt; and |
| • | negatively affecting our ability to fund a change of control offer. |
Our ability to make scheduled payments on or to refinance our debt obligations depends on our financial condition and operating performance, which is subject to prevailing economic and competitive conditions and to certain financial, business and other factors beyond our control. We cannot assure that we will generate a level of cash flows from operating activities sufficient to permit us to pay the principal, premium, if any, and interest on our indebtedness.
The credit ratings assigned to our debt reflect each rating agency’s opinion of our ability to make payments on the debt obligations when such payments are due. The rating of our outstanding 2021 Notes as of April 2015 is Caa1 by Moody’s and B- by Standard and Poor’s, both of which are below investment grade. A rating may be subject to revision or withdrawal at any time by the assigning rating agency. We may experience downgrades in our debt ratings in the future. Any lowering of our debt ratings would adversely impact our ability to raise additional debt financing and increase the cost of any such financing that is obtained. In the event any ratings downgrades are significant, we may choose not to incur new debt or refinance existing debt if we are unable to incur or refinance such debt at favorable interest rates or on favorable terms.
If our cash flows and capital resources are insufficient to fund our debt service obligations or if we are unable to refinance existing indebtedness on favorable terms, we may be forced to reduce or delay capital expenditures, sell assets, seek additional capital or restructure or refinance our indebtedness. These alternative measures may not be successful and thus render us unable to meet our scheduled debt service obligations. In the absence of such operating results and resources, we could face substantial liquidity problems and might be required to dispose of material assets or operations to meet our debt service and other obligations. The indenture governing our outstanding 2021 Notes restricts our ability to dispose of assets and use the proceeds from the disposition. We may not be able to consummate those dispositions or be able to obtain the proceeds which we could realize from them and these proceeds may not be adequate to meet any debt service obligations then due.
We are a holding company and will depend on the business of our subsidiaries to satisfy our obligations under our outstanding 2021 Notes and other obligations.
We are a holding company with no independent operations of our own. Our subsidiaries conduct substantially all of the operations necessary to fund payments on our outstanding 2021 Notes, other debt and any other obligations. Our ability to make payments on our outstanding 2021 Notes and our other obligations will depend on our subsidiaries’ cash flow and their payment of funds to us. Our subsidiaries’ ability to make payments to us will depend on:
| • | their earnings; |
| • | covenants contained in our debt agreements (including the indenture governing our outstanding 2021 Notes) and the debt agreements of our subsidiaries; |
| • | covenants contained in other agreements to which we or our subsidiaries are or may become subject; |
| • | business and tax considerations; and |
| • | applicable law, including any restrictions under Korean law that may be imposed on MagnaChip Korea that would restrict its ability to make payments on intercompany loans from MagnaChip Semiconductor B.V. |
29
Table of Contents
Index to Financial Statements
We cannot assure that the operating results of our subsidiaries at any given time will be sufficient to make distributions or other payments to us or that any distributions or payments will be adequate to pay principal and interest, and any other payments, on our outstanding 2021 Notes, other debt or any other obligations when due, and the failure to make such payments could have a material adverse effect on our business, financial condition and results of operations.
Restrictions on MagnaChip Korea’s ability to make payments on its intercompany loans from MagnaChip Semiconductor B.V., or on its ability to pay dividends in excess of statutory limitations, could hinder our ability to make payments on our outstanding 2021 Notes.
We anticipate that payments under our outstanding 2021 Notes will be funded in part by MagnaChip Korea’s repayment of its existing loans from MagnaChip Semiconductor B.V., with MagnaChip Semiconductor B.V. using such repayments in turn to repay the loans owed to MagnaChip Semiconductor S.A., which will repay loans owed to us. Under the Korean Foreign Exchange Transaction Act, the minister of the Ministry of Strategy and Finance is authorized to temporarily suspend payments in foreign currencies in the event of natural calamities, wars, conflicts of arms, grave and sudden changes in domestic or foreign economic conditions, or other similar situations. In addition, under the Korean Commercial Code, a Korean company is permitted to make a dividend payment in accordance with the provisions in its articles of incorporation out of retained earnings (as determined in accordance with the Korean Commercial Code and the generally accepted accounting principles in Korea), but no more than twice a year. If MagnaChip Korea is prevented from making payments under its intercompany loans due to restrictions on payments of foreign currency or if it has an insufficient amount of retained earnings under the Korean Commercial Code to make dividend payments to MagnaChip Semiconductor B.V., we may not have sufficient funds to make payments on our outstanding 2021 Notes.
The indenture governing our outstanding 2021 Notes contains, and our future debt agreements will likely contain, covenants that significantly restrict our operations.
The indenture governing our outstanding 2021 Notes contains, and our future debt agreements will likely contain, numerous covenants imposing financial and operating restrictions on our business. These restrictions may affect our ability to operate our business, may limit our ability to take advantage of potential business opportunities as they arise and may adversely affect the conduct of our current business, including by restricting our ability to finance future operations and capital needs and by limiting our ability to engage in other business activities. These covenants will place restrictions on our ability and the ability of our operating subsidiaries to, among other things:
| • | pay dividends, redeem shares or make other distributions with respect to equity interests, make payments with respect to subordinated indebtedness or other restricted payments; |
| • | incur debt or issue preferred stock; |
| • | create liens; |
| • | make certain investments; |
| • | consolidate, merge or dispose of all or substantially all of our assets, taken as a whole; |
| • | sell or otherwise transfer or dispose of assets, including equity interests of our subsidiaries; |
| • | enter into sale-leaseback transactions; |
| • | enter into transactions with our affiliates; and |
| • | designate our subsidiaries as unrestricted subsidiaries. |
In addition, our future debt agreements will likely contain financial ratios and other financial conditions tests. Our ability to meet those financial ratios and tests could be affected by events beyond our control, and we cannot assure that we will meet those ratios and tests. A breach of any of these covenants could result in a default under such debt agreements. Upon the occurrence of an event of default under such debt agreements, our lenders under such agreements could elect to declare all amounts outstanding under such debt agreements to be immediately due and payable and terminate all commitments to extend further credit.
The global downturn and related financial crisis negatively affected our business. Poor economic conditions may negatively affect our future business, results of operations and financial condition.
The global downturn and related financial crisis that started in 2008 led to slower economic activity, increased unemployment, concerns about inflation and energy costs, decreased business and consumer confidence, reduced corporate profits and capital spending, adverse business conditions and lower levels of liquidity in many financial markets. Consumers and businesses deferred purchases in response to tighter credit and negative financial news, which has in turn negatively affected product demand and other related matters. The global downturn led to reduced customer spending in the semiconductor market and in our target markets, made it
30
Table of Contents
Index to Financial Statements
difficult for our customers, our vendors and us to accurately forecast and plan future business activities and caused U.S. and foreign businesses to slow spending on our products. Although economic conditions have improved generally and in the semiconductor industry specifically, we cannot assure the extent to which such conditions will continue to improve or whether the improvement will be sustainable. If the global economic recovery is not sustained or the global economy experiences another recession, such adverse economic conditions could lead to the insolvency of key suppliers resulting in product delays, limit the ability of customers to obtain credit to finance purchases of our products, lead to customer insolvencies and also result in counterparty failures that may negatively impact our treasury operations. As a result, our business, financial condition and results of operations could be materially adversely affected in future periods as a result of economic downturns.
We have a history of losses and may not achieve or sustain profitability in the future.
From the time we began operations as a separate entity in 2004 until we emerged from reorganization proceedings in 2009, we generated significant net losses and did not generate a profit for a full fiscal year. We may increase spending to support increased research and development and sales and marketing efforts. These expenditures may not result in increased revenue or an increase in the number of customers immediately or at all. Because many of our expenses are fixed in the short term, or are incurred in advance of anticipated sales, we may not be able to decrease our expenses in a timely manner to offset any shortfall of sales. If we cannot maintain profitability, the value of the enterprise may decline.
Investor confidence may be adversely impacted if we fail to remediate identified material weaknesses and maintain effective internal control over financial reporting and disclosure controls and procedures or are unable to comply with Section 404 of the Sarbanes-Oxley Act, and as a result, the value of our securities could decline.
We are subject to rules adopted by the SEC pursuant to Section 404 of the Sarbanes-Oxley Act, which requires us to include in our Annual Report on Form 10-K our management’s report on, and assessment of the effectiveness of, our internal control over financial reporting. We are also required to periodically assess and report on the adequacy of our disclosure controls and procedures. As reported in “Item 9A. Controls and Procedures” of this Report, we have concluded that there are material weaknesses in our internal control over financial reporting and that our disclosure controls and procedures were ineffective as of December 31, 2014.
If we fail to remediate identified material weaknesses and maintain the effectiveness of our internal control over financial reporting, there is a risk that we will continue to have material weaknesses in the future. Moreover, effective internal controls are necessary for us to produce reliable financial reports and are important to helping prevent financial fraud. Any of these possible outcomes could result in an adverse reaction in the financial marketplace due to a loss of investor confidence in the reliability of our consolidated financial statements and could result in investigations or sanctions by the SEC, the NYSE or other regulatory authorities or in stockholder litigation. Any of these factors ultimately could harm our business and could negatively impact the market price of our securities. Ineffective control over financial reporting could also cause investors to lose confidence in our reported financial information, which could adversely affect the trading price of our common stock.
Our goal is to ensure that our disclosure controls and procedures are designed to provide reasonable assurance that information required to be disclosed by us in the reports that we file or submit under the Exchange Act is recorded, processed, summarized and reported, within the time periods specified in the SEC’s rules and forms, and that such information is accumulated and communicated to our management, with the participation of our Chief Executive Officer and Chief Financial Officer, as appropriate, to allow timely decisions regarding required disclosure. However, our management, including our principal executive officer and principal financial officer, does not expect that our disclosure controls and procedures will prevent all error and all fraud. A control system, no matter how well conceived and operated, can provide only reasonable, not absolute, assurance that the objectives of the control system are met. Further, the design of a control system must reflect the fact that there are resource constraints, and the benefits of controls must be considered relative to their costs. Because of the inherent limitations in all control systems, no evaluation of controls can provide absolute assurance that all control issues and instances of fraud, if any, have been detected. See “Item 9A. Controls and Procedures.”
We may need to incur impairment and other restructuring charges, which could materially affect our results of operations and financial condition.
During industry downturns and for other reasons, we may need to record impairment or restructuring charges. From November 9, 2009, the date we emerged from Chapter 11 reorganization proceedings, through December 31, 2014, we recognized aggregate restructuring and impairment charges of $24.6 million, which consisted of $21.2 million of impairment charges and $3.4 million of restructuring charges. For the year ended December 31, 2014, we recognized $10.3 million of impairment charges related to the closure of our 6-inch fab. In the future, we may need to record additional impairment charges or to further restructure our business or incur additional restructuring charges, any of which could have a material adverse effect on our results of operations or financial condition.
31
Table of Contents
Index to Financial Statements
We are subject to litigation risks, which may be costly to defend and the outcome of which is uncertain.
All industries, including the semiconductor industry, are subject to legal claims, with and without merit, that may be particularly costly and which may divert the attention of our management and our resources in general. We are involved in a variety of legal matters, most of which we consider routine matters that arise in the normal course of business. These routine matters typically fall into broad categories such as those involving customers, employment and labor and intellectual property. Even if the final outcome of these legal claims does not have a material adverse effect on our financial position, results of operations or cash flows, defense and settlement costs can be substantial. Due to the inherent uncertainty of the litigation process, the resolution of any particular legal claim or proceeding could have a material effect on our business, financial condition, results of operations or cash flows.
The price of our common stock may be volatile and you may lose all or a part of your investment.
The trading price of our common stock might be subject to wide fluctuations. Factors, some of which are beyond our control, that could affect the trading price of our common stock may include:
| • | actual or anticipated variations in our results of operations from quarter to quarter or year to year, including variations related to the Restatement; |
| • | announcements by us or our competitors of significant agreements, technological innovations or strategic alliances; |
| • | changes in recommendations or estimates by any securities analysts who follow our securities; |
| • | addition or loss of significant customers; |
| • | recruitment or departure of key personnel; |
| • | changes in economic performance or market valuations of competing companies in our industry; |
| • | price and volume fluctuations in the overall stock market; |
| • | market conditions in our industry, end markets and the economy as a whole; |
| • | subsequent sales of stock and other financings; and |
| • | litigation, legislation, regulation or technological developments that adversely affect our business. |
In the past, following periods of volatility in the market price of a public company’s securities, securities class action litigation often has been instituted against the public company. Regardless of its outcome, this type of litigation could result in substantial costs to us and a likely diversion of our management’s attention. You may not receive a positive return on your investment when you sell your shares, and you could lose some or the entire amount of your investment.
Significant ownership of our common stock by certain stockholders could adversely affect our other stockholders.
Based upon the number of shares of common stock outstanding as of May 1, 2015, our executive officers, directors and Avenue collectively beneficially owned approximately 12.4% of our common stock, excluding shares of common stock issuable upon exercise of outstanding options, and 14.7% of our common stock, including shares of common stock issuable upon exercise of outstanding options that are exercisable within sixty days of May 1, 2015. In addition, affiliates of Avenue currently have two employees serving as members of our seven-member Board of Directors. Therefore, Avenue will continue to have significant influence over our affairs for the foreseeable future, including influence over the election of directors and significant corporate transactions, such as a merger or other sale of our company or our assets.
Our concentration of ownership may limit the ability of other stockholders to influence corporate matters and, as a result, we may take actions that our public stockholders do not view as beneficial. For example, our concentration of ownership could have the effect of delaying or preventing a change in control or otherwise discouraging a potential acquirer from attempting to obtain control of us, which in turn could cause the market price of our common stock to decline or prevent our stockholders from realizing a premium over the market price for their shares of our common stock.
Under our certificate of incorporation, our non-employee directors and non-employee holders of five percent or more of our outstanding common stock do not have a duty to refrain from engaging in a corporate opportunity in the same or similar activities or lines of business as those engaged in by us, our subsidiaries and other related parties. Also, we have renounced any interest or expectancy in such business opportunities even if the opportunity is one that we might reasonably have pursued or had the ability or desire to pursue if granted an opportunity to do so.
Future sales of significant amounts of our common stock could negatively affect our stock price, even if our business is doing well.
As of May 1, 2015, Avenue beneficially owned 4,088,978 shares, or approximately 12.0%, of our outstanding common stock. On November 9, 2014, all warrants to purchase our common stock previously held by Avenue expired. All of our currently outstanding shares that were issued pursuant to Section 1145 of the United States Bankruptcy Code, including Avenue’s shares, are
32
Table of Contents
Index to Financial Statements
eligible for sale from time to time under Rule 144 or Section 4(a)(1) of the Securities Act subject only to the limitations on affiliate sales. Additionally, all remaining shares beneficially owned by Avenue are or will be registered for resale under a shelf registration statement and therefore be eligible for sale at any time or from time to time by Avenue. If any of our current stockholders, including Avenue, sells or is perceived by the market as intending to sell substantial amounts of our common stock, the market price of our common stock could drop significantly, even if our business is doing well.
Our Rights Plan and provisions in our charter documents and Delaware Law may make it difficult for a third party to acquire us and could depress the price of our common stock.
On March 6, 2015, our Board of Directors adopted a stockholder rights plan (the “Rights Plan”) and declared a dividend of one preferred stock purchase right on each share of the Company’s common stock outstanding at the close of business on March 16, 2015. Each right will entitle the holder to purchase one one-thousandth of a share of our Series A Junior Participating Preferred Stock. Under certain circumstances, if a person or group acquires 10% (or 20% in the case of a passive institutional investor) or more of our outstanding common stock, holders of the rights (other than the person or group triggering their exercise) will be able to purchase for each share of common stock owned, $24 worth of shares of the Company’s common stock having a market value of twice such price. The rights expire in March 2016 unless extended by our Board of Directors. Because the rights may substantially dilute the stock ownership of a person or group attempting to acquire us without the approval of our Board of Directors, our rights plan could make it more difficult for a third party to acquire us (or a significant percentage of our outstanding capital stock) without first negotiating with our Board of Directors regarding such acquisition.
In addition, provisions in our certificate of incorporation and bylaws may have the effect of delaying or preventing a change of control or changes in our management. Among other things, our certificate of incorporation and bylaws:
| • | authorize our Board of Directors to issue, without stockholder approval, preferred stock with such terms as the Board of Directors may determine; |
| • | divide our Board of Directors into three classes so that only approximately one-third of the total number of directors is elected each year; |
| • | permit directors to be removed only for cause by a majority vote of the stockholders; |
| • | prohibit action by written consent of our stockholders; |
| • | prohibit any person other than our Board of Directors, the chairman of our Board of Directors, our Chief Executive Officer or holders of at least 25% of the voting power of all then outstanding shares of capital stock of the corporation entitled to vote generally in the election of directors to call a special meeting of our stockholders; and |
| • | specify advance notice requirements for stockholder proposals and director nominations. |
In addition, we are subject to the provisions of Section 203 of the Delaware General Corporation Law (the “DGCL”), regulating corporate takeovers and which has an anti-takeover effect with respect to transactions not approved in advance by our Board of Directors, including discouraging takeover attempts that might result in a premium over the market price for shares of our common stock. In general, those provisions prohibit a Delaware corporation from engaging in any business combination with any interested stockholder for a period of three years following the date that the stockholder became an interested stockholder, unless:
| • | the transaction is approved by the board of directors before the date the interested stockholder attained that status; |
| • | upon consummation of the transaction which resulted in the stockholder becoming an interested stockholder, the interested stockholder owned at least 85% of the voting stock of the corporation outstanding at the time the transaction commenced; or |
| • | on or after such date, the business combination is approved by the board of directors and authorized at a meeting of stockholders, and not by written consent, by at least two-thirds of the outstanding voting stock that is not owned by the interested stockholder. |
In general, DGCL Section 203 defines a business combination to include the following:
| • | any merger or consolidation involving the corporation and the interested stockholder; |
| • | any sale, transfer, pledge or other disposition of 10% or more of the assets of the corporation involving the interested stockholder; |
| • | subject to certain exceptions, any transaction that results in the issuance or transfer by the corporation of any stock of the corporation to the interested stockholder; |
| • | any transaction involving the corporation that has the effect of increasing the proportionate share of the stock of any class or series of the corporation beneficially owned by the interested stockholder; or |
| • | the receipt by the interested stockholder of the benefit of any loans, advances, guarantees, pledges or other financial benefits provided by or through the corporation. |
33
Table of Contents
Index to Financial Statements
In general, DGCL Section 203 defines an interested stockholder as any entity or person beneficially owning 15% or more of the outstanding voting stock of the corporation and any entity or person affiliated with or controlling or controlled by any such entity or person.
A Delaware corporation may opt out of this provision by express provision in its original certificate of incorporation or by amendment to its certificate of incorporation or bylaws approved by its stockholders. However, we have not opted out of, and do not currently intend to opt out of, this provision.
We do not intend to pay dividends for the foreseeable future, and therefore, investors should rely on sales of their common stock as the only way to realize any future gains on their investments.
We do not intend to pay any cash dividends in the foreseeable future. The payment of cash dividends on common stock is restricted under the terms of the indenture for our outstanding 2021 Notes. Any determination to pay dividends in the future will be at the discretion of our Board of Directors. Accordingly, investors must rely on sales of their common stock after price appreciation, which may never occur, as the only way to realize any future gains on their investments.
Item 1B. Unresolved Staff Comments
Not applicable.
Our manufacturing operations consist of three fabrication facilities located in Korea at two sites in Cheongju and one in Gumi. Our facilities have a combined capacity of approximately 127,597 eight-inch equivalent wafers per month. We manufacture wafers utilizing geometries ranging from 0.11 to 2.0 microns. The Cheongju facilities have three main buildings totaling 164,058 square meters devoted to manufacturing and development. The Gumi facility has one main building with 41,022 square meters devoted to manufacturing, testing and packaging.
In addition to our fabrication facilities, we lease facilities in Seoul, Korea, and Cupertino, California. Each of these facilities includes administration, sales and marketing and research and development functions. We lease sales and marketing offices through our subsidiaries in several other countries.
The ownership of our wafer manufacturing assets is an important component of our business strategy. Maintaining manufacturing control enables us to develop proprietary, differentiated products and results in higher production yields, as well as shortened design and production cycles. We believe our facilities are suitable and adequate for the conduct of our business for the foreseeable future and that we have sufficient production capacity to service our business as currently contemplated without significant capital investment.
A substantial majority of our assembly, test and packaging services for our Display Solutions business and all of such services for our Power Solutions business are outsourced with the balance handled in-house. Our independent providers of these services are located in Korea, China, Philippines, Malaysia and Thailand. The relative cost of outsourced services, as compared to in-house services, depends upon many factors specific to each product and circumstance. However, we generally incur higher costs for outsourced services, which can result in lower margins.
Although we own our manufacturing facilities, we are party to a land lease and easement agreement with SK Hynix pursuant to which we lease the land for our facilities in Cheongju, Korea from SK Hynix for an indefinite term. Because we share certain facilities with SK Hynix, several services that are essential to our business are provided to us by or through SK Hynix under our general service supply agreement with SK Hynix. These services include electricity, bulk gases and de-ionized water, campus facilities and housing, wastewater and sewage management, environmental safety and certain utilities and infrastructure support services. The services agreement continues for an indefinite term subject to each party having a right to terminate in the event of an uncured breach by the other party.
Securities Class Action Complaints
On March 12, 2014, a purported class action was filed against the Company and certain of the Company’s now-former officers. On March 16, 2015, a second amended complaint in this same action was filed against the Company, certain of the Company’s current directors and former and now-former officers, and a stockholder of the Company on behalf of a putative class consisting of all persons other than the defendants who purchased or acquired the Company’s securities between February 1, 2012 and March 12, 2015. The second amended complaint asserts claims for (i) alleged violations of Section 10(b) of the Exchange Act and Rule 10b-5 promulgated thereunder by the Company and certain of the Company’s current directors and former and now-former officers, (ii) alleged violations of Section 20(a) of the Exchange Act by certain of the Company’s current directors and former and now-former officers, and (iii) alleged violations of Sections 20(a) and 20(A) of the Exchange Act by a stockholder. The action, Thomas et al., v. MagnaChip Semiconductor Corp., et al., No. 3:14-cv-1160, is pending in the Northern District of California.
34
Table of Contents
Index to Financial Statements
On April 21, 2015, a related purported class action lawsuit was filed against the Company, certain of the Company’s current directors and former and now-former officers, a shareholder of the Company, and certain financial firms that acted as underwriters of the Company’s public stock offerings on behalf of a putative class consisting of all persons other than the defendants who purchased or acquired the Company’s securities between February 1, 2012 and February 12, 2015, including all purchasers of the Company’s common stock pursuant to or traceable to a shelf registration statement and prospectus issued in connection with the Company’s February 6, 2013 public stock offering. The complaint asserts claims for (i) alleged violations of Section 11 of the Securities Act by the Company, certain of the Company’s current directors and former and now-former officers, and certain financial firms that acted as underwriters of the Company’s public stock offerings, (ii) alleged violations of Section 12 of the Securities Act by the Company, certain of the Company’s former and now-former officers, a shareholder of the Company, and certain financial firms that acted as underwriters of the Company’s public stock offerings, (iii) alleged violations of Section 15 of the Securities Act by the Company, certain of the Company’s former and now-former officers, and a shareholder of the Company, (iv) alleged violations of Section 10(b) of the Exchange Act and Rule 10b-5 promulgated thereunder by the Company and certain of the Company’s former and now-former officers, (v) alleged violations of Section 20(a) of the Exchange Act by the Company, certain of the Company’s former and now-former officers, and a shareholder of the Company. The action, Okla. Police Pension & Retirement Sys. v. MagnaChip Semiconductor Corp., et al., No. 3:15-cv-01797, is pending in the Northern District of California. A motion to consolidate Okla. Police Pension & Retirement Sys. v. MagnaChip Semiconductor Corp., et al., No. 3:15-cv-01797 and Thomas et al., v. MagnaChip Semiconductor Corp., et al., No. 3:14-cv-1160 is also pending. At this time, the Company is unable to estimate any reasonably possible loss, or range of reasonably possible losses, with respect to the matters described above. This is primarily because these matters involve complex legal and factual issues subject to uncertainty. There can be no assurance that these matters will be resolved in a manner that is not adverse to the Company.
SEC Enforcement Staff Review
In addition, in March 2014, the Company voluntarily reported to the SEC that the Audit Committee had determined that the Company incorrectly recognized revenue on certain transactions and as a result would restate its financial statements, and that the Audit Committee had commenced the independent investigation. Over the course of 2014 and in the first quarter of 2015, the Company voluntarily produced documents to the SEC regarding the various accounting issues identified during the independent investigation, and whether the Company’s hiring of an accountant from the Company’s independent registered public accounting firm impacted that accounting firm’s independence. On July 22, 2014, the Staff of the SEC’s Division of Enforcement obtained a Formal Order of Investigation. On March 12, 2015, the SEC issued a subpoena for documents to the Company in connection with this investigation. The Company will continue to cooperate with the SEC in this investigation. At this time, the Company is unable to estimate any reasonably possible loss, or range of reasonably possible losses, with respect to the matters described above. This is primarily because these matters involve complex legal and factual issues subject to uncertainty. There can be no assurance that these matters will be resolved in a manner that is not adverse to the Company.
Shareholder Derivative Complaints
A shareholder derivative action, styled Hemmingson et al. v. Elkins et al., Case No. 1-15-cv-278614, was filed in the Superior Court of the State of California in and for Santa Clara County on March 25, 2015, naming as defendants certain of the Company’s current directors and former and now-former officers, as well as a shareholder of the Company, and naming the Company as a nominal defendant. The complaint in this action asserts claims for (i) alleged breaches of fiduciary duty by certain of the Company’s current directors and former and now-former officers for purportedly knowingly failing to maintain adequate internal controls over its accounting and reporting functions and disseminating to shareholders certain alleged materially false and misleading statements, (ii) alleged breaches of fiduciary duty by certain of the Company’s current directors and a current shareholder of the Company for purported insider trading, and (iii) alleged unjust enrichment by a shareholder of the Company for purported insider trading. On May 13, 2015, the court so ordered a stipulation entered into by certain of the parties, agreeing to stay the litigation until Thomas et al., v. MagnaChip Semiconductor Corp., et al., No. 3:14-cv-1160 and Okla. Police Pension & Retirement Sys. v. MagnaChip Semiconductor Corp., et al., No. 3:15-cv-01797 are resolved, unless the stay is lifted earlier.
On May 13, 2015, a purported shareholder provided notice to the Company and the Board of Directors of a shareholder derivative action styled as Bushansky v. Norby, et al. that the purported shareholder proposes to file in the Superior Court of the State of California, Santa Clara County. The proposed action names as defendants certain of the Company’s current directors and former officers, and a shareholder of the Company, with the Company being named as a nominal defendant. The complaint asserts claims for (i) alleged breaches of fiduciary duties by certain of the Company’s current directors and former officers for knowingly failing to maintain adequate internal controls over the Company’s accounting and reporting functions and disseminating to shareholders certain alleged materially false and misleading statements; and (ii) alleged aiding and abetting of such breaches of fiduciary duties by all defendants. At this time, the Company is unable to estimate any reasonably possible loss, or range of reasonably possible losses, with respect to the matters described above. This is primarily because these matters involve complex legal and factual issues subject to uncertainty. There can be no assurance that these matters will be resolved in a manner that is not adverse to the Company.
35
Table of Contents
Index to Financial Statements
Other Legal Proceedings
We are involved in a variety of legal matters, most of which we consider routine matters that arise in the normal course of business. These routine matters typically fall into broad categories such as those involving customers, employment and labor and intellectual property. Intellectual property litigation and infringement claims, in particular, could cause us to incur significant expenses or prevent us from selling our products. We are currently not involved in any ordinary-course legal proceedings that we believe would have a material adverse effect on our business, financial condition or results of operations.
Item 4. Mine Safety Disclosures
Not applicable.
36
Table of Contents
Index to Financial Statements
PART II
Item 5. Market for Registrant’s Common Equity, Related Stockholder Matters and Issuer Purchases of Equity Securities
Market Information
Our common stock is listed on the New York Stock Exchange under the symbol “MX.” On May 27, 2015, the last reported sales price of our common stock on the NYSE was $6.39 per share. The table below sets forth the reported high and low sales prices for our common stock during the quarterly periods for the two most recent fiscal years described below.
Price Range of Common Stock
| High | Low | |||||||
| Fiscal 2013 |
||||||||
| First Quarter |
$ | 18.25 | $ | 14.08 | ||||
| Second Quarter |
$ | 19.33 | $ | 14.42 | ||||
| Third Quarter |
$ | 23.33 | $ | 17.11 | ||||
| Fourth Quarter |
$ | 23.89 | $ | 17.52 | ||||
| Fiscal 2014 |
||||||||
| First Quarter |
$ | 19.49 | $ | 12.50 | ||||
| Second Quarter |
$ | 14.79 | $ | 12.06 | ||||
| Third Quarter |
$ | 14.77 | $ | 11.38 | ||||
| Fourth Quarter |
$ | 14.47 | $ | 9.91 | ||||
37
Table of Contents
Index to Financial Statements
Stock Performance Graph
The graph and table below compare the cumulative total stockholder return of our common shares with the cumulative total return of the S&P 500 Index and the Philadelphia Semiconductor Index (PHLX) from March 11, 2011 (the first trading date following the MagnaChip IPO) through December 31, 2014. The graph assumes that $100 was invested on March 11, 2011 in our common shares and in each index and that any dividends were reinvested. No cash dividends have been declared on our common shares since the MagnaChip IPO.
Comparison of Cumulative Total Return*
Among MagnaChip Semiconductor Corporation, the S&P 500 Index and the PHLX
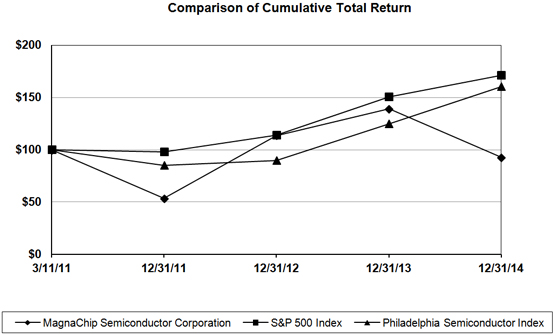
| * | The stock performance included in this graph is not necessarily indicative of future stock performance. |
Total Return to Stockholders (Including Reinvestment of Dividends)
Annual Return Percentage
| Company / Index |
12/31/2011 | 12/31/2012 | 12/31/2013 | 12/31/2014 | ||||||||||||
| MagnaChip Semiconductor Corporation |
-46.61 | 112.83 | 22.49 | -33.38 | ||||||||||||
| S&P 500 Index |
-1.86 | 16.00 | 32.39 | 13.69 | ||||||||||||
| Philadelphia Semiconductor Index |
-14.83 | 5.38 | 39.31 | 28.38 | ||||||||||||
Indexed Returns
| Company / Index |
Base Period 3/11/2011 |
12/31/2011 | 12/31/2012 | 12/31/2013 | 12/31/2014 | |||||||||||||||
| MagnaChip Semiconductor Corporation |
100 | 53.39 | 113.63 | 139.19 | 92.72 | |||||||||||||||
| S&P 500 Index |
100 | 98.14 | 113.84 | 150.72 | 171.35 | |||||||||||||||
| Philadelphia Semiconductor Index |
100 | 85.17 | 89.75 | 125.03 | 160.52 | |||||||||||||||
38
Table of Contents
Index to Financial Statements
Holders
The approximate number of record holders of our outstanding common stock as of May 1, 2015 was 83. This number does not include beneficial owners for whom shares are held by nominees in street name.
Dividends
We do not intend to pay any cash dividends on our common stock in the foreseeable future. We anticipate that we will retain all of our future earnings for use in the development of our business and for general corporate purposes. Any determination to pay dividends in the future will be at the discretion of our Board of Directors. The payment of cash dividends on our common stock is restricted under the terms of the indenture governing our 2021 Notes.
Issuer Purchases of Equity Securities
On October 7, 2011, our Board of Directors adopted a stock repurchase program whereby we may, subject to prevailing market conditions and other factors, repurchase up to $35.0 million of our outstanding common stock. Our Board of Directors extended and increased the program by an additional $25.0 million in August 2012, for a maximum aggregate repurchase amount under the original program of up to $60.0 million. On July 30, 2013, we announced that our Board of Directors approved a new stock repurchase program under which we are authorized to repurchase up to $100.0 million of our common stock. The new stock repurchase program was effective August 5, 2013 through December 15, 2014, and replaced the original stock repurchase program. The stock repurchase program did not require that we purchase a minimum amount of shares of our common stock and may be commenced, suspended, resumed or terminated at any time without notice. The timing and extent of any repurchases were dependent upon prevailing market conditions, the trading price of the Company’s common stock and other factors, and subject to contractual restrictions and restrictions under applicable law and regulations. As of December 31, 2013, we had repurchased 6,578,765 shares of our common stock in the open market under these programs at an aggregate cost of $90.9 million. In March 2014, our Board of Directors suspended the stock repurchase program indefinitely pending the completion of the independent investigation, and the stock repurchase program expired by its terms on December 15, 2014. Subsequent to December 31, 2013, we did not repurchase any shares under the stock repurchase program.
39
Table of Contents
Index to Financial Statements
Item 6. Selected Financial Data
The following tables set forth selected historical consolidated financial data of MagnaChip Semiconductor Corporation on or as of the dates and for the periods indicated. The selected historical consolidated financial data presented below should be read together with “Item 7. Management’s Discussion and Analysis of Financial Condition and Results of Operations” and our consolidated financial statements contained in “Item 8. Financial Statements and Supplementary Data,” including the notes to those consolidated financial statements, appearing elsewhere in this Report.
We have derived the selected consolidated financial data as of December 31, 2014 and 2013 and for the years ended December 31, 2014, 2013 and 2012 from the historical audited consolidated financial statements of the Company included in this Report. We have derived the selected consolidated financial data as of December 31, 2012 and 2011 and for the year ended December 31, 2011 from the audited consolidated financial statements of MagnaChip Semiconductor Corporation not included in this Report. We derived the selected consolidated financial data as of December 31, 2010 and for the year ended December 31, 2010 from the historical unaudited consolidated financial statements not included in this report, which were prepared on the same basis as our audited consolidated financial statements, and reflect adjustments to our previously filed consolidated financial statements. The historical unaudited consolidated financial data for the year ended December 31, 2010 also gives retroactive effect to the corporate conversion. The historical financial data of MagnaChip Semiconductor Corporation for any period are not necessarily indicative of the results to be expected in any future period.
| Year Ended December 31, 2014 |
Year Ended December 31, 2013 |
Year Ended December 31, 2012 |
Year Ended December 31, 2011 |
Year Ended December 31, 2010 |
||||||||||||||||
| (In millions, except per common unit/share data) | ||||||||||||||||||||
| Statements of Operations Data: |
||||||||||||||||||||
| Net sales |
$ | 698.2 | $ | 734.2 | $ | 807.3 | $ | 743.1 | $ | 771.2 | ||||||||||
| Cost of sales |
545.4 | 579.1 | 564.1 | 543.6 | 527.1 | |||||||||||||||
|
|
|
|
|
|
|
|
|
|
|
|||||||||||
| Gross profit |
152.9 | 155.1 | 243.2 | 199.5 | 244.1 | |||||||||||||||
| Selling, general and administrative expenses |
127.0 | 85.8 | 82.7 | 70.2 | 66.6 | |||||||||||||||
| Research and development expenses |
92.8 | 87.9 | 76.3 | 76.6 | 83.5 | |||||||||||||||
| Restructuring and impairment charges |
10.3 | 8.2 | — | 3.6 | 2.0 | |||||||||||||||
| Special expense for IPO incentive |
— | — | — | 12.1 | — | |||||||||||||||
|
|
|
|
|
|
|
|
|
|
|
|||||||||||
| Operating income (loss) from continuing operations |
(77.1 | ) | (26.8 | ) | 84.3 | 37.0 | 92.0 | |||||||||||||
| Interest expense, net |
(16.3 | ) | (20.4 | ) | (22.6 | ) | (25.0 | ) | (22.9 | ) | ||||||||||
| Foreign currency gain (loss), net |
(24.7 | ) | 16.8 | 57.3 | (11.3 | ) | 14.7 | |||||||||||||
| Loss on early extinguishment of senior notes |
— | (32.8 | ) | — | (5.5 | ) | — | |||||||||||||
| Others |
2.4 | 2.9 | 3.9 | 1.6 | (0.7 | ) | ||||||||||||||
|
|
|
|
|
|
|
|
|
|
|
|||||||||||
| (38.6 | ) | (33.5 | ) | 38.6 | (40.2 | ) | (8.9 | ) | ||||||||||||
|
|
|
|
|
|
|
|
|
|
|
|||||||||||
| Income (loss) from operations before income taxes |
(115.7 | ) | (60.2 | ) | 122.9 | (3.2 | ) | 83.1 | ||||||||||||
| Income tax expenses |
1.5 | 4.0 | 12.8 | 8.1 | 8.4 | |||||||||||||||
|
|
|
|
|
|
|
|
|
|
|
|||||||||||
| Net income (loss) |
$ | (117.2 | ) | $ | (64.2 | ) | $ | 110.0 | $ | (11.3 | ) | $ | 74.7 | |||||||
|
|
|
|
|
|
|
|
|
|
|
|||||||||||
| Net income (loss) attributable to common unit/share |
$ | (117.2 | ) | $ | (64.2 | ) | $ | 110.0 | $ | (11.3 | ) | $ | 74.7 | |||||||
|
|
|
|
|
|
|
|
|
|
|
|||||||||||
| Per unit/share data: |
||||||||||||||||||||
| Earnings (loss) per common unit/share— |
||||||||||||||||||||
| Basic |
$ | (3.44 | ) | $ | (1.82 | ) | $ | 3.01 | $ | (0.29 | ) | $ | 1.97 | |||||||
| Diluted |
$ | (3.44 | ) | $ | (1.82 | ) | $ | 2.93 | $ | (0.29 | ) | $ | 1.91 | |||||||
| Weighted average number of common units/shares |
||||||||||||||||||||
| Basic |
34.056 | 35.232 | 36.568 | 38.776 | 37.836 | |||||||||||||||
| Diluted |
34.056 | 35.232 | 37.533 | 38.776 | 39.144 | |||||||||||||||
| Balance Sheet Data (at period end): |
||||||||||||||||||||
| Cash and cash equivalents |
$ | 102.4 | $ | 153.6 | $ | 182.2 | $ | 162.1 | $ | 172.2 | ||||||||||
| Total assets |
527.7 | 625.2 | 680.7 | 579.3 | 625.7 | |||||||||||||||
| Total indebtedness(1) |
224.0 | 223.9 | 201.7 | 204.2 | 246.9 | |||||||||||||||
| Long-term obligations(2) |
224.0 | 223.9 | 201.7 | 201.4 | 250.0 | |||||||||||||||
| Stockholders’/Unitholders’ equity (deficit) |
(18.5 | ) | 81.5 | 191.5 | 134.2 | 161.2 | ||||||||||||||
| Supplemental Data (unaudited): |
||||||||||||||||||||
| Adjusted EBITDA(3) |
$ | 8.5 | $ | 20.0 | $ | 124.3 | ||||||||||||||
| Adjusted Net Income (Loss)(4) |
$ | (38.1 | ) | $ | (31.5 | ) | $ | 64.5 | ||||||||||||
40
Table of Contents
Index to Financial Statements
| (1) | Total indebtedness is calculated as long and short-term borrowings, including the current portion of capital lease obligation. |
| (2) | Long-term obligations include long-term borrowings and capital leases. |
| (3) | We define Adjusted EBITDA for the periods indicated as net income (loss), adjusted to exclude (i) depreciation and amortization, (ii) interest expense, net, (iii) income tax expenses (benefits), (iv) restructuring and impairment charges, (v) equity-based compensation expense, (vi) foreign currency loss (gain), net, (vii) derivative valuation loss (gain), net, (viii) secondary offering and others, (ix) loss on early extinguishment of senior notes and (x) restatement related expenses. This is a non-US GAAP financial measure and is discussed under “Item 7. Management’s Discussion and Analysis of Financial Condition and Results of Operations—Explanation and Reconciliation of Non-US GAAP measures—Adjusted EBITDA and Adjusted Net Income.” |
| (4) | We define Adjusted Net Income for the periods indicated as net income (loss), adjusted to exclude (i) restructuring and impairment charges, (ii) equity-based compensation expense, (iii) amortization of intangibles, (iv) foreign currency loss (gain), net, (v) derivative valuation loss (gain), net, (vi) secondary offering and others, (vii) loss on early extinguishment of senior notes and (viii) restatement related expenses. This is a non-US GAAP financial measure and is discussed under “Item 7. Management’s Discussion and Analysis of Financial Condition and Results of Operations—Explanation and Reconciliation of Non-US GAAP measures—Adjusted EBITDA and Adjusted Net Income.” |
41
Table of Contents
Index to Financial Statements
Item 7. Management’s Discussion and Analysis of Financial Condition and Results of Operations
The following discussion and analysis should be read in conjunction with the audited consolidated financial statements and unaudited consolidated interim financial statements, together in each case with the related notes, included elsewhere in this Report. This discussion and analysis contains, in addition to historical information, forward-looking statements that include risks and uncertainties. Our actual results may differ materially from those anticipated in these forward-looking statements as a result of certain factors, including those set forth under the heading “Risk Factors” and elsewhere in this Report.
Overview
We are a Korea-based designer and manufacturer of analog and mixed-signal semiconductor products for consumer, computing, communication, industrial, automotive and IoT applications. We provide technology platforms for analog, mixed-signal, power, high voltage, non-volatile memory, and RF applications. We have a proven record with a 30-year operating history, large portfolio of approximately 2,917 registered novel patents and 141 pending novel patent applications and extensive engineering and manufacturing process expertise. Our business is comprised of three key business lines: Display Solutions, Power Solutions and Semiconductor Manufacturing Services. Our Display Solutions products provide flat panel display solutions to major suppliers of large and small flat panel display. Our Power Solutions products include discrete and integrated circuit solutions for power management in consumer, computing, communication and industrial applications. Our Semiconductor Manufacturing Services provide specialty analog and mixed-signal foundry services mainly for fabless and IDM semiconductor companies that primarily serve the consumer, computing, communication, industrial, automotive and IoT applications.
Our wide variety of analog and mixed-signal semiconductor products and manufacturing services combined with our mature technology platform allow us to address multiple high-growth end markets and to rapidly develop and introduce new products and services in response to market demands. Our design center and substantial manufacturing operations in Korea place us at the core of the global electronics device supply chain. We believe this enables us to quickly and efficiently respond to our customers’ needs and allows us to better serve and capture additional demand from existing and new customers.
To maintain and increase our profitability, we must accurately forecast trends in demand for electronics devices that incorporate semiconductor products we produce. We must understand our customers’ needs as well as the likely end market trends and demand in the markets they serve. We must balance the likely manufacturing utilization demand of our product businesses and foundry business to optimize our capacity utilization. We must also invest in relevant research and development activities and manufacturing capacity and purchase necessary materials on a timely basis to meet our customers’ demand while maintaining our target margins and cash flow.
The semiconductor markets in which we participate are highly competitive. The prices of our products tend to decrease regularly over their useful lives, and such price decreases can be significant as new generations of products are introduced by us or our competitors. We strive to offset the impact of declining selling prices for existing products through cost reductions and the introduction of new products that command selling prices above the average selling price of our existing products. In addition, we seek to manage our inventories and manufacturing capacity so as to mitigate the risk of losses from product obsolescence.
Demand for our products and services is driven by overall demand for consumer, communication and computing products and can be adversely affected by periods of weak consumer and enterprise spending or by market share losses by our customers. In order to mitigate the impact of market volatility on our business, we are diversifying our portfolio of products, customers, and target applications. We also expect that new competitors will emerge in these markets that may place increased pressure on the pricing for our products and services. While we believe we are well-positioned competitively to compete in these markets and against these new competitors as a result of our long operating history, existing manufacturing capacity and our Korea-based operations, if we are not effective in competing in these markets our operating results may be adversely affected.
Within our Display Solutions and Power Solutions lines, net sales are driven by design wins in which we are selected by an electronics OEM or other potential customer to supply its demand for a particular product. A customer will often have more than one supplier designed in to multi-source components for a particular product line. Once we have design wins and the products enter into mass production, we often specify the pricing of a particular product for a set period of time, with periodic discussions and renegotiations of pricing with our customers. In any given period, our net sales depend heavily upon the end-market demand for the goods in which our products are used, the inventory levels maintained by our customers and in some cases, allocation of demand for components for a particular product among selected qualified suppliers.
Within the Semiconductor Manufacturing Services business, net sales are driven by customers’ decisions on which manufacturing services provider to use for a particular product. Most of our Semiconductor Manufacturing Services customers are fabless, while some are IDM customers. A customer will often have more than one supplier of manufacturing services. In any given period, our net sales
42
Table of Contents
Index to Financial Statements
depend heavily upon the end-market demand for the goods in which the products we manufacture for customers are used, the inventory levels maintained by our customers and, in some cases, allocation of demand for manufacturing services among selected qualified suppliers.
In contrast to fabless semiconductor companies, our internal manufacturing capacity provides us with greater control over manufacturing costs and the ability to implement process and production improvements which can favorably impact gross profit margins. Our internal manufacturing capacity also allows for better control over delivery schedules, improved consistency over product quality and reliability and improved ability to protect intellectual property from misappropriation. However, having internal manufacturing capacity exposes us to the risk of under-utilization of manufacturing capacity that results in lower gross profit margins, particularly during downturns in the semiconductor industry.
Our products and services require investments in capital equipment. Analog and mixed-signal manufacturing facilities and processes are typically distinguished by the design and process implementation expertise rather than the use of the most advanced equipment. These processes also tend to migrate more slowly to smaller geometries due to technological barriers and increased costs. For example, some of our products use high-voltage technology that requires larger geometries and that may not migrate to smaller geometries for several years, if at all. Additionally, the performance of many of our products is not necessarily dependent on geometry. As a result, our manufacturing base and strategy do not require substantial investment in leading edge process equipment, allowing us to utilize our facilities and equipment over an extended period of time with moderate required capital investments. Generally, incremental capacity expansions in our business line of the market result in more moderate industry capacity expansion as compared to leading edge processes. As a result, this market, and we, specifically, are less likely to experience significant industry overcapacity, which can cause product prices to decline significantly. In general, we seek to invest in manufacturing capacity that can be used for multiple high-value applications over an extended period of time. We believe this capital investment strategy enables us to optimize our capital investments and facilitates deeper and more diversified product and service offerings.
Our success going forward will depend upon our ability to adapt to future challenges such as the emergence of new competitors for our products and services or the consolidation of current competitors. Additionally, we must innovate to remain ahead of, or at least rapidly adapt to, technological breakthroughs that may lead to a significant change in the technology necessary to deliver our products and services. We believe that our established relationships and close collaboration with leading customers enhance our visibility into new product opportunities, market and technology trends and improve our ability to meet these challenges successfully. In our Semiconductor Manufacturing Services business, we strive to maintain competitiveness and our position as a primary manufacturing services provider to our customers by offering high-value added processes, high-flexibility and excellent service by tailoring existing standard processes to meet customers’ design needs and porting customers’ own process technologies into our fabrication facilities.
Other Significant Events
In January 2014, our Audit Committee commenced an internal investigation that resulted in the Restatement of certain financial statements for prior periods. As a result of the Restatement, we have incurred substantial accounting, legal and other related costs associated with the Restatement and certain litigation and other regulatory investigations and actions related thereto. We incurred Restatement related costs of $40.9 million for the year ended December 31, 2014, where there were no similar costs in 2013 or 2012. We expect to continue to incur substantial Restatement related costs in 2015 related to ongoing litigation and regulatory investigations, which could have a material adverse effect on our operating results and liquidity for the foreseeable future. See “—Liquidity and Capital Resources”
On September 13, 2013, we closed an underwritten registered public offering of 1,700,000 shares of our common stock owned by certain of our stockholders at a price per share of $21.20. We did not receive any proceeds from the sale of our common stock by the selling stockholders but paid certain expenses in connection with such secondary offering.
On July 18, 2013, we issued the 2021 Notes, at a price of 99.5%. Interest on the 2021 Notes accrues at a rate of 6.625% per annum, payable semi-annually on January 15 and July 15 of each year, beginning on January 15, 2014. We used net proceeds of the 2021 Notes, together with cash on hand, to repay all of our then outstanding 10.5% senior notes due April 15, 2018 (the “2018 Notes”), including applicable premium and accrued interest, and to pay related fees and expenses of the 2021 Notes offering.
On February 8, 2013, we closed an underwritten registered public offering of 5,750,000 shares of our common stock owned by certain of our stockholders at a price per share of $14.50. We did not receive any proceeds from the sale of our common stock by the selling stockholders but paid certain expenses in connection with such secondary offering.
On May 1, 2012, we closed an underwritten registered public offering of 7,000,000 shares of our common stock owned by certain of our stockholders at a price per share of $11.40. We did not receive any proceeds from the sale of our common stock by the selling stockholders but paid certain expenses in connection with such secondary offering.
43
Table of Contents
Index to Financial Statements
Business Lines
We operate three separate business lines within one segment: Display Solutions, Power Solutions and Semiconductor Manufacturing Services.
| • | Display Solutions: Our Display Solutions products include source and gate drivers and timing controllers that cover a wide range of flat panel displays used in UHD, HD, light emitting diode, or LED, 3D and OLED televisions, notebooks, mobile communications and entertainment devices. Our Display Solutions support the industry’s most advanced display technologies, such as AMOLEDs, and LTPS TFT, as well as high-volume display technologies such as a-Si TFTs. Our Display Solutions business represented 28.6%, 27.6% and 35.4% of our net sales for the fiscal years ended December 31, 2014, 2013 and 2012, respectively. |
| • | Power Solutions: Our Power Solutions line produces power management semiconductor products including discrete and integrated circuit solutions for power management in high-volume consumer applications. These products include MOSFETs, insulated-gate bipolar transistors (IGBTs) power modules, AC-DC converters, DC-DC converters, LED drivers, switching regulators and linear regulators for a range of devices, including televisions, smartphones, mobile phones, desktop PCs, notebooks, tablet PCs, other consumer electronics, and industrial applications such as power suppliers, LED lighting, motor control and home appliances. Our Power Solutions business represented 19.7%, 18.4% and 15.5% of our net sales for the fiscal years ended December 31, 2014, 2013 and 2012, respectively. |
| • | Semiconductor Manufacturing Services: Our Semiconductor Manufacturing Services line provides specialty analog and mixed-signal foundry services to fabless semiconductor companies and IDMs that serve the consumer, computing, communication, industrial, automotive and IoT applications. We manufacture wafers based on our customers’ product designs. We do not market these products directly to end customers but rather supply manufactured wafers and products to our customers to market to their end customers. We offer approximately 459 process flows to our manufacturing services customers. We also often partner with key customers to jointly develop or customize specialized processes that enable our customers to improve their products and allow us to develop unique manufacturing expertise. Our manufacturing services are targeted at customers who require differentiated, specialty analog and mixed-signal process technologies such as high voltage CMOS, embedded memory and power. These customers typically serve consumer, computing, communication, industrial, automotive and IoT applications. Our Semiconductor Manufacturing Services business represented 51.6%, 53.9% and 49.0% of our net sales for the fiscal years ended December 31, 2014, 2013 and 2012, respectively. |
Explanation and Reconciliation of Non-US GAAP Measures
Adjusted EBITDA and Adjusted Net Income
We use the terms Adjusted EBITDA and Adjusted Net Income throughout this Report. Adjusted EBITDA, as we define it, is a non-US GAAP measure. We define Adjusted EBITDA for the periods indicated as net income (loss), adjusted to exclude (i) depreciation and amortization, (ii) interest expense, net, (iii) income tax expenses (benefits), (iv) restructuring and impairment charges, (v) equity-based compensation expense, (vi) foreign currency loss (gain), net, (vii) derivative valuation loss (gain), net, (viii) secondary offering and others, (ix) loss on early extinguishment of senior notes and (x) restatement related expenses.
See the footnotes to the table below for further information regarding these items. We present Adjusted EBITDA as a supplemental measure of our performance because:
| • | Adjusted EBITDA eliminates the impact of a number of items that may be either one time or recurring items that we do not consider to be indicative of our core ongoing operating performance; |
| • | we believe that Adjusted EBITDA is an enterprise level performance measure commonly reported and widely used by analysts and investors in our industry; |
| • | our investor and analyst presentations will include Adjusted EBITDA; and |
| • | we believe that Adjusted EBITDA provides investors with a more consistent measurement of period to period performance of our core operations, as well as a comparison of our operating performance to that of other companies in our industry. |
We use Adjusted EBITDA in a number of ways, including:
| • | for planning purposes, including the preparation of our annual operating budget; |
| • | to evaluate the effectiveness of our enterprise level business strategies; |
| • | in communications with our Board of Directors concerning our consolidated financial performance; and |
| • | in certain of our compensation plans as a performance measure for determining incentive compensation payments. |
44
Table of Contents
Index to Financial Statements
We encourage you to evaluate each adjustment and the reasons we consider them appropriate. In evaluating Adjusted EBITDA, you should be aware that in the future we may incur expenses similar to the adjustments in this presentation. Adjusted EBITDA is not a measure defined in accordance with US GAAP and should not be construed as an alternative to income from continuing operations, cash flows from operating activities or net income (loss), as determined in accordance with US GAAP. A reconciliation of net income (loss) to Adjusted EBITDA is as follows:
| Year Ended December 31, 2014 |
Year Ended December 31, 2013 |
Year Ended December 31, 2012 |
||||||||||
| (In millions) | ||||||||||||
| Net Income (Loss) |
$ | (117.2 | ) | $ | (64.2 | ) | $ | 110.0 | ||||
| Adjustments: |
||||||||||||
| Depreciation and amortization |
30.0 | 32.7 | 32.1 | |||||||||
| Interest expense, net |
16.2 | 20.3 | 22.6 | |||||||||
| Income tax expenses |
1.5 | 4.0 | 12.8 | |||||||||
| Restructuring and impairment charges(a) |
10.3 | 8.2 | — | |||||||||
| Equity-based compensation expense(b) |
2.1 | 2.2 | 2.4 | |||||||||
| Foreign currency loss (gain), net(c) |
24.6 | (16.8 | ) | (57.3 | ) | |||||||
| Derivative valuation (gain), net(d) |
— | (0.6 | ) | (1.7 | ) | |||||||
| Secondary offering and others(e) |
— | 1.4 | 3.3 | |||||||||
| Loss on early extinguishment of senior notes(f) |
— | 32.8 | — | |||||||||
| Restatement related expenses(g) |
40.9 | — | — | |||||||||
|
|
|
|
|
|
|
|||||||
| Adjusted EBITDA |
$ | 8.5 | $ | 20.0 | $ | 124.3 | ||||||
|
|
|
|
|
|
|
|||||||
| (a) | This adjustment is comprised of all items included in the restructuring and impairment charges line item on our consolidated statements of operations, and eliminates the impact of restructuring and impairment charges related to (i) for 2014, the impact of impairment charges of $10.3 million related to the closure of our 6-inch fab, and (ii) for 2013, restructuring charges of $1.8 million related to the restructuring of our 6-inch fab, and the impact of impairment charges of $3.4 million related to the impairment of goodwill, $1.9 million related to the impairment of certain technology and $0.5 million of machinery and equipment purchased in connection with our acquisition of Dawin Electronics, which we refer to as the “Dawin acquisition,” and the impact of impairment charges of $0.6 million related to the impairment of certain existing technology. |
| (b) | This adjustment eliminates the impact of non-cash equity-based compensation expenses. Although we expect to incur non-cash equity-based compensation expenses in the future, we believe that analysts and investors will find it helpful to review our operating performance without the effects of these non-cash expenses, as supplemental information. |
| (c) | This adjustment eliminates the impact of non-cash foreign currency translation associated with intercompany debt obligations and foreign currency denominated receivables and payables, as well as the cash impact of foreign currency transaction gains or losses on collection of such receivables and payment of such payables. Although we expect to incur foreign currency translation gains or losses in the future, we believe that analysts and investors will find it helpful to review our operating performance without the effects of these primarily non-cash gains or losses, as supplemental information. |
| (d) | This adjustment eliminates the impact of gain or loss recognized in income on derivatives, which represents hedge ineffectiveness or derivatives value changes excluded from the risk being hedged. We enter into derivative transactions to mitigate foreign exchange risks. As our derivative transactions are limited to a certain portion of our expected cash flows denominated in U.S. dollars, and we do not enter into derivative transactions for trading or speculative purposes, we do not believe that these charges or gains are indicative of our core operating performance. |
| (e) | This adjustment eliminates expenses incurred for our secondary offerings in September 2013, February 2013 and May 2012 and for tax and dues related to value added tax return revisions in 2012. |
| (f) | This adjustment eliminates the impact of loss on repayment of $203.7 million aggregate principal amount of the 2018 Notes in 2013. |
| (g) | This adjustment eliminates expenses incurred in connection with the Audit Committee’s independent investigation and related restatement and litigation, primarily comprised of legal, audit and consulting fees. This amount does not include any allocation of internal costs related to the restatement. |
Adjusted EBITDA has limitations as an analytical tool, and you should not consider it in isolation, or as a substitute for analysis of our results as reported under GAAP. Some of these limitations are:
| • | Adjusted EBITDA does not reflect our cash expenditures, or future requirements, for capital expenditures or contractual commitments; |
| • | Adjusted EBITDA does not reflect changes in, or cash requirements for, our working capital needs; |
| • | Adjusted EBITDA does not reflect the interest expense, or the cash requirements necessary to service interest or principal payments, on our debt; |
| • | although depreciation and amortization are non-cash charges, the assets being depreciated and amortized will often have to be replaced in the future, and Adjusted EBITDA does not reflect any cash requirements for such replacements; |
| • | Adjusted EBITDA does not consider the potentially dilutive impact of issuing equity-based compensation to our management team and employees; |
45
Table of Contents
Index to Financial Statements
| • | Adjusted EBITDA does not reflect the costs of holding certain assets and liabilities in foreign currencies; and |
| • | other companies in our industry may calculate Adjusted EBITDA differently than we do, limiting its usefulness as a comparative measure. |
Because of these limitations, Adjusted EBITDA should not be considered as a measure of discretionary cash available to us to invest in the growth of our business. We compensate for these limitations by relying primarily on our US GAAP results and using Adjusted EBITDA only supplementally.
We present Adjusted Net Income as a further supplemental measure of our performance. We prepare Adjusted Net Income by adjusting net income (loss) to eliminate the impact of a number of non-cash expenses and other items that may be either one time or recurring that we do not consider to be indicative of our core ongoing operating performance. We believe that Adjusted Net Income is particularly useful because it reflects the impact of our asset base and capital structure on our operating performance. We present Adjusted Net Income for a number of reasons, including:
| • | we use Adjusted Net Income in communications with our Board of Directors concerning our consolidated financial performance; |
| • | we believe that Adjusted Net Income is an enterprise level performance measure commonly reported and widely used by analysts and investors in our industry; and |
| • | our investor and analyst presentations may include Adjusted Net Income. |
Adjusted Net Income is not a measure defined in accordance with US GAAP and should not be construed as an alternative to income from continuing operations, cash flows from operating activities or net income (loss), as determined in accordance with US GAAP. We encourage you to evaluate each adjustment and the reasons we consider them appropriate. Other companies in our industry may calculate Adjusted Net Income differently than we do, limiting its usefulness as a comparative measure. In addition, in evaluating Adjusted Net Income, you should be aware that in the future we may incur expenses similar to the adjustments in this presentation. We define Adjusted Net Income for the periods indicated as net income (loss), adjusted to exclude (i) restructuring and impairment charges, (ii) equity-based compensation expense, (iii) amortization of intangibles, (iv) foreign currency loss (gain), net, (v) derivative valuation loss (gain), net, (vi) secondary offering and others, (vii) loss on early extinguishment of senior notes and (viii) restatement related expenses.
The following table summarizes the adjustments to net income (loss) that we make in order to calculate Adjusted Net Income (Loss) for the periods indicated:
| Year Ended December 31, 2014 |
Year Ended December 31, 2013 |
Year Ended December 31, 2012 |
||||||||||
| (In millions) | ||||||||||||
| Net Income (Loss) |
$ | (117.2 | ) | $ | (64.2 | ) | $ | 110.0 | ||||
| Adjustments: |
||||||||||||
| Restructuring and impairment charges(a) |
10.3 | 8.2 | — | |||||||||
| Equity-based compensation expense(b) |
2.1 | 2.2 | 2.4 | |||||||||
| Amortization of intangibles(c) |
1.2 | 5.5 | 7.7 | |||||||||
| Foreign currency loss (gain), net(d) |
24.6 | (16.8 | ) | (57.3 | ) | |||||||
| Derivative valuation (gain), net(e) |
— | (0.6 | ) | (1.7 | ) | |||||||
| Secondary offering and others(f) |
— | 1.4 | 3.3 | |||||||||
| Loss on early extinguishment of senior notes(g) |
— | 32.8 | — | |||||||||
| Restatement related expenses(h) |
40.9 | — | — | |||||||||
|
|
|
|
|
|
|
|||||||
| Adjusted Net Income (Loss) |
$ | (38.1 | ) | $ | (31.5 | ) | $ | 64.5 | ||||
|
|
|
|
|
|
|
|||||||
| (a) | This adjustment is comprised of all items included in the restructuring and impairment charges line item on our consolidated statements of operations, and eliminates the impact of restructuring and impairment charges related to (i) for 2014, the impact of impairment charges of $10.3 million related to the closure of our 6-inch fab, and (ii) for 2013, restructuring charges of $1.8 million related to the restructuring of our 6-inch fab, and the impact of impairment charges of $3.4 million related to the impairment of goodwill, $1.9 million related to the impairment of certain technology and $0.5 million of machinery and equipment purchased in connection with the Dawin acquisition, and the impact of impairment charges of $0.6 million related to the impairment of certain existing technology. |
| (b) | This adjustment eliminates the impact of non-cash equity-based compensation expenses. Although we expect to incur non-cash equity-based compensation expenses in the future, we believe that analysts and investors will find it helpful to review our operating performance without the effects of these non-cash expenses, as supplemental information. |
| (c) | This adjustment eliminates the non-cash impact of amortization expense for intangible assets created as a result of the purchase accounting treatment of the Original Acquisition and other subsequent acquisitions, and from the application of fresh-start accounting in connection with the reorganization proceedings. We do not believe these non-cash amortization expenses for intangibles are indicative of our core ongoing operating performance because the assets would not have been capitalized on our balance sheet but for the application of purchase accounting or fresh-start accounting, as applicable. |
46
Table of Contents
Index to Financial Statements
| (d) | This adjustment eliminates the impact of non-cash foreign currency translation associated with intercompany debt obligations and foreign currency denominated receivables and payables, as well as the cash impact of foreign currency transaction gains or losses on collection of such receivables and payment of such payables. Although we expect to incur foreign currency translation gains or losses in the future, we believe that analysts and investors will find it helpful to review our operating performance without the effects of these primarily non-cash gains or losses, as supplemental information. |
| (e) | This adjustment eliminates the impact of gain or loss recognized in income on derivatives, which represents hedge ineffectiveness or derivatives value changes excluded from the risk being hedged. We enter into derivative transactions to mitigate foreign exchange risks. As our derivative transactions are limited to a certain portion of our expected cash flows denominated in U.S. dollars, and we do not enter into derivative transactions for trading or speculative purposes, we do not believe that these charges or gains are indicative of our core operating performance. |
| (f) | This adjustment eliminates expenses incurred for our secondary offerings in September 2013, February 2013 and May 2012 and for tax and dues related to value added tax return revisions in 2012. |
| (g) | This adjustment eliminates the impact of loss on repayment of $203.7 million aggregate principal amount of the 2018 Notes in 2013. |
| (h) | This adjustment eliminates expenses incurred in connection with the Audit Committee’s independent investigation and related restatement and litigation, primarily comprised of legal, audit and consulting fees. This amount does not include any allocation of internal costs related to the restatement. |
Adjusted Net Income has limitations as an analytical tool, and you should not consider it in isolation, or as a substitute for analysis of our results as reported under US GAAP. Some of these limitations are:
| • | Adjusted Net Income does not reflect our cash expenditures, or future requirements, for capital expenditures or contractual commitments; |
| • | Adjusted Net Income does not reflect changes in, or cash requirements for, our working capital needs; |
| • | Adjusted Net Income does not consider the potentially dilutive impact of issuing equity-based compensation to our management team and employees; |
| • | Adjusted Net Income does not reflect the costs of holding certain assets and liabilities in foreign currencies; and |
| • | other companies in our industry may calculate Adjusted Net Income differently than we do, limiting its usefulness as a comparative measure. |
Because of these limitations, Adjusted Net Income should not be considered as a measure of discretionary cash available to us to invest in the growth of our business. We compensate for these limitations by relying primarily on our US GAAP results and using Adjusted Net Income only supplementally.
In evaluating Adjusted EBITDA and Adjusted Net Income, you should be aware that in the future we may incur expenses similar to the adjustments in our presentation of Adjusted EBITDA and Adjusted Net Income. Our presentation of Adjusted EBITDA and Adjusted Net Income should not be construed as an inference that our future results will be unaffected by unusual or non-recurring items. Adjusted EBITDA and Adjusted Net Income are not measures defined in accordance with US GAAP and should not be construed as an alternative to operating income, cash flows from operating activities or net income (loss), as determined in accordance with US GAAP.
Our Adjusted EBITDA and Adjusted Net Loss for the year ended December 31, 2014 were $8.5 million and $38.1 million, respectively. Our Adjusted EBITDA and Adjusted Net Loss for the year ended December 31, 2013 were $20.0 million and $31.5 million, respectively. Our Adjusted EBITDA and Adjusted Net Income for the year ended December 31, 2012 were $124.3 million and $64.5 million, respectively.
47
Table of Contents
Index to Financial Statements
Factors Affecting Our Results of Operations
Net Sales. We derive virtually all of our sales (net of sales returns and allowances) from three business lines: Display Solutions, Power Solutions and Semiconductor Manufacturing Services. Our product inventory is primarily located in Korea and is available for drop shipment globally. Outside of Korea, we maintain limited product inventory, and our sales representatives generally relay orders to our factories in Korea for fulfillment. We have strategically located our sales and technical support offices near concentrations of major customers. Our sales offices are located in Korea, the United States, Japan and Greater China. Our network of authorized agents and distributors consists of agents in the United States and Europe and distributors and agents in the Asia Pacific region. Our net sales from All other consist principally of the disposal of waste materials.
We recognize revenue when risk and reward of ownership pass to the customer either upon shipment, upon product delivery at the customer’s location or upon customer acceptance, depending on the terms of the arrangement. For the years ended December 31, 2014 and 2013, we sold products to over 282 and 284 customers, respectively, and our net sales to our ten largest customers represented 61% and 59% of our net sales, respectively. We have a combined production capacity of over 127,000 eight-inch equivalent semiconductor wafers per month. We believe our large-scale, cost-effective fabrication facilities enable us to rapidly adjust our production levels to meet shifts in demand by our end customers.
Gross Profit. Our overall gross profit generally fluctuates as a result of changes in overall sales volumes and in the average selling prices of our products and services. Other factors that influence our gross profit include changes in product mix, the introduction of new products and services and subsequent generations of existing products and services, shifts in the utilization of our manufacturing facilities and the yields achieved by our manufacturing operations, changes in material, labor and other manufacturing costs including outsourced manufacturing expenses, and variation in depreciation expense.
Average Selling Prices. Average selling prices for our products tend to be highest at the time of introduction of new products which utilize the latest technology and tend to decrease over time as such products mature in the market and are replaced by next generation products. We strive to offset the impact of declining selling prices for existing products through our product development activities and by introducing new products that command selling prices above the average selling price of our existing products. In addition, we seek to manage our inventories and manufacturing capacity so as to preclude losses from product and productive capacity obsolescence.
Material Costs. Our cost of material consists of costs of raw materials, such as silicon wafers, chemicals, gases and tape, packaging supplies, equipment maintenance and depreciation expenses. We use processes that require specialized raw materials, such as silicon wafers, that are generally available from a limited number of suppliers. If demand increases or supplies decrease, the costs of our raw materials could significantly increase.
Labor Costs. A significant portion of our employees are located in Korea. Under Korean labor laws, most employees and certain executive officers with one or more years of service are entitled to severance benefits upon the termination of their employment based on their length of service and rate of pay. As of December 31, 2014, approximately 98% of our employees were eligible for severance benefits.
Depreciation Expense. We periodically evaluate the carrying values of long-lived assets, including property, plant and equipment and intangible assets, as well as the related depreciation periods. We depreciated our property, plant and equipment using the straight-line method over the estimated useful lives of our assets. Depreciation rates vary from 30-40 years on buildings to 5 to 12 years for certain equipment and assets. Our evaluation of carrying values is based on various analyses including cash flow and profitability projections. If our projections indicate that future undiscounted cash flows are not sufficient to recover the carrying values of the related long-lived assets, the carrying value of the assets is impaired and will be reduced, with the reduction charged to expense so that the carrying value is equal to fair value.
Selling Expenses. We sell our products worldwide through a direct sales force as well as a network of sales agents and representatives to OEMs, including major branded customers and contract manufacturers, and indirectly through distributors. Selling expenses consist primarily of the personnel costs for the members of our direct sales force, a network of sales representatives and other costs of distribution. Personnel costs include base salary, benefits and incentive compensation.
General and Administrative Expenses. General and administrative expenses consist of the costs of various corporate operations, including finance, legal, human resources and other administrative functions. These expenses primarily consist of payroll-related expenses, consulting and other professional fees and office facility-related expenses.
Research and Development. The rapid technological change and product obsolescence that characterize our industry require us to make continuous investments in research and development. Product development time frames vary but, in general, we incur research and development costs one to two years before generating sales from the associated new products. These expenses include personnel costs for members of our engineering workforce, cost of photomasks, silicon wafers and other non-recurring engineering charges related to product design. Additionally, we develop base line process technology through experimentation and through the design and use of characterization wafers that help achieve commercially feasible yields for new products. The majority of research and development expenses are for process development that serves as a common technology platform for all of our product lines.
48
Table of Contents
Index to Financial Statements
Restructuring and Impairment Charges. We evaluate the recoverability of certain long-lived assets and in-process research and development assets on a periodic basis or whenever events or changes in circumstances indicate that the carrying value may not be recoverable. In our efforts to improve our overall profitability in future periods, we have closed or otherwise impaired, and may in the future close or impair, facilities that are underutilized and that are no longer aligned with our long-term business goals.
Interest Expense, Net. Our interest expense was incurred primarily under the 2018 Notes and the 2021 Notes.
Impact of Foreign Currency Exchange Rates on Reported Results of Operations. Historically, a portion of our revenues and greater than the majority of our operating expenses and costs of sales have been denominated in non-U.S. currencies, principally the Korean won, and we expect that this will remain true in the future. Because we report our results of operations in U.S. dollars converted from our non-U.S. revenues and expenses based on monthly average exchange rates, changes in the exchange rate between the Korean won and the U.S. dollar could materially impact our reported results of operations and distort period to period comparisons. In particular, because of the difference in the amount of our consolidated revenues and expenses that are in U.S. dollars relative to Korean won, depreciation in the U.S. dollar relative to the Korean won could result in a material increase in reported costs relative to revenues, and therefore could cause our profit margins and operating income (loss) to appear to decline materially, particularly relative to prior periods. The converse is true if the U.S. dollar were to appreciate relative to the Korean won. Moreover, our foreign currency gain or loss would be affected by changes in the exchange rate between the Korean won and the U.S. dollar as a substantial portion of non-cash translation gain or loss is associated with the intercompany long-term loans to our Korean subsidiary, which is denominated in U.S. dollars. As of December 31, 2014, the outstanding intercompany loan balance including accrued interests between the Korean subsidiary and the Dutch subsidiary was $766 million. As a result of such foreign currency fluctuations, it could be more difficult to detect underlying trends in our business and results of operations. In addition, to the extent that fluctuations in currency exchange rates cause our results of operations to differ from our expectations or the expectations of our investors, the trading price of our stock could be adversely affected.
From time to time, we may engage in exchange rate hedging activities in an effort to mitigate the impact of exchange rate fluctuations. Our Korean subsidiary enters into foreign currency forward and zero cost collar contracts in order to mitigate a portion of the impact of U.S. dollar-Korean won exchange rate fluctuations on our operating results. Obligations under these foreign currency forward and zero cost collar contracts must be cash collateralized if our exposure exceeds certain specified thresholds. These forward and zero cost collar contracts may be terminated by the counterparty in a number of circumstances, including if our total cash and cash equivalents is less than $30.0 million at the end of a fiscal quarter unless a waiver is obtained from the counterparty. We cannot assure that any hedging technique we implement will be effective. If our hedging activities are not effective, changes in currency exchange rates may have a more significant impact on our results of operations.
Foreign Currency Gain or Loss. Foreign currency translation gains or losses on transactions by us or our subsidiaries in a currency other than our or our subsidiaries’ functional currency are included in our statements of operations as a component of other income (expense). A substantial portion of this net foreign currency gain or loss relates to non-cash translation gain or loss related to the principal balance of intercompany balances at our Korean subsidiary that are denominated in U.S. dollars. This gain or loss results from fluctuations in the exchange rate between the Korean won and U.S. dollar.
Income Taxes. We record our income taxes in each of the tax jurisdictions in which we operate. This process involves using an asset and liability approach whereby deferred tax assets and liabilities are recorded for differences in the financial reporting bases and tax bases of our assets and liabilities. We exercise significant management judgment in determining our provision for income taxes, deferred tax assets and liabilities. We assess whether it is more likely than not that the deferred tax assets existing at the period-end will be realized in future periods. In such assessment, we consider all available positive and negative evidence, including scheduled reversals of deferred tax liabilities, projected future taxable income, tax planning strategies and recent results of operations. In the event we were to determine that we would be able to realize the deferred income tax assets in the future in excess of their net recorded amount, we would adjust the valuation allowance, which would reduce the provision for income taxes.
Our operations are subject to income and transaction taxes in the United States and in multiple foreign jurisdictions, including Korea. Significant estimates and judgments are required in determining our worldwide provision for income taxes. Some of these estimates are based on interpretations of existing tax laws or regulations. The ultimate amount of tax liability may be uncertain as a result.
Capital Expenditures. We invest in manufacturing equipment, software design tools and other tangible and intangible assets for capacity expansion and technology improvement. Capacity expansions and technology improvements typically occur in anticipation of increases in demand. We typically pay for capital expenditures in partial installments with portions due on order, delivery and final acceptance. Our capital expenditures include our payments for the purchase of property, plant and equipment as well as payments for the registration of intellectual property rights.
Inventories. We monitor our inventory levels in light of product development changes and market expectations. We may be required to take additional charges for quantities in excess of demand, cost in excess of market value and product age. Our analysis may take into consideration historical usage, expected demand, anticipated sales price, new product development schedules, the effect new products might have on the sales of existing products, product age, customer design activity, customer concentration and other factors. These forecasts require us to estimate our ability to predict demand for current and future products and compare those estimates with our current inventory levels and inventory purchase commitments. Our forecasts for our inventory may differ from actual inventory use.
49
Table of Contents
Index to Financial Statements
Results of Operations
The following table sets forth, for the periods indicated, certain information related to our operations, expressed in U.S. dollars and as a percentage of our net sales:
| Year Ended December 31, 2014 |
Year Ended December 31, 2013 |
Year Ended December 31, 2012 |
||||||||||||||||||||||
| Amount | % of net sales |
Amount | % of net sales |
Amount | % of net sales |
|||||||||||||||||||
| (In millions) | ||||||||||||||||||||||||
| Consolidated statements of operations data: |
||||||||||||||||||||||||
| Net sales |
$ | 698.2 | 100.0 | % | $ | 734.2 | 100.0 | % | $ | 807.3 | 100.0 | % | ||||||||||||
| Cost of sales |
545.4 | 78.1 | 579.1 | 78.9 | 564.1 | 69.9 | ||||||||||||||||||
|
|
|
|
|
|
|
|||||||||||||||||||
| Gross profit |
152.9 | 21.9 | 155.1 | 21.1 | 243.2 | 30.1 | ||||||||||||||||||
| Selling, general and administrative expenses |
127.0 | 18.2 | 85.8 | 11.7 | 82.7 | 10.2 | ||||||||||||||||||
| Research and development expenses |
92.8 | 13.3 | 87.9 | 12.0 | 76.3 | 9.4 | ||||||||||||||||||
| Restructuring and impairment charges |
10.3 | 1.5 | 8.2 | 1.1 | — | — | ||||||||||||||||||
|
|
|
|
|
|
|
|||||||||||||||||||
| Operating income (loss) |
(77.1 | ) | (11.0 | ) | (26.8 | ) | (3.6 | ) | 84.3 | 10.4 | ||||||||||||||
| Interest expense, net |
(16.3 | ) | (2.3 | ) | (20.4 | ) | (2.8 | ) | (22.6 | ) | (2.8 | ) | ||||||||||||
| Foreign currency gain (loss), net |
(24.7 | ) | (3.5 | ) | 16.8 | 2.3 | 57.3 | 7.1 | ||||||||||||||||
| Loss on early extinguishment of senior notes |
— | — | (32.8 | ) | (4.5 | ) | — | — | ||||||||||||||||
| Others |
2.4 | 0.3 | 2.9 | 0.4 | 3.9 | 0.5 | ||||||||||||||||||
|
|
|
|
|
|
|
|||||||||||||||||||
| (38.6 | ) | (5.5 | ) | (33.5 | ) | (4.6 | ) | 38.6 | 4.8 | |||||||||||||||
|
|
|
|
|
|
|
|||||||||||||||||||
| Income (loss) before income taxes |
(115.7 | ) | (16.6 | ) | (60.2 | ) | (8.2 | ) | 122.9 | 15.2 | ||||||||||||||
| Income tax expenses |
1.5 | 0.2 | 4.0 | 0.5 | 12.8 | 1.6 | ||||||||||||||||||
|
|
|
|
|
|
|
|||||||||||||||||||
| Net income (loss) |
$ | (117.2 | ) | (16.8 | )% | $ | (64.2 | ) | (8.7 | )% | $ | 110.0 | 13.6 | % | ||||||||||
|
|
|
|
|
|
|
|||||||||||||||||||
| Net Sales: |
||||||||||||||||||||||||
| Display Solutions |
$ | 199.9 | 28.6 | % | $ | 203.0 | 27.6 | % | $ | 285.9 | 35.4 | % | ||||||||||||
| Power Solutions |
137.2 | 19.7 | 135.3 | 18.4 | 125.0 | 15.5 | ||||||||||||||||||
| Semiconductor Manufacturing Services |
360.5 | 51.6 | 395.4 | 53.9 | 395.9 | 49.0 | ||||||||||||||||||
| All other |
0.6 | 0.1 | 0.5 | 0.1 | 0.6 | 0.1 | ||||||||||||||||||
|
|
|
|
|
|
|
|
|
|
|
|
|
|||||||||||||
| $ | 698.2 | 100.0 | % | $ | 734.2 | 100.0 | % | $ | 807.3 | 100.0 | % | |||||||||||||
|
|
|
|
|
|
|
|
|
|
|
|
|
|||||||||||||
50
Table of Contents
Index to Financial Statements
Results of Operations—Comparison of Years Ended December 31, 2014 and 2013
The following table sets forth consolidated results of operations for the years ended December 31, 2014 and 2013:
| Year Ended December 31, 2014 |
Year Ended December 31, 2013 |
|||||||||||||||||||
| Amount | % of Net Sales |
Amount | % of Net Sales |
Change Amount |
||||||||||||||||
| (In millions) | ||||||||||||||||||||
| Net sales |
$ | 698.2 | 100.0 | % | $ | 734.2 | 100.0 | % | $ | (36.0 | ) | |||||||||
| Cost of sales |
545.4 | 78.1 | 579.1 | 78.9 | (33.8 | ) | ||||||||||||||
|
|
|
|
|
|
|
|||||||||||||||
| Gross profit |
152.9 | 21.9 | 155.1 | 21.1 | (2.2 | ) | ||||||||||||||
|
|
|
|
|
|
|
|||||||||||||||
| Selling, general and administrative expenses |
127.0 | 18.2 | 85.8 | 11.7 | 41.2 | |||||||||||||||
| Research and development expenses |
92.8 | 13.3 | 87.9 | 12.0 | 4.9 | |||||||||||||||
| Restructuring and impairment charges |
10.3 | 1.5 | 8.2 | 1.1 | 2.1 | |||||||||||||||
|
|
|
|
|
|
|
|||||||||||||||
| Operating loss |
(77.1 | ) | (11.0 | ) | (26.8 | ) | (3.6 | ) | (50.4 | ) | ||||||||||
|
|
|
|
|
|
|
|||||||||||||||
| Interest expense, net |
(16.3 | ) | (2.3 | ) | (20.4 | ) | (2.8 | ) | 4.1 | |||||||||||
| Foreign currency gain (loss), net |
(24.7 | ) | (3.5 | ) | 16.8 | 2.3 | (41.5 | ) | ||||||||||||
| Loss on early extinguishment of senior notes |
— | — | (32.8 | ) | (4.5 | ) | 32.8 | |||||||||||||
| Others |
2.4 | 0.3 | 2.9 | 0.4 | (0.5 | ) | ||||||||||||||
|
|
|
|
|
|
|
|||||||||||||||
| (38.6 | ) | (5.5 | ) | (33.5 | ) | (4.6 | ) | (5.1 | ) | |||||||||||
|
|
|
|
|
|
|
|||||||||||||||
| Loss before income taxes |
(115.7 | ) | (16.6 | ) | (60.2 | ) | (8.2 | ) | (55.5 | ) | ||||||||||
| Income tax expenses |
1.5 | 0.2 | 4.0 | 0.5 | (2.4 | ) | ||||||||||||||
|
|
|
|
|
|
|
|||||||||||||||
| Net loss |
$ | (117.2 | ) | (16.8 | )% | $ | (64.2 | ) | (8.7 | )% | $ | (53.0 | ) | |||||||
|
|
|
|
|
|
|
|||||||||||||||
|
Net Sales
|
||||||||||||||||||||
| Year
Ended December 31, 2014 |
Year
Ended December 31, 2013 |
|||||||||||||||||||
| Amount | % of Net Sales |
Amount | % of Net Sales |
Change Amount |
||||||||||||||||
| (In millions) | ||||||||||||||||||||
| Display Solutions |
$ | 199.9 | 28.6 | % | $ | 203.0 | 27.6 | % | $ | (3.1 | ) | |||||||||
| Power Solutions |
137.2 | 19.7 | 135.3 | 18.4 | 1.9 | |||||||||||||||
| Semiconductor Manufacturing Services |
360.5 | 51.6 | 395.4 | 53.9 | (34.8 | ) | ||||||||||||||
| All other |
0.6 | 0.1 | 0.5 | 0.1 | — | |||||||||||||||
|
|
|
|
|
|
|
|
|
|
|
|||||||||||
| $ | 698.2 | 100.0 | % | $ | 734.2 | 100.0 | % | $ | (36.0 | ) | ||||||||||
|
|
|
|
|
|
|
|
|
|
|
|||||||||||
Net sales were $698.2 million for the year ended December 31, 2014, a $36.0 million, or 4.9%, decrease compared to $734.2 million for the year ended December 31, 2013. Net sales declined in 2014 compared to fiscal year 2013 primarily as a result of significant decrease in revenue related to our Semiconductor Manufacturing Services line as described below.
Display Solutions. Net sales from our Display Solutions line were $199.9 million for the year ended December 31, 2014, a $3.1 million, or 1.5%, decrease compared to $203.0 million for the year ended December 31, 2013. The decline is primarily due to lower sales of large display products by $23.0 million, offset by the increase in sales of $19.5 million in the mid-range smartphone market.
Power Solutions. Net sales from our Power Solutions line were $137.2 million for the year ended December 31, 2014, a $1.9 million, or 1.4%, increase compared to $135.3 million for the year ended December 31, 2013. The increase in sales of premium products such as Super Junction MOSFETs positively impacted our overall revenue and sales volume.
Semiconductor Manufacturing Services. Net sales from our Semiconductor Manufacturing Services line were $360.5 million for the year ended December 31, 2014, a $34.8 million, or 8.8%, decrease compared to $395.4 million for the year ended December 31, 2013. The decrease was attributable to reduced levels of demand for our products by customers primarily serving the smartphone market.
All Other. All other net sales were $0.6 million for the year ended December 31, 2014 and $0.5 million for the year ended December 31, 2013.
51
Table of Contents
Index to Financial Statements
Net Sales by Geographic Region
We report net sales by geographic region based on the location of customers. Revenue from a foreign subsidiary of a multi-national corporation is classified based on the location of the subsidiary. The following table sets forth our net sales by geographic region and the percentage of total net sales represented by each geographic region for the years ended December 31, 2014 and 2013:
| Year Ended December 31, 2014 |
Year Ended December 31, 2013 |
|||||||||||||||||||
| Amount | % of Net Sales |
Amount | % of Net Sales |
Change Amount |
||||||||||||||||
| (In millions) | ||||||||||||||||||||
| Korea |
$ | 260.1 | 37.3 | % | $ | 313.6 | 42.7 | % | $ | (53.5 | ) | |||||||||
| Asia Pacific (other than Korea) |
324.2 | 46.4 | 284.4 | 38.7 | 39.8 | |||||||||||||||
| U.S.A. |
91.3 | 13.1 | 100.8 | 13.7 | (9.5 | ) | ||||||||||||||
| Europe |
21.2 | 3.0 | 32.1 | 4.4 | (11.0 | ) | ||||||||||||||
| Others |
1.4 | 0.2 | 3.2 | 0.4 | (1.8 | ) | ||||||||||||||
|
|
|
|
|
|
|
|
|
|
|
|||||||||||
| $ | 698.2 | 100.0 | % | $ | 734.2 | 100.0 | % | $ | (36.0 | ) | ||||||||||
|
|
|
|
|
|
|
|
|
|
|
|||||||||||
Net sales in Korea for the year ended December 31, 2014 decreased from $313.6 million to $260.1 million compared to the year ended December 31, 2013, or by $53.5 million, or 17.1%, primarily due to the decline in demand for our products for large display applications, discontinued use of a distributor in Korea and selling direct to OEM subsidiaries in Asia Pacific. Net sales in Asia Pacific for the year ended December 31, 2014 increased from $284.4 million to $324.2 million compared to the year ended December 31, 2013, or by $39.8 million, or 14.0%. The increase was attributable to the discontinued use of a distributor in Korea and selling direct to OEM subsidiaries in Asia Pacific.
Net sales in the U.S. for the year ended December 31, 2014 decreased from $100.8 million to $91.3 million compared to the year ended December 31, 2013, or by $9.5 million, or 9.4%. Net sales in Europe for the year ended December 31, 2014 decreased from $32.1 million to $21.2 million compared to the year ended December 31, 2013, or by $11.0 million, or 34.2%. The decreases in net sales in the U.S. and Europe were primarily due to the decrease in demand from our customers in the high end smartphone market.
Gross Profit
Total gross profit was $152.9 million for the year ended December 31, 2014 compared to $155.1 million for the year ended December 31, 2013, a $2.2 million, or 1.4%, decrease. Gross profit as a percentage of net sales for the year ended December 31, 2014 increased to 21.9% compared to 21.1% for the year ended December 31, 2013.
The increase in gross profit as a percentage of net sales was attributable to the decrease in inventory reserves of $47.1 million, the decrease in non-recurring expenses of $11.0 million related to the settlement of certain commercial disputes and the decrease in non-recurring expense accrual of $11.7 million related to the revised definition of “ordinary wages” based on the Korean Supreme Court’s ruling recorded in 2013. These factors were offset by the negative impact of unfavorable product mix and a lower utilization rate. Reduced levels of customer orders experienced by the Semiconductor Manufacturing Services line resulted in the low utilization rate.
Operating Expenses
Selling, General and Administrative Expenses. Selling, general and administrative expenses were $127.0 million, or 18.2% of net sales for the year ended December 31, 2014, compared to $85.8 million, or 11.7% of net sales for the year ended December 31, 2013. The increase of $41.2 million, or 48.0%, was primarily attributable to expenses of $40.9 million in outside service fees related to the Audit Committee’s independent investigation and related restatement and litigation, which are primarily comprised of legal, audit and consulting fees.
Research and Development (R&D) Expenses. Research and development expenses were $92.8 million, or 13.3% of net sales for the year ended December 31, 2014, compared to $87.9 million, or 12.0% of net sales for the year ended December 31, 2013. The increase of $4.9 million, or 5.6%, was due to an increase in direct material costs related to ongoing research and development activities and an increase in personnel costs.
Restructuring and Impairment Charges. Restructuring and impairment charges for the year ended December 31, 2014 were $10.3 million, or 1.5% of net sales, an increase of $2.1 million, or 25.1%, from $8.2 million, or 1.1% of net sales for the year ended December 31, 2013. Impairment charges of $10.3 million recorded for the year ended December 31, 2014 were related to the planned closure of our six-inch fabrication facilities. Restructuring charges of $1.8 million recorded for the year ended December 31, 2013 were related to the restructuring of our six-inch fabrication facilities. Impairment charges of $5.8 million for the year ended December 31, 2013 resulted from impairment of goodwill, certain technology and equipment of $3.4 million, $1.9 million and $0.5 million, respectively. These impairment charges related to goodwill, technology and equipment purchased in connection with the Dawin acquisition.
52
Table of Contents
Index to Financial Statements
Operating Income
As a result of the foregoing, operating loss increased by $50.4 million in the year ended December 31, 2014 compared to the year ended December 31, 2013. As discussed above, the increase in operating loss primarily resulted from a $41.2 million increase in selling, general and administrative expenses, which represent primarily outside service fees related to the Audit Committee’s independent investigation and related restatement and litigation, which are primarily comprised of legal, audit and consulting fees.
Other Income (Expense)
Interest Expense, Net. Net interest expense was $16.3 million for the year ended December 31, 2014, a decrease of $4.1 million compared to $20.4 million for the year ended December 31, 2013. The decrease of $4.1 million was primarily due to the repayment of the 2018 Notes and the issuance of the 2021 Notes in 2013.
Foreign Currency Gain, Net. Net foreign currency loss for the year ended December 31, 2014 was $24.7 million, compared to net foreign currency gain of $16.8 million for the year ended December 31, 2013. A substantial portion of our net foreign currency gain or loss is non-cash translation gain or loss associated with intercompany balances at our Korean subsidiary and is affected by changes in the exchange rate between the Korean won and the U.S. dollar. Foreign currency translation gain from intercompany balances was included in determining our consolidated net income since the intercompany balances were not considered long-term investments in nature because management intended to settle these intercompany balances at their respective maturity dates.
Loss on early extinguishment of senior notes. In August 2013, we repaid $203.7 million aggregate principal amount of the 2018 Notes. In relation with this repayment, we recognized $32.8 million of loss on early extinguishment of senior notes in 2013.
Others. Others were comprised of gains and losses on valuation of derivatives which were designated as hedging instruments. Net gain on valuation of derivatives for the year ended December 31, 2014 represents either hedge ineffectiveness or components of changes in fair value of derivatives excluded from the assessments of hedge effectiveness.
Income Tax Expenses
We are subject to income taxes in the United States and many foreign jurisdictions and our effective tax rate is affected by changes in the mix of earnings between countries with differing tax rates. Our primary foreign operations are in Korea where the statutory tax rate applicable to us was approximately 24.2% in 2014 and 2013. Statutory tax rates for all foreign subsidiaries other than our Japanese subsidiary were less than the U.S. federal statutory rate of 35%.
For the years ended December 31, 2014 and 2013, we recorded income tax expense of $1.5 million and $4.0 million, respectively. The effective tax rate was (1.3)% for the year ended December 31, 2014, as compared to (6.6)% for the year ended December 31, 2013. The income tax benefits computed at statutory tax rates for the years ended December 31, 2014 and 2013 were substantially offset by changes in valuation allowance, the difference in foreign tax rates lower than the U.S. federal statutory rate and withholding taxes in our Dutch subsidiary.
We make an ongoing assessment regarding the realization of U.S. and non-U.S. deferred tax assets. The valuation allowances at December 31, 2014 and 2013 are primarily attributable to net deferred tax assets at our Korean subsidiary for which, due to expected losses related to our Korean subsidiary in future years, we have recorded a full valuation allowance against the deferred tax assets, net of its deferred tax liabilities, and against certain of our foreign subsidiaries’ deferred tax assets pertaining to their related tax loss carry-forwards and tax credits that are not anticipated to generate a tax benefit.
Net Loss
As a result of the foregoing, net loss increased by $53.0 million in the year ended December 31, 2014 compared to the year ended December 31, 2013. As discussed above, the increase in net loss was primarily due to a $50.4 million increase in operating loss and a $41.5 million increase in foreign currency loss, partially offset by a $32.8 million decrease in loss on early extinguishment of senior notes.
53
Table of Contents
Index to Financial Statements
Results of Operations—Comparison of Years Ended December 31, 2013 and 2012
The following table sets forth consolidated results of operations for the year ended December 31, 2013 and 2012:
| Year Ended December 31, 2013 |
Year Ended December 31, 2012 |
|||||||||||||||||||
| Amount | % of Net Sales |
Amount | % of Net Sales |
Change Amount |
||||||||||||||||
| (In millions) | ||||||||||||||||||||
| Net sales |
$ | 734.2 | 100.0 | % | $ | 807.3 | 100.0 | % | $ | (73.2 | ) | |||||||||
| Cost of sales |
579.1 | 78.9 | 564.1 | 69.9 | 15.0 | |||||||||||||||
|
|
|
|
|
|
|
|||||||||||||||
| Gross profit |
155.1 | 21.1 | 243.2 | 30.1 | (88.2 | ) | ||||||||||||||
|
|
|
|
|
|
|
|||||||||||||||
| Selling, general and administrative expenses |
85.8 | 11.7 | 82.7 | 10.2 | 3.1 | |||||||||||||||
| Research and development expenses |
87.9 | 12.0 | 76.3 | 9.4 | 11.6 | |||||||||||||||
| Restructuring and impairment charges |
8.2 | 1.1 | — | — | 8.2 | |||||||||||||||
|
|
|
|
|
|
|
|||||||||||||||
| Operating income (loss) |
(26.8 | ) | (3.6 | ) | 84.3 | 10.4 | (111.1 | ) | ||||||||||||
|
|
|
|
|
|
|
|||||||||||||||
| Interest expense, net |
(20.4 | ) | (2.8 | ) | (22.6 | ) | (2.8 | ) | 2.2 | |||||||||||
| Foreign currency gain (loss), net |
16.8 | 2.3 | 57.3 | 7.1 | (40.4 | ) | ||||||||||||||
| Loss on early extinguishment of senior notes |
(32.8 | ) | (4.5 | ) | — | — | (32.8 | ) | ||||||||||||
| Others |
2.9 | 0.4 | 3.9 | 0.5 | (1.0 | ) | ||||||||||||||
|
|
|
|
|
|
|
|||||||||||||||
| (33.5 | ) | (4.6 | ) | 38.6 | 4.8 | (72.0 | ) | |||||||||||||
|
|
|
|
|
|
|
|||||||||||||||
| Income (loss) before income taxes |
(60.2 | ) | (8.2 | ) | 122.9 | 15.2 | (183.1 | ) | ||||||||||||
| Income tax expenses |
4.0 | 0.5 | 12.8 | 1.6 | (8.9 | ) | ||||||||||||||
|
|
|
|
|
|
|
|||||||||||||||
| Net income (loss) |
$ | (64.2 | ) | (8.7 | )% | $ | 110.0 | 13.6 | % | $ | (174.2 | ) | ||||||||
|
|
|
|
|
|
|
|||||||||||||||
|
Net Sales
|
||||||||||||||||||||
| Year Ended December 31, 2013 |
Year Ended December 31, 2012 |
|||||||||||||||||||
| As Restated | ||||||||||||||||||||
| Amount | % of Net Sales |
Amount | % of Net Sales |
Change Amount |
||||||||||||||||
| (In millions) | ||||||||||||||||||||
| Display Solutions |
$ | 203.0 | 27.6 | % | $ | 285.9 | 35.4 | % | $ | (83.0 | ) | |||||||||
| Power Solutions |
135.3 | 18.4 | 125.0 | 15.5 | 10.4 | |||||||||||||||
| Semiconductor Manufacturing Services |
395.4 | 53.9 | 395.9 | 49.0 | (0.5 | ) | ||||||||||||||
| All other |
0.5 | 0.1 | 0.6 | 0.1 | — | |||||||||||||||
|
|
|
|
|
|
|
|
|
|
|
|||||||||||
| $ | 734.2 | 100.0 | % | $ | 807.3 | 100.0 | % | $ | (73.2 | ) | ||||||||||
|
|
|
|
|
|
|
|
|
|
|
|||||||||||
Net sales were $734.2 million for the year ended December 31, 2013, a $73.2 million, or 9.1%, decrease compared to $807.3 million for the year ended December 31, 2012. Net sales declined in 2013 compared to fiscal year 2012 primarily as a result of significant decrease in revenue related to our Display Solutions line, which was offset by an increase in revenue related to our Power Solutions line as described below.
Display Solutions. Net sales from our Display Solutions line were $203.0 million for the year ended December 31, 2013, a $83.0 million, or 29.0%, decrease compared to $285.9 million for the year ended December 31, 2012. The decline in sales volume of our products, mainly related to large displays, contributed to a 44% decline in revenue, partially offset by positive contribution of 14% from the increase in average selling prices. The increase in sales of mobile display chips positively affected both sales volume and average selling prices.
Power Solutions. Net sales from our Power Solutions line were $135.3 million for the year ended December 31, 2013, a $10.4 million, or 8.3%, increase compared to $125.0 million for the year ended December 31, 2012. The increase in average selling prices contributed to a 6% increase in revenue, and the increase in sales volume of our products contributed to a 1% increase in revenue. The increase in sales of premium products such as Super Junction MOSFETs positively affected average selling prices, offset by slightly reduced volume for power modules.
Semiconductor Manufacturing Services. Net sales from our Semiconductor Manufacturing Services line were $395.4 million for the year ended December 31, 2013, a $0.5 million, or 0.1%, decrease compared to $395.9 million for the year ended December 31, 2012. The decrease in average selling prices contributed to a 1% decrease in revenue. The weak performance of our six-inch fabrication facilities negatively affected both average selling prices and sales volume.
54
Table of Contents
Index to Financial Statements
All Other. All other net sales were $0.5 million for the year ended December 31, 2013 and $0.6 million for the year ended December 31, 2012.
Net Sales by Geographic Region
We report net sales by geographic region based on the location of customers. Revenue from a foreign subsidiary of a multi-national corporation is classified based on the location of the subsidiary. The following table sets forth our net sales by geographic region and the percentage of total net sales represented by each geographic region for the years ended December 31, 2013 and 2012:
| Year Ended December 31, 2013 |
Year Ended December 31, 2012 |
|||||||||||||||||||
| As Restated | ||||||||||||||||||||
| Amount | % of Net Sales |
Amount | % of Net Sales |
Change Amount |
||||||||||||||||
| (In millions) | ||||||||||||||||||||
| Korea |
$ | 313.6 | 42.7 | % | $ | 365.7 | 45.3 | % | $ | (52.0 | ) | |||||||||
| Asia Pacific (other than Korea) |
284.4 | 38.7 | 271.9 | 33.7 | 12.5 | |||||||||||||||
| U.S.A. |
100.8 | 13.7 | 124.5 | 15.4 | (23.7 | ) | ||||||||||||||
| Europe |
32.1 | 4.4 | 39.3 | 4.9 | (7.2 | ) | ||||||||||||||
| Others |
3.2 | 0.4 | 6.0 | 0.7 | (2.8 | ) | ||||||||||||||
|
|
|
|
|
|
|
|
|
|
|
|||||||||||
| $ | 734.2 | 100.0 | % | $ | 807.3 | 100.0 | % | $ | (73.2 | ) | ||||||||||
|
|
|
|
|
|
|
|
|
|
|
|||||||||||
Net sales in Korea for the year ended December 31, 2013 decreased from $365.7 million to $313.6 million compared to the year ended December 31, 2012, or by $52.0 million, or 14.2%, primarily due to decreased demand in the market for Display Solutions products. Net sales in the U.S. for the year ended December 31, 2013 decreased from $124.5 million to $100.8 million compared to the year ended December 31, 2012, or by $23.7 million, or 19.0%, primarily due to decreased demand in the market for Semiconductor Manufacturing Services products serving the smartphone industry.
Gross Profit
Total gross profit was $155.1 million for the year ended December 31, 2013 compared to $243.2 million for the year ended December 31, 2012, a $88.2 million, or 36.3%, decrease. Gross profit as a percentage of net sales for the year ended December 31, 2013 decreased to 21.1% compared to 30.1% for the year ended December 31, 2012.
This decrease in gross profit and gross margin was primarily attributable to an increase in the impact from inventory reserve and write off of $33.4 million, non-recurring expenses of $12.8 million related to settlement of certain commercial disputes and expense accrual of $9.0 million related to the revised definition of “ordinary wages” based on the Korean Supreme Court’s ruling in December 2013. The increase in inventory reserves was a result of the failure of anticipated orders from customers materializing, which led to significantly higher excess and obsolete reserves. The inventory items related to these higher reserves are mainly comprised of highly customized products.
Additional factors that reduced gross profit and gross margin in 2013 compared to 2012 include a modest decline in the utilization rate, an increase in labor cost as a result of an increase in the average salary, and an increase in the electricity tariffs by Korea Electric Power Corporation. Gross profit and gross margin in 2013 were positively impacted by an increase in average selling prices described above.
Operating Expenses
Selling, General and Administrative Expenses. Selling, general and administrative expenses were $85.8 million, or 11.7% of net sales for the year ended December 31, 2013, compared to $82.7 million, or 10.2% of net sales for the year ended December 31, 2012. The increase of $3.1 million, or 3.7%, was primarily attributable to an increase in legal and other outside service fees, offset by a reduction in secondary offering related and other expenses from $3.3 million in 2012 to $1.4 million in 2013. The secondary offering related and other expenses of $3.3 million in 2012 include a $2.1 million one-time payment of custom duties and penalties related to the decision by Korea Customs Service on certain products manufactured by semiconductor companies operating in Korea that was not incurred in 2013. As a percentage of revenue, selling, general and administrative expenses increased because most expenses in U.S. dollars either remained flat or increased slightly, while revenue declined.
Research and Development Expenses. Research and development expenses for the year ended December 31, 2013 were $87.9 million, or 12.0% of net sales, an increase of $11.6 million, or 15.2%, from $76.3 million, or 9.4% of net sales for the year ended December 31, 2012. This increase was primarily due to an increase in use of our manufacturing facilities for R&D activities, increase in R&D headcount and increase in average salary in U.S. dollars.
Restructuring and Impairment Charges. Restructuring and impairment charges for the year ended December 31, 2013 were $8.2 million compared to nil for the year ended December 31, 2012. Restructuring charges of $1.8 million recorded for the year ended
55
Table of Contents
Index to Financial Statements
December 31, 2013 were related to the restructuring of our six-inch fabrication facilities. Impairment charges of $6.4 million for the year ended December 31, 2013 primarily resulted from $3.4 million of impairment to goodwill, $1.9 million of impairments of certain technology and $0.5 million impairments of machinery and equipment, all acquired from the Dawin acquisition, and $0.6 million of impairments of certain existing technology.
Operating Income
As a result of the foregoing, operating income decreased by $111.1 million in the year ended December 31, 2013 compared to the year ended December 31, 2012. As discussed above, the decrease in operating income primarily resulted from $88.2 million decrease in gross profit, $11.6 million increase in R&D and $8.2 million increase in restructuring and impairment charges.
Other Income (Expense)
Interest Expense, Net. Net interest expense was $20.4 million for the year ended December 31, 2013, a decrease of $2.2 million compared to $22.6 million for the year ended December 31, 2012. The decrease of $2.2 million was primarily due to the repayment of the 2018 Notes and the issuance of the 2021 Notes.
Foreign Currency Gain (Loss), Net. Net foreign currency gain for the year ended December 31, 2013 was $16.8 million, compared to $57.3 million for the year December 31, 2012. A substantial portion of our net foreign currency gain or loss is non-cash translation gain or loss associated with intercompany balances at our Korean subsidiary and is affected by changes in the exchange rate between the Korean won and the U.S. dollar. Foreign currency translation gain from intercompany balances was included in determining our consolidated net income since the intercompany balances were not considered long-term investments in nature because management intended to settle these intercompany balances at their respective maturity dates.
Loss on early extinguishment of senior notes. In August 2013, we repaid $203.7 million aggregate principal amount of the 2018 Notes. In relation with this repayment, we recognized $32.8 million of loss on early extinguishment of senior notes.
Others. Others were comprised of gains and losses on valuation of derivatives which were designated as hedging instruments. Net gain on valuation of derivatives for the year ended December 31, 2013 represents either hedge ineffectiveness or components of changes in fair value of derivatives excluded from the assessments of hedge effectiveness.
Income Tax Expenses
We are subject to income taxes in the United States and many foreign jurisdictions and our effective tax rate is affected by changes in the mix of earnings between countries with differing tax rates. Our primary foreign operations are in Korea where the statutory tax rate applicable to us was approximately 24.2% in 2013 and 2012. Statutory tax rates for all foreign subsidiaries other than our Japanese subsidiary were less than the U.S. federal statutory rate of 35%.
For the years ended December 31, 2013 and 2012, we recorded income tax expense of $4.0 million and $12.8 million, respectively. The effective tax rate was (6.6)% for the year ended December 31, 2013, as compared to 10.5% for the year ended December 31, 2012. A significant factor impacting our effective tax rate for the years ended December 31, 2013 and 2012 was intercompany interest related withholding taxes of $3.9 million and $4.2 million respectively. Such withholding taxes could be offset by application of foreign tax credits, but due to the uncertainty of utilization, a full valuation allowance was recognized.
The effective tax rate for the year ended December 31, 2012 was impacted by the utilization of loss carryforwards. In the year ended December 31, 2013, losses were recognized for which no tax benefit could be recognized. In addition, there was a $7.6 million effect of a deemed dividend under section 956 of the US Internal Revenue Code of 1986, as amended (“IRC”), in the year ended December 31, 2012.
Net Income
As a result of the foregoing, net income decreased by $174.2 million, or 158.3%, in the year ended December 31, 2013 compared to the year ended December 31, 2012. As discussed above, the decrease in net income was primarily due to a $40.4 million decrease in foreign currency gain, a $32.8 million loss on early extinguishment of senior notes and a $111.1 million decrease in operating income, partially offset by a $8.9 million decrease in income tax expenses and a $2.2 million decrease in interest expense.
56
Table of Contents
Index to Financial Statements
Liquidity and Capital Resources
Our principal capital requirements are to fund sales and marketing, invest in research and development and capital equipment, to make debt service payments and to fund working capital needs. We calculate working capital as current assets less current liabilities.
Our principal sources of liquidity are our cash, cash equivalents, our cash flows from operations and our financing activities. Our ability to manage cash and cash equivalents may be limited, as our primary cash flows are dictated by the terms of our sales and supply agreements, contractual obligations, debt instruments and legal and regulatory requirements. From time to time, we may sell accounts receivable to third parties under factoring agreements or engage in accounts receivable discounting to facilitate the collection of cash. For a description of our factoring arrangements and accounts receivable discounting, please see “Item 8. Financial Statements and Supplementary Data—Notes to Consolidated Financial Statements—Note 3. Accounts Receivable” included elsewhere in this Report. In addition, from time to time, we may make payments to our vendors on extended terms with their consent.
As of December 31, 2014, cash and cash equivalents held by our Korean subsidiary were $95.6 million, which represents 93.4% of our total cash and cash equivalents on a consolidated basis. We, as a holding company resident in the United States, issued our 2021 Notes. Payments under our outstanding 2021 Notes are currently funded in part by our Korean subsidiary’s repayment of its existing loans from our Dutch subsidiary, with our Dutch subsidiary using such repayments in turn to repay the loans owed to our Luxembourg subsidiary, which repays loans owed to us. We continue to analyze and review various repatriation strategies to continue to efficiently repatriate funds. Repatriation of funds could be subject to delay for local country approvals and could have potential adverse tax consequences.
Although we currently anticipate that our cash and cash equivalents on hand and cash flows from operations will be sufficient to meet our expected cash needs for the next twelve months, we may require or choose to obtain additional financing. If we raise additional funds through the issuance of equity, equity-linked or debt securities, those securities may have rights, preferences or privileges senior to the rights of our common stock, and our stockholders may experience dilution. If we need to raise additional funds in the future and are unable to do so or obtain additional financing on unfavorable terms in the future, it is possible we would have to limit certain planned activities including capital expenditures, sales and marketing, and research and development activities.
Year ended December 31, 2014 compared to year ended December 31, 2013
As of December 31, 2014, our cash and cash equivalents balance was $102.4 million, a $51.2 million decrease, compared to $153.6 million as of December 31, 2013. The decrease resulted from $37.5 million of cash outflow used in operating activities and $16.7 million of cash outflow used in investing activities, which was partially offset by $0.1 million of cash inflow provided by financing activities.
Cash outflow used in operating activities totaled $37.5 million for the year ended December 31, 2014, compared to $68.8 million of cash inflow provided by operating activities in the year ended December 31, 2013. The net operating cash outflow for the year ended December 31, 2014 reflects our net loss of $117.2 million and non-cash adjustments of $97.0 million, which mainly consisted of depreciation and amortization, provision for severance benefits, a loss on foreign currency translation and an increase in net operating assets of $17.2 million.
Our working capital balance as of December 31, 2014 was $106.8 million compared to $172.1 million as of December 31, 2013. The $65.3 million decrease was primarily attributable to a $51.2 million decrease in cash and cash equivalents and a $15.6 million increase in accrued expenses, primarily as a result of accrual of outside service fees related to the Audit Committee’s independent investigation and related Restatement and litigation.
Cash flow used in investing activities totaled $16.7 million in the year ended December 31, 2014, compared to $44.1 million of cash used in investing activities in the year ended December 31, 2013. The decrease was primarily due to a decrease in capital expenditures of $24.7 million.
Cash inflows generated by financing activities totaled $0.1 million for the year ended December 31, 2014, compared to $50.1 million of cash outflow used in financing activities for the year ended December 31, 2013. The financing cash outflow for the year ended December 31, 2013 mainly consisted of the repayment of $229.3 million of our 2018 Notes and the repurchase of $51.0 million of our outstanding common stock, which were offset by $11.4 million of proceed received from the issuance of common stock in connection with option and warrant exercises and the net proceeds of $218.8 million from the issuance of our 2021 Notes. We repurchased 2,614,748 shares of common stock at a cost of $51.0 million for the year ended December 31, 2013. In March 2014, our Board of Directors suspended the stock repurchase program indefinitely, and the stock repurchase program expired by its terms on December 15, 2014. Subsequent to December 31, 2013, we did not repurchase any shares under the stock repurchase program.
For the year ended December 31, 2014, capital expenditures were $18.4 million, a $24.7 million, or 57.4%, decrease from $43.1 million in the year ended December 31, 2013, due to reduced need for capital spending on technology upgrades as a result of the high level of spending in prior years.
57
Table of Contents
Index to Financial Statements
Year ended December 31, 2013 compared to year ended December 31, 2012
As of December 31, 2013, our cash and cash equivalents balance was $153.6 million, a $28.6 million decrease, compared to $182.2 million as of December 31, 2012. The decrease resulted from $44.1 million of cash outflow used in investing activities and $50.1 million of cash outflow used in financing activities including our repurchase of $51.0 million of our common stock, which was offset by $68.8 million of cash inflow provided by operating activities.
Cash inflows generated by operating activities totaled $68.8 million for the year ended December 31, 2013, compared to $118.1 million of cash provided by operating activities in the year ended December 31, 2012. The net operating cash inflow for the year ended December 31, 2013 reflects our net loss of $64.2 million and non-cash adjustments of $81.3 million, which mainly consisted of depreciation and amortization, provision for severance benefits, a loss on early extinguishment of senior notes and a decrease in net operating assets of $51.6 million.
Our working capital balance as of December 31, 2013 was $172.1 million compared to $238.6 million as of December 31, 2012. The $66.5 million decrease was primarily attributable to a $27.1 million decrease in accounts receivable, a $28.6 million decrease in cash and cash equivalents and a $18.1 million increase in accrued expense. Our accounts receivable balance declined due to increased collection efforts by the Company. The increase in accrued expense is a result of increased accrual of salaries and related benefits, settlement obligations and withholding taxes on interest.
Cash flows used in investing activities totaled $44.1 million in the year ended December 31, 2013, compared to $60.5 million of cash used in investing activities in the year ended December 31, 2012. The decrease was primarily due to a decrease in capital expenditures of $16.3 million and $8.6 million related to the Dawin acquisition, which were partially offset by a $6.7 million change in restricted cash.
Cash outflow used in financing activities totaled $50.1 million for the year ended December 31, 2013, compared to $30.1 million of cash outflow used in financing activities for the year ended December 31, 2012. The financing cash outflow for the year ended December 31, 2013 mainly consisted of the repayment of $229.3 million of our 2018 Notes and the repurchase of $51.0 million of our outstanding common stock, which were offset by $11.4 million of proceed received from the issuance of common stock in connection with option and warrant exercises and the net proceeds of $218.8 million from the issuance of our 2021 Notes. We repurchased 2,614,748 shares of common stock at a cost of $51.0 million for the year ended December 31, 2013.
For the year ended December 31, 2013, capital expenditures were $43.1 million, a $16.3 million, or 27.5%, decrease from $59.4 million in the year ended December 31, 2012. The decrease was primarily due to a comparatively larger high-technology investment in 2012.
Seasonality
Our net sales and number of distinct products sold are affected by market variations from quarter to quarter due to business cycles, and resulting product demand, of our customers. In our Display Solutions and Power Solutions business lines, consumer products manufacturers generally reduce orders in order to reduce excess inventory remaining from the holiday season. In our Semiconductor Manufacturing Services business, the supply-demand cycle is usually one quarter ahead of the broader semiconductor market due to lead time from wafer input to shipment to our customers, so the demand for these products tends to peak in the third quarter and is slower in the fourth and first quarters.
Contractual Obligations
The following summarizes our contractual obligations as of December 31, 2014:
| Payments Due by Period | ||||||||||||||||||||||||||||
| Total | 2015 | 2016 | 2017 | 2018 | 2019 | Thereafter | ||||||||||||||||||||||
| (In millions) | ||||||||||||||||||||||||||||
| Senior notes(1) |
$ | 329.3 | $ | 14.9 | $ | 14.9 | $ | 14.9 | $ | 14.9 | $ | 14.9 | $ | 254.8 | ||||||||||||||
| Operating lease(2) |
46.6 | 5.9 | 4.5 | 2.2 | 2.1 | 2.0 | 29.9 | |||||||||||||||||||||
| Others(3) |
12.7 | 9.1 | 3.7 | — | — | — | — | |||||||||||||||||||||
| (1) | Interest payments as well as $225.0 million aggregate principal amount of the 2021 Notes outstanding as of December 31, 2014, which bear interest at a rate of 6.625% per annum and are scheduled to mature in 2021. |
| (2) | Assumes constant currency exchange rate for Korean won to U.S. dollars of 1,099.2:1, the exchange rate as of December 31, 2014 |
| (3) | Includes license agreements and other contractual obligations. |
The indenture relating to the 2021 Notes contains covenants that limit our ability and our restricted subsidiaries to: (i) declare or pay any dividend or make any payment or distribution on account of or purchase or redeem our capital stock or equity interests of the restricted subsidiaries; (ii) make any principal payment on, or redeem or repurchase, prior to any scheduled repayment or maturity, any subordinated indebtedness; (iii) make certain investments; (iv) incur additional indebtedness and issue certain types of capital stock; (v) create or incur any lien (except for permitted liens) that secures obligations under any indebtedness; (vi) merge with or into or sell all or substantially all of our assets to other companies; (vii) enter into certain types of transactions with affiliates;
58
Table of Contents
Index to Financial Statements
(viii) guarantee the payment of any indebtedness; (ix) enter into sale-leaseback transactions; (x) enter into agreements that would restrict the ability of the restricted subsidiaries to make distributions with respect to their equity to us or other restricted subsidiaries, to make loans to us or other restricted subsidiaries or to transfer assets to us or other restricted subsidiaries; and (xi) designate unrestricted subsidiaries.
We lease land, office space and equipment under various operating lease agreements that expire through 2034.
We follow ASC guidance on uncertain tax positions. Our unrecognized tax benefits totaled $3.5 million as of December 31, 2014. These unrecognized tax benefits have been excluded from the above table because we cannot estimate the period of cash settlement with the respective taxing authorities.
Although we are obligated to pay severance benefits to eligible employees with one or more years of service upon the termination of their employment based on their length of service and rate pay, we have no obligation to fund the accrued severance benefits. Our accrued severance benefits totaled $139.2 million as of December 31, 2014. Our obligations in connection with severance benefits have been excluded from the above table because we are unable to reasonably estimate the rate of termination and related cash payments for future period.
Critical Accounting Policies and Estimates
Preparing financial statements in conformity with US GAAP requires management to make estimates and assumptions that affect the reported amounts of assets and liabilities as of the date of the financial statements, the reported amounts of revenues and expenses during the reporting periods and the related disclosures in our consolidated financial statements and accompanying notes.
We believe that our significant accounting policies, which are described in “Item 8. Financial Statements and Supplementary Data—Notes to Consolidated Financial Statements—Note 1. Business, Basis of Presentation and Significant Accounting Policies” included elsewhere in this Report, are critical due to the fact that they involve a high degree of judgment and estimates about the effects of matters that are inherently uncertain. We base these estimates and judgments on historical experience, knowledge of current conditions and other assumptions and information that we believe to be reasonable. Estimates and assumptions about future events and their effects cannot be determined with certainty. Accordingly, these estimates may change as new events occur, as more experience is acquired, as additional information is obtained and as the business environment in which we operate changes.
Revenue Recognition
Revenue is recognized when there is persuasive evidence of an arrangement, the price to the buyer is fixed or determinable, delivery has occurred and collectability of the sales price is reasonably assured. Revenue from the sale of products is recognized when title and risk of loss transfers to the customer, which is generally when the product is shipped to or accepted by the customer depending on the terms of the arrangement.
A portion of our sales are made through distributors for which revenue recognition criteria are usually met when the product is shipped to or accepted by the distributor, consistent with the principles described above. However, the risk of loss may not pass upon shipment of products to the distributor due to a variety of reasons, including the nature of the business arrangement with the distributors. For example, the financial condition of a distributor may indicate that payments by the distributor to us are contingent on resale of products to an end customer. In this situation, we defer recognition of revenue and cost of revenue on transactions with such distributor until the product has been resold to the end customer.
In accordance with revenue recognition guidance, any tax assessed by a governmental authority that is directly imposed on a revenue-producing transaction between a seller and a customer is presented in the statements of operations on a net basis (excluded from revenues).
We provide a warranty, under which customers can return defective products. We estimate the costs related to those defective product returns and record them as a component of cost of sales.
In addition, we offer sales returns (other than those that relate to defective products under warranty), yield provisions, cash discounts for early payments and certain allowances to our customers, including distributors. We record reserves for those returns, discounts and allowances as a deduction from sales, based on historical experience and other quantitative and qualitative factors.
All amounts billed to a customer related to shipping and handling are classified as sales while all costs incurred by us for shipping and handling are classified as selling, general and administrative expenses.
Sales of Accounts Receivable
We account for transfers of financial assets under ASC 860, “Transfers and Servicing,” as either sales or financings. Transfers of financial assets that result in sales accounting are those in which (1) the transfer legally isolates the transferred assets from the transferor, (2) the transferee has the right to pledge or exchange the transferred assets and no condition both constraints the transferee’s right to pledge or exchange the assets and provides more than a trivial benefit to the transferor and (3) the transferor does not maintain effective control over the transferred assets. If the transfer does not meet these criteria, the transfer is accounted for as a financing. Financial assets that are treated as sales are removed from our accounts with any realized gain or loss reflected in earning during the period of sale.
Product Warranties
We record, in other current liabilities, warranty liabilities for the estimated costs that may be incurred under our basic limited warranty. The standard limited warranty period is one year for the majority of products. This warranty covers defective products, and
59
Table of Contents
Index to Financial Statements
related liabilities are accrued when product revenues are recognized. Factors that affect our warranty liability include historical and anticipated rates of warranty claims and repair or replacement costs per claim to satisfy our warranty obligation. As these factors are impacted by actual experience and future expectations, we periodically assess the adequacy of our recorded warranty liabilities and adjust the amounts when necessary.
Inventories
Inventories are stated at the lower of cost or market, using the average cost method, which approximates the first in, first out method (“FIFO”). If net realizable value is less than cost at the balance sheet date, the carrying amount is reduced to the realizable value, and the difference is recognized as a loss on valuation of inventories within cost of sales. Inventory reserves are established when conditions indicate that the net realizable value is less than costs due to physical deterioration, obsolescence, changes in price levels or other causes based on individual facts and circumstances. Reserves are also established for excess inventory based on inventory levels in excess of six months of projected demand for each specific product.
In addition, as prescribed in ASC 330, “Inventory,” the cost of inventories is determined based on the normal capacity of each fabrication facility. In case the capacity utilization is lower than a certain level that management believes to be normal, the fixed overhead costs per production unit which exceed those under normal capacity are charged to cost of sales rather than capitalized as inventories.
Impairment of Long-Lived Assets
We review property, plant and equipment and other long-lived assets for impairment whenever events or changes in circumstances indicate that the carrying amount may not be recoverable in accordance with ASC 360, “Property, Plant and Equipment” (“ASC 360”). Recoverability is measured by comparing its carrying amount with the future net undiscounted cash flows the assets are expected to generate. If such assets are considered to be impaired, the impairment is measured as the difference between the carrying amount of the assets and the fair value of assets using the present value of the future net cash flows generated by the respective long-lived assets.
Intangible Assets
Intangible assets other than intellectual property include technology and customer relationships which are amortized on a straight-line basis over periods ranging from one to five years. Intellectual property assets acquired represent rights under patents, trademarks and property use rights and are amortized over their respective periods of benefit, ranging up to ten years, on a straight-line basis.
Income Taxes
We account for income taxes in accordance with ASC 740, “Income Taxes” (“ASC 740”). ASC 740 requires recognition of deferred tax assets and liabilities for the expected future tax consequences of events that have been recognized in a company’s financial statements or tax returns. Under this method, deferred tax assets and liabilities are determined based upon the difference between the financial statement carrying amounts and the tax bases of assets and liabilities using enacted tax rates in effect in the years in which the differences are expected to reverse. Valuation allowances are established when it is necessary to reduce deferred tax assets to the amount expected to be realized. Income tax expense is the tax payable for the period and the change during the period in deferred tax assets and liabilities.
We recognize and measure uncertain tax positions taken or expected to be taken in a tax return utilizing a two-step process. In the first step, recognition, we determine whether it is more-likely-than-not that a tax position will be sustained upon examination, including resolution of any related appeals or litigation processes, based on the technical merits of the position. The second step addresses measurement of a tax position that meets the more-likely-than-not criteria. The tax position is measured at the largest amount of benefit that has a likelihood of greater than 50 percent of being realized upon ultimate settlement.
Derivative Financial Instruments
We apply the provisions of ASC 815, “Derivatives and Hedging” (“ASC 815”). This Statement requires the recognition of all derivative instruments as either assets or liabilities measured at fair value.
Under the provisions of ASC 815, we may designate a derivative instrument as hedging the exposure to variability in expected future cash flows that are attributable to a particular risk (a “cash flow hedge”) or hedging the exposure to changes in the fair value of an asset or a liability (a “fair value hedge”). Special accounting for qualifying hedges allows the effective portion of a derivative instrument’s gains and losses to offset related results on the hedged item in the consolidated statements of operations and requires that a company formally document, designate and assess the effectiveness of the transactions that receive hedge accounting treatment. Both at the inception of a hedge and on an ongoing basis, a hedge must be expected to be highly effective in achieving offsetting changes in cash flows or fair value attributable to the underlying risk being hedged. If we determine that a derivative instrument is no longer highly effective as a hedge, it discontinues hedge accounting prospectively and future changes in the fair value of the derivative are recognized in current earnings. We assess hedge effectiveness at the end of each quarter.
60
Table of Contents
Index to Financial Statements
In accordance with ASC 815, changes in the fair value of derivative instruments that are cash flow hedges are recognized in accumulated other comprehensive income (loss) and reclassified into earnings in the period in which the hedged item affects earnings. Ineffective portions of a derivative instrument’s change in fair value are immediately recognized in earnings. Derivative instruments that do not qualify, or cease to qualify, as hedges must be adjusted to fair value and the adjustments are recorded through net income (loss).
The cash flows from derivative instruments receiving hedge accounting treatment are classified in the same categories as the hedged items in the consolidated statements of cash flows.
Recent Accounting Pronouncements
In April 2015, the FASB issued Accounting Standards Update. 2015-03, “Interest—Imputation of Interest” (“ASU 2015-03”). ASU 2015-03 requires that debt issuance costs are presented in the balance sheet as a direct deduction from the carrying amount of debt liability, consistent with debt discounts or premiums. The recognition and measurement guidance for debt issuance costs would not be affected. ASU 2015-03 is effective for annual reporting periods beginning after December 15, 2015, including interim periods within that reporting period. We are currently evaluating the impact of the adoption of ASU 2015-03 on our consolidated financial statements.
In August 2014, the FASB issued Accounting Standards Update No. 2014-15, “Presentation of Financial Statements – Going Concern” (“ASU 2014-15”), which provides guidance on determining when and how to disclose going-concern uncertainties in the financial statements. ASU 2014-15 requires management to perform interim and annual assessments of an entity’s ability to continue as a going concern within one year of the date the financial statements are issued. An entity will be required to provide certain disclosures if conditions of events raise substantial doubt about the entity’s ability to continue as a going concern. ASU 2014-15 is effective for annual periods ending after December 15, 2016, and interim periods thereafter, with early adoption permitted. We are currently evaluating the impact of the adoption of ASU 2014-15 on our consolidated financial statements.
In May 2014, the FASB issued Accounting Standards Update No. 2014-09 “Revenue from Contracts with Customers.” (“ASU 2014-09”). ASU 2014-09 supersedes the revenue recognition requirements in “Revenue Recognition (Topic 605)”, and requires entities to recognize revenue when it transfers promised goods or services to customers in an amount that reflects the consideration to which the entity expects to be entitled to in exchange for those goods or services. ASU 2014-09 is effective for annual reporting periods beginning after December 15, 2016, including interim periods within that reporting period. Early adoption is not permitted. We are currently evaluating the impact of the adoption of ASU 2014-09 on our consolidated financial statements.
61
Table of Contents
Index to Financial Statements
Item 7A. Quantitative and Qualitative Disclosures About Market Risk
We are exposed to the market risk that the value of a financial instrument will fluctuate due to changes in market conditions, primarily from changes in foreign currency exchange rates and interest rates. In the normal course of our business, we are subject to market risks associated with interest rate movements and currency movements on our assets and liabilities.
Foreign Currency Exposures
We have exposure to foreign currency exchange rate fluctuations on net income from our subsidiaries denominated in currencies other than U.S. dollars, as our foreign subsidiaries in Korea, Taiwan, China, Japan and Hong Kong use local currency as their functional currency. From time to time these subsidiaries have cash and financial instruments in local currency. The amounts held in Japan, Taiwan, Hong Kong and China are not material in regards to foreign currency movements. However, based on the cash and financial instruments balance at December 31, 2014 for our Korean subsidiary, a 10% devaluation of the Korean won against the U.S. dollar would have resulted in a decrease of $1.8 million in our U.S. dollar financial instruments and cash balances.
See “Note 8. Derivative Financial Instruments” to our consolidated financial statements under “Item 8. Financial Statements and Supplementary Data” and “Item 7. Management’s Discussion and Analysis of Financial Condition and Results of Operations—Factors Affecting Our Results of Operations—Impact of Foreign Currency Exchange Rates on Reported Results of Operations” for additional information regarding our foreign exchange hedging activities.
Interest Rate Exposures
As of December 31, 2014, $225.0 million aggregate principal amount of our 2021 Notes were outstanding. Interest on the 2021 Notes accrues at a fixed rate of 6.625% per annum and is paid semi-annually every January 15 and July 15 of each year until the 2021 Notes mature on July 15, 2021. Since the interest rate is fixed, we have no market risk related to the 2021 Notes.
62
Table of Contents
Index to Financial Statements
Item 8. Financial Statements and Supplementary Data
INDEX TO CONSOLIDATED FINANCIAL STATEMENTS
| 64 | ||||
| MagnaChip Semiconductor Corporation Consolidated Balance Sheets as of December 31, 2014 and 2013 | 65 | |||
| 66 | ||||
| 67 | ||||
| 68 | ||||
| 69 | ||||
| MagnaChip Semiconductor Corporation Notes to Consolidated Financial Statements |
70 |
63
Table of Contents
Index to Financial Statements
Report of Independent Registered Public Accounting Firm
To the Board of Directors and Stockholders of
MagnaChip Semiconductor Corporation
In our opinion, the consolidated financial statements listed in the accompanying index present fairly, in all material respects, the financial position of MagnaChip Semiconductor Corporation and its subsidiaries (the “Company”) at December 31, 2014 and 2013, and the results of their operations and their cash flows for each of the three years in the period ended December 31, 2014 in conformity with accounting principles generally accepted in the United States of America. Also in our opinion, the Company did not maintain, in all material respects, effective internal control over financial reporting as of December 31, 2014, based on criteria established in Internal Control – Integrated Framework (2013) issued by the Committee of Sponsoring Organizations of the Treadway Commission (COSO) because material weaknesses in internal control over financial reporting related to (1) not maintaining an effective control environment, with respect to: (i) an attitude of integrity and ethics against the pressure to achieve sales, gross margin and adjusted EBITDA targets, (ii) adherence to U.S. GAAP, (iii) utilization of the whistleblower program, (iv) prevention or detection of undisclosed business practices involving the circumvention of numerous internal controls, and (v) appropriate level of accounting knowledge, experience and training commensurate with the Company’s financial reporting requirements under U.S. GAAP; (2) not maintaining effective monitoring activities to evaluate and communicate internal control deficiencies in a timely manner to those parties responsible for taking corrective actions, including maintaining an effective internal audit function; (3) not designing effective controls over the completeness and accuracy of period end adjusting entries; and (4) not designing effective controls over the completeness and accuracy of the Company’s income tax accounting and disclosures, which existed as of that date. A material weakness is a deficiency, or a combination of deficiencies, in internal control over financial reporting, such that there is a reasonable possibility that a material misstatement of the annual or interim financial statements will not be prevented or detected on a timely basis. The material weaknesses referred to above are described in Management’s Report on Internal Control Over Financial Reporting under Item 9A. We considered these material weaknesses in determining the nature, timing, and extent of audit tests applied in our audit of the December 31, 2014 consolidated financial statements, and our opinion regarding the effectiveness of the Company’s internal control over financial reporting does not affect our opinion on those consolidated financial statements. The Company’s management is responsible for these financial statements, for maintaining effective internal control over financial reporting and for its assessment of the effectiveness of internal control over financial reporting included in management’s report referred to above. Our responsibility is to express opinions on these financial statements, and on the Company’s internal control over financial reporting based on our integrated audits. We conducted our audits in accordance with the standards of the Public Company Accounting Oversight Board (United States). Those standards require that we plan and perform the audits to obtain reasonable assurance about whether the financial statements are free of material misstatement and whether effective internal control over financial reporting was maintained in all material respects. Our audits of the financial statements included examining, on a test basis, evidence supporting the amounts and disclosures in the financial statements, assessing the accounting principles used and significant estimates made by management, and evaluating the overall financial statement presentation. Our audit of internal control over financial reporting included obtaining an understanding of internal control over financial reporting, assessing the risk that a material weakness exists, and testing and evaluating the design and operating effectiveness of internal control based on the assessed risk. Our audits also included performing such other procedures as we considered necessary in the circumstances. We believe that our audits provide a reasonable basis for our opinions.
A company’s internal control over financial reporting is a process designed to provide reasonable assurance regarding the reliability of financial reporting and the preparation of financial statements for external purposes in accordance with generally accepted accounting principles. A company’s internal control over financial reporting includes those policies and procedures that (i) pertain to the maintenance of records that, in reasonable detail, accurately and fairly reflect the transactions and dispositions of the assets of the company; (ii) provide reasonable assurance that transactions are recorded as necessary to permit preparation of financial statements in accordance with generally accepted accounting principles, and that receipts and expenditures of the company are being made only in accordance with authorizations of management and directors of the company; and (iii) provide reasonable assurance regarding prevention or timely detection of unauthorized acquisition, use, or disposition of the company’s assets that could have a material effect on the financial statements.
Because of its inherent limitations, internal control over financial reporting may not prevent or detect misstatements. Also, projections of any evaluation of effectiveness to future periods are subject to the risk that controls may become inadequate because of changes in conditions, or that the degree of compliance with the policies or procedures may deteriorate.
/s/ Samil PricewaterhouseCoopers
Seoul, Korea
May 28, 2015
64
Table of Contents
Index to Financial Statements
MAGNACHIP SEMICONDUCTOR CORPORATION AND SUBSIDIARIES
CONSOLIDATED BALANCE SHEETS
| December 31, | ||||||||
| 2014 | 2013 | |||||||
| (In thousands of US dollars, except share data) | ||||||||
| Assets |
||||||||
| Current assets |
||||||||
| Cash and cash equivalents |
$ | 102,434 | $ | 153,606 | ||||
| Restricted cash |
— | 4 | ||||||
| Accounts receivable, net |
72,957 | 78,898 | ||||||
| Inventories, net |
75,334 | 74,698 | ||||||
| Other receivables |
10,616 | 6,011 | ||||||
| Prepaid expenses |
7,560 | 9,194 | ||||||
| Current deferred income tax assets |
237 | 1,348 | ||||||
| Other current assets |
6,898 | 10,403 | ||||||
|
|
|
|
|
|||||
| Total current assets |
276,036 | 334,162 | ||||||
|
|
|
|
|
|||||
| Property, plant and equipment, net |
223,766 | 254,297 | ||||||
| Intangible assets, net |
2,451 | 3,111 | ||||||
| Long-term prepaid expenses |
10,916 | 16,405 | ||||||
| Deferred income tax assets |
415 | 896 | ||||||
| Other non-current assets |
14,147 | 16,319 | ||||||
|
|
|
|
|
|||||
| Total assets |
$ | 527,731 | $ | 625,190 | ||||
|
|
|
|
|
|||||
| Liabilities and Stockholders’ Equity |
||||||||
| Current liabilities |
||||||||
| Accounts payable |
$ | 70,767 | $ | 75,059 | ||||
| Other accounts payable |
10,986 | 15,670 | ||||||
| Accrued expenses |
81,060 | 65,494 | ||||||
| Other current liabilities |
6,460 | 5,872 | ||||||
|
|
|
|
|
|||||
| Total current liabilities |
169,273 | 162,095 | ||||||
|
|
|
|
|
|||||
| Long-term borrowings, net |
224,035 | 223,923 | ||||||
| Accrued severance benefits, net |
139,289 | 134,172 | ||||||
| Other non-current liabilities |
13,636 | 23,459 | ||||||
|
|
|
|
|
|||||
| Total liabilities |
546,233 | 543,649 | ||||||
|
|
|
|
|
|||||
| Commitments and contingencies (Note 18) |
||||||||
| Stockholders’ equity |
||||||||
| Common stock, $0.01 par value, 150,000,000 shares authorized, 40,635,233 shares issued and 34,056,468 outstanding at December 31, 2014 and 40,627,131 shares issued and 34,048,366 outstanding at December 31, 2013 |
406 | 406 | ||||||
| Additional paid-in capital |
118,419 | 116,222 | ||||||
| Retained earnings (deficit) |
(11,343 | ) | 105,889 | |||||
| Treasury stock, 6,578,765 shares at December 31, 2014 and 2013, respectively |
(90,918 | ) | (90,918 | ) | ||||
| Accumulated other comprehensive loss |
(35,066 | ) | (50,058 | ) | ||||
|
|
|
|
|
|||||
| Total stockholders’ equity (deficit) |
(18,502 | ) | 81,541 | |||||
|
|
|
|
|
|||||
| Total liabilities and stockholders’ equity |
$ | 527,731 | $ | 625,190 | ||||
|
|
|
|
|
|||||
The accompanying notes are an integral part of these consolidated financial statements
65
Table of Contents
Index to Financial Statements
MAGNACHIP SEMICONDUCTOR CORPORATION AND SUBSIDIARIES
CONSOLIDATED STATEMENTS OF OPERATIONS
| Year Ended December 31, | ||||||||||||
| 2014 | 2013 | 2012 | ||||||||||
| (In thousands of US dollars, except share data) | ||||||||||||
| Net sales |
$ | 698,218 | $ | 734,177 | $ | 807,336 | ||||||
| Cost of sales |
545,356 | 579,109 | 564,089 | |||||||||
|
|
|
|
|
|
|
|||||||
| Gross profit |
152,862 | 155,068 | 243,247 | |||||||||
|
|
|
|
|
|
|
|||||||
| Operating expenses |
||||||||||||
| Selling, general and administrative expenses |
126,954 | 85,767 | 82,677 | |||||||||
| Research and development expenses |
92,765 | 87,862 | 76,255 | |||||||||
| Restructuring and impairment charges |
10,269 | 8,207 | — | |||||||||
|
|
|
|
|
|
|
|||||||
| Total operating expenses |
229,988 | 181,836 | 158,932 | |||||||||
|
|
|
|
|
|
|
|||||||
| Operating income (loss) |
(77,126 | ) | (26,768 | ) | 84,315 | |||||||
| Interest expense, net |
(16,289 | ) | (20,360 | ) | (22,600 | ) | ||||||
| Foreign currency gain (loss), net |
(24,650 | ) | 16,837 | 57,280 | ||||||||
| Loss on early extinguishment of senior notes |
— | (32,812 | ) | — | ||||||||
| Other income, net |
2,356 | 2,870 | 3,890 | |||||||||
|
|
|
|
|
|
|
|||||||
| Income (loss) before income taxes |
(115,709 | ) | (60,233 | ) | 122,885 | |||||||
|
|
|
|
|
|
|
|||||||
| Income tax expenses |
1,523 | 3,970 | 12,847 | |||||||||
|
|
|
|
|
|
|
|||||||
| Net income (loss) |
$ | (117,232 | ) | $ | (64,203 | ) | $ | 110,038 | ||||
|
|
|
|
|
|
|
|||||||
| Earnings (loss) per common share— |
||||||||||||
| Basic |
$ | (3.44 | ) | $ | (1.82 | ) | $ | 3.01 | ||||
| Diluted |
$ | (3.44 | ) | $ | (1.82 | ) | $ | 2.93 | ||||
|
|
|
|
|
|
|
|||||||
| Weighted average number of shares— |
||||||||||||
| Basic |
34,055,513 | 35,232,194 | 36,567,684 | |||||||||
| Diluted |
34,055,513 | 35,232,194 | 37,533,391 | |||||||||
The accompanying notes are an integral part of these consolidated financial statements
66
Table of Contents
Index to Financial Statements
MAGNACHIP SEMICONDUCTOR CORPORATION AND SUBSIDIARIES
CONSOLIDATED STATEMENTS OF COMPREHENSIVE INCOME
| Year Ended December 31, | ||||||||||||
| 2014 | 2013 | 2012 | ||||||||||
| (In thousands of US dollars) | ||||||||||||
| Net income (loss) |
$ | (117,232 | ) | $ | (64,203 | ) | $ | 110,038 | ||||
|
|
|
|
|
|
|
|||||||
| Other comprehensive income (loss) |
||||||||||||
| Foreign currency translation adjustments |
21,775 | (13,727 | ) | (37,737 | ) | |||||||
| Derivative adjustments |
||||||||||||
| Fair valuation of derivatives |
(69 | ) | 7,497 | 5,237 | ||||||||
| Reclassification adjustment for loss (gain) on derivatives included in net income (loss) |
(6,033 | ) | (2,984 | ) | 4,608 | |||||||
| Investment adjustments |
||||||||||||
| Unrealized gain (loss) on investments |
1,201 | 606 | (15 | ) | ||||||||
| Reclassification adjustment for gain on investments included in net income (loss) |
(1,882 | ) | — | — | ||||||||
|
|
|
|
|
|
|
|||||||
| Total other comprehensive income (loss) |
14,992 | (8,608 | ) | (27,907 | ) | |||||||
|
|
|
|
|
|
|
|||||||
| Total comprehensive income (loss) |
$ | (102,240 | ) | $ | (72,811 | ) | $ | 82,131 | ||||
|
|
|
|
|
|
|
|||||||
The accompanying notes are an integral part of these consolidated financial statements
67
Table of Contents
Index to Financial Statements
MAGNACHIP SEMICONDUCTOR CORPORATION AND SUBSIDIARIES
CONSOLIDATED STATEMENTS OF CHANGES IN STOCKHOLDERS’ EQUITY
| Common Stock | Additional Paid-In Capital |
Retained earnings (deficit) |
Treasury Stock |
Accumulated Other Comprehensive Loss |
Total | |||||||||||||||||||||||
| (In thousands of US dollars, except share data) | Shares | Amount | ||||||||||||||||||||||||||
| Balance at January 1, 2012 |
37,907,575 | $ | 394 | $ | 99,060 | $ | 60,054 | $ | (11,793 | ) | $ | (13,543 | ) | $ | 134,172 | |||||||||||||
|
|
|
|
|
|
|
|
|
|
|
|
|
|
|
|||||||||||||||
| Stock-based compensation |
— | — | 2,389 | — | — | — | 2,389 | |||||||||||||||||||||
| Issuance of common stock |
4,499 | — | 46 | — | — | — | 46 | |||||||||||||||||||||
| Exercise of stock options |
155,708 | 2 | 914 | — | — | — | 916 | |||||||||||||||||||||
| Exercise of warrants |
52 | — | — | — | — | — | — | |||||||||||||||||||||
| Acquisition of treasury stock |
(2,432,477 | ) | — | — | — | (28,125 | ) | — | (28,125 | ) | ||||||||||||||||||
| Other comprehensive loss, net |
— | — | — | — | — | (27,907 | ) | (27,907 | ) | |||||||||||||||||||
| Net Income |
— | — | — | 110,038 | — | — | 110,038 | |||||||||||||||||||||
|
|
|
|
|
|
|
|
|
|
|
|
|
|
|
|||||||||||||||
| Balance at December 31, 2012 |
35,635,357 | $ | 396 | $ | 102,409 | $ | 170,092 | $ | (39,918 | ) | $ | (41,450 | ) | $ | 191,529 | |||||||||||||
|
|
|
|
|
|
|
|
|
|
|
|
|
|
|
|||||||||||||||
| Stock-based compensation |
— | — | 2,213 | — | — | — | 2,213 | |||||||||||||||||||||
| Exercise of stock options |
579,476 | 6 | 4,540 | — | — | — | 4,546 | |||||||||||||||||||||
| Exercise of warrants |
448,281 | 4 | 7,060 | — | — | — | 7,064 | |||||||||||||||||||||
| Acquisition of treasury stock |
(2,614,748 | ) | — | — | — | (51,000 | ) | — | (51,000 | ) | ||||||||||||||||||
| Other comprehensive loss, net |
— | — | — | — | — | (8,608 | ) | (8,608 | ) | |||||||||||||||||||
| Net loss |
— | — | — | (64,203 | ) | — | — | (64,203 | ) | |||||||||||||||||||
|
|
|
|
|
|
|
|
|
|
|
|
|
|
|
|||||||||||||||
| Balance at December 31, 2013 |
34,048,366 | $ | 406 | $ | 116,222 | $ | 105,889 | $ | (90,918 | ) | $ | (50,058 | ) | $ | 81,541 | |||||||||||||
|
|
|
|
|
|
|
|
|
|
|
|
|
|
|
|||||||||||||||
| Stock-based compensation |
— | — | 2,072 | — | — | — | 2,072 | |||||||||||||||||||||
| Exercise of stock options |
6,795 | — | 106 | — | — | — | 106 | |||||||||||||||||||||
| Exercise of warrants |
1,307 | — | 19 | — | — | — | 19 | |||||||||||||||||||||
| Other comprehensive income, net |
— | — | — | — | — | 14,992 | 14,992 | |||||||||||||||||||||
| Net loss |
— | — | — | (117,232 | ) | — | — | (117,232 | ) | |||||||||||||||||||
|
|
|
|
|
|
|
|
|
|
|
|
|
|
|
|||||||||||||||
| Balance at December 31, 2014 |
34,056,468 | $ | 406 | $ | 118,419 | $ | (11,343 | ) | $ | (90,918 | ) | $ | (35,066 | ) | $ | (18,502 | ) | |||||||||||
|
|
|
|
|
|
|
|
|
|
|
|
|
|
|
|||||||||||||||
The accompanying notes are an integral part of these consolidated financial statements
68
Table of Contents
Index to Financial Statements
MAGNACHIP SEMICONDUCTOR CORPORATION AND SUBSIDIARIES
CONSOLIDATED STATEMENTS OF CASH FLOWS
| Year Ended December 31, | ||||||||||||
| 2014 | 2013 | 2012 | ||||||||||
| (In thousands of US dollars) | ||||||||||||
| Cash flows from operating activities |
||||||||||||
| Net income (loss) |
$ | (117,232 | ) | $ | (64,203 | ) | $ | 110,038 | ||||
| Adjustments to reconcile net income (loss) to net cash provided by (used in) operating activities |
||||||||||||
| Depreciation and amortization |
29,989 | 32,726 | 32,066 | |||||||||
| Provision for severance benefits |
17,703 | 23,169 | 21,530 | |||||||||
| Bad debt expenses (reversal of allowance) |
3,718 | (85 | ) | (6 | ) | |||||||
| Amortization of debt issuance costs and original issue discount |
614 | 890 | 1,009 | |||||||||
| Loss (gain) on foreign currency, net |
32,760 | (18,329 | ) | (64,886 | ) | |||||||
| Gain on disposal of investments |
(1,524 | ) | — | — | ||||||||
| Impairment charges |
10,269 | 6,378 | — | |||||||||
| Stock-based compensation |
2,072 | 2,213 | 2,389 | |||||||||
| Loss on early extinguishment of senior notes |
— | 32,812 | — | |||||||||
| Other |
1,375 | 1,479 | (663 | ) | ||||||||
| Changes in operating assets and liabilities |
||||||||||||
| Accounts receivable |
(1,668 | ) | 26,756 | 5,758 | ||||||||
| Inventories, net |
(3,380 | ) | 9,593 | (12,495 | ) | |||||||
| Other receivables |
(5,052 | ) | (3,964 | ) | (337 | ) | ||||||
| Other current assets |
9,308 | 11,026 | 10,835 | |||||||||
| Deferred tax assets |
1,458 | 1,470 | 1,914 | |||||||||
| Accounts payable |
(1,526 | ) | (3,111 | ) | (1,737 | ) | ||||||
| Other accounts payable |
(13,046 | ) | (10,376 | ) | (11,007 | ) | ||||||
| Accrued expenses |
208 | 20,974 | 24,304 | |||||||||
| Other current liabilities |
1,179 | (387 | ) | 9,497 | ||||||||
| Other non-current liabilities |
1,963 | 6,073 | (3,329 | ) | ||||||||
| Payment of severance benefits |
(6,650 | ) | (6,130 | ) | (6,997 | ) | ||||||
| Other |
(7 | ) | (219 | ) | 223 | |||||||
|
|
|
|
|
|
|
|||||||
| Net cash provided by (used in) operating activities |
(37,469 | ) | 68,755 | 118,106 | ||||||||
|
|
|
|
|
|
|
|||||||
| Cash flows from investing activities |
||||||||||||
| Decrease in restricted cash |
4 | 125 | 13,021 | |||||||||
| Increase in restricted cash |
— | — | (6,238 | ) | ||||||||
| Proceeds from disposal of plant, property and equipment |
20 | 94 | 937 | |||||||||
| Proceeds from disposal of investments |
2,003 | — | — | |||||||||
| Purchase of property, plant and equipment |
(17,419 | ) | (42,483 | ) | (58,538 | ) | ||||||
| Payment for intellectual property registration |
(958 | ) | (605 | ) | (882 | ) | ||||||
| Payment for purchase of Dawin, net of cash acquired |
— | — | (8,642 | ) | ||||||||
| Payment of guarantee deposits |
(323 | ) | (1,365 | ) | (320 | ) | ||||||
| Other |
(25 | ) | 131 | 118 | ||||||||
|
|
|
|
|
|
|
|||||||
| Net cash used in investing activities |
(16,698 | ) | (44,103 | ) | (60,544 | ) | ||||||
|
|
|
|
|
|
|
|||||||
| Cash flows from financing activities |
||||||||||||
| Proceeds from issuance of common stock |
68 | 11,375 | 962 | |||||||||
| Proceeds from issuance of senior notes |
— | 218,836 | — | |||||||||
| Repayment of long-term borrowings |
— | (229,333 | ) | — | ||||||||
| Repayment of obligations under capital lease |
— | — | (2,968 | ) | ||||||||
| Acquisition of treasury stock |
— | (51,000 | ) | (28,125 | ) | |||||||
|
|
|
|
|
|
|
|||||||
| Net cash provided by (used in) financing activities |
68 | (50,122 | ) | (30,131 | ) | |||||||
| Effect of exchange rates on cash and cash equivalents |
2,927 | (3,162 | ) | (7,304 | ) | |||||||
|
|
|
|
|
|
|
|||||||
| Net increase (decrease) in cash and cash equivalents |
(51,172 | ) | (28,632 | ) | 20,127 | |||||||
|
|
|
|
|
|
|
|||||||
| Cash and cash equivalents |
||||||||||||
| Beginning of the period |
153,606 | 182,238 | 162,111 | |||||||||
|
|
|
|
|
|
|
|||||||
| End of the period |
$ | 102,434 | $ | 153,606 | $ | 182,238 | ||||||
|
|
|
|
|
|
|
|||||||
| Supplemental cash flow information |
||||||||||||
| Cash paid for interest |
$ | 14,817 | $ | 16,223 | $ | 21,955 | ||||||
|
|
|
|
|
|
|
|||||||
| Cash paid (refunded) for income taxes |
$ | 875 | $ | 6,267 | $ | (609 | ) | |||||
|
|
|
|
|
|
|
|||||||
| Non-cash investing and financing activities |
||||||||||||
| Property, plant and equipment additions in other accounts payable |
$ | 688 | $ | 116 | $ | 2,989 | ||||||
|
|
|
|
|
|
|
|||||||
The accompanying notes are an integral part of these consolidated financial statements
69
Table of Contents
Index to Financial Statements
MAGNACHIP SEMICONDUCTOR CORPORATION AND SUBSIDIARIES
NOTES TO CONSOLIDATED FINANCIAL STATEMENTS
(TABULAR DOLLARS IN THOUSANDS, EXCEPT SHARE DATA)
1. Business, Basis of Presentation and Summary of Significant Accounting Policies
Business
MagnaChip Semiconductor Corporation (together with its subsidiaries, the “Company”) is a Korea-based designer and manufacturer of analog and mixed-signal semiconductor products for consumer, computing, communication, industrial, automotive and Internet of Things (“IoT”) applications. The Company provides technology platforms for analog, mixed signal, power, high voltage, non-volatile memory, and RF applications. The Company’s business is comprised of three key business lines: Display Solutions, Power Solutions and Semiconductor Manufacturing Services. The Company’s Display Solutions products provide flat panel display solutions to major suppliers of large and small flat panel display. The Company’s Power Solutions products include discrete and integrated circuit solutions for power management in consumer, communication and industrial applications. The Company’s Semiconductor Manufacturing Services provides specialty analog and mixed-signal foundry services mainly for fabless and Integrated Device Manufacturer (“IDM”) semiconductor companies that primarily serve the consumer, computing, communication, industrial, automotive and IoT applications.
Basis of Presentation
The consolidated financial statements are presented in accordance with accounting principles generally accepted in the United States of America (“US GAAP”).
Significant accounting policies followed by the Company in the preparation of the accompanying consolidated financial statements are summarized below.
Principles of Consolidation
The consolidated financial statements include the accounts of the Company including its wholly-owned subsidiaries. All intercompany transactions and balances are eliminated in consolidation.
Business Combination
Pursuant to accounting guidance for ASC 805, “Business Combinations” (“ASC 805”), the Company (i) applies the definition of “business” and “business combination” as prescribed by the revised guidance; (ii) recognizes assets acquired, liabilities assumed (including goodwill) measured at fair value at the acquisition date; (iii) recognizes acquisition-related expenses in earnings; and (iv) capitalizes technology and customer relationships at fair value as intangible assets.
Use of Estimates
The preparation of financial statements in accordance with US GAAP requires management to make estimates and assumptions about future events. These estimates and the underlying assumptions affect the amounts of assets and liabilities reported, disclosures about contingent assets and liabilities, and reported amounts of revenue and expenses. Such estimates include the valuation of accounts receivable, inventories, goodwill, stock based compensation, property plant and equipment, intangible assets, other long-lived assets, long-term employee benefits, contingencies liabilities, and assumptions used in the calculation of income taxes and sales incentives, among others. Although these estimates and assumptions are based on management’s best knowledge of current events and actions that the Company may undertake in the future, actual results may be significantly different from the estimates. Changes in those estimates resulting from continuing changes in the economic environment will be reflected in the financial statements in future periods.
70
Table of Contents
Index to Financial Statements
MAGNACHIP SEMICONDUCTOR CORPORATION AND SUBSIDIARIES
NOTES TO CONSOLIDATED FINANCIAL STATEMENTS—(CONTINUED)
(TABULAR DOLLARS IN THOUSANDS, EXCEPT SHARE DATA)
Foreign Currency Translation
The Company has assessed in accordance with ASC 830, “Foreign Currency Matters” (“ASC 830”), the functional currency of each of its subsidiaries in Luxembourg and the Netherlands and has designated the U.S. dollar to be their respective functional currencies. The Company and its other subsidiaries are utilizing their local currencies as their functional currencies. The financial statements of the subsidiaries in functional currencies other than the U.S. dollar are translated into the U.S. dollar in accordance with ASC 830. All the assets and liabilities are translated to the U.S. dollar at the end-of-period exchange rates. Capital accounts are determined to be of a permanent nature and are therefore translated using historical exchange rates. Revenues and expenses are translated using average exchange rates for the respective periods. Foreign currency translation adjustments arising from differences in exchange rates from period to period are included in the foreign currency translation adjustment account in accumulated comprehensive income (loss) of stockholders’ equity. Gains and losses due to transactions in currencies other than the functional currency are included as a component of other income (expense) in the statement of operations.
Cash and Cash Equivalents
Cash equivalents consist of highly liquid investments with an original maturity date of three months or less when purchased.
Accounts Receivable Reserves
An allowance for doubtful accounts is provided based on the aggregate estimated uncollectability of the Company’s accounts receivable. The Company also records an estimate for sales returns, included within accounts receivable, net, based on the historical experience of the amount of goods that will be returned and refunded or replaced. In addition, the Company also includes in accounts receivable, an allowance for additional products that may have to be provided, free of charge, to compensate customers for products that do not meet previously agreed yield criteria, the low yield compensation reserve.
Sales of Accounts Receivable
The Company accounts for transfers of financial assets under ASC 860, “Transfers and Servicing,” as either sales or financings. Transfers of financial assets that result in sales accounting are those in which (1) the transfer legally isolates the transferred assets from the transferor, (2) the transferee has the right to pledge or exchange the transferred assets and no condition both constraints the transferee’s right to pledge or exchange the assets and provides more than a trivial benefit to the transferor, and (3) the transferor does not maintain effective control over the transferred assets. If the transfer does not meet these criteria, the transfer is accounted for as a financing. Financial assets that are treated as sales are removed from the Company’s accounts with any realized gain or loss reflected in earning during the period of sale.
Inventories
Inventories are stated at the lower of cost or market, using the average cost method, which approximates the first in, first out method (“FIFO”). If net realizable value is less than cost at the balance sheet date, the carrying amount is reduced to the realizable value, and the difference is recognized as a loss on valuation of inventories within cost of sales. Inventory reserves are established when conditions indicate that the net realizable value is less than costs due to physical deterioration, obsolescence, changes in price levels, or other causes based on individual facts and circumstances. Reserves are also established for excess inventory based on inventory levels in excess of six months of projected demand for each specific product.
In addition, as prescribed in ASC 330, “Inventory,” the cost of inventories is determined based on the normal capacity of each fabrication facility. In case the capacity utilization is lower than a certain level that management believes to be normal, the fixed overhead costs per production unit which exceeds those under normal capacity are charged to cost of sales rather than capitalized as inventories.
71
Table of Contents
Index to Financial Statements
MAGNACHIP SEMICONDUCTOR CORPORATION AND SUBSIDIARIES
NOTES TO CONSOLIDATED FINANCIAL STATEMENTS—(CONTINUED)
(TABULAR DOLLARS IN THOUSANDS, EXCEPT SHARE DATA)
Property, Plant and Equipment
Property, plant and equipment are stated at cost, less accumulated depreciation. Depreciation is computed using the straight-line method over the estimated useful lives of the assets as set forth below.
| Buildings |
30 - 40 years | |||
| Building related structures |
10 - 20 years | |||
| Machinery and equipment |
10 - 12 years | |||
| Vehicles and others |
5 years |
Routine maintenance and repairs are charged to expense as incurred. Expenditures that enhance the value or significantly extend the useful lives of the related assets are capitalized.
Impairment of Long-Lived Assets
The Company reviews property, plant and equipment and other long-lived assets for impairment whenever events or changes in circumstances indicate that the carrying amount may not be recoverable in accordance with ASC 360, “Property, Plant and Equipment” (“ASC 360”). Recoverability is measured by comparing its carrying amount with the future net undiscounted cash flows the assets are expected to generate. If such assets are considered to be impaired, the impairment is measured as the difference between the carrying amount of the assets and the fair value of assets using the present value of the future net cash flows generated by the respective long-lived assets.
Restructuring Charges
The Company recognizes restructuring charges in accordance with ASC 420, “Exit or Disposal Cost Obligations” (“ASC 420”). Certain costs and expenses related to exit or disposal activities are recorded as restructuring charges when liabilities for those costs and expenses are incurred.
Lease Transactions
The Company accounts for lease transactions as either operating leases or capital leases, depending on the terms of the underlying lease agreements. Machinery and equipment acquired under capital lease agreements are recorded at the lower of the present value of future minimum lease payments and estimated fair value of leased property and depreciated using the straight-line method over their estimated useful lives. In addition, the aggregate lease payments are recorded as capital lease obligations, net of unaccrued interest. Interest is amortized over the lease period using the effective interest rate method. Leases that do not qualify as capital leases are classified as operating leases, and the related rental payments are expensed on a straight-line basis over the shorter of the estimated useful lives of the leased property and the lease term.
72
Table of Contents
Index to Financial Statements
MAGNACHIP SEMICONDUCTOR CORPORATION AND SUBSIDIARIES
NOTES TO CONSOLIDATED FINANCIAL STATEMENTS—(CONTINUED)
(TABULAR DOLLARS IN THOUSANDS, EXCEPT SHARE DATA)
Software
The Company capitalizes certain external costs that are incurred to purchase and implement internal-use computer software. Direct costs relating to the development of software for internal use are capitalized after technological feasibility has been established, in accordance with ASC 350, “Intangibles-Goodwill and Other” (“ASC 350”). Depreciation is recorded on a straight-line basis over the software’s estimated useful life, which is usually five years.
Intangible Assets
Intangible assets other than intellectual property include technology and customer relationships which are amortized on a straight-line basis over periods ranging from one to five years. Intellectual property assets acquired represent rights under patents, trademarks and property use rights and are amortized over their respective periods of benefit, ranging up to ten years, on a straight-line basis.
Goodwill and Acquired Intangible Assets
The Company records goodwill when the purchase price of an acquisition exceeds the fair value of the net tangible and intangible assets as of the date of acquisition. Goodwill is subject to impairment testing using a two-step process after considering a qualitative assessment. The first step of the goodwill impairment test is to identify potential impairment by comparing the fair value of the reporting unit with its carrying amount, including goodwill. If the fair value of a reporting unit exceeds its carrying amount, goodwill of the reporting unit is considered not impaired and the second step of the impairment test is not required. If the carrying amount of a reporting unit exceeds its fair value, the second step of the goodwill impairment test is performed to measure the amount of the impairment loss, if any. The second step of the goodwill impairment test compares the implied fair value (i.e., the fair value of reporting unit less the fair value of the unit’s assets and liabilities, including identifiable intangible assets) of the reporting unit’s goodwill with the carrying amount of that goodwill. If the carrying value of goodwill exceeds its implied fair value, the excess is required to be recorded as an impairment charge in earnings. The Company performs its annual goodwill impairment analysis during the fourth quarter. Goodwill must be tested between annual tests if events or changes in circumstances indicate that the asset might be impaired. The Company reviews changes in the business climate, changes in market capitalization, legal factors, operating performance indicators and competition, among other factors and their potential impact on the Company’s fair value determination.
Fair Value Disclosures of Financial Instruments
The Company follows ASC 820, “Fair Value Measurements and Disclosures” (“ASC 820”) for measurement and disclosures about fair value of its financial instruments. ASC 820 establishes a framework for measuring fair value in US GAAP, and expands disclosures about fair value measurements. To increase consistency and comparability in fair value measurements and related disclosures, ASC 820 establishes a fair value hierarchy that prioritizes the inputs to valuation techniques used to measure fair value into three broad levels. The fair value hierarchy gives the highest priority to quoted prices (unadjusted) in active markets for identical assets or liabilities and the lowest priority to unobservable inputs. The three levels of fair value hierarchy defined by ASC 820 are:
Level 1—Inputs are unadjusted, quoted prices in active markets for identical assets or liabilities at the measurement date.
Level 2—Inputs (other than quoted market prices included in Level 1) are either directly or indirectly observable for the asset or liability through correlation with market data at the measurement date and for the duration of the instrument’s anticipated life.
Level 3—Inputs reflect management’s best estimate of what market participants would use in pricing the asset or liability at the measurement date. Consideration is given to the risk inherent in the valuation technique and the risk inherent in the inputs to the model. Valuation of instruments includes unobservable inputs to the valuation methodology that are significant to the measurement of fair value of assets or liabilities.
As defined by ASC 820, the fair value of a financial instrument is the amount at which the instrument could be exchanged in a current transaction between willing parties, other than in a forced or liquidation sale, which was further clarified as the price that would be received to sell an asset or paid to transfer a liability (“an exit price”) in an orderly transaction between market participants at the measurement date. The carrying amounts of the Company’s financial assets and liabilities, such as cash and cash equivalents, accounts receivable, other receivables, accounts payable and other accounts payable approximate their fair values because of the short maturity of these instruments.
73
Table of Contents
Index to Financial Statements
MAGNACHIP SEMICONDUCTOR CORPORATION AND SUBSIDIARIES
NOTES TO CONSOLIDATED FINANCIAL STATEMENTS—(CONTINUED)
(TABULAR DOLLARS IN THOUSANDS, EXCEPT SHARE DATA)
Accrued Severance Benefits
The majority of accrued severance benefits is for employees in the Company’s Korean subsidiary, MagnaChip Semiconductor Ltd. Pursuant to the Employee Retirement Benefit Security Act of Korea, eligible employees and executive officers with one or more years of service are entitled to severance benefits upon the termination of their employment based on their length of service and rate of pay. As of December 31, 2014, 98% of all employees of the Company were eligible for severance benefits.
Accrued severance benefits are funded through a group severance insurance plan. The amounts funded under this insurance plan are classified as a reduction of the accrued severance benefits. Subsequent accruals are to be funded at the discretion of the Company.
In accordance with the National Pension Act of the Republic of Korea, a certain portion of accrued severance benefits is deposited with the National Pension Fund and deducted from the accrued severance benefits. The contributed amount is paid to employees from the National Pension Fund upon their retirement.
Revenue Recognition
Revenue is recognized when there is persuasive evidence of an arrangement, the price to the buyer is fixed or determinable, delivery has occurred and collectability of the sales price is reasonably assured. Revenue from the sale of products is recognized when title and risk of loss transfers to the customer, which is generally when the product is shipped to or accepted by the customer depending on the terms of the arrangement.
A portion of the Company’s sales are made through distributors for which revenue recognition criteria are usually met when the product is shipped to or accepted by the distributors, consistent with the principles described above. However, the risk of loss may not pass upon shipment of products to the distributor due to a variety of reasons, including the nature of the business arrangement with the distributor. For example, the financial condition of a distributor may indicate that payments by the distributor to the Company are contingent on resale of products to an end customer. In this situation, the Company defers recognition of revenue and cost of revenue on transactions with such distributor until the product has been resold to the end customer.
In accordance with revenue recognition guidance, any tax assessed by a governmental authority that is directly imposed on a revenue-producing transaction between a seller and a customer is presented in the statements of operations on a net basis (excluded from revenues).
The Company provides a warranty, under which customers can return defective products. The Company estimates the costs related to those defective product returns and records them as a component of cost of sales.
In addition, the Company offers sales returns (other than those that relate to defective products under warranty), yield provisions, cash discounts for early payments and certain allowances to its customers, including distributors. The Company records reserves for those returns, discounts and allowances as a deduction from sales, based on historical experience and other quantitative and qualitative factors.
All amounts billed to a customer related to shipping and handling are classified as sales while all costs incurred by the Company for shipping and handling are classified as selling, general and administrative expenses. The amounts charged to selling, general and administrative expenses were $3,386 thousand, $2,850 thousand, and $3,057 thousand for the years ended December 31, 2014, 2013 and 2012, respectively.
74
Table of Contents
Index to Financial Statements
MAGNACHIP SEMICONDUCTOR CORPORATION AND SUBSIDIARIES
NOTES TO CONSOLIDATED FINANCIAL STATEMENTS—(CONTINUED)
(TABULAR DOLLARS IN THOUSANDS, EXCEPT SHARE DATA)
Derivative Financial Instruments
The Company applies the provisions of ASC 815, “Derivatives and Hedging” (“ASC 815”). This Statement requires the recognition of all derivative instruments as either assets or liabilities measured at fair value.
Under the provisions of ASC 815, the Company may designate a derivative instrument as hedging the exposure to variability in expected future cash flows that are attributable to a particular risk (a “cash flow hedge”) or hedging the exposure to changes in the fair value of an asset or a liability (a “fair value hedge”). Special accounting for qualifying hedges allows the effective portion of a derivative instrument’s gains and losses to offset related results on the hedged item in the consolidated statements of operations and requires that a company formally document, designate and assess the effectiveness of the transactions that receive hedge accounting treatment. Both at the inception of a hedge and on an ongoing basis, a hedge must be expected to be highly effective in achieving offsetting changes in cash flows or fair value attributable to the underlying risk being hedged. If the Company determines that a derivative instrument is no longer highly effective as a hedge, it discontinues hedge accounting prospectively and future changes in the fair value of the derivative are recognized in current earnings. The Company assesses hedge effectiveness at the end of each quarter.
In accordance with ASC 815, changes in the fair value of derivative instruments that are cash flow hedges are recognized in accumulated other comprehensive income (loss) and reclassified into earnings in the period in which the hedged item affects earnings. Ineffective portions of a derivative instrument’s change in fair value are immediately recognized in earnings. Derivative instruments that do not qualify, or cease to qualify, as hedges must be adjusted to fair value and the adjustments are recorded through net income (loss).
The cash flows from derivative instruments receiving hedge accounting treatment are classified in the same categories as the hedged items in the consolidated statements of cash flows.
Advertising
The Company expenses advertising costs as incurred. Advertising expense was approximately $155 thousand, $161 thousand and $142 thousand for the years ended December 31, 2014, 2013 and 2012, respectively.
Product Warranties
The Company records, in other current liabilities, warranty liabilities for the estimated costs that may be incurred under its basic limited warranty. The standard limited warranty period is one year for the majority of products. This warranty covers defective products, and related liabilities are accrued when product revenues are recognized. Factors that affect the Company’s warranty liability include historical and anticipated rates of warranty claims and repair or replacement costs per claim to satisfy the Company’s warranty obligation. As these factors are impacted by actual experience and future expectations, the Company periodically assesses the adequacy of its recorded warranty liabilities and adjusts the amounts when necessary.
Research and Development
Research and development costs are expensed as incurred and include wafers, masks, employee expenses, contractor fees, building costs, utilities and administrative expenses.
75
Table of Contents
Index to Financial Statements
MAGNACHIP SEMICONDUCTOR CORPORATION AND SUBSIDIARIES
NOTES TO CONSOLIDATED FINANCIAL STATEMENTS—(CONTINUED)
(TABULAR DOLLARS IN THOUSANDS, EXCEPT SHARE DATA)
Licensed Patents and Technologies
The Company has entered into a number of royalty agreements to license patents and technology used in the design of its products. The Company carries two types of royalties: lump-sum and running basis. Lump-sum royalties which require initial payments, usually paid in installments, represent a non-refundable commitment, such that the total present value of these payments is recorded as a prepaid expense and a liability upon execution of the agreements and the costs are amortized over the contract period using the straight-line method and charged to research and development expenses in the consolidated statements of operations.
Running royalties are paid based on the revenue of related products sold by the Company.
Stock-Based Compensation
The Company follows the provisions of ASC 718, “Compensation-Stock Compensation” (“ASC 718”). Under ASC 718, stock-based compensation cost is measured at the grant date, based on the fair value of the award, and is recognized as expense over the requisite service period. As permitted under ASC 718, the Company elected to recognize compensation expense for all options with graded vesting based on the graded attribution method.
The Company uses the Black-Scholes option-pricing model to measure the grant-date-fair-value of options. The Black-Scholes model requires certain assumptions to determine an option’s fair value, including expected term, risk free interest, expected volatility and fair value of underlying common share. The expected term of each option grant was based on employees’ expected exercises and post-vesting employment termination behavior and the risk free interest rate was based on the U.S. Treasury yield curve for the period corresponding with the expected term at the time of grant. The expected volatility was estimated using historical volatility of share prices of similar public entities. No dividends were assumed for this calculation of option value.
Earnings per Share
In accordance with ASC 260, “Earnings Per Share” (“ASC 260”), the Company computes basic earnings per share by dividing net income (loss) available to common stockholders by the weighted average number of common shares outstanding during the period. Diluted earnings per share reflect the dilution of potential common stock outstanding during the period. In determining the hypothetical shares repurchased, the Company uses the average share price for the period. In the case that earnings are negative, any potential common stock equivalents would have the effect of being anti-dilutive in the computation of net loss per share.
Income Taxes
The Company accounts for income taxes in accordance with ASC 740, “Income Taxes” (“ASC 740”). ASC 740 requires recognition of deferred tax assets and liabilities for the expected future tax consequences of events that have been recognized in a company’s financial statements or tax returns. Under this method, deferred tax assets and liabilities are determined based upon the difference between the financial statement carrying amounts and the tax bases of assets and liabilities using enacted tax rates in effect in the years in which the differences are expected to reverse. Valuation allowances are established when it is necessary to reduce deferred tax assets to the amount expected to be realized. Income tax expense is the tax payable for the period and the change during the period in deferred tax assets and liabilities.
76
Table of Contents
Index to Financial Statements
MAGNACHIP SEMICONDUCTOR CORPORATION AND SUBSIDIARIES
NOTES TO CONSOLIDATED FINANCIAL STATEMENTS—(CONTINUED)
(TABULAR DOLLARS IN THOUSANDS, EXCEPT SHARE DATA)
The Company recognizes and measures uncertain tax positions taken or expected to be taken in a tax return utilizing a two-step process. In the first step, recognition, the Company determines whether it is more-likely-than-not that a tax position will be sustained upon examination, including resolution of any related appeals or litigation processes, based on the technical merits of the position. The second step addresses measurement of a tax position that meets the more-likely-than-not criteria. The tax position is measured at the largest amount of benefit that has a likelihood of greater than 50 percent of being realized upon ultimate settlement.
Concentration of Credit Risk
The Company performs periodic credit evaluations of its customers’ financial condition and generally does not require collateral for customers on accounts receivable. The Company maintains reserves for potential credit losses, which are periodically reviewed.
Recent Accounting Pronouncements
In April 2015, the FASB issued Accounting Standards Update. 2015-03, “Interest—Imputation of Interest” (“ASU 2015-03”). ASU 2015-03 requires that debt issuance costs are presented in the balance sheet as a direct deduction from the carrying amount of debt liability, consistent with debt discounts or premiums. The recognition and measurement guidance for debt issuance costs would not be affected. ASU 2015-03 is effective for annual reporting periods beginning after December 15, 2015, including interim periods within that reporting period. The Company is currently evaluating the impact of the adoption of ASU 2015-03 on its consolidated financial statements.
In August 2014, the FASB issued Accounting Standards Update No. 2014-15, “Presentation of Financial Statements – Going Concern” (“ASU 2014-15”), which provides guidance on determining when and how to disclose going-concern uncertainties in the financial statements. ASU 2014-15 requires management to perform interim and annual assessments of an entity’s ability to continue as a going concern within one year of the date the financial statements are issued. An entity will be required to provide certain disclosures if conditions of events raise substantial doubt about the entity’s ability to continue as a going concern. ASU 2014-15 is effective for annual periods ending after December 15, 2016, and interim periods thereafter, with early adoption permitted. The Company is currently evaluating the impact of the adoption of ASU 2014-15 on its consolidated financial statements.
In May 2014, the FASB issued Accounting Standards Update No. 2014-09, “Revenue from Contracts with Customers” (“ASU 2014-09”). ASU 2014-09 supersedes the revenue recognition requirements in “Revenue Recognition (Topic 605)”, and requires entities to recognize revenue when it transfers promised goods or services to customers in an amount that reflects the consideration to which the entity expects to be entitled to in exchange for those goods or services. ASU 2014-09 is effective for annual reporting periods beginning after December 15, 2016, including interim periods within that reporting period. Early adoption is not permitted. The Company is currently evaluating the impact of the adoption of ASU 2014-09 on its consolidated financial statements.
77
Table of Contents
Index to Financial Statements
MAGNACHIP SEMICONDUCTOR CORPORATION AND SUBSIDIARIES
NOTES TO CONSOLIDATED FINANCIAL STATEMENTS—(CONTINUED)
(TABULAR DOLLARS IN THOUSANDS, EXCEPT SHARE DATA)
2. Fair Value Measurements
ASC 820 defines fair value, establishes a consistent framework for measuring fair value and expands disclosure requirements about fair value measurements. ASC 820 requires, among other things, the Company’s valuation techniques used to measure fair value to maximize the use of observable inputs and minimize the use of unobservable inputs.
Fair Value of Financial Instruments
As of December 31, 2014, the Company did not have any assets measured at fair value on a recurring basis other than cash and cash equivalents, restricted cash, accounts receivable, other receivables, accounts payable, and other accounts payable, fair value of which approximate carrying values due to the short-term nature of these instruments. The fair value of assets and liabilities whose carrying value approximates fair value is determined using Level 2 inputs, with the exception of cash (Level 1).
As of December 31, 2013, the following table represents the Company’s assets measured at fair value on a recurring basis and the basis for that measurement:
| Carrying Value December 31, 2013 |
Fair Value Measurement December 31, 2013 |
Quoted Prices in Active Markets for Identical Asset (Level 1) |
Significant Other Observable Inputs (Level 2) |
Significant Unobservable Inputs (Level 3) |
||||||||||||||||
| Assets: |
||||||||||||||||||||
| Available-for-sale securities (other non-current assets) |
$ | 1,236 | $ | 1,236 | $ | 1,236 | $ | — | $ | — | ||||||||||
| Derivative assets (other current assets) |
4,912 | 4,912 | — | 4,912 | — | |||||||||||||||
Items not reflected in the table above include cash and cash equivalents, restricted cash, accounts receivable, other receivables, accounts payable, and other accounts payable, fair value of which approximate carrying values due to the short-term nature of these instruments. The fair value of assets and liabilities whose carrying value approximates fair value is determined using Level 2 inputs, with the exception of cash (Level 1).
Fair Value of Long-term Borrowings
| December 31, 2014 | December 31, 2013 | |||||||||||||||
| Carrying Value |
Fair Value |
Carrying Value |
Fair Value |
|||||||||||||
| Long-term Borrowings: |
||||||||||||||||
| 6.625% senior notes due July 2021 (Level 2) |
$ | 224,035 | $ | 206,100 | $ | 223,923 | $ | 229,500 | ||||||||
The Company used net proceeds from the issuance of the Company’s 6.625% senior notes due July 15, 2021 (the “2021 Notes”) of $218.8 million, which represents $225.0 million of principal amount net of $1.1 million of original issue discount and $5.1 million of debt issuance costs, together with cash on hand, to repay all of the Company’s then outstanding 10.5% senior notes due April 15, 2018 (the “2018 Notes”), including applicable premium and accrued interest, and to pay related fees and expenses of the 2021 Notes offering. For further description of the senior notes, see Note 10, “Long-term Borrowings”.
Fair Values Measured on a Non-recurring Basis
The Company’s non-financial assets, such as property, plant and equipment, goodwill and intangible assets are recorded at fair value upon acquisition and are remeasured at fair value only if an impairment charge is recognized. The Company uses unobservable inputs (Level 3) to the valuation methodologies that were significant to the fair value measurements, and the valuations required management judgment due to the absence of quoted market prices. As of December 31, 2014, the Company recognized $10,269 thousand of impairment charges, which were incurred due to the closure of its six-inch fabrication facility. See Note 5, “Property, Plant and Equipment” for additional information. In 2013, the Company recognized $5,870 thousand of impairment charges related to the Dawin acquisition and restructuring its fabrication facility. See Note 6, “Intangible Assets” for additional information.
78
Table of Contents
Index to Financial Statements
MAGNACHIP SEMICONDUCTOR CORPORATION AND SUBSIDIARIES
NOTES TO CONSOLIDATED FINANCIAL STATEMENTS—(CONTINUED)
(TABULAR DOLLARS IN THOUSANDS, EXCEPT SHARE DATA)
3. Accounts Receivable
Accounts receivable as of December 31, 2014 and 2013 consisted of the following:
| December 31, | ||||||||
| 2014 | 2013 | |||||||
| Accounts receivable |
$ | 74,850 | $ | 81,862 | ||||
| Notes receivable |
257 | 460 | ||||||
| Less: |
||||||||
| Allowances for doubtful accounts |
(263 | ) | (268 | ) | ||||
| Sales return reserve |
(787 | ) | (1,205 | ) | ||||
| Low yield compensation reserve |
(1,100 | ) | (1,951 | ) | ||||
|
|
|
|
|
|||||
| Accounts receivable, net |
$ | 72,957 | $ | 78,898 | ||||
|
|
|
|
|
|||||
Changes in allowance for doubtful accounts for the years ended December 31, 2014 and 2013 are as follows:
| Year Ended December 31, | ||||||||
| 2014 | 2013 | |||||||
| Beginning balance |
$ | (268 | ) | $ | (401 | ) | ||
| Reversal of allowance (Bad debt expense) |
(3,718 | ) | 115 | |||||
| Write off |
3,508 | 18 | ||||||
| Translation adjustments |
215 | — | ||||||
|
|
|
|
|
|||||
| Ending balance |
$ | (263 | ) | $ | (268 | ) | ||
|
|
|
|
|
|||||
Changes in sales return reserve for the years ended December 31, 2014 and 2013 are as follows:
| Year Ended December 31, | ||||||||
| 2014 | 2013 | |||||||
| Beginning balance |
$ | (1,205 | ) | $ | (1,264 | ) | ||
| Provisions |
(3,224 | ) | (1,218 | ) | ||||
| Usage |
3,598 | 1,296 | ||||||
| Translation adjustments |
44 | (19 | ) | |||||
|
|
|
|
|
|||||
| Ending balance |
$ | (787 | ) | $ | (1,205 | ) | ||
|
|
|
|
|
|||||
Changes in low yield compensation reserve for the years ended December 31, 2014 and 2013 are as follows:
| Year Ended December 31, | ||||||||
| 2014 | 2013 | |||||||
| Beginning balance |
$ | (1,951 | ) | $ | (3,206 | ) | ||
| Provisions |
(766 | ) | (1,868 | ) | ||||
| Usage |
1,563 | 3,150 | ||||||
| Translation adjustments |
54 | (27 | ) | |||||
|
|
|
|
|
|||||
| Ending balance |
$ | (1,100 | ) | $ | (1,951 | ) | ||
|
|
|
|
|
|||||
79
Table of Contents
Index to Financial Statements
MAGNACHIP SEMICONDUCTOR CORPORATION AND SUBSIDIARIES
NOTES TO CONSOLIDATED FINANCIAL STATEMENTS—(CONTINUED)
(TABULAR DOLLARS IN THOUSANDS, EXCEPT SHARE DATA)
The Company has entered into an agreement to sell selected trade accounts receivable to a financial institution from time to time since March 2012. After the sale, the Company does not retain any interests in the receivables and the applicable financial institution collects these accounts receivable directly from the customer. The proceeds from the sales of these accounts receivable totaled $22,256 thousand and $28,869 thousand for the years ended December 31, 2014 and 2013, respectively and these sales resulted in pre-tax losses of $64 thousand and $73 thousand for the years ended December 31, 2014 and 2013, respectively, which are included in selling, general and administrative expenses in the consolidated statements of operations. Net proceeds of these accounts receivable sale program are recognized in the consolidated statements of cash flows as part of operating cash flows.
Receivable Discount Programs
The Company uses receivable discount programs with certain customers. While these discount arrangements allow the Company to accelerate collection of customers’ receivables, there can be no assurance that these programs will continue in the future.
4. Inventories
Inventories as of December 31, 2014 and 2013 consist of the following:
| Year Ended December 31, | ||||||||
| 2014 | 2013 | |||||||
| Finished goods |
40,404 | 43,734 | ||||||
| Semi-finished goods and work-in-process |
68,153 | 92,030 | ||||||
| Raw materials |
7,520 | 9,464 | ||||||
| Materials in-transit and other |
6,745 | 1,870 | ||||||
| Less: inventory reserve |
(47,488 | ) | (72,400 | ) | ||||
|
|
|
|
|
|||||
| Inventories, net |
$ | 75,334 | $ | 74,698 | ||||
|
|
|
|
|
|||||
Changes in inventory reserve for the years ended December 31, 2014 and 2013 are as follows:
| Year Ended December 31, | ||||||||
| 2014 | 2013 | |||||||
| Beginning balance |
$ | (72,400 | ) | $ | (25,429 | ) | ||
| Change in reserve |
(883 | ) | (48,015 | ) | ||||
| Write off |
23,765 | 3,086 | ||||||
| Translation adjustments |
2,030 | (2,042 | ) | |||||
|
|
|
|
|
|||||
| Ending balance |
$ | (47,488 | ) | $ | (72,400 | ) | ||
|
|
|
|
|
|||||
Inventory reserve represents the Company’s best estimate in value lost due to excessive inventory level, physical deterioration, obsolescence, changes in price levels, or other causes based on individual facts and circumstances. Inventory reserve relates to inventory items including finished goods, semi-finished goods and work-in-process. Write off of this reserve is recognized only when the related inventory has been disposed or scrapped.
80
Table of Contents
Index to Financial Statements
MAGNACHIP SEMICONDUCTOR CORPORATION AND SUBSIDIARIES
NOTES TO CONSOLIDATED FINANCIAL STATEMENTS—(CONTINUED)
(TABULAR DOLLARS IN THOUSANDS, EXCEPT SHARE DATA)
5. Property, Plant and Equipment
Property, plant and equipment as of December 31, 2014 and 2013 are comprised of the following:
| December 31, | ||||||||
| 2014 | 2013 | |||||||
| Buildings and related structures |
$ | 70,552 | $ | 81,050 | ||||
| Machinery and equipment |
269,031 | 269,840 | ||||||
| Vehicles and others |
24,812 | 22,397 | ||||||
|
|
|
|
|
|||||
| 364,395 | 373,287 | |||||||
| Less: accumulated depreciation |
(157,341 | ) | (136,397 | ) | ||||
| Land |
16,712 | 17,407 | ||||||
|
|
|
|
|
|||||
| Property, plant and equipment, net |
$ | 223,766 | $ | 254,297 | ||||
|
|
|
|
|
|||||
Aggregate depreciation expenses totaled $28,475 thousand and $25,934 thousand for the years ended December 31, 2014 and 2013, respectively.
During the fourth quarter of 2014, the Company recognized $10,269 thousand of impairment charges, which were incurred due to the closure of its six-inch fabrication facility. The impairment charges primarily resulted from $8,239 thousand of impairment to building, $1,763 thousand of impairment of machinery and equipment and $267 thousand of impairment of other tangible assets.
During the fourth quarter of 2013, the Company recorded $508 thousand in impairment charges related to the impairment of certain machinery and equipment which were purchased as part of the Dawin acquisition.
6. Intangible Assets
Intangible assets as of December 31, 2014 and 2013 are as follows:
| December 31, | ||||||||
| 2014 | 2013 | |||||||
| Technology |
$ | 19,683 | $ | 20,081 | ||||
| Customer relationships |
28,269 | 29,444 | ||||||
| Intellectual property assets |
8,359 | 7,829 | ||||||
| Less: accumulated amortization |
(53,860 | ) | (54,243 | ) | ||||
|
|
|
|
|
|||||
| Intangible assets, net |
$ | 2,451 | $ | 3,111 | ||||
|
|
|
|
|
|||||
Aggregate amortization expenses for intangible assets totaled $1,514 thousand and $6,792 thousand for the years ended December 31, 2014 and 2013, respectively. The aggregate amortization expense of intangible assets for the next five years are estimated to be $316 thousand, $315 thousand, $315 thousand, $315 thousand and $314 thousand, for the years ended December 31, 2015, 2016, 2017, 2018 and 2019, respectively.
During the fourth quarter of 2013, the Company’s management became aware that certain technology being developed in relation to the Dawin acquisition could no longer be used. The Company considered this event as an indicator of impairment in performing its annual analysis for potential impairment of its goodwill, which included examining, based on factors and conditions then existing, the impact of current general economic conditions on its future prospects. Based on this analysis, the Company determined that goodwill and certain technology associated with the Dawin acquisition were impaired and recorded an impairment charge of $3,389 thousand related to goodwill and $1,864 thousand of intangible assets.
In addition, the Company recognized an impairment charge of $617 thousand related to certain existing technology from restructuring its fabrication facility in 2013.
81
Table of Contents
Index to Financial Statements
MAGNACHIP SEMICONDUCTOR CORPORATION AND SUBSIDIARIES
NOTES TO CONSOLIDATED FINANCIAL STATEMENTS—(CONTINUED)
(TABULAR DOLLARS IN THOUSANDS, EXCEPT SHARE DATA)
7. Accrued Expenses
Accrued expenses as of December 31, 2014 and 2013 are as follows:
| December 31, | ||||||||
| 2014 | 2013 | |||||||
| Payroll, benefits and related taxes, excluding severance benefits |
$ | 18,654 | $ | 19,869 | ||||
| Withholding tax levied on intercompany interest income |
27,497 | 23,872 | ||||||
| Interest on senior notes |
7,040 | 6,749 | ||||||
| Settlement obligations |
8,976 | 6,460 | ||||||
| Outside service fees |
10,640 | 1,462 | ||||||
| Others |
8,253 | 7,082 | ||||||
|
|
|
|
|
|||||
| Accrued expenses |
$ | 81,060 | $ | 65,494 | ||||
|
|
|
|
|
|||||
Settlement obligations included in the table above relate to claims involving the Company’s products that may have caused a failure in the customer’s product. Although the Company does not agree with the claim, as its product met the customer’s specifications, the Company considered a number of factors and decided not to dispute the claim but make certain in-kind payments as demanded by the customer. These settlement obligations are accrued when they are deemed probable and can be reasonably estimated.
8. Derivative Financial Instruments
The Company’s Korean subsidiary from time to time has entered into forward and zero cost collar contracts to hedge the risk of changes in the functional-currency-equivalent cash flows attributable to currency rate changes on U.S. dollar denominated revenues.
The Company did not have any derivative contracts in effect as of December 31, 2014.
The forward and zero cost collar contracts qualify as cash flow hedges under ASC 815, since at both the inception of the contracts and on an ongoing basis, the hedging relationship was and is expected to be highly effective in achieving offsetting cash flows attributable to the hedged risk during the term of the contracts. The Company is utilizing the “hypothetical derivative” method to measure the effectiveness by comparing the changes in value of the actual derivative versus the change in fair value of the “hypothetical derivative.”
The fair values of the Company’s outstanding forward and zero cost collar contracts recorded as assets as of December 31, 2014 and 2013 are as follows:
| Derivatives designated as hedging instruments: |
December 31, | |||||||||||
| 2014 | 2013 | |||||||||||
| Asset Derivatives: |
||||||||||||
| Zero cost collars |
Other current assets | $ | — | $ | 4,912 | |||||||
Offsetting of derivative assets as of December 31, 2013 is as follows:
| As of December 31, 2013 |
Gross amounts of recognized assets/liabilities |
Gross amounts offset in the balance sheets |
Net amounts of assets/liabilities presented in the balance sheets |
Gross amounts not offset in the balance sheets |
Net amount | |||||||||||||||||||
| Financial instruments |
Cash collateral received/pledged |
|||||||||||||||||||||||
| Asset Derivatives: |
||||||||||||||||||||||||
| Zero cost collars |
$ | 4,912 | $ | — | $ | 4,912 | $ | — | $ | — | $ | 4,912 | ||||||||||||
82
Table of Contents
Index to Financial Statements
MAGNACHIP SEMICONDUCTOR CORPORATION AND SUBSIDIARIES
NOTES TO CONSOLIDATED FINANCIAL STATEMENTS—(CONTINUED)
(TABULAR DOLLARS IN THOUSANDS, EXCEPT SHARE DATA)
For derivative instruments that are designated and qualify as cash flow hedges, the effective portion of the gain or loss on the derivative is reported as a component of accumulated other comprehensive income (“AOCI”) and reclassified into earnings in the same period or periods during which the hedged transaction affects earnings. Gains and losses on the derivative, representing either hedge ineffectiveness or hedge components excluded from the assessment of effectiveness, are recognized in current earnings.
The following table summarizes the impact of derivative instruments on the consolidated statement of operations for the years ended December 31, 2014 and 2013:
| Derivatives in ASC 815 Cash Flow Hedging Relationships |
Amount of Gain (Loss) Recognized in AOCI on Derivatives (Effective Portion) |
Location of |
Amount of Gain (Loss) Reclassified from AOCI into Statement of Operations (Effective Portion) |
Location of Gain (Loss) Recognized in Statement of Operations on Derivative (Ineffective Portion and Amount Excluded from Effectiveness Testing) |
Amount of Gain (Loss) Recognized in Statement of Operations on Derivatives (Ineffective Portion and Amount Excluded from Effectiveness Testing) |
|||||||||||||||||||||||
| 2014 | 2013 | 2014 | 2013 | 2014 | 2013 | |||||||||||||||||||||||
| Forward |
$ | — | $ | 3,405 | Net sales | $ | — | $ | 3,484 | Other income (expenses)— Others |
$ | — | $ | 412 | ||||||||||||||
| Zero cost collars |
(69 | ) | 4,092 | Net sales | 6,033 | (500 | ) | Other income (expenses)— Others |
(12 | ) | 222 | |||||||||||||||||
|
|
|
|
|
|
|
|
|
|
|
|
|
|||||||||||||||||
| Total |
$ | (69 | ) | $ | 7,497 | $ | 6,033 | $ | 2,984 | $ | (12 | ) | $ | 634 | ||||||||||||||
|
|
|
|
|
|
|
|
|
|
|
|
|
|||||||||||||||||
As of December 31, 2014, the amount expected to be reclassified from accumulated other comprehensive income into earnings within the next twelve months is $485 thousand.
On September 1, 2014, the Company and the counterparty, the Goldman Sachs International bank (“GS”), mutually agreed to terminate a zero cost collar contract under termination provisions of the International Swaps and Derivatives Association (“ISDA”) agreement. In connection with this termination, the Company received $1,050 thousand for settlement proceeds from GS.
On September 30, 2014, the Company and the counterparty, UBS AG, Seoul Branch (“UBS”), mutually agreed to terminate a zero cost collar contract under termination provisions of the ISDA agreement. In connection with this termination, the Company received $430 thousand for settlement proceeds from UBS.
83
Table of Contents
Index to Financial Statements
MAGNACHIP SEMICONDUCTOR CORPORATION AND SUBSIDIARIES
NOTES TO CONSOLIDATED FINANCIAL STATEMENTS—(CONTINUED)
(TABULAR DOLLARS IN THOUSANDS, EXCEPT SHARE DATA)
9. Product Warranties
Changes in accrued warranty liabilities for each period are as follows:
| Year Ended December 31, | ||||||||
| 2014 | 2013 | |||||||
| Beginning balance |
$ | 877 | $ | 1,223 | ||||
| Provisions |
7,194 | 1,917 | ||||||
| Usage |
(4,923 | ) | (2,268 | ) | ||||
| Translation adjustments |
(175 | ) | 5 | |||||
|
|
|
|
|
|||||
| Ending balance |
$ | 2,973 | $ | 877 | ||||
|
|
|
|
|
|||||
10. Long-term Borrowings
Long-term borrowings as of December 31, 2014 and 2013 are as follows:
| December 31, | ||||||||
| 2014 | 2013 | |||||||
| 6.625% senior notes due July 2021 (the 2021 Notes) |
$ | 225,000 | $ | 225,000 | ||||
| Discount on senior notes |
(965 | ) | (1,077 | ) | ||||
|
|
|
|
|
|||||
| Long-term borrowings, net of unamortized discount |
$ | 224,035 | $ | 223,923 | ||||
|
|
|
|
|
|||||
6.625% Senior Notes
On July 18, 2013, the Company issued $225,000,000 aggregate principal amount of the 2021 Notes at a price of 99.5%. Interest on the 2021 Notes accrues at a rate of 6.625% per annum, payable semi-annually on January 15 and July 15 of each year, beginning on January 15, 2014.
In connection with the issuance of the 2021 Notes, the Company capitalized certain costs and fees, which are being amortized using the effective interest method over its respective term, 2013 to 2021. Amortization costs, which were included in interest expense in the accompanying statements of operations, amounted to $503 thousand for the year ended December 31, 2014. The remaining capitalized costs as of December 31, 2014, which were included in other non-current assets in the consolidated balance sheet, were $4,320 thousand.
The Company used net proceeds from the issuance of the 2021 Notes of $218.8 million, which represents $225.0 million of principal amount net of $1.1 million of original issue discount and $5.1 million of debt issuance costs, together with cash on hand, to repay all of the then outstanding 2018 Notes, including applicable premium and accrued interest, and to pay related fees and expenses of the 2021 Notes offering.
In connection with the refinancing of the Company’s senior notes, the Company recognized $32.8 million of loss on early extinguishment of senior notes, which consisted of $23.8 million from the applicable premium, $5.3 million from write-off of debt issuance costs, $1.9 million from write-off of discounts and $1.8 million of interest incurred during the notice period.
The Company can optionally redeem all or a part of the 2021 Notes according to the following schedule: (i) at any time prior to July 15, 2016, the Company may on any one or more occasions redeem up to 35% of the aggregate principal amount of 2021 Notes issued under that certain Indenture, dated as of July 18, 2013, by and between the Company and Wilmington Trust, National Association, as trustee (the “Trustee”), as supplemented by that certain First Supplemental Indenture, dated as of March 27, 2014 (collectively, the “Indenture”), related to the 2021 Notes at a redemption price equal to 106.625% of the principal amount of the 2021 Notes redeemed, plus accrued and unpaid interest and special interest, if any, to the date of redemption with the net proceeds of a qualified equity offering; (ii) at any time prior to July 15, 2017, the Company may on any one or more occasions redeem all or a part of the 2021 Notes at a redemption price equal to 100% of the principal amount of the notes redeemed, plus the applicable premium as of, and accrued and unpaid interest and special interest, if any, to the date of redemption; and (iii) on or after July 15, 2017, the
84
Table of Contents
Index to Financial Statements
MAGNACHIP SEMICONDUCTOR CORPORATION AND SUBSIDIARIES
NOTES TO CONSOLIDATED FINANCIAL STATEMENTS—(CONTINUED)
(TABULAR DOLLARS IN THOUSANDS, EXCEPT SHARE DATA)
Company may on any one or more occasions redeem all or a part of the 2021 Notes, at a redemption price equal to 103.313%, 101.656% and 100% of the principal amount of the notes redeemed on or after July 15, 2017, 2018 and 2019 and thereafter, respectively, plus accrued and unpaid interest and special interest, if any, on the notes redeemed, to the applicable date of redemption.
The indenture relating to the 2021 Notes contains covenants that limit ability of the Company and its restricted subsidiaries to: (i) declare or pay any dividend or make any payment or distribution on account of or purchase or redeem the Company’s capital stock or equity interests of the restricted subsidiaries; (ii) make any principal payment on, or redeem or repurchase, prior to any scheduled repayment or maturity, any subordinated indebtedness; (iii) make certain investments; (iv) incur additional indebtedness and issue certain types of capital stock; (v) create or incur any lien (except for permitted liens) that secures obligations under any indebtedness; (vi) merge with or into or sell all or substantially all of the Company’s assets to other companies; (vii) enter into certain types of transactions with affiliates; (viii) guarantee the payment of any indebtedness; (ix) enter into sale-leaseback transactions; (x) enter into agreements that would restrict the ability of the restricted subsidiaries to make distributions with respect to their equity to the Company or other restricted subsidiaries, to make loans to the Company or other restricted subsidiaries or to transfer assets to the Company or other restricted subsidiaries; and (xi) designate unrestricted subsidiaries.
These covenants are subject to a number of exceptions and qualifications. Certain of these restrictive covenants will terminate if the notes are rated investment grade at any time.
As disclosed in the Company’s Form 8-K filed on June 25, 2014, the Company received a notice of default on June 20, 2014 (the “10-K and Q1 10-Q Notice of Default”) from the Trustee under the Indenture. The 10-K and Q1 10-Q Notice of Default related to the failure by the Company, pursuant to Section 4.03 of the Indenture, to file with the SEC its Annual Report on Form 10-K for the fiscal year ended December 31, 2013 and its Quarterly Report on Form 10-Q for the fiscal quarter ended March 31, 2014 (the “Initial Reporting Defaults”). The Company did not cure the Initial Reporting Defaults within the applicable 60-day grace period and the Initial Reporting Defaults ripened into Events of Default. The Company elected, as the sole and exclusive remedy for the Events of Default, to pay additional interest on the 2021 Notes at a rate equal to 0.25% per annum of the principal amount of the 2021 Notes (the “Additional Interest”) for a period of up to180 days following the occurrence of the Events of Default (the “Additional Interest Period”).
On August 20, 2014, the Company received a notice of default related to its failure to file its Form 10-Q for the fiscal quarter ended June 30, 2014 (the “Q2 10-Q Notice of Default”), and on November 19, 2014, the Company received a notice of default related to its failure to file its Form 10-Q for the fiscal quarter ended September 30, 2014 (the “Q3 10-Q Notice of Default”). These defaults also ripened into Events of Default and on December 29, 2014 and January 15, 2015, respectively, the Company elected to extend the Additional Interest Period for up to 180 days following each additional Event of Default.
Upon the filing with the SEC of the 2013 Form 10-K and the Form 10-Qs for each of the fiscal quarters ended March 31, 2014, June 30, 2014 and September 31, 2014, the Company regained compliance with its reporting obligations under the Indenture and cured all identified covenant defaults in each of the 10-K and the Q1 10-Q Notice of Default, the Q2 10-Q Notice of Default, and the Q3 10-Q Notice of Default, and ceased accruing the Additional Interest on the 2021 Notes as of February 12, 2015.
85
Table of Contents
Index to Financial Statements
MAGNACHIP SEMICONDUCTOR CORPORATION AND SUBSIDIARIES
NOTES TO CONSOLIDATED FINANCIAL STATEMENTS—(CONTINUED)
(TABULAR DOLLARS IN THOUSANDS, EXCEPT SHARE DATA)
11. Accrued Severance Benefits
The majority of accrued severance benefits is for employees in the Company’s Korean subsidiary, MagnaChip Semiconductor Ltd. (Korea). Pursuant to the Employee Retirement Benefit Security Act of Korea, eligible employees and executive officers with one or more years of service are entitled to severance benefits upon the termination of their employment based on their length of service and rate of pay. As of December 31, 2014, 98% of all employees of the Company were eligible for severance benefits.
Changes in accrued severance benefits are as follows:
| Year Ended December 31, | ||||||||
| 2014 | 2013 | |||||||
| Beginning balance |
$ | 135,356 | $ | 116,036 | ||||
| Provisions |
17,703 | 23,169 | ||||||
| Severance payments |
(6,650 | ) | (6,130 | ) | ||||
| Translation adjustments |
(6,003 | ) | 2,281 | |||||
|
|
|
|
|
|||||
| 140,405 | 135,356 | |||||||
| Less: cumulative contributions to the National Pension Fund |
(346 | ) | (383 | ) | ||||
| Group severance insurance plan |
(770 | ) | (801 | ) | ||||
|
|
|
|
|
|||||
| $ | 139,289 | $ | 134,172 | |||||
|
|
|
|
|
|||||
The severance benefits are funded approximately 0.8% and 0.9% as of December 31, 2014 and 2013, respectively, through the Company’s National Pension Fund and group severance insurance plan which will be used exclusively for payment of severance benefits to eligible employees. These amounts have been deducted from the accrued severance benefit balance.
The Company is liable to pay the following future benefits to its employees upon their normal retirement age:
| Severance Benefit |
||||
| 2015 |
$ | 294 | ||
| 2016 |
1,154 | |||
| 2017 |
1,714 | |||
| 2018 |
2,937 | |||
| 2019 |
2,263 | |||
| 2020 – 2024 |
23,798 | |||
The above amounts were determined based on the employees’ current salary rates and the number of service years that will be accumulated upon their retirement dates. These amounts do not include amounts that might be paid to employees that will cease working with the Company before their normal retirement ages.
86
Table of Contents
Index to Financial Statements
MAGNACHIP SEMICONDUCTOR CORPORATION AND SUBSIDIARIES
NOTES TO CONSOLIDATED FINANCIAL STATEMENTS—(CONTINUED)
(TABULAR DOLLARS IN THOUSANDS, EXCEPT SHARE DATA)
12. Common Stock
Common stock par value $0.01 per share, was authorized in the amount of 150,000 thousand shares, of which 40,635 thousand shares were issued and 34,056 thousand shares were outstanding as of December 31, 2014.
Changes in common stock for each period are as follows:
| Year Ended December 31, | ||||||||||||||||
| 2014 | 2013 | |||||||||||||||
| Shares | Amount | Shares | Amount | |||||||||||||
| Common stock at the beginning of the period |
34,048,366 | $ | 406 | 35,635,357 | $ | 396 | ||||||||||
| Exercise of stock options |
6,795 | 0 | 579,476 | 6 | ||||||||||||
| Exercise of warrants |
1,307 | 0 | 448,281 | 4 | ||||||||||||
| Acquisitions of treasury stock |
— | — | (2,614,748 | ) | — | |||||||||||
|
|
|
|
|
|
|
|
|
|||||||||
| Total common stock outstanding at the end of the period |
34,056,468 | $ | 406 | 34,048,366 | $ | 406 | ||||||||||
|
|
|
|
|
|
|
|
|
|||||||||
On October 7, 2011, the Company’s Board of Directors adopted a stock repurchase program whereby the Company may, subject to prevailing market conditions and other factors, repurchase up to $35 million of its outstanding common stock. The Board of Directors extended and increased the program by an additional $25 million in August 2012, for a maximum aggregate repurchase amount under the original program of up to $60 million. On July 30, 2013, the Company announced that the Board of Directors approved a new stock repurchase program under which the Company is authorized to repurchase up to $100 million of its common stock. The new stock repurchase program was effective August 5, 2013 through December 15, 2014, and replaced the original stock repurchase program. The stock repurchase program did not require that the Company purchases a minimum amount of shares of its common stock and may be commenced, suspended, resumed or terminated at any time without notice. The timing and extent of any repurchases will depend upon prevailing market conditions, the trading price of the Company’s common stock and other factors, and subject to contractual restrictions and restrictions under applicable law and regulations. The Company purchased 2,615 thousand shares of common stock on the open market at a cost of $51,000 thousand for the year ended December 31, 2013. The Company accounted for the treasury stock using the cost method, which treats it as a temporary reduction in stockholders’ equity. As a result, the stockholders’ equity has decreased by $51,000 thousand for the years ended December 31, 2013. In March 2014, the Board of Directors suspended the stock repurchase program indefinitely, and the stock repurchase program expired by its terms on December 15, 2014. Subsequent to December 31, 2013, the Company did not repurchase any shares under the stock repurchase program.
13. Equity Incentive Plans
The Company adopted its 2009 Common Unit Plan, or the 2009 Plan, effective December 8, 2009, which is administered by the Compensation Committee of the Company’s Board of Directors (the “Compensation Committee”). The 2009 Plan terminated immediately following the Company’s corporate conversion in March 2011, and no additional options or other equity awards may be granted under the 2009 Plan. However, options granted under the 2009 Plan prior to its termination will remain outstanding until they are either exercised or expire. The Company adopted its 2011 Equity Incentive Plan, or the 2011 Plan, in March 2010. The Company amended and restated the 2011 Plan in February 2011, and the Company’s stockholders approved the amendment in March 2011 to reflect that it became effective in 2011 upon the Company’s corporate conversion in March 2011. Awards may be granted under the 2011 Plan to the Company’s employees, including officers, directors, or consultants or those of any present or future parent or subsidiary corporation or other affiliated entity. While the Company may grant incentive stock options only to employees, the Company may grant nonstatutory stock options, stock appreciation rights, restricted stock purchase rights or bonuses, restricted stock units, performance shares, performance units and cash-based awards or other stock-based awards to any eligible participant, subject to terms and conditions determined by the Compensation Committee. The term of options shall not exceed ten years from the date of grant. Restricted stock purchase rights shall be exercisable within a period established by the Compensation Committee, which shall in no event exceed thirty days from the effective date of the grant. As of December 31, 2014, an aggregate maximum of 5,902 thousand shares were authorized and 955 thousand shares were reserved for all future grants.
Stock options and stock appreciation rights must have exercise prices at least equal to the fair market value of the stock at the time of their grant pursuant to the 2011 Plan. The requisite service period, or the period during which a grantee is required to provide service in exchange for option grants, coincides with the vesting period. The stock options typically vest over three years following grant, with 34% of the common stock vesting and becoming exercisable on the first anniversary of grant date and 8% or 9% of the common stock subject to the options vesting on completion of each three-month period thereafter.
87
Table of Contents
Index to Financial Statements
MAGNACHIP SEMICONDUCTOR CORPORATION AND SUBSIDIARIES
NOTES TO CONSOLIDATED FINANCIAL STATEMENTS—(CONTINUED)
(TABULAR DOLLARS IN THOUSANDS, EXCEPT SHARE DATA)
The purchase price for shares issuable under each restricted stock purchase right shall be established by the Compensation Committee in its discretion. No monetary payment (other than applicable tax withholding) shall be required as a condition of receiving shares pursuant to a restricted stock bonus, the consideration for which shall be services actually rendered to a participating company or for its benefit. Stock issued pursuant to any restricted stock award may (but need not) be made subject to vesting conditions based upon the satisfaction of such service requirements, conditions, restrictions or performance criteria as shall be established by the Compensation Committee and set forth in the award agreement evidencing such award. During any period in which stock acquired pursuant to a restricted stock award remain subject to vesting conditions, such stock may not be sold, exchanged, transferred, pledged, assigned or otherwise disposed of other than pursuant to an ownership change event or transfer by will or the laws of descent and distribution. The grantee shall have all of the rights of a stockholder of the Company holding stock, including the right to vote such stock and to receive all dividends and other distributions paid with respect to such stock; provided, however, that if so determined by the Compensation Committee and provided by the award agreement, such dividends and distributions shall be subject to the same vesting conditions as the stock subject to the restricted stock award with respect to which such dividends or distributions were paid. If a grantee’s service terminates for any reason, whether voluntary or involuntary (including the grantee’s death or disability), then (a) the Company (or its assignee) has the option to repurchase for the purchase price paid by the grantee any stock acquired by the grantee pursuant to a restricted stock purchase right which remain subject to vesting conditions as of the date of the grantee’s termination of service and (b) the grantee shall forfeit to the Company any stock acquired by the grantee pursuant to a restricted stock bonus which remain subject to vesting conditions as of the date of the grantee’s termination of service. The Company has the right to assign at any time any repurchase right it may have, whether or not such right is then exercisable, to one or more persons as may be selected by the Company.
88
Table of Contents
Index to Financial Statements
MAGNACHIP SEMICONDUCTOR CORPORATION AND SUBSIDIARIES
NOTES TO CONSOLIDATED FINANCIAL STATEMENTS—(CONTINUED)
(TABULAR DOLLARS IN THOUSANDS, EXCEPT SHARE DATA)
The following summarizes stock option and restricted stock bonus activities for the years ended December 31, 2014, 2013 and 2012 after giving effect to the corporate conversion. At the date of grant, all options had an exercise price above the fair value of common stock:
| Number of Options |
Weighted Average Exercise Price of Stock Options |
Aggregate Intrinsic Value of Stock Options |
Weighted Average Remaining Contractual Life of Stock Options |
|||||||||||||
| Outstanding at January 1, 2012 |
2,008,960 | $ | 6.79 | 2,773 | 8.1 years | |||||||||||
| Granted |
1,319,500 | 8.29 | — | — | ||||||||||||
| Forfeited |
(95,271 | ) | 11.07 | — | — | |||||||||||
| Exercised |
(155,708 | ) | 5.88 | — | — | |||||||||||
|
|
|
|||||||||||||||
| Outstanding at December 31, 2012 |
3,077,481 | $ | 7.35 | 26,385 | 7.9 years | |||||||||||
|
|
|
|||||||||||||||
| Vested and expected to vest at December 31, 2012 |
3,021,937 | 7.32 | 25,988 | 7.9 years | ||||||||||||
| Exercisable at December 31, 2012 |
1,726,891 | 6.54 | 16,203 | 7.0 years | ||||||||||||
|
|
|
|||||||||||||||
| Outstanding at January 1, 2013 |
3,077,481 | 7.35 | 26,385 | 7.9 years | ||||||||||||
| Granted |
455,000 | 17.08 | — | — | ||||||||||||
| Forfeited |
(8,360 | ) | 10.89 | — | — | |||||||||||
| Exercised |
(579,476 | ) | 7.44 | — | — | |||||||||||
|
|
|
|||||||||||||||
| Outstanding at December 31, 2013 |
2,944,645 | $ | 8.82 | 31,558 | 7.3 years | |||||||||||
|
|
|
|||||||||||||||
| Vested and expected to vest at December 31, 2013 |
2,916,184 | 8.78 | 31,376 | 7.3 years | ||||||||||||
| Exercisable at December 31, 2013 |
1,946,475 | 7.00 | 24,325 | 6.7 years | ||||||||||||
|
|
|
|||||||||||||||
| Outstanding at January 1, 2014 |
2,944,645 | $ | 8.82 | 31,558 | 7.3 years | |||||||||||
| Granted |
310,000 | 16.75 | — | — | ||||||||||||
| Forfeited |
(31,905 | ) | 8.34 | — | — | |||||||||||
| Exercised |
(6,795 | ) | 7.03 | — | — | |||||||||||
|
|
|
|||||||||||||||
| Outstanding at December 31, 2014 |
3,215,945 | $ | 9.60 | 39,615 | 6.6 years | |||||||||||
|
|
|
|||||||||||||||
| Vested and expected to vest at December 31, 2014 |
3,204,967 | 9.58 | 39,610 | 6.6 years | ||||||||||||
| Exercisable at December 31, 2014 |
2,760,402 | 8.70 | 39,187 | 6.3 years | ||||||||||||
|
|
|
|||||||||||||||
Total compensation expenses recorded for the stock options were $2,072 thousand, $2,213 thousand and $2,389 thousand for the years ended December 31, 2014, 2013 and 2012, respectively. As of December 31, 2014, there was $636 thousand of total unrecognized compensation cost related to stock options, which is expected to be recognized over a weighted average future period of 0.8 year. Total fair value of options vested were $2,957 thousand, $1,746 thousand and $1,515 thousand for the years ended December 31, 2014, 2013 and 2012, respectively.
89
Table of Contents
Index to Financial Statements
MAGNACHIP SEMICONDUCTOR CORPORATION AND SUBSIDIARIES
NOTES TO CONSOLIDATED FINANCIAL STATEMENTS—(CONTINUED)
(TABULAR DOLLARS IN THOUSANDS, EXCEPT SHARE DATA)
The Company utilizes the Black-Scholes option-pricing model to measure the fair value of each option grant. The following summarizes the grant-date fair value of options granted for the years ended December 31, 2014, 2013 and 2012 and assumptions used in the Black-Scholes option-pricing model on a weighted average basis:
| Year Ended December 31, | ||||||||||||
| 2014 | 2013 | 2012 | ||||||||||
| Grant-date fair value of option |
$ | 4.10 | $ | 4.30 | $ | 2.70 | ||||||
| Expected term |
2.7 Years | 2.8 Years | 3.0 Years | |||||||||
| Risk-free interest rate |
0.7 | % | 0.4 | % | 0.4 | % | ||||||
| Expected volatility |
36.7 | % | 37.6 | % | 48.8 | % | ||||||
| Expected dividends |
— | — | — | |||||||||
The number and weighted average grant-date fair value of the unvested stock options are as follows:
| Year Ended December 31, | ||||||||||||||||||||||||
| 2014 | 2013 | 2012 | ||||||||||||||||||||||
| Number | Weighted Average Grant- Date Fair Value |
Number | Weighted Average Grant- Date Fair Value |
Number | Weighted Average Grant- Date Fair Value |
|||||||||||||||||||
| Unvested options at the beginning of the period |
998,170 | $ | 3.69 | 1,350,590 | $ | 2.79 | 796,514 | $ | 2.60 | |||||||||||||||
| Granted options during the period |
310,000 | 4.10 | 455,000 | 4.30 | 1,319,500 | 2.70 | ||||||||||||||||||
| Vested options during the period |
(819,818 | ) | 3.61 | (651,530 | ) | 2.68 | (654,022 | ) | 2.32 | |||||||||||||||
| Forfeited options during the period |
(31,905 | ) | 3.20 | (7,106 | ) | 3.92 | (74,335 | ) | 4.02 | |||||||||||||||
| Exercised options during the period |
(904 | ) | 3.16 | (148,784 | ) | 2.46 | (37,067 | ) | 1.87 | |||||||||||||||
|
|
|
|
|
|
|
|||||||||||||||||||
| Unvested options at the end of the period |
455,543 | $ | 4.18 | 998,170 | $ | 3.69 | 1,350,590 | $ | 2.79 | |||||||||||||||
|
|
|
|
|
|
|
|||||||||||||||||||
14. Restructuring and Impairment Charges
2014 Impairment Charges
The Company recognized $10,269 thousand of impairment charges, which were incurred due to the closure of its six-inch fabrication facility. The impairment charges primarily resulted from $8,239 thousand of impairment to building, $1,763 thousand of impairment of machinery and equipment and $267 thousand of impairment of other tangible assets.
2013 Restructuring and Impairment Charges
The Company recognized $1,829 thousand of restructuring charges for the year ended December 31, 2013 from restructuring its six-inch fabrication facility and $617 thousand of impairment charges from certain existing technology.
The Company recognized impairment charges related to impairment of goodwill, certain technology and equipment of $3,389 thousand, $1,864 thousand and $508 thousand, respectively. These impairment charges relate to goodwill, technology and equipment purchased in connection with the Dawin acquisition.
90
Table of Contents
Index to Financial Statements
MAGNACHIP SEMICONDUCTOR CORPORATION AND SUBSIDIARIES
NOTES TO CONSOLIDATED FINANCIAL STATEMENTS—(CONTINUED)
(TABULAR DOLLARS IN THOUSANDS, EXCEPT SHARE DATA)
15. Foreign Currency Gain (Loss), Net
Net foreign currency gain or loss includes non-cash translation gain or loss associated with intercompany balances. A substantial portion of the Company’s net foreign currency gain or loss is non-cash translation gain or loss associated with intercompany long-term loans to our Korean subsidiary. The loans are denominated in U.S. dollars and are affected by changes in the exchange rate between the Korean won and the U.S. dollar. As of December 31, 2014, the outstanding intercompany loan balance including accrued interests between the Korean subsidiary and the Dutch subsidiary was $766 million. The Korean won to U.S. dollar exchange rates were 1,099.2:1, 1,055.3:1 and 1,071.1:1 using the first base rate as of December 31, 2014, 2013 and 2012, respectively, as quoted by the Korea Exchange Bank.
16. Income Taxes
The Company’s income tax expenses are composed of domestic and foreign income taxes depending on the relevant tax jurisdiction. “Domestic” refers to the income before taxes and current income taxes generated or incurred in the United States, where the parent company resides.
The components of income tax expense are as follows:
| Year Ended December 31, | ||||||||||||
| 2014 | 2013 | 2012 | ||||||||||
| Income (loss) before income taxes |
||||||||||||
| Domestic |
$ | (22,146 | ) | $ | (6,127 | ) | $ | (2,634 | ) | |||
| Foreign |
(93,563 | ) | (54,106 | ) | 125,519 | |||||||
|
|
|
|
|
|
|
|||||||
| $ | (115,709 | ) | $ | (60,233 | ) | $ | 122,885 | |||||
|
|
|
|
|
|
|
|||||||
| Current income taxes expense (benefit) |
||||||||||||
| Domestic |
$ | (3,300 | ) | $ | (2,258 | ) | $ | 6,170 | ||||
| Foreign |
3,312 | 4,875 | 4,533 | |||||||||
| Uncertain tax position liability (domestic) |
10 | (87 | ) | 14 | ||||||||
| Uncertain tax position liability (foreign) |
(66 | ) | 7 | 175 | ||||||||
|
|
|
|
|
|
|
|||||||
| (44 | ) | 2,537 | 10,892 | |||||||||
|
|
|
|
|
|
|
|||||||
| Deferred income taxes expense |
||||||||||||
| Foreign |
1,567 | 1,433 | 1,955 | |||||||||
|
|
|
|
|
|
|
|||||||
| Total income tax expenses |
$ | 1,523 | $ | 3,970 | $ | 12,847 | ||||||
|
|
|
|
|
|
|
|||||||
| Effective tax rate |
— | — | 10.5 | % | ||||||||
|
|
|
|
|
|
|
|||||||
The Company’s annual effective tax rate was 10.5% for the year ended December 31, 2012.
The differences between the annual effective tax rates and the U.S. federal statutory rate of 35.0% primarily result from the non-income based withholding tax levied on intercompany interest income in the Company’s Dutch subsidiary, application of lower tax rates associated with certain earnings from the Company’s operations outside the U.S., the parent Company’s interest income, which is non-taxable for US tax purposes and the change of valuation allowance of deferred tax assets.
The statutory income tax rate of the Company’s Korean subsidiary, MagnaChip Semiconductor, Ltd., applicable to the Company was approximately 24.2% in 2014, 2013 and 2012.
91
Table of Contents
Index to Financial Statements
MAGNACHIP SEMICONDUCTOR CORPORATION AND SUBSIDIARIES
NOTES TO CONSOLIDATED FINANCIAL STATEMENTS—(CONTINUED)
(TABULAR DOLLARS IN THOUSANDS, EXCEPT SHARE DATA)
The provision for domestic and foreign income taxes incurred is different from the amount calculated by applying the statutory tax rate to the net income before income taxes. The significant items causing this difference are as follows:
| Year Ended December 31, | ||||||||||||
| 2014 | 2013 | 2012 | ||||||||||
| Provision computed at statutory rate |
$ | (40,498 | ) | $ | (21,082 | ) | $ | 43,010 | ||||
| Change in statutory tax rate |
— | — | — | |||||||||
| Difference in foreign tax rates |
10,130 | 5,375 | (12,544 | ) | ||||||||
| Permanent differences |
||||||||||||
| Derivative assets adjustment |
(1,526 | ) | 1,469 | 3,364 | ||||||||
| TPECs, hybrid and other interest |
(6,813 | ) | (3,151 | ) | (5,920 | ) | ||||||
| Permanent impairment |
— | — | (935 | ) | ||||||||
| Thin capitalization |
— | — | 97 | |||||||||
| Deemed dividend |
— | — | 7,609 | |||||||||
| Permanent foreign currency gain (loss) |
(901 | ) | 3,351 | (465 | ) | |||||||
| Customs penalty |
— | — | 742 | |||||||||
| Non-deductible settlement |
6,318 | — | — | |||||||||
| Other permanent differences |
(1,097 | ) | (881 | ) | 1,556 | |||||||
| Withholding tax |
3,506 | 3,918 | 4,242 | |||||||||
| Foreign exchange rate adjustment |
4,687 | (7,455 | ) | (4,127 | ) | |||||||
| Change in valuation allowance |
29,484 | 24,062 | (21,184 | ) | ||||||||
| Tax credit |
(1,811 | ) | (1,818 | ) | (2,796 | ) | ||||||
| Uncertain tax positions liability |
(56 | ) | (80 | ) | 189 | |||||||
| Others |
100 | 262 | 9 | |||||||||
|
|
|
|
|
|
|
|||||||
| Income tax expenses |
$ | 1,523 | $ | 3,970 | $ | 12,847 | ||||||
|
|
|
|
|
|
|
|||||||
A summary of the composition of net deferred income tax assets (liabilities) as of December 31, 2014, 2013 and 2012 are as follows:
| December 31, | ||||||||||||
| 2014 | 2013 | 2012 | ||||||||||
| Deferred tax assets |
||||||||||||
| Accounts Receivables |
$ | 1,076 | $ | 28,628 | $ | 8,799 | ||||||
| Inventories |
11,015 | 5,866 | 3,501 | |||||||||
| Accrued expenses |
9,030 | 8,758 | 2,812 | |||||||||
| Product warranties |
719 | 292 | 306 | |||||||||
| Other reserves |
457 | 684 | 1,072 | |||||||||
| Royalty income |
147 | 1,364 | 3,118 | |||||||||
| Property, plant and equipment |
15,914 | 13,667 | 12,945 | |||||||||
| Intangible assets |
780 | 922 | — | |||||||||
| Accumulated severance benefits |
30,413 | 27,769 | 23,465 | |||||||||
| Foreign currency translation loss |
17,496 | 12,220 | 13,533 | |||||||||
| NOL carry-forwards |
80,979 | 53,714 | 72,533 | |||||||||
| Tax credit |
25,161 | 26,041 | 26,786 | |||||||||
| Other long-term payable |
1,034 | 608 | 168 | |||||||||
| Others |
1,990 | 2,887 | 1,438 | |||||||||
|
|
|
|
|
|
|
|||||||
| Total deferred tax assets |
196,211 | 183,420 | 170,476 | |||||||||
| Less: valuation allowance |
(194,739 | ) | (178,729 | ) | (162,968 | ) | ||||||
|
|
|
|
|
|
|
|||||||
| 1,472 | 4,691 | 7,508 | ||||||||||
|
|
|
|
|
|
|
|||||||
| Deferred tax liabilities |
||||||||||||
| Derivative assets |
— | 1,189 | 124 | |||||||||
| Intangible assets |
— | — | 1,712 | |||||||||
| Foreign currency translation gain |
748 | 19 | 1,003 | |||||||||
| Others |
147 | 1,239 | 295 | |||||||||
|
|
|
|
|
|
|
|||||||
| Total deferred tax liabilities |
895 | 2,447 | 3,134 | |||||||||
|
|
|
|
|
|
|
|||||||
| Net deferred tax assets |
$ | 577 | $ | 2,244 | $ | 4,374 | ||||||
|
|
|
|
|
|
|
|||||||
| Reported as |
||||||||||||
| Current deferred income tax assets |
$ | 237 | $ | 1,348 | $ | 1,788 | ||||||
| Non-current deferred income tax assets |
$ | 415 | $ | 896 | $ | 2,586 | ||||||
| Current deferred income tax liabilities |
$ | (72 | ) | $ | — | $ | — | |||||
| Non-current deferred income tax liabilities |
$ | (3 | ) | $ | — | $ | — | |||||
92
Table of Contents
Index to Financial Statements
MAGNACHIP SEMICONDUCTOR CORPORATION AND SUBSIDIARIES
NOTES TO CONSOLIDATED FINANCIAL STATEMENTS—(CONTINUED)
(TABULAR DOLLARS IN THOUSANDS, EXCEPT SHARE DATA)
The valuation allowances at December 31, 2014, 2013 and 2012 are primarily attributable to net deferred tax assets at the Company’s Korean subsidiary for which, due to expected losses related to the Company’s Korean subsidiary in future years, the Company has recorded a full valuation allowance against the deferred tax assets, net of its deferred tax liabilities, and against certain foreign subsidiary’s deferred tax assets pertaining to its related tax loss carry-forwards that are not anticipated to generate a tax benefit. Changes in valuation allowance for deferred tax assets for the years ended December 31, 2014, 2013 and 2012 are as follows:
| Year Ended December 31, | ||||||||||||
| 2014 | 2013 | 2012 | ||||||||||
| Beginning balance |
$ | 178,729 | $ | 162,968 | $ | 200,056 | ||||||
| Charged to expense (income) |
29,484 | 24,062 | (21,184 | ) | ||||||||
| NOL and tax credit expiration |
(7,605 | ) | (10,150 | ) | (25,305 | ) | ||||||
| Translation adjustment |
(5,869 | ) | 1,849 | 9,401 | ||||||||
|
|
|
|
|
|
|
|||||||
| Ending balance |
$ | 194,739 | $ | 178,729 | $ | 162,968 | ||||||
|
|
|
|
|
|
|
|||||||
The amount presented as “Charged to expense (income)” primarily relates to the utilization of net operating loss and tax credit carry-forwards, or pre-tax losses for which there is no tax benefit.
The evaluation of the recoverability of the deferred tax asset and the need for a valuation allowance requires the Company to weigh all positive and negative evidence to reach a conclusion that it is more likely than not that all or some portion of the deferred tax asset will not be realized. The weight given to the evidence is commensurate with the extent to which it can be objectively verified. The more negative evidence that exists, the more positive evidence is necessary and the more difficult it is to support a conclusion that a valuation allowance is not needed. Realization of the future tax benefits related to the deferred tax assets is dependent on many factors, including the Company’s ability to generate future taxable income within the period during which the temporary differences reverse, the outlook for the economic environment in which the Company operates and the overall future industry outlook.
As of December 31, 2014, 2013 and 2012, the Company had net deferred tax assets of $577 thousand, $2,244 thousand and $4,374 thousand, respectively, related to the Company’s Japanese subsidiary. As of December 31, 2014, 2013 and 2012, the Company recorded a valuation allowance of $194,739 thousand, $178,729 thousand and $162,968 thousand on its deferred tax assets related to temporary differences, net operating loss carry-forwards and tax credit in domestic and foreign subsidiaries. The Company maintained to record these valuation allowances on deferred tax assets based on its assessment that the negative evidence of expected losses in early future years outweighed the positive evidence of historical income.
As of December 31, 2014, the Company had approximately $315,344 thousand of net operating loss carry-forwards available to offset future taxable income. The majority of net operating loss is associated with the Company’s Korean subsidiary, which expires in part at various dates through 2024, and with the Company’s Luxembourg subsidiary with indefinite expiration. The Company utilized net operating loss of $1,219 thousand, $69,159 thousand and $86,938 thousand, for the years ended December 31, 2014, 2013 and 2012, respectively. The Company also has Korean, Dutch and U.S. tax credit carry-forwards of approximately $9,561 thousand, $15,210 thousand and $390 thousand, respectively, as of December 31, 2014. The Korean tax credits expire at various dates starting from 2015 to 2019, and the Dutch tax credits are carried forward to be used for an indefinite period of time.
93
Table of Contents
Index to Financial Statements
MAGNACHIP SEMICONDUCTOR CORPORATION AND SUBSIDIARIES
NOTES TO CONSOLIDATED FINANCIAL STATEMENTS—(CONTINUED)
(TABULAR DOLLARS IN THOUSANDS, EXCEPT SHARE DATA)
Uncertainty in Income Taxes
The Company and the Company’s subsidiaries file income tax returns in Korea, Japan, Taiwan, the U.S. and in various other jurisdictions. The Company is subject to income tax examinations by tax authorities of these jurisdictions for all open tax years.
As of December 31, 2014, 2013 and 2012, the Company recorded $3,491 thousand, $3,706 thousand and $3,820 thousand of liabilities for unrecognized tax benefits, respectively. For the years ended December 31, 2014, 2013 and 2012, the Company recorded $110 thousand, $106 thousand and $5 thousand of income tax benefits by reversing liabilities due to the lapse of the applicable statute of limitations and incurred $44 thousand, $7 thousand and $55 thousand of income tax expenses for uncertain tax positions mainly resulting from withholding taxes related to intercompany balances.
The Company recognizes interest and penalties accrued related to unrecognized tax benefits as income tax expenses. The Company recognized $10 thousand, $20 thousand, $139 thousand of interest and penalties as income tax expense for the years ended December 31, 2014, 2013 and 2012, respectively. Total interest and penalties accrued as of December 31, 2014, 2013 and 2012 were $480 thousand, $530 thousand and $544 thousand, respectively.
A tabular reconciliation of the total amounts of unrecognized tax benefits at the beginning and end of each period is as follows:
| Year Ended December 31, | ||||||||||||
| 2014 | 2013 | 2012 | ||||||||||
| Unrecognized tax benefits, balance at the beginning |
$ | 11,865 | $ | 11,196 | $ | 10,297 | ||||||
| Additions based on tax positions related to the current year |
4,472 | 1,690 | 1,342 | |||||||||
| Additions for tax positions of prior years |
47 | — | 41 | |||||||||
| Lapse of statute of limitations |
(1,040 | ) | (1,067 | ) | (942 | ) | ||||||
| Translation adjustment |
(375 | ) | 46 | 458 | ||||||||
|
|
|
|
|
|
|
|||||||
| Unrecognized tax benefits, balance at the ending |
$ | 14,969 | $ | 11,865 | $ | 11,196 | ||||||
|
|
|
|
|
|
|
|||||||
94
Table of Contents
Index to Financial Statements
MAGNACHIP SEMICONDUCTOR CORPORATION AND SUBSIDIARIES
NOTES TO CONSOLIDATED FINANCIAL STATEMENTS—(CONTINUED)
(TABULAR DOLLARS IN THOUSANDS, EXCEPT SHARE DATA)
17. Geographic and Segment Information
The Company has one operating segment, consisting of three business lines: Display Solutions, Power Solutions and Semiconductor Manufacturing Services. The Company’s chief operating decision maker is considered to be its Chief Executive Officer. The chief operating decision maker allocates resources and assesses performance of the business and other activities at the operating segment level.
The following is a summary of net sales by business line:
| Year Ended December 31, | ||||||||||||
| 2014 | 2013 | 2012 | ||||||||||
| Net Sales |
||||||||||||
| Display Solutions |
$ | 199,861 | $ | 202,951 | $ | 285,939 | ||||||
| Semiconductor Manufacturing Services |
360,549 | 395,365 | 395,858 | |||||||||
| Power Solutions |
137,246 | 135,329 | 124,960 | |||||||||
| All other |
562 | 532 | 579 | |||||||||
|
|
|
|
|
|
|
|||||||
| Total net sales |
$ | 698,218 | $ | 734,177 | $ | 807,336 | ||||||
|
|
|
|
|
|
|
|||||||
The following is a summary of net sales by region, based on the location of the customer:
| Year Ended December 31, | ||||||||||||
| 2014 | 2013 | 2012 | ||||||||||
| Korea |
$ | 260,139 | $ | 313,634 | $ | 365,682 | ||||||
| Asia Pacific (other than Korea) |
324,248 | 284,429 | 271,908 | |||||||||
| U.S.A. |
91,308 | 100,790 | 124,481 | |||||||||
| Europe |
21,159 | 32,136 | 39,304 | |||||||||
| Others |
1,364 | 3,188 | 5,961 | |||||||||
|
|
|
|
|
|
|
|||||||
| $ | 698,218 | $ | 734,177 | $ | 807,336 | |||||||
|
|
|
|
|
|
|
|||||||
Net sales from the Company’s top ten largest customers accounted for 61%, 59% and 61% for the years ended December 31, 2014, 2013 and 2012, respectively.
For the year ended December 31, 2014, the Company had two customers that represented 11.4% and 10.7% of its net sales, respectively. For the year ended December 31, 2013, the Company had one customer that represented 11.3% of its net sales. For the year ended December 31, 2012, the Company had another customer that represented 11.5% of its net sales.
96% of the Company’s property, plant and equipment are located in Korea as of December 31, 2014.
95
Table of Contents
Index to Financial Statements
MAGNACHIP SEMICONDUCTOR CORPORATION AND SUBSIDIARIES
NOTES TO CONSOLIDATED FINANCIAL STATEMENTS—(CONTINUED)
(TABULAR DOLLARS IN THOUSANDS, EXCEPT SHARE DATA)
18. Commitments and Contingencies
Operating Agreements with SK Hynix
In connection with the acquisition of the non-memory semiconductor business from SK Hynix on October 4, 2004 (the “Original Acquisition”), the Company entered into several agreements with SK Hynix, including a non-exclusive cross license that provides the Company with access to certain of SK Hynix’s intellectual property for use in the manufacture and sale of non-memory semiconductor products. The Company also agreed to provide certain utilities and infrastructure support services to SK Hynix.
Upon the closing of the Original Acquisition, the Company’s Korean subsidiary and SK Hynix also entered into lease agreements under which the Company’s Korean subsidiary leases space to SK Hynix in several buildings, primarily warehouses and utility facilities, in Cheongju, Korea. These leases are generally for an initial term of 20 years plus an indefinite number of renewal terms of 10 years each. Each of the leases is cancelable upon 90 days’ notice by the lessee. The Company also leases certain land from SK Hynix located in Cheongju, Korea. The term of this lease is indefinite unless otherwise agreed by the parties, and as long as the buildings remain on the lease site and are owned and used by the Company for permitted uses.
Operating Leases
The Company leases land, office space and equipment under various operating lease agreements with various terms. Rental expenses were approximately $9,421 thousand, $8,829 thousand and $8,879 thousand for the years ended December 31, 2014, 2013 and 2012, respectively.
As of December 31, 2014, the minimum aggregate rental payments due under non-cancelable lease contracts are as follows:
| 2015 |
$ | 5,876 | ||
| 2016 |
4,491 | |||
| 2017 |
2,168 | |||
| 2018 |
2,149 | |||
| 2019 |
2,025 | |||
| 2020 and thereafter |
29,913 | |||
|
|
|
|||
| $ | 46,622 | |||
|
|
|
Securities Class Action Complaints
On March 12, 2014, a purported class action was filed against the Company and certain of the Company’s now-former officers. On March 16, 2015, a second amended complaint in this same action was filed against the Company, certain of the Company’s current directors and former and now-former officers, and a stockholder of the Company on behalf of a putative class consisting of all persons other than the defendants who purchased or acquired the Company’s securities between February 1, 2012 and February 12, 2015. The second amended complaint asserts claims for (i) alleged violations of Section 10(b) of the Exchange Act and Rule 10b-5 promulgated thereunder by the Company and certain of the Company’s current directors and former and now-former officers, (ii) alleged violations of Section 20(a) of the Exchange Act by certain of the Company’s current directors and former and now-former officers, and (iii) alleged violations of Sections 20(a) and 20(A) of the Exchange Act by a stockholder. The action, Thomas et al., v. MagnaChip Semiconductor Corp., et al., No. 3:14-cv-1160, is pending in the Northern District of California.
On April 21, 2015, a related purported class action lawsuit was filed against the Company, certain of the Company’s current directors and former and now-former officers, a shareholder of the Company, and certain financial firms that acted as underwriters of the Company’s public stock offerings on behalf of a putative class consisting of all persons other than the defendants who purchased or acquired the Company’s securities between February 1, 2012 and February 12, 2015, including all purchasers of the Company’s common stock pursuant to or traceable to a shelf registration statement and prospectus issued in connection with the Company’s February 6, 2013 public stock offering. The complaint asserts claims for (i) alleged violations of Section 11 of the Securities Act by the Company, certain of the Company’s current directors and former and now-former officers, and certain financial firms that acted as underwriters of the Company’s public stock offerings, (ii) alleged violations of Section 12 of the Securities Act by the Company, certain of the Company’s former and now-former officers, a shareholder of the Company, and certain financial firms that acted as
96
Table of Contents
Index to Financial Statements
MAGNACHIP SEMICONDUCTOR CORPORATION AND SUBSIDIARIES
NOTES TO CONSOLIDATED FINANCIAL STATEMENTS—(CONTINUED)
(TABULAR DOLLARS IN THOUSANDS, EXCEPT SHARE DATA)
underwriters of the Company’s public stock offerings, (iii) alleged violations of Section 15 of the Securities Act by the Company, certain of the Company’s former and now-former officers, and a shareholder of the Company, (iv) alleged violations of Section 10(b) of the Exchange Act and Rule 10b-5 promulgated thereunder by the Company and certain of the Company’s former and now-former officers, (v) alleged violations of Section 20(a) of the Exchange Act by the Company, certain of the Company’s former and now-former officers, and a shareholder of the Company. The action, Okla. Police Pension & Retirement Sys. v. MagnaChip Semiconductor Corp., et al., No. 3:15-cv-01797, is pending in the Northern District of California. A motion to consolidate Okla. Police Pension & Retirement Sys. v. MagnaChip Semiconductor Corp., et al., No. 3:15-cv-01797 and Thomas et al., v. MagnaChip Semiconductor Corp., et al., No. 3:14-cv-1160 is also pending. At this time, the Company is unable to estimate any reasonably possible loss, or range of reasonably possible losses, with respect to the matters described above.
SEC Enforcement Staff Review
In March 2014, the Company voluntarily reported to the Securities and Exchange Commission (“SEC”) that the Audit Committee had determined that the Company incorrectly recognized revenue on certain transactions and as a result would restate its financial statements, and that the Audit Committee had commenced the independent investigation. Over the course of 2014 and in the first quarter of 2015, the Company voluntarily produced documents to the SEC regarding the various accounting issues identified during the independent investigation, and whether the Company’s hiring of an accountant from the Company’s independent registered public accounting firm impacted that accounting firm’s independence. On July 22, 2014, the Staff of the SEC’s Division of Enforcement obtained a Formal Order of Investigation. On March 12, 2015, the SEC issued a subpoena for documents to the Company in connection with its investigation. The Company has and will continue to fully cooperate with the SEC in this investigation. At this time, the Company is unable to estimate any reasonably possible loss, or range of reasonably possible losses, with respect to the matters described above.
19. Related Party Transactions
Stockholders
Funds affiliated with Avenue Capital Management II, L.P. (“Avenue”) owned 12.0% of the Company’s common stock issued and outstanding at December 31, 2014.
Registration Rights Agreement
On November 9, 2009, the Company entered into a registration rights agreement with the holders of MagnaChip Semiconductor LLC’s common units issued in the Company’s reorganization proceedings, including Avenue, where the Company granted them registration rights with respect to the Company’s common stock. In 2012 and 2013, the Company paid fees and expenses of $1.2 million and $0.8 million, respectively, in connection with the registration and sale of shares of the Company’s common stock by Avenue pursuant to such registration rights agreement. Affiliates of Avenue currently have two employees serving as members of the Company’s Board of Directors. Another member of the Board of Directors was also previously employed by affiliates of Avenue until December 31, 2012, and currently serves as a consultant to affiliates of Avenue.
97
Table of Contents
Index to Financial Statements
MAGNACHIP SEMICONDUCTOR CORPORATION AND SUBSIDIARIES
NOTES TO CONSOLIDATED FINANCIAL STATEMENTS—(CONTINUED)
(TABULAR DOLLARS IN THOUSANDS, EXCEPT SHARE DATA)
20. Accumulated Other Comprehensive Loss
Accumulated other comprehensive loss consists of the following at December 31, 2014 and 2013, respectively:
| Year Ended December 31, | ||||||||
| 2014 | 2013 | |||||||
| Foreign currency translation adjustments |
$ | (35,551 | ) | $ | (57,326 | ) | ||
| Derivative adjustments |
485 | 6,587 | ||||||
| Unrealized gain on investments |
— | 681 | ||||||
|
|
|
|
|
|||||
| Total |
$ | (35,066 | ) | $ | (50,058 | ) | ||
|
|
|
|
|
|||||
Changes in accumulated other comprehensive loss for the years ended December 31, 2014, 2013 and 2012 is as follows:
| Year Ended December 31, 2014 |
Foreign currency translation adjustments |
Derivative adjustments |
Unrealized gain on investments |
Total | ||||||||||||
| Beginning balance |
$ | (57,326 | ) | $ | 6,587 | $ | 681 | $ | (50,058 | ) | ||||||
|
|
|
|
|
|
|
|
|
|||||||||
| Other comprehensive income (loss) before reclassifications |
21,775 | (69 | ) | 1,201 | 22,907 | |||||||||||
| Amounts reclassified from accumulated other comprehensive income |
— | (6,033 | ) | (1,882 | ) | (7,915 | ) | |||||||||
|
|
|
|
|
|
|
|
|
|||||||||
| Net current-period other comprehensive income (loss) |
21,775 | (6,102 | ) | (681 | ) | 14,992 | ||||||||||
|
|
|
|
|
|
|
|
|
|||||||||
| Ending balance |
$ | (35,551 | ) | $ | 485 | $ | — | $ | (35,066 | ) | ||||||
|
|
|
|
|
|
|
|
|
|||||||||
| Year Ended December 31, 2013 |
Foreign currency translation adjustments |
Derivative adjustments |
Unrealized gain on investments |
Total | ||||||||||||
| Beginning balance |
$ | (43,599 | ) | $ | 2,074 | $ | 75 | $ | (41,450 | ) | ||||||
|
|
|
|
|
|
|
|
|
|||||||||
| Other comprehensive income (loss) before reclassifications |
(13,727 | ) | 7,497 | 606 | (5,624 | ) | ||||||||||
| Amounts reclassified from accumulated other comprehensive income |
— | (2,984 | ) | — | (2,984 | ) | ||||||||||
|
|
|
|
|
|
|
|
|
|||||||||
| Net current-period other comprehensive income (loss) |
(13,727 | ) | 4,513 | 606 | (8,608 | ) | ||||||||||
|
|
|
|
|
|
|
|
|
|||||||||
| Ending balance |
$ | (57,326 | ) | $ | 6,587 | $ | 681 | $ | (50,058 | ) | ||||||
|
|
|
|
|
|
|
|
|
|||||||||
| Year Ended December 31, 2012 |
Foreign currency translation adjustments |
Derivative adjustments |
Unrealized gain on investments |
Total | ||||||||||||
| Beginning balance |
$ | (5,862 | ) | $ | (7,771 | ) | $ | 90 | $ | (13,543 | ) | |||||
|
|
|
|
|
|
|
|
|
|||||||||
| Other comprehensive income (loss) before reclassifications |
(37,737 | ) | 5,237 | (15 | ) | (32,515 | ) | |||||||||
| Amounts reclassified from accumulated other comprehensive loss |
— | 4,608 | — | 4,608 | ||||||||||||
|
|
|
|
|
|
|
|
|
|||||||||
| Net current-period other comprehensive income (loss) |
(37,737 | ) | 9,845 | (15 | ) | (27,907 | ) | |||||||||
|
|
|
|
|
|
|
|
|
|||||||||
| Ending balance |
$ | (43,599 | ) | $ | 2,074 | $ | 75 | $ | (41,450 | ) | ||||||
|
|
|
|
|
|
|
|
|
|||||||||
98
Table of Contents
Index to Financial Statements
MAGNACHIP SEMICONDUCTOR CORPORATION AND SUBSIDIARIES
NOTES TO CONSOLIDATED FINANCIAL STATEMENTS—(CONTINUED)
(TABULAR DOLLARS IN THOUSANDS, EXCEPT SHARE DATA)
21. Earnings (loss) per Share
The following table illustrates the computation of basic and diluted earnings (loss) per common share:
| Year Ended December 31, | ||||||||||||
| 2014 | 2013 | 2012 | ||||||||||
| Net income (loss) |
$ | (117,232 | ) | $ | (64,203 | ) | $ | 110,038 | ||||
| Weighted average common stock outstanding |
||||||||||||
| Basic |
34,055,513 | 35,232,194 | 36,567,684 | |||||||||
| Diluted |
34,055,513 | 35,232,194 | 37,533,391 | |||||||||
| Earnings (loss) per share |
||||||||||||
| Basic |
$ | (3.44 | ) | $ | (1.82 | ) | $ | 3.01 | ||||
| Diluted |
$ | (3.44 | ) | $ | (1.82 | ) | $ | 2.93 | ||||
|
|
|
|
|
|
|
|||||||
The following outstanding instruments were excluded from the computation of diluted earnings (loss) per share, as they would have an anti-dilutive effect on the calculation:
| Year Ended December 31, | ||||||||||||
| 2014 | 2013 | 2012 | ||||||||||
| Options |
3,215,945 | 2,944,645 | 255,023 | |||||||||
| Warrants |
— | 1,426,330 | 1,874,977 | |||||||||
99
Table of Contents
Index to Financial Statements
MAGNACHIP SEMICONDUCTOR CORPORATION AND SUBSIDIARIES
NOTES TO CONSOLIDATED FINANCIAL STATEMENTS—(CONTINUED)
(TABULAR DOLLARS IN THOUSANDS, EXCEPT SHARE DATA)
22. Unaudited Quarterly Financial Results
The following tables present selected unaudited Consolidated Statements of Operations for each quarter of the years ended December 31, 2014 and 2013.
| Fiscal Year 2014 | ||||||||||||||||
| First Quarter |
Second Quarter |
Third Quarter |
Fourth Quarter |
|||||||||||||
| Net sales |
$ | 164,164 | $ | 172,070 | $ | 194,332 | $ | 167,652 | ||||||||
| Gross profit |
40,277 | 35,457 | 42,630 | 34,498 | ||||||||||||
| Operating loss |
(7,887 | ) | (19,348 | ) | (19,482 | ) | (30,409 | ) | ||||||||
| Net income (loss) |
$ | (21,605 | ) | $ | 15,010 | $ | (46,807 | ) | $ | (63,830 | ) | |||||
| Earnings (loss) per share: |
||||||||||||||||
| Basic |
$ | (0.63 | ) | $ | 0.44 | $ | (1.37 | ) | $ | (1.87 | ) | |||||
| Diluted |
$ | (0.63 | ) | $ | 0.43 | $ | (1.37 | ) | $ | (1.87 | ) | |||||
| Weighted average common stock outstanding: |
||||||||||||||||
| Basic |
34,052,875 | 34,056,359 | 34,056,359 | 34,056,413 | ||||||||||||
| Diluted |
34,052,875 | 35,177,915 | 34,056,359 | 34,056,413 | ||||||||||||
| Fiscal Year 2013 | ||||||||||||||||
| First Quarter |
Second Quarter |
Third Quarter |
Fourth Quarter |
|||||||||||||
| Net sales |
$ | 194,322 | $ | 193,533 | $ | 170,812 | $ | 175,510 | ||||||||
| Gross profit |
58,235 | 45,241 | 34,413 | 17,179 | ||||||||||||
| Operating income (loss) |
13,966 | 2,665 | (10,220 | ) | (33,179 | ) | ||||||||||
| Net income (loss) |
$ | (17,589 | ) | $ | (24,668 | ) | $ | 251 | $ | (22,197 | ) | |||||
| Earnings (loss) per share: |
||||||||||||||||
| Basic |
$ | (0.49 | ) | $ | (0.70 | ) | $ | 0.01 | $ | (0.64 | ) | |||||
| Diluted |
$ | (0.49 | ) | $ | (0.70 | ) | $ | 0.01 | $ | (0.64 | ) | |||||
| Weighted average common stock outstanding: |
||||||||||||||||
| Basic |
35,539,413 | 35,474,001 | 35,443,820 | 34,480,849 | ||||||||||||
| Diluted |
35,539,413 | 35,474,001 | 37,484,601 | 34,480,849 | ||||||||||||
100
Table of Contents
Index to Financial Statements
MAGNACHIP SEMICONDUCTOR CORPORATION AND SUBSIDIARIES
NOTES TO CONSOLIDATED FINANCIAL STATEMENTS—(CONTINUED)
(TABULAR DOLLARS IN THOUSANDS, EXCEPT SHARE DATA)
23. Subsequent Events
Restatement
On February 12, 2015, the Company filed with the SEC its 2013 Form 10-K containing audited financial statements of the Company for the year ended December 31, 2013 and audited restated financial statements for the years ended December 31, 2012 and 2011, and simultaneously filed its Form 10-Q for each of the quarters ended March 31, 2014, June 30, 2014 and September, 30, 2014, which included the corresponding comparative restated financial statements for the quarters ended March 31, 2013, June 30, 2013 and September 30, 2013, respectively.
Late Filings
On March 17, 2015, the Company filed a Notification of Late Filing on Form 12b-25 with the SEC disclosing that the Company would be unable to timely file its Annual Report on Form 10-K for the year ended December 31, 2014 (the “2014 10-K”) with the SEC. On May 12, 2015, the Company filed a Notification of Late Filing on Form 12b-25 with the SEC disclosing that the Company would be unable to timely file its Quarterly Report on Form 10-Q for the quarter ended March 31, 2015 with the SEC.
NYSE Action
On April 6, 2015, the Company filed a Current Report on Form 8-K with the SEC announcing that on April 1, 2015 the Company received from NYSE Regulation, Inc. (the “NYSE”) a notice of failure to satisfy a continued listing rule or standard and related monitoring. The notice informed the Company that, as a result of the failure to timely file the 2014 10-K, the Company is subject to the procedures specified in Section 802.01E (SEC Annual and Quarterly Report Timely Filing Criteria) of the NYSE Listed Company Manual (“Section 802.01E”). Under the Section 802.01E procedures, the NYSE will monitor the status of the filing of the 2014 Form 10-K and any subsequent reports and related public disclosures for up to a six-month period from its due date. If the Company does not file the 2014 Form 10-K and any subsequent late report within six months from the filing due date, the NYSE may, in its sole discretion, allow the Company’s common stock to trade for up to an additional six months pending the filing of the 2014 Form 10-K and any subsequent late report prior to commencing suspension or delisting procedures, depending on the Company’s specific circumstances. On May 28, 2015, the Company filed the 2014 Form 10-K. The Company still must file its Quarterly Report on Form 10-Q for the quarter ended March 31, 2015 in order to satisfy the NYSE continued listing requirements.
2021 Notes indenture reporting covenant default
As disclosed in the Company’s Form 8-K filed on May 4, 2015, the Company received a notice of default on May 1, 2015 (the “10-K Notice of Default”) from the Trustee under the Indenture. The 10-K Notice of Default related to the failure by the Company, pursuant to Section 4.03 of the Indenture, to file with the SEC its Annual Report on Form 10-K for the fiscal year ended December 31, 2014. The Company believes it has cured the default referenced in the 10-K Notice of Default within the applicable 60-day grace period under the Indenture by the filing of this Report with the SEC.
Rights Agreement
On March 5, 2015 the Board of Directors of the Company, authorized and declared a dividend of one preferred stock purchase right (a “Right” and collectively, the “Rights”) for each share of the Company’s common stock, par value $0.01 per share, outstanding at the close of business on March 16, 2015. Each Right, once exercisable, will entitle the registered holder to purchase from the Company one one-thousandth of a share of Series A Junior Participating Preferred Stock, par value $0.01 per share, at a purchase price of $24, subject to adjustment.
101
Table of Contents
Index to Financial Statements
MAGNACHIP SEMICONDUCTOR CORPORATION AND SUBSIDIARIES
NOTES TO CONSOLIDATED FINANCIAL STATEMENTS—(CONTINUED)
(TABULAR DOLLARS IN THOUSANDS, EXCEPT SHARE DATA)
The Board of Directors implemented the plan to ensure that all stockholders realize the long-term value of their investment. The rights plan is designed to reduce the likelihood that any person or group would gain control of the Company through open market accumulation without appropriately compensating the Company’s stockholders for such control or allowing the Board of Directors and the stockholders sufficient time to make informed judgments. The Rights will not prevent a takeover, but will incentivize anyone seeking to acquire the Company to negotiate with the Board of Directors before making a takeover attempt.
Shareholder Derivative Complaints
A shareholder derivative action, styled Hemmingson et al. v. Elkins et al., Case No. 1-15-cv-278614, was filed in the Superior Court of the State of California in and for Santa Clara County on March 25, 2015, naming as defendants certain of the Company’s current directors and former and now-former officers, as well as a shareholder of the Company, and naming the Company as a nominal defendant. The complaint in this action asserts claims for (i) alleged breaches of fiduciary duty by certain of the Company’s current directors and former and now-former officers for purportedly knowingly failing to maintain adequate internal controls over its accounting and reporting functions and disseminating to shareholders certain alleged materially false and misleading statements, (ii) alleged breaches of fiduciary duty by certain of the Company’s current directors and a current shareholder of the Company for purported insider trading, and (iii) alleged unjust enrichment by a shareholder of the Company for purported insider trading. On May 13, 2015, the court so ordered a stipulation entered into by certain of the parties, agreeing to stay the litigation until Thomas et al., v. MagnaChip Semiconductor Corp., et al., No. 3:14-cv-1160 and Okla. Police Pension & Retirement Sys. v. MagnaChip Semiconductor Corp., et al., No. 3:15-cv-01797 are resolved, unless the stay is lifted earlier.
On May 13, 2015, a purported shareholder provided notice to the Company and the Board of Directors of a shareholder derivative action styled as Bushansky v. Norby, et al. that the purported shareholder proposes to file in the Superior Court of the State of California, Santa Clara County. The proposed action names as defendants certain of the Company’s current directors and former officers, and a shareholder of the Company, with the Company being named as a nominal defendant. The complaint asserts claims for (i) alleged breaches of fiduciary duties by certain of the Company’s current directors and former officers for knowingly failing to maintain adequate internal controls over the Company’s accounting and reporting functions and disseminating to shareholders certain alleged materially false and misleading statements; and (ii) alleged aiding and abetting of such breaches of fiduciary duties by all defendants. At this time, the Company is unable to estimate any reasonably possible loss, or range of reasonably possible losses, with respect to the matters described above.
Derivative contract
In May 2015, the Company and the counterparty, the Nomura Financial Investment (Korea) Co., Ltd., entered into derivative contracts of zero cost collars for the third and fourth quarters of the year ending December 31, 2015. The total notional amounts are $84 million. These derivative contracts were executed under the International Swaps and Derivatives Association (“ISDA”) agreement amended in the second quarter of the year 2015 with respect to deletion of the ratings decline provision. In connection with the contracts, the Company paid $5.0 million cash deposits to the counterparty in May 2015.
Reorganization
On May 28, 2015, organizational changes that will become effective immediately were simultaneously announced in connection with this filing of the 2014 Form 10-K. In conjunction with the Company’s plans to (i) realign its businesses and organizational structure and (ii) streamline and consolidate certain business processes to achieve greater operating efficiencies, the Company will manage its business and report its financial results in two operating segments: Semiconductor Manufacturing Services and Standard Products Group. These segments will be established based on how the Company’s business units will be managed prospectively and will have no effect on the Company’s historical consolidated results of operations.
102
Table of Contents
Index to Financial Statements
Item 9. Changes in and Disagreements with Accountants on Accounting and Financial Disclosure
None.
Item 9A. Controls and Procedures
(a) Background
In January 2014, the Audit Committee (the “Audit Committee”) of the Company’s Board of Directors (the “Board”) commenced an internal investigation, with the assistance of independent legal counsel engaged by the Audit Committee and outside forensic accountants, into the Company’s accounting practices and procedures, initially reviewing certain revenue recognition practices and procedures that were raised during the 2013 year-end audit process.
As previously reported in the Company’s Current Report on Form 8-K filed on March 11, 2014, the Audit Committee in consultation with management and the Board, concluded that the Company’s previously issued financial statements for the fiscal years ended December 31, 2011 and 2012 and the first three quarters of fiscal years 2013 should no longer be relied upon. Accordingly, the Company restated its previously issued financial statements covering those periods. Restated financial information was presented in the Annual Report on Form 10-K for the fiscal year ended December 31, 2013, filed with the SEC on February 12, 2015, which contains descriptions of the accounting errors identified and the adjustments made as a result of the restatement.
(b) Evaluation of Disclosure Controls and Procedures
We maintain disclosure controls and procedures that are designed to ensure that information required to be disclosed in our periodic reports filed under the Securities Exchange Act of 1934, as amended (“Exchange Act”), is recorded, processed, summarized and reported within the time periods specified in the SEC’s rules and forms, and that such information is accumulated and communicated to our management, with the participation of our Chief Executive Officer (“Principal Executive Officer”) and Chief Financial Officer (“Principal Financial Officer”), as appropriate, to allow for timely decisions regarding required disclosure.
Management of the Company, with the participation of our Principal Executive Officer and our Principal Financial Officer, conducted an evaluation of the effectiveness of the design and operation of our disclosure controls and procedures, as such term is defined under Rule 13a-15(e) promulgated under the Exchange Act, as of December 31, 2014. Based on this evaluation, our Principal Executive Officer and our Principal Financial Officer have concluded that our disclosure controls and procedures were not effective as of December 31, 2014, because of the material weaknesses in internal control over financial reporting described below.
(c) Management’s Annual Report on Internal Control Over Financial Reporting
Our management is responsible for establishing and maintaining adequate internal control over financial reporting, as such term is defined in Rule 13a-15(f) under the Exchange Act. Our internal control over financial reporting is a process designed under the supervision of our Principal Executive Officer and our Principal Financial Officer, and effected by our Board, management and other personnel, to provide reasonable assurance regarding the reliability of financial reporting and the preparation of financial statements for external purposes in accordance with generally accepted accounting principles.
Because of its inherent limitations, internal control over financial reporting may not prevent or detect misstatements. Also, projections of any evaluation of effectiveness to future periods are subject to the risk that controls may become inadequate because of changes in conditions, or that the degree of compliance with policies or procedures may deteriorate.
We conducted an evaluation of the effectiveness of the Company’s internal control over financial reporting as of December 31, 2014, based on the criteria set forth in Internal Control—Integrated Framework (2013) issued by the Committee of Sponsoring Organizations of the Treadway Commission (“COSO”). Based on our assessment, we identified material weaknesses in our internal control over financial reporting. Because of the material weaknesses described below, we concluded that we did not maintain effective internal control over financial reporting as of December 31, 2014.
Rule 12b-2 under the Exchange Act of 1934, and Rule 1-02 of Regulation S-X defines a “material weakness” as a deficiency, or a combination of deficiencies, in internal control over financial reporting, such that there is a reasonable possibility that a material misstatement of the registrant’s annual or interim financial statements will not be prevented or detected on a timely basis. Based on this definition, we have concluded that the material weaknesses noted below existed in the Company’s internal control over financial reporting as of December 31, 2014.
103
Table of Contents
Index to Financial Statements
Control Environment:
We did not maintain an effective control environment based on the criteria established in the COSO Framework. Specifically, we did not maintain a control environment that effectively emphasized (i) an attitude of integrity and ethics against the pressure to achieve sales, gross margin and adjusted EBITDA targets, (ii) adherence to U.S. GAAP, (iii) utilization of the whistleblower program, and (iv) prevention or detection of undisclosed business practices involving the circumvention of internal controls, resulting in the inaccurate accounting for certain transactions with respect to sales, cost of sales, inventory, fixed assets, provisions and income taxes, among others. In addition, we did not maintain an appropriate level of accounting knowledge, experience and training commensurate with our financial reporting requirements under U.S. GAAP.
Monitoring Activities:
We did not effectively evaluate and communicate internal control deficiencies in a timely manner to those parties responsible for taking corrective actions. Specifically, we did not maintain an effective internal audit function whereby the internal control team exercised full authority to independently report to the Audit Committee in order to provide adequate monitoring of control activities related to financial reporting throughout the organization. As a result, (i) the Company’s monitoring activities, including internal audit function that should have prevented or detected errors or failure to abide by internal controls were not effective; and (ii) incomplete information was provided to the Company’s Audit Committee, which limited the Audit Committee’s ability to effectively oversee the accounting and financial reporting processes and internal control over financial reporting of the Company.
Period End Closing and Financial Reporting:
We did not design effective controls over the completeness and accuracy of our period end adjusting entries. Specifically, controls over the analysis, documentation, review and approval of the accounting and reporting of entries were not designed effectively to ensure the accuracy and completeness of the entries recorded.
Income Tax Accounting and Disclosures:
We did not design effective controls over the completeness and accuracy of our income tax accounting and disclosures. Specifically, we did not design effective controls over the review of tax rules and regulations and the analysis and review of accounting implications with respect to current and deferred income taxes, uncertain tax positions and related disclosures.
These material weaknesses resulted in the restatement of the Company’s consolidated financial statements and related financial disclosures for the year ended December 31, 2012 and each of the first three quarters of 2012 and 2013. These material weaknesses also resulted in adjustments to our accounting records for the years ended December, 31, 2013 and 2014. In addition, these material weaknesses could result in further misstatements of the financial statements or disclosures that would result in a material misstatement of the annual or interim consolidated financial statements that would not be prevented or detected.
The effectiveness of the Company’s internal control over financial reporting as of December 31, 2014 has been audited by Samil PricewaterhouseCoopers, an independent registered public accounting firm, as stated in their report which appears in Item 8 of this Annual Report on Form 10-K.
(d) Remediation Status
As previously disclosed in the Company’s Annual Report on Form 10-K for the fiscal year ended December 31, 2013 that was filed in February 12, 2015, we identified material weaknesses in our internal control over financial reporting and concluded that the material weaknesses existed in the Company’s internal control over financial reporting as of December 31, 2013. During 2014 and through the date of the filing of this report, we have commenced a number of steps to improve our internal controls over financial reporting, and are implementing those steps as described below.
Control Environment:
| • | During the second quarter of 2015, the Company appointed YJ Kim as Chief Executive Officer and a member of the Company’s Board of Directors, and Jonathan Kim as Chief Financial Officer. Both held the same posts on an interim basis since the second quarter of 2014. |
| • | Commencing in the second quarter of 2014, the Principal Executive Officer and Principal Financial Officer/Chief Accounting Officer (“new management team”) took steps to communicate their expectation of the enhanced compliance with high ethical standards by providing ethical guidelines and other forms of internal communications to all employees. |
| • | During the fourth quarter of 2014, the new management team provided mandatory ethics compliance trainings for all employees, which included a pledge to comply with the code of conduct. Through such employee training sessions, the new management team specifically emphasized the importance of our whistleblower hotline, through which employees at all levels can anonymously submit information or express concerns regarding accounting, financial reporting, and violations of our code of ethics or other topics. |
104
Table of Contents
Index to Financial Statements
| • | During 2014, the new management team (i) strengthened accounting and finance teams by hiring full-time employees with extensive U.S. GAAP experience; (ii) established a detailed revenue recognition policy including logical criteria to decide whether necessary conditions for revenue recognition were fully met in accordance with U.S. GAAP; and (iii) facilitated U.S. GAAP training programs for relevant employees. |
| • | During the fourth quarter of 2014 and through the date of the filing of this report, the new management team has been implementing a sub-certification process, which requires that certain employees certify on a quarterly basis that they have no knowledge of (i) any transaction of which terms deviate from the terms of written sales or purchasing contracts, (ii) any undisclosed or unauthorized transaction that should be communicated to the authorized personnel in the accounting team, and (iii) any irregular activities that were not conducted in the ordinary course of business, including inappropriate decision-making and non-compliance with applicable regulations, policies and procedures. |
| • | The new management team plans to hire a senior level employee with expertise in the area of tax accounting and reporting, whose duties will be to (i) prepare and analyze income tax accounts with assistance from external tax advisors; and (ii) train accounting employees with regard to tax accounting, disclosure practices and rules and regulations. |
Monitoring Activities:
| • | The new management team has been building an environment that prioritizes compliance across the enterprise, placing special efforts on improving internal audits and compliance with the Sarbanes-Oxley Act. In December 2014, the new management hired a new Director of Compliance and Internal Audit, whose primary duties are to design, implement, and operate our internal control over financial reporting. |
| • | During the fourth quarter of 2014 and through the date of the filing of this report, the Compliance and Internal Audit Team (i) has conducted a risk assessment that considers specific risk scenarios in which misstatement of financial reporting might occur, and (ii) has executed monitoring of a sample of transactions for high risk areas. Specifically, the Compliance and Internal Audit Team has implemented an order deviation monitoring process whereby deviations from established customer sales terms were reviewed in order to ensure that such deviations are accurately reflected in our financial statements. |
| • | In May 2015, the Company named its General Counsel, Theodore Kim, as Executive Vice President and Chief Compliance Officer, a newly created position, reporting directly to the Board of Directors. He continues to serve as General Counsel. In addition, the Compliance and Internal Audit Team was reorganized under the Chief Compliance Officer, to whom the Director of Compliance and Internal Audit reports, as a part of the Company’s continuing effort to reinforce the independence and objectivity of our internal audit activities from the management. |
| • | We plan to continue to provide the Audit Committee with the information concerning internal audit activities, internal control deficiencies and remediation plans, investigation results of any whistle blowers’ complaints, and any irregular activities that are non-compliant with applicable regulations, policies and procedures. |
Period End Closing and Financial Reporting:
We are redesigning our internal controls in the period-end closing and financial reporting process to (i) require appropriate internal and external evidences to be prepared for certain type of journal entries; (ii) improve the methods of reconciliation, confirmation, verification, observation, period end cut-off test, and analysis of each accounts in a timely manner; and (iii) assign appropriate roles and responsibilities for more comprehensive review procedures, including the involvement of finance and operational managers, in order to strengthen controls over the completeness and accuracy of both recurring and non-recurring journal entries.
Income Tax Accounting and Disclosures:
We have been improving our procedures and controls over tax accounting and reporting by ensuring that we, on a timely basis, (i) review rules and regulations of tax jurisdictions relevant to each of our consolidated entities; (ii) review related accounting implications; and (iii) improve the competency of our accounting employees through ongoing training on income tax accounting, disclosure practices, and rules and regulations.
As we continue to work to improve our internal control over financial reporting, management may determine to take additional measures to address the material weaknesses or determine to modify the remediation plan described above. Until the remediation efforts set forth above are fully completed and sufficiently operated, the material weaknesses described above will continue to exist.
(e) Changes in Internal Control Over Financial Reporting
There were no changes in internal control over financial reporting during our fourth quarter ended December 31, 2014 that have materially affected, or are reasonably likely to materially affect, our internal control over financial reporting.
None.
105
Table of Contents
Index to Financial Statements
PART III
Item 10. Directors, Executive Officers and Corporate Governance
The following table sets forth certain information regarding our current directors and executive officers:
| Name |
Age |
Position | ||
| R. Douglas Norby |
79 | Non-Executive Chairman of the Board of Directors, Chairman of the Audit Committee, and Member of the Nominating and Corporate Governance Committee and Risk Committee | ||
| Michael Elkins |
47 | Lead Director, Chairman of the Compensation Committee, and Member of the Audit Committee and Nominating and Corporate Governance Committee | ||
| Randal Klein |
50 | Director, Chairman of the Finance Committee, and Member of the Risk Committee | ||
| Ilbok Lee |
69 | Director, Chairman of the Nominating and Corporate Governance Committee, and Member of the Compensation Committee and Risk Committee | ||
| Brian Mulhern |
40 | Director and Member of the Finance Committee | ||
| Nader Tavakoli |
57 | Director, Chairman of the Risk Committee, and Member of the Audit Committee and Compensation Committee | ||
| Young-Joon (YJ) Kim |
50 | Director, Chief Executive Officer and General Manager, Display Solutions Division | ||
| Tae Jong Lee |
52 | Executive Vice President and General Manager, Corporate Engineering | ||
| Jonathan Kim |
41 | Chief Financial Officer, Executive Vice President and Chief Accounting Officer | ||
| Theodore Kim |
46 | Chief Compliance Officer, Executive Vice President, General Counsel and Secretary |
R. Douglas Norby, Non-Executive Chairman of the Board of Directors, Chairman of the Audit Committee, and Member of the Nominating and Corporate Governance Committee and Risk Committee. Mr. Norby became our Non-Executive Chairman of the Board of Directors in May 2014 and our director and Chairman of the Audit Committee in March 2010. Mr. Norby retired from full time employment in July 2006. Mr. Norby previously served as our director and Chairman of the Audit Committee from May 2006 until October 2008. Mr. Norby served as Senior Vice President and Chief Financial Officer of Tessera Technologies, Inc., a public semiconductor intellectual property company, from July 2003 to January 2006. Mr. Norby worked as a management consultant with Tessera from May 2003 until July 2003 and from January 2006 to July 2006. Mr. Norby served as Chief Financial Officer of Zambeel, Inc., a data storage systems company, from March 2002 until February 2003, and as Senior Vice President and Chief Financial Officer of Novalux, Inc., an optoelectronics company, from December 2000 to March 2002. Prior to his tenure with Novalux, Inc., Mr. Norby served as Executive Vice President and Chief Financial Officer of LSI Logic Corporation from November 1996 to December 2000. Mr. Norby is a director of Alexion Pharmaceuticals, Inc., STATS ChipPAC Ltd. and Singulex, Inc. (a private company). Mr. Norby was a director of Invensense Inc. from September 2009 until July 2014, Ikanos Communications, Inc. from January 2011 until December 2012 and Intellon Corporation from May 2007 to December 2009. Mr. Norby received a B.A. degree in Economics from Harvard University and an M.B.A. from Harvard Business School. Our Board of Directors has concluded that Mr. Norby should serve on the Board of Directors based upon his extensive experience as a chief financial officer, his extensive experience in accounting and his experience as a public company director and audit committee chair.
Michael Elkins, Lead Director, Chairman of the Compensation Committee, and Member of the Audit Committee and Nominating and Corporate Governance Committee. Mr. Elkins became our director in November 2009. He is currently self-employed as an investor and business consultant which includes an agreement with Avenue. From 2004 to 2012, Mr. Elkins was employed by affiliates of Avenue, most recently as a Portfolio Manager of the Avenue U.S. Funds. In such capacity, Mr. Elkins was responsible for assisting with the direction of the investment activities of the Avenue U.S. strategy. Prior to joining Avenue, Mr. Elkins was a Portfolio Manager and Trader with ABP Investments US, Inc. While at ABP, he was responsible for actively managing high yield investments using a total return and special situations strategy. Prior to ABP, Mr. Elkins served as a Portfolio Manager and Trader for UBK Asset Management, after joining the company as a High Yield Credit Analyst. Previously, Mr. Elkins was a Credit Analyst for both Oppenheimer & Co., Inc. and Smith Barney, Inc. Mr. Elkins has served on the board of directors of QCE Finance LLC, a restaurant franchise company, since January 2013, Trump Entertainment, a casino company since February 2013 and Bowlmor AMF a consumer bowling and leisure company since August 2013. Mr. Elkins previously served on the board of directors of American Media, Inc., a media brands and magazine publishing company, Vertis Communication, an advertising services company, Milacron LLC, a plastics-processing technologies and industrial fluids supplier, and Ion Media Networks, Inc., a broadcast television station. Mr. Elkins serves or has served on the board of directors of each of these companies, all of which are private companies, in connection with a reorganization or refinancing involving affiliates of Avenue and as a result of his past position and current association with Avenue. Mr. Elkins holds a B.A. in Marketing from George Washington University and an M.B.A. in Finance from the Goizueta Business School at Emory University. Our Board of Directors has concluded that Mr. Elkins should serve on the Board of Directors based upon his more than 15 years of investment portfolio management experience, including over 10 years investing in technology companies, including the semiconductor sector.
106
Table of Contents
Index to Financial Statements
Randal Klein, Director, Chairman of the Finance Committee, and Member of the Risk Committee. Mr. Klein became our director in November 2009. Mr. Klein joined Avenue in 2004, and is currently a Portfolio Manager at Avenue responsible for directing the investment activities of the Avenue Trade Claims funds, and also assists with the direction of the investment activities of the Avenue U.S. strategy with a particular focus on restructurings and transactions. Previously, Mr. Klein was a Senior Vice President of the Avenue U.S. Funds. In such capacity, Mr. Klein was responsible for managing restructuring activities and identifying, analyzing and modeling investment opportunities for the Avenue U.S. strategy. Prior to joining Avenue, Mr. Klein was a Senior Vice President at Lehman Brothers, where his responsibilities included restructuring advisory work, financial sponsors coverage, mergers and acquisitions and corporate finance. Prior to Lehman, Mr. Klein worked in sales, marketing and engineering as an aerospace engineer for The Boeing Company. Mr. Klein holds a B.S. in Aerospace Engineering, conferred with Highest Distinction from the University of Virginia, and an M.B.A. in Finance, conferred as a Palmer Scholar, from the Wharton School of the University of Pennsylvania. Our Board of Directors has concluded that Mr. Klein should serve on the Board of Directors based upon his 20 years of experience as a financial advisor and investment manager.
Ilbok Lee, Director, Chairman of the Nominating and Corporate Governance Committee, and Member of the Compensation Committee and Risk Committee. Dr. Lee became our director in August 2011. Dr. Lee is the Chairman and Chief Executive Officer of Silego Technology, Inc., a semiconductor company, or Silego, serving as Chairman since March 2015 and as Chief Executive Officer since Silego’s inception in October 2001. He also served as Silego’s President from October 2001 until March 2015. From April 1999 to September 2001, Dr. Lee served as Senior Vice President and General Manager of the Timing Division at Cypress Semiconductor Corp., a public semiconductor company, and from May 1992 to March 1999 served as President and Chief Executive Officer of IC Works, Inc., a semiconductor company he co-founded that was acquired by Cypress in 2001. Dr. Lee co-founded Samsung Semiconductor, Inc. (U.S.A.) in July 1983 and served in various positions at the company, including President and Chief Executive Officer, until May 1992. Prior to Samsung, Dr. Lee served in various technical and managerial positions at Intel and National Semiconductor. Dr. Lee served as a member of the board of directors for Sierra Monolithic, a privately held semiconductor company, from 2002 through 2009. Dr. Lee received a Ph.D. and M.S.E.E. from the University of Minnesota and a B.S.E.E. from Seoul National University. Our Board of Directors has concluded that Dr. Lee should serve on the Board of Directors based upon his extensive experience in the semiconductor industry.
Brian Mulhern, Director and Member of the Finance Committee. Mr. Mulhern became our director in August 2011. Mr. Mulhern joined Avenue in 2004 and is currently a Senior Vice President at Avenue focused on identifying, analyzing and modeling investment opportunities for the Avenue U.S. strategy, primarily focused in the telecom, media and technology industries. Prior to joining Avenue, Mr. Mulhern was a Senior Vice President at Citadel Investment Group based in Chicago and London, focused on the analysis, negotiation and management of privately structured debt, equity and equity-linked investments. Previously, he was an analyst in Merrill Lynch’s merger & acquisition group and a consultant at Booz, Allen & Hamilton. Mr. Mulhern received a B.A. in Economics from the University of Notre Dame. Our Board of Directors has concluded that Mr. Mulhern should serve on the Board of Directors based upon his experience as a financial advisor and investment manager.
Nader Tavakoli, Director, Chairman of the Risk Committee, and Member of the Audit Committee and Compensation Committee. Mr. Tavakoli became our director in November 2009. Mr. Tavakoli is the interim President and Chief Executive Officer of Ambac Financial Group, Inc., or AFG, a financial services company, since January 1, 2015. Mr. Tavakoli also serves as a director of AFG since May 2013, and was co-chairman of the board of AFG from May 2013 until December 2014. In addition, Mr. Tavakoli serves as the Executive Chairman of AFG’s wholly owned subsidiary, Ambac Assurance Corporation, since January 1, 2015, and served as co-chairman of the board, a member of the audit committee and chairman of the compensation committee of Ambac Assurance Corporation from May 2013 until December 2014. Mr. Tavakoli is also the Chairman and Chief Executive Officer of EagleRock Capital Management, a private investment partnership based in New York City. Prior to founding EagleRock in 2002, Mr. Tavakoli managed substantial investment portfolios with Odyssey Partners and Highbridge Capital Management. During his nearly 25 year investment career, Mr. Tavakoli has made substantial investments across numerous industries, including significant investments in semiconductor, technology and telecommunications companies. Mr. Tavakoli began his professional career as an attorney with the New York City law firm of Milbank, Tweed, Hadley and McCloy, where he represented institutional clients in banking, litigation and corporate restructuring matters. Mr. Tavakoli was a director of NextWave Wireless, Inc., prior to that company’s acquisition by AT&T Inc. in January 2013. Mr. Tavakoli also serves on the board of MF Global Holding Ltd., formerly engaged in securities brokerage, trading and clearance. Mr. Tavakoli is the past chair of the Montclair State University Foundation Board and currently chairs that board’s investment committee. Mr. Tavakoli holds a B.A. in History from Montclair State University, where he was selected Valedictorian, and a Juris Doctor from the Rutgers Law School, where he was an Editor of the Rutgers Law Review. Our Board of Directors has concluded that Mr. Tavakoli should serve on the Board of Directors based upon his extensive investing and corporate governance experience.
Young-Joon (YJ) Kim, Director, Chief Executive Officer and General Manager, Display Solutions Division. Mr. YJ Kim became our director and Chief Executive Officer on May 22, 2015, after serving as Interim Chief Executive Officer since May 20, 2014. Mr. YJ Kim became our General Manager, Display Solutions Division, in May 2013, and previously served as our Executive Vice President
107
Table of Contents
Index to Financial Statements
from May 2013 to May 2015. Prior to joining our Company, Mr. YJ Kim served at Cavium, Inc., a provider of highly integrated semiconductor processors, from June 2006 to April 2013, most recently as Vice President, Infrastructure Processor Division, and General Manager at the Multi-Core Processor Group. Prior to Cavium, Mr. YJ Kim served as Core Team Lead and General Manager of Tolapai Program at Intel Corporation from August 2004 to June 2006. Mr. YJ Kim has also served as Director of Marketing at Samsung Semiconductor, Inc. from June 1996 to May 1998. Mr. YJ Kim holds B.S. and M.Eng degrees in Electrical Engineering from Cornell University. Our Board of Directors has concluded that Mr. YJ Kim should serve as a director based on his understanding of the Company’s products and technology as our Chief Executive Officer and his deep knowledge of the semiconductor industry.
Tae Jong Lee, Executive Vice President and General Manager, Corporate Engineering. Mr. Lee became our Executive Vice President and General Manager, Corporate Engineering, in December 2011, after serving successively as Senior Vice President and Vice President and General Manager, Corporate Engineering, since September 2007. Prior to joining our Company, Mr. Lee served as Director of the Technology Development Division, Chartered Semiconductor Manufacturing, in Singapore from 1999 to August 2007. Mr. Lee holds B.S. and M.S. degrees from Seoul National University, and a Ph.D in Physics from the University of Texas at Dallas.
Jonathan Kim, Chief Financial Officer, Executive Vice President and Chief Accounting Officer. Mr. J. Kim became our Chief Financial Officer and Executive Vice President on May 22, 2015, after serving as Interim Chief Financial Officer since March 25, 2014. Mr. J. Kim became our Chief Accounting Officer on March 9, 2014, and previously served as our Senior Vice President from March 2014 to May 2015. Prior to joining our Company, Mr. J. Kim served since July 2010 as the Chief Financial Officer of Startforce, Inc., a VC backed desktop virtualization company, which was acquired in February 2011 by ZeroDesktop, Inc., a Silicon Valley based global provider of next generation cloud operating system, cloud service brokerage and Android platform extender solutions for telecoms, service providers, OEMs and ISVs, where Mr. J. Kim continued to serve as the Chief Financial Officer. Mr. J. Kim also served since September 2009 as the Chief Financial Officer and Principal of Booga Ventures, a Silicon Valley based private investment and advisory firm. Prior to that time, from January 2000 to September 2009, Mr. J. Kim served as an Audit Senior Manager with Deloitte & Touche in San Jose, California and Deloitte Anjin in Seoul, South Korea. Mr. J. Kim holds a B.A. degree in Business Administration from the University of Washington.
Theodore Kim, Chief Compliance Officer, Executive Vice President, General Counsel and Secretary. Mr. T. Kim became our Chief Compliance Officer and Executive Vice President on May 22, 2015, and became our General Counsel and Secretary in November 2013. Mr. T. Kim previously served as our Senior Vice President from November 2013 to May 2015. Prior to joining our Company, Mr. T. Kim served as Head Lawyer, Global Business Development at Samsung Fire & Marine Insurance from October 2012 to October 2013. Mr. T. Kim was employed by Gibson, Dunn & Crutcher LLP, a law firm, from October 2005 to July 2012, serving most recently as Of Counsel. Prior to that, he served as Foreign Legal Consultant at Kim & Chang, a law firm in Korea, from 2001 to 2005. Mr. Kim holds a B.A. degree in Economics and a B.S. degree in Mechanical Engineering from the University of California, Irvine, and a J.D. degree from the University of California, Los Angeles, School of Law.
Involvement in Certain Legal Proceedings
Tae Jong Lee was an officer during our Chapter 11 reorganization proceedings in 2009.
Section 16(a) Beneficial Ownership Reporting Compliance
Compliance with Section 16(a) of the Exchange Act requires the Company’s executive officers and directors, and persons who own more than 10% of a registered class of its equity securities, to file reports of ownership and changes in ownership with the SEC. Officers, directors, and greater than 10% stockholders are required by SEC rules to furnish the Company with copies of all Section 16(a) forms they file.
108
Table of Contents
Index to Financial Statements
Based solely on a review of the copies of such forms furnished to the Company, the Company believes that during 2014 all Section 16(a) filing requirements applicable to its officers, directors and greater than 10% stockholders were in compliance with Section 16(a).
Code of Business Conduct and Ethics
We have adopted a Code of Business Conduct and Ethics that applies to all of our directors, officers and employees. We will provide a copy of our Code of Business Conduct and Ethics without charge to any person upon written request made to our General Counsel and Secretary at MagnaChip Semiconductor Corporation, c/o MagnaChip Semiconductor, Inc., 20400 Stevens Creek Boulevard, Suite 370, Cupertino, CA 95014. Our Code of Business Conduct and Ethics is also available on our website at www.magnachip.com. We will disclose any waivers or amendments to the provisions of our Code of Business Conduct and Ethics on our website.
Assessment of Risk
Our Board of Directors believes that our compensation programs are designed such that they will not incentivize unnecessary risk-taking. The base salary component of our compensation program is a fixed amount and does not depend on performance. Our cash incentive program takes into account multiple factors, thus diversifying the risk associated with any single performance factor, and we believe it does not incentivize our executive officers to focus exclusively on short-term outcomes. Our equity awards are limited by the terms of our equity plans to a fixed maximum amount specified in the plan, and are subject to vesting to align the long-term interests of our executive officers with those of our equityholders.
Audit Committee
Our Board of Directors has a standing Audit Committee. Our Audit Committee consists of Mr. Norby, as Chairman, Mr. Elkins, and Mr. Tavakoli. Our Board of Directors has determined that Mr. Norby is an audit committee financial expert as defined in Item 407(d)(5) of Regulation S-K promulgated under the Securities Act. Our Board of Directors has also determined that each of Mr. Norby, Mr. Elkins and Mr. Tavakoli is “independent” as that term is defined in both Rule 303A of the NYSE rules and Rule 10A-3 promulgated under the Exchange Act.
The Board of Directors has adopted a written charter for the Audit Committee. The Audit Committee charter is posted and available on our website at www.magnachip.com. The information on or accessible through our website is not a part of or incorporated by reference in this Report.
109
Table of Contents
Index to Financial Statements
Item 11. Executive Compensation
Compensation Discussion and Analysis
Compensation Philosophy and Objectives
The Compensation Committee of our Board of Directors, or the Committee, has overall responsibility for administering our compensation program for our “named executive officers.” The Committee’s responsibilities consist of evaluating, approving and monitoring our executive officer and director compensation plans, policies and programs, as well as each of our equity-based compensation plans and policies. Prior to 2010, compensation decisions were made by the entire Board of Directors and for the discussion that follows, references to the Committee during such period refer to the entire Board of Directors. For 2014, our named executive officers were:
| • | Young-Joon Kim, our Chief Executive Officer and General Manager, Display Solutions Division; |
| • | Jonathan Kim, our Chief Financial Officer, Executive Vice President and Chief Accounting Officer; |
| • | Theodore Kim, our Chief Compliance Officer, Executive Vice President, General Counsel and Secretary; |
| • | Sang Park, our former Chairman of the Board of Directors and Chief Executive Officer; |
| • | Margaret Sakai, our former Executive Vice President and Chief Financial Officer; |
| • | Tae Young Hwang, our former Chief Operating Officer and President; and |
| • | Brent Rowe, our former Executive Vice President, Worldwide Sales. |
The Committee seeks to establish total compensation for executive officers that is fair, reasonable and competitive. The Committee evaluates our compensation packages to ensure that:
| • | we maintain our ability to attract and retain superior executives in critical positions; |
| • | our executives are incentivized and rewarded for corporate growth, achievement of long-term corporate objectives and individual performance that meets or exceeds our expectations without encouraging unnecessary risk-taking; and |
| • | compensation provided to critical executives remains competitive relative to the compensation paid to similarly-situated executives of companies in the semiconductor industry. |
The Committee believes that the most effective executive compensation packages align executives’ interests with those of our stockholders by rewarding performance that exceeds specific annual, long-term and strategic goals that are intended to improve stockholder value. These objectives include the achievement of financial performance goals and progress on projects that our Board of Directors anticipates will lead to future growth, as discussed more fully below.
The information set forth below in this Compensation Discussion and Analysis describes the Committee’s general philosophy and historical approach.
Role of Executive Officers in Compensation Decisions
For named executive officers other than our chief executive officer, we have historically sought and considered input from our chief executive officer in making determinations regarding executive compensation. Our chief executive officer annually reviews the performance of our other named executive officers. Our chief executive officer subsequently presents conclusions and recommendations regarding such officers, including proposed salary adjustments and incentive amounts, to the Committee. The Committee then takes this information into account when it makes final decisions regarding any adjustments or awards.
The review of performance by the Committee and our chief executive officer of other executive officers is both an objective and subjective assessment of each executive’s contribution to our performance, leadership qualities, strengths and weaknesses and the individual’s performance relative to goals set by the Committee or our chief executive officer, as applicable. The Committee and our chief executive officer do not systematically assign a weight to the factors, and may, in their discretion, consider or disregard any one factor which, in their sole discretion, is important to or irrelevant for a particular executive.
The Committee’s annual determinations regarding executive compensation are subject to the terms of the respective service agreements between us and the named executive officers (as set forth in more detail below). In addition to the annual reviews, the Committee also typically considers compensation changes upon a named executive officer’s promotion or other change in job responsibility. Neither our chief executive officer nor any of our other executives participates in deliberations relating to their own compensation.
Stockholder Input
The Committee also seeks to ensure that the compensation paid to the Company’s executive officers is aligned with the interests of the Company’s stockholders. In that respect, as part of its ongoing review of the compensation paid to the Company’s executive officers, the Committee considered the approval by approximately 99% of the votes cast for the “Say on Pay” vote at the Company’s 2012 Annual Meeting of Stockholders and determined that the Company’s executive compensation philosophy, compensation objectives, and compensation elements continued to be appropriate and did not make any changes to the Company’s executive pay program in response to such stockholder vote.
110
Table of Contents
Index to Financial Statements
Timing of Compensation Decisions
At the end of each fiscal year, our chief executive officer will review the performance of the other executive officers and present his conclusions and recommendations to the Committee. At that time and throughout the year, the Committee will also evaluate the performance of our chief executive officer, which is measured in substantial part against our consolidated financial performance. In January of the following fiscal year, the Committee will then assess the overall functioning of our compensation plans against our goals, and determine whether any changes to the allocation of compensation elements, or the structure or level of any particular compensation element, are warranted.
In connection with this process, our Committee generally establishes the elements of its performance-based cash bonus plan for the upcoming year. As noted below, for fiscal 2014, no performance-based cash bonus plan was established. With respect to newly hired employees, our practice is typically to approve equity grants at the first meeting of the Committee following such employee’s hire date. We do not have any program, plan or practice to time equity award grants in coordination with the release of material non-public information. From time to time, additional equity awards may be granted to executive officers during the fiscal year.
Elements of Compensation
In making decisions regarding the pay of the named executive officers, the Committee looks to set a total compensation package for each officer that will retain high-quality talent and motivate executives to achieve the goals set by our Board of Directors. Our 2014 compensation package was composed of the following elements:
| • | annual base salary; |
| • | long-term equity incentives; |
| • | a benefits package that is generally available to all of our employees; and |
| • | expatriate and other executive benefits. |
Determination of Amount of Each Element of Compensation
General Background
The Committee seeks to establish a total cash compensation package for our named executive officers that is competitive with the compensation reflected in compensation data for similarly-situated executives in the peer group reviewed by the Committee, subject to adjustments based on each executive’s experience and performance. Historically, based on our review of industry specific survey data and the professional and market experience of our Committee members, we measured total cash compensation for our named executive officers against cash compensation paid to executives at similarly situated companies which we determined to be our select peer group. Base salaries for our named executive officers would then be benchmarked to median levels for companies in the select peer group, and adjusted upward or downward for performance. Short-term cash incentives would be put in place to provide for opportunities that may result in higher than median levels of cash compensation as compared to our select peer group if, and depending upon the extent to which, our performance and that of our named executive officers exceeded expectations and the goals established by the Committee for the year in question. Due to the circumstances surrounding the Restatement, the Committee did not undertake any of these actions for fiscal 2014.
Historically, our select peer group has included other major Korea-based semiconductor companies, including Fairchild Korea, Dongbu Hitek, ChipPac Korea, Hynix Semiconductor, ASE Korea and Amkor Technology Korea. In addition, we historically have also reviewed compensation data from Radford Korea, an independent compensation consultant, to assess how compensation for our select peer group related to compensation paid to executives in a broader range of technology companies; however, we did not undertake any such review in fiscal 2014.
The Committee historically makes annual determinations regarding cash incentive compensation based on our annual operating plan, which we adopt in the December preceding each fiscal year. The determination takes into account our expected performance in the coming fiscal year. The Committee makes all equity compensation decisions for our officers based on existing compensation arrangements for other executives at our Company with the same level of responsibility and based on a review of our select peer group with a view to maintaining internal consistency and parity.
Equity awards are not tied to base salary or cash incentive amounts and will constitute lesser or greater proportions of total compensation depending on the fair value of the awards. The Committee, relying on the professional and market experience of our Committee members, generally seeks to set equity awards at median levels of equity compensation at our select peer group companies. The Committee does not apply a formula or assign relative weight in making its determination. Instead, it makes a subjective determination after considering all information collectively.
111
Table of Contents
Index to Financial Statements
The Committee may approve additional cash incentive payments or equity compensation grants from time to time during the year in its discretion.
Base Salary
Base salary is the guaranteed element of an employee’s annual cash compensation. Changes in base salary may be approved by the Committee for an executive if the median levels of base salary compensation for similarly-situated executives in our select peer group have changed, and may be further adjusted based upon the employee’s long-term performance, skill set and the value of that skill. The Committee evaluates the performance of each named executive officer on an annual basis based on the accomplishment of performance objectives that were established at the beginning of the prior fiscal year as well as its own subjective evaluation of the officer’s performance. In making its evaluation, the Committee makes a subjective qualitative assessment of the officer’s contribution to our performance during the preceding year, including leadership, success in attaining particular goals of a division for which that officer has responsibility, our overall financial performance and such other criteria as the Committee may deem relevant, including input from our Chief Executive Officer. The Committee then makes a subjective decision regarding any changes in base salary based on these factors and the data from our select peer group. The Committee does not systematically assign weights to any of the factors it considers, and may, in its discretion, ignore any factors or deem any one factor to have greater importance for a particular executive officer. Base salary adjustments generally take effect in the middle of our fiscal year.
The Committee did not make any changes to the base salaries for our named executive officers for the 2014 fiscal year. Mr. J. Kim’s base salary was set in connection with the commencement of his employment.
Cash Incentives
Short-term cash incentives have historically comprised a significant portion of the total target compensation package and are designed to reward executives for their contributions to meeting and exceeding our goals and to recognize and reward our executives in achieving these goals. Incentives are typically designed as a percentage of base salary and are awarded based on individual performance and our achievement of the annual, long-term and strategic quantitative goals set by our Committee.
In December 2009, our Board of Directors implemented a cash incentive plan effective as of January 1, 2010, which we call the Profit Sharing Plan. Each of our employees is eligible to participate in the Profit Sharing Plan, and our Board of Directors intends for the Profit Sharing Plan to incentivize our named executive officers, officers and employees to exceed expectations throughout our entire fiscal year. The Committee administers the Profit Sharing Plan.
Under the Profit Sharing Plan, the Committee reviews our business plan in December of each year and determines an annual consolidated Adjusted EBITDA target, or the Base Target, for the upcoming fiscal year and sets the targeted amount to be awarded to our named executive officers and employees, or the Profit Share, for meeting the Base Target and for achievement in excess of the Base Target.
For our 2014 fiscal year, in light of the Restatement, the Committee determined that it would not be appropriate to set any bonus targets or have any bonus plan participation for our named executive officers. Except for Mr. J. Kim, no bonuses were established or paid to our named executive officers for the 2014 fiscal year.
Mr. J. Kim was paid a one-time signing bonus and relocation allowance of $100,000 in connection with joining the Company in March 2014.
Equity Compensation
In addition to our historical use of cash incentives, we offer equity incentives as a way to enhance the link between the creation of stockholder value and executive incentive compensation and to give our executives appropriate motivation and rewards for achieving increases in enterprise value. Under our 2009 Common Unit Plan, our Board of Directors previously granted options to acquire MagnaChip Semiconductor LLC common units and restricted unit bonus awards. Awards under our 2009 Common Unit Plan were converted into options for common stock and restricted common stock of MagnaChip Semiconductor Corporation upon our corporate conversion. Such options vest in installments over three years following grant, with approximately one-third of the restricted unit awards vested at grant and the remainder vesting in two subsequent annual installments, as set forth in more detail below.
Under our 2011 Equity Incentive Plan, which replaced the 2009 Common Unit Plan immediately following our corporate conversion, the Committee may grant participants stock options, stock appreciation rights, restricted stock, restricted stock units, performance shares and units, and other stock-based and cash-based awards. Stock options granted under the 2011 Equity Incentive Plan generally vest over three years following grant, with thirty-four percent of the common stock vesting and becoming exercisable on the first anniversary of grant date and eight or nine percent of the common stock subject to the options vesting on completion of each three-month period thereafter. In granting equity awards, the Committee may establish any conditions or restrictions it deems appropriate. Stock options and stock appreciation rights must have exercise prices at least equal to the fair market value of the stock at the time of their grant pursuant to the 2011 Equity Incentive
112
Table of Contents
Index to Financial Statements
Plan. The fair market value of the stock at the time of grant will generally be the closing price of a share of stock as quoted on the national or regional securities exchange or quotation system constituting the primary market for the stock on the date any grant is made. Prior to the exercise of a stock option or stock appreciation or settlement of an award denominated in units, the holder has no rights as a stockholder with respect to the stock subject to the award, including voting rights and the right to receive dividends. Participants receiving restricted stock awards are stockholders and have both voting rights and the right to receive dividends, except that dividends paid on unvested shares may remain subject to forfeiture until vested. Award vesting ceases upon termination of employment, and vested options and stock appreciation rights remain exercisable only for a limited period following such termination.
The Committee considers granting additional equity compensation in the event of new employment, a promotion or change in job responsibility or a change in median levels of equity compensation for similarly-situated executives at companies in our select peer group or in its discretion to reward or incentivize individual officers. The option award levels vary among participants based on their job grade and position. The Committee generally seeks to award equity compensation at levels consistent with the median levels for executives at companies in our select peer group, and will also make subjective determinations regarding adjustments to award amounts in light of factors such as the available pool, individual performance and role of executives. For example, the Committee may adjust the size of an award for an individual executive above the option award level for his or her position if the Committee determines that the executive has provided exceptional performance, or may increase the option award level for a position above the median level reflected in the select peer group if the position is considered by the Committee to be more critical to our long-term success. The Committee will generally maintain substantially equivalent award levels for executives at equivalent job grades. Stock option awards are not tied to base salary or cash incentive amounts.
As a result of our reorganization proceedings, all previously outstanding common and preferred units and options held by our named executive officers were cancelled. In December 2009, we granted new options to our executives with the option award amounts generally determined based upon the median levels of our select peer group. Thirty-four percent of the common units subject to the options vested and became exercisable on the first anniversary of grant date, with eight or nine percent of the common units subject to the options vesting on completion of each three-month period thereafter. In January 2012, because the options granted in December 2009 would vest by the end of that year, the Committee granted additional options to all of our named executive officers, other than Mr. YJ Kim, who joined the Company in April 2013, Mr. J. Kim, who joined the Company in March 2014, and Mr. T. Kim, who joined the Company in October 2013. The Committee believes these grants were intended to cover multiple years and thus determined that it was not appropriate to grant any equity awards in 2014 to our named executive officers, other than Mr. J. Kim, who received grants of options to purchase an aggregate of 50,000 shares arising out of the commencement of his employment with the Company.
Upon the recommendation of our Board of Directors or chief executive officer, or otherwise, the Committee may in the future consider granting additional performance-based equity incentives.
Perquisites and Other Benefits
We provide the named executive officers with perquisites and other benefits, including expatriate benefits, that the Committee believes are reasonable and consistent with our overall compensation program to better enable us to attract and retain superior employees for key positions. Generally, perquisites are determined based upon what the Committee considers to be the most customary perquisites offered by our select peer group and are not based upon a median cost for specific perquisites or for the perquisites in aggregate. The Committee determines the level and types of expatriate benefits for the executive officers based on local market surveys taken by our human resources group. These surveys are not limited to our select peer group, but include a broad range of non-Korea based companies with significant operations in Korea. Attributed costs of the personal benefits for the named executive officers are as set forth in the Summary Compensation Table below.
Mr. YJ Kim, Mr. J. Kim, Mr. T. Kim, Mr. Park and Ms. Sakai were expatriates during 2014. Mr. YJ Kim, Mr. T. Kim, Mr. Park and Ms. Sakai were also expatriates during 2013. Mr. YJ Kim, Mr. J. Kim, Mr. T. Kim, Mr. Park and Ms. Sakai received expatriate benefits commensurate with market practice in Korea. These benefits, which were determined on an individual basis, included housing allowances, relocation allowances, insurance premiums, reimbursement for the use of a car, home leave flights, living expenses, tax equalization payments and tax advisory services, each as we deemed appropriate.
In addition, pursuant to the Employee Retirement Benefit Security Act, certain executive officers resident in Korea with one or more years of service are entitled to severance benefits upon the termination of their employment for any reason. For purposes of this section, we call this benefit “statutory severance.” The base statutory severance is approximately one month of base salary per year of service. Mr. YJ Kim, Mr. J. Kim, Mr. T. Kim, Mr. Hwang and Ms. Sakai accrued statutory severance in 2014.
Certain Tax Considerations
We consider tax implications when we design our equity-based and cash compensation programs and when we make awards or grants. In particular, Section 162(m) of the Internal Revenue Code generally disallows a tax deduction to public companies for compensation over $1,000,000 paid to “covered employees” (which are defined as our named executive officers, other than the chief financial officer). However, qualifying performance-based compensation is not subject to the deduction limit if certain requirements are met. Although deductibility is a factor that the Committee takes into account in determining awards of cash bonuses and equity grant, the Committee may award compensation that is not deductible under Section 162(m) when, in the exercise of the Committee’s judgment, it would be in the best interests of the Company and its stockholders to do so.
113
Table of Contents
Index to Financial Statements
Summary Compensation Table
The following table sets forth certain information concerning the compensation earned during the years ended December 31, 2014, 2013 and 2012, of our named executive officers:
| Name and Principal Position |
Year | Salary ($) |
Bonus ($) |
Option Awards ($)(5) |
Change in Pension Value and Non- qualified Deferred Compensation Earnings ($)(6) |
All Other Compensation ($) |
Total ($) |
|||||||||||||||||||||
| Young-Joon Kim |
|
2014 2013 |
|
|
349,917 228,226 |
|
|
— 124,347 |
|
|
— 813,660 |
|
|
30,315 18,836 |
|
|
340,435 213,986 |
(7)
|
|
720,667 1,399,055 |
| |||||||
| Jonathan Kim |
2014 | 225,196 | 50,000 | 162,691 | 20,043 | 133,671 | (8) | 591,601 | ||||||||||||||||||||
| Theodore Kim |
2014 | 279,934 | — | — | 24,081 | 111,114 | (9) | 415,129 | ||||||||||||||||||||
| Sang Park |
|
2014 2013 2012 |
|
|
377,694 633,634 605,570 |
|
|
— 172,978 487,399 |
|
|
— — 583,268 |
|
|
— — — |
|
|
1,852,972 615,366 562,237 |
(10)
|
|
2,230,666 1,421,978 2,238,474 |
| |||||||
| Margaret Sakai |
|
2014 2013 2012 |
|
|
113,390 368,128 350,279 |
|
|
— 71,752 173,518 |
|
|
— — 171,092 |
|
|
6,438 24,600 37,150 |
|
|
1,028,384 525,750 462,200 |
(11)
|
|
1,148,212 990,230 1,194,239 |
| |||||||
| Tae Young Hwang |
|
2014 2013 2012 |
|
|
391,208 363,902 332,001 |
|
|
— 76,439 158,802 |
|
|
— — 51,846 |
|
|
32,601 43,968 36,876 |
|
|
30,180 31,717 34,883 |
(12)
|
|
453,989 516,026 614,408 |
| |||||||
| Brent Rowe |
|
2014 2013 2012 |
|
|
337,220 339,916 327,095 |
|
|
— 73,340 159,010 |
|
|
— — 64,808 |
|
|
— — — |
|
|
30,258 20,361 16,284 |
(13)
|
|
367,478 433,617 567,197 |
| |||||||
Note: A monthly average exchange rate was used to convert amounts in the above table that were originally paid in Korean won.
| (1) | Mr. Park resigned his positions as Chairman of the Board of Directors, Director and Chief Executive Officer of the Company, and from all other officer and director positions with the Company and its subsidiaries, effective as of May 20, 2014. |
| (2) | Ms. Sakai resigned her positions as Executive Vice President and Chief Financial Officer of the Company, and from all other officer and director positions with the Company and its subsidiaries, effective as of March 25, 2014. |
| (3) | Mr. Hwang resigned his positions as Chief Operating Officer and President of the Company, and from all other officer and director positions with the Company and its subsidiaries, effective as of April 30, 2015. |
| (4) | Mr. Rowe resigned his position as the Company’s Executive Vice President, Worldwide Sales, and from all other officer and director positions with the Company and its subsidiaries, effective as of May 21, 2015. |
| (5) | Represents the grant date fair value with respect to the fiscal year determined in accordance with FASB ASC 718. See Note 1 “Business, Basis of Presentation and Summary of Significant Accounting Policies—Stock-Based Compensation,” and Note 13 “Equity Incentive Plans” to our consolidated financial statements under “Item 8. Financial Statements and Supplementary Data.” |
| (6) | Consists of statutory severance accrued during the years ended December 31, 2014, 2013 and 2012, as applicable. See the section subtitled “Compensation Discussion and Analysis” for a description of the statutory severance benefit. |
| (7) | Includes the following personal benefits paid to Mr. YJ Kim for 2014: (a) $91,247, which is the annual aggregate monthly pro rata amount of prepaid housing expenses for Mr. YJ Kim’s housing lease; (b) $67,492 for reimbursement of tuition expenses for Mr. YJ Kim’s children; (c) $23,123 for Mr. YJ Kim’s home leave flights; (d) $34,161 for insurance premiums; (e) $58,627 for other personal benefits (including personal use of a car service provided by the Company and living expenses); and (f) $65,785 of reimbursement for the difference between the actual tax Mr. YJ Kim already paid and the hypothetical tax he had to pay for the fiscal year 2013. |
114
Table of Contents
Index to Financial Statements
| (8) | Includes the following personal benefits paid to Mr. J. Kim for 2014: (a) $37,837, which is the annual aggregate monthly pro rata amount of prepaid housing expenses for Mr. J. Kim’s housing lease; (b) $12,351 for Mr. J. Kim’s home leave flights; (c) $50,000 for Mr. J. Kim’s one-time relocation payments; (d) $25,122 for insurance premiums; and (e) $8,361 for other personal benefits (including personal use of a car service provided by the Company and living expenses). |
| (9) | Includes the following personal benefits paid to Mr. T. Kim for 2014: (a) $51,220, which is the annual aggregate monthly pro rata amount of prepaid housing expenses for Mr. T. Kim’s housing lease; (b) $12,794 for Mr. T. Kim’s home leave flights; (c) $25,303 for insurance premiums; (d) $13,306 for other personal benefits; and (e) $8,491 of reimbursement for the difference between the actual tax Mr. T. Kim already paid and the hypothetical tax he had to pay for the fiscal year 2013. |
| (10) | Includes the following personal benefits paid to Mr. Park for 2014: (a) $285,145, which is the annual aggregate monthly pro rata amount of prepaid housing expenses for Mr. Park’s housing lease; (b) $58,201 for insurance premiums; (c) $161,706 for other personal benefits (including personal use of a car service provided by the Company, home leave flights, living expenses, personal tax advisory expenses, and other personal benefits); (d) $208,169 of reimbursement for the difference between the actual tax Mr. Park already paid and the hypothetical tax he had to pay for the fiscal year 2013; (e) $647,220 for Mr. Park’s separation payment (including separation payments payable until July 2015); (f) $297,531 for other benefits (including housing expenses, reimbursement of Korean tax and living expenses amounts that are due and payable until July 2015); and (g) $195,000 of estimated reimbursement amount for the difference between the actual tax Mr. Park already paid and the hypothetical tax he had to pay for the fiscal year 2014. |
| (11) | Includes the following personal benefits paid to Ms. Sakai for 2014: (a) $127,039, which is the annual aggregate monthly pro rata amount of prepaid housing expenses for Ms. Sakai’s housing lease; (b) $43,963 for insurance premiums; (c) $117,578 for other personal benefits (including personal use of a car service provided by the Company, living expenses, personal tax advisory expenses, and other personal benefits); (d) $179,888 of reimbursement for the difference between the actual tax Ms. Sakai already paid and the hypothetical tax she had to pay for the fiscal year 2013; (e) $184,395 for Ms. Sakai’s separation payment; (f) $235,521 for statutory severance benefits paid to Ms. Sakai in connection with her termination of employment; and (g) $140,000 of estimated reimbursement amount for the difference between the actual tax Ms. Sakai already paid and the hypothetical tax she had to pay for the fiscal year 2014. |
| (12) | Includes the following personal benefits paid to Mr. Hwang for 2014: (a) $14,507 for personal use of a car service provided by the Company; (b) $2,257 for other personal benefits; and (c) $13,416 for insurance premiums. |
| (13) | Includes the following personal benefits paid to Mr. Rowe for 2014: (a) $21,890 for insurance premiums; and (b) $8,368 for other personal benefits. |
115
Table of Contents
Index to Financial Statements
Grants of Plan-Based Awards Table for Fiscal Year 2014
| Name |
Grant Date | Option Awards: Number of Securities Underlying Options (#) |
Exercise or Base Price of Option Awards ($/Share) |
Grant Date Fair Value of Option Awards ($)(2) |
||||||||||||
| Young-Joon Kim |
— | — | — | — | ||||||||||||
| Jonathan Kim |
|
3/12/2014 6/12/2014 9/12/2014 12/12/2014 |
|
|
12,500 12,500 12,500 12,500 |
(1) (1) (1) (1) |
|
13.93 12.44 12.18 12.96 |
|
|
44,590 38,939 38,274 40,887 |
| ||||
| Theodore Kim |
— | — | — | — | ||||||||||||
| Sang Park |
— | — | — | — | ||||||||||||
| Margaret Sakai |
— | — | — | — | ||||||||||||
| Tae Young Hwang |
— | — | — | — | ||||||||||||
| Brent Rowe |
— | — | — | — | ||||||||||||
| (1) | An installment of 34% of the shares of common stock subject to the options vested and became exercisable on March 12, 2015, an additional 9% of the options vest on the completion of the next period of three months, an additional 8% of the options vest upon the completion of each of the next three periods of three months, an additional 9% of the options vest upon the completion of the next period of three months, and an additional 8% of the options vest upon the completion of each of the next three periods of three months. |
| (2) | Represents the grant date fair value with respect to the fiscal year determined in accordance with FASB ASC 718. See Note 1 “Business, Basis of Presentation and Summary of Significant Accounting Policies—Stock-Based Compensation” and Note 13 “Equity Incentive Plans” to our consolidated financial statements under “Item 8: Financial Statements and Supplementary Data.” |
Outstanding Equity Awards at Fiscal Year End 2014
| Option Awards | ||||||||||||||||||||
| Name |
Grant Date |
Number of Securities Underlying Unexercised Options (#) Exercisable |
Number of Securities Underlying Unexercised Options (#) Unexercisable |
Option Exercise Price($) |
Option Expiration Date |
|||||||||||||||
| Young-Joon Kim |
5/6/2013 | 102,000 | (1) | 98,000 | (1) | 15.96 | 5/6/2023 | |||||||||||||
| Jonathan Kim |
|
3/12/2014 6/12/2014 9/12/2014 12/12/2014 |
|
|
12,500 12,500 12,500 12,500 |
(2) (2) (2) (2) |
|
13.93 12.44 12.18 12.96 |
|
|
3/12/2024 6/12/2024 9/12/2024 12/12/2024 |
| ||||||||
| Theodore Kim |
10/26/2013 | 17,000 | (3) | 33,000 | (3) | 21.79 | 10/26/2023 | |||||||||||||
| Sang Park |
|
12/8/2009 1/15/2012 |
|
|
280,000 225,000 |
(5) |
|
5.88 7.75 |
(4)
|
|
12/8/2019 1/15/2022 |
| ||||||||
| Margaret Sakai |
|
12/8/2009 1/15/2012 |
|
|
42,000 50,160 |
(6) |
|
5.88 7.75 |
(4)
|
|
12/8/2019 1/15/2022 |
| ||||||||
| Tae Young Hwang |
|
12/8/2009 1/15/2012 |
|
|
175,000 18,400 |
(7) |
1,600 | (7) |
|
5.88 7.75 |
(4)
|
|
12/8/2019 1/15/2022 |
| ||||||
| Brent Rowe |
|
12/8/2009 1/15/2012 |
|
|
105,000 23,000 |
(7) |
2,000 | (7) |
|
5.88 7.75 |
(4)
|
|
12/8/2019 1/15/2022 |
| ||||||
| (1) | An installment of 34% of the shares of common stock subject to the options vested and became exercisable on May 6, 2014, an additional 9% of the options vest on the completion of the next period of three months, an additional 8% of the options vest upon the completion of each of the next three periods of three months, an additional 9% of the options vest upon the completion of the next period of three months, and an additional 8% of the options vest upon the completion of each of the next three periods of three months. |
| (2) | An installment of 34% of the shares of common stock subject to the options vested and became exercisable on March 12, 2015, an additional 9% of the options vest on the completion of the next period of three months, an additional 8% of the options vest upon the completion of each of the next three periods of three months, an additional 9% of the options vest upon the completion of the next period of three months, and an additional 8% of the options vest upon the completion of each of the next three periods of three months. |
| (3) | An installment of 34% of the shares of common stock subject to the options vested and became exercisable on October 26, 2014, an additional 9% of the options vest on the completion of the next period of three months, an additional 8% of the options vest upon the completion of each of the next three periods of three months, an additional 9% of the options vest upon the completion of the next period of three months, and an additional 8% of the options vest upon the completion of each of the next three periods of three months. |
116
Table of Contents
Index to Financial Statements
| (4) | The option exercise price at the time of grant was $1.16 per common unit, or $9.28 after giving effect to the corporate conversion. On April 19, 2010, we made a distribution to our unitholders of $0.4254 per common unit, which resulted in the option exercise price being reduced to $0.7346 per common unit, or $5.88 after giving effect to the corporate conversion. |
| (5) | Mr. Park resigned his positions as Chairman of the Board of Directors, Director and Chief Executive Officer of the Company, and from all other officer and director positions with the Company and its subsidiaries, effective as of May 20, 2014. Mr. Park’s employment separation agreement with the Company provided for acceleration of outstanding and unvested employee stock options held by Mr. Park at the effective date of the separation agreement, with all stock options then held by Mr. Park to be exercisable up to twelve months following the effective date of the separation agreement. See “—Agreements with Executives and Potential Payments Upon Termination or Change in Control—Sang Park.” |
| (6) | Ms. Sakai resigned her positions as Executive Vice President and Chief Financial Officer of the Company, and from all other officer and director positions with the Company and its subsidiaries, effective as of March 25, 2014. On April 14, 2014, MagnaChip Korea entered into an employment separation agreement with Ms. Sakai that became effective as of April 22, 2014. As of April 22, 2014, 50,160 of the 66,000 shares of common stock subject to the options had vested and were exercisable and the unvested portion of Ms. Sakai’s equity award was forfeited. |
| (7) | An installment of 34% of the shares of common stock subject to the options vested and became exercisable on January 15, 2013, an additional 9% of the options vest on the completion of the next period of three months, an additional 8% of the options vest upon the completion of each of the next three periods of three months, an additional 9% of the options vest upon the completion of the next period of three months, and an additional 8% of the options vest upon the completion of each of the next three periods of three months. |
No option awards were exercised by our named executive officers during the year ended December 31, 2014 and no shares of our common stock of our named executive officers were subject to vesting during the year ended December 31, 2014.
117
Table of Contents
Index to Financial Statements
MagnaChip Semiconductor LLC 2009 Common Unit Plan
Following our emergence from our reorganization proceedings, in December 2009, our Board of Directors adopted, and our equityholders approved, the MagnaChip Semiconductor LLC 2009 Common Unit Plan, which we refer to as the 2009 Plan. The 2009 Plan provided for the grant of nonstatutory options, restricted unit bonus and purchase right awards, and deferred unit awards to employees and consultants of our Company and our subsidiaries and to members of our Board of Directors. However, only options and restricted unit bonus awards were granted under the 2009 Plan. Subject to adjustment in the event of certain changes in capital structure, the maximum aggregate number of MagnaChip Semiconductor LLC common units available for grant under the 2009 Plan was 30,000,000. Units subject to awards that expired, were forfeited or otherwise terminated would have been available again for grant under the 2009 Plan.
In connection with our corporate conversion, MagnaChip Semiconductor Corporation assumed the rights and obligations of MagnaChip Semiconductor LLC under the 2009 Plan and converted MagnaChip Semiconductor LLC common unit options and restricted common units outstanding under the 2009 Plan into options to acquire a number of shares of our common stock and shares of restricted common stock at a ratio of eight-for-one on substantially equivalent terms and conditions. As of December 31, 2014, there were outstanding under the 2009 Plan options to purchase 1,226,528 shares of common stock, at a weighted average exercise price of $6.12 per share. The 2009 Plan terminated immediately following our corporate conversion, and no additional options or other equity awards may be granted under the 2009 Plan. However, options granted under the 2009 Plan prior to its termination will remain outstanding until they are either exercised or expire.
The 2009 Plan is administered by the Committee. Subject to the provisions of the 2009 Plan, the Committee determined in its discretion the persons to whom and the times at which awards were granted, the sizes of such awards, and all of their terms and conditions. All awards were evidenced by a written agreement between us and the holder of the award. The Committee has the authority to construe and interpret the terms of the 2009 Plan and awards granted under it.
In the event of a change in control of our Company, the vesting of all outstanding awards held by participants whose employment has not previously terminated will accelerate in full. In addition, the Committee has the authority to require that outstanding awards be assumed or replaced with substantially equivalent awards by a successor corporation or to cancel the outstanding awards in exchange for a payment in cash or other property equal to the fair market value of restricted units or the excess, if any, of the fair market value of the units subject to an option over the exercise price per unit of such option.
2011 Equity Incentive Plan
Our 2011 Equity Incentive Plan, or the 2011 Plan, was approved by our Board of Directors and our stockholders in March 2010. We amended and restated the 2011 Plan in February 2011, and our stockholders approved the amendment in March 2011 to reflect that it became effective in 2011 upon our corporate conversion. 891,703 shares of our common stock, or the total number of shares of common stock (as adjusted by the conversion ratio in the corporate conversion) that remained available for grant upon the termination of the 2009 Plan immediately following the corporate conversion, were initially authorized and reserved.
As of December 31, 2014, there were outstanding under the 2011 Plan options to purchase 1,989,417 shares of common stock, at a weighted average exercise price of $11.74 per share. As of December 31, 2014, 955,421 shares of our common stock remained available for issuance under the 2011 Plan. This reserve automatically increased on January 1, 2014 and January 1, 2015 by an additional 680,967 and 681,129 shares, respectively, and will automatically increase each subsequent anniversary through 2021, by an amount equal to the smaller of 2% of the number of shares of common stock issued and outstanding on the immediately preceding December 31 or an amount determined by our Board of Directors. The number of shares authorized for issuance under the 2011 Plan will also be increased from time to time by up to that number of shares of common stock remaining subject to options and restricted stock awards outstanding under the 2009 Plan at the time of its termination immediately following the corporate conversion that expire or terminate or are forfeited for any reason after the effective date of the 2011 Plan, subject to a cap of 1,412,352 shares. Appropriate adjustments will be made in the number of authorized shares and other numerical limits in the 2011 Plan and in outstanding awards to prevent dilution or enlargement of participants’ rights in the event of a stock split or other change in our capital structure. Shares subject to awards granted under our 2011 Plan which expire, are repurchased, or are cancelled or forfeited will again become available for issuance under the 2011 Plan. The shares available will not be reduced by awards settled in cash. Shares withheld to satisfy tax withholding obligations will not again become available for grant. The gross number of shares issued upon the exercise of stock appreciation rights or options exercised by means of a net exercise or by tender of previously owned shares will be deducted from the shares available under the 2011 Plan.
Awards may be granted under the 2011 Plan to our employees, including officers, directors, or consultants or those of any present or future parent or subsidiary corporation or other affiliated entity. While we may grant incentive stock options only to employees, we may grant nonstatutory stock options, stock appreciation rights, restricted stock purchase rights or bonuses, restricted stock units, performance shares, performance units and cash-based awards or other stock-based awards to any eligible participant.
118
Table of Contents
Index to Financial Statements
The 2011 Plan is administered by the Committee. Subject to the provisions of the 2011 Plan, the Committee determines in its discretion the persons to whom and the times at which awards are granted, the sizes of such awards, and all of their terms and conditions. All awards are evidenced by a written agreement between us and the holder of the award. The Committee has the authority to construe and interpret the terms of the 2011 Plan and awards granted under it.
In the event of a change in control as described in the 2011 Plan, the acquiring or successor entity may assume or continue all or any awards outstanding under the 2011 Plan or substitute substantially equivalent awards. Any awards which are not assumed or continued in connection with a change in control or are not exercised or settled prior to the change in control will terminate effective as of the time of the change in control. The Committee may provide for the acceleration of vesting of any or all outstanding awards upon such terms and to such extent as it determines, except that the vesting of all awards held by members of our Board of Directors who are not employees will automatically be accelerated in full. The 2011 Plan also authorizes the Committee, in its discretion and without the consent of any participant, to cancel each or any outstanding award denominated in shares upon a change in control in exchange for a payment to the participant with respect to each share subject to the cancelled award of an amount equal to the excess of the consideration to be paid per share of common stock in the change in control transaction over the exercise price per share, if any, under the award.
2011 Employee Stock Purchase Plan
Our 2011 Employee Stock Purchase Plan, or the Purchase Plan, was approved by our Board of Directors in March 2010. Our Board of Directors amended and restated the Purchase Plan in February 2011 to reflect that the Purchase Plan would become effective in 2011 upon the commencement of the MagnaChip IPO. The Purchase Plan was approved by our stockholders in March 2011 and became effective upon the commencement of the MagnaChip IPO. We initially authorized and reserved 789,890 shares for sale under the Purchase Plan. In August, 2012, the Committee suspended the Purchase Plan.
As of December 31, 2014, 1,163,880 shares of our common stock remained reserved for sale under the Purchase Plan. In addition, the Purchase Plan provides for an automatic annual increase in the number of shares available for issuance under the plan on January 1 of each year beginning in 2012 and continuing through and including January 1, 2021 equal to the lesser of (i) 1% of our then issued and outstanding shares of common stock on the immediately preceding December 31, (ii) 789,980 shares, or (iii) a number of shares as our Board of Directors may determine. Appropriate adjustments will be made in the number of authorized shares and in outstanding purchase rights to prevent dilution or enlargement of participants’ rights in the event of a stock split or other change in our capital structure. Shares subject to purchase rights which expire or are canceled will again become available for issuance under the Purchase Plan. Because the Purchase Plan was suspended in August 2012, no annual increase in the number of shares authorized under such plan occurred on January 1, 2013, on January 1, 2014 or January 1, 2015.
Our employees and employees of any parent or subsidiary corporation designated by the Committee are eligible to participate in the Purchase Plan if they are customarily employed by us for more than 20 hours per week and more than five months in any calendar year. However, an employee may not be granted a right to purchase stock under the Purchase Plan if: (i) the employee immediately after such grant would own stock possessing 5% or more of the total combined voting power or value of all classes of our capital stock or of any parent or subsidiary corporation, or (ii) the employee’s rights to purchase stock under all of our employee stock purchase plans would accrue at a rate that exceeds $25,000 in value for each calendar year of participation in such plans.
The Purchase Plan is implemented through a series of sequential offering periods, generally three months in duration beginning on the first trading days of February, May, August, and November each year. The Committee is authorized to establish additional or alternative concurrent, sequential or overlapping offering periods and offering periods having a different duration or different starting or ending dates, provided that no offering period may have a duration exceeding 27 months.
Amounts accumulated for each participant, generally through payroll deductions, are credited toward the purchase of shares of our common stock at the end of each offering period at a price generally equal to 95% of the fair market value of our common stock on the purchase date. Prior to commencement of an offering period, the Committee is authorized to change the purchase price discount for that offering period, but the purchase price may not be less than 85% of the lower of the fair market value of our common stock at the beginning of the offering period or on the purchase date.
No participant may purchase under the Purchase Plan in any calendar year shares having a value of more than $25,000 measured by the fair market value per share of our common stock on the first day of the applicable offering period. Prior to the beginning of any offering period, the Committee may alter the maximum number of shares that may be purchased by any participant during the offering period or specify a maximum aggregate number of shares that may be purchased by all participants in the offering period. If insufficient shares remain available under the plan to permit all participants to purchase the number of shares to which they would otherwise be entitled, the Committee will make a pro rata allocation of the available shares. Any amounts withheld from participants’ compensation in excess of the amounts used to purchase shares will be refunded, without interest.
119
Table of Contents
Index to Financial Statements
In the event of a change in control, an acquiring or successor corporation may assume our rights and obligations under the Purchase Plan. If the acquiring or successor corporation does not assume such rights and obligations, then the purchase date of the offering periods then in progress will be accelerated to a date prior to the change in control as specified by the Committee, but the number of shares subject to outstanding purchase rights shall not be adjusted.
Agreements with Executives and Potential Payments Upon Termination or Change in Control
We are obligated to make certain payments to our named executive officers upon termination or a change in control as further described below.
Young-Joon Kim. We entered into an Offer Letter with Mr. YJ Kim, dated as of April 15, 2013, pursuant to which Mr. YJ Kim is entitled to an annual base salary of $350,000 per year, a one-time signing bonus and relocation allowance of $100,000, and an annual incentive bonus target of 80% of his annual base salary based on company performance and attainment of management objectives under a plan established and approved by the Board of Directors. Mr. YJ Kim is also entitled to customary employee benefits and expatriate benefits. Pursuant to his Offer Letter, on May 6, 2013, Mr. YJ Kim received an initial grant of an option to purchase an aggregate of 200,000 shares of the Company’s common stock at an exercise price of $15.96, which vests and becomes exercisable over three years from the date of commencement of Mr. YJ Kim’s employment with MagnaChip Korea. If Mr. YJ Kim’s employment is terminated by MagnaChip Korea without cause, Mr. YJ Kim is entitled to receive payment of all salary and benefits accrued and unpaid up to the date of termination, continued payment of his salary for six months at the rate in effect on the date of termination and payment of a prorated portion of the annual incentive bonus for the year in which termination occurs, and up to six months of health insurance premium reimbursement. The severance payable to Mr. YJ Kim under his Offer Letter will be reduced to the extent MagnaChip Korea makes any statutory severance payments to Mr. YJ Kim pursuant to the Korean Commercial Code or any other statute.
Jonathan Kim. We entered into an Offer Letter with Mr. J. Kim, dated as of March 8, 2014, pursuant to which Mr. J. Kim will be paid a base salary of $280,000 per year, a sign on bonus of $50,000, a one-time relocation payment of $50,000 and an annual incentive bonus based on company performance and attainment of management objectives under a plan to be established and approved by the Company’s Board of Directors. Mr. J. Kim is entitled to customary employee benefits and expatriate benefits. Pursuant to his Offer Letter, Mr. J. Kim will receive an initial grant of an option to purchase an aggregate of 50,000 shares of the Company’s common stock, which will be granted in four equal tranches during the nine-month period beginning on the commencement of his employment with MagnaChip Korea. The option grants will become vested and exercisable over three years from the date of commencement of Mr. J. Kim’s employment with MagnaChip Korea. If Mr. J. Kim’s employment is terminated by MagnaChip Korea without cause, Mr. J. Kim is entitled to receive payment of all salary and benefits accrued and unpaid up to the date of termination, continued payment of his salary for six months at the rate in effect on the date of termination and payment of a prorated portion of the annual incentive bonus for the year in which termination occurs. The severance payable to Mr. J. Kim under his Offer Letter will be reduced to the extent MagnaChip Korea makes any statutory severance payments to Mr. J. Kim pursuant to the Korean Commercial Code or any other statute.
Theodore Kim. We entered into an Offer Letter with Mr. T. Kim, dated as of September 27, 2013, pursuant to which Mr. T. Kim will be paid a base salary of $280,000 per year, and an annual incentive of up to 30% of his base salary based on company performance and attainment of management objectives under a plan to be established and approved by the Company’s Board of Directors. Mr. T. Kim is entitled to customary employee benefits and expatriate benefits. Pursuant to his Offer Letter, Mr. T. Kim will receive an initial grant of an option to purchase an aggregate of 50,000 shares of the Company’s common stock. The option grants will become vested and exercisable over three years from the date of commencement of Mr. T. Kim’s employment with MagnaChip Korea. If Mr. T. Kim’s employment is terminated by MagnaChip Korea without cause, Mr. T. Kim is entitled to receive continued payment of his salary for six months at the rate in effect on the date of termination and payment of a prorated portion of the annual incentive bonus for the year in which termination occurs. The severance payable to Mr. T. Kim under his Offer Letter will be reduced to the extent MagnaChip Korea makes any statutory severance payments to Mr. T. Kim pursuant to the Korean Commercial Code or any other statute.
Sang Park. We are party to an Amended and Restated Services Agreement, dated as of May 8, 2008 (the “Services Agreement”), with Mr. Park pursuant to which he served as our Chairman and Chief Executive Officer. On May 19, 2014, Mr. Park resigned as our Chairman and Chief Executive Officer and we entered into an employment separation agreement (the “Separation Agreement”) in connection with his resignation, as described in more detail below. The Separation Agreement partially supersedes the Services Agreement. Under the Services Agreement, Mr. Park was to receive an initial base salary of $450,000 and a one-time
120
Table of Contents
Index to Financial Statements
performance bonus payment of $900,000. Mr. Park was also entitled to an annual incentive award of 100% of his annual salary based upon the achievement of performance goals, provided that the actual bonus paid may be higher or lower dependent on over- or under-achievement of his performance goals, as determined by the Committee. Mr. Park was entitled to customary employee benefits and certain expatriate, repatriation and international service benefits, including relocation benefits, tax equalization benefits, the cost of housing accommodations and expenses, transportation benefits and repatriation benefits. Pursuant to the Services Agreement Mr. Park was granted options to purchase restricted common units but they were subsequently terminated in connection with our reorganization proceedings. The Services Agreement also contains customary non-competition and non-solicitation covenants lasting two and three years, respectively, from the date of termination of employment and confidentiality covenants of unlimited duration.
The Services Agreement provides that if Mr. Park’s employment were terminated without Cause or if he resigned for good reason, Mr. Park would be entitled to receive (i) payment of all salary and benefits accrued up to the date of termination, (ii) payment of his then-current base salary for twelve months, (iii) the annual incentive award to which Mr. Park would have been entitled for the year in which his employment terminates, (iv) twelve months’ accelerated vesting on outstanding equity awards and a twelve-month post-termination equity award exercise period, and (v) continued participation for Mr. Park and his eligible dependents in our benefit plans for twelve months, including certain international service benefits.
If such termination occurs within nine months of a change in control, Mr. Park would be entitled to receive (i) payment of all salary and benefits accrued and unpaid up to the date of termination, (ii) payment of his then-current base salary for twenty-four months, (iii) the annual incentive award to which Mr. Park would have been entitled for the year in which his employment terminates, (iv) two years’ accelerated vesting on outstanding equity awards, other than awards granted pursuant to the 2009 Plan, which accelerate in full, (v) a twelve-month post-termination equity award exercise period, and (vi) continued participation for Mr. Park and his eligible dependents in our benefit plans for two years, including certain international service benefits.
The severance described above payable to Mr. Park upon his termination without Cause or in connection with a change in control shall be reduced to the extent that we pay any statutory severance payments to Mr. Park pursuant to the Korean Commercial Code or any other statute. As used in the Services Agreement, the term “Cause” means the termination of Mr. Park’s employment because of (i) a failure by Mr. Park to substantially perform his customary duties (other than such failure resulting from incapacity due to physical or mental illness); (ii) Mr. Park’s gross negligence, intentional misconduct or material fraud in the performance of Mr. Park’s employment; (iii) Mr. Park’s conviction of, or plea of nolo contendere to, a felony or to a crime involving fraud or dishonesty; (iv) a judicial determination that Mr. Park committed fraud or dishonesty against any natural person, firm, partnership, limited liability company, association, corporation, company, trust, business trust, governmental authority or other entity; or (v) Mr. Park’s material violation of the agreement or of one or more of the material policies applicable to his employment. Resignation for “good reason” means a resignation upon any of the following events that remains uncured for 30 days after Mr. Park delivers a demand to us: (i) a salary reduction other than a reduction of less than 10% applied to our other officers, (ii) material reduction in benefits, (iii) failure to provide housing, (iv) nature or status of Mr. Park’s authorities, duties or responsibilities are materially and adversely altered, (v) removal from our Board of Directors without cause, or (vi) Mr. Park is not reappointed as Chief Executive Officer following our initial public offering.
In the event we terminate Mr. Park’s employment due to Disability, Mr. Park would be entitled to (i) payment of his salary and accrued vacation up to and including the date of termination, (ii) payment of any unpaid expense reimbursements, (iii) the prorated amount of any cash incentive to which Mr. Park would have been entitled, and (iv) other benefits due to Mr. Park through his termination date. As used in the Services Agreement, the term “Disability” means that the we determine that due to physical or mental illness or incapacity, whether total or partial, Mr. Park is substantially unable to perform his duties for a period of 180 consecutive days or shorter periods aggregating 180 days during any period of 365 consecutive days.
In the event of Mr. Park’s death while employed by us, Mr. Park’s estate or named beneficiary would be entitled to (i) payment of Mr. Park’s salary and accrued vacation up to and including the date of termination, (ii) payment of any unpaid expense reimbursements, (iii) the prorated amount of any cash incentive to which Mr. Park would have been entitled, and (iv) other benefits due to Mr. Park through his termination date.
On May 19, 2014, Mr. Park resigned his positions as our Chairman of the Board of Directors, Director and Chief Executive Officer of the Company, and from all other officer and director positions with the Company and its subsidiaries, effective as of May 20, 2014. Effective July 31, 2014, MagnaChip Korea entered into the Separation Agreement with Mr. Park. Pursuant to the terms of the Separation Agreement, Mr. Park resigned his employment with MagnaChip Korea and all affiliates as of July 31, 2014, and Mr. Park will be entitled to receive: (i) severance payments equal to twelve months of his current base salary (an aggregate of $647,220), payable in equal monthly installments, (ii) continuation of housing support and health benefits for twelve months, (iii) accrued tax equalization benefits for amounts earned up to and including the effective date of the separation agreement under the terms of Mr. Park’s Services Agreement with MagnaChip Korea (excluding all amounts paid or payable under the separation agreement), and (iv) acceleration of outstanding and unvested employee stock options held by Mr. Park at the effective date of the separation agreement, with all stock options then held by Mr. Park to be exercisable up to twelve months following the effective date of the separation agreement. The separation agreement also contains an obligation by Mr. Park to cooperate with the Company at the
121
Table of Contents
Index to Financial Statements
request of the Board of Directors and its Audit Committee in connection with the management transition, internal review and restatement of its financial statements and as otherwise may be requested by the Company, and provides for hourly consulting payments to Mr. Park for such cooperation services at his then-current hourly rate based on his base salary at the Company as of the effective date of the separation agreement or a subsequent employer during the term of the separation agreement, subject to an aggregate maximum amount. The Separation Agreement also contains a release of Korean law claims by Mr. Park and a confidentiality agreement.
Margaret Sakai. We entered into an Offer Letter with Ms. Sakai, dated as of September 5, 2006, pursuant to which Ms. Sakai served as our Senior Vice President, Finance, with an initial base salary of $250,000 per year and with a target annual incentive bonus opportunity of 50% of her base salary. Ms. Sakai’s title was changed to Senior Vice President and Chief Financial Officer in 2009 and Executive Vice President and Chief Financial Officer in 2011. Ms. Sakai is entitled to customary employee benefits and expatriate benefits under her Offer Letter. Pursuant to her Offer Letter, Ms. Sakai received an initial grant of options to purchase our common units, but the grant was subsequently terminated in connection with our reorganization proceedings.
If Ms. Sakai’s employment is terminated by us without cause, Ms. Sakai would be entitled to receive payment of all salary and benefits accrued and unpaid up to the date of termination, continued payment of her salary for six months at the rate in effect on the date of termination, payment of a prorated portion of the annual incentive bonus for the year in which termination occurs and paid benefits for Ms. Sakai and her dependents for six months. The severance payable to Ms. Sakai under her Offer Letter would be reduced to the extent we make any statutory severance payments to Ms. Sakai pursuant to the Korean Commercial Code or any other statute.
Effective March 25, 2014, Margaret Sakai resigned her positions as our Executive Vice President and Chief Financial Officer and from all other officer and director positions with the Company and its subsidiaries. On April 14, 2014, MagnaChip Korea entered into an employment separation agreement with Ms. Sakai. Pursuant to the terms of the separation agreement, Ms. Sakai resigned her employment with MagnaChip Korea and all affiliates as of the effective time of the separation agreement, and Ms. Sakai will be entitled to receive: (i) severance payments equal to six months her current base salary (an aggregate of $184,395), payable in equal monthly installments, (ii) continuation of housing support and health benefits for six months, (iii) accrued tax equalization benefits for amounts earned up to and including the effective date of the separation agreement under the terms of Ms. Sakai’s Offer Letter (excluding all amounts paid or payable under the separation agreement), and (iv) accrued Korean statutory severance benefits under MagnaChip Korea’s standard severance benefits policy to the extent accrued up to the effective date of the separation agreement; provided, that the benefits described in clauses (i), (ii) and (iii) above are conditioned upon Ms. Sakai’s continued cooperation with MagnaChip Korea and the Company for such six-month term. The separation agreement also contains a general release of claims and confidentiality agreement by Ms. Sakai, and provides for post-term hourly consulting arrangements to the extent requested by the Company.
Tae Young Hwang. We entered into an Entrustment Agreement with Mr. Hwang, effective as of October 1, 2004, under which he serves as our Chief Operating Officer and President, with an initial base salary of 220 million Korean won per year and with a target annual incentive bonus to be determined by management based on performance. Mr. Hwang is entitled to customary employee benefits. The agreement also contains customary non-competition covenants lasting one year from the date of termination of employment and confidentiality covenants of unlimited duration. If Mr. Hwang’s employment is terminated for any reason, he is entitled to statutory severance payments pursuant to the Korean Commercial Code or any other statute.
Effective April 30, 2015, Tae Young Hwang resigned as our Chief Operating Officer and President and from all other officer and director positions with the Company and its direct and indirect subsidiaries. In connection with Mr. Hwang’s resignation, on April 30, 2015, Mr. Hwang and MagnaChip Korea entered into an Advisory Services and Separation Agreement, or the Hwang Separation Agreement, which provides for Mr. Hwang’s separation from MagnaChip Korea effective as of May 31, 2015. Under the Hwang Separation Agreement, Mr. Hwang will provide advisory services to the Company for a term of 24 months. The advisory services will relate to: supporting the Company’s Chief Executive Officer; the Company’s production processes; transition matters; the Company’s LG Display business; labor union negotiations; cooperation with the Company in connection with any pending litigation or investigation relating to the Company or its affiliates; and any other matters the Company requests in its reasonable discretion. Mr. Hwang will be paid a monthly amount of 27,439,200 Korean won (approximately $25,412.55, with Korean won converted into U.S. Dollars at a reference conversion rate of 1,079.75 Korean won to 1 U.S. Dollar), which is equal to 80% of his current monthly salary, during the term of the Hwang Separation Agreement, payable on a monthly basis, for providing such advisory services. The Hwang Separation Agreement contains a general release of claims, a non-disparagement agreement and a confidentiality agreement by Mr. Hwang. The Hwang Separation Agreement also contains covenants by Mr. Hwang that during the term he provides advisory services to the Company and for one year after the conclusion of such term he will not engage in any activities or services that are competitive with the Company or any of its affiliates or solicit any of the Company’s employees. In consideration for Mr. Hwang’s advisory services and for the other terms agreed by Mr. Hwang in the Hwang Separation Agreement, the Company will pay Mr. Hwang a lump sum payment of 100% of his accrued pension benefits as of the effective date of the Hwang Separation Agreement. The value of Mr. Hwang’s accrued pension benefits as of May 31, 2015, the effective date of the Hwang Separation Agreement, is 1,103,424,670 Korean won (approximately $1,021,926.07). The Hwang Separation Agreement also provides that all stock options held by Mr. Hwang will be exercisable for 18 months following the effective date of the Hwang Separation Agreement.
Brent Rowe. We entered into an Offer Letter with Mr. Rowe, dated as of March 7, 2006, pursuant to which Mr. Rowe served as our Executive Vice President, Worldwide Sales, with an initial base salary of $220,000 per year, a sign on bonus of $50,000 and with a target annual incentive bonus opportunity of 80% of his base salary. Mr. Rowe was entitled to customary employee benefits. Pursuant to his Offer Letter, Mr. Rowe received an initial grant of options to purchase our common units, but the grant was subsequently terminated in connection with our reorganization proceedings. If Mr. Rowe’s employment were terminated without cause, he would be entitled to a severance payment equal to six months’ salary.
Effective as of May 21, 2015, Mr. Rowe resigned as the Company’s Executive Vice President, Worldwide Sales, and from all other officer and director positions with the Company and its direct and indirect subsidiaries. In connection with Mr. Rowe’s resignation, Mr. Rowe and MagnaChip Semiconductor, Inc., a subsidiary of the Company, entered into an Advisory Services and Separation Agreement (the “Rowe Separation Agreement”) which will become effective on May 28, 2015 unless earlier revoked under a statutory waiting period. Pursuant to the Rowe Separation Agreement, Mr. Rowe’s employment will terminate effective May 31, 2015. Mr. Rowe will be entitled to receive an initial severance payment of $134,000, payable within five days of the effective date of the Rowe Separation Agreement. Commencing on the effective date of the Rowe Separation Agreement, Mr. Rowe will also be entitled to receive $4,000 per month for a period of nine months or until such time as Mr. Rowe has secured other employment, whichever occurs first. Pursuant to the Rowe Separation Agreement, Mr. Rowe will provide advisory services to the Company for a term of nine months. The advisory services will relate to: supporting the Company’s Chief Executive Officer; transition matters; and any other matters the Company requests in its reasonable discretion. During the term that Mr. Rowe provides advisory services to the Company, the Company will pay for Mr. Rowe’s car lease payments and reimburse Mr. Rowe for payments made by him for continuation of his health care coverage (up to an agreed maximum amount). The Company also agreed to assume Mr. Rowe’s membership at a golf country club. In addition, all stock options held by Mr. Rowe will be exercisable for 24 months following May 31, 2015. The Rowe Separation Agreement also contains a general release of claims, a non-disparagement agreement, a confidentiality agreement by Mr. Rowe and a covenant by Mr. Rowe that for 12 months following the effective date of the Rowe Separation Agreement he will not solicit any of the Company’s employees.
122
Table of Contents
Index to Financial Statements
Potential Payments upon Termination or Change in Control.
Termination. Our named executive officers are eligible to receive certain payments and benefits in connection with certain service termination events pursuant to the terms of our employment agreements with them, as further described under the section entitled “Agreements with Executives and Potential Payments Upon Termination or Change in Control.” The terms “cause” and “resignation for good reason” used below have the meanings given to them in the applicable agreements with us.
Change in Control. Mr. Park was entitled to receive certain payments and benefits in connection with a change in control of our Company pursuant to our employment agreement with him, as further described under the section entitled “Agreements with Executives and Potential Payments Upon Termination or Change in Control.” In addition, the Committee has the authority to require that outstanding equity awards be assumed or replaced with substantially equivalent awards by the successor corporation or to cancel the outstanding awards in exchange for a payment in cash or other property equal to the fair market value of restricted units or the excess, if any, of the fair market value of the units subject to an option over the exercise price per unit of such option. For purposes of the foregoing, a “change in control” is generally defined as the acquisition by a person or entity of more than 51% of the combined voting power of our then outstanding voting securities or a sale or transfer of all or substantially all of our consolidated assets to a person or entity that is not our affiliate.
The following table presents our estimate of the dollar value of the payments and benefits payable to our named executive officers upon the occurrence of a termination without cause, assuming that each such event occurred on December 31, 2014 (except for Mr. Park and Ms. Sakai, whose employment terminated during 2014). The disclosure in the following table does not include:
| • | any accrued benefits that were earned and payable as of December 31, 2014; or |
| • | payments and benefits to the extent they are provided generally to all salaried employees and do not discriminate in scope, terms or operation in favor of the named executive officers. |
| Name |
Cash Severance Payment ($)(1) |
Continuation of Benefits ($)(2) |
Value of Equity Award Acceleration ($) |
Total ($) |
||||||||||||
| Young-Joon Kim |
175,000 | (3) | 219,891 | 394,891 | ||||||||||||
| Jonathan Kim |
140,000 | (4) | — | 140,000 | ||||||||||||
| Theodore Kim |
140,000 | (5) | — | 140,000 | ||||||||||||
| Sang Park* |
647,220 | (6) | 692,445 | (7) | 225,360 | (8) | 1,565,025 | |||||||||
| Margaret Sakai** |
419,916 | (9) | 285,469 | (10) | 705,385 | |||||||||||
| Tae Young Hwang*** |
990,842 | (11) | — | 990,842 | ||||||||||||
| Brent Rowe**** |
168,610 | — | 168,610 | |||||||||||||
| * | Mr. Park resigned his positions as Chairman of the Board of Directors, Director and Chief Executive Officer of the Company, and from all other officer and director positions with the Company and its subsidiaries, effective as of May 20, 2014. See “—Agreements with Executives and Potential Payments Upon Termination or Change in Control—Sang Park” for a description of Mr. Park’s severance arrangements with the Company. |
| ** | Ms. Sakai resigned her positions as Executive Vice President and Chief Financial Officer of the Company, and from all other officer and director positions with the Company and its subsidiaries, effective as of March 25, 2014. See “—Agreements with Executives and Potential Payments Upon Termination or Change in Control—Margaret Sakai” for a description of Ms. Sakai’s severance arrangements with the Company. |
| *** | Mr. Hwang resigned his positions as Chief Operating Officer and President of the Company, and from all other officer and director positions with the Company and its subsidiaries, effective as of April 30, 2015. See “—Agreements with Executives and Potential Payments Upon Termination or Change in Control—Tae Young Hwang” for a description of Mr. Hwang’s severance arrangements with the Company. |
| **** | Mr. Rowe resigned his positions as the Company’s Executive Vice President, Worldwide Sales, and from all other officer and director positions with the Company and its subsidiaries, effective as of May 21, 2015. See “—Agreements with Executives and Potential Payments Upon Termination or Change in Control—Brent Rowe” for a description of Mr. Rowe’s severance arrangements with the Company. |
| (1) | Represents cash severance payments payable to our named executive officers pursuant to (i) our employment agreements with them or, if greater, (ii) cash severance payments payable pursuant to the Employee Retirement Benefit Security Act of Korea. Other than Mr. Rowe, who was entitled to a lump sum cash severance payment, cash severance payments are paid monthly in accordance with our regular payroll procedures. Pursuant to the Employee Retirement Benefit Security Act, Mr. YJ Kim, Mr. J. Kim, Mr. T. Kim, Ms. Sakai and Mr. Hwang are entitled to certain statutory severance benefits from us upon the termination of their employment with us for any reason. See “—Compensation Discussion and Analysis—Perquisites and Other Benefits” for additional information. |
| (2) | Calculated assuming the continuation of benefits for the applicable period at the same dollar value of 2014 benefits. |
| (3) | Mr. YJ Kim is entitled to statutory severance benefits in the amount of $47,937. The amount owed to Mr. YJ Kim under his employment agreement, $175,000, will be reduced by the amount he is statutorily entitled to receive. |
| (4) | Mr. J. Kim is entitled to statutory severance benefits in the amount of $19,175. The amount owed to Mr. J. Kim under his employment agreement, $140,000, will be reduced by the amount he is statutorily entitled to receive. |
123
Table of Contents
Index to Financial Statements
| (5) | Mr. T. Kim is entitled to statutory severance benefits in the amount of $28,762. The amount owed to Mr. T. Kim under his employment agreement, $140,000, will be reduced by the amount he is statutorily entitled to receive. |
| (6) | Reflects amounts payable in connection with his actual termination of employment in 2014. |
| (7) | Represents the estimated aggregate value of benefits payable to Mr. Park pursuant to his separation agreement with the Company, which include housing expenses, health benefits and tax equalization benefits. |
| (8) | Reflects the aggregate value of 12 months of accelerated vesting under Mr. Park’s outstanding options issued under our 2011 Plan. The value of such accelerated vesting amount was calculated by multiplying (i) the number of outstanding options that vest as a result of an additional 12 months of vesting under the applicable option award by (ii) the difference of the fair market value of our common stock as of July 31, 2014 of $14.01, and the option exercise price for such options of $7.75 per share. |
| (9) | Reflects amounts payable in connection with her actual termination of employment in 2014, consisting of statutory severance benefits in the amount of $235,521 and a separation payment in the amount of $184,395. |
| (10) | Represents the estimated aggregate value of benefits payable to Ms. Sakai pursuant to her separation agreement with the Company, which include housing expenses, health benefits and tax equalization benefits. |
| (11) | Mr. Hwang was entitled to statutory severance benefits in the amount of $990,842 as of December 31, 2014. Although the minimum legal severance accrual is one month of base salary per year of service, Mr. Hwang was eligible for accrual of a multiple of two to three months of base salary per year of service during approximately the first ten of his nineteen years of service, or $688,834 in aggregate. |
Pension Benefits for the Fiscal Year Ended December 31, 2014
Pursuant to the Employee Retirement Benefit Security Act, certain executive officers resident in Korea with one or more years of service are entitled to severance benefits upon the termination of their employment for any reason. The base statutory severance accrues at the rate of approximately one month of base salary per year of service and is calculated on a monthly basis based upon the officer’s salary for the prior three-month period. Accordingly, if the named executive officers in the following table had retired on the last day of our fiscal year ended December 31, 2014, they would have been entitled to the statutory severance payments described below. Assuming no change in the applicable law, each of these executives will continue to accrue additional statutory severance benefits at the rate described above until his or her service with us terminates.
| Name |
Plan Name | Number of Years of Credited Service (#) |
Present Value of Accumulated Benefit ($) |
Payments During the Last Fiscal Year |
||||||||||
| Young Joon Kim |
Statutory Severance | 2 | 47,937 | — | ||||||||||
| Jonathan Kim |
Statutory Severance | 1 | 19,175 | — | ||||||||||
| Theodore Kim |
Statutory Severance | 2 | 28,762 | — | ||||||||||
| Tae Young Hwang |
Statutory Severance with Multiplier for Partial Period | 19 | (1) | 990,842 | — | |||||||||
| (1) | Mr. Hwang accrued severance for his nineteen years of service at MagnaChip and its predecessor corporation. Although the minimum legal severance accrual is one month of base salary per year of service, Mr. Hwang was eligible for accrual of a multiple of two to three months of base salary per year of service during approximately the first ten of his nineteen years of service, or $688,834 in aggregate. See “—Agreements with Executives and Potential Payments Upon Termination or Change in Control—Tae Young Hwang” for a description of the accrued pension benefits that are payable to Mr. Hwang in connection with his resignation. |
Nonqualified Deferred Compensation
We do not maintain any nonqualified deferred compensation plans.
124
Table of Contents
Index to Financial Statements
Director Compensation for the Fiscal Year Ended December 31, 2014
| Name |
Fees Earned or Paid in Cash ($) |
Option Awards ($)(1) |
Total ($) |
|||||||||
| Michael Elkins |
155,000 | (3) | 134,156 | (7) | 289,156 | |||||||
| Randal Klein(2) |
— | — | — | |||||||||
| Ilbok Lee |
110,000 | (4) | 134,156 | (7) | 244,156 | |||||||
| Brian Mulhern(2) |
— | — | — | |||||||||
| R. Douglas Norby |
115,000 | (5) | 134,156 | (7) | 249,156 | |||||||
| Nader Tavakoli |
110,000 | (6) | 134,156 | (7) | 244,156 | |||||||
| (1) | Represents grant date fair value determined in accordance with FASB ASC 718. See Note 1 “Business, Basis of Presentation and Summary of Significant Accounting Policies—Stock-Based Compensation,” and Note 13 “Equity Incentive Plans” to our consolidated financial statements under “Item 8. Financial Statements and Supplementary Data.” As of December 31, 2014, Mr. Elkins held aggregate options to purchase 85,000 shares of our common stock, of which 44,750 shares subject to the options had vested as of December 31, 2014, Dr. Lee held aggregate options to purchase 85,000 shares of our common stock, of which 55,000 shares subject to the options had vested as of December 31, 2014, Mr. Norby held aggregate options to purchase 105,000 shares of our common stock, of which 73,400 shares subject to the options had vested as of December 31, 2014, and Mr. Tavakoli held aggregate options to purchase 93,200 shares of our common stock, of which 61,600 shares subject to these options had vested as of December 31, 2014. Neither Mr. Klein nor Mr. Mulhern, our other non-employee directors as of December 31, 2014, held any outstanding stock or option awards as of December 31, 2014. |
| (2) | This director did not receive any compensation in 2014. |
| (3) | Consists of an annual retainer of $90,000 paid to independent directors plus an additional $45,000 for serving as Lead Director, an additional $10,000 for serving as the chairman of our Compensation Committee and an additional $10,000 for serving as a member of our Audit Committee and Nominating and Corporate Governance Committee pursuant to our director compensation policy. |
| (4) | Consists of an annual retainer of $90,000 paid to independent directors plus an additional $10,000 for serving as the chairman of our Nominating and Corporate Governance Committee and an additional $10,000 for serving as a member of our Compensation Committee and Risk Committee pursuant to our director compensation policy. |
| (5) | Consists of an annual retainer of $90,000 paid to independent directors plus an additional $15,000 for serving as the chairman of our Audit Committee and an additional $10,000 for serving as a member of our Nominating and Corporate Governance Committee and Risk Committee pursuant to our director compensation policy. |
| (6) | Consists of an annual retainer of $90,000 paid to independent directors plus an additional $10,000 for serving as the chairman of our Risk Committee and an additional $10,000 for serving as a member of our Audit Committee and Compensation Committee pursuant to our director compensation policy. |
| (7) | Consists of an option grant to an independent director to purchase 30,000 shares of common stock issued on January 2, 2014 under the 2011 Plan at an exercise price of $19.45. |
Further Information Regarding Director Compensation
Under our director compensation policy in effect in 2014, (i) each non-employee director received a fee of $90,000 per year; (ii) the Lead Director received an additional fee of $45,000 per year; (iii) the chairman of our Audit Committee received an additional fee of $15,000 per year; (iv) the chairman of our Compensation Committee, the chairman of our Nominating and Corporate Governance Committee and the chairman of our Risk Committee each received an additional fee of $10,000 per year; (v) each non-employee member of our Audit Committee, Compensation Committee, Nominating and Corporate Governance Committee, and Risk Committee received an additional fee of $5,000 per year per committee; (vi) upon election to the Board of Directors, each non-employee director will be granted, pursuant to the Company’s equity incentive plan as in effect at such time, a one-time option to purchase 25,000 of the Company’s common shares at an exercise price per share determined as the fair market value of a share on the date of grant and with vesting over three years at a rate of 34% on the first anniversary of grant and 9.0%, 8.0%, 8.0% and 8.0% on completion of each successive three-month period in the second and third years after grant; and (vii) each non-employee director will be granted on the first trading day of each January for such director’s service for the upcoming year, pursuant to the Company’s equity incentive plan as in effect at such time, a one-time option to purchase 30,000 of the Company’s common shares at an exercise price per share determined as the fair market value of a share on the date of grant and with vesting over one year at a rate of 100% on the first anniversary of grant. All cash amounts are payable in January for such director’s service for the upcoming year. Messrs. Klein and Mulhern are required by the internal policy of their employer, Avenue, to waive all compensation under the policy on a year-by-year basis. The Board of Directors accepted their waiver of all compensation under the policy for their service as directors during the year 2014.
125
Table of Contents
Index to Financial Statements
Compensation Committee Interlocks and Insider Participation
None of the members of the Compensation Committee has been an officer or employee of our Company during the last fiscal year. During 2014, decisions regarding executive officer compensation were made by our Compensation Committee. Mr. Park, our former Chief Executive Officer, participated in deliberations of our Compensation Committee regarding the determination of compensation of our executive officers other than himself for 2013 and prior periods. None of our executive officers currently serves, or in the past has served, as a member of the board of directors or the compensation committee of any entity that has one or more executive officers serving on our Board of Directors.
Compensation Committee Report
The Compensation Committee has reviewed and discussed the Compensation Discussion and Analysis as set forth above under “Compensation Discussion and Analysis” with our management and, based on such review and discussion, has recommended to our Board of Directors that the Compensation Discussion and Analysis be included in this Annual Report on Form 10-K for the year ended December 31, 2014.
The foregoing report was submitted by the Compensation Committee and shall not be deemed to be “soliciting material” or to be “filed” with the SEC or subject to Regulation 14A promulgated by the SEC or Section 18 of the Exchange Act.
Members of the Committee:
Michael Elkins, Chairman
Ilbok Lee
Nader Tavakoli
126
Table of Contents
Index to Financial Statements
Item 12. Security Ownership of Certain Beneficial Owners and Management and Related Stockholder Matters
Equity Compensation Plan Table
The following table provides information as of December 31, 2014, regarding securities authorized for issuance under the Company’s compensation plans. The Company’s compensation plans include the 2009 Plan, the 2011 Plan, and the Purchase Plan. The numbers in the following table do not include options or shares that may be added to the issuable amounts under the 2011 Plan or the Purchase Plan, respectively, after December 31, 2014, in accordance with the terms of the respective plans.
| Plan Category |
(a) Number of securities to be issued upon exercise of outstanding options |
(b) Weighted-average exercise price of outstanding options |
(c) Number of securities remaining available for future issuance under equity compensation plans (excluding securities reflected in column (a)) |
|||||||||
| Equity compensation plans approved by security holders |
3,215,945 | (1) | $ | 9.60 | (1) | 955,421 | (2) | |||||
| Equity compensation plans not approved by security holders |
— | — | — | |||||||||
| Total: |
3,215,945 | 955,421 | ||||||||||
| (1) | The number of securities to be issued upon the exercise of outstanding options and the weighted average exercise price do not include any purchase right under the Purchase Plan or the purchase price for the purchase of shares under the Purchase Plan. |
| (2) | Excludes 1,163,880 shares of common stock that remain available as of December 31, 2014, for future issuance under the suspended Purchase Plan. |
In December 2009, our Board of Directors adopted, and our equityholders approved, the MagnaChip Semiconductor LLC 2009 Common Unit Plan, which we refer to as the 2009 Plan. The 2009 Plan provided for the grant of nonstatutory options, restricted unit bonus and purchase right awards, and deferred unit awards to employees and consultants of our Company and our subsidiaries and to members of our Board of Directors. However, only options and restricted unit bonus awards were granted under the 2009 Plan. The 2009 Plan terminated immediately following our corporate conversion, and no additional options or other equity awards may be granted under the 2009 Plan. However, options granted under the 2009 Plan prior to its termination will remain outstanding until they are either exercised or expire. As of December 31, 2014, there were outstanding under the 2009 Plan options to purchase 1,226,528 shares of common stock, at a weighted average exercise price of $6.12 per share.
The 2011 Plan was approved by our Board of Directors and our stockholders in March 2010. We amended and restated the 2011 Plan in February 2011, and our stockholders approved the amendment in March 2011 to reflect that it became effective in 2011 upon our corporate conversion. 891,703 shares of our common stock, or the total number of shares of common stock (as adjusted by the conversion ratio in the corporate conversion) that remained available for grant upon the termination of the 2009 Plan immediately following the corporate conversion, were initially authorized and reserved.
As of December 31, 2014, there were outstanding under the 2011 Plan options to purchase 1,989,417 shares of common stock, at a weighted average exercise price of $11.74 per share. As of December 31, 2014, 955,421 shares of our common stock remained available for issuance under the 2011 Plan. This reserve automatically increased on January 1, 2014 by 680,967 shares and automatically increased on January 1, 2015 by 681,129 shares and will automatically increase each subsequent anniversary through 2021, by an amount equal to the smaller of 2% of the number of shares of common stock issued and outstanding on the immediately preceding December 31 or an amount determined by our Board of Directors. The number of shares authorized for issuance under the 2011 Plan will also be increased from time to time by up to that number of shares of common stock remaining subject to options and restricted stock awards outstanding under the 2009 Plan at the time of its termination immediately following the corporate conversion that expire or terminate or are forfeited for any reason after the effective date of the 2011 Plan, subject to a cap of 1,412,352 shares. Appropriate adjustments will be made in the number of authorized shares and other numerical limits in the 2011 Plan and in outstanding awards to prevent dilution or enlargement of participants’ rights in the event of a stock split or other change in our capital structure. Shares subject to awards granted under our 2011 Plan which expire, are repurchased, or are cancelled or forfeited will again become available for issuance under the 2011 Plan. The shares available will not be reduced by awards settled in cash. Shares withheld to satisfy tax withholding obligations will not again become available for grant. The gross number of shares issued upon the exercise of stock appreciation rights or options exercised by means of a net exercise or by tender of previously owned shares will be deducted from the shares available under the 2011 Plan.
For more information on our 2011 Equity Incentive Plan, see “Item 11: Executive Compensation—Compensation Discussion and Analysis—Grants of Plan-Based Awards—2011 Equity Incentive Plan.”
The Purchase Plan was approved by our Board of Directors in March 2010. Our Board of Directors amended and restated the Purchase Plan in February 2011 to reflect that the Purchase Plan would become effective in 2011 upon the commencement of the MagnaChip IPO. The Purchase Plan was approved by our stockholders in March 2011 and became effective upon the commencement of the MagnaChip IPO. We initially authorized and reserved 789,890 shares for sale under the Purchase Plan. In August, 2012, the Committee suspended the Purchase Plan.
127
Table of Contents
Index to Financial Statements
As of December 31, 2014, 1,163,880 shares of our common stock remained reserved for sale under the Purchase Plan. In addition, the Purchase Plan provides for an automatic annual increase in the number of shares available for issuance under the plan on January 1 of each year beginning in 2012 and continuing through and including January 1, 2021 equal to the lesser of (i) 1% of our then issued and outstanding shares of common stock on the immediately preceding December 31, (ii) 789,980 shares, or (iii) a number of shares as our Board of Directors may determine. Appropriate adjustments will be made in the number of authorized shares and in outstanding purchase rights to prevent dilution or enlargement of participants’ rights in the event of a stock split or other change in our capital structure. Shares subject to purchase rights which expire or are canceled will again become available for issuance under the Purchase Plan. Because the Purchase Plan was suspended in August 2012, no annual increase in the number of shares authorized under such plan occurred on January 1, 2013, on January 1, 2014 or on January 1, 2015. For more information on our 2011 Employee Stock Purchase Plan, see “Item 11: Executive Compensation—Compensation Discussion and Analysis—Grants of Plan-Based Awards—2011 Employee Stock Purchase Plan.”
Security Ownership of Certain Beneficial Owners and Management
The following table sets forth information regarding the beneficial ownership of our outstanding common stock for: (1) each person or entity known to us to beneficially own more than 5% of any class of our outstanding securities; (2) each member of our Board of Directors; (3) each of our named executive officers; and (4) all of the members of our Board of Directors and executive officers, as a group. The following tables list the number of shares and percentage of shares beneficially owned based on 34,056,468 shares of common stock outstanding as of May 1, 2015.
The amounts and percentages of equity interests beneficially owned are reported on the basis of SEC regulations governing the determination of beneficial ownership of securities. Under SEC rules, a person is deemed to be a “beneficial owner” of a security if that person has or shares “voting power,” which includes the power to vote or to direct the voting of such security, or “investment power,” which includes the power to dispose of or to direct the disposition of such security. A person is also deemed to be a beneficial owner of any securities of which that person has the right to acquire beneficial ownership within 60 days. Under these rules, more than one person may be deemed to be a beneficial owner of the same securities and a person may be deemed to be a beneficial owner of securities as to which he or she has no economic interest.
Except as indicated by footnote, the persons named in the table below have sole voting and investment power with respect to all shares of common stock shown as beneficially owned by them. Unless otherwise indicated, the address of each person listed in the table below is c/o MagnaChip Semiconductor, Ltd., 1 Hyangjeong-dong, Hungduk-gu, Cheongju-si, 361-725, Korea.
| Name and Address of Beneficial Owner |
Amount and Nature of Beneficial Ownership(1) |
Percent of Class(1) |
||||||
| Principal Stockholders |
||||||||
| Funds managed by Avenue Capital Management II, L.P.(2) |
4,088,978 | 12.0 | % | |||||
| FMR LLC(3) |
5,241,806 | 15.4 | % | |||||
| Funds managed by Pleasant Lake Partners LLC(4) |
2,216,020 | 6.5 | % | |||||
| Funds managed by Brigade Capital Management, LP(5) |
1,933,000 | 5.7 | % | |||||
| Funds managed by Archer Capital Management, L.P.(6) |
1,919,456 | 5.6 | % | |||||
| Funds managed by Rubric Capital Management, LLC(7) |
1,756,525 | 5.2 | % | |||||
| Directors and Executive Officers |
||||||||
| Young-Joon Kim(8) |
134,000 | * | ||||||
| Jonathan Kim(9) |
21,500 | * | ||||||
| Theodore Kim(10) |
25,500 | * | ||||||
| Michael Elkins(11) |
79,000 | * | ||||||
| Randal Klein(12) |
— | — | ||||||
| Ilbok Lee(13) |
85,000 | * | ||||||
| Brian Mulhern(12) |
— | — | ||||||
| R. Douglas Norby(14) |
105,000 | * | ||||||
| Nader Tavakoli(15) |
98,750 | * | ||||||
| Sang Park(16) |
785,000 | 2.3 | % | |||||
| Margaret Sakai(17) |
42,000 | * | ||||||
| Tae Young Hwang(18) |
285,000 | * | ||||||
| Brent Rowe(19) |
200,000 | * | ||||||
| Directors and Officers as a group (12 persons)(20) |
1,048,750 | 3.0 | % | |||||
128
Table of Contents
Index to Financial Statements
| * | Less than one percent |
| (1) | Includes any outstanding common stock held and, to the extent applicable, shares issuable upon the exercise or conversion of any securities that are exercisable or convertible within 60 days of May 1, 2015. |
| (2) | The following entities and person are collectively referred to in this table as the “Avenue Capital Group”: (i) Avenue Investments, L.P. (“Avenue Investments”), (ii) Avenue International Master, L.P. (“Avenue International”), (iii) Avenue International, Ltd. (“International Ltd.”), the sole limited partner of Avenue International Master, (iv) Avenue International Master GenPar, Ltd. (“Avenue International GenPar”), the general partner of Avenue International, (v) Avenue Partners, LLC (“Avenue Partners”), the general partner of Avenue Investments and the sole shareholder of Avenue International GenPar, (vi) Avenue-CDP Global Opportunities Fund, L.P. (“Avenue-CDP”), (vii) Avenue Global Opportunities Fund GenPar, LLC (“Global GenPar”), the general partner of Avenue-CDP, (viii) Avenue Special Situations Fund IV, L.P. (“Avenue Spec IV”), (ix) Avenue Capital Partners IV, LLC (“Avenue Capital IV”), the general partner of Avenue Spec IV, (x) GL Partners IV, LLC (“GL IV”), the managing member of Avenue Capital IV, (xi) Avenue Special Situations Fund V, L.P. (“Avenue Spec V”), (xii) Avenue Capital Partners V, LLC (“Avenue Capital V”), the general partner of Avenue Spec V, (xiii) GL Partners V, LLC (“GL V”), the managing member of Avenue Capital V, (xiv) Avenue PPF Opportunities Fund, L.P. (“Avenue PPF Opportunities”), (xv) Avenue PPF Opportunities Fund GenPar, LLC (“Avenue PPF Opportunities GenPar”), the general partner of Avenue PPF Opportunities, (xvi) Avenue US/Europe Distressed Segregated Portfolio, a segregated portfolio of Avenue EnTrust Customized Portfolio SPC (“Avenue EnTrust SPC”), (xvii) Avenue Capital Management II, L.P. (“Avenue Capital Management II”), the investment manager to Avenue Investments, Avenue International, Avenue-CDP, Avenue Spec IV, Avenue Spec V, Avenue PPF Opportunities and Avenue EnTrust SPC (such funds managed by Avenue Capital Management II, collectively, the “Avenue Funds”), (xviii) Avenue Capital Management II GenPar, LLC (“GenPar”), the general partner of Avenue Capital Management II, and (xix) Marc Lasry, the managing member of Avenue International GenPar, Avenue Partners, Global GenPar, GL IV, GL V, Avenue PPF Opportunities GenPar and GenPar. |
The Avenue Capital Group beneficially owns 4,088,978 shares of common stock. On November 9, 2014, all warrants to purchase our common stock previously held by the Avenue Capital Group expired.
The Avenue Funds have the sole power to vote and dispose of the common stock held by them. International Ltd., Avenue International GenPar, Avenue Partners, Global GenPar, Avenue Capital IV, GL IV, Avenue Capital V, GL V, Avenue PPF Opportunities GenPar, Avenue Capital Management II, GenPar and Marc Lasry have the shared power to vote and dispose of the common stock held by the Avenue Funds, all of whom disclaim any beneficial ownership except to the extent of their respective pecuniary interest. The address for all of the Avenue Funds is 399 Park Avenue, 6th Floor, New York, NY 10022.
Avenue Spec V beneficially owns 619,115 shares of common stock, or 1.8%. The securities owned by Avenue Spec V may also be deemed to be beneficially owned by Avenue Capital V, its general partner, GL V, the managing member of Avenue Capital V, Avenue Capital Management II, its investment manager, GenPar, the general partner of Avenue Capital Management II, and Mr. Lasry, the managing member of GenPar and GL V, all of whom disclaim any beneficial ownership except to the extent of their respective pecuniary interest. For further information regarding Avenue Spec V, please see above.
Avenue Spec IV beneficially owns 496,023 shares of common stock, or 1.5%. The securities owned by Avenue Spec IV may also be deemed to be beneficially owned by Avenue Capital IV, its general partner, GL IV, the managing member of Avenue Capital IV, Avenue Capital Management II, its investment manager, GenPar, the general partner of Avenue Capital Management II, and Mr. Lasry, the managing member of GenPar and GL IV, all of whom disclaim any beneficial ownership except to the extent of their respective pecuniary interest. For further information regarding Avenue Spec IV, please see above.
Avenue International beneficially owns 1,234,715 shares of common stock, or 3.6%. The securities owned by Avenue International may also be deemed to be beneficially owned by International Ltd., its sole limited partner, Avenue International GenPar, its general partner, Avenue Partners, the sole shareholder of Avenue International GenPar, Avenue Capital Management II, its investment manager, GenPar, the general partner of Avenue Capital Management II, and Mr. Lasry, the managing member of GenPar, Avenue Partners and Avenue International GenPar, all of whom disclaim any beneficial ownership except to the extent of their respective pecuniary interest. For further information regarding Avenue International, please see above.
Avenue-CDP beneficially owns 84,924 shares of common stock, or 0.2%. The securities owned by Avenue-CDP may also be deemed to be beneficially owned by Global GenPar, its general partner, Avenue Capital Management II, its investment manager, GenPar, the general partner of Avenue Capital Management II, and Mr. Lasry, the managing member of GenPar and Global GenPar, all of whom disclaim any beneficial ownership except to the extent of their respective pecuniary interest. For further information regarding Avenue-CDP, please see above.
Avenue Investments beneficially owns 722,264 shares of common stock, or 2.1%. The securities owned by Avenue Investments may also be deemed to be beneficially owned by Avenue Partners, its general partner,, Avenue Capital Management II, its investment manager, GenPar, the general partner of Avenue Capital Management II, and Mr. Lasry, the managing member of GenPar and Avenue Partners, all of whom disclaim any beneficial ownership except to the extent of their respective pecuniary interest. For further information regarding Avenue Investments, please see above.
129
Table of Contents
Index to Financial Statements
Avenue PPF Opportunities beneficially owns 812,190 shares of common stock, or 2.4%. The securities owned by Avenue PPF Opportunities may also be deemed to be beneficially owned by Avenue PPF Opportunities GenPar, its general partner, Avenue Capital Management II, its investment manager, GenPar, the general partner of Avenue Capital Management II, and Mr. Lasry, the managing member of Avenue PPF Opportunities GenPar and GenPar, all of whom disclaim any beneficial ownership except to the extent of their respective pecuniary interest. For further information regarding Avenue PPF Opportunities, please see above
Avenue EnTrust SPC beneficially owns 119,747 shares of common stock, or 0.4%. The securities owned by Avenue EnTrust SPC may also be deemed to be beneficially owned by Avenue Capital Management II, its investment manager, GenPar, the general partner of Avenue Capital Management II, and Mr. Lasry, the director of Avenue EnTrust SPC and the managing member of GenPar, all of whom disclaim any beneficial ownership except to the extent of their respective pecuniary interest. For further information regarding Avenue EnTrust SPC, please see above.
| (3) | Based on the information contained in an Amendment No.1 to Schedule 13G filed with the SEC on February 13, 2015 by FMR LLC (“FMR”), Edward C. Johnson 3d, Abigail P. Johnson and Select Electronics Portfolio. Edward C. Johnson 3d is a Director and the Chairman of FMR and Abigail P. Johnson is a Director, the Vice Chairman, the Chief Executive Officer and the President of FMR. Members of the Johnson family may be deemed, under the Investment Company Act of 1940, to form a controlling group with respect to FMR. Neither FMR nor Edward C. Johnson 3d nor Abigail P. Johnson has the sole power to vote or direct the voting of the shares owned directly by the various investment companies registered under the Investment Company Act (“Fidelity Funds”) advised by Fidelity Management & Research Company, a wholly owned subsidiary of FMR, which power resides with the Fidelity Funds’ Boards of Trustees. Fidelity Management & Research Company carries out the voting of the shares under written guidelines established by the Fidelity Funds’ Boards of Trustees. The shares of common stock listed in the table above include 1,909,582 shares of common stock beneficially owned by Select Electronics Portfolio. The business address of each of FMR, Edward C. Johnson 3d, Abigail P. Johnson and Select Electronics Portfolio is 245 Summer Street, Boston, Massachusetts 02210. |
| (4) | Based on the information contained in a Schedule 13G filed with the SEC on May 11, 2015 by Pleasant Lake Partners LLC (“PLP”), Pleasant Lake Offshore Master Fund L.P. (“PLP Master Fund”), PLP MM LLC and Jonathan Lennon. The shares of common stock listed above represent beneficial ownership as of May 7, 2015 and represent shares beneficially owned by PLP Master Fund, for which PLP serves as the investment manager and for which Pleasant Lake Onshore GP LLC (“GP LLC”) serves as General Partner. PLP MM LLC is the managing member of PLP. Jonathan Lennon serves as manager of PLP MM LLC and GP LLC. Each of PLP, PLP Master Fund, PLP MM LLC and Jonathan Lennon disclaims beneficial ownership of the shares of common stock listed above except to the extent of its or his pecuniary interest therein. Each of PLP, PLP Master Fund, PLP MM LLC and Jonathan Lennon has shared power to vote or to direct the vote and shared power to dispose or to direct the disposition of all 2,216,020 of the shares of common stock listed in the table above. The business address of each of PLP, PLP Master Fund, PLP MM LLC and Jonathan Lennon is 110 Greene Street, Suite 604, New York, New York 10012. |
| (5) | Based on the information contained in a Schedule 13G filed with the SEC on September 29, 2014 by Brigade Capital Management, LP (“Brigade Capital”), Brigade Leveraged Capital Structures Fund Ltd. (“Brigade Fund”) and Donald E. Morgan, III. Each of Brigade Capital and Donald E. Morgan, III has shared power to vote or to direct the vote and shared power to dispose or to direct the disposition of all 1,933,000 of the shares of common stock listed in the table above. Brigade Fund has shared power to vote or to direct the vote and shared power to dispose or to direct the disposition of 1,750,000 of the shares of common stock listed in the table above. The business address of each of Brigade Capital and Donald E. Morgan, III is 399 Park Avenue, 16th Floor, New York, New York 10022. The business address of Brigade Fund is c/o Elian, 89 Nexus Way, Camana Bay, Grand Cayman KY1-9007, Cayman Islands. |
| (6) | Based on the information contained in a Schedule 13G filed with the SEC on February 17, 2015 by (i) Archer Capital Management, L.P. (“Archer”), as the investment manager to certain private investment funds, (ii) Canton Holdings, L.L.C. (“Canton”), as the general partner of Archer, (iii) Joshua A. Lobel, as a principal of Canton, and (iv) Eric J. Edidin, as a principal of Canton. Canton, Archer, Mr. Lobel and Mr. Edidin may be deemed the beneficial owners of all of the 1,919,456 shares of common stock listed in the table above. Canton, Archer, Mr. Lobel and Mr. Edidin have the shared power to vote and dispose of all of the 1,919,456 shares of common stock listed in the table above. The business address of each of Canton, Archer, Mr. Lobel and Mr. Edidin is 570 Lexington Avenue, 40th Floor, New York, New York 10022. |
| (7) | Based on the information contained in a Schedule 13G filed with the SEC on February 18, 2015 by (i) Rubric Capital Management, LLC (“Rubric Capital Management”), (ii) Cubist Systematic Strategies, LLC (“Cubist Systematic Strategies”) and (iii) Steven A. Cohen. Rubric Capital Management, Cubist Systematic Strategies and Mr. Cohen own directly no shares. Pursuant to an investment management agreement, Rubric Capital Management maintains investment and voting power with respect to the securities held by certain investment funds it manages. Pursuant to an investment management agreement, Cubist Systematic Strategies maintains investment and voting power with respect to the securities held by certain investment funds it |
130
Table of Contents
Index to Financial Statements
| manages. Mr. Cohen controls each of Rubric Capital Management and Cubist Systematic Strategies. Rubric Capital Management and Mr. Cohen may be deemed to beneficially own 1,750,000 of the shares of common stock listed in the table above and Cubist Systematic Strategies and Mr. Cohen may be deemed to beneficially own 6,525 of the shares of common stock listed in the table above. Each of Rubric Capital Management, Cubist Systematic Strategies and Mr. Cohen disclaims beneficial ownership of any of the shares of common stock listed in the table above. The address of the principal business office of (i) Rubric Capital Management and Mr. Cohen is 72 Cummings Point Road, Stamford, CT 06902; and (ii) Cubist Systematic Strategies is 330 Madison Avenue, New York, NY 10173. |
| (8) | Represents 134,000 options to purchase shares of common stock that will be vested and exercisable as of June 30, 2015. |
| (9) | Represents 21,500 options to purchase shares of common stock that will be vested and exercisable as of June 30, 2015. |
| (10) | Represents 25,500 options to purchase shares of common stock that will be vested and exercisable as of June 30, 2015. |
| (11) | Represents 79,000 options to purchase shares of common stock that will be vested and exercisable as of June 30, 2015. |
| (12) | The address for Messrs. Klein and Mulhern is 399 Park Avenue, 6th Floor, New York, NY 10022. |
| (13) | Represents 85,000 options to purchase shares of common stock that will be vested and exercisable as of June 30, 2015. |
| (14) | Represents 105,000 options to purchase shares of common stock that will be vested and exercisable as of June 30, 2015. |
| (15) | Represents 5,550 shares of common stock and 93,200 options to purchase shares of common stock that will be vested and exercisable as of June 30, 2015. |
| (16) | Mr. Park resigned his positions as our Chairman of the Board of Directors, Director and Chief Executive Officer and from all other officer and director positions with us and our subsidiaries, effective as of May 20, 2014. Represents 280,000 shares of common stock and 505,000 options to purchase shares of common stock that will be vested and exercisable as of June 30, 2015. The address for Mr. Park is c/o Gibson, Dunn & Crutcher LLP, 333 South Grand Avenue, Los Angeles, CA 90071-3197, Attn: Maurice M. Suh. |
| (17) | Ms. Sakai resigned her positions as our Executive Vice President and Chief Financial Officer and from all other officer and director positions with us and our subsidiaries, effective as of March 25, 2014. Represents 42,000 shares of common stock. The address for Ms. Sakai is c/o Kobre & Kim LLP, 150 California Street, San Francisco, California 94111. |
| (18) | Mr. Hwang resigned his positions as our President and Chief Operating Officer and from all other officer and director positions with us and our subsidiaries, effective as of April 30, 2015. Represents 90,000 shares of common stock and 195,000 options to purchase shares of common stock that will be vested and exercisable as of June 30, 2015. The address for Mr. Hwang is c/o Bird, Marella, Boxer, Wolpert, Nessim, Drooks, Lincenberg & Rhow, P.C., 1875 Century Park East, 23rd Floor, Los Angeles, California 90067-2561. |
| (19) | Mr. Rowe resigned his positions as our Senior Vice President, Worldwide Sales, and from all other officer and director positions with us and our subsidiaries, effective as of May 21, 2015. Represents 70,000 shares of common stock and 130,000 options to purchase shares of common stock that will be vested and exercisable as of June 30, 2015. |
| (20) | Represents 131,550 shares of common stock and 917,200 options to purchase shares of common stock that will be vested and exercisable as of June 30, 2015. Excluding shares of common stock and options to purchase common stock held by Mr. Rowe, our directors and executive officers as of May 1, 2015 as a group beneficially own 848,750 shares of common stock or 2.4%, which represents 61,550 shares of common stock and 787,200 options to purchase shares of common stock that will be vested and exercisable as of June 30, 2015. |
131
Table of Contents
Index to Financial Statements
Item 13. Certain Relationships and Related Transactions, and Director Independence
Code of Business Conduct and Ethics
Under our Code of Business Conduct and Ethics, all conflicts of interest and related party transactions involving our directors or executive officers must be reviewed and approved in writing by our full Board of Directors. In the approval process, the approving authority will review all aspects of the conflict of interest or related party transaction, including but not limited to: (i) compliance with laws, rules and regulations, (ii) the adverse effect on our business and results of operations, (iii) the adverse effect on our relationships with third parties such as customers, vendors and potential investors, (iv) the benefit to the director, officer or employee at issue, and (v) the creation of morale problems among other employees. Our Board of Directors will only approve those related party transactions that, in light of known circumstances, are in, or are not inconsistent with, our best interests.
Registration Rights Agreement
On November 9, 2009, we entered into a registration rights agreement with the holders of MagnaChip Semiconductor LLC’s common units issued in our reorganization proceedings, including Avenue, where we granted them registration rights with respect to our common stock. In 2012 and 2013, the Company paid fees and expenses of $1.2 million and $0.8 million, respectively, in connection with the registration and sale of shares of our common stock by Avenue pursuant to such registration rights agreement. Affiliates of Avenue currently have two employees, Messrs. Klein and Mulhern, serving as members of our Board of Directors. Mr. Elkins, also a current member of our Board of Directors, was previously employed by affiliates of Avenue until December 31, 2012, and currently serves as a consultant to affiliates of Avenue.
Director Independence
The Board of Directors reviews the independence of each director annually. In determining the independence of our directors, our Board of Directors considered Section 303A of the NYSE listing standards and broadly considered the materiality of each director’s relationship with us. Based upon the foregoing criteria, in December 2014, our Board of Directors determined that the following directors are independent: Mr. R. Douglas Norby, Mr. Michael Elkins, Dr. Ilbok Lee and Mr. Nader Tavakoli. In making such determination of independence for Mr. Elkins under the applicable NYSE independence standards for his service on the Compensation Committee of the Board of Directors, the Board of Directors specifically considered Mr. Elkins’ previous employment and current consulting arrangement with Avenue.
132
Table of Contents
Index to Financial Statements
Item 14. Principal Accounting Fees and Services.
Fees Paid to Independent Registered Public Accounting Firm
The following table presents fees billed or expected to be billed for professional services rendered by Samil PricewaterhouseCoopers and its affiliates for the years ended December 31, 2014 and 2013.
| Year Ended December 31 | ||||||||
| 2014 | 2013 | |||||||
| (in millions) | ||||||||
| Audit fees(1) |
$ | 2.3 | $ | 8.5 | ||||
| Audit Related fees |
— | — | ||||||
| Tax fees |
0.0 | 0.0 | ||||||
| All other fees |
0.0 | 0.0 | ||||||
|
|
|
|
|
|||||
| Total |
$ | 2.3 | $ | 8.6 | ||||
| (1) | The large difference between the fees reflected in 2013 compared to those for 2014 primarily relates to additional fees incurred associated with our Restatement. |
Policy and procedure for approval of audit and permitted non-audit services
All audit fees were pre-approved by the Company’s Audit Committee, which concluded that the provision of such services by Samil PricewaterhouseCoopers and its affiliates was compatible with the maintenance of that firm’s independence in the conduct of its auditing functions. With respect to outside auditor independence, the Audit Committee Charter provides for pre-approval of audit services and non-audit services, based on independence, qualifications and, if applicable, performance, and approve the fees and other terms of any such engagement. The Audit Committee Charter authorizes the Audit Committee to delegate to one or more of its members the authority to grant pre-approvals for such services, provided that the decisions of such member(s) to grant any such pre-approval shall be presented to the Committee at its next scheduled meeting. The Audit Committee followed these guidelines in approving all services rendered by Samil PricewaterhouseCoopers and its affiliates.
133
Table of Contents
Index to Financial Statements
PART IV
Item 15. Exhibits and Financial Statement Schedules
| 1. | Financial Statements |
The information required by this item is included in Item 8 of Part II of this Form 10-K.
| 2. | Financial Statement Schedules |
Financial Statement Schedules are omitted because of the absence of the conditions under which they are required or because the information required by such omitted schedules is set forth in the financial statements or the notes thereto.
| 3. | Exhibits |
| Exhibit |
Exhibit Description | |
| 2.1 | Second Amended Chapter 11 Plan of Reorganization Proposed by the Official Committee of Unsecured Creditors of MagnaChip Semiconductor Finance Company, et al., dated as of September 24, 2009 (incorporated by reference to Exhibit 2.1 to our Amendment No. 1 to Registration Statement on Form S-1 filed on April 20, 2010 (Registration No. 333-165467)). | |
| 3.1 | Certificate of Conversion of MagnaChip Semiconductor LLC (incorporated by reference to Exhibit 3.1 to our Current Report on Form 8-K filed on March 11, 2011). | |
| 3.2 | Certificate of Incorporation of MagnaChip Semiconductor Corporation (incorporated by reference to Exhibit 3.2 to our Current Report on Form 8-K filed on March 11, 2011). | |
| 3.3 | Bylaws of MagnaChip Semiconductor Corporation (incorporated by reference to Exhibit 3.3 to our Current Report on Form 8-K filed on March 11, 2011). | |
| 3.4 | Form of Plan of Conversion of MagnaChip Semiconductor LLC (incorporated by reference to Exhibit 3.6 to our Amendment No. 2 to Registration Statement on Form S-1 filed on May 11, 2010 (Registration No. 333-165467)). | |
| 3.5 | Certificate of Designation, Preferences and Rights of Series A Junior Participating Preferred Stock of MagnaChip Semiconductor Corporation, as filed with the Secretary of the State of Delaware on March 6, 2015 (incorporated by reference to Exhibit 3.1 to our Current Report on Form 8-K filed on March 6, 2015). | |
| 4.1 | Rights Agreement, dated as of March 5, 2015, between MagnaChip Semiconductor Corporation and American Stock Transfer & Trust Company, LLC, which includes as Exhibits thereto the Form of Certificate of Designation, the Form of Right Certificate and the Summary of Terms attached thereto as Exhibits A, B and C, respectively (incorporated by reference to Exhibit 4.1 to our Current Report on Form 8-K filed on March 6, 2015). | |
| 4.2 | Registration Rights Agreement, dated as of November 9, 2009, by and among MagnaChip Semiconductor LLC and each of the securityholders named therein (incorporated by reference to Exhibit 4.1 to our Amendment No. 1 to Registration Statement on Form S-1 filed on April 20, 2010 (Registration No. 333-165467)). | |
| 4.3 | Indenture, dated as of July 18, 2013, between MagnaChip Semiconductor Corporation, as issuer, and Wilmington Trust, National Association, as trustee (incorporated by reference to Exhibit 4.1 to our Current Report on Form 8-K filed on July 18, 2013). | |
| 4.4 | First Supplemental Indenture, dated as of March 27, 2014, to Indenture, dated as of July 18, 2013, between MagnaChip Semiconductor Corporation, as issuer, and Wilmington Trust, National Association, as trustee (incorporated by reference to Exhibit 4.2 to our Current Report on Form 8-K filed on June 25, 2014). | |
| 4.5 | Form of 6.625% Senior Notes due 2021 and notation of guarantee (included in Exhibit 4.2) | |
| 10.1 | Intellectual Property License Agreement, dated as of October 6, 2004, by and between Hynix Semiconductor Inc. and MagnaChip Semiconductor, Ltd. (Korea) (incorporated by reference to Exhibit 10.2 to our Amendment No. 1 to Registration Statement on Form S-1 filed on April 20, 2010 (Registration No. 333-165467)). | |
| 10.2(1) | Land Lease and Easement Agreement, dated as of October 6, 2004, by and between Hynix Semiconductor Inc. and MagnaChip Semiconductor, Ltd. (Korea) (incorporated by reference to Exhibit 10.3 to our Amendment No. 1 to Registration Statement on Form S-1 filed on April 20, 2010 (Registration No. 333-165467)). | |
134
Table of Contents
Index to Financial Statements
| Exhibit |
Exhibit Description | |
| 10.3 | First Amendment to Land Lease and Easement Agreement, dated as of December 30, 2005, by and between Hynix Semiconductor Inc. and MagnaChip Semiconductor, Ltd. (Korea) (incorporated by reference to Exhibit 10.4 to our Amendment No. 1 to Registration Statement on Form S-1 filed on April 20, 2010 (Registration No. 333-165467)). | |
| 10.4(1) | General Service Supply Agreement, dated as of October 6, 2004, by and between Hynix Semiconductor Inc. and MagnaChip Semiconductor, Ltd. (Korea) (incorporated by reference to Exhibit 10.5 to Amendment No. 2 to MagnaChip Semiconductor S.A.’s and MagnaChip Semiconductor Finance Company’s Registration Statement on Form S-4 (Registration No. 333-168516) filed on October 14, 2010). | |
| 10.5 | First Amendment to the General Service Supply Agreement, dated as of December 30, 2005, by and between Hynix Semiconductor Inc. and MagnaChip Semiconductor, Ltd. (Korea) (incorporated by reference to Exhibit 10.6 to our Amendment No. 1 to Registration Statement on Form S-1 filed on April 20, 2010 (Registration No. 333-165467)). | |
| 10.6(1) | License Agreement (ModularBCD), dated as of March 18, 2005, by and between Advanced Analogic Technologies, Inc. and MagnaChip Semiconductor, Ltd. (Korea) (incorporated by reference to Exhibit 10.7 to our Registration Statement on Form S-1 filed on March 15, 2010 (Registration No. 333-165467)). | |
| 10.7(1) | Amended & Restated License Agreement (TrenchDMOS), dated as of September 19, 2007, by and between Advanced Analogic Technologies, Inc. and MagnaChip Semiconductor, Ltd. (Korea) (incorporated by reference to Exhibit 10.8 to Amendment No. 2 to MagnaChip Semiconductor S.A.’s and MagnaChip Semiconductor Finance Company’s Registration Statement on Form S-4 (Registration No. 333-168516) filed on October 14, 2010). | |
| 10.8(1) | Technology License Agreement, dated as of December 16, 1996, by and between Advanced RISC Machines Limited and MagnaChip Semiconductor, Ltd. (Korea) (successor in interest to LG Semicon Company Limited) (incorporated by reference to Exhibit 10.9 to our Registration Statement on Form S-1 filed on March 15, 2010 (Registration No. 333-165467)). | |
| 10.9(1) | Amendment to the Technology License Agreement, dated as of October 16, 2006, by and between ARM Limited and MagnaChip Semiconductor, Ltd. (Korea) (incorporated by reference to Exhibit 10.10 to Amendment No. 2 to MagnaChip Semiconductor S.A.’s and MagnaChip Semiconductor Finance Company’s Registration Statement on Form S-4 (Registration No. 333-168516) filed on October 14, 2010). | |
| 10.10(1) | ARM7201TDSP Device License Agreement, dated as of August 26, 1997, by and between Advanced RISC Machines Limited and MagnaChip Semiconductor, Ltd. (Korea) (successor in interest to LG Semicon Company Limited) (incorporated by reference to Exhibit 10.11 to our Registration Statement on Form S-1 filed on March 15, 2010 (Registration No. 333-165467)). | |
| 10.11(1) | Technology License Agreement, dated as of October 5, 1995, by and between Advanced RISC Machines Limited and MagnaChip Semiconductor, Ltd. (Korea) (successor in interest to LG Semicon Company Limited) (incorporated by reference to Exhibit 10.12 to Amendment No. 2 to MagnaChip Semiconductor S.A.’s and MagnaChip Semiconductor Finance Company’s Registration Statement on Form S-4 (Registration No. 333-168516) filed on October 14, 2010). | |
| 10.12(1) | Technology License Agreement, dated as of July 2001, by and between ARM Limited and MagnaChip Semiconductor, Ltd. (Korea) (successor in interest to Hynix Semiconductor Inc.) (incorporated by reference to Exhibit 10.13 to our Registration Statement on Form S-1 filed on March 15, 2010 (Registration No. 333-165467)). | |
| 10.13(1) | Technology License Agreement, dated as of August 22, 2001, by and between ARM Limited and MagnaChip Semiconductor, Ltd. (Korea) (successor in interest to Hynix Semiconductor Inc.) (incorporated by reference to Exhibit 10.14 to our Registration Statement on Form S-1 filed on March 15, 2010 (Registration No. 333-165467)). | |
| 10.14 | Technology License Agreement, dated as of May 20, 2004, by and between ARM Limited and MagnaChip Semiconductor, Ltd. (Korea) (successor in interest to Hynix Semiconductor Inc.) (incorporated by reference to Exhibit 10.15 to our Registration Statement on Form S-1 filed on March 15, 2010 (Registration No. 333-165467)). | |
| 10.15(1) | Design Migration Agreement, dated as of May 1, 2007, by and between ARM Limited and MagnaChip Semiconductor, Ltd. (Korea) (incorporated by reference to Exhibit 10.16 to Amendment No. 2 to MagnaChip Semiconductor S.A.’s and MagnaChip Semiconductor Finance Company’s Registration Statement on Form S-4 (Registration No. 333-168516) filed on October 14, 2010). | |
| 10.16 | Basic Contract on Joint Development and Grant of License, dated as of November 10, 2006, by and between MagnaChip Semiconductor, Ltd. and Silicon Works Co., Ltd. (English translation) (incorporated by reference to Exhibit 10.17 to our Registration Statement on Form S-1 filed on March 15, 2010 (Registration No. 333-165467)). | |
135
Table of Contents
Index to Financial Statements
| Exhibit |
Exhibit Description | |
| 10.17 | Master Service Agreement, dated as of December 27, 2000 by and between Sharp Corporation and MagnaChip Semiconductor, Ltd. (Korea) (successor in interest to Hyundai Electronics Japan Co., Ltd) (English translation) (incorporated by reference to Exhibit 10.18 to our Amendment No. 1 to Registration Statement on Form S-1 filed on April 20, 2010 (Registration No. 333-165467)). | |
| 10.18 | Warrant Agreement, dated as of November 9, 2009, between MagnaChip Semiconductor LLC and American Stock Transfer & Trust Company, LLC (incorporated by reference to Exhibit 10.19 to our Registration Statement on Form S-1 filed on March 15, 2010 (Registration No. 333-165467)). | |
| 10.19* | MagnaChip Semiconductor LLC 2009 Common Unit Plan (incorporated by reference to Exhibit 10.20 to our Registration Statement on Form S-1 filed on March 15, 2010 (Registration No. 333-165467)). | |
| 10.20* | MagnaChip Semiconductor LLC 2009 Common Unit Plan form of Option Agreement (Non-U.S. Participants) (incorporated by reference to Exhibit 10.21 to our Registration Statement on Form S-1 filed on March 15, 2010 (Registration No. 333-165467)). | |
| 10.21* | MagnaChip Semiconductor LLC 2009 Common Unit Plan form of Option Agreement (U.S. Participants) (incorporated by reference to Exhibit 10.22 to our Registration Statement on Form S-1 filed on March 15, 2010 (Registration No. 333-165467)). | |
| 10.22* | MagnaChip Semiconductor LLC 2009 Common Unit Plan form of Restricted Unit Agreement (Non-U.S. Participants). Incorporated by reference to Exhibit 10.23 to our Registration Statement on Form S-1 filed on March 15, 2010 (Registration No. 333-165467). | |
| 10.23* | MagnaChip Semiconductor LLC 2009 Common Unit Plan form of Restricted Unit Agreement (U.S. Participants) (incorporated by reference to Exhibit 10.24 to our Registration Statement on Form S-1 filed on March 15, 2010 (Registration No. 333-165467)). | |
| 10.24* | MagnaChip Semiconductor Corporation 2011 Equity Incentive Plan (incorporated by reference to Exhibit 10.25 to our Amendment No 9 to the Registration Statement on Form S-1 filed on February 18, 2011 (Registration No. 333-165467)). | |
| 10.25* | MagnaChip Semiconductor Corporation 2011 Employee Stock Purchase Plan (incorporated by reference to Exhibit 10.26 to our Amendment No 9 to the Registration Statement on Form S-1 filed on February 18, 2011 (Registration No. 333-165467)). | |
| 10.26* | Amended and Restated Service Agreement, dated as of May 8, 2008, by and between MagnaChip Semiconductor, Ltd. (Korea) and Sang Park (incorporated by reference to Exhibit 10.27 to our Amendment No. 1 to Registration Statement on Form S-1 filed on April 20, 2010 (Registration No. 333-165467)). | |
| 10.27* | Separation Agreement, effective July 31, 2014, by and between MagnaChip Semiconductor, Ltd. (Korea) and Sang Park (incorporated by reference to Exhibit 10.27 to our Annual Report on Form 10-K filed on February 12, 2015). | |
| 10.28* | Entrustment Agreement, dated as of October 6, 2004, by and between MagnaChip Semiconductor, Ltd. (Korea) and Tae Young Hwang (incorporated by reference to Exhibit 10.30 to our Amendment No. 1 to Registration Statement on Form S-1 filed on April 20, 2010 (Registration No. 333-165467)). | |
| 10.28-1*# | Advisory Services and Separation Agreement, dated April 30, 2015, by and between MagnaChip Semiconductor, Ltd. (Korea) and Tae Young Hwang. | |
| 10.29* | Offer Letter dated March 7, 2006, from MagnaChip Semiconductor LLC and MagnaChip Semiconductor, Inc. to Brent Rowe, as supplemented on December 20, 2006 (incorporated by reference to Exhibit 10.33 to our Registration Statement on Form S-1 filed on March 15, 2010 (Registration No. 333-165467)). | |
| 10.29-1*# | Advisory Services and Separation Agreement, effective May 28, 2015, by and between MagnaChip Semiconductor, Inc. and Brent Rowe. | |
| 10.30* | Offer Letter dated September 5, 2006, from MagnaChip Semiconductor LLC and MagnaChip Semiconductor, Ltd. to Margaret Sakai (incorporated by reference to Exhibit 10.36 to our Registration Statement on Form S-1 filed on March 15, 2010 (Registration No. 333-165467)). | |
| 10.31* | Separation Agreement, effective April 12, 2014, by and between MagnaChip Semiconductor, Ltd. (Korea) and Margaret Sakai (incorporated by reference to Exhibit 10.31 to our Annual Report on Form 10-K filed on February 12, 2015). | |
| 10.32* | Offer Letter, dated as of July 1, 2007, by and between MagnaChip Semiconductor, Ltd. (Korea) and Heung Kyu Kim (incorporated by reference to Exhibit 10.39 to our Registration Statement on Form S-1 filed on March 15, 2010 (Registration No. 333-165467)). | |
| 10.33* | Offer Letter, dated as of June 20, 2007, by and between MagnaChip Semiconductor, Ltd. (Korea) and Tae Jong Lee (incorporated by reference to Exhibit 10.42 to our Registration Statement on Form S-1 filed on March 15, 2010 (Registration No. 333-165467)). | |
136
Table of Contents
Index to Financial Statements
| Exhibit |
Exhibit Description | |
| 10.34* | MagnaChip Semiconductor Corporation Form of Indemnification Agreement with Directors and Officers (incorporated by reference to Exhibit 10.49 to our Registration Statement on Form S-1 filed on March 15, 2010 (Registration No. 333-165467)). | |
| 10.35* | Offer Letter, dated as of March 8, 2014, by and between MagnaChip Semiconductor, Ltd. (Korea) and Jonathan W. Kim (incorporated by reference to Exhibit 10.35 to our Annual Report on Form 10-K filed on February 12, 2015). | |
| 10.36* | Offer Letter, dated as of April 15, 2013, by and between MagnaChip Semiconductor, Ltd. (Korea) and Young-Joon Kim (incorporated by reference to Exhibit 10.36 to our Annual Report on Form 10-K filed on February 12, 2015). | |
| 10.37* | Offer Letter, dated as of September 27, 2013, by and between MagnaChip Semiconductor, Ltd. (Korea) and Theodore Kim (incorporated by reference to Exhibit 10.37 to our Annual Report on Form 10-K filed on February 12, 2015). | |
| 10.38* | MagnaChip Semiconductor LLC Profit Sharing Plan as adopted on December 31, 2009 and amended on February 15, 2010 (incorporated by reference to Exhibit 10.54 to our Quarterly Report on Form 10-Q filed on August 5, 2011). | |
| 10.39* | MagnaChip Semiconductor Corporation 2011 Form of Stock Option Agreement (U.S. Participants) (incorporated by reference to Exhibit 10.55 to our Amendment No 9 to the Registration Statement on Form S-1 filed on February 18, 2011 (Registration No. 333-165467)). | |
| 10.40* | MagnaChip Semiconductor Corporation 2011 Form of Stock Option Agreement (Non-U.S. Participants) (incorporated by reference to Exhibit 10.56 to our Amendment No 9 to the Registration Statement on Form S-1 filed on February 18, 2011 (Registration No. 333-165467)). | |
| 10.41* | MagnaChip Semiconductor Corporation 2011 Form of Restricted Stock Units Agreement (U.S. Participants) (incorporated by reference to Exhibit 10.57 to our Amendment No 9 to the Registration Statement on Form S-1 filed on February 18, 2011 (Registration No. 333-165467)). | |
| 10.42* | MagnaChip Semiconductor Corporation 2011 Form of Restricted Stock Units Agreement (Non-U.S. Participants) (incorporated by reference to Exhibit 10.58 to our Amendment No 9 to the Registration Statement on Form S-1 filed on February 18, 2011 (Registration No. 333-165467)). | |
| 10.43* | MagnaChip Semiconductor Corporation 2011 Form of Restricted Stock Agreement (U.S. Participants) (incorporated by reference to Exhibit 10.59 to our Amendment No 9 to the Registration Statement on Form S-1 filed on February 18, 2011 (Registration No. 333-165467)). | |
| 10.44* | MagnaChip Semiconductor Corporation 2011 Form of Restricted Stock Agreement (Non-U.S. Participants) (incorporated by reference to Exhibit 10.60 to our Amendment No 9 to the Registration Statement on Form S-1 filed on February 18, 2011 (Registration No. 333-165467)). | |
| 10.45 | Amendment No. 1 to Warrant Agreement, dated as of February 16, 2012, between MagnaChip Semiconductor Corporation and American Stock Transfer & Trust Company, LLC (incorporated by reference to Exhibit 10.61 to our Annual Report on Form 10-K filed on March 8, 2012). | |
| 10.46 | Exchange and Registration Rights Agreement, dated as of July 18, 2013, between MagnaChip Semiconductor Corporation and Barclays Capital Inc., as representative for the initial purchasers (incorporated by reference to Exhibit 10.1 to our Current Report on Form 8-K filed on July 18, 2013). | |
| 12.1# | Statement Regarding Computation of Ratio of Earnings to Fixed Charges | |
| 21.1 | Subsidiaries of the Registrant (incorporated by reference to Exhibit 21.1 to our Annual Report on Form 10-K filed on February 12, 2015) | |
| 23.1# | Consent of Samil PricewaterhouseCoopers | |
| 31.1# | Certification of Chief Executive Officer required by Rule 13(a)-14(a), as adopted pursuant to § 302 of the Sarbanes-Oxley Act of 2002 | |
| 31.2# | Certification of Chief Financial Officer required by Rule 13(a)-14(a), as adopted pursuant to § 302 of the Sarbanes-Oxley Act of 2002 | |
| 32.1† | Certification of Chief Executive Officer required by 18 U.S.C. § 1350, as adopted pursuant to § 906 of the Sarbanes-Oxley Act of 2002 | |
| 32.2† | Certification of Chief Financial Officer required by 18 U.S.C. § 1350, as adopted pursuant to § 906 of the Sarbanes-Oxley Act of 2002 | |
137
Table of Contents
Index to Financial Statements
| 101.INS# | XBRL Instance Document | |
| 101.SCH# | XBRL Taxonomy Extension Schema Document | |
| 101.CAL# | XBRL Taxonomy Extension Calculation Linkbase Document | |
| 101.DEF# | XBRL Taxonomy Extension Definition Linkbase Document | |
| 101.LAB# | XBRL Taxonomy Extension Label Linkbase Document | |
| 101.PRE# | XBRL Taxonomy Extension Presentation Linkbase Document | |
Footnotes:
| (1) | Certain portions of this document have been omitted pursuant to a grant of confidential treatment by the SEC. |
| * | Management contract, compensatory plan or arrangement |
| # | Filed herewith |
| † | Furnished herewith |
138
Table of Contents
Index to Financial Statements
Pursuant to the requirements of Section 13 or 15(d) of the Securities Exchange Act of 1934, the registrant has duly caused this Report to be signed on its behalf by the undersigned, thereunto duly authorized.
MAGNACHIP SEMICONDUCTOR CORPORATION
| By: | /s/ Young-Joon Kim | |||
| Name: | Young-Joon Kim | |||
| Title: | Chief Executive Officer and Director | |||
| Date: | May 28, 2015 |
Pursuant to the requirements of the Securities Exchange Act of 1934, this report has been signed below by the following persons on behalf of the registrant and in the capacities and on the dates indicated.
| Date | ||
| /s/ Young-Joon Kim |
May 28, 2015 | |
| Young-Joon Kim, Chief Executive Officer and Director (Principal Executive Officer) | ||
| /s/ Jonathan W. Kim |
May 28, 2015 | |
| Jonathan W. Kim, Chief Financial Officer, Executive Vice President and Chief Accounting Officer (Principal Financial and Accounting Officer) | ||
| /s/ Michael Elkins |
May 28, 2015 | |
| Michael Elkins, Director | ||
| /s/ Randal Klein |
May 28, 2015 | |
| Randal Klein, Director | ||
| /s/ Ilbok Lee |
May 28, 2015 | |
| Ilbok Lee, Director | ||
| /s/ Brian Mulhern |
May 28, 2015 | |
| Brian Mulhern, Director | ||
| /s/ Douglas Norby |
May 28, 2015 | |
| R. Douglas Norby, Non- Executive Chairman of the Board of Directors | ||
| /s/ Nader Tavakoli |
May 28, 2015 | |
| Nader Tavakoli, Director | ||
139
Table of Contents
Index to Financial Statements
| Exhibit |
Exhibit Description | |
| 2.1 | Second Amended Chapter 11 Plan of Reorganization Proposed by the Official Committee of Unsecured Creditors of MagnaChip Semiconductor Finance Company, et al., dated as of September 24, 2009 (incorporated by reference to Exhibit 2.1 to our Amendment No. 1 to Registration Statement on Form S-1 filed on April 20, 2010 (Registration No. 333-165467)). | |
| 3.1 | Certificate of Conversion of MagnaChip Semiconductor LLC (incorporated by reference to Exhibit 3.1 to our Current Report on Form 8-K filed on March 11, 2011). | |
| 3.2 | Certificate of Incorporation of MagnaChip Semiconductor Corporation (incorporated by reference to Exhibit 3.2 to our Current Report on Form 8-K filed on March 11, 2011). | |
| 3.3 | Bylaws of MagnaChip Semiconductor Corporation (incorporated by reference to Exhibit 3.3 to our Current Report on Form 8-K filed on March 11, 2011). | |
| 3.4 | Form of Plan of Conversion of MagnaChip Semiconductor LLC (incorporated by reference to Exhibit 3.6 to our Amendment No. 2 to Registration Statement on Form S-1 filed on May 11, 2010 (Registration No. 333-165467)). | |
| 3.5 | Certificate of Designation, Preferences and Rights of Series A Junior Participating Preferred Stock of MagnaChip Semiconductor Corporation, as filed with the Secretary of the State of Delaware on March 6, 2015 (incorporated by reference to Exhibit 3.1 to our Current Report on Form 8-K filed on March 6, 2015). | |
| 4.1 | Rights Agreement, dated as of March 5, 2015, between MagnaChip Semiconductor Corporation and American Stock Transfer & Trust Company, LLC, which includes as Exhibits thereto the Form of Certificate of Designation, the Form of Right Certificate and the Summary of Terms attached thereto as Exhibits A, B and C, respectively (incorporated by reference to Exhibit 4.1 to our Current Report on Form 8-K filed on March 6, 2015). | |
| 4.2 | Registration Rights Agreement, dated as of November 9, 2009, by and among MagnaChip Semiconductor LLC and each of the securityholders named therein (incorporated by reference to Exhibit 4.1 to our Amendment No. 1 to Registration Statement on Form S-1 filed on April 20, 2010 (Registration No. 333-165467)). | |
| 4.3 | Indenture, dated as of July 18, 2013, between MagnaChip Semiconductor Corporation, as issuer, and Wilmington Trust, National Association, as trustee (incorporated by reference to Exhibit 4.1 to our Current Report on Form 8-K filed on July 18, 2013). | |
| 4.4 | First Supplemental Indenture, dated as of March 27, 2014, to Indenture, dated as of July 18, 2013, between MagnaChip Semiconductor Corporation, as issuer, and Wilmington Trust, National Association, as trustee (incorporated by reference to Exhibit 4.2 to our Current Report on Form 8-K filed on June 25, 2014). | |
| 4.5 | Form of 6.625% Senior Notes due 2021 and notation of guarantee (included in Exhibit 4.2) | |
| 10.1 | Intellectual Property License Agreement, dated as of October 6, 2004, by and between Hynix Semiconductor Inc. and MagnaChip Semiconductor, Ltd. (Korea) (incorporated by reference to Exhibit 10.2 to our Amendment No. 1 to Registration Statement on Form S-1 filed on April 20, 2010 (Registration No. 333-165467)). | |
| 10.2(1) | Land Lease and Easement Agreement, dated as of October 6, 2004, by and between Hynix Semiconductor Inc. and MagnaChip Semiconductor, Ltd. (Korea) (incorporated by reference to Exhibit 10.3 to our Amendment No. 1 to Registration Statement on Form S-1 filed on April 20, 2010 (Registration No. 333-165467)). | |
| 10.3 | First Amendment to Land Lease and Easement Agreement, dated as of December 30, 2005, by and between Hynix Semiconductor Inc. and MagnaChip Semiconductor, Ltd. (Korea) (incorporated by reference to Exhibit 10.4 to our Amendment No. 1 to Registration Statement on Form S-1 filed on April 20, 2010 (Registration No. 333-165467)). | |
| 10.4(1) | General Service Supply Agreement, dated as of October 6, 2004, by and between Hynix Semiconductor Inc. and MagnaChip Semiconductor, Ltd. (Korea) (incorporated by reference to Exhibit 10.5 to Amendment No. 2 to MagnaChip Semiconductor S.A.’s and MagnaChip Semiconductor Finance Company’s Registration Statement on Form S-4 (Registration No. 333-168516) filed on October 14, 2010). | |
| 10.5 | First Amendment to the General Service Supply Agreement, dated as of December 30, 2005, by and between Hynix Semiconductor Inc. and MagnaChip Semiconductor, Ltd. (Korea) (incorporated by reference to Exhibit 10.6 to our Amendment No. 1 to Registration Statement on Form S-1 filed on April 20, 2010 (Registration No. 333-165467)). | |
| 10.6(1) | License Agreement (ModularBCD), dated as of March 18, 2005, by and between Advanced Analogic Technologies, Inc. and MagnaChip Semiconductor, Ltd. (Korea) (incorporated by reference to Exhibit 10.7 to our Registration Statement on Form S-1 filed on March 15, 2010 (Registration No. 333-165467)). | |
A-1
Table of Contents
Index to Financial Statements
| Exhibit |
Exhibit Description | |
| 10.7(1) | Amended & Restated License Agreement (TrenchDMOS), dated as of September 19, 2007, by and between Advanced Analogic Technologies, Inc. and MagnaChip Semiconductor, Ltd. (Korea) (incorporated by reference to Exhibit 10.8 to Amendment No. 2 to MagnaChip Semiconductor S.A.’s and MagnaChip Semiconductor Finance Company’s Registration Statement on Form S-4 (Registration No. 333-168516) filed on October 14, 2010). | |
| 10.8(1) | Technology License Agreement, dated as of December 16, 1996, by and between Advanced RISC Machines Limited and MagnaChip Semiconductor, Ltd. (Korea) (successor in interest to LG Semicon Company Limited) (incorporated by reference to Exhibit 10.9 to our Registration Statement on Form S-1 filed on March 15, 2010 (Registration No. 333-165467)). | |
| 10.9(1) | Amendment to the Technology License Agreement, dated as of October 16, 2006, by and between ARM Limited and MagnaChip Semiconductor, Ltd. (Korea) (incorporated by reference to Exhibit 10.10 to Amendment No. 2 to MagnaChip Semiconductor S.A.’s and MagnaChip Semiconductor Finance Company’s Registration Statement on Form S-4 (Registration No. 333-168516) filed on October 14, 2010). | |
| 10.10(1) | ARM7201TDSP Device License Agreement, dated as of August 26, 1997, by and between Advanced RISC Machines Limited and MagnaChip Semiconductor, Ltd. (Korea) (successor in interest to LG Semicon Company Limited) (incorporated by reference to Exhibit 10.11 to our Registration Statement on Form S-1 filed on March 15, 2010 (Registration No. 333-165467)). | |
| 10.11(1) | Technology License Agreement, dated as of October 5, 1995, by and between Advanced RISC Machines Limited and MagnaChip Semiconductor, Ltd. (Korea) (successor in interest to LG Semicon Company Limited) (incorporated by reference to Exhibit 10.12 to Amendment No. 2 to MagnaChip Semiconductor S.A.’s and MagnaChip Semiconductor Finance Company’s Registration Statement on Form S-4 (Registration No. 333-168516) filed on October 14, 2010). | |
| 10.12(1) | Technology License Agreement, dated as of July 2001, by and between ARM Limited and MagnaChip Semiconductor, Ltd. (Korea) (successor in interest to Hynix Semiconductor Inc.) (incorporated by reference to Exhibit 10.13 to our Registration Statement on Form S-1 filed on March 15, 2010 (Registration No. 333-165467)). | |
| 10.13(1) | Technology License Agreement, dated as of August 22, 2001, by and between ARM Limited and MagnaChip Semiconductor, Ltd. (Korea) (successor in interest to Hynix Semiconductor Inc.) (incorporated by reference to Exhibit 10.14 to our Registration Statement on Form S-1 filed on March 15, 2010 (Registration No. 333-165467)). | |
| 10.14 | Technology License Agreement, dated as of May 20, 2004, by and between ARM Limited and MagnaChip Semiconductor, Ltd. (Korea) (successor in interest to Hynix Semiconductor Inc.) (incorporated by reference to Exhibit 10.15 to our Registration Statement on Form S-1 filed on March 15, 2010 (Registration No. 333-165467)). | |
| 10.15(1) | Design Migration Agreement, dated as of May 1, 2007, by and between ARM Limited and MagnaChip Semiconductor, Ltd. (Korea) (incorporated by reference to Exhibit 10.16 to Amendment No. 2 to MagnaChip Semiconductor S.A.’s and MagnaChip Semiconductor Finance Company’s Registration Statement on Form S-4 (Registration No. 333-168516) filed on October 14, 2010). | |
| 10.16 | Basic Contract on Joint Development and Grant of License, dated as of November 10, 2006, by and between MagnaChip Semiconductor, Ltd. and Silicon Works Co., Ltd. (English translation) (incorporated by reference to Exhibit 10.17 to our Registration Statement on Form S-1 filed on March 15, 2010 (Registration No. 333-165467)). | |
| 10.17 | Master Service Agreement, dated as of December 27, 2000 by and between Sharp Corporation and MagnaChip Semiconductor, Ltd. (Korea) (successor in interest to Hyundai Electronics Japan Co., Ltd) (English translation) (incorporated by reference to Exhibit 10.18 to our Amendment No. 1 to Registration Statement on Form S-1 filed on April 20, 2010 (Registration No. 333-165467)). | |
| 10.18 | Warrant Agreement, dated as of November 9, 2009, between MagnaChip Semiconductor LLC and American Stock Transfer & Trust Company, LLC (incorporated by reference to Exhibit 10.19 to our Registration Statement on Form S-1 filed on March 15, 2010 (Registration No. 333-165467)). | |
| 10.19* | MagnaChip Semiconductor LLC 2009 Common Unit Plan (incorporated by reference to Exhibit 10.20 to our Registration Statement on Form S-1 filed on March 15, 2010 (Registration No. 333-165467)). | |
| 10.20* | MagnaChip Semiconductor LLC 2009 Common Unit Plan form of Option Agreement (Non-U.S. Participants) (incorporated by reference to Exhibit 10.21 to our Registration Statement on Form S-1 filed on March 15, 2010 (Registration No. 333-165467)). | |
| 10.21* | MagnaChip Semiconductor LLC 2009 Common Unit Plan form of Option Agreement (U.S. Participants) (incorporated by reference to Exhibit 10.22 to our Registration Statement on Form S-1 filed on March 15, 2010 (Registration No. 333-165467)). | |
A-2
Table of Contents
Index to Financial Statements
| Exhibit |
Exhibit Description | |
| 10.22* | MagnaChip Semiconductor LLC 2009 Common Unit Plan form of Restricted Unit Agreement (Non-U.S. Participants). Incorporated by reference to Exhibit 10.23 to our Registration Statement on Form S-1 filed on March 15, 2010 (Registration No. 333-165467). | |
| 10.23* | MagnaChip Semiconductor LLC 2009 Common Unit Plan form of Restricted Unit Agreement (U.S. Participants) (incorporated by reference to Exhibit 10.24 to our Registration Statement on Form S-1 filed on March 15, 2010 (Registration No. 333-165467)). | |
| 10.24* | MagnaChip Semiconductor Corporation 2011 Equity Incentive Plan (incorporated by reference to Exhibit 10.25 to our Amendment No 9 to the Registration Statement on Form S-1 filed on February 18, 2011 (Registration No. 333-165467)). | |
| 10.25* | MagnaChip Semiconductor Corporation 2011 Employee Stock Purchase Plan (incorporated by reference to Exhibit 10.26 to our Amendment No 9 to the Registration Statement on Form S-1 filed on February 18, 2011 (Registration No. 333-165467)). | |
| 10.26* | Amended and Restated Service Agreement, dated as of May 8, 2008, by and between MagnaChip Semiconductor, Ltd. (Korea) and Sang Park (incorporated by reference to Exhibit 10.27 to our Amendment No. 1 to Registration Statement on Form S-1 filed on April 20, 2010 (Registration No. 333-165467)). | |
| 10.27* | Separation Agreement, effective July 31, 2014, by and between MagnaChip Semiconductor, Ltd. (Korea) and Sang Park (incorporated by reference to Exhibit 10.27 to our Annual Report on Form 10-K filed on February 12, 2015). | |
| 10.28* | Entrustment Agreement, dated as of October 6, 2004, by and between MagnaChip Semiconductor, Ltd. (Korea) and Tae Young Hwang (incorporated by reference to Exhibit 10.30 to our Amendment No. 1 to Registration Statement on Form S-1 filed on April 20, 2010 (Registration No. 333-165467)). | |
| 10.28-1*# | Advisory Services and Separation Agreement, dated April 30, 2015, by and between MagnaChip Semiconductor, Ltd. (Korea) and Tae Young Hwang. | |
| 10.29* | Offer Letter dated March 7, 2006, from MagnaChip Semiconductor LLC and MagnaChip Semiconductor, Inc. to Brent Rowe, as supplemented on December 20, 2006 (incorporated by reference to Exhibit 10.33 to our Registration Statement on Form S-1 filed on March 15, 2010 (Registration No. 333-165467)). | |
| 10.29-1*# | Advisory Services and Separation Agreement, effective May 28, 2015, by and between MagnaChip Semiconductor, Inc. and Brent Rowe. | |
| 10.30* | Offer Letter dated September 5, 2006, from MagnaChip Semiconductor LLC and MagnaChip Semiconductor, Ltd. to Margaret Sakai (incorporated by reference to Exhibit 10.36 to our Registration Statement on Form S-1 filed on March 15, 2010 (Registration No. 333-165467)). | |
| 10.31* | Separation Agreement, effective April 12, 2014, by and between MagnaChip Semiconductor, Ltd. (Korea) and Margaret Sakai (incorporated by reference to Exhibit 10.31 to our Annual Report on Form 10-K filed on February 12, 2015). | |
| 10.32* | Offer Letter, dated as of July 1, 2007, by and between MagnaChip Semiconductor, Ltd. (Korea) and Heung Kyu Kim (incorporated by reference to Exhibit 10.39 to our Registration Statement on Form S-1 filed on March 15, 2010 (Registration No. 333-165467)). | |
| 10.33* | Offer Letter, dated as of June 20, 2007, by and between MagnaChip Semiconductor, Ltd. (Korea) and Tae Jong Lee (incorporated by reference to Exhibit 10.42 to our Registration Statement on Form S-1 filed on March 15, 2010 (Registration No. 333-165467)). | |
| 10.34* | MagnaChip Semiconductor Corporation Form of Indemnification Agreement with Directors and Officers (incorporated by reference to Exhibit 10.49 to our Registration Statement on Form S-1 filed on March 15, 2010 (Registration No. 333-165467)). | |
| 10.35* | Offer Letter, dated as of March 8, 2014, by and between MagnaChip Semiconductor, Ltd. (Korea) and Jonathan W. Kim (incorporated by reference to Exhibit 10.35 to our Annual Report on Form 10-K filed on February 12, 2015). | |
| 10.36* | Offer Letter, dated as of April 15, 2013, by and between MagnaChip Semiconductor, Ltd. (Korea) and Young-Joon Kim (incorporated by reference to Exhibit 10.36 to our Annual Report on Form 10-K filed on February 12, 2015). | |
| 10.37* | Offer Letter, dated as of September 27, 2013, by and between MagnaChip Semiconductor, Ltd. (Korea) and Theodore Kim (incorporated by reference to Exhibit 10.37 to our Annual Report on Form 10-K filed on February 12, 2015). | |
A-3
Table of Contents
Index to Financial Statements
| Exhibit No. |
Exhibit Description | |
| 10.38* | MagnaChip Semiconductor LLC Profit Sharing Plan as adopted on December 31, 2009 and amended on February 15, 2010 (incorporated by reference to Exhibit 10.54 to our Quarterly Report on Form 10-Q filed on August 5, 2011). | |
| 10.39* | MagnaChip Semiconductor Corporation 2011 Form of Stock Option Agreement (U.S. Participants) (incorporated by reference to Exhibit 10.55 to our Amendment No 9 to the Registration Statement on Form S-1 filed on February 18, 2011 (Registration No. 333-165467)). | |
| 10.40* | MagnaChip Semiconductor Corporation 2011 Form of Stock Option Agreement (Non-U.S. Participants) (incorporated by reference to Exhibit 10.56 to our Amendment No 9 to the Registration Statement on Form S-1 filed on February 18, 2011 (Registration No. 333-165467)). | |
| 10.41* | MagnaChip Semiconductor Corporation 2011 Form of Restricted Stock Units Agreement (U.S. Participants) (incorporated by reference to Exhibit 10.57 to our Amendment No 9 to the Registration Statement on Form S-1 filed on February 18, 2011 (Registration No. 333-165467)). | |
| 10.42* | MagnaChip Semiconductor Corporation 2011 Form of Restricted Stock Units Agreement (Non-U.S. Participants) (incorporated by reference to Exhibit 10.58 to our Amendment No 9 to the Registration Statement on Form S-1 filed on February 18, 2011 (Registration No. 333-165467)). | |
| 10.43* | MagnaChip Semiconductor Corporation 2011 Form of Restricted Stock Agreement (U.S. Participants) (incorporated by reference to Exhibit 10.59 to our Amendment No 9 to the Registration Statement on Form S-1 filed on February 18, 2011 (Registration No. 333-165467)). | |
| 10.44* | MagnaChip Semiconductor Corporation 2011 Form of Restricted Stock Agreement (Non-U.S. Participants) (incorporated by reference to Exhibit 10.60 to our Amendment No 9 to the Registration Statement on Form S-1 filed on February 18, 2011 (Registration No. 333-165467)). | |
| 10.45 | Amendment No. 1 to Warrant Agreement, dated as of February 16, 2012, between MagnaChip Semiconductor Corporation and American Stock Transfer & Trust Company, LLC (incorporated by reference to Exhibit 10.61 to our Annual Report on Form 10-K filed on March 8, 2012). | |
| 10.46 | Exchange and Registration Rights Agreement, dated as of July 18, 2013, between MagnaChip Semiconductor Corporation and Barclays Capital Inc., as representative for the initial purchasers (incorporated by reference to Exhibit 10.1 to our Current Report on Form 8-K filed on July 18, 2013). | |
| 12.1# | Statement Regarding Computation of Ratio of Earnings to Fixed Charges | |
| 21.1 | Subsidiaries of the Registrant (incorporated by reference to Exhibit 21.1 to our Annual Report on Form 10-K filed on February 12, 2015) | |
| 23.1# | Consent of Samil PricewaterhouseCoopers | |
| 31.1# | Certification of Chief Executive Officer required by Rule 13(a)-14(a), as adopted pursuant to § 302 of the Sarbanes-Oxley Act of 2002 | |
| 31.2# | Certification of Chief Financial Officer required by Rule 13(a)-14(a), as adopted pursuant to § 302 of the Sarbanes-Oxley Act of 2002 | |
| 32.1† | Certification of Chief Executive Officer required by 18 U.S.C. § 1350, as adopted pursuant to § 906 of the Sarbanes-Oxley Act of 2002 | |
| 32.2† | Certification of Chief Financial Officer required by 18 U.S.C. § 1350, as adopted pursuant to § 906 of the Sarbanes-Oxley Act of 2002 | |
| 101.INS# | XBRL Instance Document | |
| 101.SCH# | XBRL Taxonomy Extension Schema Document | |
| 101.CAL# | XBRL Taxonomy Extension Calculation Linkbase Document | |
| 101.DEF# | XBRL Taxonomy Extension Definition Linkbase Document | |
| 101.LAB# | XBRL Taxonomy Extension Label Linkbase Document | |
| 101.PRE# | XBRL Taxonomy Extension Presentation Linkbase Document | |
A-4
Table of Contents
Index to Financial Statements
Footnotes:
| (1) | Certain portions of this document have been omitted pursuant to a grant of confidential treatment by the SEC. |
| * | Management contract, compensatory plan or arrangement |
| # | Filed herewith |
| † | Furnished herewith |
A-5