Attached files
| file | filename |
|---|---|
| EX-32 - EXHIBIT 32 - MICROCHIP TECHNOLOGY INC | exhibit32.htm |
| EX-31.2 - EXHIBIT 31.2 - MICROCHIP TECHNOLOGY INC | exhibit312.htm |
| EX-21.1 - EXHIBIT 21.1 - MICROCHIP TECHNOLOGY INC | exhibit211.htm |
| EX-23.1 - EXHIBIT 23.1 - MICROCHIP TECHNOLOGY INC | exhibit231consent.htm |
| EX-10.1 - EXHIBIT 10.1 - MICROCHIP TECHNOLOGY INC | exhibit101masterincreasing.htm |
| EXCEL - IDEA: XBRL DOCUMENT - MICROCHIP TECHNOLOGY INC | Financial_Report.xls |
| EX-31.1 - EXHIBIT 31.1 - MICROCHIP TECHNOLOGY INC | exhibit311.htm |
UNITED STATES
SECURITIES AND EXCHANGE COMMISSION
Washington, D.C. 20549
FORM 10-K
(Mark One)
x | Annual Report pursuant to Section 13 or 15(d) of the Securities Exchange Act of 1934 For the fiscal year ended March 31, 2015 |
OR
o | Transition report pursuant to Section 13 or 15(d) of the Securities Exchange Act of 1934 For the transition period from _________ to __________ |
Commission File Number: 0-21184

MICROCHIP TECHNOLOGY INCORPORATED
(Exact Name of Registrant as Specified in Its Charter)
Delaware | 86-0629024 | |
(State or Other Jurisdiction of Incorporation or Organization) | (IRS Employer Identification No.) | |
2355 W. Chandler Blvd., Chandler, AZ 85224-6199
(Address of Principal Executive Offices, Including Zip Code)
(480) 792-7200
(Registrant's Telephone Number, Including Area Code)
Securities registered pursuant to Section 12(b) of the Act:
Title of Each Class | Name of Each Exchange on Which Registered | |
Common Stock, $0.001 Par Value Per Share | NASDAQ® Global Market | |
Securities registered pursuant to Section 12(g) of the Act: None
Indicate by check mark if the Registrant is a well-known seasoned issuer, as defined in Rule 405 of the Securities Act. x Yes ¨ No
Indicate by check mark if the Registrant is not required to file reports pursuant to Section 13 or Section 15(d) of the Act. o Yes x No
Indicate by checkmark whether the Registrant: (1) has filed all reports required to be filed by Section 13 or 15(d) of the Securities Exchange Act of 1934 during the preceding 12 months (or for such shorter period that the registrant was required to file such reports), and (2) has been subject to such filing requirements for the past 90 days: x Yes o No
Indicate by check mark whether the registrant has submitted electronically and posted on its corporate Website, if any, every Interactive Data File required to be submitted and posted pursuant to Rule 405 of Regulation S-T (§229.405 of this chapter) during the preceding 12 months (or for such shorter period that the registrant was required to submit and post such files). x Yes o No
Indicate by check mark if disclosure of delinquent filers pursuant to Item 405 of Regulation S-K (§232.405 of this chapter) is not contained herein, and will not be contained, to the best of registrant's knowledge, in definitive proxy or information statements incorporated by reference in Part III of Form 10-K or any amendment to this Form 10-K. o
Indicate by check mark whether the registrant is a large accelerated filer, an accelerated filer, a non-accelerated filer, or a smaller reporting company. See definitions of "large accelerated filer," "accelerated filer" and "smaller reporting company" in Rule 12b-2 of the Exchange Act:
Large accelerated filer | x | Accelerated filer | o | Non-accelerated filer | o | Smaller reporting company | o |
(Do not check if a smaller reporting company)
Indicate by check mark whether the registrant is a shell company (as defined in Rule 12b-2 of the Exchange Act). o Yes x No
Aggregate market value of the voting and non-voting common equity held by non-affiliates as of September 30, 2014 based upon the closing price of the common stock as reported by the NASDAQ Global Market on such date was approximately $9,253,053,643.
Number of shares of Common Stock, $0.001 par value, outstanding as of May 20, 2015: 202,323,225 shares
Documents Incorporated by Reference | ||
Document | Part of Form 10-K | |
Proxy Statement for the 2015 Annual Meeting of Stockholders | III | |
MICROCHIP TECHNOLOGY INCORPORATED AND SUBSIDIARIES
FORM 10-K
TABLE OF CONTENTS
Page | ||
PART I | ||
PART II | ||
PART III | ||
PART IV | ||
2
PART I
This Form 10-K contains certain forward-looking statements that involve risks and uncertainties, including statements regarding our strategy and future financial performance and those statements identified under "Item 7 – Management's Discussion and Analysis of Financial Condition and Results of Operations – Note Regarding Forward-looking Statements." Our actual results could differ materially from the results described in these forward-looking statements as a result of certain factors including those set forth under "Item 1A – Risk Factors," beginning below at page 11, and elsewhere in this Form 10-K. Although we believe that the matters reflected in the forward-looking statements are reasonable, we cannot guarantee future results, levels of activity, performance or achievements. You should not place undue reliance on these forward-looking statements. We disclaim any obligation to update information contained in any forward-looking statement.
Item 1. BUSINESS
We develop, manufacture and sell specialized semiconductor products used by our customers for a wide variety of embedded control applications. Our product portfolio comprises general purpose and specialized 8-bit, 16-bit, and 32-bit microcontrollers, a broad spectrum of high-performance linear, mixed-signal, power management, thermal management, RF, safety, security, wired connectivity and wireless connectivity devices, as well as serial EEPROMs, Serial Flash memories, Parallel Flash memories and serial SRAM memories. We also license Flash-IP solutions that are incorporated in a broad range of products. Our synergistic product portfolio targets thousands of applications worldwide and a growing demand for high-performance designs in the automotive, communications, computing, consumer and industrial control markets. Our quality systems are ISO/TS16949 (2009 version) certified.
Microchip Technology Incorporated was incorporated in Delaware in 1989. In this Form 10-K, "we," "us," and "our" each refers to Microchip Technology Incorporated and its subsidiaries. Our executive offices are located at 2355 West Chandler Boulevard, Chandler, Arizona 85224-6199 and our telephone number is (480) 792-7200.
Our Internet address is www.microchip.com. We post the following filings on our website as soon as reasonably practicable after they are electronically filed with or furnished to the Securities and Exchange Commission:
• | our annual report on Form 10-K |
• | our quarterly reports on Form 10-Q |
• | our current reports on Form 8-K |
• | our proxy statement |
• | any amendments to the above-listed reports filed or furnished pursuant to Sections 13(a) or 15(d) of the Securities Exchange Act of 1934 |
All of our SEC filings on our website are available free of charge. The information on our website is not incorporated into this Form 10-K.
Recent Developments
On May 7, 2015, we announced that we had signed a definitive agreement to acquire Micrel, Incorporated (Micrel) for $14.00 per share. Micrel shareholders may elect to receive the purchase price in either cash or shares of our common stock. The acquisition price represents a total equity value of approximately $839 million, and a total enterprise value of approximately $744 million, after excluding Micrel's cash and investments on its balance sheet of approximately $95 million. The acquisition has been unanimously approved by the Boards of Directors of both companies and is expected to close early in the third quarter of calendar year 2015, subject to approval by Micrel's shareholders, regulatory approvals and other customary closing conditions.
On May 7, 2015, our Board of Directors authorized an increase to our existing share repurchase program to 20.0 million shares of common stock from the approximately 2.5 million shares remaining under the prior authorization.
3
Industry Background
Competitive pressures require manufacturers of a wide variety of products to expand product functionality and provide differentiation while maintaining or reducing cost. To address these requirements, manufacturers often use integrated circuit-based embedded control systems that enable them to:
• | differentiate their products |
• | replace less efficient electromechanical control devices |
• | reduce the number of components in their system |
• | add product functionality |
• | reduce the system level energy consumption |
• | decrease time to market for their products |
• | significantly reduce product cost |
Embedded control systems have been incorporated into thousands of products and subassemblies in a wide variety of applications and markets worldwide, including:
• | automotive comfort, safety, information and entertainment applications |
• | remote control devices, including garage door openers |
• | handheld tools |
• | large and small home appliances |
• | portable computers and accessories |
• | robotics |
• | energy monitoring |
• | thermostats |
• | motor controls |
• | security systems |
• | smoke and carbon monoxide detectors |
• | consumer electronics |
• | power supplies |
• | applications needing touch buttons, touch screens and graphical user interfaces |
• | medical instruments |
Embedded control systems typically incorporate a microcontroller as the principal active, and sometimes sole, component. A microcontroller is a self-contained computer-on-a-chip consisting of a central processing unit, often with on-board non-volatile program memory for program storage, random access memory for data storage and various analog and digital input/output peripheral capabilities. In addition to the microcontroller, a complete embedded control system incorporates application-specific software, various analog, mixed-signal and connectivity products and non-volatile memory components such as EEPROMs and Flash memory.
The increasing demand for embedded control has made the market for microcontrollers one of the significant segments of the semiconductor market at approximately $15 billion in calendar year 2014. Microcontrollers are primarily available in 8-bit through 32-bit architectures. 8-bit microcontrollers remain very cost-effective for a wide range of high-volume embedded control applications and, as a result, continue to represent a significant portion of the overall microcontroller market. 16-bit and 32-bit microcontrollers provide higher performance and functionality, and are generally found in more complex embedded control applications. The analog and mixed-signal segment of the semiconductor market is very large at over $44 billion in calendar year 2014, and this market is fragmented into a large number of sub segments.
Our Products
Our strategic focus is on embedded control solutions, including:
• | general purpose and specialized microcontrollers |
• | development tools and related software |
• | analog, interface and mixed signal products |
• | wired and wireless connectivity products |
• | memory products |
• | technology licensing |
4
We provide highly cost-effective embedded control solutions that also offer the advantages of small size, high performance, extreme low power usage, wide voltage range operation, mixed signal integration, and ease of development, thus enabling timely and cost-effective integration of our solutions by our customers in their end products.
Microcontrollers
We offer a broad family of proprietary general purpose microcontroller products marketed under the PIC® brand name. We believe that our PIC product family is a price/performance leader in the worldwide microcontroller market. We have shipped over 15 billion microcontrollers to customers worldwide since their introduction in 1990. We also offer specialized microcontrollers for automotive networking, computing, lighting, power supplies, wireless communication and wireless audio applications. With approximately 1,300 microcontrollers in our product portfolio, we target the 8-bit, 16-bit, and 32-bit microcontroller markets.
We have used our manufacturing experience and design and process technology to bring additional enhancements and manufacturing efficiencies to the development and production of our microcontroller products. Our extensive experience base has enabled us to develop microcontrollers with rich analog and digital peripherals, that have a small footprint, extreme low power consumption and are re-programmable, enabling us to be a leader in microcontroller product offerings.
Development Tools
We offer a comprehensive set of low-cost and easy-to-learn application development tools. These tools enable system designers to quickly and easily program PIC microcontrollers for specific applications and, we believe, they are a key factor for facilitating design wins.
Our family of development tools for our PIC products range from entry-level systems, which include an assembler and programmer or in-circuit debugging hardware, to fully configured systems that provide in-circuit emulation capability. We also offer a complete suite of compilers, software code configurators and simulators. Customers moving from entry-level designs to those requiring real-time emulation are able to preserve their investment in learning and tools as they migrate to future PIC devices since all of our PIC development tools share the same integrated development environment.
Many independent companies also develop and market application development tools that support our standard microcontroller product architecture. Currently, there are approximately 200 third-party tool suppliers worldwide whose products support our proprietary microcontroller architecture.
We believe that familiarity with and adoption of development tools from Microchip as well as our third-party development tool partners by an increasing number of product designers will be an important factor in the future selection of our embedded control products. These development tools allow design engineers to develop thousands of application-specific products from our standard microcontrollers. To date, we have shipped over 1.8 million development tools.
Analog, Interface and Mixed Signal Products
Our analog, interface and mixed signal products consist of several families with over 1,500 power management, linear, mixed-signal, high voltage, thermal management, RF, drivers, safety and security, USB, ethernet, wireless and other interface products.
We market and sell our analog, interface and mixed signal products into our microcontroller customer base, to customers who use microcontrollers from other suppliers and to customers who use other products that may not fit our traditional microcontroller and memory products customer base. We market these, and all of our products, based on an application segment approach targeted to provide customers with application solutions.
Memory Products
Our memory products consist of serial electrically erasable programmable read-only memory (referred to as Serial EEPROMs), Serial Flash memories, Parallel Flash memories and Serial SRAM memories. Serial EEPROMs, Serial Flash memories and Serial SRAM have a very low I/O pin requirement, permitting production of very small footprint devices. We sell our memory products primarily into the embedded control market, complementing our microcontroller offerings.
5
Technology Licensing
Our technology licensing business includes license fees and royalties associated with technology licenses for the use of our SuperFlash® embedded flash and Smartbits® one time programmable NVM technologies. We also generate fees for engineering services related to these technologies. We license our NVM technologies to foundries, integrated device manufacturers and design partners throughout the world for use in the manufacture of their advanced microcontroller products, gate array, RF and analog products that require embedded non-volatile memory.
Manufacturing
Our manufacturing operations include wafer fabrication, wafer probe, assembly and test. The ownership of a substantial portion of our manufacturing resources is an important component of our business strategy, enabling us to maintain a high level of manufacturing control, resulting in us being one of the lowest cost producers in the embedded control industry. By owning wafer fabrication facilities and our assembly and test operations, and by employing statistical techniques (statistical process control, designed experiments and wafer level monitoring), we have been able to achieve and maintain high production yields. Direct control over manufacturing resources allows us to shorten our design and production cycles. This control also allows us to capture the wafer manufacturing and a portion of the assembly and testing profit margin. We do outsource a significant portion of our manufacturing requirements to third parties and the amount of our outsourced manufacturing has increased in recent years due to our acquisitions of companies that outsource all or substantial portions of their manufacturing.
Our manufacturing facilities are located in:
• | Tempe, Arizona (Fab 2) |
• | Gresham, Oregon (Fab 4) |
• | Chandler, Arizona (wafer probe) |
• | Bangkok, Thailand (wafer probe, assembly and test) |
Wafer Fabrication
Fab 2 currently produces 8-inch wafers and supports manufacturing processes from 0.35 microns to 5.0 microns. During fiscal 2015, we increased Fab 2's capacity to support more advanced technologies by making process improvements, upgrading existing equipment, and adding equipment.
Fab 4 currently produces 8-inch wafers using predominantly 0.22 microns to 0.5 microns manufacturing processes and is capable of supporting technologies below 0.18 microns. During fiscal 2015, we increased Fab 4's capacity to support more advanced technologies by making process improvements, upgrading existing equipment, and adding equipment. A significant amount of additional clean room capacity in Fab 4 can be brought on line in the future to support incremental wafer fabrication capacity needs. We believe the combined capacity of Fab 2 and Fab 4 will provide sufficient capacity to allow us to respond to increases in future demand over the next several years with modest incremental capital expenditures.
As a result of our acquisition of Supertex, Inc. we acquired a 6-inch fab in San Jose, California which was shut down in the March 2015 quarter and is in the process of being decommissioned.
We continue to transition products to more advanced process technologies to reduce future manufacturing costs. We believe that our ability to successfully transition to more advanced process technologies is important for us to remain competitive.
We have, in recent years, outsourced a larger portion of our wafer production requirements to third-party wafer foundries to augment our internal manufacturing capabilities. As a result of our recent acquisitions, we have become more reliant on outside wafer foundries for our wafer fabrication requirements. In fiscal 2015, approximately 39% of our sales came from products that were produced at outside wafer foundries.
6
Wafer Probe, Assembly and Test
We perform wafer probe, product assembly and testing at our facilities located near Bangkok, Thailand. We also perform a limited amount of wafer probe at our Chandler, Arizona facility. During fiscal 2015, we increased our Thailand facilities' capacity to support more technologies by making process improvements, upgrading existing equipment, and adding equipment. During fiscal 2015, approximately 57% of our assembly requirements were being performed in our Thailand facilities and approximately 88% of our test requirements were performed in our Thailand facilities. We use third-party assembly and test contractors in several Asian countries for the balance of our assembly and test requirements. As a result of our acquisition of Supertex, we acquired a test facility in Hong Kong which was shut down in the March 2015 quarter.
General Matters Impacting Our Manufacturing Operations
Due to the high fixed costs inherent in semiconductor manufacturing, consistently high manufacturing yields have significant positive effects on our gross profit and overall operating results. Our continuous focus on manufacturing productivity has allowed us to maintain excellent manufacturing yields at our facilities. Our manufacturing yields are primarily driven by a comprehensive implementation of statistical process control, extensive employee training and our effective use of our manufacturing facilities and equipment. Maintenance of manufacturing productivity and yields are important factors in the achievement of our operating results. The manufacture of integrated circuits, particularly non-volatile, erasable CMOS memory and logic devices, such as those that we produce, are complex processes. These processes are sensitive to a wide variety of factors, including the level of contaminants in the manufacturing environment, impurities in the materials used and the performance of our manufacturing personnel and equipment. As is typical in the semiconductor industry, we have from time to time experienced lower than anticipated manufacturing yields. Our operating results will suffer if we are unable to maintain yields at approximately the current levels.
Historically, we have relied on our ability to respond quickly to customer orders as part of our competitive strategy, resulting in customers placing orders with relatively short delivery schedules. In order to respond to such requirements, we have historically maintained a significant work-in-process and finished goods inventory.
At the end of fiscal 2015, we owned identifiable long-lived assets (consisting of property, plant and equipment) in the U.S. with a carrying value, net of accumulated depreciation, of $331.4 million and $250.2 million in other countries, including $198.0 million in Thailand. At the end of fiscal 2014, we owned identifiable long-lived assets in the U.S. with a carrying value, net of accumulated depreciation, of $311.9 million and $220.1 million in other countries, including $179.1 million in Thailand. At the end of fiscal 2013, we owned identifiable long-lived assets in the U.S. with a carrying value, net of accumulated depreciation, of $325.3 million and $189.2 million in other countries, including $171.1 million in Thailand.
We have many suppliers of raw materials and subcontractors which provide our various materials and service needs. We generally seek to have multiple sources of supply for our raw materials and services, but, in some cases, we may rely on a single or limited number of suppliers. In such event, we have plans to reduce the exposure that would result from a disruption in supply.
Research and Development (R&D)
We are committed to continuing our investment in new and enhanced products, including development systems, and in our design and manufacturing process technologies. We believe these investments are significant factors in maintaining our competitive position. Our current R&D activities focus on the development of general purpose and specialized microcontrollers, Serial EEPROM memory, NOR FLASH memory, Embedded FLASH technologies, connectivity products, analog, interface and mixed signal products, development systems, user interface products, software and application-specific software libraries. We are also developing design, assembly, test and process technologies to enable new products and innovative features as well as achieve further cost reductions and performance improvements in existing products.
In fiscal 2015, our R&D expenses were $349.5 million, compared to $305.0 million in fiscal 2014 and $254.7 million in fiscal 2013. R&D expenses included share-based compensation expense of $28.2 million in fiscal 2015, $24.6 million in fiscal 2014 and $22.2 million in fiscal 2013.
7
Sales and Distribution
General
We market and sell our products worldwide primarily through a network of direct sales personnel and distributors.
Our direct sales force focuses on a wide variety of strategic accounts in three geographical markets: the Americas, Europe and Asia. We currently maintain sales and technical support centers in major metropolitan areas in all three geographic markets. We believe that a strong technical service presence is essential to the continued development of the embedded control market. Many of our field sales engineers (FSEs), field application engineers (FAEs), and sales management have technical degrees or backgrounds and have been previously employed in high technology environments. We believe that the technical knowledge of our sales force is a key competitive advantage in the sale of our products. The primary mission of our FAE team is to provide technical assistance to customers and to conduct periodic training sessions for the balance of our sales team. FAEs also frequently conduct technical seminars and workshops in major cities around the world.
Our licensing division has dedicated sales, technology, design, product, test and reliability personnel that support the requirements of our licensees.
Distribution
Our distributors focus primarily on servicing the product requirements of a broad base of diverse customers. We believe that distributors provide an effective means of reaching this broad and diverse customer base. We believe that customers recognize us for our products and brand name and use distributors as an effective supply channel.
In fiscal 2015, we derived 51% of our net sales through distributors and 49% of our net sales from customers serviced directly by us. In each of fiscal 2014 and fiscal 2013, we derived 53% of our net sales through distributors and 47% of our net sales from customers serviced directly by us. No distributor or end customer accounted for more than 10% of our net sales in fiscal 2015, fiscal 2014 or fiscal 2013.
We do not have long-term agreements with our distributors and we, or our distributors, may each terminate our relationship with little or no advanced notice. The loss of, or the disruption in the operations of, one or more of our distributors could reduce our future net sales in a given quarter and could result in an increase in inventory returns.
Sales by Geography
Sales by geography for fiscal 2015, fiscal 2014 and fiscal 2013 were as follows (dollars in thousands):
Year Ended March 31, | |||||||||||||||||||||
2015 | % | 2014 | % | 2013 | % | ||||||||||||||||
Americas | $ | 421,947 | 19.6 | $ | 365,609 | 18.9 | $ | 313,574 | 19.8 | ||||||||||||
Europe | 452,165 | 21.1 | 411,531 | 21.3 | 344,398 | 21.8 | |||||||||||||||
Asia | 1,272,924 | 59.3 | 1,154,077 | 59.8 | 923,651 | 58.4 | |||||||||||||||
Total Sales | $ | 2,147,036 | 100.0 | $ | 1,931,217 | 100.0 | $ | 1,581,623 | 100.0 | ||||||||||||
Sales to foreign customers accounted for approximately 84% of our net sales in each of fiscal 2015 and 2014, and approximately 83% of our net sales in fiscal 2013. Our sales to foreign customers have been predominately in Asia and Europe, which we attribute to the manufacturing strength in those areas for automotive, communications, computing, consumer and industrial control products. Americas' sales include sales to customers in the U.S., Canada, Central America and South America.
Sales to customers in China, including Hong Kong, accounted for approximately 28% of our net sales in fiscal 2015, approximately 29% of our net sales in fiscal 2014 and approximately 27% of our net sales in fiscal 2013. Sales to customers in Taiwan accounted for approximately 14% of our net sales in fiscal 2015 and approximately 13% of our net sales in each of fiscal 2014 and 2013. We did not have sales into any other foreign countries that exceeded 10% of our net sales during fiscal 2015, fiscal 2014 or fiscal 2013.
8
Our international sales are substantially all U.S. dollar denominated. Although foreign sales are subject to certain government export restrictions, we have not experienced any material difficulties to date as a result of export restrictions.
The semiconductor industry is characterized by seasonality and wide fluctuations of supply and demand. Since a significant portion of our revenue is from consumer markets and international sales, our business is subject to seasonally lower revenues in the third and fourth quarters of our fiscal year. However, in recent periods, changes in global economic and semiconductor industry conditions have had a more significant impact on our results than seasonality, and has made it difficult to assess the impact of seasonal factors on our business.
Backlog
As of April 30, 2015, our backlog was approximately $765.0 million, compared to $813.1 million as of April 30, 2014. Our backlog includes all purchase orders scheduled for delivery within the subsequent 12 months.
We primarily produce standard products that can be shipped from inventory within a relatively short time after we receive an order. Our business and, to a large extent, that of the entire semiconductor industry, is characterized by short-term orders and shipment schedules. Orders constituting our current backlog are subject to changes in delivery schedules, or to cancellation at the customer's option without significant penalty. Thus, while backlog is useful for scheduling production, backlog as of any particular date may not be a reliable measure of sales for any future period.
Competition
The semiconductor industry is intensely competitive and has been characterized by price erosion and rapid technological change. We compete with major domestic and international semiconductor companies, many of which have greater market recognition and greater financial, technical, marketing, distribution and other resources than we have with which to pursue engineering, manufacturing, marketing and distribution of their products. We also compete with a number of companies that we believe have copied, cloned, pirated or reverse engineered our proprietary product lines in such countries as China and Taiwan. We are continuing to take actions to vigorously and aggressively defend and protect our intellectual property on a worldwide basis.
We currently compete principally on the basis of the technical innovation and performance of our embedded control products, including the following product characteristics:
• | performance |
• | analog, digital and mixed signal functionality and level of functional integration |
• | memory density |
• | low power consumption |
• | extended voltage ranges |
• | reliability |
• | packaging alternatives |
• | complete development tool line |
We believe that other important competitive factors in the embedded control market include:
• | ease of use |
• | functionality of application development systems |
• | dependable delivery, quality and availability |
• | technical and innovative service and support |
• | time to market |
• | price |
We believe that we compete favorably with other companies on all of these factors, but we may be unable to compete successfully in the future, which could harm our business.
9
Patents, Licenses and Trademarks
We maintain a portfolio of U.S. and foreign patents, expiring on various dates between 2015 and 2034. We also have numerous additional U.S. and foreign patent applications pending. We do not expect that the expiration of any particular patent will have a material impact on our business. While our intention is to continue to patent our technology and manufacturing processes, we believe that our continued success depends primarily on the technological skills and innovative capabilities of our personnel and our ability to rapidly commercialize new and enhanced products. As with any operating company, the scope and strength of our intellectual property assets, including our pending and existing patents, trademarks, copyrights, and other intellectual property rights may be insufficient to provide meaningful protection or commercial advantage. Moreover, pursuing violations of intellectual property rights on a worldwide basis is a complex challenge involving multinational patent, trademark, copyright and trade secret law. Further, the laws of particular foreign countries often fail to protect our intellectual property rights to the same extent as the laws of the U.S.
We have also entered into certain intellectual property licenses and cross-licenses with other companies and those licenses relate to semiconductor products and manufacturing processes. As is typical in the semiconductor industry, we and our customers from time to time receive, and may continue to receive, demand letters from third parties asserting infringement of patent and other intellectual property rights. We diligently investigate all such notices and respond as we believe appropriate. In most cases we believe that we can obtain necessary licenses on commercially reasonable terms, however, we cannot be certain that this would be the case, or that litigation or damages for any past infringement could be avoided. Litigation, which could result in substantial costs and require significant attention from management, may be necessary to enforce our intellectual property rights, or to defend against claimed infringement of the rights of others. The failure to obtain necessary licenses, or the necessity of engaging in defensive litigation, could harm our business.
Environmental Regulation
We must comply with many different federal, state, local and foreign governmental regulations related to the use, storage, discharge and disposal of certain chemicals and gases used in our manufacturing processes. Our facilities have been designed to comply with these regulations and we believe that our activities are conducted in material compliance with such regulations. Any changes in such regulations or in their enforcement could require us to acquire costly equipment or to incur other significant expenses to comply with environmental regulations. Any failure by us to adequately control the storage, use, discharge and disposal of regulated substances could result in significant future liabilities.
Increasing public attention has been focused on the environmental impact of electronic manufacturing operations. While we have not experienced any materially adverse effects on our operations from recently adopted environmental regulations, our business and results of operations could suffer if for any reason we fail to control the storage or use of, or to adequately restrict the discharge or disposal of, hazardous substances under present or future environmental regulations.
Employees
As of March 31, 2015, we had 9,449 employees. None of our employees are represented by a labor organization. We have never had a work stoppage and believe that our employee relations are good.
Executive Officers of the Registrant
The following sets forth certain information regarding our executive officers as of April 30, 2015:
Name | Age | Position | ||
Steve Sanghi | 59 | Chairman of the Board, President and Chief Executive Officer | ||
Ganesh Moorthy | 55 | Chief Operating Officer | ||
J. Eric Bjornholt | 44 | Vice President, Chief Financial Officer | ||
Stephen V. Drehobl | 53 | Vice President, MCU8 and Technology Development Division | ||
Mitchell R. Little | 63 | Vice President, Worldwide Sales and Applications | ||
Richard J. Simoncic | 51 | Vice President, Analog and Interface Products Division | ||
10
Mr. Sanghi has been President since August 1990, CEO since October 1991, and Chairman of the Board since October 1993. He has served as a director since August 1990. Mr. Sanghi holds an M.S. degree in Electrical and Computer Engineering from the University of Massachusetts and a B.S. degree in Electronics and Communication from Punjab University, India. Since May 2007, he has been a member of the Board of Directors of FIRST (For Inspiration and Recognition of Science and Technology).
Mr. Moorthy has served as Chief Operating Officer since June 2009, as Executive Vice President since October 2006 and as a Vice President in various roles since he joined Microchip in 2001. Prior to this time, he served in various executive capacities with other semiconductor companies. Mr. Moorthy holds an M.B.A. in Marketing from National University, a B.S. degree in Electrical Engineering from the University of Washington and a B.S. degree in Physics from the University of Mumbai, India. Mr. Moorthy was elected to the Board of Directors of Rogers Corporation in July 2013.
Mr. Bjornholt has served as Vice President of Finance since 2008 and as Chief Financial Officer since January 2009. He has served in various financial management capacities since he joined Microchip in 1995. Mr. Bjornholt holds a Master's degree in Taxation from Arizona State University and a B.S. degree in Accounting from the University of Arizona.
Mr. Drehobl has served as Vice President of the MCU8 and Technology Development Division since July 2001. He has been employed by Microchip since August 1989 and has served as a Vice President in various roles since February 1997. Mr. Drehobl holds a Bachelor of Technology degree from the University of Dayton.
Mr. Little has served as Vice President, Worldwide Sales and Applications since July 2000. He has been employed by Microchip since 1989 and has served as a Vice President in various roles since September 1993. Mr. Little holds a B.S. degree in Engineering Technology from United Electronics Institute.
Mr. Simoncic has served as Vice President, Analog and Interface Products Division since September 1999. From October 1995 to September 1999, he served as Vice President in various roles. Since joining Microchip in 1990, Mr. Simoncic held various roles in Design, Device/Yield Engineering and Quality Systems. Mr. Simoncic holds a B.S. degree in Electrical Engineering Technology from DeVry Institute of Technology.
Item 1A. RISK FACTORS
When evaluating Microchip and its business, you should give careful consideration to the factors listed below, in addition to the information provided elsewhere in this Form 10-K and in other documents that we file with the Securities and Exchange Commission.
Our operating results are impacted by global economic conditions and may fluctuate in the future due to a number of factors that could reduce our net sales and profitability.
Our operating results are affected by a wide variety of factors that could reduce our net sales and profitability, many of which are beyond our control. Some of the factors that may affect our operating results include:
• | general economic, industry or political conditions in the U.S. or internationally; |
• | changes in demand or market acceptance of our products and products of our customers, and market fluctuations in the industries into which such products are sold; |
• | changes in utilization of our manufacturing capacity and fluctuations in manufacturing yields; |
• | changes or fluctuations in customer order patterns and seasonality; |
• | our ability to secure sufficient wafer foundry, assembly and testing capacity; |
• | our ability to ramp our factory capacity to meet customer demand; |
• | the mix of inventory we hold and our ability to satisfy orders from our inventory; |
• | levels of inventories held by our customers; |
• | risk of excess and obsolete inventories; |
• | our ability to realize the expected benefits of our acquisitions; |
• | changes in tax regulations and policies in the U.S. and other countries in which we do business; |
• | competitive developments including pricing pressures; |
• | unauthorized copying of our products resulting in pricing pressure and loss of sales; |
• | availability of raw materials and equipment; |
• | our ability to successfully transition products to more advanced process technologies to reduce manufacturing costs; |
• | the level of orders that are received and can be shipped in a quarter; |
11
• | the level of sell-through of our products through distribution; |
• | fluctuations in our mix of product sales; |
• | announcements of significant acquisitions by us or our competitors; |
• | disruptions in our business or our customers' businesses due to terrorist activity, armed conflict, war, worldwide oil prices and supply, public health concerns, natural disasters or disruptions in the transportation system; |
• | constrained availability from other electronic suppliers impacting our customers' ability to ship their products, which in turn may adversely impact our sales to those customers; |
• | costs and outcomes of any current or future tax audits or any litigation involving intellectual property, customers or other issues; |
• | fluctuations in commodity prices; and |
• | property damage or other losses, whether or not covered by insurance. |
We believe that period-to-period comparisons of our operating results are not necessarily meaningful and that you should not rely upon any such comparisons as indications of our future performance. In future periods, our operating results may fall below our public guidance or the expectations of public market analysts and investors, which would likely have a negative effect on the price of our common stock. Adverse global economic conditions, the subsequent economic recovery and uncertainty surrounding the strength and duration of such recovery have caused our operating results to fluctuate significantly and make comparability between periods less meaningful.
Our operating results will suffer if we ineffectively utilize our manufacturing capacity or fail to maintain manufacturing yields.
The manufacture and assembly of integrated circuits, particularly non-volatile, erasable CMOS memory and logic devices such as those that we produce, are complex processes. These processes are sensitive to a wide variety of factors, including the level of contaminants in the manufacturing environment, impurities in the materials used, the performance of our wafer fabrication and assembly and test personnel and equipment, and other quality issues. As is typical in the semiconductor industry, we have from time to time experienced lower than anticipated manufacturing yields. Our operating results will suffer if we are unable to maintain yields at approximately the current levels. This could include delays in the recognition of revenue, loss of revenue or future orders, and customer-imposed penalties for our failure to meet contractual shipment deadlines. Our operating results are also adversely affected when we operate at less than optimal capacity. For example, in the third quarter of fiscal 2012, we reduced wafer starts in both Fab 2 and Fab 4 to help control inventory balances in response to a slowdown in global economic conditions. We continued with the reduced level of wafer starts through the first quarter of fiscal 2013. These actions had a negative impact on our gross profit. We further reduced the wafer starts in our fabs in late September 2012 and again during the quarter ended December 31, 2012 which continued to negatively impact our gross profit through the March 2013 quarter. We increased wafer starts modestly throughout fiscal 2014 and fiscal 2015. Although we operated at normal capacity levels during the last three quarters of fiscal 2015, there can be no assurance that such production levels will be maintained in future periods.
We are dependent on orders that are received and shipped in the same quarter and therefore have limited visibility to future product shipments.
Our net sales in any given quarter depend upon a combination of shipments from backlog, and customer orders that are both received and shipped in that same quarter, which we refer to as turns orders. We measure turns orders at the beginning of a quarter based on the orders needed to meet the shipment targets that we set entering the quarter. Historically, we have relied on our ability to respond quickly to customer orders as part of our competitive strategy, resulting in customers placing orders with relatively short delivery schedules. Shorter lead times generally mean that turns orders as a percentage of our business are relatively high in any particular quarter and reduce our backlog visibility on future product shipments. Turns orders correlate to overall semiconductor industry conditions and product lead times. Because turns orders are difficult to predict, varying levels of turns orders make it more difficult to forecast net sales. As a significant portion of our products are manufactured at foundries, foundry lead times may affect our ability to satisfy certain turns orders. If we do not achieve a sufficient level of turns orders in a particular quarter relative to our revenue targets, our revenue and operating results will likely suffer.
12
Intense competition in the markets we serve may lead to pricing pressures, reduced sales of our products or reduced market share.
The semiconductor industry is intensely competitive and has been characterized by price erosion and rapid technological change. We compete with major domestic and international semiconductor companies, many of which have greater market recognition and substantially greater financial, technical, marketing, distribution and other resources than we do. We may be unable to compete successfully in the future, which could harm our business. Our ability to compete successfully depends on a number of factors both within and outside our control, including, but not limited to:
• | the quality, performance, reliability, features, ease of use, pricing and diversity of our products; |
• | our success in designing and manufacturing new products including those implementing new technologies; |
• | the rate at which customers incorporate our products into their own applications and the success of such applications; |
• | the rate at which the markets that we serve redesign and change their own products; |
• | changes in demand in the markets that we serve and the overall rate of growth or contraction of such markets, including but not limited to the automotive, personal computing and consumer electronics markets; |
• | product introductions by our competitors; |
• | the number, nature and success of our competitors in a given market; |
• | our ability to obtain adequate foundry and assembly and test capacity and supplies of raw materials and other supplies at acceptable prices; |
• | our ability to protect our products and processes by effective utilization of intellectual property rights; |
• | our ability to remain price competitive against companies that have copied our proprietary product lines, especially in countries where intellectual property rights protection is difficult to achieve and maintain; |
• | our ability to address the needs of our customers; and |
• | general market and economic conditions. |
Historically, average selling prices in the semiconductor industry decrease over the life of any particular product. The overall average selling prices of our microcontroller and proprietary analog, interface and mixed signal products have remained relatively constant, while average selling prices of our memory and non-proprietary analog, interface and mixed signal products have declined over time.
We have experienced, and expect to continue to experience, modest pricing declines in certain of our more mature proprietary product lines, primarily due to competitive conditions. We have been able to moderate average selling price declines in many of our proprietary product lines by continuing to introduce new products with more features and higher prices. However, there can be no assurance that we will be able to do so in the future. We have experienced in the past, and expect to continue to experience in the future, varying degrees of competitive pricing pressures in our memory and non-proprietary analog, interface and mixed signal products. We may be unable to maintain average selling prices for our products as a result of increased pricing pressure in the future, which could adversely impact our operating results.
We are dependent on wafer foundries and other contractors to perform key manufacturing functions for us, and our licensees of our SuperFlash and other technologies also rely on foundries and other contractors.
We rely on outside wafer foundries for a significant portion of our wafer fabrication needs. Specifically, during fiscal 2015, approximately 39% of our net sales came from products that were produced at outside wafer foundries. We also use several contractors located in Asia for a portion of the assembly and testing of our products. Our reliance on third party contractors and foundries increased as a result of our acquisitions of SMSC in August 2012, Supertex in April 2014 and ISSC in July 2014. The disruption or termination of any of our contractors could harm our business and operating results.
Our use of third parties somewhat reduces our control over the subcontracted portions of our business. Our future operating results could suffer if any contractor were to experience financial, operational or production difficulties or situations when demand exceeds capacity, or if they were unable to maintain manufacturing yields, assembly and test yields and costs at approximately their current levels, or if the countries in which such contractors are located were to experience political upheaval or infrastructure disruption. If these third parties are unable or unwilling to timely deliver products or services conforming to our quality standards, we may not be able to qualify additional manufacturing sources for our products in a timely manner on terms favorable to us, or at all. Additionally, these subcontractors could abandon fabrication processes that are important to us, or fail to adopt advanced manufacturing technologies that we desire to control costs. In any such event, we could experience an interruption in production, an increase in manufacturing and production costs or a decline in product reliability, and our business and operating results could be adversely affected. Further, our use of subcontractors increases opportunities for potential misappropriation of our intellectual property.
13
Certain of our SuperFlash and other technology licensees also rely on outside wafer foundries for wafer fabrication services. If our licensees were to experience any disruption in supply from outside wafer foundries, this would reduce the revenue we receive in our technology licensing business and would harm our operating results.
Our operating results are impacted by both seasonality and the wide fluctuations of supply and demand in the semiconductor industry.
The semiconductor industry is characterized by seasonality and wide fluctuations of supply and demand. Since a significant portion of our revenue is from consumer markets and international sales, our business is subject to seasonally lower revenues in the third and fourth quarters of our fiscal year. However, broad fluctuations in our overall business, changes in semiconductor industry and global economic conditions and our acquisition activity can have a more significant impact on our results than seasonality. As a result, in periods when these broad fluctuations, changes in business conditions or acquisitions occur, it is difficult to assess the impact of seasonal factors on our business. The semiconductor industry has also experienced significant economic downturns, characterized by diminished product demand and production over-capacity. We have sought to reduce our exposure to this industry cyclically by selling proprietary products, that cannot be easily or quickly replaced, to a geographically diverse customer base across a broad range of market segments. However, we have experienced substantial period-to-period fluctuations in operating results and expect, in the future, to experience period-to-period fluctuations in operating results due to general industry or economic conditions.
Our business is dependent on selling through distributors.
Sales through distributors accounted for approximately 51% of our net sales in fiscal 2015 and approximately 53% of our net sales in fiscal 2014. We do not have long-term agreements with our distributors and we and our distributors may each terminate our relationship with little or no advance notice.
Any future adverse conditions in the U.S. or global economies or in the U.S. or global credit markets could materially impact the operations of our distributors. Any deterioration in the financial condition of our distributors or any disruption in the operations of our distributors could adversely impact the flow of our products to our end customers and adversely impact our results of operation. In addition, during an industry or economic downturn, it is possible there will be an oversupply of products and a decrease in sell-through of our products by our distributors which could reduce our net sales in a given period and result in an increase in inventory returns. Violations of the Foreign Corrupt Practices Act, or similar laws, by our distributors or other channel partners could have a material adverse impact on our business.
Our success depends on our ability to introduce new products on a timely basis.
Our future operating results depend on our ability to develop and timely introduce new products that compete effectively on the basis of price and performance and which address customer requirements. The success of our new product introductions depends on various factors, including, but not limited to:
• | proper new product selection; |
• | timely completion and introduction of new product designs; |
• | procurement of licenses for intellectual property rights from third parties under commercially reasonable terms; |
• | timely filing and protection of intellectual property rights for new product designs; |
• | availability of development and support tools and collateral literature that make complex new products easy for engineers to understand and use; and |
• | market acceptance of our customers' end products. |
Because our products are complex, we have experienced delays from time to time in completing new product development. In addition, our new products may not receive or maintain substantial market acceptance. We may be unable to timely design, develop and introduce competitive products, which could adversely impact our future operating results.
Our success also depends upon our ability to develop and implement new design and process technologies. Semiconductor design and process technologies are subject to rapid technological change and require significant R&D expenditures. We and other companies in the industry have, from time to time, experienced difficulties in effecting transitions to advanced process technologies and, consequently, have suffered reduced manufacturing yields or delays in product deliveries. Our future operating results could be adversely affected if any transition to future process technologies is substantially delayed or inefficiently implemented.
14
Our technology licensing business exposes us to various risks.
Our technology licensing business is based on our SuperFlash and other technologies. The success of our licensing business depends on the continued market acceptance of these technologies and on our ability to further develop and enhance such technologies and to introduce new technologies in the future. To be successful, any such technology must be able to be repeatably implemented by licensees, provide satisfactory yield rates, address licensee and customer requirements, and perform competitively. The success of our technology licensing business depends on various other factors, including, but not limited to:
• | proper identification of licensee requirements; |
• | timely development and introduction of new or enhanced technology; |
• | our ability to protect our intellectual property rights for our licensed technology; |
• | our ability to limit our liability and indemnification obligations to licensees; |
• | availability of sufficient development and support services to assist licensees in their design and manufacture of products integrating our technology; |
• | availability of foundry licensees with sufficient capacity to support OEM production; and |
• | market acceptance of our customers' end products. |
Because our licensed technologies are complex, there may be delays from time to time in developing and enhancing such technologies. There can be no assurance that our existing or any enhanced or new technology will achieve or maintain substantial market acceptance. Our licensees may experience disruptions in production or lower than expected production levels which would adversely affect the revenue that we receive from them. Our technology license agreements generally include an indemnification clause that indemnifies the licensee against liability and damages (including legal defense costs) arising from intellectual property matters. We could be exposed to substantial liability for claims or damages related to intellectual property matters or indemnification claims. Any claim, with or without merit, could result in significant legal fees and require significant attention from our management. Any of the foregoing issues may adversely impact the success of our licensing business and adversely affect our future operating results.
We may not fully realize the anticipated benefits of our completed or future acquisitions or divestitures.
We have acquired, and expect in the future to acquire, additional businesses that we believe will complement or augment our existing businesses. In this regard, in July 2014, we completed our acquisition of a controlling interest of ISSC; in April 2014, we completed our acquisition of Supertex; and in August 2012, we completed our acquisition of SMSC. In May 2015, we announced an agreement to acquire Micrel, Incorporated. The integration process for our acquisitions may be complex, costly and time consuming and include unanticipated issues, expenses and liabilities. We may not be able to successfully or profitably integrate, operate, maintain and manage any newly acquired operations or employees. We may not be able to maintain uniform standards, procedures and policies and we may be unable to realize the expected synergies and cost savings from the integration. There may be increased risk due to integrating financial reporting and internal control systems. We may have difficulty in developing, manufacturing and marketing the products of a newly acquired company, or in growing the business at the rate we anticipate. Following an acquisition, we may not achieve the revenue or net income levels that justify the acquisition. We may suffer loss of key employees, customers and strategic partners of acquired companies and it may be difficult to implement our corporate culture at acquired companies. We may be subject to claims from terminated employees, shareholders of acquired companies and other third parties related to the transaction. Acquisitions may also result in one-time charges (such as acquisition-related expenses, write-offs, restructuring charges, or future impairment of goodwill), contingent liabilities, adverse tax consequences, additional stock-based compensation expense and other charges that adversely affect our operating results. Additionally, we may fund acquisitions of new businesses or strategic alliances by utilizing cash, borrowings under our credit agreement, raising debt, issuing shares of common stock, or other mechanisms.
Further, if we decide to divest assets or a business, we may encounter difficulty in finding or completing divestiture opportunities or alternative exit strategies on acceptable terms or in a timely manner. These circumstances could delay the achievement of our strategic objectives or cause us to incur additional expenses with respect to assets or a business that we want to dispose of, or we may dispose of assets or a business at a price or on terms that are less favorable than we had anticipated. Even following a divestiture, we may be contractually obligated with respect to certain continuing obligations to customers, vendors, landlords or other third parties. We may also have continuing obligations for pre-existing liabilities related to the assets or businesses. Such obligations may have a material adverse impact on our results of operation and financial condition.
15
In addition to acquisitions, we have in the past, and expect in the future, to enter into joint development agreements or other business or strategic relationships with other companies. These transactions are subject to a number of risks similar to those we face with our acquisitions including our ability to realize the expected benefits of any such transaction, to successfully market and sell any products resulting from such transactions or to successfully integrate any technology developed through such transactions.
We may lose sales if our suppliers of raw materials and equipment fail to meet our needs.
Our semiconductor manufacturing operations require raw and processed materials and equipment that must meet exacting standards. We generally have more than one source for these supplies, but there are only a limited number of suppliers capable of delivering various materials and equipment that meet our standards. The materials and equipment necessary for our business could become more difficult to obtain as worldwide use of semiconductors in product applications increases. Additionally, consolidation in our supply chain due to mergers and acquisitions may reduce the number of suppliers or change the relationships that we have with our suppliers. This could impair sourcing flexibility or increase costs. We have experienced supply shortages from time to time in the past, and on occasion our suppliers have told us they need more time than expected to fill our orders or that they will no longer support certain equipment with updates or spare and replacement parts. An interruption of any materials or equipment sources, or the lack of supplier support for a particular piece of equipment, could harm our business.
We are exposed to various risks related to legal proceedings or claims.
We are currently, and in the future may be, involved in legal proceedings or claims regarding patent infringement, other intellectual property rights, contracts and other matters. As is typical in the semiconductor industry, we receive notifications from customers or licensees from time to time who believe that we owe them indemnification or other obligations related to infringement claims made against us, our customers or our licensees by third parties. These legal proceedings and claims, even if meritless, could result in substantial costs to us and divert our resources. If we are not able to resolve a claim, settle a matter, obtain necessary licenses on commercially reasonable terms, reengineer our products or processes to avoid infringement, and/or successfully prosecute or defend our position, we could incur uninsured liability in any of them, be required to take an appropriate charge to operations, be enjoined from selling a material portion of our products or using certain processes, suffer a reduction or elimination in the value of our inventories, and our business, financial condition or results of operations could be harmed.
It is also possible that from time to time we may be subject to claims related to the manufacture, performance or use of our products. These claims may be due to injuries or environmental exposures related to manufacturing, a product's nonconformance to our specifications, or specifications agreed upon with the customer, changes in our manufacturing processes, or unexpected customer system issues due to the integration of our products or insufficient design or testing by our customers. We could incur significant expenses related to such matters, including, but not limited to:
• | costs related to writing off the value of our inventory of nonconforming products; |
• | recalling nonconforming products; |
• | providing support services, product replacements, or modifications to products and the defense of such claims; |
• | diversion of resources from other projects; |
• | lost revenue or a delay in the recognition of revenue due to cancellation of orders and unpaid receivables; |
• | customer imposed fines or penalties for failure to meet contractual requirements; and |
• | a requirement to pay damages. |
Because the systems into which our products are integrated have a higher cost of goods than the products we sell, our expenses and damages may be significantly higher than the sales and profits we received from the products involved. While we specifically exclude consequential damages in our standard terms and conditions, certain of our contracts may not exclude such liabilities. Further, our ability to avoid such liabilities may be limited by applicable law. We do have liability insurance which covers certain damages arising out of product defects, but we do not expect that insurance will cover all claims or be of a sufficient amount to fully protect against such claims. Costs or payments we may make in connection with these customer claims may adversely affect the results of our operations.
Further, we sell to customers in industries such as automotive, aerospace, and medical, where failure of the systems in which our products are integrated could cause damage to property or persons. We may be subject to claims if our products, or the integration of our products, cause system failures. We will face increased exposure to claims if there are substantial increases in either the volume of our sales into these applications or the frequency of system failures integrating our products.
16
Failure to adequately protect our intellectual property could result in lost revenue or market opportunities.
Our ability to obtain patents, licenses and other intellectual property rights covering our products and manufacturing processes is important for our success. To that end, we have acquired certain patents and patent licenses and intend to continue to seek patents on our technology and manufacturing processes. The process of seeking patent protection can be long and expensive, and patents may not be issued from currently pending or future applications. In addition, our existing and new patents, trademarks and copyrights that issue may not have sufficient scope or strength to provide meaningful protection or commercial advantage to us. We may be subject to, or may ourselves initiate, interference proceedings in the U.S. Patent and Trademark Office, patent offices of a foreign country or U.S. or foreign courts, which can require significant financial and management resources. In addition, the laws of certain foreign countries do not protect our intellectual property rights to the same extent as the laws of the U.S. Infringement of our intellectual property rights by a third party could result in uncompensated lost market and revenue opportunities for us. Although we continue to vigorously and aggressively defend and protect our intellectual property on a worldwide basis, there can be no assurance that we will be successful in our endeavors.
Our operating results may be adversely impacted if economic conditions impact the financial viability of our licensees, customers, distributors, or suppliers.
We regularly review the financial performance of our licensees, customers, distributors and suppliers. However, any downturn in global economic conditions may adversely impact the financial viability of our licensees, customers, distributors or suppliers. The financial failure of a large licensee, customer or distributor, an important supplier, or a group thereof, could have an adverse impact on our operating results and could result in our not being able to collect our accounts receivable balances, higher reserves for doubtful accounts, write-offs for accounts receivable, and higher operating costs as a percentage of revenues.
We are highly dependent on foreign sales and operations, which exposes us to foreign political and economic risks.
Sales to foreign customers account for a substantial portion of our net sales. During fiscal 2015, approximately 84% of our net sales were made to foreign customers, including 28% in China. During fiscal 2014, approximately 84% of our net sales were made to foreign customers, including 29% in China. A strong position in the Chinese market is a key component of our global growth strategy. The market for integrated circuit products in China is highly competitive, and both international and domestic competitors are aggressively seeking to increase their market share. Increased competition or economic weakness in the China market may make it difficult for us to achieve our desired sales volumes in China. We purchase a substantial portion of our raw materials and equipment from foreign suppliers. In addition, we own product assembly and testing facilities near Bangkok, Thailand, which has experienced periods of political instability in the past. From time to time, Thailand has also experienced periods of severe flooding. There can be no assurance that any future flooding or political instability in Thailand would not have a material adverse impact on our operations. We use various foundries and other foreign contractors for a significant portion of our assembly and testing and wafer fabrication requirements. Substantially all of our finished goods inventory is maintained in Thailand.
Our reliance on foreign operations, foreign suppliers, maintenance of substantially all of our finished goods inventory at foreign locations and significant foreign sales exposes us to foreign political and economic risks, including, but not limited to:
• | political, social and economic instability; |
• | economic uncertainty in the worldwide markets served by us; |
• | trade restrictions and changes in tariffs; |
• | import and export license requirements and restrictions; |
• | changes in rules and laws related to taxes, environmental, health and safety, technical standards and consumer protection in various jurisdictions; |
• | currency fluctuations and foreign exchange regulations; |
• | difficulties in staffing and managing international operations; |
• | employment regulations; |
• | disruptions in international transport or delivery; |
• | public health conditions; |
• | difficulties in collecting receivables and longer payment cycles; and |
• | potentially adverse tax consequences. |
If any of these risks materialize, or are worse than we anticipate, our sales could decrease and our operating results could suffer.
17
We do not typically have long-term contracts with our customers, but where we do, certain terms of such contracts expose us to risks and liabilities.
We do not typically enter into long-term contracts with our customers and we cannot be certain about future order levels from our customers. When we do enter into customer contracts, the contract is generally cancelable at the convenience of the customer. Even though we had approximately 91,000 customers and our ten largest direct customers made up approximately 10% of our total revenue for fiscal 2015, cancellation of customer contracts could have an adverse impact on our revenue and profits.
We have entered into contracts with certain customers that differ from our standard terms of sale. Further, as a result of our acquisitions, we may inherit certain customer contracts that differ from our standard terms of sale. For several of the significant markets that we sell into, such as the automotive and personal computer markets, our current or potential customers may possess significant leverage over us in negotiating the terms and conditions of supply as a result of their market size and position. For example, under certain contracts we may commit to supply specific quantities of products on scheduled delivery dates, or agree to extend our obligations for certain liabilities such as warranties or indemnification for quality issues or claims of intellectual property infringement. If we are unable to supply the customer as required under the contract, the customer may incur additional production costs, lost revenues due to subsequent delays in their own manufacturing schedule, or quality-related issues. We may be liable for the customer's costs, expenses and damages associated with their claims and we may be obligated to defend the customer against claims of intellectual property infringement and pay the associated legal fees. While we try to limit the number of contracts that we sign which contain such special provisions, manage the risks underlying such liabilities, and set caps on our liability exposure, sometimes we are not able to do so. In order to win important designs, avoid losing business to competitors, maintain existing business, or be permitted to bid on new business, we have been, and may in the future be, forced to agree to uncapped liability for such items as intellectual property infringement or confidentiality. Such provisions expose us to risk of liability far exceeding the purchase price of the products we sell under such contracts, the lifetime revenues we receive from such products, or various forms of potential consequential damages. These significant additional risks could result in a material adverse impact on our results of operation and financial condition.
We must attract and retain qualified personnel to be successful, and competition for qualified personnel can be intense.
Our success depends upon the efforts and abilities of our senior management, engineering, manufacturing and other personnel. The competition for qualified engineering and management personnel can be intense. We may be unsuccessful in retaining our existing key personnel or in attracting and retaining additional key personnel that we require. The loss of the services of one or more of our key personnel or the inability to add key personnel could harm our business. The loss of, or any inability to attract personnel, even if not key personnel, if experienced in sufficient numbers could harm our business. We have no employment agreements with any member of our senior management team.
Business interruptions to our operations or the operations of our key vendors, subcontractors, licensees or customers, whether due to natural disasters or other events, could harm our business.
Operations at any of our facilities, at the facilities of any of our wafer fabrication or assembly and test subcontractors, or at any of our significant vendors or customers may be disrupted for reasons beyond our control. These reasons may include work stoppages, power loss, incidents of terrorism or security risk, political instability, public health issues, telecommunications, transportation or other infrastructure failure, radioactive contamination, fire, earthquake, floods, volcanic eruptions or other natural disasters. We have taken steps to mitigate the impact of some of these events should they occur; however, we cannot be certain that our actions will be effective to avoid a significant impact on our business in the event of a disaster or other business interruption.
In particular, Thailand has experienced periods of severe flooding in recent years. While our facilities in Thailand have continued to operate normally, there can be no assurance that any future flooding in Thailand would not have a material adverse impact on our operations. If operations at any of our facilities, or our subcontractors' facilities are interrupted, we may not be able to shift production to other facilities on a timely basis, and we may need to spend significant amounts to repair or replace our facilities and equipment. If we experienced business interruptions, we would likely experience delays in shipments of products to our customers and alternate sources for production may be unavailable on acceptable terms. This could result in reduced revenues and profits and the cancellation of orders or loss of customers. Although we maintain business interruption insurance, such insurance will likely not be enough to compensate us for any losses that may occur and any losses or damages incurred by us as a result of business interruptions could significantly harm our business.
18
Additionally, as described above, operations at our customers and licensees may be disrupted for a number of reasons. In the event of customer disruptions, sales of our products may decline and our revenue, profitability and financial condition could suffer. Likewise, if our licensees are unable to manufacture and ship products incorporating our technology, or if there is a decrease in product demand due to a business disruption, our royalty revenue may decline as our licenses are based on per unit royalties.
Fluctuations in foreign currency exchange rates could adversely impact our operating results.
We use forward currency exchange contracts in an attempt to reduce the adverse earnings impact from the effect of exchange rate fluctuations on our non-U.S. dollar net balance sheet exposures. Nevertheless, in periods when the U.S. dollar significantly fluctuates in relation to the non-U.S. currencies in which we transact business, the value of our non-U.S. dollar transactions can have an adverse effect on our results of operations and financial condition. In particular, in periods when a foreign currency significantly declines in value in relation to the U.S. dollar, such as recent declines in the Euro relative to the U.S. dollar, customers transacting in that foreign currency may find it more difficult to fulfill their previously committed contractual obligations or to undertake new obligations to make payments or purchase products. In periods when the U.S. dollar is significantly declining in relation to the British pound, Euro and Thai baht, the operational costs in our European and Thailand subsidiaries are adversely affected. Over the past several months, the U.S. dollar has appreciated significantly against the Euro and other major currencies. Although our business has not been materially adversely impacted by such strength in the U.S. dollar, there can be no assurance as to the future impact that a strong dollar will have on our business or results of operations.
Interruptions in our information technology systems could adversely affect our business.
We rely on the efficient and uninterrupted operation of complex information technology systems and networks to operate our business. Any significant disruption to our systems or networks, including, but not limited to, new system implementations, computer viruses, security breaches, facility issues, natural disasters, terrorism, war, telecommunication failures or energy blackouts could have a material adverse impact on our operations, sales and operating results. Such disruption could result in a loss of our intellectual property or the release of sensitive competitive information or supplier, customer or employee personal data. Any loss of such information could harm our competitive position, result in a loss of customer confidence, and cause us to incur significant costs to remedy the damages caused by any such disruptions or security breaches. Additionally, failure to properly manage the collection, handling, transfer or disposal of personal data of employees and customers may result in regulatory penalties, enforcement actions, remediation obligations, litigation, fines and other sanctions.
From time to time, we have experienced verifiable attacks on our data, attempts to breach our security and attempts to introduce malicious software into our IT systems; however, such attacks have not previously resulted in any material damage to us. Were future attacks successful, we may be unaware of the incident, its magnitude, or its effects until significant harm is done. In recent years, we have implemented improvements to our protective measures which are not limited to the following: firewalls, antivirus measures, patches, log monitors, routine backups with offsite retention of storage media, system audits, data partitioning and routine password modifications. There can be no assurance that such system improvements will be sufficient to prevent or limit the damage from any future cyber attack or disruptions. Any such attack or disruption could result in additional costs related to rebuilding of internal systems, defending litigation, responding to regulatory actions, or paying damages. Such attacks or disruption could have a material adverse impact on our business, operations and financial results.
Third-party service providers, such as wafer foundries, assembly and test contractors, distributors, credit card processors and other vendors have access to certain portions of our and our customers' sensitive data. In the event that these service providers do not properly safeguard the data that they hold, security breaches and loss of data could result. Any such loss of data by our third-party service providers could negatively impact our business, operations and financial results, as well as our relationship with our customers.
The occurrence of events for which we are self-insured, or which exceed our insurance limits, may adversely affect our profitability and liquidity.
We have insurance contracts with independent insurance companies related to many different types of risk; however, we self-insure for some potentially significant risks and obligations. In these circumstances, we believe that it is more cost effective for us to self-insure certain risks than to pay the high premium costs. The risks and exposures that we self-insure include, but are not limited to certain property, product defects, employment risks, political risks, and intellectual property matters. Should there be a loss or adverse judgment or other decision in an area for which we are self-insured, then our financial condition, results of operations and liquidity may be adversely affected.
19
We are subject to stringent environmental and other regulations, which may force us to incur significant expenses.
We must comply with many federal, state, local and foreign governmental regulations related to the use, storage, discharge and disposal of toxic, volatile or otherwise hazardous substances used in our products and manufacturing processes. Our failure to comply with applicable regulations could result in fines, suspension of production, cessation of operations or future liabilities. Such environmental regulations have required us in the past, and could require us in the future to buy costly equipment or to incur significant expenses to comply with such regulations. Our failure to control the use of, or adequately restrict the discharge of, hazardous substances could impact the health of our employees and others and could impact our ability to operate. Such failure could also restrict our ability to ship certain products to certain countries, require us to modify our operations logistics, or require us to incur other significant costs and expenses. There is a continuing expansion in environmental laws with a focus on reducing or eliminating hazardous substances and substances of high concern in electronic products and shipping materials. These and other future environmental regulations could require us to reengineer certain of our existing products and may make it more expensive for us to manufacture, sell and ship our products. In addition, the number and complexity of laws focused on the energy efficiency of electronic products and accessories, the recycling of electronic products, and the reduction in quantity and the recycling of packing materials have expanded significantly. It may be difficult for us to timely comply with these laws and we may not have sufficient quantities of compliant products to meet customers' needs, thereby adversely impacting our sales and profitability. We may also have to write off inventory in the event that we hold unsaleable inventory as a result of changes to regulations or customer requirements. We expect these risks and trends to continue. In addition, we anticipate increased customer requirements to meet voluntary criteria related to the reduction or elimination of substances of high concern in our products and energy efficiency measures. These requirements may increase our own costs, as well as those passed on to us by our supply chain.
Customer demands for us to implement business practices that are more stringent than existing legal requirements may reduce our revenue opportunities or cause us to incur higher costs.
Some of our customers and potential customers are requiring that we implement operating practices that are more stringent than what is required by applicable laws with respect to workplace and labor requirements, the type of materials we use in our products, environmental matters or other items. To comply with such requirements, we may have to pass these same operating practices on to our suppliers. Our suppliers may refuse to implement these operating practices, or may charge us more for complying with them. The cost to implement such practices may cause us to incur higher costs and reduce our profitability, and if we choose not to implement such practices, such customers may disqualify us as a supplier, resulting in decreased revenue opportunities. Developing, administering, monitoring and auditing these customer-requested practices at our own sites and those in our supply chain will increase our costs and may require that we hire more personnel.
Potential U.S. tax legislation regarding our foreign earnings could materially and adversely impact our business and financial results.
Currently, a majority of our revenue is generated from customers located outside the U.S., and a substantial portion of our assets, including employees, are located outside the U.S. Present U.S. income taxes and foreign withholding taxes have not been provided on undistributed earnings for certain of our non-U.S. subsidiaries, because such earnings are intended to be indefinitely reinvested in the operations of those subsidiaries. In recent years, there have been a number of initiatives proposed by the Obama administration and members of Congress regarding the tax treatment of such undistributed earnings. If adopted, certain of these initiatives would substantially reduce our ability to defer U.S. taxes including repealing the deferral of U.S. taxation of foreign earnings, eliminating utilization of or substantially reducing our ability to claim foreign tax credits, and eliminating various tax deductions until foreign earnings are repatriated to the U.S. Changes in tax law such as these proposals could have a material adverse impact on our financial position and results of operations.
Customer demands and new regulations related to conflict-free minerals may force us to incur additional expenses.
As required by the Dodd-Frank Wall Street Reform and Consumer Protection Act, in August 2012, the SEC released investigation, disclosure and reporting requirements regarding the use of "conflict" minerals mined from the Democratic Republic of Congo and adjoining countries and which are necessary to the functionality or production of products. We filed a report on Form SD with the SEC regarding such matters on June 2, 2014 and are required to file annually thereafter. Other countries are considering similar regulations. If we cannot certify that we are using conflict-free minerals, customers may demand that we change the sourcing of minerals and other materials used in the manufacture of our products, even if the costs for compliant minerals and materials significantly increases and availability is limited. If we make changes to materials and/or suppliers, there will likely be costs associated with qualifying new suppliers and production capacity and quality could be negatively impacted. Our relationships with customers and suppliers may be adversely affected if we are unable to certify that our products are "conflict-free." We have incurred, and expect in the future to incur, additional costs associated with complying
20
with these new disclosure requirements, such as costs related to determining the source of any conflict minerals used in our products. We may also encounter challenges to satisfy those customers who require that all of the components of our products be certified as conflict free. If we are not able to meet customer requirements, customers may choose to disqualify us as a supplier and we may have to write off inventory in the event that it cannot be sold.
Regulatory authorities in jurisdictions into which we ship our products could levy fines or restrict our ability to export products.
A significant portion of our sales are made outside of the U.S. through the exporting and re-exporting of products. In addition to local jurisdictions' export regulations, our U.S.-manufactured products or products based on U.S. technology are subject to U.S. laws and regulations governing international trade and exports, including, but not limited to the Foreign Corrupt Practices Act, Export Administration Regulations (EAR), and trade sanctions against embargoed countries and destinations administered by the U.S. Department of the Treasury, Office of Foreign Assets Control (OFAC). Licenses or proper license exceptions are required for the shipment of our products to certain countries. A determination by the U.S. or foreign government that we have failed to comply with these or other export regulations or anti-bribery regulations can result in penalties which may include denial of export privileges, fines, civil or criminal penalties, and seizure of products. Such penalties could have a material adverse effect on our business, sales and earnings. Further, a change in these laws and regulations could restrict our ability to export to previously permitted countries, customers, distributors or other third parties. Any one or more of these sanctions or a change in laws or regulations could have a material adverse effect on our business, financial condition and results of operations.
The outcome of currently ongoing and future examinations of our income tax returns by the IRS could have an adverse effect on our results of operations.
We are subject to examination of our income tax returns by the IRS and other tax authorities for fiscal 2011 and later. We are currently under IRS audit for fiscal 2011 and 2012. We are subject to certain income tax examinations in foreign jurisdictions for fiscal 2007 and later. We regularly assess the likelihood of adverse outcomes resulting from these examinations to determine the adequacy of our provision for income taxes. There can be no assurance that the outcomes from these continuing examinations will not have an adverse effect on our future operating results.
The future trading price of our common stock could be subject to wide fluctuations in response to a variety of factors.
The market price of our common stock has fluctuated significantly in the past and is likely to fluctuate in the future. The future trading price of our common stock could be subject to wide fluctuations in response to a variety of factors, many of which are beyond our control, including, but not limited to:
• | quarterly variations in our operating results or the operating results of other technology companies; |
• | general conditions in the semiconductor industry; |
• | global economic and financial conditions; |
• | changes in our financial guidance or our failure to meet such guidance; |
• | changes in analysts' estimates of our financial performance or buy/sell recommendations; |
• | any acquisitions we pursue or complete; and |
• | actual or anticipated announcements of technical innovations or new products by us or our competitors. |
In addition, the stock market has from time to time experienced significant price and volume fluctuations that have affected the market prices for many companies and that often have been unrelated to the operating performance of such companies. These broad market fluctuations and other factors have harmed and may harm the market price of our common stock. Some or all of the foregoing factors could also cause the market price of our convertible debentures to decline or fluctuate substantially.
We may in the future incur impairments to goodwill or long-lived assets.
We review our long-lived assets, including goodwill and other intangible assets, for impairment annually in the fourth fiscal quarter or whenever events or changes in circumstances indicate that the carrying amount of those assets may not be recoverable. Factors that may be considered in assessing whether goodwill or intangible assets may not be recoverable include a decline in our stock price or market capitalization, reduced estimates of future cash flows and slower growth rates in our industry. Our valuation methodology for assessing impairment requires management to make judgments and assumptions based on historical experience and to rely heavily on projections of future operating performance. Because we operate in highly competitive environments, projections of our future operating results and cash flows may vary significantly from our actual results. No goodwill or material long-lived asset impairment charges were recorded in fiscal 2015 or fiscal 2014.
21
Our financial condition and results of operations could be adversely affected if we do not effectively manage our current or future debt.
In February 2015, we amended our credit agreement to increase the revolving credit facility to $2.555 billion and remove the term loan. At March 31, 2015, we had $462.0 million in outstanding borrowings under such credit agreement. Also, in February 2015, we sold $1.725 billion of principal value of our 1.625% senior subordinated convertible debentures. As a result of such transactions, we have a substantially greater amount of debt than we had maintained in the past. Our maintenance of substantial levels of debt could adversely affect our ability to take advantage of corporate opportunities and could adversely affect our financial condition and results of operations. We may need or desire to refinance all or a portion of our loans under our credit agreement, our debentures or any other future indebtedness and there can be no assurance that we will be able to refinance any of our indebtedness on commercially reasonable terms, if at all.
Conversion of our debentures will dilute the ownership interest of existing stockholders, including holders who had previously converted their debentures.
The conversion of some or all of our outstanding debentures will dilute the ownership interest of existing stockholders to the extent we deliver common stock upon conversion of the debentures. Upon conversion, we may satisfy our conversion obligation by delivering cash, shares of common stock or any combination, at our option. If upon conversion we elect to deliver cash for the lesser of the conversion value and principal amount of the debentures, we would pay the holder the cash value of the applicable number of shares of our common stock. Upon conversion, we intend to satisfy the lesser of the principal amount or the conversion value of the debentures in cash. If the conversion value of a debenture exceeds the principal amount of the debenture, we may also elect to deliver cash in lieu of common stock for the conversion value in excess of the one thousand dollars principal amount (i.e., the conversion spread). There would be no adjustment to the numerator in the net income per common share computation for the cash settled portion of the debentures as that portion of the debt instrument will always be settled in cash. The conversion spread will be included in the denominator for the computation of diluted net income per common share. Any sales in the public market of any common stock issuable upon conversion of our debentures could adversely affect prevailing market prices of our common stock. In addition, the existence of the debentures may encourage short selling by market participants because the conversion of the debentures could be used to satisfy short positions, or anticipated conversion of the debentures into shares of our common stock could depress the price of our common stock.
Our reported financial results may be adversely affected by new accounting pronouncements or changes in existing accounting standards and practices.
We prepare our financial statements in conformity with accounting principles generally accepted in the U.S. These accounting principles are subject to interpretation or changes by the FASB and the SEC. New accounting pronouncements and varying interpretations of accounting standards and practices have occurred in the past and are expected to occur in the future. New accounting pronouncements or a change in the interpretation of existing accounting standards or practices may have a significant effect on our reported financial results and may even affect our reporting of transactions completed before the change is announced or effective.
Climate change regulations and sustained adverse climate change pose regulatory and physical risks that could harm our results of operations or affect the way we conduct business.
Climate change regulations could require us to limit emissions, change our manufacturing processes, obtain substitute materials which may cost more or be less available, increase our investment in control technology for greenhouse gas emissions, fund offset projects or undertake other costly activities. These regulations could significantly increase our costs and restrict our manufacturing operations by virtue of requirements for new equipment. New permits may be required for our current operations, or expansions thereof. Failure to timely receive permits could result in fines, suspension of production, or cessation of operations at one or more facilities. In addition, restrictions on carbon dioxide or other greenhouse gas emissions could result in significant costs such as higher energy costs, and utility companies passing down carbon taxes, emission cap and trade programs and renewable portfolio standards. The cost of complying, or of failing to comply, with these and other climate change and emissions regulations could have an adverse effect on our operating results.
Further, any sustained adverse change in climate could have a direct adverse economic impact on us, such as water and power shortages, and higher costs of water or energy to control the temperature of our facilities. Certain of our operations are located in arid or tropical regions, such as Arizona and Thailand. Some environmental experts predict that these regions may become vulnerable to storms, severe floods and droughts due to climate change. While we maintain business recovery plans that are intended to allow us to recover from natural disasters or other events that can interrupt business, we cannot be certain that our plans will protect us from all such disasters or events.
22
Item 1B. UNRESOLVED STAFF COMMENTS
None.
Item 2. PROPERTIES
At March 31, 2015, we owned the facilities described below:
Location | Approximate Total Sq. Ft. | Uses | ||
Chandler, Arizona | 415,000 | Executive and Administrative Offices; Wafer Probe; R&D Center; Sales and Marketing; and Computer and Service Functions | ||
Tempe, Arizona | 379,000 | Wafer Fabrication (Fab 2); R&D Center; Administrative Offices; and Warehousing | ||
Gresham, Oregon | 826,500 | Wafer Fabrication (Fab 4); R&D Center; Administrative Offices; and Warehousing | ||
Chacherngsao, Thailand | 489,000 | Assembly and Test; Wafer Probe; Sample Center; Warehousing; and Administrative Offices | ||
Chacherngsao, Thailand | 215,000 | Assembly and Test | ||
Bangalore, India | 232,000 | Research and Development; Sales and Marketing Support, and Administrative Offices | ||
Karlsruhe, Germany | 44,500 | Research and Development; Marketing Support, and Administrative Offices | ||
Shanghai, China | 21,000 | Research and Development; Marketing Support, and Administrative Offices | ||
In addition to the facilities we own, we lease several research and development facilities and sales offices in North America, Europe and Asia. Our aggregate monthly rental payment for our leased facilities is approximately $1.5 million.
We currently believe that our existing facilities are suitable and will be adequate to meet our requirements for at least the next 12 months.
See page 38 for a discussion of the capacity utilization of our manufacturing facilities.
Item 3. LEGAL PROCEEDINGS
In the ordinary course of our business, we are involved in a limited number of legal actions, both as plaintiff and defendant. Consequently, we could incur uninsured liability in any of those actions. We also periodically receive notifications from various third parties alleging infringement of patents or other intellectual property rights. With respect to pending legal actions to which we are a party, although the outcomes of these actions are generally not determinable, we believe that the ultimate resolution of these matters will not harm our business and will not have a material adverse effect on our financial position, cash flows or results of operations. Litigation relating to the semiconductor industry is not uncommon, and we are, from time to time, subject to such litigation. As a result, no assurances can be given with respect to the extent or outcome of any such litigation in the future.
Item 4. MINE SAFETY DISCLOSURES
Not applicable.
PART II
Item 5. MARKET FOR REGISTRANT'S COMMON EQUITY AND RELATED STOCKHOLDER MATTERS
Our common stock is traded on the NASDAQ Global Market under the symbol "MCHP." The following table sets forth the quarterly high and low closing prices of our common stock as reported by NASDAQ for our last two fiscal years.
23
Fiscal 2015 | High | Low | Fiscal 2014 | High | Low | |||||
First Quarter | $49.48 | $45.85 | First Quarter | $38.04 | $34.23 | |||||
Second Quarter | $49.83 | $45.02 | Second Quarter | $41.69 | $37.37 | |||||
Third Quarter | $46.59 | $37.73 | Third Quarter | $44.75 | $38.82 | |||||
Fourth Quarter | $52.41 | $43.02 | Fourth Quarter | $48.09 | $43.61 | |||||
Stock Price Performance Graph
The following graph and table show a comparison of the five-year cumulative total stockholder return, calculated on a dividend reinvestment basis, for Microchip Technology Incorporated, the Standard & Poor's (S&P) 500 Stock Index, and the Philadelphia Semiconductor Index.
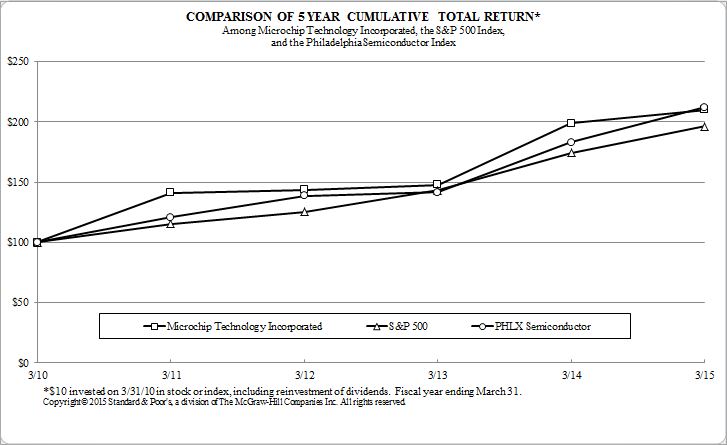
Cumulative Total Return | ||||||||||||
March 2010 | March 2011 | March 2012 | March 2013 | March 2014 | March 2015 | |||||||
Microchip Technology Incorporated | 100.00 | 141.03 | 143.53 | 147.98 | 199.01 | 210.05 | ||||||
S&P 500 Stock Index | 100.00 | 115.65 | 125.52 | 143.05 | 174.31 | 196.51 | ||||||
Philadelphia Semiconductor Index | 100.00 | 120.82 | 138.79 | 141.42 | 182.91 | 212.08 | ||||||
Data acquired by Research Data Group, Inc. (www.researchdatagroup.com)
On May 20, 2015, there were approximately 280 holders of record of our common stock. This figure does not reflect beneficial ownership of shares held in nominee names.
24
We have been declaring and paying quarterly cash dividends on our common stock since the third quarter of fiscal 2003. Our total cash dividends paid were $286.5 million, $281.2 million and $273.8 million in fiscal 2015, fiscal 2014 and fiscal 2013, respectively. The following table sets forth our quarterly cash dividends per common share and the total amount of the dividend payment for each quarter in fiscal 2015 and fiscal 2014 (amounts in thousands, except per share amounts):
Fiscal 2015 | Dividends per Common Share | Aggregate Amount of Dividend Payment | Fiscal 2014 | Dividends per Common Share | Aggregate Amount of Dividend Payment | |||||||||||||
First Quarter | $ | 0.3555 | $ | 71,202 | First Quarter | $ | 0.3535 | $ | 69,682 | |||||||||
Second Quarter | 0.3560 | 71,442 | Second Quarter | 0.3540 | 70,086 | |||||||||||||
Third Quarter | 0.3565 | 71,787 | Third Quarter | 0.3545 | 70,554 | |||||||||||||
Fourth Quarter | 0.3570 | 72,047 | Fourth Quarter | 0.3550 | 70,882 | |||||||||||||
On May 7, 2015, we declared a quarterly cash dividend of $0.3575 per share, which will be paid on June 4, 2015 to stockholders of record on May 21, 2015 and the total amount of such dividend is expected to be approximately $72.4 million. Our Board of Directors is free to change our dividend practices at any time and to increase or decrease the dividend paid, or not to pay a dividend, on our common stock on the basis of our results of operations, financial condition, cash requirements and future prospects, and other factors deemed relevant by our Board of Directors. Our current intent is to provide for ongoing quarterly cash dividends depending upon market conditions and our results of operations.
Please refer to "Item 12 - Security Ownership Of Certain Beneficial Owners And Management And Related Stockholder Matters," at page 49 below, for the information required by Item 201(d) of Regulation S-K with respect to securities authorized for issuance under our equity compensation plans at March 31, 2015.
Item 6. SELECTED FINANCIAL DATA
You should read the following selected consolidated financial data for the five-year period ended March 31, 2015 in conjunction with our consolidated financial statements and notes thereto and "Management's Discussion and Analysis of Financial Condition and Results of Operations" included in Items 7 and 8 of this Form 10-K. Our consolidated statements of income data for each of the years in the three-year period ended March 31, 2015, and the balance sheet data as of March 31, 2015 and 2014, are derived from our audited consolidated financial statements, included in Item 8 of this Form 10-K. The statement of income data for the years ended March 31, 2012 and 2011 and balance sheet data as of March 31, 2013, 2012 and 2011 have been derived from our audited consolidated financial statements not included herein (in the tables below all amounts are in thousands, except per share data).
25
Statement of Income Data:
Year ended March 31, | ||||||||||||||||||||
2015 (1) | 2014 | 2013 (1) | 2012 | 2011 | ||||||||||||||||
Net sales | $ | 2,147,036 | $ | 1,931,217 | $ | 1,581,623 | $ | 1,383,176 | $ | 1,487,205 | ||||||||||
Cost of sales | 917,472 | 802,474 | 743,164 | 583,882 | 605,954 | |||||||||||||||
Research and development | 349,543 | 305,043 | 254,723 | 182,650 | 170,607 | |||||||||||||||
Selling, general and administrative | 274,815 | 267,278 | 261,471 | 208,328 | 222,184 | |||||||||||||||
Amortization of acquired intangible assets | 176,746 | 94,534 | 111,537 | 10,963 | 12,412 | |||||||||||||||
Special charges, net (2) | 2,840 | 3,024 | 32,175 | 837 | 1,865 | |||||||||||||||
Operating income | 425,620 | 458,864 | 178,553 | 396,516 | 474,183 | |||||||||||||||
(Losses) gains on equity method investments | (317 | ) | (177 | ) | (617 | ) | (195 | ) | 157 | |||||||||||
Interest income | 19,527 | 16,485 | 15,560 | 17,992 | 16,002 | |||||||||||||||
Interest expense | (62,034 | ) | (48,716 | ) | (40,915 | ) | (34,266 | ) | (31,521 | ) | ||||||||||
Loss on retirement of convertible debentures (3) | (50,631 | ) | — | — | — | — | ||||||||||||||
Other income (expense), net | 13,742 | 5,898 | (404 | ) | (352 | ) | 1,877 | |||||||||||||
Income from continuing operations before income taxes | 345,907 | 432,354 | 152,177 | 379,695 | 460,698 | |||||||||||||||
Income tax (benefit) provision | (19,418 | ) | 37,073 | 24,788 | 42,990 | 31,531 | ||||||||||||||
Net income from continuing operations | 365,325 | 395,281 | 127,389 | 336,705 | 429,167 | |||||||||||||||
Less: Net loss attributable to noncontrolling interests | 3,684 | — | — | — | — | |||||||||||||||
Net income from continuing operations attributable to Microchip Technology | $ | 369,009 | $ | 395,281 | $ | 127,389 | $ | 336,705 | $ | 429,167 | ||||||||||
Basic net income per common share from continuing operations attributable to Microchip Technology stockholders | $ | 1.84 | $ | 1.99 | $ | 0.65 | $ | 1.76 | $ | 2.29 | ||||||||||
Diluted net income per common share from continuing operations attributable to Microchip Technology stockholders | $ | 1.65 | $ | 1.82 | $ | 0.62 | $ | 1.65 | $ | 2.20 | ||||||||||
Dividends declared per common share | $ | 1.425 | $ | 1.417 | $ | 1.406 | $ | 1.390 | $ | 1.374 | ||||||||||
Basic common shares outstanding | 200,937 | 198,291 | 194,595 | 191,283 | 187,066 | |||||||||||||||
Diluted common shares outstanding | 223,561 | 217,630 | 205,776 | 203,519 | 194,715 | |||||||||||||||
(1) | Refer to Note 2 to our consolidated financial statements for an explanation of our material business combinations during fiscal 2015 and fiscal 2013. |
(2) The following table presents a summary of special charges for the five-year period ended March 31, 2015:
March 31, | ||||||||||||||||||||
2015 | 2014 | 2013 | 2012 | 2011 | ||||||||||||||||
Acquisition related expenses | $ | 2,840 | $ | 1,654 | $ | 16,259 | $ | 340 | $ | 1,865 | ||||||||||
Legal settlement | — | — | 11,516 | — | — | |||||||||||||||
Adjustment to contingent consideration | — | 1,370 | 4,400 | (1,000 | ) | — | ||||||||||||||
Patent licenses | — | — | — | 1,497 | — | |||||||||||||||
Totals | $ | 2,840 | $ | 3,024 | $ | 32,175 | $ | 837 | $ | 1,865 | ||||||||||
26
Discussions of the special charges for fiscal 2015, fiscal 2014 and fiscal 2013 are contained in Note 3 to our consolidated financial statements.
During fiscal 2012, special charges included a benefit of $0.7 million of special income comprised of a $1.0 million favorable adjustment to contingent consideration offset by $0.3 million of severance-related charges related to a prior year acquisition. During the fourth quarter of fiscal 2012, we agreed to the terms of a patent license with an unrelated third party and signed an agreement on March 20, 2012. The patent license settled alleged infringement claims. The total payment made to the third-party in March 2012 was $2.8 million, $1.5 million of which was expensed in the fourth quarter of fiscal 2012 and the remaining $1.3 million was recorded as a prepaid royalty which will be amortized over the remaining life of the patents, which expires in December 2018.
During fiscal 2011, we incurred $1.9 million of severance-related and office closure costs associated with our acquisition of Silicon Storage Technology, Inc.
(3) Refer to Note 15 to our consolidated financial statements for an explanation of the loss on retirement of convertible debentures of approximately $50.6 million in fiscal 2015.
Balance Sheet Data:
March 31, | ||||||||||||||||||||
2015 | 2014 | 2013 | 2012 | 2011 | ||||||||||||||||
Working capital | $ | 2,310,645 | $ | 1,633,320 | $ | 1,894,759 | $ | 1,767,988 | $ | 1,434,667 | ||||||||||
Total assets | 4,780,713 | 4,067,630 | 3,851,405 | 3,083,776 | 2,968,058 | |||||||||||||||
Long-term obligations, less current portion | 1,826,858 | 1,003,258 | 983,385 | 355,050 | 347,334 | |||||||||||||||
Microchip Technology Stockholders' equity | 2,044,654 | 2,135,461 | 1,933,470 | 1,990,673 | 1,812,438 | |||||||||||||||
27
Item 7. | MANAGEMENT'S DISCUSSION AND ANALYSIS OF FINANCIAL CONDITION AND RESULTS OF OPERATIONS |
Note Regarding Forward-looking Statements
This report, including "Item 1 – Business," "Item 1A – Risk Factors," and "Item 7 – Management's Discussion and Analysis of Financial Condition and Results of Operations," contains certain forward-looking statements that involve risks and uncertainties, including statements regarding our strategy, financial performance and revenue sources. We use words such as "anticipate," "believe," "plan," "expect," "estimate," "future," "continue," "intend" and similar expressions to identify forward-looking statements. These forward-looking statements include, without limitation, statements regarding the following:
• | The effects that adverse global economic conditions and fluctuations in the global credit and equity markets may have on our financial condition and results of operations; |
• | The effects and amount of competitive pricing pressure on our product lines; |
• | Our ability to moderate future average selling price declines; |
• | The effect of product mix, capacity utilization, yields, fixed cost absorption, competition and economic conditions on gross margin; |
• | The amount of, and changes in, demand for our products and those of our customers; |
• | Our expectation that in the future we will acquire additional business that we believe will complement our existing businesses; |
• | Our expectation that in the future we will enter into joint development agreements or other business or strategic relationships with other companies; |
• | The level of orders that will be received and shipped within a quarter; |
• | Our expectation that our inventory levels will increase between 3 and 9 days in the June 2015 quarter compared to the March 2015 quarter and that it will allow us to maintain competitive lead times and provide strong delivery performance to our customers; |
• | The effect that distributor and customer inventory holding patterns will have on us; |
• | Our belief that customers recognize our products and brand name and use distributors as an effective supply channel; |
• | Our belief that deferred cost of sales are recorded at their approximate carrying value and will have low risk of material impairment; |
• | Our belief that our direct sales personnel combined with our distributors provide an effective means of reaching our customer base; |
• | Our ability to increase the proprietary portion of our analog, interface and mixed signal product lines and the effect of such an increase; |
• | Our belief that our processes afford us both cost-effective designs in existing and derivative products and greater functionality in new product designs; |
• | The impact of any supply disruption we may experience; |
• | Our ability to effectively utilize our facilities at appropriate capacity levels and anticipated costs; |
• | That we adjust capacity utilization to respond to actual and anticipated business and industry-related conditions; |
• | That our existing facilities will provide sufficient capacity to respond to increases in demand with modest incremental capital expenditures; |
• | That manufacturing costs will be reduced by transition to advanced process technologies; |
• | Our ability to maintain manufacturing yields; |
• | Continuing our investments in new and enhanced products; |
• | The cost effectiveness of using our own assembly and test operations; |
• | Our anticipated level of capital expenditures; |
• | Continuation and amount of quarterly cash dividends; |
• | The sufficiency of our existing sources of liquidity to finance anticipated capital expenditures and otherwise meet our anticipated cash requirements, and the effects that our contractual obligations are expected to have on them; |
• | The impact of seasonality on our business; |
• | The accuracy of our estimates used in valuing employee equity awards; |
• | That the resolution of legal actions will not have a material effect on our business, and the accuracy of our assessment of the probability of loss and range of potential loss; |
• | The recoverability of our deferred tax assets; |
• | The adequacy of our tax reserves to offset any potential tax liabilities, having the appropriate support for our income tax positions and the accuracy of our estimated tax rate; |
• | Our belief that the expiration of any tax holidays will not have a material impact on our overall tax expense or effective tax rate; |
28
• | Our belief that the estimates used in preparing our consolidated financial statements are reasonable; |
• | Our belief that recently issued accounting pronouncements listed in this document will not have a material impact on our consolidated financial statements; |
• | The accuracy of our estimates of the useful life and values of our property, assets and other liabilities; |
• | The adequacy of our patent strategy, and our belief that the impact of the expiration of any particular patent will not have a material effect on our business; |
• | Our actions to vigorously and aggressively defend and protect our intellectual property on a worldwide basis; |
• | Our ability to obtain patents and intellectual property licenses and minimize the effects of litigation; |
• | The level of risk we are exposed to for product liability or indemnification claims; |
• | The effect of fluctuations in market interest rates on our income and/or cash flows; |
• | The effect of fluctuations in currency rates; |
• | Our belief that any unrealized losses represent an other-than-temporary impairment based on our evaluation of available evidence and our intent to hold these investments until these assets are no longer impaired; |
• | That a significant portion of our future cash generation will be in our foreign subsidiaries; |
• | Our intention to satisfy the lesser of the principal amount or the conversion value of our debenture in cash; |
• | Our intention to indefinitely reinvest undistributed earnings of certain non-US subsidiaries in those subsidiaries; |
• | Our intent to maintain a high-quality investment portfolio that preserves principal, meets liquidity needs, avoids inappropriate concentrations and delivers an appropriate yield; and |
• | Our ability to collect accounts receivable. |
Our actual results could differ materially from the results anticipated in these forward-looking statements as a result of certain factors including those set forth in "Item 1A – Risk Factors," and elsewhere in this Form 10-K. Although we believe that the expectations reflected in our forward-looking statements are reasonable, we cannot guarantee future results, levels of activity, performance or achievements. You should not place undue reliance on these forward-looking statements. We disclaim any obligation to update the information contained in any forward-looking statement.
Introduction
The following discussion should be read in conjunction with the consolidated financial statements and the related notes that appear elsewhere in this document, as well as with other sections of this Annual Report on Form 10-K, including "Item 1 – Business;" "Item 6 – Selected Financial Data;" and "Item 8 – Financial Statements and Supplementary Data."
We begin our Management's Discussion and Analysis of Financial Condition and Results of Operations (MD&A) with a summary of our overall business strategy to give the reader an overview of the goals of our business and the overall direction of our business and products. This is followed by a discussion of the Critical Accounting Policies and Estimates that we believe are important to understanding the assumptions and judgments incorporated in our reported financial results. In the next section, beginning at page 34, we discuss our Results of Operations for fiscal 2015 compared to fiscal 2014, and for fiscal 2014 compared to fiscal 2013. We then provide an analysis of changes in our balance sheet and cash flows, and discuss our financial commitments in the sections titled "Liquidity and Capital Resources," "Contractual Obligations" and "Off-Balance Sheet Arrangements."
Strategy
Our goal is to be a worldwide leader in providing specialized semiconductor products for a wide variety of embedded control applications. Our strategic focus is on the embedded control market, which includes microcontrollers, high-performance linear and mixed signal devices, power management and thermal management devices, connectivity devices, interface devices, Serial EEPROMs, SuperFlash memory products, our patented KeeLoq® security devices and Flash IP solutions. We provide highly cost-effective embedded control products that also offer the advantages of small size, high performance, low voltage/power operation and ease of development, enabling timely and cost-effective embedded control product integration by our customers. We license our SuperFlash technology and other technologies to wafer foundries, integrated device manufacturers and design partners throughout the world for use in the manufacture of advanced microcontroller products.
We sell our products to a broad base of domestic and international customers across a variety of industries. The principal markets that we serve include consumer, automotive, industrial, office automation and telecommunications. Our business is subject to fluctuations based on economic conditions within these markets.
29
Our manufacturing operations include wafer fabrication, wafer probe and assembly and test. The ownership of a substantial portion of our manufacturing resources is an important component of our business strategy, enabling us to maintain a high level of manufacturing control resulting in us being one of the lowest cost producers in the embedded control industry. By owning wafer fabrication facilities and our assembly and test operations, and by employing statistical process control techniques, we have been able to achieve and maintain high production yields. Direct control over manufacturing resources allows us to shorten our design and production cycles. This control also allows us to capture a portion of the wafer manufacturing and the assembly and test profit margin. We do outsource a significant portion of our manufacturing requirements to third parties.
We employ proprietary design and manufacturing processes in developing our embedded control products. We believe our processes afford us both cost-effective designs in existing and derivative products and greater functionality in new product designs. While many of our competitors develop and optimize separate processes for their logic and memory product lines, we use a common process technology for both microcontroller and non-volatile memory products. This allows us to more fully leverage our process research and development costs and to deliver new products to market more rapidly. Our engineers utilize advanced computer-aided design (CAD) tools and software to perform circuit design, simulation and layout, and our in-house photomask and wafer fabrication facilities enable us to rapidly verify design techniques by processing test wafers quickly and efficiently.
We are committed to continuing our investment in new and enhanced products, including development systems, and in our design and manufacturing process technologies. We believe these investments are significant factors in maintaining our competitive position. Our current research and development activities focus on the design of new microcontrollers, digital signal controllers, memory, analog and mixed-signal products, Flash-IP systems, development systems, software and application-specific software libraries. We are also developing new design and process technologies to achieve further cost reductions and performance improvements in our products.
We market and sell our products worldwide primarily through a network of direct sales personnel and distributors. Our distributors focus primarily on servicing the product and technical support requirements of a broad base of diverse customers. We believe that our direct sales personnel combined with our distributors provide an effective means of reaching this broad and diverse customer base. Our direct sales force focuses primarily on major strategic accounts in three geographical markets: the Americas, Europe and Asia. We currently maintain sales and support centers in major metropolitan areas in North America, Europe and Asia. We believe that a strong technical service presence is essential to the continued development of the embedded control market. Many of our field sales engineers (FSEs), field application engineers (FAEs), and sales management personnel have technical degrees and have been previously employed in an engineering environment. We believe that the technical knowledge of our sales force is a key competitive advantage in the sale of our products. The primary mission of our FAE team is to provide technical assistance to strategic accounts and to conduct periodic training sessions for FSEs and distributor sales teams. FAEs also frequently conduct technical seminars for our customers in major cities around the world, and work closely with our distributors to provide technical assistance and end-user support.
See "Our operating results are impacted by both seasonality and the wide fluctuation of supply and demand in the semiconductor industry," on page 14 for discussion of the impact of seasonality on our business.
Critical Accounting Policies and Estimates
General
Our discussion and analysis of our financial condition and results of operations is based upon our consolidated financial statements, which have been prepared in accordance with accounting principles generally accepted in the U.S. We review the accounting policies we use in reporting our financial results on a regular basis. The preparation of these financial statements requires us to make estimates and judgments that affect the reported amounts of assets, liabilities, revenues and expenses and related disclosure of contingent liabilities. On an ongoing basis, we evaluate our estimates, including those related to revenue recognition, business combinations, share-based compensation, inventories, income taxes, senior and junior subordinated convertible debentures and contingencies. We base our estimates on historical experience and on various other assumptions that are believed to be reasonable under the circumstances, the results of which form the basis for making judgments about the carrying value of assets and liabilities that are not readily apparent from other sources. Our results may differ from these
30
estimates due to actual outcomes being different from those on which we based our assumptions. We review these estimates and judgments on an ongoing basis. We believe the following critical accounting policies affect our more significant judgments and estimates used in the preparation of our consolidated financial statements. We also have other policies that we consider key accounting policies, such as our policy regarding revenue recognition to original equipment manufacturers (OEMs); however, we do not believe these policies require us to make estimates or judgments that are as difficult or subjective as our policies described below.
Revenue Recognition – Distributors
Our distributors worldwide generally have broad price protection and product return rights, so we defer revenue recognition until the distributor sells the product to their customer. Revenue is recognized when the distributor sells the product to an end-user, at which time the sales price becomes fixed or determinable. Revenue is not recognized upon shipment to our distributors since, due to discounts from list price as well as price protection rights, the sales price is not substantially fixed or determinable at that time. At the time of shipment to these distributors, we record a trade receivable for the selling price as there is a legally enforceable right to payment, relieve inventory for the carrying value of goods shipped since legal title has passed to the distributor, and record the gross margin in deferred income on shipments to distributors on our consolidated balance sheets.
Deferred income on shipments to distributors effectively represents the gross margin on the sale to the distributor; however, the amount of gross margin that we recognize in future periods could be less than the deferred margin as a result of credits granted to distributors on specifically identified products and customers to allow the distributors to earn a competitive gross margin on the sale of our products to their end customers and price protection concessions related to market pricing conditions.
We sell the majority of the items in our product catalog to our distributors worldwide at a uniform list price. However, distributors resell our products to end customers at a very broad range of individually negotiated price points. The majority of our distributors' resales require a reduction from the original list price paid. Often, under these circumstances, we remit back to the distributor a portion of their original purchase price after the resale transaction is completed in the form of a credit against the distributors' outstanding accounts receivable balance. The credits are on a per unit basis and are not given to the distributor until they provide information to us regarding the sale to their end customer. The price reductions vary significantly based on the customer, product, quantity ordered, geographic location and other factors and discounts to a price less than our cost have historically been rare. The effect of granting these credits establishes the net selling price to our distributors for the product and results in the net revenue recognized by us when the product is sold by the distributors to their end customers. Thus, a portion of the "deferred income on shipments to distributors" balance represents the amount of distributors' original purchase price that will be credited back to the distributor in the future. The wide range and variability of negotiated price concessions granted to distributors does not allow us to accurately estimate the portion of the balance in the deferred income on shipments to distributors account that will be credited back to the distributors. Therefore, we do not reduce deferred income on shipments to distributors or accounts receivable by anticipated future concessions; rather, price concessions are typically recorded against deferred income on shipments to distributors and accounts receivable when incurred, which is generally at the time the distributor sells the product. At March 31, 2015, we had approximately $260.9 million of deferred revenue and $94.8 million in deferred cost of sales recognized as $166.1 million of deferred income on shipments to distributors. At March 31, 2014, we
had approximately $222.8 million of deferred revenue and $75.0 million in deferred cost of sales recognized as $147.8 million of deferred income on shipments to distributors. The deferred income on shipments to distributors that will ultimately be recognized in our income statement will be lower than the amount reflected on the balance sheet due to additional price credits to be granted to the distributors when the product is sold to their customers. These additional price credits historically have resulted in the deferred income approximating the overall gross margins that we recognize in the distribution channel of our business.
Distributor advances, reflected as a reduction of deferred income on shipments to distributors on our consolidated balance sheets, totaled $116.0 million at March 31, 2015 and $92.8 million at March 31, 2014. On sales to distributors, our payment terms generally require the distributor to settle amounts owed to us for an amount in excess of their ultimate cost. The sales price to our distributors may be higher than the amount that the distributors will ultimately owe us because distributors often negotiate price reductions after purchasing products from us and such reductions are often significant. It is our practice to apply these negotiated price discounts to future purchases, requiring the distributor to settle receivable balances, on a current basis, generally within 30 days, for amounts originally invoiced. This practice has an adverse impact on the working capital of our distributors. As such, we have entered into agreements with certain distributors whereby we advance cash to the distributors to reduce the distributor's working capital requirements. These advances are reconciled at least on a quarterly basis and are estimated based on the amount of ending inventory as reported by the distributor multiplied by a negotiated percentage. Such advances have no impact on our revenue recognition or our consolidated statements of income. We process
31
discounts taken by distributors against our deferred income on shipments to distributors' balance and true-up the advanced amounts generally after the end of each completed fiscal quarter. The terms of these advances are set forth in binding legal agreements and are unsecured, bear no interest on unsettled balances and are due upon demand. The agreements governing these advances can be canceled by us at any time.
We reduce product pricing through price protection based on market conditions, competitive considerations and other factors. Price protection is granted to distributors on the inventory they have on hand at the date the price protection is offered. When we reduce the price of our products, it allows the distributor to claim a credit against its outstanding accounts receivable balances based on the new price of the inventory it has on hand as of the date of the price reduction. There is no immediate revenue impact from the price protection, as it is reflected as a reduction of the deferred income on shipments to distributors' balance.
Products returned by distributors and subsequently scrapped have historically been immaterial to our consolidated results of operations. We routinely evaluate the risk of impairment of the deferred cost of sales component of the deferred income on shipments to distributors account. Because of the historically immaterial amounts of inventory that have been scrapped, and historically rare instances where discounts given to a distributor result in a price less than our cost, we believe the deferred costs are recorded at their approximate carrying value.
Business Combinations
All of our business combinations are accounted for at fair value under the acquisition method of accounting. Under the acquisition method of accounting, (i) acquisition-related costs, except for those costs incurred to issue debt or equity securities, will be expensed in the period incurred; (ii) non-controlling interests will be valued at fair value at the acquisition date; (iii) in-process research and development will be recorded at fair value as an intangible asset at the acquisition date and amortized once the technology reaches technological feasibility; (iv) restructuring costs associated with a business combination will be expensed subsequent to the acquisition date; and (v) changes in deferred tax asset valuation allowances and income tax uncertainties after the acquisition date will be recognized through income tax expense or directly in contributed capital. The measurement of the fair value of assets acquired and liabilities assumed requires significant judgment. The valuation of intangible assets and acquired investments, in particular, requires that we use valuation techniques such as the income approach. The income approach includes the use of a discounted cash flow model, which includes discounted cash flow scenarios and requires the following significant estimates: revenue, expenses, capital spending and other costs, and discount rates based on the respective risks of the cash flows. The valuation of non-marketable equity investments acquired also takes into account variables such as conditions reflected in the capital markets, recent financing activity by the investees, the investees' capital structure and the terms of the investees' issued interests. Under the acquisition method of accounting, the aggregate amount of consideration we pay for a company is allocated to net tangible assets and intangible assets based on their estimated fair values as of the acquisition date. The excess of the purchase price over the value of the net tangible assets and intangible assets is recorded to goodwill. On an annual basis, we test goodwill for impairment and through March 31, 2015, we have never recorded an impairment charge against our goodwill balance.
Share-based Compensation
We measure at fair value and recognize compensation expense for all share-based payment awards, including grants of employee stock options, restricted stock units (RSUs) and employee stock purchase rights, to be recognized in our financial statements based on their respective grant date fair values. Total share-based compensation in fiscal 2015 was $58.6 million, of which $49.6 million was reflected in operating expenses. Total share-based compensation included in cost of sales in fiscal 2015 was $9.0 million. Total share-based compensation included in our inventory balance was $4.1 million at March 31, 2015.
Determining the appropriate fair-value model and calculating the fair value of share-based awards at the date of grant requires judgment. The fair value of our RSUs is based on the fair market value of our common stock on the date of grant discounted for expected future dividends. We use the Black-Scholes option pricing model to estimate the fair value of employee stock options and rights to purchase shares under our employee stock purchase plans. Option pricing models, including the Black-Scholes model, require the use of input assumptions, including expected volatility, expected life, expected dividend rate, and expected risk-free rate of return. We use a blend of historical and implied volatility based on options freely traded in the open market as we believe this is most reflective of market conditions and a better indicator of expected volatility than using purely historical volatility. The expected life of the awards is based on historical and other economic data trended into the future. The risk-free interest rate assumption is based on observed interest rates appropriate for the terms of our awards. The dividend yield assumption is based on our history and expectation of future dividend payouts. We estimate the number of share-based awards that will be forfeited due to employee turnover. Quarterly changes in the estimated forfeiture rate can have a significant effect on reported share-based compensation, as the impact on prior period amortization for all
32
unvested awards is recognized in the period the forfeiture estimate is changed. If the actual forfeiture rate is higher or lower than the estimated forfeiture rate, then an adjustment is made to increase or decrease the estimated forfeiture rate, which will result in a decrease or increase to the expense recognized in our financial statements. If forfeiture adjustments are made, they would affect our gross margin, research and development expenses, and selling, general, and administrative expenses. The effect of forfeiture adjustments in fiscal 2015 was immaterial.
We evaluate the assumptions used to value our awards on a quarterly basis. If factors change and we employ different assumptions, share-based compensation expense may differ significantly from what we have recorded in the past. If there are any modifications or cancellations of the underlying unvested securities, we may be required to accelerate, increase or cancel any remaining unearned share-based compensation expense. Future share-based compensation expense and unearned share-based compensation will increase to the extent that we grant additional equity awards to employees or we assume unvested equity awards in connection with acquisitions.
Inventories
Inventories are valued at the lower of cost or market using the first-in, first-out method. We write down our inventory for estimated obsolescence or unmarketable inventory in an amount equal to the difference between the cost of inventory and the estimated market value based upon assumptions about future demand and market conditions. If actual market conditions are less favorable than those we projected, additional inventory write-downs may be required. Inventory impairment charges establish a new cost basis for inventory and charges are not subsequently reversed to income even if circumstances later suggest that increased carrying amounts are recoverable. In estimating our inventory obsolescence, we primarily evaluate estimates of demand over a 12-month period and record impairment charges for inventory on hand in excess of the estimated 12-month demand. Estimates for projected 12-month demand are generally based on the average shipments of the prior three-month period, which are then annualized to adjust for any potential seasonality in our business. The estimated 12-month demand is compared to our most recently developed sales forecast to further reconcile the 12-month demand estimate. Management reviews and adjusts the estimates as appropriate based on specific situations. For example, demand can be adjusted up for new products for which historic sales are not representative of future demand. Alternatively, demand can be adjusted down to the extent any existing products are being replaced or discontinued.
In periods where our production levels are substantially below our normal operating capacity, the reduced production levels of our manufacturing facilities are charged directly to cost of sales. As a result of production below normal operating levels in our wafer fabrication facilities, approximately $0.8 million, $19.0 million and $31.7 million was charged directly to cost of sales in fiscal 2015, fiscal 2014 and fiscal 2013, respectively.
Income Taxes
As part of the process of preparing our consolidated financial statements, we are required to estimate our income taxes in each of the jurisdictions in which we operate. This process involves estimating our actual current tax exposure together with assessing temporary differences resulting from differing treatment of items for tax and accounting purposes. These differences result in deferred tax assets and liabilities, which are included within our consolidated balance sheets. We must then assess the likelihood that our deferred tax assets will be recovered from future taxable income within the relevant jurisdiction and to the extent we believe that recovery is not likely, we must establish a valuation allowance. We have provided valuation allowances for certain of our deferred tax assets, including state net operating loss carryforwards, foreign tax credits and state tax credits, where it is more likely than not that some portion, or all of such assets, will not be realized. At March 31, 2015, the valuation allowances totaled $81.9 million. Should we determine that we would not be able to realize all or part of our net deferred tax asset in the future, an adjustment to the deferred tax asset would be charged to income in the period such determination was made. At March 31, 2015, our deferred tax asset, net of valuation allowances, was $276.8 million.
Various taxing authorities in the U.S. and other countries in which we do business scrutinize the tax structures employed by businesses. Companies of our size and complexity are regularly audited by the taxing authorities in the jurisdictions in which they conduct significant operations. We are currently under IRS audit for fiscal years 2011 and 2012. We recognize liabilities for anticipated tax audit issues in the U.S. and other tax jurisdictions based on our estimate of whether, and the extent to which, additional tax payments are probable. We believe that we maintain adequate tax reserves to offset any potential tax liabilities that may arise upon these and other pending audits in the U.S. and other countries in which we do business. If such amounts ultimately prove to be unnecessary, the resulting reversal of such reserves would result in tax benefits being recorded in the period the reserves are no longer deemed necessary. If such amounts ultimately prove to be less than an ultimate assessment, a future charge to expense would be recorded in the period in which the assessment is determined.
33
Senior and Junior Subordinated Convertible Debentures
We separately account for the liability and equity components of our senior and junior subordinated convertible debentures in a manner that reflects our nonconvertible debt (unsecured debt) borrowing rate when interest cost is recognized. This results in a bifurcation of a component of the debt, classification of that component in equity and the accretion of the resulting discount on the debt to be recognized as part of interest expense in our consolidated statements of income. Lastly, we include the dilutive effect of the shares of our common stock issuable upon conversion of the outstanding senior and junior subordinated convertible debentures in our diluted income per share calculation regardless of whether the market price triggers or other contingent conversion features have been met. We apply the treasury stock method as we have the intent and have adopted an accounting policy to settle the principal amount of the senior and junior subordinated convertible debentures in cash. This method results in incremental dilutive shares when the average fair value of our common stock for a reporting period exceeds the conversion prices per share, which were $68.17 and $25.09 for the senior and junior subordinated convertible debentures, respectively, at March 31, 2015 and adjusts as dividends are recorded in the future.
Contingencies
In the ordinary course of our business, we are involved in a limited number of legal actions, both as plaintiff and defendant, and could incur uninsured liability in any one or more of them. We also periodically receive notifications from various third parties alleging infringement of patents, intellectual property rights or other matters. With respect to pending legal actions to which we are a party, although the outcomes of these actions are not generally determinable, we believe that the ultimate resolution of these matters will not have a material adverse effect on our financial position, cash flows or results of operations. Litigation relating to the semiconductor industry is not uncommon, and we are, and from time to time have been, subject to such litigation. No assurances can be given with respect to the extent or outcome of any such litigation in the future.
Results of Operations
The following table sets forth certain operational data as a percentage of net sales for the years indicated:
Year Ended March 31, | |||||||||
2015 | 2014 | 2013 | |||||||
Net sales | 100.0 | % | 100.0 | % | 100.0 | % | |||
Cost of sales | 42.7 | 41.6 | 47.0 | ||||||
Gross profit | 57.3 | 58.4 | 53.0 | ||||||
Research and development | 16.3 | 15.8 | 16.1 | ||||||
Selling, general and administrative | 12.8 | 13.8 | 16.5 | ||||||
Amortization of acquired intangible assets | 8.3 | 4.9 | 7.1 | ||||||
Special charges | 0.1 | 0.1 | 2.0 | ||||||
Operating income | 19.8 | % | 23.8 | % | 11.3 | % | |||
Net Sales
We operate in two industry segments and engage primarily in the design, development, manufacture and sale of semiconductor products as well as the licensing of our SuperFlash and other technologies. We sell our products to distributors and original equipment manufacturers, referred to as OEMs, in a broad range of markets, perform ongoing credit evaluations of our customers and generally require no collateral. In certain circumstances, a customer's financial condition may require collateral, and, in such cases, the collateral would be typically provided by letters of credit.
34
Our net sales of $2,147.0 million in fiscal 2015 increased by $215.8 million, or 11.2%, over fiscal 2014, and our net sales of $1,931.2 million in fiscal 2014 increased by $349.6 million, or 22.1%, from fiscal 2013. The increase in net sales in fiscal 2015 over fiscal 2014 was due primarily to our acquisitions of ISSC and Supertex, market share gains and improved general economic and semiconductor industry conditions in the end markets we serve. The increase in net sales in fiscal 2014 over fiscal 2013 was due primarily to general economic and semiconductor industry conditions and market share gains. The increase in net sales in fiscal 2014 over fiscal 2013 was also impacted by our acquisition of SMSC on August 2, 2012. Average selling prices for our semiconductor products were up approximately 2% in fiscal 2015 over fiscal 2014 and were up approximately 4% in fiscal 2014 over fiscal 2013. The number of units of our semiconductor products sold was up approximately 11% in fiscal 2015 over fiscal 2014 and up approximately 17% in fiscal 2014 over fiscal 2013. The average selling prices and the unit volumes of our sales are impacted by the mix of our products sold and overall semiconductor market conditions. Key factors impacting the amount of net sales during the last three fiscal years include:
• | our acquisition of a controlling interest in ISSC on July 17, 2014; |
• | our acquisition of Supertex on April 1, 2014; |
• | global economic conditions in the markets we serve; |
• | semiconductor industry conditions; |
• | our new product offerings that have increased our served available market; |
• | customers' increasing needs for the flexibility offered by our programmable solutions; |
• | inventory holding patterns of our customers; |
• | increasing semiconductor content in our customers' products; |
• | continued market share gains in the segments of the markets we address; and |
• | our acquisition of SMSC in the second quarter of fiscal 2013. |
Net sales by product line for fiscal 2015, 2014 and 2013 were as follows (dollars in thousands):
Year Ended March 31, | ||||||||||||||||||||
2015 | % | 2014 | % | 2013 | % | |||||||||||||||
Microcontrollers | $ | 1,393,607 | 64.9 | $ | 1,260,988 | 65.3 | $ | 1,035,514 | 65.5 | |||||||||||
Analog, interface and mixed signal products | 501,048 | 23.3 | 428,088 | 22.2 | 307,723 | 19.4 | ||||||||||||||
Memory products | 132,258 | 6.2 | 134,624 | 7.0 | 142,557 | 9.0 | ||||||||||||||
Technology licensing | 89,593 | 4.2 | 94,578 | 4.9 | 83,803 | 5.3 | ||||||||||||||
Other | 30,530 | 1.4 | 12,939 | 0.6 | 12,026 | 0.8 | ||||||||||||||
Total net sales | $ | 2,147,036 | 100.0 | $ | 1,931,217 | 100.0 | $ | 1,581,623 | 100.0 | |||||||||||
Microcontrollers
Our microcontroller product line represents the largest component of our total net sales. Microcontrollers and associated application development systems accounted for approximately 64.9% of our net sales in fiscal 2015, approximately 65.3% of our net sales in fiscal 2014 and approximately 65.5% of our net sales in fiscal 2013.
Net sales of our microcontroller products increased approximately 10.5% in fiscal 2015 compared to fiscal 2014, and increased approximately 21.8% in fiscal 2014 compared to fiscal 2013. The increase in net sales in fiscal 2015 compared to fiscal 2014 resulted primarily from our acquisition of ISSC in the second quarter of fiscal 2015, market share gains and improved general economic and semiconductor industry conditions in the end markets we serve including the consumer, automotive, industrial control, communications and computing markets. The increase in net sales in fiscal 2014 compared to fiscal 2013 resulted primarily from our acquisition of SMSC in the second quarter of fiscal 2013, market share gains and general economic and semiconductor industry conditions in the end markets we serve.
Historically, average selling prices in the semiconductor industry decrease over the life of any particular product. The overall average selling prices of our microcontroller products have remained relatively constant over time due to the proprietary nature of these products. We have experienced, and expect to continue to experience, moderate pricing pressure in certain microcontroller product lines, primarily due to competitive conditions. We have in the past been able to, and expect in the future to be able to, moderate average selling price declines in our microcontroller product lines by introducing new products with more features and higher prices. We may be unable to maintain average selling prices for our microcontroller products as a result of increased pricing pressure in the future, which could adversely affect our operating results.
35
Analog, Interface and Mixed Signal Products
Sales of our analog, interface and mixed signal products accounted for approximately 23.3% of our net sales in fiscal 2015, approximately 22.2% of our net sales in fiscal 2014 and approximately 19.4% of our net sales in fiscal 2013.
Net sales of our analog, interface and mixed signal products increased approximately 17.0% in fiscal 2015 compared to fiscal 2014 and increased approximately 39.1% in fiscal 2014 compared to fiscal 2013. The increase in net sales in fiscal 2015 compared to fiscal 2014 was driven primarily by our acquisition of Supertex in the first quarter of fiscal 2015, improved general economic and semiconductor industry conditions and market share gains achieved within the analog, interface and mixed signal market. The increase in net sales in fiscal 2014 compared to fiscal 2013 was driven primarily by our acquisition of SMSC in the second quarter of fiscal 2013, general economic and semiconductor industry conditions and market share gains achieved within the analog, interface and mixed signal market.
Analog, interface and mixed signal products can be proprietary or non-proprietary in nature. Currently, we consider more than 80% of our analog, interface and mixed signal product mix to be proprietary in nature, where prices are relatively stable, similar to the pricing stability experienced in our microcontroller products. The non-proprietary portion of our analog, interface and mixed signal business will experience price fluctuations, driven primarily by the current supply and demand for those products. We may be unable to maintain the average selling prices of our analog, interface and mixed signal products as a result of increased pricing pressure in the future, which could adversely affect our operating results. We anticipate the proprietary portion of our analog, interface and mixed signal products will increase over time.
Memory Products
Sales of our memory products accounted for approximately 6.2% of our net sales in fiscal 2015, approximately 7.0% of our net sales in fiscal 2014 and approximately 9.0% of our net sales in fiscal 2013.
Net sales of our memory products decreased approximately 1.8% in fiscal 2015 compared to fiscal 2014, and decreased approximately 5.6% in fiscal 2014 compared to fiscal 2013. The decreases in memory product net sales in fiscal 2015 compared to fiscal 2014 and in fiscal 2014 compared to fiscal 2013 were driven primarily by customer demand conditions within the Serial EEPROM and Flash memory markets.
Memory product pricing has historically been cyclical in nature, with steep price declines followed by periods of relative price stability, driven by changes in industry capacity at different stages of the business cycle. We have experienced, and expect to continue to experience, varying degrees of competitive pricing pressures in our memory products. We may be unable to maintain the average selling prices of our memory products as a result of increased pricing pressure in the future, which could adversely affect our operating results.
Technology Licensing
Technology licensing revenue includes a combination of royalties associated with licenses for the use of our SuperFlash and other technologies and fees for engineering services. Technology licensing accounted for approximately 4.2% of our net sales in fiscal 2015, approximately 4.9% of our net sales in fiscal 2014 and approximately 5.3% of our net sales in fiscal 2013.
Net sales related to our technology licensing decreased approximately 5.3% in fiscal 2015 compared to fiscal 2014 and increased approximately 12.9% in fiscal 2014 compared to fiscal 2013. Revenue from technology licensing can fluctuate over time based on the production activities of our licensees as well as general economic and semiconductor industry conditions.
Other
Revenue from wafer foundry and assembly and test subcontracting services accounted for approximately 1.4% of our net sales in fiscal 2015, approximately 0.6% of our net sales in fiscal 2014 and approximately 0.8% of our net sales in fiscal 2013.
Distribution
Distributors accounted for approximately 51% of our net sales in fiscal 2015 and approximately 53% of our net sales in each of fiscal 2014 and fiscal 2013.
36
Our two largest distributors together accounted for approximately 12% of our net sales in fiscal 2015, approximately 14% of our net sales in fiscal 2014 and approximately 13% of our net sales in fiscal 2013. No single distributor accounted for more than 10% of our net sales in fiscal 2015, fiscal 2014 or fiscal 2013.
Generally, we do not have long-term agreements with our distributors and we, or our distributors, may terminate our relationship with each other with little or no advanced notice. The loss of, or the disruption in the operations of, one or more of our distributors could reduce our future net sales in a given quarter and could result in an increase in inventory returns.
At March 31, 2015, our distributors maintained 37 days of inventory of our products compared to 33 days at March 31, 2014 and 30 days at March 31, 2013. Over the past five fiscal years, the days of inventory maintained by our distributors have fluctuated between approximately 27 days and 47 days. We do not believe that inventory holding patterns at our distributors will materially impact our net sales, due to the fact that we recognize revenue based on sell-through for all of our distributors.
Net Sales by Geography
Net sales by geography for fiscal 2015, 2014 and 2013 were as follows (dollars in thousands):
Year Ended March 31, | |||||||||||||||||
2015 | % | 2014 | % | 2013 | % | ||||||||||||
Americas | $ | 421,947 | 19.7 | $ | 365,609 | 18.9 | $ | 313,574 | 19.8 | ||||||||
Europe | 452,165 | 21.0 | 411,531 | 21.3 | 344,398 | 21.8 | |||||||||||
Asia | 1,272,924 | 59.3 | 1,154,077 | 59.8 | 923,651 | 58.4 | |||||||||||
Total net sales | $ | 2,147,036 | 100.0 | $ | 1,931,217 | 100.0 | $ | 1,581,623 | 100.0 | ||||||||
Our sales to foreign customers have been predominately in Asia and Europe, which we attribute to the manufacturing strength in those areas for automotive, communications, computing, consumer and industrial control products. Americas sales include sales to customers in the U.S., Canada, Central America and South America.
Sales to foreign customers accounted for approximately 84% of our net sales in each of fiscal 2015 and fiscal 2014, and approximately 83% of our net sales in fiscal 2013. Substantially all of our foreign sales are U.S. dollar denominated. Sales to customers in Asia have generally increased over time due to many of our customers transitioning their manufacturing operations to Asia and growth in demand from the emerging Asian market. Our sales force in the Americas and Europe supports a significant portion of the design activity for products which are ultimately shipped to Asia.
Sales to customers in China, including Hong Kong, accounted for approximately 28% of our net sales in fiscal 2015, approximately 29% of our net sales in fiscal 2014 and approximately 27% of our net sales in fiscal 2013. Sales to customers in Taiwan accounted for approximately 14% of our net sales in fiscal 2015 and approximately 13% of our net sales in each of fiscal 2014 and fiscal 2013. We did not have sales into any other countries that exceeded 10% of our net sales during the last three fiscal years.
Gross Profit
Our gross profit was $1,229.6 million in fiscal 2015, $1,128.7 million in fiscal 2014 and $838.5 million in fiscal 2013. Gross profit as a percentage of sales was 57.3% in fiscal 2015, 58.4% in fiscal 2014 and 53.0% in fiscal 2013.
The most significant factors affecting our gross profit percentage in the periods covered by this report were:
• | charges of approximately $24.4 million in fiscal 2015 and approximately $53.6 million in fiscal 2013 related to the recognition of acquired inventory at fair value as a result of our acquisitions which increased the value of our acquired inventory and reduced our gross margins; |
• | production levels being at or above the range of our normal capacity levels during the last three quarters of fiscal 2015 compared to production levels being below the range of our normal capacity levels during fiscal 2014 and fiscal 2013, resulting in excess capacity charges of approximately $19.0 million in fiscal 2014 and approximately $31.7 million in fiscal 2013; |
• | for each of fiscal 2015 and fiscal 2013, inventory write-downs being higher than the gross margin impact of sales of inventory that was previously written down; and |
• | fluctuations in the product mix of microcontrollers, analog, interface and mixed signal products, memory products and technology licensing. |
37
Other factors that impacted our gross profit percentage in the periods covered by this report include:
• | continual cost reductions in wafer fabrication and assembly and test manufacturing, such as new manufacturing technologies and more efficient manufacturing techniques; and |
• | lower depreciation as a percentage of cost of sales. |
We adjust our wafer fabrication and assembly and test capacity utilization as required to respond to actual and anticipated business and industry-related conditions. When production levels are below normal capacity, we charge cost of sales for the unabsorbed capacity. Our wafer fabrication facilities operated below normal capacity levels, which we typically consider to be 90% to 95% of the actual capacity of the installed equipment, during the first quarter of fiscal 2015, fiscal 2014 and fiscal 2013 in response to uncertain global economic conditions and our inventory position. As a result of production below normal operating levels in our wafer fabs, approximately $0.8 million, $19.0 million and $31.7 million was charged to cost of sales in fiscal 2015, fiscal 2014 and fiscal 2013, respectively. Our wafer fabrication facilities have been operating at normal capacity levels since the first quarter of fiscal 2015. In the future, if production levels are below normal capacity, we will charge cost of sales for the unabsorbed capacity. During fiscal 2015 and fiscal 2014, we operated at normal levels of capacity at our Thailand assembly and test facilities, and we selectively increased our assembly and test capacity at such facilities during such time. During fiscal 2013, we operated below the normal capacity levels of our Thailand assembly and test facilities due to adverse business conditions and these actions had a negative impact on our gross margins during such periods.
The process technologies utilized in our wafer fabs impact our gross margins. Fab 2 currently utilizes various manufacturing process technologies, but predominantly utilizes our 0.5 micron to 1.0 micron processes. Fab 4 predominantly utilizes our 0.22 micron to 0.5 micron processes. We continue to transition products to more advanced process technologies to reduce future manufacturing costs. Substantially all of our production has been on 8-inch wafers during the periods covered by this report.
Our overall inventory levels were $279.5 million at March 31, 2015, compared to $262.7 million at March 31, 2014 and $242.3 million at March 31, 2013. We maintained 111 days of inventory on our balance sheet at March 31, 2015 compared to 118 days of inventory at March 31, 2014 and 116 days at March 31, 2013. We expect our inventory levels in the June 2015 quarter to increase between 3 and 9 days from the March 2015 levels. We believe our existing level of inventory will allow us to maintain competitive lead times and provide strong delivery performance to our customers.
We anticipate that our gross margins will fluctuate over time, driven primarily by capacity utilization levels, the overall product mix of microcontroller, analog, interface and mixed signal products, memory products and technology licensing revenue and the percentage of net sales of each of these products in a particular quarter, as well as manufacturing yields, fixed cost absorption, and competitive and economic conditions in the markets we serve.
During fiscal 2015, approximately 57% of our assembly requirements were performed in our Thailand facilities, compared to approximately 51% during fiscal 2014 and approximately 60% during fiscal 2013. The percentage of our assembly work that is performed internally fluctuates over time based on supply and demand conditions in the semiconductor industry, our internal capacity capabilities and our acquisition activities. Third-party contractors located in Asia perform the balance of our assembly operations. During fiscal 2015, approximately 88% of our test requirements were performed in our Thailand facilities compared to approximately 86% during fiscal 2014 and approximately 87% during fiscal 2013. We believe that the assembly and test operations performed at our Thailand facilities provide us with significant cost savings compared to contractor assembly and test costs, as well as increased control over these portions of the manufacturing process.
We rely on outside wafer foundries for a significant portion of our wafer fabrication requirements. During fiscal 2015, approximately 39% of our total net sales came from products that were produced at outside wafer foundries compared to approximately 38% during fiscal 2014 and approximately 33% during fiscal 2013.
Our use of third parties involves some reduction in our level of control over the portions of our business that we subcontract. While we review the quality, delivery and cost performance of our third-party contractors, our future operating results could suffer if any third-party contractor is unable to maintain manufacturing yields, assembly and test yields and costs at approximately their current levels.
38
Research and Development (R&D)
R&D expenses for fiscal 2015 were $349.5 million, or 16.3% of sales, compared to $305.0 million, or 15.8% of sales, for fiscal 2014 and $254.7 million, or 16.1% of sales, for fiscal 2013. We are committed to investing in new and enhanced products, including development systems software, and in our design and manufacturing process technologies. We believe these investments are significant factors in maintaining our competitive position. R&D costs are expensed as incurred. Assets purchased to support our ongoing research and development activities are capitalized when related to products which have achieved technological feasibility or that have alternative future uses and are amortized over their expected useful lives. R&D expenses include labor, depreciation, masks, prototype wafers, and expenses for the development of process technologies, new packages, and software to support new products and design environments.
R&D expenses increased $44.5 million, or 14.6%, for fiscal 2015 over fiscal 2014. The primary reasons for the dollar increase in R&D costs in fiscal 2015 compared to fiscal 2014 were additional costs from our acquisitions of Supertex and ISSC as well as higher headcount costs and bonus costs. R&D expenses increased $50.3 million, or 19.8%, for fiscal 2014 over fiscal 2013. The primary reasons for the dollar increase in R&D costs in fiscal 2014 compared to fiscal 2013 were additional costs from our acquisition of SMSC as well as higher headcount costs and bonus costs.
R&D expenses fluctuate over time, primarily due to revenue and operating expense investment levels.
Selling, General and Administrative
Selling, general and administrative expenses for fiscal 2015 were $274.8 million, or 12.8% of sales, compared to $267.3 million, or 13.8% of sales, for fiscal 2014, and $261.5 million, or 16.5% of sales, for fiscal 2013. Selling, general and administrative expenses include salary expenses related to field sales, marketing and administrative personnel, advertising and promotional expenditures and legal expenses. Selling, general and administrative expenses also include costs related to our direct sales force and field applications engineers who work in sales offices worldwide to stimulate demand by assisting customers in the selection and use of our products.
Selling, general and administrative expenses increased $7.5 million, or 2.8%, for fiscal 2015 over fiscal 2014. The primary reasons for the dollar increase in selling, general and administrative expenses in fiscal 2015 over fiscal 2014 were additional costs from our acquisitions of Supertex and ISSC and higher headcount costs partially offset by lower legal expenses. Selling, general and administrative expenses increased $5.8 million, or 2.2%, for fiscal 2014 over fiscal 2013. The primary reasons for the dollar increase in selling, general and administrative expenses in fiscal 2014 over fiscal 2013 were higher headcount costs related to our acquisition of SMSC and higher bonus costs partially offset by lower acquisition related legal expenses, professional services and share-based compensation.
Selling, general and administrative expenses fluctuate over time, primarily due to revenue and operating expense investment levels.
Special Charges
During fiscal 2015, we incurred special charges of $2.8 million related to severance, office closing and other costs associated with our acquisition activity. During fiscal 2014, we incurred special charges of $3.0 million related to severance, office closing and other costs associated with our acquisition activity. During fiscal 2013, we incurred special charges of $32.2 million comprised of a $4.4 million net increase in the fair value of contingent consideration related to one of our acquisitions, $16.3 million of primarily severance-related costs in addition to office closing, and other costs associated with the acquisition of SMSC and legal settlement costs of approximately $11.5 million for certain legal matters related to an entity which we acquired in April 2010 in excess of previously accrued amounts.
Other Income (Expense)
Interest income in fiscal 2015 was $19.5 million compared to $16.5 million in fiscal 2014 and $15.6 million in fiscal 2013. The primary reasons for the increases in interest income over these periods relates to higher yields on short-term cash investments and higher invested cash balances.
39
Interest expense in fiscal 2015 was $62.0 million compared to $48.7 million in fiscal 2014 and $40.9 million in fiscal 2013. The primary reasons for the increase in interest expense over these periods relates to $5.7 million in non-cash interest expense on the amortization of the debt discount of our 1.625% senior subordinated convertible debentures and $3.8 million of interest expense related to the 1.625% coupon as well as increased borrowings under our credit facility to partially finance our acquisition activity and increased expenses associated with our larger credit facility.
Loss on retirement of convertible debentures in fiscal 2015 was $50.6 million. In February 2015, we acquired certain of our 2.125% junior subordinated convertible debentures with a $575.0 million aggregate principal amount for an aggregate purchase price of $1,134.6 million, based on market value. The transaction resulted in a loss on retirement of convertible debentures of approximately $50.6 million, which represented the difference between the fair value of the liability component at time of repurchase and the sum of the carrying values of the debt component and any unamortized debt issuance costs.
Other income, net in fiscal 2015 was $13.7 million compared to other income, net of $5.9 million in fiscal 2014 and other expense, net of $0.4 million in fiscal 2013. The primary reasons for the change in other income, net during fiscal 2015 compared to fiscal 2014 relates to realized gains of $18.7 million from the sale of marketable equity and debt securities and fluctuations on our foreign currency derivatives. The primary reasons for the change in other income (expense), net during fiscal 2014 compared to fiscal 2013 relates to realized gains of $2.4 million from the sale of marketable equity and debt securities and a gain of $2.4 million recognized on a strategic investment in a company we acquired during fiscal 2014 compared to a gain of $1.3 million related to the sale of inventory previously considered discontinued during fiscal 2013 and fluctuations on our foreign currency derivatives.
Provision for Income Taxes
Our provision for income taxes reflects tax on our foreign earnings and federal and state tax on U.S. earnings. We had an effective tax rate of -5.6% in fiscal 2015, 8.6% in fiscal 2014 and 16.3% in fiscal 2013. Excluding certain one-time tax events described below, our effective tax rates were lower than statutory rates in the U.S. primarily due to our mix of earnings in foreign jurisdictions with lower tax rates and the R&D tax credit. Our effective tax rate in fiscal 2015 includes $33.1 million of benefits related to audit closures and expirations of the statute of limitations on various tax reserves, which reduced our effective tax rate by 9.6%. Our effective tax rate in fiscal 2015 also includes a $1.8 million benefit received from the reinstatement of the R&D credit, which reduced our effective tax rate by 0.5%. During fiscal 2014, our effective tax rate included $19.4 million of benefits related to various items including a settlement with the IRS for our fiscal 2009 and fiscal 2010 tax audits and the expiration of the statute of limitations on various tax reserves. These benefits reduced our effective tax rate by 4.5% to an effective tax rate of 8.6%. During fiscal 2013, our effective tax rate was higher due to $27.2 million of one-time foreign and domestic tax implications from our acquisition of SMSC, which offset an $8.1 million benefit received from the reinstatement of the R&D credit and $9.7 million of other non-recurring tax events including releases of previously established tax reserves related to audit closures and expirations of statutes of limitations and the revaluation of deferred tax assets and liabilities. These items increased our effective tax rate by 6.2% to an effective tax rate of 16.3%.
Various taxing authorities in the U.S. and other countries in which we do business are increasing their scrutiny of the tax structures employed by businesses. Companies of our size and complexity are regularly audited by the taxing authorities in the jurisdictions in which they conduct significant operations. For U.S. federal, and in general for U.S. state tax returns, our fiscal 2011 and later tax returns remain open for examination by the taxing authorities. We recognize liabilities for anticipated tax audit issues in the U.S. and other tax jurisdictions based on our estimate of whether, and the extent to which, additional tax payments are probable. We believe that we maintain adequate tax reserves to offset any potential tax liabilities that may arise upon these and other pending audits in the U.S. and other countries in which we do business. If such amounts ultimately prove to be unnecessary, the resulting reversal of such reserves would result in tax benefits being recorded in the period the reserves are no longer deemed necessary. If such amounts ultimately prove to be less than any final assessment, a future charge to expense would be recorded in the period in which the assessment is determined.
Our Thailand manufacturing operations currently benefit from numerous tax holidays that have been granted to us by the Thailand government based on our investments in property, plant and equipment in Thailand. Our tax holiday periods in Thailand expire at various times in the future. Any expiration of our tax holidays are expected to have a minimal impact on our overall tax expense due to other tax holidays and an increase in income in other taxing jurisdictions with lower statutory rates.
40
Liquidity and Capital Resources
We had $2,342.2 million in cash, cash equivalents and short-term and long-term investments at March 31, 2015, an increase of $198.7 million from the March 31, 2014 balance. The increase in cash, cash equivalents and short-term and long-term investments over this time period is primarily attributable to cash generated by operating activities and our credit agreement and convertible debenture financing activities being offset in part by dividend payments of $286.5 million and our acquisition activity.
Net cash provided from operating activities was $721.2 million for fiscal 2015, $676.6 million for fiscal 2014 and $459.4 million for fiscal 2013. The increase in cash flow from operations in fiscal 2015 compared to fiscal 2014 was primarily due to higher net sales during fiscal 2015. The increase in cash flow from operations in fiscal 2014 compared to fiscal 2013 was primarily due to higher net sales and net income during fiscal 2014.
Net cash used in investing activities was $678.3 million for fiscal 2015, $503.3 million for fiscal 2014 and $949.9 million in fiscal 2013. The increase in net cash used in investing activities in fiscal 2015 compared to fiscal 2014 was due primarily to $252.5 million of cash consideration, net of $15.1 million of cash and cash equivalents acquired, used to finance our acquisition of ISSC in July 2014 and $375.4 million of cash consideration, net of $14.8 million of cash and cash equivalents acquired, used to finance our acquisition of Supertex in April 2014, offset in part by an increase in cash from our purchases, sales and maturities of available-for-sale investments in fiscal 2015 compared to the prior year. The decrease in net cash used in investing activities in fiscal 2014 compared to fiscal 2013 was primarily due to our acquisition of SMSC in fiscal 2013, which used $731.7 million of cash consideration, net of $180.9 million of cash and cash equivalents acquired. This decrease in net cash used in investing activities offset a fiscal 2014 decrease in cash related to changes in our net purchases, sales and maturities of short-term and long-term investments.
Our level of capital expenditures varies from time to time as a result of actual and anticipated business conditions. Capital expenditures were $149.5 million in fiscal 2015, $113.1 million in fiscal 2014 and $50.8 million in fiscal 2013. Capital expenditures are primarily for the expansion of production capacity and the addition of research and development equipment. We currently intend to spend approximately $160 million during the next twelve months to invest in equipment and facilities to maintain, and selectively increase, our capacity.
We expect to finance our capital expenditures through our existing cash balances and cash flows from operations. We believe that the capital expenditures anticipated to be incurred over the next twelve months will provide sufficient manufacturing capacity to meet our currently anticipated needs.
Net cash provided by financing activities was $98.5 million for fiscal 2015 compared to net cash used in financing activities of $235.0 million for fiscal 2014 and net cash provided by financing activities of $382.2 million for fiscal 2013. We made payments on our borrowings under our credit agreements of $2,047.6 million during fiscal 2015, $1,103.5 million during fiscal 2014 and $761.0 million during fiscal 2013. Cash received on borrowings under our credit agreements totaled $1,859.6 million during fiscal 2015, $1,133.5 million during fiscal 2014 and $1,381.0 million during fiscal 2013. In February 2015, we issued $1,725.0 million principal amount of 1.625% senior subordinated convertible debentures due February 15, 2025. The debentures are subordinated to our senior debt, including amounts borrowed under our amended credit facility, but are senior to our outstanding 2.125% junior subordinated convertible debentures. Also, in February 2015, we acquired certain of our 2.125% junior subordinated convertible debentures with a $575.0 million aggregate principal amount for an aggregate purchase price of $1,134.6 million, based on market value. We paid cash dividends to our stockholders of $286.5 million in fiscal 2015, $281.2 million in fiscal 2014, and $273.8 million in fiscal 2013. Proceeds from the exercise of stock options and employee purchases under our employee stock purchase plans were $34.4 million for fiscal 2015, $60.1 million for fiscal 2014 and $51.4 million for fiscal 2013.
In February 2015, we amended our $2.0 billion credit agreement with certain lenders. The revolving credit facility portion of the agreement was increased from $1,650.0 million to $2,555.0 million and the $350.0 million term loan portion of the agreement was removed. The increase option permitting us, subject to certain requirements, to arrange with existing lenders and/or new lenders to provide up to an aggregate of $300 million in additional commitments, was also adjusted to $249 million. Proceeds of loans made under the credit agreement may be used for working capital and general corporate purposes. At March 31, 2015, $462.0 million of borrowings were outstanding under the credit agreement. See Note 16 of the notes to consolidated financial statements for more information regarding our credit agreement.
41
Our total cash, cash equivalents, short-term investments and long-term investments held by our foreign subsidiaries was $2,322.4 million at March 31, 2015 and $2,085.7 million at March 31, 2014. Under current tax laws and regulations, if accumulated earnings and profits held by our foreign subsidiaries that U.S. taxes had not previously been provided for were to be distributed to the U.S. in the form of dividends or otherwise, we would be subject to additional U.S. income taxes and foreign withholding taxes. The balance of cash, cash equivalents, short-term investments and long-term investments available for our U.S. operations as of March 31, 2015 and March 31, 2014 was approximately $19.8 million and $57.8 million, respectively. We utilize a variety of tax planning and financing strategies with the objective of having our worldwide cash available in the locations in which it is needed. We consider our offshore earnings to be permanently reinvested offshore. However, we could determine to repatriate some of our offshore earnings in future periods to fund stockholder dividends, share repurchases, acquisitions or other corporate activities. We expect that a significant portion of our future cash generation will be in our foreign subsidiaries.
In March 2015, we entered into ten-year fixed-to-floating interest rate swap agreements on a portion of our fixed-rate 1.625% senior subordinated convertible debentures. The interest rate swap agreements are designated as fair value hedges. We pay variable interest equal to the three-month LIBOR minus 53.6 basis points and we receive a fixed interest rate of 1.625%. The gross notional amount of these contracts outstanding at March 31, 2015 was $431.3 million.
We enter into derivative transactions from time to time in an attempt to reduce our exposure to currency rate fluctuations. Although none of the countries in which we conduct significant foreign operations have had a highly inflationary economy in the last five years, there is no assurance that inflation rates or fluctuations in foreign currency rates in countries where we conduct operations will not adversely affect our operating results in the future. At March 31, 2015, we had no foreign currency forward contracts outstanding.
In December 2007, we announced that our Board of Directors had authorized the repurchase of up to 10 million shares of our common stock in the open market or in privately negotiated transactions. As of March 31, 2015, we had repurchased 7.5 million shares under this 10 million share authorization for a total of $234.7 million. In May 2015, our Board of Directors authorized an increase in the existing share repurchase program to 20.0 million shares of common stock from the approximately 2.5 million shares remaining under the current authorization. Under this program, in the next several months, we intend to repurchase the approximate number of shares we will issue in connection with our acquisition of Micrel. There is no expiration date associated with this program. The timing and amount of future repurchases will depend upon market conditions, interest rates, and corporate considerations.
As of March 31, 2015, we held approximately 16.7 million shares as treasury shares.
On October 28, 2002, we announced that our Board of Directors had approved and instituted a quarterly cash dividend on our common stock. The initial quarterly dividend of $0.02 per share was paid on December 6, 2003 in the amount of $4.1 million. To date, our cumulative dividend payments have totaled approximately $2.52 billion. During fiscal 2015, we paid dividends in the amount of $1.425 per share for a total dividend payment of $286.5 million. During fiscal 2014, we paid dividends in the amount of $1.417 per share for a total dividend payment of $281.2 million. During fiscal 2013, we paid dividends in the amount of $1.406 per share for a total dividend payment of $273.8 million. On May 7, 2015, we declared a quarterly cash dividend of $0.3575 per share, which will be paid on June 4, 2015, to stockholders of record on May 21, 2015 and the total amount of such dividend is expected to be approximately $72.4 million. Our Board is free to change our dividend practices at any time and to increase or decrease the dividend paid, or not to pay a dividend, on our common stock on the basis of our results of operations, financial condition, cash requirements and future prospects, and other factors deemed relevant by our Board. Our current intent is to provide for ongoing quarterly cash dividends depending upon market conditions, our results of operations and potential changes in tax laws.
We believe that our existing sources of liquidity combined with cash generated from operations and borrowings under our credit agreement will be sufficient to meet our currently anticipated cash requirements for at least the next 12 months. However, the semiconductor industry is capital intensive. In order to remain competitive, we must constantly evaluate the need to make significant investments in capital equipment for both production and research and development. We may increase our borrowings under our credit agreement or seek additional equity or debt financing from time to time to maintain or expand our wafer fabrication and product assembly and test facilities, for cash dividends, for share repurchases or for acquisitions or other purposes. The timing and amount of any such financing requirements will depend on a number of factors, including our level of dividend payments, changes in tax laws and regulations regarding the repatriation of offshore cash, demand for our products, changes in industry conditions, product mix, competitive factors and our ability to identify suitable acquisition candidates. There can be no assurance that such financing will be available on acceptable terms, and any additional equity financing would result in incremental ownership dilution to our existing stockholders.
42
Contractual Obligations
The following table summarizes our significant contractual obligations at March 31, 2015, and the effect such obligations are expected to have on our liquidity and cash flows in future periods. This table excludes amounts already recorded on our balance sheet as current liabilities at March 31, 2015 (dollars in thousands):
Payments Due by Period | |||||||||||||||||||
Total | Less than 1 year | 1 – 3 years | 3 – 5 years | More than 5 years | |||||||||||||||
Operating lease obligations | $ | 39,639 | $ | 16,146 | $ | 17,952 | $ | 5,541 | $ | — | |||||||||
Capital purchase obligations (1) | 56,495 | 56,495 | — | — | — | ||||||||||||||
Other purchase obligations and commitments (2) | 50,268 | 49,920 | 348 | — | — | ||||||||||||||
Borrowings under credit agreement outstanding as of March 31, 2015 - principal and interest (3) | 499,542 | 7,752 | 15,503 | 476,287 | — | ||||||||||||||
1.625% senior convertible debentures - principal and interest (4) | 2,029,840 | 28,031 | 56,062 | 56,062 | 1,889,685 | ||||||||||||||
2.125% junior convertible debentures – principal and interest (5) | 852,467 | 12,219 | 24,438 | 24,438 | 791,372 | ||||||||||||||
Total contractual obligations (6) | $ | 3,528,251 | $ | 170,563 | $ | 114,303 | $ | 562,328 | $ | 2,681,057 | |||||||||
(1) Capital purchase obligations represent commitments for construction or purchases of property, plant and equipment. These obligations were not recorded as liabilities on our balance sheet as of March 31, 2015, as we have not yet received the related goods or taken title to the property. | |
(2) Other purchase obligations and commitments include payments due under various types of licenses and outstanding purchase commitments with our wafer foundries of approximately $48.8 million for delivery of wafers in fiscal 2016. | |
(3) For purposes of this table we have assumed that the principal of our credit agreement borrowings outstanding at March 31, 2015 will be paid on February 4, 2020, which is the maturity date of such borrowings. | |
(4) For purposes of this table we have assumed that the principal of our senior convertible debentures will be paid on February 15, 2025. | |
(5) For purposes of this table we have assumed that the principal of our junior convertible debentures will be paid on December 15, 2037. | |
(6) Total contractual obligations do not include contractual obligations recorded on our balance sheet as current liabilities, or certain purchase obligations as discussed below. The contractual obligations also do not include amounts related to uncertain tax positions because reasonable estimates cannot be made. | |
Purchase orders or contracts for the purchase of raw materials and other goods and services, with the exception of commitments to our wafer foundries, are not included in the table above. We are not able to determine the aggregate amount of such purchase orders that represent contractual obligations, as purchase orders may represent authorizations to purchase rather than binding agreements. For the purpose of this table, contractual obligations for the purchase of goods or services are defined as agreements that are enforceable and legally binding on us and that specify all significant terms, including: fixed or minimum quantities to be purchased; fixed, minimum or variable price provisions; and the approximate timing of the transaction. Our purchase orders are based on our current manufacturing needs and are fulfilled by our vendors with short time horizons. We do not have significant agreements for the purchase of raw materials or other goods specifying minimum quantities or set prices that exceed our expected requirements for three months. We also enter into contracts for outsourced services; however, the obligations under these contracts were not significant and the contracts generally contain clauses allowing for cancellation without significant penalty.
The expected timing of payment of the obligations discussed above is estimated based on current information. Timing of payments and actual amounts paid may be different depending on the time of receipt of goods or services or changes to agreed-upon amounts for some obligations.
43
Off-Balance Sheet Arrangements
As of March 31, 2015, we are not involved in any off-balance sheet arrangements, as defined in Item 303(a)(4)(ii) of SEC Regulation S-K.
Recently Issued Accounting Pronouncements
In June 2014, the Financial Accounting Standards Board (FASB) issued Accounting Standards Update (ASU) No. 2014-12, Compensation - Stock Compensation (Topic 718): Accounting for Share-Based Payments When the Terms of an Award Provide That a Performance Target Could be Achieved after the Requisite Service Period. The amendments in this ASU provide explicit guidance on whether a performance target contained in a share-based payment award that could be achieved after the requisite service period should be treated (i) as a performance condition that affects vesting or (ii) as a nonvesting condition that affects the grant-date fair value of the award. The amendments require that a performance target that affects vesting, and that could be achieved after the requisite service period, be treated as a performance condition rather than as a nonvesting condition. Accordingly, such performance targets are not reflected in the estimation of the grant date fair value of the award. Compensation cost should be recognized in the period in which it becomes probable that the performance target will be achieved and should represent the compensation cost attributable to the period(s) for which the requisite service has already been rendered. If the performance target becomes probable of being achieved before the end of the requisite service period, the remaining unrecognized compensation cost should be recognized prospectively over the
remaining service period. The total amount of compensation cost recognized during and after the requisite service period should reflect the number of awards that are expected to vest and should be adjusted to reflect those awards that ultimately vest. The amendments in this update are effective for annual periods beginning after December 15, 2015, and interim periods within those annual periods. Early adoption is permitted. We do not anticipate adoption of this ASU will have a material impact on our consolidated financial statements.
In July 2013, the FASB issued ASU No. 2013-11, Presentation of an Unrecognized Tax Benefit When a Net Operating Loss Carryforward, a Similar Tax Loss, or a Tax Credit Carryforward Exists (ASU 2013-11) to provide guidance on the presentation of unrecognized tax benefits. ASU 2013-11 requires an entity to present an unrecognized tax benefit, or a portion of an unrecognized tax benefit, as a reduction to a deferred tax asset for a net operating loss carryforward, a similar tax loss, or a tax credit carryforward, except as follows: to the extent a net operating loss carryforward, a similar tax loss, or a tax credit carryforward is not available at the reporting date under the tax law of the applicable jurisdiction to settle any additional income taxes that would result from the disallowance of a tax position or the tax law of the applicable jurisdiction does not require the entity to use, and the entity does not intend to use, the deferred tax asset for such purpose, the unrecognized tax benefit should be presented in the financial statements as a liability and should not be combined with deferred tax assets. ASU 2013-11 was effective for our first quarter of fiscal 2015 with earlier adoption permitted. ASU 2013-11 should be applied prospectively with retroactive application permitted. There was no income statement impact to us as a result of adopting this accounting standard.
In May 2014, the FASB issued ASU 2014-09-Revenue from Contracts with Customers, which will supersede nearly all existing revenue recognition guidance under US GAAP. The standard's core principle is that a company will recognize revenue when it transfers promised goods or services to customers in an amount that reflects the consideration to which the company expects to be entitled in exchange for those goods or services. We are evaluating our existing revenue recognition policies to determine whether any contracts in the scope of the guidance will be materially affected by the new requirements. The effects may include identifying performance obligations in existing arrangements, estimating the amount of variable consideration to include in the transaction price and allocating the transaction price to each separate performance obligation. The new standard is effective beginning with the first quarter of our 2018 fiscal year. Early adoption is not permitted. The standard allows for either "full retrospective" adoption, meaning the standard is applied to all of the periods presented, or "modified retrospective" adoption, meaning the standard is applied only to the most current period presented in the financial statements. On April 1, 2015, the FASB proposed deferring the effective date by one year to December 15, 2017 for annual reporting periods beginning after that date. The FASB also proposed permitting early adoption of the standard, but not before the original effective date of December 15, 2016. We are currently evaluating the transition method that will be elected.
In April 2015, the FASB issued ASU 2015-03-Simplifying the Presentation of Debt Issuance Costs. This standard amends existing guidance to require the presentation of debt issuance costs in the balance sheet as a deduction from the carrying amount of the related debt liability instead of a deferred charge. It is effective for annual reporting periods beginning after December 15, 2015, but early adoption is permitted. We are currently evaluating the impact the adoption of this standard will have on our consolidated financial statements.
44
Item 7A. QUANTITATIVE AND QUALITATIVE DISCLOSURES ABOUT MARKET RISK
Our investments are intended to establish a high-quality portfolio that preserves principal, meets liquidity needs, avoids inappropriate concentrations, and delivers an appropriate yield in relationship to our investment guidelines and market conditions. Our investment portfolio, consisting of fixed income securities, money market funds, cash deposits, and marketable securities that we hold on an available-for-sale basis, was $2,342.2 million as of March 31, 2015 compared to $2,143.5 million as of March 31, 2014. The available-for-sale debt securities, like all fixed income instruments, are subject to interest rate risk and will decline in value if market interest rates increase. We have the ability to hold our fixed income investments until maturity and, therefore, we would not expect to recognize any material adverse impact in income or cash flows if market interest rates increase. The following table provides information about our available-for-sale securities that are sensitive to changes in interest rates. We have aggregated our available-for-sale securities for presentation purposes since they are all very similar in nature (dollars in thousands):
Financial instruments maturing during the fiscal year ended March 31, | |||||||||||||||||||||||
2016 | 2017 | 2018 | 2019 | 2020 | Thereafter | ||||||||||||||||||
Available-for-sale securities | $ | 225,009 | $ | 643,508 | $ | 651,795 | $ | 40,687 | $ | 62,013 | $ | 92,012 | |||||||||||
Weighted-average yield rate | 0.91 | % | 1.03 | % | 1.24 | % | 1.55 | % | 1.20 | % | 1.52 | % | |||||||||||
We are exposed to interest rate risk related to our fixed-to-floating interest rate derivative instruments. Based on sensitivity analyses performed on our financial position as of March 31, 2015, a hypothetical increase in benchmark interest rates of up to 1%, would have resulted in a decrease in the fair value of these instruments by $43 million. A hypothetical decrease in benchmark interest rates of up to 1%, would have resulted in an increase in the fair value of these instruments by $39 million. Any gains and losses on the fair value of these derivative instruments would generally be offset by gains and losses on the hedged item.
See Note 1 to our Consolidated Financial Statements for additional information on our investments and use of derivative instruments.
Item 8. FINANCIAL STATEMENTS AND SUPPLEMENTARY DATA
The consolidated financial statements listed in the index appearing under Item 15(a)(1) hereof are filed as part of this Form 10-K. See also Index to Financial Statements below.
Item 9. | CHANGES IN AND DISAGREEMENTS WITH ACCOUNTANTS ON ACCOUNTING AND FINANCIAL DISCLOSURE |
None.
Item 9A. CONTROLS AND PROCEDURES
Evaluation of Disclosure Controls and Procedures
As of the end of the period covered by this Annual Report on Form 10-K, as required by paragraph (b) of Rule 13a-15 or Rule 15d-15 under the Securities Exchange Act of 1934, as amended (the "Exchange Act"), we evaluated under the supervision of our Chief Executive Officer and our Chief Financial Officer, the effectiveness of our disclosure controls and procedures (as defined in Rules 13a-15(e) or 15d-15(e) of the Exchange Act. Based on this evaluation, our Chief Executive Officer and our Chief Financial Officer have concluded that our disclosure controls and procedures are effective to ensure that information we are required to disclose in reports that we file or submit under the Exchange Act (i) is recorded, processed, summarized and reported within the time periods specified in Securities and Exchange Commission rules and forms, and (ii) is accumulated and communicated to our management, including our Chief Executive Officer and our Chief Financial Officer, as appropriate to allow timely decisions regarding required disclosure. Our disclosure controls and procedures are designed to provide reasonable assurance that such information is accumulated and communicated to our management. Our disclosure controls and procedures include components of our internal control over financial reporting. Management's assessment of the effectiveness of our internal control over financial reporting is expressed at the level of reasonable assurance because a control system, no matter how well designed and operated, can provide only reasonable, but not absolute, assurance that the control system's objectives will be met.
45
Management Report on Internal Control Over Financial Reporting
Our management is responsible for establishing and maintaining adequate internal control over financial reporting to provide reasonable assurance regarding the reliability of our financial reporting and the preparation of financial statements for external purposes in accordance with generally accepted accounting principles. Internal control over financial reporting includes those policies and procedures that (i) pertain to the maintenance of records that in reasonable detail accurately and fairly reflect the transactions and dispositions of the assets of the company; (ii) provide reasonable assurance that transactions are recorded as necessary to permit preparation of financial statements in accordance with generally accepted accounting principles, and that receipts and expenditures of the company are being made only in accordance with authorizations of management and directors of the company; and (iii) provide reasonable assurance regarding prevention or timely detection of unauthorized acquisition, use or disposition of our assets that could have a material effect on our financial statements.
Management assessed our internal control over financial reporting as of March 31, 2015, the end of our fiscal year. Management based its assessment on criteria established in Internal Control – Integrated Framework (1992 framework) issued by the Committee of Sponsoring Organizations of the Treadway Commission. Management's assessment included evaluation of such elements as the design and operating effectiveness of key financial reporting controls, process documentation, accounting policies, and our overall control environment. This assessment is supported by testing and monitoring performed by our finance organization.
Based on our assessment, management has concluded that our internal control over financial reporting was effective as of the end of the fiscal year to provide reasonable assurance regarding the reliability of financial reporting and the preparation of financial statements for external reporting purposes in accordance with generally accepted accounting principles. We reviewed the results of management's assessment with the Audit Committee of our Board of Directors.
Ernst & Young LLP, an independent registered public accounting firm, who audited our consolidated financial statements included in this Form 10-K has issued an attestation report on our internal control over financial reporting as of March 31, 2015, which is included in Part II, Item 9A.
Changes in Internal Control over Financial Reporting
During the three months ended March 31, 2015, there was no change in our internal control over financial reporting identified in connection with the evaluation required by paragraph (d) of Rule 13a-15 or Rule 15d-15 that has materially affected, or is reasonably likely to materially affect, our internal control over financial reporting.
46
REPORT OF INDEPENDENT REGISTERED PUBLIC ACCOUNTING FIRM
The Board of Directors and Stockholders of
Microchip Technology Incorporated and subsidiaries
We have audited Microchip Technology Incorporated and subsidiaries' internal control over financial reporting as of March 31, 2015, based on criteria established in Internal Control—Integrated Framework issued by the Committee of Sponsoring Organizations of the Treadway Commission (1992 framework) (the COSO criteria). Microchip Technology Incorporated and subsidiaries' management is responsible for maintaining effective internal control over financial reporting, and for its assessment of the effectiveness of internal control over financial reporting included in the accompanying Management's Report on Internal Control Over Financial Reporting. Our responsibility is to express an opinion on the Company's internal control over financial reporting based on our audit.
We conducted our audit in accordance with the standards of the Public Company Accounting Oversight Board (United States). Those standards require that we plan and perform the audit to obtain reasonable assurance about whether effective internal control over financial reporting was maintained in all material respects. Our audit included obtaining an understanding of internal control over financial reporting, assessing the risk that a material weakness exists, testing and evaluating the design and operating effectiveness of internal control based on the assessed risk, and performing such other procedures as we considered necessary in the circumstances. We believe that our audit provides a reasonable basis for our opinion.
A company's internal control over financial reporting is a process designed to provide reasonable assurance regarding the reliability of financial reporting and the preparation of financial statements for external purposes in accordance with generally accepted accounting principles. A company's internal control over financial reporting includes those policies and procedures that (1) pertain to the maintenance of records that, in reasonable detail, accurately and fairly reflect the transactions and dispositions of the assets of the company; (2) provide reasonable assurance that transactions are recorded as necessary to permit preparation of financial statements in accordance with generally accepted accounting principles, and that receipts and expenditures of the company are being made only in accordance with authorizations of management and directors of the company; and (3) provide reasonable assurance regarding prevention or timely detection of unauthorized acquisition, use, or disposition of the company's assets that could have a material effect on the financial statements.
Because of its inherent limitations, internal control over financial reporting may not prevent or detect misstatements. Also, projections of any evaluation of effectiveness to future periods are subject to the risk that controls may become inadequate because of changes in conditions, or that the degree of compliance with the policies or procedures may deteriorate.
In our opinion, Microchip Technology Incorporated and subsidiaries maintained, in all material respects, effective internal control over financial reporting as of March 31, 2015, based on the COSO criteria.
We also have audited, in accordance with the standards of the Public Company Accounting Oversight Board (United States), the March 31, 2015 consolidated financial statements of Microchip Technology Incorporated and subsidiaries and our report dated May 26, 2015 expressed an unqualified opinion thereon.
/s/ Ernst & Young LLP
Phoenix, Arizona
May 26, 2015
47
Item 9B. OTHER INFORMATION
In fiscal 2015, each of J. Eric Bjornholt, our Chief Financial Officer, Mitch Little, our Vice President, Worldwide Sales and Applications, Steve Drehobl, our Vice President, MCU8 and Technology Development Division, and Rich Simoncic, our Vice President, Analog and Interface Products Division, entered into trading plans as contemplated by Rule 10b-5-1 under the Exchange Act and periodic sales of our common stock have occurred and are expected to occur under such plans.
The foregoing disclosure is being made on a voluntary basis and not pursuant to any specific requirement under Form 10-K, Form 8-K or otherwise.
PART III
Item 10. DIRECTORS, EXECUTIVE OFFICERS AND CORPORATE GOVERNANCE
Information on the members of our Board of Directors is incorporated herein by reference to our proxy statement for our 2015 annual meeting of stockholders under the captions "The Board of Directors," and "Proposal One – Election of Directors."
Information on the composition of our audit committee and the members of our audit committee, including information on our audit committee financial experts, is incorporated by reference to our proxy statement for our 2015 annual meeting of stockholders under the caption "The Board of Directors – Committees of the Board of Directors – Audit Committee."
Information on our executive officers is provided in Item 1, Part I of this Form 10-K under the caption "Executive Officers of the Registrant" at page 10, above.
Information with respect to compliance with Section 16(a) of the Exchange Act, is incorporated herein by reference to our proxy statement for our 2015 annual meeting of stockholders under the caption "Section 16(a) Beneficial Ownership Reporting Compliance."
Information with respect to our code of ethics that applies to our directors, executive officers (including our principal executive officer and our principal financial and accounting officer) and employees is incorporated by reference to our proxy statement for our 2015 annual meeting of stockholders under the caption "Code of Conduct and Ethics." A copy of our Code of Conduct and Ethics is available on our website at the Investor Relations section under Mission Statement/Corporate Governance on www.microchip.com.
Information regarding material changes, if any, to procedures by which security holders may recommend nominees to our Board of Directors is incorporated by reference to our proxy statement for the 2015 annual meeting of stockholders under the caption "Requirements, Including Deadlines, for Receipt of Stockholder Proposals for the 2015 Annual Meeting of Stockholders; Discretionary Authority to Vote on Stockholder Proposals."
Item 11. EXECUTIVE COMPENSATION
Information with respect to executive compensation is incorporated herein by reference to the information under the caption "Executive Compensation" in our proxy statement for our 2015 annual meeting of stockholders.
Information with respect to director compensation is incorporated herein by reference to the information under the caption "The Board of Directors – Director Compensation" in our proxy statement for our 2015 annual meeting of stockholders.
Information with respect to compensation committee interlocks and insider participation in compensation decisions is incorporated herein by reference to the information under the caption "The Board of Directors – Compensation Committee Interlocks and Insider Participation" in our proxy statement for our 2015 annual meeting of stockholders.
Our Board compensation committee report on executive compensation is incorporated herein by reference to the information under the caption "Executive Compensation – Compensation Committee Report on Executive Compensation" in our proxy statement for our 2015 annual meeting of stockholders.
48
Item 12. | SECURITY OWNERSHIP OF CERTAIN BENEFICIAL OWNERS AND MANAGEMENT AND RELATED STOCKHOLDER MATTERS |
Information with respect to securities authorized for issuance under our equity compensation plans is incorporated herein by reference to the information under the caption "Executive Compensation – Equity Compensation Plan Information" in our proxy statement for our 2015 annual meeting of stockholders.
Information with respect to security ownership of certain beneficial owners, members of our Board of Directors and management is incorporated herein by reference to the information under the caption "Security Ownership of Principal Stockholders, Directors and Executive Officers" in our proxy statement for our 2015 annual meeting of stockholders.
Item 13. CERTAIN RELATIONSHIPS AND RELATED TRANSACTIONS, AND DIRECTOR INDEPENDENCE
The information required by this Item pursuant to Item 404 of Regulation S-K is incorporated by reference to the information under the caption "Certain Transactions" contained in our proxy statement for our 2015 annual meeting of stockholders.
The information required by this Item pursuant to Item 407(a) of Regulation S-K regarding the independence of our directors is incorporated by reference to the information under the caption "Meetings of the Board of Directors" contained in our proxy statement for our 2015 annual meeting of stockholders.
Item 14. PRINCIPAL ACCOUNTANT FEES AND SERVICES
The information required by this Item related to principal accountant fees and services as well as related pre-approval policies is incorporated by reference to the information under the caption "Independent Registered Public Accounting Firm" contained in our proxy statement for our 2015 annual meeting of stockholders.
49
PART IV
Item 15. EXHIBITS AND FINANCIAL STATEMENT SCHEDULES
(a) The following documents are filed as part of this Form 10-K:
Page No. | ||
(1) | Financial Statements: | |
Report of Independent Registered Public Accounting Firm | F-1 | |
Consolidated Balance Sheets as of March 31, 2015 and 2014 | F-2 | |
Consolidated Statements of Income for each of the three years in the period ended March 31, 2015 | F-3 | |
Consolidated Statements of Comprehensive Income for each of the three years in the period ended March 31, 2015 | F-4 | |
Consolidated Statements of Cash Flows for each of the three years in the period ended March 31, 2015 | F-5 | |
Consolidated Statements of Changes in Equity for each of the three years in the period ended March 31, 2015 | F-7 | |
Notes to Consolidated Financial Statements | F-9 | |
(2) | Financial Statement Schedules | None |
(3) | The Exhibits filed with this Form 10-K or incorporated herein by reference are set forth in the Exhibit Index beginning on page 53 hereof, which Exhibit Index is incorporated herein by this reference. | |
(b) See Item 15(a)(3) above.
(c) See "Index to Financial Statements" included under Item 8 to this Form 10-K.
50
SIGNATURES
Pursuant to the requirements of Section 13 or 15(d) of the Securities Exchange Act of 1934, the registrant has duly caused this report to be signed on its behalf by the undersigned, thereunto duly authorized.
MICROCHIP TECHNOLOGY INCORPORATED | |
(Registrant) | |
Date: May 26, 2015 | By: /s/ Steve Sanghi |
Steve Sanghi | |
President and Chief Executive Officer | |
51
POWER OF ATTORNEY
KNOW ALL PERSONS BY THESE PRESENTS, that the undersigned officer and/or director of Microchip Technology Incorporated, a Delaware corporation (the "Company"), does hereby constitute and appoint STEVE SANGHI and J. ERIC BJORNHOLT, and each of them, with full power to each of them to act alone, as the true and lawful attorneys and agents of the undersigned, with full power of substitution and resubstitution to each of said attorneys to execute, file or deliver any and all instruments and to do any and all acts and things which said attorneys and agents, or any of them, deem advisable to enable the Company to comply with the Securities Exchange Act of 1934, as amended, and any requirements of the Securities and Exchange Commission in respect thereto relating to annual reports on Form 10-K, including specifically, but without limitation of the general authority hereby granted, the power and authority to sign such person's name individually and on behalf of the Company as an officer and/or director (as indicated below opposite such person's signature) to the Company's annual reports on Form 10-K or any amendments or papers supplemental thereto; and each of the undersigned does hereby fully ratify and confirm all that said attorneys and agents or any of them, shall do or cause to be done by virtue hereof. This Power of Attorney revokes any and all previous powers of attorney granted by any of the undersigned which such power would have entitled said attorneys and agents, or any of them, to sign such person's name, individually or on behalf of the Company, to any Form 10-K.
IN WITNESS WHEREOF, each of the undersigned has subscribed these presents this 26th day of May, 2015.
Pursuant to the requirements of the Securities Exchange Act of 1934, this report has been signed below by the following persons on behalf of the registrant and in the capacities and on the dates indicated.
Name and Signature | Title | Date | |||
/s/ Steve Sanghi | Chairman, President and Chief Executive Officer | May 26, 2015 | |||
Steve Sanghi | |||||
/s/ Matthew W. Chapman | Director | May 26, 2015 | |||
Matthew W. Chapman | |||||
/s/ L.B. Day | Director | May 26, 2015 | |||
L.B. Day | |||||
/s/ Esther L. Johnson | Director | May 26, 2015 | |||
Esther L. Johnson | |||||
/s/ Wade F. Meyercord | Director | May 26, 2015 | |||
Wade F. Meyercord | |||||
/s/ J. Eric Bjornholt | Vice President and Chief Financial Officer | May 26, 2015 | |||
J. Eric Bjornholt | (Principal Financial and Accounting Officer) | ||||
52
Incorporated by Reference | ||||||||||||
Exhibit Number | Exhibit Description | Form | File Number | Exhibit | Filing Date | Filed Herewith | ||||||
2.1 | Agreement and Plan of Merger dated as of May 22, 2014 by and among Microchip Technology (Barbados) II Incorporated and ISSC Technologies Corp. | 10-K | 000-21184 | 2.1 | 5/30/2014 | |||||||
2.2 | Tender Agreement dated May 22, 2014 between Microchip Technology (Barbados) II Incorporated and Directors, Certain Officers and Certain Shareholders of ISSC Technologies Corp. | 10-K | 000-21184 | 2.2 | 5/30/2014 | |||||||
2.3 | Guaranty Concerning Merger Agreement dated May 22, 2014 made by Microchip Technology Incorporated with respect to certain obligations of Microchip Technology (Barbados) II Incorporated | 10-K | 000-21184 | 2.3 | 5/30/2014 | |||||||
2.4 | Guaranty Concerning Tender Agreement dated May 22, 2014 made by Microchip Technology Incorporated with respect to certain obligations of Microchip Technology (Barbados) II Incorporated | 10-K | 000-21184 | 2.4 | 5/30/2014 | |||||||
2.5 | Agreement and Plan of Merger dated as of February 9, 2014 by and among Microchip Technology Incorporated, Orchid Acquisition Corporation and Supertex, Inc. | 10-K | 000-21184 | 2.5 | 5/30/2014 | |||||||
2.6 | Agreement and Plan of Merger dated as of May 1, 2012 by and among Microchip Technology Incorporated, Microchip Technology Management Co. and Standard Microsystems Corporation, including Form of Voting Agreement | 10-K | 000-21184 | 2.2 | 5/30/2012 | |||||||
2.7 | Agreement and Plan of Merger dated as of May 7, 2015, by and among, Microchip Technology Incorporated, Micrel, Incorporated, Mambo Acquisition Corp. and Mambo Acquisition LLC | 8-K | 002-21184 | 2.1 | 5/8/2015 | |||||||
3.1 | Restated Certificate of Incorporation of Registrant | 10-Q | 000-21184 | 3.1 | 11/12/2002 | |||||||
3.2 | Amended and Restated By-Laws of Registrant, as amended through October 1, 2013 | 10-Q | 000-21184 | 3.1 | 11/8/2013 | |||||||
4.1 | Indenture, dated as of December 7, 2007, by and between Wells Fargo Bank, National Association, as Trustee, and Microchip Technology Incorporated | 8-K | 000-21184 | 4.1 | 12/7/2007 | |||||||
4.2 | Indenture dated as of February 11, 2015 between Microchip Technology Incorporated and Wells Fargo Bank, N.A. | 8-K | 000-21184 | 4.1 | 2/11/2015 | |||||||
4.3 | Registration Rights Agreement, dated as of December 7, 2007, by and between J.P. Morgan Securities Inc. and Microchip Technology Incorporated | 8-K | 000-21184 | 4.2 | 12/7/2007 | |||||||
53
Incorporated by Reference | ||||||||||||
Exhibit Number | Exhibit Description | Form | File Number | Exhibit | Filing Date | Filed Herewith | ||||||
10.1 | Master Increasing Lender Supplement dated as of March 19, 2015, by and among Microchip Technology Incorporated and the Increasing Lenders thereto | X | ||||||||||
10.2 | Amendment and Restatement Agreement dated as of February 4, 2015, to the Credit Agreement, dated as of June 27, 2013, by and among Microchip Technology Incorporated, the lenders party thereto and JPMorgan Chase Bank, N.A., as Administrative Agent | 8-K | 000-21184 | 10.1 | 2/4/2015 | |||||||
10.3 | Amended and Restated Credit Agreement, dated as of February 4, 2015, Microchip Technology Incorporated, the lenders from time to time party thereto and JPMorgan Chase Bank, N.A., as Administrative Agent | 8-K | 000-21184 | 10.2 | 2/4/2015 | |||||||
10.4 | Form of Indemnification Agreement between Registrant and its directors and certain of its officers | S-1 | 33-57960 | 10.1 | 2/5/1993 | |||||||
10.5 | Microchip Technology Incorporated 2012 Inducement Award Plan | S-8 | 333-183074 | 4.8 | 8/3/2012 | |||||||
10.6 | *2004 Equity Incentive Plan as amended by the Board on August 17, 2012 | 8-K | 000-21184 | 10.1 | 8/23/2012 | |||||||
10.7 | *Form of Notice of Grant of Restricted Stock Units (officer) for 2004 Equity Incentive Plan | S-8 | 333-192273 | 10.2 | 11/12/2013 | |||||||
10.8 | Form of Notice of Grant of Restricted Stock Units (non-officer) for 2004 Equity Incentive Plan | S-8 | 333-192273 | 10.3 | 11/12/2013 | |||||||
10.9 | *Form of Notice of Grant for 2004 Equity Incentive Plan (including Exhibit A Stock Option Agreement) | S-8 | 333-119939 | 4.5 | 10/25/2004 | |||||||
10.10 | Form of Notice of Grant (Foreign) for 2004 Equity Incentive Plan (including Exhibit A Stock Option Agreement (Foreign)) | 10-K | 000-21184 | 10.4 | 5/23/2005 | |||||||
10.11 | *Form of Notice of Grant of Restricted Stock Units for 2004 Equity Incentive Plan (including Exhibit A Restricted Stock Units Agreement) | 10-K | 000-21184 | 10.6 | 5/31/2006 | |||||||
10.12 | *Restricted Stock Units Agreement (Domestic) for 2004 Equity Incentive Plan | 10-Q | 000-21184 | 10.3 | 11/7/2007 | |||||||
10.13 | Restricted Stock Units Agreement (Foreign) for 2004 Equity Incentive Plan | 10-Q | 000-21184 | 10.4 | 11/7/2008 | |||||||
10.14 | *Form of Global RSU Agreement for 2004 Equity Incentive Plan (including Notice of Grant of Restricted Stock Units) | 8-K | 000-21184 | 10.1 | 9/27/2010 | |||||||
10.15 | *Form of Notice of Grant For 1993 Stock Option Plan, with Exhibit A thereto, Form of Stock Option Agreement; and Exhibit B thereto, Form of Stock Purchase Agreement | S-8 | 333-872 | 10.6 | 1/23/1996 | |||||||
10.16 | *Microchip Technology Incorporated 2001 Employee Stock Purchase Plan as amended through March 1, 2012 | 10-Q | 000-21184 | 10.1 | 2/6/2012 | |||||||
54
Incorporated by Reference | ||||||||||||
Exhibit Number | Exhibit Description | Form | File Number | Exhibit | Filing Date | Filed Herewith | ||||||
10.17 | *1997 Nonstatutory Stock Option Plan, as Amended Through March 3, 2003 | 10-K | 000-21184 | 10.13 | 6/5/2003 | |||||||
10.18 | *Form of Notice of Grant For 1997 Nonstatutory Stock Option Plan, with Exhibit A thereto, Form of Stock Option Agreement | 10-K | 000-21184 | 10.17 | 5/27/1998 | |||||||
10.19 | Microchip Technology Incorporated International Employee Stock Purchase Plan as amended through May 19, 2014, including Purchase Agreement | 10-K | 000-21184 | 10.17 | 5/30/2014 | |||||||
10.20 | *Executive Management Incentive Compensation Plan as amended on August 19, 2011 | 8-K | 000-21184 | 10.1 | 8/24/2011 | |||||||
10.21 | *Discretionary Executive Management Incentive Compensation Plan | 10-Q | 000-21184 | 10.5 | 2/6/2007 | |||||||
10.22 | Management Incentive Compensation Plan as amended by the Board of Directors on May 17, 2013 | 10-K | 000-21184 | 10.21 | 5/30/2013 | |||||||
10.23 | *Microchip Technology Incorporated Supplemental Retirement Plan | S-8 | 333-101696 | 4.1.1 | 4/1/2009 | |||||||
10.24 | *Adoption Agreement to the Microchip Technology Incorporated Supplemental Retirement Plan dated January 1, 1997 | S-8 | 333-101696 | 4.1.3 | 4/1/2003 | |||||||
10.25 | *Amendment dated December 9, 1999 to the Adoption Agreement to the Microchip Technology Incorporated Supplemental Retirement Plan | S-8 | 333-101696 | 4.1.4 | 4/1/2004 | |||||||
10.26 | *February 3, 2003 Amendment to the Adoption Agreement to the Microchip Technology Incorporated Supplemental Retirement Plan | 10-K | 000-21184 | 10.28 | 6/5/2003 | |||||||
10.27 | *Amendments to Supplemental Retirement Plan | 10-Q | 000-21184 | 10.1 | 2/9/2006 | |||||||
10.28 | *Change of Control Severance Agreement | 8-K | 000-21184 | 10.1 | 12/18/2008 | |||||||
10.29 | *Change of Control Severance Agreement | 8-K | 000-21184 | 10.2 | 12/18/2008 | |||||||
10.30 | Development Agreement dated as of August 29, 1997 by and between Registrant and the City of Chandler, Arizona | 10-Q | 000-21184 | 10.1 | 2/13/1998 | |||||||
10.31 | Addendum to Development Agreement by and between Registrant and the City of Tempe, Arizona, dated May 11, 2000 | 10-K | 000-21184 | 10.14 | 5/15/2001 | |||||||
10.32 | Development Agreement dated as of July 17, 1997 by and between Registrant and the City of Tempe, Arizona | 10-Q | 000-21184 | 10.2 | 2/13/1998 | |||||||
10.33 | Amended Strategic Investment Program Contract dated as of June 8, 2009 between, Multnomah County, Oregon, City of Gresham, Oregon and Microchip Technology Incorporated | 8-K | 000-21184 | 10.1 | 6/11/2009 | |||||||
21.1 | Subsidiaries of Registrant | X | ||||||||||
23.1 | Consent of Independent Registered Public Accounting Firm | X | ||||||||||
24.1 | Power of Attorney included on Page 52 of this Form 10-K | X | ||||||||||
55
Incorporated by Reference | ||||||||||||
Exhibit Number | Exhibit Description | Form | File Number | Exhibit | Filing Date | Filed Herewith | ||||||
31.1 | Certification of Chief Executive Officer Pursuant to Rule 13a-14(a) of the Securities Exchange Act of 1934, as amended (the Exchange Act) | X | ||||||||||
31.2 | Certification of Chief Financial Officer Pursuant to Rule 13a-14(a) of the Securities Exchange Act of 1934, as amended (the Exchange Act) | X | ||||||||||
32 | Certifications Pursuant to 18 U.S.C. Section 1350, as adopted pursuant to Section 906 of the Sarbanes-Oxley Act of 2002 | X | ||||||||||
*Compensation plans or arrangements in which directors or executive officers are eligible to participate. | ||||||||||||
56
Annual Report on Form 10-K
Item 8, Item 15(a)(1) and (2), (b) and (c)
_________________________________
INDEX TO FINANCIAL STATEMENTS
CONSOLIDATED FINANCIAL STATEMENTS
EXHIBITS
_________________________________
YEAR ENDED MARCH 31, 2015
MICROCHIP TECHNOLOGY INCORPORATED
AND SUBSIDIARIES
CHANDLER, ARIZONA
MICROCHIP TECHNOLOGY INCORPORATED AND SUBSIDIARIES
Index to Consolidated Financial Statements
Page Number | |
Report of Independent Registered Public Accounting Firm | F-1 |
Consolidated Balance Sheets as of March 31, 2015 and 2014 | F-2 |
Consolidated Statements of Income for each of the three years in the period ended March 31, 2015 | F-3 |
Consolidated Statements of Comprehensive Income for each of the three years in the period ended March 31, 2015 | F-4 |
Consolidated Statements of Cash Flows for each of the three years in the period ended March 31, 2015 | F-5 |
Consolidated Statements of Changes in Equity for each of the three years in the period ended March 31, 2015 | F-7 |
Notes to Consolidated Financial Statements | F-9 |
i
REPORT OF INDEPENDENT REGISTERED PUBLIC ACCOUNTING FIRM
The Board of Directors and Stockholders of
Microchip Technology Incorporated and subsidiaries
We have audited the accompanying consolidated balance sheets of Microchip Technology Incorporated and subsidiaries as of March 31, 2015 and 2014, and the related consolidated statements of income, comprehensive income, changes in equity, and cash flows for each of the three years in the period ended March 31, 2015. These financial statements are the responsibility of the Company's management. Our responsibility is to express an opinion on these financial statements based on our audits.
We conducted our audits in accordance with the standards of the Public Company Accounting Oversight Board (United States). Those standards require that we plan and perform the audit to obtain reasonable assurance about whether the financial statements are free of material misstatement. An audit includes examining, on a test basis, evidence supporting the amounts and disclosures in the financial statements. An audit also includes assessing the accounting principles used and significant estimates made by management, as well as evaluating the overall financial statement presentation. We believe that our audits provide a reasonable basis for our opinion.
In our opinion, the consolidated financial statements referred to above present fairly, in all material respects, the consolidated financial position of Microchip Technology Incorporated and subsidiaries at March 31, 2015 and 2014, and the consolidated results of their operations and their cash flows for each of the three years in the period ended March 31, 2015, in conformity with U.S. generally accepted accounting principles.
We also have audited, in accordance with the standards of the Public Company Accounting Oversight Board (United States), Microchip Technology Incorporated and subsidiaries' internal control over financial reporting as of March 31, 2015, based on criteria established in Internal Control—Integrated Framework (1992 framework) issued by the Committee of Sponsoring Organizations of the Treadway Commission and our report dated May 26, 2015 expressed an unqualified opinion thereon.
/s/ Ernst & Young LLP
Phoenix, Arizona
May 26, 2015
F-1
Item1. | Financial Statements |
MICROCHIP TECHNOLOGY INCORPORATED AND SUBSIDIARIES
CONSOLIDATED BALANCE SHEETS
(in thousands, except share and per share amounts)
ASSETS | |||||||
March 31, | |||||||
2015 | 2014 | ||||||
Cash and cash equivalents | $ | 607,815 | $ | 466,603 | |||
Short-term investments | 1,351,054 | 878,182 | |||||
Accounts receivable, net | 273,937 | 242,405 | |||||
Inventories | 279,456 | 262,725 | |||||
Prepaid expenses | 34,717 | 31,756 | |||||
Deferred tax assets | 71,045 | 67,490 | |||||
Assets held for sale | 13,989 | — | |||||
Other current assets | 32,604 | 20,238 | |||||
Total current assets | 2,664,617 | 1,969,399 | |||||
Property, plant and equipment, net | 581,572 | 531,967 | |||||
Long-term investments | 383,326 | 798,712 | |||||
Goodwill | 571,271 | 276,097 | |||||
Intangible assets, net | 504,417 | 445,499 | |||||
Other assets | 75,510 | 45,956 | |||||
Total assets | $ | 4,780,713 | $ | 4,067,630 | |||
LIABILITIES AND EQUITY | |||||||
Accounts payable | $ | 86,866 | $ | 74,050 | |||
Accrued liabilities | 100,978 | 96,731 | |||||
Short-term borrowings | — | 17,500 | |||||
Deferred income on shipments to distributors | 166,128 | 147,798 | |||||
Total current liabilities | 353,972 | 336,079 | |||||
Senior convertible debentures | 1,174,036 | — | |||||
Junior convertible debentures | 190,870 | 371,873 | |||||
Long-term line of credit | 461,952 | 300,000 | |||||
Long-term borrowings, net | — | 331,385 | |||||
Long-term income tax payable | 114,336 | 179,966 | |||||
Long-term deferred tax liability | 381,192 | 375,316 | |||||
Other long-term liabilities | 43,329 | 37,550 | |||||
Stockholders' equity: | |||||||
Preferred stock, $0.001 par value; authorized 5,000,000 shares; no shares issued or outstanding | — | — | |||||
Common stock, $0.001 par value; authorized 450,000,000 shares; 218,789,994 shares issued and 202,080,306 shares outstanding at March 31, 2015; 218,789,994 shares issued and 200,002,736 shares outstanding at March 31, 2014 | 202 | 200 | |||||
Additional paid-in capital | 999,515 | 1,244,583 | |||||
Common stock held in treasury: 16,709,688 shares at March 31, 2015; 18,787,258 shares at March 31, 2014 | (515,679 | ) | (577,382 | ) | |||
Accumulated other comprehensive income | 11,076 | 1,051 | |||||
Retained earnings | 1,549,540 | 1,467,009 | |||||
Microchip Technology stockholders' equity | 2,044,654 | 2,135,461 | |||||
Noncontrolling interests | 16,372 | — | |||||
Total equity | 2,061,026 | 2,135,461 | |||||
Total liabilities and equity | $ | 4,780,713 | $ | 4,067,630 | |||
See accompanying notes to consolidated financial statements | |||||||
F-2
MICROCHIP TECHNOLOGY INCORPORATED AND SUBSIDIARIES
CONSOLIDATED STATEMENTS OF INCOME
(in thousands, except per share amounts)
Year ended March 31, | |||||||||||
2015 | 2014 | 2013 | |||||||||
Net sales | $ | 2,147,036 | $ | 1,931,217 | $ | 1,581,623 | |||||
Cost of sales (1) | 917,472 | 802,474 | 743,164 | ||||||||
Gross profit | 1,229,564 | 1,128,743 | 838,459 | ||||||||
Operating expenses: | |||||||||||
Research and development (1) | 349,543 | 305,043 | 254,723 | ||||||||
Selling, general and administrative (1) | 274,815 | 267,278 | 261,471 | ||||||||
Amortization of acquired intangible assets | 176,746 | 94,534 | 111,537 | ||||||||
Special charges, net | 2,840 | 3,024 | 32,175 | ||||||||
803,944 | 669,879 | 659,906 | |||||||||
Operating income | 425,620 | 458,864 | 178,553 | ||||||||
Losses on equity method investments | (317 | ) | (177 | ) | (617 | ) | |||||
Other income (expense): | |||||||||||
Interest income | 19,527 | 16,485 | 15,560 | ||||||||
Interest expense | (62,034 | ) | (48,716 | ) | (40,915 | ) | |||||
Loss on retirement of convertible debentures | (50,631 | ) | — | — | |||||||
Other income (expense), net | 13,742 | 5,898 | (404 | ) | |||||||
Income before income taxes | 345,907 | 432,354 | 152,177 | ||||||||
Income tax (benefit) provision | (19,418 | ) | 37,073 | 24,788 | |||||||
Net income | 365,325 | 395,281 | 127,389 | ||||||||
Less: Net loss attributable to noncontrolling interests | 3,684 | — | — | ||||||||
Net income attributable to Microchip Technology | $ | 369,009 | $ | 395,281 | $ | 127,389 | |||||
Basic net income per common share attributable to Microchip Technology stockholders | $ | 1.84 | $ | 1.99 | $ | 0.65 | |||||
Diluted net income per common share attributable to Microchip Technology stockholders | $ | 1.65 | $ | 1.82 | $ | 0.62 | |||||
Dividends declared per common share | $ | 1.425 | $ | 1.417 | $ | 1.406 | |||||
Basic common shares outstanding | 200,937 | 198,291 | 194,595 | ||||||||
Diluted common shares outstanding | 223,561 | 217,630 | 205,776 | ||||||||
(1) Includes share-based compensation expense as follows: | |||||||||||
Cost of sales | $ | 9,010 | $ | 7,340 | $ | 8,234 | |||||
Research and development | 28,164 | 24,554 | 22,178 | ||||||||
Selling, general and administrative | 21,422 | 21,893 | 27,603 | ||||||||
See accompanying notes to consolidated financial statements
F-3
MICROCHIP TECHNOLOGY INCORPORATED AND SUBSIDIARIES
CONSOLIDATED STATEMENTS OF COMPREHENSIVE INCOME
CONSOLIDATED STATEMENTS OF COMPREHENSIVE INCOME
(in thousands)
Year Ended March 31, | |||||||||||
2015 | 2014 | 2013 | |||||||||
Net income | $ | 365,325 | $ | 395,281 | $ | 127,389 | |||||
Less: Net loss attributable to noncontrolling interests | 3,684 | — | — | ||||||||
Net income attributable to Microchip Technology | 369,009 | 395,281 | 127,389 | ||||||||
Components of other comprehensive income (loss): | |||||||||||
Available-for sale securities: | |||||||||||
Unrealized holding gains (losses), net of tax effect of $12, $497 and $557, respectively | 33,759 | (4,377 | ) | 2,686 | |||||||
Reclassification of realized transactions, net of tax effect of $12, $776 and $51, respectively | (18,694 | ) | (1,595 | ) | (343 | ) | |||||
Change in minimum pension liability, net of tax effect of ($76), $55 and $28, respectively | (127 | ) | 88 | 52 | |||||||
Change in net foreign currency translation adjustment | (5,188 | ) | — | 1,439 | |||||||
Other comprehensive income (loss), net of taxes | 9,750 | (5,884 | ) | 3,834 | |||||||
Less: Other comprehensive (income) loss attributable to noncontrolling interests | 866 | — | — | ||||||||
Other comprehensive income (loss) attributable to Microchip Technology | 10,616 | (5,884 | ) | 3,834 | |||||||
Comprehensive income | 375,075 | 389,397 | 131,223 | ||||||||
Less: Comprehensive loss attributable to noncontrolling interests | 4,550 | — | — | ||||||||
Comprehensive income attributable to Microchip Technology | $ | 379,625 | $ | 389,397 | $ | 131,223 | |||||
See accompanying notes to consolidated financial statements
F-4
MICROCHIP TECHNOLOGY INCORPORATED AND SUBSIDIARIES
CONSOLIDATED STATEMENTS OF CASH FLOWS
(in thousands)
Year ended March 31, | |||||||||||
2015 | 2014 | 2013 | |||||||||
Cash flows from operating activities: | |||||||||||
Net income | $ | 365,325 | $ | 395,281 | $ | 127,389 | |||||
Adjustments to reconcile net income to net cash provided by operating activities: | |||||||||||
Depreciation and amortization | 278,298 | 189,139 | 204,097 | ||||||||
Deferred income taxes | (32,811 | ) | 5,321 | (28,368 | ) | ||||||
Share-based compensation expense related to equity incentive plans | 58,596 | 53,787 | 52,069 | ||||||||
Excess tax benefit from share-based compensation | (1,216 | ) | (1,411 | ) | (297 | ) | |||||
Loss on retirement of junior convertible debentures | 50,631 | — | — | ||||||||
Convertible debt derivatives - revaluation and amortization | 26 | (482 | ) | 138 | |||||||
Amortization of debt discount on convertible debentures | 14,791 | 8,970 | 8,197 | ||||||||
Amortization of debt issuance costs | 2,463 | 1,959 | 217 | ||||||||
Losses on equity method investments | 317 | 177 | 617 | ||||||||
Losses (gains) on sale of assets | — | 244 | (256 | ) | |||||||
Loss on write-down of fixed assets | 362 | — | 400 | ||||||||
Impairment of intangible assets | 1,881 | 350 | — | ||||||||
Realized gain on available-for-sale investments | (18,469 | ) | — | — | |||||||
Amortization of premium on available-for-sale investments | 9,949 | 10,754 | 13,186 | ||||||||
Unrealized impairment loss on available-for-sale investments | — | — | 413 | ||||||||
Special (income) charges | — | (459 | ) | 4,400 | |||||||
Gain on shares of acquired company | — | (2,438 | ) | — | |||||||
Changes in operating assets and liabilities: | |||||||||||
(Increase) decrease in accounts receivable | (15,893 | ) | (12,508 | ) | 386 | ||||||
Decrease (increase) in inventories | 25,517 | (18,500 | ) | 65,867 | |||||||
Increase in deferred income on shipments to distributors | 18,330 | 8,846 | 18,867 | ||||||||
Decrease in accounts payable and accrued liabilities | (33,992 | ) | (11,633 | ) | (40,914 | ) | |||||
Change in other assets and liabilities | (2,923 | ) | 49,167 | 32,957 | |||||||
Net cash provided by operating activities | 721,182 | 676,564 | 459,365 | ||||||||
Cash flows from investing activities: | |||||||||||
Purchases of available-for-sale investments | (959,318 | ) | (1,337,482 | ) | (998,977 | ) | |||||
Sales and maturities of available-for-sale investments | 1,097,065 | 951,296 | 856,579 | ||||||||
Acquisition of ISSC, net of cash acquired | (252,469 | ) | — | — | |||||||
Purchase of additional controlling interest in ISSC | (32,095 | ) | — | — | |||||||
Acquisition of Supertex, net of cash acquired | (375,365 | ) | — | — | |||||||
Acquisition of SMSC, net of cash acquired | — | — | (731,746 | ) | |||||||
Other business acquisitions, net of cash acquired | — | (11,187 | ) | (20,556 | ) | ||||||
Investments in other assets | (6,663 | ) | (9,069 | ) | (4,730 | ) | |||||
Proceeds from sale of assets | — | 16,235 | 306 | ||||||||
Capital expenditures | (149,472 | ) | (113,072 | ) | (50,818 | ) | |||||
Net cash used in investing activities | (678,317 | ) | (503,279 | ) | (949,942 | ) | |||||
Cash flows from financing activities: | |||||||||||
Payments to retire junior convertible debentures | (1,134,621 | ) | — | — | |||||||
Proceeds from issuance of senior convertible debentures | 1,725,000 | — | — | ||||||||
Repayments of revolving loan under previous credit facility | — | (650,000 | ) | (761,000 | ) | ||||||
Repayments of revolving loan under new credit facility | (1,697,642 | ) | (453,500 | ) | — | ||||||
Proceeds from borrowings on revolving loan under previous credit facility | — | 30,000 | 1,381,000 | ||||||||
Proceeds from borrowings on revolving loan under new credit facility | 1,859,594 | 753,500 | — | ||||||||
Proceeds from issuance of long-term borrowings | — | 350,000 | — | ||||||||
Repayments of long-term borrowings | (350,000 | ) | — | — | |||||||
Deferred financing costs | (32,846 | ) | (7,515 | ) | — | ||||||
Payment of cash dividends | (286,478 | ) | (281,204 | ) | (273,822 | ) | |||||
Proceeds from sale of common stock | 34,433 | 60,086 | 51,365 | ||||||||
Tax payments related to shares withheld for vested restricted stock units | (19,504 | ) | (22,640 | ) | (15,670 | ) | |||||
Contingent consideration payment | — | (14,700 | ) | — | |||||||
F-5
Year ended March 31, | |||||||||||
2015 | 2014 | 2013 | |||||||||
Capital lease payments | (604 | ) | (454 | ) | — | ||||||
Excess tax benefit from share-based compensation | 1,216 | 1,411 | 297 | ||||||||
Net cash provided by (used in) financing activities | 98,548 | (235,016 | ) | 382,170 | |||||||
Effect of foreign exchange rate changes on cash and cash equivalents | (201 | ) | — | 986 | |||||||
Net increase (decrease) in cash and cash equivalents | 141,212 | (61,731 | ) | (107,421 | ) | ||||||
Cash and cash equivalents at beginning of period | 466,603 | 528,334 | 635,755 | ||||||||
Cash and cash equivalents at end of period | $ | 607,815 | $ | 466,603 | $ | 528,334 | |||||
See accompanying notes to consolidated financial statements
F-6
MICROCHIP TECHNOLOGY INCORPORATED AND SUBSIDIARIES
CONSOLIDATED STATEMENTS OF CHANGES IN EQUITY
(in thousands)
Common Stock and Additional Paid-in-Capital | Common Stock Held in Treasury | Accumulated Other Comprehensive Income | Retained Earnings | Net Microchip Technology Stockholders' Equity | Noncontrolling Interests | Total Equity | ||||||||||||||||||||||||||||
Shares | Amount | Shares | Amount | |||||||||||||||||||||||||||||||
Balance at March 31, 2012 | 218,790 | $ | 1,269,100 | 25,639 | $ | (780,893 | ) | $ | 3,101 | $ | 1,499,365 | $ | 1,990,673 | $ | — | $ | 1,990,673 | |||||||||||||||||
Net income | — | — | — | — | — | 127,389 | 127,389 | — | 127,389 | |||||||||||||||||||||||||
Other comprehensive income | — | — | — | — | 3,834 | — | 3,834 | — | 3,834 | |||||||||||||||||||||||||
Proceeds from sales of common stock through employee equity incentive plans | 3,799 | 51,365 | — | — | — | — | 51,365 | — | 51,365 | |||||||||||||||||||||||||
Restricted stock unit and stock appreciation right withholdings | (477 | ) | (15,670 | ) | — | — | — | — | (15,670 | ) | — | (15,670 | ) | |||||||||||||||||||||
Treasury stock used for new issuances | (3,322 | ) | (98,673 | ) | (3,322 | ) | 98,673 | — | — | — | — | — | ||||||||||||||||||||||
Tax shortfall from equity incentive plans | — | (9,896 | ) | — | — | — | — | (9,896 | ) | — | (9,896 | ) | ||||||||||||||||||||||
Share-based compensation | — | 52,667 | — | — | — | — | 52,667 | — | 52,667 | |||||||||||||||||||||||||
Non-cash consideration - SMSC acquisition | — | 6,930 | — | — | — | — | 6,930 | — | 6,930 | |||||||||||||||||||||||||
Cash dividend | — | — | — | — | — | (273,822 | ) | (273,822 | ) | — | (273,822 | ) | ||||||||||||||||||||||
Balance at March 31, 2013 | 218,790 | 1,255,823 | 22,317 | (682,220 | ) | 6,935 | 1,352,932 | 1,933,470 | — | 1,933,470 | ||||||||||||||||||||||||
Net income | — | — | — | — | — | 395,281 | 395,281 | — | 395,281 | |||||||||||||||||||||||||
Other comprehensive loss | — | — | — | — | (5,884 | ) | — | (5,884 | ) | — | (5,884 | ) | ||||||||||||||||||||||
Proceeds from sales of common stock through employee equity incentive plans | 4,161 | 60,086 | — | — | — | — | 60,086 | — | 60,086 | |||||||||||||||||||||||||
Restricted stock unit and stock appreciation right withholdings | (631 | ) | (22,640 | ) | — | — | — | — | (22,640 | ) | — | (22,640 | ) | |||||||||||||||||||||
Treasury stock used for new issuances | (3,530 | ) | (104,838 | ) | (3,530 | ) | 104,838 | — | — | — | — | — | ||||||||||||||||||||||
Tax benefit from equity incentive plans | — | 1,411 | — | — | — | — | 1,411 | — | 1,411 | |||||||||||||||||||||||||
Share-based compensation | — | 54,941 | — | — | — | — | 54,941 | — | 54,941 | |||||||||||||||||||||||||
Cash dividend | — | — | — | — | — | (281,204 | ) | (281,204 | ) | — | (281,204 | ) | ||||||||||||||||||||||
Balance at March 31, 2014 | 218,790 | 1,244,783 | 18,787 | (577,382 | ) | 1,051 | 1,467,009 | 2,135,461 | — | 2,135,461 | ||||||||||||||||||||||||
Acquisition of controlling interest in ISSC | — | — | — | — | — | — | — | 52,467 | 52,467 | |||||||||||||||||||||||||
Net income | — | — | — | — | — | 369,009 | 369,009 | (3,684 | ) | 365,325 | ||||||||||||||||||||||||
Other comprehensive income | — | — | — | — | 10,616 | — | 10,616 | (866 | ) | 9,750 | ||||||||||||||||||||||||
Other | — | — | — | — | — | — | — | 240 | 240 | |||||||||||||||||||||||||
Purchase of additional shares from noncontrolling interest | — | 345 | — | — | (591 | ) | — | (246 | ) | (31,849 | ) | (32,095 | ) | |||||||||||||||||||||
Proceeds from sales of common stock through employee equity incentive plans | 2,503 | 34,369 | — | — | — | — | 34,369 | 64 | 34,433 | |||||||||||||||||||||||||
Restricted stock unit and stock appreciation right withholdings | (426 | ) | (19,504 | ) | — | — | — | — | (19,504 | ) | — | (19,504 | ) | |||||||||||||||||||||
Treasury stock used for new issuances | (2,077 | ) | (61,703 | ) | (2,077 | ) | 61,703 | — | — | — | — | — | ||||||||||||||||||||||
Tax benefit from equity incentive plans | — | 1,220 | — | — | — | — | 1,220 | — | 1,220 | |||||||||||||||||||||||||
F-7
Common Stock and Additional Paid-in-Capital | Common Stock Held in Treasury | Accumulated Other Comprehensive Income | Retained Earnings | Net Microchip Technology Stockholders' Equity | Noncontrolling Interests | Total Equity | ||||||||||||||||||||||||||||
Shares | Amount | Shares | Amount | |||||||||||||||||||||||||||||||
Share-based compensation | — | 56,687 | — | — | — | — | 56,687 | — | 56,687 | |||||||||||||||||||||||||
Non-cash consideration - Supertex acquisition | — | 1,622 | — | — | — | — | 1,622 | — | 1,622 | |||||||||||||||||||||||||
Convertible Debt - retirement of 2037 debentures | — | (606,926 | ) | — | — | — | — | (606,926 | ) | — | (606,926 | ) | ||||||||||||||||||||||
Convertible Debt - issuance of 2025 debentures | — | 348,824 | — | — | — | — | 348,824 | — | 348,824 | |||||||||||||||||||||||||
Cash dividend | — | — | — | — | — | (286,478 | ) | (286,478 | ) | — | (286,478 | ) | ||||||||||||||||||||||
Balance at March 31, 2015 | 218,790 | $ | 999,717 | 16,710 | $ | (515,679 | ) | $ | 11,076 | $ | 1,549,540 | $ | 2,044,654 | $ | 16,372 | $ | 2,061,026 | |||||||||||||||||
See accompanying notes to consolidated financial statements | ||||||||||||||||||||||||||||||||||
F-8
MICROCHIP TECHNOLOGY INCORPORATED AND SUBSIDIARIES
NOTES TO CONSOLIDATED FINANCIAL STATEMENTS
1. SIGNIFICANT ACCOUNTING POLICIES
Nature of Business
Microchip develops, manufactures and sells specialized semiconductor products used by its customers for a wide variety of embedded control applications. Microchip's product portfolio comprises 8-bit, 16-bit and 32-bit PIC® microcontrollers and 16-bit dsPIC® digital signal controllers, which feature on-board Flash (reprogrammable) memory technology. In addition, Microchip offers a broad spectrum of high-performance linear, mixed-signal, power management, thermal management, RF, safety and security and interface devices, as well as serial EEPROMs, Serial Flash memories and Parallel Flash memories. Microchip also licenses Flash-IP solutions that are incorporated in a broad range of products.
Principles of Consolidation
The consolidated financial statements include the accounts of Microchip Technology Incorporated and its majority-owned subsidiaries (Microchip or the Company). The Company owns 100% of the outstanding stock in all of its subsidiaries with the exception of its recent acquisition of ISSC Technologies Corporation (ISSC) as further discussed in Note 2. The noncontrolling interest in the Company's net income from ISSC has been excluded from net income attributable to the Company in the Company's consolidated statements of income. All of the Company's subsidiaries are included in the consolidated financial statements. All significant intercompany accounts and transactions have been eliminated in consolidation.
Revenue Recognition
The Company recognizes revenue when the earnings process is complete, as evidenced by an agreement with the customer, transfer of title as well as fixed or determinable pricing and when collectability is reasonably assured. The Company recognizes revenue from product sales to original equipment manufacturers (OEMs) upon shipment and records reserves for estimated customer returns.
Distributors worldwide generally have broad price protection and product return rights, so the Company defers revenue recognition until the distributor sells the product to their customer. Revenue is recognized when the distributor sells the product to their end customer, at which time the sales price becomes fixed or determinable. Revenue is not recognized upon the Company's shipment to the distributors since, due to discounts from list price as well as price protection rights, the sales price is not substantially fixed or determinable at that time. At the time of shipment to these distributors, the Company records a trade receivable for the selling price as there is a legally enforceable right to payment, relieves inventory for the carrying value of goods shipped since legal title has passed to the distributor, and records the gross margin in deferred income on shipments to distributors on its consolidated balance sheets.
Deferred income on shipments to distributors effectively represents gross margin on the sale to the distributor at the initial shipment date; however, the amount of gross margin recognized by the Company in future periods will be less than the deferred margin as a result of credits granted to distributors on specifically identified products and customers to allow the distributors to earn a competitive gross margin on the sale of the Company's products to their end customers and price protection concessions related to market pricing conditions.
The Company sells the majority of the items in its product catalog to its distributors worldwide at a uniform list price. However, distributors resell the Company's products to end customers at a very broad range of individually negotiated price points. The majority of the Company's distributors' resales require a reduction from the original list price paid. Often, under these circumstances, the Company remits back to the distributor a portion of their original purchase price after the resale transaction is completed in the form of a credit against the distributors' outstanding accounts receivable balance. The credits are on a per unit basis and are not given to the distributor until they provide information regarding the sale to their end customer. The price reductions vary significantly based on the customer, product, quantity ordered, geographic location and other factors and discounts to a price less than the Company's cost have historically been rare. The effect of granting these credits establishes the net selling price from the Company to its distributors for the product and results in the net revenue recognized by the Company when the product is sold by the distributors to their end customers. Thus, a portion of the "deferred income on shipments to distributors" balance represents the amount of distributors' original purchase price that will
F-9
be credited back to the distributor in the future. The wide range and variability of negotiated price concessions granted to distributors does not allow the Company to accurately estimate the portion of the balance in the deferred income on shipments to distributors account that will be credited back to the distributors. Therefore, the Company does not reduce deferred income on shipments to distributors or accounts receivable by anticipated future price concessions; rather, price concessions are recorded against deferred income on shipments to distributors when incurred, which is generally at the time the distributor sells the product.
At March 31, 2015, the Company had approximately $260.9 million of deferred revenue and $94.8 million in deferred cost of sales recognized as $166.1 million of deferred income on shipments to distributors. At March 31, 2014, the Company had approximately $222.8 million of deferred revenue and $75.0 million of deferred cost of sales recognized as $147.8 million of deferred income on shipments to distributors. The deferred income on shipments to distributors that will ultimately be recognized in the Company's income statement will be lower than the amount reflected on the balance sheet due to price credits to be granted to the distributors when the product is sold to their customers. These price credits historically have resulted in the deferred income approximating the overall gross margins that the Company recognizes in the distribution channel of its business.
The Company reduces product pricing through price protection based on market conditions, competitive considerations and other factors. Price protection is granted to distributors on the inventory they have on hand at the date the price protection is offered. When the Company reduces the price of its products, it allows the distributor to claim a credit against its outstanding accounts receivable balances based on the new price of the inventory it has on hand as of the date of the price reduction. There is no immediate revenue impact from the price protection, as it is reflected as a reduction of the deferred income on shipments to distributors' balance.
Products returned by distributors and subsequently scrapped have historically been immaterial to the Company's consolidated results of operations. The Company routinely evaluates the risk of impairment of the deferred cost of sales component of the deferred income on shipments to distributors' account. Because of the historically immaterial amounts of inventory that have been scrapped, and historically rare instances where discounts given to a distributor result in a price less than the Company's cost, the Company believes the deferred costs have a low risk of material impairment.
For license and other arrangements for SuperFlash® technology and other technologies that the Company is continuing to enhance and refine or under which it is obligated to provide unspecified enhancements, non-royalty revenue is recognized over the lesser of (1) the estimated period that the Company has historically enhanced and developed refinements to the specific technology, typically one to three years (the "upgrade period"), and (2) the remaining portion of the upgrade period after the date of delivery of all specified technology and documentation, provided that the fee is fixed or determinable and collection of the fee is reasonably assured. Royalties received during the upgrade period are recognized as revenue based on an amortization calculation of the elapsed portion of the upgrade period compared to the entire estimated upgrade period. Royalties received after the upgrade period has elapsed are recognized when reported to the Company, which generally coincides with the receipt of payment. For licenses or other technology arrangements without an upgrade period, non-royalty revenue from license is recognized upon delivery of the technology if the fee is fixed or determinable and collection of the fee is reasonably assured. Royalties are recognized when reported to the Company, which generally coincides with the receipt of payment.
Shipping charges billed to customers are included in net sales, and the related shipping costs are included in cost of sales. The Company collects and remits certain sales-related taxes on sales of inventory and reports such amounts under the net method in its consolidated statements of income.
Product Warranty
The Company typically warrants its products against defects in materials and workmanship and non-conformance to specifications for 12 to 24 months. The majority of the Company's product warranty claims are settled through the return of the defective product and the shipment of replacement product. Warranty returns are included within the Company's allowance for returns, which is based on historical return rates. Actual future returns could differ from the allowance established. In addition, the Company accrues a liability for specific warranty costs expected to be settled other than through product return and replacement, if a loss is probable and can be reasonably estimated. Product warranty expenses during fiscal 2015, 2014, and 2013 were immaterial.
Advertising Costs
The Company expenses all advertising costs as incurred. Advertising costs were immaterial for the fiscal years ended March 31, 2015, 2014 and 2013.
F-10
Research and Development
Research and development costs are expensed as incurred. Assets purchased to support the Company's ongoing research and development activities are capitalized when related to products which have achieved technological feasibility or that have alternative future uses and are amortized over their estimated useful lives. Research and development expenses include expenditures for labor, share-based payments, depreciation, masks, prototype wafers, and expenses for development of process technologies, new packages, and software to support new products and design environments.
Foreign Currency Translation
The Company's foreign subsidiaries are considered to be extensions of the U.S. Company and any translation gains and losses related to these subsidiaries are included in other income (expense) in the consolidated statements of income. As the U.S. dollar is utilized as the functional currency, gains and losses resulting from foreign currency transactions (transactions denominated in a currency other than the subsidiaries' functional currency) are also included in income. For a portion of fiscal 2015 and fiscal 2013, certain foreign subsidiaries acquired as part of the Company's acquisition activities had the local currency as the functional currency. Once these entities were integrated into the Company's legal structure and intercompany agreements were executed, the U.S. dollar became the functional currency.
Income Taxes
The Company provides for income taxes in accordance with principles contained in ASC Topic 740, Income Taxes. Under these principles, the Company recognizes the amount of income tax payable or refundable for the current year and deferred tax assets and liabilities for the future tax consequences of events that have been recognized in its consolidated financial statements or tax returns.
Deferred tax assets and liabilities are measured using enacted tax rates in effect for the year in which those temporary differences are expected to be recovered or settled. The effect on deferred tax assets and liabilities of a change in tax rates is recognized in earnings in the period when the new rate is enacted. Deferred tax assets are evaluated for future realization and reduced by a valuation allowance if it is more likely than not that a portion will not be realized. In assessing whether it is more likely than not that deferred tax assets will be realized, the Company considers all available evidence, both positive and negative, including its recent cumulative earnings experience and expectations of future available taxable income of the appropriate character by taxing jurisdiction, tax attribute carry back and carry forward periods available to them for tax reporting purposes, and prudent and feasible tax planning strategies.
The Company measures and recognizes the amount of tax benefit that should be recorded for financial statement purposes for uncertain tax positions taken or expected to be taken in a tax return. With respect to uncertain tax positions, the Company evaluates the recognized tax benefits for de-recognition, classification, interest and penalties, interim period accounting and disclosure requirements. Judgment is required in assessing the future tax consequences of events that have been recognized in its consolidated financial statements or tax returns.
Cash and Cash Equivalents
All highly liquid investments, including marketable securities purchased with a remaining maturity of three months or less when acquired are considered to be cash equivalents.
Available-for-Sale Investments
The Company classifies its investments in debt and marketable equity securities as available-for-sale based upon management's intent with regard to the investments and the nature of the underlying securities.
The Company's available-for-sale investments consist of government agency bonds, municipal bonds, auction rate securities (ARS), corporate bonds and marketable equity securities. The Company's investments are carried at fair value with unrealized gains and losses reported in stockholders' equity unless losses are considered to be other than temporary impairments in which case the losses are recognized through the statement of income. Premiums and discounts are amortized or accreted over the life of the related available-for-sale security. Dividend and interest income are recognized when earned. The cost of securities sold is calculated using the specific identification method.
F-11
The Company includes within short-term investments its income yielding available-for-sale securities that can be readily converted to cash and includes within long-term investments those income yielding available-for-sale securities with maturities of over one year that have unrealized losses attributable to them or those that cannot be readily liquidated. Except as discussed in Note 4, the Company intends and has the ability to hold its long-term investments with temporary impairments until such time as these assets are no longer impaired. Such recovery of unrealized losses is not expected to occur within the next year.
Derivative Instruments
Derivative instruments are required to be recorded at fair value as either assets or liabilities in the Company's consolidated balance sheet. The Company's accounting policies for derivative instruments depends on whether the instrument has been designated and qualifies as part of a hedging relationship and further, on the type of hedging relationship.
The Company does not apply hedge accounting to foreign currency forward contracts. Gains and losses associated with currency rate changes on forward contracts are recorded currently in income. These gains and losses have been immaterial to the Company's financial statements.
Interest rate derivative instruments designated as fair value hedges are designed to manage the exposure to interest rate movements and to reduce borrowing costs by converting fixed-rate debt into floating-rate debt. Under these agreements, the Company agrees to exchange, at specified intervals, the difference between the fixed and floating interest amounts calculated by reference to an agreed-upon notional principal amount. For derivative instruments that are designated and qualify as fair value hedges, the gain or loss on the derivatives as well as the offsetting gain or loss on the hedged item attributable to the hedged risk are recognized in earnings. The Company evaluates hedge effectiveness at inception and on an ongoing basis. If a derivative is no longer expected to be highly effective, hedge accounting is discontinued.
Allowance for Doubtful Accounts
The Company maintains an allowance for doubtful accounts for estimated losses resulting from the inability of its customers to make required payments, which is included in bad debt expense. The Company determines the adequacy of this allowance by regularly reviewing the composition of its accounts receivable aging and evaluating individual customer receivables, considering such customer's financial condition, credit history and current economic conditions.
Inventories
Inventories are valued at the lower of cost or market using the first-in, first-out method. The Company writes down its inventory for estimated obsolescence or unmarketable inventory in an amount equal to the difference between the cost of inventory and the estimated market value based upon assumptions about future demand and market conditions. If actual market conditions are less favorable than those projected by the Company, additional inventory write-downs may be required. Inventory impairment charges establish a new cost basis for inventory and charges are not subsequently reversed to income even if circumstances later suggest that increased carrying amounts are recoverable. In estimating reserves for obsolescence, the Company primarily evaluates estimates of demand over a 12-month period and provides reserves for inventory on hand in excess of the estimated 12-month demand. Estimates for projected 12-month demand are generally based on the average shipments of the prior three-month period, which are then annualized to adjust for any potential seasonality in the Company's business. The estimated 12-month demand is compared to the Company's most recently developed sales forecast to further reconcile the 12-month demand estimate. Management reviews and adjusts the estimates as appropriate based on specific situations. For example, demand can be adjusted up for new products for which historic sales are not representative of future demand. Alternatively, demand can be adjusted down to the extent any existing products are being replaced or discontinued.
In periods where the Company's production levels are substantially below normal operating capacity, unabsorbed overhead production costs associated with the reduced production levels of the Company's manufacturing facilities are charged directly to cost of sales.
F-12
Property, Plant and Equipment
Property, plant and equipment are stated at cost. Major renewals and improvements are capitalized, while maintenance and repairs are expensed when incurred. The Company's property and equipment accounting policies incorporate estimates, assumptions and judgments relative to the useful lives of its property and equipment. Depreciation is provided for assets placed in service on a straight-line basis over the estimated useful lives of the relative assets, which range from 10 to 30 years for buildings and building improvements and 3 to 8 years for machinery and equipment. The Company evaluates the carrying value of its property and equipment when events or changes in circumstances indicate that the carrying value of such assets may be impaired. Asset impairment evaluations are, by nature, highly subjective.
Senior and Junior Subordinated Convertible Debentures
The Company separately accounts for the liability and equity components of its senior and junior subordinated convertible debentures in a manner that reflects its nonconvertible debt (unsecured debt) borrowing rate when interest cost is recognized. This results in a bifurcation of a component of the debt, classification of that component in equity and the accretion of the resulting discount on the debt to be recognized as part of interest expense in its consolidated statements of income. Lastly, the Company includes the dilutive effect of the shares of its common stock issuable upon conversion of the outstanding senior and junior subordinated convertible debentures in its diluted income per share calculation regardless of whether the market price triggers or other contingent conversion features have been met. The Company applies the treasury stock method as it has the intent and ability to settle the principal amounts of the senior and junior subordinated convertible debentures in cash. This method results in incremental dilutive shares when the average market value of the Company's common stock for a reporting period exceeds the conversion prices per share which were $68.17 and $25.09 for the senior and junior subordinated convertible debentures, respectively, at March 31, 2015 and adjusts as dividends are recorded in the future.
Upon a de-recognition event, the Company estimates the fair value of the liability component and compares that to the carrying amount in order to calculate the appropriate amount of gain or loss. The remaining amounts paid or issued (in the case of non cash consideration in the form of shares of common stock) are recognized as a reduction of additional paid-in-capital. The fair value of the liability component is estimated using the current comparable borrowing rate for an otherwise identical non-convertible debt instrument.
Litigation
The Company's estimated range of liability related to pending litigation is based on claims that management believes a loss is probable and for which an amount or range of loss is estimable. Because of uncertainties related to both the outcome and range of any potential losses from pending litigation, the Company is generally unable to make any reasonable estimates as to liability that might result from unfavorable outcomes. As additional information becomes available, the Company will assess its potential liability related to pending litigation and revise its estimates, accordingly.
Business Combinations
All of the Company's business combinations are accounted for at fair value under the acquisition method of accounting. Under the acquisition method of accounting, (i) acquisition-related costs, except for those costs incurred to issue debt or equity securities, will be expensed in the period incurred; (ii) non-controlling interests will be valued at fair value at the acquisition date; (iii) in-process research and development will be recorded at fair value as an intangible asset at the acquisition date and amortized once the technology reaches technological feasibility; (iv) restructuring costs associated with a business combination will be expensed subsequent to the acquisition date; and (v) changes in deferred tax asset valuation allowances and income tax uncertainties after the acquisition date will be recognized through income tax expense or directly in contributed capital. The measurement of fair value of assets acquired and liabilities assumed requires significant judgment. The valuation of intangible assets and acquired investments, in particular, requires that the Company use valuation techniques such as the income approach. The income approach includes the use of a discounted cash flow model, which includes discounted cash flow scenarios and requires the following significant estimates: revenue, expenses, capital spending and other costs, and discount rates based on the respective risks of the cash flows. The valuation of non-marketable equity investments acquired also takes into account variables such as conditions reflected in the capital markets, recent financing activity by the investees, the investees' capital structure and the terms of the investees' issued interests.
F-13
Goodwill and Other Intangible Assets
Goodwill is recorded when the purchase price paid for an acquisition exceeds the estimated fair value of the net identified tangible and intangible assets acquired. The Company is required to perform an annual impairment review, and more frequently under certain circumstances. The goodwill is subjected to this test during the fourth quarter of the Company's fiscal year. The Company engages primarily in the development, manufacture and sale of semiconductor products as well as technology licensing. As a result, the Company concluded there are two reporting units, semiconductor products and technology licensing. Under the qualitative goodwill impairment assessment standard, management evaluates whether it is more likely than not that goodwill is impaired. If it is determined that it is more likely than not, the Company proceeds with the next step of the impairment test, which compares the fair value of the reporting unit to its carrying value. If the Company determines through the impairment process that goodwill has been impaired, the Company will record the impairment charge in its results of operation. Through March 31, 2015, the Company has not had impaired goodwill. The Company's other intangible assets represent existing technologies, core and developed technology, in-process research and development, trademarks and trade names, and customer-related intangibles. Other intangible assets are amortized over their respective estimated lives, ranging from one year to ten years. In the event that facts and circumstances indicate intangibles or other long-lived assets may be impaired, the Company evaluates the recoverability and estimated useful lives of such assets. In-process research and development is capitalized until such time the related projects are completed or abandoned at which time the capitalized amounts will begin to be amortized or written off.
Impairment of Long-Lived Assets
The Company assesses whether indicators of impairment of long-lived assets are present. If such indicators are present, the Company determines whether the sum of the estimated undiscounted cash flows attributable to the assets in question is less than their carrying value. If less, the Company recognizes an impairment loss based on the excess of the carrying amount of the assets over their respective fair values. Fair value is determined by discounted future cash flows, appraisals or other methods. If the assets determined to be impaired are to be held and used, the Company recognizes an impairment loss through a charge to operating results to the extent the present value of anticipated net cash flows attributable to the asset are less than the asset's carrying value. The Company would depreciate the remaining value over the remaining estimated useful life of the asset.
Share-Based Compensation
The Company has equity incentive plans under which non-qualified stock options and restricted stock units (RSUs) have been granted to employees and non-employee members of the Board of Directors. In the second half of fiscal 2006, the Company adopted RSUs as its primary equity incentive compensation instrument for employees. The Company also has an employee stock purchase plan for eligible employees.
The Company estimates the fair value of share-based payment awards on the date of grant using an option pricing model. The value of the portion of the award that is ultimately expected to vest is recognized as expense ratably over the requisite service periods. The Company has estimated the fair value of each award as of the date of grant using the Black-Scholes option pricing model, which was developed for use in estimating the value of traded options that have no vesting restrictions and that are freely transferable.
Determining the appropriate fair-value model and calculating the fair value of share-based awards at the date of grant requires judgment. The fair value of RSUs is based on the fair market value of the Company's common stock on the date of grant discounted for expected future dividends. The Company uses the Black-Scholes option pricing model to estimate the fair value of employee stock options and rights to purchase shares under stock purchase plans. Option pricing models, including the Black-Scholes model, also require the use of input assumptions, including expected volatility, expected life, expected dividend rate, and expected risk-free rate of return. The Company uses a blend of historical and implied volatility based on options freely traded in the open market as it believes this is more reflective of market conditions and a better indicator of expected volatility than using purely historical volatility. The expected life of the awards is based on historical and other economic data trended into the future. The risk-free interest rate assumption is based on observed interest rates appropriate for the expected terms of the Company's awards. The dividend yield assumption is based on the Company's history and expectation of future dividend payouts. The Company estimates the number of share-based awards which will be forfeited due to employee turnover. Quarterly changes in the estimated forfeiture rate would affect share-based compensation, as the impact
F-14
on prior period amortization for all unvested awards is recognized in the period the forfeiture estimate is changed. If the actual forfeiture rate is higher than the estimated forfeiture rate, then an adjustment is made to increase the estimated forfeiture rate, which will result in a decrease to the expense recognized in the financial statements. If the actual forfeiture rate is lower than the estimated forfeiture rate, then an adjustment is made to decrease the estimated forfeiture rate, which will result in an increase to the expense recognized in the financial statements. If forfeiture adjustments are made, they would affect the Company's results of operations. The effect of forfeiture adjustments in the years ended March 31, 2015, 2014 and 2013 was immaterial.
The Company evaluates the assumptions used to value its awards on a quarterly basis. If factors change and the Company employs different assumptions, share-based compensation expense may differ significantly from what was recorded in the past. If there are any modifications or cancellations of the underlying unvested securities, the Company may be required to accelerate or increase any remaining unearned share-based compensation expense. Future share-based compensation expense and unearned share-based compensation will increase to the extent that the Company grants additional equity awards to employees or it assumes unvested equity awards in connection with acquisitions.
Concentrations of Credit Risk
Financial instruments that potentially subject the Company to concentrations of credit risk consist primarily of investments in debt securities and trade receivables. Investments in debt securities with original maturities of greater than six months consist primarily of AAA and AA rated financial instruments and counterparties. The Company's investments are primarily in direct obligations of the U.S. government or its agencies, corporate bonds, and municipal bonds.
Concentrations of credit risk with respect to accounts receivable are generally not significant due to the diversity of the Company's customers and geographic sales areas. The Company sells its products primarily to OEMs and distributors in the Americas, Europe and Asia. The Company performs ongoing credit evaluations of its customers' financial condition and, as deemed necessary, may require collateral, primarily letters of credit.
Distributor advances, included in deferred income on shipments to distributors in the consolidated balance sheets, totaled $116.0 million at March 31, 2015 and $92.8 million at March 31, 2014. On sales to distributors, the Company's payment terms generally require the distributor to settle amounts owed to the Company for an amount in excess of their ultimate cost. The Company's sales price to its distributors may be higher than the amount that the distributors will ultimately owe the Company because distributors often negotiate price reductions after purchasing the product from the Company and such reductions are often significant. It is the Company's practice to apply these negotiated price discounts to future purchases, requiring the distributor to settle receivable balances, on a current basis, generally within 30 days, for amounts originally invoiced. This practice has an adverse impact on the working capital of the Company's distributors. As such, the Company has entered into agreements with certain distributors whereby it advances cash to the distributors to reduce the distributor's working capital requirements. These advances are reconciled at least on a quarterly basis and are estimated based on the amount of ending inventory as reported by the distributor multiplied by a negotiated percentage. Such advances have no impact on revenue recognition or the Company's consolidated statements of income. The Company processes discounts taken by distributors against its deferred income on shipments to distributors' balance and trues-up the advanced amounts generally after the end of each completed fiscal quarter. The terms of these advances are set forth in binding legal agreements and are unsecured, bear no interest on unsettled balances and are due upon demand. The agreements governing these advances can be canceled by the Company at any time.
Use of Estimates
The Company has made a number of estimates and assumptions relating to the reporting of assets, liabilities, revenues and expenses and the disclosure of contingent assets and liabilities to prepare its consolidated financial statements in conformity with U.S. Generally Accepted Accounting Principles. Actual results could differ from those estimates.
Recently Issued Accounting Pronouncements
In June 2014, the Financial Accounting Standards Board (FASB) issued Accounting Standards Update (ASU) No. 2014-12, Compensation - Stock Compensation (Topic 718): Accounting for Share-Based Payments When the Terms of an Award Provide That a Performance Target Could be Achieved after the Requisite Service Period. The amendments in this ASU provide explicit guidance on whether a performance target contained in a share-based payment award that could be achieved after the requisite service period should be treated (i) as a performance condition that affects vesting or (ii) as a nonvesting condition that affects the grant-date fair value of the award. The amendments require that a performance target that affects vesting, and that could be achieved after the requisite service period, be treated as a performance condition rather than as a nonvesting
F-15
condition. Accordingly, such performance targets are not reflected in the estimation of the grant date fair value of the award. Compensation cost should be recognized in the period in which it becomes probable that the performance target will be achieved and should represent the compensation cost attributable to the period(s) for which the requisite service has already been rendered. If the performance target becomes probable of being achieved before the end of the requisite service period, the remaining unrecognized compensation cost should be recognized prospectively over the remaining service period. The total amount of compensation cost recognized during and after the requisite service period should reflect the number of awards that are expected to vest and should be adjusted to reflect those awards that ultimately vest. The amendments in this update are effective for annual periods beginning after December 15, 2015, and interim periods within those annual periods. Early adoption is permitted. The Company does not anticipate adoption of this ASU will have a material impact on its consolidated financial statements.
In July 2013, the FASB issued ASU No. 2013-11, Presentation of an Unrecognized Tax Benefit When a Net Operating Loss Carryforward, a Similar Tax Loss, or a Tax Credit Carryforward Exists (ASU 2013-11) to provide guidance on the presentation of unrecognized tax benefits. ASU 2013-11 requires an entity to present an unrecognized tax benefit, or a portion of an unrecognized tax benefit, as a reduction to a deferred tax asset for a net operating loss carryforward, a similar tax loss, or a tax credit carryforward, except as follows: to the extent a net operating loss carryforward, a similar tax loss, or a tax credit carryforward is not available at the reporting date under the tax law of the applicable jurisdiction to settle any additional income taxes that would result from the disallowance of a tax position or the tax law of the applicable jurisdiction does not require the entity to use, and the entity does not intend to use, the deferred tax asset for such purpose, the unrecognized tax benefit should be presented in the financial statements as a liability and should not be combined with deferred tax assets. ASU 2013-11 is effective for the Company's first quarter of fiscal 2015 with earlier adoption permitted. ASU 2013-11 should be applied prospectively with retroactive application permitted. There was no income statement impact to the Company as a result of adopting this accounting standard.
In May 2014, the FASB issued ASU 2014-09-Revenue from Contracts with Customers, which will supersede nearly all existing revenue recognition guidance under US GAAP. The standard's core principle is that a company will recognize revenue when it transfers promised goods or services to customers in an amount that reflects the consideration to which the company expects to be entitled in exchange for those goods or services. The Company is evaluating its existing revenue recognition policies to determine whether any contracts in the scope of the guidance will be materially affected by the new requirements. The effects may include identifying performance obligations in existing arrangements, estimating the amount of variable consideration to include in the transaction price and allocating the transaction price to each separate performance obligation. The new standard is effective beginning with the first quarter of the Company's 2018 fiscal year. Early adoption is not permitted. The standard allows for either "full retrospective" adoption, meaning the standard is applied to all of the periods presented, or "modified retrospective" adoption, meaning the standard is applied only to the most current period presented in the financial statements. On April 1, 2015, the FASB proposed deferring the effective date by one year to December 15, 2017 for annual reporting periods beginning after that date. The FASB also proposed permitting early adoption of the standard, but not before the original effective date of December 15, 2016. The Company is currently evaluating the transition method that will be elected.
In April 2015, the FASB issued ASU 2015-03-Simplifying the Presentation of Debt Issuance Costs. This standard amends existing guidance to require the presentation of debt issuance costs in the balance sheet as a deduction from the carrying amount of the related debt liability instead of a deferred charge. It is effective for annual reporting periods beginning after December 15, 2015, but early adoption is permitted. The Company is currently evaluating the impact the adoption of this standard will have on its consolidated financial statements.
2. BUSINESS ACQUISITIONS
Acquisition of ISSC
On July 17, 2014, the Company acquired an 83.5% interest in Taiwan-based ISSC, a leading provider of low power Bluetooth and advanced wireless solutions for the Internet of Things (IoT) market. The total purchase price paid for the 83.5% interest was approximately $267.6 million and was financed with existing cash and investment balances. The Company's primary reason for this acquisition was to expand the Company's range of solutions, products and capabilities in the wireless and IoT areas by extending its served available market. The Company acquired the 83.5% ownership interest through a tender offer process. Since the completion of the tender offer, the Company has acquired additional shares of ISSC. As of March 31, 2015, the Company's ownership percentage in ISSC was approximately 94.1%.
F-16
The acquisition was accounted for under the acquisition method of accounting, with the Company identified as the acquirer. Since the Company's acquired ownership interest in ISSC represents a controlling interest, the operating results of ISSC have been included in the Company's condensed consolidated financial statements as of the closing date of the tender offer with the noncontrolling interest deducted to arrive at net income. The fair value of the noncontrolling interest at the acquisition date was calculated based on the expected purchase price of the remaining shares available. As the Company purchases additional shares of ISSC, the noncontrolling interest will be reduced and any gain or loss on the shares purchased will be reflected in the stockholders' equity of the Company. Under the acquisition method of accounting, the aggregate amount of consideration paid by the Company was allocated to ISSC's net tangible assets and intangible assets based on their estimated fair values as of July 17, 2014. The excess of the purchase price over the value of the net tangible assets and intangible assets was recorded to goodwill. The factors contributing to the recognition of goodwill were based upon the Company's conclusion that there are strategic and synergistic benefits that are expected to be realized from the acquisition. The goodwill has been allocated to the Company's semiconductor products reporting segment. None of the goodwill related to the ISSC acquisition is deductible for tax purposes. The Company retained an independent third-party appraiser to assist management with its valuation; however, the purchase price allocation has not been finalized. This could result in adjustments to the carrying value of the assets acquired and liabilities assumed, the useful lives of intangible assets and the residual amount allocated to goodwill. The preliminary allocation of the purchase price is based on the best estimates of management and is subject to revision based on the final valuations and estimates of useful lives.
The amount of cash paid by the Company, net of cash and short-term investments acquired from ISSC of approximately $42.2 million, was $225.4 million. The table below represents the preliminary allocation of the purchase price, including adjustments to the purchase price allocation from the originally reported figures at September 30, 2014, to the net assets acquired based on their estimated fair values as of July 17, 2014, as well as the associated estimated useful lives of the acquired intangible assets at that date (amounts in thousands):
Assets acquired | Previously Reported September 30, 2014 | Adjustments | March 31, 2015 | ||||||||
Cash and cash equivalents | $ | 15,120 | $ | — | $ | 15,120 | |||||
Short-term investments | 27,063 | — | 27,063 | ||||||||
Accounts receivable, net | 8,792 | — | 8,792 | ||||||||
Inventories | 19,160 | (2,618 | ) | 16,542 | |||||||
Prepaid expenses and other current assets | 2,501 | — | 2,501 | ||||||||
Property, plant and equipment, net | 2,637 | — | 2,637 | ||||||||
Goodwill | 152,243 | 2,156 | 154,399 | ||||||||
Purchased intangible assets (1) | 147,800 | — | 147,800 | ||||||||
Other assets | 1,370 | — | 1,370 | ||||||||
Total assets acquired | 376,686 | (462 | ) | 376,224 | |||||||
Liabilities assumed | |||||||||||
Accounts payable | (9,860 | ) | — | (9,860 | ) | ||||||
Other current liabilities | (16,997 | ) | 462 | (16,535 | ) | ||||||
Long-term income tax payable | (4,402 | ) | — | (4,402 | ) | ||||||
Deferred tax liability | (25,126 | ) | — | (25,126 | ) | ||||||
Other long-term liabilities | (245 | ) | — | (245 | ) | ||||||
Total liabilities assumed | (56,630 | ) | 462 | (56,168 | ) | ||||||
Net assets acquired including noncontrolling interest | 320,056 | — | 320,056 | ||||||||
Less: noncontrolling interest | (52,467 | ) | — | (52,467 | ) | ||||||
Net assets acquired | $ | 267,589 | $ | — | $ | 267,589 | |||||
(1) Purchased Intangible Assets | Useful Life | April 1, 2014 | |||
(in years) | (in thousands) | ||||
Core/developed technology | 10 | $ | 68,900 | ||
In-process technology | 10 | 27,200 | |||
Customer-related | 3 | 51,100 | |||
Backlog | 1 | 600 | |||
$ | 147,800 | ||||
F-17
Purchased intangible assets include core and developed technology, in-process technology, customer-related intangibles and acquisition-date backlog. The estimated fair values of the core and developed technology and in-process technology were determined based on the present value of the expected cash flows to be generated by the respective existing technology or future technology. The core and developed technology intangible assets are being amortized commensurate with the expected cash flows used in the initial determination of fair value. In-process technology is capitalized until such time as the related projects are completed or abandoned at which time the capitalized amounts will begin to be amortized or written off.
Customer-related intangible assets consist of ISSC's contractual relationships and customer loyalty related to its distributor and end-customer relationships, and the fair values of the customer-related intangibles were determined based on ISSC's projected revenues. An analysis of expected attrition and revenue growth for existing customers was prepared from ISSC's historical customer information. Customer relationships are being amortized in a manner consistent with the estimated cash flows associated with the existing customers and anticipated retention rates. Backlog relates to the value of orders not yet shipped by ISSC at the acquisition date, and the preliminary fair values were based on the estimated profit associated with those orders. Backlog related assets are being recognized commensurate with recognition of the revenue for the orders on which the backlog intangible assets were determined. Amortization expense associated with acquired intangible assets is not deductible for tax purposes. Thus, approximately $25.1 million was established as a net deferred tax liability for the future amortization of the intangible assets.
The amount of ISSC net sales and net loss attributable to the Company included in the Company's consolidated statements of income for the year ended March 31, 2015 was approximately $37.8 million and $25.6 million, respectively.
The following unaudited pro-forma consolidated results of operations for the years ended ended March 31, 2015 and 2014 assume the ISSC acquisition occurred as of April 1, 2013. Pro-forma adjustments mainly consist of acquired inventory fair value costs and amortization of purchased intangible assets. The pro-forma results of operations are presented for informational purposes only and are not indicative of the results of operations that would have been achieved if the acquisition had taken place on April 1, 2013 or of results that may occur in the future (amounts in thousands):
Year Ended March 31, | |||||||
2015 | 2014 | ||||||
Net sales | $ | 2,169,390 | $ | 1,998,647 | |||
Net income attributable to Microchip Technology | 367,428 | 364,169 | |||||
Net income attributable to Microchip Technology common stockholders per share - basic | $ | 1.83 | $ | 1.84 | |||
Net income attributable to Microchip Technology common stockholders per share - diluted | $ | 1.64 | $ | 1.67 | |||
Acquisition of Supertex
On April 1, 2014, the Company acquired Supertex Inc., a publicly traded company based in Sunnyvale, California, for $33.00 per share and the exchange of certain share-based payment awards, for a total of $391.8 million. The Company financed the transaction using borrowings under its existing credit agreement. As a result of the acquisition, Supertex became a wholly owned subsidiary of the Company. Supertex is a leader in high voltage analog and mixed signal technologies, with a strong position in the medical, lighting and industrial control markets. The Company's primary reason for this acquisition was to expand the Company's range of solutions, products and capabilities in these areas by extending its served available market.
The acquisition was accounted for under the acquisition method of accounting, with the Company identified as the acquirer, and the operating results of Supertex have been included in the Company's condensed consolidated financial statements as of the closing date of the acquisition. Under the acquisition method of accounting, the aggregate amount of consideration paid by the Company was allocated to Supertex's net tangible assets and intangible assets based on their estimated fair values as of April 1, 2014. The excess of the purchase price over the value of the net tangible assets and intangible assets was recorded to goodwill. The factors contributing to the recognition of goodwill were based upon the Company's conclusion that there are strategic and synergistic benefits that are expected to be realized from the acquisition. The goodwill has been allocated to the Company's semiconductor products reporting segment. None of the goodwill related to the Supertex acquisition is deductible for tax purposes. The Company retained an independent third-party appraiser to assist management with its valuation. The purchase price allocation was finalized as of March 31, 2015. The total purchase price
F-18
allocated of $391.8 million includes approximately $1.6 million of non cash consideration for the exchange of certain share-based payment awards of Supertex for stock awards of the Company. The amount of cash paid by the Company, net of cash and short-term investments acquired from Supertex of approximately $155.8 million, was $234.4 million. The table below represents the allocation of the purchase price, including adjustments to the purchase price allocation from the originally reported figures at June 30, 2014, to the net assets acquired based on their estimated fair values as of April 1, 2014 (amounts in thousands):
Assets acquired | Previously Reported June 30, 2014 | Adjustments | March 31, 2015 | ||||||||
Cash and cash equivalents | $ | 14,790 | $ | — | $ | 14,790 | |||||
Short-term investments | 140,984 | — | 140,984 | ||||||||
Accounts receivable, net | 7,047 | — | 7,047 | ||||||||
Inventories | 27,630 | — | 27,630 | ||||||||
Prepaid expenses | 1,493 | — | 1,493 | ||||||||
Deferred tax assets | 3,997 | (1,541 | ) | 2,456 | |||||||
Other current assets | 16,113 | (3,488 | ) | 12,625 | |||||||
Property, plant and equipment, net | 15,679 | — | 15,679 | ||||||||
Goodwill | 133,713 | 9,447 | 143,160 | ||||||||
Purchased intangible assets (1) | 89,600 | 89,600 | |||||||||
Other assets | 325 | — | 325 | ||||||||
Total assets acquired | 451,371 | 4,418 | 455,789 | ||||||||
Liabilities assumed | |||||||||||
Accounts payable | (8,481 | ) | — | (8,481 | ) | ||||||
Accrued liabilities | (19,345 | ) | 121 | (19,224 | ) | ||||||
Long-term income tax payable | (3,796 | ) | — | (3,796 | ) | ||||||
Deferred tax liability | (27,972 | ) | (4,539 | ) | (32,511 | ) | |||||
Total liabilities assumed | (59,594 | ) | (4,418 | ) | (64,012 | ) | |||||
Net assets acquired | $ | 391,777 | $ | — | $ | 391,777 | |||||
(1) Purchased Intangible Assets | Useful Life | April 1, 2014 | |||
(in years) | (in thousands) | ||||
Core/developed technology | 10 | $ | 68,900 | ||
In-process technology | 10 | 1,900 | |||
Customer-related | 2 | 17,700 | |||
Backlog | 1 | 1,100 | |||
$ | 89,600 | ||||
Purchased intangible assets include core and developed technology, in-process technology, customer-related intangibles and acquisition-date backlog. The estimated fair values of the core and developed technology and in-process technology were determined based on the present value of the expected cash flows to be generated by the respective existing technology or future technology. The core and developed technology intangible assets are being amortized commensurate with the expected cash flows used in the initial determination of fair value. In-process technology is capitalized until such time the related projects are completed or abandoned at which time the capitalized amounts will begin to be amortized or written off.
Customer-related intangible assets consist of Supertex's contractual relationships and customer loyalty related to its distributor and end-customer relationships, and the fair values of the customer-related intangibles were determined based on Supertex's projected revenues. An analysis of expected attrition and revenue growth for existing customers was prepared from Supertex's historical customer information. Customer relationships are being amortized in a manner consistent with the estimated cash flows associated with the existing customers and anticipated retention rates. Backlog relates to the value of orders not yet shipped by Supertex at the acquisition date, and the preliminary fair values were based on the estimated profit associated with those orders. Backlog related assets are being recognized commensurate with recognition of the revenue for the orders on which the backlog intangible assets were determined. Amortization expense associated with acquired intangible
F-19
assets is not deductible for tax purposes. Thus, approximately $22.8 million was established as a net deferred tax liability for the future amortization of the intangible assets.
The amount of Supertex net sales included in the Company's consolidated statements of income for the year ended March 31, 2015 was approximately $72.7 million. The operations of Supertex were fully integrated into the Company's operations as of July 1, 2014 and as such, cost of sales and operating expenses were no longer segregated as of that date.
The following unaudited pro-forma consolidated results of operations for the years ended March 31, 2015 and 2014 assume the Supertex acquisition occurred as of April 1, 2013. Pro-forma adjustments mainly consist of acquired inventory fair value costs and amortization of purchased intangible assets. The pro-forma results of operations are presented for informational purposes only and are not indicative of the results of operations that would have been achieved if the acquisition had taken place on April 1, 2013 or of results that may occur in the future (amounts in thousands):
Year Ended March 31, | |||||||
2015 | 2014 | ||||||
Net sales | $ | 2,149,505 | $ | 1,996,819 | |||
Net income | 391,573 | 353,381 | |||||
Basic earnings per share | $ | 1.95 | $ | 1.78 | |||
Diluted earnings per share | $ | 1.75 | $ | 1.62 | |||
Acquisition of SMSC
On August 2, 2012, the Company acquired SMSC, a publicly traded company based in Hauppauge, New York. The acquisition was accounted for under the acquisition method of accounting. The Company retained an independent third-party appraiser to assist management with its valuation. The table below represents the allocation of the purchase price to the net assets acquired based on their estimated fair values as of August 2, 2012. The purchase price allocation was finalized as of August 2, 2013 (amounts in thousands):
Assets acquired | |||
Cash and cash equivalents | $ | 180,925 | |
Accounts receivable, net | 58,441 | ||
Inventories | 86,244 | ||
Prepaid expenses | 5,617 | ||
Deferred tax assets | 15,843 | ||
Other current assets | 17,578 | ||
Property, plant and equipment, net | 35,608 | ||
Long-term investments | 24,275 | ||
Goodwill | 165,592 | ||
Intangible assets, net | 10,214 | ||
Purchased intangible assets | 517,800 | ||
Other assets | 3,835 | ||
Total assets acquired | 1,121,972 | ||
Liabilities assumed | |||
Accounts payable | (28,035 | ) | |
Accrued liabilities | (62,247 | ) | |
Deferred income on shipments to distributors | (11,376 | ) | |
Long-term income tax payable | (72,781 | ) | |
Deferred tax liability | (16,682 | ) | |
Other liabilities | (11,250 | ) | |
Total liabilities assumed | (202,371 | ) | |
Purchase price allocated | $ | 919,601 | |
F-20
3. SPECIAL CHARGES
Acquisition Related Expenses
During fiscal 2015, the Company incurred special charges of $2.8 million related to severance, office closing and other costs associated with its acquisition activity. During fiscal 2014, the Company incurred special charges of $3.0 million related to severance, office closing and other costs associated with its acquisition activity. During fiscal 2013, the Company incurred special charges of $32.2 million comprised of a $4.4 million net increase in the fair value of contingent consideration related to one of its acquisitions, $16.3 million of primarily severance-related costs in addition to office closing and other costs associated with the acquisition of SMSC and legal settlement costs of approximately $11.5 million for certain legal matters related to an entity which the Company acquired in April 2010 in excess of previously accrued amounts.
4. | INVESTMENTS |
The Company's investments are intended to establish a high-quality portfolio that preserves principal, meets liquidity needs, avoids inappropriate concentrations, and delivers an appropriate yield in relationship to the Company's investment guidelines and market conditions. The following is a summary of available-for-sale securities at March 31, 2015 (amounts in thousands):
Available-for-sale Securities | |||||||||||||||
Adjusted Cost | Gross Unrealized Gains | Gross Unrealized Losses | Estimated Fair Value | ||||||||||||
Government agency bonds | $ | 741,780 | $ | 676 | $ | (200 | ) | $ | 742,256 | ||||||
Municipal bonds | 41,552 | 155 | (9 | ) | 41,698 | ||||||||||
Auction rate securities | 9,825 | — | — | 9,825 | |||||||||||
Time deposits (1) | 506 | — | — | 506 | |||||||||||
Corporate bonds and debt | 924,818 | 2,376 | (265 | ) | 926,929 | ||||||||||
Marketable equity securities | 1,362 | 11,804 | — | 13,166 | |||||||||||
$ | 1,719,843 | $ | 15,011 | $ | (474 | ) | $ | 1,734,380 | |||||||
(1) Time deposits in various financial institutions with maturities greater than three months that will mature within one year.
The following is a summary of available-for-sale securities at March 31, 2014 (amounts in thousands):
Available-for-sale Securities | |||||||||||||||
Adjusted Cost | Gross Unrealized Gains | Gross Unrealized Losses | Estimated Fair Value | ||||||||||||
Government agency bonds | $ | 684,451 | $ | 114 | $ | (3,171 | ) | $ | 681,394 | ||||||
Municipal bonds | 41,622 | 101 | (14 | ) | 41,709 | ||||||||||
Auction rate securities | 9,825 | — | — | 9,825 | |||||||||||
Corporate bonds and debt | 941,524 | 3,247 | (805 | ) | 943,966 | ||||||||||
$ | 1,677,422 | $ | 3,462 | $ | (3,990 | ) | $ | 1,676,894 | |||||||
At March 31, 2015, the Company's available-for-sale debt securities and marketable equity securities are presented on the consolidated balance sheets as short-term investments of $1,351.1 million and long-term investments of $383.3 million. At March 31, 2014, the Company’s available-for-sale debt securities are presented on the consolidated balance sheets as short-term investments of $878.2 million and long-term investments of $798.7 million.
The Company's marketable equity securities consist of an investment in Hua Hong Semiconductor Limited (Hua Hong), which effected its initial public offering on the Hong Kong stock exchange on October 15, 2014. This investment was previously classified as a non-marketable cost-method investment, and had a carrying value of $3.6 million.
F-21
The Company sold available-for-sale investments for proceeds of $273.9 million, $135.3 million and $40.5 million during the years ended March 31, 2015, 2014 and 2013, respectively. During the year ended March 31, 2015, the Company had net realized gains of $18.5 million from sales of available-for-sale marketable equity securities. The Company had no material realized gains from the sale of available-for-sale debt securities during the year ended March 31, 2015. The Company had no material realized gains or losses from the sale of available-for-sale marketable equity securities or debt securities during the years ended March 31, 2014 or 2013. The Company determines the cost of an investment sold on an average cost basis at the individual security level for sales from multiple lots. For all other sales, the Company uses an adjusted cost basis at the individual security level.
The following tables show all investments in an unrealized loss position for which an other-than-temporary impairment has not been recognized and the related gross unrealized losses and fair value, aggregated by investment category and length of time that the individual securities have been in a continuous unrealized loss position (amounts in thousands):
March 31, 2015 | |||||||||||||||||||||||
Less than 12 Months | 12 Months or Greater | Total | |||||||||||||||||||||
Fair Value | Unrealized Loss | Fair Value | Unrealized Loss | Fair Value | Unrealized Loss | ||||||||||||||||||
Government agency bonds | $ | 162,948 | $ | (142 | ) | $ | 29,942 | $ | (58 | ) | $ | 192,890 | $ | (200 | ) | ||||||||
Municipal bonds | 13,318 | (9 | ) | — | — | 13,318 | (9 | ) | |||||||||||||||
Corporate bonds and debt | 163,095 | (219 | ) | 19,021 | (46 | ) | 182,116 | (265 | ) | ||||||||||||||
$ | 339,361 | $ | (370 | ) | $ | 48,963 | $ | (104 | ) | $ | 388,324 | $ | (474 | ) | |||||||||
March 31, 2014 | |||||||||||||||||||||||
Less than 12 Months | 12 Months or Greater | Total | |||||||||||||||||||||
Fair Value | Unrealized Loss | Fair Value | Unrealized Loss | Fair Value | Unrealized Loss | ||||||||||||||||||
Government agency bonds | $ | 522,159 | $ | (3,171 | ) | $ | — | $ | — | $ | 522,159 | $ | (3,171 | ) | |||||||||
Municipal bonds | 2,625 | (13 | ) | 1,196 | (1 | ) | 3,821 | (14 | ) | ||||||||||||||
Corporate bonds and debt | 256,717 | (805 | ) | — | — | 256,717 | (805 | ) | |||||||||||||||
$ | 781,501 | $ | (3,989 | ) | $ | 1,196 | $ | (1 | ) | $ | 782,697 | $ | (3,990 | ) | |||||||||
Management does not believe any of the unrealized losses represent an other-than-temporary impairment based on its evaluation of available evidence as of March 31, 2015 and the Company's intent is to hold these investments until these assets are no longer impaired, except for certain auction rate securities (ARS). For those debt securities not scheduled to mature until after March 31, 2016, such recovery is not anticipated to occur in the next year and these investments have been classified as long-term investments.
The amortized cost and estimated fair value of the available-for-sale securities at March 31, 2015, by contractual maturity, excluding marketable equity securities of $13.2 million and corporate debt of $6.2 million, which have no contractual maturity, are shown below (amounts in thousands). Expected maturities can differ from contractual maturities because the issuers of the securities may have the right to prepay obligations without prepayment penalties, and the Company views its available-for-sale securities as available for current operations.
Adjusted Cost | Gross Unrealized Gains | Gross Unrealized Losses | Estimated Fair Value | ||||||||||||
Available-for-sale | |||||||||||||||
Due in one year or less | $ | 224,531 | $ | 512 | $ | (34 | ) | $ | 225,009 | ||||||
Due after one year and through five years | 1,395,685 | 2,648 | (330 | ) | 1,398,003 | ||||||||||
Due after five years and through ten years | 82,250 | 47 | (110 | ) | 82,187 | ||||||||||
Due after ten years | 9,825 | — | — | 9,825 | |||||||||||
$ | 1,712,291 | $ | 3,207 | $ | (474 | ) | $ | 1,715,024 | |||||||
F-22
The amortized cost and estimated fair value of the available-for-sale securities at March 31, 2014, by maturity, excluding corporate debt of $6.2 million, which has no contractual maturity, are shown below (amounts in thousands).
Adjusted Cost | Gross Unrealized Gains | Gross Unrealized Losses | Estimated Fair Value | ||||||||||||
Available-for-sale | |||||||||||||||
Due in one year or less | $ | 210,129 | $ | 1,234 | $ | — | $ | 211,363 | |||||||
Due after one year and through five years | 1,308,844 | 2,228 | (1,958 | ) | 1,309,114 | ||||||||||
Due after five years and through ten years | 142,434 | — | (2,032 | ) | 140,402 | ||||||||||
Due after ten years | 9,825 | — | — | 9,825 | |||||||||||
$ | 1,671,232 | $ | 3,462 | $ | (3,990 | ) | $ | 1,670,704 | |||||||
5. FAIR VALUE MEASUREMENTS
Accounting rules for fair value provide that fair value is an exit price, representing the amount that would be received to sell an asset or paid to transfer a liability in an orderly transaction between market participants. As such, fair value is a market-based measurement that should be determined based on assumptions that market participants would use in pricing an asset or liability. As a basis for considering such assumptions, the Company utilizes a three-tier fair value hierarchy, which prioritizes the inputs used in measuring fair value as follows:
Level 1- | Observable inputs such as quoted prices in active markets; |
Level 2- | Inputs, other than the quoted prices in active markets, that are observable either directly or indirectly; and |
Level 3- | Unobservable inputs in which there is little or no market data, which require the reporting entity to develop its own assumptions. |
Marketable Debt Instruments
Marketable debt instruments include instruments such as corporate bonds and debt, government agency bonds, bank deposits, municipal bonds, and money market mutual funds. When the Company uses observable market prices for identical securities that are traded in less active markets, the Company classifies its marketable debt instruments as Level 2. When observable market prices for identical securities are not available, the Company prices its marketable debt instruments using non-binding market consensus prices that are corroborated with observable market data; quoted market prices for similar instruments; or pricing models, such as a discounted cash flow model, with all significant inputs derived from or corroborated with observable market data. Non-binding market consensus prices are based on the proprietary valuation models of pricing providers or brokers. These valuation models incorporate a number of inputs, including non-binding and binding broker quotes; observable market prices for identical or similar securities; and the internal assumptions of pricing providers or brokers that use observable market inputs and, to a lesser degree, unobservable market inputs. The Company corroborates non-binding market consensus prices with observable market data using statistical models when observable market data exists. The discounted cash flow model uses observable market inputs, such as LIBOR-based yield curves, currency spot and forward rates, and credit ratings.
Derivative Assets
The Company's derivative assets include interest rate swaps that are classified as Level 2 as the Company uses inputs other than quoted prices that are observable for the asset. The Level 2 derivative assets are primarily valued using standard calculations and models that use readily observable market data as their basis.
F-23
Assets and Liabilities Measured at Fair Value on a Recurring Basis
Assets measured at fair value on a recurring basis at March 31, 2015 are as follows (amounts in thousands):
Quoted Prices in Active Markets for Identical Instruments (Level 1) | Significant Other Observable Inputs (Level 2) | Significant Unobservable Inputs (Level 3) | Total Balance | ||||||||||||
Assets | |||||||||||||||
Money market mutual funds | $ | 279,833 | $ | — | $ | — | $ | 279,833 | |||||||
Marketable equity securities | 13,166 | — | — | 13,166 | |||||||||||
Corporate bonds and debt | — | 920,739 | 6,190 | 926,929 | |||||||||||
Time deposits (1) | — | 506 | — | 506 | |||||||||||
Government agency bonds | — | 742,256 | — | 742,256 | |||||||||||
Deposit accounts | — | 327,982 | — | 327,982 | |||||||||||
Municipal bonds | — | 41,698 | — | 41,698 | |||||||||||
Auction rate securities | — | — | 9,825 | 9,825 | |||||||||||
Derivative assets | — | 8,928 | — | 8,928 | |||||||||||
Total assets measured at fair value | $ | 292,999 | $ | 2,042,109 | $ | 16,015 | $ | 2,351,123 | |||||||
(1) Time deposits in various financial institutions with maturities greater than three months that will mature within one year.
Assets measured at fair value on a recurring basis at March 31, 2014 are as follows (amounts in thousands):
Quoted Prices in Active Markets for Identical Instruments (Level 1) | Significant Other Observable Inputs (Level 2) | Significant Unobservable Inputs (Level 3) | Total Balance | ||||||||||||
Assets | |||||||||||||||
Money market mutual funds | $ | 192,159 | $ | — | $ | — | $ | 192,159 | |||||||
Corporate bonds and debt | — | 937,776 | 6,190 | 943,966 | |||||||||||
Government agency bonds | — | 681,394 | — | 681,394 | |||||||||||
Deposit accounts | — | 274,444 | — | 274,444 | |||||||||||
Municipal bonds | — | 41,709 | — | 41,709 | |||||||||||
Auction rate securities | — | — | 9,825 | 9,825 | |||||||||||
Total assets measured at fair value | $ | 192,159 | $ | 1,935,323 | $ | 16,015 | $ | 2,143,497 | |||||||
There were no transfers between Level 1 and Level 2 during fiscal 2015 or fiscal 2014.
At March 31, 2015 and March 31, 2014, the Company's ARS for which auctions were unsuccessful were related to the insurance industry and were valued at $9.8 million with a par value of $22.4 million. The Company estimated the fair value of its ARS, which are classified as Level 3 securities, based on the following: (i) the underlying structure of each security; (ii) the present value of future principal and interest payments discounted at rates considered to reflect current market conditions; (iii) consideration of the probabilities of default, auction failure, or repurchase at par for each period; and (iv) estimates of the recovery rates in the event of default for each security. The significant unobservable inputs used in the fair value measurement of the ARS as of March 31, 2015 were estimated risk free discount rates, liquidity risk premium, and the liquidity horizon. The risk free discount rate applied to these securities was 2% to 2.5% adjusted for the liquidity risk premium which ranged from 9.1% to 29.5%. The anticipated liquidity horizon ranged from 7 to 10 years. A significant increase in the liquidity premium or discount rate, in isolation, would lead to a significantly lower fair value measurement. A significant increase in the liquidity horizon, in isolation, would lead to a significantly lower fair value measurement. Each quarter the Company evaluates material changes in the fair value measurements of its ARS.
F-24
The following table presents a reconciliation for all assets and liabilities measured at fair value on a recurring basis, excluding accrued interest components, using significant unobservable inputs (Level 3) for the year ended March 31, 2014. There were no changes in the fair value of these assets measured on a recurring basis during fiscal 2015 (amounts in thousands):
Year ended March 31, 2014 | Auction Rate Securities | Corporate Debt | Contingent Consideration | Total Losses | |||||||||||
Balance at March 31, 2013 | $ | 33,791 | $ | 6,190 | $ | (19,100 | ) | $ | — | ||||||
Total gains (losses) (realized and unrealized): | |||||||||||||||
Included in earnings | 1,101 | — | (1,370 | ) | (269 | ) | |||||||||
Included in other comprehensive income | (332 | ) | — | — | (332 | ) | |||||||||
Purchases, sales, issuances, and settlements, net | (24,735 | ) | — | 20,470 | — | ||||||||||
Balance at March 31, 2014 | $ | 9,825 | $ | 6,190 | $ | — | $ | (601 | ) | ||||||
Gains and losses recognized in earnings using Level 3 inputs for ARS are credited or charged to Other Income (Expense) on the Consolidated Statements of Income. Gains and losses recognized in earnings using Level 3 inputs related to the revaluation of contingent consideration are credited or charged to Special Charges on the Consolidated Statements of Income.
Assets measured at fair value on a recurring basis are presented/classified on the consolidated balance sheets at March 31, 2015 as follows (amounts in thousands):
Quoted Prices in Active Markets for Identical Instruments (Level 1) | Significant Other Observable Inputs (Level 2) | Significant Unobservable Inputs (Level 3) | Total Balance | ||||||||||||
Assets | |||||||||||||||
Cash and cash equivalents | $ | 279,833 | $ | 327,982 | $ | — | $ | 607,815 | |||||||
Short-term investments | 13,166 | 1,337,888 | — | 1,351,054 | |||||||||||
Long-term investments | — | 367,311 | 16,015 | 383,326 | |||||||||||
Other assets | — | 8,928 | — | 8,928 | |||||||||||
Total assets measured at fair value | $ | 292,999 | $ | 2,042,109 | $ | 16,015 | $ | 2,351,123 | |||||||
Assets measured at fair value on a recurring basis are presented/classified in the consolidated balance sheets at March 31, 2014 as follows (amounts in thousands):
Quoted Prices in Active Markets for Identical Instruments (Level 1) | Significant Other Observable Inputs (Level 2) | Significant Unobservable Inputs (Level 3) | Total Balance | ||||||||||||
Assets | |||||||||||||||
Cash and cash equivalents | $ | 192,159 | $ | 274,444 | $ | — | $ | 466,603 | |||||||
Short-term investments | — | 878,182 | — | 878,182 | |||||||||||
Long-term investments | — | 782,697 | 16,015 | 798,712 | |||||||||||
Total assets measured at fair value | $ | 192,159 | $ | 1,935,323 | $ | 16,015 | $ | 2,143,497 | |||||||
Assets Measured and Recorded at Fair Value on a Non-Recurring Basis
The Company's non-marketable equity, cost method investments, and non-financial assets, such as intangible assets, assets held for sale and property, plant and equipment, are recorded at fair value on a non-recurring basis. These assets are subject to fair value adjustments in certain circumstances, for example, when there is evidence of impairment.
F-25
The Company's non-marketable and cost method investments are monitored on a quarterly basis for impairment charges. The fair values of these investments have been determined as Level 3 fair value measurements because the valuations use unobservable inputs that require management's judgment due to the absence of quoted market prices. There were no impairment charges recognized on these investments during the year ended March 31, 2015. During the years ended March 31, 2014 and March 31, 2013, the Company recognized impairment charges of $0.7 million and $0.5 million, respectively, on these investments. These investments are included in other assets on the consolidated balance sheet.
The fair value measurements related to the Company's non-financial assets, such as intangible assets, assets held for sale and property, plant and equipment are based on available market prices at the measurement date based on transactions of similar assets and third-party independent appraisals, less cost to sell where appropriate. The Company classifies these measurements as Level 2.
6. FAIR VALUE OF FINANCIAL INSTRUMENTS
The carrying amount of cash equivalents approximates fair value because their maturity is less than three months. Management believes the carrying amount of the equity and cost-method investments materially approximated fair value at March 31, 2015 based upon unobservable inputs. The fair values of these investments have been determined as Level 3 fair value measurements. The fair values of the Company's line of credit and short-term and long-term borrowings are estimated using discounted cash flow analyses, based on the Company's current incremental borrowing rates for similar types of borrowing arrangements and approximate carrying value. Based on the borrowing rates currently available to the Company for bank loans with similar terms and average maturities, the fair value of the Company's line of credit and long-term borrowings at March 31, 2015 approximated book value and are considered Level 2 in the fair value hierarchy described in Note 5. The carrying amount of accounts receivable, accounts payable and accrued liabilities approximates fair value due to the short-term maturity of the amounts and are considered Level 2 in the fair value hierarchy. The fair value of the Company's senior subordinated convertible debentures was $1.788 billion at March 31, 2015. The fair value of the Company's junior subordinated convertible debentures was $1.124 billion at March 31, 2015. As further discussed in Note 15, in February 2015, the Company acquired certain of its junior subordinated convertible debentures with a $575.0 million aggregate principal amount for an aggregate purchase price of $1,134.6 million. The fair values of the Company's senior and junior subordinated convertible debentures are based on observable market prices for these debentures, which are traded in less active markets and are therefore classified as a Level 2 fair value measurement, and exclude the impacts of derivative activity.
7. ACCOUNTS RECEIVABLE
Accounts receivable consists of the following (amounts in thousands):
March 31, 2015 | March 31, 2014 | ||||||
Trade accounts receivable | $ | 269,844 | $ | 243,383 | |||
Other | 6,714 | 1,940 | |||||
276,558 | 245,323 | ||||||
Less allowance for doubtful accounts | 2,621 | 2,918 | |||||
$ | 273,937 | $ | 242,405 | ||||
8. INVENTORIES
The components of inventories consist of the following (amounts in thousands):
March 31, 2015 | March 31, 2014 | ||||||
Raw materials | $ | 13,263 | $ | 9,734 | |||
Work in process | 197,565 | 179,692 | |||||
Finished goods | 68,628 | 73,299 | |||||
$ | 279,456 | $ | 262,725 | ||||
Inventories are valued at the lower of cost or market using the first-in, first-out method. Inventory impairment charges establish a new cost basis for inventory and charges are not subsequently reversed to income even if circumstances later suggest that increased carrying amounts are recoverable.
F-26
9. | ASSETS HELD FOR SALE |
During the year ended March 31, 2015, the Company began to actively market real property it acquired in the Supertex acquisition. The Company expects to sell the property within one year. As of March 31, 2015, the Company classified the property as held for sale on its consolidated balance sheet at its fair value of approximately $14.3 million, net of the estimated cost to sell of approximately $0.3 million.
10. | PROPERTY, PLANT AND EQUIPMENT |
Property, plant and equipment consists of the following (amounts in thousands):
March 31, 2015 | March 31, 2014 | ||||||
Land | $ | 55,624 | $ | 55,624 | |||
Building and building improvements | 434,403 | 411,149 | |||||
Machinery and equipment | 1,576,074 | 1,465,255 | |||||
Projects in process | 76,315 | 68,991 | |||||
2,142,416 | 2,001,019 | ||||||
Less accumulated depreciation and amortization | 1,560,844 | 1,469,052 | |||||
$ | 581,572 | $ | 531,967 | ||||
Depreciation expense attributed to property, plant and equipment was $97.3 million, $89.7 million and $88.3 million for the fiscal years ending March 31, 2015, 2014 and 2013, respectively.
11. NONCONTROLLING INTERESTS
The following table presents the changes in the components of noncontrolling interests for the year ended March 31, 2015 (amounts in thousands):
Noncontrolling Interests | |||
Balance at April 1, 2014 | $ | — | |
Additions due to acquisition of controlling interest in ISSC | 52,467 | ||
Net loss attributable to noncontrolling interests | (3,684 | ) | |
Other comprehensive loss attributable to noncontrolling interests | (866 | ) | |
Purchase of additional interests | (31,849 | ) | |
Other | 304 | ||
Balance at March 31, 2015 | $ | 16,372 | |
The following table presents the effect of changes in the Company's ownership interest in ISSC on the Company's stockholders' equity for the year ended March 31, 2015 (amounts in thousands):
Year ended March 31, | |||
2015 | |||
Net income attributable to Microchip Technology stockholders | $ | 369,009 | |
Increase in paid-in capital for purchase of additional interests | 345 | ||
Increase in paid-in capital for converted stock options | 1,094 | ||
Transfers from noncontrolling interests | 1,439 | ||
Change from net income attributable to Microchip Technology stockholders and transfers from noncontrolling interests | $ | 370,448 | |
The Company expects to acquire the remaining amount of noncontrolling interest in ISSC during the June 2015 quarter.
F-27
12. INTANGIBLE ASSETS AND GOODWILL
Intangible assets consist of the following (amounts in thousands):
March 31, 2015 | ||||||||||||
Gross Amount | Accumulated Amortization | Net Amount | ||||||||||
Developed technology | $ | 569,942 | $ | (209,676 | ) | $ | 360,266 | |||||
Customer-related | 263,969 | (193,483 | ) | 70,486 | ||||||||
Trademarks and trade names | 15,730 | (9,529 | ) | 6,201 | ||||||||
Backlog | 26,304 | (26,304 | ) | — | ||||||||
In-process technology | 67,142 | — | 67,142 | |||||||||
Distribution rights | 5,580 | (5,258 | ) | 322 | ||||||||
Covenants not to compete | 400 | (400 | ) | — | ||||||||
$ | 949,067 | $ | (444,650 | ) | $ | 504,417 | ||||||
March 31, 2014 | ||||||||||||
Gross Amount | Accumulated Amortization | Net Amount | ||||||||||
Developed technology | $ | 402,669 | $ | (117,222 | ) | $ | 285,447 | |||||
Customer-related | 195,800 | (109,170 | ) | 86,630 | ||||||||
Trademarks and trade names | 15,730 | (7,118 | ) | 8,612 | ||||||||
Backlog | 24,610 | (24,610 | ) | — | ||||||||
In-process technology | 64,396 | — | 64,396 | |||||||||
Distribution rights | 5,585 | (5,171 | ) | 414 | ||||||||
Covenants not to compete | 400 | (400 | ) | — | ||||||||
$ | 709,190 | $ | (263,691 | ) | $ | 445,499 | ||||||
The Company amortizes intangible assets over their expected useful lives, which range between 1 and 15 years. In fiscal 2015, the Company acquired $144.7 million of developed technology which has a weighted average amortization period of 9 years, $68.8 million of customer-related intangible assets which has a weighted average amortization period of 2.5 years, $1.7 million of intangible assets related to backlog with an amortization period of 1 year and $29.1 million of in-process technology which will begin amortization once the technology reaches technological feasibility. In fiscal 2015, $26.0 million of in-process technology reached technological feasibility and was reclassified as developed technology and began being amortized over its estimated useful life. The following is an expected amortization schedule for the intangible assets for fiscal 2016 through fiscal 2020, absent any future acquisitions or impairment charges (amounts in thousands):
Year ending March 31, | Projected Amortization Expense |
2016 | $144,229 |
2017 | 92,642 |
2018 | 69,428 |
2019 | 56,577 |
2020 | 40,718 |
Amortization expense attributed to intangible assets was $181.0 million, $99.4 million and $115.8 million for fiscal years 2015, 2014 and 2013, respectively. In fiscal 2015, $3.8 million was charged to cost of sales and $177.2 million was charged to operating expenses. In fiscal 2014, $4.7 million was charged to cost of sales and $94.7 million was charged to operating expenses. In fiscal 2013, $3.9 million was charged to cost of sales and $111.9 million was charged to operating expenses. The Company recognized impairment charges of $1.9 million and $0.4 million in fiscal years 2015 and 2014, respectively. The Company found no indication of impairment of its intangible assets in fiscal 2013.
F-28
Goodwill activity for fiscal years 2015 and 2014 was as follows (amounts in thousands):
Semiconductor Products Reporting Unit | Technology Licensing Reporting Unit | ||||||
Balance at March 31, 2013 | $ | 252,148 | $ | 19,200 | |||
Adjustments due to acquisition of SMSC | (3,473 | ) | — | ||||
Additions due to other acquisitions | 8,111 | — | |||||
Additions due to contingent consideration payments | 111 | — | |||||
Balance at March 31, 2014 | 256,897 | 19,200 | |||||
Additions due to the acquisition of Supertex | 143,160 | — | |||||
Additions due to acquisition of controlling interest in ISSC | 154,399 | — | |||||
Adjustments due to other acquisitions | 624 | — | |||||
Foreign currency translation adjustments | (3,009 | ) | — | ||||
Balance at March 31, 2015 | $ | 552,071 | $ | 19,200 | |||
At March 31, 2015, the Company applied a qualitative goodwill impairment screen to its two reporting units, concluding it was not more likely than not that goodwill was impaired. Through March 31, 2015, the Company has never recorded an impairment charge against its goodwill balance.
13. | INCOME TAXES |
The income tax provision consists of the following (amounts in thousands):
Year Ended March 31, | |||||||||||
2015 | 2014 | 2013 | |||||||||
Pretax Income: | |||||||||||
U.S. | (944 | ) | 28,245 | (82,163 | ) | ||||||
Foreign | 346,851 | 404,109 | 234,340 | ||||||||
$ | 345,907 | $ | 432,354 | $ | 152,177 | ||||||
Current expense: | |||||||||||
U.S. Federal | $ | (3,185 | ) | $ | 992 | $ | 33,856 | ||||
State | (24 | ) | 64 | 2,350 | |||||||
Foreign | 16,602 | 30,697 | 16,950 | ||||||||
Total current | $ | 13,393 | 31,753 | 53,156 | |||||||
Deferred expense (benefit): | |||||||||||
U.S. Federal | $ | (22,641 | ) | 14,445 | (16,004 | ) | |||||
State | (1,562 | ) | 929 | (1,111 | ) | ||||||
Foreign | (8,608 | ) | (10,054 | ) | (11,253 | ) | |||||
Total deferred | (32,811 | ) | 5,320 | (28,368 | ) | ||||||
$ | (19,418 | ) | $ | 37,073 | $ | 24,788 | |||||
The tax benefit associated with the Company's equity incentive plans reduced taxes currently payable by $1.2 million, $1.4 million and $0.3 million for the years ended March 31, 2015, 2014 and 2013, respectively. These amounts were credited to additional paid-in capital in each of these fiscal years.
F-29
The provision for income taxes differs from the amount computed by applying the statutory federal tax rate to income before income taxes. The sources and tax effects of the differences in the total income tax provision are as follows (amounts in thousands):
Year Ended March 31, | |||||||||||
2015 | 2014 | 2013 | |||||||||
Computed expected income tax provision | $ | 121,067 | $ | 151,324 | $ | 53,262 | |||||
State income taxes, net of federal benefits | (20 | ) | 686 | (2,054 | ) | ||||||
Research and development tax credits - current year | (9,703 | ) | (4,875 | ) | (8,263 | ) | |||||
Research and development tax credits - prior years | (1,789 | ) | 1,600 | (3,347 | ) | ||||||
Foreign income taxed at lower than the federal rate | (106,939 | ) | (116,003 | ) | (61,377 | ) | |||||
Increases related to current and prior year tax positions | 26,189 | 16,809 | 44,661 | ||||||||
Decreases related to prior year tax positions (1) | (40,609 | ) | (14,581 | ) | (7,154 | ) | |||||
Withholding taxes | 5,218 | 6,212 | 7,267 | ||||||||
Change in valuation allowance | (14,286 | ) | — | — | |||||||
Other | 1,454 | (4,099 | ) | 1,793 | |||||||
$ | (19,418 | ) | $ | 37,073 | $ | 24,788 | |||||
(1) The release of prior year tax positions during fiscal 2015 increased each of the current year basic and diluted net income per common share by $0.16 and $0.15, respectively. The release of prior year tax positions during fiscal 2014 increased each of the current year basic and diluted net income per common share by $0.07. The release of prior year tax positions during fiscal 2013 increased the current year basic and diluted net income per common share by $0.04 and $0.03, respectively.
The foreign tax rate differential benefit primarily relates to the Company's operations in Thailand, Cayman and Ireland. The Company's Thailand manufacturing operations are currently subject to numerous tax holidays granted to the Company based on its investment in property, plant and equipment in Thailand. The Company's tax holiday periods in Thailand expire at various times in the future, however, the Company actively seeks to obtain new tax holidays. The Company does not expect the future expiration of any of its tax holiday periods in Thailand to have a material impact on its effective tax rate. The aggregate dollar benefits derived from these tax holidays approximated $12.4 million, $16.8 million and $12.0 million in fiscal 2015, 2014 and 2013, respectively.
No U.S. income taxes have been provided on substantially all of the filing basis undistributed foreign earnings and profits of approximately $2.8 billion as of March 31, 2015 since the Company has the ability and intent to permanently reinvest these amounts. If such earnings were repatriated, additional tax expense may result, although the calculation of such additional taxes is not practicable.
During the year ended March 31, 2015, the Company settled an IRS examination of SMSC for fiscal years 2011 and 2010. In addition, the Company benefited from the expiration of the statute of limitations and other releases related to previously accrued tax reserves. The total tax benefit associated with these items resulted in a reduction of income tax provision of approximately $33.1 million and a decrease in the effective tax rate of 9.6%.
F-30
The tax effects of temporary differences that give rise to significant portions of the deferred tax assets and deferred tax liabilities are as follows (amounts in thousands):
March 31, | |||||||
2015 | 2014 | ||||||
Deferred tax assets: | |||||||
Deferred intercompany profit | $ | 10,865 | $ | 9,623 | |||
Deferred income on shipments to distributors | 34,493 | 28,596 | |||||
Inventory valuation | 9,605 | 6,072 | |||||
Net operating loss carryforward | 105,756 | 110,598 | |||||
Capital loss carryforward | 4,582 | — | |||||
Share-based compensation | 26,780 | 24,494 | |||||
Income tax credits | 115,893 | 124,395 | |||||
Accrued expenses and other | 671 | 28,227 | |||||
Gross deferred tax assets | 308,645 | 332,005 | |||||
Valuation allowances | (116,482 | ) | (93,811 | ) | |||
Deferred tax assets, net of valuation allowances | 192,163 | 238,194 | |||||
Deferred tax liabilities: | |||||||
Property, plant and equipment, principally due to differences in depreciation | 2,236 | (1,942 | ) | ||||
Convertible debentures | (493,897 | ) | (530,338 | ) | |||
Other | (10,649 | ) | (13,740 | ) | |||
Deferred tax liabilities | (502,310 | ) | (546,020 | ) | |||
Net deferred tax liability | $ | (310,147 | ) | $ | (307,826 | ) | |
Reported as: | |||||||
Current deferred tax assets | $ | 71,045 | $ | 67,490 | |||
Non-current deferred tax liability | (381,192 | ) | (375,316 | ) | |||
Net deferred tax liability | $ | (310,147 | ) | $ | (307,826 | ) | |
In addition to the deferred tax assets listed above, the Company has unrecorded tax benefits of $38.6 million attributable to the difference between the amount of the financial statement expense and the allowable tax deduction associated with share-based compensation. As a result of net operating loss (NOL) carryforwards, the Company was not able to recognize the excess tax benefits of share-based compensation deductions because the deductions did not reduce income tax payable. Although not recognized for financial reporting purposes, this unrecorded tax benefit is available to reduce future income and is incorporated into the disclosed amounts of the Company's federal and state NOL carryforwards, discussed below. If subsequently realized, the benefit will be recorded to contributed capital.
In assessing whether it is more likely than not that deferred tax assets will be realized, the Company considers all available evidence, both positive and negative, including its recent cumulative earnings experience and expectations of future available taxable income of the appropriate character by taxing jurisdiction, tax attribute carryback and carryforward periods available to them for tax reporting purposes, and prudent and feasible tax planning strategies.
The Company had federal, state and foreign NOL carryforwards with an estimated tax effect of $162.9 million available at March 31, 2015. The federal and state NOL carryforwards expire at various times between 2016 and 2035. The Company believes that it is more likely than not that the benefit from certain foreign and state NOL carryforwards will not be realized. In recognition of this risk, at March 31, 2015, the Company has provided a valuation allowance of $52.6 million. The Company also has state tax credits with an estimated tax effect of $59.1 million available at March 31, 2015. These state tax credits expire at various times between 2016 and 2035. The Company believes that it is more likely than not that the full benefit from these state tax credits will not be realized, and therefore has provided a valuation allowance of $34.4 million. The Company has capital loss carryforwards with an estimated tax effect of $4.6 million available at March 31, 2015. These capital loss carryforwards expire in 2020. The Company believes that it is more likely than not that the full benefit from these capital losses will not be realized, and therefore has provided a valuation allowance of $4.6 million. The Company had U.S foreign tax
F-31
credits with an estimated tax effect of $23.1 million that expire at various times between 2016 and 2025. The Company believes it is more likely than not that the benefit from these credits will not be fully realized and has provided a valuation allowance of $23.0 million. At March 31, 2015, the Company had credits for increasing research activity in the amount of $57.4 million that expire at various times between 2022 and 2035. In addition, the Company had $3.7 million of alternative minimum tax credits that do not expire.
On September 13, 2013, the IRS and the Treasury Department released final regulations under Section 162(a) and 263(a) on the deduction and capitalization of expenditures related to tangible property. The new regulations apply to tax years beginning on or after January 1, 2014. The Company believes that no material impact will result from these new regulations (specifically given the Company’s NOL position), but the Company is in the process of evaluating the full impact of these changes.
During the year ended March 31, 2015, the Tax Increase Prevention Act of 2014 was signed into law which extended certain business tax provisions through December 31, 2014, including IRC section 954(c)(6) dealing with the application of Subpart F to certain inter-company payments among controlled foreign corporations. The expiration of section 954(c)(6) and the other expired provisions could have a material impact on the Company's consolidated results of operations subsequent to the year ended March 31, 2015.
The Company recognizes interest and penalties related to unrecognized tax benefits through income tax expense. The Company is subject to income taxes in the U.S. and numerous foreign jurisdictions. The Company files U.S. federal, U.S. state, and foreign income tax returns. For U.S. federal, and in general for U.S. state tax returns, the fiscal 2011 and later tax years remain open for examination by tax authorities. The U.S. Internal Revenue Service (IRS) is currently auditing Microchip's 2011 and 2012 tax years. For foreign tax returns, the Company is generally no longer subject to income tax examinations for years prior to fiscal 2007.
Significant judgment is required in evaluating the Company's uncertain tax positions and determining its provision for income taxes. Although the Company believes that it has appropriately reserved for its uncertain tax positions, no assurance can be given that the final tax outcome of these matters will not be different than expectations. The Company will adjust these reserves in light of changing facts and circumstances, such as the closing of a tax audit, the refinement of an estimate, the closing of a statutory audit period or changes in applicable tax law. To the extent that the final tax outcome of these matters is different than the amounts recorded, such differences could impact the provision for income taxes in the period in which such determination is made. The provision for income taxes includes the impact of reserve provisions and changes to the reserves that are considered appropriate, as well as related net interest.
The Company recognizes liabilities for anticipated tax audit issues in the U.S. and other domestic and international tax jurisdictions based on its estimate of whether, and the extent to which, additional tax payments are more likely than not. The Company believes that it has appropriate support for the income tax positions taken and to be taken on its tax returns and that its accruals for tax liabilities are adequate for all open years based on an assessment of many factors including past experience and interpretations of tax law applied to the facts of each matter.
The Company believes it maintains appropriate reserves to offset any potential income tax liabilities that may arise upon final resolution of matters for open tax years. If such reserve amounts ultimately prove to be unnecessary, the resulting reversal of such reserves could result in tax benefits being recorded in the period the reserves are no longer deemed necessary. If such amounts prove to be less than an ultimate assessment, a future charge to expense would be recorded in the period in which the assessment is determined. Although the timing of the resolution and/or closure of audits is highly uncertain, the Company does not believe that it is reasonably possible that the unrecognized tax benefits would materially change in the next 12 months.
F-32
The following table summarizes the activity related to the Company's gross unrecognized tax benefits from April 1, 2012 to March 31, 2015 (amounts in thousands):
Year Ended March 31, | |||||||||||
2015 | 2014 | 2013 | |||||||||
Beginning balance | $ | 149,878 | $ | 152,845 | $ | 70,490 | |||||
Increases related to acquisitions | 8,381 | 341 | 45,624 | ||||||||
Decreases related to settlements with tax authorities | (20,197 | ) | (15,016 | ) | — | ||||||
Decreases related to statute of limitation expirations | (9,031 | ) | (4,069 | ) | (5,751 | ) | |||||
Increases related to current year tax positions | 23,179 | 14,669 | 42,328 | ||||||||
Increases related to prior year tax positions | 18,444 | 1,108 | 154 | ||||||||
Ending balance | $ | 170,654 | $ | 149,878 | $ | 152,845 | |||||
As of March 31, 2015, the Company had accrued approximately $0.7 million related to the potential payment of interest on the Company's uncertain tax positions. As of March 31, 2014, the Company had accrued approximately $0.3 million related to the potential payment of interest on the Company's uncertain tax positions. Interest was included in the provision for income taxes. The Company has accrued for approximately $27.6 million and $29.7 million in penalties related to its uncertain tax positions related to its international locations as of March 31, 2015 and March 31, 2014, respectively. Interest and penalties charged or (credited) to operations during the years ended March 31, 2015, 2014 and 2013 related to the Company's uncertain tax positions were $(1.8) million, $0.2 million and $0.8 million, respectively. The increase related to prior year tax positions for March 31, 2015 related primarily to a balance sheet reclassification from a valuation allowance to a reserve in the amount of $15.7 million.
14. 1.625% SENIOR SUBORDINATED CONVERTIBLE DEBENTURES
In February 2015, the Company issued $1.725 billion principal amount of 1.625% senior subordinated convertible debentures due February 15, 2025. The debentures are subordinated to the Company's senior debt, including amounts borrowed under its amended credit facility, but are senior to the Company's outstanding 2.125% junior subordinated convertible debentures. The debentures are convertible, subject to certain conditions, into cash, shares of the Company's common stock or a combination thereof, at the Company's election, at an initial base conversion rate of 14.5654 shares of common stock per $1,000 principal amount of debentures, representing an initial base conversion price of approximately $68.66 per share of common stock. As a result of cash dividends paid since the issuance of the debentures, the conversion rate has been adjusted to 14.6687 shares of common stock per $1,000 of principal amount of debentures, representing a base conversion price of approximately $68.17 per share of common stock. In addition, if at the time of conversion the applicable price of the Company's common stock exceeds the base conversion price, the conversion rate will be increased by up to an additional 7.2827 shares of common stock per $1,000 principal amount of debentures, as determined pursuant to a specified formula. As a result of cash dividends paid since the issuance of the debentures, the maximum number of additional shares that may be issued if the stock price of the Company's common stock exceeds the base conversion price has been adjusted to 7.3343 shares of common stock per $1,000 principal amount of debentures. However, in no event will the conversion rate exceed 20.3915 (adjusted to 20.5361 as a result of cash dividends paid since the issuance of the debentures) shares of common stock per $1,000 principal amount of debentures. The Company received net proceeds of approximately $1,694.7 million after deduction of issuance costs of approximately $30.3 million. The $30.3 million in issuance costs were split between a debt component of $20.4 million and an equity component of $9.9 million. The $20.4 million in debt issuance costs are recorded in other assets and are being amortized using the effective interest method over the term of the debentures.
Prior to the close of business on the business day immediately preceding November 15, 2024, the debentures will be convertible at the option of the debenture holders only upon the satisfaction of specified conditions and during certain periods. Thereafter until close of business on the second scheduled trading day immediately preceding February 15, 2025, the debentures will be convertible at the option of the debenture holders at any time regardless of these conditions. Accrued and unpaid interest will be considered fully paid upon settlement of shares.
F-33
As the debentures can be settled in cash upon conversion, for accounting purposes, the debentures were bifurcated into a liability component and an equity component, which are both initially recorded at fair value. The carrying value of the equity component at March 31, 2015 was $564.9 million. The estimated fair value of the liability component of the debentures at the issuance date was $1,160.1 million resulting in a debt discount of $564.9 million. The unamortized debt discount was $559.3 million at March 31, 2015. The remaining period over which the unamortized debt discount will be recognized as non-cash interest expense is 9.87 years. In the year ended March 31, 2015, the Company recognized $5.7 million in non-cash interest expense related to the amortization of the debt discount. The Company recognized $3.8 million of interest expense related to the 1.625% coupon on the debentures in fiscal 2015. The effective interest rate of the debentures is 6.1%.
15. 2.125% JUNIOR SUBORDINATED CONVERTIBLE DEBENTURES
Loss on retirement of convertible debentures - In February 2015, the Company acquired $575.0 million in aggregate principal amount of its 2.125% junior subordinated convertible debentures for an aggregate purchase price of $1,134.6 million, based on market value. The payment was allocated between the liability ($238.3 million) and equity ($896.3 million) components of the convertible debentures, using the equivalent rate that reflected the borrowing rate for a similar non-convertible debt prior to the retirement. The transaction resulted in a loss on retirement of convertible debentures of approximately $50.6 million, which represented the difference between the fair value of the liability component at time of repurchase and the sum of the carrying values of the debt component and any unamortized debt issuance costs.
The Company's remaining $575.0 million principal amount of 2.125% junior subordinated convertible debentures due December 15, 2037, are subordinated in right of payment to any future senior debt of the Company and are effectively subordinated in right of payment to the liabilities of the Company's subsidiaries. The debentures are convertible, subject to certain conditions, into cash, shares of the Company's common stock or a combination thereof, at the Company's election, at an initial conversion rate of 29.2783 shares of common stock per $1,000 principal amount of debentures, representing an initial conversion price of approximately $34.16 per share of common stock. As of March 31, 2015, the holders of the debentures had the right to convert their debentures between April 1, 2015 and June 30, 2015 because for at least 20 trading days during the 30 consecutive trading day period ending on March 31, 2015, the Company's common stock had a last reported sale price greater than 130% of the conversion price. As of March 31, 2015, a holder could realize more economic value by selling its debentures in the over the counter market than from converting its debentures. As a result of cash dividends paid since the issuance of the debentures, the conversion rate has been adjusted to 39.8555 shares of common stock per $1,000 of principal amount of debentures, representing a conversion price of approximately $25.09 per share of common stock. The if-converted value of the debentures exceed the principal amount by $545.6 million at March 31, 2015. The debentures include a contingent interest mechanism that begins in December 2017. The terms of the contingent interest include a 0.25% interest rate if the debentures are trading at less than $400 and 0.5% if the debentures are trading at greater than $1,500. Based on the current trading price of the debentures, the contingent interest rate would be 0.5%.
As the debentures can be settled in cash upon conversion, for accounting purposes, the debentures were bifurcated into a liability component and an equity component, which are both initially recorded at fair value. As it relates to the remaining $575.0 million principal amount of 2.125% junior subordinated convertible debentures outstanding at March 31, 2015, the carrying value of the equity component at March 31, 2015 was $411.2 million. The estimated fair value of the liability component of the debentures at the issuance date was $163.8 million, resulting in a debt discount of $411.2 million. The unamortized debt discount was $383.7 million at March 31, 2015. The carrying value of the debentures was $190.9 million at March 31, 2015. The remaining period over which the unamortized debt discount will be recognized as non-cash interest expense is 22.75 years. In the years ended March 31, 2015, 2014 and 2013, the Company recognized $9.1 million, $9.0 million and $8.2 million, respectively, in non-cash interest expense related to the amortization of the debt discount. The Company recognized $22.8 million of interest expense related to the 2.125% coupon on the debentures in fiscal 2015 and $24.4 million of interest expense related to the 2.125% coupon in each of fiscal 2014 and fiscal 2013. The effective interest rate of the debentures is 9.1%.
16. | CREDIT FACILITY |
In February 2015, the Company amended its existing $2.0 billion credit agreement by increasing the revolving credit facility to $2.555 billion and removing the term loan portion of the agreement. The new credit agreement includes two tranches. One tranche consists of bank commitments through February 2020 and another tranche consists of bank commitments through June 2018, the maturity date of the original credit agreement. The Company's increase option was also adjusted to $300 million. The credit agreement provides for a $125 million foreign currency sublimit, a $25 million letter of
F-34
credit sublimit and a $25 million swingline loan sublimit. The amended credit agreement was accounted for as a modification and as such any remaining unamortized deferred costs associated with the prior credit agreement was associated with the new agreement since the borrowing capacity was increased. At March 31, 2015, $461.9 million of revolving credit facility borrowings were outstanding under the credit agreement.
The loans under the credit agreement bear interest, at the Company's option, at the base rate plus a spread of 0.25% to 1.25% or an adjusted LIBOR rate (based on one, two, three, or six-month interest periods) plus a spread of 1.25% to 2.25%, in each case with such spread being determined based on the consolidated leverage ratio for the preceding four fiscal quarters (in the case of the 2018 tranche revolving loans) or the consolidated senior leverage ratio (in the case of the 2020 tranche revolving loans). The base rate means the highest of JPMorgan Chase Bank, N.A.'s prime rate, the federal funds rate plus a margin equal to 0.50% and the adjusted LIBOR rate for a 1-month interest period plus a margin equal to 1.00%. Swingline loans accrue interest at a per annum rate based on the base rate plus the applicable margin for base rate loans. Base rate loans may only be made in U.S. Dollars. The Company is also obligated to pay other administration fees and letter of credit fees for a credit facility of this size and type.
Interest is due and payable in arrears quarterly for loans bearing interest at the base rate and at the end of an interest period (or at each three month interval in the case of loans with interest periods greater than three months) in the case of loans bearing interest at the adjusted LIBOR rate. Interest expense related to the credit agreement was approximately $19.9 million in fiscal 2015 and approximately $14.6 million in fiscal 2014. Interest expense related to the Company's prior credit agreement was approximately $7.0 million in fiscal 2013. Principal, together with all accrued and unpaid interest, is due and payable on the respective tranche maturity date, which is June 27, 2018 and February 4, 2020. The weighted average interest rate on short-term borrowings outstanding at March 31, 2015 related to the credit agreement was 1.68%. The Company also pays a quarterly commitment fee on the available but unused portion of its line of credit which is calculated on the average daily available balance during the period. The Company may prepay the loans and terminate the commitments, in whole or in part, at any time without premium or penalty, subject to certain conditions including minimum amounts in the case of commitment reductions and reimbursement of certain costs in the case of prepayments of LIBOR loans.
The Company's obligations under the credit agreement are guaranteed by certain of its subsidiaries meeting materiality thresholds set forth in the credit agreement. To secure the Company's obligations under the credit agreement, the Company and its domestic subsidiaries will be required to pledge the equity securities of certain of their respective material subsidiaries, subject to certain exceptions and limitations.
The credit agreement contains customary affirmative and negative covenants, including covenants that limit or restrict the Company and its subsidiaries' ability to, among other things, incur subsidiary indebtedness, grant liens, merge or consolidate, dispose of assets, make investments, make acquisitions, enter into certain transactions with affiliates, pay dividends or make distributions, repurchase stock, enter into restrictive agreements and enter into sale and leaseback transactions, in each case subject to customary exceptions for a credit facility of this size and type. The Company is also required to maintain compliance with consolidated senior and total leverage ratios and a consolidated interest coverage ratio. At March 31, 2015, the Company was in compliance with these covenants.
The credit agreement includes customary events of default that include, among other things, non-payment defaults, inaccuracy of representations and warranties, covenant defaults, cross default to material indebtedness, bankruptcy and insolvency defaults, material judgment defaults, ERISA defaults and a change of control default. The occurrence of an event of default could result in the acceleration of the obligations under the credit agreement. Under certain circumstances, a default interest rate will apply on all obligations during the existence of an event of default under the credit agreement at a per annum rate equal to 2.00% above the applicable interest rate for any overdue principal and 2.00% above the rate applicable for base rate loans for any other overdue amounts.
17. | CONTINGENCIES |
In the ordinary course of the Company's business, it is involved in a limited number of legal actions, both as plaintiff and defendant, and could incur uninsured liability in any one or more of them. The Company also periodically receives notifications from various third parties alleging infringement of patents, intellectual property rights or other matters. With respect to pending legal actions to which the Company is a party, although the outcomes of these actions are not generally determinable, the Company believes that the ultimate resolution of these matters will not have a material adverse effect on its financial position, cash flows or results of operations. Litigation relating to the semiconductor industry is not uncommon, and the Company is, and from time to time has been, subject to such litigation. No assurances can be given with respect to the extent or outcome of any such litigation in the future.
F-35
The Company's technology license agreements generally include an indemnification clause that indemnifies the licensee against liability and damages (including legal defense costs) arising from any claims of patent, copyright, trademark or trade secret infringement by the Company's proprietary technology. The terms of these indemnification provisions approximate the terms of the outgoing technology license agreements, which are typically perpetual unless terminated by either party for breach. The possible amount of future payments the Company could be required to make based on agreements that specify indemnification limits, if such indemnifications were required on all of these agreements, is approximately $139 million. There are some licensing agreements in place that do not specify indemnification limits. The Company had not recorded any liabilities related to these indemnification obligations as of March 31, 2015.
18. STOCK REPURCHASE ACTIVITY
On December 11, 2007, the Company announced that its Board of Directors had authorized the repurchase of up to 10.0 million shares of its common stock in the open market or in privately negotiated transactions. As of March 31, 2015, the Company had repurchased 7.5 million shares under this authorization for $234.7 million. There is no expiration date associated with this program. See Note 28 for additional information regarding an increase to this share repurchase authorization.
During the years ended March 31, 2015, 2014 and 2013, the Company did not purchase any of its shares of common stock.
19. EMPLOYEE BENEFIT PLANS
The Company maintains a contributory profit-sharing plan for its domestic employees meeting certain eligibility and service requirements. The plan qualifies under Section 401(k) of the Internal Revenue Code of 1986, as amended, and allows employees to contribute up to 60% of their base salary, subject to maximum annual limitations prescribed by the IRS. The Company has a discretionary matching contribution program. All matches are provided on a quarterly basis and require the participant to be an active employee at the end of each quarter. During fiscal 2015, 2014 and 2013, the Company contributions to the plan totaled $3.9 million, $3.6 million and $0.8 million, respectively.
The Company's 2001 Employee Stock Purchase Plan (the 2001 Purchase Plan) became effective on March 1, 2002. Under the 2001 Purchase Plan, eligible employees of the Company may purchase shares of common stock at semi-annual intervals through periodic payroll deductions. The purchase price in general will be 85% of the lower of the fair market value of the common stock on the first day of the participant's entry date into the offering period or of the fair market value on the semi-annual purchase date. Depending upon a participant's entry date into the 2001 Purchase Plan, purchase periods under the 2001 Purchase Plan consist of overlapping periods of either 24, 18, 12 or 6 months in duration. In May 2003 and August 2003, the Company's Board and stockholders, respectively, each approved an annual automatic increase in the number of shares reserved under the 2001 Purchase Plan. The automatic increase took effect on January 1, 2005, and on each January 1 thereafter during the term of the plan, and is equal to the lesser of (i) 1,500,000, (ii) one half of one percent (0.5%) of the then outstanding shares of the Company's common stock, or (iii) such lesser amount as is approved by Board of Directors. Upon the approval of the Board of Directors, there were no shares added under the 2001 Purchase Plan on January 1, 2015, 2014 or 2013, based on the automatic increase provision. On January 1, 2012, an additional 960,269 shares were reserved under the 2001 Purchase Plan based on the automatic increase. Since the inception of the 2001 Purchase Plan, 11,277,862 shares of common stock have been reserved for issuance and 6,108,421 shares have been issued under this purchase plan.
During fiscal 1995, a purchase plan was adopted for employees in non-U.S. locations. Such plan provided for the purchase price per share to be 100% of the lower of the fair market value of the common stock at the beginning or end of the semi-annual purchase plan period. Effective May 1, 2006, the Company's Board of Directors approved a purchase price per share equal to 85% of the lower of the fair market value of the common stock at the beginning or end of the semi-annual purchase plan period. On May 1, 2006, the Company's Board of Directors approved an annual automatic increase in the number of shares reserved under the plan. The automatic increase took effect on January 1, 2007, and on each January 1 thereafter during the term of the plan, and is equal to one tenth of one percent (0.1%) of the then outstanding shares of the Company's common stock. Upon the approval of the Board of Directors, there were no shares added under the plan on January 1, 2015, 2014 or 2013, based on the automatic increase provision. On January 1, 2012, an additional 192,054 shares were reserved under the plan based on the automatic increase. Since the inception of this purchase plan, 1,500,285 shares of common stock have been reserved for issuance and 946,822 shares have been issued under this purchase plan.
F-36
Effective January 1, 1997, the Company adopted a non-qualified deferred compensation arrangement. This plan is unfunded and is maintained primarily for the purpose of providing deferred compensation for a select group of highly compensated employees as defined in ERISA Sections 201, 301 and 401. There are no Company matching contributions made under this plan.
In connection with the acquisition of SMSC, the Company assumed an unfunded Supplemental Executive Retirement Plan ("SERP"), which provides former SMSC senior management with retirement, disability and death benefits. An amendment to the SERP was executed on November 3, 2009, freezing the benefit level for existing participants as of February 28, 2010 and closing the SERP to new participants. As of March 31, 2015, the projected benefit obligation is $5.9 million. Annual benefit payments and contributions under this plan are expected to be approximately $0.8 million in fiscal 2016 and approximately $4.1 million cumulatively in fiscal 2017 through fiscal 2025.
The Company has management incentive compensation plans which provide for bonus payments, based on a percentage of base salary, from an incentive pool created from operating profits of the Company, at the discretion of the Board of Directors. During fiscal 2015, 2014 and 2013, $24.2 million, $24.4 million and $12.0 million were charged against operations for these plans, respectively.
The Company also has a plan that, at the discretion of the Board of Directors, provides a cash bonus to all employees of the Company based on the operating profits of the Company. During fiscal 2015, 2014 and 2013, $15.9 million, $15.2 million and $4.3 million, respectively, were charged against operations for this plan.
20. EQUITY INCENTIVE PLANS
Share-Based Compensation Expense
The following table presents the details of the Company's share-based compensation expense (amounts in thousands):
Year Ended March 31, | ||||||||||||
2015 | 2014 | 2013 | ||||||||||
Cost of sales | $ | 9,010 | (1) | $ | 7,340 | (1) | $ | 8,234 | (1) | |||
Research and development | 28,164 | 24,554 | 22,178 | |||||||||
Selling, general and administrative | 21,422 | 21,893 | 27,603 | |||||||||
Pre-tax effect of share-based compensation | 58,596 | 53,787 | 58,015 | |||||||||
Income tax benefit | 10,640 | 5,722 | 9,038 | |||||||||
Net income effect of share-based compensation | $ | 47,956 | $ | 48,065 | $ | 48,977 | ||||||
(1) During the year ended March 31, 2015, $6.8 million of share-based compensation expense was capitalized to inventory, and $9.0 million of previously capitalized share-based compensation expense in inventory was sold. During the year ended March 31, 2014, $7.4 million of share-based compensation expense was capitalized to inventory, and $7.3 million of previously capitalized share-based compensation expense in inventory was sold. During the year ended March 31, 2013, $5.9 million of share-based compensation expense was capitalized to inventory, and $8.2 million of previously capitalized share-based compensation expense in inventory was sold.
The amount of unearned share-based compensation currently estimated to be expensed in the remainder of fiscal 2016 through fiscal 2020 related to unvested share-based payment awards at March 31, 2015 is $94.2 million. The weighted average period over which the unearned share-based compensation is expected to be recognized is approximately 2.00 years.
F-37
Combined Incentive Plan Information
RSU share activity under the 2004 Plan is set forth below:
Number of Shares | ||
Nonvested shares at April 1, 2012 | 5,492,220 | |
Granted | 1,976,583 | |
Assumed upon acquisition | 523,043 | |
Forfeited/expired | (370,196 | ) |
Vested | (1,611,819 | ) |
Nonvested shares at March 31, 2013 | 6,009,831 | |
Granted | 1,616,632 | |
Forfeited/expired | (282,964 | ) |
Vested | (1,813,465 | ) |
Nonvested shares at March 31, 2014 | 5,530,034 | |
Granted | 1,446,968 | |
Forfeited/expired | (266,415 | ) |
Vested | (1,441,671 | ) |
Nonvested shares at March 31, 2015 | 5,268,916 | |
The total intrinsic value of RSUs which vested during the years ended March 31, 2015, 2014 and 2013 was $67.6 million, $74.6 million and $54.4 million, respectively. The aggregate intrinsic value of RSUs outstanding at March 31, 2015 was $257.6 million, calculated based on the closing price of the Company's common stock of $48.90 per share on March 31, 2015. At March 31, 2015, the weighted average remaining expense recognition period was 2.03 years.
The weighted average fair value per share of the RSUs awarded is calculated based on the fair market value of the Company's common stock on the respective grant dates discounted for the Company's expected dividend yield. The weighted average fair value per share of RSUs awarded in fiscal 2015, 2014 and 2013 was $42.02, $34.24 and $29.92, respectively.
Stock option and SAR activity under the Company's stock incentive plans in the three years ended March 31, 2015 is set forth below:
Number of Shares | Weighted Average Exercise Price per Share | |||||
Outstanding at April 1, 2012 | 3,360,997 | $ | 25.00 | |||
Granted | — | — | ||||
Assumed upon acquisition | 827,707 | 19.32 | ||||
Exercised | (1,638,548 | ) | 22.19 | |||
Canceled | (280,353 | ) | 19.90 | |||
Outstanding at March 31, 2013 | 2,269,803 | 25.58 | ||||
Granted | — | — | ||||
Exercised | (1,675,663 | ) | 25.91 | |||
Canceled | (20,529 | ) | 22.78 | |||
Outstanding at March 31, 2014 | 573,611 | 24.75 | ||||
Granted | 27,654 | 46.66 | ||||
Assumed upon acquisition | 666,586 | 29.33 | ||||
Exercised | (477,618 | ) | 26.42 | |||
Canceled | (105,934 | ) | 28.17 | |||
Outstanding at March 31, 2015 | 684,299 | $ | 28.41 | |||
F-38
The total intrinsic value of options and SARs exercised during the years ended March 31, 2015, 2014 and 2013 was $9.6 million, $25.5 million and $19.0 million, respectively. This intrinsic value represents the difference between the fair market value of the Company's common stock on the date of exercise and the exercise price of each equity award.
The aggregate intrinsic value of options and SARs outstanding at March 31, 2015 was $14.1 million. The aggregate intrinsic value of options and SARS exercisable at March 31, 2015 was $6.2 million. The aggregate intrinsic values were calculated based on the closing price of the Company's common stock of $48.90 per share on March 31, 2015.
As of March 31, 2015 and 2014, the number of option and SARs shares exercisable was 283,133 and 543,435, respectively, and the weighted average exercise price per share was $26.90 and $25.03, respectively.
The weighted average fair values per share of stock options granted in the year ended March 31, 2015 was $9.00. The fair values per share of stock options granted in the year ended March 31, 2015 were estimated utilizing the following assumptions:
Year Ended March 31, | ||
2015 | ||
Expected term (in years) | 6.5 | |
Volatility | 26.65 | % |
Risk-free interest rate | 1.59 | % |
Dividend yield | 3.00 | % |
There were no stock options granted in either of the years ended March 31, 2014 and 2013.
21. COMMITMENTS
The Company leases office space, a manufacturing facility, transportation and other equipment under operating leases which expire at various dates through March 31, 2020. The future minimum lease commitments under these operating leases at March 31, 2015 were as follows (amounts in thousands):
Year Ending March 31, | Amount | |||
2016 | $ | 16,146 | ||
2017 | 10,587 | |||
2018 | 7,365 | |||
2019 | 4,388 | |||
2020 | 1,153 | |||
Thereafter | — | |||
Total minimum payments | $ | 39,639 | ||
Rental expense under operating leases totaled $23.8 million, $21.5 million and $20.3 million for fiscal 2015, 2014 and 2013, respectively.
Commitments for construction or purchase of property, plant and equipment totaled $56.5 million as of March 31, 2015, all of which will be due within the next year. Other purchase obligations and commitments totaled approximately $50.3 million as of March 31, 2015. Other purchase obligations and commitments include payments due under various types of licenses and approximately $48.8 million of outstanding purchase commitments with the Company's wafer foundries for delivery in fiscal 2016.
22. | GEOGRAPHIC AND SEGMENT INFORMATION |
The Company's reporting segments include semiconductor products and technology licensing. The Company does not allocate operating expenses, interest income, interest expense, other income or expense, or provision for or benefit from income taxes to these segments for internal reporting purposes, as the Company does not believe that allocating these expenses is beneficial in evaluating segment performance. Additionally, the Company does not allocate assets to segments for internal reporting purposes as it does not manage its segments by such metrics.
F-39
The following table represents revenues and gross profit for each segment (amounts in thousands):
Years ended March 31, | |||||||||||||||||||||||
2015 | 2014 | 2013 | |||||||||||||||||||||
Net Sales | Gross Profit | Net Sales | Gross Profit | Net Sales | Gross Profit | ||||||||||||||||||
Semiconductor products | $ | 2,057,443 | $ | 1,139,971 | $ | 1,836,639 | $ | 1,034,165 | $ | 1,497,820 | $ | 754,656 | |||||||||||
Technology licensing | 89,593 | 89,593 | 94,578 | 94,578 | 83,803 | 83,803 | |||||||||||||||||
$ | 2,147,036 | $ | 1,229,564 | $ | 1,931,217 | $ | 1,128,743 | $ | 1,581,623 | $ | 838,459 | ||||||||||||
The Company sells its products to distributors and original equipment manufacturers (OEMs) in a broad range of market segments, performs on-going credit evaluations of its customers and, as deemed necessary, may require collateral, primarily letters of credit. The Company's operations outside the U.S. consist of product assembly and final test facilities in Thailand, and sales and support centers and design centers in certain foreign countries. Domestic operations are responsible for the design, development and wafer fabrication of products, as well as the coordination of production planning and shipping to meet worldwide customer commitments. The Company's Thailand assembly and test facility is reimbursed in relation to value added with respect to assembly and test operations and other functions performed, and certain foreign sales offices receive compensation for sales within their territory. Accordingly, for financial statement purposes, it is not meaningful to segregate sales or operating profits for the assembly and test and foreign sales office operations. Identifiable long-lived assets (consisting of property, plant and equipment net of accumulated amortization) by geographic area are as follows (amounts in thousands):
March 31, | |||||||
2015 | 2014 | ||||||
United States | $ | 331,372 | $ | 311,926 | |||
Thailand | 197,981 | 179,139 | |||||
Various other countries | 52,219 | 40,902 | |||||
Total long-lived assets | $ | 581,572 | $ | 531,967 | |||
Sales to unaffiliated customers located outside the U.S., primarily in Asia and Europe, aggregated approximately 84% of consolidated net sales for each of fiscal 2015 and 2014 and approximately 83% of consolidated net sales for fiscal 2013. Sales to customers in Europe represented approximately 21% of consolidated net sales for each of fiscal 2015 and 2014 and approximately 22% of consolidated net sales for fiscal 2013. Sales to customers in Asia represented approximately 59%, 60% and 58% of consolidated net sales for fiscal 2015, 2014 and 2013, respectively. Within Asia, sales into China, including Hong Kong, represented approximately 28%, 29% and 27% of consolidated net sales for fiscal 2015, 2014 and 2013, respectively. Sales into Taiwan represented approximately 14% of consolidated net sales for fiscal 2015 and approximately 13% of consolidated net sales for each of fiscal 2014 and 2013. Sales into any other individual foreign country did not exceed 10% of the Company's net sales for any of the years presented.
No single end customer or distributor accounted for 10% or more of the Company's net sales during fiscal 2015, 2014 or 2013.
23. | DERIVATIVE INSTRUMENTS |
Freestanding Derivative Forward Contracts
Foreign Currency Exchange Rate Risk
The Company has international operations and is thus subject to foreign currency rate fluctuations. To help manage the risk of changes in foreign currency rates, the Company periodically enters into derivative contracts comprised of foreign currency forward contracts to hedge its asset and liability foreign currency exposure and a portion of its foreign currency operating expenses. Approximately 99% of the Company's sales are U.S. Dollar denominated. Net losses due to foreign exchange rate fluctuations after the effects of hedging activity were $7.7 million during fiscal 2015, compared to net gains of $0.4 million during fiscal 2014 and net losses of $2.8 million during fiscal 2013. As of March 31, 2015 and 2014, the Company had no foreign currency forward contracts outstanding. The Company recognized an immaterial amount of net
F-40
realized gains and losses on foreign currency forward contracts in the years ended March 31, 2015, 2014 and 2013. Gains and losses from changes in the fair value of these foreign currency forward contracts and foreign currency exchange rate fluctuations are credited or charged to Other Income (Expense). The Company does not apply hedge accounting to its foreign currency derivative instruments.
Fair Value Hedges
For derivative instruments that are designated and qualify as fair value hedges, the gain or loss on the derivatives as well as the offsetting gain or loss on the hedged item attributable to the hedged risk are recognized in earnings. Interest rate derivative instruments designated as fair value hedges are designed to manage the exposure to interest rate movements and to reduce borrowing costs by converting fixed-rate debt into floating-rate debt. Under these agreements, the Company agrees to exchange, at specified intervals, the difference between the fixed and floating interest amounts calculated by reference to an agreed-upon notional principal amount.
In March 2015, the Company entered into ten-year fixed-to-floating interest rate swap agreements designated as fair value hedges of the changes in fair value of a portion of the Company's fixed-rate 1.625% senior subordinated convertible debentures due to changes in the LIBOR swap rate, the designated benchmark interest rate. The Company pays variable interest equal to the three-month LIBOR minus 53.6 basis points and it receives a fixed interest rate of 1.625%. The notional amount of these contracts outstanding at March 31, 2015 was $431.3 million, representing 25% of the principal amount of the senior subordinated convertible debentures.
The following table summarize the location and fair value amounts of derivative instruments reported in the consolidated balance sheets at March 31, 2015 (amounts in thousands):
Asset Derivatives | ||||||
Derivatives designated as hedging instruments | Balance Sheet Location | Fair Value | ||||
Interest rate contracts | Other assets | $ | 8,928 | |||
The following table summarizes the location and amount of the gain or loss on the hedged item attributable to the changes in the LIBOR swap rate and the offsetting gain or loss on the related interest rate swap agreements for the year ended March 31, 2015. The difference represents hedge ineffectiveness (amounts in thousands):
Income Statement Classification | Gain (Loss) on Senior Subordinated Convertible Debentures | Gain (Loss) on Interest Rate Swap | ||||||
Other Income (Expense) | $ | (8,302 | ) | $ | 8,928 | |||
24. | NET INCOME PER COMMON SHARE |
The following table sets forth the computation of basic and diluted net income per common share (in thousands, except per share amounts):
Year ended March 31, | |||||||||||
2015 | 2014 | 2013 | |||||||||
Net income attributable to Microchip Technology | $ | 369,009 | $ | 395,281 | $ | 127,389 | |||||
Weighted average common shares outstanding | 200,937 | 198,291 | 194,595 | ||||||||
Dilutive effect of stock options and RSUs | 3,642 | 3,910 | 3,650 | ||||||||
Dilutive effect of convertible debt | 18,982 | 15,429 | 7,531 | ||||||||
Weighted average common and potential common shares outstanding | 223,561 | 217,630 | 205,776 | ||||||||
Basic net income per common share attributable to Microchip Technology stockholders | $ | 1.84 | $ | 1.99 | $ | 0.65 | |||||
Diluted net income per common share attributable to Microchip Technology stockholders | $ | 1.65 | $ | 1.82 | $ | 0.62 | |||||
F-41
The Company computed basic earnings per common share attributable to its stockholders using net income available to common stockholders and the weighted average number of common shares outstanding during the period. The Company computed diluted earnings per common share attributable to its stockholders using net income available to stockholders and the weighted average number of common shares outstanding plus potentially dilutive common shares outstanding during the period.
Potentially dilutive common shares from employee equity incentive plans are determined by applying the treasury stock method to the assumed exercise of outstanding stock options and the assumed vesting of outstanding RSUs.
Diluted net income per common share attributable to stockholders for fiscal 2015, 2014, and 2013 includes 18,982,440, 15,429,003 and 7,531,111 shares, respectively, issuable upon the exchange of the Company's 2.125% junior subordinated convertible debentures due December 15, 2037 (see Note 15). The debentures have no impact on diluted net income per common share unless the average price of the Company's common stock exceeds the conversion price because the principal amount of the debentures will be settled in cash upon conversion. Prior to conversion, the Company will include, in the diluted net income per common share calculation, the effect of the additional shares that may be issued when the Company's common stock price exceeds the conversion price using the treasury stock method. The weighted average conversion price per share used in calculating the dilutive effect of the convertible debt for fiscal 2015, 2014 and 2013 was $25.48, $26.32 and $27.36, respectively.
There were no shares issuable upon the exchange of the Company's 1.625% senior subordinated convertible debentures due February 15, 2025 (see Note 14). The debentures have no impact on diluted net income per common share unless the average price of the Company's common stock exceeds the conversion price because the principal amount of the debentures will be settled in cash upon conversion. Prior to conversion, the Company will include, in the diluted net income per common share calculation, the effect of the additional shares that may be issued when the Company's common stock price exceeds the conversion price using the treasury stock method. The weighted average conversion price per share used in calculating the dilutive effect of the convertible debt for fiscal 2015 was $68.25.
Weighted average common shares exclude the effect of option shares which are not dilutive. For fiscal 2015, the number of option shares that were antidilutive was 19,305. There were no antidilutive option shares for fiscal 2014. For fiscal 2013, the number of option shares that were antidilutive was 98,068.
25. | QUARTERLY RESULTS (UNAUDITED) |
The following table presents the Company's selected unaudited quarterly operating results for the eight quarters ended March 31, 2015. The Company believes that all adjustments of a normal recurring nature have been made to present fairly the related quarterly results (in thousands, except per share amounts):
Fiscal 2015 | First Quarter | Second Quarter | Third Quarter | Fourth Quarter | Total | |||||||||||||||
Net sales | $ | 528,876 | $ | 546,243 | $ | 528,710 | $ | 543,207 | $ | 2,147,036 | ||||||||||
Gross profit | 306,519 | 307,454 | 301,959 | 313,632 | 1,229,564 | |||||||||||||||
Operating income | 115,946 | 101,318 | 98,009 | 110,347 | 425,620 | |||||||||||||||
Net income | 89,909 | 92,038 | 84,798 | 98,580 | 365,325 | |||||||||||||||
Less: Net loss attributable to noncontrolling interests | — | 1,603 | 1,259 | 822 | 3,684 | |||||||||||||||
Net income attributable to Microchip Technology | 89,909 | 93,641 | 86,057 | 99,402 | 369,009 | |||||||||||||||
Diluted net income per common share attributable to Microchip Technology stockholders | 0.40 | 0.42 | 0.39 | 0.45 | 1.65 | |||||||||||||||
Fiscal 2014 | First Quarter | Second Quarter | Third Quarter | Fourth Quarter | Total | |||||||||||||||
Net sales | $ | 462,792 | $ | 492,669 | $ | 482,372 | $ | 493,384 | $ | 1,931,217 | ||||||||||
Gross profit | 266,574 | 288,863 | 282,720 | 290,586 | 1,128,743 | |||||||||||||||
Operating income | 98,401 | 117,508 | 116,918 | 126,037 | 458,864 | |||||||||||||||
Net income | 78,579 | 99,806 | 105,401 | 111,495 | 395,281 | |||||||||||||||
Diluted net income per common share | 0.37 | 0.46 | 0.48 | 0.50 | 1.82 | |||||||||||||||
F-42
Refer to Note 3, Special Charges, for an explanation of the special charges included in operating income in fiscal 2015 and fiscal 2014. Refer to Note 15, 2.125% Junior Subordinated Convertible Debentures, for an explanation of the loss on retirement of convertible debentures of approximately $50.6 million included in net income (loss) during the fourth quarter of fiscal 2015. Refer to Note 4, Investments, for an explanation of the $18.5 million net realized gain from sales of available-for-sale marketable equity securities included in net income (loss) during the fourth quarter of fiscal 2015.
26. SUPPLEMENTAL FINANCIAL INFORMATION
Cash paid for income taxes amounted to $25.5 million, $25.7 million and $21.4 million during fiscal 2015, 2014 and 2013, respectively. Cash paid for interest on borrowings amounted to $40.2 million in fiscal 2015, $34.6 million in fiscal 2014 and $28.8 million in fiscal 2013.
A summary of additions and deductions related to the allowance for doubtful accounts for the years ended March 31, 2015, 2014 and 2013 follows (amounts in thousands):
Balance at Beginning of Year | Charged to Costs and Expenses | Deductions (1) | Balance at End of Year | ||||||||||||
Allowance for doubtful accounts: | |||||||||||||||
2015 | $ | 2,918 | $ | 104 | $ | (401 | ) | $ | 2,621 | ||||||
2014 | 2,764 | 245 | (91 | ) | 2,918 | ||||||||||
2013 | 2,602 | 516 | (354 | ) | 2,764 | ||||||||||
(1) Deductions represent uncollectible accounts written off, net of recoveries.
The following tables present the changes in the components of accumulated other comprehensive income (AOCI) for the years ended March 31, 2015 and March 31, 2014:
Year ended March 31, 2015 | Unrealized Holding Gains (Losses) Available-for-sale Securities | Minimum Pension Liability | Foreign Currency | Total | |||||||||||
Balance at March 31, 2014 | $ | (528 | ) | $ | 140 | $ | 1,439 | $ | 1,051 | ||||||
Other comprehensive income (loss) before reclassifications | 33,759 | (127 | ) | (4,322 | ) | 29,310 | |||||||||
Amounts reclassified from accumulated other comprehensive income (loss) | (18,694 | ) | — | — | (18,694 | ) | |||||||||
Net other comprehensive income (loss) | 15,065 | (127 | ) | (4,322 | ) | 10,616 | |||||||||
Purchase of shares from noncontrolling interest | — | — | (591 | ) | (591 | ) | |||||||||
Balance at March 31, 2015 | $ | 14,537 | $ | 13 | $ | (3,474 | ) | $ | 11,076 | ||||||
Year ended March 31, 2014 | Unrealized Holding Gains (Losses) Available-for-sale Securities | Minimum Pension Liability | Foreign Currency | Total | |||||||||||
Balance at March 31, 2013 | $ | 5,444 | $ | 52 | $ | 1,439 | $ | 6,935 | |||||||
Other comprehensive (loss) income before reclassifications | (4,377 | ) | 88 | — | (4,289 | ) | |||||||||
Amounts reclassified from accumulated other comprehensive (loss) income | (1,595 | ) | — | — | (1,595 | ) | |||||||||
Net other comprehensive (loss) income | (5,972 | ) | 88 | — | (5,884 | ) | |||||||||
Balance at March 31, 2014 | $ | (528 | ) | $ | 140 | $ | 1,439 | $ | 1,051 | ||||||
F-43
The table below details where reclassifications of realized transactions out of AOCI are recorded on the Consolidated Statements of Income.
Year ended March 31, | |||||||||||||
Description of AOCI Component | 2015 | 2014 | 2013 | Related Statement of Income Line | |||||||||
Unrealized gains on available-for-sale securities | $ | 18,706 | $ | 2,371 | $ | 394 | Other income | ||||||
Taxes | (12 | ) | (776 | ) | (51 | ) | (Provision) benefit for income taxes | ||||||
Reclassification of realized transactions, net of taxes | $ | 18,694 | $ | 1,595 | $ | 343 | Net Income | ||||||
27. DIVIDENDS
On October 28, 2002, the Company announced that its Board of Directors had approved and instituted a quarterly cash dividend on its common stock. The Company has continued to pay quarterly dividends and has increased the amount of such dividends on a regular basis. Cash dividends paid per share were $1.425, $1.417 and $1.406 during fiscal 2015, 2014 and 2013, respectively. Total dividend payments amounted to $286.5 million , $281.2 million and $273.8 million during fiscal 2015, 2014 and 2013, respectively.
28. SUBSEQUENT EVENTS
Announcement of Signing of Definitive Agreement to Acquire Micrel, Incorporated
On May 7, 2015, the Company announced that it had signed a definitive agreement to acquire Micrel, Incorporated (Micrel) for $14.00 per share. Micrel shareholders may elect to receive the purchase price in either cash or shares of the Company's common stock. The acquisition price represents a total equity value of approximately $839 million, and a total enterprise value of approximately $744 million, after excluding Micrel's cash and investments on its balance sheet of approximately $95 million. The acquisition has been unanimously approved by the Boards of Directors of both companies and is expected to close early in the third quarter of calendar year 2015, subject to approval by Micrel's shareholders, regulatory approvals and other customary closing conditions.
Authorization of Increase to Share Repurchase Program
On May 7, 2015, the Company's Board of Directors authorized an increase to the existing share repurchase program to 20.0 million shares of common stock from the approximately 2.5 million shares remaining under the prior authorization.
F-44