Attached files
| file | filename |
|---|---|
| 8-K - FORM 8-K - Nimble Storage Inc | d932013d8k.htm |
| EX-99.2 - EXHIBIT 99.2 - Nimble Storage Inc | d932013dex992.htm |
Exhibit 99.1
Nimble Storage, Inc. Q1FY16 Shareholder Letter
Executive Summary
The storage industry, comprising $40B in storage systems and software, is going through a period of unprecedented change driven by the disruptive impact of flash. Specifically, the external storage systems market that was comprised entirely of disk arrays a few years ago is seeing a rapid decline in disk-only storage arrays as two other segments are gaining share:
| • | Hybrid Flash Arrays. The market for hybrid flash arrays is estimated to be ~$10B in 2014, growing to ~$14B in 2018 (source: IDC #252304) |
| • | All-Flash Arrays. The market for all-flash arrays is estimated to be ~$1.3B in 2014, growing to ~$3.3B in 2018 (source: IDC #252304) |
We designed our Adaptive Flash Platform, consisting of our flash-optimized file system and our Infosight cloud-based management software, with the goal of addressing the entire spectrum of workloads across the Enterprise. We believe our Adaptive Flash arrays have the ability to deliver the performance of all-flash arrays and address multi-petabyte deployments far more cost-effectively than products from legacy competitors and emerging competitors. As customers aim to simultaneously consolidate storage while delivering different service levels for hundreds or even thousands of applications, we believe that we stand alone in being able to span the entire spectrum of needs of Enterprise customers among next-generation flash-optimized storage platforms.
In Q1FY16 we executed very well against that growth opportunity:
| • | Continued momentum on new customer acquisition with 542 new customers in Q1 to end with an installed base of 5,521 customers. |
| • | Accelerated Enterprise momentum: |
| • | Bookings from deals over $100K grew 142% year-over-year, and bookings from deals over $250K more than quadrupled from a year ago |
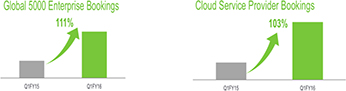
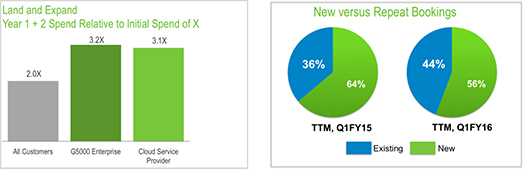
| • | Bookings from Global 5000 Enterprises and cloud service providers more than doubled from a year ago |
| • | Fibre Channel accounted for 14% of our bookings, up from 10% in Q4 |
| Executing our strategy to fuel growth
Our strategy for growth remains focused on four main themes:
1. Acquiring new customers at a rapid pace.
2. Expanding the portion of Global 5000 Enterprises and Cloud Service Providers in our installed base
3. Growing international bookings
4. Driving growth through repeat deployments from our installed base of customers
Strong record of new customer acquisitions
We continued to execute on our strong record of driving new customer acquisitions as we added 542 new customers to end the quarter with an installed base of 5,521 customers worldwide.
Our channel relationships have proven key to our ability to rapidly add new customers. A key area of focus has been the enablement of our existing base of channel partners in more mature markets even as we continue to add new partners in emerging markets. |
Intermedix Consolidates Storage Arrays with Nimble Storage
Intermedix Corporation is a leader in emergency healthcare services processing more than 15 million patient encounters annually.
With dozens of storage systems distributed across data centers and offices, Intermedix was challenged to manage disparate solutions for data protection and complex storage management tools. They wanted to consolidate to fewer data centers and were actively seeking a storage platform that could deliver performance and capacity scaling cost-effectively, simplify storage management and improve data protection.
They selected a solution comprising the Nimble Adaptive Flash platform with CommVault’s software to realize the following key benefits:
• Dozens of storage arrays across sites will be consolidated down to three high-end Nimble arrays in three data centers.
• Nimble’s WAN-optimized replication and snapshots, managed by CommVault software, will become the de-facto standard for data protection across the Enterprise
• InfoSight enables them to monitor and manage storage information from all three data centers centrally.
|
| Our channel enablement focus is yielding strong results as the number of new customers we added where our channel partners played a lead role reached record levels during Q1. |
|
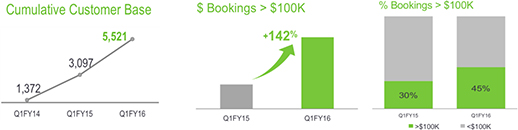
During Q1FY16, our bookings from large deals grew at a rapid pace. Deals over $100K grew at 142% compared to Q1FY15 and represented 45% of our total bookings. Similarly, bookings from deals over $250K more than quadrupled during the quarter driven by wins among large enterprises.
Rapid growth in Global 5000 Enterprises and Cloud Service Providers
Over the last two years, we made several investments in broadening our product portfolio with enterprise-centric features such as
| scale-out functionality, adaptive flash capabilities and Fibre Channel functionality. We have also been systematically expanding our enterprise-focused sales teams in conjunction with expanding our technology platform.
These investments have resulted in strong growth in our |
|
bookings from Global 5000 enterprises, which more than doubled from a year ago. Moreover, we now count dozens of Global 500 companies as our customers, and our solutions are increasingly being deployed in larger and more critical environments with escalating requirements. In a similar vein, we are seeing continued growth in our cloud service provider customer base where bookings have also more than doubled from a year ago.
Some key customer wins during Q1FY16 included the following:
| • | A leading bank selected us over EMC VMAX for a large deployment to address its database requirements |
| • | A large systems integration partner selected our platform to optimize and deliver over a million exchange mailboxes for a major government customer |
Land and expand model is driving repeat bookings
One of our most powerful areas of differentiation is the consistently high level of customer satisfaction within our installed base, which in turn drives a consistently strong pattern of repeat deployments. Our compelling product value proposition is a key contributor to driving repeat deployments. An equally significant and unique aspect of
| our approach is the value proposition delivered by InfoSight: proactively monitoring deployments to identify bottlenecks and preempt issues, helping to accurately plan and forecast for future storage performance and capacity needs, and rapidly resolving issues when they occur. |
|
Across our entire customer base of over 5,500 customers, a customer on average more than doubles its initial spend over a 2-year time frame after the initial purchase. When we look at our Global 5000 customers and our cloud service provider customers, we believe the propensity for repeat deployment is even greater. This pattern of repeat deployments by our customers has resulted in repeat bookings accounting for a record 51% of our overall bookings in Q1FY16.
Adaptive Flash Platform: The broadest approach to leveraging flash in the enterprise
Our Adaptive Flash Platform is based on two foundational innovations – our CASL file system software and our InfoSight cloud-based management software. Over the last few years, we have delivered innovation at a rapid pace that has enabled us to span the broadest spectrum of workloads across the Enterprise - ranging from extremely demanding, performance-intensive workloads to Petabyte-scale capacity-intensive workloads.
| As the disk storage systems market transitions to flash-optimized storage systems, legacy vendors are continuing to respond by bolting flash on to their disk-centric architectures. We continue to see this as an ineffective approach, which we believe is the principal driver of market share losses and low to negative product revenue growth for the large incumbent storage vendors. At the same time, we also see the approach of other emerging storage vendors as more narrowly focused on targeting niche use-cases within enterprises. Consequently, we see strong win rates in our competitive engagements driven by our ability to deliver superior price-performance and price-capacity, superior scaling, better data protection and a dramatically simpler-to-manage infrastructure. |
| In just two quarters, our Fibre Channel product has gained rapid momentum as it accounted for 14% of our bookings in Q1FY16 compared to 10% in Q4FY15. As anticipated, Fibre Channel has been a significant factor in breaking down barriers to adoption of our platform in Global 5000 enterprises. Our Fibre Channel deals on average have had a sizably larger ASP than our iSCSI deals thus far, which improves our sales productivity and accelerates growth
During the last quarter, we introduced the beta availability of a key capability within InfoSight that allows us to extend InfoSight’s real-time monitoring capabilities into VMware environments to identify performance bottlenecks and instances where a single VM causes degraded performance for other VMs. This capability is already playing a significant role in enhancing our win rates and in reinforcing our competitive differentiation with InfoSight. |
Fortune 500 Media Company deploys Nimble SmartStack solution
One of the divisions of this Fortune 500 Media company, with offices across the US, first engaged Nimble because they were facing substantial performance challenges when they tried to deploy VDI on a storage array from their incumbent vendor.
After a detailed evaluation, they chose Nimble not just to address their VDI requirements but as a consolidation platform for all of their server virtualization needs as well. They realized a number of benefits following their Nimble deployment:
• They overcame their VDI performance challenges as they achieved sub-millisecond latencies on average with Nimble
• By leveraging snapshot-based data protection along with replication for DR, their ability to recover data is substantially improved
• They were able to consolidate down one rack to 3U for their storage, which helped alleviate space constrains in their DR facility
• Nimble’s Scale-to-Fit architecture was a significant benefit given their unpredictable storage growth needs in the future
• The Nimble SmartStack solution simplified the deployment of the Nimble platform in conjunction with Cisco UCS
|
| As customers look to simplify the deployment of infrastructure through converged infrastructure solutions, we have partnered with industry leaders to create SmartStack converged infrastructure solutions for VDI with VMware and Citrix, for databases and mission critical applications with Microsoft and Oracle, for SAP HANA, and for broader server virtualization solutions. During Q1FY16, we saw rapid growth in SmartStack deployments with over 100 customers in a single quarter.
Financial Performance: Q1FY16 Financial Results
As a reminder, all results presented in this letter are on a non-GAAP basis except for revenue and the balance sheet. Non-GAAP results exclude the impact of stock-based compensation. |
Nimble addresses Grant Thornton Australia’s rapidly growing storage needs
Grant Thornton Australia, with more than 1,100 employees and six offices, is a member firm within Grant Thornton International, the fastest growing large accounting organization in the world.
When Grant Thornton Australia merged with the former BDO offices in Melbourne and Sydney, the firm experienced a rapid growth in its employee base, which proved taxing to their legacy storage infrastructure. Exponential growth in storage capacity, degradation in performance, reliability challenges and concerns over disaster recovery prompted a comprehensive evaluation of alternative vendor solutions. They deployed Nimble based on the following criteria:
• Two Nimble arrays with ~250TB of capacity replaced four NetApp and two EMC arrays, providing a more cost-effective solution capable of addressing their increasing capacity and performance requirements
• Nimble’s proven availability combined with InfoSight’s cloud-connected management and monitoring provided Grant Thornton Australia with a more resilient and reliable infrastructure
• Nimble’s snapshot and replication capabilities were implemented to increase point in time recoverability and improve disaster recovery
In their own words, “Staff have been able to access data a lot faster...the increase in available storage and growth capabilities far exceed our previous infrastructure platform…”
|
Q1FY16 Highlights
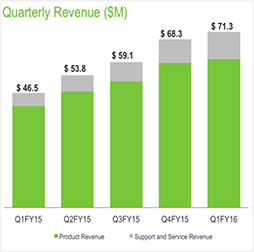
| • | Revenue of $71.3 million increased 53% from $46.5 million in Q1FY15. Excluding fluctuations in foreign currency, revenue would have been $73.4 million representing a 58% increase over Q1FY15. |
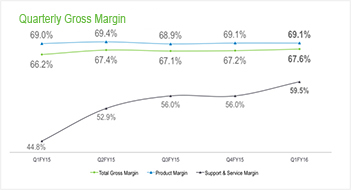
| • | Non-GAAP Gross Margin was 67.6%, a record high and an increase of 1.4 percentage points vs. Q1FY15 |
| • | Non-GAAP Operating Loss improved to $7.9 million, or negative 11% of revenue, compared to $10.1 million, or negative 22% of revenue, in Q1FY15. |
| • | Adjusted EBITDA improved to negative $4.5 million, or 6% of revenue, compared to negative $8.1 million, or 17% of revenue, in Q1FY15. |
| • | Non-GAAP EPS was a loss of $0.10 per share compared to a loss of $0.14 per share in Q1FY15. |
| Q1FY16 Financial Results
Q1FY16 was a very strong financial quarter for us. We achieved revenue of $71.3 million, above our guidance of $68 million to $70 million. Q1 revenue grew 53% from prior year. Excluding fluctuations in foreign currency, revenue would have been $73.4M representing a 58% increase over Q1FY15. Our gross margin reached a record high during Q1 and remained industry leading at 67.6%. Our operating loss was $7.9 million, better than our projected operating loss of $9.0 million to $10.0 million, primarily due to higher than expected revenue and gross margin. Q1 non-GAAP EPS was a loss of $0.10 per share, better than our guidance of $0.13 to $0.14 loss per share. |
|
| Product revenue for Q1FY16 was $60.2 million, representing 84% of total revenue and an increase of 46% from Q1FY15. Support and service revenue for Q1FY16, which includes our maintenance and InfoSight service, was $11.1 million, representing 16% of total revenue and an increase of 109% from Q1FY15. Our international business contributed 19% of total revenue during Q1FY16 and grew by 59% from Q1FY15. Excluding fluctuations in foreign currency, international revenues would have been 21% of total revenue, with growth of 84% compared to Q1FY15. We ended Q1FY16 with total deferred revenue of $86.3 million, an increase of $44.2 million or 105% from Q1FY15. Our deferred revenue consists primarily of payments received for support and service agreements, which have an average life of approximately three years. |
| Gross margin was 67.6% in Q1FY16, a record high for us, and an improvement of 1.4 percentage points compared to Q1FY15. Product gross margin in Q1FY16 was 69.1%, an improvement of 10 basis points compared to Q1FY15. Our industry leading product gross margin continues to reflect the efficiencies of our Adaptive Flash platform.
Support and service gross margin in Q1FY16 was at a record high 59.5%, up by 14.7 percentage points from 44.8% in Q1FY15. The expansion in support and service gross margin continues to be driven by increased revenue from our larger base of customers and economies of scale from our support organization, enabled by the automation capabilities of InfoSight. |
|
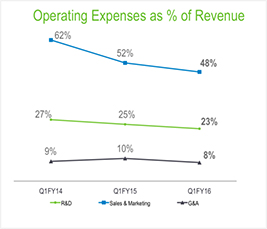
Q1FY16 total operating expenses were $56.1 million or 79% of revenue compared to Q1 last year operating expenses of $40.9 million or 88% of revenue. We saw an improvement in overall operating expense leverage by 9 percentage points which was spread across all of our functional areas.
| • Research and development (R&D) spending in Q1FY16 was $16.3 million or 23% of revenue. Leverage improved by 2.5 percentage points compared to Q1FY15 when spending was $11.8 million or 25% of total revenue. Our long-term target for R&D spending is 11% to 13% of total revenue.
• Sales and marketing (S&M) spending in Q1FY16 was $34.3 million or 48% of revenue. Leverage improved by 4 percentage points compared to Q1FY15 spending of $24.3 million or 52% of revenue. Our long-term target for S&M spending is 28% to 31% of total revenue.
• General and administrative (G&A) spending in Q1FY16 was $5.5 million or 8% of revenue. Leverage improved by 2.7 percentage points compared to Q1FY15 spending of $4.9 million or 10% of revenue. Our long-term target for G&A spending is 5% to 6% of total revenue. |
|
Our Q1FY16 operating loss was $7.9 million, better than our guidance for an operating loss of $9.0 million to $10.0 million, and better than our operating loss of $10.1 million in Q1FY15. Q1FY16 operating margin improved to negative 11% compared to negative 22% in Q1FY15, an improvement of 11 percentage points. Our Adjusted EBITDA was negative $4.5 million or negative 6% of revenue in Q1FY16 compared to negative $8.1 million or negative 17% of revenue in Q1FY15, also an 11 percentage point improvement.
Q1FY16 non-GAAP EPS was a loss of $0.10 per share on approximately 76.5 million weighted average basic and diluted shares outstanding compared to a loss of $0.14 per share in Q1FY15. This was better than our guidance for a loss of $0.13 to $0.14 per share.
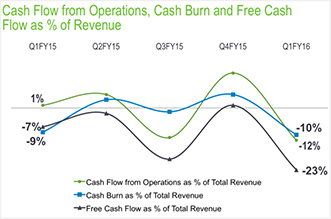
| We ended Q1FY16 with cash and cash equivalents of $201.5 million. As we expected, during Q1, our cash balance decreased by $6.9 million primarily due to the timing of payout of accrued compensation from our last fiscal year end, and the linearity of our billings during the quarter. As previously discussed, we estimate that our cash flow will be positive for the entire fiscal year with an overall increase in our cash balance by year-end.
In Q1FY16, we achieved a cash conversion cycle of 13 days, ahead of our target of 20 days. We ended Q1 with accounts receivables of $44.3 million, an increase of $9.0 million from Q4FY15. Days sales outstanding (DSO) were 43 days, inside of our target range of 35 to 45 days and was consistent with our Q3 DSO level. DSO increased by 4 days from Q4FY15 (a quarter which had better billings linearity due to December, the calendar year end for many companies, and January, our own fiscal year end). We ended Q1 with inventory of $12.9 million, an increase of $0.9 million from Q4FY15. Days sales in inventory (DSI) were 48 days, above our target range of 35 to 45 days, as we increased our service and demo inventory to support our fast growing installed base of customers and prospects. |
|
Capex spend during Q1FY16 was $8.1 million, or 11% of revenue, mainly due to leasehold improvements and R&D lab investments. For FY16, we expect our total capex spend to be approximately 7% to 9% of total revenue.
Q2FY16 Financial Outlook
Our financial guidance for Q2FY16 is as follows:
| • | Total revenue of $77.0 million to $79.0 million |
| • | Non-GAAP operating loss of $8.0 million to $9.0 million |
| • | Non-GAAP net loss of $0.11 to $0.12 per share, based on weighted average basic shares outstanding of approximately 78 million |
As discussed previously, we remain on track to achieve our goal of non-GAAP operating income break-even by the end of the current fiscal year.
Our financial objectives remain (1) driving strong revenue growth and increasing our market share by growing significantly above the level of overall industry growth, (2) maintaining industry leading gross margins and (3) steadily progressing towards our long term target financial model of 16%-20% operating margin by delivering sequential improvement in operating margin every year.
We want to thank our partners and customers once again for embracing us, our investors for their confidence in us, and our employees for their dedication and flawless execution.

|

| |||
| Suresh Vasudevan, CEO | Anup Singh, CFO |
Conference Call Information:
As previously announced, Nimble Storage will host a live question & answer conference call and webcast today at 5:00 p.m. ET (2:00 p.m. PT) to discuss its financial results for the fiscal first quarter 2016. Interested parties may access the call by dialing (888) 855-5428 in the U.S. or (719) 325-2381 from international locations. In addition, a live audio webcast of the conference call will be available on the Nimble Storage Investor Relations website at http://investors.nimblestorage.com. The live webcast will be archived and available on this site for 45 days. A replay of the conference call will be available for 45 days. To access the replay, please dial 888-203-1112 and enter pass code 6025628. Callers outside the U.S. and Canada should dial 719-457-0820 and enter pass code 6025628.
Non-GAAP Financial Measures
To provide investors with additional information regarding our financial results, Nimble Storage has disclosed in this release non-GAAP financial measures that are not calculated in accordance with generally accepted accounting principles in the United States, or GAAP. The Company provides non-GAAP gross margin, non-GAAP operating margin, non-GAAP net loss, non-GAAP net loss per basic and diluted share, free cash flow and adjusted EBITDA. In computing many of these non-GAAP financial measures, the Company excludes the effects of stock-based compensation, which is a recurring expense for the Company. The Company has provided reconciliation below of non-GAAP financial measures to the most directly comparable GAAP financial measures.
The Company discloses these non-GAAP financial measures because they are key measures used by the Company’s management and board of directors to understand and evaluate operating performance and trends, to prepare and approve the annual budget and to develop short-term and long-term operational and compensation plans. In particular, the exclusion of certain expenses in calculating non-GAAP financial measures can provide a useful measure for period-to-period comparisons of the Company’s business. Accordingly, the Company believes that these non-GAAP financial measures provide useful information to investors and others in understanding and evaluating the Company’s operating results in the same manner as the Company’s management and board of directors.
Non-GAAP financial measures have limitations as analytical tools and, as such, should not be considered in isolation or as substitutes for analysis of the Company’s results as reported under GAAP. Some of these limitations are:
| • | Non-GAAP financial measures do not consider the potentially dilutive impact of equity-based compensation, which is an ongoing expense for the Company; and |
| • | Other companies, including companies in our industry, may calculate non-GAAP financial measures differently, which reduces their usefulness as comparative measures. |
Nimble Storage, Inc.
Reconciliation of GAAP to Non-GAAP Financial Measures
(In thousands, except per share amounts)
(Unaudited)
| Three Months Ended April 30, |
||||||||
| 2015 | 2014 | |||||||
| GAAP gross margin |
$ | 46,495 | $ | 30,212 | ||||
| Stock-based compensation |
1,702 | 624 | ||||||
|
|
|
|
|
|||||
| Non-GAAP gross margin |
$ | 48,197 | $ | 30,836 | ||||
|
|
|
|
|
|||||
| GAAP operating margin |
$ | (28,918 | ) | $ | (19,644 | ) | ||
| Stock-based compensation |
20,985 | 9,557 | ||||||
|
|
|
|
|
|||||
| Non-GAAP operating margin |
$ | (7,933 | ) | $ | (10,087 | ) | ||
|
|
|
|
|
|||||
| GAAP net loss |
$ | (28,986 | ) | $ | (19,595 | ) | ||
| Stock-based compensation |
20,985 | 9,557 | ||||||
|
|
|
|
|
|||||
| Non-GAAP net loss |
$ | (8,001 | ) | $ | (10,038 | ) | ||
|
|
|
|
|
|||||
| Interest expense (income), net |
(68 | ) | 4 | |||||
| Provision for income taxes |
212 | 156 | ||||||
| Depreciation |
3,312 | 1,758 | ||||||
|
|
|
|
|
|||||
| Adjusted EBITDA |
$ | (4,545 | ) | $ | (8,120 | ) | ||
|
|
|
|
|
|||||
| GAAP net loss per share, basic and diluted |
$ | (0.38 | ) | $ | (0.28 | ) | ||
| Stock-based compensation |
0.28 | 0.14 | ||||||
|
|
|
|
|
|||||
| Non-GAAP net loss per share |
$ | (0.10 | ) | $ | (0.14 | ) | ||
|
|
|
|
|
|||||
| Shares used to compute GAAP net loss per share, basic and diluted |
76,506 | 70,319 | ||||||
|
|
|
|
|
|||||
| Shares used to compute Non-GAAP net loss per share |
76,506 | 70,319 | ||||||
|
|
|
|
|
|||||
Forward-Looking Statements
This press release contains “forward-looking” statements that are based on our management’s beliefs and assumptions and on information currently available to management. We intend for such forward-looking statements to be covered by the safe harbor provisions for forward-looking statements contained in the U.S. Private Securities Litigation Reform Act of 1995. Forward-looking statements include all statements other than statements of historical fact contained in this letter, including information concerning our future financial results, timing of product releases or enhancements, business plans and objectives, potential growth opportunities, competitive position, industry trends and environment and potential market opportunities.
Forward-looking statements are subject to known and unknown risks, uncertainties, assumptions and other factors including, but not limited to, those related to our future financial performance which is inherently uncertain, unforeseen delays in product development or introduction, uncertainty around market acceptance of our solutions, our ability to increase sales of our solutions, our ability to attract and retain customers and to selling additional solutions to our existing customers, our ability to develop new solutions and bring them to market in a timely manner, pricing pressure (as a result of competition or otherwise), introduction of new technologies and products by other companies, our ability to maintain,
protect and enhance our brand and intellectual property, the effectiveness of our channel partners and sales team, our ability to recruit new or keep our existing key talent, global economic conditions and fluctuations in foreign currency rates and our ability to continue to expand our business and manage our growth. Moreover, we operate in very competitive and rapidly changing environments, and new risks may emerge from time to time. It is not possible for our management to predict all risks, nor can we assess the impact of all factors on our business or the extent to which any factor, or combination of factors, may cause actual results to differ materially from those contained in any forward-looking statements we may make. Further information on these and other factors that could affect our financial results are included in our filings with the Securities and Exchange Commission, and may cause our actual results, performance or achievements to differ materially and adversely from those anticipated or implied by our forward-looking statements.
You should not rely upon forward-looking statements as predictions of future events. Although our management believes that the expectations reflected in our forward-looking statements are reasonable, we cannot guarantee that the future results, levels of activity, performance or events and circumstances described in the forward-looking statements will be achieved or occur. Moreover, neither we, nor any other person, assume responsibility for the accuracy and completeness of the forward-looking statements. We undertake no obligation to publicly update any forward-looking statements for any reason after the date of this presentation to conform these statements to actual results or to changes in our expectations, except as required by law.
Any unreleased services, features or functions referenced in this document, Nimble Storage’s website or other press releases or public statements that are not currently available are subject to change at Nimble Storage’s discretion and may not be delivered as planned or at all. Customers who purchase Nimble Storage’s products and services should make their purchase decisions based upon services, features and functions that are currently available.
“Customer” or “Customers” referenced above are Nimble Storage’s end customers. It is Nimble Storage’s practice to identify an end-customer from our channel partners prior to shipment and before any support and services are provided. Products are typically shipped directly to the end-customers of our channel partners. Assuming all other revenue recognition criteria have been met, Nimble Storage generally recognizes product revenue on sales upon shipment, as title and risk of loss are transferred at that time. Nimble Storage recognizes revenue from support and service contracts over the contractual service period.
Nimble Storage, the Nimble Storage logo, CASL, InfoSight, SmartStack, and NimbleConnect are trademarks or registered trademarks of Nimble Storage. Other trade names or words used in this document are the properties of their respective owners.
Press Contact:
Kristalle Cooks
408-314-3313
kristalle@nimblestorage.com
Investor Relations Contact:
Edelita Tichepco
408-514-3379
IR@nimblestorage.com