Attached files
| file | filename |
|---|---|
| EX-23.1 - EX-23.1 - Nimble Storage Inc | d704141dex231.htm |
| EX-31.1 - EX-31.1 - Nimble Storage Inc | d704141dex311.htm |
| EX-31.2 - EX-31.2 - Nimble Storage Inc | d704141dex312.htm |
| EX-32.1 - EX-32.1 - Nimble Storage Inc | d704141dex321.htm |
| EX-32.2 - EX-32.2 - Nimble Storage Inc | d704141dex322.htm |
Table of Contents
Index to Financial Statements
UNITED STATES
SECURITIES AND EXCHANGE COMMISSION
Washington, D.C. 20549
Form 10-K
(Mark One)
þ ANNUAL REPORT PURSUANT TO SECTION 13 OR 15(d) OF THE SECURITIES EXCHANGE ACT OF 1934
For the fiscal year ended January 31, 2014
OR
¨ TRANSITION REPORT PURSUANT TO SECTION 13 OR 15(d) OF THE SECURITIES EXCHANGE ACT OF 1934
For the transition period from to
001-36233
(Commission File No.)
Nimble Storage, Inc.
(Exact name of Registrant as specified in its charter)
| Delaware | 26-1418899 | |
| (State or other jurisdiction of incorporation or organization) |
(I.R.S. Employer Identification No.) |
| 211 River Oaks Parkway San Jose, California |
95134 | |
| (Address of principal executive offices) | (Zip Code) |
(408) 432-9600
(Registrant’s telephone number, including area code)
Securities registered pursuant to Section 12(b) of the Act:
| Title of each class |
Name of each exchange on which registered | |
| Common Stock, par value $0.001 per share |
New York Stock Exchange |
Securities registered pursuant to Section 12(g) of the Act:
None
Indicate by check mark if the Registrant is a well-known seasoned issuer, as defined in Rule 405 of the Securities Act. Yes ¨ No þ
Indicate by check mark if the Registrant is not required to file reports pursuant to Section 13 or Section 15(d) of the Act. Yes ¨ No þ
Indicate by check mark whether the registrant (1) has filed all reports required to be filed by Section 13 or 15(d) of the Securities Exchange Act of 1934 (Exchange Act) during the preceding 12 months (or for such shorter period that the registrant was required to file such reports), and (2) has been subject to such filing requirements for the past 90 days. Yes þ No ¨
Indicate by check mark whether the registrant has submitted electronically and posted on its corporate Website, if any, every Interactive Data File required to be submitted and posted pursuant to Rule 405 of Regulation S-T (§ 232.405 of this chapter) during the preceding 12 months (or for such shorter period that the registrant was required to submit and post such files). Yes þ No ¨
Indicate by check mark if disclosure of delinquent filers pursuant to Item 405 of Regulation S-K is not contained herein, and will not be contained, to the best of Registrant’s knowledge, in definitive proxy or information statements incorporated by reference in Part III of this Form 10-K or any amendment to this Form 10-K. þ
Indicate by check mark whether the registrant is a large accelerated filer, an accelerated filer, a non-accelerated filer, or a smaller reporting company. See definitions of “large accelerated filer,” “accelerated filer,” and “smaller reporting company” in Rule 12b-2 of the Exchange Act. (Check one):
| Large accelerated filer | ¨ | Accelerated filer | ¨ | |||
| Non-accelerated filer | þ (Do not check if a smaller reporting Company) | Small reporting company | ¨ | |||
Indicate by check mark whether the Registrant is a shell company (as defined in Rule 12b-2 of the Exchange Act). Yes ¨ No þ
The aggregate market value of voting stock held by non-affiliates of the Registrant on December 13, 2013, based on the closing price of $33.93 for shares of the Registrant’s common stock as reported by the New York Stock Exchange, was approximately $684.7 million. The Registrant has elected to use December 13, 2013 as the calculation date, which was the initial trading date of the Registrant’s common stock on the New York Stock Exchange, because on July 31, 2013 (the last business day of the Registrant’s most recently completed second fiscal quarter), the Registrant was a privately-held company. Shares of common stock held by each executive officer, director and their affiliated holders have been excluded in that such persons may be deemed to be affiliates. This determination of affiliate status is not necessarily a conclusive determination for other purposes. The registrant has no non-voting common equity.
As of March 31, 2014, there were approximately 71.8 million shares of the Registrant’s Common Stock outstanding.
DOCUMENTS INCORPORATED BY REFERENCE
Portions of the Registrant’s definitive Proxy Statement for the Registrant’s 2014 Annual Meeting of Stockholders are incorporated by reference in Part III of this Annual Report on Form 10-K to the extent stated herein. The Proxy Statement will be filed with the Securities and Exchange Commission pursuant to Regulation 14A within 120 days of the Registrant’s fiscal year ended January 31, 2014.
Table of Contents
Index to Financial Statements
| Page | ||||||
| Part I | 1 | |||||
| Item 1. | 1 | |||||
| Item 1A. | 13 | |||||
| Item 1B. | 34 | |||||
| Item 2. | 34 | |||||
| Item 3. | 35 | |||||
| Item 4. | 35 | |||||
| Part II | 36 | |||||
| Item 5. | 36 | |||||
| Item 6. | 39 | |||||
| Item 7. | Management’s Discussion and Analysis of Financial Condition and Results of Operations |
40 | ||||
| Item 7A. | 55 | |||||
| Item 8. | 60 | |||||
| Item 9. | Changes in and Disagreements with Accountants on Accounting and Financial Disclosure |
87 | ||||
| Item 9A. | 87 | |||||
| Item 9B. | 87 | |||||
| Part III | 88 | |||||
| Item 10. | 88 | |||||
| Item 11. | 88 | |||||
| Item 12. | Security Ownership of Certain Beneficial Owners and Management and Related Stockholder Matters |
88 | ||||
| Item 13. | Certain Relationships and Related Transactions, and Director Independence |
88 | ||||
| Item 14. | 88 | |||||
| Part IV | 89 | |||||
| Item 15. | 89 | |||||
Table of Contents
Index to Financial Statements
SPECIAL NOTE REGARDING FORWARD-LOOKING STATEMENTS
This report contains forward-looking statements. All statements contained in this report other than statements of historical fact, including statements regarding our future results of operations and financial position, our business strategy and plans and our objectives for future operations, are forward-looking statements. The words “believe,” “may,” “will,” “potentially,” “estimate,” “continue,” “anticipate,” “intend,” “could,” “would,” “project,” “plan,” “expect,” “seek” and similar expressions are intended to identify forward-looking statements. We have based these forward-looking statements largely on our current expectations and projections about future events and trends that we believe may affect our financial condition, results of operations, business strategy, short-term and long-term business operations and objectives and financial needs. These forward-looking statements are subject to a number of risks, uncertainties and assumptions, including those described in the “Risk Factors” section and elsewhere in this report. Moreover, we operate in a very competitive and rapidly changing environment, and new risks emerge from time to time. It is not possible for our management to predict all risks, nor can we assess the impact of all factors on our business or the extent to which any factor, or combination of factors, may cause actual results to differ materially from those contained in any forward-looking statements we may make. In light of these risks, uncertainties and assumptions, the forward-looking events and circumstances discussed in this report may not occur and actual results could differ materially and adversely from those anticipated or implied in the forward-looking statements.
You should not rely upon forward-looking statements as predictions of future events. Although we believe that the expectations reflected in the forward-looking statements are reasonable, we cannot guarantee that the future results, levels of activity, performance or events and circumstances reflected in the forward-looking statements will be achieved or occur. We undertake no obligation to update publicly any forward-looking statements for any reason after the date of this report to conform these statements to actual results or to changes in our expectations, except as required by law.
As used in this report, the terms “Nimble Storage,” “we,” “us,” and “our” mean Nimble Storage, Inc. and its subsidiaries unless the context indicates otherwise.
Overview
Our mission is to provide our customers with the industry’s most efficient data storage platform. We have designed and sell a flash-optimized hybrid storage platform that we believe is disrupting the market by enabling significant improvements in application performance and storage capacity with superior data protection, while simplifying business operations and lowering costs. At the core of our innovative platform is our Cache-Accelerated Sequential Layout file system software, which we call our CASL technology, and our cloud-based storage management and support service, InfoSight. We have built our platform from the ground up to take advantage of the high performance characteristics of flash memory and the capacity and low cost of disk. Our platform’s key benefits include high performance and high capacity efficiency, superior data protection and simplified storage lifecycle management. In addition, CASL’s scale-to-fit flexibility enables non-disruptive and independent scaling of performance and capacity. InfoSight takes advantage of deep-data analytics and rich telemetry capabilities embedded across our platform to proactively monitor the health, capacity and performance of customer systems, and provide real-time operational insight to us and our end-customers.
We serve a broad array of enterprises and cloud-based service providers, and our storage systems and software effectively handle mainstream applications, including virtual desktops, databases, email, collaboration and analytics. Since shipping our first product in August 2010, our
1
Table of Contents
Index to Financial Statements
end-customer base has grown rapidly. We had over 40, 270, 1,090 and 2,640 end-customers as of January 31, 2011, 2012, 2013 and 2014. Our end-customers span a range of industries such as cloud-based service providers, education, financial services, healthcare, manufacturing, state and local government and technology.
We sell our products through our network of value added resellers and distributors, and also engage our end-customers through our global sales force. As of January 31, 2012, 2013 and 2014, we had over 110, 430 and 910 value added resellers that offered our solutions worldwide.
Our Strategy
Our growth strategies include the following:
Extend Our Technology Leadership. We believe that we are disrupting the storage market with our technology platform and our approach to cloud-based management and automation software. We intend to extend our technology leadership by continuing to innovate and investing in research and development to expand the breadth of our platform into additional markets and deliver more cloud-based management services. To this end, our team of technology experts works to build upon the functionality of both CASL and InfoSight in order to meet the evolving needs of the storage market.
Drive Greater Penetration into Our Installed Base of End-Customers. Our installed base of over 2,640 end-customers as of January 31, 2014 provides us a strong foundation in which to drive incremental sales through our “land and expand” model. In the years ended January 31, 2012, 2013 and 2014, approximately 19%, 25%, and 34% of the dollar amounts of orders received were from existing end-customers. As of January 31, 2014, the top 50 of our end-customers that have been with us for at least one year, on average, made additional purchases that were approximately 1.5 times more than the initial dollar purchase amount in the year following the initial sale. Of these 50 customers, 18 have at least two years of purchasing history with us, and these longer term customers, on average, made additional purchases that were approximately three times the initial purchase amount in the two years following the initial sale. Our end-customers often deploy us for a specific application, which may account for only a portion of their storage needs. As we successfully demonstrate the benefits of our products, we will continue to help our end-customers migrate additional workloads and applications onto our storage platform. We also plan to continue to use InfoSight’s predictive capabilities to help our end-customers identify potential expansion needs in their storage environments, thereby driving greater sales of our systems.
Expand and Deepen Our Channel Presence to Accelerate New Customer Acquisition. We have carefully and systematically cultivated a strong channel partner network that has been a key contributor to our rapid customer growth. As of January 31, 2012, 2013 and 2014, we had over 110, 430 and 910 value added reseller channel partners that generated sales leads and distributed our products worldwide. To improve the efficiency and reach of our sales channels, we are evolving our distribution model to directly contract with large distributors. We intend to expand and deepen our value added reseller network across a broad range of industries and geographies to improve our penetration of the storage market in the United States and to continue to grow sales internationally.
Continue to Build Our Sales Organization to Fuel Our Growth and Acquire New Customers. We intend to continue to invest in our sales organization to drive efficient acquisition of new customers across industries and geographies. We will continue to expand our sales organization with additional teams focused on field sales, enterprise, government, and our channel partners. We also believe we have significant opportunities for international expansion and are continuing to invest in key markets.
Expand Our Integration with Alliance Partners. We have invested heavily in integration with applications, hypervisors and servers to make it easier to deploy our storage systems. Through our
2
Table of Contents
Index to Financial Statements
SmartStack reference architecture initiative, we work closely with leading industry players such as Cisco, Citrix, CommVault, Microsoft, Oracle and VMware to provide our customers with joint solutions to minimize interoperability and integration challenges. We intend to continue to develop SmartStack solutions with our existing technology partners, as well as invest in new alliance relationships.
Technology
Our team of storage and software technology experts purpose-built our flash-optimized hybrid storage platform to leverage the strengths of both flash and disk and to simplify business operations. We believe our key technological differentiator is the software that underlies our disruptive CASL file system and our cloud-based InfoSight service.
Cache Accelerated Sequential Layout (CASL) File System
CASL was specifically designed to work with commodity flash memory as well as dense, low revolutions-per-minute, or RPM, HDDs. As a result, CASL allows our customers to achieve the performance and capacity requirements of mainstream enterprise applications cost effectively.
The following graphic illustrates the key steps our CASL file system implements for data layouts.

The key attributes of CASL include:
Write-Optimized Data Layout. CASL delivers both fast random writes and high disk utilization by grouping thousands of random I/O writes from applications into large stripes of data that are written sequentially to low RPM disks. Since HDDs are significantly better at handling sequential I/O as compared to random I/O, CASL can extract thousands of sustained write I/Os per second, or IOPS, from a single 7,200 RPM HDD, whereas other storage architectures typically only achieve 50-75 IOPS. At the same time, the use of low-cost, low RPM HDDs enables us to deliver significantly higher gigabytes per dollar than other storage architectures which use high RPM HDDs or enterprise flash for storage capacity.
Always-on Inline Compression. CASL performs inline compression natively, using a variable-block compression algorithm that allows users to store up to 75% more data per gigabyte with minimal impact on performance or additional latency. Fixed sized blocks that are compressed become variable sized depending on the compressibility of the underlying data. Traditional storage architectures utilize a fixed-size block data layout that is incapable of natively storing variable blocks. As a result, they are typically not able to compress data inline without experiencing performance degradation.
Dynamic Caching. CASL allows for significantly higher throughput and lower latency reads than existing platforms. It leverages a large flash read cache based on commodity SSDs, while intelligently managing the SSD’s performance and endurance, thereby avoiding premature wear of the SSDs. If application patterns change, an intelligent block level index tracks and promotes active data, or data that is being actively accessed, nearly instantaneously to flash. Compared to architectures that use flash as a tier of data, CASL is significantly more cost-effective in its use of flash because it compresses the data on flash, has been designed to use inexpensive consumer-grade SSDs and eliminates the need for redundant provisioning for data protection. Finally, CASL is more responsive to workload changes and can promote active data at levels as low as 4KB granularity within milliseconds,
3
Table of Contents
Index to Financial Statements
as opposed to tiered approaches which must move data up and down in megabyte or even gigabyte-sized chunks, often taking hours or days to rebalance tiers.
Efficient, Instant Snapshots and Replication. CASL employs an efficient, reliable method for data protection with instant point-in-time snapshots. CASL snapshots are space efficient because they capture only changes in data down to 4KB granularity and reside on dense, low cost disk, further reducing costs. Furthermore, CASL snapshots eliminate the need to copy data, allowing our systems to store thousands of snapshots with minimal impact on performance. These characteristics allow our customers to take frequent snapshots (hourly or even more often) and to retain those snapshots for weeks to months, significantly reducing their dependence on traditional backups. In addition, our space-efficient snapshots enable efficient replication to an offsite disaster recovery system, resulting in reduced bandwidth costs and the deployment of a disaster recovery solution that is affordable and easy to manage.
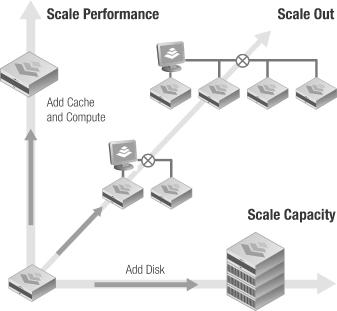
Scalability. Our platform enables efficient and non-disruptive scaling of both performance and capacity, allowing our customers to increase performance or capacity incrementally, which generally eliminates the need for large up-front investments. For increased performance, customers can upgrade controllers for higher throughput and IOPS and upgrade SSDs to accommodate larger amounts of active data. For increased capacity, customers can add additional expansion shelves of HDDs. Our platform can also linearly scale both performance and capacity beyond a single system by combining multiple systems into one centrally-managed scale-out storage cluster. We designed our systems so that these upgrades can be done non-disruptively, generally without taking our systems out of service.
4
Table of Contents
Index to Financial Statements
InfoSight
Our InfoSight platform enables us and our customers to manage and support their storage infrastructure from the cloud.
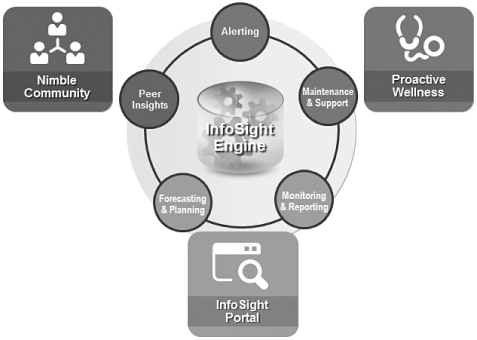
InfoSight is powered by thousands of telemetry sensors that make available over 70 million data points per system per day to our cloud-based InfoSight Engine. Telemetry sensors provide detailed statistics about the health, performance and ongoing operation of our storage systems and their surrounding environments. These sensors allow us and our customers to proactively identify and diagnose potential issues with our systems, often before they impact our customers. The InfoSight Engine applies deep-data analytics to deliver predictive capacity and performance forecasts and systems modeling to us and our customers, improving both our support functions and the storage management experience for our users. We believe the robust, proactive capabilities InfoSight enables differentiate our solution in the marketplace. The InfoSight Portal is a web-based customer portal that provides our customers insights and actionable information that enable them to adhere to storage best practices and to make intelligent decisions about how to evolve their storage environments to support ever-changing workloads. For the second half of the year ended January 31, 2014, the automated Proactive Wellness support capability allowed us to detect approximately 92% of all support issues and automatically resolved approximately 82% of these cases without requiring a single interaction with our customer support team. This level of automation not only improves customer satisfaction but also enhances the efficiency of our support organization.
Products
Our storage systems are optimized for the mainstream IT applications used by enterprises and cloud-based service providers. We offer a variety of systems with a range of capacities and processing power. Our systems provide adaptive performance for high-I/O and high-capacity mainstream business applications and environments, including Exchange, Oracle, SharePoint, SQL Server, VDI and server virtualization. We package our CASL file system software with all of our systems and offer InfoSight as a service to all our customers.
5
Table of Contents
Index to Financial Statements
We shipped our first product line, our CS200 series, in August 2010. In August 2012, we introduced our CS400 series of products and a number of scale-to-fit products, including expansion shelves and controller upgrades. Our CS Series hybrid storage systems incorporate a highly available, redundant controller design.
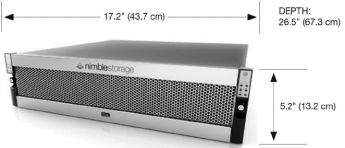
Nimble Storage Array (CS Series)
Our products include:
| ¨ | CS200 Series. Our CS200 Series systems are targeted for midsize IT organizations or distributed sites of larger organizations, supporting workloads such as Microsoft applications, virtual desktop infrastructure, or VDI, or server virtualization. |
| ¨ | CS400 Series. Our CS400 Series systems deliver higher performance and are targeted for larger-scale deployments or I/O-intensive workloads, such as larger-scale VDI or transaction processing supported by Oracle or SQL Server. |
| ¨ | ES-1 Expansion Shelves. Our ES-1 Expansion Shelves deliver cost effective capacity expansion for the CS Series arrays. |
CS Series systems interoperate with a wide range of servers, software applications, operating systems and hypervisors, including those from Cisco, Citrix, Microsoft and VMware. We have also developed a series of pre-validated reference architectures called SmartStack with these industry partners. Our systems also interoperate with leading backup software applications, and in some cases offer deep integration with backup software such as CommVault Simpana.
6
Table of Contents
Index to Financial Statements
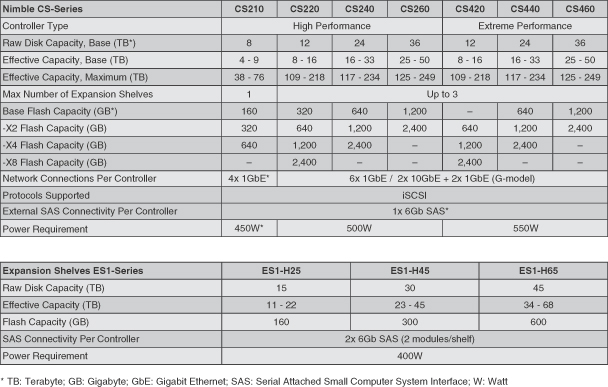
Key technical attributes of our product offerings are outlined in the table:
Customers
We target enterprises and cloud-based service providers globally. Our end-customer base has grown by more than 1,550 end-customers over the past year to over 2,640 globally as of January 31, 2014. We sell to end-customers across multiple verticals, including cloud-based service providers, education, financial services, healthcare, manufacturing, state and local government and technology. We did not have any end-customers that represented more than 10% of our total revenue in the years ended January 31, 2012, 2013 and 2014. In the year ended January 31, 2012, no single distributor or other channel partner accounted for more than 10% of our total revenue. In the year ended January 31, 2013, one of our distributors accounted for more than 10% of our total revenue. During the year ended January 31, 2014, we consolidated the majority of our North American sales to two distributors, one of which accounted for more than 10% of our total revenue in the year ended January 31, 2014.
Customer Service and Support
We combine industry standard product technical support and maintenance with our cloud-based InfoSight and Proactive Wellness support services to deliver an innovative approach to monitoring, diagnostics, support case resolution and capacity planning. We include technical support, maintenance, InfoSight and Proactive Wellness in all purchased support plans.
7
Table of Contents
Index to Financial Statements
Cloud-Based InfoSight and Proactive Wellness. We leverage our cloud-based, multi-tenant support automation and management platform, InfoSight, to transform our customer support function. Through InfoSight and Proactive Wellness, each of our storage systems provides an active monitoring system that automatically detects and notifies us of support problems, enabling us to address customer problems quickly. This cloud-based approach allows our customer support personnel and data scientists to use the gathered telemetry data to predict potential problems, quickly resolve support cases and proactively manage performance and capacity requirements of our customers. We believe the data models developed by our data scientists and our database of telemetry data enable us to provide better support that is more efficient for us and our end-customers. In addition, through InfoSight, we offer the ability for customers to optimize storage capacity and performance on their own. We have found this has the combined effect of improved customer satisfaction, but also increases the productivity of our customer support personnel who can be focused on proactive problem resolution.
Support and Maintenance. We offer industry standard technical support on our products to our end-customers and channel partners. End-customers that purchase a support and services contract receive accelerated shipment of replacement parts, onsite hardware repair and support, and software updates and maintenance releases that become available during the support period. Customer support personnel are available 24 hours per day, seven days per week. In addition, end-customers receive access to our InfoSight and Proactive Wellness support, the InfoSight Portal and our NimbleConnect community. Our support and services contracts are typically offered for periods of one to five years. We offer product support for all of our customers, including those customers who purchase our products through our channel partners. In addition, some of our international channel partners offer primary support. We also subcontract with a third party to provide onsite hardware repair and replacement services for our end-customers.
Customer Community. The support capabilities we offer are complemented by NimbleConnect, an active online community of our users, partners and product experts worldwide. Here they can ask questions, and get answers from other users as well as our employees. They can also share experiences, insights from their own InfoSight results and best practices with our other users.
Sales and Marketing
Sales. Our sales organization is responsible for large-account penetration and overall market development, which includes the management of the relationships with our channel partners, working with our channel partners in winning and supporting end-customers, and acting as the liaison between the end-customers and the marketing and product development organizations. We expect to continue to grow our sales headcount in all markets and expand our presence into countries where we currently do not have sales presence.
Our sales organization is supported by sales engineers with deep technical expertise and responsibility for pre-sales technical support, solutions engineering for our end-customers and technical training for our channel partners.
Channel Program. Our channel partners provide us with a significant amount of new and existing customer opportunities, as well as sell and facilitate the sale of our products to end-customers. We continue to recruit and retain qualified channel partners and train them in our technology and product offerings.
SmartStack. Our SmartStack offerings deliver pre-validated reference architectures that integrate our storage products with leading applications, hypervisors, data protection and server solutions from Cisco, Citrix, CommVault, Microsoft and VMware. In addition, because many of our channel partners are already working with our SmartStack partners, we are better able to accelerate customer adoption.
8
Table of Contents
Index to Financial Statements
Marketing. Our marketing is focused on building our brand reputation and market awareness of our platform, driving end-customer demand and operating our channel program. The marketing team consists primarily of product marketing, programs marketing, field marketing, channel marketing, and public relations functions. Marketing activities include demand generation, advertising, managing our partner portal, trade shows and conferences, press and analyst relations, and customer awareness.
Backlog
Product backlog includes orders confirmed for products scheduled to be shipped generally within two weeks to customers. Because of the generally short cycle between order and shipment and occasional customer changes in delivery schedules, we do believe that our product backlog, as of any particular date, is not necessarily indicative of actual product revenue for any future period. Orders for services for multiple years are billed upfront shortly after receipt of an order and are included in deferred revenue until such time revenue recognition obligations are satisfied. Timing of revenue recognition for services may vary depending on the contractual service period or when the services are rendered.
Manufacturing
In the fourth quarter of the year ended January 31, 2014, we began transitioning our manufacturing activities from two third-party manufacturers to one, Flextronics, to which we outsource the manufacturing, assembly, quality assurance testing and packaging of our hardware products. We transitioned to Flextronics as our sole contract manufacturer to scale our production requirements with a global vendor and increase our operational leverage. Our contract manufacturer generally procures the components used in our products directly from third-party suppliers.
We designed our manufacturing process to minimize the amount of inventory we retain in order to meet customer demand. We place orders with our contract manufacturer on a purchase order basis, based on our end-customers’ requirements and forecasts provided by our channel partners. In general, we engage our contract manufacturer to manufacture products to meet our forecasted demand. Our agreement with our contract manufacturer requires us to provide forecasts for orders. However, we may cancel or reschedule orders, subject to applicable notice periods and fees, and delivery schedules requested by us in these purchase orders vary based upon our particular needs. Our contract manufacturer works closely with us to ensure design for manufacturability and product quality.
Our agreement with Flextronics is an interim agreement, which establishes basic terms while we negotiate a manufacturing services agreement with Flextronics. This agreement is terminable at any time by either party upon written notice and does not provide for any specific volumes of products. Instead, orders are placed on a purchase order basis.
Research and Development
We focus our research and development efforts primarily on improving our existing technology platform, developing new products and enhancing our cloud-based management services. We work closely with our channel partners and end-customers to understand our users’ current and future needs and have designed a product development process that integrates our end-customers’ feedback.
Continued investment in research and development is critical to our business. We have assembled a team of skilled engineers with extensive experience in the fields of data storage, computing, file system architecture, data analytics, enterprise applications, data protection and replication, support automation and sensing and telemetry systems. These individuals have extensive
9
Table of Contents
Index to Financial Statements
prior experience with many leading digital storage companies. We have invested significant time and financial resources in the development of our storage solutions. Most of our research and development activities take place at our corporate headquarters in San Jose, California. We also opened a research and development facility in Raleigh, North Carolina in 2013. We intend to dedicate significant research and development resources to continue to improve the capacity, performance, scalability, reliability, recoverability and other features of our storage solutions and to expand our product and service offerings to address other segments of the enterprise storage market.
Our research and development expenses were $7.9 million, $16.1 million and $35.2 million in the years ended January 31, 2012, 2013 and 2014.
Competition
We operate in the intensely competitive data storage market that is characterized by constant change and innovation. Changes in the application requirements, data center infrastructure and trends, and the broader technology landscape result in evolving customer requirements for capacity, performance, data protection and scalability of storage systems. Our main competitors fall into two categories:
| ¨ | large storage system vendors such as EMC and NetApp that offer a broad range of storage systems targeting varied use cases and end markets; and |
| ¨ | large systems companies such as Dell and HP that have acquired specialist storage vendors in recent years to complement their internally-developed storage offerings and have the technical and financial resources to bring competitive products to the market. |
As our market grows, it will attract more highly specialized vendors as well as larger vendors that may continue to acquire or bundle their products more effectively.
The principal competitive factors in our market include:
| ¨ | potential for broader market acceptance of their storage architectures and solutions; |
| ¨ | greater name recognition and longer operating histories; |
| ¨ | larger sales and marketing and customer support budgets and resources; |
| ¨ | broader distribution and established relationships with distribution partners and end-customers; |
| ¨ | the ability to bundle storage products with other technology products and services to better fit certain customers’ needs; |
| ¨ | greater resources to make acquisitions; |
| ¨ | lower labor and development costs; |
| ¨ | larger and more mature intellectual property portfolios; and |
| ¨ | substantially greater financial, technical, and other resources. |
We believe we generally compete favorably with our competitors on the basis of these factors as a result of our fundamental innovations, CASL and InfoSight, product capabilities including performance and capacity efficiency and integrated data protection, ability to address all mainstream applications from one platform at scale, ease of use, total cost of ownership and differentiated customer support. However, many of our competitors have substantially greater financial, technical and other resources, greater name recognition, larger sales and marketing budgets, broader distribution, and larger and more mature intellectual property portfolios.
10
Table of Contents
Index to Financial Statements
Intellectual Property
Our success depends in part upon our ability to use and protect our core intellectual property. We rely on U.S. federal, state, international and common law rights, as well as contractual restrictions including license agreements, confidentiality procedures, non-disclosure agreements with third parties and employment agreements, to protect and control access to our intellectual property.
In addition to contractual arrangements, we protect our intellectual property rights by relying on a combination of copyrights, trademarks, patents, trade secrets, domain names and trade dress. As of January 31, 2014, we had one issued patent and nine patent applications pending in the United States. Where appropriate, we pursue the registration of trademarks, domain names and service marks in the United States, the European Union and in other jurisdictions.
Employees
As of January 31, 2014, we had 592 employees worldwide, including 311 in sales and marketing, 18 in operations, 172 in research and development, 41 in support and 50 in general and administrative roles. Other than our employees in France, none of our employees is represented by a labor union with respect to his or her employment. We have not experienced any work stoppages.
Information about Segment and Geographic Revenue
Information about segment and geographic revenue is set forth in the section entitled “Management’s Discussion and Analysis of Financial Condition and Results of Operations” and Notes 2 and 12 of our Notes to Consolidated Financial Statements included in Part II, Item 8, “Financial Statements and Supplementary Data” of this Annual Report on Form 10-K.
Corporate Information
We were incorporated in Delaware in November 2007 as Nimble Storage, Inc. We completed our initial public offering in December 2013 and our common stock is listed on the New York Stock Exchange under the symbol “NMBL.” Our principal executive offices are located at 211 River Oaks Parkway, San Jose, California 95134, and our telephone number is (408) 432-9600.
We have registered the trademark Nimble Storage in the United States, the European Union, Australia, Canada, Japan and Taiwan and we have pending trademark applications for the trademark Nimble Storage in other jurisdictions. We have registered the trademark CASL in the United States and the European Union. We have registered the trademark InfoSight in the European Union and we have a pending trademark application for the trademark InfoSight in the United States. We also have a pending trademark application for the trademark NimbleConnect in the United States, the European Union and other jurisdictions. The “Nimble Storage” logo, SmartStack and certain product names contained in this Annual Report on Form 10-K are our common law trademarks. This report contains additional trade names, trademarks and service marks of other companies that are the property of their respective owners. We do not intend our use or display of other companies’ trade names, trademarks or service marks to imply a relationship with, or endorsement or sponsorship of us by, these other companies.
Available Information
Our website address is www.nimblestorage.com. Our Annual Report on Form 10-K, Quarterly Reports on Form 10-Q, Current Reports on Form 8-K, reports filed pursuant to Section 16 under the Securities Exchange Act of 1934, as amended, or the Exchange Act, proxy and information statements
11
Table of Contents
Index to Financial Statements
and amendments to items filed pursuant to Sections 13(a), 14, 15(d) and 16 of the Exchange Act are filed with the U.S. Securities and Exchange Commission, or the SEC. We are subject to the informational requirements of the Exchange Act and file or furnish reports, proxy statements and other information with the SEC. Such documents and other information filed by the Company with the SEC are available free of charge on our website at www.investors.nimblestorage.com when such reports are available on the SEC’s website.
The public may read and copy any materials filed by Nimble Storage with the SEC at the SEC’s Public Reference Room at 100 F Street, NE, Room 1580, Washington, DC 20549. The public may obtain information on the operation of the Public Reference Room by calling the SEC at 1-800-SEC-0330. The SEC maintains an Internet site that contains reports, proxy and information statements and other information regarding issuers that file electronically with the SEC at www.sec.gov.
The contents of the websites referred to above are not incorporated into this report. Further, our references to the URLs for these websites are intended to be inactive textual references only.
12
Table of Contents
Index to Financial Statements
Investing in our common stock involves a high degree of risk. You should carefully consider the risks and uncertainties described below, together with all of the other information in this report, including our consolidated financial statements and related notes, before investing in our common stock. The risks and uncertainties described below are not the only ones we face. Additional risks and uncertainties that we are unaware of, or that we currently believe are not material, may also become important factors that affect us. If any of the following risks occur, our business, operating results and prospects could be materially harmed. In that event, the price of our common stock could decline, and you could lose part or all of your investment.
Risks Related to Our Business and Our Industry
We have a history of losses, anticipate increasing our operating expenses in the future, and may not be able to achieve or maintain profitability. If we cannot become profitable or maintain our profitability in the future, our business and operating results may suffer.
We have incurred net losses in all fiscal years since our inception, including net losses of $16.8 million, $27.9 million and $43.1 million in the years ended January 31, 2012, 2013 and 2014. As of January 31, 2014, we had an accumulated deficit of $101.1 million. We anticipate that our operating expenses will increase in the foreseeable future as we continue to develop our technology, enhance our product and service offerings, expand our sales channels, expand our operations and hire additional employees. These efforts may prove more expensive than we currently anticipate, and we may not succeed in increasing our revenue sufficiently, or at all, to offset these higher expenses. In future periods, our profitability could be adversely affected for a number of possible reasons, including slowing demand for our products or services, increasing competition, a decrease in the growth of our overall market or general economic conditions. If we are unable to meet these risks and challenges as we encounter them, our business and operating results may suffer.
Our limited operating history makes it difficult to evaluate our current business and future prospects.
We were incorporated in November 2007 and shipped our first products in August 2010. The majority of our revenue growth has occurred in the years ended January 31, 2012 and later. Our limited operating history makes it difficult to evaluate our current business and our future prospects, including our ability to plan for and model future growth. We have encountered and will continue to encounter risks and difficulties frequently experienced by rapidly growing companies in constantly evolving industries, including the risks described in this report. If we do not address these risks successfully, our business and operating results will be adversely affected, and our stock price could decline. Further, we have limited historical financial data. As such, any predictions about our future revenue and expenses may not be as accurate as they would be if we had a longer operating history or operated in a more predictable market.
If the market for storage products does not grow as we anticipate, our revenue may not grow and our operating results would be harmed.
We are vulnerable to fluctuations in overall demand for storage products. Our business plan assumes that the demand for storage products will increase as organizations collect, process and store an increasing amount of data. However, if storage markets experience downturns or grow more slowly than anticipated, or if demand for our products does not grow as quickly as we anticipate, whether as a result of competition, product obsolescence, budgetary constraints of our end-customers, technological changes, unfavorable economic conditions, uncertain geopolitical environments or other factors, we may not be able to increase our revenue sufficiently to ever achieve profitability and our stock price would decline.
13
Table of Contents
Index to Financial Statements
Our revenue growth rate in recent periods may not be indicative of our future performance.
You should not consider our revenue growth rate in recent periods as indicative of our future performance. While we have recently experienced significant revenue growth rates in the years ended January 31, 2012, 2013 and 2014, we may not achieve similar revenue growth rates in future periods. You should not rely on our revenue growth rates for any prior periods as any indication of our future revenue or revenue growth rates.
Our quarterly operating results may fluctuate significantly, which could cause the trading price of our common stock to decline.
Our operating results have historically fluctuated and may continue to fluctuate from quarter to quarter, and we expect that this trend will continue as a result of a number of factors, many of which are outside of our control and may be difficult to predict, including:
| ¨ | the budgeting cycles and purchasing practices of end-customers; |
| ¨ | our ability to attract and retain new channel partners and end-customers; |
| ¨ | our ability to sell additional products to existing channel partners and end-customers; |
| ¨ | changes in end-customer requirements or market needs and our inability to make corresponding changes to our business; |
| ¨ | any potential disruption in our sales channels or termination of our relationship with important channel partners; |
| ¨ | potential seasonality in the markets we serve; |
| ¨ | the timing and success of new product and service introductions by us or our competitors or any other change in the competitive landscape, including consolidation among our competitors or end-customers; |
| ¨ | deferral of orders in anticipation of new products or product enhancements announced by us or our competitors; |
| ¨ | our inability to provide adequate support to our end-customers; |
| ¨ | our ability to control the costs of manufacturing our products, including the cost of components; |
| ¨ | our inability to fulfill our customers’ orders due to supply chain delays or events that impact our manufacturers or their suppliers; |
| ¨ | our inability to adjust certain fixed costs and expenses, particularly in research and development, for changes in demand; |
| ¨ | price competition; |
| ¨ | the timing of certain payments and related expenses, such as sales commissions; |
| ¨ | increases or decreases in our revenue and expenses caused by fluctuations in foreign currency exchange rates, as an increasing portion of our revenue is collected and expenses are incurred and paid in currencies other than the U.S. dollar; |
| ¨ | general economic conditions, both domestically and in our foreign markets; |
| ¨ | the cost of and potential outcomes of existing and future claims or litigation, which could have a material adverse effect on our business; |
| ¨ | future accounting pronouncements and changes in our accounting policies; and |
| ¨ | changes in tax laws or tax regulations. |
Any one of the factors above or the cumulative effect of some of the factors referred to above may result in significant fluctuations in our operating results. In particular, because we have historically received a substantial portion of sales orders during the last few weeks of each fiscal quarter, we are particularly vulnerable to any delay in order fulfillment, failure to close anticipated orders or any other
14
Table of Contents
Index to Financial Statements
problems encountered during the last few weeks of each fiscal quarter. This variability and unpredictability could result in our failure to meet our revenue or other operating result expectations or those of investors for a particular period. The failure to meet or exceed such expectations could have a material adverse effect on our business, results of operations and financial condition that could ultimately adversely affect our stock price.
We have limited visibility into future sales, which makes it difficult to forecast our future operating results.
Because of our limited visibility into end-customer demand, our ability to accurately forecast our future revenue is limited. We sell our products primarily through our network of channel partners that accounted for 82%, 89% and 92% of our total revenue in the years ended January 31, 2012, 2013 and 2014. We place orders with our third-party manufacturer based on our forecasts of our end-customers’ requirements and forecasts provided by our channel partners. These forecasts are based on multiple assumptions, each of which might cause our estimates to be inaccurate, affecting our ability to provide products to our end-customers. When demand for our products increases significantly, we may not be able to meet it on a timely basis, and we may need to expend a significant amount of time working with our customers to allocate limited supply and maintain positive customer relations, or we may incur additional costs to accelerate the manufacture and delivery of additional products. If we or our channel partners underestimate end-customer demand, we may forego revenue opportunities, lose market share and damage our end-customer relationships. Conversely, if we overestimate demand for our products and consequently purchase significant amounts of components or hold inventory, we could incur additional costs and potentially incur related charges, which could adversely affect our operating results.
Adverse economic conditions or reduced IT spending may adversely impact our business.
Our business depends on the overall demand for IT and on the economic health of our current and prospective customers. In general, worldwide economic conditions remain unstable, and these conditions make it difficult for our current and prospective customers and us to forecast and plan future business activities accurately, and they could cause our customers or prospective customers to reevaluate their decision to purchase our products. Weak global economic conditions, or a reduction in IT spending even if economic conditions improve, could adversely impact our business and operating results in a number of ways, including longer sales cycles, lower prices for our products, reduced bookings and lower or no growth.
We are dependent on a small number of product lines, and the lack of continued market acceptance of these product lines, particularly our CS Series of storage products, would result in lower revenue.
Our CS Series of storage products, or CS products, account for a majority of our total revenue and we anticipate that these products will continue to do so for the foreseeable future. As a result, our revenue could be reduced as a result of:
| ¨ | any decline in demand for these products; |
| ¨ | the introduction of products and technologies by us or our competitors that serve as a replacement or substitute for, or represent an improvement over, our CS products; |
| ¨ | technological innovations or new communications standards that our CS products do not address; |
| ¨ | our failure or inability to predict changes in our industry or end-customers’ demands or to design products or enhancements that meet end-customers’ increasing demands; and |
| ¨ | our inability to release enhanced versions of our CS products or new product lines on a timely basis. |
15
Table of Contents
Index to Financial Statements
Our products handle mission-critical data for our end-customers and are highly technical in nature. If our products have defects, failures occur or end-customer data is lost or corrupted, our reputation and business could be harmed.
Our products are highly technical and complex and are involved in storing and replicating mission-critical data for our end-customers. Our products may contain undetected defects and failures when they are first introduced or as new versions are released. We have in the past and may in the future discover software errors in new versions of our existing products, new products or product enhancements after their release or introduction, which could result in lost revenue. Despite testing by us and by current and potential end-customers, errors might not be found in new releases or products until after commencement of commercial shipments, resulting in loss of or delay in market acceptance. Our products may have security vulnerabilities and be subject to intentional attacks by viruses that seek to take advantage of these bugs, errors or other weaknesses. If defects or failures occur in our products, a number of negative effects in our business could result, including:
| ¨ | lost revenue or lost end-customers; |
| ¨ | increased costs, including warranty expense and costs associated with end-customer support; |
| ¨ | delays, cancellations, reductions or rescheduling of orders or shipments; |
| ¨ | product returns or discounts; |
| ¨ | diversion of management resources; |
| ¨ | legal claims for breach of contract, product liability, tort or breach of warranty; and |
| ¨ | damage to our reputation and brand. |
Because our end-customers use our products to manage and protect their data, we could face claims resulting from any loss or corruption of our end-customers’ data due to a product defect. While our sales contracts contain provisions relating to warranty disclaimers and liability limitations, these provisions might not be upheld. Defending a lawsuit, regardless of its merit, is costly and may divert management’s attention and could result in public perception that our products are not effective, even if the occurrence is unrelated to the use of our products. In addition, our business liability insurance coverage might not be adequate to cover such claims. If any data is lost or corrupted in connection with the use or support of our products, our reputation could be harmed and market acceptance of our products could suffer.
We rely on third-party channel partners to sell substantially all of our products, and if our partners fail to perform, our ability to sell and distribute our products and services will be limited, and our operating results will be harmed.
We depend on value added resellers, or VARs, and distributors to sell our products. Our contracts with channel partners typically have a term of one year and are terminable without cause upon written notice to the other party. Our channel partner agreements do not prohibit them from offering competitive products or services and do not contain any purchase commitments. Many of our channel partners also sell our competitors’ products. If our channel partners give higher priority to our competitors’ storage products, we may be unable to grow our revenue and our net loss could increase. Further, in order to develop and expand our channels, we must continue to scale and improve our processes and procedures that support our channel partners, including investments in systems and training, and those processes and procedures may become increasingly complex and difficult to manage. If we fail to maintain existing channel partners or develop relationships with new channel partners, our revenue opportunities will be reduced.
16
Table of Contents
Index to Financial Statements
We receive a substantial portion of our total revenue from a limited number of channel partners, including VARs and distributors, and the loss of, or a significant reduction in, orders from one or more of our major channel partners would harm our business.
We receive a substantial portion of our total revenue from a limited number of channel partners, including VARs and distributors. For the years ended January 31, 2012, 2013 and 2014 our top ten channel partners accounted for 43%, 37% and 47% of our total revenue. During the third quarter of the year ended January 31, 2014, we transitioned order fulfillment in North America to two distributors. The majority of our existing VARs now contract directly with one or both of these two distributors. The larger of the two distributors is Avnet, Inc., which accounted for more than 10% of our revenue for the year ended January 31, 2014. Advanced Media Services is our other major distributor. It accounted for more than 10% of our revenue in the year ended January 31, 2013, but less than 10% of our revenue for the year ended January 31, 2014. We anticipate that we will continue to depend upon a limited number of channel partners for a substantial portion of our total revenue for the foreseeable future and, in some cases, the portion of our revenue attributable to individual channel partners may increase in the future. The loss of one or more key channel partners or a reduction in sales through any major channel partner would reduce our revenue.
We face intense competition in our market, especially from larger, well-established companies, and we may lack sufficient financial or other resources to maintain or improve our competitive position.
A number of very large corporations have historically dominated the storage market. We consider our primary competitors to be companies that provide enterprise storage products, including Dell, Inc., EMC Corporation, Hewlett-Packard Company and NetApp, Inc. We also compete to a lesser extent with a number of other smaller companies and certain well-established companies. Some of our competitors have made acquisitions of businesses that allow them to offer more directly competitive and comprehensive solutions than they had previously offered. We expect to encounter new competitors domestically and internationally as other companies enter our market or if we enter new markets.
Many of our existing competitors have, and some of our potential competitors could have, substantial competitive advantages such as:
| ¨ | potential for broader market acceptance of their storage architectures and solutions; |
| ¨ | greater name recognition and longer operating histories; |
| ¨ | larger sales and marketing and customer support budgets and resources; |
| ¨ | broader distribution and established relationships with distribution partners and end-customers; |
| ¨ | the ability to bundle storage products with other technology products and services to better fit certain customers’ needs; |
| ¨ | lower labor and development costs; |
| ¨ | larger and more mature intellectual property portfolios; |
| ¨ | substantially greater financial, technical and other resources; and |
| ¨ | greater resources to make acquisitions. |
We rely on a limited number of suppliers, and in some cases single-source suppliers, and any disruption or termination of these supply arrangements, failure to successfully manage our relationships with our key suppliers or component quality problems could delay shipments of our products and damage our channel partner or end-customer relationships.
We rely on a limited number of suppliers, and in some cases single-source suppliers, for several key components of our products. We generally purchase components on a purchase order basis and
17
Table of Contents
Index to Financial Statements
do not have long-term supply contracts with our suppliers. Our reliance on key suppliers reduces our control over the manufacturing process and exposes us to risks, including reduced control over product quality, production costs, timely delivery and capacity. It also exposes us to the potential inability to obtain an adequate supply of required components because we do not have long-term supply commitments. In particular, replacing the single-source suppliers of our solid state drives and chassis would require a product re-design that could take months to implement.
We generally maintain minimal inventory for repairs, evaluation and demonstration units and acquire components only as needed. We do not enter into long-term supply contracts for these components. As a result, our ability to respond to channel partner or end-customer orders efficiently may be constrained by the then-current availability, terms and pricing of these components. Our industry has experienced component shortages and delivery delays in the past, and we may experience shortages or delays of critical components in the future as a result of strong demand in the industry or other factors. If we or our suppliers inaccurately forecast demand for our products or we ineffectively manage our enterprise resource planning processes, our suppliers may have inadequate inventory, which could increase the prices we must pay for substitute components or result in our inability to meet demand for our products, as well as damage our channel partner or end-customer relationships.
Component quality is particularly important with respect to disk drives. We have in the past and may in the future experience disk drive failures, which could cause our reputation to suffer, our competitive position to be impaired and our end-customers to select other vendors. To meet our product performance requirements, we must obtain disk drives of extremely high quality and capacity. In addition, there are periodic supply-and-demand issues for disk drives and flash memory that could result in component shortages, selective supply allocations and increased prices of such components. We may not be able to obtain our full requirements of components, including disk drives, that we need for our storage products or the prices of such components may increase.
If we fail to effectively manage our relationships with our key suppliers, or if our key suppliers increase prices of components, experience delays, disruptions, capacity constraints, quality control problems in their manufacturing operations or adverse changes to their financial condition, our ability to ship products to our channel partners or end-customers could be impaired and our competitive position and reputation could be adversely affected. Qualifying a new key supplier is expensive and time-consuming. If we are required to change key suppliers or assume internal manufacturing operations, we may lose revenue and damage our channel partner or end-customer relationships.
Because we depend on a single third-party manufacturer to build our products, we are susceptible to manufacturing delays and pricing fluctuations that could prevent us from shipping orders on time, if at all, or on a cost-effective basis, which would cause our business to suffer.
In the fourth quarter of the year ended January 31, 2014, we began transitioning our manufacturing activities from two third-party manufactures to one, Flextronics. Our reliance on this third-party manufacturer reduces our control over the manufacturing process and exposes us to risks, including reduced control over quality assurance, product costs and product supply and timing. Any manufacturing disruption by Flextronics could severely impair our ability to fulfill orders. Generally, our orders represent a relatively small percentage of the overall orders received by Flextronics from its customers; therefore, fulfilling our orders may not be a priority in the event Flextronics is constrained in its ability to fulfill all of its customer obligations. If we are unable to manage our relationship with Flextronics effectively, or if Flextronics suffers delays or disruptions for any reason, experiences increased manufacturing lead-times, capacity constraints or quality control problems in its manufacturing operations, or fails to meet our future requirements for timely delivery, our ability to ship products to our end-customers would be impaired, and our business and operating results would be harmed.
18
Table of Contents
Index to Financial Statements
We rely on a single manufacturer and any disruption or termination of our manufacturing arrangements could delay shipments of our products and harm our business.
Our current agreement with Flextronics does not contain any minimum commitment to manufacture our products, and is terminable at will or upon short notice by Flextronics. Furthermore, any orders are fulfilled only after a purchase order has been delivered and accepted. As a result, Flextronics may stop taking new orders or fulfilling our orders on short notice or limiting our allocations of products. If this were to occur, we would need to find alternative vendors and we could experience delays in shipping orders, which could harm our business.
Our business and operations have experienced rapid growth in recent periods. If we do not effectively manage any future growth or are unable to improve our systems and processes, our operating results could be harmed.
We have experienced rapid growth over the last few years. Our employee headcount and number of end-customers have increased significantly, and we expect to continue to grow our headcount significantly over the next 12 months. For example, from January 31, 2011 to January 31, 2014, our headcount increased from 47 to 592 employees. Since we initially launched our products in August 2010, our number of end-customers grew to over 2,640 as of January 31, 2014. The growth and expansion of our business and product and service offerings places a continuous significant strain on our management, operational and financial resources.
To manage any future growth effectively, we must continue to improve and expand our information technology, or IT, and financial infrastructure, our operating and administrative systems and controls, our enterprise resource planning systems and processes and our ability to manage headcount, capital and processes in an efficient manner. In addition, our systems and processes may not prevent or detect all errors, omissions, or fraud. Our failure to improve our systems and processes, or their failure to operate in the intended manner, may result in our inability to manage the growth of our business and to accurately forecast our revenue and expenses, or to prevent losses. Our productivity and the quality of our products and services may also be adversely affected if we do not integrate and train our new employees quickly and effectively. Failure to manage any future growth effectively could result in increased costs, negatively impact our end-customers’ satisfaction and harm our operating results.
Our ability to sell our products is dependent on the quality of our technical support services, and our failure to offer high quality technical support services could have a material adverse effect on our sales, operating results and end-customers’ satisfaction with our products and services.
Once our products are deployed within our end-customers’ networks, our end-customers depend on our technical support services to resolve any issues relating to our products. We may be unable to respond quickly enough to accommodate short-term increases in end-customer demand for support services. We also may be unable to modify the format of our support services to compete with changes in support services provided by competitors. Increased end-customer demand for these services, without corresponding revenue, could increase costs and adversely affect our operating results. Any failure by us to effectively help our end-customers quickly resolve post-deployment issues or provide high-quality technical support, or a market perception that we do not maintain high-quality support, could harm our reputation and adversely affect our ability to sell our solutions to existing and prospective customers.
If we do not successfully anticipate market needs and develop products and product enhancements that meet those needs, or if those products do not gain market acceptance, our business will suffer.
The storage market is characterized by rapidly evolving technology, customer needs and industry standards. We might not be able to anticipate future market needs or changes in existing technologies,
19
Table of Contents
Index to Financial Statements
and we might not be able to develop new products or product enhancements to meet such needs, either in a timely manner or at all. For example, if changes in technology result in a significant reduction in the price for flash memory, enterprises may not need to utilize flash-optimized storage in order to cost effectively protect their data. Also, one or more new technologies could be introduced that compete favorably with our storage products or that cause our storage products to no longer be of significant benefit to our end-customers.
The process of developing new technology is complex and uncertain, and we may not be able to develop our products in a manner that enables us to successfully address the changing needs of our end-customers. We must commit significant resources to developing new products and product enhancements before knowing whether our investments will result in products the market will accept. Additionally, we may not achieve the cost savings or the anticipated performance improvements we expect, and we may take longer to generate revenue, or generate less revenue, than we anticipate. If we are not able to successfully identify new product opportunities, develop and bring new products to market in a timely manner, or achieve market acceptance of our products, our business and operating results will be harmed.
Our future growth plan depends in part on expanding outside of the United States, and we are therefore subject to a number of risks associated with international sales and operations.
As part of our growth plan, we intend to expand our operations globally. We have a limited history of marketing, selling and supporting our products and services internationally. International sales and operations are subject to a number of risks, including the following:
| ¨ | greater difficulty in enforcing contracts and accounts receivable collection and longer collection periods; |
| ¨ | increased expenses incurred in establishing and maintaining office space and equipment for our international operations; |
| ¨ | fluctuations in exchange rates between the U.S. dollar and foreign currencies in markets where we do business; |
| ¨ | management communication and integration problems resulting from cultural and geographic dispersion; |
| ¨ | difficulties in attracting and retaining personnel with experience in international operations; |
| ¨ | risks associated with trade restrictions and foreign legal requirements, including the importation, certification and localization of our products required in foreign countries; |
| ¨ | greater risk of unexpected changes in regulatory practices, tariffs, and tax laws and treaties; |
| ¨ | the uncertainty of protection for intellectual property rights in some countries; |
| ¨ | greater risk of a failure of foreign employees to comply with both U.S. and foreign laws, including antitrust regulations, the U.S. Foreign Corrupt Practices Act and any trade regulations ensuring fair trade practices; and |
| ¨ | general economic and political conditions in these foreign markets. |
These factors and other factors could harm our ability to gain future international revenue and, consequently, materially impact our business and operating results. The expansion of our existing international operations and entry into additional international markets will require significant management attention and financial resources. Our failure to successfully manage our international operations and the associated risks effectively could limit the future growth of our business.
20
Table of Contents
Index to Financial Statements
If we are not successful in executing our strategy to increase sales of our products to larger enterprise end-customers, our operating results may suffer.
Our growth strategy is dependent, in part, upon increasing sales of our products to larger enterprises. Sales to these types of end-customers involve risks that may not be present or that are present to a lesser extent with sales to smaller entities. These risks include:
| ¨ | competition from larger competitors that traditionally target larger enterprises that may have pre-existing relationships or purchase commitments from those end-customers; |
| ¨ | increased purchasing power and leverage held by large end-customers in negotiating contractual arrangements; |
| ¨ | more stringent support requirements; and |
| ¨ | longer sales cycles and the associated risk that substantial time and resources may be spent on potential end-customers that elect not to purchase our products. |
Large enterprises often undertake a significant evaluation process that results in a lengthy sales cycle. Although we have a channel sales model, our sales representatives may invest substantial time and resources in engaging with sales to larger end-customers. We may spend this time and resources without being successful in generating any sales. In addition, product purchases by large enterprises are frequently subject to budget constraints, multiple approvals, and unplanned administrative, processing and other delays. Finally, large enterprises typically have longer implementation cycles, require greater product functionality and scalability and a broader range of services, demand that vendors take on a larger share of risks, sometimes require acceptance provisions that can potentially lead to a delay in revenue recognition, and expect greater payment flexibility from vendors. All of these factors can add risk to business conducted with these end-customers. If we fail to realize an expected sale from a large end-customer in a particular quarter or at all, our business, operating results and financial condition could be adversely affected.
We are in the process of evolving our distribution model, which may harm our future operating results.
We are in the process of evolving our distribution model from contracting directly with hundreds of individual VARs to contracting with fewer larger global distributors. Although we believe that this transition will make our sales channels more efficient and broader reaching, there is no guarantee that this new distribution model will increase our sales in the short term or allow us to sustain our gross margins. Any potential delays or confusion during the transition process with our new partners may negatively affect our relationship with our existing end-customers and channel partners. Our failure to successfully implement this new distribution model could adversely affect our operating results.
Our sales cycle is unpredictable, which makes it difficult to predict our results even in the near term.
A substantial portion of our quarterly sales typically occurs during the last month of the quarter, which we believe largely reflects sales cycles of storage products and other products in the technology industry generally. We have little visibility at the start of any quarter as to which existing end-customers, if any, will make additional purchases and when any additional purchases may occur, if at all.
Currently, our average sales cycle is approximately three months. However, potential end-customers may undertake a longer evaluation process that has, in the past, resulted in a longer sales cycle. In addition, our sales cycle may be extended if potential end-customers decide to re-evaluate other aspects of their storage infrastructure at the same time they are considering a purchase of our products. As a result, our quarterly operating results are difficult to predict even in the near term.
21
Table of Contents
Index to Financial Statements
Our growth depends in part on the success of our strategic relationships with third parties.
Our future growth will depend on our ability to enter into successful strategic relationships with third parties. For example, our SmartStack initiative involves working with third parties, including Cisco, Citrix, Microsoft, Oracle and VMware to create a broader integrated technology solution to address our end-customers’ needs. In addition, we work with global distributors to streamline and grow our sales channel. These relationships may not result in additional customers or enable us to generate significant revenue. These relationships are typically non-exclusive and do not prohibit the other party from working with our competitors or from offering competing services. If we are unsuccessful in establishing or maintaining our relationships with these third parties, our ability to compete in the marketplace or to grow our revenue could be impaired and our operating results could suffer.
Interruptions to and failures of our IT infrastructure could disrupt our operations and services.
We depend on our IT infrastructure, which includes our data centers and networks, to operate our business and to provide services to our end-customers through our InfoSight platform. This infrastructure, including our back-up systems, resides in two locations. We do not currently have a disaster recovery policy. Any interruptions to or failures of our IT infrastructure, whether due to natural disasters, system failures, computer viruses, security breaches, computer hacking attacks or other causes, whether through third party action or employee error or malfeasance, would affect our ability to operate our business and provide services through our InfoSight platform. As a result, we could face liability with respect to any diminished performance of our InfoSight platform or support services generally during the periods when our IT infrastructure is compromised and any subsequent periods required to repair such interruptions or failures. Moreover, we would likely suffer reputational damage, and our ability to sell our solutions to existing and prospective customers could be harmed.
The inability of our products to interoperate with leading business software applications, hypervisors and data management tools would cause our business to suffer.
Our products are also designed to interoperate with virtualization solutions in the market. Virtual environment solutions require a fast and flexible network storage foundation. If our products are not compatible with leading business software applications, hypervisors and data management tools, demand for our products will decline. We must devote significant resources to enhancing our products to continue to interoperate with these software applications, hypervisors and data management tools. Any current or future providers of software applications, hypervisors or data management tools could make future changes that would diminish the ability of our products to interoperate with them, and we might need to spend significant additional time and effort to ensure the continued compatibility of our products, which might not be possible at all. Any of these developments could harm our business.
If our products do not interoperate with our end-customers’ infrastructure, sales of our products could be negatively affected, which would harm our business.
Our products must interoperate with our end-customers’ existing infrastructure, which often have different specifications, utilize multiple protocol standards, deploy products from multiple vendors, and contain multiple generations of products that have been added over time. As a result, when problems occur in a network, it may be difficult to identify the sources of these problems. If we find errors in the existing software or defects in the hardware used in our end-customers’ infrastructure or problematic network configurations or settings, we may have to modify our software or hardware so that our products will interoperate with our end-customers’ infrastructure. In such cases, our products may be unable to provide significant performance improvements for applications deployed in our end-customers’ infrastructure. In addition, government and other end-customers may require our products to comply with certain security or other certifications and standards. If our products are late in achieving or fail to achieve compliance with these certifications and standards, or our competitors achieve compliance with these certifications and standards, we may be disqualified from, or disadvantaged in, selling our products to such end-customers, which could harm our business and operating results.
22
Table of Contents
Index to Financial Statements
If our industry experiences extraordinary declines in average sales prices, our revenue and gross profit may also decline.
The data storage products industry is highly competitive and has historically been characterized by declines in average sales prices. It is possible that the market for our storage products could experience similar trends in equal or greater degree than the rest of the industry. Our average sales prices could decline due to pricing pressure caused by several factors, including competition, the introduction of competing technologies, overcapacity in the worldwide supply of flash memory or disk drive components, increased manufacturing efficiencies, implementation of new manufacturing processes and expansion of manufacturing capacity by component suppliers. If we are required to decrease our prices to be competitive and are not able to offset this decrease by increases in the volume of sales or the sales of new products with higher margins, our gross margins and operating results could be adversely affected.
Governmental regulations affecting the export of certain of our solutions could negatively affect our business.
Our products, technology and software are subject to U.S. export controls and economic sanctions, and we incorporate encryption technology into certain of our products. These encryption products and the underlying technology may be exported outside the United States only with the required export authorizations, including by license, a license exception or other appropriate government authorizations, including the filing of an encryption registration. Furthermore, U.S. export control laws and economic sanctions prohibit the shipment of certain products to U.S. embargoed or sanctioned countries, governments and persons and for certain end-uses. Governmental regulation of encryption technology and regulation of imports or exports, or our failure, or inability due to governmental action or inaction, to obtain required import or export approval for our products could harm our international sales and adversely affect our revenue. Obtaining the necessary export license or other authorization for a particular sale may be time-consuming and may result in the delay or loss of sales opportunities even if the export license ultimately may be granted. Even though we take precautions to ensure that our channel partners comply with all relevant regulations, any failure by our channel partners to comply with such regulations could have negative consequences, including reputational harm, government investigations and penalties.
In 2013, we determined that we may have shipped a particular hardware appliance product to a limited number of international customers that, prior to shipment, may have required us to first obtain an encryption registration number prior to shipment and to submit annual reports to the U.S. Commerce Department’s Bureau of Industry and Security, or BIS. In May 2013, we submitted a voluntary self-disclosure to the Office of Export Enforcement, or OEE, to report our failure to make the required submissions and the resulting unauthorized exports as a potential violation. We also filed a request for authorization to service items previously exported without the required authorization. Failure to comply with export regulations and these recent voluntary submissions could result in penalties, costs, and restrictions on export privileges, which could also harm our operating results, as well as our inability to service certain products already in the hands of our end-customers, which could have negative consequences, including reputational harm. BIS has granted the service authorization and closed the enforcement matter by issuing us a warning letter, rather than assessing a civil penalty.
A portion of our revenue is generated by sales to government entities, which are subject to a number of challenges and risks.
We may in the future increase sales to government entities. Selling to government entities can be highly competitive, expensive and time consuming, often requiring significant upfront time and expense without any assurance that these efforts will result in a sale. Government certification requirements for products like ours may change and in doing so restrict our ability to sell into certain government sectors until we have attained the revised certification. Government demand and payment for our products and
23
Table of Contents
Index to Financial Statements
services may be impacted by public sector budgetary cycles and funding authorizations, with funding reductions or delays adversely affecting public sector demand for our products and services. Government entities may have statutory, contractual or other legal rights to terminate contracts with our channel partners for convenience or due to a default, and any such termination may adversely impact our future operating results. Government entities may require contract terms that differ from standard arrangements and may impose compliance requirements that are complicated, require preferential pricing or “most favored nation” terms and conditions, or are otherwise time consuming and expensive to satisfy. Government entities routinely investigate and audit government contractors’ administrative processes, and any unfavorable audit could result in the government entity refusing to continue buying our products and services, a reduction of revenue, fines or civil or criminal liability if the audit uncovers improper or illegal activities, which could adversely impact our operating results.
We may be subject to claims that our employees have wrongfully disclosed or we have wrongfully used proprietary information of our employees’ former employers. These claims may be costly to defend and if we do not successfully do so, our business could be harmed.
Many of our employees were previously employed at current or potential competitors. We may be subject to claims that these employees have divulged or we have used proprietary information of these employees’ former employers. For example, on October 29, 2013, NetApp, Inc. filed a lawsuit against us alleging that we and certain of our employees violated NetApp’s proprietary rights, as more fully described in the section titled “Legal Proceedings.” Litigation may be necessary to defend against these claims. If we fail in defending such claims, in addition to paying monetary damages, we may lose valuable intellectual property rights or personnel. A loss of key research personnel or their work product could hamper our ability to develop new products and features for existing products, which could severely harm our business. Even if we are successful in defending against these claims, litigation could result in substantial costs and be a distraction to management.
Our proprietary rights may be difficult to enforce or protect, which could enable others to copy or use aspects of our products without compensating us.
We rely and expect to continue to rely on a combination of confidentiality agreements, as well as trademark, copyright, patent and trade secret protection laws, to protect our proprietary rights with our employees, consultants and third parties with whom we have relationships. We have filed various applications for certain aspects of our intellectual property. Valid patents may not issue from our pending applications, and the claims eventually allowed on any patents may not be sufficiently broad to protect our technology or products. Any issued patents may be challenged, invalidated or circumvented, and any rights granted under these patents may not actually provide adequate defensive protection or competitive advantages to us. Additionally, the process of obtaining patent protection is expensive and time-consuming, and we may not be able to prosecute all necessary or desirable patent applications at a reasonable cost or in a timely manner.
Despite our efforts to protect our proprietary rights, unauthorized parties may attempt to copy aspects of our products or obtain and use information that we regard as proprietary. We generally enter into confidentiality or license agreements with our employees, consultants, vendors and customers, and generally limit access to and distribution of our proprietary information. However, we cannot assure you that the agreements we have entered into will not be breached. In addition, the laws of some foreign countries do not protect our proprietary rights to as great an extent as the laws of the United States, and many foreign countries do not enforce these laws as diligently as government agencies and private parties in the United States.
From time to time, we may need to take legal action to enforce our patents and other intellectual property rights, to protect our trade secrets, to determine the validity and scope of the proprietary rights of others or to defend against claims of infringement or invalidity. Such litigation could result in
24
Table of Contents
Index to Financial Statements
substantial costs and diversion of resources and could negatively affect our business and operating results. Attempts to enforce our rights against third parties could also provoke these third parties to assert their own intellectual property or other rights against us, or result in a holding that invalidates or narrows the scope of our rights, in whole or in part. Any of these events would have a material adverse effect on our business and operating results.
Claims by others that we infringe their proprietary technology or other rights could harm our business.
Companies in the storage industry own large numbers of patents, copyrights, trademarks, domain names and trade secrets, and frequently enter into litigation based on allegations of infringement, misappropriation or other violations of intellectual property or other rights. Third parties have asserted and may in the future assert claims of infringement of intellectual property rights against us or our end-customers and channel partners. For example, in October 2013, we received a letter on behalf of Crossroads Systems suggesting that we should license some or all of its patents from its ‘972 Patent Family to avoid infringement of those patents. Our standard license and other agreements obligate us to indemnify our end-customers and channel partners against claims that our products infringe the intellectual property rights of third parties, and in some cases this indemnification obligation is uncapped as to the amount of the liability. As the number of products and competitors in our market increases and overlaps occur, and our profile within this market grows, infringement claims may increase. While we intend to increase the size of our patent portfolio, our competitors and others may now and in the future have significantly larger and more mature patent portfolios than we have. In addition, future litigation may involve patent holding companies or other adverse patent owners who have no relevant product revenue and against whom our own patents may therefore provide little or no deterrence or protection. Any claim of infringement by a third party, even those without merit, could cause us to incur substantial costs defending against the claim and could distract our management from our business. Furthermore, a successful claimant could secure a judgment or we may agree to a settlement that requires us to pay substantial damages, royalties or other fees. Any of these events could harm our business and operating results.
Although third parties may offer a license to their technology or other intellectual property, the terms of any offered license may not be acceptable and the failure to obtain a license or the costs associated with any license could materially and adversely affect our business and operating results. If a third party does not offer us a license to its technology or other intellectual property on reasonable terms, or at all, we could be enjoined from continued use of such intellectual property. As a result, we may be required to develop alternative, non-infringing technology, which could require significant time (during which we would be unable to continue to offer our affected products or services), effort and expense, and may ultimately not be successful.
If we are unable to hire, retain, train and motivate qualified personnel and senior management, our business could be harmed.
Our future success depends, in part, on our ability to continue to attract and retain highly skilled personnel. In particular, we are highly dependent on the contributions of our executive team as well as members of our research and development organization. The loss of any key personnel could make it more difficult to manage our operations and research and development activities, reduce our employee retention and revenue and impair our ability to compete. Although we have entered into employment offer letters with our key personnel, these agreements have no specific duration and constitute at-will employment.
Competition for highly skilled personnel is often intense, especially in the San Francisco Bay Area where we have a substantial presence and need for highly skilled personnel. We may not be successful in attracting, integrating or retaining qualified personnel to fulfill our current or future needs.
25
Table of Contents
Index to Financial Statements
We have from time to time experienced, and we expect to continue to experience, difficulty in hiring and retaining highly skilled employees with appropriate qualifications. In addition, job candidates and existing employees often consider the value of the equity awards they receive in connection with their employment. If the perceived value of our stock declines, it may adversely affect our ability to retain highly skilled employees. In addition, since we expense all stock-based compensation, we may periodically change our equity compensation practices, which may include reducing the number of employees eligible for options or reducing the size of equity awards granted per employee. If we fail to attract new personnel or fail to retain and motivate our current personnel, our business and future growth prospects could be harmed.
Failure to adequately expand our sales force will impede our growth.
We will need to continue to expand and optimize our sales infrastructure in order to grow our customer base and our business. We plan to continue to expand our sales force, both domestically and internationally. Identifying, recruiting and training qualified personnel require significant time, expense and attention. It can take time before our sales representatives are fully-trained and productive. Our business may be adversely affected if our efforts to expand and train our sales force do not generate a corresponding increase in revenue. In particular, if we are unable to hire, develop and retain talented sales personnel or if new sales personnel are unable to achieve desired productivity levels in a reasonable period of time, we may not be able to realize the expected benefits of this investment or increase our revenue.
If we or our channel partners fail to timely and correctly install our storage products, or if our channel partners face disruptions in their business, our reputation will suffer, our competitive position could be impaired and we could lose end-customers.
In addition to our small team of installation personnel, we rely upon some of our channel partners to install our storage products at our end-customer locations. Although we train and certify our channel partners on the installation of our products, end-customers have in the past encountered installation difficulties with our channel partners. In addition, if one or more of our channel partners suffers an interruption in its business, or experiences delays, disruptions or quality control problems in its operations, our revenue could be reduced and our ability to compete could be impaired. As a significant portion of our sales occur in the last month of a quarter, our end-customers may also experience installation delays following a purchase if we or our channel partners have too many installations in a short period of time. If we or our channel partners fail to timely and correctly install our products, end-customers may not purchase additional products and services from us, our reputation could suffer and our revenue could be reduced. In addition, if our channel partners are unable to correctly install our products, we might incur additional expenses to correctly install our products.
We are exposed to the credit risk of some of our channel partners and direct customers, which could result in material losses and negatively impact our operating results.
Some of our channel partners and direct customers have experienced financial difficulties in the past. A channel partner or direct customer experiencing such difficulties will generally not purchase or sell as many of our products as it would under normal circumstances and may cancel orders. Our typical payment terms are 30 days. Because of local customs or conditions, payment terms may be longer in some circumstances and markets. In addition, a channel partner or direct customer experiencing financial difficulties generally increases our exposure to uncollectible receivables. If any of our channel partners or direct customers that represent a significant portion of our total revenue becomes insolvent or suffers a deterioration in its financial or business condition and is unable to pay for our products, our results of operations could be harmed.
26
Table of Contents
Index to Financial Statements
Changes in laws, regulations and standards related to data privacy and the Internet could harm our business.
Federal, state or foreign government bodies or agencies have in the past adopted, and could in the future adopt, laws and regulations affecting data privacy and the use of the Internet as a commercial medium. Changing laws, regulations and standards applying to the solicitation, collection, processing or use of personal or consumer information could affect our end-customers’ ability to use and share data, potentially restricting our ability to store, process and share data with our end-customers through our InfoSight platform, and in turn limit our ability to provide real-time and predictive customer support. If we are not able to adjust to changing laws, regulations and standards related to the Internet, our business could be harmed.
Some of our products use “open source” software, which may restrict how we use or distribute our products or require that we release the source code of certain software subject to open source licenses.
Some of our products may incorporate software licensed under so-called “free,” “open source” or other similar licenses where the licensed software is made available to the general public under the terms of a specific non-negotiable license. Some open source licenses require that software subject to the license be made available to the public and that any modifications or derivative works based on open source software be licensed in source code form under the same open source licenses. Few courts have interpreted open source licenses, and the manner in which these licenses may be interpreted and enforced is therefore subject to some uncertainty. We rely on multiple software programmers to design our proprietary technologies, we are not able to exercise complete control over the development methods and efforts of our programmers, and we cannot be certain that our programmers have not incorporated open source software into our products without our knowledge or that they will not do so in the future. Some of our products incorporate third-party software under commercial licenses. We cannot be certain whether such third-party software incorporates open-source software without our knowledge. In the event that portions of our proprietary technology are determined to be subject to an open source license, we could be required to publicly release the affected portions of our source code, re-engineer all or a portion of our products, or otherwise be limited in the licensing of our technologies, each of which could reduce or eliminate the value of our products and materially and adversely affect our ability to sustain and grow our business. Many open source licenses include additional obligations and restrictions, such as providing attribution to the authors of the open source software or providing a copy of the applicable open source license to recipients of the open source software. If we distribute products outside the terms of applicable open source licenses, we could be exposed to claims of breach of contract or intellectual property infringement.
Our failure to raise additional capital or generate the significant capital necessary to expand our operations and invest in new products could reduce our ability to compete and could harm our business.
We expect that our existing cash and cash equivalents will be sufficient to meet our anticipated cash needs for at least the next 12 months. In the future, we may need to raise additional funds, and we may not be able to obtain additional debt or equity financing on favorable terms, if at all. If we raise additional equity financing, our stockholders may experience significant dilution of their ownership interests and the per share value of our common stock could decline. Furthermore, if we engage in debt financing, the holders of debt would have priority over the holders of common stock, and we may be required to accept terms that restrict our ability to incur additional indebtedness. We may also be required to take other actions that would otherwise be in the interests of the debt holders and force us to maintain specified liquidity or other ratios, any of which could harm our business and operating results. If we need additional capital and cannot raise it on acceptable terms, we might not be able to, among other things:
| ¨ | develop or enhance our products; |
27
Table of Contents
Index to Financial Statements
| ¨ | continue to expand our sales and marketing and research and development organizations; |
| ¨ | acquire complementary technologies, products or businesses; |
| ¨ | expand operations in the United States or internationally; |
| ¨ | hire, train and retain employees; or |
| ¨ | respond to competitive pressures or unanticipated working capital requirements. |
Our failure to do any of these things could harm our business and operating results.
If we fail to maintain an effective system of internal controls, our ability to produce timely and accurate financial statements or comply with applicable regulations could be impaired.
As a public company, we are subject to the reporting requirements of the Securities Exchange Act of 1934, as amended, or Exchange Act, the Sarbanes-Oxley Act and the rules and regulations of the New York Stock Exchange. We expect the requirements of these rules and regulations will increase our legal, accounting, financial compliance and audit costs, make some activities more challenging, time consuming and costly, and place strain on our personnel, systems and resources.
The Sarbanes-Oxley Act requires, among other things, that we maintain effective disclosure controls and procedures and internal control over financial reporting as defined in Rule 13a-15(f) of the Exchange Act. We are continuing to develop and refine our disclosure controls and other procedures designed to ensure information required to be disclosed in the reports filed with the U.S. Securities and Exchange Commission, or the SEC, is recorded, processed, summarized and reported within the time periods specified in SEC rules and forms, and that information required to be disclosed in reports under the Exchange Act is accumulated and communicated to our principal executive and financial officers.
Our current controls, and any new controls developed, may become inadequate because of changes in external conditions and in our business. Any failure to update, implement and maintain effective internal controls could adversely affect the results of periodic management evaluations and annual independent registered public accounting firm attestation reports regarding the effectiveness of our internal control over financial reporting required in periodic reports filed with the SEC under Section 404 of the Sarbanes-Oxley Act. Further, weaknesses in our internal controls may be discovered in the future and result in a restatement of our financial statements for prior periods. Any failure to develop or maintain effective controls, or any difficulties encountered in their implementation or improvement, could harm our operating results, or cause us to fail to meet our reporting obligations.
Ineffective disclosure controls and procedures and ineffective internal control over financial reporting could cause investors to lose confidence in our reported financial and other information, which would likely have a negative effect on the trading price of our common stock.
To maintain and improve the effectiveness of our disclosure controls and procedures and internal control over financial reporting, we have expended and will continue to expend significant resources, including accounting and professional services fees related costs and in providing diligent management oversight. Any failure to maintain the adequacy of our internal controls, or consequent inability to produce accurate financial statements on a timely basis, could increase our operating costs and could impair our ability to operate our business. In the event that our internal controls are assessed or perceived as inadequate, or we are unable to produce timely and accurate financial statements, investors may lose confidence in our operating results and our stock price could decline. In addition, if we are unable to continue to meet these requirements, we may not be able to remain listed on the New York Stock Exchange.
28
Table of Contents
Index to Financial Statements
We will be required to disclose changes made in our internal controls and procedures on a quarterly basis and, in compliance with Section 404 of the Sarbanes-Oxley Act, file an internal control report with our annual report acknowledging the obligation of management to establish and maintain adequate internal controls and procedures for financial reporting.
We will not be required to make our first annual evaluation and attestation of our internal control over financial reporting pursuant to Section 404 of the Sarbanes-Oxley Act until the year following our first annual report filed with the SEC. To comply with the full requirements of a public company, we will need to undertake various actions, such as implementing new internal controls and procedures and hiring accounting and/or internal audit staff. Commencing with the audit of our fiscal year 2015, when we must comply with the attestation requirements of Section 404(b) of the Sarbanes-Oxley Act, our independent registered public accounting firm will be required to formally attest to the effectiveness of our internal control over financial reporting. At such time, our independent registered public accounting firm may issue a report that it is not satisfied with the level at which our controls are designed or documented or may assess certain controls as ineffective, and our remediation efforts may not enable us to avoid a material weakness in the future.
If we fail to comply with environmental requirements, our business, operating results and reputation could be adversely affected.
We are subject to various environmental laws and regulations including laws governing the hazardous material content of our products and laws relating to the collection of and recycling of electrical and electronic equipment. Examples of these laws and regulations include the European Union, or EU, Restrictions of Hazardous Substances Directive, or RoHS, and the EU Waste Electrical and Electronic Equipment Directive, or WEEE, as well as the implementing legislation of the EU member states. Similar laws and regulations have been passed or are pending in China, South Korea, Norway and Japan and may be enacted in other regions, including in the United States, and we are, or may in the future be, subject to these laws and regulations.
The EU RoHS and the similar laws of other jurisdictions ban the use of certain hazardous materials such as lead, mercury and cadmium in the manufacture of electrical equipment, including our products. Currently, the manufacturer of our hardware appliances and our major component part suppliers comply with the EU RoHS requirements. However, if there are changes to this or other laws (or their interpretation) or if new similar laws are passed in other jurisdictions, we may be required to reengineer our products to use components compatible with these regulations. This reengineering and component substitution could result in additional costs to us or disrupt our operations or logistics.
The WEEE Directive requires electronic goods producers to be responsible for the collection, recycling and treatment of such products. Changes in interpretation of the directive may cause us to incur costs or have additional regulatory requirements to meet in the future in order to comply with this directive, or with any similar laws adopted in other jurisdictions.
Our failure to comply with past, present and future similar laws could result in reduced sales of our products, substantial product inventory write-offs, reputational damage, penalties and other sanctions, any of which could harm our business and operating results. We also expect that our products will be affected by new environmental laws and regulations on an ongoing basis. To date, our expenditures for environmental compliance have not had a material impact on our results of operations or cash flows, and although we cannot predict the future impact of such laws or regulations, they will likely result in additional costs and may increase penalties associated with violations or require us to change the content of our products or how they are manufactured, which could have a material adverse effect on our business and operating results.
29
Table of Contents
Index to Financial Statements
We are exposed to fluctuations in currency exchange rates, which could negatively affect our operating results.
Our sales contracts are primarily denominated in U.S. dollars, and therefore, substantially all of our revenue is not subject to foreign currency risk. However, a strengthening of the U.S. dollar could increase the real cost of our products to our end-customers outside of the United States, which could adversely affect our operating results. In addition, an increasing portion of our operating expenses is incurred and an increasing portion of our assets is held outside the United States. These operating expenses and assets are denominated in foreign currencies and are subject to fluctuations due to changes in foreign currency exchange rates. If we are not able to successfully hedge against the risks associated with currency fluctuations, our operating results could be adversely affected.
Our business is subject to the risks of earthquakes, fire, power outages, floods, and other catastrophic events, and to interruption by man-made problems such as terrorism.
A significant natural disaster, such as an earthquake, fire, flood, or significant power outage could have a material adverse impact on our business, operating results. Both our corporate headquarters and the location where our products are manufactured are located in the San Francisco Bay Area, a region known for seismic activity. In addition, natural disasters could affect our supply chain, manufacturing vendors, or logistics providers’ ability to provide materials and perform services such as manufacturing products or assisting with shipments on a timely basis. In the event we or our service providers are hindered by any of the events discussed above, shipments could be delayed, resulting in missed financial targets, such as revenue and shipment targets, for a particular quarter. In addition, acts of terrorism and other geo-political unrest could cause disruptions in our business or the businesses of our supply chain, manufacturers, logistics providers, partners or end-customers, or the economy as a whole. Any disruption in the business of our supply chain, manufacturers, logistics providers, partners or end-customers that impacts sales at the end of a fiscal quarter could have a significant adverse impact on our quarterly results. All of the aforementioned risks may be further increased if we do not implement a disaster recovery plan or our suppliers’ disaster recovery plans prove to be inadequate. To the extent that any of the above should result in delays or cancellations of customer orders, or delays in the manufacture, deployment or shipment of our products, our business and operating results would be adversely affected.
New regulations related to conflict minerals may cause us to incur additional expenses and could limit the supply and increase the costs of certain metals used in the manufacturing of our products.
As a public company, we will be subject to new requirements under the Dodd-Frank Wall Street Reform and Consumer Protection Act of 2010 that will require us to diligence, disclose and report whether or not our products contain conflict minerals. The implementation of these new requirements could adversely affect the sourcing, availability and pricing of the materials used in the manufacture of components used in our products. In addition, we will incur additional costs to comply with the disclosure requirements, including costs related to conducting diligence procedures to determine the sources of conflict minerals that may be used or necessary to the production of our products and, if applicable, potential changes to products, processes or sources of supply as a consequence of such verification activities. It is also possible that we may face reputational harm if we determine that certain of our products contain minerals not determined to be conflict free or if we are unable to alter our products, processes or sources of supply to avoid such materials.
Our ability to use net operating losses to offset future taxable income may be subject to certain limitations.
As of January 31, 2014, we had federal and state net operating loss carryforwards of $73.2 million and $55.7 million due to prior period losses, which if not utilized, will begin to expire in
30
Table of Contents
Index to Financial Statements
2034. If these net operating losses, or NOLs, expire unused and are unavailable to offset future income tax liabilities, our profitability may be adversely affected. In addition, under Section 382 of the U.S. Internal Revenue Code of 1986, or the Code, a corporation that undergoes an “ownership change” is subject to limitations on its ability to utilize its pre-change NOLs to offset future taxable income. Our existing NOLs may be subject to limitations arising from previous ownership changes and, if we undergo an ownership change in the future, our ability to utilize our NOLs could be further limited by Section 382 of the Code. Future changes in our stock ownership, many of which are outside of our control, could result in an ownership change under Section 382 of the Code. In September 2013, we completed an analysis to evaluate whether there are any limitations of our NOLs and concluded no limitations currently exist. While we do not believe that we have experienced an ownership change that would result in limitations, regulatory changes, such as suspension of the use of NOLs, could result in the expiration of our NOLs or otherwise cause them to be unavailable to offset future income tax liabilities. Our net operating losses could also be impaired under state law. As a result, we might not be able to utilize a material portion of our NOLs.
We may acquire other businesses which could require significant management attention, disrupt our business, dilute stockholder value and adversely affect our operating results.
As part of our business strategy, we may make investments in complementary companies, products or technologies. However, we have not made any acquisitions to date, and as a result, our ability as an organization to acquire and integrate other companies, products or technologies in a successful manner is unproven. We may not be able to find suitable acquisition candidates, or we may not be able to complete such acquisitions on favorable terms, if at all. If we do complete acquisitions, we may not ultimately strengthen our competitive position or achieve our goals, and any acquisitions we complete could be viewed negatively by our end-customers, investors or securities analysts. In addition, if we are unsuccessful at integrating such acquisitions, or the technologies associated with such acquisitions, into our company, our operating results could be adversely affected. We may also incur unforeseen liabilities which could materially and adversely affect our operating results. We may not successfully evaluate or utilize the acquired technology or personnel, or accurately forecast the financial impact of an acquisition transaction, including accounting charges. The sale of equity or issuance of debt to finance any such acquisitions could result in dilution to our stockholders. The incurrence of indebtedness would result in increased fixed obligations and could also include covenants or other restrictions that impede our ability to manage our operations.
We are an “emerging growth company” and we cannot be certain if the reduced disclosure requirements applicable to emerging growth companies will make our common stock less attractive to investors.
We are an “emerging growth company,” as defined in the Jumpstart Our Business Startups Act of 2012, or the JOBS Act, and we intend to take advantage of certain exemptions from various reporting requirements that are applicable to other public companies that are not emerging growth companies including, but not limited to, not being required to comply with the auditor attestation requirements of Section 404 of the Sarbanes-Oxley Act, reduced disclosure obligations regarding executive compensation in our periodic reports and proxy statements and exemptions from the requirements of holding a nonbinding advisory vote on executive compensation and shareholder approval of any golden parachute payments not previously approved.
We could be an “emerging growth company” for up to five years, although we may lose such status earlier, depending on the occurrence of certain events. We will remain an “emerging growth company” until the earliest to occur of (i) the last day of the fiscal year (a) following December 12, 2018 or (b) in which we have gross annual revenue of at least $1.0 billion, (ii) the date on which we are deemed to be a “large accelerated filer” under the Exchange Act, which means that the market value of our common stock held by non-affiliates exceeds $700 million as of the prior July 31 and (iii) the date
31
Table of Contents
Index to Financial Statements
on which we have issued more than $1.0 billion in non-convertible debt securities during the prior three-year period.
We cannot predict if investors will find our common stock less attractive because we will rely on these exemptions. If some investors find our common stock less attractive as a result, there may be a less active trading market for our common stock and our stock price may be more volatile.
Under the JOBS Act, “emerging growth companies” can delay adopting new or revised accounting standards issued subsequent to the enactment of the JOBS Act until such time as those standards apply to private companies. We have irrevocably elected not to avail ourselves of this exemption from new or revised accounting standards and will be subject to the same new or revised accounting standards as other public companies that are not “emerging growth companies.”
Risks Related to Ownership of Our Common Stock
The price of our common stock has been, and is likely to continue to be, volatile and may decline regardless of our operating performance, and you may not be able to resell your shares at or above the price at which you purchased your shares.
The trading price of our common stock has been volatile, and could be subject to wide fluctuations in response to various factors, many of which are beyond our control, including:
| • | overall performance of the equity markets; |
| • | our operating performance and the performance of other similar companies; |
| • | changes in the estimates of our operating results that we provide to the public, our failure to meet these projections or changes in recommendations by securities analysts that elect to follow our common stock; |
| • | announcements of technological innovations, new applications or enhancements to services, acquisitions, strategic alliances or significant agreements by us or by our competitors; |
| • | announcements of customer additions and customer cancellations or delays in customer purchases; |
| • | recruitment or departure of key personnel; |
| • | the economy as a whole, market conditions in our industry, and the industries of our customers; |
| • | the expiration of market standoff or contractual lock-up agreements, including the June 11, 2014 expiration of the lock-up in connection with our initial public offering; |
| • | the size of our market float; and |
| • | any other factors discussed in this report. |
In addition, the stock markets have experienced extreme price and volume fluctuations that have affected and continue to affect the market prices of equity securities of many technology companies. Stock prices of many technology companies have fluctuated in a manner unrelated or disproportionate to the operating performance of those companies. In the past, stockholders have filed securities class action litigation following periods of market volatility. If we were to become involved in securities litigation, it could subject us to substantial costs, divert resources and the attention of management from our business, and adversely affect our business.
32
Table of Contents
Index to Financial Statements
Substantial blocks of our total outstanding shares may be sold into the market when “lock-up” or “market standoff” periods end. If there are substantial sales of shares of our common stock, the price of our common stock could decline.
The price of our common stock could decline if there are substantial sales of our common stock, particularly sales by our directors, executive officers and significant stockholders, or if there is a large number of shares of our common stock available for sale. We had 71.8 million shares of our common stock outstanding as of March 31, 2014. Approximately 62.6 million shares are currently restricted as a result of lock-up and market standoff agreements and will become available for sale in the public market on June 11, 2014. Shares held by directors, executive officers and other affiliates are subject to volume limitations under Rule 144 under the Securities Act and various vesting agreements. The market price of the shares of our common stock could decline as a result of sales of a substantial number of our shares in the public market or the perception in the market that the holders of a large number of shares intend to sell their shares.
Certain of our stockholders have rights, subject to some conditions, to require us to file registration statements covering their shares or to include their shares in registration statements that we may file for ourselves or our stockholders. All of these shares are subject to market standoff or lock-up agreements restricting their sale until June 11, 2014. We have registered shares of common stock that we have issued and may issue under our employee equity incentive plans and we intend to register additional shares of common stock that we have issued and may issue under such employee equity incentive plans. Once we register these shares, they will be able to be sold freely in the public market upon issuance, subject to existing market standoff or lock-up agreements.
The representatives of the underwriters in our initial public offering may, in their discretion, permit our stockholders to sell shares prior to the expiration of the restrictive provisions contained in those lock-up agreements.
The market price of the shares of our common stock could decline as a result of the sale of a substantial number of our shares of common stock in the public market or the perception in the market that the holders of a large number of shares intend to sell their shares.
If securities or industry analysts choose to publish or refrain from publishing research, publish inaccurate or unfavorable research, or discontinue publishing research, about our business, our stock price and trading volume could decline.
The trading market for our common stock will depend in part on the research and reports that securities or industry analysts publish about us or our business. If industry analysts cease coverage of us or fail to publish reports on us regularly, demand for our common stock could decrease, which might cause our common stock price and trading volume to decline. If one or more of the analysts who cover us downgrade our common stock or publish inaccurate or unfavorable research about our business, our common stock price could decline.
Our directors, executive officers and principal stockholders have substantial control over us and could delay or prevent a change in corporate control.
Our directors, executive officers and holders of more than 5% of our common stock, together with their affiliates, beneficially own, in the aggregate, 75% of our outstanding common stock as of March 31, 2014. As a result, these stockholders, acting together, have the ability to control the outcome of matters submitted to our stockholders for approval, including the election of directors and any merger, consolidation or sale of all or substantially all of our assets. In addition, these
33
Table of Contents
Index to Financial Statements
stockholders, acting together, have the ability to control the management and affairs of our company. Accordingly, this concentration of ownership could harm the market price of our common stock by:
| ¨ | delaying, deferring or preventing a change in control of us; |
| ¨ | impeding a merger, consolidation, takeover or other business combination involving us; or |
| ¨ | discouraging a potential acquiror from making a tender offer or otherwise attempting to obtain control of us. |
We do not intend to pay dividends for the foreseeable future.
We have never declared nor paid cash dividends on our capital stock. We currently intend to retain any future earnings to finance the operation and expansion of our business, and we do not expect to declare or pay any dividends in the foreseeable future. Consequently, stockholders must rely on sales of their common stock after price appreciation, which may never occur, as the only way to realize any future gains on their investment.
Delaware law and provisions in our restated certificate of incorporation and restated bylaws could make a merger, tender offer, or proxy contest difficult, thereby depressing the trading price of our common stock.
Our status as a Delaware corporation and the anti-takeover provisions of the Delaware General Corporation Law may discourage, delay, or prevent a change in control by prohibiting us from engaging in a business combination with an interested stockholder for a period of three years after the person becomes an interested stockholder, even if a change of control would be beneficial to our existing stockholders. In addition, our restated certificate of incorporation and restated bylaws contain provisions that may make the acquisition of our company more difficult, including the following:
| ¨ | our board of directors is classified into three classes of directors with staggered three-year terms and directors will only be able to be removed from office for cause; |
| ¨ | only our board of directors has the right to fill a vacancy created by the expansion of our board of directors or the resignation, death or removal of a director, which prevents stockholders from being able to fill vacancies on our board of directors; |
| ¨ | only our chairman of the board, our chief executive officer, our president or a majority of our board of directors are authorized to call a special meeting of stockholders; |
| ¨ | certain litigation against us can only be brought in Delaware; |
| ¨ | our restated certificate of incorporation will authorizes undesignated preferred stock, the terms of which may be established, and shares of which may be issued, without the approval of the holders of common stock; and |
| ¨ | advance notice procedures apply for stockholders to nominate candidates for election as directors or to bring matters before an annual meeting of stockholders. |
ITEM 1B. UNRESOLVED STAFF COMMENTS
None.
Our corporate headquarters are located in approximately 165,000 square feet in San Jose, California. The 96-month lease commenced on November 1, 2013. We use this facility for administration, sales and marketing, research and development, customer support, and professional services. We also maintain offices in other locations in the United States and internationally, including the United Kingdom, Australia, and other various locations; we use these office spaces for sales and marketing. We believe our existing facilities are adequate to meet our current needs, and we intend to
34
Table of Contents
Index to Financial Statements
procure additional space as needed as we add employees and expand our operations. We believe that, if required, suitable additional or substitute space would be available to accommodate any such expansion of our operations.
On October 29, 2013, NetApp, Inc., or NetApp, filed a lawsuit in United States District Court, Northern District of California, alleging violations of the federal Computer Fraud and Abuse Act, trade secret misappropriation, unfair competition and related state law claims. We and three individuals, a sales engineer employee of an Australian affiliate, along with a sales representative and program manager of our company, have been named as defendants. On January 10, 2014, NetApp filed a First Amended Complaint that added similar state law claims against three additional individuals as defendants. The First Amended Complaint alleges that the Australian defendant, a former employee of a NetApp reseller, accessed NetApp’s password-protected website allegedly restricted to NetApp partners, resellers, employees and customers, and downloaded confidential and proprietary information in violation of the Computer Fraud and Abuse Act. It further alleges that the other five individual defendants, who were formerly employed at NetApp, downloaded NetApp company documents and materials, including allegedly confidential and trade secret information, and/or deleted NetApp documents and materials, prior to leaving NetApp. The complaint seeks unspecified damages and injunctive relief. Because we are in the early stages of litigation, we are unable to estimate a range of possible losses, if any. We filed a response to the complaint on February 18, 2014. An initial case management conference is scheduled for May 8, 2014; no other pretrial or trial dates have been set. Litigation is inherently uncertain and can involve significant management time and attention. In addition, the cost of any litigation, regardless of outcome, can be significant and there can be no assurance that resolution of this matter will not have a material adverse effect on our operating results. We intend to vigorously defend ourselves in this litigation.
In addition, from time to time, we may become involved in legal proceedings arising in the ordinary course of business.
ITEM 4. MINE SAFETY DISCLOSURES
Not applicable.
35
Table of Contents
Index to Financial Statements
ITEM 5. MARKET FOR REGISTRANT’S COMMON EQUITY, RELIATED STOCKHOLDER MATTERS AND ISSUER PURCHASES OF EQUITY SECURITIES
Market Information for Common Stock
Our common stock has been listed on the New York Stock Exchange under the symbol “NMBL” since December 13, 2013, the date of our initial public offering. Prior to our initial public offering, there was no public market for our common stock.
The following table sets forth for the indicated periods the high and low closing sales prices of our common stock as reported by the New York Stock Exchange.
| High | Low | |||||||
| Year ended January 31, 2014 |
||||||||
| Fourth quarter (from December 13, 2013) |
$ | 48.67 | $ | 33.86 | ||||
The last reported sale price for our common stock on the New York Stock Exchange was $30.42 per share on April 14, 2014.
Holders of Record
As of March 31, 2014, there were 275 registered stockholders of record of our common stock. Because many of our shares of common stock are held by brokers or other institutions on behalf of stockholders, we are unable to estimate the total number of stockholders represented by the record holders.
Dividend Policy
We have never declared or paid cash dividends on our common stock. We currently intend to retain all available funds and any future earnings for use in the operation of our business and do not anticipate paying any dividends on our common stock in the foreseeable future. Any future determination to declare dividends will be made at the discretion of our board of directors and will depend on our financial condition, operating results, capital requirements, general business conditions and other factors that our board of directors may deem relevant. In addition, our credit facility contains restrictions on our ability to pay dividends.
Securities Authorized for Issuance under Equity Compensation Plans
The information concerning our equity compensation plans is incorporated by reference herein to the section of the Proxy Statement entitled “Equity Compensation Plan Information.”
Stock Performance Graph
The following shall not be deemed “soliciting material” or “filed” for purposes of Section 18 of the Exchange Act, or incorporated by reference into any of our other filings under the Exchange Act or the Securities Act of 1933, as amended, except to the extent we specifically incorporate it by reference into such filing.
This chart compares the cumulative total return on our common stock with that of the S&P 500 Index and the S&P Information Technology Index from December 13, 2013 (the date our common stock commenced trading on the New York Stock Exchange) through January 31, 2014. The chart assumes $100 was invested at the close of market on December 13, 2013, in each of the common stock of Nimble Storage, Inc., the S&P 500 Index and the S&P Information Technology Index,
36
Table of Contents
Index to Financial Statements
and assumes the reinvestment of any dividends. The stock price performance on the following graph is not necessarily indicative of future stock price performance.
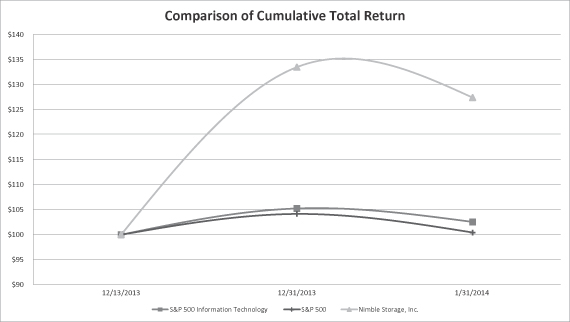
Recent Sale of Unregistered Securities and Use of Proceeds
Recent Sale of Unregistered Securities
From November 1, 2013 through December 13, 2013 (the date of the filing of our registration statement on Form S-8), we issued and sold an aggregate of 108,894 shares of our common stock to current and former employees and consultants at a weighted-average exercise price of approximately $1.96 per share pursuant to exercises of options granted under our 2008 Equity Incentive Plan. The sales of the above securities were deemed to be exempt from registration under the Securities Act in reliance on Section 4(2) of the Securities Act or Rule 701 promulgated under Section 3(b) of the Securities Act, as transactions by an issuer not involving a public offering or transactions pursuant to compensatory benefit plans and contracts relating to compensation as provided under Rule 701.
Use of Proceeds
On December 12, 2013, the Securities and Exchange Commission declared our registration statement on Form S-1 (File No. 333-191789) effective for our initial public offering, which commenced the following day and closed on December 18, 2013. The offering did not terminate before all of the securities registered in the registration statement were sold. The underwriters of the offering were Goldman, Sachs & Co., Morgan Stanley & Co. LLC, Pacific Crest Securities LLC, William Blair & Company, L.L.C., Stifel, Nicolaus & Company, Incorporated, Oppenheimer & Co. Inc. and Needham & Company, LLC.
An aggregate of 9,200,000 shares of our common stock were offered and sold in our initial public offering, including 1,200,000 shares to cover the underwriters’ over-allotment option. All of the shares sold in our initial public offering were sold by us, at a price to the public of $21.00 per share. The aggregate public offering price of the offering amount registered, including shares to cover the underwriters’ over-allotment option, was $193.2 million. As a result of the initial public offering, we received net proceeds of approximately $176.7 million, after deducting total expenses of approximately $16.5 million, consisting of underwriting discounts and commissions of approximately $13.5 million and
37
Table of Contents
Index to Financial Statements
offering-related expenses of approximately $3.0 million. As of January 31, 2014, approximately $1.0 million of additional offering-related expenses remained unpaid. We expect to pay these expenses in our first fiscal quarter. No payments were made by us to directors, officers or persons owning ten percent or more of our common stock or to their associates, or to our affiliates, other than payments in the ordinary course of business to officers for salaries.
There has been no material change in the planned use of proceeds from our initial public offering as described in our final prospectus filed with the Securities and Exchange Commission on December 13, 2013 pursuant to Rule 424(b). As of January 31, 2014, the majority of the proceeds from the initial public offering were held as cash and cash equivalent. Our management has broad discretion in the application of the net proceeds from the initial public offering and investors will be relying on the judgment of our management regarding the application of the proceeds.
Purchases of Equity Securities by the Issuer and Affiliated Purchasers
During the fourth quarter of the year ended January 31, 2014, we repurchased the following shares of common stock from former employees by exercising our right to repurchase unvested shares upon termination of employment at a price equal to the lower of the fair market value on the repurchase date or the original exercise price paid for such shares:
| Period |
Total Number of Shares Purchased |
Average Price Paid per Share |
Total Number of Shares Purchased as Part of Publicly Announced Plans or Programs |
Approximate Dollar Value of Shares That May Yet Be Purchased Under the Plans or Programs |
||||||||||||
| November 1, 2013 to November 30, 2013 |
8,347 | $ | 1.6533 | N/A | N/A | |||||||||||
| December 1, 2013 to December 31, 2013 |
N/A | N/A | N/A | N/A | ||||||||||||
| January 1, 2014 to January 31, 2014 |
N/A | N/A | N/A | N/A | ||||||||||||
38
Table of Contents
Index to Financial Statements
ITEM 6. SELECTED FINANCIAL DATA
The selected consolidated statements of operations data for the years ended January 31, 2014, 2013 and 2012 and the consolidated balance sheet data as of January 31, 2014 and 2013 are derived from our audited consolidated financial statements included elsewhere in this Annual Report on Form 10-K. The selected consolidated statement of operations data for the year ended January 31, 2011 and the consolidated balance sheet data as of January 31, 2012 have been derived from our audited consolidated financial statements, which are not included in this Annual Report on Form 10-K. The selected consolidated financial data below should be read in conjunction with the section entitled “Management’s Discussion and Analysis of Financial Condition and Results of Operations” and our consolidated financial statements and related notes included elsewhere in this Annual Report on Form 10-K. Our historical results are not necessarily indicative of the results that may be expected in any future period. The selected consolidated financial data in this section are not intended to replace the financial statements and are qualified in their entirety by the consolidated financial statements and related notes included elsewhere in this Annual Report on Form 10-K.
|
Year Ended January 31, |
||||||||||||||||
| 2014 | 2013 | 2012 | 2011 | |||||||||||||
| (in thousands, except per share data) | ||||||||||||||||
| Consolidated Statements of Operations Data: |
||||||||||||||||
| Revenue: |
||||||||||||||||
| Product |
$ | 112,812 | $ | 49,765 | $ | 13,113 | $ | 1,632 | ||||||||
| Support and service |
12,921 | 4,075 | 900 | 49 | ||||||||||||
|
|
|
|
|
|
|
|
|
|||||||||
| Total revenue |
125,733 | 53,840 | 14,013 | 1,681 | ||||||||||||
| Cost of revenue: |
||||||||||||||||
| Product(1) |
36,231 | 17,266 | 5,233 | 604 | ||||||||||||
| Support and service(1) |
7,980 | 3,184 | 1,045 | 230 | ||||||||||||
|
|
|
|
|
|
|
|
|
|||||||||
| Total cost of revenue |
44,211 | 20,450 | 6,278 | 834 | ||||||||||||
|
|
|
|
|
|
|
|
|
|||||||||
| Total gross profit |
81,522 | 33,390 | 7,735 | 847 | ||||||||||||
| Operating expenses: |
||||||||||||||||
| Research and development(1) |
35,247 | 16,135 | 7,903 | 4,415 | ||||||||||||
| Sales and marketing(1) |
75,107 | 39,851 | 12,863 | 2,934 | ||||||||||||
| General and administrative(1) |
13,737 | 5,168 | 3,756 | 325 | ||||||||||||
|
|
|
|
|
|
|
|
|
|||||||||
| Total operating expenses |
124,091 | 61,154 | 24,522 | 7,674 | ||||||||||||
|
|
|
|
|
|
|
|
|
|||||||||
| Loss from operations |
(42,569 | ) | (27,764 | ) | (16,787 | ) | (6,827 | ) | ||||||||
| Interest income, net |
21 | 32 | 6 | 5 | ||||||||||||
| Other expense, net |
(150 | ) | (26 | ) | (4 | ) | — | |||||||||
|
|
|
|
|
|
|
|
|
|||||||||
| Loss before provision for income taxes |
(42,698 | ) | (27,758 | ) | (16,785 | ) | (6,822 | ) | ||||||||
| Provision for income taxes |
425 | 99 | 5 | — | ||||||||||||
|
|
|
|
|
|
|
|
|
|||||||||
| Net loss |
(43,123 | ) | (27,857 | ) | (16,790 | ) | (6,822 | ) | ||||||||
| Accretion of redeemable convertible preferred stock |
(36 | ) | (34 | ) | (23 | ) | (16 | ) | ||||||||
|
|
|
|
|
|
|
|
|
|||||||||
| Net loss attributable to common stockholders |
$ | (43,159 | ) | $ | (27,891 | ) | $ | (16,813 | ) | $ | (6,838 | ) | ||||
|
|
|
|
|
|
|
|
|
|||||||||
| Net loss per share attributable to common stockholders, basic and diluted |
$ | (1.61 | ) | $ | (1.53 | ) | $ | (1.04 | ) | $ | (0.47 | ) | ||||
|
|
|
|
|
|
|
|
|
|||||||||
| Weighted-average shares used to compute net loss per share attributable to common stockholders, basic and diluted |
26,772 | 18,236 | 16,226 | 14,457 | ||||||||||||
|
|
|
|
|
|
|
|
|
|||||||||
| (1) | Includes stock-based compensation expense as follows: |
|
Year Ended January 31, |
||||||||||||||||
| 2014 | 2013 | 2012 | 2011 | |||||||||||||
| (in thousands) | ||||||||||||||||
| Cost of product revenue |
$ | 232 | $ | 48 | $ | 10 | $ | — | ||||||||
| Cost of support and service revenue |
468 | 114 | 31 | 5 | ||||||||||||
| Research and development |
3,049 | 874 | 268 | 46 | ||||||||||||
| Sales and marketing |
3,674 | 1,029 | 244 | 37 | ||||||||||||
| General and administrative |
1,726 | 539 | 267 | 16 | ||||||||||||
|
|
|
|
|
|
|
|
|
|||||||||
| Total stock-based compensation expense |
$ | 9,149 | $ | 2,604 | $ | 820 | $ | 104 | ||||||||
|
|
|
|
|
|
|
|
|
|||||||||
39
Table of Contents
Index to Financial Statements
| As of January 31, | ||||||||||||
| 2014 | 2013 | 2012 | ||||||||||
| (in thousands) | ||||||||||||
| Consolidated Balance Sheet Data: |
||||||||||||
| Cash and cash equivalents |
$ | 208,486 | $ | 49,205 | $ | 28,796 | ||||||
| Working capital |
195,787 | 48,835 | 29,787 | |||||||||
| Total assets |
259,071 | 72,563 | 37,420 | |||||||||
| Deferred revenue, current and non-current |
33,509 | 10,896 | 2,028 | |||||||||
| Redeemable convertible preferred stock |
— | 98,559 | 57,921 | |||||||||
| Total stockholders’ equity (deficit) |
191,686 | (53,662 | ) | (29,741 | ) | |||||||
ITEM 7. MANAGEMENT’S DISCUSSION AND ANALYSIS OF FINANCIAL CONDITION AND RESULTS OF OPERATIONS
You should read the following discussion and analysis of our financial condition and results of operations together with the consolidated financial statements and related notes that are included elsewhere in this Annual Report on Form 10-K. This discussion contains forward-looking statements based upon current plans, expectations and beliefs that involve risks and uncertainties. Our actual results may differ materially from those anticipated in these forward-looking statements as a result of various factors, including those set forth under “Risk Factors” and in other parts of this Annual Report on Form 10-K.
Overview
Our mission is to provide our customers with the industry’s most efficient data storage platform. We have designed and sell a flash-optimized hybrid storage platform that we believe is disrupting the market by enabling significant improvements in application performance and storage capacity with superior data protection, while simplifying business operations and lowering costs. At the core of our innovative platform is our Cache-Accelerated Sequential Layout file system software, which we call our CASL technology, and our cloud-based storage management and support service, InfoSight.
We were incorporated in November 2007, and we initially focused on the development of our CASL file system software and our storage platform. We shipped our first product line, our CS200 series, in August 2010. In August 2012, we introduced our CS400 series of products and a number of scale-to-fit products, including expansion shelves and controller upgrades. In April 2013, we launched InfoSight. We typically recognize revenue upon the shipment of these products. We also offer support and maintenance services including InfoSight, for periods ranging from one to five years, and recognize revenue over the term of the related support and maintenance agreement.
Since shipping our first product in August 2010, our end-customer base has grown rapidly. We had over 2,640, 1,090 and 270 end-customers as of January 31, 2014, 2013 and 2012, respectively. Our end-customers span a range of industries such as cloud-based service providers, education, financial services, healthcare, manufacturing, state and local government and technology. To continue to grow our business, it is important that we both obtain new customers and sell additional products to our existing customers. For example, in the years ended January 31, 2014, 2013 and 2012, approximately 34%, 25% and 19% of the dollar amount of orders received were from existing end-customers. As of January 31, 2014, the top 50 of our end-customers that have been with us for at least one year, on average, made additional purchases that were approximately 1.5 times more than the initial dollar purchase amount in the year following the initial sale. Of these 50 customers, 18 have at least two years of purchasing history with us, and these longer term customers, on average, made additional purchases that were approximately three times the initial purchase amount in the two years following the initial sale.
40
Table of Contents
Index to Financial Statements
We sell our products through our network of VARs and distributors, and also engage our end-customers through our global sales force. As of January 31, 2013, 2012 and 2011, we had over 910, 430 and 110 VARs that offered our solutions worldwide. Our channel partners act as an extension of our sales force to market our solutions directly to end-customers and do not hold inventory. We have sales offices located in several international locations, including Australia, England, Germany and Singapore. In addition, we have sales employees located in a number of other geographies worldwide, including Canada, Sweden, France, the Netherlands and Japan. Our revenue outside North America was 15% of our total revenue for the year ended January 31, 2014, as we increased our sales and marketing efforts on a global basis.
We outsource the manufacturing of our hardware products to our contract manufacturers, which assemble and test our products. Our contract manufacturers generally procure the components used in our products directly from third-party suppliers. Inventory and shipment are handled by our third-party logistics partners. Distributors handle fulfillment and, in some situations, shipment for our domestic and international end-customers, but do not hold inventory.
We have experienced significant growth in recent periods with total revenue of $125.7 million, $53.8 million and $14.0 million in the years ended January 31, 2014, 2013 and 2012. Our net loss was $43.1 million, $27.9 million and $16.8 million in the years ended January 31, 2014, 2013 and 2012. As our sales and customer base have grown, we have also experienced growth in our deferred revenue from $2.0 million as of January 31, 2012 to $10.9 million as of January 31, 2013 and to $33.5 million as of January 31, 2014. Our gross margin has improved from approximately 55% for the year ended January 31, 2012 to 62% for the year January 31, 2013 and to 65% for the year ended January 31, 2014. As a percentage of total revenue, our operating expenses have declined from 175% for the year ended January 31, 2012 to 114% for the year ended January 31, 2013 and to 99% for the year ended January 31, 2014.
As a consequence of the rapidly evolving nature of our business and our limited operating history, we believe that period-to-period comparisons of revenue and other operating results, including gross margin and operating expenses as a percentage of our total revenue, are not necessarily meaningful and should not be relied upon as indications of future performance. Although we have experienced significant percentage growth in our total revenue, we do not believe that our historical growth rates are likely to be sustainable or indicative of future growth.
Since our founding, we have invested heavily in growing our business, particularly in research and development and sales and marketing. From January 31, 2011 to January 31, 2014, our headcount has increased from 47 to 592 employees. We intend to continue to invest in development of our solutions and sales and marketing programs to drive long-term growth. To support future sales, we plan to continue to invest significant resources in sales and marketing.
The successful growth of our business will depend on our ability to continue to expand our customer base by gaining new customers and in turn grow revenues from our existing customer base. As a result, we intend to hire additional sales and marketing personnel. We are also expanding our VAR network and contracting directly with large distributors. While these areas represent significant opportunities for us, they also pose risks and challenges that we must successfully address in order to sustain the growth of our business and improve our operating results. For example, our investments in these areas might not result in a significant increase in productive sales personnel or channel partners. If this were to occur, we might not be able to expand our base of new customers or succeed in selling additional products to existing customers, which would affect our ability to continue to grow our revenues.
Our future performance will also depend on our ability to continue to innovate, improve functionality in our products and adapt to new technologies or changes to existing technologies.
41
Table of Contents
Index to Financial Statements
Accordingly, we also intend to continue to invest in our research and development activities. It is difficult for us to predict the timing and impact that these investments will have on future revenue. Additionally, we face significant competition in the storage market, which makes it more important that the investments we make in our business are successful. Weak global economic conditions, particularly market and financial uncertainty in the United States and Europe, or a reduction in spending even if economic conditions improve, could adversely impact our business, financial condition and operating results. If we are unable to address these challenges, our business could be adversely affected.
Key Business Metrics
We monitor the key business metrics set forth below in managing our business. We discuss revenue and gross margin below under “—Components of Operating Results.” Deferred revenue, cash flow used in operating activities, Non-GAAP Net Loss and Non-GAAP Operating Income are discussed immediately below the following table.
| Year Ended or as of January 31, | ||||||||||||
| 2014 | 2013 | 2012 | ||||||||||
| (dollars in thousands) | ||||||||||||
| Total revenue |
$ | 125,733 | $ | 53,840 | $ | 14,013 | ||||||
| Year-over-year percentage increase |
134 | % | 284 | % | 734 | % | ||||||
| Gross margin |
64.8 | % | 62.0 | % | 55.2 | % | ||||||
| Deferred revenue, current and non-current |
33,509 | 10,896 | 2,028 | |||||||||
| Net cash used in operating activities |
(6,742 | ) | (18,754 | ) | (14,841 | ) | ||||||
| Non-GAAP Net Loss |
(33,974 | ) | (25,253 | ) | (15,970 | ) | ||||||
| Non-GAAP Operating Loss |
(33,420 | ) | (25,160 | ) | (15,967 | ) | ||||||
Deferred Revenue
Our deferred revenue consists of amounts that have been either invoiced or prepaid but have not yet been recognized as revenue as of the period end. The majority of our deferred revenue consists of the unrecognized portion of revenue from sales of our support and service contracts. We monitor our deferred revenue balance because it represents a portion of revenue to be recognized in future periods.
Net Cash Used in Operating Activities
We monitor net cash used in operating activities as a measure of our overall business performance. Our net cash used in operating activities is driven in large part by our net losses. Monitoring net cash used in operating activities enables us to analyze our financial performance without the non-cash effects of certain items such as depreciation, and stock-based compensation costs, thereby allowing us to better understand and manage the cash needs of our business.
Non-GAAP Net Loss and Non-GAAP Operating Loss
To provide investors with additional information regarding our financial results, we have disclosed in this Annual Report on Form 10-K Non-GAAP Net Loss and Non-GAAP Operating Loss. We define Non-GAAP Net Loss as our net loss adjusted to exclude stock-based compensation. We define Non-GAAP Operating Loss as our operating loss adjusted to exclude stock-based compensation. We have provided reconciliations below of Non-GAAP Net Loss to net loss and Non-GAAP Operating Loss to operating loss, the most directly comparable GAAP financial measures.
We have included non-GAAP Net Loss and Non-GAAP Operating Loss in this Annual Report on Form 10-K because they are key measures used by our management and board of directors to understand and evaluate our core operating performance and trends, to prepare and approve our
42
Table of Contents
Index to Financial Statements
annual budget and to develop short-term and long-term operational and compensation plans. In particular, the exclusion of certain expenses in calculating non-GAAP Net Loss and Non-GAAP Operating Loss can provide useful measures for period-to-period comparisons of our core business. Accordingly, we believe that non-GAAP Net Loss and Non-GAAP Operating Loss provide useful information to investors and others in understanding and evaluating our operating results in the same manner as our management and board of directors.
Our use of Non-GAAP Net Loss and Non-GAAP Operating Loss has limitations as analytical tools, and you should not consider these measures in isolation or as a substitute for analysis of our results as reported under GAAP. Some of these limitations are:
| ¨ | Non-GAAP Net Loss and Non-GAAP Operating Loss do not consider the potentially dilutive impact of equity-based compensation, which is an ongoing expense for us; |
| ¨ | Other companies, including companies in our industry, may calculate Non-GAAP Net Loss and Non-GAAP Operating Loss differently, which reduces their usefulness as comparative measures. |
Because of these limitations, you should consider Non-GAAP Net Loss and Non-GAAP Operating Loss alongside other financial performance measures, including various cash flow metrics, net loss and our other GAAP results. We compensate for these limitations by also reviewing our GAAP financial statements.
Reconciliations of Non-GAAP Net Loss to net loss and Non-GAAP Operating Loss to operating loss are provided below:
| Year Ended January 31, | ||||||||||||
| 2014 | 2013 | 2012 | ||||||||||
| (in thousands) | ||||||||||||
| Net loss |
$ | (43,123 | ) | $ | (27,857 | ) | $ | (16,790 | ) | |||
| Stock-based compensation expense |
9,149 | 2,604 | 820 | |||||||||
|
|
|
|
|
|
|
|||||||
| Non-GAAP Net Loss |
$ | (33,974 | ) | $ | (25,253 | ) | $ | (15,970 | ) | |||
|
|
|
|
|
|
|
|||||||
| Operating loss |
$ | (42,569 | ) | $ | (27,764 | ) | $ | (16,787 | ) | |||
| Stock-based compensation expense |
9,149 | 2,604 | 820 | |||||||||
|
|
|
|
|
|
|
|||||||
| Non-GAAP Operating Loss |
$ | (33,420 | ) | $ | (25,160 | ) | $ | (15,967 | ) | |||
|
|
|
|
|
|
|
|||||||
Components of Operating Results
Revenue
Our total revenue is comprised of the following:
Product Revenue. We generate the substantial majority of our product revenue from the sales of our storage products. It is our practice to identify a direct customer or an end-customer from our VARs and distributors prior to shipment. Products are typically shipped directly to the direct customer or the end-customers of our VARs and distributors. Assuming all other revenue recognition criteria have been met, we generally recognize revenue on sales upon shipment, as title and risk of loss are transferred at that time. For certain VARs and distributors, title and risk of loss is transferred upon delivery to the end-customers and revenue is recognized after delivery has been completed. Our arrangements with VARs and distributors do not contain rights of return, subsequent price discounts, price protection or other allowances for shipments completed.
Support and Service Revenue. We generate our support and service revenue primarily from support and service contracts, which include our automated support and management platform. The
43
Table of Contents
Index to Financial Statements
majority of our product sales are bundled with support and service contracts with terms ranging from one to five years. We recognize revenue from support and service contracts over the contractual service period. As a percentage of total revenue, we expect our support and service revenue to increase as we add new customers and renew existing support and service contracts.
See “—Critical Accounting Policies and Estimates, Revenue Recognition” for further information on our revenue recognition policy.
Cost of Revenue
Our total cost of revenue is comprised of the following:
Cost of Product Revenue. Cost of product revenue primarily includes costs paid to our third-party contract manufacturers, which includes the costs of our components, and personnel costs associated with our manufacturing operations. Personnel costs consist of salaries, benefits, bonuses and stock-based compensation. Our cost of product revenue also includes warranty costs, freight and allocated overhead costs. Overhead costs consist of certain facilities, depreciation, benefits and IT costs. We expect our cost of product revenue to increase as our product revenue increases.
Cost of Support and Service Revenue. Cost of support and service revenue includes personnel costs associated with our global customer support organization, operation and administration of our service depots, cost from service inventory reserves and allocated overhead costs. Personnel costs consist of salaries, benefits, bonuses and stock-based compensation. Overhead costs consist of certain facilities, depreciation, benefits and IT costs. We expect our cost of support and service revenue to increase as our installed end-customer base grows.
Gross Margin
Gross margin, or gross profit as a percentage of total revenue, has been and will continue to be affected by a variety of factors, including the average sales price of our storage products and related support and service contracts, manufacturing and overhead costs, component costs, the mix of products sold, and our ability to leverage our existing infrastructure as we continue to grow. We expect our gross margins to fluctuate over time depending on the factors described above.
Operating Expenses
Our operating expenses consist of research and development, sales and marketing, and general and administrative expense. Personnel costs are the most significant component of operating expenses.
Research and Development. Research and development expense consists primarily of personnel costs and allocated overhead and also includes depreciation expense from property and equipment purchases, consulting and other costs to support our development activities. To date, we have expensed all research and development costs as incurred. We expect research and development expense to continue to increase in absolute dollars as we continue to invest in our research and product development efforts to enhance our product capabilities and access new customer markets, although such expense may fluctuate as a percentage of total revenue.
Sales and Marketing. Sales and marketing expense consists primarily of personnel costs, sales commission costs and allocated overhead. We expense sales commission costs as incurred. Sales and marketing expense also includes costs for recruiting and training channel partners, market development programs, promotional and other marketing activities, travel, office equipment, depreciation of proof-of-concept evaluation units and outside consulting costs. We expect sales and marketing expense to continue to increase in absolute dollars as we expand our sales and marketing headcount in all markets and expand our international operations, although such expense may fluctuate as a percentage of total revenue.
44
Table of Contents
Index to Financial Statements
General and Administrative. General and administrative expense consists of personnel costs, professional services and allocated overhead. General and administrative personnel include our executive, finance, human resources, administrative, IT, facilities and legal organizations. Professional services consist primarily of legal, auditing, accounting and other consulting costs. We expect general and administrative expense to continue to increase in absolute dollars as we have recently incurred, and expect to continue to incur, additional general and administrative expenses as we grow our operations and operate as a public company, including higher legal, corporate insurance and accounting expenses.
Interest Income and Other Expense, Net
Interest income consists of interest earned on our cash and cash equivalent balances. We have historically invested our cash in money-market funds. We expect interest income, which has not been historically significant to our operations, to vary each reporting period depending on our average investment balances during the period, types and mix of investments and market interest rates.
Other expense, net consists primarily of gains and losses from foreign currency transactions.
Provision for Income Taxes
Provision for income taxes consists primarily of state income taxes in the United States and income taxes in certain foreign jurisdictions in which we conduct business. We provide a full valuation allowance for deferred tax assets, which includes net operating loss, or NOL, carryforwards and tax credits related primarily to research and development. We expect to maintain this full valuation allowance for the foreseeable future as it is more likely than not that the assets will not be realized based on our history of losses. At January 31, 2014, we had federal and state NOL carryforwards of $73.2 million and $55.7 million that expire in 2034. Under Section 382 of the U.S. Internal Revenue Code of 1986, or the Code, a corporation that undergoes an “ownership change” is subject to limitations on its ability to utilize its pre-change NOLs to offset future taxable income. In September 2013, we completed an analysis to evaluate whether there are any limitations of our NOLs and concluded no limitations currently exist. While we do not believe that we have experienced an ownership change that would result in limitations, regulatory changes, such as suspension on the use of NOLs, could result in the expiration of our NOLs or otherwise cause them to be unavailable to offset future income tax liabilities.
45
Table of Contents
Index to Financial Statements
Results of Operations
The following tables summarize our consolidated results of operations for the periods presented and as a percentage of our total revenue for those periods. The period-to-period comparison of results is not necessarily indicative of results for future periods.
| Year Ended January 31, | ||||||||||||
| 2014 | 2013 | 2012 | ||||||||||
| (in thousands) | ||||||||||||
| Consolidated Statements of Operations Data: |
||||||||||||
| Revenue: |
||||||||||||
| Product |
$ | 112,812 | $ | 49,765 | $ | 13,113 | ||||||
| Support and service |
12,921 | 4,075 | 900 | |||||||||
|
|
|
|
|
|
|
|||||||
| Total revenue |
125,733 | 53,840 | 14,013 | |||||||||
| Cost of revenue: |
||||||||||||
| Product(1) |
36,231 | 17,266 | 5,233 | |||||||||
| Support and service(1) |
7,980 | 3,184 | 1,045 | |||||||||
|
|
|
|
|
|
|
|||||||
| Total cost of revenue |
44,211 | 20,450 | 6,278 | |||||||||
|
|
|
|
|
|
|
|||||||
| Total gross profit |
81,522 | 33,390 | 7,735 | |||||||||
| Operating expenses: |
||||||||||||
| Research and development(1) |
35,247 | 16,135 | 7,903 | |||||||||
| Sales and marketing(1) |
75,107 | 39,851 | 12,863 | |||||||||
| General and administrative(1) |
13,737 | 5,168 | 3,756 | |||||||||
|
|
|
|
|
|
|
|||||||
| Total operating expenses |
124,091 | 61,154 | 24,522 | |||||||||
|
|
|
|
|
|
|
|||||||
| Loss from operations |
(42,569 | ) | (27,764 | ) | (16,787 | ) | ||||||
| Interest income, net |
21 | 32 | 6 | |||||||||
| Other expense, net |
(150 | ) | (26 | ) | (4 | ) | ||||||
|
|
|
|
|
|
|
|||||||
| Loss before provision for income taxes |
(42,698 | ) | (27,758 | ) | (16,785 | ) | ||||||
| Provision for income taxes |
425 | 99 | 5 | |||||||||
|
|
|
|
|
|
|
|||||||
| Net loss |
$ | (43,123 | ) | $ | (27,857 | ) | $ | (16,790 | ) | |||
|
|
|
|
|
|
|
|||||||
| (1) | Includes stock-based compensation expense as follows: |
| Year Ended January 31, | ||||||||||||
| 2014 | 2013 | 2012 | ||||||||||
| (in thousands) | ||||||||||||
| Cost of product revenue |
$ | 232 | $ | 48 | $ | 10 | ||||||
| Cost of support and service revenue |
468 | 114 | 31 | |||||||||
| Research and development |
3,049 | 874 | 268 | |||||||||
| Sales and marketing |
3,674 | 1,029 | 244 | |||||||||
| General and administrative |
1,726 | 539 | 267 | |||||||||
|
|
|
|
|
|
|
|||||||
| Total stock-based compensation expense |
$ | 9,149 | $ | 2,604 | $ | 820 | ||||||
|
|
|
|
|
|
|
|||||||
46
Table of Contents
Index to Financial Statements
| Year Ended January 31, | ||||||||||||
| 2014 | 2013 | 2012 | ||||||||||
| Revenue: |
||||||||||||
| Product |
90 | % | 92 | % | 94 | % | ||||||
| Support and service |
10 | 8 | 6 | |||||||||
|
|
|
|
|
|
|
|||||||
| Total revenue |
100 | 100 | 100 | |||||||||
| Cost of revenue: |
||||||||||||
| Product |
29 | 32 | 37 | |||||||||
| Support and service |
6 | 6 | 8 | |||||||||
|
|
|
|
|
|
|
|||||||
| Total cost of revenue |
35 | 38 | 45 | |||||||||
|
|
|
|
|
|
|
|||||||
| Total gross profit |
65 | 62 | 55 | |||||||||
| Operating expenses: |
||||||||||||
| Research and development |
28 | 30 | 56 | |||||||||
| Sales and marketing |
60 | 74 | 92 | |||||||||
| General and administrative |
11 | 10 | 27 | |||||||||
|
|
|
|
|
|
|
|||||||
| Total operating expenses |
99 | 114 | 175 | |||||||||
|
|
|
|
|
|
|
|||||||
| Loss from operations |
(34 | ) | (52 | ) | (120 | ) | ||||||
| Interest income, net |
— | — | — | |||||||||
| Other expense, net |
— | — | — | |||||||||
|
|
|
|
|
|
|
|||||||
| Loss before provision for income taxes |
(34 | ) | (52 | ) | (120 | ) | ||||||
| Provision for income taxes |
— | — | — | |||||||||
|
|
|
|
|
|
|
|||||||
| Net loss |
(34 | )% | (52 | )% | (120 | )% | ||||||
|
|
|
|
|
|
|
|||||||
Comparison of the Years Ended January 31, 2014 and 2013
Revenue
| Year Ended January 31, |
||||||||||||||||
| 2014 | 2013 | Change | ||||||||||||||
| Amount | Amount | Amount | % | |||||||||||||
| (dollars in thousands) | ||||||||||||||||
| Revenue: |
||||||||||||||||
| Product |
$ | 112,812 | $ | 49,765 | $ | 63,047 | 127 | % | ||||||||
| Support and service |
12,921 | 4,075 | 8,846 | 217 | ||||||||||||
|
|
|
|
|
|
|
|||||||||||
| Total revenue |
$ | 125,733 | $ | 53,840 | $ | 71,893 | 134 | % | ||||||||
|
|
|
|
|
|
|
|||||||||||
Total revenue increased by $71.9 million, or 134%, during the year ended January 31, 2014 compared to the year ended January 31, 2013. The revenue growth reflects increased demand for our storage products and related support and service. The increase in product revenue was driven by higher sales of our storage products to 1,550 new end-customers and increased sales to existing customers from 25% in the year ended January 31, 2013 to 34% in the year ended January 31, 2014. During the year ended January 31, 2014, the total number of orders received greater than $100,000 increased by 236 from 130 in the year ended January 31, 2013 to 366 in the year ended January 31, 2014, which represented an increase of 182%. The increase in support and service revenue was driven by higher product sales and the resulting expansion of our installed base.
47
Table of Contents
Index to Financial Statements
Cost of Revenue and Gross Margin
| Year Ended January 31, |
||||||||||||||||
| 2014 | 2013 | Change | ||||||||||||||
| Amount | Amount | Amount | % | |||||||||||||
| (dollars in thousands) | ||||||||||||||||
| Cost of revenue: |
||||||||||||||||
| Product |
$ | 36,231 | $ | 17,266 | $ | 18,965 | 110 | % | ||||||||
| Support and service |
7,980 | 3,184 | 4,796 | 151 | ||||||||||||
|
|
|
|
|
|
|
|||||||||||
| Total cost of revenue |
$ | 44,211 | $ | 20,450 | $ | 23,761 | 116 | % | ||||||||
|
|
|
|
|
|
|
|||||||||||
| Gross margin |
64.8 | % | 62.0 | % | ||||||||||||
Cost of revenue increased by $23.8 million, or 116%, during the year ended January 31, 2014 compared to the year ended January 31, 2013. The increase in cost of product revenue was driven primarily by higher product sales. The increase in cost of product revenue was also impacted by higher costs of $2.3 million in our manufacturing operations, primarily driven by personnel costs associated with increased headcount. The increase in cost of support and service revenue was primarily attributable to higher costs of $3.7 million in our global customer support organization primarily driven by personnel costs associated with increased headcount and increased investments in our service depots, which are physical warehouse locations that hold service inventory in support of our customer service agreements.
Gross margin increased from 62.0% during the year ended January 31, 2013 to 64.8% during the year ended January 31, 2014 primarily as a result of higher product gross margin. Product gross margin increased by 2.6 percentage points from 65.3% to 67.9% during the year ended January 31, 2014 compared to the year ended January 31, 2013, primarily driven by our mix of products sold, lower average standard component costs from higher volume discounts and benefit from economies of scale as we improved the utilization of our existing infrastructure. Support and service gross margin increased by 16.3 percentage points from 21.9% to 38.2% during the year ended January 31, 2014 compared to the year ended January 31, 2013, due to increased recognition of deferred support and service revenue resulting from the increase in our installed base.
Operating Expenses
| Year Ended January 31, | ||||||||||||||||||||||||
| 2014 | 2013 | Change | ||||||||||||||||||||||
| Amount | % of Total Revenue |
Amount | % of Total Revenue |
Amount | % | |||||||||||||||||||
| (dollars in thousands) | ||||||||||||||||||||||||
| Operating expenses: |
||||||||||||||||||||||||
| Research and development |
$ | 35,247 | 28 | % | $ | 16,135 | 30 | % | $ | 19,112 | 118 | % | ||||||||||||
| Sales and marketing |
75,107 | 60 | 39,851 | 74 | 35,256 | 88 | ||||||||||||||||||
| General and administrative |
13,737 | 11 | 5,168 | 10 | 8,569 | 166 | ||||||||||||||||||
|
|
|
|
|
|
|
|
|
|
|
|||||||||||||||
| Total operating expenses |
$ | 124,091 | 99 | % | $ | 61,154 | 114 | % | $ | 62,937 | 103 | % | ||||||||||||
|
|
|
|
|
|
|
|
|
|
|
|||||||||||||||
| Includes stock-based compensation expense of: |
||||||||||||||||||||||||
| Research and development |
$ | 3,049 | $ | 874 | $ | 2,175 | 249 | % | ||||||||||||||||
| Sales and marketing |
3,674 | 1,029 | 2,645 | 257 | ||||||||||||||||||||
| General and administrative |
1,726 | 539 | 1,187 | 220 | ||||||||||||||||||||
|
|
|
|
|
|
|
|||||||||||||||||||
| Total |
$ | 8,449 | $ | 2,442 | $ | 6,007 | 246 | % | ||||||||||||||||
|
|
|
|
|
|
|
|||||||||||||||||||
48
Table of Contents
Index to Financial Statements
Research and Development
Research and development expense increased by $19.1 million, or 118%, during the year ended January 31, 2014 compared to the year ended January 31, 2013. The increase was primarily due to a $14.9 million increase in personnel costs, including stock-based compensation, resulting from headcount growth to support further development of our storage products, $2.4 million increase in allocated overhead resulting from higher facilities utilization, and $0.9 million increase in depreciation expense from property and equipment purchases as we further invest in our laboratory and test infrastructure.
Sales and Marketing
Sales and marketing expense increased by $35.3 million, or 88%, during the year ended January 31, 2014 compared to the year ended January 31, 2013. The increase was primarily due to a $21.0 million increase in personnel costs, including stock-based compensation, resulting from headcount growth, a $3.7 million increase in commission expense related to higher sales, a $3.3 million increase in travel and entertainment expenses and a $1.7 million increase in advertising and tradeshow expenses.
General and Administrative
General and administrative expense increased by $8.6 million, or 166%, during the year ended January 31, 2014 compared to the year ended January 31, 2013. The increase was primarily due to a $5.9 million increase in personnel costs, including stock-based compensation, resulting from headcount growth and a $2.7 million increase in spending on consulting resources and professional services.
Interest Income and Other Income (Expense), Net
| Year Ended January 31, |
Change | |||||||||||||||
| 2014 | 2013 | Amount | % | |||||||||||||
| (dollars in thousands) | ||||||||||||||||
| Interest income, net |
$ | 21 | $ | 32 | $ | (11) | (34 | )% | ||||||||
| Other expense, net |
(150 | ) | (26 | ) | (124) | (477 | )% | |||||||||
The decrease in interest income, net was primarily due to the commitment fee for the line of credit during the year ended January 31, 2014, partially offset by an increase in interest income, primarily due to higher cash and cash equivalent balances.
Other expense, net consisted primarily of foreign currency remeasurement losses as a result of the US dollar strengthening during the year ended January 31, 2014. This resulted in remeasurement losses on our foreign currency denominated assets.
Provision for Income Taxes
| Year Ended January 31, |
||||||||
| 2014 | 2013 | |||||||
| (in thousands) | ||||||||
| Provision for income taxes |
$ | 425 | $ | 99 | ||||
The increase in the provision for income taxes during the year ended January 31, 2014 compared to the year ended January 31, 2013 was primarily due to an increase in foreign taxes related to intercompany cost plus agreements with our international sales offices.
49
Table of Contents
Index to Financial Statements
Comparison of the Years Ended January 31, 2013 and 2012
Revenue
| Year Ended January 31, | ||||||||||||||||
| 2013 | 2012 | Change | ||||||||||||||
| Amount | Amount | Amount | % | |||||||||||||
| (dollars in thousands) | ||||||||||||||||
| Revenue: |
||||||||||||||||
| Product |
$ | 49,765 | $ | 13,113 | $ | 36,652 | 280 | % | ||||||||
| Support and service |
4,075 | 900 | 3,175 | 353 | ||||||||||||
|
|
|
|
|
|
|
|||||||||||
| Total revenue |
$ | 53,840 | $ | 14,013 | $ | 39,827 | 284 | % | ||||||||
|
|
|
|
|
|
|
|||||||||||
Total revenue increased by $39.8 million, or 284%, during the year ended January 31, 2013 compared to the year ended January 31, 2012. The revenue growth reflects increased demand for our storage products and related support and service. The increase in product revenue was driven by higher sales of our storage products to 819 new end-customers and increased sales to existing customers from 19% in the year ended January 31, 2012 to 25% in the year ended January 31 2013. During the year ended January 31, 2013, the total number of product orders received greater than $100,000 increased by 98 from 32 in the year ended January 31, 2012 to 130 in the year ended January 31, 2013, which represented an increase of 306%. The increase in support and service revenue was driven by higher product sales and the renewal of existing support and service contracts from our installed base.
Cost of Revenue and Gross Margin
| Year Ended January 31, | ||||||||||||||||
| 2013 | 2012 | Change | ||||||||||||||
| Amount | Amount | Amount | % | |||||||||||||
| (dollars in thousands) | ||||||||||||||||
| Cost of revenue: |
||||||||||||||||
| Product |
$ | 17,266 | $ | 5,233 | $ | 12,033 | 230 | % | ||||||||
| Support and service |
3,184 | 1,045 | 2,139 | 205 | ||||||||||||
|
|
|
|
|
|
|
|||||||||||
| Total cost of revenue |
$ | 20,450 | $ | 6,278 | $ | 14,172 | 226 | % | ||||||||
|
|
|
|
|
|
|
|||||||||||
| Gross margin |
62.0 | % | 55.2 | % | ||||||||||||
Total cost of revenue increased by $14.2 million, or 226%, during the year ended January 31, 2013 compared to the year ended January 31, 2012. The increase in cost of product revenue was driven primarily by the higher product sales. The increase in cost of product revenue was also impacted by higher costs of $1.0 million in our manufacturing operations, primarily driven by personnel costs associated with increased headcount, a $0.7 million increase in warranty expense and a $0.7 million increase in freight costs. The increase in cost of support and service revenue was primarily attributable to higher costs of $2.0 million in our global customer support organization primarily driven by personnel costs associated with increased headcount and increased investments in our service depots.
Gross margin increased from 55.2% during the year ended January 31, 2012 to 62.0% during the year ended January 31, 2013. Product gross margin increased by 5.2 percentage points from 60.1% to 65.3% during the year ended January 31, 2013 compared to the year ended January 31, 2012, primarily driven by higher sales volume, our mix of products sold, lower average standard component costs from higher volume discounts and benefit from economies of scale as we improved the utilization of our existing infrastructure. Support and service gross margin increased by 38.0 percentage points due to increased recognition of deferred support and service revenue.
50
Table of Contents
Index to Financial Statements
Operating Expenses
| Year Ended January 31, | ||||||||||||||||||||||||
| 2013 | 2012 | Change | ||||||||||||||||||||||
| Amount | % of Total Revenue |
Amount | % of Total Revenue |
Amount | % | |||||||||||||||||||
| (dollars in thousands) | ||||||||||||||||||||||||
| Operating expenses: |
||||||||||||||||||||||||
| Research and development |
$ | 16,135 | 30 | % | $ | 7,903 | 56 | % | $ | 8,232 | 104 | % | ||||||||||||
| Sales and marketing |
39,851 | 74 | 12,863 | 92 | 26,988 | 210 | ||||||||||||||||||
| General and administrative |
5,168 | 10 | 3,756 | 27 | 1,412 | 38 | ||||||||||||||||||
|
|
|
|
|
|
|
|||||||||||||||||||
| Total operating expenses |
$ | 61,154 | 114 | % | $ | 24,522 | 175 | % | $ | 36,632 | 149 | % | ||||||||||||
|
|
|
|
|
|
|
|||||||||||||||||||
| Includes stock-based compensation expense of: |
||||||||||||||||||||||||
| Research and development |
$ | 874 | $ | 268 | $ | 606 | 226 | % | ||||||||||||||||
| Sales and marketing |
1,029 | 244 | 785 | 322 | ||||||||||||||||||||
| General and administrative |
539 | 267 | 272 | 102 | ||||||||||||||||||||
|
|
|
|
|
|
|
|||||||||||||||||||
| Total |
$ | 2,442 | $ | 779 | $ | 1,663 | 213 | % | ||||||||||||||||
|
|
|
|
|
|
|
|||||||||||||||||||
Research and Development
Research and development expense increased by $8.2 million, or 104%, during the year ended January 31, 2013 compared to the year ended January 31, 2012. The increase was primarily due to a $6.3 million increase in personnel costs, including stock-based compensation, resulting from headcount growth to support further development of our storage products.
Sales and Marketing
Sales and marketing expense increased by $27.0 million, or 210%, during the year ended January 31, 2013 compared to the year ended January 31, 2012. The increase was primarily due to an $11.4 million increase in personnel costs, including stock-based compensation, resulting from headcount growth, a $10.0 million increase in commission expense related to higher sales, a $2.0 million increase in travel and entertainment expenses and a $1.1 million increase in advertising and tradeshow expenses.
General and Administrative
General and administrative expense increased by $1.4 million, or 38%, during the year ended January 31, 2013 compared to the year ended January 31, 2012. The increase was primarily due to a $2.2 million increase in personnel costs, including stock-based compensation, resulting from headcount growth, offset by $0.9 million in certain legal costs in the year ended January 31, 2012.
Interest Income and Other Income (Expense), Net
| Year Ended January 31, | Change | |||||||||||||||
| 2013 | 2012 | Amount | % | |||||||||||||
| (dollars in thousands) | ||||||||||||||||
| Interest income, net |
$ | 32 | $ | 6 | $ | 26 | 433 | % | ||||||||
| Other expense, net |
(26 | ) | (4 | ) | (22 | ) | 550 | |||||||||
The increase in interest income resulted from higher average cash and cash equivalents balances during the year ended January 31, 2013 compared to the year ended January 31, 2012. The increase in other income (expense), net was due to fluctuations in the British pound sterling.
51
Table of Contents
Index to Financial Statements
Provision for Income Taxes
| Year Ended January 31, | ||||||||
| 2013 | 2012 | |||||||
| (in thousands) | ||||||||
| Provision for income taxes |
$ | 99 | $ | 5 | ||||
The increase in provision for income taxes during the year ended January 31, 2013 compared to the year ended January 31, 2012 was primarily due to an increase in foreign taxes related to intercompany cost plus agreements with our international sales offices.
Liquidity and Capital Resources
| As of January 31, | ||||||||||||
| 2014 | 2013 | 2012 | ||||||||||
| (in thousands) | ||||||||||||
| Cash and cash equivalents |
$ | 208,486 | $ | 49,205 | $ | 28,796 | ||||||
| Year Ended January 31, | ||||||||||||
| 2014 | 2013 | 2012 | ||||||||||
| (dollars in thousands) | ||||||||||||
| Cash used in operating activities |
$ | (6,742 | ) | $ | (18,754 | ) | $ | (14,841 | ) | |||
| Cash used in investing activities |
(17,486 | ) | (3,554 | ) | (1,283 | ) | ||||||
| Cash provided by financing activities |
183,501 | 42,700 | 25,935 | |||||||||
| Foreign exchange impact on cash and cash equivalents |
8 | 17 | — | |||||||||
|
|
|
|
|
|
|
|||||||
| Net increase in cash and cash equivalents |
$ | 159,281 | $ | 20,409 | $ | 9,811 | ||||||
|
|
|
|
|
|
|
|||||||
| Other Financial and Operational Metrics: |
||||||||||||
| Days Sales Outstanding |
39 | 53 | 65 | |||||||||
| Days Sales Inventory(1) |
41 | 55 | 62 | |||||||||
| (1) | Average number of days we hold our inventory before sale. |
At January 31, 2014, our cash and cash equivalents were $208.5 million, of which approximately $0.6 million was held outside of the United States and not immediately available to fund domestic operations and obligations. We do not enter into investments for trading or speculative purposes.
In October 2013, we entered into an agreement with Wells Fargo Bank, National Association, or Wells Fargo, to provide a secured revolving credit facility that allows us to borrow up to $15.0 million for general corporate purposes. Amounts outstanding under the credit facility will bear interest at Wells Fargo’s prime rate with accrued interest payable on a monthly basis. In addition, we are obligated to pay a commitment fee of 0.20% per annum on the unused portion of the credit facility, with such fee payable on a quarterly basis. The credit facility expires in October 2014. As part of the credit facility, we granted to Wells Fargo a first priority lien in our accounts receivable and other corporate assets, agreed to not pledge our intellectual property to other parties and became subject to certain reporting and financial covenants, including: (1) maintaining specified quarterly levels of EBITDA, which is defined as net income before tax plus interest expense (net of capitalized interest expense), depreciation expense and non-cash stock compensation expense; and (2) maintaining a monthly ratio of not less than 1.25 to 1.00, based on the aggregate of our cash and net accounts receivable divided by total current liabilities minus current deferred revenue. As of January 31, 2014, no amounts had been drawn against the credit facility.
In December 2013, we completed an initial public offering of common stock, raising net proceeds of $176.7 million.
52
Table of Contents
Index to Financial Statements
We believe that our existing cash and cash equivalents will be sufficient to meet our anticipated cash needs for at least the next 12 months. Our future capital requirements will depend on many factors, including our growth rate, the timing and extent of spending to support development efforts, the expansion of sales and marketing activities, the introduction of new and enhanced product and service offerings, and the continuing market acceptance of our products. In the event that additional financing is required from outside sources, we may not be able to raise such financing on terms acceptable to us or at all. If we are unable to raise additional capital when desired, our business, operating results and financial condition would be adversely affected.
Operating Activities
During the year ended January 31, 2014, cash used in operating activities was $6.7 million. The primary factors affecting our cash flows from operations during this period were our net loss of $43.1 million, partially offset by non-cash charges of $9.1 million for stock-based compensation and $4.2 million for depreciation of our property and equipment, and net cash flows of $22.6 million provided by changes in our operating assets and liabilities. The primary driver of the changes in operating assets and liabilities was a $22.6 million increase in deferred revenue. The increase in deferred revenue was due to a greater number of support and service contracts related to the growth in our storage product sales and increased renewal of existing support and service contracts associated with our larger installed product base. Changes in our operating assets and liabilities were also significantly affected by a $7.5 million increase in accounts payable and accrued liabilities, a $4.1 million increase in accounts receivable, a $2.2 million increase in prepaid expenses and a $1.3 million increase in inventories. The increase in accounts payable and accrued liabilities was primarily attributable to increased personnel costs to support the overall growth of our business and higher third-party professional fees for consulting and audit services as a result of our initial public offering. The increase in accounts receivable was attributable to increased sales, partially offset by improved cash collections from our customers as supported by the decrease in days sales outstanding, or DSO, as compared to the year ended January 31, 2013. The increase in inventories was primarily due to increased purchases from our contract manufacturers and the higher overall demand for our storage products. We expect operating cash flows to continue to be affected by timing of sales and timing of collections.
During the year ended January 31, 2013, cash used in operating activities was $18.8 million. The primary factors affecting our cash flows during this period were our net loss of $27.9 million, partially offset by non-cash charges of $2.6 million for stock-based compensation, and $1.1 million for depreciation of our property and equipment, and net cash flows of $5.0 million provided by changes in our operating assets and liabilities. The primary drivers of the changes in operating assets and liabilities were a $9.2 million increase in accounts receivable, partially offset by an $8.9 million increase in deferred revenue. The increase in accounts receivable was attributable to increased sales, partially offset by improved cash collections from our customers as supported by the year over year decrease in DSO. We expect operating cash flows to continue to be affected by timing of sales and timing of collections. The increase in deferred revenue was due to a greater number of support and service contracts related to the growth in our storage product sales and increased renewal of existing support and service contracts associated with our larger installed product base. Changes in our operating assets and liabilities were also significantly affected by an $8.9 million increase in accounts payable and accrued liabilities and a $3.0 million increase in inventories. The increase in accounts payable and accrued liabilities was primarily attributable to increased personnel costs to support the overall growth of our business and higher third-party professional fees for consulting and audit services as we prepared for our initial public offering. The increase in inventories was primarily due to increased purchases from our contract manufacturers to support the development of new storage products in the third quarter of the year ended January 31, 2013 and the higher overall demand for our storage products.
53
Table of Contents
Index to Financial Statements
During the year ended January 31, 2012, cash used in operating activities was $14.8 million. The primary factors affecting our cash flows during this period were our net loss of $16.8 million, partially offset by a non-cash charge of $0.8 million for stock-based compensation, and net cash flows of $0.8 million provided by changes in certain of our operating assets and liabilities. The primary drivers of the changes in operating assets and liabilities were a $4.5 million increase in accounts payable and accrued liabilities, partially offset by a $3.5 million increase in accounts receivable. The increase in accounts payable and accrued liabilities was primarily attributable to increased personnel costs to support our first full year of production. The increase in accounts receivable was due to increased sales from our first full year of production, partially offset by improved cash collections from customers as reflected in the year over year decrease in DSO.
Investing Activities
Cash used in investing activities during the year ended January 31, 2014 was $17.5 million, primarily resulting from $13.6 million used to purchase property and equipment due to an increase in leasehold improvements related our new corporate headquarters, and the increase in expansion of our research and development infrastructure. Cash used in investing activities was also impacted by a $3.9 million increase in restricted cash related to a condition of our facility lease agreement of our new corporate headquarters that requires us to maintain a letter of credit, with the landlord named as the beneficiary. Cash used in investing activities for the years ended January 31, 2013 and 2012 was $3.6 million and $1.3 million, primarily resulting from the purchase of property and equipment. We expect to continue to make such purchases to support continued growth of our business.
Financing Activities
During the year ended January 31, 2014, financing activities provided $183.5 million in cash. In December 2013, we completed our initial public offering, which generated net proceeds of $176.7 million. We received $5.2 million of proceeds from the exercise of stock options, net of repurchases of unvested early exercised shares, and $1.6 million of proceeds from the repayment of two stockholder loans.
During the year ended January 31, 2013, financing activities provided $42.7 million in cash, primarily from $40.6 million of net proceeds received from the issuance of Series E redeemable convertible preferred stock and $2.1 million of proceeds from the exercise of stock options, net of repurchases of unvested early exercised shares.
During the year ended January 31, 2012, financing activities provided $25.9 million in cash, primarily from $24.9 million of net proceeds received from the issuance of Series D redeemable convertible preferred stock and $1.0 million of proceeds from the exercise of stock options, net of repurchases of unvested early exercised shares.
Contractual Obligations and Commitments
The following summarizes our contractual obligations and commitments as of January 31, 2014:
| Payments Due by Period | ||||||||||||||||||||
| Total | Less Than 1 Year |
1 - 3 Years |
3 - 5 Years |
More Than 5 Years |
||||||||||||||||
| (in thousands) | ||||||||||||||||||||
| Operating leases(1) |
$ | 36,780 | $ | 4,052 | $ | 9,293 | $ | 9,538 | $ | 13,897 | ||||||||||
| Purchase commitments(2) |
11,333 | 11,333 | — | — | — | |||||||||||||||
| License commitments(3) |
2,830 | 2,080 | 750 | — | — | |||||||||||||||
| Asset retirement obligations(4) |
342 | — | — | — | 342 | |||||||||||||||
|
|
|
|
|
|
|
|
|
|
|
|||||||||||
| Total |
$ | 51,285 | $ | 17,465 | $ | 10,043 | $ | 9,538 | $ | 14,239 | ||||||||||
|
|
|
|
|
|
|
|
|
|
|
|||||||||||
54
Table of Contents
Index to Financial Statements
| (1) | We have several operating leases in the US and at various international locations. This includes a 96-month lease commenced on November 1, 2013 for a 164,608 square foot facility in San Jose, California. Future minimum commitments under these operating leases are as follows (in thousands): |
| Years ending January 31: |
||||
| 2015 |
$ | 4,052 | ||
| 2016 |
4,603 | |||
| 2017 |
4,690 | |||
| 2018 |
4,710 | |||
| 2019 |
4,828 | |||
| Thereafter |
13,897 | |||
|
|
|
|||
| $ | 36,780 | |||
|
|
|
| (2) | During the year ended January 31, 2014, we entered into purchase commitments of $11.3 million to fulfill inventory requirements. |
| (3) | During the year ended January 31, 2013, we entered into two non-cancelable three-year software license and service agreements for the internal use of software and services for customer relationship management and desktop applications. During the year ended January 31, 2014, we entered into two additional non-cancelable two to three years software license and service agreements for internal use of software and services for human resource and inventory forecasting applications. |
| (4) | During the year ended January 31, 2014, we incurred asset retirement obligations of $0.3 million associated with our facility lease in California, which expires in October 2021. This obligation is included in other noncurrent liabilities in the consolidated balance sheet as of January 31, 2014. |
As of January 31, 2014, we had $2.0 million of unrecognized tax benefits, including interest and penalties, related to uncertain tax positions. Because of the high degree of uncertainty regarding the settlement of these liabilities, we are unable to estimate the years in which future cash outflows may occur. As a result, this amount is not included in the table above.
Off-Balance Sheet Arrangements
As of January 31, 2014 and 2013, we did not have any relationships with unconsolidated entities or financial partnerships, such as structured finance or special purpose entities that were established for the purpose of facilitating off-balance sheet arrangements or other purposes.
Segment Information
We have one primary business activity and operate in one reportable segment.
ITEM 7A. Quantitative and Qualitative Disclosures about Market Risk
Foreign Currency Exchange Risk
Our sales contracts are primarily denominated in U.S. dollars with a small number of contracts denominated in foreign currencies. A portion of our operating expenses are incurred outside the United States and denominated in foreign currencies and are subject to fluctuations due to changes in foreign currency exchange rates, particularly changes in the British pound sterling, Australian dollar and Canadian dollar. These fluctuations have caused us to recognize transaction losses of $149,000 and $26,000 during the years ended January 31, 2014 and 2013. Although the volatility of exchange rates depends on many factors that we cannot forecast with reliable accuracy, we believe a hypothetical 10% change of the U.S. dollar against the British pound sterling, Australian dollar or Canadian dollar, either alone or in combination with each other would not have a material impact on our results of operations. Given that the impact of foreign currency exchange rates to date has not been material, we have not engaged in any attempts to hedge our foreign currency exchange risk. As our international operations grow, we will continue to reassess our approach to managing the risks relating to fluctuations in currency rates. It is difficult to predict the impact hedging activities would have on our results of operations.
55
Table of Contents
Index to Financial Statements
Interest Rate Risk
We had cash and cash equivalents of $208.5 million as of January 31, 2014, consisting of bank deposits. Such interest-earning instruments carry a degree of interest rate risk. To date, fluctuations in interest income have not been significant.
We do not enter into investments for trading or speculative purposes and have not used any derivative financial instruments to manage our interest rate risk exposure. We have not been exposed to, nor do we anticipate being exposed to, material risks due to changes in interest rates. A hypothetical 10% change in interest rates during any of the periods presented would not have had a material impact on our financial statements.
Critical Accounting Policies and Estimates
Our consolidated financial statements have been prepared in accordance with GAAP. The preparation of these consolidated financial statements requires us to make estimates and assumptions that affect the reported amounts of assets, liabilities, revenue and expenses, and related disclosures. We base our estimates on historical experience and on various other assumptions that we believe are reasonable under the circumstances. We evaluate our estimates and assumptions on an ongoing basis. Actual results may differ from these estimates. To the extent that there are material differences between these estimates and our actual results, our future financial statements will be affected.
The critical accounting policies requiring estimates, assumptions, and judgments that we believe have the most significant impact on our consolidated financial statements are described below.
Revenue Recognition
We generate revenue from sales of software-enabled storage products and related support and service. Our software that is integrated into the storage products is more than incidental, and functions together with the storage product to deliver its essential functionality. We also offer an optional support and service plan with a typical term of one to five years. The support plan includes automated support (Proactive Wellness), bug fixes, updates and upgrades to product firmware and our management platform, including InfoSight, telephone support and expedited delivery times for replacement hardware parts. While support is not contractually mandatory, substantially all products shipped have been purchased together with a support and service plan. We also periodically sell optional installation services with our products that are not essential to the functionality of the storage product. Substantially all of our customer arrangements contain multiple deliverables. As a result, arrangements are divided into separate units of accounting based on whether the delivered items have stand-alone value. In our typical customer arrangements, we consider the following to be separate units of accounting: the storage product (together with the integrated software), support services and installation services. We have determined that each unit of accounting has stand-alone value because they are sold separately by us or could be resold by a customer on a stand-alone basis. We allocate the total consideration to all deliverables based on our determination of the units of accounting and their relative selling prices. As we have not yet established vendor-specific objective evidence (VSOE) or identified third-party evidence of fair value for our storage product (together with the integrated software) and installation services, we use the best estimate of the selling price (BESP) of each deliverable to allocate the total arrangement fee among the separate units of accounting. Our process to determine its BESP for our products and services is based on qualitative and quantitative considerations of multiple factors, which primarily include historical stand-alone sales, margin objectives and discount behavior. Additional considerations are given to factors such as customer demographics, competitive alternatives, anticipated sales volume, costs to manufacture products or provide services, pricing practices and market conditions. During the first quarter of the year ended January 31, 2013, we established VSOE of fair value for support services based on stand-alone
56
Table of Contents
Index to Financial Statements
renewals offered to our customers. As a result, beginning in the second quarter of the year ended January 31, 2013, we allocated the fair value of consideration related to support services based on VSOE of fair value for the support services. Prior to this change, we allocated consideration related to support service based on BESP. The effect of the change from BESP to VSOE of fair value for support services did not have a material impact on the allocation of consideration.
Revenue is recognized when all of the following criteria are met:
| • | Persuasive Evidence of an Arrangement Exists. We rely upon non-cancelable sales agreements and purchase orders to determine the existence of an arrangement. |
| • | Delivery Has Occurred. We use shipping documents to verify delivery. |
| • | The Fee Is Fixed or Determinable. We assess whether the fee is fixed or determinable based on the payment terms associated with the transaction. |
| • | Collectability Is Reasonably Assured. We assess collectability based on credit analysis and payment history. |
Stock-Based Compensation
Compensation expense related to stock-based transactions, including employee and non-employee director stock options, is measured and recognized in the financial statements based on the fair value of the awards granted. The fair value of each option award and purchases under our 2013 Employee Stock Purchase Plan (2013 ESPP) is estimated on the grant date using the Black-Scholes-Merton option-pricing model. Stock-based compensation expense is recognized, net of forfeitures, over the requisite service periods of the awards, which is generally four years for stock options, and six months to two years for stock purchased under our 2013 ESPP.
Our use of the Black-Scholes-Merton option-pricing model requires the input of highly subjective assumptions, including the fair value of the underlying common stock, the expected term of the option, the expected volatility of the price of our common stock, risk-free interest rates and the expected dividend yield of our common stock. The assumptions used in our option-pricing model represent management’s best estimates. These estimates involve inherent uncertainties and the application of management’s judgment. If factors change and different assumptions are used, our stock-based compensation expense could be materially different in the future.
These assumptions and estimates are as follows:
| • | Fair Value of Common Stock. Prior to our initial public offering in December 2013, we estimated the fair value of common stock using various valuation methodologies, including valuation analyses performed by third-party valuation firms. After the initial public offering, we used the publicly quoted price as the fair value of our common stock. |
| • | Risk-Free Interest Rate. We base the risk-free interest rate used in the Black-Scholes-Merton option-pricing model on the implied yield available on U.S. Treasury zero-coupon issues with a remaining term equivalent to that of the options for each option group. |
| • | Expected Term. The expected term represents the period that our stock-based awards are expected to be outstanding. We base the expected term assumption on our historical exercise behavior combined with estimates of the post-vesting holding period. |
| • | Volatility. We determine the price volatility factor based on the historical volatilities of our publicly traded peer group as we do not have a sufficient trading history for our common stock. Industry peers consist of several public companies in the technology industry that are similar to us in size, stage of life cycle, and financial leverage. We did not rely on implied volatilities of traded options in our industry peers’ common stock because the volume of activity was relatively low. We intend to continue to consistently apply this process using the same or |
57
Table of Contents
Index to Financial Statements
| similar public companies until a sufficient amount of historical information regarding the volatility of our own common stock share price becomes available, or unless circumstances change such that the identified companies are no longer similar to us, in which case, more suitable companies whose share prices are publicly available would be utilized in the calculation. |
| • | Dividend Yield. The expected dividend assumption is based on our current expectations about our anticipated dividend policy. Consequently, we used an expected dividend yield of zero. |
We estimate the fair value of the RSUs using the closing market price of our common stock on the date of grant. RSUs typically vest over a four-year period.
In addition to the assumptions used in the Black-Scholes-Merton option-pricing model, we must also estimate a forfeiture rate to calculate the stock-based compensation expense for our awards. Our forfeiture rate is based on an analysis of our actual forfeitures. We will continue to evaluate the appropriateness of the forfeiture rate based on actual forfeiture experience, analysis of employee turnover and other factors. Quarterly changes in the estimated forfeiture rate can have a significant impact on our stock-based compensation expense as the cumulative effect of adjusting the rate is recognized in the period the forfeiture estimate is changed. If a revised forfeiture rate is higher than the previously estimated forfeiture rate, an adjustment is made that will result in a decrease to the stock-based compensation expense recognized in the financial statements. If a revised forfeiture rate is lower than the previously estimated forfeiture rate, an adjustment is made that will result in an increase to the stock-based compensation expense recognized in the financial statements.
We will continue to use judgment in evaluating the assumptions related to our stock-based compensation on a prospective basis. As we continue to accumulate additional data related to our common stock, we may have refinements to our estimates, which could materially impact our future stock-based compensation expense.
Income Taxes
We account for income taxes using the asset and liability method, which requires the recognition of deferred tax assets and liabilities for the expected future tax consequences of events that have been recognized in our financial statements or tax returns. In addition, deferred tax assets are recorded for the future benefit of utilizing net operating losses and research and development credit carryforwards. Valuation allowances are provided when necessary to reduce deferred tax assets to the amount expected to be realized.
We apply the authoritative accounting guidance prescribing a threshold and measurement attribute for the financial recognition and measurement of a tax position taken or expected to be taken in a tax return. We recognize liabilities for uncertain tax positions based on a two-step process. The first step is to evaluate the tax position for recognition by determining if the weight of available evidence indicates that it is more likely than not that the position will be sustained on audit, including resolution of related appeals or litigation processes, if any. The second step requires us to estimate and measure the tax benefit as the largest amount that is more than 50% likely to be realized upon ultimate settlement.
Significant judgment is required in evaluating our uncertain tax positions and determining our provision for income taxes. Although we believe our judgments are reasonable, no assurance can be given that the final tax outcome of these matters will not be different from that which is reflected in our historical income tax provisions and accruals. We adjust these reserves in light of changing facts and circumstances, such as the closing of a tax audit or the refinement of an estimate. To the extent that the final tax outcome of these matters is different than the amounts recorded, such differences may impact the provision for income taxes in the period in which such determination is made.
58
Table of Contents
Index to Financial Statements
Significant judgment is also required in determining any valuation allowance recorded against deferred tax assets. In assessing the need for a valuation allowance, we consider all available evidence, including past operating results, estimates of future taxable income, and the feasibility of tax planning strategies. In the event that we change our determination as to the amount of deferred tax assets that can be realized, we will adjust our valuation allowance with a corresponding impact to the provision for income taxes in the period in which such determination is made.
Estimates of future taxable income are based on assumptions that are consistent with our plans. Assumptions represent management’s best estimates and involve inherent uncertainties and the application of management’s judgment. Should actual amounts differ from our estimates, the amount of our tax expense and liabilities could be materially impacted.
Recent Accounting Pronouncements
In July 2013, the Financial Accounting Standards Board (FASB) released Accounting Standards Update (ASU) No. 2013-11, Presentation of an Unrecognized Tax Benefit When a Net Operating Loss Carryforward, a Similar Tax Loss, or a Tax Credit Carryforward Exists. The new standard requires that an unrecognized tax benefit should be presented as a reduction of a deferred tax asset for a net operating loss carryforward or other tax credit carryforward when settlement in this manner is available under the tax law. We are required to adopt this standard starting fiscal year 2015 and are currently in the process of determining the impact, if any, on our financial position.
59
Table of Contents
Index to Financial Statements
ITEM 8. FINANCIAL STATEMENTS AND SUPPLEMENTARY DATA
INDEX TO CONSOLIDATED FINANCIAL STATEMENTS
| Page | ||||
| 61 | ||||
| 62 | ||||
| 63 | ||||
| 64 | ||||
| Consolidated Statements of Redeemable Convertible Preferred Stock and Stockholders’ Equity (Deficit) |
65 | |||
| 66 | ||||
| 67 | ||||
60
Table of Contents
Index to Financial Statements
REPORT OF INDEPENDENT REGISTERED PUBLIC ACCOUNTING FIRM
The Board of Directors and Stockholders
Nimble Storage, Inc.
We have audited the accompanying consolidated balance sheets of Nimble Storage, Inc. as of January 31, 2014 and 2013, and the related consolidated statements of operations, comprehensive loss, redeemable convertible preferred stock and stockholders’ equity (deficit), and cash flows for each of the three years in the period ended January 31, 2014. These financial statements are the responsibility of the Company’s management. Our responsibility is to express an opinion on these financial statements based on our audits.
We conducted our audits in accordance with the standards of the Public Company Accounting Oversight Board (United States). Those standards require that we plan and perform the audit to obtain reasonable assurance about whether the financial statements are free of material misstatement. We were not engaged to perform an audit of the Company’s internal control over financial reporting. Our audits included consideration of internal control over financial reporting as a basis for designing audit procedures that are appropriate in the circumstances, but not for the purpose of expressing an opinion on the effectiveness of the Company’s internal control over financial reporting. Accordingly, we express no such opinion. An audit also includes examining, on a test basis, evidence supporting the amounts and disclosures in the financial statements, assessing the accounting principles used and significant estimates made by management, and evaluating the overall financial statement presentation. We believe that our audits provide a reasonable basis for our opinion.
In our opinion, the financial statements referred to above present fairly, in all material respects, the consolidated financial position of Nimble Storage, Inc. at January 31, 2014 and 2013, and the consolidated results of its operations and its cash flows for each of the three years in the period ended January 31, 2014, in conformity with U.S. generally accepted accounting principles.
/s/ Ernst & Young LLP
San Jose, California
April 17, 2014
61
Table of Contents
Index to Financial Statements
Nimble Storage, Inc.
(in thousands, except per share data)
| As of January 31 | ||||||||
| 2014 | 2013 | |||||||
| Assets |
||||||||
| Current assets: |
||||||||
| Cash and cash equivalents |
$ | 208,486 | $ | 49,205 | ||||
| Accounts receivable, net of allowance for doubtful accounts of $76 and $20 as of January 31, 2014 and 2013, respectively |
17,676 | 13,725 | ||||||
| Inventories |
5,412 | 4,359 | ||||||
| Prepaid expenses and other current assets |
3,176 | 1,153 | ||||||
|
|
|
|
|
|||||
| Total current assets |
234,750 | 68,442 | ||||||
| Property and equipment, net |
20,209 | 4,061 | ||||||
| Restricted cash, non-current |
3,900 | — | ||||||
| Other long-term assets |
212 | 60 | ||||||
|
|
|
|
|
|||||
| Total assets |
$ | 259,071 | $ | 72,563 | ||||
|
|
|
|
|
|||||
| Liabilities, Redeemable Convertible Preferred Stock and Stockholders’ Equity (Deficit) |
||||||||
| Current liabilities: |
||||||||
| Accounts payable |
$ | 9,093 | $ | 6,467 | ||||
| Accrued compensation and benefits |
9,837 | 6,773 | ||||||
| Deferred revenue, current portion |
16,178 | 5,465 | ||||||
| Other current liabilities |
3,855 | 902 | ||||||
|
|
|
|
|
|||||
| Total current liabilities |
38,963 | 19,607 | ||||||
| Deferred revenue, non-current portion |
17,331 | 5,431 | ||||||
| Other long-term liabilities |
11,091 | 2,628 | ||||||
|
|
|
|
|
|||||
| Total liabilities |
67,385 | 27,666 | ||||||
|
|
|
|
|
|||||
| Commitments and contingencies (Note 6) |
||||||||
| Redeemable convertible preferred stock: |
||||||||
| Redeemable convertible preferred stock, par value of $0.001 per share; no shares authorized, issued and outstanding, and aggregate liquidation preference of $0 as of January 31, 2014; 39,320 shares authorized, 38,868 shares issued and outstanding with aggregate liquidation preference of $98,751 as of January 31, 2013 |
— | 98,559 | ||||||
| Stockholders’ equity (deficit): |
||||||||
| Preferred stock, par value of $0.001 per share; 5,000 shares authorized, no shares issued and outstanding as of January 31, 2014; no shares authorized, issued or outstanding as of January 31, 2013 |
— | — | ||||||
| Common stock, par value of $0.001 per share; 750,000 and 79,227 shares authorized as of January 31, 2014 and 2013, respectively; 71,643 and 21,388 shares issued and outstanding as of January 31, 2014 and 2013, respectively |
67 | 17 | ||||||
| Additional paid-in capital |
292,686 | 5,835 | ||||||
| Notes receivable from stockholders |
— | (1,562 | ) | |||||
| Accumulated other comprehensive income |
25 | 17 | ||||||
| Accumulated deficit |
(101,092 | ) | (57,969 | ) | ||||
|
|
|
|
|
|||||
| Total stockholders’ equity (deficit) |
191,686 | (53,662 | ) | |||||
|
|
|
|
|
|||||
| Total liabilities, redeemable convertible preferred stock and stockholders’ equity (deficit) |
$ | 259,071 | $ | 72,563 | ||||
|
|
|
|
|
|||||
See Notes to Consolidated Financial Statements.
62
Table of Contents
Index to Financial Statements
Nimble Storage, Inc.
Consolidated Statements of Operations
(in thousands, except per share data)
| Year Ended January 31, | ||||||||||||
| 2014 | 2013 | 2012 | ||||||||||
| Revenue: |
||||||||||||
| Product |
$ | 112,812 | $ | 49,765 | $ | 13,113 | ||||||
| Support and service |
12,921 | 4,075 | 900 | |||||||||
|
|
|
|
|
|
|
|||||||
| Total revenue |
125,733 | 53,840 | 14,013 | |||||||||
| Cost of revenue: |
||||||||||||
| Product |
36,231 | 17,266 | 5,233 | |||||||||
| Support and service |
7,980 | 3,184 | 1,045 | |||||||||
|
|
|
|
|
|
|
|||||||
| Total cost of revenue |
44,211 | 20,450 | 6,278 | |||||||||
|
|
|
|
|
|
|
|||||||
| Gross profit |
81,522 | 33,390 | 7,735 | |||||||||
| Operating expenses: |
||||||||||||
| Research and development |
35,247 | 16,135 | 7,903 | |||||||||
| Sales and marketing |
75,107 | 39,851 | 12,863 | |||||||||
| General and administrative |
13,737 | 5,168 | 3,756 | |||||||||
|
|
|
|
|
|
|
|||||||
| Total operating expenses |
124,091 | 61,154 | 24,522 | |||||||||
|
|
|
|
|
|
|
|||||||
| Loss from operations |
(42,569 | ) | (27,764 | ) | (16,787 | ) | ||||||
| Interest income |
21 | 32 | 6 | |||||||||
| Other expense, net |
(150 | ) | (26 | ) | (4 | ) | ||||||
|
|
|
|
|
|
|
|||||||
| Loss before provision for income taxes |
(42,698 | ) | (27,758 | ) | (16,785 | ) | ||||||
| Provision for income taxes |
425 | 99 | 5 | |||||||||
|
|
|
|
|
|
|
|||||||
| Net loss |
(43,123 | ) | (27,857 | ) | (16,790 | ) | ||||||
| Accretion of redeemable convertible preferred stock |
(36 | ) | (34 | ) | (23 | ) | ||||||
|
|
|
|
|
|
|
|||||||
| Net loss attributable to common stockholders |
$ | (43,159 | ) | $ | (27,891 | ) | $ | (16,813 | ) | |||
|
|
|
|
|
|
|
|||||||
| Net loss per share attributable to common stockholders, basic and diluted |
$ | (1.61 | ) | $ | (1.53 | ) | $ | (1.04 | ) | |||
|
|
|
|
|
|
|
|||||||
| Weighted-average shares used to compute net loss per share attributable to common stockholders, basic and diluted |
26,772 | 18,236 | 16,226 | |||||||||
|
|
|
|
|
|
|
|||||||
See Notes to Consolidated Financial Statements.
63
Table of Contents
Index to Financial Statements
Nimble Storage, Inc.
Consolidated Statements of Comprehensive Loss
(in thousands)
| Year Ended January 31, | ||||||||||||
| 2014 | 2013 | 2012 | ||||||||||
| Net loss |
$ | (43,123 | ) | $ | (27,857 | ) | $ | (16,790 | ) | |||
| Other comprehensive income, net of taxes: |
||||||||||||
| Change in cumulative translation adjustment |
8 | 17 | — | |||||||||
|
|
|
|
|
|
|
|||||||
| Comprehensive loss |
$ | (43,115 | ) | $ | (27,840 | ) | $ | (16,790 | ) | |||
|
|
|
|
|
|
|
|||||||
See Notes to Consolidated Financial Statements.
64
Table of Contents
Index to Financial Statements
Nimble Storage, Inc.
Consolidated Statements of Redeemable Convertible Preferred Stock and Stockholders’ Equity (Deficit)
(in thousands)
| Redeemable Convertible Preferred Stock |
Common Stock | Additional Paid-In Capital |
Notes Receivable from Stockholders |
Accumu- lated Other Compre- hensive Income |
Accumu- lated Deficit |
Total Stock- holders’ Equity (Deficit) |
||||||||||||||||||||||||||||||
| Shares | Amount | Shares | Amount | |||||||||||||||||||||||||||||||||
| Balance as of January 31, 2011 |
30,942 | $ | 32,965 | 16,884 | $ | 10 | $ | 288 | $ | — | $ | — | $ | (13,322 | ) | $ | (13,024 | ) | ||||||||||||||||||
| Issuance of Series D redeemable convertible preferred stock for cash, net of issuance costs of $67 |
3,678 | 24,933 | — | — | — | — | — | — | — | |||||||||||||||||||||||||||
| Accretion of redeemable convertible preferred stock to redemption value |
— | 23 | — | — | (23 | ) | — | — | — | (23 | ) | |||||||||||||||||||||||||
| Issuance of common stock upon exercise stock options, net of repurchases |
— | — | 2,244 | 1 | 165 | — | — | — | 166 | |||||||||||||||||||||||||||
| Notes receivable from stockholders |
— | — | — | — | — | (1,043 | ) | — | — | (1,043 | ) | |||||||||||||||||||||||||
| Vesting of early exercise of stock options |
— | — | — | — | 153 | — | — | — | 153 | |||||||||||||||||||||||||||
| Stock-based compensation |
— | — | — | — | 820 | — | — | — | 820 | |||||||||||||||||||||||||||
| Net loss |
— | — | — | — | — | — | — | (16,790 | ) | (16,790 | ) | |||||||||||||||||||||||||
|
|
|
|
|
|
|
|
|
|
|
|
|
|
|
|
|
|
|
|||||||||||||||||||
| Balance as of January 31, 2012 |
34,620 | 57,921 | 19,128 | 11 | 1,403 | (1,043 | ) | — | (30,112 | ) | (29,741 | ) | ||||||||||||||||||||||||
| Issuance of Series E redeemable convertible preferred stock for cash, net of issuance costs of $96 |
4,248 | 40,604 | — | — | — | — | — | — | — | |||||||||||||||||||||||||||
| Accretion of redeemable convertible preferred stock to redemption value |
— | 34 | — | — | (34 | ) | — | — | — | (34 | ) | |||||||||||||||||||||||||
| Issuance of common stock upon exercise stock options, net of repurchases |
— | — | 2,260 | 6 | 875 | — | — | — | 881 | |||||||||||||||||||||||||||
| Notes receivable from stockholders |
— | — | — | — | — | (519 | ) | — | — | (519 | ) | |||||||||||||||||||||||||
| Vesting of early exercise of stock options |
— | — | — | — | 987 | — | — | — | 987 | |||||||||||||||||||||||||||
| Stock-based compensation |
— | — | — | — | 2,604 | — | — | — | 2,604 | |||||||||||||||||||||||||||
| Net loss |
— | — | — | — | — | — | 17 | (27,857 | ) | (27,840 | ) | |||||||||||||||||||||||||
|
|
|
|
|
|
|
|
|
|
|
|
|
|
|
|
|
|
|
|||||||||||||||||||
| Balance as of January 31, 2013 |
38,868 | 98,559 | 21,388 | 17 | 5,835 | (1,562 | ) | 17 | (57,969 | ) | (53,662 | ) | ||||||||||||||||||||||||
| Accretion of redeemable convertible preferred stock to redemption value |
— | 36 | — | — | (36 | ) | — | — | — | (36 | ) | |||||||||||||||||||||||||
| Issuance of common stock upon initial public offering, net of issuance costs of $3,973 |
— | — | 9,200 | 9 | 175,693 | — | — | — | 175,702 | |||||||||||||||||||||||||||
| Conversion of preferred stock into shares of common stock |
(38,868 | ) | (98,595 | ) | 38,868 | 39 | 98,556 | — | — | — | 98,595 | |||||||||||||||||||||||||
| Issuance of common stock upon stock option exercises, net of repurchases |
— | — | 2,187 | 2 | 1,484 | — | — | — | 1,486 | |||||||||||||||||||||||||||
| Repayment of notes receivable from stockholders |
— | — | — | — | — | 1,562 | — | — | 1,562 | |||||||||||||||||||||||||||
| Vesting of early exercise of stock options |
— | — | — | — | 2,005 | — | — | — | 2,005 | |||||||||||||||||||||||||||
| Stock-based compensation |
— | — | — | — | 9,149 | — | — | — | 9,149 | |||||||||||||||||||||||||||
| Net loss |
— | — | — | — | — | — | 8 | (43,123 | ) | (43,115 | ) | |||||||||||||||||||||||||
|
|
|
|
|
|
|
|
|
|
|
|
|
|
|
|
|
|
|
|||||||||||||||||||
| Balance as of January 31, 2014 |
— | $ | — | 71,643 | $ | 67 | $ | 292,686 | $ | — | $ | 25 | $ | (101,092 | ) | $ | 191,686 | |||||||||||||||||||
|
|
|
|
|
|
|
|
|
|
|
|
|
|
|
|
|
|
|
|||||||||||||||||||
See Notes to Consolidated Financial Statements.
65
Table of Contents
Index to Financial Statements
Nimble Storage, Inc.
Consolidated Statements of Cash Flows
(in thousands)
| Year Ended January 31, | ||||||||||||
| 2014 | 2013 | 2012 | ||||||||||
| Cash flows from operating activities: |
||||||||||||
| Net loss |
$ | (43,123 | ) | $ | (27,857 | ) | $ | (16,790 | ) | |||
| Adjustments to reconcile net loss to net cash used in operating activities: |
||||||||||||
| Depreciation |
4,177 | 1,118 | 169 | |||||||||
| Stock-based compensation expense |
9,149 | 2,604 | 820 | |||||||||
| Loss on disposal of property and equipment |
148 | — | — | |||||||||
| Provision for allowance for doubtful accounts |
104 | — | 49 | |||||||||
| Provision for excess and obsolete inventories |
252 | 421 | 86 | |||||||||
| Changes in operating assets and liabilities: |
||||||||||||
| Accounts receivable |
(4,055 | ) | (9,187 | ) | (3,527 | ) | ||||||
| Inventories |
(1,305 | ) | (3,043 | ) | (1,418 | ) | ||||||
| Prepaid expenses and other assets |
(2,182 | ) | (570 | ) | (548 | ) | ||||||
| Accounts payable |
333 | 4,318 | 1,717 | |||||||||
| Deferred revenue |
22,613 | 8,868 | 1,801 | |||||||||
| Accrued and other liabilities |
7,147 | 4,574 | 2,800 | |||||||||
|
|
|
|
|
|
|
|||||||
| Net cash used in operating activities |
(6,742 | ) | (18,754 | ) | (14,841 | ) | ||||||
| Cash flows from investing activities: |
||||||||||||
| Purchase of property and equipment |
(13,613 | ) | (3,954 | ) | (1,303 | ) | ||||||
| Proceeds from sale of property and equipment |
27 | — | — | |||||||||
| Change in restricted cash |
(3,900 | ) | 400 | 20 | ||||||||
|
|
|
|
|
|
|
|||||||
| Net cash used in investing activities |
(17,486 | ) | (3,554 | ) | (1,283 | ) | ||||||
| Cash flows from financing activities: |
||||||||||||
| Proceeds from issuance of common stock, net of issuance costs |
176,729 | — | — | |||||||||
| Proceeds from issuance of redeemable convertible preferred stock, net of issuance costs |
— | 40,604 | 24,933 | |||||||||
| Proceeds from exercise of stock options, net of repurchases |
5,201 | 2,096 | 1,002 | |||||||||
| Proceeds from repayment of loan from stockholders |
1,571 | — | — | |||||||||
|
|
|
|
|
|
|
|||||||
| Net cash provided by financing activities |
183,501 | 42,700 | 25,935 | |||||||||
| Foreign exchange impact on cash and cash equivalents |
8 | 17 | — | |||||||||
|
|
|
|
|
|
|
|||||||
| Net increase in cash and cash equivalents |
159,281 | 20,409 | 9,811 | |||||||||
| Cash and cash equivalents, beginning of period |
49,205 | 28,796 | 18,985 | |||||||||
|
|
|
|
|
|
|
|||||||
| Cash and cash equivalents, end of period |
$ | 208,486 | $ | 49,205 | $ | 28,796 | ||||||
|
|
|
|
|
|
|
|||||||
| Supplemental disclosure of cash flow information: |
||||||||||||
| Cash paid for income taxes |
$ | 37 | $ | — | $ | — | ||||||
| Supplemental disclosure of noncash investing and financing activities: |
||||||||||||
| Issuance of employee loan for stock options exercised |
$ | — | $ | 439 | $ | 1,042 | ||||||
| Vesting of early exercised stock options |
2,005 | 987 | 153 | |||||||||
| Accretion of redeemable convertible preferred stock |
36 | 34 | 23 | |||||||||
| Deferred offering costs |
1,027 | — | — | |||||||||
| Increase in accounts payable and accrued liabilities related to property and equipment purchase |
6,888 | — | — | |||||||||
| Conversion of preferred stock to common stock upon IPO |
98,595 | — | — | |||||||||
See Notes to Consolidated Financial Statements.
66
Table of Contents
Index to Financial Statements
Nimble Storage, Inc.
Notes to Consolidated Financial Statements
1. Description of Business and Basis of Presentation
Description of Business
Nimble Storage, Inc. (the Company) was incorporated in the state of Delaware in November 2007. The Company has three wholly-owned foreign subsidiaries that were incorporated in August 2011, May 2012 and August 2012. The Company’s mission is to provide its customers with the industry’s most efficient data storage platform. The Company has designed and sells a flash-optimized hybrid storage platform that it believes is disrupting the market by enabling significant improvements in application performance and storage capacity with superior data protection, while simplifying business operations and lowering costs. With the combination of the Company’s file system, CASL, and its cloud-based storage management and support service, InfoSight, the Company’s platform serves a broad array of enterprises and cloud-based service providers, and the Company’s software and storage systems effectively handle mainstream applications, including virtual desktops, databases, email, collaboration and analytics. The Company is headquartered in San Jose, California, with employees in Australia, Canada, Germany, Singapore, Sweden, the Netherlands, France and the United Kingdom.
Basis of Presentation and Consolidation
The consolidated financial statements are prepared in accordance with U.S. generally accepted accounting principles (U.S. GAAP) and include the consolidated accounts of the Company and its subsidiaries. Intercompany accounts and transactions have been eliminated in consolidation.
Initial Public Offering
In December 2013, the Company completed its initial public offering of 9,200,000 shares of its common stock, including the full underwriters’ over-allotment option, at a public offering price of $21.00 per share. Net cash proceeds from the initial public offering were approximately $176.7 million.
In connection with the closing of the initial public offering, all of the shares of preferred stock outstanding automatically converted into an aggregate of 38.9 million shares of common stock.
On December 18, 2013, the Company filed its Amended and Restated Certificate of Incorporation in connection with the closing of its initial public offering. Following the amendment, the Company had authorized capital stock of 755.0 million shares, comprising: (i) 750.0 million shares of common stock, par value $0.001 per share and (ii) 5.0 million shares of preferred stock, par value $0.001 per share.
2. Summary of Significant Accounting Policies
Use of Estimates
The preparation of financial statements in conformity with U.S. GAAP requires management to make estimates and assumptions that affect the amounts reported in the financial statements and accompanying notes. Such estimates include, but are not limited to, the determination of the best estimated selling prices of deliverables included in multiple-deliverable revenue arrangements; the allowance for doubtful accounts; provision for excess or obsolete inventory; the useful lives of property and equipment; the warranty reserve; and the fair value of the Company’s common stock and stock options issued. Actual results could differ from these estimates.
Concentrations
The Company’s financial instruments that are exposed to concentrations of credit risk are primarily cash and cash equivalents and trade accounts receivable. Cash and cash equivalents are
67
Table of Contents
Index to Financial Statements
maintained primarily at one financial institution, and deposits may exceed the amount of insurance provided on such deposits. Risks associated with cash and cash equivalents are mitigated by banking with a creditworthy institution. The Company has not experienced any losses on its deposits of cash and cash equivalents.
The Company performs ongoing credit evaluations of its customers’ financial condition whenever deemed necessary and generally does not require collateral. The Company maintains an allowance for doubtful accounts based upon the expected collectability of its accounts receivable, which takes into consideration specific customer creditworthiness and current economic trends. During the third and fourth quarters of the year ended January 31, 2014, the Company consolidated the majority of its North American sales to two distributors, and as a result, accounts receivable and revenue increased in concentration. The majority of previous value added resellers (VARs) are now purchasing from these two distributors. Of all the Company’s customers, which include direct end-customers, VARs and distributors, the following customers individually accounted for more than 10% of the Company’s accounts receivable and revenue at the end of and for each period presented:
| % of Accounts Receivable | % of Revenue | |||||||||||||||||||||||||||||
| As of January 31, | Year Ended January 31, | |||||||||||||||||||||||||||||
| 2014 | 2013 | 2014 | 2013 | 2012 | ||||||||||||||||||||||||||
| Customer A |
47 | % | * | 16 | % | * | * | |||||||||||||||||||||||
| Customer B |
21 | % | * | * | * | * | ||||||||||||||||||||||||
| Customer C |
10 | % | * | * | * | * | ||||||||||||||||||||||||
| Customer D |
* | 18 | % | * | 15 | % | * | |||||||||||||||||||||||
| * | Represents less than 10%. |
There are no concentrations of business transacted with a particular market that would severely impact the Company’s business in the near term. However, the Company currently relies on a few key contract manufacturers and suppliers to produce most of its products; any disruption or termination of these arrangements could materially adversely affect the Company’s operating results.
Foreign Currency Translation and Transactions
The functional currency of each of the Company’s foreign subsidiaries is its respective local currency. The Company translates all monetary assets and liabilities denominated in foreign currencies into U.S. dollars using the exchange rates in effect at the balance sheet dates and other assets and liabilities using historical exchange rates. Revenue and expenses are translated at average exchange rates in effect during the year. Translation adjustments are recorded within accumulated other comprehensive income, a separate component of stockholders’ deficit.
Foreign currency denominated transactions are initially recorded and re-measured at the end of each period using the applicable exchange rate in effect. Foreign currency re-measurement losses are recognized in other expense, net, in the consolidated statements of operations. Foreign currency re-measurement losses recognized were $149,000, $26,000, and $4,000 for the years ended January 31, 2014, 2013, and 2012, respectively.
Fair Value
The carrying value of the Company’s financial instruments, including cash and cash equivalents, accounts receivable, accounts payable and accrued liabilities, approximates fair values.
Cash and Cash Equivalents
The Company considers all highly liquid investments with an original maturity of 90 days or less at the date of purchase to be cash equivalents. Cash and cash equivalents consist principally of cash accounts and investments in money market funds.
68
Table of Contents
Index to Financial Statements
Restricted Cash
As a condition of the Company’s headquarters facility lease agreement, the Company is required to maintain a letter of credit of $3.9 million, with the landlord named as the beneficiary. These restricted cash balance have been excluded from the Company’s cash and cash equivalents balance and are classified as restricted cash on the Company’s consolidated balance sheets. As of January 31, 2014, the amount of restricted cash was $3.9 million and classified as non-current (see Note 6). The Company did not have restricted cash as of January 31, 2013.
Accounts Receivable
Accounts receivable are recorded at the invoiced amounts and do not bear interest. The Company maintains an allowance for doubtful accounts for estimated losses inherent in its accounts receivable portfolio. An allowance for doubtful accounts is calculated based on the aging of the Company’s trade receivables, historical experience, and management judgment. The Company writes off trade receivables against the allowance when management determines a balance is uncollectible and no longer actively pursues collection of the receivable. As of January 31, 2014 and 2013, the allowance for doubtful accounts was $76,000 and $20,000, respectively.
Inventories
Inventories consist primarily of raw materials related to component parts, finished goods, which include both inventory held for sale and service inventory held at service depots in support of customer service agreements, and customer evaluation inventory.
The following is a summary of the Company’s inventories by major category (in thousands):
| As of January 31, | ||||||||
| 2014 | 2013 | |||||||
| Raw materials |
$ | 940 | $ | 471 | ||||
| Finished goods |
3,344 | 2,255 | ||||||
| Evaluation inventory |
1,128 | 1,633 | ||||||
|
|
|
|
|
|||||
| $ | 5,412 | $ | 4,359 | |||||
|
|
|
|
|
|||||
Inventory values are stated at the lower of cost (on a first-in, first-out method), or market value. A provision is recorded to adjust inventory to its estimated realizable value when inventory is determined to be in excess of anticipated demand or obsolete. In determining the provision, the Company also considers estimated recovery rates based on the nature of the inventory. Service inventory is written down to its net realizable value based upon the estimated loss of utility starting from the date the service inventory is placed in the service depots. Customer evaluation inventory is written down to its net realizable value based upon its estimated loss of utility, starting from 180 days after the unit is placed in the evaluation pool, which is the expected life of the finished goods in the evaluation pool.
The Company recorded inventory provisions of $252,000, $421,000 and $86,000 for the years ended January 31, 2014, 2013 and 2012, respectively.
69
Table of Contents
Index to Financial Statements
Property and Equipment
Property and equipment are stated at cost, net of accumulated depreciation. Demonstration units are not sold and are transferred from inventory at cost. Depreciation is computed using the straight-line method over the following estimated useful lives:
| Property and Equipment |
Useful Life | |
| Computer equipment, lab equipment and software |
3 years | |
| Furniture and fixtures |
5 years | |
| Leasehold improvements |
Shorter of estimated useful life or remaining lease term | |
| Demonstration equipment |
2 years |
Repairs and maintenance are expensed as incurred.
Impairment of Long-Lived Assets
The Company evaluates events and changes in circumstances that could indicate carrying amounts of long-lived assets, including property and equipment, may not be recoverable. When such events or changes in circumstances occur, the Company assesses the recoverability of long-lived assets by determining whether or not the carrying value of such assets will be recovered through undiscounted expected future cash flows. If the total of the future undiscounted cash flows is less than the carrying amount of an asset, the Company records an impairment charge for the amount by which the carrying amount of the assets exceeds the fair value of the asset. Through January 31, 2014, the Company had not written down any of its long-lived assets as a result of impairment.
Warranties
The Company provides a standard one-year warranty for hardware components covering material defects in materials and workmanship. In addition, the Company provides a 90-day warranty on the embedded software in its products for non-conformance with documented specifications. The Company accrues for estimated warranty costs based upon historical experience, and periodically assesses the adequacy of its recorded warranty liability at the end of each period. These costs are expensed as incurred and included in cost of product revenue in the Company’s consolidated statements of operations. The Company records warranty liability in other current liabilities in its consolidated balance sheet.
The table below summarizes the activity in the warranty accrual (in thousands):
| Year Ended January 31, | ||||||||
| 2014 | 2013 | |||||||
| Beginning balance |
$ | 275 | $ | — | ||||
| Warranty expense for new warranties issued |
1,432 | 676 | ||||||
| Utilization of warranty obligation |
(1,181 | ) | (401 | ) | ||||
| Changes in estimates for pre-existing warranties |
11 | — | ||||||
|
|
|
|
|
|||||
| Ending balance |
$ | 537 | $ | 275 | ||||
|
|
|
|
|
|||||
Revenue Recognition
The Company generates revenue from sales of software-enabled storage products and related support. The Company’s software that is integrated on the storage products is more than incidental, and functions together with the storage product to deliver its essential functionality. The Company also offers an optional support plan (typically one to five years). The support plan includes automated support (Proactive Wellness), bug fixes, updates and upgrades to product firmware and the Company’s
70
Table of Contents
Index to Financial Statements
management platform, including InfoSight, telephone support and expedited delivery times for replacement hardware parts. While support is not contractually mandatory, substantially all products shipped have been purchased together with a support plan. The Company also periodically sells optional installation services with its products that are not essential to the functionality of the storage product. Substantially all of the Company’s customer arrangements contain multiple deliverables. As a result, the Company accounts for the revenue for these sales in accordance with Accounting Standards Codification (ASC) 605-25 Revenue Recognition – Multiple Element Arrangements. Arrangements are divided into separate units of accounting based on whether the delivered items have stand-alone value. In its typical customer arrangements, the Company considers the following to be separate units of accounting: the storage product (together with the integrated software), support services and installation services. The Company has determined that each unit of accounting has stand-alone value because they are sold separately by the Company or could be resold by a customer on a stand-alone basis. The Company allocates the total consideration to all deliverables based on its determination of the units of accounting and their relative selling prices. As the Company has not yet established vendor-specific objective evidence (VSOE) or identified third-party evidence of fair value for its storage product (together with the integrated software) and installation services, it uses the best estimate of the selling price (BESP) of each deliverable to allocate the total arrangement fee among the separate units of accounting. The Company’s process to determine its BESP for its products and services is based on qualitative and quantitative considerations of multiple factors, which primarily include historical stand-alone sales, margin objectives, and discount behavior. Additional considerations are given to factors such as customer demographics, competitive alternatives, anticipated sales volume, costs to manufacture products or provide services, pricing practices, and market conditions. During the second quarter of the year ended January 31, 2013, the Company established VSOE of fair value for support services based on stand-alone renewals offered to its customers. As a result, beginning in the second quarter of the year ended January 31, 2013, the Company allocated the fair value of consideration related to support services based on VSOE of fair value for its support services. Prior to this change, the Company allocated consideration related to support services based on BESP. The effect of the change from BESP to VSOE of fair value for support services did not have a material impact on the allocation of consideration.
Revenue is recognized when all of the following criteria are met:
| • | Persuasive Evidence of an Arrangement Exists. The Company relies upon non-cancelable sales agreements and purchase orders to determine the existence of an arrangement. |
| • | Delivery Has Occurred. The Company uses shipping documents to verify delivery. |
| • | The Fee Is Fixed or Determinable. The Company assesses whether the fee is fixed or determinable based on the payment terms associated with the transaction. |
| • | Collectability Is Reasonably Assured. The Company assesses collectability based on credit analysis and payment history. |
It is the Company’s practice to identify a direct customer or an end-customer from its VARs and distributors prior to shipment. Products are typically shipped directly to the direct customer or the end-customers of the Company’s VARs and distributors. Assuming all other revenue recognition criteria have been met, the Company generally recognizes revenue upon shipment, as title and risk of loss are transferred at that time. For certain VARs and distributors, title and risk of loss is transferred upon delivery to the end-customers and revenue is recognized after delivery has been completed. The Company’s arrangements with VARs and distributors do not contain rights of return, subsequent price discounts, price protection or other allowances for shipments completed.
The Company records amounts to be recognized during the twelve months following the balance sheet date in deferred revenue, current portion in the consolidated balance sheets, and the remainder in deferred revenue, non-current portion in the consolidated balance sheets. As of January 31, 2014,
71
Table of Contents
Index to Financial Statements
the weighted average remaining contract period related to non-current deferred revenue was approximately 2.1 years.
Shipping Costs
Shipping charges billed to customers are included in product revenue and the related shipping and handling costs are included in cost of revenue.
Research and Development
Research and development expense consists of personnel costs, including stock-based compensation expense, for the Company’s research and development personnel and product development costs, including engineering services, development software and hardware tools, depreciation of capital equipment and facility costs. Research and development costs are expensed as incurred.
Advertising Costs
Advertising costs are expensed as incurred and are included in sales and marketing expense. Advertising costs for the years ended January 31, 2014, 2013 and 2012 were $1.2 million, $0.4 million and $45,000, respectively.
Stock-Based Compensation
Prior to the Company’s initial public offering on December 13, 2013, the Company’s board of directors determined the fair value of its common stock using various valuation methodologies, including valuation analyses performed by third-party valuation firms. After the initial public offering, the Company used the publicly quoted price as the fair value of its common stock.
The Company determines the fair value of its stock options and shares of common stock to be issued related to its employee stock purchase plans on the date of grant utilizing the Black-Scholes-Merton option-pricing model, and is impacted by the fair value of its common stock, as well as changes in assumptions regarding a number of highly complex and subjective variables. These variables include, but are not limited to, the expected common stock price volatility over the term of the option awards, the expected term of the awards, risk-free interest rates and expected dividend yield. The Company generally recognizes compensation expense for stock option grants on a straight-line basis over the requisite service period. Stock-based compensation expense recognized at fair value includes the impact of estimated forfeitures.
Stock-based compensation cost for restricted stock units (RSUs) is measured based on the fair value of the underlying shares on the date of grant. The RSUs generally vest over the requisite service period. The fair value of RSUs is determined by the estimated fair value of the Company’s common stock at the time of grant. Stock-based compensation expense is recognized at fair value and includes the impact of estimated forfeitures.
Income Taxes
The Company accounts for income taxes under the asset and liability method. Deferred tax assets and liabilities are determined based on the difference between the financial statement and tax bases of assets and liabilities using the enacted tax rates in effect for the years in which the temporary differences are expected to affect taxable income. Valuation allowances are established when necessary to reduce deferred tax assets to the amounts expected to be realized.
72
Table of Contents
Index to Financial Statements
Net Loss Per Share Attributable to Common Stockholders
Prior to the Company’s initial public offering on December 13, 2013, the Company calculated its basic and diluted net loss per share attributable to common stockholders in conformity with the two-class method required for companies with participating securities. The Company considers all series of its redeemable convertible preferred stock to be participating securities. In the event a dividend is declared or paid on the Company’s common stock, holders of redeemable convertible preferred stock are entitled to a proportionate share of such dividend in proportion to the holders of common stock on an as-if converted basis. Under the two-class method, basic net loss per share attributable to common stockholders is calculated by dividing the net loss attributable to common stockholders by the weighted-average number of shares of common stock outstanding for the period, less shares subject to repurchase. Net loss attributable to common stockholders is determined by allocating undistributed earnings between common and redeemable convertible preferred stockholders. The diluted net loss per share attributable to common stockholders is computed by giving effect to all potential dilutive common stock equivalents outstanding for the period. For purposes of this calculation, redeemable convertible preferred stock, options to purchase common stock, repurchasable shares from early exercised options and unvested RSUs are considered common stock equivalents but have been excluded from the calculation of diluted net loss per share attributable to common stockholders as their effect is antidilutive. Under the two-class method, the net loss attributable to common stockholders is not allocated to the convertible redeemable preferred stock as the convertible redeemable preferred stock do not have a contractual obligation to share in the Company’s losses.
On December 13, 2013, all shares of redeemable convertible preferred stocks were converted to common stock.
The following table sets forth the computation of net loss per share (in thousands, except per share amounts):
| Year Ended January 31, | ||||||||||||
| 2014 | 2013 | 2012 | ||||||||||
| Numerator: |
||||||||||||
| Net loss |
$ | (43,123 | ) | $ | (27,857 | ) | $ | (16,790 | ) | |||
| Add: accretion of redeemable convertible preferred stock |
(36 | ) | (34 | ) | (23 | ) | ||||||
|
|
|
|
|
|
|
|||||||
| Net loss attributable to common stockholders |
$ | (43,159 | ) | $ | (27,891 | ) | $ | (16,813 | ) | |||
|
|
|
|
|
|
|
|||||||
| Denominator: |
||||||||||||
| Weighted-average number of shares outstanding—basic and diluted |
26,772 | 18,236 | 16,226 | |||||||||
|
|
|
|
|
|
|
|||||||
| Net loss per share—basic and diluted |
$ | (1.61 | ) | $ | (1.53 | ) | $ | (1.04 | ) | |||
|
|
|
|
|
|
|
|||||||
The following outstanding options, unvested shares subject to repurchase, unvested RSUs and redeemable convertible preferred stock were excluded (as common stock equivalents) from the computation of diluted net loss per share for the periods presented as their effect would have been antidilutive (in thousands):
| As of January 31, | ||||||||||||
| 2014 | 2013 | 2012 | ||||||||||
| Shares subject to options to purchase common stock |
16,329 | 12,019 | 9,292 | |||||||||
| Unvested early exercised common shares |
1,593 | 1,866 | 2,131 | |||||||||
| Unvested restricted stock units |
626 | — | — | |||||||||
| Redeemable convertible preferred stock |
— | 38,868 | 34,620 | |||||||||
73
Table of Contents
Index to Financial Statements
Recent Accounting Pronouncements
In July 2013, the Financial Accounting Standards Board (FASB) released Accounting Standards Update (ASU) No. 2013-11, Presentation of an Unrecognized Tax Benefit When a Net Operating Loss Carryforward, a Similar Tax Loss, or a Tax Credit Carryforward Exists. The new standard requires that an unrecognized tax benefit should be presented as a reduction of a deferred tax asset for a net operating loss carryforward or other tax credit carryforward when settlement in this manner is available under the tax law. The Company is required to adopt this standard starting fiscal year 2015 and is currently in the process of determining the impact, if any, on its financial position.
In February 2013, the FASB issued an accounting standard update to require reclassification adjustments from other comprehensive income to be presented either in the financial statements or in the notes to the financial statements. The Company adopted this accounting standard update on February 1, 2013 and the adoption did not have a significant impact on its consolidated financial position, results of operations, comprehensive loss or cash flows.
3. Fair Value Measurements
Fair value is defined as the exchange price that would be received for an asset or paid to transfer a liability (an exit price) in the principal or most advantageous market for the asset or liability in an orderly transaction between market participants on the measurement date. Valuation techniques used to measure fair value must maximize the use of observable inputs and minimize the use of unobservable inputs. The standard describes a fair value hierarchy based on three levels of inputs, of which the first two are considered observable and the last unobservable, to measure the fair value:
| • | Level 1—Inputs are unadjusted quoted prices in active markets for identical assets or liabilities. |
| • | Level 2—Inputs are quoted prices for similar assets and liabilities in active markets or inputs other than quoted prices that are observable for the assets or liabilities, either directly or indirectly through market corroboration, for substantially the full term of the financial instruments. |
| • | Level 3—Inputs are unobservable inputs based on our own assumptions used to measure assets and liabilities at fair value. The inputs require significant management judgment or estimation. |
The Company’s financial instruments are classified within level 1 of the fair value hierarchy because they are valued using quoted prices in active markets.
As of January 31, 2013, financial assets stated at fair value on a recurring basis were comprised of money market funds included within cash and cash equivalents. The Company’s money market funds balance was $41.7 million as of January 31, 2013. The Company had no money market funds as of January 31, 2014.
74
Table of Contents
Index to Financial Statements
4. Balance Sheet Components
Property and Equipment
Property and equipment, net consisted of the following (in thousands):
| As of January 31, | ||||||||
| 2014 | 2013 | |||||||
| Computer equipment |
$ | 5,619 | $ | 1,249 | ||||
| Lab equipment |
6,517 | 2,499 | ||||||
| Software |
1,443 | 363 | ||||||
| Furniture and fixtures |
2,069 | 404 | ||||||
| Leasehold improvements |
8,377 | 352 | ||||||
| Construction in progress |
694 | 126 | ||||||
| Demonstration equipment |
770 | 436 | ||||||
|
|
|
|
|
|||||
| Total property and equipment |
25,489 | 5,429 | ||||||
| Less: accumulated depreciation |
(5,280 | ) | (1,368 | ) | ||||
|
|
|
|
|
|||||
| Total property and equipment, net |
$ | 20,209 | $ | 4,061 | ||||
|
|
|
|
|
|||||
Costs incurred in connection with the development of the Company’s software are accounted for as follows: all costs incurred in the preliminary project and post-implementation stages are expensed as incurred. Certain costs incurred in the application development stage of a new product or projects are capitalized if certain criteria are met. Maintenance and training costs are typically expensed as incurred. Such costs are depreciated on a straight-line basis over the estimated useful lives of the related assets, which was estimated to be three years.
Costs incurred related to tenant improvements of the Company’s corporate headquarters are capitalized as construction in progress. Depreciation expense related to property and equipment for the years ended January 31, 2014, 2013 and 2012 was $4.2 million, $1.1 million and $0.2 million, respectively.
5. Employee Loans
During the years ended January 31, 2011 and 2012, the Company issued full recourse loans to two employees to facilitate the exercise of their stock options. The first of these loans was issued in December 2011 with a principal amount of $1.0 million and an interest rate of at 1.3% per annum. The loan was contractually due and payable in full in December 2020 or upon such earlier date that the Company files a registration statement related to an initial public offering. The second of these loans was issued in June 2012 with a principal amount of $439,000 and an interest of 2.3% per annum. The loan was contractually due and payable in full in June 2020 or upon such earlier date that the Company files a registration statement related to an initial public offering. The principal loan amount and the accrued interest were $1.6 million as of January 31, 2013, and were reported as a deduction from stockholders’ equity (deficit) on the Company’s consolidated balance sheets. Both of these loans and related interest were repaid in full in August 2013.
6. Commitments and Contingencies
Leases
The Company leases its facilities under various noncancelable operating leases with fixed rental payments. Rent expense totaled $3.1 million, $0.5 million and $0.3 million for the years ended January 31, 2014, 2013 and 2012, respectively.
75
Table of Contents
Index to Financial Statements
Future minimum commitments under these operating leases as of January 31, 2014 were as follows (in thousands):
| Years ending January 31: |
||||
| 2015 |
$ | 4,052 | ||
| 2016 |
4,603 | |||
| 2017 |
4,690 | |||
| 2018 |
4,710 | |||
| 2019 |
4,828 | |||
| Thereafter |
13,897 | |||
|
|
|
|||
| $ | 36,780 | |||
|
|
|
In April 2013, the Company entered into a new facility lease agreement. The 96-month lease commenced on November 1, 2013 and provides 164,608 square feet space in San Jose, California. Total rent, including operating expenses, payable over the lease period is $35.5 million. As part of the lease agreement, the Company received $4.9 million in tenant improvement allowance during the year ended January 31, 2014. This tenant improvement allowance was included in the calculation of rent expense and related deferred rent balances. As a condition of the lease agreement, the Company is required to maintain a letter of credit of $3.9 million, with the landlord named as the beneficiary. The Company has the option to extend the term of the lease for an additional period of 60 months.
Contingencies
From time to time, the Company is party to litigation and subject to claims that arise in the ordinary course of business, including actions with respect to employment claims and other matters. Although the results of litigation and claims are inherently unpredictable, the Company believes that the final outcome of such matters will not have a material adverse effect on the business, consolidated financial position, results of operations or cash flows.
On October 29, 2013, NetApp, Inc. (NetApp) filed a lawsuit in United States District Court, Northern District of California, alleging violations of the federal Computer Fraud and Abuse Act, trade secret misappropriation, unfair competition and related state law claims. The Company and three individuals, a sales engineer employee of an Australian affiliate, along with a sales representative and program manager of the Company, have been named as defendants. On January 10, 2014, NetApp filed a First Amended Complaint that added similar state law claims against three additional individuals as defendants. The First Amended Complaint alleges that the Australian defendant, a former employee of a NetApp reseller, accessed NetApp’s password-protected website allegedly restricted to NetApp partners, resellers, employees and customers, and downloaded confidential and proprietary information in violation of the Computer Fraud and Abuse Act. It further alleges that the other five individual defendants, who were formerly employed at NetApp, downloaded NetApp company documents and materials, including allegedly confidential and trade secret information and/or deleted NetApp documents and materials, prior to leaving NetApp. The complaint seeks unspecified damages and injunctive relief. Because the Company is in the early stages of litigation, it is unable to estimate a range of possible losses, if any. The Company filed a response to the complaint on February 18, 2014. An initial case management conference is scheduled for May 8, 2014; no other pretrial or trial dates have been set. Litigation is inherently uncertain and can involve significant management time and attention. In addition, the cost of any litigation, regardless of outcome, can be significant and there can be no assurance that resolution of this matter will not have a material adverse effect on the Company’s operating results. The Company intends to vigorously defend itself in this litigation.
On March 11, 2011, Nimbus Data Systems, Inc. filed a lawsuit in the United States District Court for the Northern District of California against the Company, alleging that the Company’s use of Nimble Storage as its trade name and trademark constitutes trademark infringement, unfair competition and
76
Table of Contents
Index to Financial Statements
false and misleading advertising. On April 23, 2012, the Company entered into a confidential settlement agreement related to this matter, resolving all claims brought against the Company without admission of fault or liability by either party. As of January 31, 2012, the Company accrued the settlement amount in other current liabilities within its consolidated balance sheet and recognized the related expense in general and administrative expense in the Company’s consolidated statement of operations. The settlement amount was paid on April 23, 2012.
Indemnification
Some of the Company’s sales contracts require the Company to indemnify its customers against third-party claims asserting infringement of certain intellectual property rights, which may include patents, copyrights, trademarks, or trade secrets, and to pay judgments entered on such claims. The Company’s exposure under these indemnification provisions is generally limited to the total amount paid by the customer under the contract. However, certain contracts include indemnification provisions that could potentially expose the Company to losses in excess of the amount received under the contract. In addition, the Company indemnifies its officers, directors, and certain key employees while they are serving in good faith in their respective capacities. To date, there have been no claims under any indemnification provisions.
Purchase Commitments
The Company purchases components from a variety of suppliers and contract manufacturers to provide manufacturing services for products. During the normal course of business, in order to manage manufacturing lead times and help ensure adequate component supply, the Company enters into agreements with its contract manufacturers and suppliers that either allow them to procure inventory based upon criteria as defined by the Company or that establish the parameters defining the requirements. These agreements generally do not include any legally binding minimum commitment obligations. As of January 31, 2014, the Company had $14.2 million in several non-cancelable software license and service agreements for the internal use of software and services for customer relationship management, human resource, inventory forecasting application and desktop applications and two operating commitments to fulfill inventory requirements arising from growing forecasts.
7. Redeemable Convertible Preferred Stock
In December 2013, the Company completed its initial public offering of 9,200,000 shares of its common stock, including the full underwriters’ over-allotment option, at a public offering price of $21.00 per share. Net cash proceeds from the initial public offering were approximately $176.7 million.
Prior to the initial public offering on December 13, 2013, the Company had convertible preferred stock outstanding, all of which was converted into 38,867,647 shares of common stock in connection with the initial public offering.
8. Common Stock
As of January 31, 2014, there were 750,000,000 shares of common stock authorized with a par value of $0.001 per share. The Company had reserved the following shares of authorized but unissued common stock:
| As of January 31, 2014 |
||||
| Issued and outstanding stock options |
16,329,293 | |||
| Unvested restricted stock units |
626,260 | |||
| Equity incentive plans |
10,142,193 | |||
| Employee stock purchase plan |
2,015,299 | |||
|
|
|
|||
| 29,113,045 | ||||
|
|
|
|||
77
Table of Contents
Index to Financial Statements
During the year ended January 31, 2014, the Company repurchased 125,035 early exercised shares of outstanding common stock from stockholders at a weighted-average price of $1.75 per share for an aggregate purchase price of $219,000. During the year ended January 31, 2013, the Company repurchased 17,844 shares of outstanding common stock from stockholders at a weighted-average price of $1.34 per share for an aggregate purchase price of $24,000. During the year ended January 31, 2012, the Company repurchased 64,220 shares of outstanding common stock from stockholders at a weighted-average price of $0.20 per share for an aggregate purchase price of $13,000. The common stock repurchased is removed from common stock outstanding, is not held in treasury stock and is available for reissuance.
9. Equity Incentive Plans
Plan Descriptions
2008 Equity Incentive Plan
In May 2008, the Company adopted the 2008 Equity Incentive Plan (the 2008 Plan) for the benefit of its eligible employees, consultants, and independent directors. The 2008 Plan provides for the grant of stock awards, including incentive stock options, nonqualified stock options, restricted stock, stock appreciation rights and restricted stock units (RSUs). The Company grants stock options with an exercise price equal to the fair market value of its common stock on the date of the grant, as determined by the Board. The Company’s equity awards vest over a period of time as determined by the Board and expire no later than 10 years from the date of grant. Grants to new employees generally vest over a four-year period, at a rate of 25% one year from the date the optionee’s service period begins and 1/48 monthly thereafter. Subject to adjustment for certain changes in the Company’s capital structure, the maximum aggregate number of shares of common stock that may be issued under the 2008 Plan is 55,563,156.
In December 2013, in connection with the closing of the Company’s initial public offering, the 2008 Plan was terminated and shares authorized for issuance under the 2008 Plan were cancelled (except for those shares reserved for issuance upon exercise of outstanding stock options). As of January 31, 2014, options to purchase and restricted stock units to convert to a total of 16,805,602 shares of common stock were outstanding under the 2008 Plan pursuant to their original terms and no shares were available for future grant.
2013 Equity Incentive Plan
In September 2013, the Company adopted the 2013 Equity Incentive Plan (the 2013 Plan), which became effective on December 12, 2013 and serves as the successor to the Company’s 2008 Plan. Upon completion of the Company’s initial public offering, the Company ceased granting awards under the 2008 Plan and any remaining shares available for issuance under the 2008 Plan were added to the shares reserved under the 2013 Plan. The 2013 Plan will terminate in September 2023, unless sooner terminated by the board of directors.
The 2013 Plan provides for the grant of incentive stock options, non-statutory stock options, restricted stock awards, stock bonus awards, stock appreciation rights, RSUs and performance awards, all of which may be granted to eligible employees, consultants or directors.
Under the terms of the 2013 Plan, awards may be granted at prices not less than 100% of the fair value of the Company’s common stock, as determined by the Company’s board of directors, on the date of grant for stock options. Options vest over a period of time as determined by the board of directors, generally over a four-year period, and expire ten years from date of grant.
Initially, the aggregate number of shares of the Company’s common stock that may be issued pursuant to stock awards under the 2013 Plan after the 2013 Plan becomes effective is 10,168,504 shares, plus any reserved shares not issued or subject to outstanding grants under the 2008 Plan on the date the 2013 Plan became effective, shares that are subject to stock options or RSUs granted under the 2008 Plan that cease to be subject to such stock options or other awards by forfeiture or
78
Table of Contents
Index to Financial Statements
otherwise or are issued and later forfeited or repurchased by the Company after the date the 2013 Plan became effective, and shares that are subject to stock options or other awards under the 2008 Plan that are used to pay the exercise price of an option or withheld to satisfy the tax withholding obligations related to any award. The number of shares available for grant and issuance under the 2013 Plan will automatically increase on February 1st of each of the calendar years 2014 through 2022, by the lesser of (i) 5% of the number of shares issued and outstanding on each January 31st immediately prior to the date of increase or (ii) such number of shares determined by the Company’s board of directors. The maximum number of shares that may be issued pursuant to the exercise of incentive stock options under the 2013 Plan is 300 million shares. As of January 31, 2014, stock options to purchase and restricted stock units to convert to a total of 149,950 shares of common stock were outstanding under the 2013 Plan and 10,142,193 shares were reserved for future issuance.
2013 Employee Stock Purchase Plan
In September 2013, the Company adopted the 2013 Employee Stock Purchase Plan (the 2013 ESPP), which became effective on December 12, 2013.
The 2013 ESPP initially authorizes the issuance of 2,015,299 shares of the Company’s common stock pursuant to purchase rights granted to eligible employees. The number of shares of common stock reserved for issuance will automatically increase on February 1st of each calendar year, by an amount equal to (i) 1% of the total number of outstanding shares of common stock and common stock equivalents on the immediately preceding January 31st, or (ii) such lesser number of shares of common stock as determined by the Company’s board of directors. The maximum number of shares that may be issued pursuant to the 2013 ESPP is 30 million shares. The 2013 ESPP is intended to qualify as an “employee stock purchase plan” within the meaning of Section 423 of the Code.
The 2013 ESPP was implemented through a series of offerings of purchase rights to eligible employees. Except for the initial offering period, each offering period is for 24 months beginning March 10th and September 10th of each year, with each such offering period consisting of four six-month purchase periods. The initial offering period began December 12, 2013 and will end on March 9, 2016, with purchase dates on September 9, 2014, March 9, 2015, September 9, 2015 and March 9, 2016.
Eligible employees may participate through payroll deductions of 1% to 15% of their earnings. Common stock will be issued to participating employees at a price per share equal to 85% of the lesser of (a) the fair market value on the offering date, or (b) the fair market value on the purchase date. In accordance with the 2013 ESPP, the fair market value of the Company’s common stock on the first day of the initial offering period was $21.00, the price per share at which shares were first sold to the public in the Company’s initial public offering, as specified in the Company’s final prospectus filed with the Securities and Exchange Commission on December 13, 2013 pursuant to Rule 424(b). As of January 31, 2014, the Company had 2,015,299 shares reserved for future issuance.
Early Exercises of Stock Options
Stock options granted under the 2008 Plan provide employee option holders, if approved by the Board, the right to exercise unvested options in exchange for restricted common stock, which is subject to a repurchase right held by the Company at the lower of (i) the fair market value of its common stock on the date of repurchase or (ii) the original purchase price. Early exercises of options are not deemed to be substantive exercises for accounting purposes and accordingly, amounts received for early exercises are recorded as a liability. As of January 31, 2014 and 2013, there were 1,593,298 and 1,866,042 shares, respectively, subject to repurchase related to stock options early exercised and unvested. These amounts are reclassified to common stock and additional paid-in capital as the underlying shares vest. As of January 31, 2014 and 2013, the Company recorded a liability related to these shares subject to repurchase in the amount of $4.4 million and $2.6 million, respectively, within other long-term liabilities in its consolidated balance sheets.
79
Table of Contents
Index to Financial Statements
Fair Value of Common Stock
Prior to the Company’s initial public offering, the Company’s board of directors considered numerous objective and subjective factors to determine the fair value of common stock at each grant date. These factors included, but were not limited to, (i) contemporaneous valuations of common stock performed by unrelated third-party firms; (ii) the prices for the preferred stock sold to outside investors; (iii) the rights, preferences and privileges of the preferred stock relative to the common stock; (iv) the lack of marketability of the Company’s common stock; (v) developments in the business; and (vi) the likelihood of achieving a liquidity event, such as an initial public offering or a merger or acquisition of the Company, given prevailing market conditions.
The Company has used the publicly quoted price as the fair value of its common stock since its common stock became publicly traded in December 2013.
Stock Options and RSUs
The following is a summary of the Company’s stock option and RSUs activity during the year ended January 31, 2014:
| Shares Subject to Options Outstanding |
Outstanding RSUs | |||||||||||||||||||
| Shares Available for Grant |
Shares Subject to Outstanding Options |
Weighted- Average Exercise Price |
Outstanding RSUs |
Weighted- Average Grant Date Fair Value |
||||||||||||||||
| Balance as of January 31, 2013 |
205,880 | 12,018,979 | $ | 1.55 | — | $ | — | |||||||||||||
| Additional options authorized for issuance |
17,068,844 | — | — | |||||||||||||||||
| Options granted |
(7,446,276 | ) | 7,446,276 | 5.08 | — | N/A | ||||||||||||||
| RSUs granted |
(635,410 | ) | — | N/A | 635,410 | 18.92 | ||||||||||||||
| RSU vested |
— | — | N/A | (9,150 | ) | 26.53 | ||||||||||||||
| Options exercised |
— | (2,311,842 | ) | 2.34 | — | N/A | ||||||||||||||
| Options canceled |
824,120 | (824,120 | ) | 2.81 | — | N/A | ||||||||||||||
| Options repurchased |
125,035 | — | — | N/A | ||||||||||||||||
|
|
|
|
|
|
|
|||||||||||||||
| Balance as of January 31, 2014 |
10,142,193 | 16,329,293 | $ | 2.99 | 626,260 | $ | 18.81 | |||||||||||||
|
|
|
|
|
|
|
|||||||||||||||
The following table summarizes information about the Company’s stock options outstanding as of January 31, 2014:
| Shares Subject to Options Outstanding | ||||||||||||||||
| Number of Shares Subject to Options |
Weighted- Average Exercise Price |
Weighted- Average Remaining Contractual Term |
Aggregate Intrinsic Value |
|||||||||||||
| (years) | (in thousands) | |||||||||||||||
| Vested and expected to vest as of January 31, 2014 |
14,596,232 | $ | 2.82 | 8.23 | $ | 589,834 | ||||||||||
| Exercisable as of January 31, 2014 |
16,265,292 | 2.93 | 8.30 | 655,482 | ||||||||||||
The options exercisable as of January 31, 2014 included options that are exercisable prior to vesting. The intrinsic value of options vested and expected to vest and become exercisable as of January 31, 2014 was calculated based on the difference between the exercise price and the fair value of the Company’s common stock as of January 31, 2014. The intrinsic value of exercised options for the years ended January 31, 2014, 2013 and 2012 was $10.0 million, $2.5 million and $1.4 million, respectively, and was calculated based on the difference between the exercise price and the fair value of the Company’s common stock as of the exercise date.
80
Table of Contents
Index to Financial Statements
The fair value of stock options that vested in the years ended January 31, 2014, 2013 and 2012 was $3.9 million, $2.4 million and $0.3 million, respectively.
Stock-Based Compensation
The following table summarizes the components of stock-based compensation expense related to stock options, RSUs and ESPP (in thousands):
| Year Ended January 31, | ||||||||||||
| 2014 | 2013 | 2012 | ||||||||||
| Cost of product revenue |
$ | 232 | $ | 48 | $ | 10 | ||||||
| Cost of support and service revenue |
468 | 114 | 31 | |||||||||
| Research and development |
3,049 | 874 | 268 | |||||||||
| Sales and marketing |
3,674 | 1,029 | 244 | |||||||||
| General and administrative |
1,726 | 539 | 267 | |||||||||
|
|
|
|
|
|
|
|||||||
| Total stock-based compensation expense |
$ | 9,149 | $ | 2,604 | $ | 820 | ||||||
|
|
|
|
|
|
|
|||||||
The weighted-average fair value of options granted was $3.94, $1.33 and $0.61 per share for the years ended January 31, 2014, 2013 and 2012, respectively. The Company started to issue RSUs in the year ended January 31, 2014. The weighted-average fair value of RSUs granted was $18.92 per share for the years ended January 31, 2014. The weighted average fair value of stock purchase rights granted was $6.91 per share for the year ended January 31, 2014.
As of January 31, 2014, there was $25.6 million of unrecognized stock-based compensation expense for stock options that will be recognized over the remaining weighted-average period of 3.3 years. As of January 31, 2014, there was $10.2 million of unrecognized stock-based compensation expense for RSUs that will be recognized over the remaining weighted-average period of 3.9 years. As of January 31, 2014, there was $8.2 million of unrecognized stock-based compensation expense for stock purchase rights that will be recognized over the remaining offering period, through March 2016.
The Company estimated the fair value of employee stock options using a Black-Scholes-Merton option-valuation model with the following assumptions:
| Year Ended January 31, | ||||||||||||
| 2014 | 2013 | 2012 | ||||||||||
| Expected term (in years) |
6.0 | 5.8 | 6.0 | |||||||||
| Volatility |
62 | % | 62 | % | 61 | % | ||||||
| Risk-free interest rate |
0.8% - 2.0 | % | 0.6% - 3.6 | % | 0.9% - 2.5 | % | ||||||
| Dividend yield |
0 | % | 0 | % | 0 | % | ||||||
Expected Term. Given the Company’s limited historical exercise behavior, the expected term of options granted was determined using the “simplified” method. Under this approach, the expected term is presumed to be the average of the vesting term and the contractual term of the option.
Expected Volatility. Since the Company does not have sufficient trading history for its common stock, the expected volatility used is based on volatility of similar entities. In evaluating similarity, the Company considered factors such as industry, stage of life cycle, size, and financial leverage.
Risk-Free Interest Rate. The risk-free rate that the Company uses is based on U.S. Treasury zero-coupon issues with remaining terms similar to the expected term of the options.
Dividend Yield. The Company has never declared or paid any cash dividends and does not plan to pay cash dividends in the foreseeable future and, therefore, uses an expected dividend yield of zero in the valuation model.
81
Table of Contents
Index to Financial Statements
The Company is required to estimate forfeitures at the time of grant and revise those estimates in subsequent periods if actual forfeitures differ from those estimates. The Company uses historical data to estimate pre-vesting option forfeitures and records stock-based compensation expense only for those awards that are expected to vest. All stock-based payment awards are amortized on a straight-line basis over the requisite service periods of the awards, which are generally the vesting periods.
The Company accounted for the stock purchase rights at the grant date (first day of the offering period) by valuing the four purchase periods separately. The value of the stock purchase right consists of: (1) 15% discount on the purchase of the stock and (2) 85% of the call option. The call option was valued using the Black-Scholes-Merton option-pricing model with the following assumptions:
| Year Ended January 31, 2014 | ||
| Expected term (in years) |
0.8 - 2.3 | |
| Volatility |
43% - 48% | |
| Risk-free interest rate |
0.1% - 0.4% | |
| Dividend yield |
0% |
10. 401(k) Plan
The Company has a qualified defined contribution plan under Section 401(k) of the Internal Revenue Code covering eligible employees. Participants may make pre-tax contributions to the plan from their eligible earnings up to the statutorily prescribed annual limit on pre-tax contributions under the Code. Although the plan provides for a discretionary employer matching contribution, to date the Company has not made such a contribution on behalf of employees.
11. Income Taxes
The provision for income taxes is based upon the loss before provision for income taxes as follows (in thousands):
| Year Ended January 31, | ||||||||||||
| 2014 | 2013 | 2012 | ||||||||||
| U.S. operations |
$ | (44,007) | $ | (27,972) | $ | (16,805) | ||||||
| Non-U.S. operations |
1,309 | 214 | 20 | |||||||||
|
|
|
|
|
|
|
|||||||
| $ | (42,698) | $ | (27,758) | $ | (16,785) | |||||||
|
|
|
|
|
|
|
|||||||
The Company’s provision for income taxes of $425,000 for the year ended January 31, 2014 consisted of current foreign taxes, current federal taxes, current state taxes and deferred foreign taxes. The Company’s provision for income taxes of $99,000 for the year ended January 31, 2013 consisted of current foreign taxes and current state taxes. The Company’s provision for income taxes of $5,000 for the year ended January 31, 2012 consisted of current foreign taxes.
The Company’s effective tax rate differs from the U.S. federal statutory tax rate due to the following (in thousands):
| Year Ended January 31, | ||||||||||||
| 2014 | 2013 | 2012 | ||||||||||
| U.S. federal taxes at statutory tax rate |
$ | (14,492) | $ | (9,438) | $ | (5,707) | ||||||
| State taxes, net of federal benefit |
(1,414) | (1,414) | (998) | |||||||||
| Nondeductible expenses |
218 | 187 | 165 | |||||||||
| Nondeductible stock-based compensation |
1,469 | 689 | 298 | |||||||||
| Research and development credits |
(1,609) | (855) | (305) | |||||||||
| Change in valuation allowance |
16,253 | 10,930 | 6,552 | |||||||||
|
|
|
|
|
|
|
|||||||
| Provision for income taxes |
$ | 425 | $ | 99 | $ | 5 | ||||||
|
|
|
|
|
|
|
|||||||
82
Table of Contents
Index to Financial Statements
The significant components of net deferred tax assets were as follows (in thousands):
| As of January 31, | ||||||||
| 2014 | 2013 | |||||||
| Deferred tax assets: |
||||||||
| Net operating losses |
$ | 25,379 | $ | 19,045 | ||||
| Depreciation |
366 | 453 | ||||||
| Accruals and reserves |
8,813 | 1,636 | ||||||
| Stock-based compensation |
1,174 | — | ||||||
| Tax credits |
3,600 | 1,991 | ||||||
|
|
|
|
|
|||||
| Gross deferred tax assets |
39,332 | 23,125 | ||||||
| Deferred tax liabilities |
— | — | ||||||
|
|
|
|
|
|||||
| Net deferred tax assets prior to valuation allowance |
39,332 | 23,125 | ||||||
| Valuation allowance |
(39,260 | ) | (23,125 | ) | ||||
|
|
|
|
|
|||||
| Total net deferred tax assets |
$ | 72 | $ | — | ||||
|
|
|
|
|
|||||
The net valuation allowance increased by $16.1 million during the years ended January 31, 2014. Management has recorded a full valuation allowance against its net domestic deferred tax assets as it is more likely than not that the assets will not be realized based on the Company’s history of losses.
As of January 31, 2014, the Company had net operating loss carryforwards and research and development credits as follows (in thousands):
| Amount | Expiration Year | |||||
| Net operating losses, federal |
$ | 73,186 | 2034 | |||
| Net operating losses, state |
55,696 | 2034 | ||||
| Research and development credits, federal |
3,101 | 2034 | ||||
| Research and development credits, state |
3,392 | Indefinite | ||||
The Company uses the ‘with-and-without’ approach to determine the recognition and measurement of excess tax benefits. Accordingly, the Company has elected to recognize excess income tax benefits from stock option exercises in additional paid in capital only if an incremental income tax benefit would be realized after considering all other tax attributes presently available to the Company. As of January 31, 2014, the amount of such excess tax benefits from stock options included in net operating losses was $7.2 million and $2.0 million for federal and California purposes. In addition, the Company has elected to account for the indirect effects of stock-based awards on other tax attributes, such as the research and alternative minimum tax credits, through its statements of operations. Federal and California tax laws impose limitations on the utilization of net operating loss and credit carryforwards in the event of an “ownership change” for tax purposes, as defined in Section 382 of the Internal Revenue Code. The Company determined there was no “ownership change” as of January 31, 2014.
The Company has no present intention of remitting undistributed earnings of foreign subsidiaries and, accordingly, no deferred tax liability has been established relative to these earnings. As of January 31, 2014, the Company’s undistributed earnings of foreign subsidiaries was $1.1 million.
The Company recognizes interest and penalties related to uncertain tax positions, if any, as a component of its income tax provision. The Company recognized de minimis interest and penalties related to uncertain tax positions for the years ended January 31, 2014, 2013 and 2012.
83
Table of Contents
Index to Financial Statements
A reconciliation of the beginning and ending balances of gross unrecognized tax benefits, before interest and penalties is as follows (in thousands):
| Amount | ||||
| Balance as of January 31, 2011 |
$ | 376 | ||
| Additions for tax positions related to prior year |
— | |||
| Additions for tax positions related to current year |
172 | |||
| Reductions for tax positions related to prior year |
— | |||
|
|
|
|||
| Balance as of January 31, 2012 |
548 | |||
| Additions for tax positions related to prior year |
— | |||
| Additions for tax positions related to current year |
535 | |||
| Reductions for tax positions related to prior year |
— | |||
|
|
|
|||
| Balance as of January 31, 2013 |
1,083 | |||
| Additions for tax positions related to prior year |
9 | |||
| Additions for tax positions related to current year |
955 | |||
| Reductions for tax positions related to prior year |
— | |||
|
|
|
|||
| Balance as of January 31, 2014 |
$ | 2,047 | ||
|
|
|
|||
The gross unrecognized tax benefits, if recognized, would not affect the effective tax rate as of January 31, 2014. While it is often difficult to predict the final outcome of any particular uncertain tax position, the Company does not believe it is reasonably possible that the total amount of unrecognized tax benefits as of January 31, 2014 will materially change in the next 12 months.
The Company files federal, state, and foreign income tax returns in many jurisdictions in the United States and abroad. For U.S. federal and state income tax purposes, the statute of limitations currently remains open for all years due to the Company’s NOL carryforwards. The Company is not currently under examination in any jurisdiction.
The Company recorded an income tax provision of $425,000 for the year ended January 31, 2014. The income tax provision for the year ended January 31, 2014 reflected mainly income tax expense in non-U.S. jurisdictions. The Company continues to maintain a valuation allowance for its U.S. federal and state deferred tax assets.
12. Segments
The Company’s chief operating decision maker is its chief executive officer. The chief executive officer reviews consolidated financial information accompanied by information about revenue by product line for purposes of allocating resources and evaluating financial performance. The Company has one business activity and there are no segment managers who are held accountable for operations, or operating results for levels or components. In addition, the majority of the Company’s operations and customers are located in the United States. As such, the Company has a single reporting segment and operating unit structure.
84
Table of Contents
Index to Financial Statements
Revenue by country or region, based on the mailing address of the customer, for the periods presented was as follows (in thousands):
| Year Ended January 31, | ||||||||||||
| 2014 | 2013 | 2012 | ||||||||||
| North America |
$ | 107,305 | $ | 49,330 | $ | 13,887 | ||||||
| EMEA |
11,731 | 3,895 | 126 | |||||||||
| APAC |
6,550 | 573 | — | |||||||||
| Other |
147 | 42 | — | |||||||||
|
|
|
|
|
|
|
|||||||
| Total revenue |
$ | 125,733 | $ | 53,840 | $ | 14,013 | ||||||
|
|
|
|
|
|
|
|||||||
Long-lived assets located in the following countries and regions as of each period end were as follows (in thousands):
| As of January 31, | ||||||||
| 2014 | 2013 | |||||||
| North America |
$ | 24,069 | $ | 4,054 | ||||
| United Kingdom |
80 | — | ||||||
| Australia |
172 | 7 | ||||||
|
|
|
|
|
|||||
| Total long-lived assets |
$ | 24,321 | $ | 4,061 | ||||
|
|
|
|
|
|||||
13. Line of Credit
In October 2013, the Company entered into an agreement with Wells Fargo Bank, National Association (Wells Fargo) to provide a secured revolving credit facility (the Credit Facility) that allows the Company to borrow up to $15.0 million for general corporate purposes. Amounts outstanding under the Credit Facility will bear interest at Wells Fargo’s prime rate (3.25% as of October 1, 2013) with accrued interest payable on a monthly basis. In addition, the Company is obligated to pay a commitment fee of 0.20% per annum on the unused portion of the Credit Facility, with such fee payable on a quarterly basis. As of January 31, 2014, the commitment fee was capitalized and being amortized on the Company’s consolidated balance sheet. The Credit Facility expires in October 2014. As part of the credit facility, the Company granted to Wells Fargo a first priority lien in its accounts receivable and other corporate assets, agreed to not pledge its intellectual property to other parties and became subject to certain reporting and financial covenants, as follows: (1) maintain specified quarterly levels of EBITDA, which is defined as net income before tax plus interest expense (net of capitalized interest expense), depreciation expense and non-cash stock compensation expense; and (2) maintain a monthly ratio of not less than 1.25 to 1.00, based on the aggregate of its cash and net accounts receivable divided by total current liabilities minus current deferred revenue. As of January 31, 2014, no amounts had been drawn against the Credit Facility.
85
Table of Contents
Index to Financial Statements
14. Selected Quarterly Financial Data (unaudited)
The following tables set forth selected unaudited quarterly consolidated statements of operations data for each of the eight quarters in fiscal 2014 and 2013 (in thousands, except per share data):
| Quarter Ended | ||||||||||||||||||||||||||||||||
| April 30, 2012 |
July 31, 2012 |
October 31, 2012 |
January 31, 2013 |
April 30, 2013 |
July 31, 2013 |
October 31, 2013 |
January 31, 2014 |
|||||||||||||||||||||||||
| Net revenues |
$ | 8,156 | $ | 10,953 | $ | 14,552 | $ | 20,179 | $ | 22,124 | $ | 28,478 | $ | 33,411 | $ | 41,720 | ||||||||||||||||
| Gross profit |
5,178 | 6,863 | 8,936 | 12,413 | 13,581 | 18,180 | 22,022 | 27,739 | ||||||||||||||||||||||||
| Net loss |
(5,061 | ) | (5,506 | ) | (7,079 | ) | (10,211 | ) | (9,371 | ) | (10,463 | ) | (10,136 | ) | (13,153 | ) | ||||||||||||||||
| Accretion of redeemable convertible preferred stock |
(7 | ) | (7 | ) | (10 | ) | (10 | ) | (10 | ) | (11 | ) | (10 | ) | (5 | ) | ||||||||||||||||
|
|
|
|
|
|
|
|
|
|
|
|
|
|
|
|
|
|||||||||||||||||
| Net loss attributable to common stockholders |
$ | (5,068 | ) | $ | (5,513 | ) | $ | (7,089 | ) | $ | (10,221 | ) | $ | (9,381 | ) | $ | (10,474 | ) | $ | (10,146 | ) | $ | (13,158 | ) | ||||||||
|
|
|
|
|
|
|
|
|
|
|
|
|
|
|
|
|
|||||||||||||||||
| Net loss per share attributable to common stockholders, basic and diluted |
$ | (0.30 | ) | $ | (0.31 | ) | $ | (0.38 | ) | $ | (0.53 | ) | $ | (0.47 | ) | $ | (0.51 | ) | $ | (0.48 | ) | $ | (0.29 | ) | ||||||||
|
|
|
|
|
|
|
|
|
|
|
|
|
|
|
|
|
|||||||||||||||||
86
Table of Contents
Index to Financial Statements
| ITEM 9. | Changes In and Disagreements with Accountants on Accounting and Financial Disclosure |
None.
ITEM 9A. CONTROLS AND PROCEDURES
Evaluation of Disclosure Controls and Procedures
Regulations under the Securities Exchange Act of 1934, or the Exchange Act, require public companies, including us, to maintain “disclosure controls and procedures,” which are defined in Rule 13a-15(e) and Rule 15d-15(e) to mean a company’s controls and other procedures that are designed to ensure that information required to be disclosed in the reports that it files or submits under the Exchange Act is recorded, processed, summarized and reported, within the time periods specified in the U.S. Securities and Exchange Commission’s, or the SEC’s, rules and forms. Disclosure controls and procedures include, without limitation, controls and other procedures designed to ensure that information required to be disclosed by a company in the reports that it files or submits under the Exchange Act is accumulated and communicated to the company’s management, including its principal executive and principal financial officers, as appropriate to allow timely decisions regarding required disclosure.
In designing and evaluating our disclosure controls and procedures, management recognizes that disclosure controls and procedures, no matter how well conceived and operated, can provide only reasonable, not absolute, assurance that the objectives of the disclosure controls and procedures are met. Additionally, in designing disclosure controls and procedures, our management necessarily was required to apply its judgment in evaluating the cost-benefit relationship of possible disclosure controls and procedures. Our management, with the participation of our principal executive officer and principal financial officer, evaluated the effectiveness of our disclosure controls and procedures pursuant to Rules 13a-15 under the Exchange Act, as of the end of the period covered by this Annual Report on Form 10-K for the financial year ended January 31, 2014. Based on the evaluation, as of January 31, 2014, our principal executive officer and principal financial officer concluded that our disclosure controls and procedures are designed at a reasonable assurance level and are effective to provide reasonable assurance that information we are required to disclose in reports that we file or submit under the Exchange Act is recorded, processed, summarized and reported within the time periods specified in the SEC’s rules and forms, and that such information is accumulated and communicated to our management, including our chief executive officer and chief financial officer, as appropriate, to allow timely decisions regarding required disclosure.
Management’s Annual Report on Internal Control Over Financial Reporting
This Annual Report on Form 10-K does not include a report of management’s assessment regarding internal control over financial reporting or an attestation report of our registered public accounting firm due to a transition period established by rules of the Securities and Exchange Commission for newly public companies.
Changes in Internal Control over Financial Reporting
There were no changes in our internal control over financial reporting identified in management’s evaluation pursuant to Rules 13a-15(d) or 15d-15(d) of the Exchange Act during the quarter ended January 31, 2014 that materially affected, or are reasonably likely to materially affect, our internal control over financial reporting.
None.
87
Table of Contents
Index to Financial Statements
ITEM 10. DIRECTORS, EXECUTIVE OFFICERS AND CORPORATE GOVERNANCE
The information required by this item is incorporated herein by reference to information contained in the Proxy Statement for our 2014 Annual Meeting of Stockholders.
We have adopted codes of ethics, our Code of Business Conduct and Ethics for employees, which applies to all employees, including our principal executive officers, our principal financial officer and all other executive officers, and our Code of Business Conduct and Ethics for Directors, which applies to our board of directors. The Codes of Business Conduct and Ethics are available on our website at www.investors.nimblestorage.com under “Governance Documents.” We intend to satisfy the disclosure requirement under Item 5.05 of Form 8-K regarding amendment to, or waiver from, a provision of our Code of Business Conduct and Ethics by posting such information on our website at the address and location specified above.
ITEM 11. EXECUTIVE COMPENSATION
The information required by this item is incorporated herein by reference to information contained in the Proxy Statement for our 2014 Annual Meeting of Stockholders.
ITEM 12. SECURITY OWNERSHIP OF CERTAIN BENEFICIAL OWNERS AND MANAGEMENT AND RELATED STOCKHOLDER MATTERS
The information required by this item is incorporated herein by reference to information contained in the Proxy Statement for our 2014 Annual Meeting of Stockholders.
ITEM 13. CERTAIN RELATIONSHIPS AND RELATED TRANSACTIONS, AND DIRECTOR INDEPENDENCE
The information required by this item is incorporated herein by reference to information contained in the Proxy Statement for our 2014 Annual Meeting of Stockholders.
ITEM 14. PRINCIPAL ACCOUNTANT FEES AND SERVICES
The information required by this item is incorporated herein by reference to information contained in the Proxy Statement for our 2014 Annual Meeting of Stockholders.
88
Table of Contents
Index to Financial Statements
ITEM 15. EXHIBITS AND FINANCIAL STATEMENT SCHEDULES
We have filed the following documents as a part of this Annual Report on Form 10-K:
(a) Financial Statements
| Page | ||||
| 61 | ||||
| 62 | ||||
| 63 | ||||
| 64 | ||||
| Consolidated Statements of Convertible Preferred Stock and Stockholders’ Equity (Deficit) |
65 | |||
| 66 | ||||
| 67 | ||||
(b) Financial Statement Schedules
All schedules have been omitted because the required information is not present or not present in amounts sufficient to require submission of the schedules or because the information required is included in the Consolidated Financial Statements or notes thereto.
(c) Exhibits
The list of exhibits filed with this report is set forth in the Exhibit Index following the signature pages and is incorporated herein by reference.
89
Table of Contents
Index to Financial Statements
SIGNATURES
Pursuant to the requirements of Section 13 or 15(d) of the Securities Exchange Act of 1934, the Registrant has duly caused this Annual Report on Form 10-K to be signed on its behalf by the undersigned, thereunto duly authorized, in San Jose, California, on the 17th day of April, 2014.
| NIMBLE STORAGE, INC. | ||
| By: | /s/ Suresh Vasudevan | |
| Suresh Vasudevan Chief Executive Officer | ||
POWER OF ATTORNEY
KNOW ALL PERSONS BY THESE PRESENTS, that each person whose signature appears below hereby constitutes and appoints Suresh Vasudevan and Anup Singh, and each of them, as his true and lawful attorneys-in-fact, proxies and agents, each with full power of substitution, for him in any and all capacities, to sign any and all amendments to this Annual Report on Form 10-K, and to file the same, with all exhibits thereto and other documents in connection therewith, with the Securities and Exchange Commission, granting unto said attorneys-in-fact, proxies and agents full power and authority to do and perform each and every act and thing requisite and necessary to be done in connection therewith, as fully for all intents and purposes as he might or could do in person, hereby ratifying and confirming all that said attorneys-in-fact, proxies and agents, or their or his substitute or substitutes, may lawfully do or cause to be done by virtue hereof.
Pursuant to the requirements of the Securities Exchange Act of 1934, this report has been signed below by the following persons on behalf of the Registrant and in the capacities and on the dates indicated.
| Signature |
Title |
Date | ||
| /s/ Suresh Vasudevan Suresh Vasudevan |
Chief Executive Officer and Director (Principal Executive Officer) |
April 17, 2014 | ||
| /s/ Anup Singh Anup Singh |
Chief Financial Officer (Principal Accounting and Financial Officer) |
April 17, 2014 | ||
| /s/ Varun Mehta Varun Mehta |
Founder, Vice President of Engineering and Director | April 17, 2014 | ||
| /s/ Frank Calderoni Frank Calderoni |
Director | April 17, 2014 | ||
| /s/ James J. Goetz James J. Goetz |
Director | April 17, 2014 | ||
| /s/ Jerry M. Kennelly Jerry M. Kennelly |
Director | April 17, 2014 | ||
| /s/ Ping Li Ping Li |
Director | April 17, 2014 | ||
| /s/ William J. Schroeder William J. Schroeder |
Director | April 17, 2014 | ||
90
Table of Contents
Index to Financial Statements
EXHIBIT INDEX
| Exhibit | Incorporated by Reference | Filed Herewith | ||||||||||||||||||||||||
| Number | Exhibit Description | Form | File No. | Exhibit | Filing Date | |||||||||||||||||||||
| 3.1 | Restated Certificate of Incorporation. | S-1 | 333-191789 | 3.2 | December 2, 2013 | |||||||||||||||||||||
| 3.2 | Amended and Restated Bylaws. | S-1 | 333-191789 | 3.4 | December 2, 2013 | |||||||||||||||||||||
| 4.1 | Form of Common Stock Certificate. | S-1 | 333-191789 | 4.1 | December 10, 2013 | |||||||||||||||||||||
| 4.2 | Amended and Restated Investors Rights Agreement, dated August 10, 2012, by and among the Registrant and certain of its stockholders, as amended. | S-1 | 333-191789 | 4.2 | October 18, 2013 | |||||||||||||||||||||
| 10.1+ | Form of Indemnification Agreement. | S-1 | 333-191789 | 10.1 | December 2, 2013 | |||||||||||||||||||||
| 10.2+ | 2008 Equity Incentive Plan and forms of award agreements. | S-1 | 333-191789 | 10.2 | October 18, 2013 | |||||||||||||||||||||
| 10.3+ | 2013 Equity Incentive Plan and forms of award agreements. | S-1 | 333-191789 | 10.3 | December 2, 2013 | |||||||||||||||||||||
| 10.4+ | 2013 Employee Stock Purchase Plan and form of subscription agreement. | S-1 | 333-191789 | 10.4 | December 2, 2013 | |||||||||||||||||||||
| 10.5+ | Offer Letter, accepted and agreed to January 3, 2011, by and between the Registrant and Suresh Vasudevan. | S-1 | 333-191789 | 10.5 | October 18, 2013 | |||||||||||||||||||||
| 10.6+ | Offer Letter, accepted and agreed to October 22, 2011, by and between the Registrant and Anup Singh. | S-1 | 333-191789 | 10.6 | October 18, 2013 | |||||||||||||||||||||
| 10.7+ | Offer Letter, accepted and agreed to February 5, 2010, by and between the Registrant and Michael Muñoz. | S-1 | 333-191789 | 10.7 | October 18, 2013 | |||||||||||||||||||||
| 10.8 | Office Lease, dated April 19, 2013, by and between the Registrant and RO Parkway Associates, LLC. | S-1 | 333-191789 | 10.8 | October 18, 2013 | |||||||||||||||||||||
| 10.9+ | Change in Control Severance Policy. | S-1 | 333-191789 | 10.9 | October 18, 2013 | |||||||||||||||||||||
| 10.10 | Credit Agreement dated October 1, 2013, by and between the Registrant and Wells Fargo Bank, National Association. | S-1 | 333-191789 | 10.10 | October 18, 2013 | |||||||||||||||||||||
| 10.11 | Security Agreement dated October 1, 2013, by and between the Registrant and Wells Fargo Bank, National Association. | S-1 | 333-191789 | 10.11 | October 18, 2013 | |||||||||||||||||||||
| 21.1 | Subsidiaries of the Registrant. | S-1 | 333-191789 | 21.1 | October 18, 2013 | |||||||||||||||||||||
| 23.1 | Consent of Independent Registered Public Accounting Firm. | X | ||||||||||||||||||||||||
91
Table of Contents
Index to Financial Statements
| 24.1 | Power of Attorney (see page 90 to this report). | X | ||||||||||||||||||||||
| 31.1 | Certification of Periodic Report by Principal Executive Officer under Section 302 of the Sarbanes-Oxley Act of 2002. | X | ||||||||||||||||||||||
| 31.2 | Certification of Periodic Report by Principal Financial Officer under Section 302 of the Sarbanes-Oxley Act of 2002. . |
X | ||||||||||||||||||||||
| 32.1* | Certification of Chief Executive Officer Pursuant to 18 U.S.C. Section 1350 as Adopted Pursuant to Section 906 of the Sarbanes-Oxley Act of 2002. | X | ||||||||||||||||||||||
| 32.2* | Certification of Chief Financial Officer Pursuant to 18 U.S.C. Section 1350 as Adopted Pursuant to Section 906 of the Sarbanes-Oxley Act of 2002 . |
X | ||||||||||||||||||||||
| + | Indicates a management contract or compensatory plan. |
| * | As contemplated by Securities Exchange Commission Release No. 33-8212, these exhibits are furnished with this Annual Report on Form 10-K and are not deemed filed with the Securities and Exchange Commission and are not incorporated by reference in any filing of Nimble Storage, Inc. under the Securities Act of 1933, as amended, or the Exchange Act of 1934, whether made before or after the date hereof and irrespective of any general incorporation language in such filings. |
92