Attached files
| file | filename |
|---|---|
| EX-21.1 - EX-21.1 - TAKE TWO INTERACTIVE SOFTWARE INC | a2224758zex-21_1.htm |
| EX-32.1 - EX-32.1 - TAKE TWO INTERACTIVE SOFTWARE INC | a2224758zex-32_1.htm |
| EX-31.1 - EX-31.1 - TAKE TWO INTERACTIVE SOFTWARE INC | a2224758zex-31_1.htm |
| EX-23.1 - EX-23.1 - TAKE TWO INTERACTIVE SOFTWARE INC | a2224758zex-23_1.htm |
| EX-31.2 - EX-31.2 - TAKE TWO INTERACTIVE SOFTWARE INC | a2224758zex-31_2.htm |
| EX-32.2 - EX-32.2 - TAKE TWO INTERACTIVE SOFTWARE INC | a2224758zex-32_2.htm |
| EXCEL - IDEA: XBRL DOCUMENT - TAKE TWO INTERACTIVE SOFTWARE INC | Financial_Report.xls |
Use these links to rapidly review the document
TABLE OF CONTENTS
INDEX TO FINANCIAL STATEMENTS
UNITED STATES
SECURITIES AND EXCHANGE COMMISSION
WASHINGTON, D.C. 20549
FORM 10-K
ý |
Annual Report Pursuant to Section 13 or 15(d) of the Securities Exchange Act of 1934 |
|
For the fiscal year ended March 31, 2015 |
||
OR |
||
o |
Transition Report Pursuant to Section 13 or 15(d) of the Securities Exchange Act of 1934 |
|
For the transition period from to . |
||
Commission file number 001-34003
TAKE-TWO INTERACTIVE SOFTWARE, INC.
(Exact name of registrant as specified in its charter)
| Delaware (State or Other Jurisdiction of Incorporation or Organization) |
51-0350842 (I.R.S. Employer Identification No.) |
|
622 Broadway New York, New York (Address of principal executive offices) |
10012 (Zip Code) |
Registrant's Telephone Number, Including Area Code: (646) 536-2842
Securities registered pursuant to Section 12(b) of the Act:
| Title of each class |
Name of each exchange on which registered |
|
|---|---|---|
| Common Stock, $.01 par value | NASDAQ Global Select Market |
Securities registered pursuant to Section 12(g) of the Act: None
Indicate by check mark if the registrant is a well-known seasoned issuer, as defined in Rule 405 of the Securities Act. Yes ý No o
Indicate by check mark if the registrant is not required to file reports pursuant to Section 13 or Section 15(d) of the Act. Yes o No ý
Indicate by check mark whether the Registrant (1) has filed all reports required to be filed by Section 13 or 15(d) of the Securities Exchange Act of 1934 during the preceding 12 months (or for such shorter period that the registrant was required to file such reports), and (2) has been subject to such filing requirements for the past 90 days. Yes ý No o
Indicate by check mark whether the registrant has submitted electronically and posted on its corporate Website, if any, every Interactive Data File required to be submitted and posted pursuant to Rule 405 of Regulation S-T (§232.405 of this chapter) during the preceding 12 months (or for such shorter period that the registrant was required to submit and post such files). Yes ý No o
Indicate by check mark if disclosure of delinquent filers pursuant to Item 405 of Regulation S-K is not contained herein, and will not be contained, to the best of the Registrant's knowledge, in definitive proxy or information statements incorporated by reference in Part III of this Form 10-K or any amendment to this Form 10-K. ý
Indicate by check mark whether the registrant is a large accelerated filer, an accelerated filer, a non-accelerated filer, or a smaller reporting company. See the definitions of "large accelerated filer," "accelerated filer," and "smaller reporting company" in Rule 12b-2 of the Exchange Act. (Check one):
| Large accelerated filer ý | Accelerated filer o | Non-accelerated filer o (Do not check if a smaller reporting company) |
Smaller reporting company o |
Indicate by check mark whether the registrant is a shell company (as defined in Rule 12b-2 of the Exchange Act). Yes o No ý
The aggregate market value of the voting and non-voting common equity held by non-affiliates computed by reference to the price at which the common equity was last sold, or the average bid and asked price of such common equity, as of the last business day of the Registrant's most recently completed second fiscal quarter was approximately $1,864,553,000.
As of May 15, 2015, there were 84,609,452 shares of the Registrant's Common Stock outstanding, net of treasury stock.
Documents Incorporated by Reference:
Portions of the registrant's definitive proxy statement for the 2015 Annual Meeting of Stockholders
are incorporated by reference into Part III herein.
CAUTIONARY NOTE ABOUT FORWARD-LOOKING STATEMENTS
The statements contained herein which are not historical facts are considered forward-looking statements under federal securities laws and may be identified by words such as "anticipates," "believes," "estimates," "expects," "intends," "plans," "potential," "predicts," "projects," "seeks," "will," or words of similar meaning and include, but are not limited to, statements regarding the outlook for the Company's future business and financial performance. Such forward-looking statements are based on the current beliefs of our management as well as assumptions made by and information currently available to them, which are subject to inherent uncertainties, risks and changes in circumstances that are difficult to predict. Actual outcomes and results may vary materially from these forward-looking statements based on a variety of risks and uncertainties including, but not limited to, those discussed under the heading "Risk Factors" included in Part I, Item 1A herein. All forward-looking statements are qualified by these cautionary statements and speak only as of the date they are made. The Company undertakes no obligation to update any forward-looking statement, whether as a result of new information, future events or otherwise.
We are a leading developer, publisher and marketer of interactive entertainment for consumers around the globe. We develop and publish products through our two wholly-owned labels Rockstar Games and 2K. Our products are currently designed for console gaming systems such as Sony's PlayStation®3 ("PS3") and PlayStation®4 ("PS4"), Microsoft's Xbox 360® ("Xbox 360") and Xbox One® ("Xbox One"); and personal computers ("PC"), including smartphones and tablets. We deliver our products through physical retail, digital download, online platforms and cloud streaming services.
As a result of the widening popularity of interactive entertainment, the video game market is expected to continue to grow in coming years. Growth is expected to be driven by continuing increases in the installed base of traditional consoles, along with the growing popularity of games played on emerging platforms such as tablets and smartphones, and online including through social networks. According to the "Global Video Game Market" published by International Development Group ("IDG") in April 2015, the installed base of console systems that we support grew to 158.8 million units as of December 2014, an increase of 24.2 million units or 18% from December 2013, and forecasts that the number will increase to an estimated 233.6 million units in calendar 2019. In addition, according to IDG, global sales from the console, handheld, PC software and digital gaming segments that we support, inclusive of mobile gaming platforms and online, surpassed $65.0 billion in calendar 2014 and forecasts that their annual sales will increase to an estimated $87.3 billion in calendar 2019.
The demographics of the interactive entertainment industry audience have broadened significantly in recent years, with video games becoming an increasingly popular form of mainstream entertainment. According to the "2015 Essential Facts about the Computer and Video Game Industry" published by Entertainment Software Association ("ESA"), 51% of U.S. households own at least one dedicated game console. The average game player is 35 years old and has been actively playing for 13 years.
Our core strategy is to capitalize on the popularity of video games by developing and publishing high-quality interactive entertainment experiences across a range of genres. We focus on building compelling franchises by publishing a select number of titles for which we can create sequels and incremental revenue opportunities through add-on content, microtransactions and online play. We support the success of our products in the marketplace through innovative marketing programs and global distribution on all platforms and through all channels that are relevant to our target audience.
We were incorporated under the laws of the State of Delaware in 1993 and are headquartered in New York, New York with approximately 2,840 employees globally. Our telephone number is (646) 536-2842
1
and our website address is www.take2games.com. We make all of our filings with the Securities and Exchange Commission ("SEC") available free of charge on our website under the caption "Corporate—SEC Filings." Included in these filings are our annual reports on Form 10-K, quarterly reports on Form 10-Q, current reports on Form 8-K and amendments to those reports, which are available as soon as reasonably practicable after we electronically file or furnish such materials with the SEC pursuant to Section 13(a) or 15(d) of the Securities Exchange Act of 1934.
Our website and the information contained therein or connected thereto are not intended to be incorporated into this Annual Report on Form 10-K. You may also obtain copies of our reports without charge by writing to:
Take-Two
Interactive Software, Inc.
622 Broadway
New York, NY 10012
Attn: Investor Relations
You may read and copy any document we file with the SEC at the SEC's public reference room at 100 F Street, NE, Room 1580, Washington, DC 20549. Please call the SEC at 1-800-SEC-0330 for information on the public reference room. The SEC maintains a website that contains annual, quarterly and current reports, proxy and information statements and other information that issuers (including the Company) file electronically with the SEC. The SEC's website is www.sec.gov.
Overview. We endeavor to be the most creative, innovative and efficient company in our industry. Our core strategy is to capitalize on the popularity of video games by developing and publishing high-quality interactive entertainment experiences across a range of genres. We focus on building compelling entertainment franchises by publishing a select number of titles for which we can create sequels and incremental revenue opportunities through add-on content, microtransactions and online play. Most of our intellectual property is internally owned and developed, which we believe best positions us financially and competitively. We have established a portfolio of proprietary software content for the major hardware platforms in a wide range of genres, including action, adventure, family/casual, racing, role-playing, shooter, sports and strategy, which we distribute worldwide. We believe that our commitment to creativity and innovation is a distinguishing strength, enabling us to differentiate our products in the marketplace by combining advanced technology with compelling storylines and characters that provide unique gameplay experiences for consumers. We have created, acquired or licensed a group of highly recognizable brands to match the broad consumer demographics we serve, ranging from adults to children and game enthusiasts to casual gamers. Another cornerstone of our strategy is to support the success of our products in the marketplace through innovative marketing programs and global distribution on all platforms and through all channels that are relevant to our target audience.
Support Label Structure to Target Distinct Market Segments. Our business consists of our wholly-owned labels Rockstar Games and 2K. Rockstar Games is the developer and publisher of the interactive entertainment industry's most iconic and critically acclaimed brand, Grand Theft Auto, as well as other successful franchises, including L.A. Noire, Max Payne, Midnight Club, and Red Dead. We expect Rockstar Games to continue to be a leader in the action / adventure product category and create groundbreaking entertainment by leveraging our existing franchises, as well as developing new brands. 2K publishes high-quality, owned and licensed titles across a range of genres including shooter, action, role-playing, strategy, sports and family/casual. 2K is the publisher of a number of critically acclaimed, multi-million unit selling franchises including BioShock, Borderlands, Carnival Games, Evolve, Mafia, NBA 2K, Sid Meier's Civilization, WWE 2K and XCOM Enemy Unknown. We expect 2K to continue to be a leader by building on its existing brands, as well as by developing new franchises in the future.
2
Focus on Core Strength of Producing Select, High Quality Titles. We focus on publishing a select number of high-quality titles based on internally- owned and developed intellectual properties, which typically provide higher margins than licensed products. We currently own the intellectual property rights to 20 proprietary brands. In addition, we will selectively develop titles based on licensed properties, including sports, and also publish externally developed titles.
We use a product investment review process to evaluate potential titles for investment, to review existing titles in development, and to assess titles after release to measure their performance in the market and the return on our investment. We apply this process to all of our products, whether internally or externally developed. The product investment review process includes reviews of each project at various stages of development by our executive management team and the senior management of our publishing labels, and includes coordination between our sales and marketing personnel before the launch of titles. This disciplined approach to product investment is expected to enhance the competitiveness and profitability of our titles.
We develop our products using a combination of our internal development teams and external development resources acting under contract with us. We typically select external developers based on their track record and expertise in developing products in the same category or genre. One developer will generally produce the same game for multiple platforms and will also produce sequels to the original game. We believe that selecting and using development resources in this manner allows us to leverage the particular expertise of our internal and external development resources, which we believe increases the quality of our products.
Leverage Emerging Technologies, Platforms and Distribution Channels, Including Digitally Delivered Content. Interactive entertainment played on mobile platforms, including tablets and smartphones, and online platforms, including social networks, represent exciting opportunities to enhance our growth and profitability. In addition, the interactive entertainment software industry is delivering a growing amount of content for traditional platforms through digital download on the Internet. We provide a variety of online delivered products and offerings. Virtually all of our titles that are available through retailers as packaged goods products are also available through direct digital download on the Internet (from websites we own and third-party websites). We also aim to drive ongoing engagement and incremental revenues from recurrent consumer spending on our titles after their initial purchase, through downloadable offerings including add-on content, microtransactions and online play. In addition, we are publishing an expanding variety of titles for tablets and smartphones, which are delivered to consumers through digital download via the Internet. We will continue to invest in emerging opportunities in mobile and online gameplay, particularly for our wholly-owned franchises, as well as downloadable content and microtransactions that enable gamers to pay to download additional content to enhance their game playing experience.
Expand International Business. The global market for interactive entertainment continues to grow and we seek to increase our presence internationally, particularly in Asia, Eastern Europe and Latin America. We are continuing our expansion initiatives in the Asian markets, where our strategy is to broaden the distribution of our existing products and establish an online gaming presence, especially in China and South Korea. We are a direct publisher in Japan and South Korea. While we retain title to all intellectual property, under license agreements local publishers are responsible for localization of software content, distribution and marketing of the products in their respective local markets. We intend to continue to build upon our licensing relationships and also continue to expand on finished goods distribution strategies to grow our international business.
Our revenue is primarily derived from the sale of internally developed software titles and software titles developed by third-parties for our benefit. Operating margins are dependent in part upon our ability to continually release new, commercially successful products and to manage software product development
3
costs. We have internal development studios located in Canada, China, Czech Republic, the United Kingdom and the United States. As of March 31, 2015, we had a research and development staff of approximately 2,120 employees with the technical capabilities to develop software titles for all major current and prior generation consoles, handheld hardware platforms and PCs in multiple languages and territories.
Agreements with third-party developers generally give us exclusive publishing and marketing rights and require us to make development payments, pay royalties based on product sales and to satisfy other conditions. Development payments for software titles are typically recoupable against royalties otherwise due to developers based on software sales. Our agreements with third-party developers generally provide us with the right to monitor development efforts and to cease making development payments if specified development milestones are not satisfied. We also regularly monitor the level of development payments in light of the expected sales for the related titles.
We continue to explore evolving business models such as downloadable content, online gaming and microtransactions. We expect to continue to generate incremental revenue opportunities through add-on content, microtransactions and online play.
Rockstar Games. Software titles published by our Rockstar Games label are primarily internally developed. We expect Rockstar Games, our wholly-owned publisher of the Grand Theft Auto, Max Payne, Midnight Club, Red Dead and other popular franchises, to continue to be a leader in the action / adventure product category and to create groundbreaking entertainment by leveraging our existing titles as well as by developing new brands. We believe that Rockstar has established a uniquely original, popular cultural phenomenon with its Grand Theft Auto series, which is the interactive entertainment industry's most iconic and critically acclaimed brand and has sold-in over 210 million units. The latest installment, Grand Theft Auto V, was released on Sony's PlayStation 3 and Microsoft's Xbox 360 in September 2013, on Sony's PlayStation 4 and Microsoft's Xbox One in November 2014, and on the PC in April 2015. Grand Theft Auto V includes access to Grand Theft Auto Online, which initially launched in October 2013. Rockstar Games is also well known for developing brands in other genres, including the LA Noire, Bully and Manhunt franchises. Rockstar Games continues to expand on our established franchises by developing sequels, offering downloadable add-on episodes, content and virtual currency, and releasing titles for smartphones and tablets.
2K. Our 2K label has published a variety of popular entertainment properties across all key platforms and across a range of genres including shooter, action, role-playing, strategy, sports and family/casual entertainment. We expect 2K to continue to develop new, successful franchises in the future.
2K's internally owned and developed franchises include the critically acclaimed, multi-million unit selling BioShock, Mafia, Sid Meier's Civilization and XCOM Enemy Unknown series. 2K also publishes highly successful externally developed franchises such as Borderlands and Evolve. 2K's realistic sports simulation titles, including our flagship NBA 2K series which has been the top-ranked NBA basketball video game for 14 years running and the WWE 2K series.
We are continuing our expansion initiatives in the Asia markets, where our strategy is to broaden the distribution of our existing products and establish an online gaming presence, especially in China and South Korea. 2K has secured a multi-year license from the NBA to develop an online version of the NBA 2K simulation game in China, Taiwan, South Korea and Southeast Asia. In October 2012, NBA 2K Online, our free-to-play NBA simulation game co-developed by 2K and Tencent, launched commercially on the Tencent Games portal in China. In addition, South Korean-based studio XLGAMES is presently developing Civilization Online, a new online game for the Asian market, which is planned for commercial launch in Korea during our fiscal year 2016.
4
Our business is highly dependent on the creation, acquisition, licensing and protection of intellectual property. Some of the intellectual property rights we have created or acquired for our internally-owned portfolio of brands are: BioShock, Bully, Carnival Games, Evolve, Grand Theft Auto, L.A. Noire, Mafia, Manhunt, Max Payne, Midnight Club, Red Dead, Rockstar Games Presents Table Tennis, Sid Meier's Civilization, Sid Meier's Pirates!, Spec Ops, Top Spin and XCOM. We believe that content ownership facilitates our internal product development efforts and maximizes profit potential. We attempt to protect our software and production techniques under copyright, patent, trademark and trade secret laws as well as through contractual restrictions on disclosure, copying and distribution.
We also enter into content license agreements, such as those with sports leagues, players associations, music labels and musicians. These licenses are typically limited to use of the licensed rights in products for specific time periods. In addition, we license and include console manufacturer technology in our products on a non-exclusive basis, which allows our games to be played on their respective hardware systems.
Sony and Microsoft either manufacture or control selection of approved manufacturers of software products sold for use on their respective hardware platforms. We place a purchase order for the manufacture of our products with Sony or Microsoft's approved replicator and then send software code and a prototype of the product to the manufacturer, together with related artwork, user instructions, warranty information, brochures and packaging designs for approval, defect testing and manufacture. Games are generally shipped within two to three weeks of receipt of our purchase order and all materials.
Production of PC software is performed by third-party vendors in accordance with our specifications and includes CD-ROM / DVD-ROM pressing, assembly of components, printing of packaging and user manuals and shipping of finished goods. We send software code and a prototype of a title, together with related artwork, user instructions, warranty information, brochures and packaging designs to the manufacturers. Games are generally shipped within two weeks of receipt of our manufacturing order. Our software titles typically carry a 90-day limited warranty.
We sell software titles both physically and digitally in the United States, Europe, Canada, Latin America and Asia Pacific through direct relationships with large retail customers and third-party distributors. Our customers in the United States include, among others, GameStop, Microsoft, Sony, Steam and Wal-Mart. Our international customers include, among others, Amazon EU SARL, Exertis, Game, GameStop, and Media Markt. We have sales operations in Australia, Canada, France, Germany, Japan, the Netherlands, New Zealand, Singapore, South Korea, Spain, Switzerland, Taiwan, the United Kingdom and the United States.
We are dependent on a limited number of customers that account for a significant portion of our sales. Sales to our five largest customers during the fiscal year ended March 31, 2015 accounted for approximately 64.6% of our net revenue, with GameStop, Sony, Microsoft and Steam each accounted for more than 10.0% of our net revenue during the fiscal year ended March 31, 2015.
We also digitally distribute our titles, add-on content and microtransactions direct to consoles and PCs, including smartphones and tablets. We view digital distribution as an important growth opportunity for our industry and Company; however, we continue to expect that packaged goods and traditional retailers will be a significant channel for the sale of our products for the foreseeable future.
5
Our marketing and promotional efforts are intended to maximize consumer interest in our titles, promote brand name recognition of our franchises, assist retailers and properly position, package and merchandise our titles. From time to time, we also receive marketing support from hardware manufacturers in connection with their own promotional efforts.
We market titles by:
- •
- Implementing public relations campaigns, using print and online advertising, television, radio spots and outdoor advertising. We
believe that we label and market our products in accordance with the applicable principles and guidelines of the Entertainment Software Rating Board, or the ESRB, an independent self-regulatory body
that assigns ratings and enforces advertising guidelines for the interactive software industry.
- •
- Satisfying certain shelf life and sales requirements under our agreements with hardware manufacturers in order to qualify for Sony's
Greatest Hits Programs and Microsoft's Platinum Hits Program. In connection with these programs, we receive manufacturing discounts from Sony and Microsoft.
- •
- Stimulating continued sales by reducing the wholesale prices of our products to retailers at various times during the life of a
product. Price concessions may occur at any time in a product's life cycle, but typically occur three to nine months after a product's initial launch. In certain international markets, we also provide
volume rebates to stimulate continued product sales. Sales returns, price protection and other allowances amounted to $51.5 million, $138.1 million, $109.1 million during the
fiscal years ended March 31, 2015, 2014 and 2013, respectively.
- •
- Employing various other marketing methods designed to promote consumer awareness, including social media, in-store promotions and point-of- purchase displays, direct mail, co-operative advertising, attendance at trade shows as well as product sampling through demonstration software distributed via the Internet or the digital online services.
As of March 31, 2015, we had a sales and marketing staff of approximately 345 people.
We procure products from suppliers principally using standard purchase orders based on our assessment of market demand. We carry inventory quantities that we believe are necessary to provide rapid response to retailer orders. We utilize electronic data interchange with many of our customers to enhance the efficiency of placing and shipping orders and receiving payments.
In our business, we compete with:
- •
- Companies that range in size and cost structure from very small with limited resources to very large with greater financial, marketing
and technical personnel and other resources than ours, including Activision Blizzard, Electronic Arts, and international companies, such as Capcom, SEGA, Square Enix, and Ubisoft.
- •
- Sony and Microsoft for the sale of interactive entertainment software. Each of these competitors is a large developer and marketer of
software for their own platforms, and has the financial resources to withstand significant price competition and to implement extensive advertising campaigns.
- •
- Other software, hardware, entertainment and media for limited retail shelf space and promotional resources. The competition is intense among an increasing number of newly introduced
6
- •
- Other forms of entertainment such as motion pictures, television and audio, social networking, online computer programs, mobile games and other forms of entertainment which may be less expensive or provide other advantages to consumers.
entertainment software titles and hardware for adequate levels of shelf space and promotional support.
Competition in the entertainment software industry is based on innovation, features, playability, and product quality; brand name recognition; compatibility with popular platforms; access to distribution channels; price; marketing; and customer service. Our business is driven by hit titles, which require increasing budgets for development and marketing. Competition for our titles is influenced by the timing of competitive product releases and the similarity of such products to our titles and may result in loss of shelf space or a reduction in sell-through of our titles at retail stores.
Trends and Factors Affecting our Business
Product Release Schedule. Our financial results are affected by the timing of our product releases and the commercial success of those titles. Our Grand Theft Auto products in particular have historically accounted for a substantial portion of our revenue. Sales of Grand Theft Auto products generated approximately 28.0% of the Company's net revenue for the fiscal year ended March 31, 2015. The timing of our Grand Theft Auto releases varies significantly, which in turn may affect our financial performance on a quarterly and annual basis.
Economic Environment and Retailer Performance. We continue to monitor economic conditions that may unfavorably affect our businesses, such as deteriorating consumer demand, pricing pressure on our products, credit quality of our receivables, and foreign currency exchange rates. Our business is dependent upon a limited number of customers who account for a significant portion of our revenue. Our five largest customers accounted for 64.6%, 39.4% and 52.5% of net revenue during the fiscal years ended March 31, 2015, 2014 and 2013, respectively. As of March 31, 2015 and 2014, five customers comprised approximately 63.9% and 68.3% of our gross accounts receivable, respectively, with our significant customers (those that individually comprised more than 10% of our gross accounts receivable balance) accounting for approximately 54.5% and 59.8% of such balance at March 31, 2015 and 2014, respectively. We had three customers who accounted for approximately 18.5%, 18.4% and 17.6% of our gross accounts receivable as of March 31, 2015 and three customers who accounted for 22.6%, 22.3% and 14.9% of our gross accounts receivable as of March 31, 2014. We did not have any additional customers that exceeded 10% of our gross accounts receivable as of March 31, 2015 and 2014. The economic environment has affected our customers in the past, and may do so in the future. Bankruptcies or consolidations of our large retail customers could seriously hurt our business, due to uncollectible accounts receivables and the concentration of purchasing power among the remaining large retailers. Certain of our large customers sell used copies of our games, which may negatively affect our business by reducing demand for new copies of our games. While the downloadable content that we now offer for certain of our titles may serve to reduce used game sales, we expect used game sales to continue to adversely affect our business.
Hardware Platforms. We derive most of our revenue from the sale of products made for video game platforms manufactured by third-parties, such as Sony's PS3 and PS4 and Microsoft's Xbox 360 and Xbox One, which comprised approximately 81.4% of the Company's net revenue by product platform for the fiscal year ended March 31, 2015. The success of our business is dependent upon the consumer acceptance of these platforms and the continued growth in the installed base of these platforms. When new hardware platforms are introduced, demand for software based on older platforms typically declines, which may negatively affect our business during the market transition to the new consoles. Additionally, we have limited ability to predict the consumer acceptance of the new platforms, which may affect our sales and profitability. Accordingly, our strategy is to focus our development efforts on a select number of the
7
highest quality titles for these platforms, while also expanding our offerings for emerging platforms such as mobile and online games.
Online Content and Digital Distribution. The interactive entertainment software industry is delivering a growing amount of content through digital online delivery methods. We provide a variety of online delivered products and offerings. Virtually all of our titles that are available through retailers as packaged goods products are also available through direct digital download via the Internet (from websites we own and others owned by third-parties). In addition, we aim to drive ongoing engagement and recurrent consumer spending on our titles after their initial purchase by generating incremental revenues through downloadable offerings, including add-on content, microtransactions and online play. We also publish an expanding variety of titles for tablets and smartphones, which are delivered to consumers through digital download via the Internet. Note 14 to our Consolidated Financial Statements, "Segment and Geographic Information," discloses that net revenue from digital online channels comprised approximately 42.0% of the Company's net revenue by distribution channel for the fiscal year ended March 31, 2015. We expect online delivery of games and game offerings to become an increasing part of our business over the long-term.
International sales are a significant part of our business. For the fiscal years ended March 31, 2015, 2014 and 2013, approximately 42.5%, 53.5% and 41.5%, respectively, of our net revenue was earned outside the United States. We also have expanded our Asian operations in an effort to increase our geographical scope and diversify our revenue base. We are subject to risks inherent in foreign trade, including increased credit risks, tariffs and duties, fluctuations in foreign currency exchange rates, shipping delays and international political, regulatory and economic developments, all of which can have a significant effect on our operating results. See Notes 1 and 14 to the Consolidated Financial Statements.
Segment and Geographic Information
See Note 14 to the Consolidated Financial Statements.
As of March 31, 2015, we had approximately 2,840 full-time employees, of which approximately 1,360 were employed outside of the United States. None of our employees is subject to collective bargaining agreements. We consider our relations with employees to be satisfactory.
8
Our business is subject to many risks and uncertainties, which may affect our future financial performance. Because of the risks and uncertainties described below, as well as other factors affecting our operating results and financial condition, past financial performance should not be considered to be a reliable indicator of future performance and our business and financial performance could be harmed and the market value of our securities could decline.
Risks relating to our business
We are dependent on the future success of our Grand Theft Auto products and we must continue to publish "hit" titles or sequels to such "hit" titles in order to compete successfully in our industry.
Grand Theft Auto and certain of our other titles are "hit" products and have historically accounted for a substantial portion of our revenue. Sales of Grand Theft Auto products generated approximately 28.0% of the Company's net revenue for the fiscal year ended March 31, 2015 and the ten best-selling franchises (including Grand Theft Auto) that significantly contributed to the Company's net revenue for the fiscal year ended March 31, 2015 in the aggregate accounted for approximately 97.1% of the Company's net revenue. If we fail to continue to develop and sell new commercially successful "hit" titles or sequels to such "hit" titles or experience any delays in product releases or disruptions following the commercial release of our "hit" titles or their sequels, our revenue and profits may decrease substantially and we may incur losses. In addition, competition in our industry is intense and a relatively small number of hit titles account for a large portion of total revenue in our industry. Hit products offered by our competitors may take a larger share of consumer spending than we anticipate, which could cause revenue generated from our products to fall below our expectations. If our competitors develop more successful products or services at lower price points or based on payment models perceived as offering better value, or if we do not continue to develop consistently high quality and well-received products and services, our revenue and profitability may decline. In addition, both the online and mobile games marketplaces are characterized by frequent product introductions, relatively low barriers to entry, and new and evolving business methods, technologies and platforms for development. Widespread consumer adoption of these new platforms for games and other technological advances in online or mobile game offerings could negatively affect our sales of console and traditional PC products before we have an opportunity to develop profitable businesses in such markets.
We are subject to product development risks which could result in delays and additional costs, and we must adapt to changes in software technologies.
We depend on our internal development studios and third-party software developers to develop new interactive entertainment software within anticipated release schedules and cost projections. The development cycle for new titles generally ranges from 12 to more than 24 months, and our top-selling titles could take more than 4 years to develop. Therefore our development costs can be substantial. If we or our third party developers experience unanticipated development delays, financial difficulties or additional costs, we may not be able to release titles according to our schedule and at budgeted costs. There can be no assurance that our products will be sufficiently successful so that we can recoup these costs or make a profit on these products.
Additionally, in order to stay competitive, our internal development studios must anticipate and adapt to rapid technological changes affecting software development. Any inability to respond to technological advances and implement new technologies could render our products obsolete or less marketable.
9
The inability of our products to achieve significant market acceptance, delays in product releases or disruptions following the commercial release of our products may have a material adverse effect on our business, financial condition and operating results.
New products may not achieve significant market acceptance, generate sufficient sales or be introduced in a timely manner to permit us to recover development, manufacturing and marketing costs associated with these products. The life cycle of a title generally involves a relatively high level of sales during the first few months after introduction followed by a rapid decline in sales. Because revenue associated with an initial product launch generally constitutes a high percentage of the total revenue associated with the life of a product, delays in product releases or disruptions following the commercial release of one or more new products could have a material adverse effect on our business, financial condition and operating results and cause our operating results to be materially different from our expectations.
Our business is subject to our ability to develop commercially successful products for the current generation video game platforms.
We derive most of our revenue from the sale of products made for video game platforms manufactured by third parties, such as Sony's PS3 and PS4 and Microsoft's Xbox 360 and Xbox One, which comprised approximately 81.4% of the Company's net revenue by product platform for the fiscal year ended March 31, 2015. The success of our business is subject to the continued popularity of these platforms and our ability to develop commercially successful products for these platforms.
Connectivity issues could affect our ability to sell and provide online services for our products and could affect our profitability.
We rely upon third-party digital delivery platforms, such as Steam, Microsoft's Xbox Live and Sony Entertainment Network, and other third-party service providers, to provide connectivity from the consumer to our digital products and our online services. Connectivity issues could prevent customers from accessing this content and our ability to successfully market and sell our products could be adversely affected. In addition, we could experience similar issues related to services we host on our internal servers. Such issues also could affect our ability to provide online services and could have a material adverse effect on our business, financial condition and operating results.
Our business could be adversely affected if our consumer data protection measures are not seen as adequate or there are breaches of our security measures or unintended disclosures of our consumer data.
We are collecting and storing consumer information, including personal information. We take measures to protect our consumer data from unauthorized access or disclosure. It is possible that our security controls over consumer data may not prevent the improper access or disclosure of personally identifiable information. In addition, due to the high profile nature of our products, we may draw a disproportionately higher amount of attention and attempts to breach our security controls than companies with lower profile products. A security breach that leads to disclosure of consumer account information (including personally identifiable information) could harm our reputation, compel us to comply with disparate breach notification laws in various jurisdictions and otherwise subject us to liability under laws that protect personal data, resulting in increased costs or loss of revenue. A resulting perception that our products or services do not adequately protect the privacy of personal information could result in a loss of current or potential consumers and business partners. In addition, if any of our business partners experience a security breach that leads to disclosure of consumer account information, our reputation could be harmed, resulting in loss of revenue.
The interpretation and application of consumer and data protection laws in the U.S., Europe and elsewhere are often uncertain, contradictory and in flux. It is possible that these laws may be interpreted and applied in a manner that is inconsistent with our data practices. If so, this could result in government
10
imposed fines or orders requiring that we change our data practices, which could have an adverse effect on our business. Complying with these various laws could cause us to incur substantial costs or require us to change our business practices in a manner adverse to our business, financial condition and operating results.
In addition, certain of our products are online enabled. The ability of our products to offer online functionality, and our ability to offer content through a video game platform's digital distribution channel, is dependent upon the continued operation and security of such platform's online network. These third party networks, as well as our own internal systems and websites, and the security measures related thereto may be breached as a result of third-party action, including intentional misconduct by computer hackers, employee error, malfeasance or otherwise, and result in someone obtaining unauthorized access to our customers' data or our data, including our intellectual property and other confidential business information, or our information technology systems. Because the techniques used to obtain unauthorized access, or to sabotage systems, change frequently and generally are not recognized until launched against a target, we may be unable to anticipate these techniques or to implement adequate preventative measures. If an actual or perceived breach of our security occurs, we may lose business, suffer irreparable damage to our reputation, and/or incur significant costs and expenses relating to the investigation and possible litigation of claims relating to such event.
Security breaches involving the source code for our products could adversely affect our business.
We securely store the source code for our interactive entertainment software products as it is created. A breach, whether physical, electronic or otherwise, of the systems on which such source code and other sensitive data are stored could lead to damage or piracy of our software. If we are subject to data security breaches, we may have a loss in sales or increased costs arising from the restoration or implementation of additional security measures which could materially and adversely affect our business, financial condition and operating results. Any theft and/or unauthorized use or publication of our trade secrets and other confidential business information as a result of such an event could adversely affect our competitive position, reputation, brand, and future sales of our products. Our business could be subject to significant disruption, and we could suffer monetary and other losses and reputational harm, in the event of such incidents and claims.
Our efforts to expand into new products and services may subject us to additional risks.
In recent years, we have invested in emerging opportunities in interactive entertainment played on mobile platforms, including tablets and smartphones, and online platforms, including social networks. We have also grown our product offerings that are available through digital download. We are actively investing to capitalize on these trends in order to diversify our product mix, reduce our operating risks, and increase our revenue. There are risks and uncertainties associated with these efforts, particularly in instances where the markets are not fully developed. There is no assurance that we will be able to attract a sufficiently large number of customers or recover costs incurred for developing and marketing these new products or services. External factors, such as competitive alternatives and shifting market preferences, may also impact the successful implementation of any new products or services. Failure to successfully manage these risks in the development and implementation of new products or services could have a material adverse effect on our business, financial condition and operating results.
We depend on our key management and product development personnel.
Our continued success will depend to a significant extent on our senior management team and our relationship with ZelnickMedia Corporation ("ZelnickMedia"). Our Executive Chairman/Chief Executive Officer and President are partners of ZelnickMedia. We are also highly dependent on the expertise, skills and knowledge of certain of our Rockstar employees and other key creative personnel responsible for
11
content creation and development of our Grand Theft Auto titles and titles based on other brands. We may not be able to continue to retain these personnel at current compensation levels, or at all.
The loss of the services of our executive officers, ZelnickMedia, our key Rockstar employees or other key creative personnel could significantly harm our business. In addition, if one or more key employees were to join a competitor or form a competing company, we may lose additional personnel, experience material interruptions in product development, delays in bringing products to market and difficulties in our relationships with licensors, suppliers and customers, which would significantly harm our business. Failure to continue to attract and retain other qualified management and creative personnel could adversely affect our business and prospects.
Declines in consumer spending and other adverse changes in the economy could have a material adverse effect on our business, financial condition and operating results.
Most of our products involve discretionary spending on the part of consumers. We believe that consumer spending is influenced by general economic conditions and the availability of discretionary income. This makes our products particularly sensitive to general economic conditions and economic cycles as consumers are generally more willing to make discretionary purchases, including purchases of products like ours, during periods in which favorable economic conditions prevail. Adverse economic conditions such as a prolonged U.S. or international general economic downturn, including periods of increased inflation, unemployment levels, tax rates, interest rates, energy prices or declining consumer confidence could also reduce consumer spending. Reduced consumer spending has and may in the future continue to result in reduced demand for our products and may also require increased selling and promotional expenses, which has had and may continue to have an adverse effect on our business, financial condition and operating results. In addition, during periods of relative economic weakness, our consolidated credit risk, reflecting our counterparty dealings with distributors, customers, capital providers and others may increase, perhaps materially so. Furthermore, uncertainty and adverse changes in the economy could also increase the risk of material losses on our investments, increase costs associated with developing and publishing our products, increase the cost and availability of sources of financing, and increase our exposure to material losses from bad debts, any of which could have a material adverse effect on our business, financial condition and operating results. If economic conditions worsen, our business, financial condition and operating results could be adversely affected.
Changes in our tax rates or exposure to additional tax liabilities could adversely affect our earnings and financial condition.
We are subject to income taxes in the U.S. and in various other jurisdictions. Significant judgment is required in determining our worldwide provision for income taxes, and in the ordinary course of business there are many transactions and calculations where the ultimate tax determination is uncertain. We are required to estimate future taxes. Although we currently believe our tax estimates are reasonable, the estimate process is inherently uncertain, and such estimates are not binding on tax authorities. Further, our effective tax rate could be adversely affected by a variety of factors, including changes in the business, including the mix of earnings in countries with differing statutory tax rates, changes in tax elections, and changes in applicable tax laws. Additionally, tax determinations are regularly subject to audit by tax authorities and developments in those audits could adversely affect our income tax provision. Should the ultimate tax liability exceed estimates, our income tax provision and net income or loss could be adversely affected.
Historically, we recorded a valuation allowance against most of our U.S. deferred tax assets. We expect to provide a valuation allowance on future U.S. tax benefits until we can sustain a level of profitability or until other significant positive evidence arises that suggest that these benefits are more likely than not to be realized. Further, our tax determinations are regularly subject to audit by tax authorities and developments
12
in those audits could adversely affect our income tax provision. Should our ultimate tax liability exceed our estimates, our income tax provision and net income or loss could be materially affected.
We earn a significant amount of our operating income, and hold a significant portion of our cash, outside the U.S. Any repatriation of funds currently held in foreign jurisdictions may result in higher effective tax rates for the Company. In addition, there have been proposals to change U.S. tax laws that would significantly impact how U.S. multinational corporations are taxed on foreign earnings. Although we cannot predict whether or in what form this proposed legislation will pass, if enacted it could have a material adverse impact on our income tax provision and financial condition.
We are also required to pay taxes other than income taxes, such as payroll, sales, use, value-added, net worth, property and goods and services taxes, in both the U.S. and foreign jurisdictions. We are regularly under examination by tax authorities with respect to these non-income taxes. There can be no assurance that the outcomes from these examinations, changes in our business or changes in applicable tax rules will not have an adverse effect on our net income or loss and financial condition.
Our quarterly operating results are dependent on the release of "hit" titles and are highly seasonal which may cause our quarterly operating results to fluctuate significantly.
We have experienced and may continue to experience wide fluctuations in quarterly operating results. The release of a "hit" title typically leads to a high level of sales during the first few months after introduction followed by a rapid decline in sales. In addition, the interactive entertainment industry is highly seasonal, with sales typically higher during the fourth calendar quarter, due primarily to increased demand for games during the holiday season. Demand for and sales of our sports titles are also seasonal in that they are typically released just prior to the start of the sport season which they depict. If a key event or sports season to which our product release schedule is tied were to be delayed or cancelled, our sales might also suffer disproportionately. Our failure or inability to produce "hit" titles or introduce products on a timely basis to meet seasonal fluctuations in demand could adversely affect our business, financial condition and operating results. The uncertainties associated with software development, manufacturing lead times, production delays and the approval process for products by hardware manufacturers and other licensors make it difficult to predict the quarter in which our products will ship and therefore may cause us to fail to meet financial expectations.
Returns of our published titles by our customers and price concessions granted to our customers may adversely affect our operating results.
We are exposed to the risk of product returns and price concessions with respect to our customers. Our distribution arrangements with customers generally do not give them the right to return titles to us or to cancel firm orders. However, we sometimes accept product returns from our distribution customers for stock balancing and negotiate accommodations for customers, which include credits and returns, when demand for specific products falls below expectations. We accept returns and grant price concessions in connection with our publishing arrangements and revenue is recognized after deducting estimated reserves for returns and price concessions. While we believe that we can reliably estimate future returns and price concessions, if return rates and price concessions for our products exceed our reserves, our revenue could decline, which could have a material adverse effect on our business, financial condition and operating results.
Increased sales of used video game products could lower our sales.
Certain of our larger customers sell used video games, which are generally priced lower than new video games. If our customers increase their sales of used video games, it could negatively affect our sales of new video games and have an adverse influence on our business, financial condition and operating results.
13
A limited number of customers account for a significant portion of our sales. The loss of a principal customer or other significant business relationship could seriously hurt our business.
A substantial portion of our product sales are made to a limited number of customers. Sales to our five largest customers during the fiscal year ended March 31, 2015 accounted for approximately 64.6% of our net revenue, with GameStop accounting for 21.0%. Our sales are made primarily pursuant to purchase orders without long-term agreements or other commitments, and our customers may terminate their relationship with us at any time. Certain of our customers may decline to carry products containing mature content. The loss of our relationships with principal customers or a decline in sales to principal customers, including as a result of a product being rated "AO" (age 18 and over) could materially adversely affect our business, financial condition and operating results.
Furthermore, our customers may also be placed into bankruptcy, become insolvent or be liquidated due to economic downturns, global contractions of credit or for other factors. Bankruptcies or consolidations of certain large retail customers could seriously hurt our business, including as a result of uncollectible accounts receivable from such customers and the concentration of purchasing power among remaining large retailers. In addition, our results of operations may be adversely affected if certain of our customers who purchase on credit terms are no longer eligible to purchase on such terms due to their financial distress, which may reduce the quantity of products they demand from us.
If our marketing and advertising efforts fail to resonate with consumers, our business, financial condition and operating results could be adversely affected.
Our products are marketed worldwide through a diverse spectrum of advertising and promotional programs such as television and online advertising, print advertising, retail merchandising, website development and event sponsorship. Our ability to sell our products and services is dependent in part on the success of these programs. If the marketing for our products and services fails to resonate with consumers, particularly during the holiday season or other key selling periods, or if advertising rates or other media placement costs increase, these factors could have a material adverse influence on our business, financial condition and operating results.
The interactive entertainment software industry is highly competitive.
We compete for both licenses to properties and the sale of interactive entertainment software with Sony and Microsoft, each of which is a large developer and marketer of software for its own platforms. We also compete with domestic game publishers, such as Activision Blizzard and Electronic Arts and international publishers, such as Capcom, SEGA, Square Enix and Ubisoft. As our business is dependent upon our ability to develop hit titles, which require increasing budgets for development and marketing, the availability of significant financial resources has become a major competitive factor in developing and marketing software games. Some of our competitors have greater financial, technical, personnel and other resources than we do and are able to finance larger budgets for development and marketing and make higher offers to licensors and developers for commercially desirable properties. Our titles also compete with other forms of entertainment, such as social media and casual games, in addition to motion pictures, television and audio and video products featuring similar themes, online computer programs and other entertainment, which may be less expensive or provide other advantages to consumers.
A number of software publishers who compete with us have developed and commercialized or are currently developing online games for use by consumers over the Internet. If technological advances significantly increase the availability of online games and if consumer acceptance of online gaming grows substantially, it could result in a decline in our platform-based software sales and negatively affect sales of such products.
14
Increased competition for limited shelf space and promotional support from retailers could affect the success of our business and require us to incur greater expenses to market our titles.
Retailers have limited shelf space and promotional resources and competition is intense among newly introduced interactive entertainment software titles for adequate levels of shelf space and promotional support. Competition for retail shelf space is expected to continue to increase, which may require us to increase our marketing expenditures to maintain desirable sales levels of our titles. Competitors with more extensive lines and more popular titles may have greater bargaining power with retailers. Accordingly, we may not be able, or we may have to pay more than our competitors, to achieve similar levels of promotional support and shelf space.
Our business is partly dependent on our ability to enter into successful software development arrangements with third-parties.
Our success depends on our ability to continually identify and develop new titles on a timely basis. We rely on third-party software developers for the development of some of our titles. Quality third-party developers are continually in high demand. Software developers who have developed titles for us in the past may not be available to develop software for us in the future. Due to the limited number of third-party software developers and the limited control that we exercise over them, these developers may not be able to complete titles for us on a timely basis or within acceptable quality standards, if at all. We have entered into agreements with third-parties to acquire the rights to publish and distribute interactive entertainment software as well as to use licensed intellectual properties in our titles. These agreements typically require us to make development payments, pay royalties and satisfy other conditions. Our development payments may not be sufficient to permit developers to develop new software successfully, which could result in material delays and significantly increase our costs to bring particular products to market. Software development costs, promotion and marketing expenses and royalties payable to software developers and third-party licensors have increased significantly in recent years and reduce potential profits derived from sales of our software. Future sales of our titles may not be sufficient to recover development payments and advances to software developers and licensors, and we may not have adequate financial and other resources to satisfy our contractual commitments to such developers. If we fail to satisfy our obligations under agreements with third-party developers and licensors, the agreements may be terminated or modified in ways that are burdensome to us, and have a material adverse effect on our business, financial condition and operating results.
We cannot publish our titles without the approval of hardware licensors that are also our competitors.
We are required to obtain licenses from Sony and Microsoft, which are also our competitors, to develop and publish titles for their respective hardware platforms. Our existing platform licenses require that we obtain approval for the publication of new titles on a title-by-title basis. As a result, the number of titles we are able to publish for these hardware platforms, our ability to manage the timing of the release of these titles and, accordingly, our net revenue from titles for these hardware platforms, may be limited. If a licensor chooses not to renew or extend our license agreement at the end of its current term, or if a licensor were to terminate our license for any reason or does not approve one or more of our titles, we may be unable to publish that title as well as additional titles for that licensor's platform. Termination of any such agreements or disapproval of titles could seriously hurt our business and prospects. We may be unable to continue to enter into license agreements for certain current generation platforms on satisfactory terms or at all. Failure to enter into any such agreement could also seriously hurt our business.
We rely on a limited number of channel partners some of whom influence the fee structures for online distribution of our games on their platforms.
We rely on a limited number of channel partners, some of whom have retained the right to change the fee structures for online distribution of both paid content and free content (including patches and corrections)
15
that we license to them for distribution on their platforms. Such channel partners' ability to set or influence royalty rates may increase costs, which could negatively affect our operating margins. We may be unable to distribute our content in a cost-effective or profitable manner through such distribution channel, which could adversely affect our business, financial condition and operating results.
Outside of fee arrangements, our agreements with our channel partners sometimes give them significant control over other aspects of the distribution of our products and services that we develop for their platform. If our channel partners establish terms that restrict our offerings through their channels, or significantly impact the financial terms on which these products or services are offered to our customers, we may be unable to distribute our product offerings through them or be forced to do so on a materially worse financial or business terms.
We may not be able to adequately adjust our cost structure in a timely fashion in response to a sudden decrease in demand.
In the event of a significant decline in revenue, we may not be able to dispose of facilities, reduce personnel or make other changes to our cost structure without disruption to our operations or without significant termination and exit costs. Management may not be able to implement such actions in a timely manner, if at all, to offset an immediate shortfall in revenue and profit. Moreover, reducing costs may impair our ability to produce and develop software titles at sufficient levels in the future.
The increasing importance of digital sales to our business exposes us to the risks of that business model, including greater competition.
The proportion of our revenues derived from digital content delivery, as compared to traditional retail sales, may continue to increase. The increased importance of digital content delivery in our industry increases our potential competition, as the minimum capital needed to produce and publish a digitally delivered game is significantly less than that needed to produce and publish one that is purchased through retail distribution and is played on a game console. This will also require us to dedicate capital to developing and implementing alternative marketing strategies, which we may not do successfully. If either occurs, we may be unable to effectively market and distribute our products, which could materially adversely affect our business, financial condition and operating results. In addition, a continuing shift to digital delivery could result in a deprioritization of our products by traditional retailers.
We depend on servers and Internet bandwidth to operate our games and digital services with online features. If we were to lose server capacity or lack sufficient Internet bandwidth for any reason, our business could suffer.
We rely on data servers, including those owned or controlled by third parties, to enable our customers to download our games and other downloadable content, and to operate our online games and other products with online functionality. Events such as limited hardware failure, any broad-based catastrophic server malfunction, a significant intrusion by hackers that circumvents security measures, or a failure of disaster recovery services would likely interrupt the functionality of our games with online services and could result in a loss of sales for games and related services. An extended interruption of service could materially adversely affect our business, financial condition and operating results.
We expect a significant portion of our games to be on-line enabled in the future, and therefore we must project our future server needs and make advance purchases of servers or server capacity to accommodate expected business demands. If we underestimate the amount of server capacity our business requires or if our business were to grow more quickly than expected, our consumers may experience service problems, such as slow or interrupted gaming access. Insufficient server capacity may result in decreased sales, a loss of our consumer base and adverse consequences to our reputation. Conversely, if we overestimate the amount of server capacity required by our business, we may incur additional operating costs.
16
Because of the potential importance of our online business to our revenues and results of operations, our ability to access adequate Internet bandwidth and online computational resources to support our business is critical. If the price of either such resource increases, we may not be able to increase our prices or subscriber levels to compensate for such costs, which could materially adversely affect our business, financial condition and operating results.
We submit our products for rating by the Entertainment Software Rating Board ("ESRB") in the United States and other voluntary or government ratings organizations in foreign countries. Failure to obtain a target rating for certain of our products could negatively affect our ability to distribute and sell those games, as could the re-rating of a game for any reason.
We voluntarily submit our game products to the ESRB, a U.S.-based non-profit and independent ratings organization. The ESRB system provides consumers with information about game content using a rating symbol that generally suggests the appropriate player age group and specific content descriptors, such as graphic violence, profanity or sexually explicit material. The ESRB may impose significant penalties on game publishers for violations of its rules related to rating or marketing games, including revocation of a rating or monetary fines up to $1 million. Other countries require voluntary or government backed ratings as prerequisites for product sales. In some instances, we may have to modify our products in order to market them under the target rating, which could delay or disrupt the release of our products. In addition, some of our titles may not be sold at all or without extensive edits in certain countries, such as Germany.
In the United States, if the ESRB rates a game as "AO" (age 18 and older), platform licensors may not certify the game and retailers may refuse to sell it. In addition, some consumers have reacted to re-ratings or controversial game content by refusing to purchase such games, demanding refunds for games that they had already purchased, and refraining from buying other games published by us. Many of our Rockstar titles and certain of our 2K titles have been rated "M" (age 17 and older) by the ESRB. If we are unable to obtain "M" ratings and instead receive "AO" ratings on future versions of those or similar titles as a result of changes in the ESRB's ratings standards or for other reasons, including the adoption of legislation in this area, our business and prospects could be negatively affected. If any of our games are re-rated by the ESRB or other foreign based ratings organizations, we could be exposed to litigation, administrative fines and penalties and other potential liabilities, and our operating results and financial condition could be significantly affected.
We have implemented processes to comply with the requirements of the ESRB and other ratings organizations and properly display the designated rating symbols and content descriptions. Nonetheless, these processes are subject to human error, circumvention, overriding and reasonable resource constraints. If a video game we published were found to contain undisclosed pertinent content, the ESRB could re-rate a game, retailers could refuse to sell it and demand that we accept the return of any unsold copies or returns from customers, and consumers could refuse to buy it or demand that we refund their money. This could have a material negative affect on our operating results and financial condition. In addition, we may be exposed to litigation, administrative fines and penalties and our reputation could be harmed, which could affect sales of other video games we sell. If any of these consequences were to occur, our business and financial performance could be significantly harmed.
Content policies adopted by retailers, consumer opposition and litigation could negatively affect sales of our products.
Retailers may decline to sell interactive entertainment software containing what they judge to be graphic violence or sexually explicit material or other content that they deem inappropriate for their businesses. If retailers decline to sell our products based upon their opinion that they contain objectionable themes, graphic violence or sexually explicit material or other generally objectionable content, or if any of our previously "M" rated series products are rated "AO," we might be required to significantly change or discontinue particular titles or series, which in the case of our best-selling Grand Theft Auto titles could
17
seriously affect our business. Consumer advocacy groups have opposed sales of interactive entertainment software containing objectionable themes, violence or sexual material or other objectionable content by pressing for legislation in these areas and by engaging in public demonstrations and media campaigns. Additionally, although lawsuits seeking damages for injuries allegedly suffered by third-parties as a result of video games have generally been unsuccessful in the courts, claims of this kind have been asserted against us from time to time and may be asserted and be successful in the future.
We are subject to risks and uncertainties of international trade, including fluctuations in the values of local foreign currencies against the dollar.
Sales in international markets, primarily in Europe, have accounted for a significant portion of our net revenue. For the fiscal year ended March 31, 2015, approximately 42.5% of our net revenue was earned outside the United States. We have also expanded our Asian operations in an effort to increase our geographical scope and diversify our revenue base. We are subject to risks inherent in foreign trade, including increased credit risks, tariffs and duties, fluctuations in foreign currency exchange rates, shipping delays, and international political, regulatory and economic developments, all of which can have a significant influence on our operating results. Many of our international sales are made in local currencies, which could fluctuate against the dollar. While we may use forward exchange contracts to a limited extent to seek to mitigate foreign currency risk, our operating results could be adversely affected by unfavorable foreign currency fluctuations.
We face risks from our international operations.
We are subject to certain risks because of our international operations, particularly as we continue to grow our business and presence in Asia, Latin America and other parts of the world. Changes to and compliance with a variety of foreign laws and regulations may increase our cost of doing business and our inability or failure to obtain required approvals could harm our international and domestic sales. Trade legislation in either the United States or other countries, such as a change in the current tariff structures, import/export compliance laws or other trade laws or policies, could adversely affect our ability to sell or to distribute in international markets. We incur additional legal compliance costs associated with our international operations and could become subject to legal penalties in foreign countries if we do not comply with local laws and regulations which may be substantially different from those in the United States. In many foreign countries, particularly in those with developing economies, it may be common to engage in business practices that are prohibited by United States laws and regulations, such as the Foreign Corrupt Practices Act, and by local laws, such as laws prohibiting corrupt payments to government officials. Although we implement policies and procedures designed to ensure compliance with these laws, there can be no assurance that all of our employees, contractors and agents, as well as those companies to which we outsource certain of our business operations, including those based in or from countries where practices which violate such laws may be customary, will not take actions in violation of our policies. Any such violation, even if prohibited by our policies, could have a material adverse effect on our business.
If we are unable to protect the intellectual property relating to our software, the commercial value of our products will be adversely affected and our competitive position could be harmed.
We develop proprietary software and have obtained the rights to publish and distribute software developed by third-parties. We attempt to protect our software and production techniques under copyright, trademark and trade secret laws as well as through contractual restrictions on disclosure, copying and distribution. Our software is susceptible to piracy and unauthorized copying. Unauthorized third-parties may be able to copy or to reverse engineer our software to obtain and use programming or production techniques that we regard as proprietary. Well organized piracy operations have also proliferated in recent years, resulting in the ability to download pirated copies of our software over the Internet. Although we attempt to incorporate protective measures into our software, piracy of our products could negatively affect our future profitability.
18
If we infringe on or are alleged to infringe on the intellectual property rights of third-parties, our business could be adversely affected.
As our industry grows, we may be subject to an increasing amount of litigation that is common in the software industry based on allegations of infringement or other alleged violations of patent, copyright and/or trademarks. In addition, we believe that interactive entertainment software will increasingly become the subject of claims that such software infringes on the intellectual property rights of others with both the growth of online functionality and advances in technology, game content and software graphics as games become more realistic. From time to time, we receive notices from third-parties or are named in lawsuits by third-parties alleging infringement of their proprietary rights. Although we believe that our software and technologies and the software and technologies of third-party developers and publishers with whom we have contractual relations do not and will not infringe or violate proprietary rights of others, it is possible that infringement of proprietary rights of others may occur. Any claims of infringement, with or without merit, could be time consuming, costly and difficult to defend. Moreover, intellectual property litigation or claims could require us to discontinue the distribution of products, obtain a license or redesign our products, which could result in additional substantial costs and material delays.
Our software is susceptible to errors, which can harm our financial results and reputation.
The technological advancements of new hardware platforms result in the development of more complex software products. As software products become more complex, the risk of undetected errors in new products increases. We may need to produce and distribute patches in order to repair such errors, which could be costly and may distract our developers from working on new products. If, despite testing, errors are found in new products or releases after shipments have been made, we could experience a loss of or delay in timely market acceptance, product returns, loss of revenue, increases in costs relating to the repair of such errors and damage to our reputation.
If we acquire or invest in other businesses, intellectual properties or other assets, we may be unable to integrate them with our business, our financial performance may be impaired and/or we may not realize the anticipated financial and strategic goals for such transactions.
If appropriate opportunities present themselves, we may acquire or make investments in businesses, intellectual properties and other assets that we believe are strategic. We may not be able to identify, negotiate or finance any future acquisition or investment successfully. Even if we do succeed in acquiring or investing in a business, intellectual property or other asset, such acquisitions and investments involve a number of risks, including:
- •
- retaining key employees and maintaining the key business and customer relationships of the businesses we acquire;
- •
- cultural challenges associated with integrating employees from an acquired company or business into our organization;
- •
- the possibility that the combined company would not achieve the expected benefits, including any anticipated operating and product
synergies, of the acquisition as quickly as anticipated or that the costs of, or operational difficulties arising from, an acquisition would be greater than anticipated;
- •
- significant acquisition-related accounting adjustments, particularly relating to an acquired company's deferred revenue, that may
cause reported revenue and profits of the combined company to be lower than the sum of their stand-alone revenue and profits;
- •
- significant accounting charges resulting from the completion and integration of a sizeable acquisition and increased capital expenditures, including potential impairment charges incurred to write down the carrying amount of intangible assets generated as a result of an acquisition;
19
- •
- the possibility that we will not discover important facts during due diligence that could have a material adverse effect on the value
of the businesses we acquire, including the possibility that a change of control of a company we acquire triggers a termination of contractual or intellectual property rights important to the
operation of its business;
- •
- the need to integrate an acquired company's accounting, management information, human resource and other administrative systems to
permit effective management and timely reporting, and the need to implement or remediate controls, procedures and policies appropriate for a public company in an acquired company that, prior to the
acquisition, lacked these controls, procedures and policies;
- •
- litigation or other claims in connection with, or inheritance of claims or litigation risks as a result of, an acquisition, including
claims from terminated employees, customers or other third-parties; and
- •
- to the extent that we engage in strategic transactions outside of the United States, we face additional risks, including risks related to integration of operations across different cultures and languages, currency risks and the particular economic, political and regulatory risks associated with specific countries.
Future acquisitions and investments could also involve the issuance of our equity and equity-linked securities (potentially diluting our existing stockholders), the incurrence of debt, contingent liabilities or amortization expenses, write-offs of goodwill, intangibles, or acquired in-process technology, or other increased cash and non-cash expenses such as stock- based compensation. Any of the foregoing factors could harm our financial condition or prevent us from achieving improvements in our financial condition and operating performance that could have otherwise been achieved by us on a stand-alone basis. Our stockholders may not have the opportunity to review, vote on or evaluate future acquisitions or investments.
Our ability to acquire and maintain licenses to intellectual property, especially for sports titles, affects our revenue and profitability. Competition for these licenses may make them more expensive and increase our costs.
Certain of our products are based on or incorporate intellectual property owned by others. For example, certain of our 2K products include rights licensed from major sports leagues and players' associations. Similarly, some of our other titles are based on licenses of popular entertainment products. Competition for these licenses is intense. If we are unable to maintain these licenses or obtain additional licenses on reasonable economic terms or with significant commercial value, our revenue and profitability could decline significantly. Competition for these licenses may also increase the advances, guarantees and royalties that we must pay to the licensor, which could significantly increase our costs and adversely affect our profitability. In addition, on certain intellectual property licenses, we are subject to guaranteed minimum payments, royalties or standards of performance and may not be able to terminate these agreements prior to their stated expiration. If such licensed products do not generate revenues in excess of such minimum guarantees, our profitability will be adversely affected.
We may need additional capital if we incur losses.
If we incur losses in the future, we may be required to raise additional capital in order to fund our operations. We could seek to raise capital in a number of ways, including through the issuance of debt or equity, or through other financing arrangements. In August 2014, we entered into a Third Amendment to the Second Amended and Restated Credit Agreement (as amended, the "Credit Agreement"), which requires us to make periodic interest or other debt service payments. In addition, we issued 1.75% Convertible Notes due 2016 in November 2011 and 1.00% Convertible Notes due 2018 in June 2013 (the "1.75% Convertible Notes" and together with the 1.00% Convertible Notes, the "Convertible Notes"), which require us to make periodic interest payments to the holders of the Convertible Notes. If we borrow additional funds, further debt service payments would probably be necessary. In addition, the terms of
20
additional debt may impose significant restrictions on our ability to operate our business. If we seek financing through the sale of equity or equity-based securities (such as our Convertible Notes), our current stockholders will suffer dilution in their percentage ownership of common stock. We cannot be certain as to our ability to raise additional capital in the future or under what terms capital would be available. If we need to raise capital and are not successful in doing so, we will have to consider other options that may include, but are not limited to, a reduction in our expenditures for internal and external new product development, reductions in overhead expenses, and sales of intellectual property and other assets. These actions, should they become necessary, will likely result in a reduction in the size of our operations and could materially affect the prospects of our business.
We are subject to contractual covenants which place certain limitations on how we manage our business.
Our Credit Agreement and the indentures governing our Convertible Notes may limit our ability to take various actions, including incurring additional debt, paying dividends, repurchasing shares and acquiring or disposing of assets or businesses. In addition, we have granted a security interest in connection with certain compensatory arrangements which limits our ability to incur senior debt in excess of certain amounts. Accordingly, we may be restricted from taking actions that management believes would be desirable and in the best interests of us and our stockholders. Our Credit Agreement and the indentures also require us to satisfy specified financial and non-financial covenants. A breach of any of the covenants contained in our Credit Agreement could result in an event of default under the agreement and under the indentures governing our Convertible Notes and would allow our lenders and noteholders to pursue various remedies, including accelerating the repayment of any outstanding indebtedness.
Our business and products are subject to potential legislation. The adoption of such proposed legislation could limit the retail market for our products.
Several proposals have been made for federal legislation to regulate our industry. Such proposals seek to prohibit the sale of products containing certain content included in some of our games. If any such proposals are enacted into law, it may limit the potential market for some of our games in the United States, and adversely affect our business, financial condition and operating results. Other countries, such as Germany, have adopted laws regulating content both in packaged games and those transmitted over the Internet that are stricter than current United States laws. In the United States, proposals have also been made by numerous state legislators to regulate and prohibit the sale of interactive entertainment software products containing certain types of violent or sexual content to under 17 or 18 audiences, such as the State of California's "ultraviolent video games law" that sought to ban the sale or rental of violent video games to minors. While such legislation to date has been enjoined by industry and retail groups or been found unconstitutional, the adoption into law of such legislation in federal and/or in state jurisdictions in which we do significant business could severely limit the retail market for some of our games.
We may be required to record a significant charge to earnings if our goodwill becomes impaired.
We are required under U.S. generally accepted accounting principles to review our goodwill for impairment at least annually or more frequently when events or changes in circumstances indicate the carrying value may not be recoverable. Factors that may be considered a change in circumstances, indicating a requirement to reevaluate whether our goodwill continues to be recoverable, include a significant decline in stock price and market capitalization, slower growth rates in our industry or other materially adverse events. We may be required to record a significant charge to earnings in our financial statements during the period in which any impairment of our goodwill is determined. This may adversely affect our operating results.
21
Our reported financial results could be adversely affected by the application of existing or future accounting standards to our business as it evolves.
Our reported financial results are affected by the accounting policies promulgated by the SEC and national accounting standards bodies and the methods, estimates, and judgments that we use in applying our accounting policies. For example, standards regarding software revenue recognition have and could further significantly affect the way we account for revenue related to our products and services. As we enhance, expand and diversify our business and product offerings, the application of existing or future financial accounting standards, particularly those relating to the way we account for revenue, could have a significant adverse effect on our reported results although not necessarily on our cash flows.
Risks relating to our common stock
For purposes of this section "Risks relating to our common stock," references to "the Company," "we," "our," and "us" refer only to Take-Two Interactive Software, Inc. and not to its subsidiaries.
Additional issuances of equity securities by us would dilute the ownership of our existing stockholders.
We may issue equity or equity-based securities (such as our Convertible Notes) in the future in connection with acquisitions or strategic transactions, to adjust our ratio of debt to equity, including through repayment of outstanding debt, to fund expansion of our operations or for other purposes. To the extent we issue additional equity securities, the percentage ownership of our existing stockholders would be reduced.
There is no guarantee that we will do additional share repurchases in the future.
The share repurchase program authorized by the Board of Directors, which authorized the repurchase of up to 7,500,000 shares of our common stock and had 3,283,000 shares available for repurchase as of March 31, 2015, does not obligate the Company to make any purchases at any specific time or situation. On May 13, 2015, our Board of Directors approved an increase to the share repurchase authorization, increasing the total number of shares that the Company is permitted to repurchase to up to 10,000,000 shares of our common stock. Discontinuing repurchases could adversely affect the price of the Company's common stock. The program may be suspended or discontinued at any time for any reason.
Future sales or other issuances of our common stock could adversely affect its market price.
The sale of substantial amounts of our common stock could adversely affect its price. The sale or the availability for sale of a large number of shares of our common stock in the public market could cause the price of our common stock to decline. The issuance of shares of our common stock upon conversion of our Convertible Notes could also adversely affect the price of our common stock.
Our stock price has been volatile and may continue to fluctuate significantly.
The market price of our common stock historically has been, and we expect will continue to be, subject to significant fluctuations. These fluctuations may be due to factors specific to us including those discussed in the risk factors in this section as well as others not currently known to us or that we currently do not believe are material, to changes in securities analysts' earnings estimates or ratings, to our results or future financial guidance falling below our expectations and analysts' and investors' expectations, to factors affecting the computer, software, entertainment, media or electronics industries, or to national or international economic conditions.
Stock markets, in general, have experienced over the years, and continue to experience significant price and volume fluctuations that have affected market prices for companies such as ours and that may be unrelated or disproportionate to the operating performance of the affected companies. These broad
22
market and industry fluctuations may adversely affect the price of our stock, regardless of our operating performance.
Delaware law, our charter documents and provisions of our debt agreements may impede or discourage a takeover, which could cause the market price of our shares to decline.
We are a Delaware corporation, and the anti-takeover provisions of Delaware law impose various impediments to the ability of a third-party to acquire control of us, even if a change in control would be beneficial to our existing stockholders. Our Board of Directors has the power, without stockholder approval, to adopt a stockholder rights plan and/or to designate the terms of one or more series of preferred stock and issue shares of preferred stock. In addition, we may under certain circumstances involving a change of control, be obligated to repurchase all or a portion of our Convertible Notes and any potential acquirer would be required to assume our obligations related to any outstanding Convertible Notes. We or any possible acquirer may not have available financial resources necessary to repurchase those notes. The ability of our Board of Directors to create and issue a new series of preferred stock and certain provisions of Delaware law, our certificate of incorporation and bylaws and the indenture governing our notes could impede a merger, takeover or other business combination involving us or discourage a potential acquirer from making a tender offer for our common stock, which, under certain circumstances, could reduce the market price of our common stock and the value of any outstanding notes.
Our ability to use net operating loss carryforwards to reduce future years' taxes could be substantially limited if we experience an ownership change as defined in the Internal Revenue Code.
Section 382 of the Internal Revenue Code contains rules that limit the ability of a company to use its net operating loss carryforwards in years after an ownership change, which is generally defined as any change in ownership of more than 50% of its stock over a three-year testing period. These rules generally operate by focusing on ownership changes among stockholders owning directly or indirectly 5% or more of the stock of a company and/or any change in ownership arising from a new issuance of stock by the company. If, as a result of future transactions involving our common stock, including purchases or sales of stock by 5% stockholders, we undergo cumulative ownership changes which exceed 50% over the testing period, our ability to use our net operating loss carryforwards would be subject to additional limitations under Section 382.
Generally, if an ownership change occurs, the annual taxable income limitation on the use of net operating loss carryforwards is equal to the product of the applicable long-term tax exempt rate and the value of the company's stock immediately before the ownership change. Depending on the resulting limitation, a portion of our net operating loss carryforwards could expire before we would be able to use them.
Our inability to fully utilize our net operating losses to offset taxable income generated in the future could have a material and negative affect on our future financial position and results of operations.
Item 1B. Unresolved Staff Comments
None.
Our principal executive offices are located at 622 Broadway, New York, New York in approximately 64,000 square feet of space under a lease expiring in March 2023.
Take-Two Interactive Software Europe Ltd, our wholly-owned subsidiary, leases 12,500 square feet of office space in Windsor, United Kingdom, which expires in January 2022. Rockstar North, our wholly-owned subsidiary, leases 72,000 square feet of office space in Edinburgh, Scotland, which expires in June 2024.
23
2K corporate offices and two development studios occupy approximately 110,000 square feet of leased office space in Novato, California. The lease expires in March 2019.
In addition, our other subsidiaries lease office space in Sydney, Australia; Toronto, Canada; Chengdu, Hanghzhou and Shanghai, China; Brno, Czech Republic; Paris, France; Munich, Germany; Tokyo, Japan; Seoul, South Korea; Breda, Netherlands; Auckland, New Zealand; Singapore; Madrid, Spain; Taipei, Taiwan; London, Lincoln, and Leeds, United Kingdom and, in the United States, San Diego, and Northridge, California; Sparks, Maryland; Andover and Quincy, Massachusetts; Las Vegas, Nevada; Glen Cove, New York; Kirkland, Washington.
For information regarding our lease commitments, see Note 11 of the Notes to Consolidated Financial Statements.
We are, or may become, subject to demands and claims (including intellectual property claims) and are involved in routine litigation in the ordinary course of business which we do not believe to be material to our business or financial statements. We have appropriately accrued amounts related to certain of these claims and legal and other proceedings. While it is reasonably possible that a loss may be incurred in excess of the amounts accrued in our financial statements, we believe that such losses, unless otherwise disclosed, would not be material.
Item 4. Mine Safety Disclosures
Not applicable.
24
Item 5. Market for Registrant's Common Equity, Related Stockholder Matters and Issuer Purchases of Equity Securities
Market Information and Holders
Our common stock trades on the NASDAQ Global Select Market under the symbol "TTWO." The following table sets forth, for the periods indicated, the range of the high and low sale prices for our common stock as reported by NASDAQ.
| |
High | Low | |||||
|---|---|---|---|---|---|---|---|
Fiscal Year Ended March 31, 2015 |
|||||||
First Quarter ended June 30, 2014 |
$ |
22.47 |
$ |
18.45 |
|||
Second Quarter ended September 30, 2014 |
24.28 | 20.40 | |||||
Third Quarter ended December 31, 2014 |
29.10 | 20.13 | |||||
Fourth Quarter ended March 31, 2015 |
30.80 | 24.19 | |||||
Fiscal Year Ended March 31, 2014 |
|||||||
First Quarter ended June 30, 2013 |
$ |
17.54 |
$ |
14.08 |
|||
Second Quarter ended September 30, 2013 |
19.25 | 15.05 | |||||
Third Quarter ended December 31, 2013 |
18.59 | 16.00 | |||||
Fourth Quarter ended March 31, 2014 |
22.41 | 16.40 | |||||
The number of record holders of our common stock was 65 as of May 15, 2015.
Dividend Policy
We have never declared or paid cash dividends. We currently anticipate that all future earnings will be retained to finance the growth of our business and we do not expect to declare or pay any cash dividends in the foreseeable future. The payment of dividends in the future is within the discretion of our Board of Directors and will depend upon future earnings, capital requirements and other relevant factors. Our Credit Agreement restricts the payment of dividends on our stock. See "Liquidity and Capital Resources" under Item 7 for additional information on our Credit Agreement.
Securities Authorized for Issuance under Equity Compensation Plans
The table setting forth this information is included in Part III—Item 12, Security Ownership of Certain Beneficial Owners and Management and Related Stockholder Matters.
Stock Performance Graph
The following line graph compares, from March 31, 2010 through March 31, 2015, the cumulative total stockholder return on our common stock with the cumulative total return on the stocks comprising the NASDAQ Composite Index and the stocks comprising a peer group index consisting of Activision Blizzard and Electronic Arts. The comparison assumes $100 was invested on March 31, 2010 in our common stock and in each of the following indices and assumes reinvestment of all cash dividends, if any, paid on such securities. We have not paid any cash dividends and, therefore, our cumulative total return calculation is based solely upon stock price appreciation and not upon reinvestment of cash dividends. Historical stock price is not necessarily indicative of future stock price performance.
25
Comparison of 65 Month Cumulative Total Return*
Among Take-Two Interactive Software, Inc., The NASDAQ Composite Index and a Peer Group
March 2015
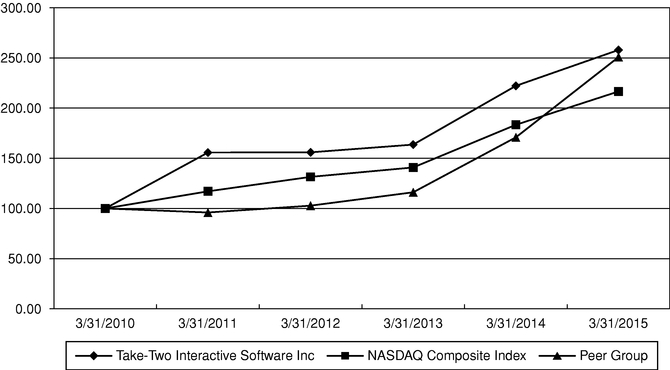
- *
- $100 invested on March 31, 2010 in stock or index- including reinvestment of dividends.
| |
March 31, | ||||||||||||||||||
|---|---|---|---|---|---|---|---|---|---|---|---|---|---|---|---|---|---|---|---|
| |
2010 | 2011 | 2012 | 2013 | 2014 | 2015 | |||||||||||||
Take-Two Interactive Software Inc |
$ | 100.00 | $ | 155.72 | $ | 155.93 | $ | 163.63 | $ | 222.19 | $ | 257.95 | |||||||
NASDAQ Composite Index |
100.00 | 117.06 | 131.47 | 140.86 | 183.38 | 216.60 | |||||||||||||
Peer Group |
100.00 | 95.97 | 102.78 | 116.13 | 170.87 | 250.85 | |||||||||||||
Issuer Purchases of Equity Securities
In January 2013, our Board of Directors authorized the repurchase of up to 7,500,000 shares of our common stock. The authorization permits the Company to purchase shares from time to time through a variety of methods, including in the open market or through privately negotiated transactions, in accordance with applicable securities laws. It does not obligate the Company to make any purchases at any specific time or situation. Repurchases are subject to the availability of stock, prevailing market conditions, the trading price of the stock, the Company's financial performance and other conditions. The program may be suspended or discontinued at any time for any reason. During the fiscal year ended March 31, 2015, the Company did not repurchase any shares of its common stock as part of the program. During the fiscal year ended March 31, 2014, the Company repurchased approximately 4,217,000 shares of its common stock in the open market for approximately $73.3 million, including commissions of $0.04 million, as part of the program. As of March 31, 2015, up to approximately 3,283,000 shares of our common stock remain available for repurchase under the Company's share repurchase authorization. On May 13, 2015, our Board of Directors approved an increase to the share repurchase authorization, increasing the total number of shares that the Company is permitted to repurchase to up to 10,000,000 shares of our common stock.
26
Repurchase from Icahn Group
In November 2013, the Company entered into a Purchase Agreement with High River Limited Partnership, Icahn Partners LP, Icahn Partners Master Fund LP, Icahn Partners Master Fund II LP and Icahn Partners Master Fund III LP (collectively, the "Icahn Group"), pursuant to which the Company repurchased approximately 12,021,000 shares of the Company's common stock owned by the Icahn Group, at a price per share of $16.93, resulting in an aggregate purchase price of approximately $203.5 million (the "Repurchase Transaction"). The closing of the Repurchase Transaction occurred on November 26, 2013. The Repurchase Transaction was conducted outside the Company's share repurchase program described above.
27
Item 6. Selected Financial Data
The following Selected Financial Data should be read in conjunction with our Consolidated Financial Statements and related Notes, and Management's Discussion and Analysis of Financial Condition and Results of Operations included elsewhere in this Annual Report on Form 10-K. (in thousands, except per share data)
| |
Fiscal Year Ended March 31, | |||||||||||||||
|---|---|---|---|---|---|---|---|---|---|---|---|---|---|---|---|---|
| STATEMENT OF OPERATIONS DATA (in thousands, except per share data): |
2015 | 2014 | 2013 | 2012 | 2011 | |||||||||||
Net revenue |
$ | 1,082,938 | $ | 2,350,568 | $ | 1,214,483 | $ | 825,823 | $ | 1,136,876 | ||||||
Cost of goods sold |
794,867 | 1,414,327 | 715,837 | 528,855 | 689,381 | |||||||||||
| | | | | | | | | | | | | | | | | |
Gross profit |
288,071 | 936,241 | 498,646 | 296,968 | 447,495 | |||||||||||
| | | | | | | | | | | | | | | | | |
Selling and marketing |
235,341 | 240,996 | 257,329 | 183,749 | 176,294 | |||||||||||
General and administrative |
175,093 | 161,374 | 147,260 | 121,200 | 109,484 | |||||||||||
Research and development |
115,043 | 105,256 | 78,184 | 64,162 | 69,576 | |||||||||||
Depreciation and amortization |
21,057 | 13,359 | 10,634 | 12,123 | 14,999 | |||||||||||
| | | | | | | | | | | | | | | | | |
Total operating expenses |
546,534 | 520,985 | 493,407 | 381,234 | 370,353 | |||||||||||
| | | | | | | | | | | | | | | | | |
Income (loss) from operations |
(258,463 | ) | 415,256 | 5,239 | (84,266 | ) | 77,142 | |||||||||
Interest and other, net |
(31,893 | ) | (33,553 | ) | (31,351 | ) | (19,571 | ) | (13,519 | ) | ||||||
Gain on long-term investments, net |
17,476 | — | — | — | — | |||||||||||
Loss on extinguishment of debt |
— | (9,014 | ) | — | — | — | ||||||||||
Gain on convertible note hedge and warrants, net |
— | 3,461 | — | — | — | |||||||||||
| | | | | | | | | | | | | | | | | |
Income (loss) from continuing operations before income taxes |
(272,880 | ) | 376,150 | (26,112 | ) | (103,837 | ) | 63,623 | ||||||||
| | | | | | | | | | | | | | | | | |
Provision for income taxes |
6,590 | 14,459 | 5,050 | 3,863 | 9,819 | |||||||||||
| | | | | | | | | | | | | | | | | |
Income (loss) from continuing operations |
(279,470 | ) | 361,691 | (31,162 | ) | (107,700 | ) | 53,804 | ||||||||
Income (loss) from discontinued operations, net of taxes |
— | (86 | ) | 1,671 | (1,116 | ) | (5,346 | ) | ||||||||
| | | | | | | | | | | | | | | | | |
Net income (loss) |
$ | (279,470 | ) | $ | 361,605 | $ | (29,491 | ) | $ | (108,816 | ) | $ | 48,458 | |||
| | | | | | | | | | | | | | | | | |
| | | | | | | | | | | | | | | | | |
| | | | | | | | | | | | | | | | | |
Earnings (loss) per share: |
||||||||||||||||
Continuing operations |
$ | (3.48 | ) | $ | 3.79 | $ | (0.36 | ) | $ | (1.30 | ) | $ | 0.62 | |||
Discontinued operations |
— | — | 0.02 | (0.01 | ) | (0.06 | ) | |||||||||
| | | | | | | | | | | | | | | | | |
Basic earnings (loss) per share |
$ | (3.48 | ) | $ | 3.79 | $ | (0.34 | ) | $ | (1.31 | ) | $ | 0.56 | |||
| | | | | | | | | | | | | | | | | |
| | | | | | | | | | | | | | | | | |
| | | | | | | | | | | | | | | | | |
Continuing operations |
$ | (3.48 | ) | $ | 3.20 | $ | (0.36 | ) | $ | (1.30 | ) | $ | 0.62 | |||
Discontinued operations |
— | — | 0.02 | (0.01 | ) | (0.06 | ) | |||||||||
| | | | | | | | | | | | | | | | | |
Diluted earnings (loss) per share |
$ | (3.48 | ) | $ | 3.20 | $ | (0.34 | ) | $ | (1.31 | ) | $ | 0.56 | |||
| | | | | | | | | | | | | | | | | |
| | | | | | | | | | | | | | | | | |
| | | | | | | | | | | | | | | | | |
Weighted average shares outstanding: |
||||||||||||||||
Basic |
80,367 | 84,519 | 85,581 | 83,356 | 86,127 | |||||||||||
Diluted |
80,367 | 113,882 | 85,581 | 83,356 | 86,139 | |||||||||||
| |
As of March 31, | |||||||||||||||
|---|---|---|---|---|---|---|---|---|---|---|---|---|---|---|---|---|
| BALANCE SHEET DATA: |
2015 | 2014 | 2013 | 2012 | 2011 | |||||||||||
Cash and cash equivalents |
$ | 911,120 | 935,400 | 402,502 | $ | 420,279 | $ | 280,359 | ||||||||
Working capital |
815,048 | 924,620 | 529,153 | 524,892 | 335,715 | |||||||||||
Total assets |
2,231,100 | 1,799,630 | 1,277,839 | 1,149,427 | 971,659 | |||||||||||
Long-term debt |
476,057 | 454,031 | 335,202 | 316,340 | 107,239 | |||||||||||
Total liabilities |
1,668,012 | 997,824 | 689,844 | 553,700 | 356,380 | |||||||||||
Stockholders' equity |
563,088 | 801,806 | 587,995 | 595,727 | 615,279 | |||||||||||
28
Item 7. Management's Discussion and Analysis of Financial Condition and Results of Operations
Our Business
We are a leading developer, publisher and marketer of interactive entertainment for consumers around the globe. We develop and publish products through our two wholly-owned labels Rockstar Games and 2K. Our products are currently designed for console gaming systems such as Sony's PlayStation®3 ("PS3") and PlayStation®4 ("PS4") and Microsoft's Xbox 360® ("Xbox 360") and Xbox One® ("Xbox One"); and personal computers ("PC"), including smartphones and tablets. We deliver our products through physical retail, digital download, online platforms and cloud streaming services.
We endeavor to be the most creative, innovative and efficient company in our industry. Our core strategy is to capitalize on the popularity of video games by developing and publishing high-quality interactive entertainment experiences across a range of genres. We focus on building compelling entertainment franchises by publishing a select number of titles for which we can create sequels and incremental revenue opportunities through add-on content, microtransactions and online play. Most of our intellectual property is internally owned and developed, which we believe best positions us financially and competitively. We have established a portfolio of proprietary software content for the major hardware platforms in a wide range of genres, including action, adventure, family/casual, racing, role-playing, shooter, sports and strategy, which we distribute worldwide. We believe that our commitment to creativity and innovation is a distinguishing strength, enabling us to differentiate our products in the marketplace by combining advanced technology with compelling storylines and characters that provide unique gameplay experiences for consumers. We have created, acquired or licensed a group of highly recognizable brands to match the broad consumer demographics we serve, ranging from adults to children and game enthusiasts to casual gamers. Another cornerstone of our strategy is to support the success of our products in the marketplace through innovative marketing programs and global distribution on all platforms and through all channels that are relevant to our target audience.
Our revenue is primarily derived from the sale of internally developed software titles and software titles developed by third-parties for our benefit. Operating margins are dependent in part upon our ability to release new, commercially successful software products and to manage effectively their development costs. We have internal development studios located in Canada, China, Czech Republic, the United Kingdom, and the United States.
Software titles published by our Rockstar Games label are primarily internally developed. We expect Rockstar Games, our wholly-owned publisher of the Grand Theft Auto, Max Payne, Midnight Club, Red Dead and other popular franchises, to continue to be a leader in the action / adventure product category and to create groundbreaking entertainment by leveraging our existing titles as well as by developing new brands. We believe that Rockstar has established a uniquely original, popular cultural phenomenon with its Grand Theft Auto series, which is the interactive entertainment industry's most iconic and critically acclaimed brand and has sold-in over 210 million units. The latest installment, Grand Theft Auto V, was released on Sony's PS3 and Microsoft's Xbox 360 in September 2013, on ony's PS4 and Microsoft's Xbox One in November 2014, and on PC in April 2015. Grand Theft Auto V includes access to Grand Theft Auto Online, which initially launched in October 2013. Rockstar is also well known for developing brands in other genres, including the L.A. Noire, Bully and Manhunt franchises. Rockstar continues to expand on our established franchises by developing sequels, offering downloadable episodes, content and virtual currency, and releasing titles for smartphones and tablets.
Our 2K label has published a variety of popular entertainment properties across all key platforms and across a range of genres including shooter, action, role-playing, strategy, sports and family/casual entertainment. We expect 2K to continue to develop new, successful franchises in the future. 2K's internally owned and developed franchises include the critically acclaimed, multi-million unit selling
29
BioShock, Mafia, Sid Meier's Civilization and XCOM Enemy Unknown series. 2K also publishes successful externally developed franchises, such as Borderlands and Evolve. 2K's realistic sports simulation titles include our flagship NBA 2K series, which has been the top-ranked NBA basketball video game for 14 years running, and the WWE 2K series.
We are continuing our expansion initiatives in the Asia markets, where our strategy is to broaden the distribution of our existing products and establish an online gaming presence, especially in China and South Korea. 2K has secured a multi-year license from the NBA to develop an online version of the NBA 2K simulation game in China, Taiwan, South Korea and Southeast Asia. In October 2012, NBA 2K Online, our free-to-play NBA simulation game co-developed by 2K and Tencent, launched commercially on the Tencent Games portal in China. In addition, South Korean-based studio XLGAMES is presently developing Civilization Online, a new online game for the Asian market, which is planned for commercial launch in Korea during our fiscal year 2016.
Trends and Factors Affecting our Business
Product Release Schedule. Our financial results are affected by the timing of our product releases and the commercial success of those titles. Our Grand Theft Auto products in particular have historically accounted for a substantial portion of our revenue. Sales of Grand Theft Auto products generated approximately 28.0% of the Company's net revenue for the fiscal year ended March 31, 2015. The timing of our Grand Theft Auto releases varies significantly, which in turn may affect our financial performance on a quarterly and annual basis.
Economic Environment and Retailer Performance. We continue to monitor economic conditions that may unfavorably affect our businesses, such as deteriorating consumer demand, pricing pressure on our products, credit quality of our receivables, and foreign currency exchange rates. Our business is dependent upon a limited number of customers who account for a significant portion of our revenue. Our five largest customers accounted for 64.6%, 39.4% and 52.5% of net revenue during the fiscal years ended March 31, 2015, 2014 and 2013, respectively. As of March 31, 2015 and 2014, our five largest customers comprised approximately 63.9% and 68.3% of our gross accounts receivable, respectively, with our significant customers (those that individually comprised more than 10% of our gross accounts receivable balance) accounting for approximately 54.5% and 59.8% of such balance at March 31, 2015 and 2014, respectively. We had three customers who accounted for approximately 18.5%, 18.4% and 17.6% of our gross accounts receivable as of March 31, 2015 and three customers who accounted for 22.6%, 22.3% and 14.9% of our gross accounts receivable as of March 31, 2014. We did not have any additional customers that exceeded 10% of our gross accounts receivable as of March 31, 2015 and 2014. The economic environment has affected our customers in the past, and may do so in the future. Bankruptcies or consolidations of our large retail customers could seriously hurt our business, due to uncollectible accounts receivables and the concentration of purchasing power among the remaining large retailers. Certain of our large customers sell used copies of our games, which may negatively affect our business by reducing demand for new copies of our games. While the downloadable content that we now offer for certain of our titles may serve to reduce used game sales, we expect used game sales to continue to adversely affect our business.
Hardware Platforms. We derive most of our revenue from the sale of products made for video game platforms manufactured by third-parties, such as Sony's PS3 and PS4 and Microsoft's Xbox 360 and Xbox One, which comprised approximately 81.4% of the Company's net revenue by product platform for the fiscal year ended March 31, 2015. The success of our business is dependent upon the consumer acceptance of these platforms and the continued growth in the installed base of these platforms. When new hardware platforms are introduced, demand for software based on older platforms typically declines, which may negatively affect our business during the market transition to the new consoles. We continually monitor console hardware sales. We manage our product delivery on each current and future platform in a manner we believe to be most effective to maximize our revenue opportunities and achieve the desired return on our investments in product development. Additionally, our development costs are generally higher for
30
titles during platform transition periods, and we have a limited ability to predict the consumer acceptance of the future platforms, which may affect our sales and profitability. Accordingly, our strategy is to focus our development efforts on a select number of the highest quality titles for these platforms, while also expanding our offerings for emerging platforms such as mobile and online games.
Online Content and Digital Distribution. The interactive entertainment software industry is delivering a growing amount of content through digital online delivery methods. We provide a variety of online delivered products and offerings. Virtually all of our titles that are available through retailers as packaged goods products are also available through direct digital download via the Internet (from websites we own and others owned by third-parties). In addition, we aim to drive ongoing engagement and recurrent consumer spending on our titles after their initial purchase, by generating incremental revenues through downloadable offerings, including add-on content, microtransactions and online play. We also publish an expanding variety of titles for tablets and smartphones, which are delivered to consumers through digital download via the Internet. Note 14 to our Consolidated Financial Statements, "Segment and Geographic Information," discloses that net revenue from digital online channels comprised approximately 42.0% of the Company's net revenue by distribution channel for the fiscal year ended March 31, 2015. We expect online delivery of games and game offerings to become an increasing part of our business over the long-term.
Product Releases
We released the following key titles in fiscal year 2015:
| Title | Publishing Label | Internal or External Development |
Platform(s) | Date Released | ||||
|---|---|---|---|---|---|---|---|---|
NBA 2K15 |
2K | Internal | PS3, PS4, Xbox 360, Xbox One, PC | October 7, 2014 | ||||
Borderlands: The Pre-Sequel |
2K | Internal/External | Xbox 360, PS3, PC | October 14, 2014 | ||||
Sid Meier's Civilization: Beyond Earth |
2K | Internal | PC | October 24, 2014 | ||||
WWE 2K15 |
2K | Internal/External | PS3, Xbox 360 | October 28, 2014 | ||||
WWE 2K15 |
2K | Internal/External | PS4, Xbox One | November 18, 2014 | ||||
Grand Theft Auto V |
Rockstar Games | Internal | Xbox One, PS4 | November 18, 2014 | ||||
Grand Theft Auto Online |
Rockstar Games | Internal | Xbox One, PS4 | November 18, 2014 | ||||
Evolve |
2K | External | Xbox One, PS4, PC | February 10, 2015 | ||||
Sid Meier's Starships |
2K | Internal | PC Mac, iOS | March 12, 2015 | ||||
Borderlands: The Handsome Collection |
2K | Internal/External | Xbox One, PS4 | March 24, 2015 |
Product Pipeline
We have announced the following key titles to date (this list does not represent all titles currently in development):
| Title | Publishing Label | Internal or External Development |
Platform(s) | Expected Release Date | ||||
|---|---|---|---|---|---|---|---|---|
Grand Theft Auto V |
Rockstar Games | Internal | PC | April 14, 2015 (Released) | ||||
Grand Theft Auto Online |
Rockstar Games | Internal | PC | April 14, 2015 (Released) | ||||
NBA 2K16 |
2K | Internal | TBA | Fiscal Year 2016 | ||||
WWE 2K16 |
2K | Internal/External | TBA | Fiscal Year 2016 | ||||
Battleborn |
2K | External | Xbox One, PS4, PC | Fiscal Year 2016 |
Fiscal 2015 Financial Summary
Our net revenue for fiscal year ended March 31, 2015 was led by titles from a variety of our top franchises, mainly Grand Theft Auto, NBA 2K, Borderlands and WWE 2K. Our net revenue decreased to $1,082.9 million, a decrease of $1,267.6 million or 53.9% from the fiscal year ended March 31, 2014, which
31
had benefitted from the release of Grand Theft Auto V on Sony's PS3 and Microsoft's Xbox 360 console gaming systems.
For the fiscal year ended March 31, 2015, our net loss was $279.5 million, as compared to net income of $361.6 million in the prior year. Diluted loss per share for the fiscal year ended March 31, 2015 was $3.48, as compared to diluted income per share of $3.20 for the fiscal year ended March 31, 2014. Our earnings decreased primarily because the prior year had benefitted from the release of Grand Theft Auto V on Sony's PS3 and Microsoft's Xbox 360 console gaming systems and due to the deferral of net revenue and cost of goods sold related to the sell-in of certain titles during the second half of our fiscal year ended March 31, 2015.
At March 31, 2015 we had $911.1 million of cash and cash equivalents, compared to $935.4 million at March 31, 2014. The decrease in cash and cash equivalents from March 31, 2014 was primarily due to cash used in investing activities partially offset by cash provided by operating activities. Net cash used in investing activities related to purchases of short-term investments and purchases of fixed assets, which were partially offset by the proceeds received from the sale of our long-term investments. Net cash provided by operations was primarily due to an increase in deferred revenue generated by the sale of Grand Theft Auto V on Sony's PS4 and Microsoft's Xbox One platforms, Evolve and virtual currency partially offset by investments in software development.
Discontinued operations
The financial results of our former distribution business, which was sold in February 2010, have been classified as discontinued operations in our Consolidated Statements of Operations for all periods presented. See Note 1 to our Consolidated Financial Statements for additional information regarding discontinued operations.
Critical Accounting Policies and Estimates
The preparation of financial statements in conformity with U.S. generally accepted accounting principles ("U.S. GAAP") requires management to make estimates and assumptions about future events and apply judgments that affect the reported amounts of assets and liabilities and the disclosure of contingent assets and liabilities at the dates of the financial statements and the reported amounts of net revenues and expenses during the reporting periods. We base our estimates, assumptions and judgments on historical experience, current trends and other factors that management believes to be relevant at the time our Consolidated Financial Statements are prepared. On a regular basis, management reviews the accounting policies, assumptions, estimates and judgments to ensure that our financial statements are fairly presented in accordance with U.S. GAAP. However, because future events and their effects cannot be determined with certainty, actual amounts could differ significantly from these estimates.
We have identified the policies below as critical to our business operations and the understanding of our financial results and they require management's most difficult, subjective or complex judgments, resulting from the need to make estimates about the effect of matters that are inherently uncertain. The effect and any associated risks related to these policies on our business operations is discussed throughout Management's Discussion and Analysis of Financial Condition and Results of Operations where such policies affect our reported and expected financial results. For a detailed discussion on the application of these and other accounting policies, see Note 1 to the Consolidated Financial Statements. Management has reviewed these critical accounting estimates and related disclosures with the Audit Committee of our Board of Directors.
Revenue Recognition
We earn our revenue from the sale of internally developed interactive software titles and from the sale of titles developed by and/or licensed from third-party developers.
32
We recognize revenue on the sales of software products upon the transfer of title and risk of loss to our customers. Accordingly, we recognize revenue for software titles when there is (1) persuasive evidence that an arrangement with the customer exists, which is generally based on a customer purchase order, (2) the product is delivered, (3) the selling price is fixed or determinable and (4) collection of the customer receivable is deemed probable. Certain products are sold to customers with a street date (i.e., the earliest date these products may be sold by retailers). For these products we recognize revenue on the later of the street date or the sale date. In addition, some of our software products are sold as full game digital downloads and digital add-on content for which the consumer takes possession of the digital content for a fee. Revenue from product downloads is generally recognized when the download is made available (assuming all other recognition criteria are met).
In providing credit terms to our customers, our payment arrangements typically provide net 30 and 60 day terms. Advances received for licensing and exclusivity arrangements are reported on our Consolidated Balance Sheets as deferred revenue until we meet our performance obligations, at which point we recognize the revenue.
For some of our software products, we enter into multiple element revenue arrangements in which we may provide a combination of full game software, additional add-on content, hosting of gameplay, maintenance or support. When all other revenue recognition criteria are met, we determine the fair value of each delivered and undelivered element using vendor-specific objective evidence ("VSOE") of fair value and allocate the total price among the various elements. When we have not established VSOE for each element, revenue is deferred until the earlier of the point at which VSOE of fair value exists for any undelivered element or until all elements of the arrangement have been delivered. For arrangements that require the deferral of revenue, the cost of goods sold is deferred and recognized as the related net revenue is recognized. Deferred cost of goods sold includes product costs and licenses. We determine VSOE for each element based on historical stand-alone sales to third parties. In determining VSOE, we require that a substantial majority of the selling prices for a product or service fall within a reasonably narrow pricing range. Changes in assumptions or judgments or changes to the elements in a software arrangement could cause a material increase or decrease in the amount of revenue that we report in a particular period.
In identifying the deliverables within an arrangement we consider whether our software products contain more-than-inconsequential online functionality by evaluating the significance of the development effort, the nature of the online features, the extent of anticipated marketing focus on the online features, the significance of the online features to the consumers' anticipated overall gameplay experience, and the significance and length of time of our post sale obligations to consumers. Determining whether the online functionality for a particular game constitutes a more than inconsequential deliverable is subjective and requires management's judgment.
When our software products provide limited online functionality at no additional cost to the consumer, we generally consider such features to be incidental to the overall product offering and an inconsequential deliverable, and we recognize revenue when the four primary criteria described above have been met. When software products provide online functionality that represents a more-than-inconsequential deliverable, we recognize the software-related revenues and the related cost of goods sold ratably over the estimated service period of the title (assuming all other recognition criteria are met) as we have not established VSOE for that deliverable.
During the fiscal year ended March 31, 2015, the Company concluded that the updates being provided with Grand Theft Auto V were no longer considered an inconsequential deliverable because add-on content updates were expected to be provided beyond 12 months. As a result, the net revenue and cost of goods sold that have been deferred will be recognized ratably over the expected service period, which is equal to the estimated remaining life of the game which, for Grand Theft Auto V, we have projected to be 24 months from the time of release.
33
Certain of our games provide consumers with the option to purchase virtual currency to use in the game to acquire virtual goods. We recognize revenue from the sale of virtual currency, using the game-based model, ratably over the estimated remaining life of the game.
Certain of our software products include in-game advertising for third-party products. Advance payments received for in-game advertising are reported on our Consolidated Balance Sheet as deferred revenue until we meet our performance obligations, at which point we recognize the revenue, which is generally at the time of the initial release of the product.
Revenue is recognized after deducting estimated reserves for returns, price concessions and other allowances. In circumstances when we do not have a reliable basis to estimate returns and price concessions or are unable to determine that collection of a receivable is probable, we defer the revenue until such time as we can reliably estimate any related returns and allowances and determine that collection of the receivable is probable.
Allowances for Returns, Price Concessions and Other Allowances
We accept returns and grant price concessions in connection with our publishing arrangements. Following reductions in the price of our products, we grant price concessions to permit customers to take credits against amounts they owe us with respect to merchandise unsold by them. Our customers must satisfy certain conditions to entitle them to return products or receive price concessions, including compliance with applicable payment terms and confirmation of field inventory levels.
Generally our distribution arrangements with customers do not give them the right to return titles or to cancel firm orders. However, we occasionally accept returns from our customers for stock balancing and make accommodations to customers, which include credits and returns, when demand for specific titles falls below expectations.
We make estimates of future product returns and price concessions related to current period product revenue. We estimate the amount of future returns and price concessions for published titles based upon, among other factors, historical experience and performance of the titles in similar genres, historical performance of the hardware platform, customer inventory levels, analysis of sell-through rates, sales force and retail customer feedback, industry pricing, market conditions and changes in demand and acceptance of our products by consumers.
Significant management judgments and estimates must be made and used in connection with establishing the allowance for returns and price concessions in any accounting period. We believe we can make reliable estimates of returns and price concessions. However, actual results may differ from initial estimates as a result of changes in circumstances, market conditions and assumptions. Adjustments to estimates are recorded in the period in which they become known.
Software Development Costs and Licenses
Capitalized software development costs include direct costs incurred for internally developed titles and payments made to third-party software developers under development agreements.
We capitalize internal software development costs (including stock-based compensation, specifically identifiable employee payroll expense and incentive compensation costs related to the completion and release of titles), third-party production and other content costs, subsequent to establishing technological feasibility of a software title. Technological feasibility of a product includes the completion of both technical design documentation and game design documentation. Significant management judgments and estimates are utilized in the assessment of when technological feasibility is established. For products where proven technology exists, this may occur early in the development cycle. Technological feasibility is evaluated on a product by product basis.
34
We enter into agreements with third-party developers that require us to make payments for game development and production services. In exchange for our payments, we receive the exclusive publishing and distribution rights to the finished game title as well as, in some cases, the underlying intellectual property rights. Such agreements typically allow us to fully recover these payments to the developers at an agreed upon royalty rate earned on the subsequent retail sales of such software, net of any agreed upon costs. Prior to establishing technological feasibility of a product we record any costs incurred by third-party developers as research and development expenses. Subsequent to establishing technological feasibility of a product we capitalize all development and production service payments to third-party developers as software development costs and licenses. We typically enter into agreements with third-party developers after completing the technical design documentation for our products and therefore record the design costs leading up to a signed development contract as research and development expense. When we contract with third-party developers, we generally select those that have proven technology and experience in the genre of the software being developed, which often allows for the establishment of technological feasibility early in the development cycle. In instances where the documentation of the design and technology are not in place prior to an executed contract, we monitor the software development process and require our third-party developers to adhere to the same technological feasibility standards that apply to our internally developed products.
Licenses consist of payments and guarantees made to holders of intellectual property rights for use of their trademarks, copyrights or other intellectual property rights in the development of our products. Agreements with license holders generally provide for guaranteed minimum payments for use of their intellectual property.
Certain licenses, especially those related to our sports products, extend over multi-year periods and encompass multiple game titles. In addition to guaranteed minimum payments, these licenses frequently contain provisions that could require us to pay royalties to the license holder based on pre-agreed unit sales thresholds.
Amortization of capitalized software development costs and licenses commences when a product is released and is recorded on a title-by-title basis in cost of goods sold. For capitalized software development costs, amortization is calculated using (1) the proportion of current year revenues to the total revenues expected to be recorded over the life of the title or (2) the straight-line method over the remaining estimated useful life of the title, whichever is greater. For capitalized licenses, amortization is calculated as a ratio of (1) current period revenues to the total revenues expected to be recorded over the remaining life of the title or (2) the contractual royalty rate based on actual net product sales as defined in the licensing agreement, whichever is greater.
We evaluate the future recoverability of capitalized software development costs and licenses on a quarterly basis. Recoverability is primarily assessed based on the actual title's performance. For products that are scheduled to be released in the future, recoverability is evaluated based on the expected performance of the specific products to which the cost or license relates. We utilize a number of criteria in evaluating expected product performance, including: historical performance of comparable products developed with comparable technology; market performance of comparable titles; orders for the product prior to its release; general market conditions; and, past performance of the franchise. When management determines that the value of the title is unlikely to be recovered by product sales, capitalized costs are charged to cost of goods sold in the period in which such determination is made.
We have established profit and unit sales based internal royalty programs that allow selected employees to each participate in the success of software titles that they assist in developing. Royalties earned by employees under this program are recorded as a component of cost of goods sold in the period earned.
35
Fair Value Estimates
The preparation of financial statements in conformity with U.S. GAAP often requires us to determine the fair value of a particular item to fairly present our Consolidated Financial Statements. Without an independent market or another representative transaction, determining the fair value of a particular item requires us to make several assumptions that are inherently difficult to predict and can have a material influence on the conclusion of the appropriate accounting.
Various valuation techniques are used to estimate fair value. These include (1) the market approach where market transactions for identical or comparable assets or liabilities are used to determine the fair value, (2) the income approach, which uses valuation techniques to convert future amounts (for example, future cash flows or future earnings) to a single present amount, and (3) the cost approach, which is based on the amount that would be required to replace an asset. For many of our fair value estimates, including our estimates of the fair value of acquired intangible assets, we use the income approach. Using the income approach requires the use of financial models, which require us to make various estimates including, but not limited to (1) the potential future cash flows for the asset, liability or equity instrument being measured, (2) the timing of receipt or payment of those future cash flows, (3) the time value of money associated with the delayed receipt or payment of such cash flows, and (4) the inherent risk associated with the cash flows (risk premium). Developing these cash flow estimates is inherently difficult and subjective, and, if any of the estimates used to determine the fair value using the income approach turn out to be inaccurate, our financial results may be negatively affected. Furthermore, relatively small changes in many of these estimates can have a significant influence on the estimated fair value resulting from the financial models or the related accounting conclusion reached. For example, a relatively small change in the estimated fair value of an asset may change a conclusion as to whether an asset is impaired. While we are required to make certain fair value assessments associated with the accounting for several types of transactions, the following areas are the most sensitive to the assessments:
- •
- Business Combinations—Goodwill and Intangible
Assets. We must estimate the fair value of assets acquired and liabilities assumed in a business combination. Our assessment of the
estimated fair value of each of these can have a material effect on our reported results as intangible assets are amortized over various lives. Goodwill represents the excess of purchase price over
the fair value of the net tangible assets and intangible assets acquired in a business combination. A change in the estimated fair value of an acquired asset or liability assumed often has a direct
influence on the amount recognized as goodwill, which is an asset that is not amortized. Often determining the fair value of these acquired assets and liabilities assumed requires an assessment of
expected use of the asset, the expected cost to extinguish the liability or our expectations related to the timing and the successful completion of development of an acquired in-process technology.
Such estimates are inherently difficult and subjective and can have a material influence on our financial statements.
We use either the income, cost or market approach to aid in our conclusions of such fair values and asset lives. The income approach presumes that the value of an asset can be estimated by the net economic benefit to be received over the life of the asset, discounted to present value. The cost approach presumes that an investor would pay no more for an asset than its replacement or reproduction cost. The market approach estimates value based on what other participants in the market have paid for reasonably similar assets. Although each valuation approach is considered in valuing the assets acquired, the approach ultimately selected is based on the characteristics of the asset and the availability of information.
We test our goodwill for impairment annually, in our second fiscal quarter, or more frequently if events and circumstances indicate the fair value of a reporting unit may be below its carrying amount. A reporting unit is defined as an operating segment or one level below an operating segment. We have determined that we operate in one reporting unit which is our operating segment. The determination of whether or not goodwill has become impaired involves a significant
36
- •
- Long-lived assets. We review long-lived assets for
impairment whenever events or changes in circumstances indicate that the related carrying amount of an asset or asset group may not be recoverable. Determining whether impairment has occurred
typically requires various estimates and assumptions, including determining which cash flows are directly related to the potentially impaired asset, the useful life over which cash flows will occur,
their amount and the asset's residual value, if any. In turn, measurement of an impairment loss requires a determination of fair value, which is based on the best information available. We use
internal discounted cash flow estimates, quoted market prices when available and independent appraisals, as appropriate, to determine fair value. We derive the required cash flow estimates from our
historical experience and our internal business plans and apply an appropriate discount rate. Recoverability of assets to be held and used is measured by a comparison of the carrying amount of an
asset with future undiscounted cash flows expected to be generated from the use and eventual disposition of the asset. If the carrying amount of an asset exceeds its estimated future undiscounted cash
flows, an impairment charge is recognized for the amount by which the carrying amount of the asset exceeds the fair value of the asset.
- •
- Inventory Obsolescence. We regularly review inventory quantities on-hand and in the retail channels and record an inventory provision for excess or obsolete inventory based on the future expected demand for our products. Significant changes in demand for our products would affect management's estimates in establishing our inventory provision. We write down inventory based on excess or obsolete inventories determined primarily by future anticipated demand for our products. Inventory write-downs are measured as the difference between the cost of the inventory and market value, based upon assumptions about future demand that are inherently difficult to assess.
level
of judgment in the assumptions underlying the approach used to determine the value of our reporting units. Changes in our strategy and/or market conditions could significantly affect these
judgments and require reductions to recorded intangible asset balances. The Company has the option to first perform a qualitative assessment to determine if the fair value of its reporting unit is
more likely than not (i.e., a likelihood of more than 50%) less than its carrying value before performing the two-step impairment test. If the two-step impairment test for goodwill is utilized,
step one compares the fair value of the reporting unit to its carrying value. If the carrying value exceeds the fair value, there is a potential impairment and step two must be performed. Step two
compares the carrying value of the reporting unit's goodwill to its implied fair value (i.e., fair value of reporting unit less the fair value of the unit's assets and liabilities, including
identifiable intangible assets). If the implied fair value of goodwill is less than the carrying amount of goodwill, an impairment is recognized. Based on our annual impairment assessment process for
goodwill, no impairments were recorded during the fiscal year ended March 31, 2015 or 2014.
Stock-based Compensation
Stock-based compensation expense is measured at the grant date based on the fair value of the award and is recognized as expense over the vesting period. Determining the fair value of stock-based awards at the grant date requires judgment in estimating expected stock volatility and the amount of stock-based awards that are expected to be forfeited. If actual results differ significantly from these estimates, stock-based compensation expense and our results of operations could be materially affected.
We have also granted time, performance-based and market-based restricted stock and restricted stock unit awards, to employees and non-employees. Time-based and market-based awards to non-employees are subject to variable accounting. For the time-based restricted stock awards to non-employees, we cumulatively remeasure the fair value at the end of every period based on the month end closing price of our common stock. Market-based restricted stock awards vest based on the relative performance of our common stock to a composite index. We calculate the fair value of market-based restricted stock awards
37
using a Monte Carlo Simulation method, which requires a substantial number of inputs and estimates of future market conditions and considers the range of various vesting probabilities. As a result, expense recorded for our non-employee awards can fluctuate substantially from period to period.
Income Taxes
We record a tax provision for the anticipated tax consequences of the reported results of operations. The provision for income taxes is computed using the asset and liability method, under which deferred income taxes are recognized for differences between the financial statement and tax bases of assets and liabilities at currently enacted statutory tax rates for the years in which the differences are expected to reverse. The effect on deferred taxes of a change in tax rates is recognized in income in the period that includes the enactment.
We record a valuation allowance to reduce our deferred tax assets to the amount that is more likely than not to be realized. Our history of pre-tax losses represents sufficient evidence for us to determine that the establishment of a valuation allowance against the deferred tax asset is appropriate. This valuation allowance offsets deferred tax assets associated with future tax deductions as well as carryforward items.
Our future effective tax rates could be adversely affected by earnings being lower than anticipated in countries where we have lower statutory rates, changes in the valuation of our deferred tax assets or liabilities, or changes in tax laws or interpretations thereof. In addition, our filed tax returns are subject to examination by the Internal Revenue Service and other tax authorities. We regularly assess the likelihood of adverse outcomes resulting from these examinations to determine the adequacy of our provision for income taxes.
We recognize and measure uncertain tax positions and record tax benefits when it is more likely than not that the tax position will be sustained on examination by the taxing authorities, based on the technical merits of the position. The tax benefits recognized in the financial statements from such positions are then measured based on the largest benefit that has a greater than 50% likelihood of being realized upon ultimate settlement.
At each period end, it is necessary for us to make certain estimates and assumptions to compute the provision for income taxes including allocations of certain transactions to different tax jurisdictions, amounts of permanent and temporary differences, the likelihood of deferred tax assets being recovered and the outcome of contingent tax risks. These estimates and assumptions are revised as new events occur, more experience is acquired and additional information is obtained. The effect of these revisions is recorded in income tax expense or benefit in the period in which they become known.
Recently Issued Accounting Pronouncements
Presentation of Debt Issuance Costs
In April 2015, the Financial Accounting Standards Board ("FASB") issued Accounting Standards Update ("ASU") 2015-03, "Simplifying the Presentation of Debt Issuance Costs." This new guidance requires the presentation of debt issuance costs in the balance sheet as a deduction from the carrying amount of the related debt liability. This update will be applied retrospectively and is effective for annual periods, and interim periods within those years, beginning after December 15, 2015 (April 1, 2016 for the Company). Early adoption is permitted. The adoption of this new guidance is not expected to have a material effect on our Consolidated Financial Statements.
Revenue from Contracts with Customers
In May 2014, the FASB issued ASU 2014-09, Revenue from Contracts with Customers, as a new Topic, Accounting Standards Codification Topic 606. The new revenue recognition standard provides a five-step analysis of transactions to determine when and how revenue is recognized. The core principle is that a
38
company should recognize revenue to depict the transfer of promised goods or services to customers in an amount that reflects the consideration to which the entity expects to be entitled in exchange for those goods or services. This ASU is effective for the annual and interim periods beginning after December 15, 2016 (April 1, 2017 for the Company) and shall be applied retrospectively to each period presented or as a cumulative-effect adjustment as of the date of adoption. On April 1, 2015, the FASB proposed deferring the effective date by one year to annual and interim years beginning after December 15, 2017. The proposal permits early adoption, but no earlier than the original effective date of annual and interim periods beginning after December 15, 2016. The Company is currently determining its implementation approach and evaluating the impact of adopting this update on our Consolidated Financial Statements.
Requirements for Reporting Discontinued Operations
In April 2014, the FASB issued ASU 2014-08, Reporting Discontinued Operations and Disclosures of Disposals of Components of an Entity. This new guidance raises the threshold for a disposal to qualify as discontinued operations and requires new disclosures for individually material disposal transactions that do not meet the definition of a discontinued operation. Under the new standard, companies report discontinued operations when they have a disposal that represents a strategic shift that has or will have a major impact on operations or financial results. This update will be applied prospectively and is effective for annual periods, and interim periods within those years, beginning after December 15, 2014 (April 1, 2015 for the Company). Early adoption is permitted provided the disposal was not previously disclosed. The adoption of this new guidance is not expected to have a material effect on our Consolidated Financial Statements.
Presentation of Unrecognized Tax Benefits
In July 2013, new guidance was issued requiring that entities that have an unrecognized tax benefit and a net operating loss carryforward or similar tax loss or tax credit carryforward in the same jurisdiction as the uncertain tax position present the unrecognized tax benefit as a reduction of the deferred tax asset for the loss or tax credit carryforward rather than as a liability when the uncertain tax position would reduce the loss or tax credit carryforward under the tax law. The disclosure requirements became effective for annual periods (and interim periods within those annual periods) beginning after December 15, 2013 (April 1, 2014 for the Company), and are applied prospectively. The adoption of this guidance had no material effect on our Consolidated Financial Statements.
Fluctuations in Operating Results and Seasonality
We have experienced fluctuations in quarterly and annual operating results as a result of: the timing of the introduction of new titles; variations in sales of titles developed for particular platforms; market acceptance of our titles; development and promotional expenses relating to the introduction of new titles, sequels or enhancements of existing titles; projected and actual changes in platforms; the timing and success of title introductions by our competitors; product returns; changes in pricing policies by us and our competitors; the size and timing of acquisitions; the timing of orders from major customers; order cancellations; and delays in product shipment. Sales of our products are also seasonal, with peak shipments typically occurring in the fourth calendar quarter as a result of increased demand for titles during the holiday season. Quarterly and annual comparisons of operating results are not necessarily indicative of future operating results.
39
The following table sets forth, for the periods indicated, the percentage of net revenue represented by certain line items in our statements of operations, net revenue by geographic region, net revenue by platform and net revenue by distribution channel:
| |
Fiscal Year Ended March 31, | |||||||||
|---|---|---|---|---|---|---|---|---|---|---|
| |
2015 | 2014 | 2013 | |||||||
Net revenue |
100.0 | % | 100.0 | % | 100.0 | % | ||||
Cost of goods sold |
73.4 | % | 60.2 | % | 58.9 | % | ||||
| | | | | | | | | | | |
Gross profit |
26.6 | % | 39.8 | % | 41.1 | % | ||||
| | | | | | | | | | | |
Selling and marketing |
21.7 | % | 10.2 | % | 21.2 | % | ||||
General and administrative |
16.2 | % | 6.9 | % | 12.1 | % | ||||
Research and development |
10.6 | % | 4.5 | % | 6.4 | % | ||||
Depreciation and amortization |
2.0 | % | 0.6 | % | 1.0 | % | ||||
| | | | | | | | | | | |
Total operating expenses |
50.5 | % | 22.2 | % | 40.7 | % | ||||
| | | | | | | | | | | |
Income (loss) from operations |
(23.9 | )% | 17.7 | % | 0.4 | % | ||||
Interest and other, net |
(2.9 | )% | (1.4 | )% | (2.6 | )% | ||||
Gain on long-term investments, net |
1.6 | % | 0.0 | % | 0.0 | % | ||||
Loss on extinguishment of debt |
0.0 | % | (0.4 | )% | 0.0 | % | ||||
Gain on convertible note hedge and warrants, net |
0.0 | % | 0.1 | % | 0.0 | % | ||||
| | | | | | | | | | | |
Income (loss) from continuing operations before income taxes |
(25.2 | )% | 16.0 | % | (2.2 | )% | ||||
| | | | | | | | | | | |
Provision for income taxes |
0.6 | % | 0.6 | % | 0.4 | % | ||||
| | | | | | | | | | | |
Income (loss) from continuing operations |
(25.8 | )% | 15.4 | % | (2.6 | )% | ||||
(Loss) income from discontinued operations, net of taxes |
0.0 | % | 0.0 | % | 0.2 | % | ||||
| | | | | | | | | | | |
Net income (loss) |
(25.8 | )% | 15.4 | % | (2.4 | )% | ||||
| | | | | | | | | | | |
| | | | | | | | | | | |
| | | | | | | | | | | |
Net revenue by geographic region: |
||||||||||
United States |
57.5 | % | 46.5 | % | 58.5 | % | ||||
International |
42.5 | % | 53.5 | % | 41.5 | % | ||||
Net revenue by platform: |
||||||||||
Console |
81.4 | % | 91.4 | % | 80.4 | % | ||||
PC and other |
18.6 | % | 8.6 | % | 19.6 | % | ||||
Net revenue by distribution channel: |
||||||||||
Physical retail and other |
58.0 | % | 84.2 | % | 78.9 | % | ||||
Digital online |
42.0 | % | 15.8 | % | 21.1 | % | ||||
40
Fiscal Years ended March 31, 2015 and 2014
| (thousands of dollars) | 2015 | % | 2014 | % | Increase/ (decrease) |
% Increase/ (decrease) |
|||||||||||||
|---|---|---|---|---|---|---|---|---|---|---|---|---|---|---|---|---|---|---|---|
Net revenue |
$ | 1,082,938 | 100.0 | % | $ | 2,350,568 | 100.0 | % | $ | (1,267,630 | ) | (53.9 | )% | ||||||
Software development costs and royalties(1) |
231,615 | 21.4 | % | 333,450 | 14.2 | % | (101,835 | ) | (30.5 | )% | |||||||||
Product costs |
178,810 | 16.5 | % | 477,861 | 20.3 | % | (299,051 | ) | (62.6 | )% | |||||||||
Licenses |
77,725 | 7.2 | % | 64,412 | 2.8 | % | 13,313 | 20.7 | % | ||||||||||
Internal royalties |
306,717 | 28.3 | % | 538,604 | 22.9 | % | (231,887 | ) | (43.1 | )% | |||||||||
Cost of goods sold |
794,867 | 73.4 | % | 1,414,327 | 60.2 | % | (619,460 | ) | (43.8 | )% | |||||||||
Gross profit |
$ | 288,071 | 26.6 | % | $ | 936,241 | 39.8 | % | $ | (648,170 | ) | (69.2 | )% | ||||||
- (1)
- Includes $17,121 and $30,124 of stock-based compensation expense in 2015 and 2014, respectively.
Net revenue decreased $1,267.6 million for the fiscal year ended March 31, 2015 as compared to the prior year. This decrease was primarily due to a decrease of approximately $1,315.3 million in sales from our Grand Theft Auto franchise, as the prior year's results included the release of Grand Theft Auto V on Sony's PS3 and Microsoft's Xbox 360 console gaming systems, which was partially offset this year by the November 2014 release of Grand Theft Auto V on Sony's PS4 and Microsoft's Xbox One console gaming systems and the growth from Grand Theft Auto Online. The decrease in net revenue from Grand Theft Auto was partially offset by a $186.3 million increase in net sales due to the October 2014 release of Borderlands: The Pre-Sequel, higher sales from our WWE 2K franchise, the release of Sid Meier's Civilization: Beyond Earth in October 2014, higher sales from our NBA 2K franchise and sales from our release of Evolve in February 2015.
Net revenue on consoles decreased to 81.4% of our total net revenue for the fiscal year ended March 31, 2015 as compared to 91.4% for the same period in the prior year primarily because last year's results included the release of Grand Theft Auto V on Microsoft's Xbox 360 and Sony's PS3 console gaming systems. PC and other sales increased to 18.6% of our total net revenue for the year ended March 31, 2015 as compared to 8.6% for the year ended March 31, 2014, primarily due to the release of Sid Meier's Civilization: Beyond Earth for the PC in October 2014. Net revenue from physical retail and other channels decreased to 58.0% of our total net revenue for the fiscal year ended March 31, 2015 as compared to 84.2% for the same period in the prior year primarily due to last year's net revenue from physical retail benefitting from the release of Grand Theft Auto V on Sony's PS3 and Microsoft's Xbox 360 console gaming systems. Net revenue from digital online channels increased to 42.0% of our total net revenue for the fiscal year ended March 31, 2015 as compared to 15.8% in the prior fiscal year. Recurrent consumer spending (including add-on content, microtransactions and online play) represented 49.4% and 40.4% of net revenue from digital online channels for the fiscal years ended March 31, 2015 and 2014, respectively.
Gross profit as a percentage of net revenue was 26.6% for the fiscal year ended March 31, 2015, a decrease of 13.2 percentage points as compared to the prior year, primarily due to higher software development costs and royalties as a percentage of net revenue and the deferral of net revenue and cost of goods sold related to sell-in of certain titles during the second half of our fiscal year 2015. In addition, internal royalties were higher as a percentage of net revenues due to the timing of when internal royalties are earned.
Net revenue earned outside of the United States accounted for 42.5% of our total net revenue for the fiscal year ended March 31, 2015, as compared to 53.5% in the prior year. The year-over-year percentage decrease was primarily due to Grand Theft Auto V, which generated higher sales outside of the United States during the fiscal year ended March 31, 2014. Foreign currency exchange rates decreased net revenue by $14.4 million and decreased gross profit by $8.2 million for the fiscal year ended March 31, 2015.
41
Operating Expenses
| (thousands of dollars) | 2015 | % of net revenue | 2014 | % of net revenue |
Increase/ (decrease) |
% Increase/ (decrease) |
|||||||||||||
|---|---|---|---|---|---|---|---|---|---|---|---|---|---|---|---|---|---|---|---|
Selling and marketing |
$ | 235,341 | 21.7 | % | $ | 240,996 | 10.2 | % | $ | (5,655 | ) | (2.3 | )% | ||||||
General and administrative |
175,093 | 16.2 | % | 161,374 | 6.9 | % | 13,719 | 8.5 | % | ||||||||||
Research and development |
115,043 | 10.6 | % | 105,256 | 4.5 | % | 9,787 | 9.3 | % | ||||||||||
Depreciation and amortization |
21,057 | 2.0 | % | 13,359 | 0.6 | % | 7,698 | 57.6 | % | ||||||||||
| | | | | | | | | | | | | | | | | | | | |
Total operating expenses(1) |
$ | 546,534 | 50.5 | % | $ | 520,985 | 22.2 | % | $ | 25,549 | 4.9 | % | |||||||
| | | | | | | | | | | | | | | | | | | | |
| | | | | | | | | | | | | | | | | | | | |
| | | | | | | | | | | | | | | | | | | | |
- (1)
- Includes stock-based compensation expense, which was allocated as follows (in thousands):
| |
2015 | |
2014 | |
|
|
|||||||||||||
|---|---|---|---|---|---|---|---|---|---|---|---|---|---|---|---|---|---|---|---|
Selling and marketing |
$ 8,798 | $10,136 | |||||||||||||||||
General and administrative |
$33,636 | $28,991 | |||||||||||||||||
Research and development |
$ 5,691 | $ 8,867 | |||||||||||||||||
Foreign currency exchange rates decreased total operating expenses by approximately $4.3 million in the fiscal year ended March 31, 2015 as compared to the prior year.
Selling and marketing
Selling and marketing expenses decreased by $5.7 million for the fiscal year ended March 31, 2015, as compared to the prior year, primarily due to $20.7 million in higher advertising expenses incurred in the prior year for the releases of Grand Theft Auto V on Sony's PS3 and Microsoft's Xbox 360 gaming consoles in September 2013, and The Bureau: XCOM: Declassified in August 2013, which were partially offset by advertising expenses incurred in the current year for the releases of Grand Theft Auto V on Sony's PS4 and Microsoft's Xbox One gaming consoles in November 2014, and Borderlands: The Pre-Sequel and Sid Meier's Civilization: Beyond Earth in October 2014. Partially offsetting the overall decrease in selling and marketing expenses was $8.2 million in higher customer service costs and $6.0 million of higher incentive compensation based on label performance.
General and administrative
General and administrative expenses increased $13.7 million for the fiscal year ended March 31, 2015, as compared to the prior year primarily due to $9.0 million of higher expense related to our compensation of Zelnick Media which was predominantly stock based compensation expense resulting from the Company's relative stock price performance during fiscal year 2015 as well as $2.6 million of higher rent expense.
General and administrative expenses for the fiscal years ended March 31, 2015 and 2014 include occupancy expense (primarily rent, utilities and office expenses) of $17.9 million and $16.4 million, respectively, related to our development studios.
Research and development
Research and development expenses increased $9.8 million for the fiscal year ended March 31, 2015, as compared to the prior year primarily due to an increase of $3.9 million in IT spend on equipment at our development studios, higher personnel costs of $1.4 million, higher studio support costs of $1.4 million and higher occupancy related costs of $1.3 million.
Depreciation and amortization
Depreciation and amortization expenses increased $7.7 million for the fiscal year ended March 31, 2015, as compared to the prior year, primarily due to higher purchases of fixed assets for studio build-outs and information technology infrastructure.
42
Interest and other, net
| (thousands of dollars) | 2015 | % of net revenue |
2014 | % of net revenue |
(Increase)/ decrease |
% Increase/ (decrease) |
|||||||||||||
|---|---|---|---|---|---|---|---|---|---|---|---|---|---|---|---|---|---|---|---|
Interest income (expense), net |
$ | (29,901 | ) | (2.7 | )% | $ | (33,961 | ) | (1.4 | )% | $ | 4,060 | (12.0 | )% | |||||
Foreign exchange loss |
(2,068 | ) | (0.2 | )% | 209 | 0.0 | % | (2,277 | ) | (1089.5 | )% | ||||||||
Other |
76 | 0.0 | % | 199 | 0.0 | % | (123 | ) | (61.8 | )% | |||||||||
| | | | | | | | | | | | | | | | | | | | |
Interest and other, net |
$ | (31,893 | ) | (2.9 | )% | $ | (33,553 | ) | (1.4 | )% | $ | 1,660 | (4.9 | )% | |||||
| | | | | | | | | | | | | | | | | | | | |
| | | | | | | | | | | | | | | | | | | | |
| | | | | | | | | | | | | | | | | | | | |
Interest and other, net was an expense of $31.9 million for the fiscal year ended March 31, 2015, as compared to an expense of $33.6 million for the fiscal year ended March 31, 2014. The decrease of $1.7 million in interest and other, net was primarily related to a net decrease of $4.1 million in interest expense primarily due to the redemption of our 4.375% Convertible Notes in August 2013, partially offset by interest on the 1.00% Convertible Notes issued in June 2013. This decrease was partially offset by an increase of $2.3 million due to greater foreign currency exchange losses recorded during the fiscal year ended March 31, 2015.
Gain on long-term investments, net
During the fiscal year ended March 31, 2015 the Company recognized a $17.5 million net gain on long-term investments, which was primarily comprised of the Company's sale of its investment in Twitch Interactive, Inc.'s ("Twitch") Class C Preferred stock, which was accounted for under the cost method of accounting. In September 2014, the Company recognized a pretax gain of $19.0 million in connection with the sale of Twitch.
Loss on extinguishment of debt
Loss on extinguishment of debt was $9.0 million for the fiscal year ended March 31, 2014 due to the conversion and redemption of our 4.375% Convertible Notes in August 2013. See "Liquidity and Capital Resources" for additional information regarding loss on extinguishment of debt.
Gain on convertible note hedge and warrants, net
Gain on convertible note hedge and warrants, net was $3.5 million for the fiscal year ended March 31, 2014 due to the increase in the Company's share price during the period from June 2013 to the date of the net settlement of the hedge and warrants in August 2013. See "Liquidity and Capital Resources" for additional information regarding settlement and related net gain on the convertible note hedge and warrant transactions.
Provision for income taxes
Income tax expense was $6.6 million for the fiscal year ended March 31, 2015, as compared to $14.5 million for the fiscal year ended March 31, 2014. The decrease in income tax expense is primarily attributable to a decrease in net income. Our effective tax rate differed from the federal statutory rate primarily due to changes in valuation allowances related to tax losses and tax credit carryforwards and due to the mix of earnings in our foreign entities, which are taxed at a rate other than the U.S. statutory rate of 35%. Our valuation allowances increased by $92.7 million during the fiscal year ended March 31, 2015 and decreased by $92.1 million during the fiscal year ended March 31, 2014 due to changes in net operating loss and tax credit carryforwards.
As of March 31, 2015, we had gross unrecognized tax benefits, including interest and penalties, of $42.7 million, of which $29.2 million would affect our effective tax rate if realized. For the fiscal year ended
43
March 31, 2015, gross unrecognized tax benefits increased by $17.8 million, which primarily relates to an increase in uncertain tax position for certain tax credits in domestic jurisdictions.
We generally are no longer subject to audit for U.S. federal income tax returns for periods prior to our fiscal year ended March 31, 2011 and state income tax returns for periods prior to the fiscal year ended October 31, 2010. With few exceptions, we are no longer subject to income tax examinations in non-U.S. jurisdictions for years prior to fiscal year ended October 31, 2010. U.S. federal taxing authorities have completed their audit through the fiscal years ended October 31, 2009. Certain U.S. state taxing authorities are currently examining our income tax returns from fiscal years ended March 31, 2011 through March 31, 2013. The determination as to further adjustments to our gross unrecognized tax benefits during the next 12 months is not practicable.
We are regularly audited by domestic and foreign taxing authorities. Audits may result in tax assessments in excess of amounts claimed and the payment of additional taxes. We believe that our tax positions comply with applicable tax law, and that we have adequately provided for reasonably foreseeable tax assessments.
Net income (loss) and earnings (loss) per share
For the fiscal year ended March 31, 2015, our net loss was $279.5 million, as compared to net income of $361.6 million in the prior year. Basic and diluted loss per share for the fiscal year ended March 31, 2015 was $3.48, as compared to basic earnings per share of $3.79 and diluted earnings per share of $3.20 for the fiscal year ended March 31, 2014. Basic and diluted weighted average shares outstanding were lower compared to the prior fiscal year primarily due to the repurchase of 16.2 million shares during the fiscal year ended March 31, 2014 and due to Convertible Notes shares being anti-dilutive in the current period, partially offset by vesting of restricted stock awards. See Note 1 to our consolidated financial statements for additional information regarding earnings (loss) per share.
Fiscal Years Ended March 31, 2014 and 2013
| (thousands of dollars) | 2014 | % | 2013 | % | Increase/ (decrease) |
% Increase/ (decrease) |
|||||||||||||
|---|---|---|---|---|---|---|---|---|---|---|---|---|---|---|---|---|---|---|---|
Net revenue |
$ | 2,350,568 | 100.0 | % | $ | 1,214,483 | 100.0 | % | $ | 1,136,085 | 93.5 | % | |||||||
Internal royalties |
538,604 | 22.9 | % | 24,724 | 2.0 | % | 513,880 | 2078.5 | % | ||||||||||
Product costs |
477,861 | 20.3 | % | 316,072 | 26.0 | % | 161,789 | 51.2 | % | ||||||||||
Software development costs and royalties(1) |
333,450 | 14.2 | % | 317,756 | 26.2 | % | 15,694 | 4.9 | % | ||||||||||
Licenses |
64,412 | 2.8 | % | 57,285 | 4.7 | % | 7,127 | 12.4 | % | ||||||||||
| | | | | | | | | | | | | | | | | | | | |
Cost of goods sold |
1,414,327 | 60.2 | % | 715,837 | 58.9 | % | 698,490 | 97.6 | % | ||||||||||
| | | | | | | | | | | | | | | | | | | | |
Gross profit |
$ | 936,241 | 39.8 | % | $ | 498,646 | 41.1 | % | $ | 437,595 | 87.8 | % | |||||||
| | | | | | | | | | | | | | | | | | | | |
| | | | | | | | | | | | | | | | | | | | |
| | | | | | | | | | | | | | | | | | | | |
- (1)
- Includes $30,124 and $10,060 of stock-based compensation expense in 2014 and 2013, respectively.
Net revenue increased $1,136.1 million for the fiscal year ended March 31, 2014 as compared to the prior year. This increase was primarily due to an increase of approximately $1,481.5 million in sales from our Grand Theft Auto franchise, primarily related to the releases of Grand Theft Auto V on Sony's PS3 and Microsoft's Xbox 360, and higher sales of $139.5 million mainly driven by the October 2013 release of WWE 2K14 and higher sales of our NBA 2K franchise. These increases were partially offset by a $446.0 million decrease in net sales, as the prior year benefitted from the releases of Borderlands 2, Max Payne 3, BioShock Infinite, XCOM: Enemy Unknown and Spec Ops: The Line.
44
Net revenue on consoles increased to 91.4% of our total net revenue for the fiscal year ended March 31, 2014 as compared to 80.4% for the same period in the prior year primarily due to the current year release of Grand Theft Auto V on Microsoft's Xbox 360 and Sony's PS3 console gaming systems. PC and other sales decreased to $192.4 million or 8.2% of our total net revenue for the fiscal year ended March 31, 2014 as compared to $216.3 million or 17.8% for the prior year. The decrease was primarily due to the prior year PC release of Borderlands 2. Handheld sales decreased to $9.7 million or 0.4% of our total net revenue for the fiscal year ended March 31, 2014 as compared to $22.2 million, or 1.8% for the prior year primarily due to the prior year releases of various Nick Jr. titles.
Net revenue from physical retail and other channels increased to 84.2% of our total net revenue for the fiscal year ended March 31, 2014 as compared to 78.9% for the same period in the prior year, primarily due to the current year release of Grand Theft Auto V on Microsoft's Xbox 360 and Sony's PS3 console gaming systems. Net revenue from digital online channels of $372.0 million for the fiscal year ended March 31, 2014 increased $115.8 million, or 45.2%, as compared to the same period in the prior year. The increase was mainly driven by digital offerings from our Grand Theft Auto and NBA 2K franchises as well as Bioshock Infinite.
Gross profit as a percentage of net revenue was 39.8% for the fiscal year ended March 31, 2014, a decrease of 1.3 percentage points as compared to the prior year, primarily due to higher internal royalties mainly due to higher income generated from our Grand Theft Auto franchise, partially offset by (i) lower product costs in the current year as a percentage of net revenue as a result of a greater share of net revenue in the current year being generated from a product mix with higher average selling price points and (ii) lower software development costs and royalties as a percentage of net revenue for the fiscal year ended March 31, 2014, primarily due to the prior year release of Borderlands 2, which was externally developed.
Net revenue earned outside of the United States accounted for 53.5% of our total net revenue for the fiscal year ended March 31, 2014, as compared to 41.5% in the prior year. The year-over-year percentage increase was primarily due to the global release of Grand Theft Auto V, which generated higher sales outside the United States during the fiscal year ended March 31, 2014. Foreign currency exchange rates decreased net revenue and decreased gross profit by $5.7 million and $2.3 million, respectively, for the fiscal year ended March 31, 2014 as compared to the prior year.
Operating Expenses
| (thousands of dollars) | 2014 | % of net revenue |
2013 | % of net revenue |
Increase/ (decrease) |
% Increase/ (decrease) |
|||||||||||||
|---|---|---|---|---|---|---|---|---|---|---|---|---|---|---|---|---|---|---|---|
Selling and marketing |
$ | 240,996 | 10.2 | % | $ | 257,329 | 21.2 | % | $ | (16,333 | ) | (6.3 | )% | ||||||
General and administrative |
161,374 | 6.9 | % | 147,260 | 12.1 | % | 14,114 | 9.6 | % | ||||||||||
Research and development |
105,256 | 4.5 | % | 78,184 | 6.4 | % | 27,072 | 34.6 | % | ||||||||||
Depreciation and amortization |
13,359 | 0.6 | % | 10,634 | 1.0 | % | 2,725 | 25.6 | % | ||||||||||
| | | | | | | | | | | | | | | | | | | | |
Total operating expenses(1) |
$ | 520,985 | 22.2 | % | $ | 493,407 | 40.7 | % | $ | 27,578 | 5.6 | % | |||||||
| | | | | | | | | | | | | | | | | | | | |
| | | | | | | | | | | | | | | | | | | | |
| | | | | | | | | | | | | | | | | | | | |
- (1)
- Includes stock-based compensation expense, as follows:
| |
2014 | |
2013 | |
|
|
|||||||||||||
|---|---|---|---|---|---|---|---|---|---|---|---|---|---|---|---|---|---|---|---|
Selling and marketing |
$10,136 | $ 5,562 | |||||||||||||||||
General and administrative |
$28,991 | $17,824 | |||||||||||||||||
Research and development |
$ 8,867 | $ 2,319 | |||||||||||||||||
Foreign currency exchange rates increased total operating expenses by approximately $0.4 million in the fiscal year ended March 31, 2014 as compared to the prior year.
45
Selling and marketing
Selling and marketing expenses decreased $16.3 million for the fiscal year ended March 31, 2014, as compared to the prior year, primarily due to a decrease in advertising expenses of $31.5 million. In the prior year, advertising expenses had increased due to the releases of Borderlands 2 in September 2012, Max Payne 3 in May 2012 and BioShock Infinite in March 2013, as compared to expenses incurred for the September 2013 release of Grand Theft Auto V. This net decrease was partially offset by a $14.0 million increase primarily due to higher personnel costs related to stock-based compensation expense and headcount, and higher third-party commissions.
General and administrative
General and administrative expenses increased $14.1 million for the fiscal year ended March 31, 2014, as compared to the prior year, primarily due to an increase of $12.1 million in personnel costs primarily due to higher headcount and higher severance costs related to current year restructuring activities, $11.2 million of higher stock-based compensation expense primarily for previously granted stock-based awards to ZelnickMedia and $5.3 million of higher legal fees and IT-related costs, which were partially offset by the absence of a $15.0 million contractual provision that was triggered in June 2012.
General and administrative expenses for the fiscal years ended March 31, 2014 and 2013 include occupancy expense (primarily rent, utilities and office expenses) of $16.4 million and $15.9 million, respectively, related to our development studios.
Research and development
Research and development expenses increased $27.1 million for the fiscal year ended March 31, 2014, as compared to the prior year, primarily due to an increase of $20.9 million in personnel costs due mainly to higher stock-based compensation related to the current year issuance of restricted stock awards to certain employees and lower capitalization rates at our development studios due mainly to resources being transitioned to new projects following the September 2013 release of Grand Theft Auto V and an increase of $6.6 million in production expenses primarily due to work on titles that have not reached technological feasibility.
Depreciation and amortization
Depreciation and amortization expenses increased $2.7 million for the fiscal year ended March 31, 2014, as compared to the prior year primarily due to higher purchases of fixed assets during recent years.
Interest and other, net
| (thousands of dollars) | 2014 | % of net revenue |
2013 | % of net revenue |
(Increase)/ decrease |
% Increase/ (decrease) |
|||||||||||||
|---|---|---|---|---|---|---|---|---|---|---|---|---|---|---|---|---|---|---|---|
Interest expense, net |
$ | (33,961 | ) | (1.4 | )% | $ | (30,763 | ) | (2.5 | )% | $ | (3,198 | ) | 10.4 | % | ||||
Foreign currency exchange gain (loss) |
209 | 0.0 | % | (778 | ) | (0.1 | )% | 987 | (126.9 | )% | |||||||||
Other |
199 | 0.0 | % | 190 | 0.0 | % | 9 | 4.7 | % | ||||||||||
Interest and other, net |
$ | (33,553 | ) | (1.4 | )% | $ | (31,351 | ) | (2.6 | )% | $ | (2,202 | ) | 7.0 | % | ||||
Interest and other, net was an expense of $33.6 million for the fiscal year ended March 31, 2014, as compared to an expense of $31.4 million for the fiscal year ended March 31, 2013. The increase of $2.2 million in interest and other, net was primarily related to an increase in our long-term debt associated with our June 2013 issuance of $287.5 million of 1.00% Convertible Notes partially offset by the August 29,
46
2013 redemption of our 4.375% Convertible Notes which had an aggregate principal amount of $138.0 million.
Loss on extinguishment of debt
Loss on extinguishment of debt was $9.0 million for the fiscal year ended March 31, 2014 due to the conversion and redemption of our 4.375% Convertible Notes. See "Liquidity and Capital Resources" for additional information regarding loss on extinguishment of debt.
Gain on convertible note hedge and warrants, net
Gain on convertible note hedge and warrants, net was $3.5 million for the fiscal year ended March 31, 2014 due to the increase in the Company's share price during the period from June 2013 to the date of the net settlement of the hedge and warrants in August 2013. See "Liquidity and Capital Resources" for additional information regarding settlement and related net gain on the convertible note hedge and warrant transactions.
Provision for income taxes
Income tax expense was $14.5 million for the fiscal year ended March 31, 2014, as compared to $5.1 million for the fiscal year ended March 31, 2013. The increase in tax expense was primarily attributable to an increase in pre-tax income from operations in excess of remaining net operating losses available in the fiscal year ended March 31, 2014. Our effective tax rate differed from the federal statutory rate primarily due to changes in valuation allowances during the period. Our valuation allowances decreased by $92.1 million and $1.3 million during fiscal years ended March 31, 2014 and 2013, respectively, due to the utilization of net operating loss carryforwards from prior years against income earned during each year.
As of March 31, 2014, we had gross unrecognized tax benefits, including interest and penalties, of $24.9 million, of which $24.9 million would affect our effective tax rate if realized. For the fiscal year ended March 31, 2014, gross unrecognized tax benefits increased by $3.2 million. We are generally no longer subject to audit for U.S. federal income tax returns for periods prior to our fiscal year ended October 31, 2010 and state income tax returns for periods prior to our fiscal year ended October 31, 2007. With few exceptions, we are no longer subject to income tax examinations in non-U.S. jurisdictions for years prior to our fiscal year ended October 31, 2010. U.S. federal taxing authorities have completed their audit through the fiscal years ended October 31, 2009. Certain U.S. state taxing authorities are currently examining our income tax returns from the fiscal years ended October 31, 2007 through October 31, 2010. The determination as to further adjustments to our gross unrecognized tax benefits during the next 12 months is not practicable.
We are regularly audited by domestic and foreign taxing authorities. Audits may result in tax assessments in excess of amounts claimed and the payment of additional taxes. We believe that our tax positions comply with applicable tax law, and that we have adequately provided for reasonably foreseeable tax assessments.
Discontinued operations
Income (loss) from discontinued operations, net of taxes, reflects the results of our former distribution business which was sold in February 2010. For the fiscal year ended March 31, 2014, there was an immaterial net loss from discontinued operations, net of taxes, compared to net income of $1.7 million for the prior year. The net income during the fiscal year ended March 31, 2013 was primarily due to the maturity of a remaining contract and changes in estimates of sublease income as a result of the Company entering into a new sublease.
47
Net income (loss) and earnings (loss) per share
For the fiscal year ended March 31, 2014, our net income was $361.6 million, as compared to a net loss of $29.5 million in the prior year. Earnings per share for the fiscal year ended March 31, 2014 were $3.79 for basic and $3.20 for diluted earnings per share as compared to a loss per share of $0.34 for basic and diluted earnings for the fiscal year ended March 31, 2013. Basic and diluted weighted average shares outstanding were lower compared to the prior year period primarily due to the repurchase of shares during the fiscal year ended March 31, 2014 partially offset by the vesting of restricted stock awards over the last twelve months and the issuance of shares upon the conversion of the 4.375% Convertible Notes. See Note 1 to our consolidated financial statements for additional information regarding earnings (loss) per share.
Liquidity and Capital Resources
Our primary cash requirements have been to fund (i) the development, manufacturing and marketing of our published products, (ii) working capital, (iii) acquisitions and (iv) capital expenditures. We expect to rely on funds provided by our operating activities, our Credit Agreement and our Convertible Notes to satisfy our working capital needs.
Short-term Investments
During the fiscal year ended March 31, 2015, the Company purchased $187.6 million of short-term investments, which are highly liquid in nature and represent an investment of cash that is available for current operations. From time to time, the Company may purchase additional short-term investments depending on future market conditions and liquidity needs.
Credit Agreement
In August 2014, we entered into a Third Amendment to our Credit Agreement. The Credit Agreement provides for borrowings of up to $100.0 million which may be increased by up to $40.0 million pursuant to the terms of the Credit Agreement, and is secured by substantially all of our assets and the equity of our subsidiaries. The Credit Agreement expires on August 18, 2019. Revolving loans under the Credit Agreement bear interest at our election of (a) 0.50% to 1.00% above a certain base rate (3.75% at March 31, 2015), or (b) 1.50% to 2.00% above the LIBOR Rate (approximately 1.76% at March 31, 2015), with the margin rate subject to the achievement of certain average liquidity levels. We are also required to pay a monthly fee on the unused available balance, ranging from 0.25% to 0.375% based on availability. We had no outstanding borrowings at March 31, 2015 and 2014.
Availability under the Credit Agreement is restricted by our United States and United Kingdom based accounts receivable and inventory balances. The Credit Agreement also allows for the issuance of letters of credit in an aggregate amount of up to $5.0 million.
As of March 31, 2015, there was $98.3 million available to borrow under the Credit Agreement. At March 31, 2015, we had no outstanding borrowings under the Credit Agreement and $1.7 million of letters of credit outstanding.
The Credit Agreement contains covenants that substantially limit us and our subsidiaries' ability to: create, incur, assume or be liable for indebtedness; dispose of assets outside the ordinary course of business; acquire, merge or consolidate with or into another person or entity; create, incur or allow any lien on any of their respective properties; make investments; or pay dividends or make distributions (each subject to certain limitations); or optionally prepay any indebtedness (subject to certain exceptions, including an exception permitting the redemption of the Company's unsecured convertible senior notes upon the meeting of certain minimum liquidity requirements). In addition, the Credit Agreement provides for certain events of default such as nonpayment of principal and interest, breaches of representations and warranties, noncompliance with covenants, acts of insolvency, default on indebtedness held by third parties
48
and default on certain material contracts (subject to certain limitations and cure periods). The Credit Agreement also contains a requirement that we maintain an interest coverage ratio of more than one to one for the trailing twelve month period, if certain average liquidity levels fall below $30.0 million. As of March 31, 2015, we were in compliance with all covenants and requirements outlined in the Credit Agreement.
1.75% Convertible Notes Due 2016
On November 16, 2011, we issued $250.0 million aggregate principal amount of 1.75% Convertible Notes due 2016 (the "1.75% Convertible Notes"). Interest on the 1.75% Convertible Notes is payable semi-annually in arrears on June 1st and December 1st of each year, commencing on June 1, 2012. The 1.75% Convertible Notes mature on December 1, 2016, unless earlier repurchased by the Company or converted. The Company does not have the right to redeem the 1.75% Convertible Notes prior to maturity.
The 1.75% Convertible Notes are convertible at an initial conversion rate of 52.3745 shares of our common stock per $1,000 principal amount of 1.75% Convertible Notes (representing an initial conversion price of approximately $19.093 per share of common stock for a total of approximately 13,094,000 underlying conversion shares) subject to adjustment in certain circumstances. Holders may convert the 1.75% Convertible Notes at their option prior to the close of business on the business day immediately preceding June 1, 2016 only under the following circumstances: (1) during any fiscal quarter commencing after March 31, 2012, if the last reported sale price of the common stock for at least 20 trading days (whether or not consecutive) during a period of 30 consecutive trading days ending on the last trading day of the preceding fiscal quarter is greater than or equal to 130% of the applicable conversion price on each applicable trading day; (2) during the five business day period after any 10 consecutive trading day period (the "measurement period") in which the trading price per $1,000 principal amount of 1.75% Convertible Notes for each day of that measurement period was less than 98% of the product of the last reported sale price of our common stock and the applicable conversion rate on each such day; or (3) upon the occurrence of specified corporate events. On and after June 1, 2016 until the close of business on the business day immediately preceding the maturity date, holders may convert their 1.75% Convertible Notes at any time, regardless of the foregoing circumstances. Upon conversion, the 1.75% Convertible Notes may be settled, at our election, in cash, shares of our common stock, or a combination of cash and shares of the Company's common stock. Our common stock price exceeded 130% of the applicable conversion price per share for at least 20 trading days during the 30 consecutive trading days ended March 31, 2015. Accordingly, as of April 1, 2015 the 1.75% Convertible Notes may be converted at the holder's option through June 30, 2015. If the 1.75% Convertible Notes were to be converted during this period, our current intent and ability, given our option, would be to settle the conversion in shares of our common stock. As such, we have continued to classify these 1.75% Convertible Notes as long-term debt.
The indenture governing the 1.75% Convertible Notes contains customary terms and covenants and events of default. As of March 31, 2014, we were in compliance with all covenants and requirements outlined in the indenture governing the 1.75% Convertible Notes.
1.00% Convertible Notes Due 2018
On June 18, 2013, we issued $250.0 million aggregate principal amount of 1.00% Convertible Notes due 2018 (the "1.00% Convertible Notes" and together with the 1.75% Convertible Notes, the "Convertible Notes"). The 1.00% Convertible Notes were issued at 98.5% of par value for proceeds of $246.3 million. Interest on the 1.00% Convertible Notes is payable semi-annually in arrears on July 1st and January 1st of each year, commencing on January 1, 2014. The 1.00% Convertible Notes mature on July 1, 2018, unless earlier repurchased by the Company or converted. The Company does not have the right to redeem the 1.00% Convertible Notes prior to maturity. The Company also granted the underwriters a 30-day option to purchase up to an additional $37.5 million principal amount of 1.00% Convertible Notes to cover
49
overallotments, if any. On July 17, 2013, the Company closed its public offering of $37.5 million principal amount of the Company's 1.00% Convertible Notes as a result of the underwriters exercising their overallotment option in full on July 12, 2013, bringing the proceeds to $283.2 million.
The 1.00% Convertible Notes are convertible at an initial conversion rate of 46.4727 shares of our common stock per $1,000 principal amount of 1.00% Convertible Notes (representing an initial conversion price of approximately $21.52 per share of common stock for a total of approximately 13,361,000 underlying conversion shares) subject to adjustment in certain circumstances. Holders may convert the 1.00% Convertible Notes at their option prior to the close of business on the business day immediately preceding January 1, 2018 only under the following circumstances: (1) during any fiscal quarter commencing after September 30, 2013, if the last reported sale price of the common stock for at least 20 trading days (whether or not consecutive) during a period of 30 consecutive trading days ending on the last trading day of the preceding fiscal quarter is greater than or equal to 130% of the applicable conversion price on each applicable trading day; (2) during the five business day period after any 10 consecutive trading day period (the "measurement period") in which the trading price per $1,000 principal amount of 1.00% Convertible Notes for each day of that measurement period was less than 98% of the product of the last reported sale price of our common stock and the applicable conversion rate on each such day; or (3) upon the occurrence of specified corporate events. On and after January 1, 2018 until the close of business on the business day immediately preceding the maturity date, holders may convert their 1.00% Convertible Notes at any time, regardless of the foregoing circumstances. Upon conversion, the 1.00% Convertible Notes may be settled, at our election, in cash, shares of our common stock, or a combination of cash and shares of the Company's common stock.
The indenture governing the 1.00% Convertible Notes contains customary terms and covenants and events of default. As of the fiscal year end March 31, 2014, we were in compliance with all covenants and requirements outlined in the indenture governing the 1.00% Convertible Notes.
Financial Condition
We are subject to credit risks, particularly if any of our receivables represent a limited number of customers or are concentrated in foreign markets. If we are unable to collect our accounts receivable as they become due, it could adversely affect our liquidity and working capital position.
Generally, we have been able to collect our accounts receivable in the ordinary course of business. We do not hold any collateral to secure payment from customers. We have trade credit insurance on the majority of our customers to mitigate accounts receivable risk.
A majority of our trade receivables are derived from sales to major retailers and distributors. Our five largest customers accounted for 64.6%, 39.4% and 52.5% of net revenue during the fiscal years ended March 31, 2015, 2014 and 2013, respectively. As of March 31, 2015 and 2014, five customers accounted for 63.9% and 68.3% of our gross accounts receivable, respectively. Customers that individually accounted for more than 10% of our gross accounts receivable balance comprised 54.5% and 59.8% of such balances at March 31, 2015 and 2014, respectively. We had three customers who accounted for approximately 18.5%, 18.4% and 17.6% of our gross accounts receivable as of March 31, 2015 and three customers who accounted for 22.6%, 22.3% and 14.9% of our gross accounts receivable as of March 31, 2014. We did not have any additional customers that exceeded 10% of our gross accounts receivable as of March 31, 2015 and 2014. Based upon performing ongoing credit evaluations, maintaining trade credit insurance on a majority of our customers and our past collection experience, we believe that the receivable balances from these largest customers do not represent a significant credit risk, although we actively monitor each customer's credit worthiness and economic conditions that may affect our customers' business and access to capital. We are monitoring the current global economic conditions, including credit markets and other factors as it relates to our customers in order to manage the risk of uncollectible accounts receivable.
50
We believe our current cash and cash equivalents and projected cash flow from operations, along with availability under our Credit Agreement will provide us with sufficient liquidity to satisfy our cash requirements for working capital, capital expenditures and commitments through at least the next 12 months.
As of March 31, 2015, the amount of cash and cash equivalents held outside of the U.S. by our foreign subsidiaries was approximately $291.0 million. These balances are dispersed across various locations around the world. We believe that such dispersion meets the business and liquidity needs of our foreign affiliates. In addition, the Company expects in the foreseeable future to have the ability to generate sufficient cash domestically to support ongoing operations. Consequently, it is the Company's intention to indefinitely reinvest undistributed earnings of its foreign subsidiaries. In the event the Company needed to repatriate funds outside of the U.S., such repatriation may be subject to local laws and tax consequences including foreign withholding taxes or U.S. income taxes. It is not practicable to estimate the tax liability and the Company would try to minimize the tax effect to the extent possible. However, any repatriation may not result in significant cash payments as the taxable event would likely be offset by the utilization of the then available tax credits.
In January 2013, our Board of Directors authorized the repurchase of up to 7,500,000 shares of our common stock. The authorization permits the Company to purchase shares from time to time through a variety of methods, including in the open market or through privately negotiated transactions, in accordance with applicable securities laws. It does not obligate the Company to make any purchases at any specific time or situation. Repurchases are subject to the availability of stock, prevailing market conditions, the trading price of the stock, the Company's financial performance and other conditions. The program may be suspended or discontinued at any time for any reason. The Company did not repurchase any shares during fiscal year ended March 31, 2015. During the fiscal year ended March 31, 2014, the Company repurchased approximately 4,217,000 shares of our common stock in the open market for approximately $73.3 million, including commissions of approximately $0.04 million, as part of the program. As of March 31, 2015, up to approximately 3,283,000 shares of our common stock remain available for repurchase under the Company's share repurchase authorization. On May 13, 2015, our Board of Directors approved an increase to the share repurchase authorization, increasing the total number of shares that the Company is permitted to repurchase to up to 10,000,000 shares of our common stock.
Our changes in cash flows were as follows:
| |
Fiscal Year Ended March 31, | |||||||||
|---|---|---|---|---|---|---|---|---|---|---|
| (thousands of dollars) | 2015 | 2014 | 2013 | |||||||
Net cash provided by operating activities |
$ | 212,814 | $ | 700,262 | $ | (4,567 | ) | |||
Net cash used in investing activities |
(220,141 | ) | (30,813 | ) | (16,820 | ) | ||||
Net cash provided by (used in) financing activities |
928 | (133,684 | ) | — | ||||||
Effects of foreign currency exchange rates on cash and cash equivalents |
(17,881 | ) | (2,867 | ) | 3,610 | |||||
Net (decrease) increase in cash and cash equivalents |
$ | (24,280 | ) | $ | 532,898 | $ | (17,777 | ) | ||
At March 31, 2015 we had $911.1 million of cash and cash equivalents, compared to $935.4 million at March 31, 2014. The decrease in cash and cash equivalents from March 31, 2014 was primarily due to cash being used in investing activities partially offset by cash provided by operating activities. Net cash used in investing activities related to purchases of short-term investments and purchases of fixed assets and was partially offset by the proceeds received from the sale of our long-term investment. Net cash provided by operations was primarily due to cash generated from the sale of Grand Theft Auto V on Sony's PS4 and Microsoft's Xbox One platforms, the sale of Evolve and the sale virtual currency partially offset by investments in software development and licenses.
51
Contractual Obligations and Commitments
We have entered into various agreements in the ordinary course of business that require substantial cash commitments over the next several years. Generally, these include:
- •
- Software Development and Licensing: We make payments to
third-party software developers that include contractual payments to developers under several software development agreements that expire at various times through September 2019. Our aggregate
outstanding software development commitments assume satisfactory performance by third-party software developers. We also have licensing commitments that primarily consist of obligations to holders of
intellectual property rights for use of their trademarks, copyrights, technology or other intellectual property rights in the development of our products.
- •
- Marketing: We have certain minimum marketing support
commitments where we commit to spend specified amounts related to marketing our products. Marketing commitments expire at various times through September 2019.
- •
- Operating Leases: Our offices are occupied under
non-cancelable operating leases expiring at various times through June 2024. We also lease certain furniture, equipment and automobiles under non-cancelable leases expiring through fiscal year 2020.
Some of the leases have fixed rent increases and also include inducements to enter into the lease. The effect of such amounts are deferred and recognized on a straight-line basis over the related
lease term.
- •
- Purchase obligations primarily related to agreements to purchase services that are enforceable and legally binding on the Company that specifies all significant terms, including fixed, minimum or variable pricing provisions; and the approximate timing of the transactions, expiring at various times through March 2019.
A summary of annual minimum contractual obligations and commitments as of March 31, 2015 is as follows (in thousands of dollars):
| Fiscal Year Ending March 31, | Software Development and Licensing |
Marketing | Operating Leases |
Purchase Obligations |
Convertible Notes Interest |
Convertible Notes |
Total | |||||||||||||||
|---|---|---|---|---|---|---|---|---|---|---|---|---|---|---|---|---|---|---|---|---|---|---|
2016 |
$ | 81,612 | $ | 24,591 | $ | 19,558 | $ | 21,556 | $ | 7,250 | $ | — | $ | 154,567 | ||||||||
2017 |
62,320 | 5,675 | 17,007 | 12,207 | 7,250 | 250,000 | 354,459 | |||||||||||||||
2018 |
48,011 | 4,717 | 15,255 | 5,543 | 2,875 | — | 76,401 | |||||||||||||||
2019 |
27,204 | 43,423 | 15,452 | 1,593 | 1,438 | 287,500 | 376,610 | |||||||||||||||
2020 |
8,200 | 9,500 | 11,092 | — | — | — | 28,792 | |||||||||||||||
Thereafter |
— | — | 36,727 | — | — | — | 36,727 | |||||||||||||||
Total |
$ | 227,347 | $ | 87,906 | $ | 115,091 | $ | 40,899 | $ | 18,813 | $ | 537,500 | $ | 1,027,556 | ||||||||
In addition to the cash commitments above, we have also entered into acquisition agreements that contain provisions for us to pay contingent cash consideration, typically contingent on the acquired company achieving certain financial, unit sales, or performance conditions. The amount and timing of these payments are currently not fixed or determinable. See Note 11 to the Consolidated Financial Statements for a full discussion of our potential acquisition commitments.
Income Taxes. At March 31, 2015, the Company had recorded a liability for gross unrecognized tax benefits, including interest and penalties, of $29.2 million for which we are unable to make a reasonable and reliable estimate of the period in which these liabilities will be settled with the respective tax authorities, therefore, these liabilities have not been included in the contractual obligations table.
52
Off-Balance Sheet Arrangements
As of March 31, 2015 and 2014, we did not have any material relationships with unconsolidated entities or financial parties, such as entities often referred to as structured finance or variable interest entities, which would have been established for the purpose of facilitating off-balance sheet arrangements or other contractually narrow or limited purposes. As such, we are not exposed to any financing, liquidity, market or credit risk that could arise if we had engaged in such relationships.
Net revenue earned outside of the United States is principally generated by our operations in Europe, Asia, Australia, Canada and Latin America. For the fiscal years ended March 31, 2015, 2014 and 2013, approximately 42.5%, 53.5% and 41.5%, respectively, of our net revenue was earned outside the United States. We are subject to risks inherent in foreign trade, including increased credit risks, tariffs and duties, fluctuations in foreign currency exchange rates, shipping delays and international political, regulatory and economic developments, all of which can have a significant effect on our operating results.
Fluctuations in Quarterly Operating Results and Seasonality
We have experienced fluctuations in quarterly operating results as a result of the timing of the introduction of new titles; variations in sales of titles developed for particular platforms; market acceptance of our titles; development and promotional expenses relating to the introduction of new titles; sequels or enhancements of existing titles; projected and actual changes in platforms; the timing and success of title introductions by our competitors; product returns; changes in pricing policies by us and our competitors; the accuracy of retailers' forecasts of consumer demand; the size and timing of acquisitions; the timing of orders from major customers; and order cancellations and delays in product shipment. Sales of our titles are also seasonal, with peak shipments typically occurring in the fourth calendar quarter as a result of increased demand for titles during the holiday season. Quarterly comparisons of operating results are not necessarily indicative of future operating results.
53
Item 7A. Quantitative and Qualitative Disclosures About Market Risk
Market risk is the potential loss arising from fluctuations in market rates and prices. Our market risk exposures primarily include fluctuations in interest rates and foreign currency exchange rates.
Interest Rate Risk
Historically, fluctuations in interest rates have not had a significant effect on our operating results. Under our Credit Agreement, outstanding balances bear interest at our election of (a) 0.50% to 1.00% above a certain base rate (3.75% at March 31, 2015), or (b) 1.50% to 2.00% above the LIBOR rate (approximately 1.76% at March 31, 2015), with the margin rate subject to the achievement of certain average liquidity levels. Changes in market rates may affect our future interest expense if there is an outstanding balance on our line of credit. The 1.75% Convertible Notes and the 1.00% Convertible Notes pay interest semi-annually at a fixed rate of 1.75% and 1.00%, respectively, per annum and we expect that there will be no fluctuation related to the Convertible Notes affecting our cash component of interest expense. For additional details on our Convertible Notes see Note 10 to our Consolidated Financial Statements.
Foreign Currency Exchange Rate Risk
We transact business in foreign currencies and are exposed to risks resulting from fluctuations in foreign currency exchange rates. Accounts relating to foreign operations are translated into United States dollars using prevailing exchange rates at the relevant period end. Translation adjustments are included as a separate component of stockholders' equity. For the fiscal year ended March 31, 2015 and 2014, our foreign currency translation adjustment was approximately $32.7 million loss and $6.4 million gain, respectively. We recognized a foreign currency exchange transaction loss of $2.1 million for the fiscal year ended March 31, 2015, a foreign currency gain of $0.2 million for the fiscal year ended March 31, 2014, and a foreign currency exchange transaction loss for the fiscal year ended March 31, 2013 of $0.8 million, in interest and other, net in our Consolidated Statements of Operations.
Cash Flow Hedging Activities
We use foreign currency forward contracts to mitigate foreign currency exchange rate risk associated with forecasted transactions involving non-functional currency denominated expenditures. These contracts, which are designated and qualify as cash flow hedges, are accounted for as derivatives whereby the fair value of the contracts is reported as either assets or liabilities on our Consolidated Balance Sheets. The effective portion of gains or losses resulting from changes in the fair value of these hedges is initially reported, net of tax, as a component of accumulated other comprehensive income (loss) in stockholders' equity. The gross amount of the effective portion of gains or losses resulting from changes in the fair value of these hedges is subsequently reclassified into cost of goods sold or research and development expenses, as appropriate, in the period when the forecasted transaction is recognized in our Consolidated Statements of Operations. In the event that the gains or losses in accumulated other comprehensive income (loss) are deemed to be ineffective, the ineffective portion of gains or losses resulting from changes in fair value, if any, is reclassified to interest and other, net, in our Consolidated Statements of Operations. In the event that the underlying forecasted transactions do not occur, or it becomes probable that they will not occur, within the defined hedge period, the gains or losses on the related cash flow hedges are reclassified from accumulated other comprehensive income (loss) to interest and other, net, in our Consolidated Statements of Operations. During the reporting periods presented, all forecasted transactions occurred, and therefore, there were no such gains or losses reclassified into interest and other, net. We do not enter into derivative financial contracts for speculative or trading purposes. At March 31, 2015 we did not have cash flow hedging contracts outstanding and at March 31, 2014, we had $0.9 million, of forward contracts outstanding to buy foreign currencies in exchange for U.S. dollars all of which had maturities of less than one year. As of March 31, 2014, the fair value of these outstanding forward contracts was immaterial and is
54
included in prepaid expenses and other. The fair value of these outstanding forward contracts is estimated based on the prevailing exchange rates of the various hedged currencies as of the end of the period.
Balance Sheet Hedging Activities
We use foreign currency forward contracts to mitigate foreign currency exchange rate risk associated with non-functional currency denominated cash balances and inter-company funding loans, non-functional currency denominated accounts receivable and non-functional currency denominated accounts payable. These transactions are not designated as hedging instruments and are accounted for as derivatives whereby the fair value of the contracts is reported as either assets or liabilities on our Consolidated Balance Sheets, and gains and losses resulting from changes in the fair value are reported in interest and other, net, in our Consolidated Statements of Operations. We do not enter into derivative financial contracts for speculative or trading purposes. At March 31, 2015, we had $4.1 million of forward contracts outstanding to buy foreign currencies in exchange for U.S. dollars and $72.5 million of forward contracts outstanding to sell foreign currencies in exchange for U.S. dollars all of which have maturities of less than one year. At March 31, 2014, we had $68.5 million of forward contracts outstanding to sell foreign currencies in exchange for U.S. dollars all of which have maturities of less than one year. For the fiscal years ended March 31, 2015, 2014 and 2013, we recorded a gain of $18.5 million, a loss of $18.4 million and a gain of $2.2 million, respectively, related to foreign currency forward contracts in interest and other, net on the Consolidated Statements of Operations. As of March 31, 2015 the fair value of these outstanding forward contracts was a loss of $0.6 million and as of March 31, 2014 was immaterial and is included in prepaid expenses and other. The fair value of these outstanding forward contracts is estimated based on the prevailing exchange rates of the various hedged currencies as of the end of the period.
Our hedging programs are designed to reduce, but do not entirely eliminate, the effect of currency exchange rate movements. We believe the counterparties to these foreign currency forward contracts are creditworthy multinational commercial banks and that the risk of counterparty nonperformance is not material. Notwithstanding our efforts to mitigate some foreign currency exchange rate risks, there can be no assurance that our hedging activities will adequately protect us against the risks associated with foreign currency fluctuations. For the fiscal year ended March 31, 2015, 42.5% of the Company's revenue was generated outside the United States. Using sensitivity analysis, a hypothetical 10% increase in the value of the U.S. dollar against all currencies would decrease revenues by 4.3%, while a hypothetical 10% decrease in the value of the U.S. dollar against all currencies would increase revenues by 4.3%. In the opinion of management, a substantial portion of this fluctuation would be offset by cost of goods sold and operating expenses incurred in local currency.
Item 8. Financial Statements and Supplementary Data
The financial statements and supplementary data appear in a separate section of this report following Part IV. We provide details of our valuation and qualifying accounts in "Note 17—Supplementary Financial Information" to the Consolidated Financial Statements. All schedules have been omitted since the information required to be submitted has been included on the Consolidated Financial Statements or notes thereto or has been omitted as not applicable or not required.
Item 9. Changes in and Disagreements with Accountants on Accounting and Financial Disclosure
None.
55
Item 9A. Controls and Procedures
Definition and Limitations of Disclosure Controls and Procedures
Our disclosure controls and procedures (as defined in Rules 13a-15(e) and 15d-15(e) under the Securities Exchange Act of 1934, as amended (the "Exchange Act")) are designed to reasonably ensure that information required to be disclosed in our reports filed under the Exchange Act is (i) recorded, processed, summarized, and reported within the time periods specified in the Securities and Exchange Commission's rules and forms and (ii) accumulated and communicated to management, including our principal executive officer and principal financial officer, as appropriate, to allow timely decisions regarding required disclosures.
There are inherent limitations to the effectiveness of any system of disclosure controls and procedures. These limitations include the possibility of human error, the circumvention or overriding of the controls and procedures and reasonable resource constraints. In addition, because we have designed our system of controls based on certain assumptions, which we believe are reasonable, about the likelihood of future events, our system of controls may not achieve its desired purpose under all possible future conditions. Accordingly, our disclosure controls and procedures provide reasonable assurance, but not absolute assurance, of achieving their objectives.
Evaluation of Disclosure Controls and Procedures
Our management, with the participation of our principal executive officer and principal financial officer, has evaluated the effectiveness of our disclosure controls and procedures at March 31, 2015, the end of the period covered by this report. Based on this evaluation, the principal executive officer and principal financial officer concluded that, at March 31, 2015, our disclosure controls and procedures were effective to provide reasonable assurance that information required to be disclosed by the Company in the reports that it files or submits under the Exchange Act is (i) recorded, processed, summarized, and reported on a timely basis, and (ii) accumulated and communicated to management, including our principal executive officer and principal financial officer, as appropriate to allow timely decisions regarding required disclosures.
Management's Report on Internal Control Over Financial Reporting
Our management is responsible for establishing and maintaining adequate internal control over financial reporting (as defined in Rule 13a-15(f) under the Exchange Act). Management conducted an evaluation of the effectiveness of our internal control over financial reporting based on the criteria set forth in Internal Control—Integrated Framework issued by the Committee of Sponsoring Organizations of the Treadway Commission 2013 framework ("COSO"). Based on this evaluation, management has concluded that our internal control over financial reporting was effective as of March 31, 2015.
Our independent registered public accounting firm, Ernst & Young LLP, has issued an audit report on our internal control over financial reporting. The report on the audit of internal control over financial reporting is included in this Form 10-K.
Changes in Internal Control Over Financial Reporting
There were no changes in our internal control over financial reporting during the fiscal quarter ended March 31, 2015, which were identified in connection with management's evaluation required by paragraph (d) of Rules 13a-15 and 15d-15 under the Exchange Act, that have materially affected, or are reasonably likely to materially affect, our internal control over financial reporting.
None.
56
Item 10. Directors, Executive Officers and Corporate Governance
The information required by this Item is incorporated herein by reference to the sections entitled "Proposal 1—Election of Directors" and "Executive Compensation—Section 16(a) Beneficial Ownership Reporting Compliance" in the Company's definitive Proxy Statement (the "Proxy Statement") for the Annual Meeting of Stockholders to be held in 2015. The Company intends to file the Proxy Statement within 120 days after the end of the fiscal year (i.e. on or before July 29, 2015). The Company's Code of Business Conduct and Ethics applicable to its directors and all employees, including senior financial officers, is available on the Company's website at www.take2games.com. If the Company makes any amendment to its Code of Business Conduct and Ethics that is required to be disclosed pursuant to the Exchange Act, the Company will make such disclosures on its website.
Item 11. Executive Compensation
The information required by this Item is incorporated herein by reference to the section entitled "Executive Compensation" in the Company's Proxy Statement.
Item 12. Security Ownership of Certain Beneficial Owners and Management and Related Stockholder Matters
The information required by this Item is incorporated herein by reference to the sections entitled "Voting Security Ownership of Certain Beneficial Owners and Management" and "Equity Compensation Plan Information" in the Company's Proxy Statement.
Item 13. Certain Relationships and Related Transactions, and Director Independence
The information required by this Item is incorporated herein by reference to the section entitled "Certain Relationships and Related Transactions" in the Company's Proxy Statement.
Item 14. Principal Accounting Fees and Services
The information required by this Item is incorporated herein by reference to the section entitled "Independent Auditor Fee Information" in the Company's Proxy Statement.
57
Item 15. Exhibits, Financial Statement Schedules
- (a)
- The
following documents are filed as part of this Report:
- (i)
- Financial
Statements. See Index to Financial Statements on page 65 of this Report.
- (ii)
- Financial
Statement Schedule. See Note 17 to the Consolidated Financial Statements.
- (iii)
- Index to Exhibits:
| |
|
Incorporated by Reference | ||||||||||||
|---|---|---|---|---|---|---|---|---|---|---|---|---|---|---|
| Exhibit Number |
Exhibit Description | Form | Filing Date | Exhibit | Filed Herewith |
|||||||||
| 3.1 | Restated Certificate of Incorporation | 10-K | 2/12/2004 | 3.1 | ||||||||||
3.1.1 |
Certificate of Amendment of Restated Certificate of Incorporation, dated April 30, 1998 |
10-K |
2/12/2004 |
3.1.2 |
||||||||||
3.1.2 |
Certificate of Amendment of Restated Certificate of Incorporation, dated November 17, 2003 |
10-K |
2/12/2004 |
3.1.3 |
||||||||||
3.1.3 |
Certificate of Amendment of Restated Certificate of Incorporation, dated April 23, 2009. |
8-K |
4/23/2009 |
3.1 |
||||||||||
3.1.4 |
Certificate of Amendment of Restated Certificate of Incorporation, dated September 21, 2012 |
8-K |
8/24/2012 |
3.1 |
||||||||||
3.2 |
Certificate of Designation of Series A Preferred Stock, dated March 11, 1998 |
10-K |
2/12/2004 |
3.1.1 |
||||||||||
3.3 |
Certificate of Designation of Series B Preferred Stock, dated March 24, 2008 |
8-K |
3/26/2008 |
3.2 |
||||||||||
3.4 |
Amended and Restated Bylaws of the Company |
8-K |
2/24/2010 |
3.1 |
||||||||||
3.5 |
Amendment to Amended and Restated Bylaws of the Company |
8-K |
11/18/2010 |
3(ii) |
||||||||||
3.6 |
Amended and Restated Bylaws of Take-Two Interactive Software, Inc., effective as of December 2, 2014. |
8-K |
12/5/2014 |
3.1 |
||||||||||
4.1 |
Indenture, dated as of November 16, 2011, by and between the Company and The Bank of New York Mellon, as Trustee, relating to 1.75% Convertible Notes |
8-K |
11/18/2011 |
4.1 |
||||||||||
4.2 |
Form of 1.75% Convertible Note (included in Exhibit 4.1) |
8-K |
11/18/2011 |
4.1 |
||||||||||
4.3 |
Indenture, dated as of June 18, 2013, by and between the Company and The Bank of New York Mellon, as Trustee |
8-K |
6/18/2013 |
4.1 |
||||||||||
58
| |
|
Incorporated by Reference | ||||||||||||
|---|---|---|---|---|---|---|---|---|---|---|---|---|---|---|
| Exhibit Number |
Exhibit Description | Form | Filing Date | Exhibit | Filed Herewith |
|||||||||
| 4.4 | Supplemental Indenture, dated as of June 18, 2013, between the Company and The Bank of New York Mellon, as Trustee, to Indenture, dated as of June 18, 2013, between the Company and The Bank of New York Mellon, as Trustee | 8-K | 6/18/2013 | 4.2 | ||||||||||
4.5 |
Form of Global Note (included in Exhibit 4.4) |
8-K |
6/18/2013 |
4.2 |
||||||||||
10.1 |
Take-Two Interactive Software, Inc. Change in Control Employee Severance Plan+ |
8-K |
3/7/2008 |
10.1 |
||||||||||
10.2 |
Amended and Restated Take-Two Interactive Software, Inc. 2009 Stock Incentive Plan+ |
14A |
7/29/2013 |
Annex A |
||||||||||
10.3 |
Form of Employee Restricted Stock Agreement+ |
10-Q |
6/5/2009 |
10.2 |
||||||||||
10.4 |
Form of Non-Employee Director Restricted Stock Agreement+ |
10-Q |
6/5/2009 |
10.3 |
||||||||||
10.5 |
Form of Employee Restricted Unit Agreement+ |
10-Q |
8/1/2012 |
10.1 |
||||||||||
10.6 |
Form of Employee Restricted Unit Agreement+ |
10-Q |
10/30/2013 |
10.1 |
||||||||||
10.7 |
Form of Employee Restricted Unit Agreement+ |
10-Q |
10/30/2013 |
10.2 |
||||||||||
10.8 |
Form of Employee Restricted Unit Agreement+ |
10-Q |
10/30/2013 |
10.3 |
||||||||||
10.9 |
Form of Employee Restricted Unit Agreement+ |
10-Q |
10/30/2013 |
10.4 |
||||||||||
10.10 |
Form of Employee Restricted Unit Agreement+ |
10-Q |
10/30/2013 |
10.5 |
||||||||||
10.11 |
Employment Agreement, dated June 4, 2010, between the Company and Seth Krauss+ |
10-Q |
6/9/2010 |
10.2 |
||||||||||
10.12 |
Amendment to Employment Agreement, dated October 25, 2010, between the Company and Seth Krauss+ |
8-K |
10/25/2010 |
10.2 |
||||||||||
10.13 |
Second Amendment to Employment Agreement, dated September 14, 2012, between the Company and Seth Krauss+ |
10-Q |
10/31/2012 |
10.3 |
||||||||||
10.14 |
Employment Agreement, dated May 12, 2010, between the Company and Lainie Goldstein+ |
8-K |
5/14/2010 |
10.1 |
||||||||||
59
| |
|
Incorporated by Reference | ||||||||||||
|---|---|---|---|---|---|---|---|---|---|---|---|---|---|---|
| Exhibit Number |
Exhibit Description | Form | Filing Date | Exhibit | Filed Herewith |
|||||||||
| 10.15 | Amendment to Employment Agreement, dated October 25, 2010, between the Company and Lainie Goldstein+ | 8-K | 10/25/2010 | 10.1 | ||||||||||
10.16 |
Second Amendment to Employment Agreement, dated August 27, 2012, between the Company and Lainie Goldstein+ |
10-Q |
10/31/2012 |
10.6 |
||||||||||
10.17 |
Employment Agreement, dated February 14, 2008, by and between the Company and Karl Slatoff+ |
8-K |
2/15/2008 |
10.3 |
||||||||||
10.18 |
Management Agreement between the Company and ZelnickMedia Corporation dated March 30, 2007+ |
8-K |
4/4/2007 |
99.1 |
||||||||||
10.19 |
Amendment dated July 26, 2007 to the Management Agreement dated March 30, 2007 between the Company and ZelnickMedia Corporation+ |
8-K |
7/27/2007 |
99.1 |
||||||||||
10.20 |
Second Amendment, dated February 14, 2008, to the Management Agreement dated March 30, 2007 between the Company and ZelnickMedia Corporation+ |
8-K |
2/15/2008 |
10.1 |
||||||||||
10.21 |
Management Agreement, dated as of May 20, 2011, by and between Take-Two Interactive Software, Inc. and ZelnickMedia Corporation+ |
8-K |
5/24/2011 |
10.1 |
||||||||||
10.22 |
Amendment to Non-Qualified Stock Option Agreement with ZelnickMedia Corporation, dated as of November 18, 2013+ |
8-K |
11/18/2013 |
10.1 |
||||||||||
10.23 |
Management Agreement, dated as of March 10, 2014, by and between the Company and ZelnickMedia Corporation.+ |
8-K |
3/10/2014 |
10.1 |
||||||||||
10.24 |
Security Agreement dated as of July 3, 2007, made by each of the Grantors listed on the signature pages thereof and Wells Fargo Foothill, Inc. in its capacity as administrative agent for the Lender Group and the Bank Product Providers |
8-K |
7/9/2007 |
10.2 |
||||||||||
10.25 |
Supplement to Security Agreement dated as of November 16, 2007, made by each of the grantors listed on the signature pages thereof and Wells Fargo Foothill, Inc. in its capacity as administrative agent for the Lender Group and the Bank Product Providers |
8-K |
11/20/2007 |
99.2 |
||||||||||
60
| |
|
Incorporated by Reference | ||||||||||||
|---|---|---|---|---|---|---|---|---|---|---|---|---|---|---|
| Exhibit Number |
Exhibit Description | Form | Filing Date | Exhibit | Filed Herewith |
|||||||||
| 10.26 | Second Amended and Restated Credit Agreement, dated as of October 17, 2011, by and among the Company, each of its Subsidiaries identified on the signature pages thereto as Borrowers, each of its Subsidiaries identified on the signature pages thereto as Guarantors, the lender parties thereto, and Wells Fargo Capital Finance, Inc., as administrative agent | 8-K | 10/17/2011 | 10.1 | ||||||||||
10.27 |
First Amendment to Second Amended and Restated Credit Agreement, dated June 12, 2013 |
10-K |
5/14/2014 |
10.27 |
||||||||||
10.28 |
Second Amendment to Second Amended and Restated Credit Agreement, dated April 28, 2014 |
10-K |
5/14/2014 |
10.28 |
||||||||||
10.29 |
Xbox 360 Publisher License Agreement dated November 17, 2006, between Microsoft Licensing, GP and the Company* |
10-Q |
11/8/2011 |
10.3 |
||||||||||
10.30 |
Amendment to Xbox 360 Publisher License Agreement, dated December 4, 2008, between Microsoft Licensing, GP and the Company* |
10-Q |
6/5/2009 |
10.1 |
||||||||||
10.31 |
Amendment to the Xbox 360 Publisher License Agreement, dated November 22, 2011, between the Company and Microsoft Licensing, GP* |
10-Q |
2/3/2012 |
10.1 |
||||||||||
10.32 |
Amendment to the Xbox 360 Publisher License Agreement, dated December 11, 2012, between the Company and Microsoft Licensing, GP* |
10-Q |
2/6/2013 |
10.2 |
||||||||||
10.33 |
Amendment to the Xbox 360 Publisher License Agreement, dated November 13, 2013, between the Company and Microsoft Licensing, GP.* |
10-Q |
2/4/2014 |
10.2 |
||||||||||
10.34 |
Xbox One Publisher License Agreement dated October 31, 2013, between Microsoft Licensing, GP and the Company* |
10-Q |
2/4/2014 |
10.1 |
||||||||||
10.35 |
Global Playstation 3 Format Licensed Publisher Agreement, dated May 18, 2010, between Take-Two International S.A. and Sony Computer Entertainment Europe Limited* |
10-Q |
11/8/2011 |
10.2 |
||||||||||
61
| |
|
Incorporated by Reference | ||||||||||||
|---|---|---|---|---|---|---|---|---|---|---|---|---|---|---|
| Exhibit Number |
Exhibit Description | Form | Filing Date | Exhibit | Filed Herewith |
|||||||||
| 10.36 | Global Playstation 3 Format Licensed Publisher Agreement, dated May 20, 2010, between the Company and Sony Computer Entertainment America LLC* | 10-Q | 11/8/2011 | 10.1 | ||||||||||
10.37 |
Lease Agreement between the Company and Moklam Enterprises, Inc. dated July 1, 2002 |
10-Q |
9/16/2002 |
10.2 |
||||||||||
10.38 |
Sixth Lease Modification Agreement, dated January 18, 2012, between the Company and Moklam Enterprises, Inc. |
10-K |
5/23/2012 |
10.45 |
||||||||||
10.39 |
Seventh Lease Modification Agreement, dated April 8, 2014, between the Company and Moklam Enterprises, Inc. |
10-K |
5/14/2014 |
10.39 |
||||||||||
10.40 |
Purchase Agreement, dated November 26, 2013, by and among the Company and the Icahn Group. |
8-K |
11/27/2014 |
10.1 |
||||||||||
10.41 |
Amendment to the Xbox One Publisher License Agreement, dated May 7, 2014, between Microsoft Licensing, GP and the Company* |
10-Q |
8/6/2014 |
10.1 |
||||||||||
10.42 |
Amendment to the Xbox 360 Publisher License Agreement, dated September 30, 2014, between Microsoft Corporation and the Company* |
10-Q |
10/30/2014 |
10.1 |
||||||||||
10.43 |
Amended and Restated Take-Two Interactive Software, Inc. 2009 Stock Incentive Plan, effective as of July 23, 2014 |
14A |
7/28/2014 |
Annex A |
||||||||||
10.44 |
Third Amendment to Second Amended and Restated Credit Agreement, dated August 18, 2014, by and among the Company, each of its Subsidiaries identified on the signature pages thereto as Borrowers, each of its Subsidiaries identified on the signature pages thereto as Guarantors, the lender parties thereto, and Wells Fargo Capital Finance, llc, as arranger and administrative agent |
8-K |
8/21/2014 |
10.1 |
||||||||||
10.45 |
Employment Agreement dated January 28, 2015 between the Company and Daniel Emerson |
10-Q |
2/6/2015 |
10.1 |
||||||||||
10.46 |
Amendment to the Restricted Stock Agreement dated as of May 20, 2011 between the Company and ZelnickMedia Corporation, effective as of December 2, 2014 |
10-Q |
2/6/2015 |
10.1 |
||||||||||
62
| |
|
Incorporated by Reference | ||||||||||||
|---|---|---|---|---|---|---|---|---|---|---|---|---|---|---|
| Exhibit Number |
Exhibit Description | Form | Filing Date | Exhibit | Filed Herewith |
|||||||||
| 10.47 | Amendment to the Performance Based Restricted Stock Agreement dated as of May 20, 2011 between the Company and ZelnickMedia Corporation, effective as of December 2, 2014 | 10-Q | 2/6/2015 | 10.1 | ||||||||||
10.48 |
Second Amendment to the Restricted Stock Agreement dated as of May 20, 2011 between the Company and ZelnickMedia Corporation, effective as of April 24, 2015 |
S-3ASR |
5/20/2015 |
10.5 |
||||||||||
10.49 |
Second Amendment to the Performance Based Restricted Stock Agreement dated as of May 20, 2011 between the Company and ZelnickMedia Corporation, effective as of April 24, 2015 |
S-3ASR |
5/20/2015 |
10.6 |
||||||||||
10.50 |
Restricted Unit Agreement, dated as of May 20, 2015, by and between the Company and ZelnickMedia Corporation |
S-3ASR |
5/20/2015 |
10.2 |
||||||||||
21.1 |
Subsidiaries of the Company |
X |
||||||||||||
23.1 |
Consent of Ernst & Young LLP |
X |
||||||||||||
31.1 |
Chief Executive Officer Certification Pursuant to Rules 13a-15(e) and 15d-15(e) under the Securities and Exchange Act of 1934, as adopted pursuant to Section 302 of the Sarbanes-Oxley Act of 2002 |
X |
||||||||||||
31.2 |
Chief Financial Officer Certification Pursuant to Rules 13a-15(e) and 15d-15(e) under the Securities and Exchange Act of 1934, as adopted pursuant to Section 302 of the Sarbanes-Oxley Act of 2002 |
X |
||||||||||||
32.1 |
Chief Executive Officer Certification pursuant to 18 U.S.C. Section 1350, as adopted Pursuant to Section 906 of the Sarbanes-Oxley Act of 2002 |
X |
||||||||||||
32.2 |
Chief Financial Officer Certification pursuant to 18 U.S.C. Section 1350, as adopted Pursuant to Section 906 of the Sarbanes-Oxley Act of 2002 |
X |
||||||||||||
101.INS |
XBRL Instance Document. |
X |
||||||||||||
101.SCH |
XBRL Taxonomy Extension Schema Document. |
X |
||||||||||||
101.CAL |
XBRL Taxonomy Calculation Linkbase Document. |
X |
||||||||||||
101.LAB |
XBRL Taxonomy Label Linkbase Document. |
X |
||||||||||||
63
| |
|
Incorporated by Reference | ||||||||||||
|---|---|---|---|---|---|---|---|---|---|---|---|---|---|---|
| Exhibit Number |
Exhibit Description | Form | Filing Date | Exhibit | Filed Herewith |
|||||||||
| 101.PRE | XBRL Taxonomy Presentation Linkbase Document. | X | ||||||||||||
101.DEF |
XBRL Taxonomy Extension Definition Document. |
X |
||||||||||||
- +
- Represents
a management contract or compensatory plan or arrangement.
- *
- Portions thereof were omitted and filed separately with the Securities and Exchange Commission pursuant to a request for confidential treatment that was granted in accordance with Exchange Act Rule 24b-2.
Attached as Exhibit 101 to this report are the following formatted in XBRL (Extensible Business Reporting Language): (i) Consolidated Balance Sheets at March 31, 2015 and 2014, (ii) Consolidated Statements of Operations for the fiscal years ended March 31, 2015, 2014 and 2013, (iii) Consolidated Statements of Comprehensive Income (Loss) for the fiscal years ended March 31, 2015, 2014 and 2013, (iv) Consolidated Statements of Cash Flows for the fiscal years ended March 31, 2015, 2014 and 2013, (v) Consolidated Statements of Stockholders' Equity for the fiscal years ended March 31, 2015, 2014 and 2013; and (vi) Notes to the Consolidated Financial Statements.
64
TAKE-TWO INTERACTIVE SOFTWARE, INC.
FISCAL YEAR ENDED MARCH 31, 2015
INDEX TO FINANCIAL STATEMENTS
(All other items in this report are inapplicable)
65
REPORT OF INDEPENDENT REGISTERED PUBLIC ACCOUNTING FIRM
The Board of Directors and Stockholders of Take-Two Interactive Software, Inc.
We have audited the accompanying consolidated balance sheets of Take-Two Interactive Software, Inc. as of March 31, 2015 and 2014, and the related consolidated statements of operations, comprehensive income (loss), cash flows and stockholders' equity for each of the three years in the period ended March 31, 2015. These financial statements are the responsibility of the Company's management. Our responsibility is to express an opinion on these financial statements based on our audits.
We conducted our audits in accordance with the standards of the Public Company Accounting Oversight Board (United States). Those standards require that we plan and perform the audit to obtain reasonable assurance about whether the financial statements are free of material misstatement. An audit includes examining, on a test basis, evidence supporting the amounts and disclosures in the financial statements. An audit also includes assessing the accounting principles used and significant estimates made by management, as well as evaluating the overall financial statement presentation. We believe that our audits provide a reasonable basis for our opinion.
In our opinion, the financial statements referred to above present fairly, in all material respects, the consolidated financial position of Take-Two Interactive Software, Inc. at March 31, 2015 and 2014, and the consolidated results of its operations and its cash flows for each of the three years in the period ended March 31, 2015, in conformity with U.S. generally accepted accounting principles.
We also have audited, in accordance with the standards of the Public Company Accounting Oversight Board (United States), Take-Two Interactive Software, Inc.'s internal control over financial reporting as of March 31, 2015, based on criteria established in Internal Control Integrated Framework issued by the Committee of Sponsoring Organizations of the Treadway Commission (2013 framework) and our report dated May 21, 2015 expressed an unqualified opinion thereon.
/s/ Ernst & Young LLP
New York, New York
May 21, 2015
66
REPORT OF INDEPENDENT REGISTERED PUBLIC ACCOUNTING FIRM
The Board of Directors and Stockholders of Take-Two Interactive Software, Inc.
We have audited Take-Two Interactive Software, Inc.'s internal control over financial reporting as of March 31, 2015, based on criteria established in Internal Control—Integrated Framework issued by the Committee of Sponsoring Organizations of the Treadway Commission (2013 framework) (the COSO criteria). Take-Two Interactive Software, Inc.'s management is responsible for maintaining effective internal control over financial reporting, and for its assessment of the effectiveness of internal control over financial reporting included in the accompanying Management's Report on Internal Control Over Financial Reporting. Our responsibility is to express an opinion on the company's internal control over financial reporting based on our audit.
We conducted our audit in accordance with the standards of the Public Company Accounting Oversight Board (United States). Those standards require that we plan and perform the audit to obtain reasonable assurance about whether effective internal control over financial reporting was maintained in all material respects. Our audit included obtaining an understanding of internal control over financial reporting, assessing the risk that a material weakness exists, testing and evaluating the design and operating effectiveness of internal control based on the assessed risk, and performing such other procedures as we considered necessary in the circumstances. We believe that our audit provides a reasonable basis for our opinion.
A company's internal control over financial reporting is a process designed to provide reasonable assurance regarding the reliability of financial reporting and the preparation of financial statements for external purposes in accordance with generally accepted accounting principles. A company's internal control over financial reporting includes those policies and procedures that (1) pertain to the maintenance of records that, in reasonable detail, accurately and fairly reflect the transactions and dispositions of the assets of the company; (2) provide reasonable assurance that transactions are recorded as necessary to permit preparation of financial statements in accordance with generally accepted accounting principles, and that receipts and expenditures of the company are being made only in accordance with authorizations of management and directors of the company; and (3) provide reasonable assurance regarding prevention or timely detection of unauthorized acquisition, use, or disposition of the company's assets that could have a material effect on the financial statements.
Because of its inherent limitations, internal control over financial reporting may not prevent or detect misstatements. Also, projections of any evaluation of effectiveness to future periods are subject to the risk that controls may become inadequate because of changes in conditions, or that the degree of compliance with the policies or procedures may deteriorate.
In our opinion, Take-Two Interactive Software, Inc. maintained, in all material respects, effective internal control over financial reporting as of March 31, 2015, based on the COSO criteria.
We also have audited, in accordance with the standards of the Public Company Accounting Oversight Board (United States), the consolidated balance sheets of Take-Two Interactive Software, Inc. as of March 31, 2015 and 2014, and the related consolidated statements of operations, comprehensive income (loss), cash flows and stockholders' equity for each of the three years in the period ended March 31, 2015 of Take-Two Interactive Software, Inc. and our report dated May 21, 2015 expressed an unqualified opinion thereon.
/s/ Ernst & Young LLP
New York, New York
May 21, 2015
67
TAKE-TWO INTERACTIVE SOFTWARE, INC.
CONSOLIDATED BALANCE SHEETS
(in thousands, except per share amounts)
| |
March 31, | ||||||
|---|---|---|---|---|---|---|---|
| |
2015 | 2014 | |||||
ASSETS |
|||||||
Current assets: |
|||||||
Cash and cash equivalents |
$ | 911,120 | $ | 935,400 | |||
Short-term investments |
186,929 | — | |||||
Restricted cash |
169,678 | 193,839 | |||||
Accounts receivable, net of allowances of $70,471 and $75,518 at March 31, 2015 and 2014, respectively |
217,860 | 53,143 | |||||
Inventory |
20,051 | 29,780 | |||||
Software development costs and licenses |
163,385 | 116,203 | |||||
Deferred cost of goods sold |
56,779 | 5,002 | |||||
Prepaid expenses and other |
55,506 | 66,073 | |||||
| | | | | | | | |
Total current assets |
1,781,308 | 1,399,440 | |||||
| | | | | | | | |
Fixed assets, net |
69,792 | 42,572 | |||||
Software development costs and licenses, net of current portion |
124,329 | 109,506 | |||||
Deferred cost of goods sold, net of current portion |
19,869 | 858 | |||||
Goodwill |
217,288 | 226,705 | |||||
Other intangibles, net |
4,769 | 5,113 | |||||
Other assets |
13,745 | 15,436 | |||||
| | | | | | | | |
Total assets |
$ | 2,231,100 | $ | 1,799,630 | |||
| | | | | | | | |
| | | | | | | | |
| | | | | | | | |
LIABILITIES AND STOCKHOLDERS' EQUITY |
|||||||
Current liabilities: |
|||||||
Accounts payable |
$ | 38,789 | $ | 16,452 | |||
Accrued expenses and other current liabilities |
444,738 | 397,173 | |||||
Deferred revenue |
482,733 | 61,195 | |||||
| | | | | | | | |
Total current liabilities |
966,260 | 474,820 | |||||
| | | | | | | | |
Long-term debt |
476,057 | 454,031 | |||||
Non-current deferred revenue |
164,618 | 18,128 | |||||
Other long-term liabilities |
61,077 | 50,845 | |||||
| | | | | | | | |
Total liabilities |
1,668,012 | 997,824 | |||||
| | | | | | | | |
Commitments and contingencies |
|||||||
Stockholders' equity: |
|||||||
Preferred stock, $.01 par value, 5,000 shares authorized |
— | — | |||||
Common stock, $.01 par value, 200,000 shares authorized; 104,594 and 105,156 shares issued and 88,356 and 88,918 outstanding at March 31, 2015 and 2014, respectively |
1,046 | 1,052 | |||||
Additional paid-in capital |
1,028,197 | 954,699 | |||||
Treasury stock, at cost (16,238 common shares at March 31, 2015 and 2014) |
(276,836 | ) | (276,836 | ) | |||
(Accumulated deficit) Retained earnings |
(158,695 | ) | 120,775 | ||||
Accumulated other comprehensive (loss) income |
(30,624 | ) | 2,116 | ||||
| | | | | | | | |
Total stockholders' equity |
563,088 | 801,806 | |||||
| | | | | | | | |
Total liabilities and stockholders' equity |
$ | 2,231,100 | $ | 1,799,630 | |||
| | | | | | | | |
| | | | | | | | |
| | | | | | | | |
See accompanying Notes.
68
TAKE-TWO INTERACTIVE SOFTWARE, INC.
CONSOLIDATED STATEMENTS OF OPERATIONS
(in thousands, except per share amounts)
| |
Fiscal Year Ended March 31, | |||||||||
|---|---|---|---|---|---|---|---|---|---|---|
| |
2015 | 2014 | 2013 | |||||||
Net revenue |
$ | 1,082,938 | $ | 2,350,568 | $ | 1,214,483 | ||||
Cost of goods sold |
794,867 | 1,414,327 | 715,837 | |||||||
| | | | | | | | | | | |
Gross profit |
288,071 | 936,241 | 498,646 | |||||||
Selling and marketing |
235,341 | 240,996 | 257,329 | |||||||
General and administrative |
175,093 | 161,374 | 147,260 | |||||||
Research and development |
115,043 | 105,256 | 78,184 | |||||||
Depreciation and amortization |
21,057 | 13,359 | 10,634 | |||||||
| | | | | | | | | | | |
Total operating expenses |
546,534 | 520,985 | 493,407 | |||||||
| | | | | | | | | | | |
Income (loss) from operations |
(258,463 | ) | 415,256 | 5,239 | ||||||
Interest and other, net |
(31,893 | ) | (33,553 | ) | (31,351 | ) | ||||
Gain on long-term investments, net |
17,476 | — | — | |||||||
Loss on extinguishment of debt |
— | (9,014 | ) | — | ||||||
Gain on convertible note hedge and warrants, net |
— | 3,461 | — | |||||||
| | | | | | | | | | | |
Income (loss) from continuing operations before income taxes |
(272,880 | ) | 376,150 | (26,112 | ) | |||||
| | | | | | | | | | | |
Provision for income taxes |
6,590 | 14,459 | 5,050 | |||||||
| | | | | | | | | | | |
Income (loss) from continuing operations |
(279,470 | ) | 361,691 | (31,162 | ) | |||||
Income (loss) from discontinued operations, net of taxes |
— | (86 | ) | 1,671 | ||||||
| | | | | | | | | | | |
Net income (loss) |
$ | (279,470 | ) | $ | 361,605 | $ | (29,491 | ) | ||
| | | | | | | | | | | |
| | | | | | | | | | | |
| | | | | | | | | | | |
Earnings (loss) per share: |
||||||||||
Continuing operations |
$ | (3.48 | ) | $ | 3.79 | $ | (0.36 | ) | ||
Discontinued operations |
— | — | 0.02 | |||||||
| | | | | | | | | | | |
Basic earnings (loss) per share |
$ | (3.48 | ) | $ | 3.79 | $ | (0.34 | ) | ||
| | | | | | | | | | | |
| | | | | | | | | | | |
| | | | | | | | | | | |
Continuing operations |
$ | (3.48 | ) | $ | 3.20 | $ | (0.36 | ) | ||
Discontinued operations |
— | — | 0.02 | |||||||
| | | | | | | | | | | |
Diluted earnings (loss) per share |
$ | (3.48 | ) | $ | 3.20 | $ | (0.34 | ) | ||
| | | | | | | | | | | |
| | | | | | | | | | | |
| | | | | | | | | | | |
See accompanying Notes.
69
TAKE-TWO INTERACTIVE SOFTWARE, INC.
CONSOLIDATED STATEMENTS OF COMPREHENSIVE INCOME (LOSS)
(in thousands)
| |
Twelve Months Ended March 31, | |||||||||
|---|---|---|---|---|---|---|---|---|---|---|
| |
2015 | 2014 | 2013 | |||||||
Net income (loss) |
$ | (279,470 | ) | $ | 361,605 | $ | (29,491 | ) | ||
Other comprehensive (loss) income: |
||||||||||
Foreign currency translation adjustment |
(32,747 | ) | 6,447 | (11,590 | ) | |||||
Change in unrealized gains on cash flow hedges, net of taxes |
32 | 241 | 285 | |||||||
Unrealized gains and (losses) on available-for-sale securities, net of taxes |
(25 | ) | — | — | ||||||
| | | | | | | | | | | |
Other comprehensive (loss) income |
(32,740 | ) | 6,688 | (11,305 | ) | |||||
| | | | | | | | | | | |
Comprehensive income (loss) |
$ | (312,210 | ) | $ | 368,293 | $ | (40,796 | ) | ||
| | | | | | | | | | | |
| | | | | | | | | | | |
| | | | | | | | | | | |
See accompanying Notes.
70
TAKE-TWO INTERACTIVE SOFTWARE, INC.
CONSOLIDATED STATEMENTS OF CASH FLOWS
(in thousands)
| |
Fiscal Year Ended March 31, | |||||||||
|---|---|---|---|---|---|---|---|---|---|---|
| |
2015 | 2014 | 2013 | |||||||
Operating activities: |
||||||||||
Net income (loss) |
$ | (279,470 | ) | $ | 361,605 | $ | (29,491 | ) | ||
| | | | | | | | | | | |
Adjustments to reconcile net income (loss) to net cash provided by operating activities: |
||||||||||
Amortization and impairment of software development costs and licenses |
133,453 | 265,533 | 230,748 | |||||||
Depreciation and amortization |
21,057 | 13,359 | 10,634 | |||||||
Loss (income) from discontinued operations |
— | 86 | (1,671 | ) | ||||||
Amortization and impairment of intellectual property |
344 | 3,558 | 7,000 | |||||||
Stock-based compensation |
65,246 | 78,118 | 35,765 | |||||||
Deferred income taxes |
2,279 | (19,036 | ) | (841 | ) | |||||
Amortization of discount on Convertible Notes |
22,026 | 22,801 | 18,862 | |||||||
Amortization of debt issuance costs |
1,663 | 1,947 | 2,021 | |||||||
Gain on long-term investments, net |
(17,476 | ) | — | — | ||||||
Loss on extinguishment of debt |
— | 9,014 | — | |||||||
Gain on convertible note hedge and warrants, net |
— | (3,461 | ) | — | ||||||
Other, net |
2,068 | (208 | ) | 778 | ||||||
Changes in assets and liabilities, net of effect from purchases of businesses: |
||||||||||
Restricted cash |
24,161 | (186,350 | ) | 8,975 | ||||||
Accounts receivable |
(164,717 | ) | 136,453 | (144,561 | ) | |||||
Inventory |
9,729 | 438 | (7,741 | ) | ||||||
Software development costs and licenses |
(188,772 | ) | (192,357 | ) | (216,893 | ) | ||||
Prepaid expenses, other current and other non-current assets |
5,398 | (18,424 | ) | (14,669 | ) | |||||
Deferred revenue |
568,028 | 34,276 | 13,055 | |||||||
Deferred cost of goods sold |
(70,788 | ) | — | — | ||||||
Accounts payable, accrued expenses and other liabilities |
78,585 | 194,228 | 83,734 | |||||||
Net cash used in discontinued operations |
— | (1,318 | ) | (272 | ) | |||||
| | | | | | | | | | | |
Net cash provided by operating activities |
212,814 | 700,262 | (4,567 | ) | ||||||
| | | | | | | | | | | |
Investing activities: |
||||||||||
Purchase of fixed assets |
(49,501 | ) | (29,813 | ) | (16,820 | ) | ||||
Purchases of short-term investments |
(187,616 | ) | — | — | ||||||
Purchase of long-term investments |
(5,000 | ) | — | — | ||||||
Cash received from sale of long-term investment |
21,976 | — | — | |||||||
Payments in connection with business combinations, net of cash acquired |
— | (1,000 | ) | — | ||||||
| | | | | | | | | | | |
Net cash used in investing activities |
(220,141 | ) | (30,813 | ) | (16,820 | ) | ||||
| | | | | | | | | | | |
Financing activities: |
||||||||||
Excess tax benefit from stock-based compensation |
928 | — | — | |||||||
Repurchase of common stock |
— | (276,836 | ) | — | ||||||
Proceeds from issuance of 1.00% Convertible Notes |
— | 283,188 | — | |||||||
Payment for extinguishment of 4.375% Convertible Notes |
— | (165,999 | ) | — | ||||||
Proceeds from termination of convertible note hedge transactions |
— | 84,429 | — | |||||||
Payment for termination of convertible note warrant transactions |
— | (55,651 | ) | — | ||||||
Payment of debt issuance costs for the issuance of 1.00% Covertible Notes |
— | (2,815 | ) | — | ||||||
| | | | | | | | | | | |
Net cash provided by (used in) financing activities |
928 | (133,684 | ) | — | ||||||
| | | | | | | | | | | |
Effects of foreign currency exchange rates on cash and cash equivalents |
(17,881 | ) | (2,867 | ) | 3,610 | |||||
| | | | | | | | | | | |
Net (decrease) increase in cash and cash equivalents |
(24,280 | ) | 532,898 | (17,777 | ) | |||||
Cash and cash equivalents, beginning of year |
935,400 | 402,502 | 420,279 | |||||||
| | | | | | | | | | | |
Cash and cash equivalents, end of period |
$ | 911,120 | $ | 935,400 | $ | 402,502 | ||||
| | | | | | | | | | | |
| | | | | | | | | | | |
| | | | | | | | | | | |
Supplemental data: |
||||||||||
Interest paid |
$ | 7,657 | $ | 9,095 | $ | 11,230 | ||||
Income taxes paid |
$ | 9,749 | $ | 10,025 | $ | 4,702 | ||||
See accompanying Notes.
71
TAKE-TWO INTERACTIVE SOFTWARE, INC.
CONSOLIDATED STATEMENTS OF STOCKHOLDERS' EQUITY
(in thousands)
| |
|
|
|
|
|
|
Accumulated Other Comprehensive Income (Loss) |
|
|||||||||||||||||
|---|---|---|---|---|---|---|---|---|---|---|---|---|---|---|---|---|---|---|---|---|---|---|---|---|---|
| |
Common Stock | |
Treasury Stock | (Accumulated Deficit) Retained Earnings |
|
||||||||||||||||||||
| |
Additional Paid-in Capital |
Total Stockholders' Equity |
|||||||||||||||||||||||
| |
Shares | Amount | Shares | Amount | |||||||||||||||||||||
Balance, March 31, 2012 |
90,215 | $ | 902 | $ | 799,431 | — | $ | — | $ | (211,339 | ) | $ | 6,733 | $ | 595,727 | ||||||||||
| | | | | | | | | | | | | | | | | | | | | | | | | | |
Net loss |
(29,491 | ) | (29,491 | ) | |||||||||||||||||||||
Change in cumulative foreign currency translation adjustment |
— | — | — | — | — | — | (11,590 | ) | (11,590 | ) | |||||||||||||||
Change in unrealized gains on derivative instruments, net |
— | — | — | — | — | — | 285 | 285 | |||||||||||||||||
Stock-based compensation |
— | — | 32,664 | — | — | — | — | 32,664 | |||||||||||||||||
Issuance of restricted stock, net of forfeitures and cancellations |
3,497 | 35 | (35 | ) | — | — | — | — | — | ||||||||||||||||
Issuance of common stock in connection with acquisition |
31 | — | 400 | — | — | — | — | 400 | |||||||||||||||||
| | | | | | | | | | | | | | | | | | | | | | | | | | |
Balance, March 31, 2013 |
93,743 | 937 | 832,460 | — | — | (240,830 | ) | (4,572 | ) | 587,995 | |||||||||||||||
| | | | | | | | | | | | | | | | | | | | | | | | | | |
Net income |
361,605 | 361,605 | |||||||||||||||||||||||
Change in cumulative foreign currency translation adjustment |
— | — | — | — | — | — | 6,447 | 6,447 | |||||||||||||||||
Change in unrealized gains on derivative instruments, net |
— | — | — | — | — | — | 241 | 241 | |||||||||||||||||
Exercise of stock options |
557 | 6 | (6 | ) | — | — | — | — | — | ||||||||||||||||
Stock-based compensation |
— | — | 80,285 | — | — | — | — | 80,285 | |||||||||||||||||
Tax benefit associated with stock awards |
— | — | 7,416 | — | — | — | — | 7,416 | |||||||||||||||||
Issuance of 1.00% Convertible Notes |
— | — | 35,784 | — | — | — | — | 35,784 | |||||||||||||||||
Extinguishment of 4.375% Convertible Notes |
3,217 | 32 | (26,480 | ) | — | — | — | — | (26,448 | ) | |||||||||||||||
Termination of convertible note hedge transactions |
— | — | 67,170 | — | — | — | — | 67,170 | |||||||||||||||||
Termination of convertible note warrant transactions |
— | — | (41,853 | ) | — | — | — | — | (41,853 | ) | |||||||||||||||
Issuance of restricted stock, net of forfeitures and cancellations |
7,639 | 77 | (77 | ) | — | — | — | — | — | ||||||||||||||||
Repurchased common stock |
— | — | — | (16,238 | ) | (276,836 | ) | — | — | (276,836 | ) | ||||||||||||||
| | | | | | | | | | | | | | | | | | | | | | | | | | |
Balance, March 31, 2014 |
105,156 | 1,052 | 954,699 | (16,238 | ) | (276,836 | ) | 120,775 | 2,116 | 801,806 | |||||||||||||||
| | | | | | | | | | | | | | | | | | | | | | | | | | |
Net loss |
(279,470 | ) | (279,470 | ) | |||||||||||||||||||||
Change in cumulative foreign currency translation adjustment |
— | — | — | — | — | — | (32,747 | ) | (32,747 | ) | |||||||||||||||
Change in unrealized gains on derivative instruments, net |
— | — | — | — | — | — | 32 | 32 | |||||||||||||||||
Unrealized gains and (losses) on available-for-sale securities, net of taxes |
— | — | — | — | — | — | (25 | ) | (25 | ) | |||||||||||||||
Stock-based compensation |
— | — | 72,579 | — | — | — | — | 72,579 | |||||||||||||||||
Tax benefit associated with stock awards |
— | — | 928 | — | — | — | — | 928 | |||||||||||||||||
Issuance of restricted stock, net of forfeitures and cancellations |
(570 | ) | (6 | ) | (108 | ) | — | — | — | — | (114 | ) | |||||||||||||
Issuance of common stock in connection with acquisition |
8 | — | 99 | — | — | — | — | 99 | |||||||||||||||||
| | | | | | | | | | | | | | | | | | | | | | | | | | |
Balance, March 31, 2015 |
104,594 | $ | 1,046 | $ | 1,028,197 | (16,238 | ) | $ | (276,836 | ) | $ | (158,695 | ) | $ | (30,624 | ) | $ | 563,088 | |||||||
| | | | | | | | | | | | | | | | | | | | | | | | | | |
| | | | | | | | | | | | | | | | | | | | | | | | | | |
| | | | | | | | | | | | | | | | | | | | | | | | | | |
See accompanying Notes.
72
TAKE-TWO INTERACTIVE SOFTWARE, INC.
NOTES TO THE CONSOLIDATED FINANCIAL STATEMENTS
(In thousands, except share and per share amounts)
1. BASIS OF PRESENTATION AND SIGNIFICANT ACCOUNTING POLICIES
Take-Two Interactive Software, Inc. (the "Company," "we," "us," or similar pronouns) was incorporated in the state of Delaware in 1993. We are a leading developer, publisher and marketer of interactive entertainment for consumers around the globe. The Company develops and publishes products through its two wholly-owned labels Rockstar Games and 2K. Our products are designed for console systems, handheld gaming systems and personal computers, including smart phones and tablets, and are delivered through physical retail, digital download, online platforms and cloud streaming services.
The Consolidated Financial Statements include the financial statements of the Company and its wholly-owned subsidiaries. All material inter-company balances and transactions have been eliminated in consolidation.
Certain amounts in the financial statements of the prior years have been reclassified to conform to the current year presentation for comparative purposes.
The preparation of financial statements in conformity with U.S. generally accepted accounting principles ("U.S. GAAP") requires management to make estimates and assumptions that affect the reported amounts of assets and liabilities and the disclosure of contingent assets and liabilities at the dates of the financial statements and the reported amounts of net revenue and expenses during the reporting periods. Our most significant estimates and assumptions relate to the recoverability of software development costs and prepaid royalties, licenses and intangibles, valuation of inventories, realization of deferred income taxes, the adequacy of allowances for sales returns, price concessions and doubtful accounts, accrued liabilities, the service period for deferred net revenue and related cost of goods sold, fair value estimates, the valuation of stock-based compensation and assumptions used in our goodwill impairment test. These estimates generally involve complex issues and require us to make judgments, involve analysis of historical and the prediction of future trends, and are subject to change from period to period. Actual amounts could differ significantly from these estimates. The Company considers transactions or events that occur after the balance sheet date, but before the financial statements are issued, to provide additional evidence relative to certain estimates or to identify matters that require additional disclosures.
The carrying amounts of our financial instruments, including cash and cash equivalents, accounts receivable, restricted cash, accounts payable and accrued liabilities, approximate fair value because of their short maturities. We consider all highly liquid instruments purchased with original maturities of three months or less to be cash equivalents. Our restricted cash balance is primarily related to a dedicated account limited to the payment of certain royalty obligations.
As of March 31, 2015, the estimated fair value of the Company's 1.75% Convertible Notes due 2016 (the "1.75% Convertible Notes") and the Company's 1.00% Convertible Notes due 2018 (the "1.00% Convertible Notes" and together with the 1.75% Convertible Notes, the "Convertible Notes") was $352,250 and $377,804, respectively. The fair value was determined using observable market data for the
73
Convertible Notes and its embedded option feature. See Note 10 for additional information regarding our Convertible Notes.
We transact business in various foreign currencies and have significant sales and purchase transactions denominated in foreign currencies, subjecting us to foreign currency exchange rate risk. From time to time, we use hedging programs in an effort to mitigate the effect of currency exchange rate movements.
Cash Flow Hedging Activities
We use foreign currency forward contracts to mitigate foreign currency exchange rate risk associated with forecasted transactions involving non-functional currency denominated expenditures. These contracts, which are designated and qualify as cash flow hedges, are accounted for as derivatives whereby the fair value of the contracts is reported as either assets or liabilities on our Consolidated Balance Sheets. The effective portion of gains or losses resulting from changes in the fair value of these hedges is initially reported, net of tax, as a component of accumulated other comprehensive income (loss) in stockholders' equity. The gross amount of the effective portion of gains or losses resulting from changes in the fair value of these hedges is subsequently reclassified into cost of goods sold or research and development expenses, as appropriate, in the period when the forecasted transaction is recognized in our Consolidated Statements of Operations. In the event that the gains or losses in accumulated other comprehensive income (loss) are deemed to be ineffective, the ineffective portion of gains or losses resulting from changes in fair value, if any, is reclassified to interest and other, net, in our Consolidated Statements of Operations. In the event that the underlying forecasted transactions do not occur, or it becomes probable that they will not occur, within the defined hedge period, the gains or losses on the related cash flow hedges are reclassified from accumulated other comprehensive income (loss) to interest and other, net, in our Consolidated Statements of Operations. During the reporting periods presented, all forecasted transactions occurred, and therefore, there were no such gains or losses reclassified into interest and other, net. We do not enter into derivative financial contracts for speculative or trading purposes. We did not have any cash flow hedges outstanding at March 31, 2015 and at March 31, 2014, we had $890 of forward contracts outstanding to buy foreign currencies in exchange for U.S. dollars all of which had maturities of less than one year. As of March 31, 2014, the fair value of these outstanding forward contracts was immaterial and is included in prepaid expenses and other. The fair value of these outstanding forward contracts is estimated based on the prevailing exchange rates of the various hedged currencies as of the end of the period.
Balance Sheet Hedging Activities
We use foreign currency forward contracts to mitigate foreign currency exchange rate risk associated with non-functional currency denominated cash balances and inter-company funding loans, non-functional currency denominated accounts receivable and non-functional currency denominated accounts payable. These transactions are not designated as hedging instruments and are accounted for as derivatives whereby the fair value of the contracts is reported as either assets or liabilities on our Consolidated Balance Sheets, and gains and losses resulting from changes in the fair value are reported in interest and other, net, in our Consolidated Statements of Operations. We do not enter into derivative financial contracts for speculative or trading purposes. At March 31, 2015, we had $4,097 of forward contracts outstanding to buy foreign currencies in exchange for U.S. dollars and $72,488 of forward contracts outstanding to sell foreign currencies in exchange for U.S. dollars all of which have maturities of less than one year. At March 31, 2014, we had $68,520, of forward contracts outstanding to sell foreign currencies in exchange for U.S. dollars all of which have maturities of less than one year. For the fiscal years ended March 31, 2015, 2014 and 2013, we recorded a gain of $18,548, a loss of $18,425 and a gain of $2,163, respectively, related to foreign currency forward contracts in interest and other, net on the Consolidated Statements of Operations. As of March 31, 2015 the fair value of these outstanding forward contracts was a loss of $587 and as of March 31, 2014 was immaterial and is included in prepaid expenses and other. The fair value of
74
these outstanding forward contracts is estimated based on the prevailing exchange rates of the various hedged currencies as of the end of the period.
Concentration of Credit Risk and Accounts Receivable
We maintain cash balances at several major financial institutions. While we attempt to limit credit exposure with any single institution, balances often exceed insurable amounts.
If the financial condition and operations of our customers deteriorate, our risk of collection could increase substantially. A majority of our trade receivables are derived from sales to major retailers and distributors. Our five largest customers accounted for 64.6%, 39.4% and 52.5% of net revenue during the fiscal years ended March 31, 2015, 2014 and 2013, respectively. One customer accounted for 21.0%, 18.4% and 23.8% of net revenue during the fiscal years ended March 31, 2015, 2014 and 2013, respectively. Three additional customers individually accounted for 13.3%, 11.7% and 10.4% of net revenue during the fiscal year ended March 31, 2015. As of March 31, 2015 and 2014, five customers accounted for 63.9% and 68.3% of our gross accounts receivable, respectively. Customers that individually accounted for more than 10% of our gross accounts receivable balance comprised 54.5% and 59.8% of such balances at March 31, 2015 and 2014, respectively. We had three customers who accounted for approximately 18.5%, 18.4% and 17.6% of our gross accounts receivable as of March 31, 2015 and three customers who accounted for 22.6%, 22.3% and 14.9% of our gross accounts receivable as of March 31, 2014. We did not have any additional customers that exceeded 10% of our gross accounts receivable as of March 31, 2015 and 2014. Based upon performing ongoing credit evaluations, maintaining trade credit insurance on a majority of our customers and our past collection experience, we believe that the receivable balances from these largest customers do not represent a significant credit risk.
Inventory consists of materials, including manufacturing royalties paid to console manufacturers, and is stated at the lower of average cost or market. Estimated product returns are included in the inventory balance at their cost. We regularly review inventory quantities on-hand and in the retail channels and record an inventory provision for excess or obsolete inventory based on the future expected demand for our products. Significant changes in demand for our products would affect management's estimates in establishing our inventory provision. We write down inventory based on excess or obsolete inventories determined primarily by future anticipated demand for our products. Inventory write-downs are measured as the difference between the cost of the inventory and market value, based upon assumptions about future demand that are inherently difficult to assess.
Short-term investments designated as available-for-sale securities are carried at fair value, which is based on quoted market prices for such securities, if available, or is estimated on the basis of quoted market prices of financial instruments with similar characteristics. Investments with original maturities greater than 90 days and remaining maturities of less than one year are normally classified within short-term investments. In addition, investments with maturities beyond one year at the time of purchase that are highly liquid in nature and represent the investment of cash that is available for current operations are classified as short-term investments.
Unrealized gains and losses of the Company's available-for-sale securities are excluded from earnings and are reported as a component of other comprehensive income (loss), net of tax, until the security is sold, the security has matured, or the Company determines that the fair value of the security has declined below its adjusted cost basis and the decline is other-than-temporary. Realized gains and losses on short-term investments are calculated based on the specific identification method and would be reclassified from accumulated other comprehensive income (loss) to interest and other, net.
75
Short-term investments are evaluated for impairment quarterly. The Company considers various factors in determining whether it should recognize an impairment charge, including the credit quality of the issuer, the duration that the fair value has been less than the adjusted cost basis, the severity of the impairment, the reason for the decline in value, and our intent to sell and ability to hold the investment for a period of time sufficient to allow for any anticipated recovery in market value. If the Company concludes that an investment is other-than-temporarily impaired, it recognizes an impairment charge at that time in the Consolidated Statements of Operations. In determining whether the decline in fair value is other-than-temporary requires management judgment based on the specific facts and circumstances of each security. The ultimate value realized on these securities is subject to market price volatility until they are sold.
The Company held an investment in Twitch Interactive, Inc.'s ("Twitch") Class C Preferred stock, which was accounted for under the cost method of accounting. During the fiscal year ended March 31, 2015, the Company recognized a pretax gain of approximately $18,976 in connection with the sale of Twitch. The pretax gain is presented within "Gain on long-term investments, net" in our Consolidated Statements of Operations.
Software Development Costs and Licenses
Capitalized software development costs include direct costs incurred for internally developed titles and payments made to third-party software developers under development agreements.
We capitalize internal software development costs (including stock-based compensation, specifically identifiable employee payroll expense and incentive compensation costs related to the completion and release of titles), third-party production and other content costs, subsequent to establishing technological feasibility of a software title. Technological feasibility of a product includes the completion of both technical design documentation and game design documentation. Significant management judgments and estimates are utilized in the assessment of when technological feasibility is established. For products where proven technology exists, this may occur early in the development cycle. Technological feasibility is evaluated on a product by product basis.
We enter into agreements with third-party developers that require us to make payments for game development and production services. In exchange for our payments, we receive the exclusive publishing and distribution rights to the finished game title as well as, in some cases, the underlying intellectual property rights. Such agreements typically allow us to fully recover these payments to the developers at an agreed upon royalty rate earned on the subsequent retail sales of such software, net of any agreed upon costs. Prior to establishing technological feasibility of a product we record any costs incurred by third-party developers as research and development expenses. Subsequent to establishing technological feasibility of a product we capitalize all development and production service payments to third-party developers as software development costs and licenses. We typically enter into agreements with third-party developers after completing the technical design documentation for our products and therefore record the design costs leading up to a signed development contract as research and development expense. When we contract with third-party developers, we generally select those that have proven technology and experience in the genre of the software being developed, which often allows for the establishment of technological feasibility early in the development cycle. In instances where the documentation of the design and technology are not in place prior to an executed contract, we monitor the software development process and require our third-party developers to adhere to the same technological feasibility standards that apply to our internally developed products.
Licenses consist of payments and guarantees made to holders of intellectual property rights for use of their trademarks, copyrights or other intellectual property rights in the development of our products.
76
Agreements with license holders generally provide for guaranteed minimum payments for use of their intellectual property. Certain licenses, especially those related to our sports products, extend over multi-year periods and encompass multiple game titles. In addition to guaranteed minimum payments, these licenses frequently contain provisions that could require us to pay royalties to the license holder based on pre-agreed unit sales thresholds.
Amortization of capitalized software development costs and licenses commences when a product is released and is recorded on a title-by-title basis in cost of goods sold. For capitalized software development costs, amortization is calculated using (1) the proportion of current year revenues to the total revenues expected to be recorded over the life of the title or (2) the straight-line method over the remaining estimated useful life of the title, whichever is greater. For capitalized licenses, amortization is calculated as a ratio of (1) current period revenues to the total revenues expected to be recorded over the remaining life of the title or (2) the contractual royalty rate based on actual net product sales as defined in the licensing agreement, whichever is greater.
We evaluate the future recoverability of capitalized software development costs and licenses on a quarterly basis. Recoverability is primarily assessed based on the actual title's performance. For products that are scheduled to be released in the future, recoverability is evaluated based on the expected performance of the specific products to which the cost or license relates. We utilize a number of criteria in evaluating expected product performance, including: historical performance of comparable products developed with comparable technology; market performance of comparable titles; orders for the product prior to its release; general market conditions; and, past performance of the franchise. When management determines that the value of the title is unlikely to be recovered by product sales, capitalized costs are charged to cost of goods sold in the period in which such determination is made.
We have established profit and unit sales based internal royalty programs that allow selected employees to each participate in the success of software titles that they assist in developing. Royalties earned by employees under this program are recorded as a component of cost of goods sold in the period earned.
Office equipment, furniture and fixtures are depreciated using the straight-line method over their estimated useful life of five years. Computer equipment and software are generally depreciated using the straight-line method over three to five years. Leasehold improvements are amortized over the lesser of the term of the related lease or seven years. The cost of additions and betterments are capitalized, and repairs and maintenance costs are charged to operations, in the periods incurred. When depreciable assets are retired or sold, the cost and related allowances for depreciation are removed from the accounts and the gain or loss is recognized. The carrying amounts of these assets are recorded at historical cost.
Goodwill and Intangible Assets
Goodwill is the excess of purchase price paid over identified intangible and tangible net assets of acquired companies. Intangible assets consist of trademarks, intellectual property, non-compete agreements, customer lists and acquired technology. Certain intangible assets acquired in a business combination are recognized as assets apart from goodwill.
We use either the income, cost or market approach to aid in our conclusions of such fair values and asset lives. The income approach presumes that the value of an asset can be estimated by the net economic benefit to be received over the life of the asset, discounted to present value. The cost approach presumes that an investor would pay no more for an asset than its replacement or reproduction cost. The market approach estimates value based on what other participants in the market have paid for reasonably similar assets. Although each valuation approach is considered in valuing the assets acquired, the approach ultimately selected is based on the characteristics of the asset and the availability of information.
77
Identified intangibles other than goodwill are generally amortized using the straight-line method over the period of expected benefit ranging from two to ten years, except for intellectual property, which is a usage-based intangible asset that is amortized using the shorter of the useful life or expected revenue stream.
We test our goodwill for impairment annually, at the beginning of August, or more frequently, if events and circumstances indicate the fair value of a reporting unit may be below its carrying amount. A reporting unit is defined as an operating segment or one level below an operating segment. We have determined that we operate in one reporting unit which is our operating segment. In the evaluation of goodwill for impairment, we have the option to first perform a qualitative assessment to determine if the fair value of its reporting unit is more likely than not (i.e., a likelihood of more than 50%) less than the carrying value before performing the two-step impairment test. If the carrying value exceeds the fair value, there is a potential impairment and step two must be performed. If the two-step impairment test is utilized to test goodwill for impairment, step one compares the fair value of the reporting unit to its carrying value. In performing the quantitative assessment in step-one, we measure the fair value of the reporting unit using a combination of the income approach, which uses discounted cash flows, and the market approach, which uses market capitalization and comparable companies' data. Each step requires us to make judgments and involves the use of significant estimates and assumptions. These estimates and assumptions include long-term growth rates and operating margins used to calculate projected future cash flows, risk-adjusted discount rates based on our weighted average cost of capital, future economic and market conditions and the determination of appropriate market comparables. Our estimates for market growth are based on historical data, various internal estimates and observable external sources when available, and are based on assumptions that are consistent with the plans and estimates we use to manage the underlying business. If the carrying value of the reporting unit exceeds its fair value, the goodwill of that reporting unit is potentially impaired and step two must be performed. Step two compares the carrying value of the reporting unit's goodwill to its implied fair value (i.e., fair value of reporting unit less the fair value of the unit's assets and liabilities, including identifiable intangible assets). If the implied fair value of goodwill is less than the carrying amount of goodwill, an impairment is recognized. Based on our annual impairment assessment process for goodwill, no impairments were recorded during the fiscal years ended March 31, 2015, 2014 or 2013.
We review all long-lived assets for impairment whenever events or changes in circumstances indicate that the related carrying amount of an asset or asset group may not be recoverable. We compare the carrying amount of the asset to the estimated undiscounted future cash flows expected to result from the use of the asset. If the carrying amount of the asset exceeds estimated expected undiscounted future cash flows, we record an impairment charge for the difference between the carrying amount of the asset and its fair value. The estimated fair value is generally measured by discounting expected future cash flows using our incremental borrowing rate or fair value, if available. As of March 31, 2015 no indicators of impairment exist.
We record a tax provision for the anticipated tax consequences of the reported results of operations. Our provision for income taxes is computed using the asset and liability method, under which deferred income taxes are recognized for differences between the financial statement and tax bases of assets and liabilities at currently enacted statutory tax rates for the years in which the differences are expected to reverse. The effect on deferred taxes of a change in tax rates is recognized in income in the period that includes the enactment.
Valuation allowances are established when we determine that it is more likely than not that such deferred tax assets will not be realized. We do not record income tax expense related to foreign withholding taxes or United States income taxes which may become payable upon the repatriation of undistributed earnings of
78
foreign subsidiaries, as such earnings are expected to be reinvested indefinitely outside of the United States.
We use estimates and assumptions to compute the provision for income taxes including allocations of certain transactions to different tax jurisdictions, amounts of permanent and temporary differences, the likelihood of deferred tax assets being recovered and the outcome of contingent tax risks. These estimates and assumptions are revised as new events occur, more experience is acquired and additional information is obtained. The effect of these revisions is recorded in income tax expense or benefit in the period in which they become known.
We earn our revenue from the sale of internally developed interactive software titles and from the sale of titles developed by and/or licensed from third-party developers.
We recognize revenue on the sales of software products upon the transfer of title and risk of loss to our customers. Accordingly, we recognize revenue for software titles when there is (1) persuasive evidence that an arrangement with the customer exists, which is generally based on a customer purchase order, (2) the product is delivered, (3) the selling price is fixed or determinable and (4) collection of the customer receivable is deemed probable. Certain products are sold to customers with a street date (i.e., the earliest date these products may be sold by retailers). For these products we recognize revenue on the later of the street date or the sale date. In addition, some of our software products are sold as full game digital downloads and digital add-on content for which the consumer takes possession of the digital content for a fee. Revenue from product downloads is generally recognized when the download is made available (assuming all other recognition criteria are met).
In providing credit terms to our customers, our payment arrangements typically provide net 30 and 60 day terms. Advances received for licensing and exclusivity arrangements are reported on our Consolidated Balance Sheets as deferred revenue until we meet our performance obligations, at which point we recognize the revenue.
For some of our software products, we enter into multiple element revenue arrangements in which we may provide a combination of full game software, additional add-on content, maintenance or support. When all other revenue recognition criteria are met, we determine the fair value of each delivered and undelivered element using vendor-specific objective evidence ("VSOE") of fair value and allocate the total price among the various elements. When we have not established VSOE for each element, revenue is deferred until the earlier of the point at which VSOE of fair value exists for any undelivered element or until all elements of the arrangement have been delivered. For arrangements that require the deferral of revenue, the cost of goods sold is deferred and recognized as the related net revenue is recognized. Deferred cost of goods sold includes product costs and licenses. We determine VSOE for each element based on historical stand-alone sales to third parties. In determining VSOE, we require that a substantial majority of the selling prices for a product or service fall within a reasonably narrow pricing range. Changes in assumptions or judgments or changes to the elements in a software arrangement could cause a material increase or decrease in the amount of revenue that we report in a particular period.
In identifying the deliverables within an arrangement we consider whether our software products contain more-than-inconsequential online functionality by evaluating the significance of the development effort, the nature of the online features, the extent of anticipated marketing focus on the online features, the significance of the online features to the consumers' anticipated overall gameplay experience, and the significance and length of time of our post sale obligations to consumers. Determining whether the online functionality for a particular game constitutes a more than inconsequential deliverable is subjective and requires management's judgment.
79
When our software products provide limited online functionality at no additional cost to the consumer, we generally consider such features to be incidental to the overall product offering and an inconsequential deliverable, we recognize revenue when the four primary criteria described above have been met. When software products provide online functionality that represents a more-than-inconsequential deliverable, we recognize the software-related revenues and the related cost of goods sold ratably over the estimated service period of the title (assuming all other recognition criteria are met) as we have not established VSOE for that deliverable.
During the fiscal year ended March 31, 2015, the Company concluded that the updates being provided with Grand Theft Auto V were no longer considered an inconsequential deliverable because add-on content updates were expected to be provided beyond twelve months. As a result, the net revenue and cost of goods sold that have been deferred will be recognized ratably over the expected service period which, for Grand Theft Auto V, which we have projected to be 24 months from the time of release.
Certain of our games provide consumers with the option to purchase virtual currency to use in the game to acquire virtual goods. We recognize revenue from the sale of virtual currency, using the game-based model, ratably over the estimated remaining life of the game.
Certain of our software products include in-game advertising for third-party products. Advance payments received for in-game advertising are reported on our Consolidated Balance Sheets as deferred revenue until we meet our performance obligations, at which point we recognize the revenue, which is generally at the time of the initial release of the product.
Revenue is recognized after deducting estimated reserves for returns, price concessions and other allowances. In circumstances when we do not have a reliable basis to estimate returns and price concessions or are unable to determine that collection of a receivable is probable, we defer the revenue until such time as we can reliably estimate any related returns and allowances and determine that collection of the receivable is probable.
Allowances for Returns, Price Concessions and Other Allowances
We accept returns and grant price concessions in connection with our publishing arrangements. Following reductions in the price of our products, we grant price concessions to permit customers to take credits against amounts they owe us with respect to merchandise unsold by them. Our customers must satisfy certain conditions to entitle them to return products or receive price concessions, including compliance with applicable payment terms and confirmation of field inventory levels.
Generally, our distribution arrangements with customers do not give them the right to return titles or to cancel firm orders. However, we occasionally accept returns from our customers for stock balancing and make accommodations to customers, which include credits and returns, when demand for specific titles falls below expectations.
We make estimates of future product returns and price concessions related to current period product revenue. We estimate the amount of future returns and price concessions for published titles based upon, among other factors, historical experience and performance of the titles in similar genres, historical performance of the hardware platform, customer inventory levels, analysis of sell-through rates, sales force and retail customer feedback, industry pricing, market conditions and changes in demand and acceptance of our products by consumers.
Significant management judgments and estimates must be made and used in connection with establishing the allowance for returns and price concessions in any accounting period. We believe we can make reliable estimates of returns and price concessions. However, actual results may differ from initial estimates as a result of changes in circumstances, market conditions and assumptions. Adjustments to estimates are recorded in the period in which they become known.
80
Consideration Given to Customers and Received from Vendors
We have various marketing arrangements with retailers and distributors of our products that provide for cooperative advertising and market development funds, among others, which are generally based on single exchange transactions. Such amounts are accrued as a reduction to revenue at the later of: (1) the date at which the related revenue is recognized by us, or (2) the date at which the sales incentive is offered, except for cooperative advertising which is included in selling and marketing expense if there is a separate identifiable benefit and the benefit's fair value can be established.
We receive various incentives from our manufacturers, including up-front cash payments as well as rebates based on a cumulative level of purchases. Such amounts are generally accounted for as a reduction in the price of the manufacturer's product and included as a reduction of inventory or cost of goods sold, based on (1) a ratio of current period revenue to the total revenue expected to be recorded over the remaining life of the product or (2) an agreed upon per unit rebate, based on actual units manufactured during the period.
We expense advertising costs as incurred. Advertising expense for the fiscal years ended March 31, 2015, 2014 and 2013 amounted to $132,990, $153,732 and $185,162, respectively, and are included in "Selling and marketing expense" in the Consolidated Statements of Operations.
Earnings (Loss) per Share ("EPS")
Basic EPS is computed by dividing the net income (loss) applicable to common stockholders for the period by the weighted average number of shares of common stock outstanding during the same period. Diluted EPS is computed by dividing the net income (loss) applicable to common stockholders for the period by the weighted average number of shares of common stock and common stock equivalents outstanding.
The following table sets forth the computation of basic and diluted EPS (shares in thousands):
| |
Fiscal Years Ended March 31, | |||||||||
|---|---|---|---|---|---|---|---|---|---|---|
| |
2015 | 2014 | 2013 | |||||||
Computation of Basic EPS: |
||||||||||
Net income (loss) |
$ | (279,470 | ) | $ | 361,605 | $ | (29,491 | ) | ||
Less: net income allocated to participating securities |
— | (41,065 | ) | — | ||||||
| | | | | | | | | | | |
Net income (loss) for basic EPS calculation |
$ | (279,470 | ) | $ | 320,540 | $ | (29,491 | ) | ||
| | | | | | | | | | | |
| | | | | | | | | | | |
| | | | | | | | | | | |
Total weighted average shares outstanding—basic |
80,367 | 95,347 | 85,581 | |||||||
Less: weighted average participating shares outstanding |
— | (10,828 | ) | — | ||||||
| | | | | | | | | | | |
Weighted average common shares outstanding—basic |
80,367 | 84,519 | 85,581 | |||||||
| | | | | | | | | | | |
| | | | | | | | | | | |
| | | | | | | | | | | |
Basic EPS |
$ | (3.48 | ) | $ | 3.79 | $ | (0.34 | ) | ||
| | | | | | | | | | | |
| | | | | | | | | | | |
| | | | | | | | | | | |
Computation of Diluted EPS: |
||||||||||
Net income (loss) |
$ | (279,470 | ) | $ | 361,605 | $ | (29,491 | ) | ||
Less: net income allocated to participating securities |
— | (31,397 | ) | — | ||||||
Add: interest expense, net of tax, on Convertible Notes |
— | 33,718 | — | |||||||
| | | | | | | | | | | |
Net income (loss) for diluted EPS calculation |
$ | (279,470 | ) | $ | 363,926 | $ | (29,491 | ) | ||
| | | | | | | | | | | |
| | | | | | | | | | | |
| | | | | | | | | | | |
Weighted average shares outstanding—basic |
80,367 | 84,519 | 85,581 | |||||||
Add: dilutive effect of common stock equivalents |
— | 29,363 | — | |||||||
| | | | | | | | | | | |
Weighted average common shares outstanding—diluted |
$ | 80,367 | $ | 113,882 | $ | 85,581 | ||||
| | | | | | | | | | | |
| | | | | | | | | | | |
| | | | | | | | | | | |
Diluted EPS |
$ | (3.48 | ) | $ | 3.20 | $ | (0.34 | ) | ||
| | | | | | | | | | | |
| | | | | | | | | | | |
| | | | | | | | | | | |
81
The Company incurred a net loss for the fiscal years ended March 31, 2015 and 2013; therefore, the basic and diluted weighted average shares outstanding exclude the effect of unvested share-based awards that are considered participating securities and all common stock equivalents because their effect would be antidilutive.
Certain of our unvested restricted stock awards (including restricted stock units, time-based and market-based restricted stock awards) are considered participating securities since these securities have non-forfeitable rights to dividends or dividend equivalents during the contractual period of the award, and thus require the two-class method of computing EPS. The calculation of EPS for common stock shown above excludes the income attributable to the participating securities from the numerator and excludes the dilutive effect of those awards from the denominator. For the fiscal year ended March 31, 2015 and 2013 we had 6,061,000 and 7,357,000, respectively, of unvested share-based awards that are considered participating securities which are excluded due to the net loss for those periods.
The Company defines common stock equivalents as unexercised stock options, common stock equivalents underlying the Convertible Notes (see Note 10) and warrants outstanding during the period. Common stock equivalents are measured using the treasury stock method, except for the Convertible Notes, which are assessed for their effect on diluted EPS using the more dilutive of the treasury stock method or the if-converted method. Under the provisions of the if-converted method, the Convertible Notes are assumed to be converted and included in the denominator of the EPS calculation and the interest expense, net of tax, recorded in connection with the Convertible Notes is added back to the numerator.
In connection with the issuance of our 4.375% Convertible Notes in June 2009 (the "4.375% Convertible Notes"), the Company purchased convertible note hedges (see Note 10) which were excluded from the calculation of diluted EPS because their effect is always considered antidilutive since the call option would be exercised by the Company when the exercise price is lower than the market price. Also in connection with the issuance of our 4.375% Convertible Notes, the Company entered into warrant transactions (see Note 10). On June 12, 2013, the Company entered into Unwind Agreements with respect to the convertible note hedge transactions and Unwind Agreements with respect to the warrant transactions with each of the hedge counterparties (see Note 10).
Other common stock equivalents excluded from the diluted EPS calculation were unexercised stock option awards of approximately 2,009,000 for the fiscal year ended March 31, 2013 due to the net loss for those periods.
We have issued stock-based compensation to employees and non-employee consultants, such as ZelnickMedia Corporation ("ZelnickMedia").
We value time-based restricted stock awards to employees using our closing stock price on the date of grant. Time-based restricted stock awards are amortized and recorded as expense on a straight-line basis over their expected vesting period, which is typically three years, and reduced for estimated forfeitures. We apply variable accounting to our non-employee time-based restricted stock awards, whereby we remeasure the value of such awards at each balance sheet date and adjust the value of the awards based on the closing price of our common stock at the end of the reporting period. Changes in the value of the awards from period to period are recorded as stock-based compensation expense over the vesting period, which typically ranges from three to four years.
Estimated forfeitures are adjusted, if necessary, in subsequent periods if actual forfeitures differ from our estimates.
Market-based restricted stock awards are typically awarded to executives and non-employee consultants. We estimate the fair value of market-based awards using the Monte Carlo Simulation method which takes into account the probability that the market conditions of the awards will be achieved. We apply variable
82
accounting to our non-employee market-based awards. We have granted market-based awards that vest based on a variety of conditions. Our employee and non-employee market-based awards are amortized over their estimated derived service period, which typically ranges from three to four years.
The Company also grants performance-based restricted awards to non-employees ZelnickMedia. These awards, of which 50% are tied to "New IP" and 50% to "Major IP" (as defined in the relevant grant agreement), are eligible to vest over a specified period based on the Company's achievement of certain performance metrics (as defined in the relevant grant agreement) of individual product releases of "New IP" or "Major IP". For these types of awards the Company does not record an expense until a performance target(s) have been achieved.
See Note 13 for a full discussion of our stock-based compensation arrangements.
The functional currency for our foreign operations is primarily the applicable local currency. Accounts of foreign operations are translated into U.S. dollars using exchange rates for assets and liabilities at the balance sheet date and average prevailing exchange rates for the period for revenue and expense accounts. Adjustments resulting from translation are included in accumulated other comprehensive income (loss). Realized and unrealized transaction gains and losses are included in our Consolidated Statements of Operations in the period in which they occur, except on inter-company balances considered to be long term. Transaction gains and losses on inter-company balances which are considered to be long term are recorded in accumulated other comprehensive income (loss).
Comprehensive income (loss) is defined to include all changes in equity except those resulting from investments by owners and distributions to owners. The Company's items of accumulated other comprehensive income (loss) include foreign currency translation adjustments, which relate to investments that are permanent in nature and therefore do not require tax adjustments, and the net of tax amounts for unrealized gains (losses) on derivative instruments designated as cash flow hedges and available for sale securities.
The financial results of our former distribution business, which was sold in February 2010, have been classified as Income (loss) from discontinued operations, net of tax in our Consolidated Statements of Operations for the fiscal years ended March 31, 2014 and 2013. The fiscal year ended March 31, 2013 includes an adjustment to decrease the gain on the sale of the business by $1,316.
Recently Issued Accounting Pronouncements
Presentation of Debt Issuance Costs
In April 2015, the Financial Accounting Standards Board ("FASB") issued Accounting Standards Update ("ASU") 2015-03, "Simplifying the Presentation of Debt Issuance Costs." This new guidance requires the presentation of debt issuance costs in the balance sheet as a deduction from the carrying amount of the related debt liability. This update will be applied retrospectively and is effective for annual periods, and interim periods within those years, beginning after December 15, 2015 (April 1, 2016 for the Company). Early adoption is permitted. The adoption of this new guidance is not expected to have a material effect on our Consolidated Financial Statements.
83
Revenue from Contracts with Customers
In May 2014, the FASB issued ASU 2014-09, Revenue from Contracts with Customers, as a new Topic, Accounting Standards Codification Topic 606. The new revenue recognition standard provides a five-step analysis of transactions to determine when and how revenue is recognized. The core principle is that a company should recognize revenue to depict the transfer of promised goods or services to customers in an amount that reflects the consideration to which the entity expects to be entitled in exchange for those goods or services. This ASU is effective for the annual and interim periods beginning after December 15, 2016 (April 1, 2017 for the Company) and shall be applied retrospectively to each period presented or as a cumulative-effect adjustment as of the date of adoption. On April 1, 2015, the FASB proposed deferring the effective date by one year to annual and interim years beginning after December 15, 2017. The proposal permits early adoption, but no earlier than the original effective date of annual and interim periods beginning after December 15, 2016. The Company is currently determining its implementation approach and evaluating the impact of adopting this update on our Consolidated Financial Statements.
Requirements for Reporting Discontinued Operations
In April 2014, the FASB issued ASU 2014-08, Reporting Discontinued Operations and Disclosures of Disposals of Components of an Entity. This new guidance raises the threshold for a disposal to qualify as discontinued operations and requires new disclosures for individually material disposal transactions that do not meet the definition of a discontinued operation. Under the new standard, companies report discontinued operations when they have a disposal that represents a strategic shift that has or will have a major impact on operations or financial results. This update will be applied prospectively and is effective for annual periods, and interim periods within those years, beginning after December 15, 2014 (April 1, 2015 for the Company). Early adoption is permitted provided the disposal was not previously disclosed. The adoption of this new guidance is not expected to have a material effect on our Consolidated Financial Statements.
Presentation of Unrecognized Tax Benefits
In July 2013, new guidance was issued requiring that entities that have an unrecognized tax benefit and a net operating loss carryforward or similar tax loss or tax credit carryforward in the same jurisdiction as the uncertain tax position present the unrecognized tax benefit as a reduction of the deferred tax asset for the loss or tax credit carryforward rather than as a liability when the uncertain tax position would reduce the loss or tax credit carryforward under the tax law. The disclosure requirements became effective for annual periods (and interim periods within those annual periods) beginning after December 15, 2013 (April 1, 2014 for the Company), and are applied prospectively. The adoption of this guidance had no material effect on our Consolidated Financial Statements.
2. MANAGEMENT AGREEMENT
In March 2007, we entered into a management services agreement, which was renewed in May 2011 (as amended, the "2011 Management Agreement") with ZelnickMedia pursuant to which ZelnickMedia provided us with certain management, consulting and executive level services. In March 2014, we entered into a new management agreement, (the "2014 Management Agreement"), with ZelnickMedia pursuant to which ZelnickMedia continues to provide financial and management consulting services to the Company through March 31, 2019. The 2014 Management Agreement became effective April 1, 2014 and supersedes and replaces the 2011 Management Agreement, except as otherwise contemplated by the 2014 Management Agreement. As part of the 2014 Management Agreement, Strauss Zelnick, the President of ZelnickMedia, continues to serve as Executive Chairman and Chief Executive Officer and Karl Slatoff, a partner of ZelnickMedia, continues to serve as President of the Company. The 2014 Management Agreement provides for an annual management fee of $2,970 over the term of the agreement and a maximum annual bonus opportunity of $4,752 over the term of the agreement, based on the Company
84
achieving certain performance thresholds. By comparison, the 2011 Management Agreement provided for an annual management fee of $2,500, subject to annual increases over the term of the agreement, and a maximum annual bonus opportunity of $3,500, subject to annual increases over the term of the agreement, based on the Company achieving certain performance thresholds. In consideration for ZelnickMedia's services, we recorded consulting expense (a component of general and administrative expenses) of $7,737, $6,365 and $6,180 for the fiscal years ended March 31, 2015, 2014 and 2013, respectively.
Pursuant to the 2011 Management Agreement and the 2014 Management Agreement, we also issued stock-based awards to ZelnickMedia. See Note 13 for a discussion of such awards.
3. FAIR VALUE MEASUREMENTS
We follow a three-level fair value hierarchy that prioritizes the inputs used to measure fair value. This hierarchy requires entities to maximize the use of "observable inputs" and minimize the use of "unobservable inputs." The three levels of inputs used to measure fair value are as follows:
- •
- Level 1—Quoted prices in active markets for identical assets or liabilities.
- •
- Level 2—Observable inputs other than quoted prices included in Level 1, such as quoted prices for markets
that are not active or other inputs that are observable or can be corroborated by observable market data.
- •
- Level 3—Unobservable inputs that are supported by little or no market activity and that are significant to the fair value of the assets or liabilities. This includes certain pricing models, discounted cash flow methodologies and similar techniques that use significant unobservable inputs.
The table below segregates all assets that are measured at fair value on a recurring basis (which is measured at least annually) into the most appropriate level within the fair value hierarchy based on the inputs used to determine the fair value at the measurement date.
| March 31, 2015 | Quoted prices in active markets for identical assets (level 1) |
Significant other observable inputs (level 2) |
Significant unobservable inputs (level 3) |
Balance Sheet Classification |
||||||||||
|---|---|---|---|---|---|---|---|---|---|---|---|---|---|---|
Money market funds |
$ | 544,334 | $ | 544,334 | $ | — | $ | — | Cash and cash equivalents | |||||
Bank-time deposits |
79,852 | 79,852 | — | — | Cash and cash equivalents | |||||||||
Corporate bonds |
99,429 | — | 99,429 | — | Short-term investments | |||||||||
Bank-time deposits |
87,500 | 87,500 | — | Short-term investments | ||||||||||
4. SHORT-TERM INVESTMENTS
Our short-term investments consisted of the following as of March 31, 2015:
| |
March 31, 2015 | ||||||||||||
|---|---|---|---|---|---|---|---|---|---|---|---|---|---|
| |
|
Gross Unrealized |
|
||||||||||
| |
Cost or Amortized Cost |
Fair Value |
|||||||||||
| Gains | Losses | ||||||||||||
Short-term investments |
|||||||||||||
Bank-time deposits |
$ | 87,500 | $ | — | $ | — | $ | 87,500 | |||||
Available-for-sale securities: |
|||||||||||||
Corporate bonds |
99,454 | 39 | (64 | ) | 99,429 | ||||||||
| | | | | | | | | | | | | | |
Total short-term investments |
$ | 186,954 | $ | 39 | $ | (64 | ) | $ | 186,929 | ||||
| | | | | | | | | | | | | | |
| | | | | | | | | | | | | | |
| | | | | | | | | | | | | | |
Unrealized gains and losses of the Company's available-for-sale securities are reported as a component of other comprehensive income (loss), net of tax, until the security is sold, the security has matured, or the Company determines that the fair value of the security has declined below its adjusted cost basis and the
85
decline is other-than-temporary. We evaluate our investments for impairment quarterly. The Company considers various factors in the review of investments with an unrealized loss, including the credit quality of the issuer, the duration that the fair value has been less than the adjusted cost basis, the severity of the impairment, the reason for the decline in value and our intent to sell and ability to hold the investment for a period of time sufficient to allow for any anticipated recovery in market value. Based on our review, we did not consider these investments to be other-than-temporarily impaired as of March 31, 2015.
The following table summarizes the contracted maturities of our short-term investments at March 31, 2015:
| |
March 31, 2015 | ||||||
|---|---|---|---|---|---|---|---|
| Amortized Cost |
Fair Value |
||||||
Short-term investments |
|||||||
Due in 1 year or less |
$ | 125,115 | $ | 125,111 | |||
Due in 1-2 years |
61,839 | 61,818 | |||||
| | | | | | | | |
Total short-term investments |
$ | 186,954 | $ | 186,929 | |||
| | | | | | | | |
| | | | | | | | |
| | | | | | | | |
5. INVENTORY
Inventory balances by category are as follows:
| |
March 31, | ||||||
|---|---|---|---|---|---|---|---|
| 2015 | 2014 | ||||||
Finished products |
$ | 17,229 | $ | 28,418 | |||
Parts and supplies |
2,822 | 1,362 | |||||
| | | | | | | | |
Inventory |
$ | 20,051 | $ | 29,780 | |||
| | | | | | | | |
| | | | | | | | |
| | | | | | | | |
Estimated product returns included in inventory at March 31, 2015 and 2014 were $921 and $578, respectively.
6. SOFTWARE DEVELOPMENT COSTS AND LICENSES
Details of our capitalized software development costs and licenses are as follows:
| |
March 31, | ||||||||||||
|---|---|---|---|---|---|---|---|---|---|---|---|---|---|
| |
2015 | 2014 | |||||||||||
| Current | Non-current | Current | Non-current | ||||||||||
Software development costs, internally developed |
$ | 54,225 | $ | 116,026 | $ | 53,041 | $ | 60,196 | |||||
Software development costs, externally developed |
102,713 | 8,303 | 51,643 | 49,310 | |||||||||
Licenses |
6,447 | — | 11,519 | — | |||||||||
| | | | | | | | | | | | | | |
Software development costs and licenses |
$ | 163,385 | $ | 124,329 | $ | 116,203 | $ | 109,506 | |||||
| | | | | | | | | | | | | | |
| | | | | | | | | | | | | | |
| | | | | | | | | | | | | | |
Software development costs and licenses as of March 31, 2015 and 2014 included $211,248 and $211,302, respectively, related to titles that have not been released.
86
Amortization and impairment of software development costs and licenses are as follows:
| |
Fiscal Year Ended March 31, | |||||||||
|---|---|---|---|---|---|---|---|---|---|---|
| 2015 | 2014 | 2013 | ||||||||
Amortization of software development costs and licenses |
$ | 119,488 | $ | 236,759 | $ | 231,423 | ||||
Impariment of software development costs and licenses |
23,947 | 52,863 | 9,385 | |||||||
Less: Portion representing stock-based compensation |
(9,982 | ) | (24,089 | ) | (10,060 | ) | ||||
| | | | | | | | | | | |
Amortization and impairment, net of stock-based compensation |
$ | 133,453 | $ | 265,533 | $ | 230,748 | ||||
| | | | | | | | | | | |
| | | | | | | | | | | |
| | | | | | | | | | | |
7. FIXED ASSETS, NET
Fixed asset balances by category are as follows:
| |
March 31, | ||||||
|---|---|---|---|---|---|---|---|
| 2015 | 2014 | ||||||
Computer equipment |
$ | 73,675 | $ | 55,751 | |||
Computer software |
59,575 | 38,111 | |||||
Leasehold improvements |
35,535 | 33,968 | |||||
Office equipment |
7,002 | 5,672 | |||||
Furniture and fixtures |
7,073 | 5,865 | |||||
| | | | | | | | |
|
182,860 | 139,367 | |||||
Less: accumulated depreciation |
113,068 | 96,795 | |||||
| | | | | | | | |
Fixed assets, net |
$ | 69,792 | $ | 42,572 | |||
| | | | | | | | |
| | | | | | | | |
| | | | | | | | |
Depreciation expense related to fixed assets for the fiscal years ended March 31, 2015, 2014 and 2013 was $21,057, $13,203 and $10,200, respectively.
8. GOODWILL AND INTANGIBLE ASSETS, NET
The change in our goodwill balance is as follows:
| Total | ||||
|---|---|---|---|---|
Balance at March 31, 2013 |
$ | 225,992 | ||
| | | | | |
Additions and adjustments |
— | |||
Currency translation adjustment |
713 | |||
| | | | | |
Balance at March 31, 2014 |
$ | 226,705 | ||
| | | | | |
Additions and adjustments |
— | |||
Currency translation adjustment |
(9,417 | ) | ||
| | | | | |
Balance at March 31, 2015 |
$ | 217,288 | ||
| | | | | |
| | | | | |
| | | | | |
87
The following table sets forth the components of the intangible assets subject to amortization:
| |
|
March 31, | ||||||||||||||||||||
|---|---|---|---|---|---|---|---|---|---|---|---|---|---|---|---|---|---|---|---|---|---|---|
| |
|
2015 | 2014 | |||||||||||||||||||
| |
Estimated useful Lives (Years) |
|||||||||||||||||||||
| Gross Carrying Amount |
Accumulated Amortization |
Net Book Value |
Gross Carrying Amount |
Accumulated Amortization |
Net Book Value |
|||||||||||||||||
Intellectual property |
2-6 | $ | 26,859 | $ | (22,090 | ) | $ | 4,769 | $ | 26,949 | $ | (21,836 | ) | $ | 5,113 | |||||||
Trademarks |
7-10 | 13,782 | (13,782 | ) | — | 13,839 | (13,839 | ) | — | |||||||||||||
Technology |
3 | 3,200 | (3,200 | ) | — | 3,200 | (3,200 | ) | — | |||||||||||||
Non-compete |
5-10 | 5,240 | (5,240 | ) | — | 5,249 | (5,249 | ) | — | |||||||||||||
| | | | | | | | | | | | | | | | | | | | | | | |
|
$ | 49,081 | $ | (44,312 | ) | $ | 4,769 | $ | 49,237 | $ | (44,124 | ) | $ | 5,113 | ||||||||
| | | | | | | | | | | | | | | | | | | | | | | |
| | | | | | | | | | | | | | | | | | | | | | | |
| | | | | | | | | | | | | | | | | | | | | | | |
Amortization of intangible assets is included in our Consolidated Statements of Operations as follows:
| |
Fiscal Year Ended March 31, | |||||||||
|---|---|---|---|---|---|---|---|---|---|---|
| 2015 | 2014 | 2013 | ||||||||
Cost of goods sold |
$ | 344 | $ | 3,558 | $ | 7,000 | ||||
Depreciation and amortization |
— | 156 | 434 | |||||||
| | | | | | | | | | | |
Total amortization of intangible assets |
$ | 344 | $ | 3,714 | $ | 7,434 | ||||
| | | | | | | | | | | |
| | | | | | | | | | | |
| | | | | | | | | | | |
Estimated future amortization of intangible assets that will be recorded in cost of goods sold and operating expenses for the years ending March 31, are as follows:
| |
|
|||
|---|---|---|---|---|
| | | | | |
2016 |
$ | 160 | ||
2017 |
4,036 | |||
2018 |
548 | |||
2019 |
25 | |||
2020 |
— | |||
Thereafter |
— | |||
| | | | | |
Total |
$ | 4,769 | ||
| | | | | |
| | | | | |
| | | | | |
9. ACCRUED EXPENSES AND OTHER CURRENT LIABILITIES
Accrued expenses and other current liabilities consisted of:
| |
March 31, | ||||||
|---|---|---|---|---|---|---|---|
| 2015 | 2014 | ||||||
Software development royalties |
$ | 307,953 | $ | 258,129 | |||
Compensation and benefits |
47,763 | 44,255 | |||||
Licenses |
23,974 | 16,917 | |||||
Marketing and promotions |
21,708 | 16,552 | |||||
Sales tax liability |
8,861 | 6,592 | |||||
Income tax payable and deferred tax liability |
2,482 | 15,362 | |||||
Professional fees |
8,747 | 8,781 | |||||
Other |
23,250 | 30,585 | |||||
| | | | | | | | |
Accrued expenses and other current liabilities |
$ | 444,738 | $ | 397,173 | |||
| | | | | | | | |
| | | | | | | | |
| | | | | | | | |
88
10. LONG-TERM DEBT
Credit Agreement
In August 2014, we entered into a Third Amendment to our Credit Agreement. The Credit Agreement provides for borrowings of up to $100,000 which may be increased by up to $40,000 pursuant to the terms of the Credit Agreement, and is secured by substantially all of our assets and the equity of our subsidiaries. The Credit Agreement expires on August 18, 2019. Revolving loans under the Credit Agreement bear interest at our election of (a) 0.50% to 1.00% above a certain base rate (3.75% at March 31, 2015), or (b) 1.50% to 2.00% above the LIBOR Rate (approximately 1.76% at March 31, 2015), with the margin rate subject to the achievement of certain average liquidity levels. We are also required to pay a monthly fee on the unused available balance, ranging from 0.25% to 0.375% based on availability. We had no outstanding borrowings at March 31, 2015 and 2014.
Availability under the Credit Agreement is restricted by our United States and United Kingdom based accounts receivable and inventory balances. The Credit Agreement also allows for the issuance of letters of credit in an aggregate amount of up to $5,000.
Information related to availability on our Credit Agreement is as follows:
| |
March 31, 2015 | March 31, 2014 | |||||
|---|---|---|---|---|---|---|---|
Available borrowings |
$ | 98,335 | $ | 63,630 | |||
Outstanding letters of credit |
1,664 | 1,664 | |||||
We recorded interest expense and fees related to the Credit Agreement of $518, $637 and $638, for the fiscal years ended March 31, 2015, 2014 and 2013, respectively. The Credit Agreement contains covenants that substantially limit us and our subsidiaries' ability to: create, incur, assume or be liable for indebtedness; dispose of assets outside the ordinary course of business; acquire, merge or consolidate with or into another person or entity; create, incur or allow any lien on any of their respective properties; make investments; or pay dividends or make distributions (each subject to certain limitations); or optionally prepay any indebtedness (subject to certain exceptions, including an exception permitting the redemption of the Company's unsecured convertible senior notes upon the meeting of certain minimum liquidity requirements). In addition, the Credit Agreement provides for certain events of default such as nonpayment of principal and interest, breaches of representations and warranties, noncompliance with covenants, acts of insolvency, default on indebtedness held by third parties and default on certain material contracts (subject to certain limitations and cure periods). The Credit Agreement also contains a requirement that we maintain an interest coverage ratio of more than one to one for the trailing twelve month period, if certain average liquidity levels fall below $30,000. As of March 31, 2015, we were in compliance with all covenants and requirements outlined in the Credit Agreement.
4.375% Convertible Notes Due 2014
In June 2009, we issued $138,000 aggregate principal amount of 4.375% Convertible Notes due 2014. The issuance of the 4.375% Convertible Notes included $18,000 related to the exercise of an over-allotment option by the underwriters. Interest on the 4.375% Convertible Notes was paid semi-annually in arrears on June 1st and December 1st of each year, and commenced on December 1, 2009. The 4.375% Convertible Notes were scheduled to mature on June 1, 2014, unless earlier redeemed or repurchased by the Company or converted. As further described below, on June 12, 2013, we issued a notice of redemption calling all of our outstanding 4.375% Convertible Notes for redemption on August 29, 2013.
We recorded approximately $3,410 of banking, legal and accounting fees related to the issuance of the 4.375% Convertible Notes which were capitalized as debt issuance costs and were being amortized to interest and other, net over the term of the 4.375% Convertible Notes.
89
On June 12, 2013, we issued a notice of redemption calling all of our outstanding 4.375% Convertible Notes, in the aggregate principal amount of $138,000, for redemption on August 29, 2013 at a redemption price of $1 per $1 principal amount, plus accrued and unpaid interest up to, but not including, the redemption date (the period from June 12, 2013 to August 29, 2013 is the "Notice Period"). Holders who elected to convert during the Notice Period were entitled to make-whole shares in addition to such shares they would otherwise be entitled to receive upon conversion. The notice of redemption specified that we would settle any 4.375% Convertible Notes surrendered for conversion in connection with the redemption on a combination settlement basis by paying cash up to a cash amount equal to $166,000 in the aggregate of converted notes and delivering shares of our common stock in respect of the amount, if any, by which our conversion obligation exceeded such cash amount. During the Notice Period, $137,993 of 4.375% Convertible Notes were converted for $165,992 in cash and 3,217,000 shares of our common stock. On August 29, 2013, we paid $7 in cash and we redeemed $7 of 4.375% Convertible Notes. During the fiscal year ended March 31, 2014, we recorded a loss on extinguishment, net of capitalized debt issuance costs, totaling $9,014 related to these transactions.
In connection with the offering of the 4.375% Convertible Notes, we entered into convertible note hedge transactions which were expected to reduce the potential dilution to our common stock upon conversion of the 4.375% Convertible Notes. The transactions included options to purchase approximately 12,927,000 shares of common stock at $10.675 per share, expiring on June 1, 2014, for a total cost of approximately $43,600, which was charged to additional paid-in capital.
Separately, the Company entered into warrant transactions with a strike price of $14.945 per share. The warrants covered approximately 12,927,000 shares of the Company's common stock and were scheduled to expire on August 30, 2014, for total proceeds of approximately $26,300, which was credited to additional paid-in capital.
On June 12, 2013, the Company entered into Unwind Agreements with respect to the convertible note hedge transactions and Unwind Agreements with respect to the warrant transactions with each of the hedge counterparties (collectively, the "Unwind Agreements"). Pursuant to the terms of the Unwind Agreements, and in connection with the Company's issuance of a notice of redemption for all the 4.375% Convertible Notes, the Company had the right to deliver a notice to the hedge counterparties, prior to the redemption date set forth in such redemption notice, designating an early termination date for the convertible note hedge transactions and warrant transactions. The hedge counterparties owed a cash payment to the Company as a result of the early termination of the convertible note hedge transactions that was calculated based on its current fair market value. The Company owed a cash payment to the warrant holders, as applicable, as a result of the early termination of the warrant transactions that was calculated based on its current fair market value. As a result of the Unwind Agreements, the convertible note hedge transactions and warrant transactions were accounted for as derivatives whereby the fair values of these transactions were reported as a convertible note hedge receivable and as a convertible note warrant liability with an offsetting impact to additional paid-in capital. Gains and losses on the derivatives resulting from their unwinding were reported in gain on convertible note hedge and warrants, net, in our Consolidated Statements of Operations. In August 2013, the payment received from unwinding the associated convertible note hedge transactions resulted in proceeds to us of $84,429, offset by $55,651 we paid the warrant holders.
During the fiscal year ended March 31, 2014, we recorded a gain of approximately $17,259 resulting from the unwinding of our convertible note hedge transactions and a loss of approximately $13,798 resulting from the unwinding of our convertible note warrant transactions to gain on convertible note hedge and warrants, net, in our Consolidated Statements of Operations.
90
The following table provides the components of interest expense related to our 4.375% Convertible Notes:
| |
Fiscal Year Ended March 31, |
||||||
|---|---|---|---|---|---|---|---|
| 2014 | 2013 | ||||||
Cash interest expense (coupon interest expense) |
$ | 2,516 | $ | 6,038 | |||
Non-cash amortization of discount on 4.375% Convertible Notes |
4,358 | 9,550 | |||||
Amortization of debt issuance costs |
284 | 682 | |||||
| | | | | | | | |
Total interest expense related to 4.375% Convertible Notes |
$ | 7,158 | $ | 16,270 | |||
| | | | | | | | |
| | | | | | | | |
| | | | | | | | |
1.75% Convertible Notes Due 2016
On November 16, 2011, we issued $250,000 aggregate principal amount of 1.75% Convertible Notes due 2016. The issuance of the 1.75% Convertible Notes included $30,000 related to the exercise of an over-allotment option by the underwriters. Interest on the 1.75% Convertible Notes is payable semi-annually in arrears on June 1st and December 1st of each year, commencing on June 1, 2012. The 1.75% Convertible Notes mature on December 1, 2016, unless earlier repurchased by the Company or converted. The Company does not have the right to redeem the 1.75% Convertible Notes prior to maturity.
The 1.75% Convertible Notes are convertible at an initial conversion rate of 52.3745 shares of our common stock per $1 principal amount of 1.75% Convertible Notes (representing an initial conversion price of approximately $19.093 per share of common stock for a total of approximately 13,094,000 underlying conversion shares) subject to adjustment in certain circumstances. Holders may convert the 1.75% Convertible Notes at their option prior to the close of business on the business day immediately preceding June 1, 2016 only under the following circumstances: (1) during any fiscal quarter commencing after March 31, 2012, if the last reported sale price of the common stock for at least 20 trading days (whether or not consecutive) during a period of 30 consecutive trading days ending on the last trading day of the preceding fiscal quarter is greater than or equal to 130% of the applicable conversion price on each applicable trading day; (2) during the five business day period after any 10 consecutive trading day period (the "measurement period") in which the trading price per $1 principal amount of 1.75% Convertible Notes for each day of that measurement period was less than 98% of the product of the last reported sale price of our common stock and the applicable conversion rate on each such day; or (3) upon the occurrence of specified corporate events. On and after June 1, 2016 until the close of business on the business day immediately preceding the maturity date, holders may convert their 1.75% Convertible Notes at any time, regardless of the foregoing circumstances. Upon conversion, the 1.75% Convertible Notes may be settled, at our election, in cash, shares of our common stock, or a combination of cash and shares of the Company's common stock. Our common stock price exceeded 130% of the applicable conversion price per share for at least 20 trading days during the 30 consecutive trading days ended March 31, 2015. Accordingly, as of April 1, 2015, the 1.75% Convertible Notes may be converted at the holder's option through June 30, 2015. If the 1.75% Convertible Notes were to be converted during this period, our current intent and ability, given our option, would be to settle the conversion in shares of our common stock. As such, we have continued to classify these 1.75% Convertible Notes as long-term debt.
Upon the occurrence of certain fundamental changes involving the Company, holders of the 1.75% Convertible Notes may require us to purchase all or a portion of their 1.75% Convertible Notes for cash at a price equal to 100% of the principal amount of the notes to be purchased, plus accrued and unpaid interest (including additional interest, if any) to, but excluding, the fundamental change purchase date.
91
The indenture governing the 1.75% Convertible Notes contains customary terms and covenants and events of default. If an event of default (as defined therein) occurs and is continuing, the Trustee by notice to the Company, or the holders of at least 25% in aggregate principal amount of the 1.75% Convertible Notes then outstanding by notice to the Company and the Trustee, may, and the Trustee at the request of such holders shall, declare 100% of the principal of and accrued and unpaid interest (including additional interest, if any) on all the 1.75% Convertible Notes to be due and payable. In the case of an event of default arising out of certain bankruptcy events, 100% of the principal of and accrued and unpaid interest (including additional interest, if any), on the 1.75% Convertible Notes will automatically become due and payable immediately. As of March 31, 2015, we were in compliance with all covenants and requirements outlined in the indenture governing the 1.75% Convertible Notes.
The 1.75% Convertible Notes are senior unsecured obligations and rank senior in right of payment to our existing and future indebtedness that is expressly subordinated in right of payment to the 1.75% Convertible Notes; equal in right of payment to our existing and future indebtedness that is not so subordinated; effectively junior in right of payment to any of our secured indebtedness to the extent of the value of the assets securing such indebtedness; and structurally junior to all existing and future indebtedness incurred by our subsidiaries.
We separately account for the liability and equity components of the 1.75% Convertible Notes in a manner that reflects the Company's nonconvertible debt borrowing rate when interest expense is recognized in subsequent periods. We estimated the fair value of the 1.75% Convertible Notes to be $197,373, as of the date of issuance of our 1.75% Convertible Notes, assuming a 6.9% non-convertible borrowing rate. The carrying amount of the equity component was determined to be $52,627 by deducting the fair value of the liability component from the par value of the 1.75% Convertible Notes. The excess of the principal amount of the liability component over its carrying amount is amortized to interest and other, net over the term of the 1.75% Convertible Notes using the effective interest method. The equity component is not remeasured as long as it continues to meet the conditions for equity classification. In accounting for the $6,875 of banking, legal and accounting fees related to the issuance of the 1.75% Convertible Notes, we allocated $5,428 to the liability component and $1,447 to the equity component. Debt issuance costs attributable to the liability component are being amortized to interest and other, net over the term of the 1.75% Convertible Notes, and issuance costs attributable to the equity component were netted with the equity component in additional paid-in capital.
As of March 31, 2015 and 2014, the if-converted value of our 1.75% Convertible Notes exceeded the principal amount of $250,000 by $83,373 and $37,151, respectively.
The following table provides additional information related to our 1.75% Convertible Notes:
| |
March 31, | ||||||
|---|---|---|---|---|---|---|---|
| 2015 | 2014 | ||||||
Additional paid-in capital |
$ | 51,180 | $ | 51,180 | |||
| | | | | | | | |
Principal amount of 1.75% Convertible Notes |
$ | 250,000 | $ | 250,000 | |||
Unamortized discount of the liability component |
19,386 | 30,025 | |||||
| | | | | | | | |
Net carrying amount of 1.75% Convertible Notes |
$ | 230,614 | $ | 219,975 | |||
| | | | | | | | |
Carrying amount of debt issuance costs |
$ | 1,662 | $ | 2,716 | |||
| | | | | | | | |
92
The following table provides the components of interest expense related to our 1.75% Convertible Notes:
| |
Fiscal Year Ended March 31, | |||||||||
|---|---|---|---|---|---|---|---|---|---|---|
| 2015 | 2014 | 2013 | ||||||||
Cash interest expense (coupon interest expense) |
$ | 4,375 | $ | 4,375 | $ | 4,375 | ||||
Non-cash amortization of discount on 1.75% Convertible Notes |
10,639 | 9,954 | 9,312 | |||||||
Amortization of debt issuance costs |
1,054 | 1,105 | 1,158 | |||||||
| | | | | | | | | | | |
Total interest expense related to 1.75% Convertible Notes |
$ | 16,068 | $ | 15,434 | $ | 14,845 | ||||
| | | | | | | | | | | |
| | | | | | | | | | | |
| | | | | | | | | | | |
1.00% Convertible Notes Due 2018
On June 18, 2013, we issued $250,000 aggregate principal amount of 1.00% Convertible Notes due 2018. The 1.00% Convertible Notes were issued at 98.5% of par value for proceeds of $246,250. Interest on the 1.00% Convertible Notes is payable semi-annually in arrears on July 1st and January 1st of each year, commencing on January 1, 2014. The 1.00% Convertible Notes mature on July 1, 2018, unless earlier repurchased by the Company or converted. The Company does not have the right to redeem the 1.00% Convertible Notes prior to maturity. The Company also granted the underwriters a 30-day option to purchase up to an additional $37,500 principal amount of 1.00% Convertible Notes to cover overallotments, if any. On July 17, 2013, the Company closed its public offering of $37,500 principal amount of the Company's 1.00% Convertible Notes as a result of the underwriters exercising their overallotment option in full on July 12, 2013, bringing the total proceeds to $283,188.
The 1.00% Convertible Notes are convertible at an initial conversion rate of 46.4727 shares of our common stock per $1 principal amount of 1.00% Convertible Notes (representing an initial conversion price of approximately $21.52 per share of common stock for a total of approximately 13,361,000 underlying conversion shares) subject to adjustment in certain circumstances. Holders may convert the 1.00% Convertible Notes at their option prior to the close of business on the business day immediately preceding January 1, 2018 only under the following circumstances: (1) during any fiscal quarter commencing after September 30, 2013, if the last reported sale price of the common stock for at least 20 trading days (whether or not consecutive) during a period of 30 consecutive trading days ending on the last trading day of the preceding fiscal quarter is greater than or equal to 130% of the applicable conversion price on each applicable trading day; (2) during the five business day period after any 10 consecutive trading day period (the "measurement period") in which the trading price per $1 principal amount of 1.00% Convertible Notes for each day of that measurement period was less than 98% of the product of the last reported sale price of our common stock and the applicable conversion rate on each such day; or (3) upon the occurrence of specified corporate events. On and after January 1, 2018 until the close of business on the business day immediately preceding the maturity date, holders may convert their 1.00% Convertible Notes at any time, regardless of the foregoing circumstances. Upon conversion, the 1.00% Convertible Notes may be settled, at our election, in cash, shares of our common stock, or a combination of cash and shares of the Company's common stock.
Upon the occurrence of certain fundamental changes involving the Company, holders of the 1.00% Convertible Notes may require us to purchase all or a portion of their 1.00% Convertible Notes for cash at a price equal to 100% of the principal amount of the notes to be purchased, plus accrued and unpaid interest (including additional interest, if any) to, but excluding, the fundamental change purchase date.
The indenture governing the 1.00% Convertible Notes contains customary terms and covenants and events of default. If an event of default (as defined therein) occurs and is continuing, the Trustee by notice to the Company, or the holders of at least 25% in aggregate principal amount of the 1.00% Convertible Notes then outstanding by notice to the Company and the Trustee, may, and the Trustee at the request of such holders shall, declare 100% of the principal of and accrued and unpaid interest (including additional interest, if any) on all the 1.00% Convertible Notes to be due and payable. In the case of an event of
93
default arising out of certain bankruptcy events, 100% of the principal of and accrued and unpaid interest (including additional interest, if any), on the 1.00% Convertible Notes will automatically become due and payable immediately. As of March 31, 2014, we were in compliance with all covenants and requirements outlined in the indenture governing the 1.00% Convertible Notes.
The 1.00% Convertible Notes are senior unsecured obligations and rank senior in right of payment to our existing and future indebtedness that is expressly subordinated in right of payment to the 1.00% Convertible Notes; equal in right of payment to our existing and future indebtedness that is not so subordinated; effectively junior in right of payment to any of our secured indebtedness to the extent of the value of the assets securing such indebtedness; and structurally junior to all existing and future indebtedness incurred by our subsidiaries.
We separately account for the liability and equity components of the 1.00% Convertible Notes in a manner that reflects the Company's nonconvertible debt borrowing rate. We estimated the fair value of the 1.00% Convertible Notes to be $225,567 upon issuance of our 1.00% Convertible Notes, assuming a 6.15% non- convertible borrowing rate. The carrying amount of the equity component was determined to be approximately $57,621 by deducting the fair value of the liability component from the net proceeds of the 1.00% Convertible Notes. The excess of the principal amount of the liability component over its carrying amount is amortized to interest and other, net over the term of the 1.00% Convertible Notes using the effective interest method. The equity component is not remeasured as long as it continues to meet the conditions for equity classification. In accounting for the $2,815 of banking, legal and accounting fees related to the issuance of the 1.00% Convertible Notes, we allocated $2,209 to the liability component and $606 to the equity component. Debt issuance costs attributable to the liability component are being amortized to interest and other, net over the term of the 1.00% Convertible Notes, and issuance costs attributable to the equity component were netted with the equity component in additional paid-in capital.
As of March 31, 2015 and 2014, the if-converted value of our 1.00% Convertible Notes exceeded the principal amount of $287,500 by $52,671 and $5,507, respectively.
The following table provides additional information related to our 1.00% Convertible Notes:
| |
March 31, | ||||||
|---|---|---|---|---|---|---|---|
| 2015 | 2014 | ||||||
Additional paid-in capital |
$ | 35,784 | $ | 35,784 | |||
| | | | | | | | |
Principal amount of 1.00% Convertible Notes |
$ | 287,500 | $ | 287,500 | |||
Unamortized discount of the liability component |
42,057 | 53,444 | |||||
| | | | | | | | |
Net carrying amount of 1.00% Convertible Notes |
$ | 245,443 | $ | 234,056 | |||
| | | | | | | | |
Carrying amount of debt issuance costs |
$ | 1,365 | $ | 1,831 | |||
| | | | | | | | |
| | | | | | | | |
| | | | | | | | |
The following table provides the components of interest expense related to our 1.00% Convertible Notes:
| |
Fiscal Year Ended March 31, |
||||||
|---|---|---|---|---|---|---|---|
| 2015 | 2014 | ||||||
Cash interest expense (coupon interest expense) |
$ | 2,875 | $ | 2,259 | |||
Non-cash amortization of discount on 1.00% Convertible Notes |
11,387 | 8,489 | |||||
Amortization of debt issuance costs |
466 | 378 | |||||
| | | | | | | | |
Total interest expense related to 1.00% Convertible Notes |
$ | 14,728 | $ | 11,126 | |||
| | | | | | | | |
| | | | | | | | |
| | | | | | | | |
94
11. COMMITMENTS AND CONTINGENCIES
A summary of annual minimum contractual obligations and commitments as of March 31, 2015 is as follows:
Fiscal Year Ending March 31,
|
Software Development and Licensing |
Marketing | Operating Leases |
Purchase Obligations |
Convertible Notes Interest |
Convertible Notes |
Total | |||||||||||||||
|---|---|---|---|---|---|---|---|---|---|---|---|---|---|---|---|---|---|---|---|---|---|---|
2016 |
$ | 81,612 | $ | 24,591 | $ | 19,558 | $ | 21,556 | $ | 7,250 | $ | — | $ | 154,567 | ||||||||
2017 |
62,320 | 5,675 | 17,007 | 12,207 | 7,250 | 250,000 | 354,459 | |||||||||||||||
2018 |
48,011 | 4,717 | 15,255 | 5,543 | 2,875 | — | 76,401 | |||||||||||||||
2019 |
27,204 | 43,423 | 15,452 | 1,593 | 1,438 | 287,500 | 376,610 | |||||||||||||||
2020 |
8,200 | 9,500 | 11,092 | — | — | — | 28,792 | |||||||||||||||
Thereafter |
— | — | 36,727 | — | — | — | 36,727 | |||||||||||||||
| | | | | | | | | | | | | | | | | | | | | | | |
Total |
$ | 227,347 | $ | 87,906 | $ | 115,091 | $ | 40,899 | $ | 18,813 | $ | 537,500 | $ | 1,027,556 | ||||||||
| | | | | | | | | | | | | | | | | | | | | | | |
| | | | | | | | | | | | | | | | | | | | | | | |
| | | | | | | | | | | | | | | | | | | | | | | |
Software Development and Licensing Agreements: We make payments to third-party software developers that include contractual payments to developers under several software development agreements that expire at various times through September 2019. Our aggregate outstanding software development commitments assume satisfactory performance by third-party software developers. We also have licensing commitments that primarily consist of obligations to holders of intellectual property rights for use of their trademarks, copyrights, technology or other intellectual property rights in the development of our products.
Marketing Agreements: We have certain minimum marketing support commitments where we commit to spend specified amounts related to marketing our products. Licensing and marketing commitments expire at various times through September 2019 and primarily reflect our agreements with major sports leagues and players' associations.
Lease Commitments: Our offices are occupied under non-cancelable operating leases expiring at various times through June 2024. We also lease certain furniture, equipment and automobiles under non-cancelable leases expiring through fiscal year 2020. Some of the leases have fixed rent increases and also include inducements to enter into the lease. The effect of such amounts are deferred and recognized on a straight-line basis over the related lease term. Rent expense amounted to $18,120, $15,574 and $15,107 for the fiscal years ended March 31, 2015, 2014 and 2013, respectively.
Purchase obligations: These obligations are primarily related to agreements to purchase services that are enforceable and legally binding on the Company that specifies all significant terms, including fixed, minimum or variable pricing provisions; and the approximate timing of the transactions, expiring at various times through March 2019.
Contingent Consideration: Part of our business acquisition strategy has been to make a portion of the purchase price of certain acquisitions dependent on product delivery or future product sales. The amounts and timing of these payments are currently not fixed or determinable. Our acquisition of 2K Czech a.s., formerly known as Illusion Softworks, a.s, in December 2007, had contingent payments in cash and stock based on future product sales of up to $10,000, of which $8,601 was paid as of March 31, 2015. Under the terms of our acquisition of the assets of Rockstar New England, Inc., formerly known as Mad Doc Software LLC, in March 2008 up to $15,000 payable in cash or stock, based on meeting certain employment provisions and future product sales, of which $2,750 was paid as of March 31, 2015. During the year ended March 31, 2015, we paid $99 by issuing 7,616 shares of our unregistered common stock as contingent consideration for our prior year acquisitions. During the fiscal year ended March 31, 2014, we paid contingent consideration of $1,000 for our prior acquisitions. During the fiscal year ended March 31,
95
2013, we paid $400 by issuing 30,726 shares of our unregistered common stock as contingent consideration for our prior year acquisitions.
Employee Savings Plans: For our United States employees we maintain a 401(k) retirement savings plan and trust. Our 401(k) plan is offered to all eligible employees and participants may make voluntary contributions. We also have various pension plans for our non-U.S. employees, some of which are required by local laws, and allow or require Company contributions. Employer contributions under all defined contribution and pension plans during the fiscal years ended March 31, 2015, 2014 and 2013 were $8,554, $7,476 and $6,089, respectively.
Income Taxes: At March 31, 2015, the Company had recorded a liability for gross unrecognized tax benefits, including interest and penalties, of $29,153 for which we are unable to make a reasonable and reliable estimate of the period in which these liabilities will be settled with the respective tax authorities, therefore, these liabilities have not been included in the contractual obligations table.
Legal and Other Proceedings: We are, or may become, subject to demands and claims (including intellectual property claims) and are involved in routine litigation in the ordinary course of business which we do not believe to be material to our business or financial statements. We have appropriately accrued amounts related to certain of these claims and legal and other proceedings. While it is reasonably possible that a loss may be incurred in excess of the amounts accrued in our financial statements, we believe that such losses, unless otherwise disclosed, would not be material.
12. INCOME TAXES
Components of income (loss) before income taxes are as follows:
| |
Fiscal Year Ended March 31, | |||||||||
|---|---|---|---|---|---|---|---|---|---|---|
| 2015 | 2014 | 2013 | ||||||||
Domestic |
$ | (126,582 | ) | $ | 197,992 | $ | 16,924 | |||
Foreign |
(146,298 | ) | 178,158 | (43,036 | ) | |||||
| | | | | | | | | | | |
Income (loss) from continuing operations before income taxes |
$ | (272,880 | ) | $ | 376,150 | $ | (26,112 | ) | ||
| | | | | | | | | | | |
| | | | | | | | | | | |
| | | | | | | | | | | |
Provision for current and deferred income taxes consists of the following:
| |
Fiscal Year Ended March 31, | |||||||||
|---|---|---|---|---|---|---|---|---|---|---|
| 2015 | 2014 | 2013 | ||||||||
Current: |
||||||||||
U.S. federal |
$ | 2,773 | $ | 16,340 | $ | 3,705 | ||||
U.S. state and local |
(1,406 | ) | 4,527 | 456 | ||||||
Foreign |
2,944 | 12,628 | 1,730 | |||||||
| | | | | | | | | | | |
Total current income taxes |
4,311 | 33,495 | 5,891 | |||||||
Deferred: |
||||||||||
U.S. federal |
1,575 | (14,216 | ) | (1,821 | ) | |||||
U.S. state and local |
72 | (3,462 | ) | 134 | ||||||
Foreign |
632 | (1,358 | ) | 846 | ||||||
| | | | | | | | | | | |
Total deferred income taxes |
2,279 | (19,036 | ) | (841 | ) | |||||
| | | | | | | | | | | |
Provision for income taxes |
$ | 6,590 | $ | 14,459 | $ | 5,050 | ||||
| | | | | | | | | | | |
| | | | | | | | | | | |
| | | | | | | | | | | |
96
A reconciliation of our effective tax rate to the U.S. statutory federal income tax rate is as follows:
| |
Fiscal Year Ended March 31, |
|||||||||
|---|---|---|---|---|---|---|---|---|---|---|
| 2015 | 2014 | 2013 | ||||||||
U.S. federal statutory rate |
35.0 | % | 35.0 | % | 35.0 | % | ||||
Foreign tax rate differential |
(12.1 | )% | (10.4 | )% | (41.5 | )% | ||||
Tax amortization of goodwill |
(0.6 | )% | 0.5 | % | (7.7 | )% | ||||
Foreign earnings |
1.1 | % | 1.6 | % | (4.0 | )% | ||||
State and local taxes, net of U.S. federal benefit |
0.9 | % | 0.3 | % | (2.3 | )% | ||||
Valuation allowance—domestic |
(16.8 | )% | (19.8 | )% | 28.4 | % | ||||
Valuation allowance—foreign |
(5.1 | )% | (5.1 | )% | (22.2 | )% | ||||
Other |
(4.8 | )% | 1.7 | % | (5.0 | )% | ||||
| | | | | | | | | | | |
Effective tax rate |
(2.4 | )% | 3.8 | % | (19.3 | )% | ||||
| | | | | | | | | | | |
| | | | | | | | | | | |
| | | | | | | | | | | |
97
The effects of temporary differences that gave rise to our deferred tax assets and liabilities were as follows:
| |
March 31, | ||||||
|---|---|---|---|---|---|---|---|
| 2015 | 2014 | ||||||
Deferred tax assets: |
|||||||
Current deferred tax assets: |
|||||||
Sales returns and allowances (including bad debt) |
$ | 8,670 | $ | 8,757 | |||
Inventory reserves |
892 | 1,120 | |||||
Deferred rent |
4,692 | 3,364 | |||||
Deferred revenue |
5,011 | 15,157 | |||||
Bonus |
30,391 | 20,586 | |||||
Equity compensation |
21,660 | 17,232 | |||||
Other |
— | 6,545 | |||||
| | | | | | | | |
Total current deferred tax assets |
71,316 | 72,761 | |||||
Less: Valuation allowance |
(35,826 | ) | (26,689 | ) | |||
| | | | | | | | |
Net current deferred tax assets |
35,490 | 46,072 | |||||
| | | | | | | | |
Noncurrent deferred tax assets: |
|||||||
Equity compensation |
— | 2,552 | |||||
Domestic net operating loss carryforward |
70,159 | 3,645 | |||||
Tax credit carryforward |
60,278 | 17,368 | |||||
Foreign net operating loss carryforwards |
22,390 | 8,083 | |||||
Other |
10 | — | |||||
| | | | | | | | |
Total noncurrent deferred tax assets |
152,837 | 31,648 | |||||
Less: Valuation allowance |
(97,642 | ) | (14,085 | ) | |||
| | | | | | | | |
Net noncurrent deferred tax assets |
55,195 | 17,563 | |||||
| | | | | | | | |
Deferred tax liabilities: |
|||||||
Current deferred tax liabilities: |
|||||||
Capitalized software and depreciation |
(21,725 | ) | (25,806 | ) | |||
Other |
(703 | ) | — | ||||
| | | | | | | | |
Total current deferred tax liabilities |
(22,428 | ) | (25,806 | ) | |||
| | | | | | | | |
Net current deferred tax asset |
13,062 | 20,266 | |||||
| | | | | | | | |
Noncurrent deferred tax liabilities: |
|||||||
Convertible debt |
(21,391 | ) | (29,222 | ) | |||
Intangible amortization |
(4,356 | ) | (4,408 | ) | |||
Capitalized software and depreciation |
(47,573 | ) | (6,983 | ) | |||
| | | | | | | | |
Total noncurrent deferred tax liabilities |
(73,320 | ) | (40,613 | ) | |||
| | | | | | | | |
Net noncurrent deferred tax liability |
$ | (18,125 | ) | $ | (23,050 | ) | |
| | | | | | | | |
| | | | | | | | |
| | | | | | | | |
The valuation allowance is primarily attributable to deferred tax assets for which no benefit is provided due to uncertainty with respect to their realization. The net deferred tax liability is primarily the result of deferred tax liabilities related to indefinite lived intangibles, which cannot be used to offset deferred tax assets.
At March 31, 2015, we had domestic net operating loss carryforwards totaling $70,159 of which $1,451 will expire in 2027, $2,155 will expire in 2030 and $66,553 will expire in 2035. In addition, we had foreign net operating loss carryforwards of $22,390, of which $1,873 expire in 2019, $4,091 will expire in 2020, $14,709 will expire in 2022 and the remainder may be carried forward indefinitely.
98
The total amount of undistributed earnings of foreign subsidiaries was approximately $156,000 at March 31, 2015 and $315,700 at March 31, 2014. It is our intention to reinvest undistributed earnings of our foreign subsidiaries and thereby indefinitely postpone their remittance. Accordingly, no provision has been made for foreign withholding taxes or U.S. income taxes which may become payable if undistributed earnings of foreign subsidiaries are repatriated. It is not practicable to estimate the tax liability that would arise if these earnings were remitted.
We are regularly audited by domestic and foreign taxing authorities. Audits may result in tax assessments in excess of amounts claimed and the payment of additional taxes. We believe that our tax return positions comply with applicable tax law and that we have adequately provided for reasonably foreseeable assessments of additional taxes. Additionally, we believe that any assessments in excess of the amounts provided for will not have a material adverse effect on the Consolidated Financial Statements.
As of March 31, 2015 and March 31, 2014, we had gross unrecognized tax benefits, including interest and penalties, of $42,706 and $24,880, respectively, of which $29,153 and $24,880, respectively, would affect our effective tax rate if realized.
The aggregate changes to the liability for gross uncertain tax positions, excluding interest and penalties, were as follows:
| |
Fiscal Year Ended March 31, | |||||||||
|---|---|---|---|---|---|---|---|---|---|---|
| 2015 | 2014 | 2013 | ||||||||
Balance, beginning of period |
$ | 23,536 | $ | 20,400 | $ | 20,328 | ||||
Additions: |
||||||||||
Current year tax positions |
8,297 | 5,069 | 73 | |||||||
Prior year tax positions |
9,040 | 2,008 | 2,812 | |||||||
Reduction of prior year tax positions |
(256 | ) | (3,219 | ) | (2,605 | ) | ||||
Lapse of statute of limitations |
(26 | ) | (667 | ) | (81 | ) | ||||
Other, net |
— | (55 | ) | (127 | ) | |||||
| | | | | | | | | | | |
Balance, end of period |
$ | 40,591 | $ | 23,536 | $ | 20,400 | ||||
| | | | | | | | | | | |
| | | | | | | | | | | |
| | | | | | | | | | | |
We recognize interest and penalties related to uncertain tax positions in the provision for income taxes in our Consolidated Statements of Operations. For the fiscal years ended March 31, 2015 and March 31, 2014, we recognized an increase in interest and penalties of approximately $771 and $32, respectively. For the fiscal year ended March 31, 2013, we recognized a decrease in interest and penalties of approximately $766. The gross amount of interest and penalties accrued as of March 31, 2015 and March 31, 2014 was approximately $2,115 and $1,344, respectively.
We are generally no longer subject to audit for U.S. federal income tax returns for periods prior to our fiscal year ended March 31, 2011 and state income tax returns for periods prior to the fiscal year ended October 31, 2010. With few exceptions, we are no longer subject to income tax examinations in non-U.S. jurisdictions for years prior to our fiscal year ended October 31, 2010. U.S. federal taxing authorities have completed examinations of our income tax returns through the fiscal years ended October 31, 2009. The statute relating to fiscal year October 31, 2010 has expired. Certain U.S. state taxing authorities are currently examining our income tax returns for fiscal years ended March 31, 2011 through March 31, 2013. The determination as to further adjustments to our gross unrecognized tax benefits during the next 12 months is not practicable.
We believe that we have provided for any reasonably foreseeable outcomes related to our tax audits and that any settlement will not have a material adverse effect on our consolidated financial statements. However, there can be no assurances as to the possible outcomes.
99
13. STOCK-BASED COMPENSATION
Our stock-based compensation plans are broad-based, long-term retention programs intended to attract and retain talented employees and align stockholder and employee interests. For similar reasons, we also granted non-employee equity awards, which are subject to variable accounting, to ZelnickMedia in connection with their contract to provide executive management services to us. Under certain of our unvested restricted stock awards (including restricted stock units, time-based and market-based restricted stock awards) we issue shares to employees on the date the restricted stock awards are granted and therefore shares granted have voting rights, participate in dividends and are considered issued and outstanding. Shares issued for any restricted stock awards that are forfeited prior to vesting are canceled and no longer outstanding. In April 2009, our stockholders approved our 2009 Stock Incentive Plan (the "2009 Plan"). The aggregate number of shares issuable under this plan was 6,409,000, representing 4,900,000 new shares available for grant approved by our stockholders and 1,509,000 shares allocated from the Incentive Stock Plan and 2002 Stock Option Plan. Our stockholders have further approved amendments to the 2009 Plan to increase the available shares for issuance by 20,800,000. The 2009 Plan is administered by the Compensation Committee of the Board of Directors and allows for awards of restricted stock, deferred stock and other stock-based awards of our common stock to employees and non-employees. As of March 31, 2015, there were approximately 3,555,000 shares available for issuance under the 2009 Plan.
Subject to the provisions of the plans, the Board of Directors or any Committee appointed by the Board of Directors, has the authority to determine the individuals to whom the equity awards are to be granted, the number of shares to be covered by each equity award, the vesting period, restrictions, if any, on the equity award, the terms and conditions of the equity award.
The following table summarizes stock-based compensation expense included in our Consolidated Statements of Operations:
| |
Fiscal Year Ended March 31, | |||||||||
|---|---|---|---|---|---|---|---|---|---|---|
| 2015 | 2014 | 2013 | ||||||||
Cost of goods sold |
$ | 17,121 | $ | 30,124 | $ | 10,060 | ||||
Selling and marketing |
8,798 | 10,136 | 5,562 | |||||||
General and administrative |
33,636 | 28,991 | 17,824 | |||||||
Research and development |
5,691 | 8,867 | 2,319 | |||||||
| | | | | | | | | | | |
Stock-based compensation expense |
$ | 65,246 | $ | 78,118 | $ | 35,765 | ||||
| | | | | | | | | | | |
| | | | | | | | | | | |
| | | | | | | | | | | |
Capitalized stock-based compensation expense |
$ | 17,423 | $ | 26,156 | $ | 6,964 | ||||
| | | | | | | | | | | |
| | | | | | | | | | | |
| | | | | | | | | | | |
During the fiscal years ended March 31, 2015, 2014 and 2013, we recorded $24,449, $16,807 and $8,789, respectively, of stock-based compensation expense for non-employee awards, which is included in general and administrative expenses in the table above.
We capitalize and amortize stock-based compensation awards in accordance with our software development cost accounting policy.
Restricted Stock and Restricted Stock Units
Restricted stock and restricted stock unit awards granted to employees under our stock-based compensation plans generally vest annually over 3 years from the date of grant. Certain restricted stock awards granted to key officers, senior-level employees, and key employees vest based on market conditions, primarily related to the performance of the price of our common stock.
100
In June 2008, pursuant to the Management Agreement, we granted 600,000 shares of restricted stock to ZelnickMedia that vested annually over a three year period and 900,000 shares of market-based restricted stock that could have vested over a four year period through June 2012, provided that the Company's Total Shareholder Return (as defined in the relevant grant agreements) was at or higher than the 75th percentile of the NASDAQ Industrial Index measured annually on a cumulative basis. Because the price of our common stock did not achieve its performance targets, the 900,000 shares of market-based restricted stock were forfeited in June 2012. In April 2011, pursuant to the 2011 Management Agreement, we granted 1,100,000 shares of restricted stock to ZelnickMedia that will vest annually through May 15, 2015 and 1,650,000 shares of market-based restricted stock that will be eligible to vest through May 15, 2015, based on the Company's Total Shareholder Return (as defined in the relevant grant agreements) relative to the Total Shareholder Return of the companies that constitute the NASDAQ Composite Index measured annually on a cumulative basis. To earn all of the shares of market-based restricted stock, the Company must perform at the 75th percentile, or top quartile, of the NASDAQ Composite Index. The unvested portion of the shares of restricted stock granted pursuant to the 2011 Management Agreement as of March 31, 2015 and 2014 was 1,133,000 and 1,894,750 shares, respectively. For the fiscal years ended March 31, 2015, 2014 and 2013, we recorded expenses of $18,145, $16,807 and $8,789 of stock-based compensation (a component of general and administrative expenses) related to the shares of restricted stock granted pursuant to the 2011 Management Agreement.
In connection with the 2014 Management Agreement, on April 1, 2014, we granted 178,654 time-based restricted stock units to ZelnickMedia that will vest on April 1, 2016, provided that the 2014 Management Agreement has not been terminated prior to such vesting date. In addition, we granted 330,628 market-based restricted stock units that are eligible to vest based on the Company's Total Shareholder Return (as defined in the relevant grant agreement) relative to the Total Shareholder Return (as defined in the relevant grant agreement) of the companies that constitute the NASDAQ Composite Index as of the grant date measured over the two-year period ending on April 1, 2016. To earn the target number of 165,314 market-based restricted stock units, the Company must perform at the 50th percentile, with the maximum number of 330,628 market-based restricted units if the Company performs at the 75th percentile. Each reporting period, we remeasure the fair value of the unvested portion of the shares of market-based restricted units granted to ZelnickMedia. We also granted 110,208 performance-based restricted stock units, of which 50% are tied to "New IP" and 50% to "Major IP" (as defined in the relevant grant agreement), that are eligible to vest based on the Company's achievement of certain performance metrics (as defined in the relevant grant agreement) of individual product releases of "New IP" or "Major IP" measured over the two-year period ending on April 1, 2016. The target number of performance-based restricted stock units that may be earned pursuant to these grants is 55,104, with a maximum number of 110,208 performance-based restricted stock units. Each reporting period, we assess the performance metric and upon achievement of certain thresholds record an expense for the unvested portion of the shares of performance-based restricted stock units. During the fiscal year ended March 31, 2015, the maximum target performance vesting condition for "New IP" and "Major IP" unit sales was achieved. As a result, the Company recorded an expense of approximately $420 in stock compensation for the fiscal year ended March 31, 2015.
The unvested portion of time-based, market-based and performance-based restricted units granted pursuant to the 2014 Management Agreement as of March 31, 2015 was 619,490. For the fiscal year ended March 31, 2015 we recorded an expense of $6,304 of stock-based compensation (a component of general and administrative expenses) related to the restricted stock units granted pursuant to the 2014 Management Agreement
We measure the fair value of our market-based awards to employees and non-employees using the Monte Carlo Simulation method, which takes into account assumptions such as the expected volatility of our common stock, the risk-free interest rate based on the contractual term of the award, expected dividend yield, vesting schedule and the probability that the market conditions of the award will be achieved. The
101
estimated value of market-based restricted stock awards granted to employees during the fiscal years ended March 31, 2015, 2014 and 2013 was $36.56, $15.73 and $9.36 per share, respectively.
Each reporting period, we remeasure the fair value of the unvested portion of the market-based restricted stock awards granted to ZelnickMedia. For the fiscal years ended March 31, 2015, 2014 and 2013, the estimated value of the awards granted to ZelnickMedia during the fiscal year ended March 31, 2012 was $24.21, $11.83 and $7.65 per share, respectively. The following table summarizes the weighted-average assumptions used in the Monte Carlo Simulation method:
| |
Fiscal Year Ended March 31, | ||||||||||||||||||
|---|---|---|---|---|---|---|---|---|---|---|---|---|---|---|---|---|---|---|---|
| |
2015 | 2014 | 2013 | ||||||||||||||||
| Employee Market-Based |
Non-Employee Market-Based |
Employee Market-Based |
Non-Employee Market-Based |
Employee Market-Based |
Non-Employee Market-Based |
||||||||||||||
Risk-free interest rate |
0.4 | % | 0.1 | % | 0.6 | % | 0.2 | % | 0.6 | % | 0.3 | % | |||||||
Expected stock price volatility |
31.9 | % | 33.7 | % | 39.1 | % | 36.5 | % | 49.3 | % | 40.0 | % | |||||||
Expected service period (years) |
2.0 | 3.7 | 2.0 | 3.4 | 2.8 | 3.3 | |||||||||||||
Dividends |
None | None | None | None | None | None | |||||||||||||
The following table summarizes the activity in non-vested restricted stock awards to employees and ZelnickMedia under our stock-based compensation plans:
| Shares (in thousands) |
Weighted Average Fair Value on Grant Date |
||||||
|---|---|---|---|---|---|---|---|
Non-vested restricted stock at March 31, 2014 |
11,155 | $ | 11.38 | ||||
Granted |
2,090 | 26.09 | |||||
Vested |
(3,576 | ) | 14.38 | ||||
Forfeited |
(674 | ) | 11.88 | ||||
| | | | | | | | |
Non-vested restricted stock at March 31, 2015 |
8,995 | $ | 17.52 | ||||
| | | | | | | | |
| | | | | | | | |
| | | | | | | | |
As of March 31, 2015, the total future unrecognized compensation cost, net of estimated forfeitures, related to outstanding unvested restricted stock and restricted stock unit awards was approximately $107,014 and will be recognized as compensation expense on a straight-line basis over the remaining vesting period, or capitalized as software development costs.
Stock Options
Pursuant to the Management Agreement, in August 2007, we issued stock options to ZelnickMedia to acquire 2,009,075 shares of our common stock at an exercise price of $14.74 per share, which vested over 36 months and expire 10 years from the date of grant. In November 2013, we entered into an amendment to the stock option agreement permitting ZelnickMedia to exercise the stock options on a "net exercise" basis. Each month, we remeasured the fair value of the unvested portion of such options and recorded compensation expense for the difference between total earned compensation at the end of the period and total earned compensation at the beginning of the period. As a result, changes in the price of our common stock affected compensation expense or benefit recognized from period to period. In a net exercise of stock options, an optionee receives the number of shares equal to the number of options being exercised less the number of shares necessary to satisfy the cost to exercise the options. A net exercise of stock options results in fewer shares being issued and no cash proceeds provided to us when the net exercise option is exercised. On February 18, 2014, ZelnickMedia exercised its 2,009,075 stock options on a net exercise basis in exchange for 557,410 shares of the Company's common stock.
102
The following table summarizes the activity in stock options awarded to employees and ZelnickMedia under our stock-based compensation plans and also includes non-plan options:
| |
Fiscal Year Ended March 31, | ||||||||||||||||||
|---|---|---|---|---|---|---|---|---|---|---|---|---|---|---|---|---|---|---|---|
| |
2015 | 2014 | 2013 | ||||||||||||||||
| (options in thousands) | Options | Weighted Average Exercise Price |
Options | Weighted Average Exercise Price |
Options | Weighted Average Exercise Price |
|||||||||||||
Outstanding at beginning of period |
— | $ | — | 2,009 | $ | 14.74 | 2,164 | $ | 15.16 | ||||||||||
Exercised(1) |
— | — | (2,009 | ) | 14.74 | — | — | ||||||||||||
Forfeited |
— | — | — | — | (155 | ) | 20.59 | ||||||||||||
| | | | | | | | | | | | | | | | | | | | |
Outstanding at end of period |
— | $ | — | — | $ | — | 2,009 | $ | 14.74 | ||||||||||
| | | | | | | | | | | | | | | | | | | | |
| | | | | | | | | | | | | | | | | | | | |
| | | | | | | | | | | | | | | | | | | | |
Exercisable at period-end |
— | $ | — | — | $ | — | 2,009 | $ | 14.74 | ||||||||||
Remaining weighted average contractual life of options exercisable (years) |
— | 4.4 | 5.0 | ||||||||||||||||
Aggregate intrinsic value |
$ | — | $ | 2,833 | $ | 1,296 | |||||||||||||
- (1)
- Includes options that were exercised through net share settlement. As a result, only 557 shares were issued with no corresponding option cost in fiscal year ended March 31, 2014.
Valuation Assumptions
Generally, our assumptions are based on historical information and judgment is required to determine if historical trends could be indicators of future outcomes. For the fiscal years ended March 31, 2015, 2014 and 2013, we estimated stock price volatility of all stock-based compensation awards using a combination of historical volatility and implied volatility for publicly traded options on our common stock. In addition, stock-based compensation expense is calculated based on the number of awards that are ultimately expected to vest, and therefore are reduced for estimated forfeitures. Our estimate of expected forfeitures is based on our historical annual forfeiture rate of 5%. The estimated forfeiture rate, which is evaluated at each balance sheet date throughout the life of the award, provides a time-based adjustment of forfeited shares. The estimated forfeiture rate is reassessed at each balance sheet date and may have changed based on new facts and circumstances.
Share Repurchase Program
In January 2013, our Board of Directors authorized the repurchase of up to 7,500,000 shares of our common stock. The authorization permits the Company to purchase shares from time to time through a variety of methods, including in the open market or through privately negotiated transactions, in accordance with applicable securities laws. It does not obligate the Company to make any purchases at any specific time or situation. Repurchases are subject to the availability of stock, prevailing market conditions, the trading price of the stock, the Company's financial performance and other conditions. The program may be suspended or discontinued at any time for any reason. The Company did not repurchase any shares of its common stock during the fiscal year ended March 31, 2015. During the fiscal year ended March 31, 2014, the Company repurchased approximately 4,217,000 shares of its common stock in the open market for approximately $73,325, including commissions of $42, as part of the program. As of March 31, 2015, up to approximately 3,283,000 shares of our common stock remain available for repurchase under the Company's share repurchase authorization. On May 13, 2015, our Board of Directors approved an increase to the share repurchase authorization, increasing the total number of shares that the Company is permitted to repurchase to up to 10,000,000 shares of our common stock.
103
Repurchase from Icahn Group
In November 2013, the Company entered into a Purchase Agreement with High River Limited Partnership, Icahn Partners LP, Icahn Partners Master Fund LP, Icahn Partners Master Fund II LP and Icahn Partners Master Fund III LP (collectively, the "Icahn Group"), pursuant to which the Company repurchased approximately 12,021,000 shares of the Company's common stock owned by the Icahn Group, at a price per share of $16.93, resulting in an aggregate purchase price of approximately $203,511 (the "Repurchase Transaction"). The closing of the Repurchase Transaction occurred on November 26, 2013. The Repurchase Transaction was conducted outside the Company's share repurchase program described above.
All of the repurchased shares are classified as treasury stock in our Consolidated Balance Sheets.
14. SEGMENT AND GEOGRAPHIC INFORMATION
We have one reportable segment which is our operating segment where we are a publisher of interactive software games designed for console systems, handheld gaming systems and personal computers, including smart phones and tablets, and are delivered through physical retail, digital download, online platforms and cloud streaming services. Our reporting segment is based upon our internal organizational structure, the manner in which our operations are managed and the criteria used by our Chief Executive Officer, our Chief Operating Decision Maker ("CODM") to evaluate performance. The Company's operations involve similar products and customers worldwide. We are centrally managed and the CODM primarily uses consolidated financial information supplemented by sales information by product category, major product title and platform to make operational decisions and assess financial performance. Our business consists of our Rockstar Games and 2K labels which represent a single reportable segment (the "publishing segment") based upon their similar economic characteristics, products and distribution methods. Revenue earned from our publishing segment is primarily derived from the sale of internally developed software titles and software titles developed on our behalf by third-parties.
We attribute net revenue to geographic regions based on product destination. Net revenue by geographic region was as follows:
| |
Fiscal Year Ended March 31, | |||||||||
|---|---|---|---|---|---|---|---|---|---|---|
| Net revenue by geographic region: | 2015 | 2014 | 2013 | |||||||
United States |
$ | 623,080 | $ | 1,093,918 | $ | 710,488 | ||||
Europe |
322,645 | 903,610 | 328,003 | |||||||
Asia Pacific |
69,923 | 178,816 | 88,427 | |||||||
Canada and Latin America |
67,290 | 174,224 | 87,565 | |||||||
| | | | | | | | | | | |
Total net revenue |
$ | 1,082,938 | $ | 2,350,568 | $ | 1,214,483 | ||||
| | | | | | | | | | | |
| | | | | | | | | | | |
| | | | | | | | | | | |
Net revenue by product platform was as follows:
| |
Fiscal Year Ended March 31, | |||||||||
|---|---|---|---|---|---|---|---|---|---|---|
| Net revenue by product platform: | 2015 | 2014 | 2013 | |||||||
Console |
$ | 881,516 | $ | 2,148,494 | $ | 975,994 | ||||
PC and other |
201,422 | 202,074 | 238,489 | |||||||
| | | | | | | | | | | |
Total net revenue |
$ | 1,082,938 | $ | 2,350,568 | $ | 1,214,483 | ||||
| | | | | | | | | | | |
| | | | | | | | | | | |
| | | | | | | | | | | |
104
Our products are delivered through physical retail and digital online services (digital download, online platforms and cloud streaming). Net revenue by distribution channel was as follows:
| |
Fiscal Year Ended March 31, | |||||||||
|---|---|---|---|---|---|---|---|---|---|---|
| Net revenue by distribution channel: | 2015 | 2014 | 2013 | |||||||
Physical retail and other |
$ | 627,639 | $ | 1,978,598 | $ | 958,355 | ||||
Digital online |
455,299 | 371,970 | 256,128 | |||||||
| | | | | | | | | | | |
Total net revenue |
$ | 1,082,938 | $ | 2,350,568 | $ | 1,214,483 | ||||
| | | | | | | | | | | |
| | | | | | | | | | | |
| | | | | | | | | | | |
15. INTEREST AND OTHER, NET
| |
Fiscal Year Ended March 31, | |||||||||
|---|---|---|---|---|---|---|---|---|---|---|
| 2015 | 2014 | 2013 | ||||||||
Interest expense, net |
$ | (29,901 | ) | $ | (33,961 | ) | $ | (30,763 | ) | |
Foreign currency exchange gain (loss) |
(2,068 | ) | 209 | (778 | ) | |||||
Other |
76 | 199 | 190 | |||||||
| | | | | | | | | | | |
Interest and other, net |
$ | (31,893 | ) | $ | (33,553 | ) | $ | (31,351 | ) | |
| | | | | | | | | | | |
| | | | | | | | | | | |
| | | | | | | | | | | |
16. OTHER COMPREHENSIVE INCOME
The following table provides the components of accumulated other comprehensive income (loss):
| Foreign currency translation adjustments |
Unrealized gain (loss) on derivative instruments |
Unrealized gain (loss) on available- for-sales securities |
Total | ||||||||||
|---|---|---|---|---|---|---|---|---|---|---|---|---|---|
Balance at March 31, 2013 |
$ | (4,916 | ) | $ | 344 | $ | — | $ | (4,572 | ) | |||
Other comprehensive income before reclassifications |
6,447 | 241 | 6,688 | ||||||||||
Amounts reclassified from accumulated other comprehensive income (loss) |
— | — | — | — | |||||||||
| | | | | | | | | | | | | | |
Balance at March 31, 2014 |
$ | 1,531 | $ | 585 | $ | — | $ | 2,116 | |||||
Other comprehensive (loss) income before reclassifications |
(32,747 | ) | 32 | (25 | ) | (32,740 | ) | ||||||
Amounts reclassified from accumulated other comprehensive income (loss) |
— | — | — | — | |||||||||
| | | | | | | | | | | | | | |
Balance at March 31, 2015 |
$ | (31,216 | ) | $ | 617 | $ | (25 | ) | $ | (30,624 | ) | ||
| | | | | | | | | | | | | | |
| | | | | | | | | | | | | | |
| | | | | | | | | | | | | | |
105
17. SUPPLEMENTARY FINANCIAL INFORMATION
The following table provides details of our valuation and qualifying accounts:
| Beginning Balance |
Additions(1) | Deductions | Other | Ending Balance |
||||||||||||
|---|---|---|---|---|---|---|---|---|---|---|---|---|---|---|---|---|
Fiscal Year Ended March 31, 2015 |
||||||||||||||||
Valuation allowance for deferred income taxes |
$ |
40,774 |
$ |
92,694 |
$ |
— |
$ |
— |
$ |
133,468 |
||||||
| | | | | | | | | | | | | | | | | |
| | | | | | | | | | | | | | | | | |
| | | | | | | | | | | | | | | | | |
Sales returns, price protection and other allowances |
$ | 74,078 | $ | 50,114 | $ | (57,982 | ) | $ | 3,095 | $ | 69,305 | |||||
Allowance for doubtful accounts |
1,440 | — | (274 | ) | — | 1,166 | ||||||||||
| | | | | | | | | | | | | | | | | |
Total accounts receivable allowances |
$ | 75,518 | $ | 50,114 | $ | (58,256 | ) | $ | 3,095 | $ | 70,471 | |||||
| | | | | | | | | | | | | | | | | |
| | | | | | | | | | | | | | | | | |
| | | | | | | | | | | | | | | | | |
Fiscal Year Ended March 31, 2014 |
||||||||||||||||
Valuation allowance for deferred income taxes |
$ |
132,912 |
$ |
— |
$ |
(92,138 |
) |
$ |
— |
$ |
40,774 |
|||||
| | | | | | | | | | | | | | | | | |
| | | | | | | | | | | | | | | | | |
| | | | | | | | | | | | | | | | | |
Sales returns, price protection and other allowances |
$ | 62,880 | $ | 138,050 | $ | (127,458 | ) | $ | 606 | $ | 74,078 | |||||
Allowance for doubtful accounts |
1,201 | 736 | (497 | ) | — | 1,440 | ||||||||||
| | | | | | | | | | | | | | | | | |
Total accounts receivable allowances |
$ | 64,081 | $ | 138,786 | $ | (127,955 | ) | $ | 606 | $ | 75,518 | |||||
| | | | | | | | | | | | | | | | | |
| | | | | | | | | | | | | | | | | |
| | | | | | | | | | | | | | | | | |
Fiscal Year Ended March 31, 2013 |
||||||||||||||||
Valuation allowance for deferred income taxes |
$ |
134,168 |
$ |
— |
$ |
(1,256 |
) |
$ |
— |
$ |
132,912 |
|||||
| | | | | | | | | | | | | | | | | |
| | | | | | | | | | | | | | | | | |
| | | | | | | | | | | | | | | | | |
Sales returns, price protection and other allowances |
$ | 50,290 | $ | 109,107 | $ | (95,901 | ) | $ | (616 | ) | $ | 62,880 | ||||
Allowance for doubtful accounts |
712 | 487 | — | 2 | 1,201 | |||||||||||
| | | | | | | | | | | | | | | | | |
Total accounts receivable allowances |
$ | 51,002 | $ | 109,594 | $ | (95,901 | ) | $ | (614 | ) | $ | 64,081 | ||||
| | | | | | | | | | | | | | | | | |
| | | | | | | | | | | | | | | | | |
| | | | | | | | | | | | | | | | | |
- (1)
- Includes price concessions of $16,669, $65,996 and $66,207; returns of $9,043, $23,299 and $14,976; and other sales allowances including rebates, discounts and cooperative advertising of $24,402, $48,755 and $27,924 for the fiscal years ended March 31, 2015, 2014 and 2013, respectively.
106
18. QUARTERLY FINANCIAL INFORMATION (UNAUDITED)
The following tables set forth quarterly supplementary data for each of the years in the two-year period ended March 31, 2015:
| |
Quarter | ||||||||||||
|---|---|---|---|---|---|---|---|---|---|---|---|---|---|
| Fiscal Year Ended March 31, 2015 | First | Second | Third | Fourth | |||||||||
Net revenue |
$ | 125,425 | $ | 126,277 | $ | 531,147 | $ | 300,089 | |||||
Software development costs and royalties |
20,306 | 16,343 | 108,214 | 86,752 | |||||||||
Product costs |
18,592 | 18,761 | 102,068 | 39,389 | |||||||||
Licenses |
6,960 | 4,499 | 53,632 | 12,634 | |||||||||
Internal royalties |
8,298 | 12,413 | 14,099 | 271,907 | |||||||||
| | | | | | | | | | | | | | |
Cost of goods sold |
54,156 | 52,016 | 278,013 | 410,682 | |||||||||
| | | | | | | | | | | | | | |
Gross profit (loss) |
71,269 | 74,261 | 253,134 | (110,593 | ) | ||||||||
| | | | | | | | | | | | | | |
Selling and marketing |
36,846 | 49,136 | 96,892 | 52,467 | |||||||||
General and administrative |
39,352 | 43,975 | 53,564 | 38,202 | |||||||||
Research and development |
24,132 | 24,533 | 31,221 | 35,157 | |||||||||
Depreciation and amortization |
4,148 | 5,130 | 5,845 | 5,934 | |||||||||
| | | | | | | | | | | | | | |
Total operating expenses |
104,478 | 122,774 | 187,522 | 131,760 | |||||||||
| | | | | | | | | | | | | | |
Income (loss) from operations |
(33,209 | ) | (48,513 | ) | 65,612 | (242,353 | ) | ||||||
Interest and other, net |
(7,719 | ) | (7,512 | ) | (9,458 | ) | (7,204 | ) | |||||
Gain on long-term investments, net |
— | 18,976 | (1,500 | ) | — | ||||||||
| | | | | | | | | | | | | | |
Income (loss) from continuing operations before income taxes |
(40,928 | ) | (37,049 | ) | 54,654 | (249,557 | ) | ||||||
| | | | | | | | | | | | | | |
Provision (benefit) for income taxes |
(5,525 | ) | 4,320 | 14,561 | (6,766 | ) | |||||||
| | | | | | | | | | | | | | |
Net income (loss) |
$ | (35,403 | ) | $ | (41,369 | ) | $ | 40,093 | $ | (242,791 | ) | ||
| | | | | | | | | | | | | | |
| | | | | | | | | | | | | | |
| | | | | | | | | | | | | | |
Earnings (loss) per share: |
|||||||||||||
Continuing operations |
$ | (0.45 | ) | $ | (0.51 | ) | $ | 0.46 | $ | (2.99 | ) | ||
Discontinued operations |
— | — | — | — | |||||||||
| | | | | | | | | | | | | | |
Basic earnings (loss) per share |
$ | (0.45 | ) | $ | (0.51 | ) | $ | 0.46 | $ | (2.99 | ) | ||
| | | | | | | | | | | | | | |
| | | | | | | | | | | | | | |
| | | | | | | | | | | | | | |
Continuing operations |
$ | (0.45 | ) | $ | (0.51 | ) | $ | 0.42 | $ | (2.99 | ) | ||
Discontinued operations |
— | — | — | — | |||||||||
| | | | | | | | | | | | | | |
Diluted earnings (loss) per share |
$ | (0.45 | ) | $ | (0.51 | ) | $ | 0.42 | $ | (2.99 | ) | ||
| | | | | | | | | | | | | | |
| | | | | | | | | | | | | | |
| | | | | | | | | | | | | | |
107
| |
Quarter | ||||||||||||
|---|---|---|---|---|---|---|---|---|---|---|---|---|---|
| Fiscal Year Ended March 31, 2014 | First | Second | Third | Fourth | |||||||||
Net revenue |
$ | 142,667 | $ | 148,824 | $ | 1,863,869 | $ | 195,208 | |||||
Software development costs and royalties |
53,728 | 51,090 | 200,333 | 28,299 | |||||||||
Product costs |
30,987 | 33,142 | 374,710 | 39,022 | |||||||||
Licenses |
6,187 | 2,969 | 42,522 | 12,734 | |||||||||
Internal royalties |
2,940 | 5,262 | 502,169 | 28,233 | |||||||||
| | | | | | | | | | | | | | |
Cost of goods sold |
93,842 | 92,463 | 1,119,734 | 108,288 | |||||||||
| | | | | | | | | | | | | | |
Gross profit |
48,825 | 56,361 | 744,135 | 86,920 | |||||||||
| | | | | | | | | | | | | | |
Selling and marketing |
41,601 | 101,342 | 70,476 | 27,577 | |||||||||
General and administrative |
32,860 | 43,023 | 34,718 | 50,773 | |||||||||
Research and development |
20,871 | 26,520 | 29,233 | 28,632 | |||||||||
Depreciation and amortization |
3,057 | 3,367 | 3,413 | 3,522 | |||||||||
| | | | | | | | | | | | | | |
Total operating expenses |
98,389 | 174,252 | 137,840 | 110,504 | |||||||||
| | | | | | | | | | | | | | |
(Loss) income from operations |
(49,564 | ) | (117,891 | ) | 606,295 | (23,584 | ) | ||||||
Interest and other, net |
(9,322 | ) | (10,747 | ) | (5,949 | ) | (7,535 | ) | |||||
Loss on extinguishment of debt |
— | (9,014 | ) | — | — | ||||||||
Gain on convertible note hedge and warrants, net |
(1,911 | ) | 5,372 | — | — | ||||||||
| | | | | | | | | | | | | | |
(Loss) income from continuing operations before income taxes |
(60,797 | ) | (132,280 | ) | 600,346 | (31,119 | ) | ||||||
| | | | | | | | | | | | | | |
Provision (benefit) for income taxes |
1,087 | (8,185 | ) | 21,902 | (345 | ) | |||||||
| | | | | | | | | | | | | | |
Loss (income) from continuing operations |
(61,884 | ) | (124,095 | ) | 578,444 | (30,774 | ) | ||||||
Loss from discontinued operations, net of taxes |
(30 | ) | (25 | ) | (18 | ) | (13 | ) | |||||
| | | | | | | | | | | | | | |
Net (loss) income |
$ | (61,914 | ) | $ | (124,120 | ) | $ | 578,426 | $ | (30,787 | ) | ||
| | | | | | | | | | | | | | |
| | | | | | | | | | | | | | |
| | | | | | | | | | | | | | |
Earnings (loss) per share: |
|||||||||||||
Basic earnings (loss) per share |
$ | (0.71 | ) | $ | (1.40 | ) | $ | 5.88 | $ | (0.40 | ) | ||
| | | | | | | | | | | | | | |
| | | | | | | | | | | | | | |
| | | | | | | | | | | | | | |
Diluted earnings (loss) per share |
$ | (0.71 | ) | $ | (1.40 | ) | $ | 4.69 | $ | (0.40 | ) | ||
| | | | | | | | | | | | | | |
| | | | | | | | | | | | | | |
| | | | | | | | | | | | | | |
Basic and diluted earnings per share are computed independently for each of the quarters presented. Therefore, the sum of quarterly basic and diluted earnings per share information may not equal annual basic and diluted earnings per share.
108
Pursuant to the requirements of Section 13 or 15(d) of the Securities Exchange Act of 1934 the registrant has duly caused this report to be signed on its behalf by the undersigned, thereunto duly authorized.
| TAKE-TWO INTERACTIVE SOFTWARE, INC. | ||||
By: |
/s/ STRAUSS ZELNICK Strauss Zelnick Chairman and Chief Executive Officer |
|||
| May 21, 2015 | ||||
Pursuant to the requirements of the Securities Exchange Act of 1934, this report has been signed below by the following persons on behalf of the Registrant in the capacities and on the date indicated.
| Signature | Title | Date | ||
|---|---|---|---|---|
| /s/ STRAUSS ZELNICK Strauss Zelnick |
Chairman and Chief Executive Officer (Principal Executive Officer) | May 21, 2015 | ||
/s/ LAINIE GOLDSTEIN Lainie Goldstein |
Chief Financial Officer (Principal Financial and Accounting Officer) |
May 21, 2015 |
||
/s/ MICHAEL DORNEMANN Michael Dornemann |
Lead Independent Director |
May 21, 2015 |
||
/s/ ROBERT A. BOWMAN Robert A. Bowman |
Director |
May 21, 2015 |
||
/s/ J MOSES J Moses |
Director |
May 21, 2015 |
||
/s/ MICHAEL SHERESKY Michael Sheresky |
Director |
May 21, 2015 |
||
/s/ SUSAN TOLSON Susan Tolson |
Director |
May 21, 2015 |
109