Attached files
| file | filename |
|---|---|
| EXCEL - IDEA: XBRL DOCUMENT - NortonLifeLock Inc. | Financial_Report.xls |
| EX-32.02 - EXHIBIT 32.02 - NortonLifeLock Inc. | a4315exhibit322.htm |
| EX-32.01 - EXHIBIT 32.01 - NortonLifeLock Inc. | a4315exhibit321.htm |
| EX-31.02 - EXHIBIT 31.02 - NortonLifeLock Inc. | a4315exhibit312.htm |
| EX-31.01 - EXHIBIT 31.01 - NortonLifeLock Inc. | a4315exhibit311.htm |
| EX-21.01 - EXHIBIT 21.01 - NortonLifeLock Inc. | a4315exhibit2101.htm |
| EX-10.18 - EXHIBIT 10.18 - NortonLifeLock Inc. | a4315exhibit1018.htm |
| EX-10.19 - EXHIBIT 10.19 - NortonLifeLock Inc. | a4315exhibit1019.htm |
| EX-23.01 - EXHIBIT 23.01 - NortonLifeLock Inc. | a4315exhibit2301.htm |
UNITED STATES SECURITIES AND EXCHANGE COMMISSION
Washington, D.C. 20549
Form 10-K
(Mark One)
þ | ANNUAL REPORT PURSUANT TO SECTION 13 OR 15(d) OF THE SECURITIES EXCHANGE ACT OF 1934 |
For the Fiscal Year Ended April 3, 2015
or
o | TRANSITION REPORT PURSUANT TO SECTION 13 OR 15(d) OF THE SECURITIES EXCHANGE ACT OF 1934 |
For the Transition Period from to
Commission File Number 000-17781
Symantec Corporation
(Exact name of the registrant as specified in its charter)
Delaware | 77-0181864 | |
(State or other jurisdiction of incorporation or organization) | (I.R.S. employer Identification no.) | |
350 Ellis Street, | ||
Mountain View, California | 94043 | |
(Address of principal executive offices) | (zip code) | |
Registrant’s telephone number, including area code:
(650) 527-8000
Securities registered pursuant to Section 12(b) of the Act:
Common Stock, par value $0.01 per share (Title of each class) | The NASDAQ Stock Market LLC (Name of each exchange on which registered) | |
Securities registered pursuant to Section 12(g) of the Act:
None
(Title of class)
Indicate by check mark if the registrant is a well-known seasoned issuer, as defined in Rule 405 of the Securities Act. Yes þ No o
Indicate by check mark if the registrant is not required to file reports pursuant to Section 13 or 15(d) of the Exchange Act. Yes o No þ
Indicate by check mark whether the registrant (1) has filed all reports required to be filed by Section 13 or 15(d) of the Securities Exchange Act of 1934 during the preceding 12 months (or for such shorter period that the registrant was required to file such reports), and (2) has been subject to such filing requirements for the past 90 days. Yes þ No o
Indicate by check mark whether the registrant has submitted electronically and posted on its corporate Web site, if any, every Interactive Data File required to be submitted and posted pursuant to Rule 405 of Regulation S-T (§ 232.405 of this chapter) during the preceding 12 months (or for such shorter period that the registrant was required to submit and post such files). Yes þ No o
Indicate by check mark if disclosure of delinquent filers pursuant to Item 405 of Regulation S-K is not contained herein, and will not be contained, to the best of registrant’s knowledge, in definitive proxy or information statements incorporated by reference in Part III of this Form 10-K or any amendment to this Form 10-K. þ
Indicate by check mark whether the registrant is a large accelerated filer, an accelerated filer, a non-accelerated filer, or a smaller reporting company. See the definitions of “large accelerated filer,” “accelerated filer” and “smaller reporting company” in Rule 12b-2 of the Exchange Act. (Check one):
Large accelerated filer þ | Accelerated filer o | Non-accelerated filer o | Smaller reporting company o | |||
(Do not check if a smaller reporting company) | ||||||
Indicate by check mark whether the registrant is a shell company (as defined in Rule 12b-2 of the Exchange Act). Yes o No þ
Aggregate market value of the voting stock held by non-affiliates of the registrant, based upon the closing sale price of Symantec common stock on October 3, 2014 as reported on the NASDAQ Global Select Market: $16,119,850,545.
Number of shares outstanding of the registrant’s common stock as of May 1, 2015: 680,727,932
DOCUMENTS INCORPORATED BY REFERENCE
The information called for by Part III will be included in an amendment to this Form 10-K or incorporated by reference from the registrant’s definitive Proxy Statement to be filed pursuant to Regulation 14A.
SYMANTEC CORPORATION
FORM 10-K
For the Fiscal Year Ended April 3, 2015
TABLE OF CONTENTS
Page | ||
PART I | ||
Item 1. | ||
Item 1A. | ||
Item 1B. | ||
Item 2. | ||
Item 3. | ||
Item 4. | ||
PART II | ||
Item 5. | ||
Item 6. | ||
Item 7. | ||
Item 7A. | ||
Item 8. | ||
Item 9. | ||
Item 9A. | ||
Item 9B. | ||
PART III | ||
Item 10. | ||
Item 11. | ||
Item 12. | ||
Item 13. | ||
Item 14. | ||
PART IV | ||
Item 15. | ||
“Symantec,” “we,” “us,” “our,” and “the Company” refer to Symantec Corporation and all of its subsidiaries. Symantec, the Symantec Logo, Norton, and Veritas are trademarks or registered trademarks of Symantec in the United States (“U.S.”) and other countries. Other names may be trademarks of their respective owners.
2
FORWARD-LOOKING STATEMENTS AND FACTORS THAT MAY AFFECT FUTURE RESULTS
The discussion below contains forward-looking statements, which are subject to safe harbors under the Securities Act of 1933, as amended (the “Securities Act”) and the Exchange Act of 1934, as amended (the “Exchange Act”). Forward-looking statements include references to our ability to utilize our deferred tax assets, as well as statements including words such as “expects,” “plans,” “anticipates,” “believes,” “estimates,” “predicts,” “projects,” and similar expressions. In addition, statements that refer to our plans to distribute shares of our information management business to shareholders, projections of our future financial performance, anticipated growth and trends in our businesses and in our industries, the anticipated impacts of acquisitions, our intent to pay quarterly cash dividends in the future, the actions we intend to take as part of our new strategy, the expected impact of our new strategy and other characterizations of future events or circumstances are forward-looking statements. These statements are only predictions, based on our current expectations about future events and may not prove to be accurate. We do not undertake any obligation to update these forward-looking statements to reflect events occurring or circumstances arising after the date of this report. These forward-looking statements involve risks and uncertainties, and our actual results, performance, or achievements could differ materially from those expressed or implied by the forward-looking statements on the basis of several factors, including those that we discuss under Item 1A, Risk Factors. We encourage you to read that section carefully.
3
PART I
Item 1. Business
Overview
Symantec Corporation is a global leader in security, backup and availability solutions. Our market leading products and services protect people and information in any environment – from the mobile device in your pocket, to the enterprise data center, to cloud-based systems. Founded in April 1982, Symantec operates one of the largest global threat-intelligence networks. The company has more than 19,000 employees in more than 50 countries. Our Internet home page is www.symantec.com.
Strategy
In our security business, we operate a global civilian cyber intelligence threat network and track a vast number of threats across the Internet from hundreds of millions of mobile devices, endpoints, and servers across the globe. We believe one of our competitive advantages is our database of threat indicators which allows us to reduce the number of false positives and provide faster and better protection for customers through our products. We are leveraging our capabilities in threat protection and data loss prevention and extending them into our core security offerings. We are also pioneering new solutions in growing markets like cloud, advanced threat protection, information protection and cyber security services.
Our security strategy is to leverage our unique assets to provide best-in-class consumer and enterprise security products; deliver a unified security analytics platform that provides big data analytics, utilizes our vast telemetry, provides visibility into real-time global threats, and powers Symantec and third-party security analytics applications; and offer cyber security services that provide a full-suite of services from monitoring to incident response to threat intelligence supported by over 500 cyber security experts and nine global threat centers.
In our information management business, with a global installed customer base, we have a comprehensive portfolio that spans backup and recovery, storage management and archiving. Our information availability offerings help customers keep their data and systems available where they need them, when they need them, and irrespective of their location. Our information insight solutions help customers know what data they have and leverage that knowledge to help manage such data better and inform strategic decisions.
Our information management product strategy is to expand our best-in-class foundational portfolio across backup, storage management, business continuity, archiving and eDiscovery through software, integrated appliances and the cloud; deliver next-generation availability solutions through a coordinated orchestration architecture focused on managing and moving mission-critical data in a hybrid cloud world; and enable next-generation insight solutions that provide visibility, action, and automated control across an organization’s information landscape through an intelligent information fabric that integrates our portfolio and third-party ecosystems.
In fiscal 2015, we focused on five priorities: running our businesses with a portfolio approach by managing certain businesses for operating margin; prioritizing investments for growth; further reducing costs and improving efficiencies; attracting top talent to our executive team; and continuing to return significant cash to shareholders. We are optimizing some of our businesses by methodically evaluating every product line to balance our profitability targets against our objectives. In order to prioritize investments for growth, we are realigning our research and development budgets to apply the best resources to the most promising market opportunities. To further reduce costs and improve efficiencies, we are consolidating our global footprint, data centers and product support capabilities as well as streamlining the way we run our businesses with initiatives to increase research and development efficiencies and sales productivity. We are focused on continuing to attract talented business and technology leaders to the company. We remain committed to returning significant cash to shareholders in the form of dividends and share buybacks.
The Planned Separation of Information Management from the Security Business
On October 9, 2014, we announced plans to separate our business into two independent publicly-traded companies: one focused on security and one focused on information management. The transaction is intended to take the form of a tax-free distribution to Symantec shareholders of all of the capital stock of our information management business. We expect to complete the legal separation on January 2, 2016, subject to market, regulatory and certain other conditions. John Gannon has been appointed as General Manager of the information management business, and Don Rath has been appointed as acting Chief Financial Officer. After the transaction, Michael Brown and Thomas Seifert will continue to lead Symantec as Chief Executive Officer and Chief Financial Officer, respectively. For additional separation cost information, see Note 6 of the Notes to Consolidated Financial Statements included in this annual report.
4
Business Highlights
During fiscal 2015, we took the following actions in support of our business:
• | We announced plans to separate our business into two independent publicly-traded companies: one focused on security and one focused on information management. |
• | We released new products and services. |
◦ | In Information Management, we launched our NetBackup 5330 appliance, which delivers twice the performance and capacity of our prior models, making the management of information simpler and less expensive; and we released Backup Exec 2014, which delivers powerful, flexible, and easy-to-use backup and recovery to protect a customer’s physical, virtual, or hybrid environment for a mixture of applications and operating systems. |
◦ | In Consumer Security, we simplified our product portfolio by streamlining our core products into a single Norton Security offering. |
◦ | In Enterprise Security, we launched our managed advanced threat protection service, which helps customers triangulate threat indicators from our endpoint protection and third-party security products to provide more comprehensive threat detection. We also introduced our managed incident response service, which provides emergency on-demand service to help customers recover from a breach. In addition, we introduced our managed adversary and threat intelligence service, which offers customers a deeper understanding of specific threat actors and attacks. |
• | We hired five new executives, who bring valuable skills in analytics, backup and recovery software, sales, security, strategy, and human resources. |
• | We remained committed to a capital allocation strategy pursuant to which we expect to return over time approximately 50% of free cash flow to stockholders through a combination of dividends and share repurchases, while still enabling our company to invest in its future. As part of this program we paid quarterly cash dividends of $0.15 per share of common stock in fiscal 2015, paying out a total of $413 million to shareholders. |
• | Our Board of Directors approved an additional $1.0 billion stock repurchase program in February 2015. This program does not have an expiration date. During fiscal 2015, we repurchased 21 million shares of our common stock for an aggregate amount of $500 million, and $1.2 billion remains authorized for future repurchases. |
Operating Segments and Products
Our operating segments are significant strategic business units that offer different products and services distinguished by customer needs. In the second quarter of fiscal 2015, we modified our segment reporting structure to match our new operating structure. The three reporting segments, which are the same as our operating segments, are: Consumer Security, Enterprise Security, and Information Management.
Consumer Security
Our Consumer Security segment focuses on making it simple for customers to be productive and protected at home and at work. Our Norton-branded services provide multi-layer security and identity protection on major desktop and mobile operating systems, to defend against increasingly complex online threats to individuals, families, and small businesses.
Our Norton products help customers protect against increasingly complex threats and address the need for identity protection, while also managing the rapid increase in mobile and digital data, such as personal financial records, photos, music, and videos.
Enterprise Security
Our Enterprise Security segment protects organizations so they can securely conduct business while leveraging new platforms and data. These products include Secure Socket Layer (“SSL”) Certificates, authentication, mail and web security, data center security, data loss prevention, information security services, endpoint security and management, encryption, and mobile security offerings.
These products and services help our customers secure their confidential information wherever it resides in the network path, from the user’s device to the data’s resting place. In doing so, these products protect customer data from sophisticated threats such as advanced protection threats, malicious spam and phishing attacks, malware, drive-by website infections, hackers, and cyber criminals. In addition, these products help to prevent the loss of confidential data by insiders, and help customers achieve compliance with laws and regulations. Our enterprise endpoint security and management offerings support the evolving endpoint, providing advanced threat protection while helping reduce cost and complexity. These solutions are delivered through various methods, such as software, appliance, SaaS, and managed services.
5
Information Management
Our Information Management segment focuses on backup and recovery, archiving and eDiscovery, storage and high availability solutions, helping to ensure that our customers’ IT infrastructure and mission-critical applications are protected, managed and available.
Our products enable customers to reduce cost and complexity as we improve the way information is managed through the ever-evolving cloud and virtualized environments. Our products are designed to ensure successful backup, recovery, availability, eDiscovery and archiving of information, applications, and systems for organizations ranging from small businesses to large enterprises.
Financial Information by Segment and Geographic Region
For information regarding our revenue by segment, revenue by geographical area, and property and equipment by geographical area, see Note 9 of the Notes to Consolidated Financial Statements in this annual report. For information regarding the amount and percentage of our revenue contributed by each of our segments and our financial information, including information about geographic areas in which we operate, see Item 7, Management’s Discussion and Analysis of Financial Condition and Results of Operations and Note 9 of the Notes to Consolidated Financial Statements in this annual report. For information regarding risks associated with our international operations, see Item 1A, Risk Factors.
Sales and Go-To-Market Strategy
Our go-to-market ("GTM") network includes direct sales forces and broad eCommerce capabilities, as well as indirect sales resources that support our global partner ecosystem. We also maintain important relationships with a number of Original Equipment Manufacturers (“OEMs”), Internet Service Providers (“ISPs”), and retail and online stores by which we market and sell our products.
Our dedicated renewals team remains focused on extending customer relationships and renewing our contracts. We also continued to streamline our indirect sales strategy to have fewer, more focused partners with specialized partner programs to enhance sales. We believe these changes provide customers with a high-quality sales and post-sales support experience, while also enabling us to expand our business.
Consumer and Small Business
We sell our consumer products and services to individuals, households and small businesses globally. We bring these products to market through our eCommerce platform, distributors, direct marketers, Internet-based resellers, system builders, ISPs, wireless carriers, and retailers worldwide. We also have a limited number of partnerships with OEMs globally to distribute our Internet security and online backup offerings.
Commercial
We sell and market our products and related services to small, medium and large enterprise customers through field sales and inside sales leveraging indirect sales partners around the world who are specifically trained and certified to sell our solutions. These partners include national solution providers, regional solution providers, national account resellers, global/federal system integrators and managed service providers. Our products are also available on our eCommerce platform, as well as through authorized distributors and OEMs who incorporate our technologies into their products, bundle our products with their offerings, or serve as authorized resellers of our products.
Enterprise
We sell and market our products and related services to large enterprises, including government and public sector customers, through our field sales force. This field sales team is responsible for approximately 2,000 named accounts around the world, leveraging our global partner ecosystem primarily targeting senior executives and IT department personnel responsible for managing a company’s highest-order IT initiatives.
Research and Development
Symantec embraces a global research and development (“R&D”) strategy to drive organic innovation. Engineers and researchers throughout the Company pursue advanced projects to translate R&D into customer solutions by creating new technologies and integrating our unique set of technology assets. Symantec focuses on short, medium, and long-term applied research, develops new products in emerging areas, participates in government-funded research projects, drives industry standards, and partners with universities to conduct research supporting Symantec’s strategy.
Symantec’s Security Technology and Response organization consists of a global team of security engineers, threat analysts, and researchers and provides the underlying functionality, content, and support for many of our consumer, small business and enterprise security products. Our security experts monitor malicious code reports collected through the Global Intelligence Network, one of the largest in the world, to provide insight into emerging attacks, malicious code activity, phishing, spam, and other threats. The team uses this vast amount of data and insights to develop new technologies and approaches, such as
6
Symantec’s reputation-based security technology and our forthcoming unified security analytics platform, to protect customer information.
Research and development expenses were $1,144 million, $1,039 million, and $1,026 million in fiscal 2015, 2014, and 2013, respectively, representing approximately 18% of revenue in fiscal 2015 and 16% and 15% of revenue in fiscal 2014 and 2013, respectively. The percentage fluctuates between periods as a result of a variety of factors, including changes in sales level and foreign currency exchange rates. We believe that technical leadership is essential to our success and we expect to continue to commit substantial resources to R&D.
Support
Symantec has support facilities throughout the world, staffed by technical product experts knowledgeable in the operating environments in which our products are deployed. Our technical support experts assist customers with issue resolution and threat detection.
We provide consumers with various levels of support offerings. Consumers receive automatic downloads of the latest virus definitions, application bug fixes, and patches for most of our consumer products. Our consumer support program provides self-help online services and phone, chat, and email support to consumers worldwide, and our Norton Security products come with a “Virus Protection Promise,” which in some markets provides free virus removal services to customers whose protected computers become infected.
We provide customers various levels of enterprise support offerings. Our enterprise security support program offers annual maintenance support contracts, including content, upgrades, and technical support. Our standard technical support includes: self-service options delivered by telephone or electronically during the contracted-for hours, immediate patches for severe problems, periodic software updates, and access to our technical knowledge base and frequently asked questions.
Customers
In fiscal 2015, 2014 and 2013, there were no customers that accounted for more than 10% of our total net revenue.
Acquisitions
Our strategy will be complemented by business combinations that fit strategically and meet specific profitability hurdles. Our acquisitions are designed to enhance the features and functionality of our existing products and extend our product leadership in core markets. We consider time-to-market, synergies with existing products, and potential market share gains when evaluating the economics of acquisitions of technologies, product lines, or companies. We may acquire or dispose of other technologies, products, and companies in the future.
We did not make any material acquisitions during fiscal 2015.
Competition
Our markets are consolidating, highly competitive, and subject to rapid changes in technology. The competitive landscape has changed significantly over the past few years, with new competition arising. Much of the market growth has come from startups whose focus is on solving a specific customer issue or delivering a specific niche-oriented product and from larger integration providers that increasingly are looking to put various types of protection, whether it is backup, high availability or security, into their platforms. We are focused on delivering comprehensive customer solutions, integrating across our broad product portfolio and partnering with other technology providers to differentiate ourselves from the competition. We believe that the principal competitive factors necessary to be successful in our industry include product quality and effectiveness, time-to-market, price, reputation, financial stability, breadth of product offerings, customer support, brand recognition, and effective sales and marketing efforts.
In addition to the competition we face from direct competitors, we face indirect or potential competition from retailers, application providers, operating system providers, network equipment manufacturers, and other OEMs who may provide various solutions and functions in their current and future products. We also compete for access to retail distribution channels and for spending at the retail level and in corporate accounts. In addition, we compete with other software companies, operating system providers, network equipment manufacturers, and other OEMs to acquire technologies, products, or companies and to publish software developed by third parties. We also compete with other software companies in our effort to place our products on the computer equipment sold to consumers and enterprises by OEMs.
The competitive environments for our security and information management products are described below.
Security
Most of the channels in which our security products are offered are highly competitive. Some of our consumer competitors are intensely focused on customer acquisition, which has led competitors to offer their technology for free, engage in aggressive marketing, or enter into competitive partnerships. Our primary security competitors are Intel Corporation, Microsoft Corporation (“Microsoft”), and Trend Micro Inc. There are also several freeware providers and regional security companies
7
that we compete against. For our consumer backup offerings, our primary competitors are Carbonite, Inc. and EMC Corporation (“EMC”). In the SSL market, our primary competitors are Comodo Group, Inc. and GoDaddy.com, Inc. In the Software-as-a-Service (“SaaS”) security market, our primary competitors are Google Inc. and Microsoft. Our primary competitors in the managed security services business are Dell Inc., IBM Corporation ("IBM"), and Hewlett-Packard Company ("HP").
Information Management
The markets for storage management, backup, archiving, and eDiscovery are intensely competitive. Our primary competitors are CommVault Systems, Inc., EMC, HP and IBM.
Intellectual Property
Protective Measures
We regard some of the features of our internal operations, software, and documentation as proprietary and rely on copyright, patent, trademark and trade secret laws, confidentiality procedures, contractual arrangements, and other measures to protect our proprietary information. Our intellectual property is an important and valuable asset that enables us to gain recognition for our products, services, and technology and enhance our competitive position.
As part of our confidentiality procedures, we generally enter into non-disclosure agreements with our employees, distributors, and corporate partners and we enter into license agreements with respect to our software, documentation, and other proprietary information. These license agreements are generally non-transferable and have either a perpetual or subscription based time limited term. We also educate our employees on trade secret protection and employ measures to protect our facilities, equipment, and networks.
Trademarks, Patents, Copyrights, and Licenses
Symantec and the Symantec logo are trademarks or registered trademarks in the U.S. and other countries. In addition to Symantec and the Symantec logo, we have used, registered, or applied to register other specific trademarks and service marks to help distinguish our products, technologies, and services from those of our competitors in the U.S. and foreign countries and jurisdictions. We enforce our trademark, service mark, and trade name rights in the U.S. and abroad. The duration of our trademark registrations varies from country to country, and in the U.S. we generally are able to maintain our trademark rights and renew any trademark registrations for as long as the trademarks are in use.
We have more than 2,700 patents, in addition to foreign patents and pending U.S. and foreign patent applications, which relate to various aspects of our products and technology. The duration of our patents is determined by the laws of the country of issuance and for the U.S. is typically 17 years from the date of issuance of the patent or 20 years from the date of filing of the patent application resulting in the patent, which we believe is adequate relative to the expected lives of our products.
Our products are protected under U.S. and international copyright laws and laws related to the protection of intellectual property and proprietary information. We take measures to label such products with the appropriate proprietary rights notices, and we actively enforce such rights in the U.S. and abroad. However, these measures may not provide sufficient protection, and our intellectual property rights may be challenged. In addition, we license some intellectual property from third parties for use in our products, and generally must rely on the third party to protect the licensed intellectual property rights. While we believe that our ability to maintain and protect our intellectual property rights is important to our success, we also believe that our business as a whole is not materially dependent on any particular patent, trademark, license, or other intellectual property right.
Seasonality
As is typical for many large technology companies, our business is seasonal. License and maintenance orders are generally higher in our third and fourth fiscal quarters and lower in our first and second fiscal quarters. A decline in license and maintenance orders is typical in the first quarter of our fiscal year as compared to license and maintenance orders in the fourth quarter of the prior fiscal year. In addition, we generally receive a higher volume of license and maintenance orders in the last month of a quarter, with orders concentrated in the latter part of that month. We believe that this seasonality primarily reflects customer spending patterns and budget cycles, as well as the impact of compensation incentive plans for our sales personnel. Revenue generally reflects similar seasonal patterns but to a lesser extent than orders because revenue is not recognized until an order is shipped or services are performed and other revenue recognition criteria are met, and because a significant portion of our in-period revenue comes from our deferred revenue balance.
Employees
As of April 3, 2015, we employed more than 19,000 people worldwide, approximately 44% of whom reside in the U.S. Approximately 6,100 employees work in sales and marketing, 6,700 in research and development, 4,900 in support and services, and 1,900 in management, manufacturing, and administration.
8
Available Information
Our Internet address is www.symantec.com. We make available free of charge our annual reports on Form 10-K, quarterly reports on Form 10-Q, current reports on Form 8-K, and amendments to those reports as soon as reasonably practicable after we electronically file such material with the Securities and Exchange Commission (“SEC”) on our investor relations website located at www.symantec.com/invest. The information contained, or referred to, on our website is not part of this annual report unless expressly noted. The SEC maintains a website that contains reports, proxy and information statements, and other information regarding our filings at http://www.sec.gov. In addition, you may read and copy any filing that we make with the SEC at the public reference room maintained by the SEC, located at 100 F Street, N.E., Washington, D.C. 20549. Please call the SEC at 1-800-SEC-0330 for further information about the public reference room.
Item 1A. Risk Factors
A description of the risk factors associated with our business is set forth below. The list is not exhaustive and you should carefully consider these risks and uncertainties before investing in our common stock.
If we are unsuccessful at addressing our business challenges, our business and results of operations may be adversely affected and our ability to invest in and grow our business could be limited.
For the last few years, we have experienced a number of transitions as we have attempted to revitalize our business model, improve execution, and innovate new products and services. These transitions have involved significant turnover in management and other key personnel, changes in our strategic direction and, more recently, our decision to separate into two independent publicly-traded companies. Transitions of the order we have experienced or are experiencing can be disruptive and result in loss of institutional focus and employee morale, making execution of business strategies more difficult. We are also in the process of seeking to address the challenges of dynamic and accelerating market trends, such as the decline in the PC market, the market shift towards tablets within mobility and architectural shifts in the provision of security and storage solutions, all of which has made it more difficult for us to compete effectively and requires us to improve our product and service offerings. We may experience delays in the anticipated timing of activities related to our efforts to address these challenges and higher than expected or unanticipated execution costs. In addition, we are vulnerable to increased risks associated with these efforts given our multiple business units, the proposed separation and the broad range of geographic regions in which we and our customers and partners operate. If we do not succeed in these efforts, or if these efforts are more costly or time-consuming than expected, our business and results of operations may be adversely affected, which could limit our ability to invest in and grow our business.
We are pursuing a plan to separate our information management business into a new, independent publicly-traded company. The proposed separation may not be completed on the currently contemplated timeline or at all and, if completed, may not achieve the intended benefits.
In October 2014, we announced a plan to separate into two independent publicly-traded companies through a tax-free distribution to Symantec stockholders of 100% of the capital stock of our information management business (the “spin-off”). We could be delayed or prevented from completing the proposed separation, or be forced to complete it on terms or conditions that are less favorable and/or different than expected, for a variety of reasons, including unanticipated developments, such as delays in obtaining regulatory approvals or clearances, uncertainty of the financial markets. Furthermore, any significant delays or complications in our implementation of a new enterprise resource management system and IT infrastructure for our stand-alone information management business would adversely affect our ability to effect the separation in a timely manner and could result in significant business disruption, increased costs, or both. In addition, if other opportunities were to arise for the disposition of the information business that we believe are superior to the spin-off, we may elect not to complete the spin-off. Even if the transaction is completed, we may not realize some or all of the anticipated benefits from the proposed separation. Moreover, following the proposed separation, the combined value of the common stock of the two publicly-traded companies may not be equal to or greater than what the value of our common stock would have been had the proposed separation not occurred. In addition, we expect to spend substantial time, money and effort on completing the proposed separation without any assurance that it will be completed. Our investments in terms of financial and management resources may be significantly higher than expected, which could limit our ability to pursue other business opportunities and distract us from operating our businesses as currently conducted. Our focus on completing the separation, and resource constraints resulting from that focus, could also adversely affect the execution of our business strategy.
If we are unable to attract and retain qualified employees, lose key personnel, fail to integrate replacement personnel successfully, or fail to manage our employee base effectively, we may be unable to develop new and enhanced products and services, effectively manage or expand our business, or increase our revenues.
Our future success depends upon our ability to recruit and retain key management, technical, sales, marketing, finance, and other personnel. Our officers and other key personnel are employees-at-will, and we cannot assure you that we will be able to retain them. Competition for people with the specific skills that we require is significant, and we face difficulties in attracting,
9
retaining and motivating employees as a result. These difficulties may increase during the pendency of the proposed separation and following its completion. In order to attract and retain personnel in a competitive marketplace, we believe that we must provide a competitive compensation package, including cash and equity-based compensation. The volatility in our stock price may from time to time adversely affect our ability to recruit or retain employees. In addition, we may be unable to obtain required stockholder approvals of future increases in the number of shares available for issuance under our equity compensation plans, and accounting rules require us to treat the issuance of equity-based compensation as compensation expense. As a result, we may decide to issue fewer equity-based incentives and may be impaired in our efforts to attract and retain necessary personnel. If we are unable to hire and retain qualified employees, or conversely, if we fail to manage employee performance or reduce staffing levels when required by market conditions, our business and operating results could be adversely affected.
Effective succession planning is also important to our long-term success. Failure to ensure effective transfer of knowledge and smooth transitions involving key employees could hinder our strategic planning and execution. From time to time, key personnel leave our company and the incidence of this increased in recent periods due to the transitions we have experienced over the last few years. While we strive to reduce the negative impact of such changes, the loss of any key employee could result in significant disruptions to our operations, including adversely affecting the timeliness of product releases, the successful implementation and completion of company initiatives, the effectiveness of our disclosure controls and procedures and our internal control over financial reporting, and our results of operations. In addition, hiring, training, and successfully integrating replacement sales and other personnel could be time consuming, may cause additional disruptions to our operations, and may be unsuccessful, which could negatively impact future revenues. These risks may be exacerbated by the uncertainty associated with the transitions we have experienced over the last few years, including the proposed separation.
Fluctuations in demand for our products and services are driven by many factors, and a decrease in demand for our products could adversely affect our financial results.
We are subject to fluctuations in demand for our products and services due to a variety of factors, including general economic conditions, competition, product obsolescence, technological change, shifts in buying patterns, financial difficulties and budget constraints of our current and potential customers, awareness of security threats to IT systems, and other factors. While such factors may, in some periods, increase product sales, fluctuations in demand can also negatively impact our product sales. If demand for our products and solutions declines, whether due to general economic conditions or a shift in buying patterns, our revenues and margins would likely be adversely affected.
If we are unable to develop new and enhanced products and services that achieve widespread market acceptance, or if we are unable to continually improve the performance, features, and reliability of our existing products and services or adapt our business model to keep pace with industry trends, our business and operating results could be adversely affected.
Our future success depends on our ability to respond to the rapidly changing needs of our customers by developing or introducing new products, product upgrades, and services on a timely basis. We have in the past incurred, and will continue to incur, significant research and development expenses as we strive to remain competitive. Additionally, we are in the process of addressing the challenges of dynamic and accelerating market trends, such as the emergence of advanced persistent threats in the security space, the decline in the PC market, and the market shift towards tablets and handheld devices, all of which have made it more difficult for us to compete effectively. Customers may require features and capabilities that our current solutions do not have. Our failure to develop solutions that satisfy customer preferences in a timely and cost-effective manner may harm our ability to renew our subscriptions with existing customers and to create or increase demand for our solutions, and may adversely impact our operating results. New product development and introduction involves a significant commitment of time and resources and is subject to a number of risks and challenges including:
• | Managing the length of the development cycle for new products and product enhancements, which has frequently been longer than we originally expected; |
• | Adapting to emerging and evolving industry standards and to technological developments by our competitors and customers; |
• | Extending the operation of our products and services to new and evolving platforms, operating systems and hardware products, such as mobile devices; |
• | Entering into new or unproven markets with which we have limited experience; |
• | Managing new product and service strategies for the markets in which we operate; |
• | Addressing trade compliance issues affecting our ability to ship our products; |
• | Developing or expanding efficient sales channels; and |
10
• | Obtaining sufficient licenses to technology and technical access from operating system software vendors on reasonable terms to enable the development and deployment of interoperable products, including source code licenses for certain products with deep technical integration into operating systems. |
If we are not successful in managing these risks and challenges, or if our new products, product upgrades and services are not technologically competitive or do not achieve market acceptance, our business and operating results could be adversely affected. We may also experience increased difficulties in managing these risks and challenges during the pendency of the separation and following its completion.
We operate in a highly competitive environment, and our competitors may gain market share in the markets for our products that could adversely affect our business and cause our revenues to decline.
We operate in intensely competitive markets that experience rapid technological developments, changes in industry standards, changes in customer requirements, and frequent new product introductions and improvements. If we are unable to anticipate or react to these competitive challenges or if existing or new competitors gain market share in any of our markets, our competitive position could weaken and we could experience a decline in our sales that could adversely affect our business and operating results. To compete successfully, we must maintain an innovative research and development effort to develop new products and services and enhance existing products and services, effectively adapt to changes in the technology or product rights held by our competitors, appropriately respond to competitive strategies, and effectively adapt to technological changes and changes in the ways that our information is accessed, used, and stored within our enterprise and consumer markets. If we are unsuccessful in responding to our competitors or to changing technological and customer demands, our competitive position and our financial results could be adversely affected.
Our competitors include software vendors that offer software products that directly compete with our product offerings. In addition to competing with these vendors directly for sales to end-users of our products, we compete with them for the opportunity to have our products bundled with the product offerings of our strategic partners such as computer hardware OEMs and ISPs. Our competitors could gain market share from us if any of these strategic partners replace our products with the products of our competitors or if these partners more actively promote our competitors’ products than our products. In addition, software vendors who have bundled our products with theirs may choose to bundle their software with their own or other vendors’ software or may limit our access to standard product interfaces and inhibit our ability to develop products for their platform. In the future, further product development by these vendors could cause our software applications and services to become redundant, which could significantly impact our sales and financial results.
We face growing competition from network equipment, computer hardware manufacturers, large operating system providers and other technology companies. These firms are increasingly developing and incorporating into their products data protection and storage and server management software that competes at some levels with our product offerings. Our competitive position could be adversely affected to the extent that our customers perceive the functionality incorporated into these products as replacing the need for our products.
Security protection is also offered by some of our competitors at prices lower than our prices or, in some cases is offered free of charge. Some companies offer the lower-priced or free security products within their computer hardware or software products that we believe are inferior to our products and SaaS offerings. Our competitive position could be adversely affected to the extent that our customers perceive these security products as replacing the need for more effective, full featured products and services such as those that we provide. The expansion of these competitive trends could have a significant negative impact on our sales and financial results by causing, among other things, price reductions of our products, reduced profitability and loss of market share.
Many of our competitors have greater financial, technical, sales, marketing, or other resources than we do and consequently may have the ability to influence customers to purchase their products instead of ours. Further consolidation within our industry or other changes in the competitive environment, such as Intel Corporation’s acquisition of McAfee, could result in larger competitors that compete with us on several levels. We also face competition from many smaller companies that specialize in particular segments of the markets in which we compete.
If the separation, together with certain related transactions, is determined to be taxable for U.S. federal income tax purposes, we, our stockholders that are subject to U.S. federal income tax and/or the independent information management business could incur significant income tax liabilities.
Receipt of opinions from outside tax counsel and from a national accounting firm (together, the “tax opinions”) substantially to the effect that, for U.S. federal income tax purposes, the proposed separation and certain related internal transactions (collectively the "separation") will qualify under Sections 355 and 368 of the Internal Revenue Code (the “Code), will be a condition to the completion of the separation. In addition, we will seek a private letter ruling from the IRS to the effect that, among other things, certain aspects of the spin-off and certain other related transactions will not disqualify the spin-off or the related transactions from receiving the generally tax-free treatment that we are anticipating for U.S. federal income tax purposes under the same Code sections. The tax opinions and private letter ruling will rely on certain facts, assumptions,
11
representations and undertakings, including those regarding the past and future conduct of certain of our businesses and other matters. If any of these facts, assumptions, representations or undertakings are incorrect or not satisfied, we and our stockholders may not be able to rely on the tax opinions and could be subject to significant tax liabilities. Notwithstanding the tax opinions and private letter ruling, the IRS could determine on audit that the separation and certain other related transactions are taxable if it determines that any of these facts, assumptions, representations or undertakings are not correct or have been violated or if it disagrees with the conclusions in the tax opinions, or for other reasons. The tax opinions will not be binding on the IRS or the courts. Accordingly, the IRS or the courts may challenge the conclusions stated in the tax opinions and such challenge could prevail.
If the separation is determined to be taxable for U.S. federal income tax purposes, we and those of our stockholders that are subject to U.S. federal income tax could incur significant U.S. federal income tax liabilities. For example, if the spin-off fails to qualify for tax-free treatment, the transactions would, for U.S. federal income tax purposes, be treated as if the stock of the information management business was sold in a taxable sale for its fair market value, and our stockholders who are subject to U.S. federal income tax would be treated as receiving a taxable distribution in an amount equal to the fair market value of the stock received in the spin-off. Additionally, the parties and their respective affiliates could incur significant U.S. and foreign income tax liabilities if it is ultimately determined that certain related internal transactions undertaken in connection with the separation are taxable.
The parties might not be able to engage in desirable strategic transactions and equity issuances following the separation because of restrictions relating to U.S. federal income tax requirements for tax-free distributions.
The parties' ability to engage in significant equity transactions could be limited or restricted after the separation in order to preserve, for U.S. federal income tax purposes, the tax-free nature of the separation and certain related internal transactions. Even if the separation otherwise qualifies for tax-free treatment under Section 355 of the Code, it may result in corporate-level taxable gain to Symantec if 50% or more, by vote or value, of our shares or shares of the independent information management business are acquired or issued as part of a plan or series of related transactions that includes the separation. Any acquisitions or issuances of the shares of either party within two years after the separation are generally presumed to be part of such a plan, although the parties may be able to rebut that presumption.
To preserve the tax-free treatment to us of the separation, the parties will agree not to take or fail to take any action that prevents the separation and related transactions from being tax-free, among other restrictions. These restrictions may limit our ability to pursue strategic transactions.
Fluctuations in our quarterly financial results have affected the price of our common stock in the past and could affect our stock price in the future.
Our quarterly financial results have fluctuated in the past and are likely to vary significantly in the future due to a number of factors, many of which are outside of our control. If our quarterly financial results or our predictions of future financial results fail to meet our expectations or the expectations of securities analysts and investors, our stock price could be negatively affected. Any volatility in our quarterly financial results may make it more difficult for us to raise capital in the future or pursue acquisitions that involve issuances of our stock. Our operating results for prior periods may not be effective predictors of our future performance.
Factors associated with our industry, the operation of our business, and the markets for our products may cause our quarterly financial results to fluctuate, including:
• | Reduced demand for any of our products and services; |
• | Entry of new competition into our markets; |
• | Competitive pricing pressure for one or more of our classes of products; |
• | Our ability to timely complete the release of new or enhanced versions of our products; |
• | How well we execute our strategy and operating plans and the impact of changes in our business model that could result in significant restructuring charges; |
• | Fluctuations in foreign currency exchange rates; |
• | The number, severity, and timing of threat outbreaks (e.g. worms and viruses); |
• | Our resellers making a substantial portion of their purchases near the end of each quarter; |
• | Enterprise customers’ tendency to negotiate site licenses near the end of each quarter; |
• | Cancellation, deferral, or limitation of orders by customers; |
• | Changes in the mix or type of products sold; |
12
• | Movements in interest rates; |
• | The rate of adoption of new product technologies and new releases of operating systems; |
• | Changes in accounting rules; |
• | Weakness or uncertainty in general economic or industry conditions in any of the multiple markets in which we operate that could reduce customer demand and ability to pay for our products and services; |
• | Political and military instability, which could slow spending within our target markets, delay sales cycles, and otherwise adversely affect our ability to generate revenues and operate effectively; |
• | Budgetary constraints of customers, which are influenced by corporate earnings and government budget cycles and spending objectives; |
• | Disruptions in our business operations or target markets caused by, among other things, earthquakes, floods, or other natural disasters affecting our headquarters located in Silicon Valley, California, an area known for seismic activity, or our other locations worldwide; |
• | Acts of war or terrorism; |
• | Intentional disruptions by third parties; and |
• | Health or similar issues, such as a pandemic. |
Any of the foregoing factors could cause the trading price of our common stock to fluctuate significantly.
Our business models present execution and competitive risks.
In recent years, our SaaS offerings have become increasingly critical in our business. Our competitors are rapidly developing and deploying SaaS offerings for consumers and business customers. Pricing and delivery models are evolving. Devices and form factors influence how users access services in the cloud. We are devoting significant resources to develop and deploy our own SaaS strategies. We cannot assure you that our investments in and development of SaaS offerings will achieve the expected returns for us or that we will be able to compete successfully in the marketplace. In addition to software development costs, we are incurring costs to build and maintain infrastructure to support SaaS offerings. These costs may reduce the operating margins we have previously achieved. Whether we are successful in this business model depends on our execution in a number of areas, including:
• | Continuing to innovate and bring to market compelling cloud-based experiences that generate increasing traffic and market share; and |
• | Ensuring that our SaaS offerings meet the reliability expectations of our customers and maintain the security of their data. |
We may need to change our pricing models to compete successfully.
The intense competition we face in the sales of our products and services and general economic and business conditions can put pressure on us to change our prices. If our competitors offer deep discounts on certain products or services or develop products that the marketplace considers more valuable, we may need to lower prices or offer other favorable terms in order to compete successfully. Any such changes may reduce margins and could adversely affect operating results. Additionally, the increasing prevalence of cloud and SaaS delivery models offered by us and our competitors may unfavorably impact pricing in both our on-premise enterprise software business and our cloud business, as well as overall demand for our on-premise software product and service offerings, which could reduce our revenues and profitability. Our competitors may offer lower pricing on their support offerings, which could put pressure on us to further discount our product or support pricing.
Any broad-based change to our prices and pricing policies could cause our revenues to decline or be delayed as our sales force implements and our customers adjust to the new pricing policies. Some of our competitors may bundle products for promotional purposes or as a long-term pricing strategy or provide guarantees of prices and product implementations. These practices could, over time, significantly constrain the prices that we can charge for certain of our products. If we do not adapt our pricing models to reflect changes in customer use of our products or changes in customer demand, our revenues could decrease. The increase in open source software distribution may also cause us to change our pricing models.
Our business depends on customers renewing their arrangements for maintenance, subscriptions, managed security services and SaaS offerings.
A large portion of our revenue is derived from arrangements for maintenance, subscriptions, managed security services and SaaS offerings, yet existing customers have no contractual obligation to purchase additional solutions after the initial subscription or contract period. Our customers’ renewal rates may decline or fluctuate as a result of a number of factors, including the level of their satisfaction with our solutions or our customer support, customer budgets and the pricing of our solutions compared with the solutions offered by our competitors, any of which may cause our revenue to grow more slowly
13
than expected, if at all. Accordingly, we must invest significant time and resources in providing ongoing value to our customers. If these efforts fail, or if our customers do not renew for other reasons, or if they renew on terms less favorable to us, our revenue may decline and our business will suffer.
Our increasing focus on the delivery of products in an appliance form factor creates new business and financial risks.
Since fiscal 2012, shipments of products to customers in an appliance form factor have represented an increasingly larger part of our revenues, particularly in our information management segment, and we expect this trend to continue. The delivery of solutions in the form of appliances creates business and financial risks, including the following:
• | Increased cost of components and contract manufacturing, as we do not own our manufacturing facilities; |
• | Supply chain issues, including financial problems of contract manufacturers or component suppliers; |
• | A shortage of adequate component supply or manufacturing capacity that increases our costs and/or causes a delay in order fulfillment; |
• | Excess inventory levels, which could lead to write-downs or obsolescence charges; |
• | Additional reserves for product returns; |
• | Challenges in managing our channel business; |
• | Tax and trade compliance complications; and |
• | Local field support of customers’ appliances. |
Defects, disruptions or risks related to the provision of our SaaS offerings could impair our ability to deliver our services and could expose us to liability, damage our brand and reputation or otherwise negatively impact our business.
Our SaaS offerings may contain errors or defects that users identify after they begin using them that could result in unanticipated service interruptions, which could harm our reputation and our business. Since our customers use our SaaS offerings for mission-critical protection from threats to electronic information, endpoint devices, and computer networks, any errors, defects, disruptions in service or other performance problems with our SaaS offerings could significantly harm our reputation and may damage our customers’ businesses. If that occurs, customers could elect not to renew, or delay or withhold payment to us, we could lose future sales or customers may make warranty or other claims against us, which could result in an increase in our provision for doubtful accounts, an increase in collection cycles for accounts receivable or the expense and risk of litigation.
We currently serve our SaaS-based customers from hosting facilities located across the globe. Damage to, or failure of, any significant element of these hosting facilities could result in interruptions in our service, which could harm our customers and expose us to liability. Interruptions or failures in our service delivery could cause customers to terminate their subscriptions with us, could adversely affect our renewal rates, and could harm our ability to attract new customers. Our business would also be harmed if our customers believe that our SaaS offerings are unreliable.
Our SaaS offerings also involve the storage and transmission of large amounts of our customers’ proprietary information, including sensitive and personally identifiable information. Breaches of our security measures or the accidental loss, inadvertent disclosure or unapproved dissemination of proprietary information or sensitive or confidential data about us or our customers, including the potential loss or disclosure of such information or data as a result of fraud or other forms of deception, could expose us, our customers or the individuals affected to a risk of loss or misuse of this information, result in litigation and potential liability for us, damage our brand and reputation or otherwise negatively impact our business. Despite our precautions and significant ongoing investments to protect against such breaches, our security measures could be breached at any time and could result in unauthorized third parties obtaining access to our, or our customers’ data. Any actual or perceived security vulnerabilities in our SaaS offerings could reduce sales, and constrain consumer and business customer adoption of our SaaS offering. In addition, the cost and operational consequences of implementing further security measures could be significant. In addition, prolonged delays or unforeseen difficulties in connection with adding storage capacity or upgrading our network architecture when required may cause our service quality to suffer. Problems with the reliability or security of our systems could harm our reputation.
We process, store and use personal information and other data, which subjects us to governmental regulation and other legal obligations related to privacy, and our actual or perceived failure to comply with such obligations could harm our business.
We receive, store, and process personal information and other customer data. There are numerous federal, state, local and foreign laws regarding privacy and the storing, sharing, use, processing, disclosure and protection of personal information and other customer data, the scope of which are changing and, subject to differing interpretations. We generally seek to comply with industry standards and are subject to the terms of our privacy policies and privacy-related obligations to third parties. We strive to comply with all applicable laws, policies, legal obligations and industry codes of conduct relating to privacy and data
14
protection to the extent possible. However, it is possible that these obligations may be interpreted and applied in a manner that is inconsistent from one jurisdiction to another and may conflict with other rules or our practices. Any failure or perceived failure by us to comply with our privacy policies, our privacy-related obligations to customers or other third parties, our privacy-related legal obligations, or any compromise of security that results in the unauthorized release or transfer of personally identifiable information or other customer data, may result in governmental enforcement actions, litigation, or public statements against us by consumer advocacy groups or others and could cause our customers to lose trust in us, which could have an adverse effect on our reputation and business. Our customers may also accidentally disclose their passwords or store them on a mobile device that is lost or stolen, creating the perception that our systems are not secure against third-party access. Additionally, if third parties that we work with, such as vendors or developers, violate applicable laws or our policies, such violations may also put our customers’ information at risk and could in turn have an adverse effect on our business. Any significant change to applicable laws, regulations or industry practices regarding the use or disclosure of our customers’ data, or regarding the manner in which the express or implied consent of customers for the use and disclosure of such data is obtained, could require us to modify our solutions and features, possibly in a material manner, and may limit our ability to develop new services and features that make use of the data that our customers voluntarily share with us.
If we fail to manage our sales and distribution channels effectively, or if our partners choose not to market and sell our products to their customers, our operating results could be adversely affected.
We sell our products to customers around the world through multi-tiered sales and distribution networks. Sales through these different channels involve distinct risks, including the following:
Direct Sales. A significant portion of our revenues from enterprise products is derived from sales by our direct sales force to end-users. Special risks associated with direct sales include:
• | Longer sales cycles associated with direct sales efforts; |
• | Difficulty in hiring, retaining, and motivating our direct sales force, particularly through periods of transition in our organization; and |
• | Substantial amounts of training for sales representatives to become productive in selling our products and services, including regular updates to cover new and revised products, and associated delays and difficulties in recognizing the expected benefits of investments in new products and updates. |
Indirect Sales Channels. A significant portion of our revenues is derived from sales through indirect channels, including distributors that sell our products to end-users and other resellers. This channel involves a number of risks, including:
• | Our lack of control over the timing of delivery of our products to end-users; |
• | Our resellers and distributors are generally not subject to minimum sales requirements or any obligation to market our products to their customers; |
• | Our reseller and distributor agreements are generally nonexclusive and may be terminated at any time without cause; |
• | Our resellers and distributors frequently market and distribute competing products and may, from time to time, place greater emphasis on the sale of these products due to pricing, promotions, and other terms offered by our competitors; and |
• | The consolidation of electronics retailers has increased their negotiating power with respect to hardware and software providers such as us. |
OEM Sales Channels. A portion of our revenues is derived from sales through our OEM partners that incorporate our products into, or bundle our products with, their products. Our reliance on this sales channel involves many risks, including:
• | Our lack of control over the volume of systems shipped and the timing of such shipments; |
• | Our OEM partners are generally not subject to minimum sales requirements or any obligation to market our products to their customers; |
• | Our OEM partners may terminate or renegotiate their arrangements with us and new terms may be less favorable due to competitive conditions in our markets and other factors; |
• | Sales through our OEM partners are subject to changes in general economic conditions, strategic direction, competitive risks, and other issues that could result in a reduction of OEM sales; |
• | The development work that we must generally undertake under our agreements with our OEM partners may require us to invest significant resources and incur significant costs with little or no assurance of ever receiving associated revenues; |
15
• | The time and expense required for the sales and marketing organizations of our OEM partners to become familiar with our products may make it more difficult to introduce those products to the market; and |
• | Our OEM partners may develop, market, and distribute their own products and market and distribute products of our competitors, which could reduce our sales. |
If we fail to manage our sales and distribution channels successfully, these channels may conflict with one another or otherwise fail to perform as we anticipate, which could reduce our sales and increase our expenses as well as weaken our competitive position. Some of our distribution partners have experienced financial difficulties in the past, and if our partners suffer financial difficulties in the future because of general economic conditions or for other reasons, these partners may delay paying their obligations to us and we may have reduced sales or increased bad debt expense that could adversely affect our operating results. In addition, reliance on multiple channels subjects us to events that could cause unpredictability in demand, which could increase the risk that we may be unable to plan effectively for the future, and could result in adverse operating results in future periods.
Over the long term we intend to invest in research and development activities, and these investments may achieve delayed, or lower than expected, benefits which could harm our operating results.
While we continue to focus on managing our costs and expenses, over the long term, we also intend to invest significantly in research and development activities as we focus on organic growth through internal innovation in each of our business segments. We believe that we must continue to dedicate a significant amount of resources to our research and development efforts to maintain our competitive position. We recognize the costs associated with these research and development investments earlier than the anticipated benefits, and the return on these investments may be lower, or may develop more slowly, than we expect. If we do not achieve the benefits anticipated from these investments, or if the achievement of these benefits is delayed, our operating results may be adversely affected.
Changes in industry structure and market conditions could lead to charges related to discontinuances of certain of our products or businesses and asset impairments.
In response to changes in industry and market conditions, or in connection with our pending separation, we may be required to strategically reallocate our resources and consider restructuring, disposing of, or otherwise exiting businesses. Any decision to limit investment in or dispose of or otherwise exit businesses may result in the recording of special charges, such as inventory and technology-related write-offs, workforce reduction costs, charges relating to consolidation of excess facilities, or claims from third parties who were resellers or users of discontinued products. Our estimates with respect to the useful life or ultimate recoverability of our carrying basis of assets, including purchased intangible assets, could change as a result of such assessments and decisions. Although in certain instances, our supply agreements allow us the option to cancel, reschedule, and adjust our requirements based on our business needs prior to firm orders being placed, our loss contingencies may include liabilities for contracts that we cannot cancel, reschedule or adjust with contract manufacturers and suppliers. Further, our estimates relating to the liabilities for excess facilities are affected by changes in real estate market conditions. Additionally, we are required to evaluate goodwill impairment on an annual basis and between annual evaluations in certain circumstances, and future goodwill impairment evaluations may result in a charge to earnings.
Our inability to successfully recover from a disaster or other business continuity event could impair our ability to deliver our products and services and harm our business.
We are heavily reliant on our technology and infrastructure to provide our products and services to our customers. For example, we host many of our products using third-party data center facilities and we do not control the operation of these facilities. These facilities are vulnerable to damage, interruption or performance problems from earthquakes, hurricanes, floods, fires, power loss, telecommunications failures and similar events. They are also subject to break-ins, computer viruses, sabotage, intentional acts of vandalism and other misconduct. The occurrence of a natural disaster or an act of terrorism, a decision to close the facilities without adequate notice or other unanticipated problems could result in lengthy interruptions in the delivery of our products and services.
Furthermore, our business administration, human resources and finance services depend on the proper functioning of our computer, telecommunication and other related systems and operations. A disruption or failure of these systems or operations because of a disaster or other business continuity event could cause data to be lost or otherwise delay our ability to complete sales and provide the highest level of service to our customers. In addition, we could have difficulty producing accurate financial statements on a timely basis, which could adversely affect the trading value of our stock. Although we endeavor to ensure there is redundancy in these systems and that they are regularly backed-up, there are no assurances that data recovery in the event of a disaster would be effective or occur in an efficient manner.
Any errors, defects, disruptions or other performance problems with our products and services could harm our reputation and may damage our customers’ businesses. For example, we may experience disruptions, outages and other performance problems due to a variety of factors, including infrastructure changes, human or software errors, capacity constraints due to an
16
overwhelming number of users accessing our website simultaneous, fraud or security attacks. In some instances, we may not be able to identify the cause or causes of these performance problems within an acceptable period of time. Interruptions in our products and services could impact our revenues or cause customers to cease doing business with us. In addition, our business would be harmed if any of events of this nature caused our customers and potential customers to believe our services are unreliable. Our operations are dependent upon our ability to protect our technology infrastructure against damage from business continuity events that could have a significant disruptive effect on our operations. We could potentially lose customer data or experience material adverse interruptions to our operations or delivery of services to our clients in a disaster recovery scenario.
We have grown, and may continue to grow, through acquisitions, which gives rise to risks and challenges that could adversely affect our future financial results.
We have in the past acquired, and we expect to acquire in the future, other businesses, business units, and technologies. Acquisitions can involve a number of special risks and challenges, including:
• | Complexity, time, and costs associated with the integration of acquired business operations, workforce, products, and technologies; |
• | Diversion of management time and attention; |
• | Loss or termination of employees, including costs associated with the termination or replacement of those employees; |
• | Assumption of liabilities of the acquired business, including litigation related to the acquired business; |
• | The addition of acquisition-related debt as well as increased expenses and working capital requirements; |
• | Dilution of stock ownership of existing stockholders; and |
• | Substantial accounting charges for restructuring and related expenses, write-off of in-process research and development, impairment of goodwill, amortization of intangible assets, and stock-based compensation expense. |
If integration of our acquired businesses is not successful, we may not realize the potential benefits of an acquisition or suffer other adverse effects. To integrate acquired businesses, we must implement our technology systems in the acquired operations and integrate and manage the personnel of the acquired operations. We also must effectively integrate the different cultures of acquired business organizations into our own in a way that aligns various interests, and may need to enter new markets in which we have no or limited experience and where competitors in such markets have stronger market positions.
Any of the foregoing, and other factors, could harm our ability to achieve anticipated levels of profitability from our acquired businesses or to realize other anticipated benefits of acquisitions.
Our international operations involve risks that could increase our expenses, adversely affect our operating results, and require increased time and attention of our management.
We derive a substantial portion of our revenues from customers located outside of the U.S. and we have significant operations outside of the U.S., including engineering, sales, customer support, and production. We plan to expand our international operations, but such expansion is contingent upon our identification of growth opportunities. Our international operations are subject to risks in addition to those faced by our domestic operations, including:
• | Potential loss of proprietary information due to misappropriation or laws that may be less protective of our intellectual property rights than U.S. laws or that may not be adequately enforced; |
• | Requirements of foreign laws and other governmental controls, including trade and labor restrictions and related laws that reduce the flexibility of our business operations; |
• | Regulations or restrictions on the use, import, or export of encryption technologies that could delay or prevent the acceptance and use of encryption products and public networks for secure communications; |
• | Local business and cultural factors that differ from our normal standards and practices, including business practices that we are prohibited from engaging in by the Foreign Corrupt Practices Act and other anti-corruption laws and regulations; |
• | Central bank and other restrictions on our ability to repatriate cash from our international subsidiaries or to exchange cash in international subsidiaries into cash available for use in the U.S.; |
• | Fluctuations in currency exchange rates, economic instability and inflationary conditions could reduce our customers’ ability to obtain financing for software products or could make our products more expensive or could increase our costs of doing business in certain countries; |
• | Limitations on future growth or inability to maintain current levels of revenues from international sales if we do not invest sufficiently in our international operations; |
• | Longer payment cycles for sales in foreign countries and difficulties in collecting accounts receivable; |
17
• | Difficulties in staffing, managing, and operating our international operations, including difficulties related to administering our stock plans in some foreign countries; |
• | Difficulties in coordinating the activities of our geographically dispersed and culturally diverse operations; |
• | Seasonal reductions in business activity in the summer months in Europe and in other periods in other countries; |
• | Costs and delays associated with developing software and providing support in multiple languages; and |
• | Political unrest, war, or terrorism, or regional natural disasters, particularly in areas in which we have facilities. |
A significant portion of our transactions outside of the U.S. is denominated in foreign currencies. Accordingly, our revenues and expenses will continue to be subject to fluctuations in foreign currency rates. For example, in recent periods the U.S. dollar has strengthened significantly against the Euro and other major currencies, which has adversely impacted our reported international revenue. We expect to be affected by fluctuations in foreign currency rates in the future, especially if international sales continue to grow as a percentage of our total sales or our operations outside the U.S. continue to increase.
The level of corporate income tax from sales to our non-U.S. customers is generally less than the level of tax from sales to our U.S. customers. This benefit is contingent upon existing tax regulations in the U.S. and in the countries in which our international operations are located. Future changes in domestic or international tax regulations could adversely affect our ability to continue to realize these tax benefits.
Our products are complex and operate in a wide variety of environments, systems, applications and configurations, which could result in errors or product failures.
Because we offer very complex products, undetected errors, failures, or bugs may occur, especially when products are first introduced or when new versions are released. Our products are often installed and used in large-scale computing environments with different operating systems, system management software, and equipment and networking configurations, which may cause errors or failures in our products or may expose undetected errors, failures, or bugs in our products. Our customers’ computing environments are often characterized by a wide variety of standard and non-standard configurations that make pre-release testing for programming or compatibility errors very difficult and time-consuming. In addition, despite testing by us and others, errors, failures, or bugs may not be found in new products or releases until after commencement of commercial shipments. In the past, we have discovered software errors, failures, and bugs in certain of our product offerings after their introduction and, in some cases, have experienced delayed or lost revenues as a result of these errors.
Errors, failures, or bugs in products released by us could result in negative publicity, damage to our brand, product returns, loss of or delay in market acceptance of our products, loss of competitive position, or claims by customers or others. Many of our end-user customers use our products in applications that are critical to their businesses and may have a greater sensitivity to defects in our products than to defects in other, less critical, software products. In addition, if an actual or perceived breach of information integrity, security or availability occurs in one of our end-user customer’s systems, regardless of whether the breach is attributable to our products, the market perception of the effectiveness of our products could be harmed. Alleviating any of these problems could require significant expenditures of our capital and other resources and could cause interruptions, delays, or cessation of our product licensing, which could cause us to lose existing or potential customers and could adversely affect our operating results.
If we do not protect our proprietary information and prevent third parties from making unauthorized use of our products and technology, our financial results could be harmed.
Most of our software and underlying technology is proprietary. We seek to protect our proprietary rights through a combination of confidentiality agreements and procedures and through copyright, patent, trademark, and trade secret laws. However, all of these measures afford only limited protection and may be challenged, invalidated, or circumvented by third parties. Third parties may copy all or portions of our products or otherwise obtain, use, distribute, and sell our proprietary information without authorization.
Third parties may also develop similar or superior technology independently by designing around our patents. Our shrink-wrap license agreements are not signed by licensees and therefore may be unenforceable under the laws of some jurisdictions. Furthermore, the laws of some foreign countries do not offer the same level of protection of our proprietary rights as the laws of the U.S., and we may be subject to unauthorized use of our products in those countries. The unauthorized copying or use of our products or proprietary information could result in reduced sales of our products. Any legal action to protect proprietary information that we may bring or be engaged in with a strategic partner or vendor could adversely affect our ability to access software, operating system, and hardware platforms of such partner or vendor, or cause such partner or vendor to choose not to offer our products to their customers. In addition, any legal action to protect proprietary information that we may bring or be engaged in, could be costly, may distract management from day-to-day operations, and may lead to additional claims against us, which could adversely affect our operating results.
18
From time to time we are a party to lawsuits and investigations, which typically require significant management time and attention and result in significant legal expenses, and which could, if not determined favorably, negatively impact our business, financial condition, results of operations, and cash flows.
We have been named as a party to lawsuits, including patent litigation, class actions and governmental claims, and we may be named in additional litigation. The expense of defending such litigation may be costly and divert management’s attention from the day-to-day operations of our business, which could adversely affect our business, results of operations, and cash flows. In addition, an unfavorable outcome in such litigation could result in significant fines, settlements, monetary damages or injunctive relief that could negatively impact our ability to conduct our business, results of operations, and cash flows.
Third parties claiming that we infringe their proprietary rights could cause us to incur significant legal expenses and prevent us from selling our products.
From time to time, third parties may claim that we have infringed their intellectual property rights, including claims regarding patents, copyrights, and trademarks. Because of constant technological change in the segments in which we compete, the extensive patent coverage of existing technologies, and the rapid rate of issuance of new patents, it is possible that the number of these claims may grow. In addition, former employers of our former, current, or future employees may assert claims that such employees have improperly disclosed to us the confidential or proprietary information of these former employers. Any such claim, with or without merit, could result in costly litigation and distract management from day-to-day operations. If we are not successful in defending such claims, we could be required to stop selling, delay shipments of, or redesign our products, pay monetary amounts as damages, enter into royalty or licensing arrangements, or satisfy indemnification obligations that we have with some of our customers. We cannot assure you that any royalty or licensing arrangements that we may seek in such circumstances will be available to us on commercially reasonable terms or at all. We have made and expect to continue making significant expenditures to investigate, defend and settle claims related to the use of technology and intellectual property rights as part of our strategy to manage this risk.
In addition, we license and use software from third parties in our business. These third party software licenses may not continue to be available to us on acceptable terms or at all, and may expose us to additional liability. This liability, or our inability to use any of this third party software, could result in shipment delays or other disruptions in our business that could materially and adversely affect our operating results.
Adverse global economic events may harm our business, operating results and financial condition.
Adverse macroeconomic conditions could negatively affect our business, operating results or financial condition under a number of different scenarios. During challenging economic times and periods of high unemployment, current or potential customers may delay or forgo decisions to license new products or additional instances of existing products, upgrade their existing hardware or operating environments (which upgrades are often a catalyst for new purchases of our software), or purchase services. Customers may also have difficulties in obtaining the requisite third-party financing to complete the purchase of our products and services. An adverse macroeconomic environment could also subject us to increased credit risk should customers be unable to pay us, or delay paying us, for previously purchased products and services. Accordingly, reserves for doubtful accounts and write-offs of accounts receivable may increase. In addition, weakness in the market for end users of our products could harm the cash flow of our distributors and resellers who could then delay paying their obligations to us or experience other financial difficulties. This would further increase our credit risk exposure and, potentially, cause delays in our recognition of revenue on sales to these customers.
In addition, the onset or continuation of adverse economic conditions may make it more difficult to obtain financing for our operations, investing activities (including potential acquisitions) or financing activities. Specific economic trends, such as declines in the demand for PCs, servers, and other computing devices, or softness in corporate information technology spending, could have an even more direct, and harmful, impact on our business.
Our financial condition and results of operations could be adversely affected if we do not effectively manage our liabilities.
As a result of the sale of our 2.75% senior notes (“2.75% notes due 2015”) and 4.20% senior notes (“4.20% notes”) in September 2010, and 2.75% senior notes (“2.75 notes due 2017”) and 3.95% senior notes (“3.95% notes”) in June 2012, we have notes outstanding in an aggregate principal amount of $2.1 billion that mature at specific dates in calendar years 2015, 2017, 2020, and 2022. In addition, we have entered into a credit facility with a borrowing capacity of $1 billion. From time to time in the future, we may also incur indebtedness in addition to the amount available under our credit facility. The maintenance of our debt levels could adversely affect our flexibility to take advantage of certain corporate opportunities and could adversely affect our financial condition and results of operations.
We may be required to use all or a substantial portion of our cash balance to repay these notes on maturity unless we can obtain new financing. There is a risk that we may not be able to refinance existing debt or that the terms of any refinancing may not be as favorable as the terms of our existing debt. Furthermore, if prevailing interest rates or other factors at the time of
19
refinancing result in higher interest rates upon refinancing, then the interest expense relating to that refinanced indebtedness would increase. In addition, changes by any rating agency to our outlook or credit rating could negatively affect the value of both our debt and equity securities and increase the interest we pay on outstanding or future debt. These risks could adversely affect our financial condition and results of operations.
Our software products, SaaS Offerings and website may be subject to intentional disruption that could adversely impact our reputation and future sales.
Despite our precautions and significant ongoing investments to protect against security risks, data protection breaches, cyber-attacks and other intentional disruptions of our products and offerings, we expect to be an ongoing target of attacks specifically designed to impede the performance and availability of our products and offerings and harm our reputation as a company. Similarly, experienced computer programmers may attempt to penetrate our network security or the security of our website and misappropriate proprietary information or cause interruptions of our services. Because the techniques used by such computer programmers to access or sabotage networks change frequently and may not be recognized until launched against a target, we may be unable to anticipate these techniques. The theft or unauthorized use or publication of our trade secrets and other confidential business information as a result of such an event could adversely affect our competitive position, reputation, brand and future sales of our products, and our customers may assert claims against us related to resulting losses of confidential or proprietary information. Furthermore, our employees or contractors may, either intentionally or unintentionally, subject us to information security risks and incidents. Our business could be subject to significant disruption, and we could suffer monetary and other losses and reputational harm, in the event of such incidents.
Some of our products contain “open source” software, and any failure to comply with the terms of one or more of these open source licenses could negatively affect our business.
Certain of our products are distributed with software licensed by its authors or other third parties under so-called “open source” licenses, which may include, by way of example, the GNU General Public License, GNU Lesser General Public License, the Mozilla Public License, the BSD License, and the Apache License. Some of these licenses contain requirements that we make available source code for modifications or derivative works we create based upon the open source software, and that we license such modifications or derivative works under the terms of a particular open source license or other license granting third parties certain rights of further use. By the terms of certain open source licenses, we could be required to release the source code of our proprietary software if we combine our proprietary software with open source software in a certain manner. In addition to risks related to license requirements, usage of open source software can lead to greater risks than use of third party commercial software, as open source licensors generally do not provide warranties or controls on origin of the software. We have established processes to help alleviate these risks, including a review process for screening requests from our development organizations for the use of open source, but we cannot be sure that all open source is submitted for approval prior to use in our products. In addition, many of the risks associated with usage of open source cannot be eliminated, and could, if not properly addressed, negatively affect our business.
If we are unable to adequately address increased customer demands on our technical support services, our relationships with our customers and our financial results may be adversely affected.
We offer technical support services with many of our products. We may be unable to respond quickly enough to accommodate short-term increases in customer demand for support services. We also may be unable to modify the format of our support services to compete with changes in support services provided by competitors or successfully integrate support for our customers. Further customer demand for these services, without corresponding revenues, could increase costs and adversely affect our operating results.
We have outsourced a substantial portion of our worldwide consumer support functions to third party service providers. If these companies experience financial difficulties, do not maintain sufficiently skilled workers and resources to satisfy our contracts, or otherwise fail to perform at a sufficient level under these contracts, the level of support services to our customers may be significantly disrupted, which could materially harm our relationships with these customers.
We sell products to the U.S. government under contracts that include special compliance obligations and subject us to audits and reviews by various agencies of the U.S. government. Any failure to meet these obligations, or an adverse outcome in an audit or investigation, could result in civil damages and/or penalties being assessed against us by the government.
We have sold products through our GSA Schedule contract. Our GSA Schedule contract contains provisions that require us to provide customers purchasing through that contract with negotiated favorable pricing as compared to certain non-federal customers, and requires us to monitor aspects of our commercial sales practices to ensure compliance with that pricing obligation. In the ordinary course of business, sales under our GSA Schedule contract may be subject to audit or investigation by the U.S. government. Noncompliance with the provisions of the contract identified as a result of such reviews (as well as noncompliance identified on our own) could subject us to damages and other penalties, which would adversely affect our operating results and financial condition.
20
On June 4, 2012, we were advised by the Commercial Litigation Branch of the Department of Justice’s Civil Division and the Civil Division of the U.S. Attorney’s Office for the District of Columbia that the government is investigating our compliance with certain provisions of our GSA Schedule contract, including provisions relating to pricing, country of origin, accessibility, and the disclosure of commercial sales practices. The Department of Justice has requested that we preserve, among other things, all records relating to GSA Schedule contracting activity. As reported on the GSA’s publicly-available database, our total sales under the GSA Schedule contract were approximately $222 million from the period beginning January 2007 and ending September 2012. In 2012, a sealed civil lawsuit was filed against Symantec related to compliance with the GSA Schedule contract and contracts with California, Florida, and New York. In July 2014, following expiration of the Court-imposed seal, the U.S. government intervened in the lawsuit and in September 2014, the states of California and Florida intervened in the lawsuit, and the state of New York notified the Court that it would not intervene. In October 2014, the Department of Justice filed an amended complaint, which did not state a specific damages amount, and California and Florida combined their claims with those of the Department of Justice and the relator on behalf of New York in an Omnibus Complaint. The state claims also do not state specific damages amounts.
It is possible that the litigation could lead to claims or findings of violations of the False Claims Act and could be material to our results of operations and cash flows for any period. Violations of the False Claims Act could result in the imposition of damages, including up to treble damages, plus civil penalties in some cases. Whether or not we are successful in defending ourselves in the litigation, the cost to resolve this matter would adversely affect our operating results and financial condition. Any negative publicity related to our government customer contracts or any proceedings surrounding them, regardless of the outcome of this matter, may also damage our business by affecting our ability to compete for new contracts.
Accounting charges may cause fluctuations in our quarterly financial results.
Our financial results have been in the past, and may continue to be in the future, materially affected by non-cash and other accounting charges, including:
• | Amortization of intangible assets; |
• | Impairment of goodwill and other long-lived assets; |
• | Stock-based compensation expense; |
• | Restructuring charges; and |
• | Loss on sale of a business and similar write-downs of assets held for sale. |
Our effective tax rate may increase, which could increase our income tax expense and reduce (increase) our net income (loss).
Our effective tax rate could be adversely affected by several factors, many of which are outside of our control, including:
• | Changes in the relative proportions of revenues and income before taxes in the various jurisdictions in which we operate that have differing statutory tax rates; |
• | Changing tax laws, regulations, and interpretations in multiple jurisdictions in which we operate, including possible corporate tax reform in the U.S., and proposed actions by international bodies such as the OECD, as well as the requirements of certain tax rulings; |
• | The tax effects of purchase accounting for acquisitions and restructuring charges that may cause fluctuations between reporting periods; |
• | Tax assessments, or any related tax interest or penalties that could significantly affect our income tax expense for the period in which the settlements take place; and |
• | Taxes arising in connection with the separation of certain foreign operations of the Information Management business. |
The price of our common stock could decline if our financial results are materially affected by an adverse change in our effective tax rate.
We report our results of operations based on our determination of the aggregate amount of taxes owed in the tax jurisdictions in which we operate. From time to time, we receive notices that a tax authority in a particular jurisdiction believes that we owe a greater amount of tax than we have reported to such authority. We are regularly engaged in discussions and sometimes disputes with these tax authorities. We are engaged in disputes of this nature at this time. If the ultimate determination of our taxes owed in any of these jurisdictions is for an amount in excess of the tax provision we have recorded or reserved for, our operating results, cash flows, and financial condition could be adversely affected.
21
Our stock price may be volatile in the future, and you could lose the value of your investment.
The market price of our common stock has experienced significant fluctuations in the past and may continue to fluctuate in the future, and as a result you could lose the value of your investment. The market price of our common stock may be affected by a number of factors, including:
• | Announcements of quarterly operating results and revenue and earnings forecasts by us that fail to meet or be consistent with our earlier projections or the expectations of our investors or securities analysts; |
• | Announcements by either our competitors or customers that fail to meet or be consistent with their earlier projections or the expectations of our investors or securities analysts; |
• | Rumors, announcements, or press articles regarding our or our competitors’ operations, management, organization, financial condition, or financial statements; |
• | Changes in revenue and earnings estimates by us, our investors, or securities analysts; |
• | Accounting charges, including charges relating to the impairment of goodwill; |
• | Announcements of planned acquisitions or dispositions by us or by our competitors; |
• | Announcements of new or planned products by us, our competitors, or our customers; |
• | Gain or loss of a significant customer, partner, reseller or distributor; |
• | Inquiries by the SEC, NASDAQ, law enforcement, or other regulatory bodies; |
• | Acts of terrorism, the threat of war, and other crises or emergency situations; and |
• | Economic slowdowns or the perception of an oncoming economic slowdown in any of the major markets in which we operate. |
The stock market in general, and the market prices of stocks of technology companies in particular, have experienced extreme price volatility that has adversely affected, and may continue to adversely affect, the market price of our common stock for reasons unrelated to our business or operating results.
Unforeseen catastrophic or other global events could harm our operating results and financial condition.
We are a global company and conduct our business inside and outside the U.S. Our business operations and financial results could be adversely impacted by unforeseen catastrophic or other global events, including an epidemic or a pandemic, acts of war or terrorist attacks, cyber-attacks, natural disasters, or political unrest or turmoil. Unforeseen political turmoil, military escalations, and armed conflict pose a risk of economic disruption in the countries in which they occur and in other countries, which may increase our operating costs. Such incidences of uncertainty could disrupt customers’ spending on our products and services which may adversely affect our revenue. In addition, our corporate headquarters are located in the Silicon Valley area of Northern California, a region known for seismic activity. A significant natural disaster, such as an earthquake, could have a material adverse impact on our business operations, target markets, operating results, and financial condition.
Item 1B. Unresolved Staff Comments
None.
22
Item 2. Properties
Our properties consist primarily of owned and leased office facilities for sales, research and development, administrative, customer service, and technical support personnel. Our corporate headquarters is located in Mountain View, California where we occupy facilities totaling approximately 1,074,000 square feet, of which 723,000 square feet is owned and 351,000 square feet is leased. We also lease an additional 67,000 square feet in the San Francisco Bay Area. Our leased facilities are occupied under leases that expire on various dates through fiscal 2029. The following table presents the approximate square footage of our facilities as of April 3, 2015:
Approximate Total Square Footage(1) | |||||
Owned | Leased | ||||
(In thousands) | |||||
Americas (U.S., Canada and Latin America) | 1,740 | 1,177 | |||
EMEA (Europe, Middle East, Africa) | 285 | 541 | |||
Asia Pacific/Japan | 235 | 1,857 | |||
Total | 2,260 | 3,575 | |||
(1) | Included in the total square footage above are vacant and available-for-lease properties totaling approximately 79,000 square feet. Total square footage excludes approximately 14,000 square feet relating to facilities subleased to third parties. |
We believe that our existing facilities are adequate for our current needs and that the productive capacity of our facilities is substantially utilized.
Item 3. Legal Proceedings
Information with respect to this Item may be found under the heading “Litigation Contingencies” in Note 7 of the Notes to Consolidated Financial Statements in this annual report which information is incorporated into this Item 3 by reference.
Item 4. Mine Safety Disclosures
Not applicable.
23
PART II
Item 5. Market for Registrant’s Common Equity, Related Stockholder Matters and Issuer Purchases of Equity Securities
Price Range of Common Stock
Our common stock is traded on the NASDAQ Global Select Market under the symbol “SYMC.” The high and low closing sales prices set forth below are as reported on the NASDAQ Global Select Market during each quarter of the two most recent fiscal years.
2015 | 2014 | ||||||||||||||||||||||||||||||
Fourth Quarter | Third Quarter | Second Quarter | First Quarter | Fourth Quarter | Third Quarter | Second Quarter | First Quarter | ||||||||||||||||||||||||
High | $ | 26.69 | $ | 26.58 | $ | 24.77 | $ | 23.04 | $ | 24.15 | $ | 25.41 | $ | 26.96 | $ | 25.10 | |||||||||||||||
Low | $ | 23.28 | $ | 21.94 | $ | 22.42 | $ | 19.97 | $ | 18.20 | $ | 21.49 | $ | 22.36 | $ | 21.62 | |||||||||||||||
Stockholders
As of April 3, 2015, there were 1,996 stockholders of record.
Dividends
During fiscal 2015 and fiscal 2014 we declared and paid aggregate cash dividends of $413 million or $0.60 per common share and $418 million or $0.60 per common share, respectively. Dividends declared and paid each quarter during fiscal 2015 and fiscal 2014 were $0.15 per share. Our restricted stock and performance-based stock units have dividend equivalent rights entitling holders to dividend equivalents to be paid in the form of cash upon vesting, for each share of the underlying units. On May 14, 2015, we declared a quarterly dividend in the amount of $0.15 per share of common stock to be paid on June 24, 2015 to all stockholders of record as of June 10, 2015. All future dividends and dividend equivalents are subject to the approval of our Board of Directors.
Repurchases of our equity securities
Stock repurchases during the three months ended April 3, 2015 were as follows:
Total Number of Shares Purchased | Average Price Paid per Share | Total Number of Shares Purchased Under Publicly Announced Plans or Programs | Maximum Dollar Value of Shares That May Yet Be Purchased Under the Plans or Programs | ||||||||||
(In millions, except per share data) | |||||||||||||
January 3, 2015 to January 30, 2015 | 4 | $ | 25.57 | 4 | $ | 183 | |||||||
January 31, 2015 to February 27, 2015 | 1 | $ | 25.50 | 1 | $ | 1,158 | |||||||
February 28, 2015 to April 3, 2015 | — | $ | — | — | $ | 1,158 | |||||||
Total | 5 | $ | 25.55 | 5 | |||||||||
Through our stock repurchase programs we have repurchased shares on a quarterly basis since the fourth quarter of fiscal 2004. During the fourth quarter of fiscal 2015, our Board of Directors authorized a new $1.0 billion stock repurchase program which commenced immediately. Our active stock repurchase programs have $1.2 billion remaining authorized for future repurchase as of April 3, 2015 and do not have an expiration date.
24
Stock performance graph
This performance graph shall not be deemed “filed” for purposes of Section 18 of the Exchange Act or otherwise subject to the liabilities under that Section, and shall not be deemed to be incorporated by reference into any filing of Symantec under the Securities Act or the Exchange Act.
The graph below compares the cumulative total stockholder return on our common stock with the cumulative total return on the S&P 500 Composite Index and the S&P Information Technology Index for the five years ended April 3, 2015 (assuming the investment of $100 in our common stock and in each of the other indices on the last day of trading for fiscal 2010, and the reinvestment of all dividends). The comparisons in the graph below are based on historical data and are not intended to forecast the possible future performance of our common stock.
COMPARISON OF FIVE-YEAR CUMULATIVE TOTAL RETURN
Among Symantec Corporation, the S&P 500 Index
and the S&P Information Technology Index
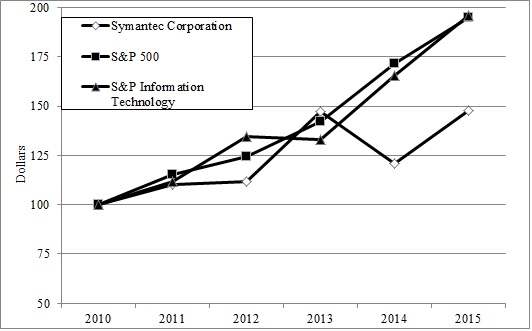
2010 | 2011 | 2012 | 2013 | 2014 | 2015 | ||||||||||||||||||
Symantec Corporation | $ | 100.00 | $ | 110.08 | $ | 111.51 | $ | 147.17 | $ | 121.12 | $ | 147.78 | |||||||||||
S&P 500 | $ | 100.00 | $ | 115.36 | $ | 124.59 | $ | 141.99 | $ | 171.65 | $ | 194.99 | |||||||||||
S&P Information Technology | $ | 100.00 | $ | 111.68 | $ | 134.37 | $ | 132.86 | $ | 165.49 | $ | 196.12 | |||||||||||
25
Item 6. Selected Financial Data
The following selected consolidated financial data is derived from our Consolidated Financial Statements. This data should be read in conjunction with our Consolidated Financial Statements and related notes included in this annual report and with Item 7. Management’s Discussion and Analysis of Financial Condition and Results of Operations. Historical results may not be indicative of future results.
Five-Year Summary
Fiscal (a) | ||||||||||||||||||||
2015 | 2014 | 2013 | 2012 | 2011 | ||||||||||||||||
(In millions, except per share data) | ||||||||||||||||||||
Consolidated Statements of Income Data: | ||||||||||||||||||||
Net revenue | $ | 6,508 | $ | 6,676 | $ | 6,906 | $ | 6,730 | $ | 6,190 | ||||||||||
Operating income | 1,149 | 1,183 | 1,106 | 1,104 | 927 | |||||||||||||||
Net income attributable to Symantec Corporation stockholders (b) | 878 | 898 | 755 | 1,187 | 626 | |||||||||||||||
Net income per share attributable to Symantec Corporation stockholders: (c) | ||||||||||||||||||||
Basic | $ | 1.27 | $ | 1.29 | $ | 1.08 | $ | 1.60 | $ | 0.80 | ||||||||||
Diluted | $ | 1.26 | $ | 1.28 | $ | 1.06 | $ | 1.59 | $ | 0.76 | ||||||||||
Weighted-average shares outstanding: | ||||||||||||||||||||
Basic | 689 | 696 | 701 | 741 | 778 | |||||||||||||||
Diluted | 696 | 704 | 711 | 748 | 786 | |||||||||||||||
Cash dividends per share | $ | 0.60 | $ | 0.60 | $ | — | $ | — | $ | — | ||||||||||
Consolidated Balance Sheet Data: | ||||||||||||||||||||
Cash, cash equivalents, and short-term investments | $ | 3,891 | $ | 4,084 | $ | 4,747 | $ | 3,211 | $ | 2,958 | ||||||||||
Total assets | 13,233 | 13,539 | 14,508 | 13,158 | 12,841 | |||||||||||||||
Deferred revenue | 3,109 | 3,322 | 3,496 | 3,444 | 3,321 | |||||||||||||||
Current portion of long-term debt (c)(d) | 350 | — | 997 | — | 596 | |||||||||||||||
Long-term debt (c)(d) | 1,746 | 2,095 | 2,094 | 2,039 | 1,987 | |||||||||||||||
Long-term deferred revenue | 555 | 581 | 584 | 596 | 565 | |||||||||||||||
Total stockholders’ equity (e) | 5,935 | 5,797 | 5,476 | 5,237 | 4,635 | |||||||||||||||
(a) | We have a 52/53-week fiscal year. Our fiscal 2015 was a 53-week year whereas fiscal 2014, 2013, 2012, and 2011 each consisted of 52 weeks. |
(b) | In fiscal 2008, we formed a joint venture with a subsidiary of Huawei Technologies Co., Limited (“Huawei”). In fiscal 2012, we sold our 49% ownership interest in the joint venture to Huawei for $530 million in cash. The gain of $530 million, offset by costs to sell the joint venture of $4 million, was included in gain from sale of joint venture in our fiscal 2012 Consolidated Statements of Income. |
(c) | In the first quarter of fiscal 2007, we issued $1.0 billion in principal amount of 1.00% Convertible Senior Notes (“1.00% notes”), due in June 2013. On June 15, 2013, the principal balance on those notes matured and was settled by a cash payment of $1 billion, along with the $5 million semi-annual interest payment. In addition, we elected to pay the conversion value above par value of the 1.00% notes in cash in the amount of $189 million. Concurrently with the payment of the conversion value we received $189 million from the note hedge we entered into at the time of the issuance of the 1.00% notes. At the time of issuance of the 1.00% notes, we granted warrants to affiliates of certain initial purchasers of the notes whereby they had the option to purchase up to 52.7 million shares of our common stock at a price of $27.1330 per share. All the warrants expired unexercised on various dates during the second quarter of fiscal 2014 and there was no dilutive impact from the warrants on our earnings per share for fiscal 2014. |
(d) | In fiscal 2011, we issued $350 million in principal amount of 2.75% senior notes due September 2015 (“2.75% notes due 2015”) and $750 million in principal amount of 4.20% senior notes due September 2020 (“4.20% notes”). In fiscal 2013, we issued $600 million in principal amount of 2.75% senior notes due June 2017 (“2.75% notes due 2017”) and $400 million in principal amount of 3.95% senior notes due June 2022 (“3.95% notes”). |
(e) | Includes noncontrolling interest in subsidiary of $78 million and $77 million in fiscal 2012 and fiscal 2011, respectively. |
26
Item 7. Management’s Discussion and Analysis of Financial Condition and Results of Operations
OVERVIEW
Our business
Symantec Corporation is a global leader in security, backup and availability solutions. Our market leading products and services protect people and information in any environment – from the mobile device in your pocket, to the enterprise data center, to cloud-based systems. Founded in April 1982, Symantec operates one of the largest global threat-intelligence networks. The company has more than 19,000 employees in more than 50 countries.
Fiscal calendar
We have a 52/53-week fiscal year ending on the Friday closest to March 31. Unless otherwise stated, references to years in this report relate to fiscal year and periods ended April 3, 2015, March 28, 2014 and March 29, 2013. Our fiscal 2015 was a 53-week year whereas our fiscal 2014 and 2013 were 52-week years.
Strategy
In our security business, we operate a global civilian cyber intelligence threat network and track a vast number of threats across the Internet from hundreds of millions of mobile devices, endpoints, and servers across the globe. We believe one of our competitive advantages is our database of threat indicators which allows us to reduce the number of false positives and provide faster and better protection for customers through our products. We are leveraging our capabilities in threat protection and data loss prevention and extending them into our core security offerings. We are also pioneering new solutions in growing markets like cloud, advanced threat protection, information protection and cyber security services.
Our security strategy is to leverage our unique assets to provide best-in-class consumer and enterprise security products; deliver a unified security analytics platform that provides big data analytics, utilizes our vast telemetry, provides visibility into real-time global threats, and powers Symantec and third-party security analytics applications; and offer cyber security services that provide a full-suite of services from monitoring to incident response to threat intelligence supported by over 500 cyber security experts and nine global threat centers.
In our information management business, with a global installed customer base, we have a comprehensive portfolio that spans backup and recovery, storage management and archiving. Our information availability offerings help customers keep their data and systems available where they need them, when they need them, and irrespective of their location. Our information insight solutions help customers know what data they have and leverage that knowledge to help manage such data better and inform strategic decisions.
Our information management product strategy is to expand our best-in-class foundational portfolio across backup, storage management, business continuity, archiving and eDiscovery through software, integrated appliances and the cloud; deliver next-generation availability solutions through a coordinated orchestration architecture focused on managing and moving mission-critical data in a hybrid cloud world; and enable next-generation insight solutions that provide visibility, action, and automated control across an organization’s information landscape through an intelligent information fabric that integrates our portfolio and third-party ecosystems.
In fiscal 2015, we focused on five priorities: running our businesses with a portfolio approach by managing certain businesses for operating margin; prioritizing investments for growth; further reducing costs and improving efficiencies; attracting top talent to our executive team; and continuing to return significant cash to shareholders. We are optimizing some of our businesses by methodically evaluating every product line to balance our profitability targets against our objectives. In order to prioritize investments for growth, we are realigning our research and development budgets to apply the best resources to the most promising market opportunities. To further reduce costs and improve efficiencies, we are consolidating our global footprint, data centers and product support capabilities as well as streamlining the way we run our businesses with initiatives to increase research and development efficiencies and sales productivity. We are focused on continuing to attract talented business and technology leaders to the company. We remain committed to returning significant cash to shareholders in the form of dividends and share buybacks.
The Planned Separation of Information Management from the Security Business
On October 9, 2014, we announced plans to separate our business into two independent publicly-traded companies: one focused on security and one focused on information management. The transaction is intended to take the form of a tax-free distribution to Symantec shareholders of all of the capital stock of our information management business. We expect to complete the legal separation on January 2, 2016, subject to market, regulatory and certain other conditions. John Gannon has been appointed as General Manager of the information management business, and Don Rath has been appointed as acting Chief Financial Officer. After the transaction, Michael Brown and Thomas Seifert will continue to lead Symantec as Chief Executive Officer and Chief Financial Officer, respectively. For additional separation cost information, see Note 6 of the Notes to Consolidated Financial Statements in this annual report.
27
Our operating segments
Our operating segments are significant strategic business units that offer different products and services distinguished by customer needs. In the second quarter of fiscal 2015, we modified our segment reporting structure to match our new operating structure. The three reporting segments, which are the same as our operating segments, are:
• | Consumer Security: Our Consumer Security segment focuses on making it simple for customers to be productive and protected at home and at work. Our Norton-branded services provide multi-layer security and identity protection on major desktop and mobile operating systems, to defend against increasingly complex online threats to individuals, families, and small businesses. |
• | Enterprise Security: Our Enterprise Security segment protects organizations so they can securely conduct business while leveraging new platforms and data. These products include Secure Socket Layer (“SSL”) Certificates, authentication, mail and web security, data center security, data loss prevention, information security services, endpoint security and management, encryption, and mobile security offerings. |
• | Information Management: Our Information Management segment focuses on backup and recovery, archiving and eDiscovery, storage and high availability solutions, helping to ensure that our customers’ IT infrastructure and mission-critical applications are protected, managed and available. |
For further description of our operating segments see Note 9 of the Notes to Consolidated Financial Statements in this annual report.
Financial results and trends
The following table provides an overview of key financial metrics for each of the last three fiscal years:
2015 | 2014 | 2013 | |||||||||
(In millions, except percentages) | |||||||||||
Consolidated Income Statement Data: | |||||||||||
Total net revenue | $ | 6,508 | $ | 6,676 | $ | 6,906 | |||||
Gross profit | 5,355 | 5,527 | 5,731 | ||||||||
Operating income | 1,149 | 1,183 | 1,106 | ||||||||
Operating margin percentage | 18 | % | 18 | % | 16 | % | |||||
Consolidated Cash Flow and Balance Sheet Data: | |||||||||||
Cash flow from operations | 1,312 | 1,281 | 1,593 | ||||||||
Deferred revenue | 3,664 | 3,903 | 4,080 | ||||||||
Total net revenue decreased $168 million for fiscal 2015 as compared to fiscal 2014, reflecting declines in our content, subscription, and maintenance revenue, partially offset by an additional week from the 53-week fiscal 2015 year and by increased license revenue. Content, subscription, and maintenance revenue decreased $211 million primarily due to the general strengthening of the U.S. dollar against foreign currencies and declines in our consumer security products driven by our channel strategy to exit certain high-cost OEM arrangements and change our renewal practices. This was partially offset by increased revenue from Backup and Recovery products. License revenue increased $43 million primarily due to an increase in sales of our NetBackup appliances, partially offset by unfavorable foreign currency fluctuations.
Gross margin was 82% for fiscal 2015 compared to 83% for fiscal 2014 driven by growth in our lower margin appliance business.
Operating income declined $34 million year over year as lower operating expenses largely offset lower net revenue. Our operating expenses decreased $138 million year over year due to our cost savings initiatives and favorable foreign currency effects of $66 million. Fiscal 2015 operating expenses included $252 million of restructuring, separation, and transition costs compared to $264 million in fiscal 2014. We expect our operating margins to fluctuate in future periods as a result of a number of factors, including our operating results and the timing and amount of expenses incurred.
Net cash provided by operating activities was $1.3 billion for fiscal 2015, which resulted from net income of $878 million adjusted for non-cash items, including depreciation and amortization charges of $443 million and stock-based compensation expense of $195 million. These amounts were partially offset by decreases in deferred income taxes of $23 million and income taxes payable of $191 million.
Deferred revenue decreased $239 million year over year primarily due to unfavorable foreign currency fluctuations.
28
CRITICAL ACCOUNTING POLICIES AND ESTIMATES
The preparation of our Consolidated Financial Statements and related notes included in this annual report in accordance with generally accepted accounting principles in the U.S., requires us to make estimates, including judgments and assumptions, that affect the reported amounts of assets, liabilities, revenue, and expenses, and related disclosure of contingent assets and liabilities. We have based our estimates on historical experience and on various assumptions that we believe to be reasonable under the circumstances. We evaluate our estimates on a regular basis and make changes accordingly. Historically, our critical accounting policies and estimates have not differed materially from actual results; however, actual results may differ from these estimates under different conditions. If actual results differ from these estimates and other considerations used in estimating amounts reflected in our Consolidated Financial Statements included in this annual report, the resulting changes could have a material adverse effect on our Consolidated Statements of Income, and in certain situations, could have a material adverse effect on our liquidity and financial condition.
A critical accounting estimate is based on judgments and assumptions about matters that are uncertain at the time the estimate is made. Different estimates that reasonably could have been used or changes in accounting estimates could materially impact our operating results or financial condition. We believe that the estimates described below represent our critical accounting policies and estimates, as they have the greatest potential impact on our Consolidated Financial Statements. See also Note 1 of the Notes to Consolidated Financial Statements included in this annual report.
Revenue recognition
We recognize revenue primarily pursuant to the requirements under the authoritative guidance on software revenue recognition, and any applicable amendments or modifications. Revenue recognition requirements in the software industry are very complex and require us to make estimates.
For software arrangements that include multiple elements, including perpetual software licenses and maintenance or services, packaged products with content updates, and subscriptions, we allocate and defer revenue for the undelivered items based on the fair value using vendor specific objective evidence (“VSOE”), and recognize the difference between the total arrangement fee and the amount deferred for the undelivered items as revenue. VSOE of each element is based on the price for which the undelivered element is sold separately. We determine fair value of the undelivered elements based on historical evidence of our stand-alone sales of these elements to third parties or from the stated renewal rate for the undelivered elements. When VSOE does not exist for undelivered items, the entire arrangement fee is recognized ratably over the performance period. Our deferred revenue consists primarily of the unamortized balance of enterprise product maintenance, consumer product content updates, managed security services, subscriptions, and arrangements where VSOE does not exist. Deferred revenue totaled approximately $3.7 billion as of April 3, 2015, of which $555 million was classified as long-term deferred revenue in our Consolidated Balance Sheets. Changes to the elements in a software arrangement, the ability to identify VSOE for those elements, the fair value of the respective elements, and increasing flexibility in contractual arrangements could materially impact the amount recognized in the current period and deferred over time.
For arrangements that include both software and non-software elements, we allocate revenue to the software deliverables as a group and non-software deliverables based on their relative selling prices. In such circumstances, the accounting principles establish a hierarchy to determine the selling price to be used for allocating revenue to deliverables as follows: (i) VSOE, (ii) third-party evidence of selling price (“TPE”) and (iii) best estimate of the selling price (“ESP”). When we are unable to establish a selling price using VSOE or TPE, we use ESP to allocate the arrangement fees to the deliverables.
For our consumer products that include content updates, we recognize revenue and the associated cost of revenue ratably over the term of the subscription upon sell-through to end-users, as the subscription period generally commences on the date of sale to the end-user. We defer revenue and cost of revenue amounts for unsold product held by our distributors and resellers.
We expect our distributors and resellers to maintain adequate inventory of consumer packaged products to meet future customer demand, which is generally four or six weeks of customer demand based on recent buying trends. We ship product to our distributors and resellers at their request and based on valid purchase orders. Our distributors and resellers base the quantity of orders on their estimates to meet future customer demand, which may exceed the expected level of a four or six week supply. We offer limited rights of return if the inventory held by our distributors and resellers is below the expected level of a four or six week supply. We estimate reserves for product returns as described below. We typically offer liberal rights of return if inventory held by our distributors and resellers exceeds the expected level. Because we cannot reasonably estimate the amount of excess inventory that will be returned, we primarily offset deferred revenue against trade accounts receivable for the amount of revenue in excess of the expected inventory levels.
Arrangements for maintenance, subscriptions, managed security services and SaaS offerings are generally offered to our customers over a specified period of time, and we recognize the related revenue ratably over the maintenance, subscription, or service period.
29
Reserves for product returns. We reserve for estimated product returns as an offset to revenue or deferred revenue based primarily on historical trends. We fully reserve for obsolete products in the distribution channels as an offset to deferred revenue. Actual product returns may be different than what was estimated. These factors and unanticipated changes in the economic and industry environment could make actual results differ from our return estimates.
Reserves for rebates. We estimate and record reserves for channel and end-user rebates as an offset to revenue or deferred revenue. For consumer products that include content updates, rebates are recorded as a ratable offset to revenue or deferred revenue over the term of the subscription. Our estimated reserves for channel volume incentive rebates are based on distributors’ and resellers’ actual performance against the terms and conditions of volume incentive rebate programs, which are typically entered into quarterly. Our reserves for end-user rebates are estimated based on the terms and conditions of the promotional programs, actual sales during the promotion, the amount of actual redemptions received, historical redemption trends by product and by type of promotional program, and the value of the rebate. We also consider current market conditions and economic trends when estimating our reserves for rebates. If actual redemptions differ from our estimates, material differences may result in the amount and timing of our net revenues for any period presented.
Valuation of goodwill, intangible assets and long-lived assets
Business combination valuations. When we acquire businesses, we allocate the purchase price to tangible assets and liabilities and identifiable intangible assets acquired. Any residual purchase price is recorded as goodwill. The allocation of the purchase price requires management to make significant estimates in determining the fair values of assets acquired and liabilities assumed, especially with respect to intangible assets. These estimates are based on information obtained from management of the acquired companies and historical experience. These estimates can include, but are not limited to:
• | cash flows that an asset is expected to generate in the future; |
• | expected costs to develop the in-process research and development into commercially viable products and estimated cash flows from the projects when completed; |
• | the acquired company’s brand and competitive position, as well as assumptions about the period of time the acquired brand will continue to be used in the combined company’s product portfolio; |
• | cost savings expected to be derived from acquiring an asset; and |
• | discount rates. |
These estimates are inherently uncertain and unpredictable, and if different estimates were used, the purchase price for the acquisition could be allocated to the acquired assets and liabilities differently from the allocation that we have made. In addition, unanticipated events and circumstances may occur which may affect the accuracy or validity of such estimates, and if such events occur we may be required to record a charge against the value ascribed to an acquired asset or an increase in the amounts recorded for assumed liabilities.
Goodwill impairment. We review goodwill for impairment on an annual basis on the first day of the fourth quarter of each fiscal year, and on an interim basis whenever events or changes in circumstances indicate that the carrying value may not be recoverable, at the reporting unit level. Our reporting units are the same as our operating segments. A qualitative assessment is first made to determine whether it is necessary to perform quantitative testing. This initial assessment includes, among others, consideration of: (i) past, current and projected future earnings and equity; (ii) recent trends and market conditions; and (iii) valuation metrics involving similar companies that are publicly-traded and acquisitions of similar companies, if available. If this initial qualitative assessment indicates that it is more likely than not that impairment exists, a second step is taken, involving a comparison between the estimated fair values of our reporting units with their respective carrying amounts including goodwill. The methods for estimating reporting unit values include asset and liability fair values and other valuation techniques, such as discounted cash flows and multiples of earnings or revenues. If the carrying value exceeds estimated fair value, there is an indication of potential impairment, and a third step is performed to measure the amount of impairment. The third step involves calculating an implied fair value of goodwill by measuring the excess of the estimated fair value of the reporting units over the aggregate estimated fair values of the individual assets less liabilities. If the carrying value of goodwill exceeds the implied fair value of goodwill, an impairment charge is recorded for the excess.
The process of estimating the fair value and carrying value of our reporting units’ equity requires significant judgment at many points during the analysis. Many assets and liabilities, such as trade accounts receivable and property and equipment, are not specifically allocated to an individual reporting unit, and therefore, we apply judgment to allocate the assets and liabilities, and this allocation affects the carrying value of the respective reporting units. Similarly, we use judgment to allocate goodwill to the reporting units based on relative fair values. The use of relative fair values has been necessary for certain reporting units due to changes in our operating structure in prior years. To determine a reporting unit’s fair value, we use the income approach under which we calculate the fair value of each reporting unit based on the estimated discounted future cash flows of that unit. We evaluate the reasonableness of this approach by comparing it with the market approach, which involves a review of the
30
carrying value of our assets relative to our market capitalization and to the valuation of publicly traded companies operating in the same or similar lines of business.
Applying the income approach requires that we make a number of important estimates and assumptions. We estimate the future cash flows of each reporting unit based on historical and forecasted revenue and operating costs. This, in turn, involves further estimates, such as estimates of future revenue and expense growth rates. In addition, we apply a discount rate to the estimated future cash flows for the purpose of the valuation. This discount rate is based on the estimated weighted-average cost of capital for each reporting unit and may change from year to year. Changes in these key estimates and assumptions, or in other assumptions used in this process, could materially affect our impairment analysis for a given year.
As of April 3, 2015, our goodwill balance was $5.8 billion amongst our reporting units. Based on a qualitative impairment analysis performed as of January 3, 2015, we determined that it was more likely than not that there was no impairment in any of our reporting units.
A number of factors, many of which we have no ability to control, could affect our financial condition, operating results and business prospects and could cause actual results to differ from the estimates and assumptions we employed. These factors include:
• | a prolonged global economic crisis; |
• | a significant decrease in the demand for our products; |
• | the inability to develop new and enhanced products and services in a timely manner; |
• | a significant adverse change in legal factors or in the business climate; |
• | an adverse action or assessment by a regulator; |
• | successful efforts by our competitors to gain market share in our markets; |
• | a loss of key personnel; |
• | our determination to dispose of one or more of our reporting units; |
• | the testing for recoverability of a significant asset group within a reporting unit; and |
• | recognition of a goodwill impairment loss. |
Intangible asset impairment. We assess the impairment of identifiable finite-lived intangible assets whenever events or changes in circumstances indicate that an asset group’s carrying amount may not be recoverable. Recoverability of certain finite-lived intangible assets, particularly customer relationships and finite-lived trade names, would be measured by the comparison of the carrying amount of the asset group to which the assets are assigned to the sum of the undiscounted estimated future cash flows the asset group is expected to generate. If an asset is considered to be impaired, the amount of such impairment would be measured as the difference between the carrying amount of the asset and its fair value. Recoverability and impairment of other finite-lived intangible assets, particularly developed technology and patents, would be measured by the comparison of the carrying amount of the asset to the sum of undiscounted estimated future product revenues offset by estimated future costs to dispose of the product to which the asset relates. For indefinite-lived intangible assets, we review impairment on an annual basis consistent with the timing of the annual evaluation for goodwill. These assets generally include trade names and trademarks. Similar to goodwill impairment testing, a qualitative assessment is first made to determine whether it is necessary to perform quantitative testing. This initial assessment includes consideration of, among other things: (i) past, current and projected future revenues; (ii) recent trends and market conditions, including discount rates; and (iii) valuation metrics, such as royalty rates, involving similar companies that are publicly-traded, if available. If this initial qualitative assessment indicates that it is more likely than not that impairment exists, a second step is taken. This step involves a comparison between the fair values of the assets and their respective carrying amounts. Any excess of the carrying amount over the fair value would be recognized as an impairment charge. Our cash flow assumptions are based on historical and forecasted future revenue, operating costs, and other relevant factors. Assumptions and estimates about the remaining useful lives of our intangible assets are subjective and are affected by changes to our business strategies. If management’s estimates of future operating results change, or if there are changes to other assumptions, the estimate of the fair value of our identifiable intangible assets could change significantly. Such change could result in impairment charges in future periods, which could have a significant impact on our operating results and financial condition.
Long-lived assets. We assess long-lived assets for impairment whenever events or changes in circumstances indicate that the carrying value of the long-lived assets may not be recoverable. Based on the existence of one or more indicators of impairment, we assess recoverability of long-lived assets based on a projected undiscounted cash flow method using assumptions determined by management to be commensurate with the risk inherent in our current business model. If an asset is not recoverable, impairment is measured as the difference between the carrying amount and its fair value. Our estimates of cash flows require significant judgment based on our historical and anticipated results and are subject to many factors which could
31
change and cause a material impact to our operating results or financial condition. We record impairment charges on long-lived assets held for sale when we determine that the carrying value of the long-lived assets may not be recoverable. In determining fair value, we obtain and consider market value appraisal information from third parties.
Stock-based compensation
We account for stock-based compensation expense, which principally consists of restricted stock units, in accordance with the authoritative guidance on stock compensation. Under the fair value recognition provisions of this guidance, stock-based compensation expense is measured at the grant date based on the fair value of the award and is generally recognized ratably over the requisite service period, which is generally the vesting period of the respective award.
We record stock-based compensation expense for awards that are expected to vest. As a result, judgment is required in estimating the amount of stock-based awards that are expected to be forfeited. Although we estimate forfeitures based on historical experience, actual forfeitures may differ. If actual results differ significantly from these estimates, stock-based compensation expense and our results of operations could be materially impacted when we record an adjustment for the difference in the period that the awards vest or are forfeited.
Contingencies and litigation
We evaluate contingent liabilities including threatened or pending litigation in accordance with the authoritative guidance on contingencies. We assess the likelihood of any adverse judgments or outcomes from potential claims or proceedings, as well as potential ranges of probable losses, when the outcomes of the claims or proceedings are probable and reasonably estimable. A determination of the amount of accrued liabilities required, if any, for these contingencies is made after the analysis of each separate matter. Because of uncertainties related to these matters, we base our estimates on the information available at the time of our assessment. As additional information becomes available, we reassess the potential liability related to our pending claims and litigation and may revise our estimates. Any revisions in the estimates of potential liabilities could have a material impact on our operating results and financial position.
Income taxes
We are required to compute our income taxes in each federal, state, and international jurisdiction in which we operate. This process requires that we estimate the current tax exposure as well as assess temporary differences between the accounting and tax treatment of assets and liabilities, including items such as accruals and allowances not currently deductible for tax purposes. The income tax effects of the differences we identify are classified as current or long-term deferred tax assets and liabilities in our Consolidated Balance Sheets. Our judgments, assumptions, and estimates relative to the current provision for income tax take into account current tax laws, our interpretation of current tax laws, and possible outcomes of current and future audits conducted by foreign and domestic tax authorities. Changes in tax laws or our interpretation of tax laws and the resolution of current and future tax audits could significantly impact the amounts provided for income taxes in our Consolidated Balance Sheets and Consolidated Statements of Income.
Our effective tax rate includes the impact of certain undistributed foreign earnings for which no U.S. taxes have been provided because such earnings are planned to be indefinitely reinvested outside the U.S. While we do not anticipate changing our intention regarding indefinitely reinvested earnings outside the U.S., material changes in our estimates of such earnings or tax legislation that limits or restricts the amount of such earnings could materially impact our income tax provision and effective tax rate. If certain foreign earnings previously treated as indefinitely reinvested outside the U.S. are repatriated, the related U.S. tax liability may be reduced by any foreign income taxes paid on these earnings.
We account for uncertain tax positions pursuant to authoritative guidance based on a two-step approach to recognize and measure those positions taken or expected to be taken in a tax return. The first step is to determine if the weight of available evidence indicates that it is more likely than not that the tax position will be sustained on audit, including resolution of any related appeals or litigation processes. The second step is to measure the tax benefit as the largest amount that is more than 50% likely to be realized upon ultimate settlement. We adjust reserves for our uncertain tax positions due to changing facts and circumstances, such as the closing of a tax audit, the refinement of estimates, or the realization of earnings or deductions that differ from our estimates. To the extent that the final outcome of these matters is different than the amounts recorded, such differences will impact our tax provision in our Consolidated Statements of Income in the period in which such determination is made.
We must also assess the likelihood that deferred tax assets will be realized from future taxable income and, based on this assessment establish a valuation allowance, if required. The determination of our valuation allowance involves assumptions, judgments and estimates, including forecasted earnings, future taxable income, and the relative proportions of revenue and income before taxes in the various domestic and international jurisdictions in which we operate. To the extent we establish a valuation allowance or change the valuation allowance in a period, we reflect the change with a corresponding increase or decrease to our tax provision in our Consolidated Statements of Income.
32
Recently issued authoritative guidance
See Note 1 of the Notes to Consolidated Financial Statements in this annual report for recently issued authoritative guidance, including the respective expected dates of adoption and effects on our results of operations and financial condition.
RESULTS OF OPERATIONS
The following table sets forth certain Consolidated Statements of Income data as a percentage of net revenue for the fiscal years indicated below:
2015 | 2014 | 2013 | ||||||
Net revenue: | ||||||||
Content, subscription, and maintenance | 88 | % | 89 | % | 87 | % | ||
License | 12 | % | 11 | % | 13 | % | ||
Total net revenue | 100 | % | 100 | % | 100 | % | ||
Cost of revenue: | ||||||||
Content, subscription, and maintenance | 15 | % | 15 | % | 15 | % | ||
License | 2 | % | 1 | % | 1 | % | ||
Amortization of intangible assets | 1 | % | 1 | % | 1 | % | ||
Total cost of revenue | 18 | % | 17 | % | 17 | % | ||
Gross profit | 82 | % | 83 | % | 83 | % | ||
Operating expenses: | ||||||||
Sales and marketing | 36 | % | 37 | % | 40 | % | ||
Research and development | 18 | % | 16 | % | 15 | % | ||
General and administrative | 6 | % | 7 | % | 6 | % | ||
Amortization of intangible assets | 2 | % | 2 | % | 4 | % | ||
Restructuring, separation, and transition | 4 | % | 4 | % | 1 | % | ||
Total operating expenses | 65 | % | 65 | % | 67 | % | ||
Operating income | 18 | % | 18 | % | 16 | % | ||
Non-operating expense, net | (1) | % | — | % | (1) | % | ||
The total percentages may not add due to rounding.
Total net revenue by fiscal year
Change in % | |||||||||||||||||
2015 | 2014 | 2013 | 2015 v 2014 | 2014 v 2013 | |||||||||||||
(Dollars in millions) | |||||||||||||||||
Content, subscription, and maintenance revenue | $ | 5,749 | $ | 5,960 | $ | 6,021 | (4) | % | (1) | % | |||||||
License revenue | 759 | 716 | 885 | 6 | % | (19) | % | ||||||||||
Total | $ | 6,508 | $ | 6,676 | $ | 6,906 | (3) | % | (3) | % | |||||||
2015 compared to 2014:
Content, subscription, and maintenance revenue represented 88%, 89% and 87% of total net revenue for the fiscal years ended 2015, 2014 and 2013, respectively. Content, subscription, and maintenance revenue decreased $211 million primarily due to the general strengthening of the U.S. dollar against foreign currencies and declines in our consumer security revenue driven by our channel strategy to exit unprofitable retail arrangements and certain high-cost OEM arrangements, coupled with the impact of our decision to change our renewal practices. This was partially offset by an additional week from the 53-week fiscal 2015 year and by increased revenue from Backup and Recovery products. License revenue increased $43 million primarily due to an increase in sales of our NetBackup appliances, partially offset by unfavorable foreign currency fluctuations.
2014 compared to 2013:
Content, subscription, and maintenance revenue decreased $61 million primarily due to decreases from our Consumer Security segment of $30 million and Information Management segment of $26 million. License revenue decreased $169 million due to declines from our Information Management segment of $89 million, Enterprise Security segment of $63 million and Consumer Security segment of $17 million.
33
Net revenue and operating income by segment by fiscal year
Change in % | |||||||||||||||||
2015 | 2014 | 2013 | 2015 v 2014 | 2014 v 2013 | |||||||||||||
(Dollars in millions) | |||||||||||||||||
Total net revenue: | |||||||||||||||||
Consumer Security | $ | 1,887 | $ | 2,063 | $ | 2,109 | (9) | % | (2) | % | |||||||
Enterprise Security | 2,063 | 2,100 | 2,168 | (2) | % | (3) | % | ||||||||||
Information Management | 2,558 | 2,513 | 2,629 | 2 | % | (4) | % | ||||||||||
Percentage of total net revenue: | |||||||||||||||||
Consumer Security | 29 | % | 31 | % | 31 | % | |||||||||||
Enterprise Security | 32 | % | 31 | % | 31 | % | |||||||||||
Information Management | 39 | % | 38 | % | 38 | % | |||||||||||
Operating income: | |||||||||||||||||
Consumer Security | $ | 982 | $ | 928 | $ | 805 | 6 | % | 15 | % | |||||||
Enterprise Security | 287 | 314 | 213 | (9) | % | 47 | % | ||||||||||
Information Management | 486 | 571 | 684 | (15) | % | (17) | % | ||||||||||
Operating margin: | |||||||||||||||||
Consumer Security | 52 | % | 45 | % | 38 | % | |||||||||||
Enterprise Security | 14 | % | 15 | % | 10 | % | |||||||||||
Information Management | 19 | % | 23 | % | 26 | % | |||||||||||
2015 compared to 2014:
Consumer Security revenue decreased $176 million primarily due to our channel strategy to exit unprofitable retail arrangements and certain high-cost OEM arrangements, coupled with the impact of our decision to change our renewal practices. Consumer Security operating income increased $54 million primarily due to reductions in advertising and promotional expenses of $141 million and decreases in cost of revenue of $52 million and salaries and wages of $26 million, partially offset by the revenue decline.
Enterprise Security revenue decreased $37 million primarily due to unfavorable foreign currency fluctuations of $45 million. The decrease of $27 million in operating income was mainly due to the reduction in revenue.
Information Management revenue increased $45 million primarily due to growth in our NetBackup software which was partially offset by unfavorable foreign currency fluctuations. Information Management operating income decreased $85 million driven by increased headcount related expenses including higher sales commission expense, occupancy expenses and marketing spend, partially offset by the increase in revenue.
2014 compared to 2013:
Consumer Security revenue declined $46 million primarily due to declines in PC tools revenue of $21 million and decreases in certain services activities revenues of $19 million. Consumer Security operating income increased $123 million primarily due to lower advertising and promotional expenses of $128 million.
Enterprise Security revenue declined $68 million primarily due to a $54 million decline in endpoint management sales. Enterprise Security operating income increased $101 million mainly due to lower salaries and wages of $119 million, lower outside services expenses of $28 million, and a decrease in cost of revenue of $24 million, partially offset by lower revenue.
Information Management revenue decreased $116 million primarily due to an $80 million decline in our storage management offerings, a decrease of $50 million from our Backup Exec products and a decrease of $12 million from our Enterprise Vault products. These decreases were partially offset by growth in our NetBackup offerings of $31 million. Information Management operating income decreased $113 million primarily from decreases in revenue and higher materials costs related to our appliances business, coupled with higher costs associated with our services business.
34
Net revenue by geographic region by fiscal year
Change in % | |||||||||||||||||
2015 | 2014 | 2013 | 2015 v 2014 | 2014 v 2013 | |||||||||||||
(Dollars in millions) | |||||||||||||||||
Revenue by geographic region: | |||||||||||||||||
Americas (U.S., Canada and Latin America) | $ | 3,586 | $ | 3,617 | $ | 3,744 | (1) | % | (3) | % | |||||||
EMEA (Europe, Middle East, Africa) | 1,813 | 1,891 | 1,858 | (4) | % | 2 | % | ||||||||||
Asia Pacific/Japan | 1,109 | 1,168 | 1,304 | (5) | % | (10) | % | ||||||||||
Total net revenue | $ | 6,508 | $ | 6,676 | $ | 6,906 | |||||||||||
U.S. | 3,170 | 3,198 | 3,337 | (1) | % | (4) | % | ||||||||||
International | 3,338 | 3,478 | 3,569 | (4) | % | (3) | % | ||||||||||
Total net revenue | $ | 6,508 | $ | 6,676 | $ | 6,906 | |||||||||||
Percentage of total net revenue: | |||||||||||||||||
Americas (U.S., Canada and Latin America) | 55 | % | 54 | % | 54 | % | |||||||||||
EMEA (Europe, Middle East, Africa) | 28 | % | 28 | % | 27 | % | |||||||||||
Asia Pacific/Japan | 17 | % | 18 | % | 19 | % | |||||||||||
U.S. | 49 | % | 48 | % | 48 | % | |||||||||||
International | 51 | % | 52 | % | 52 | % | |||||||||||
Fluctuations in the U.S. dollar compared to foreign currencies unfavorably impacted our international revenue by approximately $156 million for fiscal 2015 as compared to fiscal 2014. Fiscal 2015 revenue for the EMEA and Asia Pacific and Japan regions decreased primarily due to unfavorable foreign currency fluctuations of $100 million and $54 million, respectively, compared to fiscal 2014.
Fluctuations in the U.S. dollar compared to foreign currencies unfavorably impacted our international revenue by approximately $20 million for fiscal 2014 as compared to fiscal 2013. This was due to a $90 million unfavorable foreign currency fluctuation in the Asia Pacific and Japan region partially offset by a favorable foreign currency fluctuation of $70 million in the EMEA region.
Our international sales are expected to continue to be a significant portion of our revenue. As a result, revenue is expected to continue to be affected by foreign currency exchange rates as compared to the U.S. dollar. We are unable to predict the extent to which revenue in future periods will be impacted by changes in foreign currency exchange rates. If international sales become a greater portion of our total sales in the future, changes in foreign currency exchange rates may have a potentially greater impact on our revenue and operating results.
Cost of revenue by fiscal year
Change in % | |||||||||||||||||
2015 | 2014 | 2013 | 2015 v 2014 | 2014 v 2013 | |||||||||||||
(Dollars in millions) | |||||||||||||||||
Cost of content, subscription, and maintenance | $ | 988 | $ | 1,008 | $ | 1,017 | (2) | % | (1) | % | |||||||
Cost of license | 114 | 87 | 89 | 31 | % | (2) | % | ||||||||||
Amortization of intangible assets | 51 | 54 | 69 | (6) | % | (22) | % | ||||||||||
Total | $ | 1,153 | $ | 1,149 | $ | 1,175 | — | % | (2) | % | |||||||
2015 compared to 2014:
Cost of content, subscription, and maintenance consists primarily of technical support costs, costs of billable services, and fees to OEMs under revenue-sharing agreements. Cost of license consists primarily of royalties paid to third parties under technology licensing agreements, appliance manufacturing costs, and other direct material costs. Intangible assets are primarily comprised of developed technologies and patents from acquired companies. Our total cost of revenue remained relatively consistent for fiscal 2015 compared to fiscal 2014. Cost of license increased in fiscal 2015 compared to fiscal 2014, primarily due to direct costs associated with our appliance offerings.
35
2014 compared to 2013:
Our total cost of revenue remained relatively consistent for fiscal 2014 compared to fiscal 2013. Amortization of intangible assets decreased in fiscal 2014 compared to fiscal 2013 as certain developed technologies from acquired companies became fully amortized early in fiscal 2014.
Operating expenses by fiscal year
Change in % | |||||||||||||||||
2015 | 2014 | 2013 | 2015 v 2014 | 2014 v 2013 | |||||||||||||
(Dollars in millions) | |||||||||||||||||
Sales and marketing expense | $ | 2,323 | $ | 2,439 | $ | 2,789 | (5) | % | (13) | % | |||||||
Research and development expense | 1,144 | 1,039 | 1,026 | 10 | % | 1 | % | ||||||||||
General and administrative expense | 379 | 446 | 447 | (15) | % | — | % | ||||||||||
Amortization of intangible assets | 108 | 156 | 286 | (31) | % | (45) | % | ||||||||||
Restructuring, separation, and transition | 252 | 264 | 77 | (5) | % | 243 | % | ||||||||||
Total | $ | 4,206 | $ | 4,344 | $ | 4,625 | (3) | % | (6) | % | |||||||
2015 compared to 2014:
Sales and marketing expense decreased $116 million primarily due to lower OEM royalty fees of $130 million.
Research and development expense increased $105 million primarily due to higher salaries and wages of $34 million, higher equipment costs of $12 million, an increase in information technology and telecom costs of $11 million, and an increase in stock-based compensation of $17 million.
General and administrative expenses decreased $67 million primarily due to a reduction of outside services of $63 million.
Amortization of intangible assets decreased $48 million primarily as a result of various customer relationship intangibles becoming fully amortized at the end of the first quarter of fiscal 2014.
Restructuring, separation, and transition costs include severance, facilities, separation, transition and other related costs. For fiscal 2015, we incurred $125 million of restructuring costs, $81 million in separation costs, and $46 million in transition costs. For further information on restructuring, separation, and transition costs, see Note 6 of the Notes to Consolidated Financial Statements in this annual report.
We experienced favorable foreign currency effects on our operating expenses of $66 million in fiscal 2015 as compared to fiscal 2014.
2014 compared to 2013:
Sales and marketing expense decreased $350 million in fiscal 2014, primarily due to lower salaries and wages of $188 million resulting from lower headcount, and lower advertising and promotion expenses of $146 million. Our sales and marketing expense in fiscal 2014 was also impacted by the changes in our go-to-market strategy as described under Part I, Item 1. Business, "Sales and Go-To-Market-Strategy."
The $13 million increase in research and development expense for fiscal 2014 was primarily due to higher equipment costs.
Amortization of intangible assets decreased by $130 million primarily as a result of various customer relationship intangibles becoming fully amortized at the end of the first quarter of fiscal 2014.
Restructuring and transition costs consist of severance, facilities, transition and other related costs associated with our organization simplification. For fiscal 2014, we recognized $212 million of restructuring, $49 million in transition costs related to our ERP system and $3 million in other transition costs. For further information on restructuring and transition costs, see Note 6 of the Notes to Consolidated Financial Statements in this annual report.
We experienced favorable foreign currency effects on our operating expenses of $42 million in fiscal 2014 as compared to fiscal 2013.
36
Non-operating expense, net by fiscal year
Change in % | |||||||||||||||||
2015 | 2014 | 2013 | 2015 v 2014 | 2014 v 2013 | |||||||||||||
(Dollars in millions) | |||||||||||||||||
Interest income | $ | 12 | $ | 12 | $ | 12 | — | % | — | % | |||||||
Interest expense | (79 | ) | (84 | ) | (139 | ) | (6) | % | (40) | % | |||||||
Other income, net | 11 | 45 | 27 | (76) | % | 67 | % | ||||||||||
Non-operating expense, net | $ | (56 | ) | $ | (27 | ) | $ | (100 | ) | 107 | % | (73) | % | ||||
2015 compared to 2014:
Non-operating expense, net, increased $29 million primarily due to a $32 million realized gain from sale of short-term investments during fiscal 2014 that did not recur in fiscal 2015.
2014 compared to 2013:
Non-operating expense, net, decreased $73 million primarily due to a $32 million realized gain from sale of short-term investments during fiscal 2014, coupled with a decrease in interest expense of $55 million as we experienced lower amortization of debt issuance costs and discounts following the maturity of our $1.0 billion 1.00% notes in June 2013.
Provision for income taxes
Change in % | |||||||||||||||||
2015 | 2014 | 2013 | 2015 v 2014 | 2014 v 2013 | |||||||||||||
(Dollars in millions) | |||||||||||||||||
Provision for income taxes | $ | 215 | $ | 258 | $ | 251 | (17) | % | 3 | % | |||||||
Effective tax rate on earnings | 20 | % | 22 | % | 25 | % | (2) | % | (3) | % | |||||||
Our effective tax rate was approximately 20%, 22%, and 25% in fiscal 2015, 2014, and 2013, respectively.
The tax expense in fiscal 2015 was reduced by the following benefits: (1) $59 million for tax benefits related to the settlement of the Symantec 2009 through 2013 Internal Revenue Service (“IRS”) audit, (2) $21 million in tax benefits resulting from tax settlements and lapses of statutes of limitations, (3) $14 million in tax benefits related to certain foreign operations, and (4) $14 million in tax benefits resulting from deductible separation costs.
The tax expense in fiscal 2014 was reduced by the following benefits: (1) $33 million for the resolution of a tax matter related to the sale of our 49% ownership interest in the joint venture with Huawei during the fourth quarter of fiscal 2012, (2) $24 million for tax benefits related to the settlement of the Symantec 2005 through 2008 IRS audit, (3) $15 million tax benefit related to certain foreign operations, and (4) $13 million from lapses of statutes of limitation. These tax benefits were partially offset by $12 million in tax expense, resulting from the sale of short-term investments.
The tax expense in fiscal 2013 was reduced by the following benefits: (1) $17 million tax benefits arising from the Veritas 2002 through 2005 IRS Appeals matters, including adjustments to state liabilities and a reduction of interest accrued, (2) $13 million in tax benefits resulting from tax settlements and adjustments to prior year items, (3) $10 million from lapses of statutes of limitation, and (4) $2 million for the benefit of the research credit for the fourth quarter of fiscal 2012 resulting from the extension of the federal research credit as part of the 2012 Taxpayer Relief Act. These tax benefits were offset by a $9 million tax expense from an increase in valuation allowance on state research tax credits.
The effective tax rates for all periods presented otherwise reflect the benefits of lower-taxed international earnings, domestic manufacturing incentives, and research and development credits (of which the U.S. federal research and development credit expired on December 31, 2014), partially offset by state income taxes.
We are a U.S.-based multinational company subject to tax in multiple U.S. and international tax jurisdictions. A substantial portion of our international earnings were generated from subsidiaries organized in Ireland and Singapore. Our results of operations would be adversely affected to the extent that our geographical mix of income becomes more weighted toward jurisdictions with higher tax rates and would be favorably affected to the extent the relative geographic mix shifts to lower tax jurisdictions. Any change in our mix of earnings is dependent upon many factors and is therefore difficult to predict.
For further information on the impact of foreign earnings on our effective tax rate, see Note 11 of the Notes to Consolidated Financial Statements in this annual report.
See Critical Accounting Policies and Estimates above for additional information about our provision for income taxes.
37
In assessing the ability to realize our deferred tax assets, we considered whether it is more likely than not that some portion or all the deferred tax assets will not be realized. We considered the following: we have historical cumulative book income, as measured by the current and prior two years; we have strong, consistent taxpaying history; we have substantial U.S. federal income tax carryback potential; and we have substantial amounts of scheduled future reversals of taxable temporary differences from our deferred tax liabilities. Levels of future taxable income are subject to the various risks and uncertainties discussed in Part I, Item 1A, Risk Factors, set forth in this annual report. We have concluded that this positive evidence outweighs the negative evidence and, thus, that the deferred tax assets as of April 3, 2015 of $350 million, which are net of a valuation allowance of $60 million, are realizable on a “more likely than not” basis.
In fiscal 2013, we resolved an IRS audit for the Veritas 2002 through 2005 tax years and executed the final closing agreement. Accordingly, we recorded a further tax benefit of $3 million in fiscal 2013 based on the closing agreement. We also amended our state tax returns for the Veritas 2002 through 2005 tax years in fiscal 2013 to reflect the adjustments in the closing agreement and remeasured our state liability resulting in a benefit of $7 million.
On September 3, 2013, we settled and effectively settled matters with the IRS for the Symantec 2005 through 2008 fiscal years. The result of the settlements, effective settlements, and re-measurements resulted in a reduction in the balance of our gross unrecognized tax benefits in fiscal year 2014 of $122 million.
On March 18, 2015, we settled and effectively settled matters with the IRS for the Symantec 2009 through 2013 fiscal years. The settlement and effective settlement resulted in a benefit to tax expense in fiscal year 2015 of $59 million. Additionally, the Company settled transfer price related matters of $158 million, a portion of which was accounted for against deferred tax liabilities on unremitted foreign earnings. The Company has paid in $155 million to cover the final tax and interest liability on the settlement.
The timing of the resolution of income tax examinations is highly uncertain, and the amounts ultimately paid, if any, upon resolution of the issues raised by the taxing authorities may differ materially from the amounts accrued for each year. Although potential resolution of uncertain tax positions involve multiple tax periods and jurisdictions, it is reasonably possible that the gross unrecognized tax benefits related to these audits could decrease (whether by payment, release, or a combination of both) in the next 12 months by $44 million.
We continue to monitor the progress of ongoing income tax controversies and the impact, if any, of the expected tolling of the statute of limitations in various taxing jurisdictions.
LIQUIDITY AND CAPITAL RESOURCES
Sources of Cash
We have historically relied on cash flow from operations, borrowings under a credit facility, and issuances of debt and equity securities for our liquidity needs. As of April 3, 2015, we had cash, cash equivalents and short-term investments of $3.9 billion and an unused credit facility of $1.0 billion resulting in a liquidity position of approximately $4.9 billion. As of April 3, 2015, $2.2 billion in cash, cash equivalents, and short-term investments were held by our foreign subsidiaries. We have provided U.S. deferred taxes on a portion of our undistributed foreign earnings sufficient to address the incremental U.S. tax that would be due if we needed such portion of these funds to support our operations in the U.S.
Senior Notes. In fiscal 2013, we issued $1.0 billion of Senior Notes consisting of the 3.95% Senior Notes due in 2022 and the 2.75% Senior Notes due in 2017. We received proceeds of $996 million, net of an issuance discount. In fiscal 2011, we issued $1.1 billion of Senior Notes consisting of the 4.20% Senior Notes due in 2020 and 2.75% Senior Notes due in 2015.
Revolving Credit Facility. In fiscal 2011, we entered into a $1.0 billion senior unsecured revolving credit facility (“credit facility”), which was amended in fiscal 2013. The amendment extended the term of the credit facility to June 7, 2017. Under the terms of this credit facility, we must comply with certain financial and non-financial covenants, including a covenant to maintain a specified ratio of debt to EBITDA (earnings before interest, taxes, depreciation and amortization). As of April 3, 2015, we were in compliance with the required covenants, and no amounts were outstanding.
We believe that our existing cash and investment balances, our available revolving credit facility, our ability to issue new debt instruments, and cash generated from operations will be sufficient to meet our working capital and capital expenditure requirements, as well as to fund any cash dividends, principal and interest payments on debt, and repurchases of our stock, for at least the next 12 months and foreseeable future. Since the beginning of fiscal 2014, we have implemented a capital allocation strategy pursuant to which we expect to return over time approximately 50% of free cash flow to stockholders through a combination of dividends and share repurchases, while still enabling our company to invest in its future. Our strategy emphasizes organic growth through internal innovation and will be complemented by acquisitions that fit strategically and meet specific internal profitability hurdles.
38
Uses of Cash
Our principal cash requirements include working capital, capital expenditures, payments of principal and interest on debt, and payments of taxes. Also, we may, from time to time, engage in the open market purchase of our notes prior to their maturity. Furthermore, our capital allocation strategy contemplates a quarterly cash dividend. In addition, we regularly evaluate our ability to repurchase stock, pay debts, and acquire other businesses.
Stock Repurchases. Our Board of Directors authorized a new $1.0 billion stock repurchase program during the fourth quarter of fiscal 2015. In fiscal 2015, we repurchased 21 million shares, or $500 million of our common stock. In fiscal 2014, we repurchased 21 million shares, or $500 million, of our common stock. In fiscal 2013, we repurchased 49 million shares, or $826 million, of our common stock. Our active stock repurchase programs have $1.2 billion remaining authorized for future repurchase as of April 3, 2015, with no expiration date.
Dividend Program. During fiscal 2015, we declared and paid aggregate cash dividends of $413 million or $0.60 per common share. During fiscal 2014, we declared and paid cash dividends of $418 million or $0.60 per common share. Our restricted stock and performance-based stock units have dividend equivalent rights entitling holders to dividend equivalents to be paid in the form of cash upon vesting, for each share of the underlying units. No dividends or dividend equivalents were paid in any periods prior to fiscal 2014.
On May 14, 2015, we declared a cash dividend of $0.15 per share of common stock to be paid on June 24, 2015 to all stockholders of record as of the close of business on June 10, 2015. All shares of common stock issued and outstanding, and unvested restricted stock and performance-based stock, as of the record date will be entitled to the dividend and dividend equivalents, respectively. Any future dividends and dividend equivalents will be subject to the approval of our Board of Directors.
Restructuring Plans. In fiscal 2015, we announced plans to separate our business into two independent publicly-traded companies: one focused on security and one focused on information management. We expect to complete the legal separation on January 2, 2016, subject to market, regulatory and certain other conditions. In order to separate the business, we initiated a restructuring plan to properly align personnel and expect to incur associated severance and facilities costs. We also expect to incur separation costs in the form of advisory, consulting and disentanglement expenses. These actions are expected to be completed in fiscal 2016. We expect to incur total severance and facilities costs between $165 million and $195 million. We expect to incur separation costs between $170 million and $190 million, excluding any potential tax implications outside the U.S. and potential advisor fees payable upon separation. Total restructuring and separation costs are expected to be between $335 million and $385 million. As of April 3, 2015, liabilities for excess facility obligations at several locations around the world are expected to be paid throughout the respective lease terms as we continue to occupy these facilities, the longest of which extends through fiscal 2019.
In fiscal 2013, we initiated a restructuring plan to reduce management and redundant personnel resulting in headcount reductions across the Company. As of April 3, 2015, the related costs for severance and benefits are substantially complete; however, we expect to incur immaterial adjustments to existing reserves in subsequent periods.
Note Repayments. In fiscal 2014, the principal balance of our 1.00% Convertible Senior Notes issued in fiscal 2007 matured and was settled by a cash payment of $1.0 billion, along with the $5 million semiannual interest payment. In addition, we elected to pay the conversion value above par value in cash in the amount of $189 million. Concurrently with the payment of the conversion value, we received $189 million from the note hedge we entered into at the time of issuance of the 1.00% notes. In fiscal 2016, $350 million of principal amount of 2.75% Senior Notes due September 2015 will mature and become due and payable.
Cash Flows
The following table summarizes, for the fiscal periods indicated, selected items in our Consolidated Statements of Cash Flows:
2015 | 2014 | 2013 | |||||||||
(Dollars in millions) | |||||||||||
Net cash provided by (used in): | |||||||||||
Operating activities | $ | 1,312 | $ | 1,281 | $ | 1,593 | |||||
Investing activities | (1,154 | ) | (583 | ) | (319 | ) | |||||
Financing activities | (811 | ) | (1,712 | ) | 308 | ||||||
Operating activities
We expect cash from our operating activities to fluctuate in future periods as a result of a number of factors, including the timing of our billings and collections, our operating results, the timing and amount of tax and other liability payments.
39
Net cash provided by operating activities was $1.3 billion for fiscal 2015, which resulted from net income of $878 million adjusted for non-cash items, including depreciation and amortization charges of $443 million and stock-based compensation expense of $195 million. These amounts were partially offset by decreases in income taxes payable of $191 million and accounts payable of $65 million.
Net cash provided by operating activities was $1.3 billion for fiscal 2014, which resulted from net income of $898 million adjusted for non-cash items, including depreciation and amortization charges of $498 million and stock-based compensation expense of $156 million. These amounts were partially offset by decreases in deferred revenue of $223 million.
Net cash provided by operating activities was $1.6 billion for fiscal 2013, which resulted from net income of $755 million adjusted for non-cash items, including depreciation and amortization charges of $698 million and stock-based compensation expense of $164 million, and an increase in deferred revenue of $119 million. These amounts were partially offset by an increase in trade accounts receivable, net of $107 million.
Investing activities
Net cash used in investing activities was $1.2 billion for fiscal 2015 and was primarily due to the purchase of $1.8 billion of short-term investments and payments of $381 million for capital expenditures, partially offset by proceeds of $681 million from maturities of short-term investments and $343 million from sales of our short-term investments.
Net cash used in investing activities was $583 million for fiscal 2014 and was primarily due to payments of $260 million for capital expenditures, and $492 million in purchases of short-term investments, partially offset by $186 million in proceeds from the sales and maturities of our short-term investments.
Net cash used in investing activities was $319 million for fiscal 2013 and was primarily due to payments of $336 million for capital expenditures, partially offset by $46 million in proceeds from the sales and maturities of our short-term investments.
Financing activities
Net cash used in financing activities was $811 million for fiscal 2015, which was primarily due to repurchases of our common stock of $500 million and cash dividend payments of $413 million, partially offset by proceeds from sales of common stock under employee stock benefit plans of $116 million.
Net cash used in financing activities was $1.7 billion for fiscal 2014, which was primarily due to the repayment of our convertible senior notes of $1.0 billion, repurchases of our common stock of $500 million and cash dividends paid of $418 million, partially offset by net proceeds from sales of common stock through employee stock benefit plans of $234 million.
Net cash provided by financing activities of $308 million for fiscal 2013 was primarily due to the $996 million net proceeds generated from our issuance of $600 million in principal amount of 2.75% interest-bearing senior notes due June 15, 2017 and $400 million in principal amount of 3.95% interest-bearing senior notes due June 15, 2022, and net proceeds from sales of common stock through employee stock benefit plans of $281 million, partially offset by repurchases of our common stock of $826 million and the purchase of additional equity interest in subsidiary of $111 million.
Contractual obligations
The following is a schedule by years of our significant contractual obligations as of April 3, 2015:
Payments Due by Fiscal Period | |||||||||||||||||||
Total | 2016 | 2017 - 2018 | 2019 - 2020 | Thereafter | |||||||||||||||
(Dollars in millions) | |||||||||||||||||||
Senior Notes (1) | $ | 2,100 | $ | 350 | $ | 600 | $ | — | $ | 1,150 | |||||||||
Interest payments on Senior Notes (1) | 327 | 68 | 115 | 95 | 49 | ||||||||||||||
Purchase obligations (2) | 542 | 539 | 3 | — | — | ||||||||||||||
Operating leases (3) | 442 | 103 | 150 | 104 | 85 | ||||||||||||||
Uncertain tax positions(4) | 29 | 29 | — | — | — | ||||||||||||||
Total | $ | 3,440 | $ | 1,089 | $ | 868 | $ | 199 | $ | 1,284 | |||||||||
(1) | In fiscal 2011, we issued $350 million in principal amount of 2.75% senior notes due September 2015 and $750 million in principal amount of 4.20% senior notes due September 2020. In fiscal 2013, we issued $600 million in principal amount of 2.75% senior notes due June 2017 and $400 million in principal amount of 3.95% senior notes due June 2022. Interest payments were calculated based on terms of the related senior notes. For further information on the senior notes, see Note 5 of the Notes to Consolidated Financial Statements in this annual report. |
40
(2) | These amounts are associated with agreements for purchases of goods or services generally including agreements that are enforceable and legally binding and that specify all significant terms, including fixed or minimum quantities to be purchased; fixed, minimum, or variable price provisions; and the approximate timing of the transaction. The table above also includes agreements to purchase goods or services that have cancellation provisions requiring little or no payment. The amounts under such contracts are included in the table above because management believes that cancellation of these contracts is unlikely and we expect to make future cash payments according to the contract terms or in similar amounts for similar materials. |
(3) | We have entered into various noncancelable operating lease agreements that expire on various dates through fiscal 2029. The amounts in the table above exclude expected sublease income and include $6 million in exited or excess facility costs related to restructuring activities. |
(4) | Due to the uncertainty with respect to the timing of future cash flows associated with our unrecognized tax benefits as of April 3, 2015 we are unable to make reasonably reliable estimates of the period of cash settlement with the respective taxing authorities. Therefore, $134 million in long-term income taxes payable has been excluded from the contractual obligations table. For further information, see Note 11 of the Notes to Consolidated Financial Statements in this annual report. |
Indemnifications
In the ordinary course of business, we may provide indemnifications of varying scope and terms to customers, vendors, lessors, business partners, subsidiaries and other parties with respect to certain matters, including, but not limited to, losses arising out of our breach of agreements or representations and warranties made by us. In addition, our bylaws contain indemnification obligations to our directors, officers, employees and agents, and we have entered into indemnification agreements with our directors and certain of our officers to give such directors and officers additional contractual assurances regarding the scope of the indemnification set forth in our bylaws and to provide additional procedural protections. We maintain director and officer insurance, which may cover certain liabilities arising from our obligation to indemnify our directors and officers. It is not possible to determine the aggregate maximum potential loss under these indemnification agreements due to the limited history of prior indemnification claims and the unique facts and circumstances involved in each particular agreement. Such indemnification agreements might not be subject to maximum loss clauses. Historically, we have not incurred material costs as a result of obligations under these agreements and we have not accrued any liabilities related to such indemnification obligations in our Consolidated Financial Statements.
We provide limited product warranties and the majority of our software license agreements contain provisions that indemnify licensees of our software from damages and costs resulting from claims alleging that our software infringes on the intellectual property rights of a third party. Historically, payments made under these provisions have been immaterial. We monitor the conditions that are subject to indemnification to identify if a loss has occurred.
Item 7A. Quantitative and Qualitative Disclosures about Market Risk
We are exposed to various market risks related to fluctuations in interest rates and foreign currency exchange rates. We may use derivative financial instruments to mitigate certain risks in accordance with our investment and foreign exchange policies. We do not use derivatives or other financial instruments for trading or speculative purposes.
Interest rate risk
As of April 3, 2015 and March 28, 2014, we had $2.1 billion in principal amount of fixed-rate senior notes outstanding, with a carrying amount of $2.1 billion and a fair value of $2.2 billion, which fair value is based on level 2 inputs. We have performed sensitivity analyses as of April 3, 2015 and March 28, 2014 by using a modeling technique that measures the change in the fair values arising from a hypothetical 50 bps movement in the levels of market interest rates, with all other variables held constant. On April 3, 2015 and March 28, 2014, a hypothetical 50 bps increase or decrease in market interest rates would change the fair value of the fixed-rate senior notes by a decrease of approximately $39 million and $48 million, respectively and an increase of approximately $40 million and $49 million, respectively. However, this hypothetical change in market interest rates would not impact the interest expense on the fixed-rate debt.
Foreign currency exchange rate risk
We conduct business in 43 currencies through our worldwide operations and, as such, we are exposed to foreign currency risk. Foreign currency risks are associated with our cash and cash equivalents, investments, receivables, and payables denominated in foreign currencies. Our exposure to foreign currency transaction gains and losses is the result of certain net receivables due from our foreign subsidiaries and customers being denominated in currencies other than the functional currency of the subsidiary, primarily the Euro and Singapore dollar. Our foreign subsidiaries conduct their businesses in local currency. We have entered into foreign exchange forward contracts with up to six months in duration, to offset the foreign exchange risk on certain monetary assets and liabilities denominated in currencies other than the functional currency of the subsidiary. We
41
considered the historical trends in currency exchange rates and determined that it was reasonably possible that adverse changes in exchange rates for all currencies could be experienced. The estimated impacts of a ten percent appreciation or depreciation of foreign currency are as follows:
April 3, 2015 | March 28, 2014 | |||||||||||||||||||||||
Change in Fair Value Due to 10% | Change in Fair Value Due to 10% | |||||||||||||||||||||||
Foreign Exchange Forward Contract | Notional Amount | Appreciation | Depreciation | Notional Amount | Appreciation | Depreciation | ||||||||||||||||||
(Dollars in millions) | ||||||||||||||||||||||||
Purchased | $ | 102 | $ | 10 | $ | (10 | ) | $ | 154 | $ | 15 | $ | (15 | ) | ||||||||||
Sold | (195 | ) | (19 | ) | 19 | (240 | ) | (24 | ) | 24 | ||||||||||||||
Total net outstanding contracts | $ | (93 | ) | $ | (9 | ) | $ | 9 | $ | (86 | ) | $ | (9 | ) | $ | 9 | ||||||||
We do not use derivative financial instruments for speculative trading purposes, nor do we hedge our foreign currency exposure in a manner that entirely offsets the effects of the changes in foreign exchange rates.
Item 8. Financial Statements and Supplementary Data
Annual financial statements
The Consolidated Financial Statements and related disclosures included in Part IV, Item 15 of this annual report are incorporated by reference into this Item 8.
Selected quarterly financial data
Fiscal 2015 | Fiscal 2014 | ||||||||||||||||||||||||||||||
Apr. 3, 2015 | Jan. 2, 2015 | Oct. 3, 2014 | Jul. 4, 2014 | Mar. 28, 2014 | Dec. 27, 2013 | Sep. 27, 2013 | Jun. 28, 2013 | ||||||||||||||||||||||||
(In millions, except per share data) | |||||||||||||||||||||||||||||||
Net revenue | $ | 1,518 | $ | 1,638 | $ | 1,617 | $ | 1,735 | $ | 1,625 | $ | 1,705 | $ | 1,637 | $ | 1,709 | |||||||||||||||
Gross profit | 1,231 | 1,359 | 1,339 | 1,426 | 1,343 | 1,422 | 1,353 | 1,409 | |||||||||||||||||||||||
Operating income | 152 | 327 | 348 | 322 | 306 | 405 | 248 | 224 | |||||||||||||||||||||||
Net income | 176 | 222 | 244 | 236 | 217 | 283 | 241 | 157 | |||||||||||||||||||||||
Net income per share — basic | 0.26 | 0.32 | 0.35 | 0.34 | 0.31 | 0.41 | 0.34 | 0.23 | |||||||||||||||||||||||
Net income per share — diluted | 0.25 | 0.32 | 0.35 | 0.34 | 0.31 | 0.40 | 0.34 | 0.22 | |||||||||||||||||||||||
Item 9. Changes in and Disagreements with Accountants on Accounting and Financial Disclosure
None.
Item 9A. Controls and Procedures
a) Evaluation of Disclosure Controls and Procedures
The SEC defines the term “disclosure controls and procedures” to mean a company’s controls and other procedures that are designed to ensure that information required to be disclosed in the reports that it files or submits under the Exchange Act is recorded, processed, summarized, and reported, within the time periods specified in the SEC’s rules and forms. “Disclosure controls and procedures” include, without limitation, controls and procedures designed to ensure that information required to be disclosed by an issuer in the reports that it files or submits under the Exchange Act is accumulated and communicated to the issuer’s management, including its principal executive and principal financial officers, or persons performing similar functions, as appropriate to allow timely decisions regarding required disclosure. Our disclosure controls and procedures are designed to provide reasonable assurance that such information is accumulated and communicated to our management. Our management (with the participation of our Chief Executive Officer and Chief Financial Officer) has conducted an evaluation of the effectiveness of our disclosure controls and procedures (as defined in Rules 13a-15(e) and 15d-15(e) of the Securities Exchange Act). Based on such evaluation, our Chief Executive Officer and our Chief Financial Officer have concluded that our disclosure controls and procedures were effective at the reasonable assurance level as of the end of the period covered by this report.
42
b) Management’s Report on Internal Control over Financial Reporting
Our management is responsible for establishing and maintaining adequate internal control over financial reporting (as defined in Rules 13a-15(f) and 15d-15(f) of the Exchange Act) for Symantec. Our management, with the participation of our Chief Executive Officer and our Chief Financial Officer, has conducted an evaluation of the effectiveness of our internal control over financial reporting as of April 3, 2015, based on criteria established in Internal Control — Integrated Framework (1992) issued by the Committee of Sponsoring Organizations of the Treadway Commission (“COSO”).
Our management has concluded that, as of April 3, 2015, our internal control over financial reporting was effective based on these criteria.
The Company’s independent registered public accounting firm has issued an attestation report regarding its assessment of the Company’s internal control over financial reporting as of April 3, 2015, which is included in Part IV, Item 15 of this annual report.
c) Changes in Internal Control over Financial Reporting
There were no changes in our internal control over financial reporting during the quarter ended April 3, 2015 that have materially affected, or are reasonably likely to materially affect, our internal control over financial reporting.
d) Limitations on Effectiveness of Controls
Our management, including our Chief Executive Officer and Chief Financial Officer, does not expect that our disclosure controls and procedures or our internal controls will prevent all errors and all fraud. A control system, no matter how well conceived and operated, can provide only reasonable, not absolute, assurance that the objectives of the control system are met. Further, the design of a control system must reflect the fact that there are resource constraints, and the benefits of controls must be considered relative to their costs. Because of the inherent limitations in all control systems, no evaluation of controls can provide absolute assurance that all control issues and instances of fraud, if any, within our company have been detected.
Item 9B. Other Information
None.
43
PART III
Item 10. Directors, Executive Officers and Corporate Governance
The information required by this item will be included in an amendment to this annual report on Form 10-K or incorporated by reference from Symantec’s definitive proxy statement to be filed pursuant to Regulation 14A.
Item 11. Executive Compensation
The information required by this item will be included in an amendment to this annual report on Form 10-K or incorporated by reference from Symantec’s definitive proxy statement to be filed pursuant to Regulation 14A.
Item 12. Security Ownership of Certain Beneficial Owners and Management and Related Stockholder Matters
The information required by this item will be included in an amendment to this annual report on Form 10-K or incorporated by reference from Symantec’s definitive proxy statement to be filed pursuant to Regulation 14A.
Item 13. Certain Relationships and Related Transactions, and Director Independence
The information required by this item will be included in an amendment to this annual report on Form 10-K or incorporated by reference from Symantec’s definitive proxy statement to be filed pursuant to Regulation 14A.
Item 14. Principal Accounting Fees and Services
The information required by this item will be included in an amendment to this annual report on Form 10-K or incorporated by reference from Symantec’s definitive proxy statement to be filed pursuant to Regulation 14A.
44
PART IV
Item 15. Exhibits, Financial Statement Schedules
Upon written request, we will provide, without charge, a copy of this annual report, including the Consolidated Financial Statements and financial statement schedule. All requests should be sent to:
Symantec Corporation
Attn: Investor Relations
350 Ellis Street
Mountain View, California 94043
650-527-8000
The following documents are filed as part of this report:
Page | ||
1. | Consolidated Financial Statements: | |
Financial statement schedules have been omitted since they are either not required, not applicable, or the information is otherwise included. | ||
2. | ||
45
REPORT OF INDEPENDENT REGISTERED PUBLIC ACCOUNTING FIRM
The Board of Directors and Stockholders
Symantec Corporation:
We have audited the accompanying consolidated balance sheets of Symantec Corporation and subsidiaries as of April 3, 2015 and March 28, 2014, and the related consolidated statements of income, comprehensive income, stockholders’ equity, and cash flows for each of the years in the three-year period ended April 3, 2015. We also have audited the internal control over financial reporting of Symantec Corporation as of April 3, 2015, based on criteria established in Internal Control – Integrated Framework (1992) issued by the Committee of Sponsoring Organizations of the Treadway Commission (COSO). The management of Symantec Corporation is responsible for these consolidated financial statements for maintaining effective internal control over financial reporting, and for its assessment of the effectiveness of internal control over financial reporting, included in Management’s Report on Internal Control over Financial Reporting appearing under Item 9A.b). Our responsibility is to express an opinion on these consolidated financial statements and an opinion on the internal control over financial reporting of Symantec Corporation based on our audits.
We conducted our audits in accordance with the standards of the Public Company Accounting Oversight Board (United States). Those standards require that we plan and perform the audits to obtain reasonable assurance about whether the financial statements are free of material misstatement and whether effective internal control over financial reporting was maintained in all material respects. Our audits of the consolidated financial statements included examining, on a test basis, evidence supporting the amounts and disclosures in the financial statements, assessing the accounting principles used and significant estimates made by management, and evaluating the overall financial statement presentation. Our audit of internal control over financial reporting included obtaining an understanding of internal control over financial reporting, assessing the risk that a material weakness exists, and testing and evaluating the design and operating effectiveness of internal control based on the assessed risk. Our audits also included performing such other procedures as we considered necessary in the circumstances. We believe that our audits provide a reasonable basis for our opinions.
A company’s internal control over financial reporting is a process designed to provide reasonable assurance regarding the reliability of financial reporting and the preparation of financial statements for external purposes in accordance with generally accepted accounting principles. A company’s internal control over financial reporting includes those policies and procedures that (1) pertain to the maintenance of records that, in reasonable detail, accurately and fairly reflect the transactions and dispositions of the assets of the company; (2) provide reasonable assurance that transactions are recorded as necessary to permit preparation of financial statements in accordance with generally accepted accounting principles, and that receipts and expenditures of the company are being made only in accordance with authorizations of management and directors of the company; and (3) provide reasonable assurance regarding prevention or timely detection of unauthorized acquisition, use, or disposition of the company’s assets that could have a material effect on the financial statements.
Because of its inherent limitations, internal control over financial reporting may not prevent or detect misstatements. Also, projections of any evaluation of effectiveness to future periods are subject to the risk that controls may become inadequate because of changes in conditions, or that the degree of compliance with the policies or procedures may deteriorate.
In our opinion, the consolidated financial statements referred to above present fairly, in all material respects, the financial position of Symantec Corporation and subsidiaries as of April 3, 2015 and March 28, 2014, and the results of their operations and their cash flows for each of the years in the three-year period ended April 3, 2015, in conformity with U.S. generally accepted accounting principles. Also in our opinion, Symantec Corporation maintained, in all material respects, effective internal control over financial reporting as of April 3, 2015, based on criteria established in Internal Control – Integrated Framework (1992) issued by the Committee of Sponsoring Organizations of the Treadway Commission (COSO).
/s/ KPMG LLP
Santa Clara, California
May 22, 2015
46
SYMANTEC CORPORATION
CONSOLIDATED BALANCE SHEETS
April 3, 2015 | March 28, 2014 | ||||||
(In millions, except par value) | |||||||
ASSETS | |||||||
Current assets: | |||||||
Cash and cash equivalents | $ | 2,874 | $ | 3,707 | |||
Short-term investments | 1,017 | 377 | |||||
Trade accounts receivable, net of allowance for doubtful accounts of $7 and $7, respectively | 993 | 1,007 | |||||
Deferred income taxes | 152 | 142 | |||||
Deferred commissions | 131 | 115 | |||||
Other current assets | 255 | 304 | |||||
Total current assets | 5,422 | 5,652 | |||||
Property and equipment, net | 1,205 | 1,116 | |||||
Intangible assets, net | 628 | 768 | |||||
Goodwill | 5,847 | 5,858 | |||||
Long-term deferred commissions | 26 | 21 | |||||
Other long-term assets | 105 | 124 | |||||
Total assets | $ | 13,233 | $ | 13,539 | |||
LIABILITIES AND STOCKHOLDERS’ EQUITY | |||||||
Current liabilities: | |||||||
Accounts payable | $ | 213 | $ | 282 | |||
Accrued compensation and benefits | 398 | 365 | |||||
Deferred revenue | 3,109 | 3,322 | |||||
Current portion of long-term debt | 350 | — | |||||
Other current liabilities | 383 | 337 | |||||
Total current liabilities | 4,453 | 4,306 | |||||
Long-term debt | 1,746 | 2,095 | |||||
Long-term deferred revenue | 555 | 581 | |||||
Long-term deferred tax liabilities | 308 | 425 | |||||
Long-term income taxes payable | 134 | 252 | |||||
Other long-term obligations | 102 | 83 | |||||
Total liabilities | 7,298 | 7,742 | |||||
Commitments and contingencies | |||||||
Stockholders’ equity: | |||||||
Common stock, $0.01 par value, 3,000 shares authorized; 898 and 909 shares issued; 684 and 695 shares outstanding, respectively | 7 | 7 | |||||
Additional paid-in capital | 6,094 | 6,744 | |||||
Accumulated other comprehensive income | 104 | 194 | |||||
Accumulated deficit | (270 | ) | (1,148 | ) | |||
Total stockholders’ equity | 5,935 | 5,797 | |||||
Total liabilities and stockholders’ equity | $ | 13,233 | $ | 13,539 | |||
The accompanying Notes to Consolidated Financial Statements are an integral part of these statements.
47
SYMANTEC CORPORATION
CONSOLIDATED STATEMENTS OF INCOME
Year Ended | |||||||||||
April 3, 2015 | March 28, 2014 | March 29, 2013 | |||||||||
(In millions, except per share data) | |||||||||||
Net revenue: | |||||||||||
Content, subscription, and maintenance | $ | 5,749 | $ | 5,960 | $ | 6,021 | |||||
License | 759 | 716 | 885 | ||||||||
Total net revenue | 6,508 | 6,676 | 6,906 | ||||||||
Cost of revenue: | |||||||||||
Content, subscription, and maintenance | 988 | 1,008 | 1,017 | ||||||||
License | 114 | 87 | 89 | ||||||||
Amortization of intangible assets | 51 | 54 | 69 | ||||||||
Total cost of revenue | 1,153 | 1,149 | 1,175 | ||||||||
Gross profit | 5,355 | 5,527 | 5,731 | ||||||||
Operating expenses: | |||||||||||
Sales and marketing | 2,323 | 2,439 | 2,789 | ||||||||
Research and development | 1,144 | 1,039 | 1,026 | ||||||||
General and administrative | 379 | 446 | 447 | ||||||||
Amortization of intangible assets | 108 | 156 | 286 | ||||||||
Restructuring, separation, and transition | 252 | 264 | 77 | ||||||||
Total operating expenses | 4,206 | 4,344 | 4,625 | ||||||||
Operating income | 1,149 | 1,183 | 1,106 | ||||||||
Interest income | 12 | 12 | 12 | ||||||||
Interest expense | (79 | ) | (84 | ) | (139 | ) | |||||
Other income, net | 11 | 45 | 27 | ||||||||
Income before income taxes | 1,093 | 1,156 | 1,006 | ||||||||
Provision for income taxes | 215 | 258 | 251 | ||||||||
Net income | $ | 878 | $ | 898 | $ | 755 | |||||
Net income per share: | |||||||||||
Basic | $ | 1.27 | $ | 1.29 | $ | 1.08 | |||||
Diluted | $ | 1.26 | $ | 1.28 | $ | 1.06 | |||||
Weighted-average shares outstanding: | |||||||||||
Basic | 689 | 696 | 701 | ||||||||
Diluted | 696 | 704 | 711 | ||||||||
Cash dividends declared per common share | $ | 0.60 | $ | 0.60 | $ | — | |||||
The accompanying Notes to Consolidated Financial Statements are an integral part of these statements.
48
SYMANTEC CORPORATION
CONSOLIDATED STATEMENTS OF COMPREHENSIVE INCOME
Year Ended | |||||||||||
April 3, 2015 | March 28, 2014 | March 29, 2013 | |||||||||
(Dollars in millions) | |||||||||||
Net income | $ | 878 | $ | 898 | $ | 755 | |||||
Other comprehensive (loss) income, net of taxes: | |||||||||||
Foreign currency translation adjustments: | |||||||||||
Translation adjustments | (89 | ) | 1 | 5 | |||||||
Reclassification adjustments for (gain) loss included in net income | (1 | ) | 4 | 2 | |||||||
Net foreign currency translation adjustments | (90 | ) | 5 | 7 | |||||||
Available-for-sale securities: | |||||||||||
Unrealized gain on available-for-sale securities, net of taxes of $0, $1, and $11, respectively | — | 1 | 15 | ||||||||
Reclassification adjustments for realized gain included in net income, net of taxes of $0, $(10), and $0, respectively | — | (14 | ) | — | |||||||
Net (decrease) increase from available-for-sale securities | — | (13 | ) | 15 | |||||||
Other comprehensive (loss) income, net of taxes | (90 | ) | (8 | ) | 22 | ||||||
Comprehensive income | 788 | 890 | 777 | ||||||||
Less: Comprehensive loss attributable to noncontrolling interest | — | — | (2 | ) | |||||||
Comprehensive income attributable to Symantec Corporation stockholders | $ | 788 | $ | 890 | $ | 779 | |||||
The accompanying Notes to Consolidated Financial Statements are an integral part of these statements.
49
SYMANTEC CORPORATION
CONSOLIDATED STATEMENTS OF STOCKHOLDERS’ EQUITY
Common Stock | Additional Paid-In Capital | Accumulated Other Comprehensive Income | Accumulated Earnings (Deficit) | Total Symantec Corporation Stockholders’ Equity | Noncontrolling Interest in Subsidiary | Total Stockholders’ Equity | ||||||||||||||||||||||||
Shares | Amount | |||||||||||||||||||||||||||||
(In millions) | ||||||||||||||||||||||||||||||
Balance as of March 30, 2012 | 724 | $ | 7 | $ | 7,773 | $ | 178 | $ | (2,799 | ) | $ | 5,159 | $ | 78 | $ | 5,237 | ||||||||||||||
Net income | — | — | — | — | 755 | 755 | — | 755 | ||||||||||||||||||||||
Other comprehensive income (loss) | — | — | — | 24 | — | 24 | (2 | ) | 22 | |||||||||||||||||||||
Issuance of common stock under employee stock plans | 17 | — | 281 | — | — | 281 | — | 281 | ||||||||||||||||||||||
Repurchases of common stock | (49 | ) | — | (826 | ) | — | — | (826 | ) | — | (826 | ) | ||||||||||||||||||
Tax payments related to restricted stock units | 6 | — | (36 | ) | — | — | (36 | ) | — | (36 | ) | |||||||||||||||||||
Stock-based compensation, net of estimated forfeitures | — | — | 165 | — | — | 165 | — | 165 | ||||||||||||||||||||||
Income tax benefit from employee stock transactions | — | — | (11 | ) | — | — | (11 | ) | — | (11 | ) | |||||||||||||||||||
Purchase of additional equity interest in subsidiary | — | — | (33 | ) | — | (2 | ) | (35 | ) | (76 | ) | (111 | ) | |||||||||||||||||
Balance as of March 29, 2013 | 698 | 7 | 7,313 | 202 | (2,046 | ) | 5,476 | — | 5,476 | |||||||||||||||||||||
Net income | — | — | — | — | 898 | 898 | — | 898 | ||||||||||||||||||||||
Other comprehensive loss | — | — | — | (8 | ) | — | (8 | ) | (8 | ) | ||||||||||||||||||||
Issuance of common stock under employee stock plans | 18 | — | 234 | — | — | 234 | — | 234 | ||||||||||||||||||||||
Repurchases of common stock | (21 | ) | — | (500 | ) | — | — | (500 | ) | — | (500 | ) | ||||||||||||||||||
Tax payments related to restricted stock units | — | — | (45 | ) | — | — | (45 | ) | — | (45 | ) | |||||||||||||||||||
Dividends paid and accrued | — | — | (429 | ) | — | — | (429 | ) | — | (429 | ) | |||||||||||||||||||
Stock-based compensation, net of estimated forfeitures | — | — | 157 | — | — | 157 | — | 157 | ||||||||||||||||||||||
Income tax benefit from employee stock transactions | — | — | 14 | — | — | 14 | — | 14 | ||||||||||||||||||||||
Balance as of March 28, 2014 | 695 | 7 | 6,744 | 194 | (1,148 | ) | 5,797 | — | 5,797 | |||||||||||||||||||||
Net income | — | — | — | — | 878 | 878 | — | 878 | ||||||||||||||||||||||
Other comprehensive loss | — | — | — | (90 | ) | — | (90 | ) | — | (90 | ) | |||||||||||||||||||
Issuance of common stock under employee stock plans | 10 | — | 116 | — | — | 116 | — | 116 | ||||||||||||||||||||||
Repurchases of common stock | (21 | ) | — | (500 | ) | — | — | (500 | ) | — | (500 | ) | ||||||||||||||||||
Tax payments related to restricted stock units | — | — | (47 | ) | — | — | (47 | ) | — | (47 | ) | |||||||||||||||||||
Dividends paid and accrued | — | — | (428 | ) | — | — | (428 | ) | — | (428 | ) | |||||||||||||||||||
Stock-based compensation, net of estimated forfeitures | — | — | 198 | — | — | 198 | — | 198 | ||||||||||||||||||||||
Income tax benefit from employee stock transactions | — | — | 11 | — | — | 11 | — | 11 | ||||||||||||||||||||||
Balance as of April 3, 2015 | 684 | $ | 7 | $ | 6,094 | $ | 104 | $ | (270 | ) | $ | 5,935 | $ | — | $ | 5,935 | ||||||||||||||
The accompanying Notes to Consolidated Financial Statements are an integral part of these statements.
50
SYMANTEC CORPORATION
CONSOLIDATED STATEMENTS OF CASH FLOWS
Year Ended | |||||||||||
April 3, 2015 | March 28, 2014 | March 29, 2013 | |||||||||
(Dollars in millions) | |||||||||||
OPERATING ACTIVITIES: | |||||||||||
Net income | $ | 878 | $ | 898 | $ | 755 | |||||
Adjustments to reconcile net income to net cash provided by operating activities: | |||||||||||
Depreciation | 280 | 281 | 283 | ||||||||
Amortization of intangible assets | 159 | 210 | 355 | ||||||||
Amortization of debt issuance costs and discounts | 4 | 7 | 60 | ||||||||
Stock-based compensation expense | 195 | 156 | 164 | ||||||||
Deferred income taxes | (23 | ) | 47 | 31 | |||||||
Excess income tax benefit from the exercise of stock options | (10 | ) | (17 | ) | (11 | ) | |||||
Net gain from sale of short-term investments | — | (32 | ) | — | |||||||
Other | 10 | 8 | 16 | ||||||||
Net change in assets and liabilities, excluding effects of acquisitions: | |||||||||||
Trade accounts receivable, net | (38 | ) | 30 | (107 | ) | ||||||
Deferred commissions | (30 | ) | 26 | 17 | |||||||
Accounts payable | (65 | ) | (75 | ) | 33 | ||||||
Accrued compensation and benefits | 49 | (58 | ) | 12 | |||||||
Deferred revenue | 19 | (223 | ) | 119 | |||||||
Income taxes payable | (191 | ) | 7 | (31 | ) | ||||||
Other assets | 22 | (11 | ) | (64 | ) | ||||||
Other liabilities | 53 | 27 | (39 | ) | |||||||
Net cash provided by operating activities | 1,312 | 1,281 | 1,593 | ||||||||
INVESTING ACTIVITIES: | |||||||||||
Purchases of property and equipment | (381 | ) | (260 | ) | (336 | ) | |||||
Payments for acquisitions, net of cash acquired, and purchases of intangibles | (39 | ) | (17 | ) | (28 | ) | |||||
Purchases of short-term investments | (1,758 | ) | (492 | ) | — | ||||||
Proceeds from maturities of short-term investments | 681 | 117 | 45 | ||||||||
Proceeds from sales of short-term investments | 343 | 69 | 1 | ||||||||
Other | — | — | (1 | ) | |||||||
Net cash used in investing activities | (1,154 | ) | (583 | ) | (319 | ) | |||||
FINANCING ACTIVITIES: | |||||||||||
Repayments of debt and other obligations | (21 | ) | (1,189 | ) | — | ||||||
Proceeds from convertible note hedge | — | 189 | — | ||||||||
Net proceeds from sales of common stock under employee stock benefit plans | 116 | 234 | 281 | ||||||||
Excess income tax benefit from the exercise of stock options | 10 | 17 | 11 | ||||||||
Tax payments related to restricted stock units | (47 | ) | (45 | ) | (36 | ) | |||||
Dividends paid, net | (413 | ) | (418 | ) | — | ||||||
Repurchases of common stock | (500 | ) | (500 | ) | (826 | ) | |||||
Purchase of additional equity interest in subsidiary | — | — | (111 | ) | |||||||
Proceeds from debt issuance, net of discount | — | — | 996 | ||||||||
Debt issuance costs | — | — | (7 | ) | |||||||
Proceeds from other financing, net | 44 | — | — | ||||||||
Net cash (used in) provided by financing activities | (811 | ) | (1,712 | ) | 308 | ||||||
Effect of exchange rate fluctuations on cash and cash equivalents | (180 | ) | 36 | (59 | ) | ||||||
Change in cash and cash equivalents | (833 | ) | (978 | ) | 1,523 | ||||||
Beginning cash and cash equivalents | 3,707 | 4,685 | 3,162 | ||||||||
Ending cash and cash equivalents | $ | 2,874 | $ | 3,707 | $ | 4,685 | |||||
Income taxes paid (net of refunds) | $ | 353 | $ | 224 | $ | 252 | |||||
Interest expense paid | $ | 75 | $ | 79 | $ | 69 | |||||
The accompanying Notes to Consolidated Financial Statements are an integral part of these statements.
51
SYMANTEC CORPORATION
Notes to Consolidated Financial Statements
Note 1. Summary of Significant Accounting Policies
Business
Symantec Corporation (“we,” “us,” “our,” and “the Company” refer to Symantec Corporation and all of its subsidiaries) is an information protection expert that helps people, businesses and governments seeking the freedom to unlock the opportunities technology brings – anytime, anywhere.
On October 9, 2014, we announced plans to separate our business into two independent publicly-traded companies: one focused on security and one focused on information management. The transaction is intended to take the form of a tax-free distribution to Symantec shareholders of all of the capital stock of our information management business. We expect to complete the legal separation on January 2, 2016, subject to market, regulatory and certain other conditions. John Gannon has been appointed as General Manager of the information management business, and Don Rath has been appointed as acting Chief Financial Officer. After the transaction, Michael Brown and Thomas Seifert will continue to lead Symantec as Chief Executive Officer and Chief Financial Officer, respectively. For additional separation cost information, see Note 6.
Principles of consolidation
The accompanying consolidated financial statements of Symantec Corporation and its wholly-owned subsidiaries are prepared in conformity with generally accepted accounting principles ("GAAP") in the United States ("U.S."). All significant intercompany accounts and transactions have been eliminated. Certain amounts in the 2014 and 2013 Consolidated Financial Statements within operating expenses have been reclassified to be comparable with classifications used in our 2015 Consolidated Financial Statements.
Fiscal calendar
We have a 52/53-week fiscal year ending on the Friday closest to March 31. Our fiscal 2015 was a 53-week year whereas our fiscal 2014 and 2013 were 52-week years.
Use of estimates
The preparation of consolidated financial statements in conformity with U.S. GAAP requires management to make estimates and assumptions that affect the amounts reported in the consolidated financial statements and accompanying notes. Estimates are based upon historical factors, current circumstances and the experience and judgment of management. Management evaluates its assumptions and estimates on an ongoing basis and may engage outside subject matter experts to assist in its valuations. Actual results could differ from those estimates. Significant items subject to such estimates and assumptions include those related to the allocation of revenue recognized and deferred amounts, valuation of goodwill, intangible assets and long-lived assets, valuation of stock-based compensation, contingencies and litigation, and the recognition and measurement of current and deferred income taxes (including the measurement of uncertain tax positions).
Segment reporting change
In fiscal 2015, we focused on managing our businesses as a portfolio and optimizing certain businesses for margin or growth. As a result, beginning from the second quarter of fiscal 2015, we modified our segment reporting structure to match our new operating structure and how our Chief Operating Decision Maker ("CODM") reviews the business and allocates resources. The CODM function is comprised of our Chief Executive Officer and Chief Financial Officer. Reclassifications of prior period segment information have been made to conform to the current period presentation. This change does not impact our previously reported Consolidated Financial Statements. See Note 9 for additional information on our segment reporting change.
Foreign currency
The functional currency of our foreign subsidiaries is generally the local foreign currency. Assets and liabilities denominated in non-functional currencies are remeasured into the functional currencies at current exchange rates, and the gains or losses from such remeasurement are recorded in other income, net. Assets and liabilities denominated in foreign currencies are translated using the exchange rate on the balance sheet dates. Revenues and expenses are translated using monthly average exchange rates prevailing during the year. The translation adjustments resulting from this process are included as a component of accumulated other comprehensive income. Deferred tax assets and liabilities are established on the cumulative translation adjustment attributable to unremitted foreign earnings that are not intended to be indefinitely reinvested. In the event of liquidation of a foreign subsidiary, the cumulative translation adjustment attributable to that foreign subsidiary is reclassified from accumulated other comprehensive income and included in other income, net. For fiscal 2015, the net foreign currency transaction loss was $3 million. For fiscal 2014 and 2013, the net foreign currency transaction losses were $6 million for each year. These net losses are included in other income, net, in our Consolidated Statements of Income.
52
Revenue recognition
We market and distribute our software products both as stand-alone products and as integrated product suites. We recognize revenue when 1) persuasive evidence of an arrangement exists, 2) delivery has occurred or services have been rendered, 3) fees are fixed or determinable and 4) collectability is probable. If we determine that any one of the four criteria is not met, we will defer recognition of revenue until all the criteria are met.
We derive revenue primarily from sales of content, subscriptions, and maintenance and licenses. We present revenue net of sales taxes and any similar assessments.
Content, subscription, and maintenance revenue includes arrangements for software maintenance and technical support for our products, content and subscription services primarily related to our security products, revenue from arrangements where vendor-specific objective evidence (“VSOE”) of the fair value of undelivered elements does not exist, arrangements for managed security services, and Software-as-a-Service (“SaaS”) offerings. These arrangements are generally offered to our customers over a specified period of time, and we recognize the related revenue ratably over the maintenance, subscription, or service period. We enter into perpetual software license agreements through direct sales to customers and indirect sales with distributors and resellers. The license agreements generally include product maintenance agreements, for which the related revenue is included with content, subscriptions, and maintenance and is deferred and recognized ratably over the period of the agreements.
Content, subscription, and maintenance revenue also includes professional services revenue, consisting primarily of the fees we earn related to consulting and educational services. We generally recognize revenue from professional services as the services are performed or upon written acceptance from customers, if applicable, assuming all other conditions for revenue recognition noted above have been met.
License revenue is derived primarily from the licensing of our various products and technology. We generally recognize license revenue upon delivery of the product, assuming all other conditions for revenue recognition noted above have been met. License revenue also includes appliance product revenue. We generally recognize appliance product revenue as each product is delivered, assuming all other conditions for revenue recognition noted above have been met.
For software arrangements that include multiple elements, including perpetual software licenses, maintenance, services, and packaged products with content updates and subscriptions, we allocate and defer revenue for the undelivered items based on VSOE of the fair value of the undelivered elements, and recognize the difference between the total arrangement fee and the amount deferred for the undelivered items as license revenue. VSOE of each element is based on historical evidence of our stand-alone sales of these elements to third parties or from the stated renewal rate for the undelivered elements. When VSOE does not exist for undelivered items, the entire arrangement fee is recognized ratably over the performance period. Our deferred revenue consists primarily of the unamortized balance of enterprise product maintenance, consumer product content updates, managed security services, subscriptions, and arrangements where VSOE does not exist for an undelivered element.
For arrangements that include both software and non-software elements, we allocate revenue to the software deliverables as a group and non-software deliverables based on their relative selling prices. In such circumstances, the accounting principles establish a hierarchy to determine the selling price used for allocating revenue to the deliverables as follows: (i) VSOE, (ii) third-party evidence of selling price (“TPE”) and (iii) the best estimate of the selling price (“ESP”). Our appliance products, SaaS and certain other services are considered to be non-software elements in our arrangements.
When we are unable to establish a selling price using VSOE or TPE, we use ESP in the allocation of arrangement consideration. The objective of ESP is to determine the price at which we would transact a sale if the product or service were sold on a stand-alone basis. The determination of ESP is made through consultation with and formal approval by our management, taking into consideration the go-to-market strategy, pricing factors, and historical transactions.
Indirect channel sales
We sell consumer packaged software products through a multi-tiered distribution channel. For consumer products that include content updates, we recognize revenue ratably over the term of the subscription upon sell-through to end-users, as the subscription period commences on the date of sale to the end-user. For most other consumer products, we recognize packaged product revenue on distributor and reseller channel inventory that is not in excess of specified inventory levels in these channels. We offer the right of return of our products under various policies and programs with our distributors, resellers, and end-user customers. We estimate and record reserves for product returns as an offset to revenue or deferred revenue. We fully reserve for obsolete products in the distribution channel as an offset to deferred revenue for products with content updates and to revenue for all other products.
For security and storage products, we generally recognize revenue from the licensing of software products through our indirect sales channel upon sell-through or with evidence of an end-user. For licensing of our software to Original Equipment Manufacturers (“OEMs”), royalty revenue is recognized when the OEM reports the sale of the software products to an end-user, generally on a quarterly basis. In addition to license royalties, some OEMs pay an annual flat fee and/or support royalties for
53
the right to sell maintenance and technical support to the end-user. We recognize revenue from OEM support royalties and fees ratably over the term of the support agreement.
We offer channel and end-user rebates for our products. Our estimated reserves for channel volume incentive rebates are based on distributors’ and resellers’ actual performance against the terms and conditions of volume incentive rebate programs, which are typically entered into quarterly. Our reserves for end-user rebates are estimated based on the terms and conditions of the promotional program, actual sales during the promotion, the amount of actual redemptions received, historical redemption trends by product and by type of promotional program, and the value of the rebate. We estimate and record reserves for channel and end-user rebates as an offset to revenue or deferred revenue. As of April 3, 2015 and March 28, 2014, we had reserves for rebates of $59 million and $68 million, respectively. For consumer products that include content updates, rebates are recorded as a ratable offset to revenue or deferred revenue over the term of the subscription.
Financial instruments
For assets and liabilities measured at fair value, such amounts are based on an expected exit price representing the amount that would be received on the sale of an asset or paid to transfer a liability, as the case may be, in an orderly transaction between market participants. As such, fair value may be based on assumptions that market participants would use in pricing an asset or liability. The authoritative guidance on fair value measurements establishes a consistent framework for measuring fair value on either a recurring or nonrecurring basis whereby inputs used in valuation techniques are assigned a hierarchical level.
The following methods were used to estimate the fair value of each class of financial instruments for which it is practicable to estimate that value:
Cash equivalents. We consider all highly liquid investments with an original maturity of three months or less at the time of purchase to be cash equivalents. Cash equivalents are carried at amounts that approximate fair value due to the short period of time to maturity.
Short-term investments. Short-term investments consist of investment and marketable equity securities that are classified as available-for-sale and recognized at fair value using Level 1 and Level 2 inputs, which are quoted using market prices, independent pricing vendors, or other sources, to determine the fair value. Unrealized gains and losses, net of tax, are included in accumulated other comprehensive income. We regularly review our investment portfolio to identify and evaluate investments that have indications of impairment. Factors considered in determining whether a loss is other-than-temporary include: the length of time and extent to which the fair value has been lower than the cost basis, the financial condition and near-term prospects of the investee, credit quality, likelihood of recovery, and our ability to hold the investment for a period of time sufficient to allow for any anticipated recovery in market value.
Debt. Our debt has included senior unsecured notes, convertible senior notes, and a revolving credit facility. Our senior unsecured notes are recorded at cost based upon par value at issuance less discounts. The discount associated with our senior unsecured notes represents the amount by which the face value exceeds the issuance price. The discount and issuance costs (recognized initially in the other long-term assets) are amortized using the effective interest rate method over the term of the debt as a non-cash charge to interest expense. Borrowings under our $1.0 billion senior unsecured revolving credit facility (“credit facility”) would be recognized at cost plus accrued interest based upon stated interest rates.
Trade accounts receivable
Trade accounts receivable are recorded at the invoiced amount and are not interest bearing. We maintain an allowance for doubtful accounts to reserve for potentially uncollectible trade receivables. Additions to the allowance for doubtful accounts are recorded as general and administrative expenses. We review our trade receivables by aging category to identify specific customers with known disputes or collectability issues. In addition, we maintain an allowance for all other receivables not included in the specific reserve by applying specific percentages of projected uncollectible receivables to the various aging categories. In determining these percentages, we analyze our historical collection experience and current economic trends. We exercise judgment when determining the adequacy of these reserves as we evaluate historical bad debt trends, general economic conditions in the U.S. and internationally, and changes in customer financial conditions. We also offset deferred revenue against accounts receivable when channel inventories are in excess of specified levels and for transactions where collection of a receivable is not considered probable.
54
The following table summarizes the allowances for doubtful accounts for the periods presented:
April 3, 2015 | March 28, 2014 | March 29, 2013 | |||||||||
(Dollars in millions) | |||||||||||
Beginning balance | $ | 7 | $ | 5 | $ | 5 | |||||
Provision for doubtful accounts | 7 | 6 | 3 | ||||||||
Deductions, net | (7 | ) | (4 | ) | (3 | ) | |||||
Ending balance | $ | 7 | $ | 7 | $ | 5 | |||||
Property and equipment
Property, equipment, and leasehold improvements are stated at cost, net of accumulated depreciation. We capitalize costs incurred during the application development stage related to the development of internal use software and enterprise cloud computing services. We expense costs incurred related to the planning and post-implementation phases of development as incurred. Depreciation is provided on a straight-line basis over the estimated useful lives. Estimated useful lives for financial reporting purposes are as follows: buildings, 20 to 30 years; leasehold improvements, the lesser of the life of the improvement or the initial lease term; computer hardware and software, and office furniture and equipment, 3 to 5 years.
The following table summarizes property and equipment, net of accumulated depreciation by categories for the periods presented:
April 3, 2015 | March 28, 2014 | ||||||
(Dollars in millions) | |||||||
Land | $ | 79 | $ | 79 | |||
Computer hardware and software | 1,188 | 1,797 | |||||
Office furniture and equipment | 102 | 140 | |||||
Buildings | 542 | 539 | |||||
Leasehold improvements | 288 | 356 | |||||
Construction in progress | 80 | 28 | |||||
2,279 | 2,939 | ||||||
Accumulated depreciation | (1,074 | ) | (1,823 | ) | |||
Property and equipment, net | $ | 1,205 | $ | 1,116 | |||
Depreciation expense was $280 million, $281 million, and $283 million in fiscal 2015, 2014, and 2013, respectively.
Business combinations
We use the acquisition method of accounting under the authoritative guidance on business combinations. Each acquired company’s operating results are included in our consolidated financial statements starting on the date of acquisition. The purchase price is equivalent to the fair value of consideration transferred. Tangible and identifiable intangible assets acquired and liabilities assumed as of the date of acquisition are recorded at their estimated fair values at acquisition date. Goodwill is recognized for the excess of purchase price over the net fair value of assets acquired and liabilities assumed.
Goodwill and intangible assets
Goodwill. Goodwill represents the excess of the purchase price of the acquisition over the net fair value of assets acquired and liabilities assumed. We assign goodwill to our reporting units based on the relative fair value at acquisition date. We review goodwill for impairment for each reporting unit on an annual basis during the fourth quarter of the fiscal year or more frequently if facts and circumstances warrant. During the annual impairment reviews in fiscal 2015, 2014 and 2013, we evaluated qualitative factors to assess the likelihood of impairment and determined that were no indicators of significant risk of goodwill impairment. Consequently, we did not recognize any goodwill impairment charges in fiscal 2015, 2014 or 2013.
Intangible assets. In connection with our acquisitions, we generally recognize assets for customer relationships, developed technology, finite-lived trade names, patents, and indefinite-lived trade names. Finite-lived intangible assets are carried at cost less accumulated amortization. Such amortization is provided on a straight-line basis over the estimated useful lives of the respective assets, generally from 1 to 11 years. Amortization for developed technology is recognized in cost of revenue. Amortization for customer relationships and certain trade names is recognized in operating expenses. Indefinite-lived intangible assets are not subject to amortization but instead tested for impairment annually or more frequently if events or changes in circumstances indicate that the carrying amount of an asset may not be recoverable. Recoverability of indefinite-lived intangible assets is measured by the comparison of the carrying amount of the asset to the discounted future cash flows of the
55
asset is expected to generate. If the carrying amount of the asset exceeds its discounted future cash flows, an impairment loss is recognized for the difference between the asset’s carrying amount and fair value.
Restructuring
Restructuring actions generally include significant actions involving employee-related severance charges and contract termination costs. Employee-related severance charges are largely based upon substantive severance plans, while some are mandated requirements in certain foreign jurisdictions. These charges are reflected in the period when both the actions are probable and the amounts are estimable. Separation and other related costs include advisory, consulting and other costs incurred in connection with the separation of our information management business. Contract termination costs for leased facilities primarily reflect costs that will continue to be incurred under the contract for its remaining term without economic benefit to the Company. These charges are reflected in the period when the facility ceases to be used.
Income taxes
The provision for income taxes is computed using the asset and liability method, under which deferred tax assets and liabilities are recognized for the expected future tax consequences of temporary differences between the financial reporting and tax bases of assets and liabilities, and for operating loss and tax credit carryforwards in each jurisdiction in which we operate. Deferred tax assets and liabilities are measured using the currently enacted tax rates that apply to taxable income in effect for the years in which those tax assets are expected to be realized or settled. We record a valuation allowance to reduce deferred tax assets to the amount that is believed more likely than not to be realized.
We are required to compute our income taxes in each federal, state, and international jurisdiction in which we operate. This process requires that we estimate the current tax exposure as well as assess temporary differences between the accounting and tax treatment of assets and liabilities, including items such as accruals and allowances not currently deductible for tax purposes. The income tax effects of the differences we identify are classified as current or long-term deferred tax assets and liabilities in our Consolidated Balance Sheets. Our judgments, assumptions, and estimates relative to the current provision for income tax take into account current tax laws, our interpretation of current tax laws, and possible outcomes of current and future audits conducted by foreign and domestic tax authorities. Changes in tax laws or our interpretation of tax laws and the resolution of current and future tax audits could significantly impact the amounts provided for income taxes in our Consolidated Balance Sheets and Consolidated Statements of Income. We must also assess the likelihood that deferred tax assets will be realized from future taxable income and, based on this assessment, establish a valuation allowance, if required. Our determination of our valuation allowance is based upon a number of assumptions, judgments, and estimates, including forecasted earnings, future taxable income, and the relative proportions of revenue and income before taxes in the various domestic and international jurisdictions in which we operate. To the extent we establish a valuation allowance or change the valuation allowance in a period, we reflect the change with a corresponding increase or decrease to our tax provision in our Consolidated Statements of Income.
We apply the authoritative guidance on income taxes that prescribes a minimum recognition threshold a tax position is required to meet before being recognized in the consolidated financial statements. It also provides guidance on derecognition, measurement, classification, interest and penalties, accounting in interim periods, disclosure and transition.
This guidance prescribes a two-step process to determine the amount of tax benefit to be recognized. The first step is to evaluate the tax position for recognition by determining if the weight of available evidence indicates that it is more likely than not that the position will be sustained on audit, including resolution of related appeals or litigation processes, if any. The second step requires us to estimate and measure the tax benefit as the largest amount that is more than 50% likely to be realized upon ultimate settlement. It is inherently difficult and subjective to estimate such amounts, as this requires us to determine the probability of various possible outcomes. We reevaluate these uncertain tax positions on a quarterly basis. This evaluation is based on factors including, but not limited to, changes in facts or circumstances, changes in tax law, effectively settled issues under audit, and new audit activity. Such a change in recognition or measurement would result in the recognition of a tax benefit or an additional charge to the tax provision in the period.
Stock-based compensation
Stock-based compensation expense is measured at the grant date based on the fair value of the award and is generally recognized ratably on a straight-line basis over the requisite service period, which is generally the vesting period of the respective award. No compensation cost is ultimately recognized for awards for which employees do not render the requisite service and are forfeited. As a result, judgment is required in estimating the amount of stock-based awards that are expected to be forfeited. Although we estimate forfeitures based on historical experience, actual forfeitures may differ. If actual results differ significantly from these estimates, stock-based compensation expense and our results of operations could be materially impacted when we record an adjustment for the difference in the period that the awards vest or are forfeited.
56
Fair value of stock-based awards. Stock-based awards principally consist of restricted stock units (“RSU”). The fair value of each RSU is equal to the market value of Symantec’s common stock on the date of grant. Because the Company’s RSUs include dividend-equivalent rights, the fair values are not discounted by the dividend yield.
Changes in the valuation assumptions and our related estimates may change the fair value for stock-based compensation and the related expense recognized. There have not been any material changes to our stock-based compensation expense due to changes in our valuation assumptions.
Concentrations of credit risk
A significant portion of our revenue and net income is derived from international sales and independent agents and distributors. Fluctuations of the U.S. dollar against foreign currencies, changes in local regulatory or economic conditions, piracy, or nonperformance by independent agents or distributors could adversely affect operating results.
Financial instruments that potentially subject us to concentrations of credit risk consist principally of cash and cash equivalents, short-term investments, and trade accounts receivable. Our investment policy limits the amount of credit risk exposure to any one issuer and to any one country. We are exposed to credit risks in the event of default by the issuers to the extent of the amount recorded in our Consolidated Balance Sheets. The credit risk in our trade accounts receivable is substantially mitigated by our credit evaluation process, reasonably short collection terms, and the geographical dispersion of sales transactions. We maintain reserves for potential credit losses and such losses have been within management’s expectations. See Note 9 for details of significant customers.
Advertising and other promotional costs
Advertising and other promotional costs are charged to operations as incurred and included in operating expenses. These costs totaled $330 million, $451 million, and $594 million for fiscal 2015, 2014, and 2013, respectively.
Contingencies
We evaluate contingent liabilities including threatened or pending litigation in accordance with the authoritative guidance on contingencies. We assess the likelihood of any adverse judgments or outcomes from potential claims or proceedings, as well as potential ranges of probable losses, when the outcomes of the claims or proceedings are probable and reasonably estimable. A determination of the amount of accrued liabilities required, if any, for these contingencies is made after the analysis of each separate matter. Because of uncertainties related to these matters, we base our estimates on the information available at the time of our assessment. As additional information becomes available, we reassess the potential liability related to our pending claims and litigation and may revise our estimates. Any revisions in the estimates of potential liabilities could have a material impact on our operating results and financial position.
Sales Commissions
Sales commissions that are incremental and directly related to customer sales contracts in which revenue is deferred are accrued and capitalized upon execution of a non-cancelable customer contract, and subsequently expensed over the term of such contract in proportion to the related future revenue streams. For commission costs where revenue is recognized, the related commission costs are recorded in the period of revenue recognition.
Recently issued authoritative guidance
On April 10, 2014, the Financial Accounting Standards Board (“FASB”) issued Accounting Standards Update No. 2014-08, Presentation of Financial Statements and Property, Plant and Equipment, that provides new guidance related to reporting discontinued operations. This new standard raises the threshold for a disposal to qualify as a discontinued operation and requires new disclosures of both discontinued operations and certain other disposals that do not meet the definition of a discontinued operation. The new standard is effective for the Company April 4, 2015, and will apply to the treatment of the planned separation of our information management business that is expected to occur on January 2, 2016. Early adoption is permitted but only for disposals that have not been reported in financial statements previously issued. We do not expect that this standard will have a material impact on our Consolidated Financial Statements and related disclosures.
On May 28, 2014, the FASB issued Accounting Standards Update No. 2014-09, Revenue from Contracts with Customers, that requires an entity to recognize the amount of revenue to which it expects to be entitled for the transfer of promised goods or services to customers, and will replace most existing revenue recognition guidance in U.S. GAAP. The new standard is effective for the Company April 1, 2017. The standard permits the use of either the retrospective or cumulative effect transition method. On April 29, 2015, the FASB proposed a one year deferral in the effective date of the new standard. We are evaluating the effect that the standard will have on our Consolidated Financial Statements and related disclosures. We have not yet selected a transition method nor have we determined the effect of the standard on our ongoing financial reporting.
On April 7, 2015, the FASB issued Accounting Standards Update No. 2015-03, Interest-Imputation of Interest, which requires debt issuance costs to be presented as a direct deduction from the carrying amount of the related liability. The new standard is effective for the Company April 2, 2016. Early adoption is permitted and we expect to adopt the standard in the
57
fiscal period beginning April 4, 2015. We do not expect that this standard will have a material impact on our Consolidated Financial Statements and related disclosures.
There was no other recently issued authoritative guidance that is expected to have a material impact to our Consolidated Financial Statements through the reporting date.
Note 2. Fair Value Measurements
For assets and liabilities measured at fair value, such amounts are based on an expected exit price representing the amount that would be received on the sale of an asset or paid to transfer a liability, as the case may be, in an orderly transaction between market participants. As such, fair value may be based on assumptions that market participants would use in pricing an asset or liability. The authoritative guidance on fair value measurements establishes a consistent framework for measuring fair value on either a recurring or nonrecurring basis whereby inputs, used in valuation techniques, are assigned a hierarchical level. The following are the hierarchical levels of inputs to measure fair value:
• | Level 1: Observable inputs that reflect quoted prices (unadjusted) for identical assets or liabilities in active markets. |
• | Level 2: Observable inputs that reflect quoted prices for identical assets or liabilities in markets that are not active; quoted prices for similar assets or liabilities in active markets; inputs other than quoted prices that are observable for the assets or liabilities; or inputs that are derived principally from or corroborated by observable market data by correlation or other means. |
• | Level 3: Unobservable inputs reflecting our own assumptions incorporated in valuation techniques used to determine fair value. These assumptions are required to be consistent with market participant assumptions that are reasonably available. |
Assets measured and recorded at fair value on a recurring basis
Cash equivalents. Cash equivalents consist primarily of money market funds with original maturities of three months or less at the time of purchase, and the carrying amount is a reasonable estimate of fair value.
Short-term investments. Short-term investments consist of investment and marketable equity securities with original maturities greater than three months. Investment securities are priced using inputs such as actual trade data, benchmark yields, broker/dealer quotes, and other similar data, which are obtained from quoted market prices, independent pricing vendors, or other sources, to determine the fair value of these assets. Marketable equity securities are recorded at fair value using quoted prices in active markets for identical assets.
There have been no transfers between fair value measurement levels during fiscal 2015. The following table summarizes our assets measured at fair value on a recurring basis, by level, within the fair value hierarchy:
April 3, 2015 | March 28, 2014 | ||||||||||||||||||||||
Fair value | Cash and cash equivalents | Short-term investments | Fair value | Cash and cash equivalents | Short-term investments | ||||||||||||||||||
(Dollars in millions) | |||||||||||||||||||||||
Cash | $ | 807 | $ | 807 | $ | — | $ | 922 | $ | 922 | $ | — | |||||||||||
Non-negotiable certificates of deposit | 296 | 260 | 36 | 405 | 365 | 40 | |||||||||||||||||
Level 1 | |||||||||||||||||||||||
Money market | 1,725 | 1,725 | — | 2,380 | 2,380 | — | |||||||||||||||||
U.S. government securities | 284 | — | 284 | 95 | — | 95 | |||||||||||||||||
Marketable equity securities | 5 | — | 5 | 6 | — | 6 | |||||||||||||||||
2,014 | 1,725 | 289 | 2,481 | 2,380 | 101 | ||||||||||||||||||
Level 2 | |||||||||||||||||||||||
Corporate bonds | 166 | — | 166 | 123 | 3 | 120 | |||||||||||||||||
U.S. agency securities | 68 | — | 68 | 45 | — | 45 | |||||||||||||||||
Commercial paper | 333 | 82 | 251 | 56 | 32 | 24 | |||||||||||||||||
Negotiable certificates of deposit | 184 | — | 184 | — | — | — | |||||||||||||||||
International government securities | 23 | — | 23 | 52 | 5 | 47 | |||||||||||||||||
774 | 82 | 692 | 276 | 40 | 236 | ||||||||||||||||||
Total | $ | 3,891 | $ | 2,874 | $ | 1,017 | $ | 4,084 | $ | 3,707 | $ | 377 | |||||||||||
58
Fair Value of Debt
As of April 3, 2015 and March 28, 2014, the fair value of our current and long-term debt was $2.2 billion based on Level 2 inputs.
Note 3. Goodwill and Intangible Assets
During fiscal 2015, 2014, and 2013 we completed business acquisitions primarily to enhance our technology portfolio for aggregate cash consideration, net of cash acquired, of $19 million, $17 million, and $28 million, respectively. The results of operations related to these acquisitions have been included in our consolidated statements of income from the acquisition date. Pro forma results of operations have not been presented because the acquisitions were not material to our results of operations.
We also acquired rights to certain technology for $20 million in an asset acquisition during the third quarter of fiscal 2015. The total amount assigned to acquired finite-lived intangible assets from fiscal 2015 acquisitions was $27 million. This cost was assigned to developed technology and is being amortized to cost of revenue on a straight-line basis over the weighted-average useful life of 3.5 years. Goodwill related to the business acquisitions is summarized in the following table.
Goodwill
The changes in the carrying amount of goodwill are as follows:
Consumer Security | Enterprise Security | Information Management | Total | ||||||||||||
(Dollars in millions) | |||||||||||||||
Net balance as of March 29, 2013 | $ | 1,233 | $ | 1,901 | $ | 2,707 | $ | 5,841 | |||||||
Acquisitions | — | 16 | — | 16 | |||||||||||
Translation adjustments | — | 1 | — | 1 | |||||||||||
Net balance as of March 28, 2014 | $ | 1,233 | $ | 1,918 | $ | 2,707 | $ | 5,858 | |||||||
Acquisitions | — | 11 | — | 11 | |||||||||||
Translation adjustments | (3 | ) | (13 | ) | (6 | ) | (22 | ) | |||||||
Net balance as of April 3, 2015 | $ | 1,230 | $ | 1,916 | $ | 2,701 | $ | 5,847 | |||||||
Effective in the second quarter of fiscal 2015, we evaluated our segment reporting structure and modified the reporting to match our new operating structure. Our reporting units for goodwill are the same as our reportable operating segments, and the net goodwill balance has been allocated to the reporting units based on their relative fair value. See Note 9 of these Consolidated Financial Statements for information regarding the changes related to segment information.
As a result of the change in our segments, we assessed goodwill for impairment immediately prior to the changes to the new reporting units and determined that the estimated fair value of our reporting units exceeded their respective carrying amount including goodwill. Based on the results of our impairment analysis, we do not believe that impairment existed as of the date of the change in our segments.
Intangible assets, net
April 3, 2015 | March 28, 2014 | ||||||||||||||||||||||
Gross Carrying Amount | Accumulated Amortization | Net Carrying Amount | Gross Carrying Amount | Accumulated Amortization | Net Carrying Amount | ||||||||||||||||||
(Dollars in millions) | |||||||||||||||||||||||
Customer relationships | $ | 730 | $ | (536 | ) | $ | 194 | $ | 766 | $ | (469 | ) | $ | 297 | |||||||||
Developed technology | 296 | (172 | ) | 124 | 287 | (142 | ) | 145 | |||||||||||||||
Finite-lived trade names | 125 | (117 | ) | 8 | 125 | (103 | ) | 22 | |||||||||||||||
Patents | 21 | (16 | ) | 5 | 21 | (14 | ) | 7 | |||||||||||||||
Total finite-lived intangible assets | 1,172 | (841 | ) | 331 | 1,199 | (728 | ) | 471 | |||||||||||||||
Indefinite-lived trade names | 297 | — | 297 | 297 | — | 297 | |||||||||||||||||
Total | $ | 1,469 | $ | (841 | ) | $ | 628 | $ | 1,496 | $ | (728 | ) | $ | 768 | |||||||||
59
As of April 3, 2015, future amortization expense related to intangible assets that have finite lives is as follows by fiscal year:
April 3, 2015 | ||||
(Dollars in millions) | ||||
2016 | $ | 112 | ||
2017 | 93 | |||
2018 | 70 | |||
2019 | 37 | |||
2020 | 15 | |||
Thereafter | 4 | |||
Total | $ | 331 | ||
Note 4. Supplemental Financial Information
Dividends
During fiscal 2015, we declared and paid aggregate cash dividends of $413 million or $0.60 per common share. During fiscal 2014, we declared and paid aggregate cash dividends of $418 million or $0.60 per common share. Each quarterly dividend was recorded as a reduction to additional paid-in capital. Our restricted stock and performance-based stock units have dividend equivalent rights entitling holders to dividend equivalents to be paid in the form of cash upon vesting, for each share of the underlying units. No dividends or dividend equivalents were paid in any periods prior to fiscal 2014.
On May 14, 2015, we declared a cash dividend of $0.15 per share of common stock to be paid on June 24, 2015 to all stockholders of record as of the close of business on June 10, 2015. All shares of common stock issued and outstanding, and unvested restricted stock and performance-based stock, as of the record date will be entitled to the dividend and dividend equivalents, respectively. Any future dividends and dividend equivalents will be subject to the approval of our Board of Directors.
Changes in Accumulated Other Comprehensive Income by Component
Components of accumulated other comprehensive income, on a net of tax basis, were as follows:
Foreign Currency Translation Adjustments | Unrealized Gain On Available-For-Sale Securities | Total | |||||||||
(Dollars in millions) | |||||||||||
Balance as of March 28, 2014 | $ | 191 | $ | 3 | $ | 194 | |||||
Other comprehensive income before reclassifications | (89 | ) | — | (89 | ) | ||||||
Amounts reclassified from accumulated other comprehensive income | (1 | ) | — | (1 | ) | ||||||
Balance as of April 3, 2015 | $ | 101 | $ | 3 | $ | 104 | |||||
In fiscal 2015, we reclassified $1 million of realized gain on foreign currency translation adjustments from accumulated other comprehensive income to other income, net in our Consolidated Statements of Income.
60
Note 5. Debt
The following table summarizes components of our debt:
April 3, 2015 | March 28, 2014 | ||||||||||||
Amount | Effective Interest Rate | Amount | Effective Interest Rate | ||||||||||
(Dollars in millions) | |||||||||||||
Senior Notes | |||||||||||||
2.75% due September 15, 2015 | $ | 350 | 2.76 | % | $ | 350 | 2.76 | % | |||||
2.75% due June 15, 2017 | 600 | 2.79 | % | 600 | 2.79 | % | |||||||
4.20% due September 15, 2020 | 750 | 4.25 | % | 750 | 4.25 | % | |||||||
3.95% due June 15, 2022 | 400 | 4.05 | % | 400 | 4.05 | % | |||||||
Total principal amount | $ | 2,100 | $ | 2,100 | |||||||||
Less: unamortized discount | (4 | ) | (5 | ) | |||||||||
Total debt | $ | 2,096 | $ | 2,095 | |||||||||
Less: current portion | (350 | ) | — | ||||||||||
Total long-term portion | $ | 1,746 | $ | 2,095 | |||||||||
The future maturities of debt by fiscal year are as follows:
April 3, 2015 | ||||
(Dollars in millions) | ||||
2016 | $ | 350 | ||
2017 | — | |||
2018 | 600 | |||
2019 | — | |||
2020 | — | |||
Thereafter | 1,150 | |||
Total | $ | 2,100 | ||
Senior Notes
In fiscal 2013, we issued $1.0 billion of Senior Notes consisting of the 3.95% Senior Notes due in 2022 and the 2.75% Senior Notes due in 2017. We received proceeds of $996 million, net of an issuance discount. We also incurred issuance costs of $6 million in fiscal 2013. In fiscal 2011, we issued $1.1 billion of Senior Notes consisting of the 4.20% Senior Notes due in 2020 and 2.75% Senior Notes due in 2015. We collectively refer to such debt as our Senior Notes.
Our Senior Notes are senior unsecured obligations that rank equally in right of payment with all of our existing and future unsecured, unsubordinated obligations and are redeemable by us at any time, subject to a “make-whole” premium. Interest on our Senior Notes is payable semiannually. Both the discount and issuance costs are being amortized as incremental interest expense over the respective terms of the Senior Notes. Contractual interest expense totaled $73 million, $73 million, and $67 million in fiscal years 2015, 2014, and 2013, respectively.
Convertible Senior Notes
In fiscal 2014, the principal balance of our 1.00% Convertible Senior Notes issued in fiscal 2007 matured and was settled by a cash payment of $1.0 billion, along with the $5 million semiannual interest payment. In addition, we elected to pay the conversion value above par value in cash in the amount of $189 million. Concurrently with the payment of the conversion value, we received $189 million from the note hedge we entered into at the time of issuance of the 1.00% notes.
At the time of issuance of the 1.00% notes, we granted warrants to affiliates of certain initial purchasers of the notes whereby they had the option to purchase up to 52.7 million shares of our common stock at a price of $27.1330 per share. All the warrants expired unexercised on various dates during the second quarter of fiscal 2014 and there was no dilutive impact from the warrants on our earnings per share for fiscal 2014.
Interest on our 1.00% notes was payable semiannually. Contractual interest expense was $0 million, $2 million, and $10 million in fiscal 2015, 2014 and 2013, respectively. Amortization of the debt discount was $0 million, $3 million and $55 million in fiscal 2015, 2014 and 2013, respectively.
61
Revolving credit facility
In fiscal 2011, we entered into a $1.0 billion senior unsecured revolving credit facility, which was amended in fiscal 2013. The amendment extended the term of the credit facility to June 7, 2017 and revolving loans under the credit facility will bear interest, at our option, either at a rate equal to a) LIBOR plus a margin based on debt ratings, as defined in the credit facility agreement or b) the bank’s base rate plus a margin based on debt ratings, as defined in the credit facility agreement. Under the terms of this credit facility, we must comply with certain financial and non-financial covenants, including a covenant to maintain a specified ratio of debt to EBITDA (earnings before interest, taxes, depreciation and amortization). As of April 3, 2015 and March 28, 2014, we were in compliance with the required covenants, and no amounts were outstanding.
Note 6. Restructuring, Separation, and Transition
Our restructuring, separation, and transition costs and liabilities consist primarily of severance, facilities, separation, transition and other related costs. Severance costs generally include severance payments, outplacement services, health insurance coverage, and legal costs. Facilities costs generally include rent expense and lease termination costs, less estimated sublease income. Separation and other related costs include advisory, consulting and other costs incurred in connection with the separation of our information management business. Transition and other related costs consist of consulting charges associated with the implementation of new Enterprise Resource Planning systems. Restructuring, separation, and transition costs are managed at the corporate level and are not allocated to our reportable segments. See Note 9 of these Consolidated Financial Statements for information regarding the reconciliation of total segment operating income to total consolidated operating income.
Restructuring plans
Fiscal 2014 Plan
We initiated a restructuring plan in the fourth quarter of fiscal 2013 to reduce management and redundant personnel resulting in headcount reductions across the Company. As of April 3, 2015, the related costs for severance and benefits are substantially complete; however, we expect to incur immaterial adjustments to existing reserves in subsequent periods.
Fiscal 2015 Plan
In fiscal 2015, we announced plans to separate our business into two independent publicly-traded companies: one focused on security and one focused on information management. We expect to complete the legal separation on January 2, 2016, subject to market, regulatory and certain other conditions. In order to separate the business, we initiated a restructuring plan to properly align personnel and expect to incur associated severance and facilities costs. We also expect to incur separation costs in the form of advisory, consulting and disentanglement expenses. These actions are expected to be completed in fiscal 2016. We expect to incur total severance and facilities costs between $165 million and $195 million. We expect to incur separation costs between $170 million and $190 million, excluding any potential tax implications outside the U.S. and potential advisor fees payable upon separation. Total restructuring and separation costs are expected to be between $335 million and $385 million. As of April 3, 2015, liabilities for excess facility obligations at several locations around the world are expected to be paid throughout the respective lease terms as we continue to occupy these facilities, the longest of which extends through fiscal 2019.
Restructuring, separation, and transition summary
March 28, 2014 | Costs, Net of Adjustments | Cash Payments | April 3, 2015 | Cumulative Incurred to Date | |||||||||||||||
(Dollars in millions) | |||||||||||||||||||
Fiscal 2014 Plan Total | $ | 38 | $ | 16 | $ | (50 | ) | $ | 4 | $ | 238 | ||||||||
Fiscal 2015 Plan | |||||||||||||||||||
Severance costs | — | 102 | (43 | ) | 59 | 102 | |||||||||||||
Separation costs | — | 81 | (64 | ) | 17 | 81 | |||||||||||||
Other exit and disposal costs | — | 7 | (1 | ) | 6 | 7 | |||||||||||||
Fiscal 2015 Plan Total | $ | — | $ | 190 | $ | (108 | ) | $ | 82 | $ | 190 | ||||||||
Restructuring and separation Plans Total | $ | 38 | $ | 206 | $ | (158 | ) | $ | 86 | ||||||||||
Transition and other related costs | 46 | ||||||||||||||||||
Total restructuring, separation, and transition costs | $ | 252 | |||||||||||||||||
As of April 3, 2015, the restructuring and separation liabilities are included in accounts payable, other current liabilities and other long-term obligations in our Consolidated Balance Sheets.
62
Note 7. Commitments and Contingencies
Lease commitments
We lease certain of our facilities, equipment, and co-locations under operating leases that expire at various dates through fiscal 2029. We currently sublease some space under various operating leases that will expire on various dates through fiscal 2018. Some of our leases contain renewal options, escalation clauses, rent concessions, and leasehold improvement incentives. Rent expense under operating leases was $128 million, $121 million, and $124 million for fiscal 2015, 2014, and 2013, respectively.
The minimum future rentals on noncancelable operating leases by fiscal year are as follows:
April 3, 2015 | ||||
(Dollars in millions) | ||||
2016 | $ | 103 | ||
2017 | 81 | |||
2018 | 69 | |||
2019 | 62 | |||
2020 | 42 | |||
Thereafter | 85 | |||
Total minimum future lease payments | $ | 442 | ||
Sublease income | (1 | ) | ||
Total minimum future lease payments, net | $ | 441 | ||
Purchase obligations
We have purchase obligations that are associated with agreements for purchases of goods or services. Management believes that cancellation of these contracts is unlikely and we expect to make future cash payments according to the contract terms. The following reflects unrecognized purchase obligations by fiscal year:
April 3, 2015 | ||||
(Dollars in millions) | ||||
2016 | $ | 539 | ||
2017 | 1 | |||
2018 | 2 | |||
Thereafter | — | |||
Total purchase obligations | $ | 542 | ||
Indemnifications
In the ordinary course of business, we may provide indemnifications of varying scope and terms to customers, vendors, lessors, business partners, subsidiaries and other parties with respect to certain matters, including, but not limited to, losses arising out of our breach of agreements or representations and warranties made by us. In addition, our bylaws contain indemnification obligations to our directors, officers, employees and agents, and we have entered into indemnification agreements with our directors and certain of our officers to give such directors and officers additional contractual assurances regarding the scope of the indemnification set forth in our bylaws and to provide additional procedural protections. We maintain director and officer insurance, which may cover certain liabilities arising from our obligation to indemnify our directors and officers. It is not possible to determine the aggregate maximum potential loss under these indemnification agreements due to the limited history of prior indemnification claims and the unique facts and circumstances involved in each particular agreement. Such indemnification agreements might not be subject to maximum loss clauses. Historically, we have not incurred material costs as a result of obligations under these agreements and we have not accrued any liabilities related to such indemnification obligations in our Consolidated Financial Statements.
We provide limited product warranties and the majority of our software license agreements contain provisions that indemnify licensees of our software from damages and costs resulting from claims alleging that our software infringes on the intellectual property rights of a third party. Historically, payments made under these provisions have been immaterial. We monitor the conditions that are subject to indemnification to identify if a loss has occurred.
63
Litigation contingencies
GSA
During the first quarter of fiscal 2013, we were advised by the Commercial Litigation Branch of the Department of Justice’s Civil Division and the Civil Division of the U.S. Attorney’s Office for the District of Columbia that the government is investigating our compliance with certain provisions of our U.S. General Services Administration (“GSA”) Multiple Award Schedule Contract No. GS-35F-0240T effective January 24, 2007, including provisions relating to pricing, country of origin, accessibility, and the disclosure of commercial sales practices.
As reported on the GSA’s publicly-available database, our total sales under the GSA Schedule contract were approximately $222 million from the period beginning January 2007 and ending September 2012. We have fully cooperated with the government throughout its investigation and in January 2014, representatives of the government indicated that their initial analysis of our actual damages exposure from direct government sales under the GSA schedule is approximately $145 million; since the initial meeting, the government’s analysis of our potential damages exposure relating to direct sales has increased. The government has also indicated they are going to pursue claims for certain sales to New York, California, and Florida as well as sales to the federal government through reseller GSA Schedule contracts, which could significantly increase our potential damages exposure.
In 2012, a sealed civil lawsuit was filed against Symantec related to compliance with the GSA Schedule contract and contracts with California, Florida, and New York. On July 18, 2014, the Court-imposed seal expired, and the government intervened in the lawsuit. On September 16, 2014, the states of California and Florida intervened in the lawsuit, and the state of New York notified the Court that it would not intervene. On October 3, 2014, the Department of Justice filed an amended complaint, which did not state a specific damages amount. On October 17, 2014, California and Florida combined their claims with those of the Department of Justice and the relator on behalf of New York in an Omnibus Complaint; the state claims also do not state specific damages amounts.
It is possible that the litigation could lead to claims or findings of violations of the False Claims Act, and could be material to our results of operations and cash flows for any period. Resolution of False Claims Act investigations can ultimately result in the payment of somewhere between one and three times the actual damages proven by the government, plus civil penalties in some cases, depending upon a number of factors. Our current estimate of the low end of the range of the probable estimated loss from this matter is $25 million, which we have accrued. This amount contemplates estimated losses from both the investigation of compliance with the terms of the GSA Schedule contract as well as possible violations of the False Claims Act. There is at least a reasonable possibility that a loss may have been incurred in excess of our accrual for this matter, however, we are currently unable to determine a range of estimated losses resulting from this matter.
IV
On December 8, 2010, Intellectual Ventures ("IV") sued Symantec for patent infringement in the U.S. District Court in Delaware. The complaint alleged infringement of four patents by various Symantec internet security products, including Norton security products, Symantec Endpoint Protection, and other Symantec email and web security products. In October 2014, one patent was dismissed from the case. On January 26, 2015, a jury trial began on the remaining three patents. At trial, IV requested a damages award of approximately $299 million. Symantec offered evidence that the three patents were invalid and not infringed. Symantec also offered evidence that, even if any of the patents are found to be valid and infringed, any damages would be significantly lower than the amount requested by IV.
On February 6, 2015, after a nine-day trial, the jury issued a verdict finding that Symantec infringed two patents, that Symantec did not infringe the third patent, that Symantec had not established that the patents are invalid based on prior art, and that the proper measure of damages for Symantec’s past and future use of the two patents until their expiration was $17 million ($9 million for one patent and $8 million for the second patent). On April 10, 2015, the Court heard a post-trial motion brought by Symantec specifically addressing whether the three patents-in-suit are invalid under 35 U.S.C. § 101 due to lack of patentable subject matter. On April 22, 2015, the Court issued an order holding that two of the patents are invalid, including one of the patents Symantec was found to infringe. Therefore, the $9 million jury verdict related to that patent has been rendered moot. Symantec is still considering its options to seek to overturn all or part of the remaining $8 million verdict. Symantec does not believe that it is probable that it has incurred a material loss and, as a result, has not made an accrual for this matter.
Other
See Note 13 for information regarding an agreement in principle to settle litigation. We are also involved in a number of other judicial and administrative proceedings that are incidental to our business. Although adverse decisions (or settlements) may occur in one or more of the cases, it is not possible to estimate the possible loss or losses from each of these cases. The final resolution of these lawsuits, individually or in the aggregate, is not expected to have a material adverse effect on our business, results of operations, financial condition or cash flow.
64
Note 8. Stock Repurchases
The following table summarizes our stock repurchases:
Year Ended | |||||||||||
April 3, 2015 | March 28, 2014 | March 29, 2013 | |||||||||
(In millions, except per share data) | |||||||||||
Total number of shares repurchased | 21 | 21 | 49 | ||||||||
Dollar amount of shares repurchased | $ | 500 | $ | 500 | $ | 826 | |||||
Average price paid per share | $ | 23.73 | $ | 23.87 | $ | 16.98 | |||||
Remaining authorization at end of period | $ | 1,158 | $ | 658 | $ | 1,158 | |||||
Through our stock repurchase programs we have repurchased shares on a quarterly basis since the fourth quarter of fiscal 2004. On February 3, 2015, our Board of Directors authorized a new $1.0 billion stock repurchase program which commenced immediately and does not have an expiration date. This is in addition to the remaining amount authorized for future repurchase under our previous program.
Note 9. Segment and Geographic Information
In fiscal 2015, we are focused on managing our businesses as a portfolio and optimizing certain businesses for margin or growth. As a result, in the second quarter of fiscal 2015 we formed a new consumer group and modified our segment reporting structure to match our operating structure based on financial information reviewed by our CODM. Consumer Security consists of our consumer businesses that were previously reported in User Productivity & Protection. Enterprise Security consists of our enterprise security businesses that were previously reported in User Productivity & Protection and Information Security. Our Information Management segment was not impacted by the change in our operating structure. The three reporting segments, which are the same as our operating segments, are as follows:
• | Consumer Security: Our Consumer Security segment focuses on making it simple for customers to be productive and protected at home and at work. Our Norton-branded services provide multi-layer security and identity protection on major desktop and mobile operating systems, to defend against increasingly complex online threats to individuals, families, and small businesses. |
• | Enterprise Security: Our Enterprise Security segment protects organizations so they can securely conduct business while leveraging new platforms and data. These products include Secure Socket Layer (“SSL”) Certificates, authentication, mail and web security, data center security, data loss prevention, information security services, endpoint security and management, encryption, and mobile security offerings. |
• | Information Management: Our Information Management segment focuses on backup and recovery, archiving and eDiscovery, storage and high availability solutions, helping to ensure that our customers’ IT infrastructure and mission-critical applications are protected, managed and available. |
There were no intersegment sales for the periods presented. The historical information presented has been retrospectively adjusted to reflect the new segment reporting. Our CODM evaluates performance primarily based on net revenue and operating income. Except for goodwill, as disclosed in Note 3, our assets are not discretely identified by segment.
Consumer Security | Enterprise Security | Information Management | Total Segments | ||||||||||||
(Dollars in millions) | |||||||||||||||
Fiscal 2015 | |||||||||||||||
Net revenue | $ | 1,887 | $ | 2,063 | $ | 2,558 | $ | 6,508 | |||||||
Operating income | 982 | 287 | 486 | 1,755 | |||||||||||
Fiscal 2014 | |||||||||||||||
Net revenue | $ | 2,063 | $ | 2,100 | $ | 2,513 | $ | 6,676 | |||||||
Operating income | 928 | 314 | 571 | 1,813 | |||||||||||
Fiscal 2013 | |||||||||||||||
Net revenue | $ | 2,109 | $ | 2,168 | $ | 2,629 | $ | 6,906 | |||||||
Operating income | 805 | 213 | 684 | 1,702 | |||||||||||
65
The following table provides a reconciliation of the total of the reportable segments’ operating income to the consolidated operating income:
Year Ended | |||||||||||
April 3, 2015 | March 28, 2014 | March 29, 2013 | |||||||||
(Dollars in millions) | |||||||||||
Total segment operating income | $ | 1,755 | $ | 1,813 | $ | 1,702 | |||||
Less reconciling items: | |||||||||||
Stock-based compensation | 195 | 156 | 164 | ||||||||
Amortization of intangibles | 159 | 210 | 355 | ||||||||
Restructuring, separation, and transition | 252 | 264 | 77 | ||||||||
Total consolidated operating income | $ | 1,149 | $ | 1,183 | $ | 1,106 | |||||
Product revenue information
The following table summarizes revenue by significant product categories:
Year Ended | |||||||||||
April 3, 2015 | March 28, 2014 | March 29, 2013 | |||||||||
(Dollars in millions) | |||||||||||
Core consumer security | $ | 1,887 | $ | 2,063 | $ | 2,109 | |||||
Backup | 1,536 | 1,423 | 1,445 | ||||||||
Information availability | 585 | 652 | 733 | ||||||||
Endpoint security and management | 604 | 638 | 701 | ||||||||
Others (1) | 1,896 | 1,900 | 1,918 | ||||||||
Total product revenue | $ | 6,508 | $ | 6,676 | $ | 6,906 | |||||
(1) | No other product category was material to the respective totals. |
Geographical Information
The following table represents net revenue amounts recognized for sales in the corresponding countries:
Year Ended | |||||||||||
April 3, 2015 | March 28, 2014 | March 29, 2013 | |||||||||
(Dollars in millions) | |||||||||||
U.S. | $ | 3,170 | $ | 3,198 | $ | 3,337 | |||||
Foreign countries (1) | 3,338 | 3,478 | 3,569 | ||||||||
Total net revenue | $ | 6,508 | $ | 6,676 | $ | 6,906 | |||||
(1) | No individual country represented more than 10% of the respective totals. |
66
The table below lists our property and equipment, net of accumulated depreciation, by geographic area for the periods presented. We do not identify or allocate our other assets by geographic area:
April 3, 2015 | March 28, 2014 | ||||||
(Dollars in millions) | |||||||
U.S. | $ | 948 | $ | 871 | |||
Foreign countries (1) | 257 | 245 | |||||
Total | $ | 1,205 | $ | 1,116 | |||
(1) | No individual country represented more than 10% of the respective totals. |
Significant customers
In fiscal 2015, 2014 and 2013, there were no significant customers that accounted for more than 10% of our total net revenue.
Note 10. Stock-Based Compensation
Stock purchase plans
2008 Employee Stock Purchase Plan
We maintain the 2008 Employee Stock Purchase Plan, as amended (“ESPP”) under which participating employees may annually contribute up to 10% of their gross compensation, subject to certain limitations, to purchase shares of our common stock at 85% of its fair market value on the purchase date at the end of each six-month purchase period. To be eligible to participate in the ESPP, an employee must, among other requirements, be employed by the Company on both the offering enrollment and purchase dates, and be employed customarily for at least 20 hours per week and at least five months per calendar year. As of April 3, 2015, 25 million shares have been issued under this plan and 45 million shares remained available for future issuance.
Stock award plans
2000 Director Equity Incentive Plan
Our stockholders approved the 2000 Director Equity Incentive Plan and subsequent amendments which reserved 200,000 shares of common stock for issuance thereunder. The purpose of this plan is to provide the members of the Board of Directors with an opportunity to receive common stock for all or a portion of the retainer payable to each director for serving as a member. Each director may elect any portion up to 100% of the retainer to be paid in the form of stock. As of April 3, 2015, a total of 135,000 shares have been issued under this plan and 65,000 shares remained available for future issuance.
2004 and 2013 Equity Incentive Plans
Under both the 2013 Equity Incentive Plan ("2013 Plan") and the 2004 Equity Incentive Plan ("2004 Plan") (collectively “the Equity Plans”), the Company has granted incentive and nonqualified stock options, stock appreciation rights, RSUs, restricted stock awards, and performance-based awards to employees, officers, directors, consultants, independent contractors, and advisors to us. These may also be granted to any parent, subsidiary, or affiliate of ours. The purpose of the Equity Plans has been to attract, retain, and motivate eligible persons whose present and potential contributions are important to our success by offering them an opportunity to participate in our future performance through equity awards. RSUs granted prior to November 2014 generally vest over a four-year period, whereas RSUs granted thereafter generally vest over a three-year period.
Effective as of the first quarter of 2013, following Board of Directors' approval, all RSUs and performance-based awards granted under the Equity Plans have dividend equivalent rights (“DER”) which entitle participants to the same dividend value per share as holders of Company’s Common Stock. The DER are to be paid in the form of cash upon vesting for each share of the underlying award, and are subject to the same terms and conditions as the underlying award.
Upon adoption, our stockholders approved and reserved 45 million shares of common stock for issuance under the 2013 Plan. As of April 3, 2015, 24 million shares remained available for future grant. We use restricted stock units as our primary equity awards and stock option activity is not material to the financial statements.
67
Stock-based compensation expense
The following table sets forth the total stock-based compensation expense recognized in our Consolidated Statements of Income.
Year Ended | |||||||||||
April 3, 2015 | March 28, 2014 | March 29, 2013 | |||||||||
(In millions) | |||||||||||
Cost of revenue | $ | 24 | $ | 19 | $ | 15 | |||||
Sales and marketing | 75 | 59 | 67 | ||||||||
Research and development | 65 | 48 | 50 | ||||||||
General and administrative | 31 | 30 | 32 | ||||||||
Total stock-based compensation expense | 195 | 156 | 164 | ||||||||
Tax benefit associated with stock-based compensation expense | (55 | ) | (45 | ) | (48 | ) | |||||
Net stock-based compensation expense | $ | 140 | $ | 111 | $ | 116 | |||||
Restricted stock units
Number of Shares | Weighted- Average Grant Date Fair Value | Weighted- Average Remaining Years | Aggregate Intrinsic Value | |||||||||
(In millions, except per share and years data) | ||||||||||||
Outstanding at March 28, 2014 | 19 | $ | 20.61 | |||||||||
Granted | 18 | 22.66 | ||||||||||
Vested and released | (6 | ) | 19.27 | |||||||||
Forfeited | (5 | ) | 21.06 | |||||||||
Outstanding and unvested at April 3, 2015 | 26 | $ | 22.23 | 1.4 | $ | 622 | ||||||
Expected to vest at April 3, 2015 | 22 | 1.3 | $ | 508 | ||||||||
The weighted-average grant date fair value per share of restricted stock granted during fiscal 2015, 2014, and 2013, including assumed restricted stock was $22.66, $23.90, and $15.74, respectively. The total fair value of restricted stock that vested and released in fiscal 2015, 2014, and 2013 was $133 million, $147 million, and $124 million, respectively.
As of April 3, 2015, total unrecognized compensation cost adjusted for estimated forfeitures related restricted stock was $368 million, which is expected to be recognized over the remaining weighted-average vesting period of 2.5 years.
Performance-based restricted stock units
During fiscal 2015, 2014 and 2013, we granted performance-based restricted stock units ("PRUs") to certain senior level employees under our 2013 Plan and 2004 Plan. During fiscal 2015, we granted 2 million PRUs. As of April 3, 2015 and March 28, 2014, there were 2 million and 1 million PRUs unvested, respectively. The weighted-average grant date fair value per share of PRUs granted during fiscal 2015, 2014, and 2013 was $26.30, $26.03 and $16.97, respectively.
During each of fiscal 2015, 2014 and 2013, we recognized $13 million of compensation cost related to PRUs and performance-contingent stock units ("PCSUs"). As of April 3, 2015, total unrecognized compensation cost related to the PRUs was approximately $18 million, which is expected to be recognized over the remaining weighted-average period of 1.8 years. No PCSUs were granted during fiscal 2015 and none remained unvested as of April 3, 2015.
Shares reserved
We reserved the following shares of authorized but unissued common stock:
April 3, 2015 | ||
(In millions) | ||
Stock purchase plans | 45 | |
Stock award plans | 53 | |
Total | 98 | |
68
Note 11. Income Taxes
The components of the provision for income taxes are as follows:
Year Ended | |||||||||||
April 3, 2015 | March 28, 2014 | March 29, 2013 | |||||||||
(Dollars in millions) | |||||||||||
Current: | |||||||||||
Federal | $ | 72 | $ | 111 | $ | 104 | |||||
State | 13 | 23 | 23 | ||||||||
International | 115 | 78 | 87 | ||||||||
200 | 212 | 214 | |||||||||
Deferred: | |||||||||||
Federal | 20 | 36 | 27 | ||||||||
State | (3 | ) | 17 | 5 | |||||||
International | (2 | ) | (7 | ) | 5 | ||||||
15 | 46 | 37 | |||||||||
Provision for income taxes | $ | 215 | $ | 258 | $ | 251 | |||||
Pretax income from international operations was $617 million, $612 million, and $652 million for fiscal 2015, 2014, and 2013, respectively.
The difference between our effective income tax and the federal statutory income tax is as follows:
Year Ended | |||||||||||
April 3, 2015 | March 28, 2014 | March 29, 2013 | |||||||||
(Dollars in millions) | |||||||||||
Federal statutory tax | $ | 382 | $ | 405 | $ | 351 | |||||
State taxes, net of federal benefit | 20 | 26 | 25 | ||||||||
Foreign earnings taxed at less than the federal rate | (127 | ) | (131 | ) | (96 | ) | |||||
Domestic production activities deduction | (12 | ) | (14 | ) | (12 | ) | |||||
Federal research and development credit | (11 | ) | (6 | ) | (10 | ) | |||||
Valuation allowance (decrease) increase | 4 | (3 | ) | — | |||||||
Nondeductible separation costs | 11 | — | — | ||||||||
Change in uncertain tax positions | (57 | ) | (26 | ) | (9 | ) | |||||
Other, net | 5 | 7 | 2 | ||||||||
Provision for income taxes | $ | 215 | $ | 258 | $ | 251 | |||||
69
The principal components of deferred tax assets are as follows:
Year Ended | |||||||
April 3, 2015 | March 28, 2014 | ||||||
(Dollars in millions) | |||||||
Deferred tax assets: | |||||||
Tax credit carryforwards | $ | 31 | $ | 38 | |||
Net operating loss carryforwards of acquired companies | 57 | 79 | |||||
Other accruals and reserves not currently tax deductible | 173 | 128 | |||||
Deferred revenue | 74 | 92 | |||||
Loss on investments not currently tax deductible | 16 | 16 | |||||
State income taxes | 14 | 19 | |||||
Stock-based compensation | 45 | 31 | |||||
Gross deferred tax assets | 410 | 403 | |||||
Valuation allowance | (60 | ) | (56 | ) | |||
Deferred tax assets, net of valuation allowance | $ | 350 | $ | 347 | |||
Deferred tax liabilities: | |||||||
Property and equipment | (88 | ) | (76 | ) | |||
Goodwill | (54 | ) | (29 | ) | |||
Intangible assets | (24 | ) | (48 | ) | |||
Unremitted earnings of foreign subsidiaries | (273 | ) | (399 | ) | |||
Prepaids and deferred expenses | (42 | ) | (30 | ) | |||
Other | — | (7 | ) | ||||
Total deferred tax liabilities | $ | (481 | ) | $ | (589 | ) | |
Net deferred tax assets (liabilities) | $ | (131 | ) | $ | (242 | ) | |
The valuation allowance provided against our deferred tax assets as of April 3, 2015 is mainly attributable to net operating loss and tax credit carryforwards of acquired companies, state tax credits, and net operating losses in foreign jurisdictions. The valuation allowance increased by a net of $4 million in fiscal 2015 due to changes in corresponding deferred tax assets primarily related to state tax credit carryforwards.
As of April 3, 2015, we have U.S. federal net operating losses attributable to various acquired companies of approximately $60 million, which, if not used, will expire between fiscal 2018 and 2032. These net operating loss carryforwards are subject to an annual limitation under Internal Revenue Code §382, but are expected to be fully realized. Furthermore, we have U.S. state net operating loss and credit carryforwards attributable to various acquired companies of approximately $161 million and $39 million, respectively. If not used, our U.S. state net operating losses will expire between fiscal 2016 and 2032 and the majority of our U.S. state credit carryforwards can be carried forward indefinitely. In addition, we have foreign net operating loss carryforwards attributable to various acquired foreign companies of approximately $183 million net of valuation allowances, the majority of which, under current applicable foreign tax law, can be carried forward indefinitely.
In assessing the ability to realize our deferred tax assets, we considered whether it is more likely than not that some portion or all the deferred tax assets will not be realized. We considered the following: we have historical cumulative book income, as measured by the current and prior two years; we have strong, consistent taxpaying history; we have substantial U.S. federal income tax carryback potential; and we have substantial amounts of scheduled future reversals of taxable temporary differences from our deferred tax liabilities. We have concluded that this positive evidence outweighs the negative evidence and, thus, that the deferred tax assets as of April 3, 2015 are realizable on a “more likely than not” basis.
As of April 3, 2015, no provision has been made for federal or state income taxes on $3.6 billion of cumulative unremitted earnings of certain of our foreign subsidiaries since we plan to indefinitely reinvest these earnings. As of April 3, 2015, the unrecognized deferred tax liability for these earnings was approximately $1 billion.
70
The aggregate changes in the balance of gross unrecognized tax benefits were as follows:
Year Ended | |||||||||||
April 3, 2015 | March 28, 2014 | March 29, 2013 | |||||||||
(Dollars in millions) | |||||||||||
Balance at beginning of year | $ | 282 | $ | 412 | $ | 619 | |||||
Settlements with tax authorities | (150 | ) | (122 | ) | (114 | ) | |||||
Lapse of statute of limitations | (13 | ) | (11 | ) | (98 | ) | |||||
Increase related to prior period tax positions | 147 | 27 | 11 | ||||||||
Decrease related to prior period tax positions | (96 | ) | (50 | ) | (20 | ) | |||||
Increase related to current year tax positions | 23 | 26 | 14 | ||||||||
Net increase (decrease) | $ | (89 | ) | $ | (130 | ) | $ | (207 | ) | ||
Balance at end of year | $ | 193 | $ | 282 | $ | 412 | |||||
There was a change of $89 million in gross unrecognized tax benefits during the fiscal year as disclosed above. This gross liability does not include offsetting tax benefits associated with the correlative effects of potential transfer pricing adjustments, interest deductions, and state income taxes.
Of the total unrecognized tax benefits at April 3, 2015, $200 million, if recognized, would favorably affect the Company’s effective tax rate, while a $7 million offsetting impact would affect the cumulative translation adjustments. However, one or more of these unrecognized tax benefits could be subject to a valuation allowance if and when recognized in a future period, which could impact the timing of any related effective tax rate benefit.
At April 3, 2015, before any tax benefits, we had $18 million of accrued interest and penalties on unrecognized tax benefits. Interest included in our provision for income taxes was a benefit of approximately $12 million, offset by accruals of $6 million for the year ended April 3, 2015. If the accrued interest and penalties do not ultimately become payable, amounts accrued will be reduced in the period that such determination is made, and reflected as a reduction of the overall income tax provision.
We file income tax returns in the U.S. on a federal basis and in many U.S. state and foreign jurisdictions. Our most significant tax jurisdictions are the U.S., Ireland, and Singapore. Our tax filings remain subject to examination by applicable tax authorities for a certain length of time following the tax year to which those filings relate. Our fiscal years 2014 and 2015 remain subject to examination by the Internal Revenue Service (“IRS”) for U.S. federal tax purposes. Our fiscal years prior to 2014 have been settled and closed with the IRS. Our 2011 through 2015 fiscal years remain subject to examination by the appropriate governmental agencies for Irish tax purposes, and our 2014 through 2015 fiscal years remain subject to examination by the appropriate governmental agencies for Singapore tax purposes. Other significant jurisdictions include California, Japan, the UK, India and Australia. As of April 3, 2015, we have effectively settled Symantec U.S. federal income taxes for the fiscal years 2009 through 2013. In addition, we are under examination by the California Franchise Tax Board for the Symantec California income taxes for the 2009 through 2010 tax years. We are also under examination by the Indian income tax authorities for fiscal years 2004 through 2014 as well as the Australian income tax authorities for fiscal years 2011 through 2013.
In fiscal 2013, we resolved an IRS audit for the Veritas 2002 through 2005 tax years and executed the final closing agreement. Accordingly, we recorded a further tax benefit of $3 million in fiscal 2013 based on the closing agreement. We also amended our state tax returns for the Veritas 2002 through 2005 tax years in fiscal 2013 to reflect the adjustments in the closing agreement and remeasured our state liability resulting in a benefit of $7 million.
On September 3, 2013, we settled and effectively settled matters with the IRS for the Symantec 2005 through 2008 fiscal years. The result of the settlements, effective settlements, and re-measurements resulted in a reduction in the balance of our gross unrecognized tax benefits in fiscal year 2014 of $122 million.
On March 18, 2015, we settled and effectively settled matters with the IRS for the Symantec 2009 through 2013 fiscal years. The settlement and effective settlement resulted in a benefit to tax expense in fiscal year 2015 of $59 million. Additionally, the Company settled transfer price related matters of $158 million, a portion of which was accounted for against deferred tax liabilities on unremitted foreign earnings. The Company has paid in $155 million to cover the final tax and interest liability on the settlement.
The timing of the resolution of income tax examinations is highly uncertain, and the amounts ultimately paid, if any, upon resolution of the issues raised by the taxing authorities may differ materially from the amounts accrued for each year. Although potential resolution of uncertain tax positions involve multiple tax periods and jurisdictions, it is reasonably possible that the gross unrecognized tax benefits related to these audits could decrease (whether by payment, release, or a combination of both)
71
in the next 12 months by $44 million. Depending on the nature of the settlement or expiration of statutes of limitations, we estimate $44 million could affect our income tax provision and therefore benefit the resulting effective tax rate.
We continue to monitor the progress of ongoing income tax controversies and the impact, if any, of the expected tolling of the statute of limitations in various taxing jurisdictions.
Note 12. Earnings Per Share
Basic and diluted earnings per share are computed on the basis of the weighted-average number of shares of common stock outstanding during the period. Diluted earnings per share also include the incremental effect of dilutive potential common shares outstanding during the period using the treasury stock method. Dilutive potential common shares include the dilutive effect of shares underlying outstanding stock options, restricted stock, warrants, ESPP and convertible senior notes.
The components of earnings per share attributable to Symantec Corporation stockholders are as follows:
Year Ended | |||||||||||
April 3, 2015 | March 28, 2014 | March 29, 2013 | |||||||||
(In millions, except per share data) | |||||||||||
Net income | $ | 878 | $ | 898 | $ | 755 | |||||
Net income per share — basic | $ | 1.27 | $ | 1.29 | $ | 1.08 | |||||
Net income per share — diluted | $ | 1.26 | $ | 1.28 | $ | 1.06 | |||||
Weighted-average shares outstanding — basic | 689 | 696 | 701 | ||||||||
Dilutive potential shares from stock-based compensation | 7 | 8 | 10 | ||||||||
Weighted-average shares outstanding — diluted | 696 | 704 | 711 | ||||||||
Anti-dilutive effect of stock-based compensation and note hedge | 1 | 5 | 24 | ||||||||
Note 13. Subsequent Event
On January 24, 2011, a class action lawsuit was filed against the Company and its previous e-commerce vendor Digital River, Inc. Against the Company, the lawsuit alleged violations of California’s Unfair Competition Law, the California Legal Remedies Act and unjust enrichment related to prior sales of Extended Download Service and Norton Download Insurance. On March 31, 2014, the U.S. District Court for the District of Minnesota certified a class of all people who purchased these products between January 24, 2005, and March 10, 2011. In April 2015, we reached agreement in principle with the plaintiffs under which the Company will pay the plaintiffs $30 million. As we consider this settlement amount now estimable and probable, we have recorded it as an offset to revenue during the year ended April 3, 2015.
72
SIGNATURES
Pursuant to the requirements of Section 13 or 15(d) of the Securities Exchange Act of 1934, the Registrant has duly caused this report to be signed on its behalf by the undersigned, thereunto duly authorized, in the City of Mountain View, State of California, on the 22nd day of May 2015.
SYMANTEC CORPORATION | ||
By: | /s/ Michael A. Brown | |
Michael A. Brown President and Chief Executive Officer, and Director | ||
KNOW ALL PERSONS BY THESE PRESENTS, that each person whose signature appears below constitutes and appoints Michael A. Brown, Thomas J. Seifert and Scott C. Taylor, and each or any of them, his attorneys-in-fact, each with the power of substitution, for him in any and all capacities to sign any and all amendments to this report on Form 10-K and any other documents in connection therewith, with the Securities and Exchange Commission, granting unto said attorneys-in-fact, and each of them, full power and authority to do and perform each and every act and thing requisite and necessary to be done in and about the premises, as fully to all intents and purposes as he might or could do in person, hereby ratifying and confirming all that such attorneys-in-fact, or his or their substitute or substitutes, may lawfully do or cause to be done by virtue hereof. This Power of Attorney may be signed in several counterparts.
Pursuant to the requirements of the Securities Exchange Act of 1934, this report has been signed below by the following persons on behalf of the Registrant and in the capacities and on the dates indicated below.
Signature | Title | Date | ||
/s/ Michael A. Brown | President and Chief Executive Officer, and Director (Principal Executive Officer) | May 22, 2015 | ||
Michael A. Brown | ||||
/s/ Thomas J. Seifert | Executive Vice President and Chief Financial Officer (Principal Financial Officer) | May 22, 2015 | ||
Thomas J. Seifert | ||||
/s/ Mark S. Garfield | Senior Vice President and Chief Accounting Officer (Principal Accounting Officer) | May 22, 2015 | ||
Mark S. Garfield | ||||
/s/ Daniel H. Schulman | Chairman of the Board | May 22, 2015 | ||
Daniel H. Schulman | ||||
/s/ Frank E. Dangeard | Director | May 22, 2015 | ||
Frank E. Dangeard | ||||
/s/ Geraldine B. Laybourne | Director | May 22, 2015 | ||
Geraldine B. Laybourne | ||||
/s/ David L. Mahoney | Director | May 22, 2015 | ||
David L. Mahoney | ||||
/s/ Robert S. Miller | Director | May 22, 2015 | ||
Robert S. Miller | ||||
/s/ Anita M. Sands | Director | May 22, 2015 | ||
Anita M. Sands | ||||
/s/ V. Paul Unruh | Director | May 22, 2015 | ||
V. Paul Unruh | ||||
/s/ Suzanne M. Vautrinot | Director | May 22, 2015 | ||
Suzanne M. Vautrinot | ||||
73
EXHIBIT INDEX
Exhibit Number | Incorporated by Reference | Filed Herewith | ||||||||||
Exhibit Description | Form | File No. | Exhibit | Filing Date | ||||||||
3.01 | Amended and Restated Certificate of Incorporation of Symantec Corporation | S-8 | 333-119872 | 4.01 | 10/21/2004 | |||||||
3.02 | Certificate of Amendment of Amended and Restated Certificate of Incorporation of Symantec Corporation | S-8 | 333-126403 | 4.03 | 7/6/2005 | |||||||
3.03 | Certificate of Amendment to Amended and Restated Certificate of Incorporation of Symantec Corporation | 10-Q | 000-17781 | 3.01 | 8/5/2009 | |||||||
3.04 | Certificate of Designations of Series A Junior Participating Preferred Stock of Symantec Corporation | 8-K | 000-17781 | 3.01 | 12/21/2004 | |||||||
3.05 | Bylaws, as amended, of Symantec Corporation | 8-K | 000-17781 | 3.01 | 5/7/2012 | |||||||
4.01 | Form of Common Stock Certificate | S-3ASR | 333-139230 | 4.07 | 12/11/2006 | |||||||
4.02 | Credit Agreement, dated as of September 8, 2010, by and among Symantec Corporation, the lenders party thereto (the “Lenders”), Wells Fargo Bank, National Association, as Administrative Agent, Bank of America, N.A. and Citibank, N.A., as Co-Syndication Agents, JPMorgan Chase Bank, N.A. and Morgan Stanley Senior Funding, Inc., as Co-Documentation Agents, and Wells Fargo Securities, LLC, Banc of America Securities LLC and Citigroup Global Markets Inc., as Joint Bookrunners and Joint Lead Arrangers | 10-Q | 000-17781 | 4.01 | 11/3/2010 | |||||||
4.03 | First Amendment to Credit Agreement, dated June 7, 2012, by and among Symantec Corporation, Wells Fargo Bank, National Association, and the lenders party thereto | 8-K | 000-17781 | 4.01 | 6/11/2012 | |||||||
4.04 | Indenture, dated September 16, 2010, between Symantec Corporation and Wells Fargo Bank, National Association, as trustee | 8-K | 000-17781 | 4.01 | 9/16/2010 | |||||||
4.05 | Form of Global Note for Symantec’s 2.750% Senior Note due 2015 (contained in Exhibit No. 4.02) | 8-K | 000-17781 | 4.03 | 9/16/2010 | |||||||
4.06 | Form of Global Note for Symantec’s 4.200% Senior Note due 2020 (contained in Exhibit No. 4.02) | 8-K | 000-17781 | 4.04 | 9/16/2010 | |||||||
4.07 | Form of Global Note for Symantec’s 2.750% Senior Notes due 2017 (contained in Exhibit No. 4.02) | 8-K | 000-17781 | 4.03 | 6/14/2012 | |||||||
4.08 | Form of Global Note for Symantec’s 3.950% Senior Notes due 2022 (contained in Exhibit No. 4.02) | 8-K | 000-17781 | 4.04 | 6/14/2012 | |||||||
10.01(*) | Form of Indemnification Agreement with Officers and Directors, as amended (form for agreements entered into prior to January 17, 2006) | S-1 | 33-28655 | 10.17 | 6/21/1989 | |||||||
10.02(*) | Form of Indemnification Agreement for Officers, Directors and Key Employees | 8-K | 000-17781 | 10.01 | 1/23/2006 | |||||||
74
Exhibit Number | Incorporated by Reference | Filed Herewith | ||||||||||
Exhibit Description | Form | File No. | Exhibit | Filing Date | ||||||||
10.03(*) | Symantec Corporation 1996 Equity Incentive Plan, as amended, including form of Stock Option Agreement and form of Restricted Stock Purchase Agreement | 10-K | 000-17781 | 10.05 | 6/9/2006 | |||||||
10.04(*) | Symantec Corporation Deferred Compensation Plan, restated and amended January 1, 2010, as adopted December 15, 2009 | 10-K | 000-17781 | 10.05 | 5/24/2010 | |||||||
10.05(*) | Brightmail Inc. 1998 Stock Option Plan, including form of Stock Option Agreement and form of Notice of Assumption | 10-K | 000-17781 | 10.08 | 6/9/2006 | |||||||
10.06(*) | Symantec Corporation 2000 Director Equity Incentive Plan, as amended | 10-Q | 000-17781 | 10.01 | 11/1/2011 | |||||||
10.07(*) | Altiris, Inc. 2002 Stock Plan | S-8 | 333-141986 | 99.03 | 4/10/2007 | |||||||
10.08(*) | Form of Stock Option Agreement under the Altiris, Inc. 2002 Stock Plan | S-8 | 333-141986 | 99.04 | 4/10/2007 | |||||||
10.09(*) | Vontu, Inc. 2002 Stock Option/Stock Issuance Plan, as amended | S-8 | 333-148107 | 99.02 | 12/17/2007 | |||||||
10.10(*) | Form of Vontu, Inc. Stock Option Agreement | S-8 | 333-148107 | 99.03 | 12/17/2007 | |||||||
10.11(*) | Veritas Software Corporation 2003 Stock Incentive Plan, as amended and restated, including form of Stock Option Agreement, form of Stock Option Agreement for Executives and Senior VPs and form of Notice of Stock Option Assumption | 10-K | 000-17781 | 10.15 | 6/9/2006 | |||||||
10.12(*) | Symantec Corporation 2004 Equity Incentive Plan, as amended, including Stock Option Grant — Terms and Conditions, form of RSU Award Agreement, form of RSU Award Agreement for Non-Employee Directors and form of PRU Award Agreement | 10-K | 000-17781 | 10.17 | 5/20/2011 | |||||||
10.13(*) | Clearwell Systems, Inc. 2005 Stock Plan, as amended | S-8 | 333-175783 | 99.01 | 7/26/2011 | |||||||
10.14(*) | Form of Clearwell Systems, Inc. Stock Option Agreement | S-8 | 333-175783 | 99.02 | 7/26/2011 | |||||||
10.15(*) | Symantec Corporation 2008 Employee Stock Purchase Plan, as amended | S-8 | 333-191889 | 99.02 | 10/24/2013 | |||||||
10.16(*) | Symantec Corporation 2013 Equity Incentive Plan, including form of Stock Option Grant — Terms and Conditions and form of RSU Awards Agreement | 10-Q | 000-17781 | 10.01 | 2/3/2014 | |||||||
10.17(*) | Symantec Senior Executive Incentive Plan, as amended and restated | 8-K | 000-17781 | 10.03 | 10/25/2013 | |||||||
10.18(*) | Symantec Corporation Executive Retention Plan, as amended and restated | X | ||||||||||
10.19(*) | Symantec Corporation Executive Severance Plan | X | ||||||||||
10.20(*) | Offer Letter, dated February 8, 2006, from Symantec Corporation to James A. Beer | 10-K | 000-17781 | 10.17 | 6/9/2006 | |||||||
10.21(*) | Executive Employment Agreement, dated August 21, 2012, between Symantec Corporation and Steve Bennett | 8-K | 000-17781 | 10.01 | 8/23/2012 | |||||||
75
Exhibit Number | Incorporated by Reference | Filed Herewith | ||||||||||
Exhibit Description | Form | File No. | Exhibit | Filing Date | ||||||||
10.22(*) | Employment Offer Letter, dated December 19, 2012, between Symantec Corporation and Stephen Gillett | 8-K | 000-17781 | 10.01 | 12/19/2012 | |||||||
10.23(*) | Employment Offer Letter, dated January 15, 2014, between Symantec Corporation and Thomas J. Seifert | 8-K | 000-17781 | 10.01 | 3/3/2014 | |||||||
10.24(*) | Employment Offer Letter, dated February 3, 2014, between Symantec Corporation and Mark Garfield | 8-K | 000-17781 | 10.01 | 3/10/2014 | |||||||
10.25(*) | FY14 Executive Annual Incentive Plan — President and Chief Executive Officer | 10-Q | 000-17781 | 10.01 | 7/31/2013 | |||||||
10.26(*) | FY14 Executive Annual Incentive Plan — Vice President, Senior Vice President and Executive Vice President | 10-Q | 000-17781 | 10.02 | 7/31/2013 | |||||||
10.27(*) | Performance Contingent Stock Unit Award Agreement, dated May 30, 2013, by and between Symantec Corporation and Steve Bennett | 10-Q | 000-17781 | 10.03 | 7/31/2013 | |||||||
10.28 | Assignment of Copyright and Other Intellectual Property Rights, by and between Peter Norton and Peter Norton Computing, Inc., dated August 31, 1990 | S-4 | 33-35385 | 10.37 | 6/13/1990 | |||||||
10.29† | Environmental Indemnity Agreement, dated April 23, 1999, between Veritas and Fairchild Semiconductor Corporation, included as Exhibit C to that certain Agreement of Purchase and Sale, dated March 29, 1999, between Veritas and Fairchild Semiconductor of California | S-1/A | 333-83777 | 10.27 Exhibit C | 8/6/1999 | |||||||
10.30 | Amendment, dated June 20, 2007, to the Amended and Restated Agreement Respecting Certain Rights of Publicity dated as of August 31, 1990, by and between Peter Norton and Symantec Corporation | 10-Q | 000-17781 | 10.01 | 8/7/2007 | |||||||
10.31 | Amendment, effective December 6, 2010, to the Trademark License Agreement, dated August 9, 2010, by and between VeriSign, Inc. and Symantec Corporation | 10-Q | 000-17781 | 10.01 | 2/2/2011 | |||||||
10.32(*) | Executive Employment Agreement dated September 24, 2014 between Symantec Corporation and Michael A. Brown | 8-K | 000-17781 | 10.01 | 9/26/2014 | |||||||
10.33(*) | Amendment dated April 30, 2014 to Offer Letter between Symantec Corporation and Thomas J. Seifert | 10-Q | 000-17781 | 10.01 | 8/8/2014 | |||||||
10.34(*) | FY15 Executive Annual Incentive Plan - Senior Vice President and Executive Vice President | 10-Q | 000-17781 | 10.02 | 8/8/2014 | |||||||
10.35(*) | FY15 Executive Annual Incentive Plan - Chief Executive Officer | 10-Q | 000-17781 | 10.02 | 11/7/2014 | |||||||
21.01 | Subsidiaries of Symantec Corporation | X | ||||||||||
23.01 | Consent of Independent Registered Public Accounting Firm | X | ||||||||||
24.01 | Power of Attorney (see Signature page to this annual report) | X | ||||||||||
31.01 | Certification of Chief Executive Officer pursuant to Section 302 of the Sarbanes-Oxley Act of 2002 | X | ||||||||||
76
Exhibit Number | Incorporated by Reference | Filed Herewith | ||||||||||
Exhibit Description | Form | File No. | Exhibit | Filing Date | ||||||||
31.02 | Certification of Chief Financial Officer pursuant to Section 302 of the Sarbanes-Oxley Act of 2002 | X | ||||||||||
32.01(††) | Certification of Chief Executive Officer pursuant to Section 906 of the Sarbanes-Oxley Act of 2002 | X | ||||||||||
32.02(††) | Certification of Chief Financial Officer pursuant to Section 906 of the Sarbanes-Oxley Act of 2002 | X | ||||||||||
101.INS | XBRL Instance Document | X | ||||||||||
101.SCH | XBRL Taxonomy Schema Linkbase Document | X | ||||||||||
101.CAL | XBRL Taxonomy Calculation Linkbase Document | X | ||||||||||
101.LAB | XBRL Taxonomy Labels Linkbase Document | X | ||||||||||
101.PRE | XBRL Taxonomy Presentation Linkbase Document | X | ||||||||||
101.DEF | XBRL Taxonomy Definition Linkbase Document | X | ||||||||||
* Indicates a management contract, compensatory plan or arrangement.
† Filed by Veritas Software Corporation.
†† This exhibit is being furnished, rather than filed, and shall not be deemed incorporated by reference into any filing, in accordance with Item 601 of Regulation S-K.
77