Attached files
| file | filename |
|---|---|
| EX-3.2 - EXHIBIT 3.2 - PETMED EXPRESS INC | t82385_ex3-2.htm |
| EX-32.1 - EXHIBIT 32.1 - PETMED EXPRESS INC | t82385_ex32-1.htm |
| EX-31.2 - EXHIBIT 31.2 - PETMED EXPRESS INC | t82385_ex31-2.htm |
| EX-31.1 - EXHIBIT 31.1 - PETMED EXPRESS INC | t82385_ex31-1.htm |
| EX-21.1 - EXHIBIT 21.1 - PETMED EXPRESS INC | t82385_ex21-1.htm |
| EXCEL - IDEA: XBRL DOCUMENT - PETMED EXPRESS INC | Financial_Report.xls |
UNITED STATES
SECURITIES AND EXCHANGE COMMISSION
Washington, D.C. 20549
FORM 10-K
|
x ANNUAL REPORT PURSUANT TO SECTION 13 OR 15(d) OF THE SECURITIES EXCHANGE ACT OF 1934
|
|
For the fiscal year ended March 31, 2015
|
|
OR
|
|
o TRANSITION REPORT PURSUANT TO SECTION 13 OR 15(d) OF THE SECURITIES EXCHANGE ACT OF 1934
|
|
For the transition period from ___________ to ___________
|
Commission File Number 000-28827
PETMED EXPRESS, INC.
(Exact name of registrant as specified in its charter)
|
FLORIDA
|
65-0680967
|
|
(State or other jurisdiction of
|
(IRS Employer
|
|
incorporation or organization)
|
Identification No.)
|
|
1441 S.W. 29th Avenue, Pompano Beach, Florida 33069
|
|
|
(Address of principal executive offices) (Zip Code)
|
|
|
Registrant’s telephone number, including area code: (954) 979-5995
|
|
|
Securities registered under Section 12(b) of the Act:
|
|
|
Title of each class
|
Name of each exchange on which
registered |
|
COMMON STOCK, $.001 PAR VALUE
|
The NASDAQ Stock Market LLC
(NASDAQ Global Select Market)
|
|
Securities registered under Section 12(g) of the Act:
|
|
|
NONE
|
|
Indicate by check mark if the registrant is a well-known seasoned issuer, as defined in Rule 405 of the Securities Act. Yes o No x
Indicate by check mark if the registrant is not required to file reports pursuant to Section 13 or Section 15(d) of the Act. Yes o No x
Indicate by check mark whether the registrant (1) has filed all reports required to be filed by Section 13 or 15(d) of the Securities Exchange Act of 1934 during the preceding 12 months (or for such shorter period that the registrant was required to file such reports), and (2) has been subject to such filing requirements for the past 90 days. Yes x No o
Indicate by check mark whether the registrant has submitted electronically and posted on its corporate website, if any, every Interactive Data File required to be submitted and posted pursuant to Rule 405 of Regulation S-T (§ 232.405 of this chapter) during the preceeding12 months (or for such shorter period that the registrant was required to submit and post such files). Yes x No o
Indicate by check mark if disclosure of delinquent filers pursuant to Item 405 of Regulation S-K (§ 229.405 of this chapter) is not contained herein, and will not be contained, to the best of registrant’s knowledge, in definitive proxy or information statements incorporated by reference in Part III of this Form 10-K or any amendment to this Form 10-K. x
Indicate by check mark whether the registrant is a large accelerated filer, an accelerated filer, a non-accelerated filer, or a smaller reporting company. See definition of “accelerated filer”, “large accelerated filer”, and “smaller reporting company” in Rule 12b-2 of the Exchange Act.
| Large accelerated filer | o | Accelerated filer | x | |
| Non-accelerated filer | o | Smaller reporting company | o |
Indicate by check mark whether the registrant is a shell company (as defined in Rule 12b-2 of the Exchange Act). Yes o No x
The aggregate market value of the registrant’s Common Stock held by non-affiliates of the registrant as of September 30, 2014, the last business day of the registrant’s most recently completed second fiscal quarter, was $262.5 million based on the closing sales price of the registrant’s Common Stock on that date, as reported on the NASDAQ Global Select Market.
The number of shares of the registrant’s Common Stock outstanding as of May 22, 2015 was 20,259,359.
DOCUMENTS INCORPORATED BY REFERENCE
Information to be set forth in our Proxy Statement relating to our 2015 Annual Meeting of Stockholders to be held on July 24, 2015 is incorporated by reference in Items 10, 11, 12, 13, and 14 of Part III of this report.
PETMED EXPRESS, INC.
2015 Annual Report on Form 10-K
TABLE OF CONTENTS
|
Page
|
|||
|
PART I
|
1
|
||
|
Item 1.
|
Business
|
1
|
|
|
Item 1A.
|
Risk Factors
|
6
|
|
|
Item 1B.
|
Unresolved Staff Comments
|
10
|
|
|
Item 2.
|
Properties
|
10
|
|
|
Item 3.
|
Legal Proceedings
|
10
|
|
|
Item 4.
|
Mine Safety Disclosures
|
10
|
|
|
PART II
|
11
|
||
|
Item 5.
|
Market for Registrant’s Common Equity, Related Stockholder Matters and Issuer Purchases of Equity Securities
|
11
|
|
|
Item 6.
|
Selected Financial Data
|
14
|
|
|
Item 7.
|
Management’s Discussion and Analysis of Financial Condition and Results of Operations
|
15
|
|
|
Item 7A.
|
Quantitative and Qualitative Disclosures About Market Risk
|
21
|
|
|
Item 8.
|
Financial Statements and Supplementary Data
|
22
|
|
|
Item 9.
|
Changes in and Disagreements With Accountants on Accounting and Financial Disclosure
|
40
|
|
|
Item 9A.
|
Controls and Procedures
|
40
|
|
|
Item 9B.
|
Other Information
|
40
|
|
|
PART III
|
41
|
||
|
Item 10.
|
Directors, Executive Officers, and Corporate Governance
|
41
|
|
|
Item 11.
|
Executive Compensation
|
41
|
|
|
Item 12.
|
Security Ownership of Certain Beneficial Owners and Management and Related Stockholder Matters
|
41
|
|
|
Item 13.
|
Certain Relationships and Related Transactions, and Director Independence
|
41
|
|
|
Item 14.
|
Principal Accountant Fees and Services
|
41
|
|
|
PART IV
|
42
|
||
|
Item 15.
|
Exhibits, Financial Statement Schedules
|
42
|
|
|
SIGNATURES
|
43
|
PART I
CAUTIONARY STATEMENT REGARDING FORWARD-LOOKING INFORMATION
Certain information in this Annual Report on Form 10-K includes forward-looking statements within the meaning of Section 27A of the Securities Act of 1933 and Section 21E of the Securities Exchange Act of 1934. You can identify these forward-looking statements by the words “believes,” “intends,” “expects,” “may,” “will,” “should,” “plan,” “projects,” “contemplates,” “intends,” “budgets,” “predicts,” “estimates,” “anticipates,” or similar expressions. These statements are based on our beliefs, as well as assumptions we have used based upon information currently available to us. Because these statements reflect our current views concerning future events, these statements involve risks, uncertainties and assumptions. Actual future results may differ significantly from the results discussed in the forward-looking statements. A reader, whether investing in our common stock or not, should not place undue reliance on these forward-looking statements, which apply only as of the date of this Annual Report.
When used in this Annual Report on Form 10-K, “PetMed Express,” “1-800-PetMeds,” “PetMeds,” “PetMed,” “PetMeds.com,” “PetMed Express.com,” “the Company,” “we,” “our,” and “us” refer to PetMed Express, Inc. and our wholly-owned subsidiaries.
ITEM 1. BUSINESS
General
PetMed Express, Inc. and subsidiaries, d/b/a 1-800-PetMeds, is a leading nationwide pet pharmacy. The Company markets prescription and non-prescription pet medications, and other health products for dogs and cats, direct to the consumer. The Company offers consumers an attractive alternative for obtaining pet medications in terms of convenience, price, and speed of delivery.
The Company markets its products through national television, online, and direct mail/print advertising campaigns, which aim to increase the recognition of the “1-800-PetMeds” brand name, and “PetMeds” family of trademarks, increase traffic on its website at www.1800petmeds.com, acquire new customers, and maximize repeat purchases. Our fiscal year end is March 31, our executive offices are located at 1441 S.W. 29th Avenue, Pompano Beach, Florida 33069, and our telephone number is (954) 979-5995.
Our Products
We offer a broad selection of products for dogs and cats. Our current product line contains approximately 3,000 SKUs of the most popular pet medications, health products, and supplies. These products include a majority of the well-known brands of medication, such as Frontline Plus®, K9 Advantix® II, Advantage® II, Heartgard Plus®, Sentinel®, Revolution®, and Rimadyl®. Generally, our prices are competitive with the prices for medications charged by veterinarians and retailers. In March 2010, we started offering for sale additional pet supplies on our website, which are drop shipped to our customers by third parties. These pet supplies include: food, beds, crates, stairs, strollers, and other popular pet supplies.
We research new products, and regularly select new products or the latest generation of existing products to become part of our product selection. In addition, we also refine our current products to respond to changing consumer-purchasing habits. Our website is designed to give us the flexibility to change featured products or promotions. Our product line provides customers with a wide variety of selections across the most popular health categories for dogs and cats. Our current products include:
Non-Prescription Medications (OTC) and supplies: Flea and tick control products, bone and joint care products, vitamins, treats, nutritional supplements, hygiene products, and supplies.
Prescription Medications (Rx): Heartworm preventatives, arthritis, thyroid, diabetes, pain medications, antibiotics, and other specialty medications, as well as generic substitutes.
| 1 |
Sales
We offer our products through three main sales channels: Internet through our website, telephone contact center through our toll-free number, and direct mail/print through 1-800-PetMeds catalogs, brochures, and postcards. We have designed our website and catalogs to provide a convenient, cost-effective, and informative shopping experience that encourages consumers to purchase products important for a pet’s health and quality of life. We believe that these multiple channels allow us to increase the visibility of our brand name and provide our customers with increased shopping flexibility and excellent service. For the fiscal year approximately 50% of our sales were over-the-counter non-prescription medications and supplies, with the remaining portion being prescription medications.
Internet
We seek to combine our product selection and pet health information with the shopping ease of the Internet to deliver a convenient and personalized shopping experience. Our website offers health and nutritional product selections for dogs and cats, and relevant editorial and easily obtainable or retrievable resource information. From our home page, customers can search our website for products and access resources on a variety of information on dogs and cats. Customers can shop at our website by category, product line, individual product, or symptom. We attracted approximately 30 million visitors to our website during fiscal 2015, approximately 9% of those visitors placed an order, and our website generated approximately 80% of our total sales for the same time period. On our website pet owners have access to health information covering pets’ behavior and illnesses, and natural and pharmaceutical remedies specifically for a pet’s problem. The pet education content on our main website is periodically updated with the latest research for pet owners.
Telephone Contact Center
Our customer care representatives receive and process inbound and outbound customer calls, facilitate our live web chat, and process customer e-mails. Our telephone system is equipped with certain features including pop-up screens and call blending capabilities that give us the ability to efficiently utilize our customer care representatives’ time, providing excellent customer care, service, and support. Our customer care representatives receive a base salary and are rewarded with commissions for sales, and bonuses and other awards for achieving certain quality goals.
Direct Mail/Print
The 1-800-PetMeds catalog is a full-color catalog that features our most popular products. The catalog is produced by a combination of in-house writers, production artists, and independent contractors. We mail catalogs, brochures, and postcards in response to requests generated from our advertising and as part of direct mail campaigns to our customers.
Our Customers
Approximately 2.5 million customers have purchased from us within the last two years. We attracted approximately 529,000 and 597,000 new customers in fiscal 2015 and 2014, respectively. Our customers are located throughout the United States, with approximately 50% of customers residing in California, Florida, New York, Texas, Pennsylvania, Virginia, North Carolina, and New Jersey. Our primary focus has been on retail customers and the average purchase was approximately $77 for fiscal 2015 compared to $75 for fiscal 2014.
Marketing
The goal of our marketing strategy is to build brand recognition, increase customer traffic, add new customers, build strong customer loyalty, maximize reorders, and develop incremental revenue opportunities. We have an integrated marketing campaign that includes television advertising, online marketing, direct mail/print and e-mail.
| 2 |
Television Advertising
Our television advertising is designed to build brand equity, create brand awareness, and generate initial purchases of products via the telephone and the Internet. We have used :30 and :15 second television commercials to attract new customer orders. Our television commercials typically focus on our ability to rapidly deliver to customers the same medications offered by veterinarians, but at reduced prices. We generally purchase advertising to target our key demographic group – women, ages 30 to 65. We believe that television advertising is particularly effective and instrumental in building brand awareness.
Online Marketing
We supplement our traditional advertising with online advertising and marketing efforts. We make our brand available to Internet consumers by purchasing targeted keywords and achieving prominent placement on the top search engines and search engine networks, including Google, Bing™, and Yahoo®. We utilize Internet display and video advertisements, social media, and comparison shopping, and we are also members of the LinkShare Network, which is an affiliate program with merchant clients and affiliate websites.
Direct Mail/Print and E-mail
We use direct mail/print and e-mail to acquire new customers and to remind our existing customers to reorder.
Operations
Order Processing
Our website allows customers to easily browse and purchase all of our products online. Our website is designed to be fast, secure, and easy to use with order and shipping confirmations, and with online order tracking capabilities. We provide our customers with toll-free telephone access to our customer care representatives. Our call center generally operates from 8:00 AM to 11:00 PM, Monday through Thursday, 8:00 AM to 9:00 PM on Friday, 9:00 AM to 6:00 PM on Saturday, and 10:00 AM to 5:00 PM on Sunday, Eastern Time. The process of customers purchasing products from 1-800-PetMeds consists of a few simple steps. A customer first places an order online or a call to our toll-free telephone number. The following information is needed to process prescription orders: pet information, prescription information, and the veterinarian’s name and phone number. This information is entered into our computer system. Then our pharmacists and pharmacy technicians verify all prescriptions. The order process system checks for the verification for prescription medication orders and a valid payment method for all orders. An invoice is generated and printed in our fulfillment center, where items are picked, and then shipped via United States Postal Service, Federal Express, or UPS. Our customers enjoy the convenience of rapid home delivery, with approximately 79% of all orders being shipped within 24 hours of ordering.
Customer Care and Support
We believe that a high level of customer care and support is critical in retaining and expanding our customer base. Customer care representatives participate in ongoing training programs under the supervision of our training managers. These training sessions include a variety of topics such as product knowledge, computer usage, customer service tips, and the relationship between our Company and veterinarians. Our customer care representatives respond to customers’ e-mails, calls, and live chats that are related to products, order status, prices, and shipping. We believe our customer care representatives are a valuable source of feedback regarding customer satisfaction.
Warehousing and Shipping
We inventory our products and fill most customer orders from our corporate headquarters in Pompano Beach, Florida. We have an in-house fulfillment and distribution operation, which is used to manage the entire supply chain, beginning with the placement of the order, continuing through order processing, and then fulfilling and shipping of the product to the customer. We offer a variety of shipping options, including next day delivery. We ship to anywhere in the United States served by the United States Postal Service, Federal Express, or UPS. Priority orders are expedited in our fulfillment process. Our goal is to ship the products the same day that the order is received. For prescription medications, our goal is to ship the product immediately after the prescription has been authorized by the customer’s veterinarian.
| 3 |
Purchasing
We purchase our products from a variety of sources, including certain manufacturers, domestic distributors, and wholesalers. There were four suppliers from whom we purchased approximately 50% of all products in fiscal 2015. We purchase the majority of the health and nutritional supplements directly from manufacturers. We believe having strong relationships with product manufacturers will ensure the availability of an adequate volume of products ordered by our customers, and will enable us to provide more and better product information. Historically, substantially all the major manufacturers of prescription and non-prescription medications have declined to sell these products to direct marketing companies, such as our Company. (See Risk Factors.) Part of our growth strategy includes developing direct relationships with the leading pharmaceutical manufacturers of the more popular prescription and non-prescription medications.
Technology
We utilize integrated technologies in our call centers, e-commerce, order entry, and inventory control/fulfillment operations. Our systems are custom configured by the Company to optimize our computer telephone integration and mail-order processing. The systems are designed to maintain a large database of specialized information and process a large volume of orders efficiently and effectively. Our systems provide our customer care representatives, and our customers on our website, with real time product availability information and updated customer information to enhance our customer care. We also have an integrated direct connection for processing credit cards to ensure that a valid credit card number and authorization have been received at the same time our customer care representatives are on the phone with the customer or when a customer submits an order on our website. Our information systems provide our customer care representatives with records of all prior contact with a customer, including the customer’s address, phone number, e-mail address, prescription information, order history, payment history, and notes.
Competition
The pet medications market is competitive and highly fragmented. Our competitors consist of veterinarians, and online and traditional retailers. We believe that the following are the principal competitive factors in our market:
|
|
●
|
Product selection and availability, including the availability of prescription and non-prescription medications;
|
|
|
●
|
Brand recognition;
|
|
|
●
|
Reliability and speed of delivery;
|
|
|
●
|
Personalized service and convenience;
|
|
|
●
|
Price; and
|
|
|
●
|
Quality of website content.
|
We compete with veterinarians for the sale of prescription and non-prescription pet medications and other health products. Many pet owners may prefer the convenience of purchasing their pet medications or other health products at the time of a veterinarian visit. In order to effectively compete with veterinarians, we must continue to educate pet owners about the service, convenience, and savings offered by our Company.
According to the American Pet Products Manufacturers Association, pet spending in the United States increased 4.2% to $58.0 billion in 2014. Pet supplies and medications represented $13.8 billion, or 24% of the total spending on pets in the United States. The pet medication market that we participate in is estimated to be approximately $4.0 billion, with veterinarians having the majority of the market share. The dog and cat population is approximately 164 million, with approximately 65% of all households having a pet.
We believe that the following are the main competitive strengths that differentiate 1-800-PetMeds from the competition:
|
|
●
|
Channel leader, in an estimated $4.0 billion industry;
|
|
|
●
|
“1-800-PetMeds” brand name;
|
|
|
●
|
Licensed pharmacy to conduct business in 50 states, and awarded Vet-VIPPSCM (Veterinary-Verified Internet Pharmacy Practice Site) accreditation by the National Association of Boards of Pharmacy®;
|
|
|
●
|
Exceptional customer care and support
|
| 4 |
Intellectual Property
We conduct our business under the trade name “1-800-PetMeds” and use a family of trade names all containing the term “PetMeds” or “PetMed” in some form. We believe the “1-800-PetMeds” trade name, which is also our toll-free telephone number, and the “PetMeds” family of trademarks, has added significant value and is an important factor in the marketing of our products. We have also obtained the right to use and control the Internet addresses www.1800petmeds.com, www.1888petmeds.com, www.petmedexpress.com, www.petmed.com, and www.petmeds.com. We do not expect to lose the ability to use the Internet addresses; however, there can be no assurance in this regard and the loss of these addresses may have a material adverse effect on our financial position and results of operations. We are the exclusive owners of United States Trademark Registrations for “PetMed Express and Design®,” “1888PetMeds and Design®,” “1-800-PetMeds and Design®,” 1-800-PetMeds®,” and “PetMeds®.”
Government Regulation
Dispensing prescription medications is governed at the state level by Boards of Pharmacy, or similar regulatory agencies, of each state where prescription medications are dispensed. We are subject to regulation by the State of Florida and are licensed as a community pharmacy by the Florida Board of Pharmacy. Our current license is valid until February 28, 2017, and prior to that date a renewal application will be submitted to the Board of Pharmacy. During fiscal 2015 we obtained a federal registration, and state registrations/permits as required, to dispense Schedule IV controlled substances, Our pharmacy practice is also licensed and/or regulated by 49 other state pharmacy boards and the United States Drug Enforcement Administration, and with respect to our products, by other regulatory authorities including, but not necessarily limited to, the United States Food and Drug Administration (“FDA”) and the United States Environmental Protection Agency. As a licensed pharmacy in the State of Florida, we are subject to the Florida Pharmacy Act and regulations promulgated thereunder. To the extent that we are unable to maintain our license as a community pharmacy with the Florida Board of Pharmacy, or if we do not maintain the licenses granted by other state pharmacy boards, or if we become subject to actions by the FDA, or other enforcement regulators, our distribution of prescription medications to pet owners could cease, which could have a material adverse effect on our financial condition and results of operations.
Employees
We currently have 182 full time employees, including: 106 in customer care and marketing; 31 in fulfillment and purchasing; 34 in our pharmacy; 3 in information technology; 3 in administrative positions; and 5 in management. None of our employees are represented by a labor union, or governed by any collective bargaining agreements. We consider relations with our employees to be satisfactory.
Available Information
We file annual, quarterly, and current reports, proxy statements, and other information with the Securities and Exchange Commission (“SEC”). Our SEC filings, including our annual reports on Form 10-K, quarterly reports on Form 10-Q, current reports on Form 8-K, and any amendments to those reports filed or furnished pursuant to the Exchange Act are available free of charge over the Internet on our website at www.1800petmeds.com or at the SEC’s web site at www.sec.gov. Our SEC filings will be available through our website as soon as reasonably practicable after we have electronically filed or furnished them to the SEC. Information contained on our website is not incorporated by reference into this Annual Report on Form 10-K.
| 5 |
ITEM 1A. RISK FACTORS
You should carefully consider the risks and uncertainties described below, and all the other information included in this Annual Report on Form 10-K before you decide to invest in our common stock. Any of the following risks could materially adversely affect our business, financial condition, or operating results and could result in a loss of your investment.
We may inadvertently fail to comply with various state or federal regulations covering the dispensing of prescription pet medications which may subject us to reprimands, sanctions, probations, fines, suspensions, or the loss of one or more of our pharmacy licenses.
The sale and delivery of prescription pet medications is generally governed by state laws and state regulations, and with respect to controlled substances, by federal law. Since our pharmacy is located in the State of Florida, the Company is governed by the laws and regulations of the State of Florida. Each prescription pet medication sale we make is likely also to be covered by the laws of the state where the customer is located. The laws and regulations relating to the sale and delivery of prescription pet medications vary from state to state, but generally require that prescription pet medications be dispensed with the authorization from a prescribing veterinarian. To the extent that we are unable to maintain our license as a community pharmacy with the Florida Board of Pharmacy, or if we do not maintain the licenses granted by other state boards, or if we become subject to actions by the FDA, or other enforcement regulators, our dispensing of prescription medications to pet owners could cease, which could have a material adverse effect on our operations.
The Company is a party to routine litigation and administrative complaints incidental to its business. Management does not believe that the resolution of any or all of such routine litigation and administrative complaints is likely to have a material adverse effect on the Company’s financial condition or results of operations. While we make every effort to fully comply with all applicable state rules, laws, and regulations, from time to time we have been the subject of administrative complaints regarding the authorization of prescriptions prior to shipment. We cannot assure you that we will not continue to be the subject of administrative complaints in the future. We cannot guarantee you that we will not be subject to reprimands, sanctions, probations, or fines, or that one or more of our pharmacy licenses will not be suspended or revoked. If we were unable to maintain our license as a community pharmacy in the State of Florida, or if we are not granted licensure in a state that begins to require licensure, or if one or more of the licenses granted by other state boards should be suspended or revoked, our ability to continue to sell prescription medications and to continue our business as it is presently conducted could be in jeopardy.
We currently purchase a portion of our prescription and non-prescription medications from third party distributors and we are not an authorized distributor of these products. We do not have any guaranteed supply of medications at any pre-established prices.
The majority of our sales were attributable to sales of prescription and non-prescription medications. Historically, substantially all the major pharmaceutical manufacturers have declined to sell prescription and non-prescription pet medications directly to us. In order to assure a supply of these products, we purchase medications from various secondary sources, including a variety of domestic distributors. Our business strategy includes seeking to establish direct purchasing arrangements with major pet pharmaceutical manufacturing companies. If we are not successful in achieving this goal, we will continue to rely upon secondary sources.
We cannot guarantee that if we continue to purchase prescription and non-prescription pet medications from secondary sources that we will be able to purchase an adequate supply to meet our customers’ demands, or that we will be able to purchase these products at competitive prices. As these products represent a significant portion of our sales, our failure to fill customer orders for these products could adversely impact our sales. If we are forced to pay higher prices for these products to ensure an adequate supply, we cannot guarantee that we will be able to pass along to our customers any increases in the prices we pay for these medications. This inability to pass along increased prices could materially adversely affect our financial condition and results of operations.
| 6 |
Our failure to properly manage our inventory may result in excessive inventory carrying costs, or inadequate supply of products, which could materially adversely affect our financial condition and results of operations.
Our current product line contains approximately 3,000 SKUs. A significant portion of our sales is attributable to products representing approximately 100 SKUs, including the most popular flea and tick, and heartworm preventative brands. We need to properly manage our inventory to provide an adequate supply of these products and avoid excessive inventory of the products representing the balance of the SKUs. We generally place orders for products with our suppliers based upon our internal estimates of the amounts of inventory we will need to fill future orders. These estimates may be significantly different from the actual orders we receive.
In the event that subsequent orders fall short of original estimates, we may be left with excess inventory. Significant excess inventory could result in price discounts and increased inventory carrying costs. Similarly, if we fail to have an adequate supply of some SKUs, we may lose sales opportunities. We cannot guarantee that we will maintain appropriate inventory levels. Any failure on our part to maintain appropriate inventory levels may have a material adverse effect on our financial condition and results of operations.
Resistance from veterinarians to authorize prescriptions, or attempts/efforts on their part to discourage pet owners to purchase from internet mail-order pharmacies could cause our sales to decrease and could materially adversely affect our financial condition and results of operations.
Since we began our operations some veterinarians have resisted providing our customers with a copy of their pet’s prescription or authorizing the prescription to our pharmacy staff, thereby effectively preventing us from filling such prescriptions under state law. We have also been informed by customers and consumers that veterinarians have tried to discourage pet owners from purchasing from internet mail-order pharmacies. Sales of prescription medications represented approximately 50% of our sales for the fiscal year. Although veterinarians in some states are required by law to provide a pet owner with a prescription if medically appropriate, if the number of veterinarians who refuse to authorize prescriptions should increase, or if veterinarians are successful in discouraging pet owners from purchasing from internet mail-order pharmacies, our sales could decrease and our financial condition and results of operations may be materially adversely affected.
Significant portions of our sales are made to residents of eight states. If we should lose our pharmacy license in one or more of these states, our financial condition and results of operations would be materially adversely affected.
While we ship pet medications to customers in all 50 states, approximately 50% of our sales for the fiscal year ended March 31, 2015 were made to customers located in the states of California, Florida, New York, Texas, Pennsylvania, Virginia, North Carolina, and New Jersey. If for any reason our license to operate a pharmacy in one or more of those states should be suspended or revoked, or if it is not granted or renewed, our ability to sell prescription medications to residents of those states would cease and our financial condition and results of operations in future periods would be materially adversely affected.
We face significant competition from veterinarians and online and traditional retailers and may not be able to compete profitably with them.
We compete directly and indirectly with veterinarians for the sale of pet medications and other health products. Veterinarians hold a competitive advantage over us because many pet owners may find it more convenient or preferable to purchase these products directly from their veterinarians at the time of an office visit. We also compete directly and indirectly with both online and traditional retailers. Both online and traditional retailers may hold a competitive advantage over us because of longer operating histories, established brand names, greater resources, and/or an established customer base. Online retailers may have a competitive advantage over us because of established affiliate relationships to drive traffic to their website. Traditional retailers may hold a competitive advantage over us because pet owners may prefer to purchase these products from a store instead of online or through catalog or telephone methods. In order to effectively compete in the future, we may be required to offer promotions and other incentives, which may result in lower operating margins and adversely affect the results of operations.
We also face a significant challenge from our competitors forming alliances with each other, such as those between online and traditional retailers. These relationships may enable both their retail and online stores to negotiate better pricing and better terms from suppliers by aggregating the demand for products and negotiating volume discounts, which could be a competitive disadvantage to us.
| 7 |
The content of our website could expose us to various kinds of liability, which, if prosecuted successfully, could negatively impact our business.
Because we post product and pet health information and other content on our website, we face potential liability for negligence, copyright infringement, patent infringement, trademark infringement, defamation, and/or other claims based on the nature and content of the materials we post. Various claims have been brought, and sometimes successfully prosecuted, against Internet content distributors. We could be exposed to liability with respect to the unauthorized duplication of content or unauthorized use of other parties’ proprietary technology. Although we maintain general liability insurance, our insurance may not cover potential claims of this type, or may not be adequate to indemnify us for all liability that may be imposed. Any imposition of liability that is not covered by insurance, or is in excess of insurance coverage, could materially adversely affect our financial condition and results of operations.
We may not be able to protect our intellectual property rights, and/or we may be found to infringe on the proprietary rights of others.
We rely on a combination of trademarks, trade secrets, copyright laws, and contractual restrictions to protect our intellectual property rights. These afford only limited protection. Despite our efforts to protect our proprietary rights, unauthorized parties may attempt to copy our non-prescription private label generic equivalents, when and if developed, as well as aspects of our sales formats, or to obtain and use information that we regard as proprietary, including the technology used to operate our website and our content, and our trademarks. Litigation or proceedings before the United States Patent and Trademark Office or other bodies may be necessary in the future to enforce our intellectual property rights, to protect our trade secrets and domain names, or to determine the validity and scope of the proprietary rights of others. Any litigation or adverse proceeding could result in substantial costs and diversion of resources, and could seriously harm our business and operating results. Third parties may also claim infringement by us with respect to past, current, or future technologies. We expect that participants in our market will be increasingly involved in infringement claims as the number of services and competitors in our industry segment grows. Any claim, whether meritorious or not, could be time-consuming, result in costly litigation, cause service upgrade delays, or require us to enter into royalty or licensing agreements. These royalty or licensing agreements might not be available on terms acceptable to us or at all.
If we are unable to protect our Internet addresses or to prevent others from using Internet addresses that are confusingly similar, our business may be adversely impacted.
Our Internet addresses, www.1800petmeds.com, www.1888petmeds.com, www.petmedexpress.com, www.petmed.com, and www.petmeds.com are critical to our brand recognition and our overall success. If we are unable to protect these Internet addresses, our competitors could capitalize on our brand recognition. There may be similar Internet addresses used by competitors. Governmental agencies and their designees generally regulate the acquisition and maintenance of Internet addresses. The regulation of Internet addresses in the United States and in foreign countries has changed, and may undergo further change in the near future. Furthermore, the relationship between regulations governing Internet addresses and laws protecting trademarks and similar proprietary rights is unclear. Therefore, we may not be able to protect our own Internet addresses, or prevent third parties from acquiring Internet addresses that are confusingly similar to, infringe upon, or otherwise decrease the value of our Internet addresses.
Since all of our operations are housed in a single location, we are more susceptible to business interruption in the event of damage to or disruptions in our facility.
Our headquarters and distribution center are located in two buildings in one location in South Florida, and most of our shipments of products to our customers are made from this sole distribution center. We have no present plans to establish any additional distribution centers or offices. Because we consolidate our operations in one location, we are more susceptible to power and equipment failures, and business interruptions in the event of fires, floods, and other natural disasters than if we had additional locations. Furthermore, because we are located in South Florida, which is a hurricane-sensitive area, we are particularly susceptible to the risk of damage to, or total destruction of, our headquarters and distribution center and surrounding transportation infrastructure caused by a hurricane. We cannot assure you that we are adequately insured to cover the amount of any losses relating to any of these potential events, business interruptions resulting from damage to or destruction of our headquarters and distribution center, or power and equipment failures relating to our call center or websites, or interruptions or disruptions to major transportation infrastructure, or other events that do not occur on our premises. The occurrence of one or more of these events could adversely impact our ability to generate revenues in future periods.
| 8 |
Our operating results are difficult to predict and may fluctuate, and a portion of our sales are seasonal.
Factors that may cause our operating results to fluctuate include:
|
|
●
|
Our ability to obtain new customers at a reasonable cost, retain existing customers, or encourage reorders;
|
|
|
●
|
Our ability to increase the number of visitors to our website, or our ability to convert visitors to our website into customers;
|
|
|
●
|
The mix of medications and other pet products sold by us;
|
|
|
●
|
Our ability to manage inventory levels or obtain an adequate supply of products;
|
|
|
●
|
Our ability to adequately maintain, upgrade, and develop our website, the systems that we use to process customers’ orders and payments, or our computer network;
|
|
|
●
|
Increased competition within our market niche;
|
|
|
●
|
Price competition;
|
|
|
●
|
New products introduced to the market, including generics;
|
|
|
●
|
Increases in the cost of advertising;
|
|
|
●
|
The amount and timing of operating costs and capital expenditures relating to expansion of our product line or operations;
|
|
|
●
|
Disruption of our toll-free telephone service, technical difficulties, or systems and Internet outages or slowdowns; and
|
|
|
●
|
Unfavorable general economic trends.
|
Because our operating results are difficult to predict, we believe that quarter-to-quarter comparisons of our operating results are not a good indication of our future performance. The majority of our product sales are affected by the seasons, due to the seasonality of mainly heartworm, and flea and tick medications. For the quarters ended June 30, 2014, September 30, 2014, December 31, 2014, and March 31, 2015, Company sales were 32%, 25%, 21%, and 22%, respectively. In addition to the seasonality of our sales, our annual and quarterly operating results have fluctuated in the past and may fluctuate significantly in the future due to a variety of factors, including weather, many of which are out of our control. Any change in one or more of these factors could materially adversely affect our financial condition and results of operations in future periods.
Our stock price fluctuates from time to time and may fall below expectations of securities analysts and investors, and could subject us to litigation, which may result in you suffering a loss on your investment.
The market price of our common stock may fluctuate significantly in response to a number of factors, many of which are out of our control. These factors include: quarterly variations in operating results; changes in accounting treatments or principles; announcements by us or our competitors of new products and services offerings; significant contracts, acquisitions, or strategic relationships; additions or departures of key personnel; any future sales of our common stock or other securities; stock market price and volume fluctuations of publicly-traded companies; and general political, economic, and market conditions.
In some future quarter our operating results may fall below the expectations of securities analysts and investors, which could result in a decrease in the trading price of our common stock. In the past, securities class action litigation has often been brought against a company following periods of volatility in the market price of its securities. We may be the target of similar litigation in the future. Securities litigation could result in substantial costs and divert management’s attention and resources, which could seriously harm our business and operating results.
We may issue additional shares of preferred stock that could defer a change of control or dilute the interests of our common stockholders. Our charter documents could defer a takeover effort which could inhibit your ability to receive an acquisition premium for your shares.
Our charter permits our Board of Directors to issue up to 5.0 million shares of preferred stock without stockholder approval. Currently there are 2,500 shares of our Convertible Preferred Stock issued and outstanding. This leaves a little less than 5.0 million shares of preferred stock available for issuance at the discretion of our Board of Directors. These shares, if issued, could contain dividend, liquidation, conversion, voting, or other rights which could adversely affect the rights of our common stockholders and which could also be utilized, under some circumstances, as a method of discouraging, delaying, or preventing a change in control. Provisions of our articles of incorporation, bylaws and Florida law could make it more difficult for a third party to acquire us, even if many of our stockholders believe it is in their best interest.
| 9 |
A failure of our information systems or any security breach or unauthorized disclosure of confidential information could have a material adverse effect on our business.
Our business is dependent upon the efficient operation of our information systems. In particular, we rely on our information systems to effectively manage our business model strategy, with tools to track and manage sales, inventory, marketing, customer service efforts, the preparation of our consolidated financial and operating data, credit card information, and customer information. The failure of our information systems to perform as designed or the failure to maintain and enhance or protect the integrity of these systems could disrupt our business operations, adversely impact sales and the results of operations, expose us to customer or third-party claims, or result in adverse publicity. Additionally, we collect, process, and retain sensitive and confidential customer information in the normal course of our business. Despite the security measures we have in place and any additional measures we may implement in the future, our facilities and systems, and those of our third-party service providers, could be vulnerable to security breaches, computer viruses, lost or misplaced data, programming errors, human errors, acts of vandalism, or other events. Any security breach or event resulting in the misappropriation, loss, or other unauthorized disclosure of confidential information, whether by us directly or our third-party service providers, could damage our reputation, expose us to the risks of litigation and liability, disrupt our business, or otherwise affect our results of operations.
ITEM 1B. UNRESOLVED STAFF COMMENTS
None
ITEM 2. PROPERTIES
Our facilities, including our principal executive offices, are located at 1441 S.W. 29th Avenue and 2900 Gateway Drive, Pompano Beach, Florida 33069. The Company leases its 65,300 square foot executive offices, warehouse facility and customer service and pharmacy contact centers under a non-cancelable operating lease, through December 1, 2016. The Company is responsible for certain maintenance costs, taxes, and insurance under this lease. The future minimum annual lease payments are as follows: $781,000 for fiscal 2016 and $519,000 for fiscal 2017, for a lease payment total of $1.3 million. Rent expense was $794,000, $785,000, and $767,000 for the fiscal years ended March 31, 2015, 2014 and 2013, respectively. We believe that our facilities are sufficient for our current needs and are in good condition in all material respects.
ITEM 3. LEGAL PROCEEDINGS
The Company has settled complaints that had been filed with various states’ pharmacy boards in the past. There can be no assurances made that other states will not attempt to take similar actions against the Company in the future. The Company initiates litigation to protect its trade or service marks. There can be no assurance that the Company will be successful in protecting its trade or service marks. Legal costs related to the above matters are expensed as incurred.
ITEM 4. MINE SAFETY DISCLOSURES
Not applicable.
| 10 |
PART II
ITEM 5. MARKET FOR REGISTRANT’S COMMON EQUITY, RELATED STOCKHOLDER MATTERS AND ISSUER PURCHASES OF EQUITY SECURITIES
Our common stock is traded on the NASDAQ Global Select Market (“NASDAQ”) under the symbol “PETS.” The prices set forth below reflect the range of high and low closing sale prices per share in each of the quarters of fiscal 2015 and 2014 as reported by the NASDAQ.
|
Fiscal 2015:
|
High
|
Low
|
||||||
|
First Quarter
|
$ | 13.80 | $ | 12.63 | ||||
|
Second Quarter
|
$ | 14.54 | $ | 13.24 | ||||
|
Third Quarter
|
$ | 14.72 | $ | 12.56 | ||||
|
Fourth Quarter
|
$ | 16.59 | $ | 14.04 | ||||
|
Fiscal 2014:
|
High
|
Low
|
||||||
|
First Quarter
|
$ | 13.73 | $ | 12.37 | ||||
|
Second Quarter
|
$ | 17.17 | $ | 12.82 | ||||
|
Third Quarter
|
$ | 16.94 | $ | 14.58 | ||||
|
Fourth Quarter
|
$ | 16.65 | $ | 12.62 | ||||
There were 87 holders of record of our common stock at May 22, 2015, and approximately 19,000 of our holders are “street name” or beneficial holders, whose shares are held by banks, brokers, or other financial institutions.
During fiscal 2014 and 2015, our Board of Directors declared the following dividends:
|
Declaration Date
|
Per Share
Dividend
|
Record Date
|
Total Amount
(In thousands)
|
Payment Date
|
||||||
|
May 3, 2013
|
$ | 0.150 |
May 15, 2013
|
$ | 3,016 |
May 24, 2013
|
||||
|
July 26, 2013
|
$ | 0.170 |
August 12, 2013
|
$ | 3,433 |
August 23, 2013
|
||||
|
October 28, 2013
|
$ | 0.170 |
November 8, 2013
|
$ | 3,432 |
November 22, 2013
|
||||
|
January 30, 2014
|
$ | 0.170 |
February 12, 2014
|
$ | 3,432 |
February 21, 2014
|
||||
|
May 2, 2014
|
$ | 0.170 |
May 14, 2014
|
$ | 3,432 |
May 23, 2014
|
||||
|
July 21, 2014
|
$ | 0.170 |
August 4, 2014
|
$ | 3,446 |
August 15, 2014
|
||||
|
October 20, 2014
|
$ | 0.170 |
November 3, 2014
|
$ | 3,445 |
November 14, 2014
|
||||
|
January 20, 2015
|
$ | 0.170 |
February 3, 2015
|
$ | 3,445 |
February 13, 2015
|
||||
On May 4, 2015, the Company’s Board of Directors declared an increased quarterly dividend of $0.18 per share on its common stock. The $3.6 million dividend was paid on May 22, 2015, to shareholders of record at the close of business on May 15, 2015. The Company intends to continue to pay regular quarterly dividends; however the declaration and payment of future dividends is discretionary and will be subject to a determination by the Board of Directors each quarter following its review of the Company’s financial performance.
Share Repurchase Plan
On November 8, 2006, the Company’s Board of Directors approved a share repurchase plan of up to $20.0 million. On October 31, 2008, November 1, 2010, and August 1, 2011, the Company’s Board of Directors approved a second, third, and fourth share repurchase plan, respectively, each for an additional $20.0 million. The repurchase plan is intended to be implemented through purchases made from time to time in either the open market or through private transactions at the Company’s discretion, subject to market conditions and other factors, in accordance with Securities and Exchange Commission requirements. There can be no assurances as to the precise number of shares that will be repurchased under the share repurchase plan, and the Company may discontinue the share repurchase plan at any time subject to compliance with applicable regulatory requirements. Shares purchased pursuant to the share repurchase plan will either be cancelled or held in the Company’s treasury. During fiscal 2015 and fiscal 2014 the Company did not repurchase any shares, and as of March 31, 2015, the Company had approximately $10.2 million remaining under the Company’s share repurchase plan. Since the inception of the share repurchase plan, approximately 5.6 million shares have been repurchased under the plan for approximately $69.8 million, averaging approximately $12.54 per share.
| 11 |
Performance Graph
Set forth below is a line graph comparing the five year cumulative performance of our Common Stock with the Standard & Poor’s Composite-500 Stock Index (the “S&P 500”), the Nasdaq Composite, and the Russell 2000, from March 31, 2010 to March 31, 2015. The graph assumes that $100 was invested on March 31, 2010 in each of our Common Stock, the S&P 500, the Nasdaq Composite, and the Russell 2000. Because we have historically paid dividends on a quarterly basis, the graph assumes that dividends were reinvested. The performance graph and related information below shall not be deemed “filed” with the Securities and Exchange Commission, nor shall such information be incorporated by reference into any future filing under the Securities Act of 1933 or Securities Exchange Act of 1934, each as amended, except to the extent that we specifically incorporate it by reference into such filing.
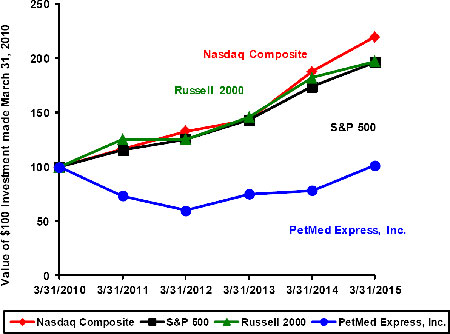
Performance graph data:
|
Fiscal Year Ended March 31,
|
||||||||||||||||||||||||
|
2010
|
2011
|
2012
|
2013
|
2014
|
2015
|
|||||||||||||||||||
|
Nasdaq Composite
|
100.00 | 116.80 | 132.87 | 143.58 | 188.17 | 219.73 | ||||||||||||||||||
|
S&P 500
|
100.00 | 115.65 | 125.52 | 143.05 | 174.31 | 196.51 | ||||||||||||||||||
|
Russell 2000
|
100.00 | 125.79 | 125.56 | 146.03 | 182.39 | 197.37 | ||||||||||||||||||
|
PetMed Express, Inc.
|
100.00 | 73.57 | 60.23 | 74.94 | 78.48 | 101.55 | ||||||||||||||||||
| 12 |
Securities Authorized for Issuance under Equity Compensation Plans
The following table sets forth securities authorized for issuance under equity compensation plans, including individual compensation arrangements, by us under our 2006 Employee Equity Compensation Restricted Stock Plan and 2006 Outside Director Equity Compensation Restricted Stock Plan as of March 31, 2015:
|
EQUITY COMPENSATION PLAN INFORMATION
|
||||||||||||
|
(In thousands, except for per share amounts)
|
||||||||||||
|
Number of securities
|
Number of securities
|
|||||||||||
|
to be issued upon
|
Weighted average
|
remaining available
|
||||||||||
|
exercise of outstanding
|
exercise price of
|
for future issuance
|
||||||||||
|
options, warrants
|
outstanding options,
|
under equity
|
||||||||||
|
Plan category
|
and rights
|
warrants and rights
|
compensation plans
|
|||||||||
|
2006 Employee Restricted Stock Plan
|
773 | - | 558 | |||||||||
|
2006 Director Restricted Stock Plan
|
242 | - | 290 | |||||||||
|
Total
|
1,015 | 848 | ||||||||||
| 13 |
ITEM 6. SELECTED FINANCIAL DATA
The following selected financial data should be read together with “Management’s Discussion and Analysis of Financial Condition and Results of Operations,” the Consolidated Financial Statements and notes thereto, and other financial information included elsewhere in this Annual Report on Form 10-K. The Consolidated Statements of Income data set forth below for the fiscal years ended March 31, 2015, 2014, and 2013 and the Consolidated Balance Sheet data as of March 31, 2015 and 2014 have been derived from our audited Consolidated Financial Statements which are included elsewhere in this Annual Report on Form 10-K. The Consolidated Statements of Income data set forth below for the fiscal years ended March 31, 2012 and 2011 and the Consolidated Balance Sheet data as of March 31, 2013, 2012 and 2011 have been derived from our audited Consolidated Financial Statements which are not included in this Annual Report on Form 10-K.
|
CONSOLIDATED STATEMENTS OF INCOME DATA
|
||||||||||||||||||||
|
(In thousands, except for per share amounts)
|
||||||||||||||||||||
|
Fiscal Year Ended March 31,
|
||||||||||||||||||||
|
2015
|
2014
|
2013
|
2012
|
2011
|
||||||||||||||||
|
Sales
|
$ | 229,395 | $ | 233,391 | $ | 227,829 | $ | 238,250 | $ | 231,642 | ||||||||||
|
Cost of sales
|
153,125 | 155,774 | 150,708 | 158,085 | 147,686 | |||||||||||||||
|
Gross profit
|
76,270 | 77,617 | 77,121 | 80,165 | 83,956 | |||||||||||||||
|
Operating expenses
|
48,657 | 49,399 | 50,116 | 54,143 | 50,932 | |||||||||||||||
|
Net income
|
17,453 | 17,972 | 17,165 | 16,659 | 20,871 | |||||||||||||||
|
Net income per common share:
|
||||||||||||||||||||
|
Basic
|
0.87 | 0.90 | 0.86 | 0.81 | 0.93 | |||||||||||||||
|
Diluted
|
0.87 | 0.90 | 0.86 | 0.80 | 0.92 | |||||||||||||||
|
Weighted average number of
|
||||||||||||||||||||
|
common shares outstanding:
|
||||||||||||||||||||
|
Basic
|
20,015 | 19,901 | 19,926 | 20,613 | 22,514 | |||||||||||||||
|
Diluted
|
20,136 | 20,043 | 20,049 | 20,708 | 22,643 | |||||||||||||||
|
Cash dividends declared per common share
|
0.680 | 0.660 | 1.600 | 0.525 | 0.475 | |||||||||||||||
|
CONSOLIDATED BALANCE SHEET DATA
|
||||||||||||||||||||
|
(In thousands)
|
||||||||||||||||||||
|
March 31,
|
||||||||||||||||||||
| 2015 | 2014 | 2013 | 2012 | 2011 | ||||||||||||||||
|
Working capital
|
$ | 72,983 | $ | 66,116 | $ | 59,760 | $ | 78,216 | $ | 80,643 | ||||||||||
|
Total assets
|
82,852 | 78,375 | 73,179 | 91,064 | 106,287 | |||||||||||||||
|
Total liabilities
|
7,417 | 8,158 | 9,165 | 9,883 | 9,282 | |||||||||||||||
|
Shareholders’ equity
|
75,435 | 70,217 | 64,014 | 81,181 | 97,005 | |||||||||||||||
|
NON FINANCIAL DATA (UNAUDITED)
|
||||||||||||||||||||
|
(In thousands)
|
||||||||||||||||||||
|
March 31,
|
||||||||||||||||||||
| 2015 | 2014 | 2013 | 2012 | 2011 | ||||||||||||||||
|
New customers acquired
|
529 | 597 | 630 | 722 | 645 | |||||||||||||||
|
Total accumulated customers (1)
|
8,586 | 8,057 | 7,460 | 6,830 | 6,108 | |||||||||||||||
|
(1) includes both active and inactive customers
|
||||||||||||||||||||
| 14 |
ITEM 7. MANAGEMENT’S DISCUSSION AND ANALYSIS OF FINANCIAL CONDITION AND RESULTS OF OPERATIONS
Executive Summary
PetMed Express was incorporated in the state of Florida in January 1996. The Company’s common stock is traded on the NASDAQ Global Select Market under the symbol “PETS.” The Company began selling pet medications and other pet health products in September 1996. In March 2010 the Company started offering for sale additional pet supplies on its website, and these items are drop shipped to customers by third party vendors. Presently, the Company’s product line includes approximately 3,000 SKUs of the most popular pet medications, health products, and supplies for dogs and cats.
The Company markets its products through national television, online, and direct mail/print advertising campaigns which aim to increase the recognition of the “1-800-PetMeds” brand name, and “PetMeds” family of trademarks, increase traffic on its website at www.1800petmeds.com, acquire new customers, and maximize repeat purchases. Approximately 80% of all sales were generated via the Internet in fiscal 2015, compared to 79% in fiscal 2014. The Company’s sales consist of products sold mainly to retail consumers. The twelve-month average purchase was approximately $77 and $75 per order for the fiscal years ended March 31, 2015 and 2014, respectively.
Critical Accounting Policies
Our discussion and analysis of our financial condition and the results of our operations are based upon our Consolidated Financial Statements and the data used to prepare them. The Company’s Consolidated Financial Statements have been prepared in accordance with accounting principles generally accepted in the United States of America. On an ongoing basis we re-evaluate our judgments and estimates including those related to product returns, bad debts, inventories, and income taxes. We base our estimates and judgments on our historical experience, knowledge of current conditions, and our beliefs of what could occur in the future considering available information. Actual results may differ from these estimates under different assumptions or conditions. Our estimates are guided by observing the following critical accounting policies.
Revenue recognition
The Company generates revenue by selling pet medication products and pet supplies primarily to retail consumers. The Company’s policy is to recognize revenue from product sales upon shipment, when the rights of ownership and risk of loss have passed to the customer. Outbound shipping and handling fees are included in sales and are billed upon shipment. Shipping expenses are included in cost of sales. The majority of the Company’s sales are paid by credit cards and the Company usually receives the cash settlement in two to three banking days. Credit card sales minimize accounts receivable balances relative to sales. The Company maintains an allowance for doubtful accounts for losses that the Company estimates will arise from customers’ inability to make required payments, arising from either credit card charge-backs or insufficient funds checks. The Company determines its estimates of the uncollectibility of accounts receivable by analyzing historical bad debts and current economic trends. The allowance for doubtful accounts was approximately $8,000 at March 31, 2015, compared to $7,000 at March 31, 2014.
Valuation of inventory
Inventories consist of prescription and non-prescription pet medications and pet supplies that are available for sale and are priced at the lower of cost or market value using a weighted average cost method. The Company writes down its inventory for estimated obsolescence. The inventory reserve was approximately $63,000 and $90,000 as of March 31, 2015 and 2014, respectively.
Advertising
The Company’s advertising expense consists primarily of television advertising, Internet marketing, and direct mail/print advertising. Television advertising costs are expensed as the advertisements are televised. Internet costs are expensed in the month incurred and direct mail/print advertising costs are expensed when the related catalogs, brochures, and postcards are produced, distributed, or superseded.
| 15 |
Accounting for income taxes
The Company accounts for income taxes under the provisions of ASC Topic 740, (“Accounting for Income Taxes”), which generally requires the recognition of deferred tax assets and liabilities for the expected future tax benefits or consequences of events that have been included in the Consolidated Financial Statements or tax returns. Under this method, deferred tax assets and liabilities are determined based on differences between the financial reporting carrying values and the tax bases of assets and liabilities, and are measured by applying enacted tax rates and laws for the taxable years in which those differences are expected to reverse.
Results of Operations
The following should be read in conjunction with the Company’s Consolidated Financial Statements and the related notes thereto included elsewhere herein. The following table sets forth, as a percentage of sales, certain operating data appearing in the Company’s Consolidated Statements of Comprehensive Income:
|
Fiscal Year Ended March 31,
|
||||||||||||
|
2015
|
2014
|
2013
|
||||||||||
|
Sales
|
100.0 | % | 100.0 | % | 100.0 | % | ||||||
|
Cost of sales
|
66.8 | 66.7 | 66.1 | |||||||||
|
Gross profit
|
33.2 | 33.3 | 33.9 | |||||||||
|
Operating expenses:
|
||||||||||||
|
General and administrative
|
9.2 | 9.2 | 9.5 | |||||||||
|
Advertising
|
11.0 | 11.6 | 12.0 | |||||||||
|
Discontinued project costs
|
0.7 | - | - | |||||||||
|
Depreciation
|
0.3 | 0.4 | 0.5 | |||||||||
|
Total operating expenses
|
21.2 | 21.2 | 22.0 | |||||||||
|
Income from operations
|
12.0 | 12.1 | 11.9 | |||||||||
|
Total other income
|
0.1 | 0.1 | 0.1 | |||||||||
|
Income before provision for income taxes
|
12.1 | 12.2 | 12.0 | |||||||||
|
Provision for income taxes
|
4.5 | 4.5 | 4.5 | |||||||||
|
Net income
|
7.6 | % | 7.7 | % | 7.5 | % | ||||||
Fiscal 2015 Compared to Fiscal 2014
Sales
Sales decreased by approximately $4.0 million, or 1.7%, to approximately $229.4 million for the fiscal year ended March 31, 2015, from approximately $233.4 million for the fiscal year ended March 31, 2014. The decrease in sales for the fiscal year ended March 31, 2015 was primarily due to decreased new order and reorder sales. Fiscal 2015 sales were negatively impacted primarily by the weakness in demand for flea and tick topical pet medications. The Company acquired approximately 529,000 new customers for the year ended March 31, 2015, compared to approximately 597,000 new customers for the same period the prior year.
| 16 |
The following chart illustrates sales by various sales classifications:
|
Sales (In thousands)
|
2015
|
%
|
2014
|
%
|
$ Variance
|
% Variance
|
||||||||||||||||||
|
Reorder Sales
|
$ | 189,685 | 82.7 | % | $ | 191,205 | 81.9 | % | $ | (1,520 | ) | -0.8 | % | |||||||||||
|
New Order Sales
|
$ | 39,710 | 17.3 | % | $ | 42,186 | 18.1 | % | $ | (2,476 | ) | -5.9 | % | |||||||||||
|
Total Net Sales
|
$ | 229,395 | 100.0 | % | $ | 233,391 | 100.0 | % | $ | (3,996 | ) | -1.7 | % | |||||||||||
|
Internet Sales
|
$ | 184,078 | 80.2 | % | $ | 184,356 | 79.0 | % | $ | (278 | ) | -0.2 | % | |||||||||||
|
Contact Center Sales
|
$ | 45,317 | 19.8 | % | $ | 49,035 | 21.0 | % | $ | (3,718 | ) | -7.6 | % | |||||||||||
|
Total Net Sales
|
$ | 229,395 | 100.0 | % | $ | 233,391 | 100.0 | % | $ | (3,996 | ) | -1.7 | % | |||||||||||
Going forward sales may continue to be adversely affected due to increased competition and consumers giving more consideration to price. The majority of our product sales were affected by the seasons, due to the seasonality of mainly heartworm, and flea and tick medications. For the quarters ended June 30, September 30, December 31, and March 31 of fiscal 2015, the Company’s sales were approximately 32%, 25%, 21%, and 22%, respectively. For the quarters ended June 30, September 30, December 31, and March 31 of fiscal 2014, the Company’s sales were approximately 32%, 26%, 21%, and 21%, respectively.
Cost of sales
Cost of sales decreased by $2.7 million, or 1.7%, to $153.1 million for the fiscal year ended March 31, 2015, from $155.8 million for the fiscal year ended March 31, 2014. The decrease in cost of sales is directly related to a reduction in sales. As a percentage of sales, cost of sales was 66.8% in fiscal 2015, as compared to 66.7% in fiscal 2014. The cost of sales percentage increase can be mainly attributed to a slight increase in product costs.
Gross profit
Gross profit decreased by $1.3 million, or 1.7%, to $76.3 million for the fiscal year ended March 31, 2015, from $77.6 million for the fiscal year ended March 31, 2014. Gross profit as a percentage of sales for fiscal 2015 was 33.2% compared to 33.3%, for fiscal 2014. The gross profit percentage decrease can be mainly attributed to a slight increase in product costs.
General and administrative expenses
General and administrative expenses decreased by $251,000, or 1.2%, to $21.1 million for the fiscal year ended March 31, 2015 from $21.4 million for the fiscal year ended March 31, 2014. The decrease in general and administrative expenses for the fiscal year ended March 31, 2015 was primarily due to the following: a $151,000 reduction in payroll expense; a $103,000 decrease in bank service fees due to a decrease in sales; a $84,000 decrease in property expenses related to computer maintenance expenses; and a $57,000 decrease in other expenses including office expense, insurance expense, and licenses and fees. Offsetting the decrease was a $67,000 increase in professional fees, with the majority of the increase relating to investor relations and pharmacy; a $53,000 one-time charge relating to state/county sales tax which was not collected on behalf of our customers; and a $24,000 increase in telephone expenses. General and administrative expenses as a percentage of sales was 9.2% for both the fiscal years ended March 31, 2015 and 2014, respectively.
Advertising expenses
Advertising expenses decreased by approximately $2.0 million to approximately $25.2 million for the year ended March 31, 2015, from approximately $27.2 million for the year ended March 31, 2014. The decrease in advertising expenses for fiscal 2015 can be attributed to a reduction in television and print advertising. The advertising costs of acquiring a new customer, defined as total advertising costs divided by new customers acquired, was $48 for the fiscal year ended March 31, 2015, compared to $46 for the fiscal year ended March 31, 2014. Advertising cost of acquiring a new customer can be impacted by the advertising environment, the effectiveness of our advertising creative, increased advertising spending, and price competition. Historically, the advertising environment fluctuates due to supply and demand. A more favorable advertising environment may positively impact future new order sales, whereas a less favorable advertising environment may negatively impact future new order sales.
| 17 |
As a percentage of sales, advertising expense was 11.0 % and 11.6% for the fiscal years ended March 31, 2015 and 2014, respectively. The decrease in advertising expense as a percentage of total sales for the fiscal year ended March 31, 2015 can be attributed to a reduction in advertising expense. The Company currently anticipates advertising as a percentage of sales to be approximately 11% for fiscal 2016. However, the advertising percentage will fluctuate quarter to quarter due to seasonality and advertising availability. For the fiscal year ended March 31, 2015, quarterly advertising expenses as a percentage of sales ranged between 8% and 14%.
Discontinued project costs
During the quarter ended September 30, 2014 the Company discontinued an information technology project related to a new software platform, which was intended to be put into service and capitalized during the September quarter. The Company expensed a one-time project charge of $1.7 million in the September quarter. The net after tax impact of this one-time charge was $1.1 million, or $0.05 diluted per share. The Company does not expect any additional future expenditures relating to this discontinued project. Management determined that it was not in the best interest of the Company to proceed with this project. The Company decided to continue with, and upgrade, its current software platform.
Depreciation
Depreciation decreased by approximately $207,000, to approximately $660,000 for the year ended March 31, 2015, from approximately $867,000 for the year ended March 31, 2014. This decrease to depreciation for the year ended March 31, 2015 can be attributed to more fixed assets becoming fully depreciated.
Other income
Other income increased slightly, to approximately $185,000 for the year ended March 31, 2015 from approximately $181,000 for the year ended March 31, 2014. Interest income may decrease in the future as the Company utilizes its cash balances on its share repurchase plan, with approximately $10.2 million remaining as of March 31, 2015, on any quarterly dividend payment, or on its operating activities.
Provision for income taxes
For the fiscal years ended March 31, 2015 and 2014, the Company recorded an income tax provision for approximately $10.3 million and $10.4 million, respectively. The decrease to the income tax provision for fiscal 2015 is related to a reduction in operating income for the period due to the one-time discontinued project charge of $1.7 million. The net after tax impact of this one-time charge was $1.1 million, which reduced the income tax provision by approximately $600,000. The effective tax rate for the fiscal years ended March 31, 2015 and 2014 were 37.2% and 36.7%, respectively. The effective tax rate increase for the fiscal year ended March 31, 2015, can be attributed to a one-time charge related to a fiscal 2015 income tax under-accrual, which was recognized in the quarter ended December 31, 2014, compared to a one-time benefit related to a fiscal 2014 income tax over-accrual, which was recognized in the quarter ended December 31, 2013. The Company estimates its effective tax rate will be approximately 37.0% for fiscal 2016.
Net income
Net income decreased by approximately $519,000, or 2.9%, to approximately $17.5 million for the fiscal year ended March 31, 2015 from approximately $18.0 million for the fiscal year ended March 31, 2014. The decrease was primarily due to a reduction in sales, and the recognition of one-time project charge of $1.7 million during the fiscal year. The net after tax impact of this one-time charge was $1.1 million.
Fiscal 2014 Compared to Fiscal 2013
Sales
Sales increased by approximately $5.6 million, or 2.4%, to approximately $233.4 million for the fiscal year ended March 31, 2014, from approximately $227.8 million for the fiscal year ended March 31, 2013. The increase in sales for the fiscal year ended March 31, 2014 can be attributed to increased reorder sales, offset by a reduction to new order sales. Our sales increase was also due to an increase in the average order size during the year. The Company acquired approximately 597,000 new customers for the year ended March 31, 2014, compared to approximately 630,000 new customers for the same period the prior year.
| 18 |
The following chart illustrates sales by various sales classifications:
|
Sales (In thousands)
|
2014
|
%
|
2013
|
%
|
$ Variance
|
% Variance
|
||||||||||||||||||
|
Reorder Sales
|
$ | 191,205 | 81.9 | % | $ | 184,814 | 81.1 | % | $ | 6,391 | 3.5 | % | ||||||||||||
|
New Order Sales
|
$ | 42,186 | 18.1 | % | $ | 43,015 | 18.9 | % | $ | (829 | ) | -1.9 | % | |||||||||||
|
Total Net Sales
|
$ | 233,391 | 100.0 | % | $ | 227,829 | 100.0 | % | $ | 5,562 | 2.4 | % | ||||||||||||
|
Internet Sales
|
$ | 184,356 | 79.0 | % | $ | 175,984 | 77.2 | % | $ | 8,372 | 4.8 | % | ||||||||||||
|
Contact Center Sales
|
$ | 49,035 | 21.0 | % | $ | 51,845 | 22.8 | % | $ | (2,810 | ) | -5.4 | % | |||||||||||
|
Total Net Sales
|
$ | 233,391 | 100.0 | % | $ | 227,829 | 100.0 | % | $ | 5,562 | 2.4 | % | ||||||||||||
Future sales may be adversely affected due to increased competition and consumers giving more consideration to price. No guarantees can be made that sales will grow in the future. The majority of our product sales were affected by the seasons, due to the seasonality of mainly heartworm, and flea and tick medications. For the quarters ended June 30, September 30, December 31, and March 31 of fiscal 2014, the Company’s sales were approximately 32%, 26%, 21%, and 21%, respectively. For the quarters ended June 30, September 30, December 31, and March 31 of fiscal 2013, the Company’s sales were approximately 30%, 26%, 22%, and 22%, respectively. Sales in the March quarter of fiscal 2014 were negatively impacted by the colder-than-normal weather.
Cost of sales
Cost of sales increased by $5.1 million, or 3.4%, to $155.8 million for the fiscal year ended March 31, 2014, from $150.7 million for the fiscal year ended March 31, 2013. The increase in cost of sales is directly related to increased sales. As a percentage of sales, cost of sales was 66.7% in fiscal 2014, as compared to 66.1% in fiscal 2013. The cost of sales percentage increase can be mainly attributed to an increase in product costs and an increase in promotional discounts.
Gross profit
Gross profit increased by $496,000, to $77.6 million for the fiscal year ended March 31, 2014, from $77.1 million for the fiscal year ended March 31, 2013. Gross profit as a percentage of sales for fiscal 2014 was 33.3% compared to 33.9%, for fiscal 2013. The gross profit percentage decrease can be mainly attributed to an increase in product costs and an increase in promotional discounts.
General and administrative expenses
General and administrative expenses decreased by $240,000, or 1.1%, to $21.4 million for the fiscal year ended March 31, 2014 from $21.6 million for the fiscal year ended March 31, 2013. The decrease in general and administrative expenses for the fiscal year ended March 31, 2014 was primarily due to the following: a $331,000 reduction in payroll expense primarily related to a reduction in stock based compensation; a $67,000 decrease in office expenses; a $37,000 decrease in licenses and fees; and a $36,000 decrease in telephone expenses. Offsetting the decrease was a $155,000 increase in bank service fees due to increased sales; a $40,000 increase in bad debt expense; and a $36,000 net increase in other expenses including professional fees and travel expense. General and administrative expenses as a percentage of sales was 9.2% compared to 9.5% for the fiscal years ended March 31, 2014 and 2013, respectively. The decrease in general and administrative expenses as a percentage of sales can mainly be attributed to an increase in sales in fiscal 2014.
Advertising expenses
Advertising expenses decreased by approximately $253,000 to approximately $27.2 million for the year ended March 31, 2014, from approximately $27.4 million for the year ended March 31, 2013. The decrease in advertising expenses for fiscal 2014 can be attributed to a reduction in print advertising. The advertising costs of acquiring a new customer, defined as total advertising costs divided by new customers acquired, was $46 for the fiscal year ended March 31, 2014, compared to $44 for the fiscal year ended March 31, 2013.
| 19 |
Advertising cost of acquiring a new customer can be impacted by the advertising environment, the effectiveness of our advertising creative, increased advertising spending, and price competition. Historically, the advertising environment fluctuates due to supply and demand. A more favorable advertising environment may positively impact future new order sales, whereas a less favorable advertising environment may negatively impact future new order sales. As a percentage of sales, advertising expense was 11.6 % and 12.0% for the fiscal years ended March 31, 2014 and 2013, respectively. The decrease in advertising expense as a percentage of total sales for the fiscal year ended March 31, 2014 can be attributed to increased sales and a reduction in advertising expense. The Company currently anticipates advertising as a percentage of sales to be approximately 12% for fiscal 2015. However, the advertising percentage will fluctuate quarter to quarter due to seasonality and advertising availability. For the fiscal year ended March 31, 2014, quarterly advertising expenses as a percentage of sales ranged between 9% and 14%.
Depreciation
Depreciation decreased by approximately $224,000, to approximately $867,000 for the year ended March 31, 2014, from approximately $1.1 million for the year ended March 31, 2013. This decrease to depreciation for the year ended March 31, 2014 can be attributed to a reduction in new property and equipment additions, and an increase in fully depreciated fixed assets.
Other income
Other income decreased by approximately $120,000, to approximately $181,000 for the year ended March 31, 2014 from approximately $301,000 for the year ended March 31, 2013. The decrease to other income for the year ended March 31, 2014 can be attributed to decreased interest income. Interest income may decrease in the future as the Company utilizes its cash balances on its share repurchase plan, with approximately $10.2 million remaining as of March 31, 2014, on any quarterly dividend payment, or on its operating activities.
Provision for income taxes
For the fiscal years ended March 31, 2014 and 2013, the Company recorded an income tax provision for approximately $10.4 million and $10.1 million, respectively. The effective tax rate for the fiscal years ended March 31, 2014 and 2013 were 36.7% and 37.1%, respectively. The effective tax rate decrease for the fiscal year ended March 31, 2014, was due to a one-time benefit related to a fiscal 2013 income tax over-accrual, which was recognized in fiscal 2014, compared to a one-time charge related to a fiscal 2012 income tax under-accrual, which was recognized in fiscal 2013. The Company estimates its effective tax rate will be approximately 37.0% for fiscal 2015.
Net income
Net income increased by approximately $807,000, or 4.7%, to approximately $18.0 million for the fiscal year ended March 31, 2014 from approximately $17.2 million for the fiscal year ended March 31, 2013. The increase was primarily due to an increase in sales and a decrease in operating expenses in fiscal 2014.
Liquidity and Capital Resources
The Company’s working capital at March 31, 2015 and 2014 was approximately $73.0 million and approximately $66.1 million, respectively. The $6.9 million increase in working capital was primarily attributable to cash flow generated from operations, offset by dividends paid. Net cash provided by operating activities was $32.0 million and $13.5 million for the fiscal years ended March 31, 2015 and 2014, respectively. This change can be mainly attributed to a decrease in the Company’s inventory balance. Net cash used in investing activities was $986,000 and $129,000 for the years ended March 31, 2015 and 2014, respectively. This change can be attributed to increased property and equipment additions during fiscal 2015. Net cash used in financing activities was $13.7 million and $13.2 million for the years ended March 31, 2015 and 2014, respectively. This change represented an increase in the dividends paid during the year. As of March 31, 2015 the Company had approximately $10.2 million remaining under the Company’s share repurchase plan, and no shares were repurchased in fiscal 2015.
Subsequent to March 31, 2015, the Company’s Board of Directors declared an increased quarterly dividend of $0.18 per share on May 4, 2015. The Board established a May 15, 2015 record date and a May 22, 2015 payment date. Depending on future market conditions the Company may utilize its cash and cash equivalents on the remaining balance of its current share repurchase plan, on quarterly dividends, or on its operating activities.
| 20 |
As of both March 31, 2015 and 2014 the Company had no outstanding lease commitments except for the lease for its 65,300 square foot facility. We are not currently bound by any long or short term agreements for the purchase or lease of capital expenditures. Any material amounts expended for capital expenditures would be the result of an increase in the capacity needed to adequately provide for any increase in our business. To date we have paid for any needed additions to our capital equipment infrastructure from working capital funds and anticipate this being the case in the future. Presently, we have approximately $1.0 million forecasted for capital expenditures in fiscal 2016 which will be funded through cash from operations. The Company’s primary source of working capital is cash from operations. The Company presently has no need for alternative sources of working capital, and has no commitments or plans to obtain additional capital.
Off-Balance Sheet Arrangements
The Company had no off-balance sheet arrangements as of March 31, 2015.
Contractual Obligations and Commitments (In thousands)
|
Total
|
Less than
1 year
|
1-2 years
|
3-5 Years
|
More than
5 years
|
||||||||||||||||
|
Property lease
|
$ | 1,300 | $ | 781 | $ | 519 | $ | - | $ | - | ||||||||||
|
Executive employment contract
|
$ | 550 | $ | 550 | $ | - | $ | - | $ | - | ||||||||||
|
Total obligations
|
$ | 1,850 | $ | 1,331 | $ | 519 | $ | - | $ | - | ||||||||||
Recent Accounting Pronouncements
The Company does not believe that any recently issued, but not yet effective, accounting standards, if currently adopted, will have a material effect on the Company’s consolidated financial position, results of operations, or cash flows.
ITEM 7A. QUANTITATIVE AND QUALITATIVE DISCLOSURES ABOUT MARKET RISK
Market risk generally represents the risk that losses may occur in the value of financial instruments as a result of movements in interest rates, foreign currency exchange rates, and commodity prices. Our financial instruments include cash and cash equivalents, short term investments, accounts receivable, and accounts payable. The book values of cash equivalents, short term investments, accounts receivable, and accounts payable are considered to be representative of fair value because of the short maturity of these instruments. Interest rates affect our return on excess cash and investments. At March 31, 2015, we had $35.6 million in cash and cash equivalents and $15.6 million in short term investments. A majority of our cash and cash equivalents and investments generates interest income based on prevailing interest rates.
A significant change in interest rates would impact the amount of interest income generated from our excess cash and investments. It would also impact the market value of our investments. Our investments are subject to market risk, primarily interest rate and credit risk. Our investments are managed by a limited number of outside professional managers within investment guidelines set by our Board of Directors. Such guidelines include security type, credit quality, and maturity, and are intended to limit market risk by restricting our investments to high-quality debt instruments with both short and long term maturities. We do not hold any derivative financial instruments that could expose us to significant market risk. At March 31, 2015, we had no debt obligations.
| 21 |
ITEM 8. FINANCIAL STATEMENTS AND SUPPLEMENTARY DATA
PETMED EXPRESS, INC. AND SUBSIDIARIES
INDEX TO CONSOLIDATED FINANCIAL STATEMENTS
|
Page
|
||
|
Report of Independent Registered Public Accounting Firm
|
23
|
|
|
Consolidated Balance Sheets as of March 31, 2015 and 2014
|
24
|
|
|
Consolidated Statements of Comprehensive Income for each of the three years in the period ended March 31, 2015
|
25
|
|
|
Consolidated Statements of Changes in Shareholders’ Equity for each of the three years in the period ended March 31, 2015
|
26
|
|
|
Consolidated Statements of Cash Flows for each of the three years in the period ended March 31, 2015
|
27
|
|
|
Notes to Consolidated Financial Statements
|
28
|
|
|
Report of Management on Internal Control Over Financial Reporting
|
38
|
|
|
Report of Independent Registered Public Accounting Firm on Internal Control Over Financial Reporting
|
39
|
| 22 |
REPORT OF INDEPENDENT REGISTERED PUBLIC ACCOUNTING FIRM
To the Board of Directors and Shareholders
PetMed Express, Inc. and subsidiaries
We have audited the accompanying consolidated balance sheets of PetMed Express, Inc. and subsidiaries as of March 31, 2015 and 2014, and the related consolidated statements of comprehensive income, shareholders’ equity and cash flows for each of the three years in the period ended March 31, 2015. These financial statements are the responsibility of the Company’s management. Our responsibility is to express an opinion on these financial statements based on our audits.
We conducted our audits in accordance with the standards of the Public Company Accounting Oversight Board (United States). Those standards require that we plan and perform the audit to obtain reasonable assurance about whether the financial statements are free of material misstatement. An audit includes examining, on a test basis, evidence supporting the amounts and disclosures in the financial statements. An audit also includes assessing the accounting principles used and significant estimates made by management, as well as evaluating the overall financial statement presentation. We believe that our audits provide a reasonable basis for our opinion.
In our opinion, the consolidated financial statements referred to above present fairly, in all material respects, the financial position of PetMed Express, Inc. and subsidiaries as of March 31, 2015 and 2014, and the results of their operations and their cash flows for each of the three years in the period ended March 31, 2015, in conformity with U.S. generally accepted accounting principles.
We have also audited, in accordance with the standards of the Public Company Accounting Oversight Board (United States), PetMed Express, Inc. and subsidiaries’ internal control over financial reporting as of March 31, 2015, based on criteria established in Internal Control—Integrated Framework issued by the Committee of Sponsoring Organizations of the Treadway Commission in 2013, and our report dated May 22, 2015 expressed an unqualified opinion on the effectiveness of PetMed Express, Inc. and subsidiaries’ internal control over financial reporting.
|
/s/ McGladrey LLP
|
|
|
McGladrey LLP
|
Fort Lauderdale, Florida
May 22, 2015
| 23 |
PETMED EXPRESS, INC. AND SUBSIDIARIES
CONSOLIDATED BALANCE SHEETS
(In thousands)
|
March 31,
|
March 31,
|
|||||||
|
2015
|
2014
|
|||||||
|
ASSETS
|
||||||||
|
Current assets:
|
||||||||
|
Cash and cash equivalents
|
$ | 35,613 | $ | 18,305 | ||||
|
Short term investments - available for sale
|
15,591 | 15,539 | ||||||
|
Accounts receivable, less allowance for doubtful accounts of $8 and $7, respectively
|
1,931 | 1,761 | ||||||
|
Inventories - finished goods
|
25,068 | 35,727 | ||||||
|
Prepaid expenses and other current assets
|
1,380 | 1,761 | ||||||
|
Deferred tax assets
|
817 | 1,062 | ||||||
|
Prepaid income taxes
|
- | 54 | ||||||
|
Total current assets
|
80,400 | 74,209 | ||||||
|
Nonurrent assets:
|
||||||||
|
Prepaid expenses
|
- | 1,996 | ||||||
|
Property and equipment, net
|
1,569 | 1,310 | ||||||
|
Intangible assets
|
860 | 860 | ||||||
|
Deferred tax assets
|
23 | - | ||||||
|
Total noncurrent assets
|
2,452 | 4,166 | ||||||
|
Total assets
|
$ | 82,852 | $ | 78,375 | ||||
|
LIABILITIES AND SHAREHOLDERS’ EQUITY
|
||||||||
|
Current liabilities:
|
||||||||
|
Accounts payable
|
$ | 5,153 | $ | 5,768 | ||||
|
Accrued expenses and other current liabilities
|
2,214 | 2,325 | ||||||
|
Income taxes payable
|
50 | - | ||||||
|
Total current liabilities
|
7,417 | 8,093 | ||||||
|
Deferred tax liabilities
|
- | 65 | ||||||
|
Total liabilities:
|
7,417 | 8,158 | ||||||
|
Commitments and contingencies
|
||||||||
|
Shareholders’ equity:
|
||||||||
|
Preferred stock, $.001 par value, 5,000 shares authorized; 3 convertible shares issued and outstanding with a liquidation preference of $4 per share
|
9 | 9 | ||||||
| Common stock, $.001 par value, 40,000 shares authorized; 20,262 and 20,190 shares issued and outstanding, respectively | 20 | 20 | ||||||
|
Additional paid-in capital
|
3,117 | 1,578 | ||||||
|
Retained earnings
|
72,343 | 68,647 | ||||||
|
Accumulated other comprehensive loss
|
(54 | ) | (37 | ) | ||||
|
Total shareholders’ equity
|
75,435 | 70,217 | ||||||
|
Total liabilities and shareholders’ equity
|
$ | 82,852 | $ | 78,375 | ||||
See accompanying notes to consolidated financial statements.
| 24 |
PETMED EXPRESS, INC. AND SUBSIDIARIES
CONSOLIDATED STATEMENTS OF COMPREHENSIVE INCOME
(In thousands, except for per share amounts)
|
Year Ended March 31,
|
||||||||||||
|
2015
|
2014
|
2013
|
||||||||||
|
Sales
|
$ | 229,395 | $ | 233,391 | $ | 227,829 | ||||||
|
Cost of sales
|
153,125 | 155,774 | 150,708 | |||||||||
|
Gross profit
|
76,270 | 77,617 | 77,121 | |||||||||
|
Operating expenses:
|
||||||||||||
|
General and administrative
|
21,101 | 21,352 | 21,592 | |||||||||
|
Advertising
|
25,182 | 27,180 | 27,433 | |||||||||
|
Discontinued project costs
|
1,714 | - | - | |||||||||
|
Depreciation
|
660 | 867 | 1,091 | |||||||||
|
Total operating expenses
|
48,657 | 49,399 | 50,116 | |||||||||
|
Income from operations
|
27,613 | 28,218 | 27,005 | |||||||||
|
Other income (expense):
|
||||||||||||
|
Interest income, net
|
184 | 185 | 306 | |||||||||
|
Other, net
|
1 | (4 | ) | (5 | ) | |||||||
|
Total other income
|
185 | 181 | 301 | |||||||||
|
Income before provision for income taxes
|
27,798 | 28,399 | 27,306 | |||||||||
|
Provision for income taxes
|
10,345 | 10,427 | 10,141 | |||||||||
|
Net income
|
$ | 17,453 | $ | 17,972 | $ | 17,165 | ||||||
|
Net change in unrealized loss on short term investments
|
(17 | ) | (35 | ) | (46 | ) | ||||||
|
Comprehensive income
|
$ | 17,436 | $ | 17,937 | $ | 17,119 | ||||||
|
Net income per common share:
|
||||||||||||
|
Basic
|
$ | 0.87 | $ | 0.90 | $ | 0.86 | ||||||
|
Diluted
|
$ | 0.87 | $ | 0.90 | $ | 0.86 | ||||||
|
Weighted average number of common shares outstanding:
|
||||||||||||
|
Basic
|
20,015 | 19,901 | 19,926 | |||||||||
|
Diluted
|
20,136 | 20,043 | 20,049 | |||||||||
|
Cash dividends declared per common share
|
$ | 0.68 | $ | 0.66 | $ | 1.60 | ||||||
See accompanying notes to consolidated financial statements.
| 25 |
PETMED EXPRESS, INC. AND SUBSIDIARIES
CONSOLIDATED STATEMENTS OF CHANGES IN SHAREHOLDERS’ EQUITY
Fiscal years ended March 31, 2013, March 31, 2014, and March 31, 2015
(In thousands)
|
Convertible
|
Common
|
Additional
|
Other
|
|||||||||||||||||||||||||||||
|
Preferred Stock
|
Stock
|
Paid-In
|
Retained
|
Comprehensive
|
||||||||||||||||||||||||||||
|
Shares
|
Amounts
|
Shares
|
Amounts
|
Capital
|
Earnings
|
Loss
|
Total
|
|||||||||||||||||||||||||
|
Balance, March 31, 2012
|
3 | $ | 9 | 20,338 | $ | 20 | $ | - | $ | 81,108 | $ | 44 | $ | 81,181 | ||||||||||||||||||
|
Issuance of restricted stock, net
|
- | - | 168 | - | - | - | - | - | ||||||||||||||||||||||||
|
Share based compensation
|
- | - | - | - | 1,943 | - | - | 1,943 | ||||||||||||||||||||||||
|
Dividends declared
|
- | - | - | - | - | (32,080 | ) | - | (32,080 | ) | ||||||||||||||||||||||
|
Repurchased and retired shares
|
- | - | (397 | ) | - | (3,865 | ) | - | - | (3,865 | ) | |||||||||||||||||||||
|
Deferred tax adjustment related to resticted stock
|
- | - | - | - | (284 | ) | - | - | (284 | ) | ||||||||||||||||||||||
|
Allocation of retirement of repurchased shares of additional paid in capital and retained earnings
|
- | - | - | - | 2,206 | (2,206 | ) | - | - | |||||||||||||||||||||||
|
Net income
|
- | - | - | - | - | 17,165 | 17,165 | 17,165 | ||||||||||||||||||||||||
|
Other comprehensive loss:
|
||||||||||||||||||||||||||||||||
|
Net Change in unrealized loss on short term investments
|
(46 | ) | (46 | ) | ||||||||||||||||||||||||||||
|
Total comprehensive income
|
$ | 17,119 | - | |||||||||||||||||||||||||||||
|
Balance, March 31, 2013
|
3 | 9 | 20,109 | 20 | - | 63,987 | (2 | ) | 64,014 | |||||||||||||||||||||||
|
Issuance of restricted stock, net
|
- | - | 81 | - | - | - | - | - | ||||||||||||||||||||||||
|
Share based compensation
|
- | - | - | - | 1,479 | - | - | 1,479 | ||||||||||||||||||||||||
|
Dividends declared
|
- | - | - | - | - | (13,312 | ) | - | (13,312 | ) | ||||||||||||||||||||||
|
Deferred tax adjustment related to resticted stock
|
- | - | - | - | 99 | - | - | 99 | ||||||||||||||||||||||||
|
Net income
|
- | - | - | - | - | 17,972 | 17,972 | 17,972 | ||||||||||||||||||||||||
|
Other comprehensive loss:
|
||||||||||||||||||||||||||||||||
|
Net Change in unrealized loss on short term investments
|
(35 | ) | (35 | ) | ||||||||||||||||||||||||||||
|
Total comprehensive income
|
$ | 17,937 | - | |||||||||||||||||||||||||||||
|
Balance, March 31, 2014
|
3 | 9 | 20,190 | 20 | 1,578 | 68,647 | (37 | ) | 70,217 | |||||||||||||||||||||||
|
Issuance of restricted stock, net
|
- | - | 72 | - | - | - | - | - | ||||||||||||||||||||||||
|
Share based compensation
|
- | - | - | - | 1,481 | - | - | 1,481 | ||||||||||||||||||||||||
|
Dividends declared
|
- | - | - | - | - | (13,757 | ) | - | (13,757 | ) | ||||||||||||||||||||||
|
Deferred tax adjustment related to resticted stock
|
- | - | - | - | 58 | - | - | 58 | ||||||||||||||||||||||||
|
Net income
|
- | - | - | - | - | 17,453 | 17,453 | 17,453 | ||||||||||||||||||||||||
|
Other comprehensive loss:
|
||||||||||||||||||||||||||||||||
|
Net Change in unrealized loss on short term investments
|
(17 | ) | (17 | ) | ||||||||||||||||||||||||||||
|
Total comprehensive income
|
$ | 17,436 | - | |||||||||||||||||||||||||||||
|
Balance, March 31, 2015
|
3 | $ | 9 | 20,262 | $ | 20 | $ | 3,117 | $ | 72,343 | $ | (54 | ) | $ | 75,435 | |||||||||||||||||
See accompanying notes to consolidated financial statements.
| 26 |
PETMED EXPRESS, INC. AND SUBSIDIARIES
CONSOLIDATED STATEMENTS OF CASH FLOWS
(In thousands)
|
Year Ended
|
||||||||||||
|
March 31,
|
||||||||||||
|
2015
|
2014
|
2013
|
||||||||||
|
Cash flows from operating activities:
|
||||||||||||
|
Net income
|
$ | 17,453 | $ | 17,972 | $ | 17,165 | ||||||
|
Adjustments to reconcile net income to net cash provided by operating activities:
|
||||||||||||
|
Depreciation
|
660 | 867 | 1,091 | |||||||||
|
Share based compensation
|
1,481 | 1,479 | 1,943 | |||||||||
|
Discontinued project costs
|
1,714 | - | - | |||||||||
|
Deferred income taxes
|
157 | (183 | ) | (76 | ) | |||||||
|
Bad debt expense
|
94 | 95 | 56 | |||||||||
|
(Increase) decrease in operating assets and increase (decrease) in liabilities:
|
||||||||||||
|
Accounts receivable
|
(264 | ) | (417 | ) | 77 | |||||||
|
Inventories - finished goods
|
10,659 | (4,126 | ) | (5,384 | ) | |||||||
|
Prepaid income taxes
|
54 | (54 | ) | 199 | ||||||||
|
Prepaid expenses and other current assets
|
662 | (1,237 | ) | (1,279 | ) | |||||||
|
Accounts payable
|
(616 | ) | (686 | ) | (165 | ) | ||||||
|
Accrued expenses and other current liabilities
|
(61 | ) | (42 | ) | (499 | ) | ||||||
|
Income taxes payable
|
50 | (162 | ) | 162 | ||||||||
|
Net cash provided by operating activities
|
32,043 | 13,506 | 13,290 | |||||||||
|
Cash flows from investing activities:
|
||||||||||||
|
Net change in investments
|
(68 | ) | (84 | ) | (5,189 | ) | ||||||
|
Purchases of property and equipment
|
(918 | ) | (45 | ) | (626 | ) | ||||||
|
Net cash used in investing activities
|
(986 | ) | (129 | ) | (5,815 | ) | ||||||
|
Cash flows from financing activities:
|
||||||||||||
|
Dividends paid
|
(13,807 | ) | (13,326 | ) | (31,972 | ) | ||||||
|
Purchases of treasury stock
|
- | - | (3,865 | ) | ||||||||
|
Tax adjustment related to stock compensation
|
58 | 99 | (284 | ) | ||||||||
|
Net cash used in financing activities
|
(13,749 | ) | (13,227 | ) | (36,121 | ) | ||||||
|
Net increase (decrease) in cash and cash equivalents
|
17,308 | 150 | (28,646 | ) | ||||||||
|
Cash and cash equivalents, at beginning of year
|
18,305 | 18,155 | 46,801 | |||||||||
|
Cash and cash equivalents, at end of year
|
$ | 35,613 | $ | 18,305 | $ | 18,155 | ||||||
|
Supplemental disclosure of cash flow information:
|
||||||||||||
|
Cash paid for income taxes
|
$ | 10,026 | $ | 10,727 | $ | 10,140 | ||||||
|
Retirement of treasury stock
|
$ | - | $ | - | $ | 3,865 | ||||||
|
Dividends payable in accrued expenses
|
$ | 212 | $ | 262 | $ | 276 | ||||||
See accompanying notes to consolidated financial statements.
| 27 |
NOTES TO CONSOLIDATED FINANCIAL STATEMENTS
(1) Summary of Significant Accounting Policies
Organization
PetMed Express, Inc. and subsidiaries, d/b/a 1-800-PetMeds (the “Company”), is a leading nationwide pet pharmacy. The Company markets prescription and non-prescription pet medications, health products, and supplies for dogs and cats, direct to the consumer. The Company markets its products through national television, online, and direct mail/print advertising campaigns, which aim to increase the recognition of the “1-800-PetMeds” brand name and “PetMeds” family of trademarks, increase traffic on its website at www.1800petmeds.com, acquire new customers, and maximize repeat purchases. The majority of all of the Company’s sales are to residents in the United States. The Company’s executive offices are located in Pompano Beach, Florida. The Company’s fiscal year end is March 31, and references herein to fiscal 2015, 2014, or 2013 refer to the Company’s fiscal years ended March 31, 2015, 2014, and 2013, respectively.
Principles of Consolidation
The consolidated financial statements include the accounts of the Company and its wholly owned subsidiaries. All significant intercompany transactions have been eliminated in consolidation.
Revenue Recognition
The Company generates revenue by selling pet medication products and pet supplies mainly to retail consumers. The Company’s policy is to recognize revenue from product sales upon shipment, when the rights of ownership and risk of loss have passed to the customer. Outbound shipping and handling fees are included in sales and are billed upon shipment. Shipping expenses are included in cost of sales. The majority of the Company’s sales are paid by credit cards and the Company usually receives the cash settlement in two to three banking days. Credit card sales minimize the accounts receivable balances relative to sales. The Company maintains an allowance for doubtful accounts for losses that the Company estimates will arise from the customers’ inability to make required payments, arising from either credit card charge-backs or insufficient funds checks. The Company determines its estimates of the uncollectibility of accounts receivable by analyzing historical bad debts and current economic trends. At March 31, 2015 and 2014, the allowance for doubtful accounts was approximately $8,000 and $7,000, respectively.
Cash and Cash Equivalents
The Company considers all highly liquid investments with maturity of three months or less when purchased to be cash equivalents. Cash and cash equivalents at March 31, 2015 and 2014 consisted of the Company’s cash accounts and money market accounts with a maturity of three months or less. The carrying amount of cash equivalents approximates fair value. The Company maintains its cash in bank deposit accounts which, at times, may exceed federally insured limits. The Company has not experienced any losses in such accounts.
Short Term Investments
The Company’s short term investments balance consists of short term bond mutual funds. In accordance with ASC Topic 320 (“Accounting for Certain Investments in Debt and Equity Securities”), short term investments are accounted for as available for sale securities with any changes in fair value to be reflected in other comprehensive income (loss). The Company had a short term investments balance of $15.6 million and $15.5 million as of March 31, 2015 and March 31, 2014, respectively.
Use of Estimates
The preparation of consolidated financial statements in conformity with accounting principles generally accepted in the United States of America requires management to make estimates and assumptions that affect the reported amounts of assets and liabilities and disclosure of contingent assets and liabilities at the date of the consolidated financial statements and the reported amounts of revenues and expenses during the reporting period. Actual results could differ from those estimates.
| 28 |
NOTES TO CONSOLIDATED FINANCIAL STATEMENTS
|
(1)
|
Summary of Significant Accounting Policies (Continued)
|
Inventories
Inventories consist of prescription and non-prescription pet medications and pet supplies that are available for sale and are priced at the lower of cost or market value using a weighted average cost method. The Company writes down its inventory for estimated obsolescence. The inventory reserve was approximately $63,000 and $90,000 at March 31, 2015 and 2014, respectively.
Property and Equipment
Property and equipment are stated at cost and depreciated using the straight-line method over the estimated useful lives of the assets. The furniture, fixtures, equipment, and computer software are depreciated over periods ranging from three to seven years. Leasehold improvements and assets under capital lease agreements are amortized over the shorter of the underlying lease agreement or the useful life of the asset.
Long-lived Assets
Long-lived assets are reviewed for impairment whenever events or changes in circumstances indicate that the carrying amount may not be recoverable. Recoverability of assets is measured by a comparison of the carrying amount of the asset to the undiscounted cash flows expected to be generated from the asset.
Intangible Assets
The intangible asset consists of a toll-free telephone number and an internet domain name. In accordance with the ASC Topic 350 (“Goodwill and Other Intangible Assets”) the intangible assets are not being amortized, and are subject to an annual review for impairment.
Fair Value of Financial Instruments
The carrying amounts of the Company’s cash and cash equivalents, accounts receivable, and accounts payable approximate fair value due to the short-term nature of these instruments.
Advertising
The Company’s advertising expenses consist primarily of television advertising, online marketing, and direct mail/print advertising. Television advertising costs are expensed as the advertisements are televised. Internet costs are expensed in the month incurred and direct mail/print costs are expensed when the related catalogs, brochures, and postcards are produced, distributed, or superseded.
Business Concentrations
The Company purchases its products from a variety of sources, including certain manufacturers, domestic distributors, and wholesalers. We have multiple suppliers for each of our products to obtain the lowest cost. There were four suppliers from whom we purchased approximately 50% of all products in fiscal 2015 compared to five suppliers in fiscal 2014.
Accounting for Share Based Compensation
The Company records compensation expense associated with restricted stock in accordance with ASC Topic 718 (“Share Based Payment”). The compensation expense related to all of the Company’s stock-based compensation arrangements is recorded as a component of general and administrative expenses.
| 29 |
NOTES TO CONSOLIDATED FINANCIAL STATEMENTS
(1) Summary of Significant Accounting Policies (Continued)
Comprehensive Income
The Company applies ASC Topic 220 (“Reporting Comprehensive Income”) which requires that all items that are recognized under accounting standards as components of comprehensive income be reported in a financial statement that is displayed with the same prominence as other financial statements. The items of other comprehensive income that are typically required to be displayed are foreign currency items, minimum pension liability adjustments, and unrealized gains and losses on certain investments in debt and equity securities. For the years ended March 31, 2015, 2014 and 2013 the Company recorded an unrealized loss of $17,000, $35,000 and $46,000 on its short term investments, respectively.
The following is a summary of our comprehensive income (in thousands):
|
March 31,
|
||||||||||||
|
2015
|
2014
|
2013
|
||||||||||
|
Net income
|
$ | 17,453 | $ | 17,972 | $ | 17,165 | ||||||
|
Net change in unrealized loss on short term investments
|
(17 | ) | (35 | ) | (46 | ) | ||||||
|
Comprehensive income
|
$ | 17,436 | $ | 17,937 | $ | 17,119 | ||||||
Income Taxes
The Company accounts for income taxes under the provisions of ASC Topic 740 (“Accounting for Income Taxes”) which generally requires the recognition of deferred tax assets and liabilities for the expected future tax benefits or consequences of events that have been included in the consolidated financial statements or tax returns. Under this method, deferred tax assets and liabilities are determined based on differences between the financial reporting carrying values and the tax bases of assets and liabilities, and are measured by applying enacted tax rates and laws for the taxable years in which those differences are expected to reverse. As required by “Accounting for Uncertainty in Income Taxes” guidance, which clarifies ASC Topic 740, the Company recognizes the financial statement benefit of a tax position only after determining that the relevant tax authority would more likely than not sustain the position following an audit. For tax positions meeting the more-likely-than-not threshold, the amount recognized in the Consolidated Financial Statements is the largest benefit that has a greater than 50 percent likelihood of being realized upon ultimate settlement with the relevant tax authority. The Company applies “Accounting for Uncertainty in Income Taxes” guidance to all tax positions for which the statute of limitations remained open. The Company files tax returns in the U.S. federal jurisdiction and Florida and Georgia. With few exceptions, the Company is no longer subject to U.S. federal, state or local income tax examinations by tax authorities for years ending March 31, 2010. Any interest and penalties related to income taxes will be recorded to other income (expenses).
Reclassifications
Certain reclassifications have been made to the prior years’ consolidated financial statements to conform to the fiscal 2015 presentation. These reclassifications had no impact on net income, shareholders’ equity or cash flows as previously reported.
Recent Accounting Pronouncements
The Company does not believe that any recently issued, but not yet effective, accounting standards, if currently adopted, will have a material effect on the Company’s consolidated financial position, results of operations, or cash flows.
| 30 |
NOTES TO CONSOLIDATED FINANCIAL STATEMENTS
(2) Fair Value Measurements
The Company carries various assets at fair value in the Consolidated Balance Sheets. Fair value is defined as an exit price, representing the amount that would be received to sell an asset or paid to transfer a liability in an orderly transaction between market participants. As such, fair value is a market-based measurement that should be determined based on assumptions that market participants would use in pricing an asset or a liability. ASC Topic 820 (“Fair Value Measurements”) establishes a three-tier fair value hierarchy, which prioritizes the inputs used in the valuation methodologies in measuring fair value:
Level 1 - Observable inputs that reflect quoted prices (unadjusted) for identical assets or liabilities in active markets.
Level 2 - Include other inputs that are directly or indirectly observable in the marketplace.
Level 3 - Unobservable inputs which are supported by little or no market activity.
The fair value hierarchy also requires an entity to maximize the use of observable inputs and minimize the use of unobservable inputs when measuring fair value. The Company’s cash equivalents and short term investments are classified within Level 1. Assets and liabilities measured at fair value are summarized below (in thousands):
|
Fair Value Measurement at March 31, 2015 Using
|
||||||||||||||||
|
Quoted Prices
|
Significant
|
|||||||||||||||
|
in Active
|
Other
|
Significant
|
||||||||||||||
|
Markets for
|
Observable
|
Unobservable
|
||||||||||||||
|
March 31,
|
Identical Assets
|
Inputs
|
Inputs
|
|||||||||||||
|
2015
|
(Level 1)
|
(Level 2)
|
(Level 3)
|
|||||||||||||
|
Assets:
|
||||||||||||||||
|
Cash and Cash equivalents - money market funds
|
$ | 35,613 | $ | 35,613 | $ | - | $ | - | ||||||||
|
Short term investments -bond mutual funds
|
15,591 | 15,591 | - | - | ||||||||||||
| $ | 51,204 | $ | 51,204 | $ | - | $ | - | |||||||||
(3) Property and Equipment
Major classifications of property and equipment consist of the following (in thousands):
|
March 31,
|
||||||||
|
2015
|
2014
|
|||||||
|
Leasehold improvements
|
$ | 1,119 | $ | 1,124 | ||||
|
Computer software
|
3,391 | 2,749 | ||||||
|
Furniture, fixtures and equipment
|
4,686 | 5,771 | ||||||
| 9,196 | 9,644 | |||||||
|
Less: accumulated depreciation
|
(7,627 | ) | (8,334 | ) | ||||
|
Property and equipment, net
|
$ | 1,569 | $ | 1,310 | ||||
| 31 |
NOTES TO CONSOLIDATED FINANCIAL STATEMENTS
(4) Accrued Expenses and Other Current Liabilities
Major classifications of accrued expenses and other current liabilities consist of the following (in thousands):
|
March 31,
|
||||||||
|
2015
|
2014
|
|||||||
|
Accrued sales tax
|
$ | 465 | $ | 478 | ||||
|
Accrued credit card fees
|
285 | 275 | ||||||
|
Accrued salaries and benefits
|
741 | 754 | ||||||
|
Accrued professional expenses
|
225 | 275 | ||||||
|
Accrued sales return allowance
|
147 | 143 | ||||||
|
Accrued dividends payable
|
212 | 262 | ||||||
|
Other accrued liabilities
|
139 | 138 | ||||||
|
Accrued expenses and other current liabilities
|
$ | 2,214 | $ | 2,325 | ||||
(5) Net Income Per Share
In accordance with the provisions of ASC Topic 260 (“Earnings Per Share”) basic net income per share is computed by dividing net income available to common shareholders by the weighted average number of common shares outstanding during the period. Diluted net income per common share includes the dilutive effect of potential restricted stock and the effects of the potential conversion of preferred shares, calculated using the treasury stock method. Unvested restricted stock, and convertible preferred shares issued by the Company represent the only dilutive effect reflected in diluted weighted average shares outstanding.
The following is a reconciliation of the numerators and denominators of the basic and diluted net income per share computations for the periods presented (in thousands, except for per share amounts):
|
Year Ended March 31,
|
||||||||||||
|
2015
|
2014
|
2013
|
||||||||||
|
Net income (numerator):
|
||||||||||||
|
Net income
|
$ | 17,453 | $ | 17,972 | $ | 17,165 | ||||||
|
Shares (denominator)
|
||||||||||||
|
Weighted average number of common shares outstanding used in basic computation
|
20,015 | 19,901 | 19,926 | |||||||||
|
Common shares issuable upon the vesting of restricted stock
|
111 | 132 | 113 | |||||||||
|
Common shares issuable upon conversion of preferred shares
|
10 | 10 | 10 | |||||||||
|
Shares used in diluted computation
|
20,136 | 20,043 | 20,049 | |||||||||
|
Net income per common share:
|
||||||||||||
|
Basic
|
$ | 0.87 | $ | 0.90 | $ | 0.86 | ||||||
|
Diluted
|
$ | 0.87 | $ | 0.90 | $ | 0.86 | ||||||
At March 31, 2015 and 2014, all restricted stock was included in the diluted net income per common share computation.
| 32 |
NOTES TO CONSOLIDATED FINANCIAL STATEMENTS
(6) Income Taxes
Deferred income taxes reflect the net tax effects of temporary differences between the carrying amount of assets and liabilities for financial reporting purposes and the amounts used for income tax purposes. The tax effects of temporary differences that give rise to significant portions of deferred tax assets and deferred tax liabilities are as follows (in thousands):
|
March 31,
|
||||||||
|
2015
|
2014
|
|||||||
|
Deferred tax assets:
|
||||||||
|
Accrued expenses
|
$ | 545 | $ | 679 | ||||
|
Deferred stock compensation
|
246 | 248 | ||||||
|
Net operating loss carryforward
|
- | 53 | ||||||
|
Bad debt and inventory reserves
|
26 | 35 | ||||||
|
Property and equipment
|
23 | - | ||||||
|
Total deferred tax assets
|
840 | 1,015 | ||||||
|
Deferred tax liabilities:
|
||||||||
|
Property and equipment
|
- | (18 | ) | |||||
|
Total net deferred taxes
|
$ | 840 | $ | 997 | ||||
At March 31, 2015, the Company had no federal net operating loss carryforwards.
The components of the income tax provision consist of the following (in thousands):
|
Year Ended March 31,
|
||||||||||||
|
2015
|
2014
|
2013
|
||||||||||
|
Current taxes
|
||||||||||||
|
Federal
|
$ | 9,303 | $ | 9,689 | $ | 9,588 | ||||||
|
State
|
885 | 921 | 913 | |||||||||
|
Total current taxes
|
10,188 | 10,610 | 10,501 | |||||||||
|
Deferred taxes
|
||||||||||||
|
Federal
|
143 | (167 | ) | (329 | ) | |||||||
|
State
|
14 | (16 | ) | (31 | ) | |||||||
|
Total deferred taxes
|
157 | (183 | ) | (360 | ) | |||||||
|
Total provision for income taxes
|
$ | 10,345 | $ | 10,427 | $ | 10,141 | ||||||
The reconciliation of income tax provision computed at the U.S. federal statutory tax rates to income tax expense is as follows (in thousands):
|
Year Ended March 31,
|
||||||||||||
|
2015
|
2014
|
2013
|
||||||||||
|
Income taxes at U.S. statutory rates
|
$ | 9,729 | $ | 9,940 | $ | 9,557 | ||||||
|
State income taxes, net of federal tax benefit
|
589 | 583 | 562 | |||||||||
|
Permanent differences
|
(29 | ) | (35 | ) | (74 | ) | ||||||
|
Other
|
56 | (61 | ) | 96 | ||||||||
|
Total provision for income taxes
|
$ | 10,345 | $ | 10,427 | $ | 10,141 | ||||||
| 33 |
NOTES TO CONSOLIDATED FINANCIAL STATEMENTS
(7) Discontinued Project Costs
During the quarter ended September 30, 2014 the Company discontinued an information technology project related to a new software platform, which was intended to be put into service and capitalized during the September quarter. The Company expensed a one-time project charge of $1.7 million in the September quarter. The net after tax impact of this one-time charge was $1.1 million, or $0.05 diluted per share. The Company does not expect any additional future expenditures relating to this discontinued project. Management determined that it was not in the best interest of the Company to proceed with this project. The Company decided to continue with, and upgrade, its current software platform.
(8) Shareholders’ Equity
Preferred Stock
In April 1998, the Company issued 250,000 shares of its $.001 par value preferred stock at a price of $4.00 per share, less issuance costs of $112,187. Each share of the preferred stock is convertible into approximately 4.05 shares of common stock at the election of the shareholder. The shares have a liquidation value of $4.00 per share and may pay dividends at the sole discretion of the Company. The Company does not anticipate paying dividends to the preferred shareholders in the foreseeable future. Each share of preferred stock is entitled to one vote on all matters submitted to a vote of shareholders of the Company. As of March 31, 2015 and 2014, 2,500 shares of the convertible preferred stock remained unconverted and outstanding.
Share Repurchase Plan
On November 8, 2006, the Company’s Board of Directors approved a share repurchase plan of up to $20.0 million. On October 31, 2008, November 1, 2010, and August 1, 2011, the Company’s Board of Directors approved a second, third, and fourth share repurchase plan, respectively, each for an additional $20.0 million. The repurchase plan is intended to be implemented through purchases made from time to time in either the open market or through private transactions at the Company’s discretion, subject to market conditions and other factors, in accordance with Securities and Exchange Commission requirements. There can be no assurances as to the precise number of shares that will be repurchased under the share repurchase plan, and the Company may discontinue the share repurchase plan at any time subject to compliance with applicable regulatory requirements. Shares purchased pursuant to the share repurchase plan will either be cancelled or held in the Company’s treasury. During fiscal 2014 and 2015 the Company had no share repurchases. As of March 31, 2015 the Company had approximately $10.2 million remaining under the Company’s share repurchase plan.
Dividends
On August 3, 2009, the Company’s Board of Directors declared its first quarterly dividend of $0.10 per share on its common stock. On August 2, 2010, the Company’s Board of Directors increased the quarterly dividend to $0.125 per share, and then on January 27, 2012, the Company’s Board of Directors increased the quarterly dividend to $0.15 per share. On December 3, 2012, the Company’s Board of Directors declared a special dividend of $1.00 per share on its common stock. On July 26, 2013, the Company’s Board of Directors increased the quarterly dividend to $0.17 per share. The Company intends to continue to pay regular quarterly dividends; however the declaration and payment of future dividends is discretionary and will be subject to a determination by the Board of Directors each quarter following its review of the Company’s financial performance.
| 34 |
NOTES TO CONSOLIDATED FINANCIAL STATEMENTS
(8) Shareholders’ Equity (Continued)
During fiscal 2015, our Board of Directors declared the following dividends:
|
Declaration Date
|
Per Share
Dividend |
Record Date
|
Total Amount
(In thousands) |
Payment Date
|
||||||
|
May 2, 2014
|
$ | 0.170 |
May 14, 2014
|
$ | 3,432 |
May 23, 2014
|
||||
|
July 21, 2014
|
$ | 0.170 |
August 4, 2014
|
$ | 3,446 |
August 15, 2014
|
||||
|
October 20, 2014
|
$ | 0.170 |
November 3, 2014
|
$ | 3,445 |
November 14, 2014
|
||||
|
January 20, 2015
|
$ | 0.170 |
February 3, 2015
|
$ | 3,445 |
February 13, 2015
|
||||
(9) Restricted Stock
On July 28, 2006, the Company received shareholder approval for the adoption of the 2006 Employee Equity Compensation Restricted Stock Plan (the “Employee Plan”) and the 2006 Outside Director Equity Compensation Restricted Stock Plan (the “Director Plan”). The purpose of the plans is to promote the interests of the Company by securing and retaining both employees and outside directors. The Company had reserved 1.0 million shares of common stock for issuance under the Employee Plan, and 200,000 shares of common stock for issuance under the Director Plan. In July 2012 the Company received shareholder approval to ratify the amendment to the Company’s Director Plan passed by the Board of Directors to increase the number of shares available for issuance under the Director Plan from 200,000 to 400,000. Additionally, the Company received shareholder approval to ratify the amendment passed by the Board of Directors to provide for a 10% automatic increase every year in the amount of shares available for issuance under each of the plans. The value of the restricted stock is determined based on the market value of the stock at the issuance date. The restriction period or forfeiture period is determined by the Company’s Board and is to be no less than 1 year and no more than ten years. The Company had 773,212 restricted common shares issued under the Employee Plan and 242,000 restricted common shares issued under the Director Plan at March 31, 2015, all shares of which were issued subject to a restriction or forfeiture period which will lapse ratably on the first, second, and third anniversaries of the date of grant, and the fair value of which is being amortized over the three-year restriction period. For both the years ended March 31, 2015 and 2014, the Company recognized compensation expense related to the Employee and Director Plans of $1.5 million, respectively.
A summary of the Company’s non-vested restricted stock as of March 31, 2015 is as follows:
|
Employee
Plan Number of Shares (In thousands) |
Director
Plan Number of Shares (In thousands) |
Both Plans
Number of Shares (In thousands) |
||||||||||
|
Non-vested restricted stock outstanding at March 31, 2014
|
170 | 60 | 230 | |||||||||
|
Restricted stock granted
|
51 | 30 | 81 | |||||||||
|
Restricted stock vested
|
(83 | ) | (30 | ) | (113 | ) | ||||||
|
Restricted stock forfeited or expired
|
(10 | ) | - | (10 | ) | |||||||
|
Non-vested restricted stock outstanding at March 31, 2015
|
128 | 60 | 188 | |||||||||
At March 31, 2015 and 2014, there were 188,017 and 229,558 non-vested restricted stock shares outstanding, respectively. During the fiscal years ended March 31, 2015 and 2014, the Company issued, net of forfeitures, 71,858 and 81,500 restricted shares, respectively. At March 31, 2015 and 2014, there were $2.0 million and $2.5 million of unrecognized compensation cost related to the non-vested restricted stock awards, respectively, which is expected to be recognized over the remaining weighted average vesting period of 1.5 years and 2.0 years for fiscal 2015 and 2014, respectively.
| 35 |
NOTES TO CONSOLIDATED FINANCIAL STATEMENTS
(10) Valuation and Qualifying Accounts
Activity in the Company’s valuation and qualifying accounts consists of the following (in thousands):
|
Year Ended March 31,
|
||||||||||||
|
2015
|
2014
|
2013
|
||||||||||
|
Allowance for doubtful accounts:
|
||||||||||||
|
Balance at beginning of period
|
$ | 7 | $ | 5 | $ | 5 | ||||||
|
Provision for doubtful accounts
|
95 | 95 | 56 | |||||||||
|
Write-off of uncollectible accounts receivable
|
(94 | ) | (93 | ) | (56 | ) | ||||||
|
Balance at end of year
|
$ | 8 | $ | 7 | $ | 5 | ||||||
(11) Commitments and Contingencies
Legal Matters and Routine Proceedings
The Company has settled complaints that had been filed with various states’ pharmacy boards in the past. There can be no assurances made that other states will not attempt to take similar actions against the Company in the future. The Company initiates litigation to protect its trade or service marks. There can be no assurance that the Company will be successful in protecting its trade or service marks. Legal costs related to the above matters are expensed as incurred.
Employment Agreements
On January 25, 2013, the Company amended the existing Executive Employment Agreement of Menderes Akdag, the Company’s President, Chief Executive Officer, and Director, and entered into Amendment No. 4 to the Executive Employment Agreement with Mr. Akdag. The Agreement amended certain provisions of the Executive Employment Agreement as follows: the term of the Agreement is for three years, commencing on March 16, 2013; Mr. Akdag’s salary remained at $550,000 per year throughout the term of the Agreement, and Mr. Akdag was granted 108,000 shares of restricted stock. The restricted stock was granted on March 16, 2013, in accordance with the Company’s 2006 Employee Equity Compensation Restricted Stock Plan and the restrictions lapse ratably over a three-year period.
Operating Lease
The Company leases its 65,300 square foot executive offices, warehouse facility, and customer service and pharmacy contact centers under a non-cancelable operating lease. On April 30, 2014, the Company entered into a seventh amendment of its operating lease agreement to extend its existing lease until December 1, 2016. The Company is responsible for certain maintenance costs, taxes, and insurance under this lease.
The future minimum annual lease payments are as follows:
|
Years Ending March 31, (in thousands)
|
|||||
|
2016
|
781 | ||||
|
2017
|
519 | ||||
|
Total lease payments
|
$ | 1,300 | |||
Rent expense was $794,000, $785,000, and $767,000 for the years ended March 31, 2015, 2014 and 2013, respectively.
| 36 |
NOTES TO CONSOLIDATED FINANCIAL STATEMENTS
(12) Employee Benefit Plan
The Company maintains a 401(k) Savings Plan for eligible employees. The plan is a defined contribution plan that is administered by the Company. All regular, full-time employees are eligible for voluntary participation upon completing one year of service and having attained the age of 21. The plan provides for growth in savings through contributions and income from investments. It is subject to the provisions of the Employee Retirement Income Security Act of 1974, as amended. Plan participants are allowed to contribute a specified percentage of their base salary. In 2006, the Company adopted a matching plan which is funded subsequent to the calendar year. During the fiscal years ended March 31, 2015 and 2014, the Company charged $187,000 and $181,000, respectively, of 401(k) matching contribution and administration expense to general and administrative expenses.
(13) Quarterly Financial Data (Unaudited)
Summarized unaudited quarterly financial data for fiscal 2015 and 2014 is as follows (in thousands, except for per share amounts):
|
Quarter Ended:
|
June 30, 2014
|
September 30, 2014
|
December 31, 2014
|
March 31, 2015
|
|||||||||||||
|
Sales
|
$ | 72,541 | $ | 57,576 | $ | 49,284 | $ | 49,994 | |||||||||
|
Gross Profit
|
$ | 23,772 | $ | 18,459 | $ | 17,100 | $ | 16,939 | |||||||||
|
Income from operations
|
$ | 7,838 | $ | 4,290 | $ | 7,666 | $ | 7,819 | |||||||||
|
Net income
|
$ | 4,973 | $ | 2,732 | $ | 4,797 | $ | 4,951 | |||||||||
|
Diluted net income per common share
|
$ | 0.25 | $ | 0.14 | $ | 0.24 | $ | 0.25 | |||||||||
|
Quarter Ended:
|
June 30, 2013 |
September 30, 2013
|
December 31, 2013
|
March 31, 2014
|
|||||||||||||
|
Sales
|
$ | 74,194 | $ | 60,479 | $ | 50,086 | $ | 48,632 | |||||||||
|
Gross Profit
|
$ | 24,013 | $ | 19,252 | $ | 16,889 | $ | 17,463 | |||||||||
|
Income from operations
|
$ | 7,497 | $ | 6,532 | $ | 7,047 | $ | 7,142 | |||||||||
|
Net income
|
$ | 4,755 | $ | 4,150 | $ | 4,541 | $ | 4,526 | |||||||||
|
Diluted net income per common share
|
$ | 0.24 | $ | 0.21 | $ | 0.23 | $ | 0.23 | |||||||||
(14) Subsequent Events
On May 4, 2015, the Company’s Board of Directors declared an increased quarterly dividend of $0.18 per share on its common stock. The $3.6 million dividend was paid on May 22, 2015, to shareholders of record at the close of business on May 15, 2015.
| 37 |
REPORT OF MANAGEMENT ON INTERNAL CONTROL OVER FINANCIAL REPORTING
Management of the Company is responsible for the preparation and integrity of the Consolidated Financial Statements appearing in our Annual Report on Form 10-K. The financial statements were prepared in conformity with generally accepted accounting principles appropriate in the circumstances and, accordingly, include certain amounts based on our best judgments and estimates. Financial information in the Annual Report on Form 10-K is consistent with that in the financial statements.
Management of the Company is responsible for establishing and maintaining adequate internal control over financial reporting, as such term is defined in Rules 13a-15(f) under the Securities Exchange Act of 1934 (“Exchange Act”). The Company’s internal control over financial reporting is designed to provide reasonable assurance regarding the reliability of financial reporting and the preparation of the Consolidated Financial Statements. Our internal control over financial reporting is supported by a team of consultants and appropriate reviews by management, written policies and guidelines, careful selection and training of qualified personnel, and a written Corporate Code of Business Conduct and Ethics adopted by our Company’s Board of Directors, applicable to all Company Directors and all officers and employees of our Company and subsidiaries.
Because of its inherent limitations, internal control over financial reporting may not prevent or detect misstatements and even when determined to be effective, can only provide reasonable assurance with respect to financial statement preparation and presentation. Also, projections of any evaluation of effectiveness to future periods are subject to the risk that controls may become inadequate because of changes in conditions, or that the degree of compliance with the policies or procedures may deteriorate.
The Audit Committee (“Committee”) of our Company’s Board of Directors, comprised solely of Directors who are independent in accordance with the requirements of The NASDAQ Stock Market LLC listing standards, the Exchange Act and the Company’s Corporate Governance Guidelines, meets with the independent auditors and management periodically to discuss internal control over financial reporting, and auditing and financial reporting matters. The Committee reviews with the independent auditors the scope and results of the audit effort. The Committee also meets periodically with the independent auditors without management present to ensure that the independent auditors have free access to the Committee. Our Audit Committee’s Report can be found in the Company’s 2015 Proxy Statement.
Management assessed the effectiveness of the Company’s internal control over financial reporting as of March 31, 2015. In making this assessment, management used the criteria set forth by the Committee of Sponsoring Organizations of the Treadway Commission (COSO) in Internal Control – Integrated Framework. Based on our assessment, management believes that the Company maintained effective internal control over financial reporting as of March 31, 2015.
The Company’s independent auditors, McGladrey LLP, a registered public accounting firm, are appointed by the Audit Committee of the Company’s Board of Directors, subject to ratification by our Company’s shareholders. McGladrey LLP have audited and reported on the Consolidated Financial Statements of PetMed Express, Inc. and subsidiaries, and issued a report on the Company’s internal control over financial reporting. The reports of the independent auditors are contained in our Annual Report on Form 10-K.
|
/s/ Menderes Akdag
|
|||
|
Menderes Akdag
|
|||
|
President, Chief Executive Officer, Director
|
|||
May 22, 2015
| /s/ Bruce S. Rosenbloom | |||
| Bruce S. Rosenbloom | |||
| Chief Financial Officer | |||
May 22, 2015
| 38 |
REPORT OF INDEPENDENT REGISTERED PUBLIC ACCOUNTING FIRM
To the Board of Directors and Shareholders
PetMed Express, Inc. and subsidiaries:
We have audited PetMed Express, Inc. and subsidiaries’ internal control over financial reporting as of March 31, 2015, based on criteria established in Internal Control—Integrated Framework issued by the Committee of Sponsoring Organizations of the Treadway Commission in 2013. PetMed Express, Inc. and subsidiaries’ management is responsible for maintaining effective internal control over financial reporting and for its assessment of the effectiveness of internal control over financial reporting included in the accompanying Report of Management on Internal Control over Financial Reporting. Our responsibility is to express an opinion on the company’s internal control over financial reporting based on our audit.
We conducted our audit in accordance with the standards of the Public Company Accounting Oversight Board (United States). Those standards require that we plan and perform the audit to obtain reasonable assurance about whether effective internal control over financial reporting was maintained in all material respects. Our audit included obtaining an understanding of internal control over financial reporting, assessing the risk that a material weakness exists, and testing and evaluating the design and operating effectiveness of internal control based on the assessed risk. Our audit also included performing such other procedures as we considered necessary in the circumstances. We believe that our audit provides a reasonable basis for our opinion.
A company’s internal control over financial reporting is a process designed to provide reasonable assurance regarding the reliability of financial reporting and the preparation of financial statements for external purposes in accordance with generally accepted accounting principles. A company’s internal control over financial reporting includes those policies and procedures that (a) pertain to the maintenance of records that, in reasonable detail, accurately and fairly reflect the transactions and dispositions of the assets of the company; (b) provide reasonable assurance that transactions are recorded as necessary to permit preparation of financial statements in accordance with generally accepted accounting principles, and that receipts and expenditures of the company are being made only in accordance with authorizations of management and directors of the company; and (c) provide reasonable assurance regarding prevention or timely detection of unauthorized acquisition, use, or disposition of the company’s assets that could have a material effect on the financial statements.
Because of its inherent limitations, internal control over financial reporting may not prevent or detect misstatements. Also, projections of any evaluation of effectiveness to future periods are subject to the risk that controls may become inadequate because of changes in conditions, or that the degree of compliance with the policies or procedures may deteriorate.
In our opinion, PetMed Express, Inc. and subsidiaries maintained, in all material respects, effective internal control over financial reporting as of March 31, 2015, based on criteria established in Internal Control—Integrated Framework issued by the Committee of Sponsoring Organizations of the Treadway Commission in 2013.
We have also audited, in accordance with the standards of the Public Company Accounting Oversight Board (United States), the consolidated financial statements of PetMed Express, Inc. and subsidiaries and our report dated May 22, 2015 expressed an unqualified opinion.
| /s/ McGladrey LLP | |||
| McGladrey LLP | |||
Fort Lauderdale, Florida
May 22, 2015
| 39 |
ITEM 9. CHANGES IN AND DISAGREEMENTS WITH ACCOUNTANTS ON ACCOUNTING AND FINANCIAL DISCLOSURE
None.
ITEM 9A. CONTROLS AND PROCEDURES
Evaluation of Disclosure Controls and Procedures
The Company’s management, including our Chief Executive Officer and Chief Financial Officer, has conducted an evaluation of the effectiveness of the design and operation of our disclosure controls and procedures (as defined in Rule 13a-15(e) and 15d-15(e) promulgated under the Securities Exchange Act of 1934, as amended) as of March 31, 2015, the end of the period covered by this report (the “Evaluation Date”). Based upon that evaluation, our Chief Executive Officer and Chief Financial Officer concluded as of the Evaluation Date, that our disclosure controls and procedures were effective such that the information relating to PetMed Express, Inc., including our consolidated subsidiaries, required to be disclosed in our Securities and Exchange Commission (“SEC”) reports (i) is recorded, processed, summarized, and reported within the time periods specified in SEC rules and forms and (ii) is accumulated and communicated to our management including our Chief Executive Officer and Chief Financial Officer, as appropriate, to allow timely decisions regarding required disclosure.
Management’s Report on Internal Control over Financial Reporting
Our management is responsible for establishing and maintaining adequate internal control over financial reporting, as such term is defined in Exchange Act Rule 13a-15(f). Under the supervision and with the participation of our management, including our Chief Executive Officer and Chief Financial Officer, we conducted an evaluation of the effectiveness of our internal control over financial reporting as of March 31, 2015 based on the framework in Internal Control — Integrated Framework issued by the Committee of Sponsoring Organizations of the Treadway Commission. Based on our evaluation under the framework in Internal Control — Integrated Framework, our management concluded that the Company maintained effective internal control over financial reporting as of March 31, 2015, as stated in our report which is included herein. Our internal control over financial reporting as of March 31, 2015 has been audited by McGladrey LLP, an independent registered public accounting firm, as stated in their report which is included herein.
Changes in Internal Controls over Financial Reporting
There have been no changes in our internal controls over financial reporting during our last fiscal quarter that have materially affected, or are reasonably likely to materially affect, our internal control over financial reporting.
ITEM 9B. OTHER INFORMATION
Not applicable.
| 40 |
PART III
ITEM 10. DIRECTORS, EXECUTIVE OFFICERS, AND CORPORATE GOVERNANCE
The information required by this item will be set forth in our Proxy Statement, to be filed with the SEC within 120 days after the end of the fiscal year ended March 31, 2015, relating to our 2015 Annual Meeting of Stockholders to be held on July 24, 2015, and is incorporated herein by reference.
We adopted a Code of Business Conduct and Ethics applicable to all officers, directors, and employees. The Company’s Code of Business Conduct and Ethics may be found in our 2004 Proxy which was filed on June 30, 2004. You may also obtain a copy of our Code of Business Conduct and Ethics free of charge by contacting Investor Relations at 1-800-738-6337.
ITEM 11. EXECUTIVE COMPENSATION
The information required by this item will be set forth in our Proxy Statement, to be filed with the SEC within 120 days after the end of the fiscal year ended March 31, 2015, relating to our 2015 Annual Meeting of Stockholders to be held on July 24, 2015, and is incorporated herein by reference.
ITEM 12. SECURITY OWNERSHIP OF CERTAIN BENEFICIAL OWNERS AND MANAGEMENT AND RELATED STOCKHOLDER MATTERS
The information required by this item (other than information required by Item 201(d) of Regulation S-K with respect to equity compensation plans, which is set forth under Item 5. in this Annual Report on Form 10-K) will be set forth in our Proxy Statement, to be filed with the SEC within 120 days after the end of the fiscal year ended March 31, 2015, relating to our 2015 Annual Meeting of Stockholders to be held on July 24, 2015, and is incorporated herein by reference.
ITEM 13. CERTAIN RELATIONSHIPS AND RELATED TRANSACTIONS, AND DIRECTOR INDEPENDENCE
The information required by this item will be set forth in our Proxy Statement, to be filed with the SEC within 120 days after the end of the fiscal year ended March 31, 2015, relating to our 2015 Annual Meeting of Stockholders to be held on July 24, 2015, and is incorporated herein by reference.
ITEM 14. PRINCIPAL ACCOUNTANT FEES AND SERVICES
The information required by this item will be set forth in our Proxy Statement, to be filed with the SEC within 120 days after the end of the fiscal year ended March 31, 2015, relating to our 2015 Annual Meeting of Stockholders to be held on July 24, 2015, and is incorporated herein by reference.
| 41 |
PART IV
ITEM 15. EXHIBITS, FINANCIAL STATEMENT SCHEDULES
(a) The following documents are filed as part of this report on Form 10-K.
(1) Consolidated Financial Statements
The following exhibits are filed as part of this report on Form 10-K.
(3) Articles of Incorporation and By-Laws
|
|
3.1
|
Amended and Restated Articles of Incorporation (incorporated by reference to Exhibit 3.1 to the Registration Statement on Form 10-SB, File No. 000-28827, filed January 10, 2000).
|
|
|
3.2
|
Articles of Amendment to the Amended and Restated Articles of Incorporation
filed June 6, 2001.*
|
|
|
3.3
|
By-Laws of the Corporation (incorporated by reference to Exhibit 3.3 to the Registration Statement on Form 10-SB, File No. 000-28827, filed January 10, 2000).
|
(4) Instruments Defining the Rights of Security Holders
|
|
4.1
|
Specimen common stock certificate (incorporated by reference to Exhibit 4.2 to the Registration Statement on Form 10-SB, File No. 000-28827, filed January 10, 2000).
|
(10) Material Contracts
|
|
10.1
|
1998 Stock Option Plan incorporated by reference to Exhibit 10.1 to the Registration Statement on Form 10-SB, File No. 000-28827, filed January 10, 2000).
|
|
|
10.2
|
Employment Agreement with Menderes Akdag (incorporated by reference to Exhibit 10 of the Registrant’s Form 8-K filed March 30, 2001).
|
|
|
10.3
|
Agreement for the Sale and Leaseback of the Land and Building (incorporated by reference to Exhibit 99.1 of the Registrant’s Form 8-K filed June 14, 2001).
|
|
|
10.4
|
Amendment Number 1 to Executive Employment Agreement with Menderes Akdag (incorporated by reference to Exhibit 99.1 of the Registrant’s Form 8-K filed March 18, 2004).
|
|
|
10.5
|
Amendment Number 2 to Executive Employment Agreement with Menderes Akdag (incorporated by reference to Exhibit 10.1 of the Registrant’s Form 8-K filed February 28, 2007).
|
|
|
10.6
|
2006 Employee Equity Compensation Restricted Stock Plan (incorporated by reference to our definitive Proxy Statement for our 2006 Annual Meeting of Stockholders filed June 22, 2006).
|
|
|
10.7
|
2006 Outside Director Equity Compensation Restricted Stock Plan (incorporated by reference to our definitive Proxy Statement for our 2006 Annual Meeting of Stockholders filed June 22, 2006).
|
|
|
10.8
|
Employment Letter with Bruce Rosenbloom dated May 30, 2001 (incorporated by reference to Exhibit 10.9 of the Registrant’s Form 8-K filed April 7, 2009).
|
|
|
10.9
|
Amendment Number 3 to Executive Employment Agreement with Menderes Akdag (incorporated by reference to Exhibit 10.1 of the Registrant’s Form 8-K filed February 8, 2010).
|
|
|
10.10
|
Amendment Number 4 to Executive Employment Agreement with Menderes Akdag (incorporated by reference to Exhibit 10.1 of the Registrant’s Form 8-K filed January 28, 2013).
|
(14) Corporate Code of Ethics
|
|
14.1
|
Corporate Code of Ethics (incorporated by reference to our definitive Proxy Statement for our 2004 Annual Meeting of Stockholders filed June 30, 2004).
|
(21) Subsidiaries of Registrant
|
|
21.1
|
Subsidiaries of Registrant*
|
(31) Certifications
|
|
31.1
|
Certification of Chief Executive Officer pursuant to Rule 13a-14(a)/15d-14(a).*
|
|
|
31.2
|
Certification of Chief Financial Officer pursuant to Rule 13a-14(a)/15d-14(a).*
|
(32) Certifications
|
|
32.1
|
Certification of Principal Executive Officer and Principal Financial Officer pursuant to Section 1350.**
|
*Filed herewith **Furnished herewith
| 42 |
SIGNATURES
Pursuant to the requirements of Section 13 or 15(d) of the Securities Exchange Act of 1934, as amended, the registrant has duly caused this report to be signed on its behalf by the undersigned, thereunto duly authorized.
Dated: May 22, 2015
|
PETMED EXPRESS, INC.
(the “registrant”)
|
||
|
By: /s/ Menderes Akdag
|
||
|
Menderes Akdag
Chief Executive Officer and President
(principal executive officer)
|
Pursuant to the requirements of the Securities Exchange Act of 1934, this report has been signed below by the following persons on behalf of the registrant and in the capacities on May 22, 2015.
|
SIGNATURE
|
TITLE
|
|
|
|
Chief Executive Officer and President
|
|
|
/s/ Menderes Akdag
|
(principal executive officer)
|
|
|
Menderes Akdag
|
Officer and Director
|
|
|
/s/ Robert C. Schweitzer
|
Chairman of the Board
|
|
|
Robert C. Schweitzer
|
Director
|
|
| Chief Financial Officer and Treasurer | ||
|
/s/ Bruce S. Rosenbloom
|
(principal financial and accounting officer)
|
|
|
Bruce S. Rosenbloom
|
Officer
|
|
|
/s/ Ronald J. Korn
|
Director
|
|
|
Ronald J. Korn
|
||
|
/s/ Gian M. Fulgoni
|
Director
|
|
|
Gian M. Fulgoni
|
||
|
/s/ Frank J. Formica
|
Director
|
|
|
Frank J. Formica
|
| 43 |