Attached files
| file | filename |
|---|---|
| EXCEL - IDEA: XBRL DOCUMENT - Booz Allen Hamilton Holding Corp | Financial_Report.xls |
| EX-32.1 - EXHIBIT 32.1 - Booz Allen Hamilton Holding Corp | bah-20150331xex321.htm |
| EX-32.2 - EXHIBIT 32.2 - Booz Allen Hamilton Holding Corp | bah-20150331xex322.htm |
| EX-31.2 - EXHIBIT 31.2 - Booz Allen Hamilton Holding Corp | bah-20150331xex312.htm |
| EX-31.1 - EXHIBIT 31.1 - Booz Allen Hamilton Holding Corp | bah-20150331xex311.htm |
| EX-10.14 - EXHIBIT 10.14 - Booz Allen Hamilton Holding Corp | bah-20150331xex1014.htm |
| EX-23 - EXHIBIT 23 - Booz Allen Hamilton Holding Corp | bah-20150331xex23.htm |
UNITED STATES
SECURITIES AND EXCHANGE COMMISSION
WASHINGTON, D.C. 20549
___________________________________
FORM 10-K
___________________________________
(Mark One)
ý | ANNUAL REPORT PURSUANT TO SECTION 13 OR 15(D) OF THE SECURITIES EXCHANGE ACT OF 1934 |
For the fiscal year ended March 31, 2015
¨ | TRANSITION REPORT PURSUANT TO SECTION 13 OR 15(D) OF THE SECURITIES EXCHANGE ACT OF 1934 |
For the transition period from to
Commission File No. 001-34972
___________________________________
Booz Allen Hamilton Holding Corporation
(Exact name of registrant as specified in its charter)
___________________________________
Delaware | 26-2634160 | |
(State or other jurisdiction of incorporation or organization) | (I.R.S. Employer Identification No.) | |
8283 Greensboro Drive, McLean, Virginia | 22102 | |
(Address of principal executive offices) | (Zip Code) | |
(703) 902-5000
Registrant’s telephone number, including area code
Securities registered pursuant to Section 12(b) of the Act:
Title of Each Class | Name of Each Exchange on Which Registered | |
Class A Common Stock | New York Stock Exchange | |
Securities registered pursuant to Section 12(g) of the Act:
None.
__________________
Indicate by check mark if the registrant is a well-known seasoned issuer, as defined in Rule 405 of the Securities Act. Yes ý No ¨
Indicate by check mark if the registrant is not required to file reports pursuant to Section 13 or Section 15(d) of the Act. Yes ¨ No ý
Note — Checking the box above will not relieve any registrant required to file reports pursuant to Section 13 or 15(d) of the Exchange Act from their obligations under those sections.
Indicate by check mark whether the registrant (1) has filed all reports required to be filed by Section 13 or 15(d) of the Securities Exchange Act of 1934 during the preceding 12 months (or for such shorter period that the registrant was required to file such reports), and (2) has been subject to such filing requirements for the past 90 days. Yes ý No ¨
Indicate by check mark whether the registrant has submitted electronically and posted on its corporate Web site, if any, every Interactive Data File required to be submitted and posted pursuant to Rule 405 of Regulation S-T (§232.405 of this chapter) during the preceding 12 months (or for such shorter period that the registrant was required to submit and post such files). Yes ý No ¨
Indicate by check mark if disclosure of delinquent filers pursuant to Item 405 of Regulation S-K (§ 229.405 of this chapter) is not contained herein, and will not be contained, to the best of registrant’s knowledge, in definitive proxy or information statements incorporated by reference in Part III of this Form 10-K or any amendment to this Form 10-K. ¨
Indicate by check mark whether the registrant is a large accelerated filer, an accelerated filer, a non-accelerated filer or a smaller reporting company. See definition of “large accelerated filer,” “accelerated filer” and “smaller reporting company” in Rule 12b-2 of the Exchange Act. (Check one):
Large accelerated filer | ý | Accelerated filer | ¨ | |||
Non-accelerated filer | ¨ (Do not check if a smaller reporting company) | Smaller reporting company | ¨ | |||
Indicate by check mark whether the registrant is a shell company (as defined in Rule 12b-2 of the Exchange Act). Yes ¨ No ý
As of September 30, 2014, the market value of the voting and non-voting common equity held by non-affiliates based on the closing price as of that day was $1,851,829,177.
Indicate the number of shares outstanding of each of the issuer’s classes of common stock, as of the latest practicable date.
Shares Outstanding as of May 15, 2015 | ||
Class A Common Stock | 147,236,512 | |
Class B Non-Voting Common Stock | — | |
Class C Restricted Common Stock | — | |
Class E Special Voting Common Stock | 1,851,590 | |
Portions of the registrant’s Proxy Statement for its Annual Meeting of Stockholders scheduled for July 30, 2015 are incorporated by reference into Part III.
TABLE OF CONTENTS
Item 1. | ||
Item 1A. | ||
Item 1B. | ||
Item 2. | ||
Item 3. | ||
Item 4. | ||
Item 5. | ||
Item 6. | ||
Item 7. | ||
Item 7A. | ||
Item 8. | ||
Item 9. | ||
Item 9A. | ||
Item 9B. | ||
Item 10. | ||
Item 11. | ||
Item 12. | ||
Item 13. | ||
Item 14. | ||
Item 15. | ||
INTRODUCTORY NOTE
Unless the context otherwise indicates or requires, as used in this Annual Report on Form 10-K for the fiscal year ended March 31, 2015 references to: (i) “we,” “us,” “our” or our “company” refer to Booz Allen Hamilton Holding Corporation, its consolidated subsidiaries and predecessors; (ii) “Booz Allen Holding” refers to Booz Allen Hamilton Holding Corporation exclusive of its subsidiaries; (iii) “Booz Allen Investor” refers to Booz Allen Hamilton Investor Corporation, a wholly-owned subsidiary of Booz Allen Holding; (iv) “Booz Allen Hamilton” refers to Booz Allen Hamilton Inc., our primary operating company and a wholly-owned subsidiary of Booz Allen Holding; and (v) “fiscal,” when used in reference to any twelve-month period ended March 31, refers to our fiscal years ended March 31. Unless otherwise indicated, information contained in this Annual Report is as of March 31, 2015. We have made rounding adjustments to reach some of the figures included in this Annual Report and, unless otherwise indicated, percentages presented in this Annual Report are approximate.
Cautionary Note Regarding Forward-Looking Statements
Certain statements contained or incorporated in this Annual Report include forward-looking statements. In some cases, you can identify forward-looking statements by terminology such as “may,” “will,” “could,” “should,” “forecasts,” “expects,” “intends,” “plans,” “anticipates,” “projects,” “outlook,” “believes,” “estimates,” “predicts,” “potential,” “continue,” “preliminary,” or the negative of these terms or other comparable terminology. Although we believe that the expectations reflected in the forward-looking statements are reasonable, we can give you no assurance these expectations will prove to have been correct. These forward-looking statements relate to future events or our future financial performance and involve known and unknown risks, uncertainties and other factors that may cause our actual results, levels of activity, performance, or achievements to differ materially from any future results, levels of activity, performance, or achievements expressed or implied by these forward-looking statements. These risks and other factors include:
• | cost cutting and efficiency initiatives, budget reductions, Congressionally mandated automatic spending cuts, and other efforts to reduce U.S. government spending, including automatic sequestration required by the Budget Control Act of 2011 (as amended by the American Taxpayer Relief Act of 2012 and the Consolidated Appropriations Act, 2014), which have reduced and delayed contract awards and funding for orders for services especially in the current political environment or otherwise negatively affect our ability to generate revenue under contract awards, including as a result of reduced staffing and hours of operation at U.S. government clients; |
• | delayed funding of our contracts due to uncertainty relating to and a possible failure of Congressional efforts to craft a long-term agreement on the U.S. government’s ability to incur indebtedness in excess of its current limits, or changes in the pattern or timing of government funding and spending (including those resulting from or related to cuts associated with sequestration or other budgetary cuts made in lieu of sequestration); |
• | current and continued uncertainty around the timing, extent, nature, and effect of ongoing Congressional and other U.S. government action to address budgetary constraints, including, but not limited to, uncertainty around the outcome of Congressional efforts to craft a long-term agreement on the U.S. government’s ability to incur indebtedness in excess of its current limits and the U.S. deficit; |
• | U.S. government facility closures due to weather-related events that limit our ability to provide services to our clients, which will negatively impact our ability to generate revenue under our contracts; |
• | any issue that compromises our relationships with the U.S. government or damages our professional reputation, including negative publicity concerning government contractors in general or us in particular; |
• | changes in U.S. government spending, including a continuation of efforts by the U.S. government to decrease spending for management support service contracts, and mission priorities that shift expenditures away from agencies or programs that we support; |
• | the size of our addressable markets and the amount of U.S. government spending on private contractors; |
• | failure to comply with numerous laws and regulations; |
• | our ability to compete effectively in the competitive bidding process and delays or losses of contract awards caused by competitors’ protests of major contract awards received by us; |
• | the loss of General Services Administration Multiple Award schedule contracts, or GSA schedules, or our position as prime contractor on government-wide acquisition contract vehicles, or GWACs; |
• | changes in the mix of our contracts and our ability to accurately estimate or otherwise recover expenses, time, and resources for our contracts; |
• | our ability to generate revenue under certain of our contracts; |
• | our ability to realize the full value of and replenish our backlog and the timing of our receipt of revenue under contracts included in backlog; |
• | changes in estimates used in recognizing revenue; |
• | an inability to attract, train, or retain employees with the requisite skills, experience, and security clearances; |
• | an inability to hire, assimilate, and deploy enough employees to serve our clients under existing contracts; |
1
• | an inability to timely and effectively utilize our employees; |
• | failure by us or our employees to obtain and maintain necessary security clearances; |
• | the loss of members of senior management or failure to develop new leaders; |
• | misconduct or other improper activities from our employees or subcontractors, including the improper use or release of our clients’ sensitive or classified information; |
• | increased insourcing by various U.S. government agencies due to changes in the definition of “inherently governmental” work, including proposals to limit contractor access to sensitive or classified information and work assignments; |
• | increased competition from other companies in our industry; |
• | failure to maintain strong relationships with other contractors; |
• | inherent uncertainties and potential adverse developments in legal or regulatory proceedings, including litigation, audits, reviews, and investigations, which may result in materially adverse judgments, settlements, withheld payments, penalties, or other unfavorable outcomes including debarment, as well as disputes over the availability of insurance or indemnification; |
• | continued efforts to change how the U.S. government reimburses compensation related and other expenses or otherwise limit such reimbursements, including recent rules that expand the scope of existing reimbursement limitations, such as a reduction in allowable annual employee compensation to certain contractors as a result of the Bipartisan Budget Act of 2013, and an increased risk of compensation being deemed unallowable or payments being withheld as a result of U.S. government audit, review or investigation; |
• | internal system or service failures and security breaches, including, but not limited to, those resulting from external cyber attacks on our network and internal systems or employee misconduct; |
• | risks related to changes to our operating structure, capabilities, or strategy intended to address client needs, grow our business or respond to market developments; |
• | risks associated with new relationships, clients, capabilities, and service offerings in our U.S. and international businesses; |
• | failure to comply with special U.S. government laws and regulations relating to our international operations; |
• | risks related to our indebtedness and credit facilities which contain financial and operating covenants; |
• | the adoption by the U.S. government of new laws, rules, and regulations, such as those relating to organizational conflicts of interest issues or limits; |
• | risks related to completed and future acquisitions, including our ability to realize the expected benefits from such acquisitions; |
• | an inability to utilize existing or future tax benefits, including those related to our stock-based compensation expense, for any reason, including a change in law; |
• | variable purchasing patterns under U.S. government GSA schedules, blanket purchase agreements and indefinite delivery, indefinite quantity, or ID/IQ, contracts; and |
• | other risks and factors listed under “Item 1A. Risk Factors” and elsewhere in this Annual Report. |
In light of these risks, uncertainties, and other factors, the forward-looking statements might not prove to be accurate and you should not place undue reliance upon them. All forward-looking statements speak only as of the date made and we undertake no obligation to update or revise publicly any forward-looking statements, whether as a result of new information, future events, or otherwise.
2
PART I
Item 1. | Business |
Overview
Booz Allen Hamilton is a leading provider of management consulting, technology, and engineering services to the U.S. government in the defense, intelligence, and civil markets. Additionally, we provide management and technology consulting services to major corporations, institutions, not-for-profit organizations, and international clients.
We have been listening to our clients for more than 100 years, standing alongside them to solve many of their toughest challenges. It is through these opportunities, as well as the quality of our character and the strength of our talent base of approximately 22,500 people, that we continue to redefine our ability to meet and exceed client expectations with an expanding set of capabilities in a rapidly changing world.
At the dawn of our second century, we continue to build on our legacy of innovative client service by investing in new and different ways to solve many of our clients' toughest problems. This effort is guided by “Vision 2020,” our comprehensive strategy to position Booz Allen for sustainable quality growth. Under Vision 2020, in the face of a competitive government contracting market, we have continued to manage our business to ensure our ability to invest in future growth. Under Vision 2020, we are investing in advanced capabilities that expand our capacity to deliver innovative, integrated solutions to clients and building new platforms to serve government and commercial clients domestically and abroad. These investments include innovation occurring in our Strategic Innovation Group (SIG) and throughout the firm as well as continued pursuit of acquisition opportunities that align with our strategic agenda. In parallel, we are building distinctive business and people models to support those growth platforms.
Our business continues to benefit from the capability breadth, client access, and financial stability that comes with a diverse base of clients and contract vehicles. Our diverse client base includes substantially all of the cabinet-level departments of the U.S. government, clients in selected commercial markets, and international clients. Major government clients include the Department of Defense, all branches of the U.S. military, the U.S. Intelligence Community, and civil agencies such as the Department of Homeland Security, the Department of Health and Human Services, and the Department of the Treasury. We support these clients in addressing complex and pressing challenges such as combating global terrorism, improving cyber capabilities, transforming the healthcare system, improving efficiency and managing change within the government. In the commercial sector, we serve U.S. clients primarily in the financial services, healthcare, energy, retail, and automotive markets. Our international clients are primarily in the Middle East, as well as in south-east Asia following the recent opening of our office in Singapore.
Booz Allen's approach has long been to ensure that we have prime or subcontractor positions on a wide range of contracts that allow clients maximum opportunity to access our services. Our diverse contract base provides stability to our business. This diversity is seen in the fact that over 78% of our revenue for fiscal 2015 was derived from over 3,300 active task orders under indefinite delivery, indefinite quantity (ID/IQ) contract vehicles. Our top ID/IQ contract vehicle, which had approximately 130 task orders, represented approximately 12% of our revenue in our fiscal year 2015. Our largest task order under an ID/IQ contract vehicle accounted for approximately 1.6% of our revenue in our fiscal year 2015. Our largest definite contract represented approximately 2.6% of our revenue in our fiscal year 2015.
Through the execution of our Vision 2020 strategic initiatives, we are well positioned to operate at the intersection of management consulting, technology, and mission expertise. It is in this intersection that we have created service offerings in areas such as predictive intelligence, emerging technology, and advanced engineering. The combination of our service offerings with deep mission understanding uniquely positions us to help a broad range of clients solve many of their toughest challenges in response to today's complex and dynamic environment. The depth and breadth of our capabilities - as standalone offerings and in combination with one another - together with our client-focused culture continue to form the core of our value proposition to the market.
History and Corporate Structure
We were founded in 1914 by Edwin Booz, one of the pioneers of management consulting. In 1940, we began serving the U.S. government by advising the Secretary of the Navy in preparation for World War II. As the needs of our clients have grown more complex, we have expanded beyond our management consulting foundation to develop deep expertise in the fields of technology, engineering, cyber security, and data science.
We are organized and operate as a corporation. Our use of the term “partnership” reflects our collaborative culture, and our use of the term “partner” refers to our Chief Executive Officer and our Senior and Executive Vice Presidents. The use of the terms “partnership” and “partner” is not meant to create any implication that we operate our company as, or have any intention to create a legal entity that is, a partnership.
3
Booz Allen Holding was incorporated in Delaware in May 2008 to serve as the top-level holding company for the consolidated Booz Allen Hamilton U.S. government consulting business. On July 31, 2008, Booz Allen Hamilton completed the separation of its U.S. government consulting business from its legacy commercial and international consulting business, the spin off of the commercial and international business, and the sale of 100% of its outstanding common stock to Booz Allen Holding, which was majority owned by The Carlyle Group and certain of its affiliated investment funds, or Carlyle. Our company is a corporation that is the successor to the government business of Booz Allen Hamilton following the separation. The aforementioned transactions are referred to in this Annual Report as the acquisition.
Our Institution and Operating Model
We attribute the strength of our client relationships, the commitment of our people, and our strong financial position to our management consulting heritage and collaborative culture, which instills a relentless focus on delivering value and enduring results to our clients. Over the past century of serving clients and the 75 years that we have been supporting the U.S. government, we have cultivated relationships of trust with our clients. These relationships provide a deep understanding of our client's needs and mission requirements. Our approach to the market combines this domain expertise in the defense, intelligence, and civil government markets, and commercial and international markets, with our strong functional capabilities and enables us to provide our clients with differentiated insights and to anticipate, identify, and address their specific needs.
Across all sectors, our clients are facing ever-more challenging issues. We address their complex and evolving needs by deploying teams of staff with deep mission understanding, market-leading functional capabilities, consulting talent, and true technical and engineering expertise. These staff and functional capabilities are housed within market-facing teams and our cross-market Strategic Innovation Group, while being connected and developed through a strong network of internal communities. We have an internal resource management function that deploys staff across the entire firm to balance staffing needs and provide career advancement opportunities. This approach enables us to quickly assemble, deploy, and redeploy when necessary, multi-faceted client-facing teams comprised of people with the right skills and expertise needed to address specific client challenges. This ability is central to the differentiated value proposition of Booz Allen. We believe that our significant win rates on new and re-competed contracts of 55% and 88%, respectively, demonstrate the strength of this approach.
We operate our business as a single profit center that encourages the efficient allocation of our people across markets, clients, and opportunities. Our operating model is based on a partnership-style culture and compensation system that focuses on the success of the institution over the success of the individual and encourages our leadership and staff to collaborate internally and compete externally. This makes us more responsive to the market and better able to bring all the resources of the company to bear in support of specific client needs. We believe that we serve our clients best when we go to market as a whole firm rather than as a collection of individual business units or profit centers. A commitment to teamwork is deeply ingrained in our company, and our partnership-style culture is critical to maintaining this feature of our operating model.
Our People
Our success is highly dependent upon the quality, integrity, and dedication of our people. We have a highly educated talent base of approximately 22,500 people: as of March 31, 2015, approximately 70% held bachelor degrees, approximately 35% held masters degrees, and approximately 3% held doctoral degrees. In addition, many of the U.S. government contracts for which we compete require contractors to have high-level security clearances, and our large pool of cleared employees allows us to meet these needs. As of March 31, 2015, 72% of our people held government security clearances, which include Secret, Top Secret, Top Secret/Sensitive Compartmented Information and Sensitive Compartmented Information. High-level security clearances generally afford a person access to data that affects national security, counterterrorism or counterintelligence, or other highly sensitive data. Through internal referrals, internships and external recruiting efforts, we are able to successfully renew and grow our diverse talent base, and we believe that our ability to attract top level talent is significantly enhanced by our commitment to professional development, our position as a leader in our markets, the high quality of our work and people, and the appeal of our culture.
To encourage career development and progression, we provide our people with the opportunity to work on important and complex problems, support and acknowledge contributions of people at all levels of seniority, and encourage broad, inclusive, and insightful leadership. In furtherance of these goals, we have introduced a new career progression and people development model designed to recognize and reward client-facing employees based on differentiated roles within two tracks: our traditional management consulting track and an engineering and technology track. The move to two tracks allows us to retain the core of our people model while supporting the increasingly broad skills, interests, and career aspirations of our employee base. We continue to leverage an assessment process that helps promote and enforce the consistency of our collaborative culture, core values, and ethics.
4
We also encourage our people to continue developing their substantive skills through continuing education and provide funding for tuition assistance and technical certifications. Our learning programs, which have consistently been recognized as best-in-class in the industry, include partnerships with universities, vendors, and online content providers. These programs offer convenient, cost-effective, quality educational opportunities that are aligned with our core capabilities.
We believe that one of the key components of our success is our focus on ethics and core values. Our core values are: client service, diversity, excellence, entrepreneurship, teamwork, professionalism, fairness, integrity, respect, and trust. All new hires receive extensive training that emphasizes our core values, facilitates their integration into our collaborative, client-oriented culture, and helps to ensure the delivery of consistent and exceptional client service. As of March 31, 2015, 100% of our employees participated in internal training including mandatory annual ethics training for all employees, as well as additional specialized ethics and compliance training based on job requirements.
The emphasis that we place on our people continues to receive external recognition. External awards and recognition include being named to the “Best Companies” to work for lists published by Working Mother, GI Jobs, CareerBliss, Alliance for Workplace Excellence, and a number of other publications and associations. Additionally, the company was named for each of the past four years as one of Fortune Magazine’s “The World’s Most Admired Companies,” a list based on quality and brand reputation.
Our Functional Capabilities
The breadth and depth of our capabilities and the way in which our collaborative model allows us to seamlessly combine and integrate these capabilities to address the challenges faced by our clients is unique. The combination of our 100 year management consulting heritage, deep functional and technical expertise in traditional as well as new innovative disciplines, and a thorough understanding of our clients’ core missions, has helped position Booz Allen as an increasingly essential partner to our clients. We are constantly reevaluating our clients' needs to further optimize our functional offerings. Our functional capabilities include:
Acquisition, Program Management, and Logistics
Our Acquisition, Program Management, and Logistics capabilities help clients imagine, implement, and deliver a wide range of operational programs including those related to acquisition and contracts, supplier, and budget management. Services delivered include strategy development, policy support, logistics management, staff development and deployment, modeling and simulation, testing and validation, information assurance, and data management.
Cyber Security
Our Cyber Security capabilities are rooted in deep technical, analytic, and cyber mission experience and help clients anticipate threats to their networks and their data, ensure their cyber posture is consistent with established best practices, and respond to cyber events. We have a significant Cyber Security business based on our military and intelligence work with the federal government and we have invested in the development of capabilities needed to address the dynamic environment of cyber security.
As of March 31, 2015, over 3,700 employees hold over 7,000 certifications representing a variety of technical disciplines, including DoD 8570 specified certifications, from various certifying bodies, such as SANS, Comp TIA, EC Council, and ISC2.. Additionally, to continue to position us as a leader across the broad and growing range of areas requiring cyber-related services, we are focused on hiring new employees with related expertise and cross training existing employees through our Cyber University program.
Cloud Analytics and Data Science
Our Cloud Analytics and Data Science capabilities help clients design cloud architecture solutions, select the data that is most applicable to storage in the cloud, develop analytical solutions to gain valuable insights from large data sets and then strategically use that knowledge to drive mission success, save money, and improve effectiveness. Our data science capabilities apply advanced analytic techniques such as data mining, text mining, statistical analysis, and predictive modeling, to extract meaning from data. We also create analytic tools that support end users by providing access to data, analytic outputs, and visualizations.
Decision Analytics
Our Decision Analytics capabilities help clients make informed choices to maximize performance at an appropriate cost, while delivering on schedule and minimizing risks. We leverage a wide range of problem-solving techniques including simulation, mathematical optimization, queuing theory, and machine learning to improve decision making and efficiency.
5
Engineering
Our engineering capabilities offer Rapid Prototyping, Reverse Engineering, Systems Engineering & Integration, and Applied Engineering disciplines. We use design and manufacturing techniques to convert functional requirements into useable prototypes that can be deployed to test and confirm the requirements are met. Our prototyping capabilities utilize electronics design and development, a wide variety of shop floor manufacturing methods, 3-D printing, and product assembly. We also provide advanced engineering services such as electronics/embedded system technical exploitation.
Human Capital and Learning
Our Human Capital and Learning capabilities offer a wide range of strategy and transformation expertise to help clients address workforce and leadership challenges in a resource constrained environment. We design, develop, and deliver instructional classroom and on-line learning programs for all levels within a client's organization. We offer experiential leadership and team development programs, training, as well as individual assessment and coaching. Our HC&L capabilities also include workforce planning, management of learning programs, and talent management expertise designed to help clients address the full range of human capital needs of their organizations.
Management Consulting
Our Management Consulting capabilities are forged in experience gained over our 100 year consulting history and include expertise in strategy development, organizational design, efficiency, transformation, and a range of other consulting offerings. Management Consulting professionals help clients define their strategic goals and objectives as well as the people, processes, costs, and technology needed to realize them. We don't stop at strategy - we also leverage our expertise in the areas of process improvement, change management, and transformation to ensure clients achieve their intended results.
Networks and IT Infrastructure
Our Networks & Information Technology Infrastructure (NITI) capabilities include expertise in the area of enterprise operations, network services and communications, data center operations, and data storage. We apply our NITI expertise to physical, virtualized, cloud, and hybrid form factors networks. Network enabled services involve active directory identity management, radio frequency, mobile device management, and unified communications solutions. We provide the services and oversight clients require for IT infrastructure transformation, implementation, and operations. We offer network engineering and design expertise to optimize client network and communications performance.
Sciences
Our Sciences capabilities offer scientific research and the development and management of technology. We have a number of facilities and laboratories that are developing new methods of detection, designing and conducting research, and helping clients address mission challenges using a broad range of scientific disciplines. For example, our chemical, biological, radiological, nuclear, and explosives experts perform forensics, crisis response, pathogen detection, and threat assessment using data and artifacts from items such as improvised explosive devices. Our Intelligence, Surveillance, and Reconnaissance experts perform hyper-temporal optical and radio frequency sensing and tagging to detect anomalies and identify items of interest (such as electrical signatures of vehicles passing through check points).
Software Development and Architecture
Our Software Development & Architecture capabilities include development of small and large scale information technology applications, embedded systems, and mobile applications. We deliver expertise across an extensive list of programming languages applicable to traditional, cloud, mobile, and embedded applications. We rely on quality standards such as the variants of ISO9000 and the Carnegie Mellon Maturity model (CMM) at various levels depending on the project. We employ traditional and agile development methods depending on the application.
Our Long Term Growth Strategy
We began crafting our long term growth strategy in 2011 when we saw the potential for market challenges to come as a result of public debate about the impact of government spending on the national debt and potential changes to the U.S. defense and intelligence posture. In fiscal 2011 and fiscal 2012, we performed an assessment of our business portfolio and identified future challenges and opportunities and engaged a broad range of stakeholders to define Vision 2020, a strategy designed to fundamentally reshape and grow our business over time while addressing likely near-term pressures on our business.
Vision 2020 is driving our investments in innovation, advanced capabilities, and commercial and international markets. In support of Vision 2020, we see opportunities to acquire capabilities using a disciplined strategy focused on businesses that are strategically aligned with our growth platforms, share our values, and are priced appropriately.
6
Acquisitions that will be most attractive to us will add to our capabilities and will help drive organic growth across areas of our business portfolio by leveraging access to our client service professionals and their extensive client base.
Our growth platforms are:
Innovation. Our Innovation Growth Platform is anchored in our Vision 2020 strategy and is focused on creating clear leadership positions in the market and supporting growth across our client portfolio. At the start of our fiscal year 2014, we established the Strategic Innovation Group (SIG). Now entering its third year, the SIG is driving growth through adjacent and transformative innovation, integrating capabilities and building horizontal businesses to deliver solutions that solve our clients’ most complex problems. Our focused innovation agenda includes higher-margin areas such as NextGen Analytics, Predictive Intelligence, and Digital. The SIG is leveraging our access to an extensive client base as both a sensor network and a delivery mechanism. Internally, we are establishing a culture of innovation through the use of collaborative platforms that bring together our diverse staff to focus on solving client challenges, in addition to building expertise to deliver to clients. Externally, we are building a network of relationships with Industry, Start-ups/Incubators/Accelerators, and Academia to optimize complementary capabilities, integrate new ideas within our expanding ecosystem, and create value that we can deliver in new and different ways for our clients. We are confident our innovation agenda will drive growth through the development of new solutions to our clients’ complex problems.
Engineering. We are creating a coherent vision, comprehensive strategy, and clear roadmap to be a provider of high-quality engineering services, solutions, and products well matched to mission and business imperatives of our clients in areas such as Command, Control, Communications, Computers, Intelligence, Surveillance and Reconnaissance (C4ISR) Cyber, Navigation, RF Engineering, Networking, Prototyping, and Systems Engineering & Integration. Through this effort, we are integrating our engineering business elements and resources from across the company to leverage a critical mass of engineering professionals to expand our business in engineering services, solutions, and products across all markets.
Systems Delivery. We are working to sustain and enhance the processes, tools, environments, intellectual capital and assets leveraged by the systems delivery resources across the company to deliver the highest quality systems to our clients, while meeting industry recognized process maturity and quality standards and benchmarks. Through this work, we are establishing the foundation for a branded systems delivery business with robust past performance qualifications and the credibility in the marketplace to compete for large scale systems work.
Cyber. Our Cyber capabilities extend across our intelligence business and portions of our defense, civil, commercial, and international businesses. As a result of its scale, the cyber growth platform is predominately self-funding and while not a significant beneficiary of the company's strategic investments, we believe our differentiated cyber capability provides an avenue for growth in both the U.S. government market as well as the commercial and international markets.
Commercial. We are building a sustainable commercial business with top quality clients by offering differentiated service offerings in vertical markets, including in the financial services, health, energy, retail, and manufacturing markets, and by emphasizing cross-cutting offerings in the cyber, analytics, and compliance markets. These service offerings draw on our demonstrated expertise in the U.S. government market, which are translated into a unique set of capabilities that are tailored to the needs of the commercial market.
International. We are leveraging our successful Middle East/North Africa (MENA) business started in fiscal 2012 to build a sustainable, long term model for international expansion, capable of offering the full breadth of our service offerings and generating significant direct commercial sales. Specifically, by combining various technical and analytical capabilities, such as cyber security and systems delivery, with general management consulting capabilities to form a major differentiated strategy in our MENA business, Booz Allen has become an essential partner to our clients in the region, providing strategic and technical solutions across the engagement lifecycle. In fiscal 2015, we expanded the seasoned leadership team in our MENA business by adding core leaders from the region who manage a diverse mix of staff expertise based in the US and a localized client staff delivering direct commercial sales across both the public and private market sectors.
Our Clients
We believe that the U.S. government is the world's largest consumer of management and technology consulting services. The U.S. government's budget for the fiscal year ended September 30, 2014 was close to $3.8 trillion, excluding authorizations from Overseas Contingency Operations and supplemental funding for the Department of Defense. Of this amount, approximately $1.2 trillion was for discretionary budget authority, including $618 billion for the Department of Defense and Intelligence Community and $624 billion for civil agencies. Based on data from the Federal Procurement Data System, approximately $442 billion of the U.S. government's fiscal year 2014 discretionary outlays were non-intelligence agency funding-related products and services procured from private contractors. We estimate that $100 billion of the spending directed towards private contractors in U.S. government fiscal year 2014 was for management and
7
technology consulting services, with $56 billion spent by the Department of Defense and $43 billion spent by civil agencies. The agencies of the U.S. Intelligence Community that we serve represent an additional market. These numbers also exclude a large addressable market for our services and capabilities in the commercial and international markets where we have a small but growing footprint.
Across all of our markets, our century-long dedication to client service has built unusually strong customer relationships. Through our commitment to helping clients succeed, we have built a track record of results and trust among our client base, which in turn, provides a robust sales channel through which we can engage our current and prospective clients and deliver our services.
We have strong and longstanding relationships with a diverse group of clients at all levels of the U.S. government. During fiscal 2015, we derived 98% of our revenue from services under more than 5,400 contracts and task orders. The revenue was generated from contracts where the end client was an agency or department of the U.S. government, including contracts where Booz Allen performed in either a prime or subcontract position, and regardless of the geographic location in which the work was performed. The single largest entity that we served in fiscal 2015 was the U.S. Army, which represented approximately 16% of our revenue in that period. We derived 91% of our revenue in fiscal 2015 from engagements for which we acted as the prime contractor. Also during fiscal 2015, we achieved an overall win rate of 55% on new contracts and task orders for which we competed and a win rate of 88% on re-competed contracts and task orders for existing or related business. As of March 31, 2015, our total backlog, including funded, unfunded, and priced options, was $9.4 billion, a decrease of 5% in total backlog with an approximate 18% increase in funded backlog over March 31, 2014.
Selected Long-Term Client Relationships
Client (1) | Relationship Length (Years) |
U.S. Navy | 75+ |
U.S. Army | 65+ |
U.S. Air Force | 35+ |
Department of Energy | 35+ |
National Security Agency | 30+ |
Department of Homeland Security | 30+ |
Federal Bureau of Investigation | 20+ |
National Reconnaissance Office | 20+ |
A U.S. intelligence agency | 20+ |
Internal Revenue Service | 20+ |
(1) | Includes predecessor organizations. |
Defense Clients
Our reputation and track record in serving the U.S. military and defense agencies spans more than 70 years, over which time we have provided a broad range of capabilities to our defense clients. Our revenue generated from defense clients was $2.6 billion, or approximately 48.4% of our revenue in fiscal 2015 as compared to $2.7 billion, or approximately 49.4% of our revenue in fiscal 2014. Our key defense clients include:
• | U.S. Air Force. The U.S. Air Force provides Global Vigilance, Global Reach, and Global Power in support of National objectives. Their missions include delivery of Air and Space Superiority, Intelligence Surveillance and Reconnaissance (ISR), Rapid Global Mobility, Global Strike, and Command and Control. Specific clients include Headquarters and the AF Commands - Air Combat, Space, Materiel, Air Mobility, Cyber, Global Strike, and Pacific Air Forces. Across this specific client set, our skilled strategists, scientists, engineers, analysts, and technicians bring a notable set of essential services including assignments related to weapon systems analysis, capability-based planning, and aircraft systems engineering. These services are aimed at increasing Air Force mission efficiency and effectiveness. |
• | U.S. Army. The Army’s mission is to fight and win our Nation’s wars by providing prompt, sustained land dominance across the full range of military operations and spectrum of conflict in support of combatant commanders. Booz Allen provides integrated teams of engineers, analysts and technical experts to support all Army Components and Commands -- Army Headquarters, Army Materiel Command (AMC), Forces Command (FORSCOM), Training and Doctrine Command (TRADOC), Special Operations Command, and Army Cyber |
8
Command and Cyber Center of Excellence. By providing diverse services including enhancement of field intelligence systems; Counter-Improvised Explosive Device (C-IED) training for soldiers; accelerated capability development and C4ISR modernization; and infusion of lifecycle sustainment capabilities across the enterprise, Booz Allen consultants are helping the Army provide America’s warfighters with the decisive edge needed to “Win in a Complex World.”
• | Joint Staff and Combatant Commands. The combined efforts of the Office of the Secretary of Defense, the Joint Staff, and the Unified Combatant Commands provide mission critical support and solutions to the warfighter across the whole of the Department of Defense and protecting the security of the country. Our services and solutions support the full spectrum of business operations and warfighter missions, providing strategy and technology expertise to clients in systems engineering, across the supply chain, extending to cyber, personnel and readiness, research and development, countering weapons of mass destruction, and integrated intelligence, surveillance, and reconnaissance to space and global strike operations. We provide analytical services for intelligence activities, performing the full spectrum of innovation from strategic planning through execution. Our clients include the major organizations within the Office of the Secretary of Defense and all Department of Defense Agencies, as well as the U.S. Pacific Command, Northern Command, Central Command, Southern Command, the Defense Information Systems Agency, European Command, U.S. Strategic Command, Special Operations Command, and Transportation Command. |
• | U.S. Navy and Marine Corps. The mission of the U.S. Navy is to maintain, train, and equip combat-ready naval forces capable of winning wars, deterring aggression and maintaining freedom of the seas. Through global reach and persistent presence of forward-stationed and rotational forces to secure the nation from direct attack, and assuring Joint operational access and global freedom of action, the Navy, together with their primary Joint partner the U.S. Marine Corps, continue to evolve how they will operate and fight as expeditionary warfare partners. Since 1940, we have partnered with the U.S. Navy and Marine Corps to effectively accomplish strategic objectives and mission outcomes. Our clients include the Office of the Secretary of the Navy; Headquarters Navy; the Office of Naval Intelligence; the Commandant of the Marine Corps; U.S. Navy/Marine Corps operating commands and systems commands (including Naval Air Systems Command, Naval Seas Systems Command, U.S. Marine Corps Systems Command, and Space and Naval Warfare Systems Command); as well as joint and individual Program Executive Offices. By combining professional, experienced staff along with innovative solutions, we are able to deliver material results related to mission readiness, integration and interoperability, engineering, systems development, and cyber security. Collectively, we partner with our clients to help them remain ready to meet current challenges and build a relevant and capable future force. |
• | Infrastructure & Military Health. We support clients in defense agencies responsible for military and veterans' health as well as the transportation, energy, and environment sectors which have control over our national infrastructure. We support our clients' efforts to maintain and build infrastructure that is efficient, effective, and sustainable. Our services span all functional capabilities including management consulting, technology, engineering, and mission operations. Our clients include the Departments of Defense, Energy, Transportation, and Interior and their component agencies; the Environmental Protection Agency; and the Department of Defense Military Health System. |
Intelligence Clients
We have provided the government agencies and organizations that carry out national security and intelligence activities for the U.S. government with a wide range of services and capabilities for over 30 years. This critical business area requires specialized expertise and high-level security clearances. Revenue generated from intelligence clients was $1.3 billion, or approximately 24.9% of our revenue in fiscal 2015 as compared to $1.4 billion, or approximately 25.5% of our revenue in fiscal 2014. Our major intelligence clients include:
• | U.S. Intelligence Agencies. We provide thought leadership and serve as a trusted integrator of enterprise solutions and technologies; we enable U.S. intelligence agencies to excel at their missions. Our services in space and ground systems, mission services, and corporate integration include strategic planning and business operations; system engineering, integration and acquisition; user engagement and operations support; and information and cyber technologies. We reshape Systems Engineering and Integration efforts to meet evolving needs; implementing innovative agile development and extensive support in cyber services, policy, standards, tradecraft, and community engagement and planning and executing agency modernizations and transformations. We provide mission critical systems and services for the most demanding intelligence requirements in the world. Our clients include the National Security Agency, the National Geospatial-Intelligence Agency, the National Reconnaissance Office, and other classified clients. |
9
• | Military Intelligence. We are at the forefront of supporting warfighters, policymakers, and acquisition communities of the Military Intelligence organizations, the Defense Intelligence Agency, Service Intelligence Centers, operational Intelligence Surveillance Reconnaissance units, and Combatant Command. By bringing a unique mix of experienced people, high-quality processes, and advanced technologies, we help our clients address many of their toughest challenges through agility, precision, and efficiency. We provide innovative approaches and superior program management with capabilities such as intelligence analysis and training, mission engineering, organizational change and strategy, and technology to support client missions at all levels. Our expertise is in instructional design and delivery, workforce planning, all-source intelligence analysis, counterintelligence and human intelligence expertise, Intelligence Surveillance Reconnaissance planning and operations, simulation and gaming based training, targeting support, systems delivery and engineering, multi-source collections management, and knowledge management. |
Civil Clients
We provide support to the wide ranging missions of our U.S. government civilian agency clients. Revenue generated from civilian clients in the U.S. government was $1.2 billion, or approximately 23.5% of our revenue in fiscal 2015 as compared to $1.2 billion, or approximately 22.5% of our revenue in fiscal 2014. Our civil government clients include:
• | Health. Our clients include the Department of Veterans Affairs (VA) and the Department of Health and Human Services (HHS) and its agencies, including the U.S. Food and Drug Administration, National Institutes of Health, Centers for Disease Control and Prevention, and the Centers for Medicare and Medicaid Services. Their missions include protecting public health, strengthening and modernizing the nation's health care system to provide high quality care at a lower cost, and delivering healthcare and benefits to our nations' veterans. Health Reform and advances in technology have driven a significant amount of change in our HHS and VA client environments. Through a deep understanding of our clients' missions and our ability to deliver a broad set of innovation solutions, we have extensive experience solving complex and multi-disciplinary challenges in the areas of payment reform, care delivery transformation, benefits delivery optimization, and development of new platforms for sharing and analyzing data in the research, public health, and regulatory environments. Our scientists, data analysts, health industry experts, and technologists are helping our clients bring rapid resolution to some of the toughest healthcare challenges facing the nation and the world today. |
• | Security, Law Enforcement, and Justice. Our clients include the Department of Homeland Security (DHS), the Department of Justice (DOJ), and the Federal Bureau of Investigation (FBI). The missions of these agencies and their component departments focus on protecting and defending the United States against foreign and domestic threats. They are responsible for enhancing national security, enforcing laws, protecting our borders, preventing terrorism, securing cyberspace, and ensuring disaster resilience. Based on our clear understanding of these missions, and our longstanding relationships with these agencies, Booz Allen supports these clients by delivering management consulting expertise to define mission objectives and manage change, technology expertise in the areas of IT application development and network engineering; analytics, data science and scientific expertise to identify current and anticipate future threats; and engineering design and prototyping capabilities to protect against rapidly evolving threats found in both the physical and cyber space. |
• | Finance and Economic Development. Our clients include the Internal Revenue Service, the Department of Labor, General Services Administration, and the National Science Foundation. We provide a wide range of technology, analytics, and digital solutions to federal agencies that establish regulatory and economic policy (i.e., Federal Reserve System, Federal Deposit Insurance Corporation, Department of Labor); that provide core services to other Federal agencies (i.e., Department of Commerce, Department of State, Office of Personnel Management, General Services Administration); that are charged with the collection, management, and protection of the nation's financial system (i.e., Internal Revenue Service, Treasury Bureaus), and that administers grants (i.e., National Science Foundation, Department of Agriculture). Our developers, programmers, business analysts and project managers are essential partners to our clients in defending and protecting the institutional systems that process our nation's financial needs. For example, the Internal Revenue Service (IRS) utilizes our application development and analytics capability in support of tax collection, fraud identification, and the preparation of the tax systems to address complex changes in tax law. |
• | Energy, Environment, Transportation and Space. Our clients include the Department of Energy (DOE), the Environmental Protection Agency (EPA), the Department of Transportation (DOT), and the National Aeronautics and Space Administration (NASA). Working with the DOE, our capabilities in techno-economic analysis, organizational transformation, and R&D program management are helping to develop game-changing energy technologies and enabling DOE to manage its laboratories and facilities such as the Strategic Petroleum Reserve and Y-12/Pantex more efficiently. For the EPA, we provide systems development and program management |
10
across a wide range of agency offices. At the DOT, we provide engineering, technology, analytics, strategy, program management, and technical services across the breadth of the DOT component administrations including supporting the nation's most advanced and innovative transportation initiatives, including the development and deployment of the Next Generation Air Transportation System, the Intelligent Transportation Systems Connected Vehicle Program, and the High-Speed Intercity Passenger Rail Program. At NASA, we are supporting space programs with engineering, systems integration, and configuration management.
Commercial and International Clients
Our revenue generated with commercial and international clients, which includes work for private sector clients inside and outside of the U.S., foreign government entities, foreign military sales to non U.S. government clients, and work performed outside of the U.S. for the U.S. Agency for International Development, was $167.2 million, or approximately 3.2% of our revenue in fiscal 2015 as compared to $141.8 million, or approximately 2.6% of our revenue in fiscal 2014.
Commercial Clients. In the U.S. commercial market, we are leveraging our cyber expertise developed over decades of work with U.S. intelligence community clients, and core competencies in advanced analytics, regulatory compliance, and IT infrastructure to anticipate threats, analyze massive amounts of data, comply with governing laws, and improve operations. We serve clients in industries in which there is a strong intersection between government and commercial interests and where clients are experiencing greater cyber threats. These industries include financial services, healthcare, energy, retail, and automotive. Our client base includes major pharmaceutical manufacturers, health care providers, large commercial and investment banks, utilities, oil and gas companies, major retailers, and auto manufacturers.
International Clients. Our primary international activities are in the Middle East and North Africa region, where we currently see strong demand for our services, including data analytics, cyber defense diagnostics, mission assurance and risk management, technology, strategy transformation, and program management. Our primary client base is in the United Arab Emirates, Saudi Arabia, Qatar, Oman, and Kuwait. We have expanded our offices into Abu Dhabi, United Arab Emirates and Qatar and see growth opportunities in Saudi Arabia, Bahrain, and Turkey. Additionally, we have recently expanded our international footprint to Singapore as an initial positioning to serve clients in select Asian markets.
Contracts
Our portfolio of contracts is highly diversified consisting of a range of contract vehicles through which our clients may contract for our services, with no single definite contract accounting for more than 2.6% of our revenue, and no single task order under any ID/IQ contract accounting for more than 1.6% of our revenue for fiscal 2015. Note that statistics included in this Contracts section do not include contracts, orders, or revenue associated with classified contracts since information under those contracts is classified. Revenue associated with classified contracts is included in total firm wide revenue used in the denominator for percentage calculations.
There are two predominant contracting methods by which the U.S. government procures services: definite contracts and indefinite contract vehicles. Each of these is described below:
• | Definite contracts call for the performance of specified services or the delivery of specified products. The U.S. government procures services and solutions through single award, definite contracts that specify the scope of services that will be delivered and identify the contractor that will provide the specified services. When an agency recognizes a need for services or products, it develops an acquisition plan, which details the means by which it will procure those services or products. During the acquisition process, the agency may release a request for information to determine if qualified bidders exist, a draft request for a proposal to allow the industry to comment on the scope of work and acquisition strategy, and finally a formal request for a proposal. Following the evaluation of submitted proposals, the agency will award the contract to the winning bidder. |
• | Indefinite contract vehicles provide for the issuance by the client of orders for services or products under the terms of the contract. Indefinite contracts are formally known as ID/IQ contracts and are often referred to as contract vehicles or ordering contracts. ID/IQ contracts may be awarded to one contractor (single award) or several contractors (multiple award). Under a multiple award ID/IQ contract, there is no guarantee of work as contract holders must compete for individual work orders. ID/IQ contracts will often include pre-established labor categories and rates, and the ordering process is streamlined (usually taking less than a month from recognition of a need to an established order with a contractor). ID/IQ contracts often have multi-year terms and unfunded ceiling amounts, thereby enabling but not committing the U.S. government to purchase substantial amounts of products and services from one or more contractors in a streamlined procurement process. |
• | GWACs and GSA Schedules are ID/IQ contracts that are open to all U.S. government agencies. Contract holders compete for individual task orders under both types of ID/IQ contract vehicles. Prices (labor rates) are pre-established under GSA Schedules, while prices under GWACs may be pre-established or determined |
11
by task order proposal. Agencies may solicit companies directly under GSA Schedules and, under GWACs, must work through the agency that operates the GWAC or receive a delegation of authority to use the GWAC. GSA Schedules are administered by the GSA and support a wide range of products and services. GWACs are used to procure IT products and services and are administered by the agency soliciting the services or products, with permission from the Office of Management and Budget.
Listed below are our top definite contract, our top five definite contracts and our top ten definite contracts for fiscal 2015 and revenue recognized under these contracts in fiscal 2015.
Fiscal 2015 | % of Total Revenue | Expiration Date | |||||||
( in millions) | |||||||||
Top Definite Contract | $ | 137.8 | 3 | % | 12/31/2020 | ||||
Top Five Definite Contracts | 317.4 | 6 | % | ||||||
Top Ten Definite Contracts | 426.2 | 8 | % | ||||||
Listed below are our top ID/IQ contract, our top five ID/IQ contracts and our top ten ID/IQ contracts for fiscal 2015, in each case excluding revenue associated with GSA Schedules and GWACS, and the number of active task orders under these contracts as of March 31, 2015.
Fiscal 2015 | % of Total Revenue | Number of Task Orders as of March 31, 2015 | Expiration Date | |||||||||
(in millions) | ||||||||||||
Top ID/IQ Contract (1) | $ | 641.8 | 12 | % | 126 | 7/8/2015 | ||||||
Top Five ID/IQ Contracts | 1,236.5 | 23 | % | 243 | ||||||||
Top Ten ID/IQ Contracts | 1,637.6 | 31 | % | 297 | ||||||||
(1) While the contract end date is 7/8/2015, there are several task orders that extend beyond the contract end date with the longest duration task order end date on 9/30/2016.
As of March 31, 2015, there were a total of 32 GSA Federal Supply schedules with over 19,000 schedule holders. In government fiscal year 2014 (ended September 30, 2014), sales on GSA Schedules totaled more than $32.8 billion. During the government fiscal year 2014, we were the number two provider under the GSA Federal Supply Schedule program.
GSA has been examining ways to improve its professional service Schedule offerings as part of their Category Management initiative. As a result of their examination, GSA has determined that cross-functional solutions would be more accessible to government clients if the Schedule program were consolidated. GSA is, therefore, consolidating the scope of the eight professional service Schedules into one professional service Schedule contract to reduce procurement complexity and increase agency use.
Booz Allen has submitted its migration request to GSA and anticipates the new vehicle to be awarded on or about June 30, 2015. Once awarded, the company will begin using this Schedule for all new work. The individual Schedules included in GSA’s consolidation will remain in place through the end of the current option to prevent the interruption of services. The revenue generated under these individual Schedules will begin to decrease during this transition period. The decrease in revenue on the individual schedules will be offset by commensurate growth under the new professional service Schedule. GSA has been listening to industry’s concerns and implementing changes when appropriate to reduce risk to existing work. As a result, we anticipate this transition will have negligible impact on future revenues, but mention the consolidation as it will cause changes to the list of top GSA Schedules and GWACs as the transition takes place.
Listed below are our top three GSA Schedules and GWACs in fiscal 2015 and revenue for each of fiscal 2015, fiscal 2014, and fiscal 2013, the number of active task orders as of March 31, 2015 under each of our top three GSA Schedules and GWACs and an aggregation of all other GSA Schedules and GWACs. These contract vehicles are available to all U.S. government agencies and the revenue stated is the result of individually competed task orders.
12
Fiscal 2015 | % of Total Revenue | Fiscal 2014 | % of Total Revenue | Fiscal 2013 (1) | % of Total Revenue | Number of Task Orders as of 31-Mar-15 | Expiration Date | |||||||||||||||||||
(Revenue in millions) | ||||||||||||||||||||||||||
Mission Oriented Business Integrated Services (MOBIS) — #874 | $ | 229.5 | 4 | % | $ | 274.9 | 5 | % | $ | 354.0 | 6 | % | 561 | 9/30/2017 | ||||||||||||
Booz Allen Alliant | 181.8 | 3 | % | 119.6 | 2 | % | 63.5 | 1 | % | 27 | 4/30/2019 | |||||||||||||||
Information Technology (IT) — #70 | 177.8 | 3 | % | 199.1 | 4 | % | 186.8 | 3 | % | 311 | 3/22/2019 | |||||||||||||||
All Others | 449.4 | 10 | % | 567.6 | 10 | % | 522.0 | 9 | % | 680 | ||||||||||||||||
Total | $ | 1,038.5 | 20 | % | $ | 1,161.2 | 21 | % | $ | 1,126.3 | 19 | % | 1,579 | |||||||||||||
(1) Fiscal 2013 revenue was updated to include a missing group of orders under the MOBIS contract vehicle.
We derived approximately 78% of our revenue for fiscal 2015 from over 3,300 active task orders under ID/IQ contracts (inclusive of GSA Schedules and GWACs). Listed below for each specified revenue band is the number of, revenue derived from, and average duration of our task orders as of March 31, 2015. The table includes revenue earned during fiscal 2015 under all task orders that were active during fiscal 2015 under these ID/IQ contracts and the number of active task orders on which this revenue was earned. Average duration reflected in the table below is calculated based on the inception date of the task order, which may be prior to the beginning of fiscal 2015, and the completion date which may have been prior or subsequent to March 31, 2015. As a result, the actual average remaining duration for task orders included in this table may be less than the average duration shown in the table, and task orders included in the table may have been complete on March 31, 2015.
Segmentation of Task Order by Revenue Fiscal 2015 | Number of Task Orders Active During Fiscal 2015 | Fiscal 2015 Revenue (in millions) | % of Total Fiscal 2015 Revenue | Average Duration (Years) | |||||||||
Less than $1 million | 2,521 | $ | 631.8 | 12 | % | 1.7 | |||||||
Between $1 million and $3 million | 460 | 788.3 | 15 | % | 2.3 | ||||||||
Between $3 million and $5 million | 155 | 595.8 | 11 | % | 2.6 | ||||||||
Between $5 million and $10 million | 113 | 780.8 | 15 | % | 2.8 | ||||||||
Greater than $10 million | 72 | 1,341.6 | 25 | % | 2.6 | ||||||||
Total | 3,321 | $ | 4,138.3 | 78 | % | 1.8 | |||||||
For fiscal 2015, we used a revised methodology to present the segmentation of task orders by revenue band. The change in methodology includes: 1) Active task orders are defined as orders with a start date that is prior to the last day of the fiscal year (March 31) and an end date that is on or after the first day of the fiscal year (April 1st), and 2) We revised the average duration to include all periods (base and options) on the active task orders. As such, we present a revised table below for fiscal 2014 which reflects the same methodology used for the fiscal 2015 table.
Segmentation of Task Order by Revenue Fiscal 2014 | Number of Task Orders Active During Fiscal 2014 | Fiscal 2014 Revenue (in millions) | % of Total Fiscal 2014 Revenue | Average Duration (Years) | |||||||||
Less than $1 million | 2,506 | $ | 632.4 | 11 | % | 1.7 | |||||||
Between $1 million and $3 million | 508 | 874.3 | 16 | % | 2.4 | ||||||||
Between $3 million and $5 million | 146 | 549.0 | 10 | % | 2.6 | ||||||||
Between $5 million and $10 million | 136 | 949.8 | 17 | % | 2.9 | ||||||||
Greater than $10 million | 79 | 1,407.2 | 25 | % | 2.8 | ||||||||
Total | 3,375 | $ | 4,412.7 | 79 | % | 1.9 | |||||||
13
Backlog
We define backlog to include the following three components:
• | Funded Backlog. Funded backlog represents the revenue value of orders for services under existing contracts for which funding is appropriated or otherwise authorized less revenue previously recognized on these contracts. |
• | Unfunded Backlog. Unfunded backlog represents the revenue value of orders for services under existing contracts for which funding has not been appropriated or otherwise authorized. |
• | Priced Options. Priced contract options represent 100% of the revenue value of all future contract option periods under existing contracts that may be exercised at our clients’ option and for which funding has not been appropriated or otherwise authorized. |
Backlog does not include any task orders under ID/IQ contracts, including GWACs and GSA schedules, except to the extent that task orders have been awarded to us under those contracts.
The following table summarizes the value of our contract backlog as of the respective dates presented:
As of March 31, | ||||||||
2015 | 2014 | |||||||
(In millions) | ||||||||
Funded | $ | 2,691 | $ | 2,290 | ||||
Unfunded (1) | 2,121 | 2,343 | ||||||
Priced options | 4,548 | 5,205 | ||||||
Total backlog | $ | 9,360 | $ | 9,838 | ||||
(1) | Reflects a reduction by management to the revenue value of orders for services under one existing single award ID/IQ contracts the Company has had for several years, based on an established pattern of funding under this contract by the U.S. government. |
We may never realize all of the revenue that is included in our total backlog, and there is a higher degree of risk in this regard with respect to unfunded backlog and priced options. See “Item 7. Management’s Discussion and Analysis of Financial Condition and Results of Operations — Factors Affecting Our Results of Operations — Sources of Revenue — Contract Backlog” for additional disclosure regarding our backlog. See also “Item 1A. Risk Factors — Risks Related to Our Business — We may not realize the full value of our backlog, which may result in lower than expected revenue.”
Competition
The government services market is highly fragmented and competition within the government professional services industry has intensified due to market pressure. In addition to professional service companies like ours that focus principally on the provision of services to the U.S. government, other companies active in our markets include large defense contractors; diversified consulting, technology, and outsourcing service providers; and small businesses. Changing government policies and market dynamics are also helping to reshape the competitive landscape. Some large prime contractors are beginning to divest their professional services business units due to the U.S. government’s increased sensitivity to organizational conflicts of interest and these divested companies will be free to compete with us without their former organizational conflicts of interest constraints. The formal adoption of the Federal Acquisition Regulation, or FAR, organizational conflicts of interest rules, or additional more restrictive rules by U.S. government agencies could cause further such divestitures which could further increase competition in our markets. At the other end of the spectrum, small businesses are growing in the government services industry due in large part to a push by both the Obama and Bush administrations to bolster the economy by helping small business owners. Finally, due to the foregoing factors and the drive in our markets to quickly build competencies in growth areas and achieve economies of scale, we believe that consolidation activity among market participants will increase.
In the course of doing business, we compete and collaborate with companies of all types and sizes. We strive to maintain positive and productive relationships with these organizations. Some of them hire us as a subcontractor, and we hire some of them to work with us as our subcontractors. Our major competitors include: (i) contractors focused principally on the provision of services to the U.S. government; such as CACI International, Inc., L-3 Communications Holdings, Inc., ManTech International Corp., SRA International, Inc., Vencore, and Engility (ii) large defense contractors which provide both products and services to the U.S. government; such as General Dynamics Corp., Lockheed Martin Corp., Northrop Grumman Corp., and Raytheon Co.; and (iii) diversified service providers; such as Accenture, Computer Sciences Corp., Deloitte Consulting LLP, Leidos, and SAIC, Inc. We compete on the basis of our technical expertise and
14
client knowledge, our ability to successfully recruit appropriately skilled and experienced talent, our ability to deliver cost-effective multi-faceted services in a timely manner, our reputation and relationship with our clients, our past performance, security clearances, and the size and scale of our company. In addition, in order to maintain our competitive position, we routinely review our operating structure, capabilities, and strategy to determine whether we are effectively meeting the needs of existing clients, effectively responding to developments in our markets, and successfully building a platform intended to provide the foundation for the future growth of our business.
Patents and Proprietary Information
Our management and technology consulting services and related products are not generally dependent upon patent protection. We claim a proprietary interest in certain of our service offerings and related products, methodologies, and know-how. We have a few patents but we do not consider our business to be materially dependent on the protection of such patents. Additionally, we have a number of trade secrets that contribute to our success and competitive position, and we endeavor to protect this proprietary information. While protecting trade secrets and proprietary information is important, we are not materially dependent on any specific trade secret or group of trade secrets. Other than licenses to commercially available third-party software, we have no licenses to intellectual property that are significant to our business.
We rely upon a combination of nondisclosure agreements and other contractual arrangements, as well as copyright, trademark, patent, and trade secret laws to protect our proprietary information. We also enter into proprietary information and intellectual property agreements with employees, which require them to disclose any inventions created during employment, to convey such rights to inventions to us, and to restrict any disclosure of proprietary information.
Our most important trademark is the “Booz Allen Hamilton” mark, registered in the United States and certain foreign countries. Generally, registered trademarks have perpetual life, provided that they are renewed on a timely basis and continue to be used properly as trademarks. We have four registered trademarks related to our name and logo with the earliest renewal in March 2020.
For our work under U.S. government funded contracts and subcontracts, the U.S. government obtains certain rights to data, software, and related information developed under such contracts or subcontracts. These rights generally allow the U.S. government to disclose such data, software, and related information to third parties, which third parties may include our competitors in some instances. In the case of our work as a subcontractor, our prime contractor may also have certain rights to data, information, and products we develop under the subcontract.
Booz Allen Hamilton®, the Booz Allen Cyber Solutions Network®, the Booz Allen Hamilton logo, and other trademarks or service marks of Booz Allen Hamilton Inc. appearing in this Annual Report are property of Booz Allen Hamilton Inc. Trade names, trademarks, and service marks of other companies appearing in this Annual Report are the property of their respective owners.
Regulation
As a contractor to the U.S. government, as well as state and local governments, we are heavily regulated in most fields in which we operate. We deal with numerous U.S. government agencies and entities, and when working with these and other entities, we must comply with and are affected by unique laws and regulations relating to the formation, administration, and performance of public government contracts. Some significant laws and regulations that affect us include:
• | FAR, and agency regulations supplemental to the FAR, which regulate the formation, administration, and performance of U.S. government contracts. For example, FAR 52.203-13 requires contractors to establish a Code of Business Ethics and Conduct, implement a comprehensive internal control system, and report to the government when the contractor has credible evidence that a principal, employee, agent, or subcontractor, in connection with a government contract, has violated certain federal criminal laws, violated the civil False Claims Act, or has received a significant overpayment; |
• | the False Claims Act and False Statements Act, which impose civil and criminal liability for presenting false or fraudulent claims for payments or reimbursement, and making false statements to the U.S. government, respectively; |
• | the Truth in Negotiations Act, which requires certification and disclosure of cost and pricing data in connection with the negotiation of a contract, modification, or task order; |
• | the Procurement Integrity Act, which regulates access to competitor bid and proposal information and certain internal government procurement sensitive information, and our ability to provide compensation to certain former government procurement officials; |
15
• | laws and regulations restricting the ability of a contractor to provide gifts or gratuities to employees of the U.S. government; |
• | post-government employment laws and regulations, which restrict the ability of a contractor to recruit and hire current employees of the U.S. government and deploy former employees of the U.S. government; |
• | laws, regulations, and executive orders restricting the use and dissemination of information classified for national security purposes or determined to be “controlled unclassified information” or “for official use only” and the export of certain products, services, and technical data, including requirements regarding any applicable licensing of our employees involved in such work; |
• | laws, regulations, and executive orders regulating the handling, use, and dissemination of personally identifiable information in the course of performing a U.S. government contract; |
• | laws, regulations, and executive orders governing organizational conflicts of interest that may restrict our ability to compete for certain U.S. government contracts because of the work that we currently perform for the U.S. government or may require that we take measures such as firewalling off certain employees or restricting their future work activities due to the current work that they perform under a U.S. government contract; |
• | laws, regulations and executive orders that impose requirements on us to ensure compliance with requirements and protect the government from risk related to our supply chain; |
• | laws, regulations and mandatory contract provisions providing protections to employees or subcontractors seeking to report alleged fraud, waste, and abuse related to a government contract; |
• | the Contractor Business Systems rule, which authorizes Department of Defense agencies to withhold a portion of our payments if we are determined to have a significant deficiency in our accounting, cost estimating, purchasing, earned value management, material management and accounting, and/or property management system; and |
• | the Cost Accounting Standards and Cost Principles, which impose accounting requirements that govern our right to reimbursement under certain cost-based U.S. government contracts and require consistency of accounting practices over time. |
Given the magnitude of our revenue derived from contracts with the Department of Defense, the Defense Contract Audit Agency, or DCAA, is our cognizant government audit agency. The DCAA audits the adequacy of our internal control systems and policies including, among other areas, compensation. As a result of its audits, the DCAA may determine that a portion of our employee compensation is unallowable. See “Item 1A. Risk Factors — Risk Related to Our Industry — Our contracts, performance, and administrative processes and systems are subject to audits, reviews, investigations, and cost adjustments by the U.S. government, which could reduce our revenue, disrupt our business, or otherwise materially adversely affect our results of operations.” We are also subject to audit by Inspectors General of other U.S. government agencies.
The U.S. government may revise its procurement practices or adopt new contract rules and regulations at any time. In order to help ensure compliance with these laws and regulations, all of our employees are required to attend ethics training at least annually, as well as other compliance training relevant to their position. Internationally, we are subject to special U.S. government laws and regulations (such as the Foreign Corrupt Practices Act), local government regulations and procurement policies and practices, including regulations relating to import-export control, investments, exchange controls, and repatriation of earnings, as well as varying currency, political, and economic risks.
U.S. government contracts are, by their terms, subject to termination by the U.S. government either for its convenience or default by the contractor. In addition, U.S. government contracts are conditioned upon the continuing availability of Congressional appropriations. Congress usually appropriates funds for a given program on a September 30 fiscal year basis, even though contract performance may take many years. As is common in the industry, our company is subject to business risks, including changes in governmental appropriations, national defense policies, service modernization plans, and availability of funds. Any of these factors could materially adversely affect our company’s business with the U.S. government in the future.
The U.S. government has a broad range of actions that it can instigate in order to enforce its procurement law and policies. These include proposing a contractor, certain of its operations or individual employees for debarment or suspending or debarring a contractor, certain of its operations or individual employees from future government business. In addition to criminal, civil and administrative actions by the U.S. government, under the False Claims Act, an individual alleging fraud related to payments under a U.S. government contract or program may file a qui tam lawsuit on behalf of the government against us; if successful in obtaining a judgment or settlement, the individual filing the suit may receive up to 30 percent of the amount recovered by the government.
16
See “Item 1A. Risk Factors — Risks Related to Our Business — We are required to comply with numerous laws and regulations, some of which are highly complex, and our failure to comply could result in fines or civil or criminal penalties or suspension or debarment by the U.S. government that could result in our inability to continue to work on or receive U.S. government contracts, which could materially and adversely affect our results of operations.”
Available Information
We file annual, quarterly, and current reports and other information with the SEC. You may read and copy any documents that we file at the SEC’s public reference room at 100 F Street, N.E., Washington, D.C. 20549. You may call the SEC at 1-800-SEC-0330 to obtain further information about the public reference room. In addition, the SEC maintains an Internet website (www.sec.gov) that contains reports, proxy and information statements, and other information regarding registrants that file electronically with the SEC, including us. You may also access, free of charge, our reports filed with the SEC (for example, our Annual Report on Form 10-K, our Quarterly Reports on Form 10-Q, and our Current Reports on Form 8-K and any amendments to those forms) through the “Investors” portion of our Internet website (www.boozallen.com). Reports filed with or furnished to the SEC will be available as soon as reasonably practicable after they are filed with or furnished to the SEC. Our website is included in this Annual Report as an inactive textual reference only. The information found on our website is not part of this or any other report filed with or furnished to the SEC.
Item 1A. | Risk Factors |
You should consider and read carefully all of the risks and uncertainties described below, as well as other information included in this Annual Report, including our consolidated financial statements and related notes. The risks described below are not the only ones facing us. The occurrence of any of the following risks or additional risks and uncertainties not presently known to us or that we currently believe to be immaterial could materially and adversely affect our business, financial condition, or results of operations. This Annual Report also contains forward-looking statements and estimates that involve risks and uncertainties. Our actual results could differ materially from those anticipated in the forward-looking statements as a result of specific factors, including the risks and uncertainties described below.
Risks Related to Our Business
We depend on contracts with U.S. government agencies for substantially all of our revenue. If our relationships with such agencies are harmed, our future revenue and operating profits would decline.
The U.S. government is our primary client, with revenue from contracts and task orders, either as a prime or a subcontractor, with U.S. government agencies accounting for 98% of our revenue for fiscal 2015. Our belief is that the successful future growth of our business will continue to depend primarily on our ability to be awarded work under U.S. government contracts, as we expect this will be the primary source of substantially all of our revenue in the foreseeable future. For this reason, any issue that compromises our relationship with the U.S. government generally or any U.S. government agency that we serve would cause our revenue to decline. Among the key factors in maintaining our relationship with U.S. government agencies are our performance on contracts and task orders, the strength of our professional reputation, compliance with applicable laws and regulations, and the strength of our relationships with client personnel. In addition, the mishandling or the perception of mishandling of sensitive information, such as our failure to maintain the confidentiality of the existence of our business relationships with certain of our clients, including as a result of misconduct or other improper activities by our employees or subcontractors, or a failure to maintain adequate protection against security breaches, including those resulting from cyber attacks, could harm our relationship with U.S. government agencies. Our relationship with the U.S. government could also be damaged as a result of an agency’s dissatisfaction with work performed by us, a subcontractor, or other third parties who provide services or products for a specific project for any reason, including due to perceived or actual deficiencies in the performance or quality of our work, and we may incur additional costs to address any such situation and the profitability of that work might be impaired. Further, negative publicity concerning government contractors in general or us in particular may harm our reputation with federal government contractors. To the extent our reputation or relationships with U.S. government agencies is impaired, our revenue and operating profits could materially decline.
U.S. government spending and mission priorities could change in a manner that adversely affects our future revenue and limits our growth prospects.
Our business depends upon continued U.S. government expenditures on defense, intelligence, and civil programs for which we provide support. These expenditures have not remained constant over time, have been reduced in certain periods and, recently, have been affected by the U.S. government’s efforts to improve efficiency and reduce costs affecting federal government programs generally. Our business, prospects, financial condition, or operating results could be materially harmed, among other causes, by the following:
17
• | budgetary constraints, including Congressionally mandated automatic spending cuts, affecting U.S. government spending generally, or specific agencies in particular, and changes in available funding; |
• | a shift in expenditures away from agencies or programs that we support; |
• | reduced U.S. government outsourcing of functions that we are currently contracted to provide, including as a result of increased insourcing by various U.S. government agencies due to changes in the definition of “inherently governmental” work, including proposals to limit contractor access to sensitive or classified information and work assignments; |
• | further efforts to improve efficiency and reduce costs affecting federal government programs; |
• | changes in U.S. government programs that we support or related requirements; |
• | a continuation of recent efforts by the U.S. government to decrease spending for management support service contracts; |
• | U.S. government shutdowns due to a failure by elected officials to fund the government (such as that which occurred during government fiscal year 2014) or weather-related closures in the Washington, DC area (such as that which occurred in the winter of 2014) and other potential delays in the appropriations process; |
• | U.S. government agencies awarding contracts on a technically acceptable/lowest cost basis in order to reduce expenditures; |
• | delays in the payment of our invoices by government payment offices; |
• | an inability by the U.S. government to fund its operations as a result of a failure to increase the federal government’s debt ceiling, a credit downgrade of U.S. government obligations or for any other reason; and |
• | changes in the political climate and general economic conditions, including a slowdown of the economy or unstable economic conditions and responses to conditions, such as emergency spending, that reduce funds available for other government priorities. |
In addition, any disruption in the functioning of U.S. government agencies, including as a result of U.S. government closures and shutdowns, terrorism, war, natural disasters, destruction of U.S. government facilities, and other potential calamities could have a negative impact on our operations and cause us to lose revenue or incur additional costs due to, among other things, our inability to deploy our staff to client locations or facilities as a result of such disruptions.
The U.S. government budget deficits, the national debt, and the prevailing economic condition, and actions taken to address them, could continue to negatively affect the U.S. government expenditures on defense, intelligence, and civil programs for which we provide support. The Department of Defense is one of our significant clients and cost cutting, including through consolidation and elimination of duplicative organizations and insourcing, has become a major initiative for the Department of Defense. In particular, the Budget Control Act of 2011 (as amended by the American Taxpayer Relief Act of 2012 and the Consolidated Appropriations Act, 2014) requires a ten-year $487 billion reduction to baseline spending of the Department of Defense and provides for automatic spending cuts (referred to as sequestration) totaling approximately $1.2 trillion between 2013 and 2021, including an estimated $500 billion in federal defense spending cuts over this time period. On February 2, 2015, President Obama released his U.S. government fiscal year 2016 budget proposal, which sets discretionary spending at $1.087 trillion, with $561 billion for defense and $526 billion for non-defense. The President's proposal would eliminate the sequester for fiscal year 2016 and future years through a series of ten year offsets that include trimming certain mandatory and discretionary programs by $600 billion, raising nearly $640 billion in new tax revenue, and implementing an immigration overhaul plan that estimates say would save approximately $160 billion. It is unclear, however, whether Congress will enact any of the President’s proposed budget increases, and there remains uncertainty regarding how sequester cuts beyond government fiscal year 2015 will be applied to the Department of Defense and other agencies. The implementation of further such spending cuts may reduce, delay or cancel funding for certain of our contracts and programs and could adversely impact our operations and financial results. While recent budget actions reflect a more measured and strategic approach to addressing the U.S. government’s fiscal challenges, there remains uncertainty as to how exactly budget cuts, including sequestration, will impact us, and we are therefore unable to predict the extent of the impact of such cuts on our business and results of operations. However, a reduction in the amount of services that we are contracted to provide to the Department of Defense as a result of any of these related initiatives, legislation or otherwise could have a material adverse effect on our business and results of operations. In addition, in response to an Office of Management and Budget mandate, government agencies have reduced management support services spending in recent years. If federal awards for management support services continue to decline, our revenue and operating profits may materially decline and further efforts by the Office of Management and Budget to decrease federal awards for management support services could have a material and adverse effect on our business and results of operations.
18
These or other factors could cause our defense, intelligence, or civil clients to decrease the number of new contracts awarded generally and fail to award us new contracts, reduce their purchases under our existing contracts, exercise their right to terminate our contracts, or not exercise options to renew our contracts, any of which could cause a material decline in our revenue.
We are required to comply with numerous laws and regulations, some of which are highly complex, and our failure to comply could result in fines or civil or criminal penalties or suspension or debarment by the U.S. government that could result in our inability to continue to work on or receive U.S. government contracts, which could materially and adversely affect our results of operations.
As a U.S. government contractor, we must comply with laws and regulations relating to the formation, administration, and performance of U.S. government contracts, which affect how we do business with our clients. Such laws and regulations may potentially impose added costs on our business and our failure to comply with them may lead to civil or criminal penalties, termination of our U.S. government contracts, and/or suspension or debarment from contracting with federal agencies. Some significant laws and regulations that affect us include:
• | the FAR, and agency regulations supplemental to the FAR, which regulate the formation, administration, and performance of U.S. government contracts. For example, FAR 52.203-13 requires contractors to establish a Code of Business Ethics and Conduct, implement a comprehensive internal control system, and report to the government when the contractor has credible evidence that a principal, employee, agent, or subcontractor, in connection with a government contract, has violated certain federal criminal laws, violated the civil False Claims Act, or has received a significant overpayment; |
• | the False Claims Act and False Statements Act, which impose civil and criminal liability for presenting false or fraudulent claims for payments or reimbursement, and making false statements to the U.S. government, respectively; |
• | the Truth in Negotiations Act, which requires certification and disclosure of cost and pricing data in connection with the negotiation of a contract, modification, or task order; |
• | post government employment laws and regulations, which restrict the ability of a contractor to recruit, hire, and deploy former employees of the U.S. government; |
• | laws, regulations, and executive orders restricting the use and dissemination of information classified for national security purposes and the export of certain products, services, and technical data, including requirements regarding any applicable licensing of our employees involved in such work; and |
• | the FAR Cost Accounting Standards and Cost Principles, which impose accounting requirements that govern our right to reimbursement under certain cost-based U.S. government contracts and require consistency of accounting practices over time. |
In addition, the U.S. government adopts new laws, rules, and regulations from time to time that could have a material impact on our results of operations.
Our performance under our U.S. government contracts and our compliance with the terms of those contracts and applicable laws and regulations are subject to periodic audit, review, and investigation by various agencies of the U.S. government and the current environment has led to increased regulatory scrutiny and sanctions for non-compliance by such agencies generally. In addition, from time to time we report potential or actual violations of applicable laws and regulations to the relevant governmental authority. Any such report of a potential or actual violation of applicable laws or regulations could lead to an audit, review, or investigation by the relevant agencies of the U.S. government. If such an audit, review, or investigation uncovers a violation of a law or regulation, or improper or illegal activities relating to our U.S. government contracts, we may be subject to civil or criminal penalties or administrative sanctions, including the termination of contracts, forfeiture of profits, the triggering of price reduction clauses, withholding of payments, suspension of payments, fines and suspension, or debarment from contracting with U.S. government agencies. Such penalties and sanctions are not uncommon in the industry and there is inherent uncertainty as to the outcome of any particular audit, review, or investigation. If we incur a material penalty or administrative sanction or otherwise suffer harm to our reputation, our profitability, cash position, and future prospects could be materially and adversely affected.
Further, if the U.S. government were to initiate suspension or debarment proceedings against us or if we are indicted for or convicted of illegal activities relating to our U.S. government contracts following an audit, review, or investigation, we may lose our ability to be awarded contracts in the future or receive renewals of existing contracts for a period of time which could materially and adversely affect our results of operations or financial condition. We could also suffer harm to our reputation if allegations of impropriety were made against us, which would impair our ability to win awards of contracts in the future or receive renewals of existing contracts. See “Item 1. Business — Regulation."
19
We derive a majority of our revenue from contracts awarded through a competitive bidding process, and our revenue and profitability may be adversely affected if we are unable to compete effectively in the process or if there are delays caused by our competitors protesting major contract awards received by us.
We derive a majority of our revenue from U.S. government contracts awarded through competitive bidding processes. We do not expect this to change for the foreseeable future. Our failure to compete effectively in this procurement environment would have a material adverse effect on our revenue and profitability.
The competitive bidding process involves risk and significant costs to businesses operating in this environment, including:
• | the necessity to expend resources, make financial commitments (such as procuring leased premises) and bid on engagements in advance of the completion of their design, which may result in unforeseen difficulties in execution, cost overruns and, in the case of an unsuccessful competition, the loss of committed costs; |
• | the substantial cost and managerial time and effort spent to prepare bids and proposals for contracts that may not be awarded to us; |
• | the ability to accurately estimate the resources and costs that will be required to service any contract we are awarded; |
• | the expense and delay that may arise if our competitors protest or challenge contract awards made to us pursuant to competitive bidding, and the risk that any such protest or challenge could result in the resubmission of bids on modified specifications, or in termination, reduction, or modification of the awarded contract; and |
• | any opportunity cost of bidding and winning other contracts we might otherwise pursue. |
In circumstances where contracts are held by other companies and are scheduled to expire, we still may not be provided the opportunity to bid on those contracts if the U.S. government determines to extend the existing contract. If we are unable to win particular contracts that are awarded through the competitive bidding process, we may not be able to operate in the market for services that are provided under those contracts for the duration of those contracts to the extent that there is no additional demand for such services. An inability to consistently win new contract awards over any extended period would have a material adverse effect on our business and results of operations.
The current competitive environment has resulted in an increase in the number of bid protests from unsuccessful bidders on new program awards. It can take many months for the relevant U.S. government agency to resolve protests by one or more of our competitors of contract awards we receive. Bid protests may result in significant expense to us, contract modification or loss of an awarded contract as a result of the award being overturned. Even where we do not lose the awarded contract, the resulting delay in the start up and funding of the work under these contracts may cause our actual results to differ materially and adversely from those anticipated.
A significant majority of our revenue is derived from task orders under indefinite delivery/indefinite quantity, or ID/IQ, contract vehicles including GSA Schedules and GWACs, where we perform in either a prime or subcontract position. Some of these contract vehicles are material to our business.
We believe that one of the key elements of our success is our position as the holder of over 3,300 active task orders under ID/IQ contract vehicles (inclusive of GSA Schedules and GWAC's) as of March 31, 2015, the largest of which represents 12% of our revenue base. Our ability to maintain our existing business and win new business depends on our ability to maintain our prime and subcontractor positions on these contracts. Our largest ID/IQ contract expires on July 8, 2015. The loss, without replacement, of certain of these contract vehicles could have a material adverse affect on our ability to win new business and our operating results. In addition, if the U.S. government elects to use a contract vehicle that we do not hold, we will not be able to compete for work under that contract vehicle as a prime contractor.
We may earn less revenue than projected, or no revenue, under certain of our contracts.
Many of our contracts with our clients are ID/IQ contracts, including GSA schedules and GWACs. ID/IQ contracts provide for the issuance by the client of orders for services or products under the contract, and often contain multi-year terms and unfunded ceiling amounts, which allow but do not commit the U.S. government to purchase products and services from contractors. Our ability to generate revenue under each of these types of contracts depends upon our ability to be awarded task orders for specific services by the client. ID/IQ contracts may be awarded to one contractor (single award) or several contractors (multiple award). Multiple contractors must compete under multiple award ID/IQ contracts for task orders to provide particular services, and contractors earn revenue only to the extent that they successfully compete for these task orders. In fiscal 2015, fiscal 2014, and fiscal 2013, our revenue under our GSA schedules and GWACs accounted for 20%, 21% and 19%, respectively, of our total revenue. A failure to be awarded task orders under such contracts would have a material adverse effect on our results of operations and financial condition.
20
Our earnings and profitability may vary based on the mix of our contracts and may be adversely affected by our failure to accurately estimate or otherwise recover the expenses, time, and resources for our contracts.
We enter into three general types of U.S. government contracts for our services: cost-reimbursable, time-and-materials, and fixed-price. For fiscal 2015, we derived 55% of our revenue from cost-reimbursable contracts, 25% from time-and-materials contracts and 20% from fixed-price contracts.
Each of these types of contracts, to varying degrees, involves the risk that we could underestimate our cost of fulfilling the contract, which may reduce the profit we earn or lead to a financial loss on the contract and adversely affect our operating results.
Under cost-reimbursable contracts, we are reimbursed for allowable costs up to a ceiling and paid a fee, which may be fixed or performance-based. If our actual costs exceed the contract ceiling or are not allowable under the terms of the contract or applicable regulations, we may not be able to recover those costs. In particular, there is increasing focus by the U.S. government on the extent to which government contractors, including us, are able to receive reimbursement for employee compensation, including recent rules under the Bipartisan Budget Act of 2013 that substantially decreased the level of allowable compensation cost for executive-level employees and further applied the newly reduced limitation to all employees. In addition, there is an increased risk of compensation being deemed unallowable or payments being withheld as a result of U.S. government audit, review or investigation.
Under time-and-materials contracts, we are reimbursed for labor at negotiated hourly billing rates and for certain allowable expenses. We assume financial risk on time-and-materials contracts because our costs of performance may exceed these negotiated hourly rates.
Under fixed-price contracts, we perform specific tasks for a pre-determined price. Compared to time-and-materials and cost-reimbursable contracts, fixed-price contracts generally offer higher margin opportunities because we receive the benefits of any cost savings, but involve greater financial risk because we bear the impact of any cost overruns. The U.S. government has generally indicated that it intends to increase its use of fixed price contract procurements. Because we assume the risk for cost overruns and contingent losses on fixed-price contracts, an increase in the percentage of fixed-price contracts in our contract mix would increase our risk of suffering losses.
Additionally, our profits could be adversely affected if our costs under any of these contracts exceed the assumptions we used in bidding for the contract. For example, we may miscalculate the costs, resources, or time needed to complete projects or meet contractual milestones as a result of delays on a particular project, including delays in designs, engineering information, or materials provided by the customer or a third party, delays or difficulties in equipment and material delivery, schedule changes, and other factors, some of which are beyond our control. We have recorded provisions in our consolidated financial statements for losses on our contracts, as required under U.S. Generally Accepted Accounting Principles, or GAAP, but our contract loss provisions may not be adequate to cover all actual losses that we may incur in the future.
Our professional reputation is critical to our business, and any harm to our reputation could decrease the amount of business the U.S. government does with us, which could have a material adverse effect on our future revenue and growth prospects.
We depend on our contracts with U.S. government agencies for substantially all of our revenue and if our reputation or relationships with these agencies were harmed, our future revenue and growth prospects would be materially and adversely affected. Our reputation and relationship with the U.S. government is a key factor in maintaining and growing revenue under contracts with the U.S. government. Negative press reports regarding poor contract performance, employee misconduct, information security breaches, or other aspects of our business, or regarding government contractors generally, could harm our reputation. In addition, to the extent our performance under a contract does not meet a U.S. government agency’s expectations, the client might seek to terminate the contract prior to its scheduled expiration date, provide a negative assessment of our performance to government-maintained contractor past-performance data repositories, fail to award us additional business under existing contracts or otherwise, and direct future business to our competitors. If our reputation with these agencies is negatively affected, or if we are suspended or debarred from contracting with government agencies for any reason, such actions would decrease the amount of business that the U.S. government does with us, which would have a material adverse effect on our future revenue and growth prospects.
21
We use estimates in recognizing revenue and if we make changes to estimates used in recognizing revenue, our profitability may be adversely affected.
Revenue from our fixed-price contracts is primarily recognized using the percentage-of-completion method with progress toward completion of a particular contract based on actual costs incurred relative to total estimated costs to be incurred over the life of the contract. Revenue from our cost-reimbursable-plus-award-fee contracts are based on our estimation of award fees over the life of the contract. Estimating costs at completion and award fees on our long-term contracts is complex and involves significant judgment. Adjustments to original estimates are often required as work progresses, experience is gained, and additional information becomes known, even though the scope of the work required under the contract may not change. Any adjustment as a result of a change in estimate is recognized as events become known.
In the event updated estimates indicate that we will experience a loss on the contract, we recognize the estimated loss at the time it is determined. Additional information may subsequently indicate that the loss is more or less than initially recognized, which requires further adjustments in our consolidated financial statements. Changes in the underlying assumptions, circumstances, or estimates could result in adjustments that could have a material adverse effect on our future results of operations.
We may not realize the full value of our backlog, which may result in lower than expected revenue.
As of March 31, 2015, our total backlog was $9.4 billion, of which $2.7 billion was funded. We define backlog to include the following three components:
• | Funded Backlog. Funded backlog represents the revenue value of orders for services under existing contracts for which funding is appropriated or otherwise authorized, less revenue previously recognized on these contracts. |
• | Unfunded Backlog. Unfunded backlog represents the revenue value of orders for services under existing contracts for which funding has not been appropriated or otherwise authorized. |
• | Priced Options. Priced contract options represent 100% of the revenue value of all future contract option periods under existing contracts that may be exercised at our clients’ option and for which funding has not been appropriated or otherwise authorized. |
Backlog does not include any task orders under ID/IQ contracts, including GWACs and GSA schedules, except to the extent that task orders have been awarded to us under those contracts.
We historically have not realized all of the revenue included in our total backlog, and we may not realize all of the revenue included in our total backlog in the future. There is a somewhat higher degree of risk in this regard with respect to unfunded backlog and priced options. In addition, there can be no assurance that our backlog will result in actual revenue in any particular period. This is because the actual receipt, timing, and amount of revenue under contracts included in backlog are subject to various contingencies, including congressional appropriations, many of which are beyond our control. In particular, delays in the completion of the U.S. government’s budgeting process and the use of continuing resolutions could adversely affect our ability to timely recognize revenue under our contracts included in backlog. Furthermore, the actual receipt of revenue from contracts included in backlog may never occur or may be delayed because: a program schedule could change or the program could be canceled; a contract’s funding or scope could be reduced, modified, delayed, or terminated early, including as a result of a lack of appropriated funds or as a result of cost cutting initiatives and other efforts to reduce U.S. government spending and/or the automatic federal defense spending cuts required by sequestration; in the case of funded backlog, the period of performance for the contract has expired; in the case of unfunded backlog, funding may not be available; or, in the case of priced options, our clients may not exercise their options. In addition, consulting staff headcount growth is the primary means by which we are able to recognize revenue growth. Any inability to hire additional appropriately qualified personnel or failure to timely and effectively deploy such additional personnel against funded backlog could negatively affect our ability to grow our revenue. Furthermore, even if our backlog results in revenue, the contracts may not be profitable.
We may fail to attract, train and retain skilled and qualified employees, which may impair our ability to generate revenue, effectively serve our clients, and execute our growth strategy.
Our business depends in large part upon our ability to attract and retain sufficient numbers of highly qualified individuals who may have advanced degrees in areas such as information technology as well as appropriate security clearances. We compete for such qualified personnel with other U.S. government contractors, the U.S. government, and private industry, and such competition is intense. Personnel with the requisite skills, qualifications, or security clearance may be in short supply or generally unavailable. In addition, our ability to recruit, hire, and internally deploy former employees of the U.S. government is subject to complex laws and regulations, which may serve as an impediment to our ability to attract such former employees, and failure to comply with these laws and regulations may expose us and our employees to civil or criminal penalties. If we are unable to recruit and retain a sufficient number of qualified employees, or fail to deploy such employees or obtain their appropriate security clearances in a timely manner, our ability to maintain and grow our business and to effectively serve our
22
clients could be limited and our future revenue and results of operations could be materially and adversely affected. Furthermore, to the extent that we are unable to make necessary permanent hires to appropriately serve our clients, we could be required to engage larger numbers of contracted personnel, which could reduce our profit margins.
If we are able to attract sufficient numbers of qualified new hires, training and retention costs may place significant demands on our resources. In addition, to the extent that we experience attrition in our employee ranks, we may realize only a limited or no return on such invested resources, and we would have to expend additional resources to hire and train replacement employees. The loss of services of key personnel could also impair our ability to perform required services under some of our contracts and to retain such contracts, as well as our ability to win new business.
We may fail to obtain and maintain necessary security clearances which may adversely affect our ability to perform on certain contracts.
Many U.S. government programs require contractor employees and facilities to have security clearances. Depending on the level of required clearance, security clearances can be difficult and time-consuming to obtain. If we or our employees are unable to obtain or retain necessary security clearances, we may not be able to win new business, and our existing clients could terminate their contracts with us or decide not to renew them. To the extent we are not able to obtain and maintain facility security clearances or engage employees with the required security clearances for a particular contract, we may not be able to bid on or win new contracts, or effectively rebid on expiring contracts, as well as lose existing contracts, which may adversely affect our operating results and inhibit the execution of our growth strategy.
Our profitability could suffer if we are not able to timely and effectively utilize our employees or manage our cost structure.
The cost of providing our services, including the degree to which our employees are utilized, affects our profitability. The degree to which we are able to utilize our employees in a timely manner or at all is affected by a number of factors, including:
• | our ability to transition employees from completed projects to new assignments and to hire, assimilate, and deploy new employees; |
• | our ability to forecast demand for our services and to maintain and deploy headcount that is aligned with demand, including employees with the right mix of skills and experience to support our projects; |
• | our employees’ inability to obtain or retain necessary security clearances; |
• | our ability to manage attrition; and |
• | our need to devote time and resources to training, business development, and other non-chargeable activities. |
If our employees are under-utilized, our profit margin and profitability could suffer. Additionally, if our employees are over-utilized, it could have a material adverse effect on employee engagement and attrition, which would in turn have a material adverse impact on our business.
Our profitability is also affected by the extent to which we are able to effectively manage our overall cost structure for operating expenses, such as wages and benefits, overhead and capital and other investment-related expenditures. If we are unable to effectively manage our costs and expense and achieve efficiencies, our competitiveness and profitability may be adversely affected.
We may lose one or more members of our senior management team or fail to develop new leaders, which could cause the disruption of the management of our business.
We believe that the future success of our business and our ability to operate profitably depends on the continued contributions of the members of our senior management and the continued development of new members of senior management. We rely on our senior management to generate business and execute programs successfully. In addition, the relationships and reputation that many members of our senior management team have established and maintain with our clients are important to our business and our ability to identify new business opportunities. We have employment agreements with only our four most senior executives. The loss of any member of our senior management or our failure to continue to develop new members could impair our ability to identify and secure new contracts, to maintain good client relations, and to otherwise manage our business.
Our employees or subcontractors may engage in misconduct or other improper activities, which could harm our ability to conduct business with the U.S. government.
We are exposed to the risk that employee or subcontractor fraud or other misconduct could occur. Misconduct by employees or subcontractors could include intentional or unintentional failures to comply with U.S. government procurement regulations, engaging in other unauthorized activities, or falsifying time records. Employee or subcontractor misconduct could also involve the improper use of our clients’ sensitive or classified information, or the inadvertent or intentional disclosure of
23
our or our clients' sensitive information in violation of our contractual, statutory, or regulatory obligations. It is not always possible to deter employee or subcontractor misconduct, and the precautions we take to prevent and detect this activity may not be effective in controlling unknown or unmanaged risks or losses, which could materially harm our business. As a result of such misconduct, our employees could lose their security clearance and we could face fines and civil or criminal penalties, loss of facility clearance accreditation, and suspension, proposed debarment or debarment from bidding for or performing under contracts with the U.S. government, as well as reputational harm, which would materially and adversely affect our results of operations and financial condition.
We face intense competition from many competitors, which could cause us to lose business, lower prices and suffer employee departures.
Our business operates in a highly competitive industry, and we generally compete with a wide variety of U.S. government contractors, including large defense contractors, diversified service providers, and small businesses. We also face competition from entrants into our markets including companies divested by large prime contractors in response to increasing scrutiny of organizational conflicts of interest issues and from market participants formed by or benefiting from industry consolidation. Some of these companies possess greater financial resources and larger technical staffs, and others have smaller and more specialized staffs. These competitors could, among other things:
• | divert sales from us by winning very large-scale government contracts, a risk that is enhanced by the recent trend in government procurement practices to bundle services into larger contracts; |
• | force us to charge lower prices in order to win or maintain contracts; |
• | seek to hire our employees; or |
• | adversely affect our relationships with current clients, including our ability to continue to win competitively awarded engagements where we are the incumbent. |
If we lose business to our competitors or are forced to lower our prices or suffer employee departures, our revenue and our operating profits could decline. In addition, we may face competition from our subcontractors who, from time to time, seek to obtain prime contractor status on contracts for which they currently serve as a subcontractor to us. If one or more of our current subcontractors are awarded prime contractor status on such contracts in the future, it could divert sales from us and could force us to charge lower prices, which could have a material adverse effect on our revenue and profitability.
Our failure to maintain strong relationships with other contractors, or the failure of contractors with which we have entered into a sub- or prime contractor relationship to meet their obligations to us or our clients, could have a material adverse effect on our business and results of operations.
Maintaining strong relationships with other U.S. government contractors, who may also be our competitors, is important to our business and our failure to do so could have a material adverse effect on our business, prospects, financial condition, and operating results. To the extent that we fail to maintain good relations with our subcontractors or other prime contractors due to either perceived or actual performance failures or other conduct, they may refuse to hire us as a subcontractor in the future or to work with us as our subcontractor. In addition, other contractors may choose not to use us as a subcontractor or choose not to perform work for us as a subcontractor for any number of additional reasons, including because they choose to establish relationships with our competitors or because they choose to directly offer services that compete with our business.
As a prime contractor, we often rely on other companies to perform some of the work under a contract, and we expect to continue to depend on relationships with other contractors for portions of our delivery of services and revenue in the foreseeable future. If our subcontractors fail to perform their contractual obligations, our operating results and future growth prospects could be impaired. There is a risk that we may have disputes with our subcontractors arising from, among other things, the quality and timeliness of work performed by the subcontractor, client concerns about the subcontractor, our failure to extend existing task orders or issue new task orders under a subcontract, or our hiring of a subcontractor’s personnel. In addition, if any of our subcontractors fail to deliver the agreed-upon supplies or perform the agreed-upon services on a timely basis, our ability to fulfill our obligations as a prime contractor may be jeopardized. Material losses could arise in future periods and subcontractor performance deficiencies could result in a client terminating a contract for default. A termination for default could expose us to liability and have an adverse effect on our ability to compete for future contracts and orders.
We estimate that revenue derived from contracts under which we acted as a subcontractor to other companies represented 9% of our revenue for fiscal 2015. As a subcontractor, we often lack control over fulfillment of a contract, and poor performance on the contract could tarnish our reputation, even when we perform as required, and could cause other contractors to choose not to hire us as a subcontractor in the future. If the U.S. government terminates or reduces other prime contractors’ programs or does not award them new contracts, subcontracting opportunities available to us could decrease, which would have a material adverse effect on our financial condition and results of operations. In addition, as a subcontractor, we may be unable to collect payments owed to us by the prime contractor, even if we have performed our obligations under the contract, as a
24
result of, among other things, the prime contractor’s inability to fulfill the contact. Due to certain common provisions in subcontracts in certain countries, we could also experience delays in receiving payment if the prime contractor experiences payment delays, which could have an adverse effect on our financial condition and results of operations.
Adverse judgments or settlements in legal disputes could result in materially adverse monetary damages or injunctive relief and damage our reputation.
We are subject to, and may become a party to, a variety of litigation or other claims and suits that arise from time to time in the ordinary course of our business. For example, over time, we have had disputes with current and former employees involving alleged violations of civil rights, wage and hour, and worker’s compensation laws. Further, as more fully described under “Item 3. Legal Proceedings,” six former officers and stockholders who had departed the firm prior to the acquisition have filed a total of nine suits in various jurisdictions against our company and certain of our current and former directors and officers. Each of the suits arises out of the acquisition and alleges that the former stockholders are entitled to certain payments that they would have received if they had held their stock at the time of acquisition. Three of these suits have been dismissed with all appeals exhausted. Two suits were settled on April 16, 2015. The four remaining suits have been dismissed but are either on appeal or subject to appeal by the plaintiffs. The results of litigation and other legal proceedings are inherently uncertain and adverse judgments or settlements in some or all of these legal disputes may result in materially adverse monetary damages or injunctive relief against us. Any claims or litigation, even if fully indemnified or insured, could damage our reputation and make it more difficult to compete effectively or obtain adequate insurance in the future. The litigation and other claims described under the “Item 3. Legal Proceedings” are subject to future developments and management’s view of these matters may change in the future.
Systems that we develop, integrate, maintain, or otherwise support could experience security breaches which may damage our reputation with our clients and hinder future contract win rates.
Many of the systems we develop, integrate, maintain, or otherwise support involve managing and protecting information involved in intelligence, national security, and other sensitive or classified government functions. The cyber and security threats that our clients face have grown more frequent and sophisticated. A security breach in one of these systems could cause serious harm to our business, damage our reputation, and prevent us from being eligible for further work on sensitive systems for U.S. government clients. Work for non-U.S. government clients involving the protection of information systems could also be harmed due to associated security breaches. Damage to our reputation or limitations on our eligibility for additional work or any liability resulting from a security breach in one of the systems we develop, install, maintain, or otherwise support could have a material adverse effect on our results of operations.
Certain services we provide and technologies we develop are designed to detect and monitor threats to our clients and may require our staff to travel to locations where their physical safety may be at risk.
We help our clients detect, monitor and mitigate threats to their people, information and facilities. These threats may originate from nation states, terrorist or criminal actors, activist hackers or others who seek to harm our clients. Successful attacks on our clients may cause reputational harm to us and our clients, as well as liability to our clients or third parties. In addition, if we are associated with our clients in this regard, our staff, information and facilities may be targeted by a similar group of threat actors and may be at risk for loss, or physical or reputational harm.
Internal system or service failures, including as a result of cyber or other security threats, could disrupt our business and impair our ability to effectively provide our services to our clients, which could damage our reputation and have a material adverse effect on our business and results of operations.
We create, implement, and maintain information technology and engineering systems, and provide services that are often critical to our clients' operations, some of which involve sensitive information and may be conducted in war zones or other hazardous environments. As a result, we are subject to systems or service failures, not only resulting from our own failures or the failures of third-party service providers, natural disasters, power shortages, or terrorist attacks, but also from continuous exposure to cyber and other security threats, including computer viruses, attacks by computer hackers or physical break-ins. There has been an increase in the frequency and sophistication of the cyber and security threats we face, with attacks ranging from those common to businesses generally to those that are more advanced and persistent, which may target us because, as a cybersecurity services contractor, we hold classified or other sensitive information. As a result, we face a heightened risk of a security breach or disruption with respect to sensitive information resulting from an attack by computer hackers, foreign governments, and cyber terrorists. We have been the target of these types of attacks in the past and future attacks are likely to occur. If successful, these types of attacks on our network or other systems or service failures could have a material adverse effect on our business and results of operations, due to, among other things, the loss of client or proprietary data, interruptions or delays in our clients' businesses, and damage to our reputation. In addition, the failure or disruption of our systems, communications, or utilities could cause us to interrupt or suspend our operations, which could have a material adverse effect on our business and results of operations. In addition, if our employees inadvertently do not adhere to appropriate information security protocols, our protocols are inadequate, or our employees intentionally avoid these protocols, our or our client's
25
sensitive information may be released thereby causing significant negative impacts to our reputation and expose us or our clients to liability.
If our systems, services, or other applications have significant defects or errors, are successfully attacked by cyber and other security threats, suffer delivery delays, or otherwise fail to meet our clients’ expectations, we may:
• | lose revenue due to adverse client reaction; |
• | be required to provide additional services to a client at no charge; |
• | incur additional costs related to monitoring and increasing our cybersecurity; |
• | lose revenue due to the deployment of internal staff for remediation efforts instead of client assignments; |
• | receive negative publicity, which could damage our reputation and adversely affect our ability to attract or retain clients; |
• | be unable to successfully market services that are reliant on the creation and maintaining of secure information technology systems to U.S. government, international, and commercial clients; |
• | suffer claims by clients or impacted third parties for substantial damages, particularly as a result of any successful network or systems breach and exfiltration of client and/or third party information; or |
• | incur significant costs complying with applicable federal or state law, including laws governing protection of personal information. |
In addition to any costs resulting from contract performance or required corrective action, these failures may result in increased costs or loss of revenue if they result in clients postponing subsequently scheduled work or canceling or failing to renew contracts.
The costs related to cyber or other security threats or disruptions may not be fully insured or indemnified by other means. Additionally, some cyber technologies and techniques that we utilize or develop may raise potential liabilities related to legal compliance intellectual property and civil liberties, including privacy concerns, which may not be fully insured or indemnified. Our errors and omissions insurance coverage may not continue to be available on reasonable terms or in sufficient amounts to cover one or more large claims, or the insurer may disclaim coverage as to some types of future claims. The successful assertion of any large claim against us could seriously harm our business. Even if not successful, these claims could result in significant legal and other costs, may be a distraction to our management, and may harm our client relationships. In certain new business areas, we may not be able to obtain sufficient insurance and may decide not to accept or solicit business in these areas.
Failure to adequately protect, maintain, or enforce our rights in our intellectual property may adversely limit our competitive position.
We rely upon a combination of nondisclosure agreements and other contractual arrangements, as well as copyright, trademark, patent, and trade secret laws to protect our proprietary information. We also enter into proprietary information and intellectual property agreements with employees, which require them to disclose any inventions created during employment, to convey such rights to inventions to us, and to restrict any disclosure of proprietary information. Trade secrets are generally difficult to protect. Although our employees are subject to confidentiality obligations, this protection may be inadequate to deter or prevent misappropriation of our confidential information and/or the infringement of our patents and copyrights. Further, we may be unable to detect unauthorized use of our intellectual property or otherwise take appropriate steps to enforce our rights. Failure to adequately protect, maintain, or enforce our intellectual property rights may adversely limit our competitive position.
Assertions by third parties of infringement, misappropriation or other violations by us of their intellectual property rights could result in significant costs and substantially harm our business and operating results.
In recent years, there has been significant litigation involving intellectual property rights in technology industries. We may face from time to time, allegations that we or a supplier or customer have violated the rights of third parties, including patent, trademark, and other intellectual property rights. If, with respect to any claim against us for violation of third-party intellectual property rights, we are unable to prevail in the litigation or retain or obtain sufficient rights or develop non-infringing intellectual property or otherwise alter our business practices on a timely or cost-efficient basis, our business and competitive position may be adversely affected.
Any infringement, misappropriation or related claims, whether or not meritorious, are time consuming, divert technical and management personnel, and are costly to resolve. As a result of any such dispute, we may have to develop non-infringing technology, pay damages, enter into royalty or licensing agreements, cease utilizing certain products or services, or take other actions to resolve the claims. These actions, if required, may be costly or unavailable on terms acceptable to us.
26
Our focus on new growth areas for our business entails risks, including those associated with new relationships, clients, talent needs, capabilities, service offerings, and maintaining our collaborative culture and core values.
We are focused on growing our presence in our addressable markets by: expanding our relationships with existing clients, developing new clients by leveraging our core competencies, further developing our existing capabilities and service offerings, and creating new capabilities and service offerings to address our clients' emerging needs, and undertaking business development efforts focused on identifying near-term developments and long-term trends that may pose significant challenges for our clients. These efforts entail inherent risks associated with innovation and competition from other participants in those areas, potential failure to help our clients respond to the challenges they face, our ability to comply with uncertain evolving legal standards applicable to certain of our service offerings, including those in the cybersecurity area, and, with respect to potential international growth, risks associated with operating in foreign jurisdictions, such as compliance with applicable foreign and U.S. laws and regulations that may impose different and, occasionally, conflicting or contradictory requirements, and the economic, legal, and political conditions in the foreign jurisdictions in which we operate. As we attempt to develop new relationships, clients, capabilities, and service offerings, these efforts could harm our results of operations due to, among other things, a diversion of our focus and resources and actual costs, opportunity costs of pursuing these opportunities in lieu of others and a failure to reach a profitable return on our investments in new technologies, capabilities, and businesses, including expenses on research and development investments, and these efforts could ultimately be unsuccessful.
In addition, our ability to grow our business by leveraging our operating model to efficiently and effectively deploy our people across our client base is largely dependent on our ability to maintain our collaborative culture. To the extent that we are unable to maintain our culture for any reason, including our effort to focus on new growth areas or acquire new businesses with different corporate cultures, we may be unable to grow our business. Any such failure could have a material adverse effect on our business and results of operations.
In addition, with the growth of our U.S. and international operations, we are now providing client services and undertaking business development efforts in numerous and disparate geographic locations both domestically and internationally. Our ability to effectively serve our clients is dependent upon our ability to successfully leverage our operating model across all of these and any future locations, maintain effective management controls over all of our locations to ensure, among other things, compliance with applicable laws, rules and regulations, and instill our core values in all of our personnel at each of these and any future locations. Any inability to ensure any of the foregoing could have a material adverse effect on our business and results of operations.
Our international operations are subject to local and other foreign laws, U.S. government laws, regulations such as the Foreign Corrupt Practices Act, and procurement policies which may expose us to liability or impair our ability to compete in international markets.
Our international operations are subject to the U.S. Foreign Corrupt Practices Act, or the FCPA, and other laws that prohibit improper payments or offers of payments to foreign governments and their officials and political parties by business entities for the purpose of obtaining or retaining business. We have operations and deal with governmental clients in countries known to experience corruption, including certain emerging countries in the Middle East and Southeast Asia. Our activities in these countries create the risk of unauthorized payments or offers of payments by one of our employees, consultants or contractors that could be in violation of various laws including the FCPA and other anti-corruption laws, even though these parties are not always subject to our control. Our international operations also involve activities involving the transmittal of information, which may include personal data,that may expose us to data privacy laws in the jurisdictions in which we operate. If our data protection practices become subject to new or different restrictions, and to the extent such practices are not compliant with the laws of the countries in which we process data, we could face increased compliance expenses and face penalties for violating such laws or be excluded from those markets altogether, in which case our operations could be adversely affected. We are also subject to import-export control regulations restricting the use and dissemination of information classified for national security purposes and the export of certain products, services, and technical data, including requirements regarding any applicable licensing of our employees involved in such work.
If we were to fail to comply with the FCPA, other anti-corruption laws, applicable import-export control regulations, data privacy laws, or other applicable rules and regulations, we could be subject to substantial civil and criminal penalties, including fines for our company and incarceration for responsible employees and managers, suspension or debarment, and the possible loss of export or import privileges which could have a material adverse effect on our business and results of operations.
27
Changes to our operating structure, capabilities or strategy intended to address our clients’ needs, respond to developments in our markets and grow our business may not be successful.
We routinely review our operating structure, capabilities and strategy to determine whether we are effectively meeting the needs of existing clients, effectively responding to developments in our markets and successfully building platforms intended to provide the foundation for the future growth of our business. The outcome of any such review is difficult to predict and the extent of changes to our business following such a review, if any, are dependent in part upon the nature and extent of the review.
The implementation of these changes, and the implementation of other future changes to our operating structure, capabilities, strategy or any other aspect of our business following an internal review, may materially alter various aspects of our business or our business model as an entirety and there can be no assurance that any such changes will be successful or that they will not ultimately have a negative effect on our business and results of operations.
We and our subsidiaries may incur debt in the future, which could substantially reduce our profitability, limit our ability to pursue certain business opportunities, and reduce the value of your investment.
As of March 31, 2015, we had approximately $1.6 billion of debt outstanding. The instruments governing our indebtedness may not prevent us or our subsidiaries from incurring additional debt in the future or other obligations that do not constitute indebtedness, which could increase the risks described below and lead to other risks. In addition, with the closing of our refinancing on May 7, 2014, we may increase the borrowing capacity under our senior secured credit agreement without the consent of any person other than the institutions agreeing to provide all or any portion of such increase, to an amount which would not cause our net consolidated secured leverage ratio to exceed 3.50:1.00, subject to certain closing conditions including pro forma compliance with financial covenants. The amount of our debt or such other obligations could have important consequences, including, but not limited to:
• | our ability to satisfy obligations to lenders may be impaired, resulting in possible defaults on and acceleration of our indebtedness; |
• | our ability to obtain additional financing for refinancing of existing indebtedness, working capital, capital expenditures, product and service development, acquisitions, general corporate purposes, and other purposes may be impaired; |
• | a substantial portion of our cash flow from operations could be dedicated to the payment of the principal and interest on our debt; |
• | we may be increasingly vulnerable to economic downturns and increases in interest rates; |
• | our flexibility in planning for and reacting to changes in our business and the industry may be limited; and |
• | we may be placed at a competitive disadvantage relative to other firms in our industry. |
Our senior secured credit agreement contains financial and operating covenants that limit our operations and could lead to adverse consequences if we fail to comply with them.
Our senior secured credit agreement contains financial and operating covenants relating to, among other things, interest coverage and leverage ratios, as well as limitations on mergers, consolidations and dissolutions, sales of assets, investments and acquisitions, indebtedness and liens, dividends, repurchase of shares of capital stock and options to purchase shares of capital stock, transactions with affiliates, sale and leaseback transactions, and restricted payments. The revolving credit facility matures on May 31, 2019. The Term Loan A and Term Loan B facilities mature on May 31, 2019 and July 31, 2019, respectively. Failure to meet these financial and operating covenants could result from, among other things, changes in our results of operations, the incurrence of debt, or changes in general economic conditions, which may be beyond our control. These covenants may restrict our ability to engage in transactions that we believe would otherwise be in the best interests of our stockholders, which could harm our business and operations.
Many of our contracts with the U.S. government are classified or subject to other security restrictions, which may limit investor insight into portions of our business.
For fiscal 2015, we derived a substantial portion of our revenue from contracts with the U.S. government that are classified or subject to security restrictions that preclude the dissemination of certain information. In addition, a significant number of our employees have security clearances which preclude them from providing information regarding certain of our clients and services provided to such clients to other of our employees without security clearances and investors. Because we are limited in our ability to provide information about these contracts and services, the various risks associated with these contracts or services or any dispute or claims relating to such contracts or services, you may not have important information concerning our business, which will limit your insight into a substantial portion of our business and therefore may be less able to fully evaluate the risks related to that portion of our business.
28
If we cannot collect our receivables or if payment is delayed, our business may be adversely affected by our inability to generate cash flow, provide working capital, or continue our business operations.
We depend on the timely collection of our receivables to generate cash flow, provide working capital, and continue our business operations. If the U.S. government or any prime contractor for whom we are a subcontractor fails to pay or delays the payment of invoices for any reason, our business and financial condition may be materially and adversely affected. The U.S. government may delay or fail to pay invoices for a number of reasons, including lack of appropriated funds, lack of an approved budget, or as a result of audit findings by government regulatory agencies. Some prime contractors for whom we are a subcontractor have significantly fewer financial resources than we do, which may increase the risk that we may not be paid in full or that payment may be delayed.
Recent efforts by the U.S. government to revise its organizational conflict of interest rules could limit our ability to successfully compete for new contracts or task orders, which would adversely affect our results of operations.
Recent efforts by the U.S. government to reform its procurement practices have focused, among other areas, on the separation of certain types of work to facilitate objectivity and avoid or mitigate organizational conflicts of interest and the strengthening of regulations governing organizational conflicts of interest. Organizational conflicts of interest may arise from circumstances in which a contractor has:
• | impaired objectivity during performance; |
• | unfair access to non-public information; or |
• | the ability to set the “ground rules” for another procurement for which the contractor competes. |
A focus on organizational conflicts of interest issues has resulted in legislation and a proposed regulation aimed at increasing organizational conflicts of interest requirements, including, among other things, separating sellers of products and providers of advisory services in major defense acquisition programs. In addition, the U.S. government is working to adopt a FAR rule to address organizational conflicts of interest issues that will apply to all government contractors, including us, in Department of Defense and other procurements. A future FAR rule may also increase the restrictions in current organizational conflicts of interest regulations and rules. To the extent that proposed and future organizational conflicts of interest laws, regulations, and rules, limit our ability to successfully compete for new contracts or task orders with the U.S. government, either because of organizational conflicts of interest issues arising from our business, or because companies with which we are affiliated, including through Carlyle, or with which we otherwise conduct business, create organizational conflicts of interest issues for us, our results of operations could be materially and adversely affected.
Acquisitions could result in operating difficulties or other adverse consequences to our business.
As part of our operating strategy, we may continue to selectively pursue acquisitions. This could pose many risks, including:
• | we may not be able to identify suitable acquisition candidates at prices we consider attractive; |
• | we may not be able to compete successfully for identified acquisition candidates, complete acquisitions, or accurately estimate the financial effect of acquisitions on our business; |
• | future acquisitions may require us to issue common stock or spend significant cash, resulting in dilution of ownership or additional debt leverage; |
• | we may have difficulty retaining an acquired company’s key employees or clients; |
• | we may have difficulty integrating acquired businesses, resulting in unforeseen difficulties, such as incompatible accounting, information management, or other control systems, and greater expenses than expected; |
• | acquisitions may disrupt our business or distract our management from other responsibilities; |
• | as a result of an acquisition, we may incur additional debt and we may need to record write-downs from future impairments of intangible assets, each of which could reduce our future reported earnings; and |
• | we may have difficulty integrating personnel from the acquired company with our people and our core values. |
In connection with any acquisition that we make, there may be liabilities that we fail to discover or that we inadequately assess, and we may fail to discover any failure of a target company to have fulfilled its contractual obligations to the U.S. government or other clients. Acquired entities may not operate profitably or result in improved operating performance. Additionally, we may not realize anticipated synergies, business growth opportunities, cost savings, and other benefits we anticipate, which could have a material adverse effect on our business and results of operations.
29
Risks Related to Our Industry
Our U.S. government contracts may be terminated by the government at any time and may contain other provisions permitting the government to discontinue contract performance, and if lost contracts are not replaced, our operating results may differ materially and adversely from those anticipated.
U.S. government contracts contain provisions and are subject to laws and regulations that provide government clients with rights and remedies not typically found in commercial contracts. These rights and remedies allow government clients, among other things, to:
• | terminate existing contracts, with short notice, for convenience as well as for default; |
• | reduce orders under or otherwise modify contracts; |
• | for contracts subject to the Truth in Negotiations Act, reduce the contract price or cost where it was increased because a contractor or subcontractor furnished cost or pricing data during negotiations that was not complete, accurate, and current; |
• | for some contracts, (i) demand a refund, make a forward price adjustment, or terminate a contract for default if a contractor provided inaccurate or incomplete data during the contract negotiation process and (ii) reduce the contract price under certain triggering circumstances, including the revision of price lists or other documents upon which the contract award was predicated; |
• | terminate our facility security clearances and thereby prevent us from receiving classified contracts; |
• | cancel multi-year contracts and related orders if funds for contract performance for any subsequent year become unavailable; |
• | decline to exercise an option to renew a multi-year contract or issue task orders in connection with ID/IQ contracts; |
• | claim rights in solutions, systems, and technology produced by us, appropriate such work-product for their continued use without continuing to contract for our services and disclose such work-product to third parties, including other U.S. government agencies and our competitors, which could harm our competitive position; |
• | prohibit future procurement awards with a particular agency due to a finding of organizational conflicts of interest based upon prior related work performed for the agency that would give a contractor an unfair advantage over competing contractors, or the existence of conflicting roles that might bias a contractor’s judgment; |
• | subject the award of contracts to protest by competitors, which may require the contracting federal agency or department to suspend our performance pending the outcome of the protest and may also result in a requirement to resubmit offers for the contract or in the termination, reduction, or modification of the awarded contract; |
• | suspend or debar us from doing business with the U.S. government; and |
• | control or prohibit the export of our services. |
Recent and potential future budget cuts, the impact of sequestration and recent efforts by the Office of Management and Budget to decrease federal awards for management support services, may cause agencies with which we currently have contracts to terminate, reduce the number of task orders under or fail to renew such contracts. If a U.S. government client were to unexpectedly terminate, cancel, or decline to exercise an option to renew with respect to one or more of our significant contracts, or suspend or debar us from doing business with the U.S. government, our revenue and operating results would be materially harmed.
The U.S. government may revise its procurement, contract or other practices in a manner adverse to us.
The U.S. government may:
• | revise its procurement practices or adopt new contract laws, rules, and regulations, such as cost accounting standards, organizational conflicts of interest, and other rules governing inherently governmental functions at any time; |
• | reduce, delay, or cancel procurement programs resulting from U.S. government efforts to improve procurement practices and efficiency; |
• | limit the creation of new government-wide or agency-specific multiple award contracts; |
• | face restrictions or pressure from government employees and their unions regarding the amount of services the U.S. government may obtain from private contractors; |
• | award contracts on a technically acceptable/lowest cost basis in order to reduce expenditures, and we may not be the lowest cost provider of services; |
30
• | adopt new socio-economic requirements, including setting aside procurement opportunities to small, disadvantaged businesses; |
• | change the basis upon which it reimburses our compensation and other expenses or otherwise limit such reimbursements; and |
• | at its option, terminate or decline to renew our contracts. |
In addition, any new contracting methods could be costly or administratively difficult for us to implement and could adversely affect our future revenue and profit margin. In addition, changes to the procurement system could cause delays in the procurement decision-making process. Any such changes to the U.S. government’s procurement practices or the adoption of new contracting rules or practices could impair our ability to obtain new or re-compete contracts and any such changes or increased associated costs could materially and adversely affect our results of operations.
As part of its cost-cutting initiative, the Department of Defense has issued guidance regarding changes to the procurement process that is intended to control cost growth throughout the acquisition cycle by developing a competitive strategy for each program. Because this initiative may significantly change the way the U.S. government solicits, negotiates, and manages its contracts, it could result in an increase in competitive pressure and decreased profitability on contracts and have a material adverse effect on our results of operations.
The U.S. government may prefer minority-owned, small and small disadvantaged businesses; therefore, we may have fewer opportunities to bid for.
As a result of the Small Business Administration set-aside program, the U.S. government may decide to restrict certain procurements only to bidders that qualify as minority-owned, small, or small disadvantaged businesses. As a result, we would not be eligible to perform as a prime contractor on those programs and would be restricted to a maximum of 49% of the work as a subcontractor on those programs. An increase in the amount of procurements under the Small Business Administration set-aside program may impact our ability to bid on new procurements as a prime contractor or restrict our ability to recompete on incumbent work that is placed in the set-aside program.
Our contracts, performance, and administrative processes and systems are subject to audits, reviews, investigations, and cost adjustments by the U.S. government, which could reduce our revenue, disrupt our business, or otherwise materially adversely affect our results of operation.
U.S. government agencies routinely audit, review, and investigate government contracts and government contractors’ administrative processes and systems. These agencies review our performance on contracts, pricing practices, cost structure, and compliance with applicable laws, regulations and standards, including applicable government cost accounting standards. These agencies also review our compliance with government regulations and policies, and the DCAA audits, among other areas, the adequacy of our internal control systems and policies, including our purchasing, property, estimating, earned value and accounting systems. These internal control systems could focus on significant elements of costs, such as executive compensation. Determination of a significant internal control deficiency by a government agency could result in increased payment withholding that might materially increase our accounts receivable days sales outstanding and adversely affect our cash flow. In particular, over time the DCMA has increased and may continue to increase the proportion of executive compensation that it deems unallowable and the size of the executive population whose compensation is disallowed, which will continue to materially and adversely affect our results of operations or financial condition including the requirement to carry an increased level of reserves. Recent legislation and regulations implementing new limitations on the amount of allowable executive compensation costs contribute to increased regulatory scrutiny of the allowability of employee compensation costs, which can lead to greater amounts of employee compensation cost being disallowed. We recognize as revenue, net of reserves, executive compensation that we determine, based on management's estimates, to be allowable; management's estimates in this regard are based on a number of factors that may change over time, including executive compensation survey data, our and other government contractors' experiences with the DCAA audit practices in our industry and relevant decisions of courts and boards of contract appeals. Any costs found to be unallowable under a contract will not be reimbursed, and any such costs already reimbursed must be refunded. Further, the amount of any such refund may exceed reserves established by management based on estimates and assumptions that are inherently uncertain. Moreover, if any of the administrative processes and systems are found not to comply with government imposed requirements, we may be subjected to increased government scrutiny and approval that could delay or otherwise adversely affect our ability to compete for or perform contracts. Unfavorable U.S. government audit, review, or investigation results could subject us to civil or criminal penalties or administrative sanctions, and could harm our reputation and relationships with our clients and impair our ability to be awarded new contracts. For example, if our invoicing system were found to be inadequate following an audit by the DCAA, our ability to directly invoice U.S. government payment offices could be eliminated. As a result, we would be required to submit each invoice to the DCAA for approval prior to payment, which could materially increase our accounts receivable days sales outstanding and adversely affect our cash flow. In addition, proposed regulatory changes, if adopted, would require the Department of Defense’s contracting officers to impose contractual withholdings at no less than certain minimum levels based on assessments of a
31
contractor’s business systems. An unfavorable outcome to an audit, review, or investigation by any U.S. government agency could materially and adversely affect our relationship with the U.S. government. If a government investigation uncovers improper or illegal activities, we may be subject to civil and criminal penalties and administrative sanctions, including termination of contracts, forfeitures of profits, withholding of payments, suspension of payments, fines, and suspension or debarment from doing business with the U.S. government. In addition, we could suffer serious reputational harm if allegations of impropriety were made against us. Provisions that we have recorded in our financial statements as a compliance reserve may not cover actual losses. Furthermore, the disallowance of any costs previously charged could directly and negatively affect our current results of operations for the relevant prior fiscal periods, and we could be required to repay any such disallowed amounts. Each of these results could materially and adversely affect our results of operations or financial condition.
A delay in the completion of the U.S. government’s budget process could result in a reduction in our backlog and have a material adverse effect on our revenue and operating results.
On an annual basis, the U.S. Congress must approve budgets that govern spending by each of the federal agencies we support. When the U.S. Congress is unable to agree on budget priorities, and thus is unable to pass the annual budget on a timely basis, the U.S. Congress typically enacts a continuing resolution. A continuing resolution allows government agencies to operate at spending levels approved in the previous budget cycle. This was recently case for the Department of Homeland Security, which was funded through a series of short-term continuing resolutions into March 2015, at which point Congress and the Obama administration reached an agreement on funding for the remainder of the fiscal year. Under a continuing resolution, funding may not be available for new projects. In addition, when government agencies operate on the basis of a continuing resolution, they may delay funding we expect to receive on contracts we are already performing. Any such delays would likely result in new business initiatives being delayed or canceled and a reduction in our backlog, and could have a material adverse effect on our revenue and operating results. In addition, a failure to complete the budget process and fund government operations pursuant to a continuing resolution may result in a federal government shutdown (such as that which occurred during government fiscal year 2014). A shutdown may result in us incurring substantial costs without reimbursement under our contracts and the delay or cancellation of key programs, which could have a material adverse effect on our revenue and operating results.
Risks Related to Our Common Stock
Booz Allen Holding is a holding company with no operations of its own, and it depends on its subsidiaries for cash to fund all of its operations and expenses, including to make future dividend payments, if any.
The operations of Booz Allen Holding are conducted almost entirely through its subsidiaries and its ability to generate cash to meet its debt service obligations or to pay dividends is highly dependent on the earnings and the receipt of funds from its subsidiaries via dividends or intercompany loans. Further, our senior secured credit agreement significantly restricts the ability of our subsidiaries to pay dividends or otherwise transfer assets to us. In addition, Delaware law may impose requirements that may restrict our ability to pay dividends to holders of our common stock.
Our principal stockholder could exert significant influence over our company.
As of March 31, 2015, Carlyle, through Coinvest, owned shares of our Class A Common Stock representing approximately 29% of our outstanding voting power.
Coinvest is a party to the amended and restated stockholders agreement pursuant to which Carlyle has the right to nominate three members of our board of directors. The number of directors that Carlyle is entitled to nominate will be
reduced to (i) two directors at such time as Carlyle holds less than 25%, but at least 15%, of our outstanding Class A Common Stock and (ii) one director at such time as Carlyle holds less than 15%, but at least 5%, of our outstanding Class A Common Stock. Carlyle is in the business of making investments in companies, and may from time to time in the future acquire controlling interests in businesses engaged in management and technology consulting that complement or directly or indirectly compete with certain portions of our business. If Carlyle pursues such acquisitions in our industry, those acquisition opportunities may not be available to us. In addition, to the extent that Carlyle acquires a controlling interest in one or more companies that provide services or products to the U.S. government, our affiliation with any such company through Carlyle could create organizational conflicts of interest and similar issues for us under federal procurement laws and regulations. See “— Risks Related to Our Business — Recent efforts by the U.S. government to revise its organizational conflicts of interest rules could limit our ability to successfully compete for new contracts or task orders, which would adversely affect our results of operations.”
32
Our financial results may vary significantly from period to period as a result of a number of factors many of which are outside our control, which could cause the market price of our Class A Common Stock to fluctuate.
Our financial results may vary significantly from period to period in the future as a result of many external factors that are outside of our control. Factors that may affect our financial results and that could cause the market price of our outstanding securities, including our Class A Common Stock, to fluctuate include those listed in this “Risk Factors” section and others such as:
• | any cause of reduction or delay in U.S. government funding; |
• | fluctuations in revenue earned on existing contracts; |
• | commencement, completion, or termination of contracts during a particular period; |
• | a potential decline in our overall profit margins if our other direct costs and subcontract revenue grow at a faster rate than labor-related revenue; |
• | strategic decisions by us or our competitors, such as changes to business strategy, strategic investments, acquisitions, divestitures, spin offs, and joint ventures; |
• | a change in our contract mix to less profitable contracts; |
• | changes in policy or budgetary measures that adversely affect U.S. government contracts in general; |
• | variable purchasing patterns under U.S. government GSA schedules, blanket purchase agreements, which are agreements that fulfill repetitive needs under GSA schedules, and ID/IQ contracts; |
• | changes in demand for our services and solutions; |
• | fluctuations in the degree to which we are able to utilize our professionals; |
• | seasonality associated with the U.S. government’s fiscal year; |
• | an inability to utilize existing or future tax benefits for any reason, including a change in law; |
• | alterations to contract requirements; and |
• | adverse judgments or settlements in legal disputes. |
We cannot assure you that we will pay special or regular dividends on our stock in the future.
The board of directors has authorized and declared a regular quarterly for each quarter in the last several years. The board of directors also authorized and declared a special cash dividend on May 29, 2012, July 30, 2012, October 29, 2013, January 30, 2014, and July 30, 2014. The declaration of any future dividends and the establishment of the per share amount, record dates and payment dates for any such future dividends are subject to the discretion of the board of directors taking into account future earnings, cash flows, financial requirements and other factors. There can be no assurance that the board of directors will declare any dividends in the future. To the extent that expectations by market participants regarding the potential payment, or amount, of any special or regular dividend prove to be incorrect, the price of our common stock may be materially and negatively affected and investors that bought shares of our common stock based on those expectations may suffer a loss on their investment. Further, to the extent that we declare a regular or special dividend at a time when market participants hold no such expectations or the amount of any such dividend exceeds current expectations, the price of our common stock may increase and investors that sold shares of our common stock prior to the record date for any such dividend may forego potential gains on their investment.
A majority of our outstanding indebtedness is secured by substantially all of our consolidated assets. As a result of these security interests, such assets would only be available to satisfy claims of our general creditors or to holders of our equity securities if we were to become insolvent to the extent the value of such assets exceeded the amount of our indebtedness and other obligations. In addition, the existence of these security interests may adversely affect our financial flexibility.
Indebtedness under our senior secured credit agreement is secured by a lien on substantially all of our assets. Accordingly, if an event of default were to occur under our senior secured credit agreement, the senior secured lenders under such facilities would have a prior right to our assets, to the exclusion of our general creditors in the event of our bankruptcy, insolvency, liquidation, or reorganization. In that event, our assets would first be used to repay in full all indebtedness and other obligations secured by them (including all amounts outstanding under our senior secured credit agreement), resulting in all or a portion of our assets being unavailable to satisfy the claims of our unsecured indebtedness. Only after satisfying the claims of our unsecured creditors and our subsidiaries’ unsecured creditors would any amount be available for our equity holders. The pledge of these assets and other restrictions may limit our flexibility in raising capital for other purposes. Because substantially
33
all of our assets are pledged under these financing arrangements, our ability to incur additional secured indebtedness or to sell or dispose of assets to raise capital may be impaired, which could have an adverse effect on our financial flexibility. As of March 31, 2015, we had $1.6 billion of indebtedness outstanding under our senior secured credit agreement and had $494.8 million of capacity available for additional borrowings under the revolving portion of our senior secured credit agreement. In addition, we may, increase the borrowing capacity under our senior secured credit agreement without the consent of any person other than the institutions agreeing to provide all or any portion of such increase, to an amount not to exceed $300 million, subject to certain closing conditions including pro forma compliance with financial covenants.
Fulfilling our obligations incident to being a public company, including with respect to the requirements of and related rules under the Sarbanes Oxley Act of 2002, is expensive and time consuming and any delays or difficulty in satisfying these obligations could have a material adverse effect on our future results of operations and our stock price.
As a public company, the Sarbanes-Oxley Act of 2002 and the Dodd-Frank Wall Street Reform and Consumer Protection Act, the related rules and regulations of the SEC, as well as the New York Stock Exchange rules, require us to implement various corporate governance practices and adhere to a variety of reporting requirements and complex accounting rules. Compliance with these public company obligations requires us to devote significant management time and place significant additional demands on our finance and accounting staff and on our financial, accounting, and information systems. We have hired additional accounting and financial staff with appropriate public company reporting experience and technical accounting knowledge. Other expenses associated with being a public company include increased auditing, accounting, and legal fees and expenses, investor relations expenses, increased directors’ fees and director and officer liability insurance costs, registrar and transfer agent fees, listing fees, as well as other expenses.
In particular, the Sarbanes-Oxley Act of 2002 requires us to document and test the effectiveness of our internal control over financial reporting in accordance with an established internal control framework, and to report on our conclusions as to the effectiveness of our internal controls. It also requires an independent registered public accounting firm to test our internal control over financial reporting and report on the effectiveness of such controls. In addition, we are required under the Securities Exchange Act of 1934, as amended, or the Exchange Act, to maintain disclosure controls and procedures and internal control over financial reporting. Any failure to maintain effective controls or implement new or improved controls, or difficulties encountered in their implementation, could harm our operating results or cause us to fail to meet our reporting obligations. If we are unable to conclude that we have effective internal control over financial reporting, or if our independent registered public accounting firm is unable to provide us with an unqualified report regarding the effectiveness of our internal control over financial reporting, investors could lose confidence in the reliability of our financial statements. This could result in a decrease in the value of our common stock. Failure to comply with the Sarbanes-Oxley Act of 2002 could potentially subject us to sanctions or investigations by the SEC, the New York Stock Exchange, or other regulatory authorities.
Provisions in our organizational documents and in the Delaware General Corporation Law may prevent takeover attempts that could be beneficial to our stockholders.
Our amended and restated certificate of incorporation and amended and restated bylaws include a number of provisions that may have the effect of delaying, deterring, preventing, or rendering more difficult a change in control of Booz Allen Holding that our stockholders might consider in their best interests. These provisions include:
• | establishment of a classified Board, with staggered terms; |
• | granting to the Board the sole power to set the number of directors and to fill any vacancy on the Board; |
• | limitations on the ability of stockholders to remove directors; |
• | granting to the Board the ability to designate and issue one or more series of preferred stock without stockholder approval, the terms of which may be determined at the sole discretion of the Board; |
• | a prohibition on stockholders from calling special meetings of stockholders; |
• | the establishment of advance notice requirements for stockholder proposals and nominations for election to the Board at stockholder meetings; |
• | requiring approval of two-thirds of stockholders to amend the bylaws; and |
• | prohibiting our stockholders from acting by written consent. |
These provisions may prevent our stockholders from receiving the benefit from any premium to the market price of our common stock offered by a bidder in a takeover context. Even in the absence of a takeover attempt, the existence of these provisions may adversely affect the prevailing market price of our common stock if the provisions are viewed as discouraging takeover attempts in the future. In addition, we have opted out of Section 203 of the Delaware General Corporation Law, which would have otherwise imposed additional requirements regarding mergers and other business combinations, until Carlyle and
34
its affiliates no longer own more than 20% of our Class A Common Stock. After such time, we will be governed by Section 203.
Our amended and restated certificate of incorporation and amended and restated by-laws may also make it difficult for stockholders to replace or remove our management. These provisions may facilitate management entrenchment that may delay, deter, render more difficult, or prevent a change in our control, which may not be in the best interests of our stockholders.
Sales of outstanding shares of our common stock into the market in the future could cause the market price of our common stock to drop significantly.
As of March 31, 2015, Carlyle owned 42,660,000 shares of our Class A Common Stock, or approximately 29% of our outstanding Class A Common Stock. If Carlyle sells, or the market perceives that Carlyle intends to sell, a substantial portion of its beneficial ownership interest in us in the public market, the market price of our Class A Common Stock could decline significantly. The sales also could make it more difficult for us to sell equity or equity-related securities at a time and price that we deem appropriate.
As of March 31, 2015, 147,238,282 shares of our Class A Common Stock were outstanding. In addition to the shares owned by Carlyle, 4,000,243 shares of our Class A Common Stock which are held by directors, executive officers and other affiliates, are restricted securities within the meaning of Rule 144 under the Securities Act eligible for resale in the public market subject to volume, manner of sale and holding period limitations under Rule 144 under the Securities Act. In addition, (1) 1,857,126 shares of our Class A Common Stock are issuable upon the exercise of outstanding stock options granted under our Officers’ Rollover Stock Plan relating to our outstanding Class E Special Voting Common Stock and (2) 19,030,241 shares of our Class A Common Stock underlying equity awards that are either subject to the terms of our Equity Incentive Plan or reserved for future issuance under our Equity Incentive Plan, including 6,276,805 shares issuable upon the exercise of outstanding stock options at an average price of $10.19 and 464,047 shares issuable upon settlement of restricted stock units granted under our Equity Incentive Plan, are eligible for sale in the public market to the extent permitted by the provisions of various option agreements and, to the extent held by affiliates, the volume and manner of sale restrictions of Rule 144. If these additional shares are sold, or if it is perceived that they will be sold, in the public market, the price of our Class A Common Stock could decline substantially.
The market for our Class A common stock may be adversely affected by the performance of other companies in the government services market.
In addition to factors that may affect our financial results and operations, the price of our Class A common stock may be impacted by the financial performance and outlook of other companies in the government services market. While certain factors may affect all participants in the markets in which we operate, such as U.S. government spending conditions and changes in rules and regulations applicable to government contractors, the market for our Class A common stock may be adversely affected by financial results or negative events only affecting other market participants or financial results of such participants. While such events or results may not impact or be indicative of our current or future performance, the price of our securities may nonetheless may be adversely affected as a result thereof.
Item 1B. | Unresolved Staff Comments |
None.
Item 2. | Properties |
We do not own any facilities or real estate. Our corporate headquarters are located at 8283 Greensboro Drive, McLean, Virginia 22102. We lease other operating offices and facilities throughout North America, and a limited number of overseas locations. Our principal offices outside of McLean, Virginia include: Annapolis Junction, Maryland; Rockville, Maryland; San Diego, California; Herndon, Virginia and Washington, D.C. We have a number of Sensitive Compartmented Information Facilities, which are enclosed areas within buildings that are used to perform classified work for the U.S. Intelligence Community. Many of our employees are located in facilities provided by the U.S. government. The total square footage of our leased offices and facilities is approximately 2.8 million square feet. We believe our facilities meet our current needs.
Item 3. | Legal Proceedings |
Our performance under U.S. government contracts and compliance with the terms of those contracts and applicable laws and regulations are subject to continuous audit, review, and investigation by the U.S. government which may include such investigative techniques as subpoenas or civil investigative demands. Given the nature of our business, these audits, reviews, and investigations may focus, among other areas, on various aspects of procurement integrity, labor time reporting, sensitive and/or classified information access and control, executive compensation, and post government employment restrictions. We
35
are not always aware of our status in such matters, but we are currently aware of certain pending audits and investigations involving labor time reporting, procurement integrity, and classified information access. In addition, from time to time, we are also involved in legal proceedings and investigations arising in the ordinary course of business, including those relating to employment matters, relationships with clients and contractors, intellectual property disputes, and other business matters. These legal proceedings seek various remedies, including claims for monetary damages in varying amounts that currently range up to $40 million or are unspecified as to amount. Although the outcome of any such matter is inherently uncertain and may be materially adverse, based on current information, we do not expect any of the currently ongoing audits, reviews, investigations, or litigation to have a material adverse effect on our financial condition and results of operations. As of March 31, 2015 and 2014, there are no material amounts accrued in the consolidated financial statements related to these proceedings.
Six former officers and stockholders who had departed the company prior to the acquisition have filed a total of nine suits in various jurisdictions, with original filing dates ranging from July 3, 2008 through December 15, 2009, against us and certain of our current and former directors and officers. Three of these suits were amended on July 2, 2010 and then further amended into one consolidated complaint on September 7, 2010. Another two of the original nine suits were consolidated into one complaint on September 24, 2014. Each of the suits arises out of the acquisition and alleges that the former stockholders are entitled to certain payments that they would have received if they had held their stock at the time of the acquisition. Some of the suits also allege that the acquisition price paid to stockholders was insufficient. The various suits assert claims for breach of contract, tortious interference with contract, breach of fiduciary duty, civil Racketeer Influenced and Corrupt Organizations Act, or RICO, violations, violations of the Employee Retirement Income Security Act, or ERISA, and/or securities and common law fraud. Three of these suits have been dismissed with all appeals exhausted. The two suits that were consolidated into one action on September 24, 2014 were settled on April 16, 2015. One of the remaining suits has been dismissed by the United States District Court for the Southern District of California and is on appeal before the United States Court of Appeals for the Ninth Circuit. The other three remaining suits that were previously consolidated on September 7, 2010 have been dismissed by the United States District Court for the Southern District of New York, but are still subject to appeal by the plaintiffs. The aggregate alleged damages sought in these four remaining suits is approximately $291.7 million (which is sought to be trebled pursuant to RICO), plus punitive damages, costs, and fees. Although the outcome of any of these cases is inherently uncertain and may be materially adverse, based on current information, we do not expect them to have a material adverse effect on our financial condition and results of operations.
Item 4. | Mine Safety Disclosures |
None.
Executive Officers of the Registrant
The following table sets forth information about our executive officers as of May 18, 2015:
Name | Age | Position | ||
Horacio D. Rozanski | 47 | President and Chief Executive Officer | ||
Kevin L. Cook | 60 | Executive Vice President, Chief Financial Officer and Treasurer | ||
Karen M. Dahut | 51 | Executive Vice President | ||
Lloyd Howell, Jr. | 48 | Executive Vice President | ||
Nancy J. Laben | 53 | Executive Vice President and General Counsel | ||
Joseph Logue | 50 | Executive Vice President | ||
Joseph W. Mahafee | 57 | Executive Vice President, Chief Administrative Officer and Chief Information Security Officer | ||
John D. Mayer | 69 | Executive Vice President | ||
Elizabeth M. Thompson | 60 | Executive Vice President and Chief Personnel Officer | ||
Horacio D. Rozanski is our President and Chief Executive Officer and served as our Chief Operating Officer until January 1, 2015. Mr. Rozanski served as the Chief Strategy and Talent Officer in 2010 and, prior to that, Chief Personnel Officer of our company from 2002 through 2010. Mr. Rozanski joined our company in 1992. He serves on the boards of advisors for the Wolf Trap Foundation for the Performing Arts, the Jewish Primary Day School of the Nation’s Capital and The Center for Talent Innovation.
Kevin L. Cook is an Executive Vice President and our Chief Financial Officer and Treasurer. He previously served as the company's Corporate Controller. Mr. Cook joined the company in 1986 as Manager, Project Cost Accounting. He left the company in 1996 to take on the role of Senior Vice President, Client Development for what is now JAMIS Software. Mr. Cook returned to Booz Allen in the spring of 2003 as Director, Financial Reporting Systems. In April of 2008, Mr. Cook was selected
36
as the Corporate Controller for the company. Mr. Cook received his B.S. degree with a concentration in Accounting from Towson University in 1977, and an MBA with a concentration in Management in 1981 from the University of Baltimore. In 1982, he became a Certified Public Accountant (CPA) in the State of Maryland. He is also a member of the George Mason University Board of Trustees.
Karen M. Dahut is an Executive Vice President and formerly the lead for the company's Analytics capability. Currently, Ms. Dahut is the group leader for the company's Strategic Innovation Group. Ms. Dahut joined our company in 2002 and became a Senior Vice President in 2004. Previously, Ms. Dahut led the company's US Navy and Marine Corps business and its Economic and Business Analytics (EBA) capability. She is also a trustee of the Employee Capital Accumulation Plan (ECAP) Board of Trustees. Ms. Dahut is a Board Member of the Northern Virginia Technology Council and serves on the Board of Trustees for Stone Ridge School of the Sacred Heart in Bethesda, Maryland.
Lloyd Howell, Jr. is an Executive Vice President of our company and is the group leader for our Civil Group. Mr. Howell joined our company in 1988, left in 1991, rejoined in 1995 and became an Executive Vice President in 2005. He served as chairman of our Ethics & Compliance Committee for over seven years, until April 2014. Mr. Howell serves on the boards of directors of Integra Life Sciences (IART), Partnership for Public Service, Capital Partners for Education, Committee for Economic Development, and Management Leadership for Tomorrow.
Nancy J. Laben is an Executive Vice President of our company and our General Counsel. Ms. Laben joined our company in September 2013. Before joining our company, Ms. Laben served as General Counsel of AECOM Technology Corporation from June 2010 to August 2013, where she was responsible for all legal support. Prior to June 2010, Ms. Laben served as Deputy General Counsel at Accenture plc beginning in 1989. Prior to Accenture, Ms. Laben served in the law department at IBM Corporation.
Joseph Logue is an Executive Vice President of our company and is the group leader for our Defense Intelligence Group. Mr. Logue joined our company in 1997 and became an Executive Vice President in 2009. Previously, he led our former commercial Information Technology practice.
Joseph W. Mahafee is an Executive Vice President and our Chief Administrative Officer (CAO) and Chief Information Security Officer (CISO). Prior to assuming his CAO and CISO roles, Mr. Mahaffee served in a variety of client/market-facing leadership roles to include Client Service Officer for our NSA account; Assurance and Resilience Capability Leader; and the Northeast Region Leader. Mr. Mahaffee has primarily focused his career serving clients in the Defense and Intelligence Community markets. Altogether, he has more than 36 years of professional experience in Cybersecurity, systems engineering, communications, information assurance, and signals intelligence. Prior to joining Booz Allen, Mr. Mahaffee was an information security engineer with the National Security Agency. He is presently serving as the Booz Allen representative to the Defense Industrial Base. Previously, he served on the Board of Directors for the AFCEA Central Maryland Chapter and the Board of the Independent College Fund of Maryland. Mr. Mahaffee holds a B.S. degree in electrical engineering from Clemson University and an M.S. degree in electrical engineering from Johns Hopkins University.
John D. Mayer is an Executive Vice President of our company and is the lead for the company's International business. Mr. Mayer joined our company in 1997 and became an Executive Vice President in 2009. He is the former chairman of the board of directors of the Homeland Security and Defense Business Council, a member of the board of the Washington Education and Tennis Foundation, and was a former member of the Corporate Advisory Board for the Darden School of Business at the University of Virginia.
Elizabeth M. Thompson is an Executive Vice President of our company and serves as our Chief Personnel Officer. Ms. Thompson joined our company in 2008. Ms. Thompson served as Vice President of Human Resources for Fannie Mae from 2000 to 2008. Prior to Fannie Mae, Ms. Thompson served in IBM's Human Resources department and business leadership roles. Ms. Thompson holds an M.S. in Human Resources and Personnel Management from American University. Ms. Thompson is also a member of the Thurgood Marshall College Fund. Previously, she served on the Board of Trustees for Gallaudet University.
37
PART II
Item 5. Market for Registrant's Common Equity, Related Stockholder Matters and Issuer Purchases of Equity Securities.
Market Information
Our Class A Common Stock began trading on the New York Stock Exchange on November 17, 2010. At the annual meeting of stockholders held on July 31, 2014, the stockholders approved a proposal to amend and restate the certificate of incorporation, which had the effect of converting all issued and outstanding shares of Class B Non-Voting Common Stock and Class C Restricted Common Stock into shares of Class A Common Stock on a one-for-one basis. The conversion was effected on August 13, 2014 when the Company filed its third amended and restated certificate of incorporation with the Secretary of State of the State of Delaware. As a result of the conversion, there were no more shares of Class B Non-Voting Common Stock and Class C Restricted Common Stock outstanding at such time. There is no established trading market for each of our Class B Non-Voting Common Stock, Class C Restricted Common Stock, or Class E Special Voting Common Stock. On May 4, 2015, there were 46,131 and 83 beneficial holders of our Class A Common Stock and Class E Special Voting Common Stock, respectively. The following table sets forth, for the periods indicated, the high and low sales price per share of our Class A Common Stock as reported by the New York Stock Exchange:
High | Low | |||||||
Fiscal 2015 | ||||||||
1st Quarter | $ | 25.32 | $ | 20.84 | ||||
2nd Quarter | 24.51 | 20.65 | ||||||
3rd Quarter | 27.82 | 23.27 | ||||||
4th Quarter | 31.30 | 25.82 | ||||||
Fiscal 2014 | ||||||||
1st Quarter | $ | 18.74 | $ | 12.66 | ||||
2nd Quarter | 22.27 | 17.33 | ||||||
3rd Quarter | 20.55 | 16.61 | ||||||
4th Quarter | 22.34 | 17.20 | ||||||
Dividends
On May 21, 2014, we announced a regular quarterly cash dividend in the amount of $0.11 per share. The quarterly dividend was paid on June 30, 2014 to stockholders of record on June 10, 2014.
On July 30, 2014, we announced a regular quarterly cash dividend in the amount of $0.11 per share and a special cash dividend of $1.00 per share, each paid on August 29, 2014 to stockholders of record on August 11, 2014. The Board of Directors, acting as the Administrator of the Officers' Rollover Stock Plan and the EIP made a determination to adjust the outstanding Rollover and EIP options for the special dividend to prevent the dilution of the options. The adjustment was in the form of a $1.00 dividend equivalent. Holders of the Rollover Options will receive a cash payment equal to the amount of the special dividend on the exercise of the option during the options' mandatory exercise period. Holders of EIP options received or will receive a cash payment equal to the amount of the special dividend payable on August 29, 2014, or the vesting of the EIP option, whichever is later.
On October 29, 2014, we announced a regular quarterly cash dividend in the amount of $0.11 per share. The quarterly dividend was paid on November 28, 2014 to stockholders of record on November 10, 2014.
On February 28, 2015, we announced a regular quarterly cash dividend in the amount of $0.13 per share. The quarterly dividend was paid on February 27, 2015 to stockholders of record on February 10, 2015.
Recent Sales of Unregistered Securities
None.
38
Issuer Purchases of Equity Securities
The following table shows the share repurchase activity for each of the three months in the quarter ended March 31, 2015:
Period | Total Number of Shares Purchased (1) | Average Price Paid per Share | Total Number of Shares Purchased as Part of Publicly Announced Plans or Programs | Approximate Dollar Value of Shares that May Yet Be Purchased Under the Plans or Programs (2) | ||||
January 2015 | — | — | — | $ 154,900,000 | ||||
February 2015 | 1,000,000 | $ 28.36 | 1,000,000 | $ 126,540,000 | ||||
March 2015 | — | — | — | $ 126,540,000 | ||||
Total | 1,000,000 | 1,000,000 | ||||||
(1) | On February 2, 2015, the Company entered into an underwriting agreement with an affiliate of the Carlyle Group, or the selling stockholder, and Morgan Stanley & Co. LLC, or the underwriter, pursuant to which (i) the selling stockholder sold 12,000,000 shares of Class A Common Stock to the underwriter and (ii) the Company repurchased 1,000,000 shares of Class A Common Stock from the underwriter. The shares were repurchased at the price per share equal to the price per share paid by the underwriter in the offering. |
(2) | On December 12, 2011, the Board of Directors approved a $30.0 million share repurchase program. On January 27, 2015, the Board of Directors approved an increase to our share repurchase authorization from $30.0 million to up to $180.0 million. A special committee of the Board of Directors was appointed to evaluate market conditions and other relevant factors and initiate repurchases under the program from time to time. The share repurchase program may be suspended, modified or discontinued at any time at the Company’s discretion without prior notice. |
Use of Proceeds from Registered Securities
None.
39
Performance
The graph set forth below compares the cumulative shareholder return on our Common Stock between November 17, 2010 (the date our Class A common stock began trading on the New York Stock Exchange) and March 31, 2015, to the cumulative return of (i) the Russell 1000 Index and (ii) the Dow Jones US Computer Services Index over the same period. This graph assumes an initial investment of $100 on November 17, 2010 in our common stock, the Russell 1000 Index, and the Dow Jones US Computer Services Index and assumes the reinvestment of dividends, if any. The stock price performance included in this graph is not necessarily indicative of future stock price performance.
COMPARISON OF CUMULATIVE TOTAL RETURNS SINCE IPO
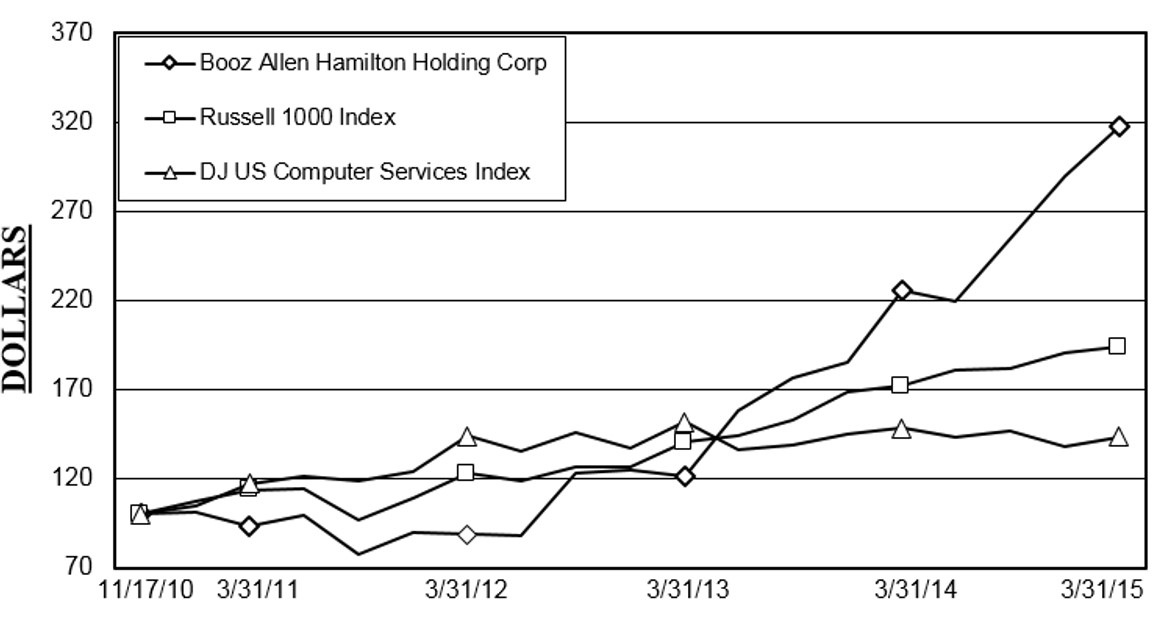
ASSUMES $100 INVESTED ON NOV. 17, 2010
ASSUMES DIVIDEND REINVESTED
Company/Market/Peer Group | 11/17/2010* | 3/31/2011 | 3/31/2012 | 3/31/2013 | 3/31/2014 | 3/31/2015 | ||||||||||||||||||
Booz Allen Hamilton Holding Corp | $ | 100.00 | $ | 93.56 | $ | 88.91 | $ | 121.27 | $ | 225.94 | $ | 317.26 | ||||||||||||
Russell 1000 Index | $ | 100.00 | $ | 113.85 | $ | 122.85 | $ | 140.60 | $ | 172.00 | $ | 193.87 | ||||||||||||
DJ US Computer Services Index | $ | 100.00 | $ | 117.02 | $ | 144.08 | $ | 151.73 | $ | 148.28 | $ | 143.43 | ||||||||||||
* | Note: BAH base values reflect the closing price of $19.25 on the first day of trading and index base values are as of 11/17/2010 end of day. | ||||
Item 6. | Selected Financial Data |
The selected consolidated statements of operations data for fiscal 2015, fiscal 2014, and fiscal 2013 and the selected consolidated balance sheet data as of March 31, 2015 and 2014 have been derived from our audited consolidated financial statements included elsewhere in this Annual Report. The selected consolidated statement of operations data for fiscal 2012 and fiscal 2011 and the selected consolidated balance sheet data as of March 31, 2013, 2012 and 2011 have been derived from audited consolidated financial statements which are not included in this Annual Report. Our historical results are not
40
necessarily indicative of the results that may be expected for any future period. The selected financial data should be read in conjunction with “Item 7. Management’s Discussion and Analysis of Financial Condition and Results of Operations” and our consolidated financial statements and related notes included elsewhere in this Annual Report.
Fiscal Year Ended March 31, | ||||||||||||||||||||
(In thousands, except share and per share data) | 2015 | 2014 | 2013 | 2012 | 2011 | |||||||||||||||
Consolidated Statements of Operations: | ||||||||||||||||||||
Revenue | $ | 5,274,770 | $ | 5,478,693 | $ | 5,758,059 | $ | 5,859,218 | $ | 5,591,296 | ||||||||||
Operating costs and expenses: | ||||||||||||||||||||
Cost of revenue | 2,593,849 | 2,716,113 | 2,871,240 | 2,934,378 | 2,836,955 | |||||||||||||||
Billable expenses | 1,406,527 | 1,487,115 | 1,532,590 | 1,542,822 | 1,473,266 | |||||||||||||||
General and administrative expenses | 752,912 | 742,527 | 833,986 | 903,721 | 881,028 | |||||||||||||||
Depreciation and amortization | 62,660 | 72,327 | 74,009 | 75,205 | 80,603 | |||||||||||||||
Restructuring charge | — | — | — | 15,660 | — | |||||||||||||||
Total operating costs and expenses | 4,815,948 | 5,018,082 | 5,311,825 | 5,471,786 | 5,271,852 | |||||||||||||||
Operating income | 458,822 | 460,611 | 446,234 | 387,432 | 319,444 | |||||||||||||||
Interest expense | (71,832 | ) | (78,030 | ) | (70,284 | ) | (48,078 | ) | (131,892 | ) | ||||||||||
Other, net | (1,072 | ) | (1,794 | ) | (7,639 | ) | 4,520 | (59,488 | ) | |||||||||||
Income before income taxes | 385,918 | 380,787 | 368,311 | 343,874 | 128,064 | |||||||||||||||
Income tax expense | 153,349 | 148,599 | 149,253 | 103,919 | 43,370 | |||||||||||||||
Net income | $ | 232,569 | $ | 232,188 | $ | 219,058 | $ | 239,955 | $ | 84,694 | ||||||||||
Earnings per common share (1): | ||||||||||||||||||||
Basic | $ | 1.58 | $ | 1.62 | $ | 1.56 | $ | 1.83 | $ | 0.74 | ||||||||||
Diluted | $ | 1.52 | $ | 1.54 | $ | 1.45 | $ | 1.70 | $ | 0.66 | ||||||||||
Weighted average common shares outstanding (1): | ||||||||||||||||||||
Basic | 145,414,120 | 141,314,544 | 134,402,729 | 130,145,689 | 114,478,947 | |||||||||||||||
Diluted | 150,375,531 | 148,681,074 | 144,854,724 | 140,812,012 | 127,448,700 | |||||||||||||||
Dividends declared per share | $ | 1.46 | $ | 2.40 | $ | 8.36 | $ | 0.09 | $ | — | ||||||||||
As of March 31, | ||||||||||||||||||||
(In thousands) | 2015 | 2014 | 2013 | 2012 | 2011 | |||||||||||||||
Consolidated Balance Sheets: | ||||||||||||||||||||
Cash and cash equivalents | $ | 207,217 | $ | 259,994 | $ | 350,384 | $ | 484,368 | $ | 192,631 | ||||||||||
Working capital | 314,214 | 338,873 | 459,706 | 739,211 | 494,308 | |||||||||||||||
Total assets | 2,877,493 | 2,940,818 | 3,177,528 | 3,314,791 | 3,024,023 | |||||||||||||||
Long-term debt, net of current portion | 1,569,272 | 1,585,231 | 1,659,611 | 922,925 | 964,328 | |||||||||||||||
Stockholders’ equity | 186,498 | 171,636 | 226,793 | 1,185,185 | 907,250 | |||||||||||||||
(1) | Basic earnings per share for the Company has been computed using the weighted average number of shares of Class A Common Stock, Class B Non- Voting Common Stock, and Class C Restricted Common Stock outstanding during the period. The Company’s diluted earnings per share has been computed using the weighted average number of shares of Class A Common Stock, Class B Non-Voting Common Stock, and Class C Restricted Common Stock including the dilutive effect of outstanding common stock options and other stock-based awards. For the purposes of calculating basic and diluted earnings per share, the Company has utilized the two class method, given non-forfeitable dividends declared on unvested Class A Restricted Common Stock. The weighted average number of Class E Special Voting Common Stock has not been included in the calculation of either basic earnings per share or diluted earnings per share due to the terms of such common stock. |
Item 7. | Management’s Discussion and Analysis of Financial Condition and Results of Operations |
The following discussion and analysis is intended to help the reader understand our business, financial condition, results of operations, and liquidity and capital resources. You should read this discussion in conjunction with “Item 6. Selected Financial Data,” and our consolidated financial statements and the related notes contained elsewhere in this Annual Report.
The statements in this discussion regarding industry outlook, our expectations regarding our future performance, liquidity and capital resources, and other non-historical statements in this discussion are forward-looking statements. These forward-looking statements are subject to numerous risks and uncertainties, including, but not limited to, the risks and uncertainties described in “Item 1A. Risk Factors” and “Introductory Note — Cautionary Note Regarding Forward-Looking Statements”. Our actual results may differ materially from those contained in or implied by any forward-looking statements.
41
Our fiscal year ends March 31 and, unless otherwise noted, references to years or fiscal are for fiscal years ended March 31. See “— Results of Operations.”
Overview
We are a leading provider of management consulting, technology, and engineering services to the U.S. government in the defense, intelligence, and civil markets. Additionally, we provide management and technology consulting services to major corporations, institutions, not-for-profit organizations, and international clients. We are a well-known, trusted and long-term partner to our clients, who seek our expertise and objective advice to address their most important and complex problems. Leveraging our 100-year consulting heritage and a talent base of approximately 22,500 people, we deploy our deep domain knowledge, functional and technical expertise, expanding set of capabilities, and experience of innovative client service to help our clients achieve their objectives. We have a collaborative culture, supported by our operating model, which helps our professionals identify and respond to emerging trends across the markets we serve and deliver enduring results for our clients. Today, we serve substantially all of the cabinet-level departments of the U.S. government, clients in selected commercial markets, and international clients. Major government clients include the Department of Defense, all branches of the U.S. military, the U.S. Intelligence Community, and civil agencies such as the Department of Homeland Security, the Department of Health and Human Services, and the Department of the Treasury. We support these clients in addressing complex and pressing challenges such as combating global terrorism, improving cyber capabilities, transforming the healthcare system, improving efficiency and managing change within the government. In the commercial sector, we serve U.S. clients primarily in the financial services, healthcare, energy, retail, and automotive markets. Our international clients are primarily in the Middle East, as well as in south-east Asia following the recent opening of our office in Singapore.
Financial and Other Highlights
During fiscal 2015, the Company saw revenue declines for the full year while continuing to effectively manage indirect costs. This includes managing our capacity to balance the supply of consulting staff with an increased market demand as evidenced in our increasing level of funded backlog. This effective management of indirect spending allowed the Company to invest in new capabilities and continued investment in growth areas including the expansion of our commercial and international markets.
Revenue decreased 3.7% from fiscal 2014 to fiscal 2015 as a result of lower demand, primarily driven by the continuing effect of macro challenges in the federal government spending environment. However, maintaining solid productivity and deployment of consulting staff on billable work mitigated the impact of these conditions on our revenue performance. In addition, the Company reported a second sequential quarter of headcount increases to deploy against existing and future funded work. Although headcount has increased in the most recent months, the average headcount over the last twelve months declined slightly which led to fewer billable hours in total and an overall decrease in revenue for fiscal 2015. The revenue decline year over year was also attributable to a reduction in billable expenses due to a decline in our use of subcontractors and other direct expenses incurred to perform on contracts.
Operating income decreased 0.4% to $458.8 million in fiscal 2015 from $460.6 million in fiscal 2014, which reflects a 30 basis point increase in operating margin to 8.7% from 8.4% in the comparable period. The decrease in operating income was attributable to revenue declines over the year to date period, mitigated by volume based reductions in compensation costs and related fringe benefits, and to a lesser extent a decrease in depreciation and amortization expense. While the Company continues to focus on disciplined cost management of indirect spending, there was an increase in the level of bid and proposal activity and continued investments in new capabilities, new markets, and growth platforms as compared to the prior year period.
Non-GAAP Measures
We publicly disclose certain non-GAAP financial measurements, including Adjusted Operating Income, Adjusted EBITDA, Adjusted Net Income, and Adjusted Diluted Earnings Per Share, or Adjusted Diluted EPS, because management uses these measures for business planning purposes, including to manage our business against internal projected results of operations and measure our performance. We view Adjusted Operating Income, Adjusted EBITDA, Adjusted Net Income, and Adjusted Diluted EPS as measures of our core operating business, which exclude the impact of the items detailed below, as these items are generally not operational in nature. These non-GAAP measures also provide another basis for comparing period to period results by excluding potential differences caused by non-operational and unusual or non-recurring items. We also utilize and discuss Free Cash Flow, because management uses this measure for business planning purposes, measuring the cash generating ability of the operating business, and measuring liquidity generally. We present these supplemental measures because we believe that these measures provide investors and securities analysts with important supplemental information with which to evaluate our performance, long term earnings potential, or liquidity, as applicable, and to enable them to assess our performance on the same basis as management. These supplemental performance measurements may vary from and may not be
42
comparable to similarly titled measures by other companies in our industry. Adjusted Operating Income, Adjusted EBITDA, Adjusted Net Income, Adjusted Diluted EPS, and Free Cash Flow are not recognized measurements under accounting principles generally accepted in the United States, or GAAP, and when analyzing our performance or liquidity, as applicable, investors should (i) evaluate each adjustment in our reconciliation of operating and net income to Adjusted Operating Income, Adjusted EBITDA and Adjusted Net Income, and net cash provided by operating activities to Free Cash Flows, and the explanatory footnotes regarding those adjustments, each as defined under GAAP, (ii) use Adjusted Operating Income, Adjusted EBITDA, Adjusted Net Income, and Adjusted Diluted EPS in addition to, and not as an alternative to, operating income, net income or diluted EPS, as measures of operating results, and (iii) use Free Cash Flows in addition to, and not as an alternative to, net cash provided by operating activities as a measure of liquidity, each as defined under GAAP. We have defined the aforementioned non-GAAP measures as follows:
• | "Adjusted Operating Income" represents operating income before (i) certain stock option-based and other equity-based compensation expenses, (ii) adjustments related to the amortization of intangible assets, and (iii) transaction costs, fees, losses, and expenses, including fees associated with debt prepayments. We prepare Adjusted Operating Income to eliminate the impact of items we do not consider indicative of ongoing operating performance due to their inherent unusual, extraordinary, or non-recurring nature or because they result from an event of a similar nature. |
• | "Adjusted EBITDA" represents net income before income taxes, net interest and other expense, and depreciation and amortization and before certain other items, including: (i) certain stock option-based and other equity-based compensation expenses, and (ii) transaction costs, fees, losses, and expenses, including fees associated with debt prepayments. We prepare Adjusted EBITDA to eliminate the impact of items we do not consider indicative of ongoing operating performance due to their inherent unusual, extraordinary, or non-recurring nature or because they result from an event of a similar nature. |
• | "Adjusted Net Income" represents net income before: (i) certain stock option-based and other equity-based compensation expenses, (ii) transaction costs, fees, losses, and expenses, including fees associated with debt prepayments, (iii) adjustments related to the amortization of intangible assets, (iv) amortization or write-off of debt issuance costs and write-off of original issue discount, and (v) any extraordinary, unusual, or non-recurring items, in each case net of the tax effect calculated using an assumed effective tax rate. We prepare Adjusted Net Income to eliminate the impact of items, net of tax, we do not consider indicative of ongoing operating performance due to their inherent unusual, extraordinary, or non-recurring nature or because they result from an event of a similar nature. |
• | "Adjusted Diluted EPS" represents diluted EPS calculated using Adjusted Net Income as opposed to net income. Additionally, Adjusted Diluted EPS does not contemplate any adjustments to net income as required under the two-class method as disclosed in the footnotes to the financial statements. |
• | "Free Cash Flow" represents the net cash generated from operating activities less the impact of purchases of property and equipment. |
43
Below is a reconciliation of Adjusted Operating Income, Adjusted EBITDA, Adjusted Net Income, Adjusted Diluted EPS, and Free Cash Flow to the most directly comparable financial measure calculated and presented in accordance with GAAP.
Fiscal Year Ended March 31, | |||||||||||
(Amounts in thousands, except share and per share data) | 2015 | 2014 | 2013 | ||||||||
(Unaudited) | |||||||||||
Adjusted Operating Income | |||||||||||
Operating Income | $ | 458,822 | $ | 460,611 | $ | 446,234 | |||||
Certain stock-based compensation expense (a) | — | 1,094 | 5,868 | ||||||||
Amortization of intangible assets (b) | 4,225 | 8,450 | 12,510 | ||||||||
Transaction expenses (c) | 2,039 | — | 2,725 | ||||||||
Adjusted Operating Income | $ | 465,086 | $ | 470,155 | $ | 467,337 | |||||
EBITDA & Adjusted EBITDA | |||||||||||
Net income | $ | 232,569 | $ | 232,188 | $ | 219,058 | |||||
Income tax expense | 153,349 | 148,599 | 149,253 | ||||||||
Interest and other, net | 72,904 | 79,824 | 77,923 | ||||||||
Depreciation and amortization | 62,660 | 72,327 | 74,009 | ||||||||
EBITDA | 521,482 | 532,938 | 520,243 | ||||||||
Certain stock-based compensation expense (a) | — | 1,094 | 5,868 | ||||||||
Transaction expenses (c) | 2,039 | — | 2,725 | ||||||||
Adjusted EBITDA | $ | 523,521 | $ | 534,032 | $ | 528,836 | |||||
Adjusted Net Income | |||||||||||
Net income | $ | 232,569 | $ | 232,188 | $ | 219,058 | |||||
Certain stock-based compensation expense (a) | — | 1,094 | 5,868 | ||||||||
Amortization of intangible assets (b) | 4,225 | 8,450 | 12,510 | ||||||||
Transaction expenses (c) | 2,039 | — | 2,725 | ||||||||
Amortization or write-off of debt issuance costs and write-off of original issue discount | 6,545 | 6,719 | 13,018 | ||||||||
Adjustments for tax effect (d) | (5,124 | ) | (6,505 | ) | (13,649 | ) | |||||
Adjusted Net Income | $ | 240,254 | $ | 241,946 | $ | 239,530 | |||||
Adjusted Diluted Earnings Per Share | |||||||||||
Weighted-average number of diluted shares outstanding | 150,375,531 | 148,681,074 | 144,854,724 | ||||||||
Adjusted Net Income Per Diluted Share (e) | $ | 1.60 | $ | 1.63 | $ | 1.65 | |||||
Free Cash Flow | |||||||||||
Net cash provided by operating activities | $ | 309,958 | $ | 332,718 | $ | 464,654 | |||||
Less: Purchases of property and equipment | (36,041 | ) | (20,905 | ) | (33,113 | ) | |||||
Free Cash Flow | $ | 273,917 | $ | 311,813 | $ | 431,541 | |||||
(a) | Reflects stock-based compensation expense for options for Class A Common Stock and restricted shares, in each case, issued in connection with the Acquisition of our Company by The Carlyle Group (the "Acquisition") under the Officers' Rollover Stock Plan. Also reflects stock-based compensation expense for Equity Incentive Plan Class A Common Stock options issued in connection with the Acquisition under the Equity Incentive Plan. |
(b) | Reflects amortization of intangible assets resulting from the Acquisition. |
(c) | Fiscal 2015 reflects debt refinancing costs incurred in connection with the refinancing transaction consummated on May 7, 2014. Fiscal 2013 reflects debt refinancing costs incurred in connection with the recapitalization transaction consummated on July 31, 2012. |
(d) | Reflects tax effect of adjustments at an assumed marginal tax rate of 40%. |
(e) | Excludes an adjustment of approximately $3.4 million, $3.1 million, and $9.1 million of net earnings for fiscal 2015, 2014, and 2013, respectively, associated with the application of the two-class method for computing diluted earnings per share. |
44
Factors and Trends Affecting Our Results of Operations
Our results of operations have been, and we expect them to continue to be, affected by the following factors, which may cause our future results of operations to differ from our historical results of operations discussed under “— Results of Operations.”
Business Environment and Key Trends in Our Markets
We believe that the following trends and developments in the U.S. government services industry and our markets may influence our future results of operations:
• | budget deficits and the growing U.S. national debt increasing pressure on the U.S. government to reduce federal spending across all federal agencies together with associated uncertainty about the size and timing of those reductions; |
• | changes in the relative mix of overall U.S. government spending and areas of spending growth, with lower spending on homeland security, intelligence and defense-related programs as overseas operations end, and continued increased spending on cyber-security, advanced analytics, technology integration and healthcare; |
• | cost cutting and efficiency initiatives, current and future budget reductions, continued implementation of Congressionally mandated automatic spending cuts, and other efforts to reduce U.S. government spending, which could cause clients to reduce or delay funding for orders for services or invest appropriated funds on a less consistent or rapid basis or not at all, particularly when considering long-term initiatives and in light of uncertainty around Congressional efforts to craft a long-term agreement on the U.S. government's ability to incur indebtedness in excess of its current limits and generally in the current political environment, not issue task orders in sufficient volume to reach current contract ceilings, alter historical patterns of contract awards, including the typical increase in the award of task orders or completion of other contract actions by the U.S. government in the period before the end of the U.S. government's fiscal year on September 30, delay requests for new proposals and contract awards, rely on short-term extensions and funding of current contracts, or reduce staffing levels and hours of operation; |
• | current and continued uncertainty around the timing, extent, nature and effect of Congressional and other U.S. government action to address budgetary constraints, the outcome of Congressional efforts to craft a long-term agreement on the U.S. government’s ability to incur indebtedness in excess of its current limits and the U.S. deficit, including, the required reductions under the Budget Control Act of 2011 (as amended by the American Taxpayer Relief Act of 2012 and the Consolidated Appropriations Act, 2014), which provides for automatic spending cuts totaling approximately $1.2 trillion between 2013 and 2021, and the impact of the expiration of the Temporary Debt Limit Extension Act on March 15, 2015, and the means by which the U.S. government addresses such expiration; |
• | delays in the completion of the U.S. government’s budget processes, which have in the past and could in the future delay procurement of the products, services, and solutions we provide; |
• | increased audit, review, investigation and general scrutiny by U.S. government agencies of government contractors' performance under U.S. government contracts and compliance with the terms of those contracts and applicable laws; |
• | the implementation by U.S. government agencies of approximately $90 billion in mandated 2015 sequestration spending cuts, including an estimated $45 billion in cuts to the Department of Defense, as well as further reductions in Overseas Contingency Operations ("OCO") funding, such as the future reductions from current levels of OCO funding in President Obama's proposed fiscal 2016 budget; |
• | the federal focus on refining the definition of “inherently governmental” work, including proposals to limit contractor access to sensitive or classified information and work assignments, which will continue to drive pockets of insourcing in various agencies, particularly in the intelligence market; |
• | negative publicity and increased scrutiny of government contractors in general, including us, relating to U.S. government expenditures for contractor services and incidents involving the mishandling of sensitive or classified information; |
• | cost cutting and efficiency and effectiveness efforts by U.S. civilian agencies with a focus on increased use of performance measurement, “program integrity” efforts to reduce waste, fraud and abuse in entitlement |
45
programs, and renewed focus on improving procurement practices for and interagency use of IT services, including through the use of cloud based options and data center consolidation;
• | U.S. government agencies awarding contracts on a technically acceptable/lowest cost basis, which could have a negative impact on our ability to win certain contracts; |
• | as a result of the U.S. government's efforts to reduce outlays for contractor costs, we may see a continuing shift toward placement of our consulting staff at client site locations instead of our facilities, which generally results in lower billing rates and could have a negative impact on our revenue; |
• | restrictions by the U.S. government on the ability of federal agencies to use lead system integrators, in response to cost, schedule and performance problems with large defense acquisition programs where contractors were performing the lead system integrator role; |
• | increasingly complex requirements of the Department of Defense and the U.S. Intelligence Community, including cyber-security, managing federal health care cost growth and focus on reforming existing government regulation of various sectors of the economy, such as financial regulation and healthcare; |
• | increased competition from other government contractors and market entrants seeking to take advantage of the trends identified above; |
• | legislative and regulatory changes to limitations on the amount of allowable executive compensation permitted under flexibly priced contracts following implementation of interim rules adopted by federal agencies pursuant to the Bipartisan Budget Act of 2013 published on June 24, 2014, which substantially further reduce the amount of allowable executive compensation under these contracts and extend these limitations to a larger segment of our executives and our entire contract base; and |
• | efforts by the U.S. government to address organizational conflicts of interest and related issues and the impact of those efforts on us and our competitors. |
Sources of Revenue
Substantially all of our revenue is derived from services provided under contracts and task orders with the U.S. government, primarily by our consulting staff and, to a lesser extent, our subcontractors. Funding for our contracts and task orders is generally linked to trends in budgets and spending across various U.S. government agencies and departments. We provide services under a large portfolio of contracts and contract vehicles to a broad client base, and we believe that our diversified contract and client base lessens potential volatility in our business; however, a reduction in the amount of services that we are contracted to provide to the U.S. government or any of our significant U.S. government clients could have a material adverse effect on our business and results of operations. In particular, the Department of Defense is one of our significant clients, and the Budget Control Act of 2011 (as amended by the American Taxpayer Relief Act of 2012 and the Consolidated Appropriations Act, 2014) provides for automatic spending cuts totaling approximately $1.2 trillion between 2013 and 2021, and requires an estimated $500 billion in federal defense spending cuts over this time period. Under the Budget Control Act, as amended, approximately $90 billion in spending cuts are mandated for government fiscal 2015, and the Department of Defense has estimated its share of these cuts at $45 billion. A reduction in the amount of services that we are contracted to provide to the Department of Defense could have a material adverse effect on our business and results of operations, and given the uncertainty of when and how these automatic reductions may be applied, we are unable to predict the nature or magnitude of the potential adverse effect.
Contract Types
We generate revenue under the following three basic types of contracts:
• | Cost-Reimbursable Contracts. Cost-reimbursable contracts provide for the payment of allowable costs incurred during performance of the contract, up to a ceiling based on the amount that has been funded, plus a fee. As we increase or decrease our spending on allowable costs, our revenue generated on cost-reimbursable contracts will increase, up to the ceiling and funded amounts, or decrease respectively. We generate revenue under two general types of cost-reimbursable contracts: cost-plus-fixed-fee and cost-plus-award-fee, both of which reimburse allowable costs and provide for a fee. The fee under each type of cost-reimbursable contract is generally payable upon completion of services in accordance with the terms of the contract. Cost-plus-fixed-fee contracts offer no opportunity for payment beyond the fixed fee. Cost-plus-award-fee contracts also provide for an award fee that varies within specified limits based upon the client’s assessment of our |
46
performance against a predetermined set of criteria, such as targets for factors like cost, quality, schedule, and performance.
• | Time-and-Materials Contracts. Under a time-and-materials contract, we are paid a fixed hourly rate for each direct labor hour expended, and we are reimbursed for billable material costs and billable out-of-pocket expenses inclusive of allocable indirect costs. To the extent our actual direct labor including allocated indirect costs, and associated billable expenses decrease or increase in relation to the fixed hourly billing rates provided in the contract, we will generate more or less profit, respectively, or could incur a loss. |
• | Fixed-Price Contracts. Under a fixed-price contract, we agree to perform the specified work for a pre-determined price. To the extent our actual direct and allocated indirect costs decrease or increase from the estimates upon which the price was negotiated, we will generate more or less profit, respectively, or could incur a loss. Some fixed-price contracts have a performance-based component, pursuant to which we can earn incentive payments or incur financial penalties based on our performance. Fixed-price level of effort contracts require us to provide a specified level of effort (i.e., labor hours), over a stated period of time, for a fixed price. |
The amount of risk and potential reward varies under each type of contract. Under cost-reimbursable contracts, there is limited financial risk, because we are reimbursed for all allowable costs up to a ceiling. However, profit margins on this type of contract tend to be lower than on time-and-materials and fixed-price contracts. Under time-and-materials contracts, we are reimbursed for the hours worked using the predetermined hourly rates for each labor category. In addition, we are typically reimbursed for other contract direct costs and expenses at cost. We assume financial risk on time-and-materials contracts because our labor costs may exceed the negotiated billing rates. Profit margins on well-managed time-and-materials contracts tend to be higher than profit margins on cost-reimbursable contracts as long as we are able to staff those contracts with people who have an appropriate skill set. Under fixed-price contracts, we are required to deliver the objectives under the contract for a pre-determined price. Compared to time-and-materials and cost-reimbursable contracts, fixed-price contracts generally offer higher profit margin opportunities because we receive the full benefit of any cost savings but generally involve greater financial risk because we bear the impact of any cost overruns. In the aggregate, the contract type mix in our revenue for any given period will affect that period's profitability. During our fiscal year 2015 we realized the conversion of a material cost reimbursable contract in the U.S. government market to fixed price. Additionally, we generated an increasing fixed price contract base in our commercial and international markets. Going forward, we do not anticipate any macro drivers that will cause our fixed price percentage to materially increase or decrease, and we expect our percentage of fixed price work to be roughly 20% of our total revenue mix. Changes in contract type as a result of re-competes and new business could influence the percentage/mix in an unanticipated way.
The table below presents the percentage of total revenue for each type of contract:
Fiscal Year Ended March 31, | |||||
2015 | 2014 | 2013 | |||
Cost-reimbursable (1) | 55% | 55% | 57% | ||
Time-and-materials | 25% | 28% | 28% | ||
Fixed-price (2) | 20% | 17% | 15% | ||
(1) | Includes both cost-plus-fixed-fee and cost-plus-award-fee contracts. |
(2) | Includes fixed-price level of effort contracts. |
Contract Diversity and Revenue Mix
We provide services to our clients through a large number of single award contracts and contract vehicles and multiple award contract vehicles. Most of our revenue is generated under indefinite delivery/indefinite quantity, or ID/IQ, contract vehicles, which include multiple award government wide acquisition contract vehicles, or GWACs, and General Services Administration Multiple Award Schedule Contracts, or GSA schedules, and certain single award contracts. GWACs and GSA schedules are available to all U.S. government agencies. Any number of contractors typically compete under multiple award ID/IQ contract vehicles for task orders to provide particular services, and we earn revenue under these contract vehicles only to the extent that we are successful in the bidding process for task orders. In fiscal 2015, 2014, and 2013, our revenue under GWACs and GSA schedules collectively represented 20%, 21%, and 19% of our total revenue, respectively. No single task
47
order under any ID/IQ contract represented more than 1.6% of our revenue in fiscal 2015. No single definite contract accounted for more than 2.6% of our revenue in fiscal 2015.
We generate revenue under our contracts and task orders through our provision of services as both a prime contractor and subcontractor, as well as from the provision of services by subcontractors under contracts and task orders for which we act as the prime contractor. For fiscal 2015, 2014, and 2013, 91% of our revenue was generated by contracts and task orders for which we served as a prime contractor; 9% of our revenue was generated by contracts and task orders for which we served as a subcontractor; and 23%, 23%, and 21%, respectively, of our revenue was generated by services provided by our subcontractors. The mix of these types of revenue affects our operating margin. Substantially all of our operating margin is derived from direct consulting staff labor as the portion of our operating margin derived from fees we earn on services provided by our subcontractors is not significant. We view growth in direct consulting staff labor as the primary driver of earnings growth. Direct consulting staff labor growth is driven by consulting staff headcount growth, after attrition, and total backlog growth.
Our People
Revenue from our contracts is derived from services delivered by consulting staff and, to a lesser extent, from our subcontractors. Our ability to hire, retain, and deploy talent with skills appropriately aligned with client needs is critical to our ability to grow our revenue. We continuously evaluate whether our talent base is properly sized and appropriately compensated, and contains an optimal mix of skills to be cost competitive and meet the rapidly evolving needs of our clients.We seek to achieve that result through recruitment and management of capacity and compensation. As of March 31, 2015, 2014, and 2013 we employed approximately 22,500, 22,700, and 24,500 people, respectively, of which approximately 20,500, 20,600, and 22,000, respectively, were consulting staff.
Contract Backlog
We define backlog to include the following three components:
• | Funded Backlog. Funded backlog represents the revenue value of orders for services under existing contracts for which funding is appropriated or otherwise authorized less revenue previously recognized on these contracts. |
• | Unfunded Backlog. Unfunded backlog represents the revenue value of orders for services under existing contracts for which funding has not been appropriated or otherwise authorized. |
• | Priced Options. Priced contract options represent 100% of the revenue value of all future contract option periods under existing contracts that may be exercised at our clients’ option and for which funding has not been appropriated or otherwise authorized. |
Backlog does not include any task orders under ID/IQ contracts, including GWACs and GSA schedules, except to the extent that task orders have been awarded to us under those contracts.
The following table summarizes the value of our contract backlog at the respective dates presented:
Fiscal Year Ended March 31, | |||||||||||
2015 | 2014 | 2013 | |||||||||
(In millions) | |||||||||||
Backlog: | |||||||||||
Funded | $ | 2,691 | $ | 2,290 | $ | 2,509 | |||||
Unfunded (1) | 2,121 | 2,343 | 2,799 | ||||||||
Priced options | 4,548 | 5,205 | 6,227 | ||||||||
Total backlog | $ | 9,360 | $ | 9,838 | $ | 11,535 | |||||
(1) | Reflects a reduction by management to the revenue value of orders for services under one existing single award ID/IQ contract the Company has had for several years, based on an established pattern of funding under this contract by the U.S. government. |
Our backlog includes orders under contracts that in some cases extend for several years. The U.S. Congress generally appropriates funds for our clients on a yearly basis, even though their contracts with us may call for performance that is expected to take a number of years. As a result, contracts typically are only partially funded at any point during their term and
48
all or some of the work to be performed under the contracts may remain unfunded unless and until the U.S. Congress makes subsequent appropriations and the procuring agency allocates funding to the contract.
We view growth in total backlog and consulting staff headcount as the two key measures of our potential business growth. Growing and deploying consulting staff is the primary means by which we are able to recognize profitable revenue growth. To the extent that we are able to hire additional consulting staff and deploy them against funded backlog, we generally recognize increased revenue. Total backlog decreased by 4.9% from March 31, 2014 to March 31, 2015 and decreased 14.7% from March 31, 2013 to March 31, 2014. Additions to funded backlog, during fiscal 2015 and 2014 totaled $5.7 billion and $5.3 billion, respectively, with the increase from 2014 to 2015 due to the conversion of unfunded backlog to funded backlog, the award of new contracts and task orders under which funding was appropriated, and the exercise and subsequent funding of priced options. We report internally on our backlog on a monthly basis and review backlog upon occurrence of certain events to determine if any adjustments are necessary.
Our largest ID/IQ contract represents 12% of our revenue base and expires on July 8, 2015 with several task orders that extend beyond that date, the latest ending in September 2016. The contract is ending and being replaced with a set of new multiple award ID/IQ vehicles. We are working to position our work on other contracts. The loss, without replacement, of certain of these contract vehicles could have a material adverse effect on our ability to win new business and our operating results. We cannot predict with any certainty the portion of our backlog that we expect to recognize as revenue in any future period and we cannot guarantee that we will recognize any revenue from our backlog. The primary risks that could affect our ability to recognize such revenue on a timely basis or at all are: program schedule changes, contract modifications, and our ability to assimilate and deploy new consulting staff against funded backlog; cost cutting initiatives and other efforts to reduce U.S. government spending, which could reduce or delay funding for orders for services; and delayed funding of our contracts due to delays in the completion of the U.S. government's budgeting process and the use of continuing resolutions by the U.S. government to fund its operations. Funded backlog includes orders under contracts for which the period of performance has expired, and we may not recognize revenue on the funded backlog that includes such orders due to, among other reasons, the tardy submission of invoices by our subcontractors and the expiration of the relevant appropriated funding in accordance with a pre-determined expiration date such as the end of the U.S. government's fiscal year. The revenue value of orders included in funded backlog that has not been recognized as revenue due to period of performance expirations has not exceeded approximately 3.5% of funded backlog as of the end of any of the four fiscal quarters preceding the fiscal quarter ended March 31, 2015. In our recent experience, none of the following additional risks have had a material negative effect on our ability to realize revenue from our funded backlog: the unilateral right of the U.S. government to cancel multi-year contracts and related orders or to terminate existing contracts for convenience or default; in the case of unfunded backlog, the potential that funding will not be made available; and, in the case of priced options, the risk that our clients will not exercise their options.
Operating Costs and Expenses
Costs associated with compensation and related expenses for our people are the most significant component of our operating costs and expenses. The principal factors that affect our costs are additional people as we grow our business and are awarded new contracts, task orders, and additional work under our existing contracts, and the hiring of people with specific skill sets and security clearances as required by our additional work.
Our most significant operating costs and expenses are described below.
• | Cost of Revenue. Cost of revenue includes direct labor, related employee benefits, and overhead. Overhead consists of indirect costs, including indirect labor relating to infrastructure, management and administration, and other expenses. |
• | Billable Expenses. Billable expenses include direct subcontractor expenses, travel expenses, and other expenses incurred to perform on contracts. |
• | General and Administrative Expenses. General and administrative expenses include indirect labor of executive management and corporate administrative functions, marketing and bid and proposal costs, and other discretionary spending. |
• | Depreciation and Amortization. Depreciation and amortization includes the depreciation of computers, leasehold improvements, furniture and other equipment, and the amortization of internally developed software, as well as third-party software that we use internally, and of identifiable long-lived intangible assets over their estimated useful lives. |
49
Seasonality
The U.S. government's fiscal year ends on September 30 of each year. It is not uncommon for U.S. government agencies to award extra tasks or complete other contract actions in the weeks before the end of its fiscal year in order to avoid the loss of unexpended fiscal year funds. In addition, we also have generally experienced higher bid and proposal costs in the months leading up to the U.S. government's fiscal year end as we pursue new contract opportunities being awarded shortly after the U.S. government fiscal year end as new opportunities are expected to have funding appropriated in the U.S. government's subsequent fiscal year. We may continue to experience this seasonality in future periods, and our future periods may be affected by it. While not certain, changes in the government's funding and spending patterns have altered historical seasonality trends, supporting our approach to managing the business on an annual basis.
Seasonality is just one of a number of factors, many of which are outside of our control, which may affect our results in any period. See "Item 1A. Risk Factors."
Critical Accounting Estimates and Policies
Our discussion and analysis of our financial condition and results of operations are based on our consolidated financial statements, which have been prepared in accordance with accounting principles generally accepted in the United States, or GAAP. The preparation of these consolidated financial statements in accordance with GAAP requires management to make estimates and assumptions that affect the reported amounts of assets and liabilities and the disclosure of contingencies at the date of the financial statements as well as the reported amounts of revenue and expenses during the reporting period. Management evaluates these estimates and assumptions on an ongoing basis. Our estimates and assumptions have been prepared on the basis of the most current reasonably available information. Actual results may differ from these estimates under different assumptions or conditions.
Our significant accounting policies, including the critical policies and practices listed below, are more fully described and discussed in the notes to the consolidated financial statements. We consider the following accounting policies to be critical to an understanding of our financial condition and results of operations because these policies require the most difficult, subjective or complex judgments on the part of our management in their application, often as a result of the need to make estimates about the effect of matters that are inherently uncertain.
Revenue Recognition and Cost Estimation
Substantially all of our revenue is derived from contracts to provide professional services to the U.S. government and its agencies. In most cases, we recognize revenue as work is performed. We recognize revenue for cost-reimbursable-plus-fixed-fee contracts with the U.S. government as hours are worked based on reimbursable and allowable costs, recoverable indirect costs and an accrual for the fixed fee component of these contracts. Executive compensation that we determine to be allowable for cost reimbursement based on management's estimates is recognized as revenue, net of reserves. Management's estimates in this regard are based on a number of factors that may change over time, including executive compensation survey data, our and other government contractors' experiences with the DCAA audit practices in our industry, and relevant decisions of courts and boards of contract appeals. Many of our U.S. government contracts include award fees, which are earned based on the client’s evaluation of our performance. We have significant history with the client for the majority of contracts on which we earn award fees. That history and management's evaluation and monitoring of performance form the basis for our ability to estimate such fees over the life of the contract. Based on these estimates, we recognize award fees as work on the contracts is performed. Revisions to these estimates may result in increases or decreases to revenue and income, and are reflected in the financial statements in periods in which they are identified. Historically, revisions to these estimates have not had a material effect on our results of operations.
Revenue for time-and-materials contracts is recognized as services are performed, generally on the basis of contract allowable labor hours worked multiplied by the contract-defined billing rates, plus allowable direct costs and indirect cost allocations associated with materials used and other direct expenses incurred in connection with the performance of the contract.
For fixed-price contracts, we primarily recognize revenue on the percentage-of-completion basis with progress toward completion of a particular contract based on actual costs incurred relative to total estimated costs to be incurred over the life of the contract. On some fixed-price contracts we may use an alternative input method to calculate the percent complete, such as labor hours or labor dollars. This method is used when a contract contains significant, up-front material purchases resulting in costs incurred that are not representative of the actual progress on the contract. Profits on fixed-price contracts result from the difference between the incurred costs used to calculate the percentage of completion and the revenue earned. These methods are followed where reasonably dependable estimates of revenue and costs under the contract can be made. If we are unable to reasonably estimate revenue or cost, the completed contract method is used. Historically, we have been able to reasonably estimate total contract revenue and costs and such estimates are regularly reviewed. Recorded revenue and costs are subject to revision as the contract progresses. Such revisions may result in increases or decreases to revenue and income, and are reflected
50
in the financial statements in the periods in which they are first identified. If our estimates indicate that a contract loss will occur, a loss provision is recorded in the period in which the loss first becomes probable and reasonably estimable. Estimating costs under our long-term contracts is complex and involves significant judgment. Factors that must be considered in making estimates include labor productivity and availability, the nature and technical complexity of the work to be performed, potential performance delays, warranty obligations, availability and timing of funding from the client, progress toward completion, and recoverability of claims. Adjustments to original estimates are often required as work progresses and additional information becomes known, even though the scope of the work required under the contract may not change. Any adjustment as a result of a change in estimates is made when facts develop, events become known, or an adjustment is otherwise warranted, such as in the case of a contract modification. We have procedures and processes in place to monitor the actual progress of a project against estimates and our estimates are updated if circumstances are warranted. Historically, revisions to our estimates have not had a material effect on our results of operations.
Business Combinations
The accounting for the Company's business combinations consists of allocating the purchase price to tangible and intangible assets acquired and liabilities assumed based on their fair values, with the excess recorded as goodwill. Certain fair value measurements include inputs that are unobservable, requiring management to make judgments and estimates that can be affected by contract performance and other factors over time, which may cause final amounts to differ materially from original estimates. We have one year from the acquisition date to use additional information obtained to adjust the fair value of the acquired assets and liabilities which may result in changes to the recorded values with an offsetting adjustment to goodwill.
During the fiscal year ended March 31, 2015, we entered into a contingent consideration arrangement in connection with a business acquisition which required a fair value measurement using inputs such as projected cash flows and volatility. The use of different values for these inputs could have a material impact on the valuation. Any adjustment to the fair value of contingent consideration is recorded in earnings. See Note 18 to our consolidated financial statements for further information about the valuation of the contingent consideration liability and the inputs used in the fair value measurement.
Goodwill and Intangible Assets Impairment
We test goodwill for impairment at the reporting unit level on an annual basis and more frequently if an event occurs or circumstances change that would more likely than not reduce the fair value of a reporting unit below its carrying value. A significant amount of management judgment is required to determine if an event representing an impairment indicator has occurred during the year, including but not limited to: a decline in forecasted cash flows; a sustained, material decline in the stock price and market capitalization; a significant adverse change in the business climate or economy; or unanticipated competition. An adverse change in any of these factors could have a significant impact on the recoverability of goodwill and other intangible assets.
As the consolidated entity represents the only component that constitutes a business whereby discrete financial information is available, we concluded that we have one reporting unit, which is the same as our single operating segment. We test goodwill for impairment using the quantitative method (primarily based on market capitalization). We test the trade name for impairment using the relief from royalty method. Our other amortizable intangible assets are tested by comparing revenue projections to actuals and assessing qualitative factors. We perform our annual testing for impairment of goodwill, the trade name, and other amortizable intangible assets as of January 1 of each year.
During the fiscal years ended March 31, 2015, 2014, and 2013, we did not record any impairment of goodwill, our trade name or other amortizable intangible assets. Further, we do not consider any of the goodwill, trade name, or other amortizable intangible assets at risk of impairment.
Share-Based Payments
We use the Black-Scholes option-pricing model to determine the estimated fair value for stock options. Critical inputs into the Black-Scholes option-pricing model include the following: option exercise price, fair value of the stock price, expected life of the option, annualized volatility of the stock, annual rate of quarterly dividends on the stock, and the risk-free interest rate.
During fiscal 2015, the Company’s Board of Directors authorized and declared recurring cash dividends in the amount of $0.11 per share (declared in the first three quarters) and $0.13 per share (declared in the fourth quarter) to holders of Booz Allen Holding’s Class A Common Stock and Class B Non-Voting Common Stock. Therefore, an annualized dividend yield between 1.66% and 2.04% was used in the Black-Scholes option-pricing model for all grants made during the fiscal year. Implied volatility is calculated as of each grant date based on our historical volatility along with an assessment of the historical volatility of a peer group of publicly traded companies. Until the historical volatility of the Company is available for a period consistent with the expected option term, we will continue to compare to a peer group volatility data to estimate expected volatility for future option grants. Other than the expected life of the option, volatility is the most sensitive input to our option grants. To be consistent with all other implied calculations, the same peer group used to calculate other implied metrics is also
51
used to calculate implied volatility. While we are not aware of any news or disclosures by our peers that may impact their respective volatility, there is a risk that peer group volatility may increase, potentially increasing any prospective future compensation expense that will result from future option grants.
The risk-free interest rate used in the Black-Scholes option-pricing model is determined by referencing the U.S. Treasury yield curve rates with the remaining term equal to the expected life assumed at the date of grant.
Forfeitures are estimated based on our historical analysis of attrition levels. Forfeiture estimates are updated quarterly for actual forfeitures. We do not expect this assumption to change materially, as attrition levels associated with new option grants have not materially changed.
As a public company, we use the closing price of our Class A Common Stock on the grant date for valuation purposes.
Accounting for Income Taxes
Provisions for federal, state, and foreign income taxes are calculated from the income reported on our financial statements based on current tax law and also include the cumulative effect of any changes in tax rates from those previously used in determining deferred tax assets and liabilities. Such provisions differ from the amounts currently receivable or payable because certain items of income and expense are recognized in different time periods for purposes of preparing financial statements than for income tax purposes.
Significant judgment is required in determining income tax provisions and evaluating tax positions. We establish reserves for uncertain tax positions when, despite the belief that our tax positions are supportable, there remains uncertainty in a tax position taken in our previously filed income tax returns. For tax positions where it is more likely than not that a tax benefit will be sustained, we record the largest amount of tax benefit with a greater than 50% likelihood of being realized upon settlement with a taxing authority that has full knowledge of all relevant information. To the extent we prevail in matters for which accruals have been established or are required to pay amounts in excess of reserves, our effective tax rate in a given financial statement period may be materially impacted.
The carrying value of our net deferred tax assets assumes that we will be able to generate sufficient future taxable income in certain tax jurisdictions to realize the value of these assets. If we are unable to generate sufficient future taxable income in these jurisdictions, a valuation allowance is recorded when it is more likely than not that the value of the deferred tax assets is not realizable.
Recent Accounting Pronouncements
In May 2014, the Financial Accounting Standards Board (FASB) issued a new standard that will replace existing revenue recognition standards and significantly expand the disclosure requirements for revenue arrangements. In April 2015, the FASB proposed a one-year delay in the effective date of the standard to January 1, 2018, with an option that would permit companies to adopt the standard as early as the original effective date. Early adoption prior to the effective date is not permitted. A final decision on the effective date is expected in 2015. The new standard will be effective for the Company beginning on April 1, 2017 (i.e., beginning with the first quarter fiscal 2018 interim financial statements) or April 1, 2018 if the one-year delay is enacted. The new standard may be adopted retrospectively for all periods presented, or adopted using a modified retrospective approach. Under the retrospective approach, the fiscal 2017 and 2016 financial statements would be adjusted to reflect the effects of adopting the new standard in those periods. Under the modified retrospective approach, the new standard would only be adopted for the period beginning April 1, 2017 to new contracts and those contracts that are not yet complete at April 1, 2017, with a cumulative catch-up adjustment recorded to beginning retained earnings for existing contracts that still require performance. We are still in the process of determining which transition method to utilize in order to adopt the new standard and still assessing what effect the adoption of this standard may have on the timing of our revenue recognition and our financial statements.
Recent accounting pronouncements issued by the FASB during fiscal 2015 and through the filing date did not and are not believed by management to have a material impact on the Company's present or historical consolidated financial statements.
Segment Reporting
We report operating results and financial data in one operating and reportable segment. We manage our business as a single profit center in order to promote collaboration, provide comprehensive functional service offerings across our entire client base, and provide incentives to employees based on the success of the organization as a whole. Although certain information regarding served markets and functional capabilities is discussed for purposes of promoting an understanding of our complex business, we manage our business and allocate resources at the consolidated level of a single operating segment.
52
Basis of Presentation
The accompanying consolidated financial statements include the accounts of the Company and its wholly-owned subsidiaries, and have been prepared in accordance with accounting principles generally accepted in the United States, or GAAP. All intercompany balances and transactions have been eliminated in consolidation.
The Company’s fiscal year ends on March 31 and unless otherwise noted, references to fiscal year or fiscal are for fiscal years ended March 31. The accompanying consolidated financial statements present the financial position of the Company as of March 31, 2015 and 2014 and the Company’s results of operations for fiscal 2015, fiscal 2014, and fiscal 2013.
Results of Operations
The following table sets forth items from our consolidated statements of operations for the periods indicated:
Fiscal Year Ended March 31, | Fiscal 2015 Versus Fiscal 2014 | Fiscal 2014 Versus Fiscal 2013 | ||||||||||||||||
2015 | 2014 | 2013 | ||||||||||||||||
(In thousands) | ||||||||||||||||||
Revenue | $ | 5,274,770 | $ | 5,478,693 | $ | 5,758,059 | (3.7 | )% | (4.9 | )% | ||||||||
Operating costs and expenses: | ||||||||||||||||||
Cost of revenue | 2,593,849 | 2,716,113 | 2,871,240 | (4.5 | )% | (5.4 | )% | |||||||||||
Billable expenses | 1,406,527 | 1,487,115 | 1,532,590 | (5.4 | )% | (3.0 | )% | |||||||||||
General and administrative expenses | 752,912 | 742,527 | 833,986 | 1.4 | % | (11.0 | )% | |||||||||||
Depreciation and amortization | 62,660 | 72,327 | 74,009 | (13.4 | )% | (2.3 | )% | |||||||||||
Total operating costs and expenses | 4,815,948 | 5,018,082 | 5,311,825 | (4.0 | )% | (5.5 | )% | |||||||||||
Operating income | 458,822 | 460,611 | 446,234 | (0.4 | )% | 3.2 | % | |||||||||||
Interest expense | (71,832 | ) | (78,030 | ) | (70,284 | ) | (7.9 | )% | 11.0 | % | ||||||||
Other, net | (1,072 | ) | (1,794 | ) | (7,639 | ) | (40.2 | )% | (76.5 | )% | ||||||||
Income before income taxes | 385,918 | 380,787 | 368,311 | 1.3 | % | 3.4 | % | |||||||||||
Income tax expense | 153,349 | 148,599 | 149,253 | 3.2 | % | (0.4 | )% | |||||||||||
Net income | $ | 232,569 | $ | 232,188 | $ | 219,058 | 0.2 | % | 6.0 | % | ||||||||
Fiscal 2015 Compared to Fiscal 2014
Revenue
Revenue decreased to $5,274.8 million from $5,478.7 million, or a 3.7% decrease, as a result of lower demand, primarily driven by the continuing effect of macro challenges in the federal government spending environment. However, maintaining solid productivity and deployment of consulting staff on billable work mitigated the impact of these conditions on our revenue performance. In addition, the Company reported a second sequential quarter of headcount increases to deploy against existing and future funded work. Although headcount has increased in the most recent months, the average headcount over the last twelve months declined which led to fewer billable hours in total and an overall decrease in revenue for fiscal 2015. The revenue decline year over year was also attributable to a reduction in billable expenses due to a decline in our use of subcontractors and other direct expenses incurred to perform on contracts. Conversions to funded backlog during fiscal 2015 totaled $5.7 billion in comparison to $5.3 billion for the comparable year. The revenue conversion was a result of the conversion of unfunded backlog to funded backlog, the award of new contracts and task orders under which funding was appropriated, and the exercise and subsequent funding of priced options.
Cost of Revenue
Cost of revenue decreased to $2,593.8 million from $2,716.1 million, or a 4.5% decrease. This decrease was primarily due to a decrease in salaries and salary-related benefits of $96.6 million and a decrease in employer retirement plan contributions of $52.0 million. The decrease in salaries and salary-related benefits was primarily due to reduced headcount in direct consulting staff throughout fiscal 2015. The decrease in employer retirement plan contributions was due to a decrease in the Company's expected discretionary employer contribution percentage due to a change to the matching program effective April 1, 2014, as well as the reduced headcount noted above. Cost of revenue as a percentage of revenue was 49.2% and 49.6% in fiscal 2015 and fiscal 2014, respectively.
Billable Expenses
53
Billable expenses decreased to $1,406.5 million from $1,487.1 million, or a 5.4% decrease. The overall decrease was primarily due to decreases in subcontractor-related expenses and other direct expenses of $91.4 million incurred to perform on contracts. Direct subcontractor related expenses decreased due to lower demand. Billable expenses as a percentage of revenue was 26.7% and 27.1% in fiscal 2015 and fiscal 2014, respectively.
General and Administrative Expenses
General and administrative expenses increased to $752.9 million from $742.5 million, or a 1.4% increase. This increase was primarily due to an increase in incentive and stock-based compensation of $3.5 million and an increase in professional fees and other business expenses of $12.0 million. This was partially offset by decreases in employer retirement plan contributions of $2.9 million. The decrease in employer retirement plan contributions was due to a decrease in the Company's expected discretionary employer contribution percentage due to a change to a matching program effective April 1, 2014, as well as reduced headcount. General and administrative expenses as a percentage of revenue were 14.3% and 13.6% for fiscal 2015 and fiscal 2014, respectively.
Depreciation and Amortization
Depreciation and amortization decreased to $62.7 million from $72.3 million, or a 13.4% decrease, primarily due to a reduction in amortization of intangible assets, as well as a decrease in depreciation expense resulting from the effect of lower capital expenditures in prior years.
Interest Expense
Interest expense decreased to $71.8 million from $78.0 million, or a 7.9% decrease, primarily as a result of the Second Amendment to the Credit Agreement consummated in May 2014. The Company increased its borrowing under Term Loan A by approximately $168.4 million, the proceeds of which were used to pay outstanding principal on the Term Loan B. As the interest rates for Term Loan A are lower than those for Term Loan B, total interest expense decreased for fiscal 2015 as compared to fiscal 2014.
Income Tax Expense
Income tax expense increased to $153.3 million from $148.6 million, or a 3.2% increase, due to an increase in pre-tax income and to an increase in the effective tax rate in fiscal 2015 from 39.0% to 39.7%. The increase in the effective tax rate primarily relates to income tax credits recognized during fiscal 2015 that were lower than that recognized in fiscal 2014, as well as an increase in foreign tax expense.
Fiscal 2014 Compared to Fiscal 2013
Revenue
Revenue decreased to $5,478.7 million from $5,758.1 million, or a 4.9% decrease. The decrease was primarily driven by reductions in headcount due to lower demand in an uncertain federal budget environment and a reduction in billable expenses. Revenue in fiscal 2014 was additionally impacted by the October 2013 government shutdown and weather-related closures. While lower headcount led to fewer billable hours in total, we experienced a slight improvement in productivity of consulting staff over the prior year, which helped reduce the impact of such reduced billable hours. The decrease in revenue was partially offset by an increase in inorganic revenue of $103.0 million from the Company's acquisition of BES. Conversions to funded backlog during fiscal 2014 totaled $5.3 billion in comparison to $5.4 billion for the comparable period. The decrease in revenue conversion was due to challenging and uncertain market conditions which contributed to a lower conversion of unfunded backlog to funded backlog, the reduced award of new contracts and task orders under which funding was appropriated, and the decline in exercise and subsequent funding of priced options.
Cost of Revenue
Cost of revenue decreased to $2,716.1 million from $2,871.2 million, or a 5.4% decrease. This decrease was primarily due to a decrease in salaries and salary-related benefits of $97.3 million, a decrease in employer retirement plan contributions of $56.9 million, and a decrease in incentive compensation costs of $4.9 million. The decrease was partially offset by increases in other direct consulting staff expenses of $5.3 million. The decrease in salaries and salary-related benefits and incentive compensation was primarily due to reduced headcount in senior direct consulting staff. The decrease in employer retirement plan contributions was due to a decrease in the Company's expected discretionary employer contribution for fiscal 2014 as well as the reduced headcount noted above. Cost of revenue as a percentage of revenue was 49.6% and 49.9% in fiscal 2014 and fiscal 2013, respectively.
54
Billable Expenses
Billable expenses decreased to $1,487.1 million from $1,532.6 million, or a 3.0% decrease. The overall decrease was primarily due to decreases in subcontractor-related expenses and other billable expenses of $51.9 million incurred to perform on contracts. Direct subcontractor related expenses decreased due to lower demand in an uncertain federal budget environment and a decline in contract related purchases for the government. Billable expenses as a percentage of revenue was 27.1% and 26.6% in fiscal 2014 and fiscal 2013, respectively.
General and Administrative Expenses
General and administrative expenses decreased to $742.5 million from $834.0 million, or a 11.0% decrease. This decrease was due to decreases in salaries and salary-related benefits of $45.4 million, a decrease of $16.5 million in employer retirement plan contributions, and a decrease in incentive compensation of $13.4 million. The decrease in salaries and salary-related expenses and incentive compensation was primarily driven by the net reduction in our headcount. The decrease in employer retirement plan contributions was due to a decrease in the Company's expected discretionary employer contribution percentage for fiscal 2014 as well as the reduced headcount noted above. The remaining decrease was due to decreases in stock based compensation of $3.4 million and decreases in business-related transaction expenses, such as expenses incurred in fiscal 2013 associated with the Company's July 2012 debt recapitalization and acquisitions and decreases in professional fees and other expenses due to the Company's continued focus on cost management. General and administrative expenses as a percentage of revenue were 13.6% and 14.5% for fiscal 2014 and fiscal 2013, respectively.
Depreciation and Amortization
Depreciation and amortization decreased to $72.3 million from $74.0 million, or a 2.3% decrease due to a decrease in capital expenditures during fiscal 2014.
Interest Expense
Interest expense increased to $78.0 million from $70.3 million, or an 11.0% increase primarily due to a full year of interest expense on additional principal incurred in connection with the Company's debt recapitalization consummated on July 31, 2012.
Income Tax Expense
Income tax expense decreased to $148.6 million from $149.3 million, or a 0.4% decrease primarily due to an increase in pre-tax income more than offset by a decrease in effective tax rate in fiscal 2014 from 40.5% to 39.0%. The decrease in the effective tax rate primarily relates to federal and state income tax credits recognized in fiscal 2014, which reduced the effective tax rate by 1.5%.
Liquidity and Capital Resources
We have historically been able to generate sufficient cash to fund our operations, debt payments, capital expenditures, and discretionary funding needs. We had $207.2 million and $260.0 million in cash and cash equivalents as of March 31, 2015 and 2014, respectively. However, due to fluctuations in cash flows, including as a result of the trends and developments described above under "—Factors and Trends Affecting Our Results of Operations" relating to U.S. government cost-cutting, reductions or delays in the U.S. government appropriations and spending process and other budgetary matters, it may be necessary from time-to-time in the future to borrow under our senior secured loan facilities to meet cash demands. See Note 10 to our consolidated financial statements for additional information regarding borrowings under our revolving credit facility. We anticipate that cash provided by operating activities, existing cash and cash equivalents, and borrowing capacity under our revolving credit facility will be sufficient to meet our anticipated cash requirements for the next twelve months, which primarily include:
• | operating expenses, including salaries; |
• | working capital requirements to fund the growth of our business; |
• | capital expenditures which primarily relate to the purchase of computers, business systems, furniture and leasehold improvements to support our operations; |
• | debt service requirements for borrowings under our senior secured loan facilities; and |
• | cash taxes to be paid. |
55
From time to time we evaluate alternative uses for excess cash resources once our operating cash flow needs and required debt amortization have been met. Some of the possible uses of our remaining excess cash at any point in time may include funding acquisitions, further investment in our business and voluntary debt prepayments, as well as initiatives intended to return value to shareholders in the form of payment of recurring and special dividends and share repurchases. The Company paid $1.46 in dividends per share to shareholders of record in fiscal 2015. On December 12, 2011, the Board of Directors authorized the repurchase of up to $30.0 million of our shares. On January 27, 2015, the share repurchase authorization was increased to $180.0 million. Following our repurchase of 1,000,000 shares of our Class A Common Stock on November 5, 2014 and an additional 1,000,000 shares of our Class A Common Stock on February 2, 2015, the Company currently has $126.5 million remaining under the repurchase program. Any determination to pursue one or more of the above alternative uses for excess cash is subject to the discretion of our Board of Directors, and will depend upon various factors, including our results of operations, financial condition, liquidity requirements, restrictions that may be imposed by applicable law, our contracts, and our senior secured credit agreement, as amended, and other factors deemed relevant by our Board of Directors.
Our debt totaled $1,626.3 million and $1,658.9 million as of March 31, 2015 and 2014, respectively. Our debt bears interest at specified rates and is held by a syndicate of lenders (see Note 10 in our consolidated financial statements).
Our senior secured loan facilities consist of an $830.0 million Tranche A term facility, or Term Loan A, and an $841.2 million Tranche B term facility, or Term Loan B. As of March 31, 2015, we had $798.9 million and $841.2 million principal outstanding under the Term Loan A facility and Term Loan B facility, respectively. As of March 31, 2014, we had $661.6 million and $1,009.6 million principal outstanding under the Term Loan A facility and Term Loan B facility, respectively, of our prior credit facility.
On May 7, 2014, the Company entered into the Second Amendment to the Credit Agreement, dated as of July 31, 2012 (as previously amended by the First Amendment to the Credit Agreement, dated as of August 16, 2013). Following the Second Amendment, the interest rates for the Term Loan A facility and Term Loan B facility remain unchanged. The Second Amendment extended the maturity date of the Term Loan A and the revolving credit facility to May 31, 2019. The maturity date for the Term Loan B facility remained unchanged. The Company also amended its existing debt covenants to provide for greater operational and financial flexibility. See "- Indebtedness."
The following table summarizes the cash distributions recognized in the consolidated statement of cash flows:
Fiscal Year Ended March 31, | ||||||||||||
2015 | 2014 | 2013 | ||||||||||
Recurring dividends (1) | $ | 67,846 | $ | 57,063 | $ | 48,736 | ||||||
Special dividends (2) | 147,248 | 288,739 | 1,073,733 | |||||||||
Dividend equivalents (3) | 47,110 | 56,138 | 59,471 | |||||||||
Total distributions | $ | 262,204 | $ | 401,940 | $ | 1,181,940 | ||||||
(1) Amounts represent recurring dividends that were declared and paid for during each quarter of fiscal 2015, fiscal 2014, and fiscal 2013.
(2) Amounts represent aggregate special dividends of $1.00 per share ($1.00 paid on August 29, 2014), $2.00 per share ($1.00 paid November 29, 2013 and $1.00 paid February 28, 2014) and $8.00 per share ($1.50 paid June 29, 2012 and $6.50 paid August 31, 2012) that were declared and paid for during fiscal 2015, fiscal 2014, and fiscal 2013, respectively.
(3) Dividend equivalents are distributions made to option holders equal to the special dividends declared and paid.
On May 21, 2015, the Company announced a regular quarterly cash dividend in the amount of $0.13 per share. The quarterly dividend is payable on June 30, 2015 to stockholders of record on June 10, 2015.
For each special dividend declared, the Board of Directors, acting as the Administrator of the Officers' Rollover Stock Plan and the Equity Incentive Plan (EIP), as amended, is required to make a determination under the respective plan's antidilution provision to adjust the outstanding options. For the $1.00 special dividends authorized and declared October 29, 2013, January 31, 2014, and July 30, 2014, holders of the Rollover Options received a cash payment equal to the amount of the special dividend on the exercise of the option during the options' mandatory exercise period. Holders of EIP options will receive a cash payment equal to the amount of the special dividend on the date the dividend was paid or the vesting of the EIP option, whichever is later. In the event the Board of Directors elects to grant option holders a cash payment equal to the amount of the special dividend, the Company accrues a stock-based compensation liability as the respective option's stock compensation expense is recorded in the statement of operations. This obligation will be settled on the options' mandatory exercise date for Rollover options and on the later of the date the dividend is paid or vesting for the EIP options. As of
56
March 31, 2015 and March 31, 2014, the Company calculated a total recorded and unrecorded stock-based compensation liability of $35.8 million and $73.1 million, respectively, related to the special dividends paid in July and December 2009, June and August 2012, November 2013, and February and August 2014.
The Company paid accrued interest on the DPO of $8.0 million during fiscal 2015 and 2014, respectively.
Cash Flows
Cash received from clients, either from the payment of invoices for work performed or for advances in excess of costs incurred, is our primary source of cash. We generally do not begin work on contracts until funding is appropriated by the client. Billing timetables and payment terms on our contracts vary based on a number of factors, including whether the contract type is cost-reimbursable, time-and-materials, or fixed-price. We generally bill and collect cash more frequently under cost-reimbursable and time-and-materials contracts, as we are authorized to bill as the costs are incurred or work is performed. In contrast, we may be limited to bill certain fixed-price contracts only when specified milestones, including deliveries, are achieved. In addition, a number of our contracts may provide for performance-based payments, which allow us to bill and collect cash prior to completing the work.
Accounts receivable is the principal component of our working capital and is generally driven by revenue growth with other short-term fluctuations related to the payment practices of our clients. Our accounts receivable reflect amounts billed to our clients as of each balance sheet date. Our clients generally pay our invoices within 30 days of the invoice date. At any month-end, we also include in accounts receivable the revenue that was recognized in the preceding month, which is generally billed early in the following month. Finally, we include in accounts receivable amounts related to revenue accrued in excess of amounts billed, primarily on our fixed-price and cost-reimbursable-plus-award-fee contracts. The total amount of our accounts receivable can vary significantly over time, but is generally sensitive to revenue levels. Total accounts receivable (billed and unbilled combined, net of allowance for doubtful accounts) days sales outstanding or DSO, which we calculate by dividing total accounts receivable by revenue per day during the relevant fiscal quarter, was 59 and 60 as of March 31, 2015 and 2014, respectively.
The table below sets forth our net cash flows for the periods presented:
Fiscal Year Ended March 31, | |||||||||||
2015 | 2014 | 2013 | |||||||||
(In thousands) | |||||||||||
Net cash provided by operating activities | $ | 309,958 | $ | 332,718 | $ | 464,654 | |||||
Net cash used in investing activities | (60,575 | ) | (13,556 | ) | (190,452 | ) | |||||
Net cash used in financing activities | (302,160 | ) | (409,552 | ) | (408,186 | ) | |||||
Total decrease in cash and cash equivalents | $ | (52,777 | ) | $ | (90,390 | ) | $ | (133,984 | ) | ||
Net Cash from Operating Activities
Net cash from operations is primarily affected by the overall profitability of our contracts, our ability to invoice and collect from clients in a timely manner, and our ability to manage our vendor payments. Net cash provided by operations was $310.0 million in fiscal 2015 compared to $332.7 million in the same prior year period, or a 6.8% decrease. The decrease in net cash provided by operations was primarily due to the following:
• | A reduction in the volume of outstanding invoices to our customers as compared to the prior year as the Company continued to have strong collections of billed accounts receivable. |
• | A reduction in outstanding payments to our vendors. |
• | The payout of $27.5 million associated with the Company's deferred compensation plan. |
• | An decrease in income taxes paid due to the timing of estimated tax payments. |
• | Declines in compensation related liabilities primarily related to changes in our expected discretionary employer retirement contributions. |
Net Cash from Investing Activities
Net cash used in investing activities was $60.6 million in fiscal 2015 compared to $13.6 million in the same prior year period, or a 346.9% increase. The increase in net cash used in investing activities was primarily due to cash paid for business acquisitions during fiscal 2015.
57
Net Cash from Financing Activities
Net cash used in financing activities was $302.2 million in fiscal 2015 compared to $409.6 million in the same prior year period, or a 26.2% decrease. The decrease in net cash used in financing activities was primarily due to a decrease in special cash dividends paid in fiscal 2015 as compared to fiscal 2014, as well as a decrease in debt principal payments in fiscal 2015 as compared to fiscal 2014, as a result of the Second Amendment to the Credit Agreement consummated on May 7, 2014. These decreases were partially offset by an increase in repurchases of common stock in fiscal 2015 as compared to fiscal 2014 mainly due to a repurchase of 2,000,000 shares of our Class A Common Stock from an affiliate of The Carlyle Group in fiscal 2015.
Indebtedness
On May 7, 2014 the Company entered into the Second Amendment to the Credit Agreement, dated as of July 31, 2012 (as previously amended by the First Amendment to the Credit Agreement, dated as of August 16, 2013). Following the Second Amendment, the rates for Term Loan A and Term Loan B remain unchanged. The Second Amendment extended the maturity date of Term Loan A and the revolving credit facility to May 31, 2019. The maturity date for Term Loan B remained unchanged at July 31, 2019. The Company also amended its existing debt covenants to provide for greater operational and financial flexibility. As of March 31, 2015, the Credit Agreement, as amended, provided the Company with a $830.0 million Term Loan A facility and a $841.2 million Term Loan B facility, and a $500.0 million revolving credit facility with a $100.0 million sublimit for letters of credit.
We occasionally borrow under our revolving credit facility in anticipation of cash demands. On September 26, 2014, the Company's wholly-owned subsidiary Booz Allen Hamilton Inc. accessed $30.0 million of its $500.0 million revolving credit facility to support month-end transactions. The Company repaid the $30.0 million borrowed from the revolving credit facility on September 30, 2014. On February 26, 2015, the Company's wholly-owned subsidiary Booz Allen Hamilton Inc. accessed $50.0 million of its $500.0 million revolving credit facility to support month-end transactions. The Company repaid the $50.0 million borrowed from the revolving credit facility on March 6, 2015.
The Credit Agreement, as amended, requires quarterly principal payments of 1.25% of the stated principal amount of Term Loan A, with annual incremental increases to 1.875%, 2.50%, 3.125%, and 13.0%, prior to Term Loan A's maturity date of May 31, 2019. As a result of paying approximately $168.4 million of Term Loan B principal in connection with the Second Amendment, no additional principal payments are required until the remaining balance is due on Term Loan B's maturity date of July 31, 2019. The revolving credit facility matures on May 31, 2019, at which time any outstanding principal balance is due in full.
The interest rate on borrowings under Term Loan A is LIBOR plus 2.50% spread. The spread ranges from 2.00% to 2.75% based on the Company's total leverage ratio. The interest rate on borrowings under Term Loan B is LIBOR plus 3.0% spread with a 0.75% floor. The spread ranges from 2.00% to 3.00% based upon either an ABR or LIBOR borrowing. The revolving credit facility margin and commitment fee are subject to the leveraged based pricing grid, as set forth in the Credit Agreement, as amended. As of March 31, 2015 and 2014, we were contingently liable under open standby letters of credit and bank guarantees issued by our banks in favor of third parties that totaled $5.3 million and $2.4 million, respectively. These letters of credit and bank guarantees primarily support insurance and bid and performance obligations. At March 31, 2015 and 2014, approximately $5.2 million and $2.4 million of these instruments reduce our available borrowings under the revolving credit facility. The remainder are guaranteed under a separate $5.0 million facility established in fiscal 2015, $4.9 million of which was available to us at March 31, 2015. As of March 31, 2015, we had $494.8 million of capacity available for additional borrowings under the revolving credit facility.
The loans under the Credit Agreement, as amended, are secured by substantially all of our assets and none of such assets will be available to satisfy the claims of our general creditors. The Credit Agreement, as amended, contains customary representations and warranties and customary affirmative and negative covenants. The negative covenants are limited to the following, in each case subject to certain exceptions: a maximum net total leverage ratio; a minimum net interest coverage ratio; limitations on indebtedness and liens; mergers, consolidations or amalgamations, or liquidations, wind-ups or dissolutions; dispositions of property; restricted payments; investments; transactions with affiliates; sale and lease back transactions; change in fiscal periods; negative pledges; restrictive agreements; limitations on line of business; limitations on speculative hedging and limitations on changes of names and jurisdictions. In addition, we are required to meet certain financial covenants at each quarter end, namely Consolidated Net Total Leverage and Consolidated Net Interest Coverage Ratios. As of March 31, 2015, we were compliant with these covenants.
During fiscal 2015, interest payments of $21.0 million and $29.0 million were made for the Term Loan A and Term Loan B facilities, respectively. During fiscal 2014, interest payments of $19.0 million and $41.9 million were made for the Term Loan A and Term Loan B facilities, respectively. As of March 31, 2015, no amounts were drawn on the revolving credit facility.
The total outstanding debt balance is recorded in the accompanying consolidated balance sheets net of unamortized discount of $13.7 million and $12.3 million as of March 31, 2015 and 2014, respectively.
58
Capital Structure and Resources
Our stockholders’ equity amounted to $186.5 million as of March 31, 2015, an increase of $14.9 million compared to stockholders’ equity of $171.6 million as of March 31, 2014. The increase was primarily due to net income of $232.6 million in fiscal 2015, $50.8 million in excess tax benefits for the exercise of stock options, and stock-based compensation expense of $26.2 million, partially offset by $215.1 million in recurring and special dividend payments and a $62.1 million increase in treasury stock.
Off-Balance Sheet Arrangements
As of March 31, 2015, we did not have any off-balance sheet arrangements.
Contractual Obligations
The following table summarizes our contractual obligations that require us to make future cash payments as of March 31, 2015. For contractual obligations, we included payments that we have an unconditional obligation to make.
Payments Due by Period | ||||||||||||||||||||
Total | Less Than 1 Year | 1 to 3 Years | 3 to 5 Years | More Than 5 years | ||||||||||||||||
(In thousands) | ||||||||||||||||||||
Long-term debt (a) | $ | 1,640,063 | $ | 57,063 | $ | 176,375 | $ | 1,406,625 | $ | — | ||||||||||
Operating lease obligations | 241,721 | 70,158 | 74,622 | 48,477 | 48,464 | |||||||||||||||
Interest on indebtedness | 210,032 | 53,290 | 100,450 | 56,292 | — | |||||||||||||||
Deferred payment obligation (b) | 76,655 | — | 76,655 | — | — | |||||||||||||||
Liability to option holders (c) | 35,854 | 31,732 | 3,635 | 487 | — | |||||||||||||||
Tax liabilities for uncertain tax positions (d) | 58,444 | 57,915 | 323 | 206 | — | |||||||||||||||
Total contractual obligations | $ | 2,262,769 | $ | 270,158 | $ | 432,060 | $ | 1,512,087 | $ | 48,464 | ||||||||||
(a) | See Note 10 to our consolidated financial statements for additional information regarding debt and related matters. |
(b) | Includes $59.4 million deferred payment obligation balance, plus current and future interest accruals. |
(c) | Reflects liabilities to holders of stock options issued under our Officers’ Rollover Stock Plan and the Equity Incentive Plan, as amended, related to the reduction in the exercise price of such options as a result of special dividends paid in July and December 2009, June and August 2012, November 2013, and February and August 2014. |
(d) | Includes $20.6 million of tax liabilities offset by amounts owed under the deferred payment obligation. The remainder is related to other tax liabilities, which may not result in a cash outlay within the next year. |
In the normal course of business, we enter into agreements with subcontractors and vendors to provide products and services that we consume in our operations or that are delivered to our clients. These products and services are not considered unconditional obligations until the products and services are actually delivered, at which time we record a liability for our obligation.
Capital Expenditures
Since we do not own any of our facilities, our capital expenditure requirements primarily relate to the purchase of computers, business systems, furniture, and leasehold improvements to support our operations. Direct facility and equipment costs billed to clients are not treated as capital expenses. Our capital expenditures for fiscal 2015 and 2014 were $36.0 million and $20.9 million, respectively, and the majority of such capital expenditures related to facilities infrastructure, equipment, and information technology. Expenditures for facilities infrastructure and equipment are generally incurred to support new and existing programs across our business. We also incur capital expenditures for information technology to support programs and general enterprise information technology infrastructure.
Commitments and Contingencies
We are subject to a number of reviews, investigations, claims, lawsuits, and other uncertainties related to our business. For a discussion of these items, refer to Note 20 to our consolidated financial statements.
59
Item 7A. Quantitative and Qualitative Disclosures About Market Risk
Our exposure to market risk for changes in interest rates relates primarily to our outstanding debt and cash equivalents, which consist primarily of funds invested in U.S. government insured money-market accounts and prime money-market funds. As of March 31, 2015 and 2014, we had $207.2 million and $260.0 million, respectively, in cash and cash equivalents. The interest expense associated with our term loans and any loans under our revolving credit facility will vary with market rates.
Our exposure to market risk for changes in interest rates related to our outstanding debt will impact our senior secured loan facilities. A hypothetical 1% increase in interest rates would have increased interest expense related to the term facilities under our senior secured loan facilities by approximately $8.7 million in fiscal 2015 and $8.1 million in fiscal 2014, and likewise decreased our income and cash flows. A hypothetical increase of LIBOR to 4%, the average historical three-month LIBOR, would have increased interest expense related to all term facilities under our senior secured loan facilities by approximately $57.9 million in fiscal 2015 and $58.3 million in fiscal 2014, and likewise decreased our income and cash flows. The year over year decrease in interest expense is primarily due to the Second Amendment to the Credit Agreement consummated in May 2014. The Company increased its borrowing under Term Loan A, the proceeds of which were used to pay outstanding principal on the Term Loan B. As the interest rates for Term Loan A are lower than those for Term Loan B, total interest expense decreased for fiscal 2015 as compared to fiscal 2014.
The return on our cash and cash equivalents balance as of March 31, 2015 and 2014 was less than 1%. Therefore, although investment interest rates may continue to decrease in the future, the corresponding impact to our interest income, and likewise to our income and cash flow, would not be material.
We do not use derivative financial instruments in our investment portfolio and have not entered into any hedging transactions.
60
Item 8. | Financial Statements and Supplementary Data |
INDEX TO THE CONSOLIDATED FINANCIAL STATEMENTS
Page | |
F-1
Report of Ernst & Young LLP,
Independent Registered Public Accounting Firm
The Board of Directors and Shareholders of
Booz Allen Hamilton Holding Corporation
We have audited the accompanying consolidated balance sheets of Booz Allen Hamilton Holding Corporation as of March 31, 2015 and 2014, and the related consolidated statements of operations, comprehensive income, stockholders’ equity and cash flows for each of the three years in the period ended March 31, 2015. These financial statements are the responsibility of the Company’s management. Our responsibility is to express an opinion on these financial statements based on our audits.
We conducted our audits in accordance with the standards of the Public Company Accounting Oversight Board (United States). Those standards require that we plan and perform the audit to obtain reasonable assurance about whether the financial statements are free of material misstatement. An audit includes examining, on a test basis, evidence supporting the amounts and disclosures in the financial statements. An audit also includes assessing the accounting principles used and significant estimates made by management, as well as evaluating the overall financial statement presentation. We believe that our audits provide a reasonable basis for our opinion.
In our opinion, the financial statements referred to above present fairly, in all material respects, the consolidated financial position of Booz Allen Hamilton Holding Corporation at March 31, 2015 and 2014, and the consolidated results of its operations and its cash flows for each of the three years in the period ended March 31, 2015, in conformity with U.S. generally accepted accounting principles.
We also have audited, in accordance with the standards of the Public Company Accounting Oversight Board (United States), Booz Allen Hamilton Holding Corporation’s internal control over financial reporting as of March 31, 2015, based on criteria established in Internal Control-Integrated Framework issued by the Committee of Sponsoring Organizations of the Treadway Commission (2013 framework) and our report dated May 21, 2015 expressed an unqualified opinion thereon.
/s/ Ernst & Young LLP
McLean, Virginia
May 21, 2015
F-2
BOOZ ALLEN HAMILTON HOLDING CORPORATION CONSOLIDATED BALANCE SHEETS | |||||||
March 31, 2015 | March 31, 2014 | ||||||
(Amounts in thousands, except share and per share data) | |||||||
ASSETS | |||||||
Current assets: | |||||||
Cash and cash equivalents | $ | 207,217 | $ | 259,994 | |||
Accounts receivable, net of allowance | 857,310 | 916,737 | |||||
Deferred income taxes | 14,539 | 29,687 | |||||
Prepaid expenses and other current assets | 84,142 | 49,559 | |||||
Total current assets | 1,163,208 | 1,255,977 | |||||
Property and equipment, net of accumulated depreciation | 111,367 | 129,427 | |||||
Deferred income taxes | 14,758 | — | |||||
Intangible assets, net of accumulated amortization | 219,382 | 220,887 | |||||
Goodwill | 1,304,231 | 1,273,789 | |||||
Other long-term assets | 64,547 | 60,738 | |||||
Total assets | $ | 2,877,493 | $ | 2,940,818 | |||
LIABILITIES AND STOCKHOLDERS’ EQUITY | |||||||
Current liabilities: | |||||||
Current portion of long-term debt | $ | 57,063 | $ | 73,688 | |||
Accounts payable and other accrued expenses | 481,815 | 488,807 | |||||
Accrued compensation and benefits | 279,239 | 331,440 | |||||
Other current liabilities | 30,877 | 23,169 | |||||
Total current liabilities | 848,994 | 917,104 | |||||
Long-term debt, net of current portion | 1,569,272 | 1,585,231 | |||||
Income tax reserve | 58,444 | 57,406 | |||||
Deferred income taxes | — | 8,231 | |||||
Other long-term liabilities | 214,285 | 201,210 | |||||
Total liabilities | 2,690,995 | 2,769,182 | |||||
Commitments and contingencies (Note 20) | |||||||
Stockholders’ equity: | |||||||
Common stock, Class A — $0.01 par value — authorized, 600,000,000 shares; issued, 150,237,675 shares at March 31, 2015 and 143,962,073 shares at March 31, 2014; outstanding, 147,238,282 shares at March 31, 2015 and 143,352,448 shares at March 31, 2014 | 1,502 | 1,440 | |||||
Non-voting common stock, Class B — $0.01 par value — authorized, 16,000,000 shares; issued and outstanding, 0 shares at March 31, 2015 and 582,080 shares at March 31, 2014 | — | 6 | |||||
Restricted common stock, Class C — $0.01 par value — authorized, 5,000,000 shares; issued and outstanding, 0 shares at March 31, 2015 and 935,871 shares at March 31, 2014 | — | 9 | |||||
Special voting common stock, Class E — $0.003 par value — authorized, 25,000,000 shares; issued and outstanding, 1,851,589 shares at March 31, 2015 and 4,424,814 shares at March 31, 2014 | 6 | 13 | |||||
Treasury stock, at cost — 2,999,393 shares at March 31, 2015 and 609,625 shares at March 31, 2014 | (72,293 | ) | (10,153 | ) | |||
Additional paid-in capital | 174,985 | 144,269 | |||||
Retained earnings | 104,457 | 42,688 | |||||
Accumulated other comprehensive loss | (22,159 | ) | (6,636 | ) | |||
Total stockholders’ equity | 186,498 | 171,636 | |||||
Total liabilities and stockholders’ equity | $ | 2,877,493 | $ | 2,940,818 | |||
The accompanying notes are an integral part of these Consolidated Financial Statements.
F-3
BOOZ ALLEN HAMILTON HOLDING CORPORATION CONSOLIDATED STATEMENTS OF OPERATIONS | |||||||||||
Fiscal Year Ended March 31, | |||||||||||
2015 | 2014 | 2013 | |||||||||
(Amounts in thousands, except per share data) | |||||||||||
Revenue | $ | 5,274,770 | $ | 5,478,693 | $ | 5,758,059 | |||||
Operating costs and expenses: | |||||||||||
Cost of revenue | 2,593,849 | 2,716,113 | 2,871,240 | ||||||||
Billable expenses | 1,406,527 | 1,487,115 | 1,532,590 | ||||||||
General and administrative expenses | 752,912 | 742,527 | 833,986 | ||||||||
Depreciation and amortization | 62,660 | 72,327 | 74,009 | ||||||||
Total operating costs and expenses | 4,815,948 | 5,018,082 | 5,311,825 | ||||||||
Operating income | 458,822 | 460,611 | 446,234 | ||||||||
Interest expense | (71,832 | ) | (78,030 | ) | (70,284 | ) | |||||
Other, net | (1,072 | ) | (1,794 | ) | (7,639 | ) | |||||
Income before income taxes | 385,918 | 380,787 | 368,311 | ||||||||
Income tax expense | 153,349 | 148,599 | 149,253 | ||||||||
Net income | $ | 232,569 | $ | 232,188 | $ | 219,058 | |||||
Earnings per common share (Note 3): | |||||||||||
Basic | $ | 1.58 | $ | 1.62 | $ | 1.56 | |||||
Diluted | $ | 1.52 | $ | 1.54 | $ | 1.45 | |||||
The accompanying notes are an integral part of these Consolidated Financial Statements.
F-4
BOOZ ALLEN HAMILTON HOLDING CORPORATION CONSOLIDATED STATEMENTS OF COMPREHENSIVE INCOME | |||||||||||
Fiscal Year Ended March 31, | |||||||||||
2015 | 2014 | 2013 | |||||||||
(Amounts in thousands) | |||||||||||
Net income | $ | 232,569 | $ | 232,188 | $ | 219,058 | |||||
Change in postretirement plan costs, net of tax | (15,523 | ) | 7,151 | (5,072 | ) | ||||||
Comprehensive income | $ | 217,046 | $ | 239,339 | $ | 213,986 | |||||
The accompanying notes are an integral part of these Consolidated Financial Statements.
F-5
BOOZ ALLEN HAMILTON HOLDING CORPORATION CONSOLIDATED STATEMENTS OF CASH FLOWS | |||||||||||
Fiscal Year Ended March 31, | |||||||||||
2015 | 2014 | 2013 | |||||||||
(Amounts in thousands) | |||||||||||
Cash flows from operating activities | |||||||||||
Net income | $ | 232,569 | $ | 232,188 | $ | 219,058 | |||||
Adjustments to reconcile net income to net cash provided by operating activities: | |||||||||||
Depreciation and amortization | 62,660 | 72,327 | 74,009 | ||||||||
Stock-based compensation expense | 26,163 | 20,065 | 24,841 | ||||||||
Deferred income taxes | (2,543 | ) | (26,371 | ) | (48,088 | ) | |||||
Excess tax benefits from the exercise of stock options | (50,800 | ) | (38,185 | ) | (26,860 | ) | |||||
Amortization of debt issuance costs and loss on extinguishment | 11,582 | 11,682 | 17,224 | ||||||||
Losses on dispositions and impairments | 1,541 | 1,024 | 1,106 | ||||||||
Gain on sales of businesses | — | — | (254 | ) | |||||||
Changes in assets and liabilities: | |||||||||||
Accounts receivable | 60,533 | 110,308 | 125,125 | ||||||||
Income taxes receivable / payable | 36,456 | (1,903 | ) | 104,877 | |||||||
Prepaid expenses and other current assets | (1,591 | ) | (5,923 | ) | 10,006 | ||||||
Other long-term assets | (8,240 | ) | (4,773 | ) | 2,723 | ||||||
Accrued compensation and benefits | (44,329 | ) | (72,881 | ) | (26,832 | ) | |||||
Accounts payable and other accrued expenses | (35,443 | ) | 39,178 | (23,760 | ) | ||||||
Accrued interest | 5,262 | — | (3,563 | ) | |||||||
Income tax reserves | 1,038 | 388 | 1,736 | ||||||||
Other current liabilities | 5,127 | (1,090 | ) | 11,367 | |||||||
Other long-term liabilities | 9,973 | (3,316 | ) | 1,939 | |||||||
Net cash provided by operating activities | 309,958 | 332,718 | 464,654 | ||||||||
Cash flows from investing activities | |||||||||||
Purchases of property and equipment | (36,041 | ) | (20,905 | ) | (33,113 | ) | |||||
Cash paid for business acquisitions, net of cash acquired | (24,534 | ) | 3,563 | (157,964 | ) | ||||||
Proceeds from sales of businesses | — | — | 625 | ||||||||
Escrow receipts | — | 3,786 | — | ||||||||
Net cash used in investing activities | (60,575 | ) | (13,556 | ) | (190,452 | ) | |||||
Cash flows from financing activities | |||||||||||
Net proceeds from issuance of common stock | 5,020 | 5,078 | 6,373 | ||||||||
Stock option exercises | 6,099 | 14,620 | 14,977 | ||||||||
Excess tax benefits from the exercise of stock options | 50,800 | 38,185 | 26,860 | ||||||||
Repurchases of common stock | (62,140 | ) | (3,709 | ) | (1,067 | ) | |||||
Cash dividends paid | (215,094 | ) | (345,802 | ) | (1,122,457 | ) | |||||
Dividend equivalents paid to option holders | (47,110 | ) | (56,138 | ) | (49,765 | ) | |||||
Debt issuance costs | (8,610 | ) | (6,223 | ) | (29,607 | ) | |||||
Repayment of debt | (279,563 | ) | (355,563 | ) | (993,250 | ) | |||||
Proceeds from debt issuance | 248,438 | 300,000 | 1,739,750 | ||||||||
Net cash used in financing activities | (302,160 | ) | (409,552 | ) | (408,186 | ) | |||||
Net decrease in cash and cash equivalents | (52,777 | ) | (90,390 | ) | (133,984 | ) | |||||
Cash and cash equivalents––beginning of year | 259,994 | 350,384 | 484,368 | ||||||||
Cash and cash equivalents––end of year | $ | 207,217 | $ | 259,994 | $ | 350,384 | |||||
Supplemental disclosures of cash flow information | |||||||||||
Cash paid during the period for: | |||||||||||
Interest | $ | 50,074 | $ | 61,050 | $ | 58,847 | |||||
Income taxes | $ | 122,912 | $ | 178,411 | $ | 90,146 | |||||
The accompanying notes are an integral part of these Consolidated Financial Statements.
F-6
BOOZ ALLEN HAMILTON HOLDING CORPORATION
CONSOLIDATED STATEMENTS OF STOCKHOLDERS’ EQUITY
(Amounts in thousands, except share data) | Class A Common Stock | Class B Non-Voting Common Stock | Class C Restricted Common Stock | Class E Special Voting Common Stock | Treasury Stock | Additional Paid-In Capital | Retained Earnings | Accumulated Other Comprehensive Income (Loss) | Total Stockholders’ Equity | |||||||||||||||||||||||||||||||||||||
Shares | Amount | Shares | Amount | Shares | Amount | Shares | Amount | Shares | Amount | |||||||||||||||||||||||||||||||||||||
Balance at March 31, 2012 | 128,726,324 | $ | 1,287 | 2,487,125 | $ | 25 | 1,533,020 | $ | 15 | 10,140,067 | $ | 30 | (333,775) | $ | (5,377 | ) | $ | 898,541 | $ | 299,379 | $ | (8,715 | ) | $ | 1,185,185 | |||||||||||||||||||||
Issuance of common stock | 1,182,004 | 12 | 0 | — | 0 | — | 0 | — | 0 | — | 6,361 | — | — | 6,373 | ||||||||||||||||||||||||||||||||
Stock options exercised | 5,204,890 | 52 | 0 | — | 0 | — | (2,661,545) | (8 | ) | 0 | — | 14,933 | — | — | 14,977 | |||||||||||||||||||||||||||||||
Excess tax benefits from the exercise of stock options | 0 | — | 0 | — | 0 | — | 0 | — | 0 | — | 26,860 | — | — | 26,860 | ||||||||||||||||||||||||||||||||
Share exchange | 1,344,226 | 13 | (1,035,525) | (10 | ) | (308,701) | (3 | ) | 0 | — | 0 | — | — | — | — | — | ||||||||||||||||||||||||||||||
Repurchase of common stock | 0 | — | 0 | — | 0 | — | 0 | — | (72,068) | (1,067 | ) | — | — | — | (1,067 | ) | ||||||||||||||||||||||||||||||
Recognition of liability related to future stock option exercises (Note 17) | 0 | — | 0 | — | 0 | — | 0 | — | 0 | — | (121,905 | ) | — | — | (121,905 | ) | ||||||||||||||||||||||||||||||
Net income | 0 | — | 0 | — | 0 | — | 0 | — | 0 | — | — | 219,058 | — | 219,058 | ||||||||||||||||||||||||||||||||
Change in postretirement plan costs, net of tax | 0 | — | 0 | — | 0 | — | 0 | — | 0 | — | — | — | (5,072 | ) | (5,072 | ) | ||||||||||||||||||||||||||||||
Comprehensive income | 213,986 | |||||||||||||||||||||||||||||||||||||||||||||
Dividends paid (Note 16) | 0 | — | 0 | — | 0 | — | 0 | — | 0 | — | (728,795 | ) | (393,662 | ) | — | (1,122,457 | ) | |||||||||||||||||||||||||||||
Stock-based compensation expense | 0 | — | 0 | — | 0 | — | 0 | — | 0 | — | 24,841 | — | — | 24,841 | ||||||||||||||||||||||||||||||||
Balance at March 31, 2013 | 136,457,444 | $ | 1,364 | 1,451,600 | $ | 15 | 1,224,319 | $ | 12 | 7,478,522 | $ | 22 | (405,843) | $ | (6,444 | ) | $ | 120,836 | $ | 124,775 | $ | (13,787 | ) | $ | 226,793 | |||||||||||||||||||||
Issuance of common stock | 1,047,160 | 10 | 0 | — | 0 | — | 0 | — | 0 | — | 5,068 | — | — | 5,078 | ||||||||||||||||||||||||||||||||
Stock options exercised | 5,299,501 | 54 | 0 | — | 0 | — | (3,053,708) | (9 | ) | 0 | — | 14,575 | — | — | 14,620 | |||||||||||||||||||||||||||||||
Excess tax benefits from the exercise of stock options | 0 | — | 0 | — | 0 | — | 0 | — | 0 | — | 38,185 | — | — | 38,185 | ||||||||||||||||||||||||||||||||
Share exchange | 1,157,968 | 12 | (869,520) | (9 | ) | (288,448) | (3 | ) | 0 | — | 0 | — | — | — | — | — | ||||||||||||||||||||||||||||||
Repurchase of common stock | 0 | — | 0 | — | 0 | — | 0 | — | (203,782) | (3,709 | ) | — | — | — | (3,709 | ) | ||||||||||||||||||||||||||||||
Recognition of liability related to future stock option exercises (Note 17) | 0 | — | 0 | — | 0 | — | 0 | — | 0 | — | (22,933 | ) | — | — | (22,933 | ) | ||||||||||||||||||||||||||||||
Net income | 0 | — | 0 | — | 0 | — | 0 | — | 0 | — | — | 232,188 | — | 232,188 | ||||||||||||||||||||||||||||||||
Change in postretirement plan costs, net of tax | 0 | — | 0 | — | 0 | — | 0 | — | 0 | — | — | — | 7,151 | 7,151 | ||||||||||||||||||||||||||||||||
Comprehensive income | 239,339 | |||||||||||||||||||||||||||||||||||||||||||||
Dividends paid (Note 16) | 0 | — | 0 | — | 0 | — | 0 | — | 0 | — | (31,527 | ) | (314,275 | ) | — | (345,802 | ) | |||||||||||||||||||||||||||||
Stock-based compensation expense | 0 | — | 0 | — | 0 | — | 0 | — | 0 | — | 20,065 | — | — | 20,065 | ||||||||||||||||||||||||||||||||
Balance at March 31, 2014 | 143,962,073 | $ | 1,440 | 582,080 | $ | 6 | 935,871 | $ | 9 | 4,424,814 | $ | 13 | (609,625) | $ | (10,153 | ) | $ | 144,269 | $ | 42,688 | $ | (6,636 | ) | $ | 171,636 | |||||||||||||||||||||
Issuance of common stock | 1,365,008 | 14 | 0 | — | 0 | — | 0 | — | 0 | — | 5,006 | — | — | 5,020 | ||||||||||||||||||||||||||||||||
Stock options exercised | 3,392,643 | 33 | 0 | — | 0 | — | (2,573,225) | (7 | ) | 0 | — | 6,073 | — | — | 6,099 | |||||||||||||||||||||||||||||||
Excess tax benefits from the exercise of stock options | 0 | — | 0 | — | 0 | — | 0 | — | 0 | — | 50,800 | — | — | 50,800 | ||||||||||||||||||||||||||||||||
Share exchange | 1,517,951 | 15 | (582,080) | (6 | ) | (935,871) | (9 | ) | 0 | — | 0 | — | — | — | — | — | ||||||||||||||||||||||||||||||
Repurchase of common stock | 0 | — | 0 | — | 0 | — | 0 | — | (2,389,768) | (62,140 | ) | — | — | — | (62,140 | ) | ||||||||||||||||||||||||||||||
Recognition of liability related to future stock option exercises (Note 17) | 0 | — | 0 | — | 0 | — | 0 | — | 0 | — | (13,032 | ) | — | — | (13,032 | ) | ||||||||||||||||||||||||||||||
Net income | 0 | — | 0 | — | 0 | — | 0 | — | 0 | — | — | 232,569 | — | 232,569 | ||||||||||||||||||||||||||||||||
Change in postretirement plan costs, net of tax | 0 | — | 0 | — | 0 | — | 0 | — | 0 | — | — | — | (15,523 | ) | (15,523 | ) | ||||||||||||||||||||||||||||||
Comprehensive income | 217,046 | |||||||||||||||||||||||||||||||||||||||||||||
Dividends paid (Note 16) | 0 | — | 0 | — | 0 | — | 0 | — | 0 | — | (44,294 | ) | (170,800 | ) | — | (215,094 | ) | |||||||||||||||||||||||||||||
Stock-based compensation expense | 0 | — | 0 | — | 0 | — | 0 | — | 0 | — | 26,163 | — | — | 26,163 | ||||||||||||||||||||||||||||||||
Balance at March 31, 2015 | 150,237,675 | $ | 1,502 | 0 | $ | — | 0 | $ | — | 1,851,589 | $ | 6 | (2,999,393) | $ | (72,293 | ) | $ | 174,985 | $ | 104,457 | $ | (22,159 | ) | $ | 186,498 | |||||||||||||||||||||
The accompanying notes are an integral part of these Consolidated Financial Statements.
F-7
BOOZ ALLEN HAMILTON HOLDING CORPORATION
NOTES TO CONSOLIDATED FINANCIAL STATEMENTS
(Amounts in tables in thousands, except share and per share data or unless otherwise noted)
March 31, 2015
1. BUSINESS OVERVIEW
Our Business
Booz Allen Hamilton Holding Corporation, including its wholly owned subsidiaries, or Holding or the Company, is an affiliate of The Carlyle Group, or Carlyle, and was incorporated in Delaware in May 2008. The Company provides management consulting, technology, and engineering services to the U.S. government in the defense, intelligence, and civil markets. Additionally, the Company provides its management and technology consulting services to major corporations, institutions, not-for-profit organizations, and international clients. The Company reports operating results and financial data in one operating segment. The Company is headquartered in McLean, Virginia, with approximately 22,500 employees as of March 31, 2015.
2. SUMMARY OF SIGNIFICANT ACCOUNTING POLICIES
Basis of Presentation
The accompanying consolidated financial statements include the accounts of the Company and its wholly-owned subsidiaries, and have been prepared in accordance with accounting principles generally accepted in the United States, or U.S. GAAP. All intercompany balances and transactions have been eliminated in consolidation.
The Company’s fiscal year ends on March 31 and unless otherwise noted, references to fiscal year or fiscal are for fiscal years ended March 31. The accompanying consolidated financial statements present the financial position of the Company as of March 31, 2015 and 2014 and the Company’s results of operations for fiscal 2015, fiscal 2014, and fiscal 2013.
Use of Estimates
The preparation of financial statements in conformity with U.S. GAAP requires management to make estimates and assumptions that affect the reported amounts of assets and liabilities and disclosure of contingent assets and liabilities at the date of the financial statements, and the reported amounts of revenue and expenses during the reporting periods. Areas of the financial statements where estimates may have the most significant effect include contractual and regulatory reserves, valuation and lives of tangible and intangible assets, contingent consideration related to business acquisitions, impairment of long-lived assets, accrued liabilities, revenue recognition, bonus and other incentive compensation, stock-based compensation, realization of deferred tax assets, provisions for income taxes, and postretirement obligations. Actual results experienced by the Company may differ materially from management's estimates.
Revenue Recognition
Substantially all of the Company’s revenue is derived from services and solutions provided to the U.S. government and its agencies, primarily by the Company’s consulting staff and, to a lesser extent, subcontractors. The Company generates its revenue from the following types of contractual arrangements: cost-reimbursable-plus-fee contracts, time-and-materials contracts, and fixed-price contracts.
Revenue on cost-reimbursable-plus-fee contracts is recognized as services are performed, generally based on the allowable costs incurred during the period plus any recognizable earned fee. The Company considers fixed fees under cost-reimbursable-plus-fee contracts to be earned in proportion to the allowable costs incurred in performance of the contract. For cost-reimbursable-plus-fee contracts that include performance-based fee incentives, which are principally award fee arrangements, the Company recognizes income when such fees are probable and estimable. Estimates of the total fee to be earned are made based on contract provisions, prior experience with similar contracts or clients, and management’s evaluation of the performance on such contracts. Contract costs, including indirect expenses, are subject to audit by the Defense Contract Audit Agency, or DCAA, and, accordingly, are subject to possible cost disallowances. Executive compensation that we determine to be allowable for cost reimbursement based on management's estimates is recognized as revenue, net of reserves. Management's estimates in this regard are based on a number of factors that may change over time, including executive compensation survey data, our and other government contractors' experiences with the DCAA audit practices in our industry, and relevant decisions of courts and boards of contract appeals.
Revenue earned under time-and-materials contracts is recognized as hours are worked based on contractually billable rates to the client. Costs on time-and-materials contracts are expensed as incurred.
F-8
Revenue on fixed-price contracts is primarily recognized using the percentage of completion method based on actual costs incurred relative to total estimated costs for the contract. On some fixed-price contracts the Company may use an alternative input method to calculate the percent complete, such as labor hours or labor dollars. This method is used when a contract contains significant, up-front material purchases resulting in costs incurred that are not representative of the actual progress on the contract. In either method, these estimated costs are updated during the term of the contract, and may result in revision by the Company of recognized revenue and estimated costs in the period in which the changes in estimated costs are identified. Profits on fixed-price contracts result from the difference between incurred costs used to calculate the percentage of completion and revenue earned.
Contract accounting requires significant judgment relative to assessing risks, estimating contract revenue and costs, and making assumptions for schedule and technical issues. Due to the size and nature of many of the Company’s contracts, developing total revenue and cost at completion estimates requires the use of significant judgment. Contract costs include direct labor and billable expenses, an allocation of allowable indirect costs, and warranty obligations. Billable expenses is comprised of subcontracting costs and other “out of pocket” costs that often include, but are not limited to, travel-related costs and telecommunications charges. The Company recognizes revenue and billable expenses from these transactions on a gross basis because it is the primary obligor on our contracts with customers. Assumptions regarding the length of time to complete the contract also include expected increases in wages and prices for materials. Estimates of total contract revenue and costs are monitored during the term of the contract and are subject to revision as the contract progresses. Anticipated losses on contracts are recognized in the period they are deemed probable and can be reasonably estimated.
The Company’s contracts may include the delivery of a combination of one or more of the Company’s service offerings. In these situations, the Company determines whether such arrangements with multiple service offerings should be treated as separate units of accounting based on how the elements are bid or negotiated, whether the customer can accept separate elements of the arrangement, and the relationship between the pricing on the elements individually and combined.
Cash and Cash Equivalents
Cash and cash equivalents include cash on hand and highly liquid investments having an original maturity of three months or less. The Company’s cash equivalents consist primarily of institutional money market funds. The Company maintains its cash and cash equivalents in bank accounts that, at times, exceed the federally insured limits. The Company has not experienced any losses in such accounts.
Valuation of Accounts Receivable
The Company maintains allowances for doubtful accounts against certain billed receivables based upon the latest information regarding whether invoices are ultimately collectible. Assessing the collectability of customer receivables requires management judgment. The Company determines its allowance for doubtful accounts by specifically analyzing individual accounts receivable, historical bad debts, customer credit-worthiness, current economic conditions, and accounts receivable aging trends. Valuation reserves are periodically re-evaluated and adjusted as more information about the ultimate collectability of accounts receivable becomes available. Upon determination that a receivable is uncollectible, the receivable balance and any associated reserve are written off.
Concentrations of Credit Risk
Financial instruments that potentially subject the Company to concentrations of credit risk consist primarily of cash equivalents and accounts receivable. The Company’s cash equivalents are generally invested in Prime or U.S. government money market funds, which minimizes the credit risk. The Company believes that credit risk, for accounts receivable is limited as the receivables are primarily with the U.S. government.
Property and Equipment
Property and equipment are recorded at cost, and the balances are presented net of accumulated depreciation. The cost of software purchased or internally developed is capitalized, as appropriate. Depreciation is calculated using the straight-line method over the estimated useful lives of the assets. Furniture and equipment is depreciated over five to ten years, computer equipment is depreciated over four years, and software purchased or developed for internal use is depreciated over three to five years. Leasehold improvements are amortized over the shorter of the useful life of the asset or the lease term. Maintenance and repairs are charged to expense as incurred.
Rent expense is recorded on a straight-line basis over the life of the respective lease. The difference between the cash payment and rent expense is recorded as deferred rent in either accounts payable and other accrued expenses or other long-term liabilities in the consolidated balance sheets, depending on when the amounts will be recognized. The Company receives incentives for tenant improvements on certain of its leases. The cash expended on such improvements is recorded as property and equipment and amortized over the life of the associated asset, or lease term, whichever is shorter. Incentives for tenant improvements are recorded as deferred rent in either accounts payable and other accrued expenses or other long-term liabilities
F-9
in the consolidated balance sheets depending on when the amounts will be recognized. Then they are amortized on a straight line basis over the lease term.
Business Combinations
The accounting for the Company’s business combinations consists of allocating the purchase price to tangible and intangible assets acquired and liabilities assumed based on their fair values, with the excess recorded as goodwill. The Company has one year from the acquisition date to use additional information obtained to adjust the fair value of the acquired assets and liabilities which may result in changes to their recorded values with an offsetting adjustment to goodwill.
During the fiscal year ended March 31, 2015, the Company entered into a contingent consideration arrangement in connection with a business acquisition which required a fair value measurement using inputs such as projected cash flows and volatility. See Note 18 to our consolidated financial statements for further information about the valuation of the contingent consideration liability and the inputs used in the fair value measurement.
Intangible Assets
Intangible assets primarily consist of the Company's trade name, customer relationships, and other amortizable intangible assets. Customer relationships are amortized on an accelerated basis over the expected life based on projected future cash flows of approximately seven to nine years. The Company's trade name is not amortized, but is tested on at least an annual basis as of January 1 and more frequently if interim indicators of impairment exist. The trade name is considered to be impaired if the carrying value exceeds its estimated fair value. The Company used the relief from royalty method to estimate the fair value. The fair value of the asset is the present value of the license fees avoided by owning the asset, or the royalty savings. During the fiscal years ended March 31, 2015, 2014, and 2013 the Company did not record any impairment of intangible assets.
Goodwill
The Company assesses goodwill for impairment on at least an annual basis on January 1 unless interim indicators of impairment exist. Goodwill is considered to be impaired when the net book value of a reporting unit exceeds its estimated fair value. The Company operates as a single operating segment and as a single reporting unit for the purpose of evaluating goodwill. As of January 1, 2015, the Company performed its annual impairment test of goodwill by comparing the fair value of the Company (primarily based on market capitalization) to the carrying value of equity, and concluded that the fair value of the reporting unit was greater than the carrying amount. During the fiscal years ended March 31, 2015, 2014, and 2013 the Company did not record any impairment of goodwill.
Long-Lived Assets
The Company reviews its long-lived assets, including property and equipment and intangible assets, for impairment whenever events or changes in circumstances indicate that the carrying amounts of the assets may not be fully recoverable. If the total of the expected undiscounted future net cash flows is less than the carrying amount of the asset, a loss is recognized for any excess of the carrying amount over the fair value of the asset. During the fiscal years ended March 31, 2015, 2014, and 2013 the Company did not record any impairment charges.
Income Taxes
The Company provides for income taxes as a “C” corporation on income earned from operations. The Company is subject to federal, state, and foreign taxation in various jurisdictions.
Deferred tax assets and liabilities are recorded to recognize the expected future tax benefits or costs of events that have been, or will be, reported in different years for financial statement purposes than for tax purposes. Deferred tax assets and liabilities are computed based on the difference between the financial statement carrying amount and tax basis of assets and liabilities using enacted tax rates and laws for the years in which these items are expected to reverse. If management determines that some portion or all of a deferred tax asset is not “more likely than not” to be realized, a valuation allowance is recorded as a component of the income tax provision to reduce the deferred tax asset to an appropriate level in that period. In determining the need for a valuation allowance, management considers all positive and negative evidence, including historical earnings, projected future taxable income, future reversals of existing taxable temporary differences, taxable income in prior carryback periods, and prudent, feasible tax-planning strategies.
The Company periodically assesses its tax positions for all periods open to examination by tax authorities based on the latest available information. Where it is not more likely that not that the Company’s tax position will be sustained, the Company records its best estimate of the resulting tax liability, penalties, and interest in the consolidated financial statements. These uncertain tax positions are recorded as a component of income tax expense. As uncertain tax positions in periods open to examination are closed out, or as new information becomes available, the resulting change is reflected in the recorded liability and income tax expense. Penalties and interest recognized related to the reserves for uncertain tax positions are recorded as a component of income tax expense.
F-10
Comprehensive Income
Comprehensive income is the change in equity of a business enterprise during a period from transactions and other events and circumstances from nonowner sources, and is presented in the consolidated statements of comprehensive income. Accumulated other comprehensive income (loss) as of March 31, 2015 and 2014 consisted of net unrealized losses on the Company’s defined and postretirement benefit plans.
Share-Based Payments
Share-based payments to employees are recognized in the consolidated statements of operations based on their grant date fair values with the expense recognized on an accelerated basis over the vesting period. The Company uses the Black-Scholes option-pricing model to determine the fair value of its awards at the time of the grant.
Defined Benefit Plan and Other Postretirement Benefits
The Company recognizes the underfunded status of defined benefit plans on the consolidated balance sheets. Gains and losses and prior service costs and credits that have not yet been recognized through net periodic benefit cost are recognized in accumulated other comprehensive income (loss), net of tax effects, and will be amortized as a component of net periodic cost in future periods. The measurement date, the date at which the benefit obligations are measured, is the Company’s fiscal year end.
Self-Funded Medical Plans
The Company maintains self-funded medical insurance. Self-funded plans include a health maintenance organization, high-deductible, and traditional choice. Further, self-funded plans also include prescription drug and dental benefits. The Company records an incurred but unreported claim liability in the accrued compensation and benefits line of the consolidated balance sheets for self-funded plans based on an actuarial valuation. Data that drives this estimate are primarily based on claims and enrollment data provided by a third party valuation firm for medical and pharmacy related costs.
Deferred Compensation Plan
The Company accounts for its deferred compensation plan in accordance with the terms of the underlying plan agreement. To the extent the terms of the contract attribute all or a portion of the expected future benefit to an individual year of the employee’s service, the cost of the benefits is recognized in that year. Therefore, the Company estimates the cost of future benefits that are expected to be paid and expenses the present value of those costs in the year as services are provided. As of March 31, 2015, there is no liability associated with the Company's deferred compensation plan.
Fair Value Measurements
Fair value is the price that would be received to sell an asset or paid to transfer a liability in an orderly transaction between market participants at the measurement date. In determining fair value, we consider the principal or most advantageous market in which the asset or liability would transact, and if necessary, consider assumptions that market participants would use when pricing the asset or liability.
The accounting guidance for fair value measurements establishes a three level fair value hierarchy that prioritizes the inputs used in measuring fair value as follows: observable inputs such as quoted prices in active markets (Level 1); inputs other than quoted prices in active markets that are observable either directly or indirectly (Level 2); and unobservable inputs in which there is little or no market data, which requires the Company to develop its own assumptions (Level 3). Assets and liabilities are classified in their entirety within the fair value hierarchy based on the lowest level input that is significant to the fair value measurement. See Note 18 for additional information on the Company’s fair value measurements.
Recent Accounting Pronouncements
In May 2014, the Financial Accounting Standards Board (FASB) issued a new standard that will replace existing revenue recognition standards and significantly expand the disclosure requirements for revenue arrangements. In April 2015, the FASB proposed a one-year delay in the effective date of the standard to January 1, 2018, with an option that would permit companies to adopt the standard as early as the original effective date. Early adoption prior to the effective date is not permitted. A final decision on the effective date is expected in 2015. The new standard will be effective for the Company beginning on April 1, 2017 (i.e., beginning with the first quarter fiscal 2018 interim financial statements) or April 1, 2018 if the one-year delay is enacted. The new standard may be adopted retrospectively for all periods presented, or adopted using a modified retrospective approach. Under the retrospective approach, the fiscal 2017 and 2016 financial statements would be adjusted to reflect the effects of adopting the new standard in those periods. Under the modified retrospective approach, the new standard would only be adopted for the period beginning April 1, 2017 to new contracts and those contracts that are not yet complete at April 1,
F-11
2017, with a cumulative catch-up adjustment recorded to beginning retained earnings for existing contracts that still require performance. Management is still in the process of determining which transition method to utilize in order to adopt the new standard and still assessing what effect the adoption of this standard may have on the timing of our revenue recognition and our financial statements.
Other recent accounting pronouncements issued by the FASB during fiscal 2015 and through the filing date did not and are not believed by management to have a material impact on the Company's present or historical consolidated financial statements.
3. EARNINGS PER SHARE
The Company computes basic and diluted earnings per share amounts based on net income for the periods presented. The Company uses the weighted average number of common shares outstanding during the period to calculate basic earnings per share, or EPS. Diluted EPS adjusts the weighted average number of shares outstanding to include the dilutive effect of outstanding common stock options and other stock-based awards.
The Company currently has outstanding shares of Class A Common Stock and Class E Special Voting Common Stock. During fiscal 2015, the Company converted all issued and outstanding shares of Class B Non-Voting Common Stock and Class C Restricted Common Stock into shares of Class A Common Stock on a one-for-one basis. Class E Special Voting Common Stock shares are not included in the calculation of EPS as these shares represent voting rights only and are not entitled to participate in dividends or other distributions. Unvested Class A Restricted Common Stock holders are entitled to participate in non-forfeitable dividends or other distributions. These unvested shares participated in the Company's dividends declared and paid in each quarter of fiscal 2015, 2014, and 2013. As such, EPS is calculated using the two-class method whereby earnings are reduced by distributed earnings as well as any available undistributed earnings allocable to holders of unvested restricted shares. A reconciliation of the income used to compute basic and diluted EPS for the periods presented are as follows:
Fiscal Year Ended March 31, | |||||||||||
2015 | 2014 | 2013 | |||||||||
Earnings for basic computations (1) | $ | 229,093 | $ | 229,082 | $ | 209,994 | |||||
Weighted-average Class A Common Stock outstanding | 144,809,906 | 139,275,596 | 131,068,847 | ||||||||
Weighted-average Class B Non-Voting Common Stock outstanding | 222,129 | 1,019,051 | 2,080,050 | ||||||||
Weighted-average Class C Restricted Common Stock outstanding | 382,085 | 1,019,897 | 1,253,832 | ||||||||
Total weighted-average common shares outstanding for basic computations | 145,414,120 | 141,314,544 | 134,402,729 | ||||||||
Earnings for diluted computations (1) | $ | 229,101 | $ | 229,082 | $ | 209,994 | |||||
Dilutive stock options and restricted stock | 4,961,411 | 7,366,530 | 10,451,995 | ||||||||
Average number of common shares outstanding for diluted computations | 150,375,531 | 148,681,074 | 144,854,724 | ||||||||
Earnings per common share | |||||||||||
Basic | $ | 1.58 | $ | 1.62 | $ | 1.56 | |||||
Diluted | $ | 1.52 | $ | 1.54 | $ | 1.45 | |||||
(1) During fiscal 2015, 2014, and 2013 approximately 2.2 million, 1.3 million, and 1.2 million shares of participating securities were paid dividends totaling $3.2 million, $3.1 million, and $9.1 million, respectively. For fiscal 2015 there were undistributed earnings of $256,000 and $248,000 allocated to the participating class of securities in basic and diluted earnings per share, respectively. The allocated undistributed earnings and the dividends paid comprise the difference between net income presented on the consolidated statements of operations for fiscal 2015 and earnings for basic and diluted computations, while only the dividends paid for fiscal 2014 and 2013 comprise the difference from net income presented on the consolidated statements of operations, as there were no undistributed earnings.
The EPS calculation for fiscal 2015, 2014, and 2013 excludes 306,000, 1,072,000, and 328,000 options as their impact was anti-dilutive.
F-12
4. GOODWILL AND INTANGIBLE ASSETS
Goodwill
As of March 31, 2015 and 2014, goodwill was $1,304.2 million and $1,273.8 million, respectively. The increase in the carrying amount of goodwill is primarily attributable to the Company's business acquisitions. The Company performed an annual impairment test of goodwill as of January 1, 2015 and 2014, noting no impairment.
Intangible Assets
Intangible assets consisted of the following:
As of March 31, 2015 | As of March 31, 2014 | |||||||||||||||||||||||
Gross Carrying Value | Accumulated Amortization | Net Carrying Value | Gross Carrying Value | Accumulated Amortization | Net Carrying Value | |||||||||||||||||||
Amortizable intangible assets | ||||||||||||||||||||||||
Customer relationships and other amortizable intangible assets | $ | 196,359 | $ | 167,177 | $ | 29,182 | $ | 187,758 | $ | 157,071 | $ | 30,687 | ||||||||||||
Total | $ | 196,359 | $ | 167,177 | $ | 29,182 | $ | 187,758 | $ | 157,071 | $ | 30,687 | ||||||||||||
Unamortizable intangible assets | ||||||||||||||||||||||||
Trade name | $ | 190,200 | $ | — | $ | 190,200 | $ | 190,200 | $ | — | $ | 190,200 | ||||||||||||
Total | $ | 386,559 | $ | 167,177 | $ | 219,382 | $ | 377,958 | $ | 157,071 | $ | 220,887 | ||||||||||||
Intangible assets are primarily amortized on an accelerated basis over periods ranging from 7 years to 9 years. The weighted-average remaining period of amortization for all customer relationships is 4.6 years.
The Company performed an annual impairment test of the trade name as of January 1, 2015 and 2014, noting no impairment.
Amortization expense for fiscal 2015, 2014, and 2013 was $10.7 million, $14.8 million, and $14.8 million, respectively. The following table summarizes the estimated annual amortization expense for future periods indicated below:
For the Fiscal Year Ended March 31, | |||
2016 | $ | 10,722 | |
2017 | 9,330 | ||
2018 | 3,889 | ||
2019 | 2,677 | ||
2020 | 1,468 | ||
Thereafter | 1,096 | ||
Total amortization expense | $ | 29,182 | |
5. ACCOUNTS RECEIVABLE, NET
Accounts receivable, net consisted of the following:
F-13
March 31, | |||||||
2015 | 2014 | ||||||
Current | |||||||
Accounts receivable–billed | $ | 318,464 | $ | 395,509 | |||
Accounts receivable–unbilled | 539,203 | 522,685 | |||||
Allowance for doubtful accounts | (357 | ) | (1,457 | ) | |||
Accounts receivable, net | 857,310 | 916,737 | |||||
Long-term | |||||||
Unbilled receivables | 18,496 | 22,877 | |||||
Total accounts receivable, net | $ | 875,806 | $ | 939,614 | |||
Unbilled amounts represent sales for which billings have not been presented to customers at year end. These amounts are usually billed and collected within one year. Long-term unbilled receivables not anticipated to be billed and collected within one year, which are primarily related to retainage, holdbacks, and long-term rate settlements to be billed at contract closeout, are included in other long-term assets as accounts receivable in the accompanying consolidated balance sheets. The Company recognized a provision (benefit) for doubtful accounts (including certain unbilled reserves) of $(1.0) million, $1.3 million, and $544,000 for fiscal 2015, 2014 and 2013, respectively. Because the Company's accounts receivable are primarily with U.S. Government and its agencies, the Company does not have material exposure to accounts receivable credit risk.
6. PROPERTY AND EQUIPMENT, NET
The components of property and equipment, net were as follows:
March 31, | ||||||||
2015 | 2014 | |||||||
Furniture and equipment | $ | 134,378 | $ | 104,463 | ||||
Computer equipment | 57,723 | 49,469 | ||||||
Software | 43,881 | 25,380 | ||||||
Leasehold improvements | 152,661 | 201,166 | ||||||
Total | 388,643 | 380,478 | ||||||
Less: Accumulated depreciation and amortization | (277,276 | ) | (251,051 | ) | ||||
Property and equipment, net | $ | 111,367 | $ | 129,427 | ||||
Property and equipment, net, includes $4.9 million and $6.6 million of internally developed software, net of depreciation as of March 31, 2015 and 2014, respectively. Depreciation and amortization expense relating to property and equipment for fiscal 2015, 2014, and 2013 was $52.7 million, $57.6 million, and $59.5 million, respectively. During fiscal 2015 and 2014, the Company reduced the gross cost and accumulated depreciation and amortization by $16.3 million and $17.3 million, respectively, for zero net book value assets deemed no longer in service.
7. ACCOUNTS PAYABLE AND OTHER ACCRUED EXPENSES
Accounts payable and other accrued expenses consisted of the following:
March 31, | ||||||||
2015 | 2014 | |||||||
Vendor payables | $ | 215,995 | $ | 265,079 | ||||
Accrued expenses | 265,820 | 223,728 | ||||||
Total accounts payable and other accrued expenses | $ | 481,815 | $ | 488,807 | ||||
Accrued expenses consisted primarily of the Company’s reserve related to potential cost disallowance in conjunction with government audits. Refer to Note 20 for further discussion of this reserve.
8. ACCRUED COMPENSATION AND BENEFITS
Accrued compensation and benefits consisted of the following:
F-14
March 31, | |||||||
2015 | 2014 | ||||||
Bonus | $ | 82,237 | $ | 75,423 | |||
Retirement | 29,285 | 43,405 | |||||
Vacation | 115,657 | 117,626 | |||||
Stock-based compensation liability (Note 17) | 31,732 | 39,922 | |||||
Deferred Compensation (1) | — | 27,547 | |||||
Other | 20,328 | 27,517 | |||||
Total accrued compensation and benefits | $ | 279,239 | $ | 331,440 | |||
(1) The Company maintained a deferred compensation plan, or EPP, established in January 2009, for the benefit of certain employees. The EPP allowed eligible participants to defer all or a portion of their annual performance bonus, reduced by amounts withheld for the payment of taxes or other deductions required by law. The Company made no contributions to the EPP, but maintained participant accounts for deferred amounts and interest earned. The deferred balance was paid during the three months ended December 31, 2014. The EPP is no longer active as of March 31, 2015.
9. DEFERRED PAYMENT OBLIGATION
Pursuant to an Agreement and Plan of Merger, or the Merger Agreement, dated as of May 15, 2008, and subsequently amended, The Carlyle Group indirectly acquired all of the issued and outstanding stock of the Company. In connection with this transaction, on July 31, 2008 the Company established a Deferred Payment Obligation, or DPO, of $158.0 million, payable 8.5 years after the Closing Date, less any settled claims. Pursuant to the Merger Agreement, $78.0 million of the $158.0 million DPO was required to be paid in full to the selling shareholders. On December 11, 2009, in connection with a recapitalization transaction, $100.4 million was paid to the selling shareholders, of which $78.0 million was the repayment of that portion of the DPO, with approximately $22.4 million representing accrued interest.
The remaining $80.0 million is available to indemnify the Company for certain pre-acquisition tax contingencies, related interest and penalties, and other matters pursuant to the Merger Agreement. Any amounts remaining after the settlement of claims will be paid out to the selling shareholders. As of March 31, 2015 and 2014, the Company has recorded $57.8 million and $56.8 million, respectively, for pre-acquisition uncertain tax positions, of which approximately $20.6 million and $19.6 million, respectively, may be indemnified under the remaining available DPO. During fiscal 2015, the Company accrued additional interest for certain pre-acquisition uncertain tax positions, thereby increasing the estimated amount to be indemnified under the remaining available DPO and decreasing the DPO amount to be paid to the selling shareholders. Offsetting this decrease in the DPO amount is interest accrued at a rate of 5% per six-month period on the unpaid DPO balance, net of any settled claims or payments, which was $80.0 million as of March 31, 2015 and 2014. Accordingly, the $60.7 million and $61.7 million DPO balance recorded as of March 31, 2015 and 2014, respectively, within other long-term liabilities, except the current portion of accrued interest expense which is recorded within short-term liabilities, represents the residual balance estimated to be paid to the selling shareholders based on consideration of contingent tax claims, accrued interest and other matters.
A reconciliation of the principal balance of the DPO to the amount recorded in the consolidated balance sheets for the periods presented are as follows:
March 31, | ||||||||
2015 | 2014 | |||||||
Deferred payment obligation | $ | 80,000 | $ | 80,000 | ||||
Indemnified pre-acquisition uncertain tax positions | (20,586 | ) | (19,556 | ) | ||||
Accrued interest | 1,304 | 1,304 | ||||||
Amount recorded in the consolidated balance sheets | $ | 60,718 | $ | 61,748 | ||||
During fiscal 2015 and 2014 respectively, the Company paid $8.0 million in each year of accrued interest to the selling shareholders.
10. DEBT
Debt consisted of the following:
F-15
March 31, 2015 | March 31, 2014 | ||||||||||||
Interest Rate | Outstanding Balance | Interest Rate | Outstanding Balance | ||||||||||
Term Loan A | 2.68 | % | $ | 796,024 | 2.65 | % | $ | 660,317 | |||||
Term Loan B | 3.75 | % | 830,311 | 3.75 | % | 998,602 | |||||||
Total | 1,626,335 | 1,658,919 | |||||||||||
Less: Current portion of long-term debt | (57,063 | ) | (73,688 | ) | |||||||||
Long-term debt, net of current portion | $ | 1,569,272 | $ | 1,585,231 | |||||||||
On May 7, 2014, the Company entered into the Second Amendment to the Credit Agreement, dated as of July 31, 2012 (as previously amended by the First Amendment to the Credit Agreement, dated as of August 16, 2013). Pursuant to the Second Amendment, the Company increased its borrowing under Term Loan A by approximately $168.4 million, the proceeds of which were used to pay outstanding principal on the Term Loan B. The rates for Term Loan A and Term Loan B, as amended, remain unchanged. The Second Amendment also extended the maturity date of Term Loan A and the revolving credit facility to May 31, 2019. The maturity date for Term Loan B remained unchanged at July 31, 2019. The Company also amended its existing debt covenants to provide for greater operational and financial flexibility.
As of March 31, 2015, the Credit Agreement, as amended, provided the Company with an $830.0 million Term Loan A and an $841.2 million Term Loan B, and a $500.0 million revolving credit facility, with a sublimit for letters of credit of $100.0 million. The outstanding obligations under the Credit Agreement, as amended, are secured by a security interest in substantially all of the assets of the Company, subject to certain exceptions set forth in the Credit Agreement, as amended, and related documentation.
In connection with the Second Amendment, the Company accelerated the amortization of ratable portions of the Debt Issuance Costs, or DIC, and Original Issue Discount, or OID, associated with the prior senior secured loan facilities of $1.2 million. These expenses are reflected in other expense, net in the consolidated statement of operations for fiscal 2015. Furthermore, the Company expensed third party debt issuance costs of $2.0 million that did not qualify for deferral, which are reflected in general and administrative costs in the consolidated statement of operations for fiscal 2015.
We occasionally borrow under our revolving credit facility in anticipation of cash demands. During the fiscal years ended March 31, 2015 and 2014, the Company's wholly-owned subsidiary Booz Allen Hamilton Inc. accessed a total of $80.0 million and $300.0 million, respectively, of its $500.0 million revolving credit facility. As of March 31, 2015 and 2014, no amounts were outstanding on the revolving credit facility.
The Credit Agreement, as amended, requires quarterly principal payments of 1.25% of the stated principal amount of Term Loan A, with annual incremental increases to 1.875%, 2.50%, 3.125%, and 13.0%, prior to Term Loan A's maturity date of May 31, 2019. As a result of paying approximately $168.4 million of Term Loan B principal in connection with the Second Amendment, no additional principal payments are required until the remaining balance is due on Term Loan B's maturity date of July 31, 2019. The revolving credit facility matures on May 31, 2019, at which time any outstanding principal balance is due in full.
The following table summarizes required future debt principal repayments:
Payments Due By March 31, | ||||||||||||||||||||||||||||
Total | 2016 | 2017 | 2018 | 2019 | 2020 | Thereafter | ||||||||||||||||||||||
Term Loan A | $ | 798,875 | $ | 57,063 | $ | 77,813 | $ | 98,562 | $ | 349,637 | $ | 215,800 | $ | — | ||||||||||||||
Term Loan B | 841,188 | — | — | — | — | 841,188 | — | |||||||||||||||||||||
Total | $ | 1,640,063 | $ | 57,063 | $ | 77,813 | $ | 98,562 | $ | 349,637 | $ | 1,056,988 | $ | — | ||||||||||||||
The interest rate on borrowings under Term Loan A is LIBOR plus 2.50% spread. The spread ranges from 2.00% to 2.75% based on the Company's total leverage ratio. The interest rate on borrowings under Term Loan B is LIBOR plus 3.0% spread with a 0.75% floor. The spread ranges from 2.00% to 3.00% based upon either an ABR or LIBOR borrowing. The revolving credit facility margin and commitment fee are subject to the leveraged based pricing grid, as set forth in the Credit Agreement, as amended.
During fiscal 2015, interest payments of $21.0 million and $29.0 million were made for Term Loan A and Term Loan B, respectively. During fiscal 2014, interest payments of $19.0 million and $41.9 million were made for Term Loan A and Term Loan B, respectively.
F-16
The total outstanding debt balance is recorded in the accompanying consolidated balance sheets, net of unamortized discount of $13.7 million and $12.3 million as of March 31, 2015 and 2014, respectively. As of March 31, 2015 and 2014, the Company was in compliance with all of the Credit Agreement's debt covenants.
11. DEFERRED FINANCING COSTS
A reconciliation of the beginning and ending amount of Debt Issuance Costs, or DIC, for the periods presented are as follows:
March 31, | ||||||||
2015 | 2014 | |||||||
Beginning of year | $ | 25,670 | $ | 31,820 | ||||
Amortization | (5,334 | ) | (6,719 | ) | ||||
Accelerated amortization of DIC related to May 2014 Refinancing Transaction and August 2013 Repricing Transaction 1 | (1,131 | ) | (610 | ) | ||||
Additional DIC related to May 2014 Refinancing Transaction and August 2013 Repricing Transaction 2 | 2,035 | 1,179 | ||||||
End of year | $ | 21,240 | $ | 25,670 | ||||
1 Included in "Amortization of debt issuance costs and loss on extinguishment" in the consolidated statement of cash flows.
2 Included in "Debt issuance costs" in the consolidated statement of cash flows.
Costs incurred in connection with the May 7, 2014 Refinancing Transaction were $4.0 million, of which $2.0 million was recorded as other long-term assets and will be amortized and reflected in interest expense in the consolidated statements of operations over the term of the loans. Amortization of these costs will be accelerated to the extent that any prepayment is made on the Credit Agreement. The remaining amount of $2.0 million, which was not deferred, was recorded as general and administrative expenses in the consolidated statements of operations in fiscal 2015.
Costs incurred in connection with the August 16, 2013 Repricing Transaction were $2.8 million, of which $1.2 million was recorded as other long-term assets and will be amortized and reflected in interest expense in the consolidated statements of operations over the term of the loans. Amortization of these costs will be accelerated to the extent that any prepayment is made on the Credit Agreement. The remaining amount of $1.6 million, which was not deferred, was recorded as general and administrative expenses in the consolidated statements of operations in fiscal 2014.
Absent any prepayment accelerations of DIC or the effect of changes in interest rates, the following table summarizes the estimated annual amortization expense of DIC using the effective interest rate method, as a component of interest expense, for the future fiscal periods indicated below:
DIC Amortization Expense | ||||||||||||||||||||||||||||
Total | 2016 | 2017 | 2018 | 2019 | 2020 | Thereafter | ||||||||||||||||||||||
Term Loan A | $ | 6,012 | $ | 1,732 | $ | 1,622 | $ | 1,463 | $ | 1,108 | $ | 87 | $ | — | ||||||||||||||
Term Loan B | 7,501 | 1,611 | 1,678 | 1,752 | 1,830 | 630 | — | |||||||||||||||||||||
Revolver | 7,727 | 1,858 | 1,853 | 1,853 | 1,853 | 310 | — | |||||||||||||||||||||
Total | $ | 21,240 | $ | 5,201 | $ | 5,153 | $ | 5,068 | $ | 4,791 | $ | 1,027 | $ | — | ||||||||||||||
F-17
12. INCOME TAXES
The components of income tax expense were as follows:
Fiscal Year Ended March 31, | ||||||||||||
2015 | 2014 | 2013 | ||||||||||
Current | ||||||||||||
U.S. Federal | $ | 133,400 | $ | 148,908 | $ | 161,838 | ||||||
State and local | 22,492 | 26,062 | 35,503 | |||||||||
Total current | 155,892 | 174,970 | 197,341 | |||||||||
Deferred | ||||||||||||
U.S. Federal | (2,938 | ) | (22,540 | ) | (40,652 | ) | ||||||
State and local | 395 | (3,831 | ) | (7,436 | ) | |||||||
Total deferred | (2,543 | ) | (26,371 | ) | (48,088 | ) | ||||||
Total | $ | 153,349 | $ | 148,599 | $ | 149,253 | ||||||
A reconciliation of the provision for income tax to the amount computed by applying the statutory federal income tax rate to income from continuing operations before income taxes for each of the three years ended March 31 is as follows:
Fiscal Year Ended March 31, | ||||||||||||
2015 | 2014 | 2013 | ||||||||||
Income tax expense computed at U.S. federal statutory rate (35%) | $ | 135,071 | $ | 133,275 | $ | 128,909 | ||||||
Increases (reductions) resulting from: | ||||||||||||
Changes in uncertain tax positions | 1,038 | 1,838 | 1,477 | |||||||||
State income taxes, net of the federal tax benefit | 15,039 | 13,847 | 17,039 | |||||||||
Meals and entertainment | 1,513 | 1,135 | 1,365 | |||||||||
Other | 688 | (1,496 | ) | 463 | ||||||||
Income tax expense from operations | $ | 153,349 | $ | 148,599 | $ | 149,253 | ||||||
Significant components of the Company’s net deferred income tax (liability) asset were as follows:
March 31, | ||||||||
2015 | 2014 | |||||||
Deferred income tax assets: | ||||||||
Accrued expenses | $ | 92,747 | $ | 96,554 | ||||
Accrued compensation | 36,956 | 40,198 | ||||||
Stock-based compensation | 25,537 | 34,532 | ||||||
Pension and postretirement insurance | 44,030 | 31,776 | ||||||
Property and equipment | 14,035 | 7,753 | ||||||
Net operating loss & Capital loss carryforwards | 263 | 532 | ||||||
Deferred rent and tenant allowance | 13,700 | 11,256 | ||||||
Other | 7,777 | 6,974 | ||||||
Total gross deferred income tax assets | 235,045 | 229,575 | ||||||
Less: Valuation allowance | — | — | ||||||
Total net deferred income tax assets | 235,045 | 229,575 | ||||||
Deferred income tax liabilities: | ||||||||
Accrued compensation-IRC Section 481(a) | (10,039 | ) | (20,086 | ) | ||||
Unbilled receivables | (104,017 | ) | (98,129 | ) | ||||
Intangible assets | (81,486 | ) | (80,054 | ) | ||||
Debt issuance costs | (4,395 | ) | (6,650 | ) | ||||
Other | (5,811 | ) | (3,200 | ) | ||||
Total deferred income tax liabilities | (205,748 | ) | (208,119 | ) | ||||
Net deferred income tax asset | $ | 29,297 | $ | 21,456 | ||||
F-18
Deferred tax balances arise from temporary differences between the carrying amount of assets and liabilities and their tax basis and are stated at the enacted tax rates in effect for the year in which the differences are expected to reverse. A valuation allowance is provided against deferred tax assets when it is more likely than not that some or all of the deferred tax asset will not be realized. In determining if the Company's deferred tax assets are realizable, management considers all positive and negative evidence, including the history of generating book earnings, future reversals of existing taxable temporary differences, projected future taxable income, as well as any tax planning strategies. The Company believes it is more likely than not that the results of future operations will generate sufficient taxable income to realize the net deferred tax assets.
As of March 31, 2015, the Company has a minimal amount of State net operating loss, or NOL, carryforwards. The State NOL carryforwards expire in 2028. The Company believes that it is more likely than not that the Company will generate sufficient taxable income to fully realize the tax benefit of the State NOL carryforwards.
Uncertain Tax Positions
The Company maintains reserves for uncertain tax positions related to income tax benefits recognized. These reserves involve considerable judgment and estimation and are evaluated by management based on the best information available including changes in tax laws and other information. As of March 31, 2015, 2014, and 2013 the Company has recorded $58.4 million, $57.4 million, and $57.0 million respectively, of reserves for uncertain tax positions which includes potential tax benefits of $55.2 million, $55.0 million, and $55.7 million respectively, that, if recognized, would impact the effective tax rate. Of the $58.4 million, $57.4 million, and $57.0 million of reserves for uncertain tax positions as of March 31, 2015, 2014, and 2013 respectively, approximately $20.6 million , $19.6 million, and $18.5 million respectively, may be indemnified under the remaining available DPO.
A reconciliation of the beginning and ending amount of potential tax benefits for the periods presented is as follows:
March 31, | ||||||||||||
2015 | 2014 | 2013 | ||||||||||
Beginning of year | $ | 54,966 | $ | 55,679 | $ | 54,895 | ||||||
Federal benefit from change in reserve | — | — | — | |||||||||
Increases in prior year position | 27 | 364 | 1,074 | |||||||||
Increases in current year position | 203 | — | — | |||||||||
Settlements with taxing authorities | (32 | ) | (1,074 | ) | (11 | ) | ||||||
Lapse of statute of limitations | — | (3 | ) | (279 | ) | |||||||
End of year | $ | 55,164 | $ | 54,966 | $ | 55,679 | ||||||
The Company recognized accrued interest and penalties of approximately $840,000, $1.1 million and $952,000 for fiscal 2015, 2014, and 2013, respectively, related to the reserves for uncertain tax positions in the income tax provision. Included in the total reserve for uncertain tax positions are accrued penalties and interest of approximately $3.3 million, $2.4 million and $1.3 million at March 31, 2015, 2014, and 2013 respectively.
The Company did not have any material settlements or lapse of statute of limitations during fiscal year 2015. The Company is subject to taxation in the United States and various state and foreign jurisdictions. As of March 31, 2015, the Company's tax years ended July 31, 2008 and forward are open and subject to examination by the tax authorities. The jurisdictions currently under examination are not considered to be material. It is reasonably possible that during
the next twelve months the Company’s liability for uncertain tax positions, mostly relating to prior period restructurings, may be reduced significantly (approximately $57.9 million including interest and penalties) primarily due to the lapse in statute limitations.
13. EMPLOYEE BENEFIT PLANS
Defined Contribution Plan
The Company sponsors the Employees’ Capital Accumulation Plan, or ECAP, which is a qualified defined contribution plan that covers eligible U.S. and international employees. ECAP provides for distributions, subject to certain vesting provisions, to participants by reason of retirement, death, disability, or termination of employment. Effective April 1, 2014, the Company transitioned from a discretionary employer contribution to an annual matching contribution of up to 6% of eligible annual income as determined by the Internal Revenue Code for the ECAP. Total expense recognized under ECAP for fiscal 2015, 2014, and 2013 was $110.7 million, $165.6 million, and $237.1 million, respectively, and the Company-paid contributions were $124.8 million, $205.2 million, and $242.6 million, respectively.
F-19
Defined Benefit Plan and Other Postretirement Benefit Plans
The Company maintains and administers a postretirement medical plan and a defined benefit retirement plan for current, retired, and resigned officers.
The Company established a non-qualified defined benefit plan for all Officers in May 1995, or the Retired Officers' Bonus Plan, which pays a lump-sum amount of $10,000 per year of service as an Officer, provided the Officer meets retirement vesting requirements. The Company also provides a fixed annual allowance after retirement to cover financial counseling and other expenses. The Retired Officers' Bonus Plan is not salary related, but rather is based primarily on years of service.
In addition, the Company provides postretirement healthcare benefits to former Officers under a medical indemnity insurance plan, with premiums paid by the Company. This plan is referred to as the Officer Medical Plan.
The Company recognizes a liability for the defined benefit plans' underfunded status, measures the defined benefit plans' obligations that determine its funded status as of the end of the fiscal year, and recognizes as a component of accumulated other comprehensive income the changes in the defined benefit plans' funded status that are not recognized as components of net periodic benefit cost.
As of March 31, 2015, the Company adopted new mortality tables published by the Society of Actuaries, which reflects improved life expectancies and projected mortality improvements. The result was an increase to the benefit obligation of our defined benefit plans of $9.6 million. Our defined benefit plans' benefit obligation increased by an additional $8.9 million as a result of the decrease in the discount rate assumption by 50 basis points.
The components of net postretirement medical expense for the Officer Medical Plan were as follows:
Fiscal Year Ended March 31, | ||||||||||||
2015 | 2014 | 2013 | ||||||||||
Service cost | $ | 4,086 | $ | 4,745 | $ | 3,892 | ||||||
Interest cost | 3,568 | 3,660 | 3,147 | |||||||||
Net actuarial loss | 582 | 2,728 | 1,537 | |||||||||
Total postretirement medical expense | $ | 8,236 | $ | 11,133 | $ | 8,576 | ||||||
The weighted-average discount rate used to determine the year-end benefit obligations was as follows:
Fiscal Year Ended March 31, | |||||||||
2015 | 2014 | 2013 | |||||||
Officer Medical Plan | 4.25 | % | 4.75 | % | 4.75 | % | |||
Retired Officers’ Bonus Plan | 4.25 | % | 4.75 | % | 4.75 | % | |||
Assumed healthcare cost trend rates for the Officer Medical Plan at March 31, 2015 and 2014 were as follows:
Pre-65 initial rate | 2015 | 2014 | ||||
Healthcare cost trend rate assumed for next year | 7.00 | % | 7.25 | % | ||
Rate to which the cost trend rate is assumed to decline (the ultimate trend rate) | 5.00 | % | 5.00 | % | ||
Year that the rate reaches the ultimate trend rate | 2023 | 2023 | ||||
Post-65 initial rate | 2015 | 2014 | ||||
Healthcare cost trend rate assumed for next year | 6.75 | % | 7.00 | % | ||
Rate to which the cost trend rate is assumed to decline (the ultimate trend rate) | 5.00 | % | 5.00 | % | ||
Year that the rate reaches the ultimate trend rate | 2023 | 2022 | ||||
Assumed healthcare cost trend rates have a significant effect on the amounts reported for the healthcare plans. A one-percentage-point change in assumed healthcare cost trend rates calculated as of March 31, 2015 would have the following effects:
1% Increase | 1% Decrease | |||||||
Effect on total of service and interest cost | $ | 1,497 | $ | (1,188 | ) | |||
Effect on postretirement benefit obligation | 19,964 | (15,774 | ) | |||||
F-20
Total defined benefit plan expense, consisting of service, interest, and net actuarial gain associated with the Retired Officers' Bonus Plan was $686,000, $768,000, and $743,000 for fiscal 2015, 2014, and 2013, respectively. Benefits paid associated with the Retired Officers’ Bonus Plan were $1.3 million, $1.1 million, and $361,000 for fiscal 2015, 2014, and 2013, respectively. The end-of-period benefit obligation of $4.3 million and $4.7 million as of March 31, 2015 and 2014, respectively, is included in postretirement obligations within other long-term liabilities in the accompanying consolidated balance sheets.
Accumulated other comprehensive loss as of March 31, 2015 includes unrecognized gross actuarial loss of $25.6 million, reduced by taxes of $10.1 million, that has not yet been recognized in net periodic pension cost for the Retired Officers’ Bonus Plan and the Officer Medical Plan. Accumulated other comprehensive loss as of March 31, 2014, includes unrecognized net actuarial gain of $6.7 million, net of taxes of $4.4 million, that has not yet been recognized in net periodic pension cost for the Retired Officers’ Bonus Plan and the Officer Medical Plan.
The amounts in accumulated other comprehensive income expected to be recognized as components of net periodic cost in fiscal 2016 are $3.5 million of net actuarial (gain) loss, $0 of net prior service cost (credit), and $0 of net transition (asset) obligation.
The changes in the benefit obligation, plan assets, and funded status of the Officer Medical Plan were as follows:
Fiscal Year Ended March 31, | ||||||||||||
2015 | 2014 | 2013 | ||||||||||
Benefit obligation, beginning of the year | $ | 75,902 | $ | 78,735 | $ | 63,585 | ||||||
Service cost | 4,086 | 4,745 | 3,892 | |||||||||
Interest cost | 3,568 | 3,660 | 3,147 | |||||||||
Net actuarial (gain) loss | 26,293 | (9,436 | ) | 9,891 | ||||||||
Benefits paid | (2,532 | ) | (1,802 | ) | (1,780 | ) | ||||||
Benefit obligation, end of the year | $ | 107,317 | $ | 75,902 | $ | 78,735 | ||||||
Changes in plan assets | ||||||||||||
Fair value of plan assets, beginning of the year | $ | — | $ | — | $ | — | ||||||
Employer contributions | 2,532 | 1,802 | 1,780 | |||||||||
Benefits paid | (2,532 | ) | (1,802 | ) | (1,780 | ) | ||||||
Fair value of plan assets, end of the year | $ | — | $ | — | $ | — | ||||||
As of March 31, 2015 and 2014, the unfunded status of the Officer Medical Plan was $107.3 million and $75.9 million, respectively, which is included in other long-term liabilities in the accompanying consolidated balance sheets.
Funded Status for Defined Benefit Plans
Generally, annual contributions are made at such times and in amounts as required by law and may, from time to time, exceed minimum funding requirements. The Retired Officers’ Bonus Plan is an unfunded plan and contributions are made as benefits are paid. As of March 31, 2015 and 2014, there were no plan assets for the Retired Officers’ Bonus Plan and therefore, the accumulated liability of $4.3 million and $4.7 million, respectively, is unfunded. The liability will be distributed in a lump-sum payment as each Officer retires.
The expected future medical benefit payments and related contributions are as follows:
For the Fiscal Year Ending March 31, | ||
2016 | 2,672 | |
2017 | 3,030 | |
2018 | 3,368 | |
2019 | 4,027 | |
2020 | 4,454 | |
2021-2024 | 27,292 | |
F-21
14. ACCUMULATED OTHER COMPREHENSIVE LOSS
All amounts recorded in other comprehensive loss are related to the Company's post-retirement plan. The following table represents a rollforward of amounts recognized in accumulated other comprehensive loss, net of tax:
March 31, | |||||||||||
2015 | 2014 | 2013 | |||||||||
Beginning of year | $ | (6,636 | ) | $ | (13,787 | ) | $ | (8,715 | ) | ||
Other comprehensive income (loss) before reclassifications | (15,873 | ) | 5,499 | (5,996 | ) | ||||||
Amounts reclassified from accumulated other comprehensive loss | 350 | 1,652 | 924 | ||||||||
Net current-period other comprehensive income (loss) | (15,523 | ) | 7,151 | (5,072 | ) | ||||||
End of year | $ | (22,159 | ) | $ | (6,636 | ) | $ | (13,787 | ) | ||
The following table presents the reclassifications out of accumulated other comprehensive loss to net income:
March 31, | |||||||||||
2015 | 2014 | 2013 | |||||||||
Amortization of net actuarial loss included in net periodic benefit cost (See Note 13) | |||||||||||
Total before tax | $ | 577 | $ | 2,728 | $ | 1,524 | |||||
Tax benefit | (227 | ) | (1,076 | ) | (600 | ) | |||||
Net of tax | $ | 350 | $ | 1,652 | $ | 924 | |||||
15. OTHER LONG-TERM LIABILITIES
Other long-term liabilities consisted of the following:
March 31, | ||||||||
2015 | 2014 | |||||||
Deferred rent | $ | 34,732 | $ | 28,527 | ||||
Stock-based compensation liability (Note 17) | — | 25,966 | ||||||
Deferred payment obligation | 59,414 | 60,444 | ||||||
Postretirement benefit obligation | 111,624 | 80,527 | ||||||
Other (1) | 8,515 | 5,746 | ||||||
Total other long-term liabilities | $ | 214,285 | $ | 201,210 | ||||
(1) Balance at March 31, 2015 includes a contingent earnout liability of $4.5 million related to business acquisitions. Refer to Note 18 for further discussion.
In fiscal 2015 and 2014, the Company recorded a stock-based compensation liability of $31.7 million and $65.9 million, respectively, including $31.7 million and $39.9 million, respectively, expected to be paid within one year, related to special dividends paid in July and December 2009, June and August 2012, November 2013, and February and August 2014. Rollover options vested and not yet exercised that would have had an exercise price below zero as a result of the dividend were reduced to one cent, with the remaining reduction to be paid in cash upon exercise of the options. Payments of the special dividends to the Company's Amended and Restated Equity Incentive Plan, or EIP, option holders is linked to vesting. Refer to Note 17 for further discussion of the special dividends.
16. STOCKHOLDERS’ EQUITY
Common Stock
Holders of Class A Common Stock, Class C Restricted Common Stock, and Class E Special Voting Common Stock are entitled to one vote for each share as a holder. The holders of the Voting Common Stock shall vote together as a single class. The holders of Class B Non-Voting Common Stock have no voting rights.
F-22
Class C Restricted Common Stock was restricted in that a holder’s shares vested as set forth in the Rollover Plan. Refer to Note 17 for further discussion of the Rollover Plan.
When shares of Class B Non-Voting Common Stock or Class C Restricted Common Stock are sold on the open market, they become Class A Common Stock shares. At the annual meeting of stockholders held on July 31, 2014, the stockholders approved a proposal to amend and restate the certificate of incorporation, which had the effect of converting all issued and outstanding shares of Class B Non-Voting Common Stock and Class C Restricted Common Stock into shares of Class A Common Stock on a one-for-one basis. The conversion was effected on August 13, 2014 when the Company filed its third amended and restated certificate of incorporation with the Secretary of State of the State of Delaware. As a result of the conversion, there were no shares of Class B Non-Voting Common Stock and Class C Restricted Common Stock outstanding at such time.
Class E Special Voting Common Stock represents the voting rights that accompany the Rollover Options. Rollover Options have a fixed vesting and exercise schedule to comply with IRS section 409A. Upon exercise, the option will convert to Class A Common Stock, and the corresponding Class E Special Voting Common Stock will be repurchased by the Company and retired. Refer to Note 17 for further discussion of the Rollover Options.
Each share of common stock, except for Class E Special Voting Common Stock, is entitled to participate equally in dividends, when and if declared by the Board of Directors from time to time, such dividends and other distributions in cash, stock, or property from the Company’s assets or funds become legally available for such purposes subject to any dividend preferences that may be attributable to preferred stock that may be authorized. The Company’s ability to pay dividends to stockholders is limited as a practical matter by restrictions in the credit agreements governing the Senior Credit Facilities.
The authorized and unissued Class A Common Stock shares are available for future issuance upon share option exercises, without additional stockholder approval.
Employee Stock Purchase Plan
In connection with the Company’s initial public offering in November 2010, the Company established a tax qualified Employee Stock Purchase Plan, or ESPP, which is designed to enable eligible employees to periodically purchase shares of the Company’s Class A Common Stock up to an aggregate of 10,000,000 shares at a five percent discount from the fair market value of the Company’s common stock. The ESPP provides for quarterly offering periods, the first of which commenced on April 1, 2011. For the year ended March 31, 2015, 213,825 Class A Common Stock shares were purchased by employees under the ESPP. As of the program's inception, 1,508,895 shares have been purchased by employees.
Share Repurchase Program
On December 12, 2011, the Board of Directors approved a $30.0 million share repurchase program, to be funded from cash on hand. A special committee of the Board of Directors was appointed to evaluate market conditions and other relevant factors and initiate repurchases under the program from time to time. On January 27, 2015, the Board of Directors approved an increase to the share repurchase authorization to $180.0 million. The share repurchase program may be suspended, modified or discontinued at any time at the Company’s discretion without prior notice. On November 5, 2014, the Company entered into an agreement with an affiliate of The Carlyle Group to repurchase 1,000,000 shares of our Class A common stock pursuant to the repurchase program. The shares were repurchased at a price of $25.10 per share as part of a private non-underwritten transaction. On February 2, 2015, the Company entered into a similar agreement with an affiliate of the Carlyle Group to repurchase an additional 1,000,000 shares of our Class A common stock pursuant to the repurchase program. The shares were repurchased from the Underwriter at a price of $28.36 per share. As of March 31, 2015, the Company has $126.5 million remaining under the repurchase program.
Dividends
The following table summarizes the cash distributions recognized in the consolidated statement of cash flows:
Fiscal Year Ended March 31, | ||||||||||||
2015 | 2014 | 2013 | ||||||||||
Recurring dividends (1) | $ | 67,846 | $ | 57,063 | $ | 48,736 | ||||||
Special dividends (2) | 147,248 | 288,739 | 1,073,733 | |||||||||
Dividend equivalents (3) | 47,110 | 56,138 | 59,471 | |||||||||
Total distributions | $ | 262,204 | $ | 401,940 | $ | 1,181,940 | ||||||
F-23
(1) Amounts represent recurring quarterly dividends that were declared and paid for during each quarter of fiscal 2015, fiscal 2014, and fiscal 2013.
(2) Amounts represent aggregate special dividends of $1.00 per share ($1.00 paid on August 29, 2014), $2.00 per share ($1.00 paid November 29, 2013 and $1.00 paid February 28, 2014) and $8.00 per share ($1.50 paid June 29, 2012 and $6.50 paid August 31, 2012) that were declared and paid for during fiscal 2015, fiscal 2014, and fiscal 2013, respectively.
(3) Dividend equivalents are distributions made to option holders equal to the special dividends declared and paid.
On May 21, 2015, the Company announced a regular quarterly cash dividend in the amount of $0.13 per share. The quarterly dividend is payable on June 30, 2015 to stockholders of record on June 10, 2015.
For each special dividend authorized and declared, the Board of Directors, acting as the Administrator of the Officers' Rollover Stock Plan and the Equity Incentive Plan (EIP), as amended, is required to make a determination under the respective plan's antidilution provision to adjust the outstanding options. Refer to Note 17 for further discussion of the special dividends.
The total payout of the dividend and the dividend equivalents have been presented as a financing activity within the consolidated statement of cash flows.
17. STOCK-BASED COMPENSATION
The following table summarizes stock-based compensation expense recognized in the consolidated statements of operations:
Fiscal Year Ended March 31, | |||||||||||
2015 | 2014 | 2013 | |||||||||
Cost of revenue | $ | 8,652 | $ | 5,672 | $ | 7,061 | |||||
General and administrative expenses | 17,511 | 14,393 | 17,780 | ||||||||
Total | $ | 26,163 | $ | 20,065 | $ | 24,841 | |||||
The following table summarizes the total stock-based compensation expense recognized in the consolidated statements of operations by the following types of equity awards:
Fiscal Year Ended March 31, | |||||||||||
2015 | 2014 | 2013 | |||||||||
Equity Incentive Plan Options | $ | 4,897 | $ | 7,257 | $ | 13,148 | |||||
Class A Restricted Common Stock | 21,266 | 12,171 | 8,412 | ||||||||
Rollover Options | — | 578 | 2,970 | ||||||||
Class C Restricted Stock | — | 59 | 311 | ||||||||
Total | $ | 26,163 | $ | 20,065 | $ | 24,841 | |||||
As of March 31, 2015 and 2014, there was $27.9 million and $16.4 million of total unrecognized compensation cost related to unvested stock-based compensation agreements. The unrecognized compensation cost as of March 31, 2015 is expected to be fully amortized over the next four years. Absent the effect of accelerating stock compensation cost for any departures of employees who may continue to vest in their equity awards, the following tables summarize the unrecognized compensation cost, the weighted average period the cost is expected to be amortized, and the estimated annual compensation cost for the future periods indicated below (excludes any future awards):
Unrecognized Compensation Cost | Weighted Average Remaining Period to be Recognized | |||||||||||
March 31, 2015 | March 31, 2014 | March 31, 2015 | March 31, 2014 | |||||||||
Equity Incentive Plan Options | $ | 4,475 | $ | 8,249 | 2.83 | 3.10 | ||||||
Class A Restricted Common Stock | 23,418 | 8,157 | 2.71 | 2.02 | ||||||||
Total | $ | 27,893 | $ | 16,406 | ||||||||
F-24
Total Unrecognized Compensation Cost | ||||||||||||||||||||
Total | 2016 | 2017 | 2018 | 2019 | ||||||||||||||||
Equity Incentive Plan Options | $ | 4,475 | $ | 2,639 | $ | 1,233 | $ | 480 | $ | 123 | ||||||||||
Class A Restricted Common Stock | 23,418 | 14,320 | 6,649 | 2,383 | 66 | |||||||||||||||
Total | $ | 27,893 | $ | 16,959 | $ | 7,882 | $ | 2,863 | $ | 189 | ||||||||||
Equity Incentive Plan
The Equity Incentive Plan, or EIP, was created in connection with the Merger Agreement for employees and directors of Holding. The Company created a pool of options, or EIP Options, to draw upon for future grants that would be governed by the EIP. All options under the EIP are exercisable, upon vesting, for shares of common stock of Holding.
Stock options are granted at the discretion of the Board of Directors or its Compensation Committee and expire ten years from the grant date. Options generally vest over a five-year period based upon required service and performance conditions. Starting on February 1, 2012, the Board of Directors or its Compensation Committee updated vesting conditions for stock options, whereby stock options only vest upon a required service condition. The Company calculates the pool of additional paid-in capital associated with excess tax benefits using the “simplified method.”
In addition to options, the Board of Directors also grants restricted stock awards to members of the Board as compensation for services rendered to the Company. These awards generally vest over one year.
During fiscal 2015, the Company issued two equity awards in the form of restricted stock to certain senior executives and newly hired officers of the Company. These awards will vest over a four-year period.
The aggregate grant date fair value of the EIP Options issued during fiscal 2015, 2014, and 2013, was $1.7 million, $4.9 million, and $4.2 million, respectively, and is being recorded as expense over the vesting period. The total fair value of EIP Options vested during fiscal 2015 and 2014 was $14.0 million and $17.5 million, respectively. The total intrinsic value of EIP options exercised during fiscal 2015 and 2014 was $15.0 million and $31.8 million, respectively. As of March 31, 2015 and 2014, there were 12,753,436 and 9,197,629 options, respectively, available for future grant under the EIP.
Adoption of Annual Incentive Plan
On October 1, 2010, the Board of Directors adopted a new compensation plan in connection with the initial public offering to more appropriately align the Company’s compensation programs with those of similarly situated companies. The amount of the annual incentive payment will be determined based on performance targets established by the Board of Directors and a portion of the bonus may be paid in the form of equity (including stock and other awards under the EIP). If the Board of Directors elects to make payments in equity, the value of the overall award will be increased by 20%, related to the portion paid in equity. Equity awards vest based on the passage of time, subject to the officer’s continued employment by the Company. The portion to be paid in the form of equity will be recognized in the accompanying consolidated statements of operations based on grant date fair value over the vesting period of three years. The portion to be paid in cash is accrued ratably during the fiscal year in which the employees provide service and paid out during the first quarter of the subsequent fiscal year.
Grants of Class A Restricted Common Stock and Restricted Stock Units
On May 2, 2014, the Board of Directors granted 896,060 shares of Class A Restricted Stock to certain senior executives. The aggregate value of this award was estimated at $21.0 million based on the stock price of $23.45 on the grant date. This award will vest over a four year period subject to the executives' continued employment with the Company.
On June 23, 2014, the Board of Directors granted 196,095 shares of Class A Restricted Stock to certain newly hired partners. The aggregate value was estimated at $4.2 million based on the stock price of $21.57 on the grant date. This award will vest over four years based upon required service and performance conditions.
On July 1, 2014 the Board of Directors granted 465,886 Restricted Stock Units in conjunction with the Annual Incentive Plan adopted on October 1, 2010, or Annual Incentive Plan. The amount of the annual incentive payment was determined based on performance targets established by the Compensation Committee and a portion of the incentive payment awarded under the Annual Incentive Plan was paid in the form of Restricted Stock Units. A Restricted Stock Unit represents a contingent right to receive one share of Class A Common Stock upon vesting. The Restricted Stock Units will vest based on the passage of time, subject to the participant’s continued employment with the Company. The aggregate value was estimated at $10.1 million based on the stock price of $21.57 on the grant date.
On July 1, 2014, the Board of Directors granted the Chief Executive Officer 23,282 shares of Class A Restricted Stock. The amount of the annual incentive payment was determined based on performance targets established by the Compensation
F-25
Committee and a portion of the bonus awarded under the Annual Incentive Plan to the Chief Executive Officer was paid in the form of Class A Restricted Stock. The aggregate value of this award was estimated at $0.5 million based on the stock price of $21.57 on the grant date.
On August 8, 2014, the Board of Directors granted 26,915 shares of Class A Restricted Stock to certain members of the Board of Directors. The aggregate value of this award was estimated at $0.6 million based on the stock price of $21.18 on the grant date.
On September 2, 2014, the Board of Directors granted 7,238 shares of Class A Restricted Stock to a new member of the Board of Directors. The aggregate value was estimated at $0.2 million based on the stock price of $22.69 on the grant date.
On February 5, 2015, the Board of Directors granted 1,593 shares of Class A Restricted Stock to a member of the Board of Directors. The aggregate value of this award was estimated at $0.05 million based on the stock price of $29.17 on the grant date.
The total fair value of restricted stock shares vested during fiscal 2015 and 2014 was $15.0 million and $8.7 million, respectively.
Officers’ Rollover Stock Plan
The Rollover Plan was adopted as a mechanism to enable Company Officers to exchange a portion of their previous equity interests in the pre-acquisition Company for equity interests in the Company. Among the equity interests that were eligible for exchange were common stock and stock rights, both vested and unvested.
Unvested stock rights that would have vested in 2008 were exchanged for 2,028,270 shares of new Class C Restricted Stock issued by the Company at an estimated fair value of $10.00 on August 1, 2008. The aggregate grant date fair value of the Class C Restricted Stock issued of $20.3 million was recorded as expense over the vesting period. For the fiscal year ended March 31, 2014, 136,200 cumulative shares of Class C Restricted Stock vested. As of March 31, 2015 all shares of class C Restricted Stock were fully vested. At March 31, 2015 and 2014, 3,971,730 shares of Class C Restricted Stock were authorized but unissued under the Plan. Notwithstanding the foregoing, Class C Restricted Stock was intended to be issued only in connection with the exchange process described above.
In addition to the conversion of the stock rights that would have vested in 2008 to Class C Restricted Stock, Options were issued in exchange for old stock rights held by the U.S. government consulting partners of the pre-acquisition Company. The Rollover Options were granted based on the retirement eligibility of the Officer. For the purposes of these options, there were two categories of Officers - retirement eligible and non-retirement eligible. Those individuals who were considered retirement eligible also were given the opportunity to make a one-time election to be treated as non-retirement eligible. The determination of retirement eligibility was made as of a set point in time and could not be changed at a future date. The aggregate grant date fair value of the Rollover Options issued of $127.1 million was recorded as compensation expense over the vesting period. Rollover Options granted to retirement eligible Officers had different vesting and exercise schedules than those granted to non-retirement eligible Officers. The total grant date fair value of Rollover Options vested during fiscal 2014 was $16.2 million. The Rollover Options were fully vested as of March 31, 2015. Rollover Options granted to retirement-eligible Officers were fully exercised as of March 31, 2015. Rollover Options granted to non-retirement eligible Officers are scheduled to be fully exercised in fiscal 2016.
As permitted under the terms of the EIP and Rollover Plans, the Compensation Committee as Administrator of the Plans, authorized the withholding of taxes not to exceed the minimum statutory withholding amount, through the surrender of shares of Class A common stock issuable upon the exercise of Rollover Options and the vesting or accelerated vesting of Restricted Stock. For those holders who elected to participate, the trade dates were as listed in the table below. As a result of these transactions, the Company repurchased a total of 388,824 shares and recorded them as treasury shares at a cost of $8.6 million, detailed as follows:
Total Shares Withheld to Cover Taxes | |||||
Trade Date | Shares | Cost | Total | ||
April 1, 2014 | 2,111 | $22.32 | $ | 47,118 | |
May 21, 2014 | 3,266 | $22.17 | 72,407 | ||
June 30, 2014 | 212,445 | $21.24 | 4,512,332 | ||
September 12, 2014 | 159,179 | $22.85 | 3,637,240 | ||
March 1, 2015 | 943 | $29.76 | 28,064 | ||
March 31, 2015 | 10,880 | $28.94 | 314,867 | ||
Total | 388,824 | $ | 8,612,028 | ||
F-26
Methodology
The Company uses the Black-Scholes option-pricing model to determine the estimated fair value for stock-based awards. The fair value of the Company’s stock is based on the closing price on the New York Stock Exchange.
During fiscal year 2015, the Company’s Board of Directors authorized and declared three regular quarterly cash dividends of $0.11 per share and one quarterly cash dividend of $0.13 per share. Therefore, an annualized dividend yield between 1.66% and 2.04% was used in the Black-Scholes option-pricing model for all grants issued during the fiscal year. The Company has excluded any special dividends from the annualized dividend yield because of their classification as special dividends and their non-recurring nature. The Company plans to continue paying recurring dividends in the near term and assessing its excess cash resources to determine the best way to utilize its excess cash flow in order to meet its objectives. One way the Company may utilize excess cash includes the payment of special dividends. The Company does not anticipate or forecast the payment of special dividends and therefore does not include special dividends in the annual dividend yield which the company uses to calculate the fair value of stock options, as the Company does not pay these special dividends on a regular basis.
Implied volatility is calculated as of each grant date based on our historical volatility along with an assessment of the historical volatility of a peer group of publicly traded companies. Other than the expected life of the option, volatility is the most sensitive input to our option grants. To be consistent with all other implied calculations, the same peer group used to calculate other implied metrics is also used to calculate implied volatility.
The risk-free interest rate is determined by reference to the U.S. Treasury yield curve rates with the remaining term equal to the expected life assumed at the date of grant. The average expected life is calculated based on the Company's historical experience with respect to its stock plan activity in combination with an estimate of when vested and unexercised option shares will be exercised. Forfeitures were estimated based on the Company’s historical analysis of Officer and Vice-President attrition levels and actual forfeiture rates by grant date.
The weighted average assumptions used in the Black-Scholes option-pricing model for stock option awards were as follows:
For The Fiscal Year Ended March 31, | ||||||
2015 | 2014 | 2013 | ||||
Dividend yield | 1.9% | 2.19% | 2.07% | |||
Expected volatility | 30.42% | 30.97% | 33.12% | |||
Risk-free interest rate | 1.60% | 1.36% | 1.44% | |||
Expected life (in years) | 5.00 | 6.64 | 7.00 | |||
Weighted-average grant date fair value | $5.55 | $4.59 | $4.69 | |||
Special Dividends
The Board of Directors, acting as the Administrator of the Officers' Rollover Stock Plan and the Equity Incentive Plan (EIP), as amended have discretion in how to effect the required adjustment to keep option holders whole in the event of a distribution of dividends that trigger certain anti-dilution clauses within the respective plans. In the event the Board of Directors elects to grant option holders a cash payment equal to the amount of the special dividend, the Company accrues a stock-based compensation liability as the EIP options are scheduled to be vested. Rollover Options are fully vested, therefore the liability associated with these options is fully recorded on the consolidated balance sheet. The obligation will be settled on the options' mandatory exercise date for Rollover Options and on the later of the date the dividend is paid or vesting for the EIP options. The stock-based compensation liability includes all special dividends declared.
On October 29, 2013, the Board of Directors authorized and declared a special cash dividend of $1.00 per share. The dividend was paid on November 29, 2013 to stockholders of record on November 11, 2013. On January 31, 2014, the Board of Directors authorized and declared a special cash dividend of $1.00 per share. The dividend was paid on February 28, 2014 to stockholders of record on February 10, 2014. On July 30, 2014, the Board of Directors authorized and declared a special cash dividend of $1.00 per share. The dividend was paid on August 29, 2014 to stockholders of record on August 11, 2014. For each special dividend declared, the Board of Directors, acting as the Administrator of the Officers' Rollover Stock Plan and the EIP, made a determination to adjust outstanding Rollover and EIP options for the special dividend to prevent the dilution of the benefit or potential benefit of the options. The adjustment was in the form of a $1.00 dividend equivalent. Holders of the Rollover options will receive a cash payment equal to the amount of the special dividend on the exercise of the option during the options' mandatory exercise period. Holders of EIP options will receive a cash payment equal to the amount of the special dividend payable on the later of the date the dividend was paid or the vesting of the EIP option, whichever is later.
On June 30, 2014 vested EIP option holders received a payment of $4.4 million, related to the special dividends declared
F-27
in fiscal years 2013 and 2014. On August 29, 2014 vested outstanding EIP option holders received a dividend equivalent payment of $4.5 million related to the special dividend declared in fiscal year 2015. On September 30, 2014, Rollover Options holders received a dividend equivalent payment of $37.8 million related to special dividends declared in fiscal years 2010, 2013, 2014, and 2015. On March 31, 2015, vested EIP option holders received a payment of $0.1 million, related to the special dividends declared in fiscal years 2013, 2014, and 2015.
Payment of the dividend equivalents were accounted for as modifications resulting in incremental benefit to the option holders resulting in additional compensation expense of $0.6 million. Total compensation expense recorded in conjunction with the payment of all dividend equivalent to holders of unvested EIP options for the fiscal year ended March 31, 2015 was $1.0 million. Future compensation cost related to payment of the dividend equivalents to holders of EIP options not yet recognized in the statement of operations is $0.5 million and is expected to be recognized over 2.25 years.
As of March 31, 2015 and 2014, the Company calculated a total recorded and unrecorded stock-based compensation liability of $35.8 million and $73.1 million, respectively, related to the special dividends paid in July and December 2009, June and August 2012, November 2013, and February and August 2014, as follows:
March 31, 2015 | March 31, 2014 | ||||||||||||||||||||||
EIP Options | Rollover Options | Total | EIP Options | Rollover Options | Total | ||||||||||||||||||
Current portion of liability1 | $ | 3,697 | $ | 28,035 | $ | 31,732 | $ | 3,675 | $ | 36,247 | $ | 39,922 | |||||||||||
Long-term portion of liability2 | — | — | — | — | 25,966 | 25,966 | |||||||||||||||||
$ | 3,697 | $ | 28,035 | $ | 31,732 | $ | 3,675 | $ | 62,213 | $ | 65,888 | ||||||||||||
1 Included in accrued compensation and benefits (Note 8).
2 Included in other long-term liabilities.
As of March 31, 2015, $4.1 million related to EIP Options will be recorded as liabilities as the options vest over the next four years. As of March 31, 2014, there was an unrecorded liability of $7.2 million related to EIP options. There is no unrecorded liability related to Rollover options as of March 31, 2015 or 2014, as the Rollover options are fully vested.
The following table summarizes unvested restricted stock activity for the periods presented:
Number of Shares | Weighted Average Grant Date Fair Value | |||||
Unvested Restricted Stock Awards | ||||||
Unvested at March 31, 2014 | 1,296,013 | 17.06 | ||||
Granted | 1,617,069 | 22.62 | ||||
Vested | 693,228 | 17.34 | ||||
Forfeited | 1,839 | 21.57 | ||||
Unvested at March 31, 2015 | 2,218,015 | 21.02 | ||||
F-28
The following table summarizes stock option activity for the periods presented:
Number of Options | Weighted Average Exercise Price | ||||||||
Officers’ Rollover Stock Plan Options | |||||||||
Retirement Eligible: | |||||||||
Options outstanding at March 31, 2014 | 728,550 | $ | 0.01 | * | |||||
Granted | — | ||||||||
Forfeited | — | ||||||||
Expired | — | ||||||||
Exercised | 728,550 | 0.01 | * | ||||||
Options outstanding at March 31, 2015 | — | * | |||||||
Non-Retirement Eligible: | |||||||||
Options outstanding at March 31, 2014 | 3,696,103 | $ | 0.01 | * | |||||
Granted | — | ||||||||
Forfeited | — | ||||||||
Expired | — | ||||||||
Exercised | 1,838,977 | 0.01 | * | ||||||
Options outstanding at March 31, 2015 | 1,857,126 | $ | 0.01 | * | |||||
Equity Incentive Plan Options | |||||||||
Options outstanding at March 31, 2014 | 7,050,965 | $ | 9.39 | ||||||
Granted | 306,262 | 23.38 | |||||||
Forfeited | 246,710 | 13.38 | |||||||
Expired | — | — | |||||||
Exercised | 833,712 | 7.30 | |||||||
Options outstanding at March 31, 2015 | 6,276,805 | $ | 10.19 | ** | |||||
* Amount reduced for $4.642 dividend issued December 11, 2009, $1.087 dividend issued July 27, 2009, $1.50 dividend issued May 29, 2012, and the $6.50 dividend issued July 30, 2012.
** Reflects exercise price adjustment of $6.36 per grant for the $6.50 dividend per share issued July 30, 2012.
The following table summarizes unvested stock options for the periods presented:
Number of Options | Weighted Average Grant Date Fair Value | ||||||
Equity Incentive Plan Options | |||||||
Unvested at March 31, 2014 | 3,403,059 | $ | 5.78 | ||||
Granted | 306,262 | 5.55 | |||||
Vested | 1,232,686 | 6.00 | |||||
Forfeited | 246,710 | 5.31 | |||||
Unvested at March 31, 2015 | 2,229,925 | $ | 5.68 | ||||
F-29
The following table summarizes stock options outstanding at March 31, 2015:
Range of exercise prices | Stock Options Outstanding | Weighted Average Exercise Price | Weighted Average Remaining Contractual Life | Intrinsic Value | Stock Options Exercisable | Weighted Average Exercise Price | Weighted Average Remaining Contractual Life | Intrinsic Value | ||||||||||
(In years) | (In years) | |||||||||||||||||
Officers’ Rollover Stock Plan | ||||||||||||||||||
$0.01 | 1,857,126 | $0.01 | (1) | 0.25 | $53,727 | 1,857,126 | $0.01 | 0.25 | $53,727 | |||||||||
Equity Incentive Plan | ||||||||||||||||||
$4.28 - $29.38 | 6,276,805 | $10.19 | (2) | 5.71 | $ | 117,663 | 4,046,880 | $7.81 | 4.91 | $85,511 | ||||||||
(1) Amount reduced for $ 4.642 dividend issued December 11, 2009, $1.087 dividend issued July 27, 2009, $1.50 dividend issued May 29, 2012 and the $6.50 dividend issued July 30, 2012.
(2) Reflects exercise price adjustment of $6.36 per grant for the $6.50 dividend per share issued July 30, 2012.
18. FAIR VALUE MEASUREMENTS
The accounting guidance for fair value measurements establishes a three-tier value hierarchy, which prioritizes the inputs used in measuring fair value as follows: observable inputs such as quoted prices in active markets (Level 1); inputs other than quoted prices in active markets that are observable either directly or indirectly (Level 2); and unobservable inputs in which there is little or no market data, which requires the Company to develop its own assumptions (Level 3).
A financial instrument's level within the fair value hierarchy is based on the lowest level of input that is significant to the fair value measurement. The financial instruments measured at fair value in the accompanying consolidated balance sheets consist of the following:
Recurring Fair Value Measurements as of March 31, 2015 | |||||||||||||||
Level 1 | Level 2 | Level 3 | Total | ||||||||||||
Cash and cash equivalents: | |||||||||||||||
Cash and cash equivalents | $ | 48,942 | $ | — | $ | — | $ | 48,942 | |||||||
Money market funds (1) | — | 158,275 | — | 158,275 | |||||||||||
Total cash and cash equivalents | $ | 48,942 | $ | 158,275 | $ | — | $ | 207,217 | |||||||
Liabilities: | |||||||||||||||
Contingent earnout liability (2) | — | — | 4,500 | 4,500 | |||||||||||
Total liabilities | $ | — | $ | — | $ | 4,500 | $ | 4,500 | |||||||
Recurring Fair Value Measurements as of March 31, 2014 | |||||||||||||||
Level 1 | Level 2 | Level 3 | Total | ||||||||||||
Cash and cash equivalents: | |||||||||||||||
Cash and cash equivalents | $ | 37,886 | $ | — | $ | — | $ | 37,886 | |||||||
Money market funds (1) | — | 222,108 | — | 222,108 | |||||||||||
Total cash and cash equivalents | $ | 37,886 | $ | 222,108 | $ | — | $ | 259,994 | |||||||
(1) Level 2 cash and cash equivalents are invested in money market funds that are intended to maintain a stable net asset value of $1.00 per share by investing in liquid, high quality U.S. dollar-denominated money market instruments. Therefore, the fair value approximates the carrying value. Depending on our short-term liquidity needs, we make regular transfers between money market funds and other cash equivalents.
F-30
(2) On October 9, 2014, the Company entered into a contingent consideration arrangement in connection with a business acquisition. Under the arrangement, the Company agreed to pay up to a maximum of $9 million in cash to the seller if certain financial performance thresholds are achieved in calendar years 2016 and 2017. The fair value of the contingent consideration liability as of March 31, 2015 was $4.5 million and is a Level 3 fair value measurement recorded within other long-term liabilities. It was valued using a Monte Carlo simulation and the key input besides projected cash flows was volatility, estimated as 30% based on the asset volatility of comparable publicly-traded companies. An increase (decrease) in volatility in isolation would result in a lower (higher) fair value measurement. After the initial recording of this liability as a part of the purchase accounting, there were no subsequent changes in fair value recorded during the six months ended March 31, 2015. Any future changes in the fair value of this contingent consideration liability will be recognized in earnings during the applicable period.
The fair value of the Company's debt instruments approximates its carrying value at March 31, 2015 and March 31, 2014. The fair value of debt is determined based on interest rates available for debt with terms and maturities similar to the Company's existing debt arrangements (Level 2 inputs).
The following table presents a summary of changes in the fair value of the Company's contingent earnout liability categorized as Level 3 for the fiscal year ended March 31, 2015:
Contingent Earnout Liability | |||
Balance at March 31, 2014 | $ | — | |
Issuances | 4,500 | ||
Balance at March 31, 2015 | $ | 4,500 | |
19. RELATED-PARTY TRANSACTIONS
The Carlyle Group is the largest shareholder of the Company. On November 5, 2014, the Company entered into an agreement with an affiliate of The Carlyle Group to repurchase 1,000,000 shares of our Class A common stock pursuant to the repurchase program described in Note 16 above. The shares were repurchased at a price of $25.10 per share as part of a private non-underwritten transaction. On February 2, 2015, the Company entered into an underwriting agreement with an affiliate of the Carlyle Group, or the selling stockholder, and Morgan Stanley & Co. LLC, or the underwriter, pursuant to which (i) the selling stockholder sold 12,000,000 shares of our Class A Common Stock to the underwriter and (ii) the Company repurchased 1,000,000 shares of our Class A common stock from the underwriter. The shares were repurchased at a price of $28.36 per share from the underwriter.
From time to time, and in the ordinary course of business: (1) other Carlyle portfolio companies engage the Company as a subcontractor or service provider, and (2) the Company engages other Carlyle portfolio companies as subcontractors or service providers. Revenue and cost associated with these related parties for fiscal 2015 were $1.1 million and $857,000, respectively. Revenue and cost associated with these related parties for fiscal 2014 were $444,000 and $368,000, respectively. Revenue and cost associated with these related party transactions for fiscal 2013 were $739,000 and $657,000, respectively.
In addition, investment vehicles affiliated with The Carlyle Group participated in a lender syndicate in the Company’s outstanding debt in the amounts of $47.0 million and $55.5 million at March 31, 2015 and 2014, respectively. The participation by such investment vehicles in the syndication of the Company's debt during fiscal 2015 and 2014 was done on an arm’s length basis.
On July 31, 2008, the Company entered into a management agreement, or Management Agreement, with TC Group V US, L.L.C., or TC Group, a company affiliated with Carlyle. In accordance with the Management Agreement, TC Group provides the Company with advisory, consulting and other services and the Company pays TC Group an aggregate annual fee of $1.0 million plus expenses. In addition, the Company made a one-time payment to TC Group of $20.0 million for investment banking, financial advisory, and other services provided to the Company in connection with the acquisition of Booz Allen Hamilton, Inc. in 2008 by The Carlyle Group. For fiscal 2015, 2014, and 2013, the Company incurred $1.0 million per year in advisory fees.
F-31
20. COMMITMENTS AND CONTINGENCIES
Leases
The Company leases office space under noncancelable operating leases that expire at various dates through 2026. The terms for the facility leases generally provide for rental payments on a graduated scale, which are recognized on a straight-line basis over the terms of the leases, including reasonably assured renewal periods, from the time the Company controls the leased property. Lease incentives are recorded as a deferred credit and recognized as a reduction to rent expense on a straight-line basis over the lease term. Rent expense was approximately $92.9 million, net of $696,000 of sublease income, $103.5 million, net of $2.5 million of sublease income, and $105.9 million, net of $5.5 million of sublease income, for fiscal 2015, 2014, and 2013, respectively.
Future minimum operating lease payments for noncancelable operating leases and future minimum income for noncancelable sublease rentals are summarized as follows:
For the Fiscal Year Ending March 31, | Operating Lease Payments | Operating Sublease Income | ||||||
2016 | $ | 70,158 | $ | 198 | ||||
2017 | 43,014 | 47 | ||||||
2018 | 31,608 | 17 | ||||||
2019 | 26,305 | 10 | ||||||
2020 | 22,172 | 4 | ||||||
Thereafter | 48,464 | — | ||||||
$ | 241,721 | $ | 276 | |||||
Rent expense is included in occupancy costs, a component of general and administrative expenses, as shown on the consolidated statements of operations, and includes rent, sublease income from third parties, real estate taxes, utilities, parking, security, repairs and maintenance, and storage costs.
As a result of the July 2008 acquisition, the Company assigned a total of nine leases to Booz & Co, which has subsequently changed its name to Strategy&. The Company remains liable for two leases for facilities located in Chicago and London under the terms of the original leases should Strategy& default on its obligations. All other leases assigned to Strategy& have expired. There were no events of default under these leases as of March 31, 2015 or 2014, and the maximum potential amount of undiscounted future payments is $9.3 million. The Chicago lease expires in November 2015 and the London lease expires in March 2017. Based on the Company’s assessment of the likelihood of future payment, no amounts have been recorded related to the Company’s contingent liability on such leases.
Letters of Credit and Third-Party Guarantees
As of March 31, 2015 and 2014, the Company was contingently liable under open standby letters of credit and bank guarantees issued by our banks in favor of third parties that totaled $5.3 million and $2.4 million, respectively. These letters of credit and bank guarantees primarily support insurance and bid and performance obligations. At March 31, 2015 and 2014, approximately $5.2 million and $2.4 million of these instruments reduce the available borrowings under the revolving credit facility. The remainder are guaranteed under a separate $5.0 million facility established in fiscal 2015, $4.9 million of which was available to the Company at March 31, 2015.
Government Contracting Matters
For fiscal 2015, 2014, and 2013, approximately 98%, 98%, and 99%, respectively, of the Company’s revenue was generated from contracts where the end client was an agency or department of the U.S. government, including contracts where Booz Allen performed in either a prime or subcontract position, and regardless of the geographic location in which the work was performed. Contracts with the U.S. government are subject to extensive legal and regulatory requirements and, from time to time and in the ordinary course of business, agencies of the U.S. government investigate whether the Company’s operations are conducted in accordance with these requirements and the terms of the relevant contracts by using investigative techniques such as subpoenas or civil investigative demands. U.S. government investigations of the Company, whether related to the Company’s U.S. government contracts or conducted for other reasons, could result in administrative, civil, or criminal liabilities, including repayments, fines, or penalties being imposed upon the Company, or could lead to suspension or debarment from future U.S. government contracting. Management believes it has adequately reserved for any losses that may be experienced from any investigation of which it is aware. The Defense Contract Management Agency Administrative Contracting Officer has negotiated annual final indirect cost rates through fiscal year 2007. Audits of subsequent years may result in cost reductions and/or penalties. Management believes it has adequately reserved for any losses that may be
F-32
experienced from any such reductions and/or penalties. As of March 31, 2015 and 2014, the Company has recorded a liability of approximately $205.3 million and $189.8 million, respectively, for its current best estimate, amounts to be refunded to customers for potential adjustments from audits or reviews of contract costs incurred subsequent to fiscal year 2007.
Litigation
The Company is involved in legal proceedings and investigations arising in the ordinary course of business, including those relating to employment matters, relationships with clients and contractors, intellectual property disputes, and other business matters. These legal proceedings seek various remedies, including claims for monetary damages in varying amounts that currently range up to $40 million or are unspecified as to amount. Although the outcome of any such matter is inherently uncertain and may be materially adverse, based on current information, management does not expect any of the currently ongoing audits, reviews, investigations, or litigation to have a material adverse effect on the Company’s financial condition and results of operations. As of March 31, 2015 and 2014, there are no material amounts accrued in the consolidated financial statements related to these proceedings.
Six former officers and stockholders who had departed the company prior to the acquisition have filed a total of nine suits in various jurisdictions, with original filing dates ranging from July 3, 2008 through December 15, 2009, against us and certain of our current and former directors and officers. Three of these suits were amended on July 2, 2010 and then further amended into one consolidated complaint on September 7, 2010. Another two of the original nine suits were consolidated into one complaint on September 24, 2014. Each of the suits arises out of the acquisition and alleges that the former stockholders are entitled to certain payments that they would have received if they had held their stock at the time of the acquisition. Some of the suits also allege that the acquisition price paid to stockholders was insufficient. The various suits assert claims for breach of contract, tortious interference with contract, breach of fiduciary duty, civil Racketeer Influenced and Corrupt Organizations Act, or RICO, violations, violations of the Employee Retirement Income Security Act, and/or securities and common law fraud. Three of these suits have been dismissed with all appeals exhausted. The two suits that were consolidated into one action on September 24, 2014 were settled on April 16, 2015. One of the remaining suits has been dismissed by the United States District Court for the Southern District of California and is on appeal before the United States Court of Appeals for the Ninth Circuit. The other three remaining suits that were previously consolidated on September 7, 2010 have been dismissed by the United States District Court for the Southern District of New York, but are still subject to appeal by the plaintiffs. As of March 31, 2015, the aggregate alleged damages sought in these four remaining suits was approximately $291.7 million (which is sought to be trebled pursuant to RICO) plus punitive damages, costs, and fees. As of March 31, 2014, the aggregate alleged damages sought was approximately $348.7 million ($291.5 million of which is sought to be trebled pursuant to RICO) plus punitive damages, costs, and fees.
Although the outcome of any of these cases is inherently uncertain and may be materially adverse, based on current information, management does not expect them to have a material adverse effect on our financial condition and results of operations.
21. BUSINESS SEGMENT INFORMATION
The Company reports operating results and financial data in one operating and reportable segment. The Company manages its business as a single profit center in order to promote collaboration, provide comprehensive functional service offerings across its entire client base, and provide incentives to employees based on the success of the organization as a whole. Although certain information regarding served markets and functional capabilities is discussed for purposes of promoting an understanding of the Company’s complex business, the Company manages its business and allocates resources at the consolidated level of a single operating segment.
F-33
22. UNAUDITED QUARTERLY FINANCIAL DATA
2015 Quarters | ||||||||||||||||
First | Second | Third | Fourth | |||||||||||||
Revenue | $ | 1,322,297 | $ | 1,304,841 | $ | 1,304,686 | $ | 1,342,946 | ||||||||
Operating income | 139,023 | 121,983 | 105,256 | 92,560 | ||||||||||||
Income before income taxes | 119,049 | 104,973 | 86,616 | 75,280 | ||||||||||||
Net income | 71,115 | 65,284 | 52,807 | 43,363 | ||||||||||||
Earnings per common share: | ||||||||||||||||
Basic (1) | $ | 0.49 | $ | 0.43 | $ | 0.35 | $ | 0.29 | ||||||||
Diluted (1) | $ | 0.47 | $ | 0.42 | $ | 0.35 | $ | 0.29 | ||||||||
2014 Quarters | ||||||||||||||||
First | Second | Third | Fourth | |||||||||||||
Revenue | $ | 1,427,691 | $ | 1,378,020 | $ | 1,273,150 | $ | 1,399,832 | ||||||||
Operating income | 138,673 | 135,667 | 97,034 | 89,237 | ||||||||||||
Income before income taxes | 118,015 | 113,798 | 78,181 | 70,793 | ||||||||||||
Net income | 70,313 | 67,813 | 47,167 | 46,895 | ||||||||||||
Earnings per common share: | ||||||||||||||||
Basic (1) | $ | 0.51 | $ | 0.48 | $ | 0.32 | $ | 0.32 | ||||||||
Diluted (1) | $ | 0.48 | $ | 0.45 | $ | 0.31 | $ | 0.30 | ||||||||
(1) Earnings per share are computed independently for each of the quarters presented and therefore may not sum to the total for the fiscal year.
23. SUPPLEMENTAL FINANCIAL INFORMATION
The following schedule summarizes valuation and qualifying accounts for the periods presented:
Fiscal Year Ended March 31, | ||||||||||||
2015 | 2014 | 2013 | ||||||||||
Allowance for doubtful accounts: | ||||||||||||
Beginning balance | $ | 1,457 | $ | 188 | $ | 799 | ||||||
Provision for doubtful accounts | (1,100 | ) | 1,621 | 397 | ||||||||
Allowance for doubtful accounts from acquisitions | — | — | 32 | |||||||||
Charges against allowance | — | (352 | ) | (1,040 | ) | |||||||
Ending balance | $ | 357 | $ | 1,457 | $ | 188 | ||||||
Tax valuation allowance: | ||||||||||||
Beginning balance | $ | — | $ | — | $ | 36,335 | ||||||
Deductions and other adjustments | — | — | (36,335 | ) | ||||||||
Ending balance | $ | — | $ | — | $ | — | ||||||
F-34
Item 9. | Changes in and Disagreements With Accountants on Accounting and Financial Disclosure. |
None.
Item 9A. Controls and Procedures
Disclosure Controls and Procedures
The Company’s management, with the participation of our Chief Executive Officer and Chief Financial Officer, has evaluated the effectiveness of our disclosure controls and procedures, as defined in Rules 13a-15(e) and 15d-15(e) of the Securities Exchange Act of 1934, as of the end of the period covered by this Annual Report. Based on that evaluation, our Chief Executive Officer and Chief Financial Officer concluded that, as of the end of the period covered by this Annual Report, our disclosure controls and procedures were effective as of March 31, 2015.
Management’s Annual Report on Internal Control over Financial Reporting and Attestation Report of the Registered Public Accounting Firm
Our management is responsible for establishing and maintaining adequate internal control over financial reporting. Our internal control system was designed to provide reasonable assurance to our management and board of directors regarding the reliability of financial reporting and the preparation of financial statements for external purposes.
Our management conducted an assessment of the effectiveness of our internal control over financial reporting as of March 31, 2015. This assessment was based on the criteria set forth by the Committee of Sponsoring Organizations of the Treadway Commission in Internal Control — Integrated Framework (2013 framework). Based on this assessment, management has concluded that, as of March 31, 2015, our internal control over financial reporting was effective.
Our independent registered public accounting firm has issued a report on the effectiveness of our internal control over financial reporting, which is below.
Changes in Internal Control Over Financial Reporting
There have been no changes in our internal control over financial reporting, as defined in Rules 13a-15(f) and 15d-15(f) of the Securities Exchange Act of 1934, that occurred in the fourth fiscal quarter of the period covered by this Annual Report that materially affected, or are reasonably likely to materially affect, our internal control over financial reporting.
61
Report of Ernst & Young LLP,
Independent Registered Public Accounting Firm,
Regarding Internal Control over Financial Reporting
The Board of Directors and Shareholders of
Booz Allen Hamilton Holding Corporation
We have audited Booz Allen Hamilton Holding Corporation’s internal control over financial reporting as of March 31, 2015, based on criteria established in Internal Control - Integrated Framework issued by the Committee of Sponsoring Organizations of the Treadway Commission (2013 framework) (the COSO criteria). Booz Allen Hamilton Holding Corporation’s management is responsible for maintaining effective internal control over financial reporting, and for its assessment of the effectiveness of internal control over financial reporting included in the accompanying Management’s Annual Report on Internal Control over Financial Reporting. Our responsibility is to express an opinion on the company’s internal control over financial reporting based on our audit.
We conducted our audit in accordance with the standards of the Public Company Accounting Oversight Board (United States). Those standards require that we plan and perform the audit to obtain reasonable assurance about whether effective internal control over financial reporting was maintained in all material respects. Our audit included obtaining an understanding of internal control over financial reporting, assessing the risk that a material weakness exists, testing and evaluating the design and operating effectiveness of internal control based on the assessed risk, and performing such other procedures as we considered necessary in the circumstances. We believe that our audit provides a reasonable basis for our opinion.
A company’s internal control over financial reporting is a process designed to provide reasonable assurance regarding the reliability of financial reporting and the preparation of financial statements for external purposes in accordance with generally accepted accounting principles. A company’s internal control over financial reporting includes those policies and procedures that (1) pertain to the maintenance of records that, in reasonable detail, accurately and fairly reflect the transactions and dispositions of the assets of the company; (2) provide reasonable assurance that transactions are recorded as necessary to permit preparation of financial statements in accordance with generally accepted accounting principles, and that receipts and expenditures of the company are being made only in accordance with authorizations of management and directors of the company; and (3) provide reasonable assurance regarding prevention or timely detection of unauthorized acquisition, use, or disposition of the company’s assets that could have a material effect on the financial statements.
Because of its inherent limitations, internal control over financial reporting may not prevent or detect misstatements. Also, projections of any evaluation of effectiveness to future periods are subject to the risk that controls may become inadequate because of changes in conditions, or that the degree of compliance with the policies or procedures may deteriorate.
In our opinion, Booz Allen Hamilton Holding Corporation maintained, in all material respects, effective internal control over financial reporting as of March 31, 2015 based on the COSO criteria.
We also have audited, in accordance with the standards of the Public Company Accounting Oversight Board (United States), the consolidated balance sheets of Booz Allen Hamilton Holding Corporation as of March 31, 2015 and March 31, 2014 and the related consolidated statements of operations, comprehensive income, stockholders’ equity, and cash flows for each of the three years in the period ended March 31, 2015 of Booz Allen Hamilton Holding Corporation and our report dated May 21, 2015 expressed an unqualified opinion thereon.
/s/ Ernst & Young LLP
McLean, Virginia
May 21, 2015
62
Item 9B. | Other Information. |
None.
PART III
Item 10. | Directors, Executive Officers and Corporate Governance. |
Information related to our directors is set forth under the caption “Election of Directors” of our Proxy Statement for our Annual Meeting of Stockholders scheduled for July 30, 2015. Such information is incorporated herein by reference.
Information relating to our Executive Officers is included in Part I of this Annual Report under the caption “Executive Officers of the Registrant.”
Information relating to compliance with Section 16(a) of the Exchange Act is set forth under the caption “Section 16(a) Beneficial Ownership Reporting Compliance” of our 2015 Proxy Statement. Such information is incorporated herein by reference.
Information related to our code of ethics is set forth under the caption “Corporate Governance and General Information Concerning the Board of Directors and its Committees” of our 2015 Proxy Statement. Such information is incorporated herein by reference.
Information relating to the Audit Committee and Board of Directors determinations concerning whether a member of the Audit Committee is a “financial expert” as that term is defined under Item 407(d)(5) of Regulation S-K is set forth under the caption “Corporate Governance and General Information Concerning the Board of Directors and its Committees” of our 2015 Proxy Statement. Such information is incorporated herein by reference.
Item 11. | Executive Compensation. |
Information relating to this item is set forth under the captions “Compensation Discussion and Analysis,” “Director Compensation,” “Compensation Committee Interlocks and Insider Participation” and “Compensation Committee Report on Executive Compensation” of our 2015 Proxy Statement. Such information is incorporated herein by reference.
Item 12. | Security Ownership of Certain Beneficial Owners and Management and Related Stockholder Matters. |
Equity Compensation Plans
The following table presents information concerning the securities authorized for issuance pursuant to our equity compensation plans as of March 31, 2015:
Plan Category | Number of Securities to Be Issued Upon Exercise of Outstanding Options, Warrants and Rights (a) | Weighted Average Exercise Price of Outstanding Options, Warrants and Rights (b) | Number of Securities Remaining Available for Future Issuance Under Equity Compensation Plans (Excluding Securities Reflected in Column (a)) (c) | |||||||||
Equity compensation plans approved by securityholders | 8,597,978 | (1)(2) | $ | 7.87 | 12,753,436 | |||||||
Equity compensation plans not approved by securityholders | — | N/A | — | |||||||||
Total | 8,597,978 | (1)(2) | $ | 7.87 | 12,753,436 | |||||||
(1) | Column (a) includes: 464,047 shares that have been granted as restricted stock units (RSUs) and 8,133,931 shares granted as options under our equity compensation plans. The weighted average price in column (b) does not take into account shares issued pursuant to RSUs. |
63
(2) | Upon the exercise of all outstanding options, we will issue approximately 8,133,766 shares of Class A Common Stock and will redeem approximately 165 fractional shares for cash. |
Information relating to the security ownership of certain beneficial owners and management is included in our 2015 Proxy Statement under the caption “Security Ownership of Certain Beneficial Owners and Management” and is incorporated herein by reference.
Item 13. | Certain Relationships and Related Transactions, and Director Independence. |
Information relating to this item is set forth under the captions “Certain Relationships and Related Party Transactions” and “Corporate Governance and General Information Concerning the Board of Directors and its Committees” of our 2015 Proxy Statement. Such information is incorporated herein by reference.
Item 14. | Principal Accounting Fees and Services |
Information relating to this item is set forth under the caption “Independent Registered Public Accounting Firm Fees” of our 2015 Proxy Statement. Such information is incorporated herein by reference.
Item 15. | Exhibits, Financial Statement Schedules. |
(a) The following documents are filed as part of this Annual Report:
(1) | Our financial statements filed herewith are set forth in Item 8 of this Annual Report. |
(2) | Financial statement schedules have been omitted because either they are not applicable or the required information is included in the financial statements or the notes thereto. |
(3) | The attached list of exhibits in the “Exhibit Index” immediately following the signature pages to this Annual Report is filed as part of this Annual Report and is incorporated herein by reference. |
64
SIGNATURES
Pursuant to the requirements of Section 13 or 15(d) of the Securities Exchange Act of 1934, the registrant has duly caused this report to be signed on its behalf by the undersigned, thereunto duly authorized, in Washington, DC, on this 21st day of May, 2015.
BOOZ ALLEN HAMILTON HOLDING CORPORATION (Registrant) | ||
By: | /s/ Horacio D. Rozanski | |
Name: Horacio D. Rozanski | ||
Title: President and Chief Executive Officer | ||
SIGNATURES
Pursuant to the requirements of the Securities Act of 1934, this report has been signed by the following persons in the capacities and on the dates indicated.
Signature | Title | Date | ||
/s/ Horacio D. Rozanski | President, Chief Executive Officer and Director (Principal Executive Officer) | May 21, 2015 | ||
Horacio D. Rozanski | ||||
/s/ Kevin L. Cook | Executive Vice President, Chief Financial Officer and Treasurer (Principal Financial and Accounting Officer) | May 21, 2015 | ||
Kevin L. Cook | ||||
/s/ Ralph W. Shrader | Chairman of the Board | May 21, 2015 | ||
Ralph W. Shrader | ||||
Director | May 21, 2015 | |||
Joan Lordi C. Amble | ||||
/s/ Peter Clare | Director | May 21, 2015 | ||
Peter Clare | ||||
/s/ Ian Fujiyama | Director | May 21, 2015 | ||
Ian Fujiyama | ||||
/s/ Mark Gaumond | Director | May 21, 2015 | ||
Mark Gaumond | ||||
Director | May 21, 2015 | |||
Allan M. Holt | ||||
/s/ Arthur E. Johnson | Director | May 21, 2015 | ||
Arthur E. Johnson | ||||
/s/ Gretchen W. McClain | Director | May 21, 2015 | ||
Gretchen W. McClain | ||||
65
/s/ Philip A. Odeen | Director | May 21, 2015 | ||
Philip A. Odeen | ||||
/s/ Charles O. Rossotti | Director | May 21, 2015 | ||
Charles O. Rossotti | ||||
66
Exhibit Index
Exhibit Number | Description | |
2.1 | Agreement and Plan of Merger, dated as of May 15, 2008, by and among Booz Allen Hamilton Inc., Booz Allen Hamilton Holding Corporation (formerly known as Explorer Holding Corporation), Booz Allen Hamilton Investor Corporation (formerly known as Explorer Investor Corporation), Explorer Merger Sub Corporation and Booz & Company Inc. (Incorporated by reference to Exhibit 2.1 to the Company’s Registration Statement on Form S-1 (File No. 333- 167645)) | |
2.2 | Spin Off Agreement, dated as of May 15, 2008, by and among Booz Allen Hamilton Inc., Booz & Company Holdings, LLC, Booz & Company Inc., Booz & Company Intermediate I Inc. and Booz & Company Intermediate II Inc. (Incorporated by reference to Exhibit 2.2 to the Company’s Registration Statement on Form S-1 (File No. 333-167645)) | |
2.3 | Amendment to the Agreement and Plan of Merger and the Spin Off Agreement, dated as of July 30, 2008, by and among Booz Allen Hamilton Inc., Booz Allen Hamilton Investor Corporation (formerly known as Explorer Investor Corporation), Explorer Merger Sub Corporation, Booz & Company Holdings, LLC, Booz & Company Inc., Booz & Company Intermediate I Inc. and Booz & Company Intermediate II Inc. (Incorporated by reference to Exhibit 2.3 to the Company’s Registration Statement on Form S-1 (File No. 333-167645)) | |
3.1 | Third Amended and Restated Certificate of Incorporation of Booz Allen Hamilton Holding Corporation (Incorporated by reference to Exhibit 3.1 to the Company’s Quarterly Report for the period ended September 30, 2014 on Form 10-Q (File No. 001-34972)) | |
3.2 | Second Amended and Restated Bylaws of Booz Allen Hamilton Holding Corporation (Incorporated by reference to Exhibit 3.2 to the Company’s Quarterly Report for the period ended December 31, 2010 on Form 10-Q (File No. 001-34972)) | |
4.1 | Amended and Restated Stockholders Agreement (Incorporated by reference to Exhibit 10.1 to the Company’s Periodic Report on Form 8-K filed on January 30, 2015) (File No. 001-34972)) | |
4.2 | Form of Stock Certificate (Incorporated by reference to Exhibit 4.5 to the Company’s Registration Statement on Form S-1 (File No. 333-167645)) | |
10.1 | Management Agreement, among Booz Allen Hamilton Holding Corporation (formerly known as Explorer Holding Corporation), Booz Allen Hamilton Inc., and TC Group V US, LLC, dated as of July 31, 2008 (Incorporated by reference to Exhibit 10.6 to the Company’s Registration Statement on Form S-1 (File No. 333-167645)) | |
10.2† | Second Amended and Restated Equity Incentive Plan of Booz Allen Hamilton Holding Corporation (Incorporated by reference to Exhibit 10.2 to the Company’s Quarterly Report for the period ended September 30, 2014 on Form 10-Q (File No. 001-34972))† | |
10.3† | Booz Allen Hamilton Holding Corporation Officers’ Rollover Stock Plan (Incorporated by reference to Exhibit 10.8 to the Company’s Registration Statement on Form S-1 (File No. 333-167645))† | |
10.4† | Form of Booz Allen Hamilton Holding Corporation Rollover Stock Option Agreement (Incorporated by reference to Exhibit 10.9 to the Company’s Registration Statement on Form S-1 (File No. 333-167645))† | |
10.5† | Form of Stock Option Agreement under the Equity Incentive Plan of Booz Allen Hamilton Holding Corporation (Incorporated by reference to Exhibit 10.10 to the Company’s Registration Statement on Form S-1 (File No. 333-167645))† | |
10.6† | Form of Stock Option Agreement under the Equity Incentive Plan of Booz Allen Hamilton Holding Corporation (Incorporated by reference to Exhibit 10.11 to the Company’s Registration Statement on Form S-1 (File No. 333-167645))† | |
10.7† | Form of Subscription Agreement (Incorporated by reference to Exhibit 10.12 to the Company’s Registration Statement on Form S-1 (File No. 333-167645)) | |
10.8† | Form of Restricted Stock Agreement for Directors under the Equity Incentive Plan of Booz Allen Hamilton Holding Corporation (Incorporated by reference to Exhibit 10.13 to the Company’s Registration Statement on Form S-1 (File No. 333-167645)) | |
10.9† | Form of Restricted Stock Agreement for Employees under the Equity Incentive Plan of Booz Allen Hamilton Holding Corporation (Incorporated by reference to Exhibit 10.14 to the Company’s Registration Statement on Form S-1 (File No. 333-167645)) | |
67
10.10† | Amended and Restated Booz Allen Hamilton Holding Corporation Annual Incentive Plan (Incorporated by reference to Exhibit 10.10 to the Company’s Quarterly Report for the period ended September 30, 2014 on Form 10-Q (File No. 001-34972)) | |
10.11† | Booz Allen Hamilton Holding Corporation Officers’ Retirement Plan (Incorporated by reference to Exhibit 10.16 to the Company’s Registration Statement on Form S-1 (File No. 333-167645)) | |
10.12† | Officer’s Comprehensive Medical and Dental Plans (Incorporated by reference to Exhibit 10.17 to the Company’s Registration Statement on Form S-1 (File No. 333-167645)) | |
10.13† | Retired Officer’s Comprehensive Medical and Dental Plans (Incorporated by reference to Exhibit 10.18 to the Company’s Registration Statement on Form S-1 (File No. 333-167645)) | |
10.14† | Group Variable Universal Life Insurance* | |
10.15† | Group Personal Excess Liability Insurance (Incorporated by reference to Exhibit 10.21 to the Company’s Registration Statement on Form S-1 (File No. 333-167645)) | |
10.16† | Annual Performance Program (Incorporated by reference to Exhibit 10.22 to the Company’s Registration Statement on Form S-1 (File No. 333-167645)) | |
10.17† | Form of Booz Allen Hamilton Holding Corporation Director and Officer Indemnification Agreement (Incorporated by reference to Exhibit 10.23 to the Company’s Registration Statement on Form S-1 (File No. 333-167645)) | |
10.18† | Form of Stock Option Agreement under the Equity Incentive Plan of Booz Allen Hamilton Holding Corporation (Incorporated by reference to Exhibit 10.23 to the Company’s Annual Report for the year ended March 31, 2011 on Form 10-K (File No. 001-34972)) | |
10.19† | Officer Transition Policy (Incorporated by reference to Exhibit 10.24 to the Company’s Annual Report for the year ended March 31, 2011 on Form 10-K (File No. 001-34972)) | |
10.20† | Form of Stock Option Agreement under the Equity Incentive Plan of Booz Allen Hamilton Holding Corporation (Incorporated by reference to Exhibit 10.25 to the Company’s Quarterly Report for the period ended December 31, 2011 on Form 10-Q (File No. 001-34972)) | |
10.21 | Credit Agreement among Booz Allen Hamilton Inc., as the Borrower, the several lenders from time to time parties thereto, Bank of America, N.A., as Administrative Agent, Collateral Agent and Issuing Lender, Merrill Lynch, Pierce, Fenner & Smith Incorporated and Credit Suisse Securities (USA) LLC, as Joint Lead Arrangers, Merrill Lynch, Pierce, Fenner & Smith Incorporated, Credit Suisse Securities (USA) LLC, Barclays Bank PLC, Citigroup Global Markets Inc., HSBC Securities (USA) Inc., J.P. Morgan Securities LLC, Morgan Stanley Senior Funding, Inc. and Sumimoto Mitsui Banking Corporation, as Joint Bookrunners, Credit Suisse Securities (USA) LLC, as Syndication Agent, Barclays Bank PLC, Citigroup Global Markets Inc., HSBC Securities (USA) Inc., J.P. Morgan Securities LLC, Morgan Stanley Senior Funding, Inc., Sumimoto Mitsui Banking Corporation and The Bank of Tokyo-Mitsubishi UFJ, Ltd., as Co-Documentation Agents, dated as of July 31, 2012 (Incorporated by reference to Exhibit 10.1 to the Company’s Periodic Report on Form 8-K filed on August 1, 2012 (File No. 001-34972)) | |
10.22 | Guarantee and Collateral Agreement, among Booz Allen Hamilton Investor Corporation, Booz Allen Hamilton Inc., and the Subsidiary Guarantors party thereto, in favor of Bank of America, N.A., as Collateral Agent, dated as of July 31, 2012 (Incorporated by reference to Exhibit 10.2 to the Company’s Periodic Report on Form 8-K filed on August 1, 2012 (File No. 001-34972)) | |
10.23 | First Amendment to Credit Agreement, dated as of August 16, 2013, among Booz Allen Hamilton Inc., as Borrower, Booz Allen Hamilton Investor Corporation, Booz Allen Hamilton Engineering Holding Co., LLC, Booz Allen Hamilton Engineering Services, LLC, SDI Technology Corporation, ASE, Inc. and , Booz Allen Hamilton International, Inc., as Guarantors,, Bank of America, N.A., as Administrative Agent, Collateral Agent and New Refinancing Tranche B Term Lender, and the other Lenders and financial institutions from time to time party thereto. (Incorporated by reference to Exhibit 10.1 to the Company’s Periodic Report on Form 8-K filed on August 20, 2013 (File No. 001-34972)) | |
10.24† | Form of Employment Agreement (Incorporated by reference to Exhibit 10.27 to the Company’s Annual Report for the year ended March 31, 2014 on Form 10-K (File No. 001-34972)) | |
10.25† | Form of Restricted Stock Agreement under the Amended and Restated Equity Incentive Plan of Booz Allen Hamilton Holding Corporation (Incorporated by reference to Exhibit 10.28 to the Company’s Annual Report for the year ended March 31, 2014 on Form 10-K (File No. 001-34972)) | |
10.26† | Form of Restricted Stock Unit Agreement under the Amended and Restated Equity Incentive Plan of Booz Allen Hamilton Holding Corporation (Incorporated by reference to Exhibit 10.29 to the Company’s Annual Report for the year ended March 31, 2014 on Form 10-K (File No. 001-34972)) | |
68
10.27 | Second Amendment to Credit Agreement, dated as of May 7, 2014, among Booz Allen Hamilton Inc., as Borrower, Booz Allen Hamilton Investor Corporation, Booz Allen Hamilton Engineering Holding Co., LLC, Booz Allen Hamilton Engineering Services, LLC, SDI Technology Corporation, ASE, Inc. and Booz Allen Hamilton International, Inc., as Guarantors, Bank of America, N.A., as Administrative Agent, Collateral Agent and Issuing Lender, and the other Lenders and financial institutions from time to time party thereto (Incorporated by reference to Exhibit 10.1 to the Company’s Periodic Report on Form 8-K filed on May 13, 2014 (File No. 001-34972)) | |
23 | Consent of Ernst & Young LLP, Independent Registered Public Accounting Firm* | |
31.1 | Rule 13a-14(a)/15d-14(a) Certification of the Chief Executive Officer* | |
31.2 | Rule 13a-14(a)/15d-14(a) Certification of the Chief Financial Officer* | |
32.1 | Certification of the Chief Executive Officer required by Rule 13a-14(b) or Rule 15d-14(b) and Section 1350 of Chapter 63 of Title 18 of the United States Code (18 U.S.C. 1350)* | |
32.2 | Certification of the Chief Financial Officer required by Rule 13a-14(b) or Rule 15d-14(b) and Section 1350 of Chapter 63 of Title 18 of the United States Code (18 U.S.C. 1350)* | |
101 | The following materials from Booz Allen Hamilton Holding Corporation’s Annual Report on Form 10-K for the fiscal year ended March 31, 2015, formatted in XBRL (eXtensible Business Reporting Language): (i) Consolidated Balance Sheets as of March 31, 2015 and 2014; (ii) Consolidated Statements of Operations for the fiscal years ended March 31, 2015, 2014 and 2013; (iii) Consolidated Statements of Comprehensive Income for the fiscal years ended March 31, 2015, 2014 and 2013; (iv) Consolidated Statements of Cash Flows for the fiscal years ended March 31, 2015, 2014 and 2013; (v) Consolidated Statements of Stockholders' Equity for the fiscal years ended March 31, 2015, 2014 and 2013; and (vi) Notes to Consolidated Financial Statements. | |
___________________________________
* | Filed electronically herewith. |
† Management contract or compensatory arrangement.
69