Attached files
| file | filename |
|---|---|
| EX-31.2 - EXHIBIT 31.2 - INTEGRATED DEVICE TECHNOLOGY INC | idti-3292015xex312.htm |
| EX-21.1 - EXHIBIT 21.1 - INTEGRATED DEVICE TECHNOLOGY INC | idti-3292015xex211.htm |
| EX-32.2 - EXHIBIT 32.2 - INTEGRATED DEVICE TECHNOLOGY INC | idti-3292015xex322.htm |
| EX-23.1 - EXHIBIT 23.1 - INTEGRATED DEVICE TECHNOLOGY INC | idti-3292015xex231.htm |
| EX-32.1 - EXHIBIT 32.1 - INTEGRATED DEVICE TECHNOLOGY INC | idti-3292015xex321.htm |
| EX-31.1 - EXHIBIT 31.1 - INTEGRATED DEVICE TECHNOLOGY INC | idti-3292015xex311.htm |
| EX-10.4 - EXHIBIT 10.4 - INTEGRATED DEVICE TECHNOLOGY INC | idti-3292015xex104.htm |
| EXCEL - IDEA: XBRL DOCUMENT - INTEGRATED DEVICE TECHNOLOGY INC | Financial_Report.xls |
UNITED STATES
SECURITIES AND EXCHANGE COMMISSION
Washington, D.C. 20549
______________________________
FORM 10-K
______________________________
(Mark One)
/x/ | ANNUAL REPORT PURSUANT TO SECTION 13 OR 15(d) OF THE SECURITIES EXCHANGE ACT OF 1934 |
For the fiscal year ended March 29, 2015
OR
/ / | TRANSITION REPORT PURSUANT TO SECTION 13 OR 15(d) OF THE SECURITIES EXCHANGE ACT OF 1934 |
For the transition period from to .
Commission File No. 0-12695
INTEGRATED DEVICE TECHNOLOGY, INC.
(Exact Name of Registrant as Specified in Its Charter)
DELAWARE (State or Other Jurisdiction of Incorporation or Organization) | 94-2669985 (I.R.S. Employer Identification No.) |
6024 SILVER CREEK VALLEY ROAD, SAN JOSE, CALIFORNIA (Address of Principal Executive Offices) | 95138 (Zip Code) |
Registrant's Telephone Number, Including Area Code: (408) 284-8200
Securities registered pursuant to Section 12(b) of the Act:
Title of each class | Name of each exchange on which registered |
Common stock, $.001 par value | The NASDAQ Stock Market LLC |
Securities registered pursuant to Section 12(g) of the Act: None
Indicate by check mark if the registrant is a well-known seasoned issuer, as defined in Rule 405 of the Securities Act. Yes ý No o
Indicate by check mark if the registrant is not required to file reports pursuant to Section 13 or 15(d) of the Act. Yes o No ý
Indicate by check mark whether the registrant (1) has filed all reports required to be filed by Section 13 or 15(d) of the Securities Exchange Act of 1934 during the preceding 12 months (or for such shorter period that the registrant was required to file such reports), and (2) has been subject to such filing requirements for the past 90 days. Yes ý No o
Indicate by check mark whether the registrant has submitted electronically and posted on its corporate Web site, if any, every Interactive Data File required to be submitted and posted pursuant to Rule 405 of Regulation S-T during the preceding 12 months (or for such shorter period that the registrant was required to submit and post such files). Yes ý No ¨
Indicate by check mark if disclosure of delinquent filers pursuant to Item 405 of Regulation S-K is not contained herein, and will not be contained, to the best of registrant’s knowledge, in definitive proxy or information statements incorporated by reference in Part III of this Form 10-K or any amendment to this Form 10-K.ý
Indicate by check mark whether the registrant is a large accelerated filer, an accelerated filer, a non-accelerated filer or a smaller reporting company. See definition of “large accelerated filer,” “accelerated filer” and “smaller reporting company” in Rule 12b-2 of the Exchange Act.
ý Large accelerated filer ¨ Accelerated filer ¨ Non-accelerated filer ¨ Smaller reporting company
Indicate by check mark whether the registrant is a shell company (as defined in Rule 12b-2 of the Exchange Act) Yes o No ý
The aggregate market value of the voting and non-voting common equity held by non-affiliates was approximately $2,036 million, computed by reference to the last sales price of $15.98 as reported by The NASDAQ Stock Market LLC, as of the last business day of the registrant’s most recently completed second fiscal quarter, September 28, 2014. Shares of common stock held by each executive officer and director and by each person who owns 5% or more of the outstanding common stock have been excluded in that such persons may be deemed affiliates. This determination of affiliate status is not necessarily a conclusive determination for other purposes.
The number of outstanding shares of the registrant's Common Stock, $.001 par value, as of May 15, 2015 was approximately 148,354,809.
DOCUMENTS INCORPORATED BY REFERENCE
Items 10, 11, 12, 13, and 14 of Part III incorporate information by reference from the registrant’s Proxy Statement for the 2015 Annual Meeting of Stockholders.
INTEGRATED DEVICE TECHNOLOGY, INC.
ANNUAL REPORT ON FORM 10-K
TABLE OF CONTENTS
Item 1. | ||
Item 1A. | ||
Item 1B. | ||
Item 2. | ||
Item 3. | ||
Item 4. | ||
Item 5. | ||
Item 6. | ||
Item 7. | ||
Item 7A. | ||
Item 8. | ||
Item 9. | ||
Item 9A. | ||
Item 9B. | ||
Item 10. | ||
Item 11. | ||
Item 12. | ||
Item 13. | ||
Item 14. | ||
Item 15. | ||
2
PART I
Special Note Regarding Forward-Looking Statements
We have made statements in this Annual Report on Form 10-K in Part I, Item 1-“Business,” Item 1A-“Risk Factors,” Item 3-“Legal Proceedings,” Part II, Item 7-“Management’s Discussion and Analysis of Financial Condition and Results of Operations” and in other sections of this Annual Report that are forward-looking statements within the meaning of Section 27A of the Securities Act of 1933, as amended, and Section 21E of the Securities Exchange Act of 1934, as amended (the Exchange Act). These statements relate to future events and the future results of Integrated Device Technology, Inc., and are based on current expectations, estimates, forecasts and projections about our business and growth prospects, the industry in which we operate and general economic conditions and the beliefs and assumptions of our management. In addition, in this Annual Report on Form 10-K, the words “expects,” “anticipates,” ”targets,” “goals,” “projects,” “intends,” “plans, “believes,” “seeks, “estimates, “will,” “would,” “could,” “might,” and variations of such words and similar expressions, as they relate to us, our business and our management, are intended to identify such forward-looking statements. Forward-looking statements should not be read as a guarantee of future performance or results, and will not necessarily be accurate indications of the times at, or by, which such performance or results will be achieved. Forward-looking statements are based on information available at the time those statements are made and/or management’s good faith belief as of that time with respect to future events, and are subject to risks and uncertainties that could cause actual performance or results to differ materially from those expressed in or suggested by the forward-looking statements. Factors that might cause or contribute to such differences include, but are not limited to, those discussed in this Annual Report under the section entitled “Risk Factors” under Part I, Item 1A and elsewhere in this Annual Report, and in other reports we file with the Securities and Exchange Commission (SEC), including our quarterly reports on Form 10-Q.
Forward-looking statements speak only as of the date the statements are made. You should not put undue reliance on any forward-looking statements. We assume no obligation to update forward-looking statements to reflect actual results, changes in assumptions or changes in other factors affecting forward-looking information, except to the extent required by applicable securities laws. If we do update one or more forward-looking statements, no inference should be drawn that we will make additional updates with respect to those or other forward-looking statements.
ITEM 1. BUSINESS
We develop a broad range of low-power, high-performance mixed-signal semiconductor solutions that optimize our customers’ applications in key markets. In addition to our market-leading timing products, we offer semiconductors targeting communications infrastructure - both wired and wireless - high-performance computing and power management. These products are used for next-generation development in areas such as 4G infrastructure, network communications, cloud data centers and power management for computing and mobile devices.
Our top talent and technology paired with an innovative product-development philosophy allows us to solve complex customer problems when designing communications, computing and consumer applications. Through system-level analog and digital innovation, we consistently deliver extraordinary value to our customers.
On a worldwide basis, we primarily market our products to original equipment manufacturers (OEMs) through a variety of channels, including direct sales, distributors, electronic manufacturing suppliers (EMSs) and independent sales representatives.
IDT was incorporated in California in 1980 and reincorporated in Delaware in 1987. The terms “the Company,” “IDT,” “our,” “us” and “we” refer to Integrated Device Technology, Inc. and its consolidated subsidiaries, where applicable.
Available Information
We electronically file our annual reports on Form 10-K, quarterly reports on Form 10-Q and current reports on Form 8-K pursuant to Section 13(a) or 15(d) of the Exchange Act with the SEC. The public may read or copy any materials we file with the SEC at the SEC’s Public Reference Room at 100 F Street, NE, Washington, DC 20549. The public may obtain information on the operation of the Public Reference Room by calling the SEC at 1-800-SEC-0330. The SEC maintains an Internet site that contains reports, proxy and information statements, and other information regarding issuers that file electronically with the SEC at http://www.sec.gov. You may obtain a free copy of our annual reports on Form 10-K, quarterly reports on Form 10-Q and current reports on Form 8-K and amendments to those reports filed with or furnished to the SEC on our website at http://www.IDT.com, by contacting the Investor Relations Department at our corporate offices by calling (408) 284-8200 or by sending an e-mail message to ir@IDT.com. The information on our website is not part of this Annual Report on Form 10-K.
Products and Markets
We design, develop, manufacture and market a broad range of semiconductor solutions for the advanced communications, computing and consumer industries. By leveraging our products and market knowledge, we deliver high value to our customers' applications through system-level analog and digital innovations.
3
We measure our business based on two reportable segments: the Communications segment and the Computing and Consumer segment. In fiscal 2015, the Communications segment and the Computing and Consumer segment accounted for approximately 55% and 45%, respectively, of our revenues from continuing operations of $572.9 million. In fiscal 2014, the Communications segment and the Computing and Consumer segment accounted for approximately 60% and 40%, respectively, of our revenues from continuing operations of $484.8 million. In fiscal 2013, the Communications segment and the Computing and Consumer segment accounted for approximately 53% and 47%, respectively, of our revenues from continuing operations of $484.5 million. For further information, see “Note 18 - Segment Information” in Part II, Item 8 of this Form 10-K.
Communications Segment
The Communications segment includes clock and timing solutions, flow-control management devices including Serial RapidIO® switching solutions, and radio frequency (RF) products.
Communications Timing Products: We are the leading provider of silicon timing solutions, offering a complete portfolio of products for clock generation, distribution, recovery and jitter attenuation to serve performance-oriented applications. Created for networking, wireless infrastructure, wireline communications, advanced computing, and enterprise storage applications, our communications clocks include high-performance and high-reliability frequency generation and clock distribution products enabling advanced clock-tree development, clock synthesizers optimized for the latest processors and SOCs, ultra-low jitter clock sources, jitter attenuation and frequency translation PLLs, RF timing products, and solutions for Synchronous Ethernet and IEEE1588.
Serial RapidIO Solutions: Our extensive line of high-performance, low-power, low-latency RapidIO switches are ideal for peer-to-peer multiprocessor embedded systems up to 6.25 Gbaud per serial link. IDT's RapidIO switches deliver industry-leading interoperability, configurability, and power per port. We currently ship five generations of RapidIO switches in wireless, video, military, and industrial applications supporting both the RapidIO 1.3 and 2.1 standards. RapidIO switches are the backbone of 3G and 4G wireless base stations for chip-to-chip, board-to-board and chassis-to-chassis links including secure encryption/decryption of the S-RIO protocol for out-of-the-box cabling.
RF Products: We offer high-performance and full-featured RF signal path products to complement our clocks and timing, RapidIO, and other industry-leading devices from our rich communications portfolio. Our comprehensive portfolio of performance-leading products includes radio frequency (RF) to intermediate frequency (IF) mixers, intermediate frequency (IF) variable gain amplifiers (VGA), digital step attenuators (DSA), digital pre-distortion (DPD) demodulators, IF modulators, and RF switches.
Computing and Consumer Segment
The Computing and Consumer Segment includes clock generation and distribution products, high-performance server memory interface products, PCI Express® switching solutions, power management solutions and signal integrity products.
Consumer and Computing Timing Products: Our timing products consist of custom and off-the-shelf solutions optimized for digital consumer and computing applications. Consumer timing products include programmable timing devices that address in-system programming and test and I/O translation. By directly enhancing design flexibility, portability and reliability, these products also reduce inventory and test costs. Our other consumer clocks include fanout and zero-delay buffers, crystal oscillators and spread-spectrum clock generators.
We offer the industry’s largest portfolio of computing timing products for all generations of motherboards. Our computing timing solutions offer a unique combination of features and high performance, enabling leading-edge technologies, such as PCI Express, as well as registered and load-reduced dual in-line memory modules (RDIMMs and LRDIMMs). Other computing timing products include synthesizers and volume-controlled crystal oscillators. In addition, we provide customized clock solutions, offering optimized feature sets to meet the needs of specific motherboards.
Memory Interface Products: The broad range of our products for RDIMMs and LRDIMMs is a direct result of our significant experience in timing, high-speed serial interface and logic technologies. We offer register and PLL chipsets to meet the latest memory speed needs of server and workstation devices, including Single Data Rate (SDR), Double Data Rate (DDR), DDR2, DDR3, and DDR4 memory technology.
High-Performance Computing Products: We offer high-performance DDR3 and DDR4 RDIMM and LRDIMM memory interface solutions, RapidIO, PCI Express switches and bridges, signal integrity products, world-class timing, and high-efficiency power management solutions for high-performance computing and cloud-based enterprise server applications. In addition, we have been teaming with other technology companies to develop high-performance platforms using RapidIO in data centers.
4
PCI Express Switching Solutions: Our family of PCI Express switching solutions is aimed at high-performance server, storage, embedded and communications applications. Moreover, we offer a complete integrated hardware/software development kit that includes evaluation boards, software drivers and a graphical user interface that enables complete system configuration and optimization. Our PCIe Gen1, Gen2 and Gen3 devices are optimized for I/O expansion system interconnects and inter-domain communications.
Power Management Solutions: Our power management portfolio includes the industry's first true single-chip Qi-certified wireless power transmitter and Qi-compliant wireless power receiver ICs, as well as dual-mode single-chip wireless power receivers that support both the Wireless Power Consortium (WPC) Qi and the Power Matters Alliance (PMA) standards. We offer an expanding selection of power management integrated circuits (PMICs), including intelligent, scalable, distributed power management for portable multi-core processors.
We are a leader in wireless power transmitter and receiver solutions for battery charging applications, with proven expertise in developing solutions for both magnetic induction and magnetic resonance technologies. Addressing all major standards and technologies, our highly integrated and innovative transmitter ICs are designed for use in wireless charging stations in homes, offices, libraries, stores, public waiting areas, airports and airplane seats. Our receiver ICs are targeted for use in portable devices and accessories. We participate in all major industry associations and ecosystems, including the WPC, PMA and Alliance for Wireless Power (A4WP).
Signal Integrity Products: Computing and storage applications face increasing signal integrity challenges as data rates continuously rise. The high-speed I/O used in today’s systems make cost-effective and reliable PCB design complicated. Our signal integrity products condition signals and help alleviate constraints in computing, storage and communications applications.
Sales Channels
We sell our semiconductor products through three channels: direct sales to OEMs and EMS providers, consignment sales to OEMs and EMSs, and sales through distributors. Direct sales are managed mainly through our internal sales force and independent sales representatives. Revenue is recognized on direct sales based on the relevant shipping terms. During fiscal 2015, direct sales accounted for approximately 19% of our total worldwide revenues.
Consignment sales relate to areas where we have established hubs at or near key customers to allow them quick access to our products. We retain ownership of the product at consignment locations until the product is pulled by the customer. Consignment sales are managed by our internal sales team and accounted for approximately 19% of our total worldwide revenues in fiscal 2015.
The majority of our sales are through distributors. In general, distributors who serve our customers worldwide and distributors who serve our customers in the U.S. and Europe, have rights to price protection, ship from stock pricing credits and stock rotations. Due to the uncertainty of the amount of the credits related to these programs, revenue is not recognized until the product has been sold by the distributor to an end customer. Distributors serving only the Asia Pacific region, excluding Japan (APAC) and Japan distributors have limited stock rotation and little or no price protection rights. Revenue is recognized upon shipment to these distributors as we are able to reasonably estimate the amount of pricing adjustments and stock rotation returns. Revenue recognized on a sell through basis through distribution represented approximately 18% of our total worldwide revenues in fiscal 2015, while revenue through distribution recognized upon shipment represented 44% of our total worldwide revenues in the same period.
Sales through two, one and three distributors each accounted for 10% or more of our total revenues in fiscal 2015, 2014 and 2013, respectively. Sales through a distributor, Avnet and its affiliates, represented approximately 11%, 12% and 10% of our total revenues in fiscal 2015, 2014 and 2013, respectively. Sales through a distributor, Maxtek and its affiliates represented approximately 13% of our total revenues in fiscal 2013. Sales through another distributor, Uniquest, represented approximately 16% and 10%, of our total revenues in fiscal 2015 and 2013, respectively. No other distributor or single direct or consignment customer represented 10% or more of our total revenues in fiscal 2015, 2014 and 2013.
Customers
We market our products on a worldwide basis, primarily to OEMs who, in turn, incorporate our products into the customers’ products marketed under their brands. We work closely with our OEM customers to design and integrate current and next generation products to meet the requirements of end users. Many of our end customer OEMs have outsourced their manufacturing to a concentrated group of global EMSs and original design manufacturers (ODMs), who then buy product directly from us or through our distributors on behalf of the OEM. These EMSs and ODMs have achieved greater autonomy in design win, product qualification and product purchasing decisions, especially for commodity products. No direct OEM customer accounted for 10% or more of our total revenues in fiscal 2015, 2014 and 2013.
5
Manufacturing
We currently use third-party foundries that are primarily located in the APAC region who provide wafer fabrication requirements for our products. We assemble or package products at several different subcontractors in the APAC region. Utilizing several different subcontractors located in different countries enables us to negotiate lower prices and limits the risk associated with production concentration in one country or company. The criteria used to select assembly subcontractors include, but are not limited to, cost, quality, delivery, and subcontractor financial stability. We perform the vast majority of our test operations at our test facility located in Malaysia. A relatively small amount of test operations are also performed at third-party subcontractors in the APAC region.
Backlog
We offer custom designed products, as well as industry-standard products and ASSPs. Sales are made primarily pursuant to standard purchase orders, which are frequently revised by customers as their requirements change. We have also entered into master purchase agreements, which do not require minimum purchase quantities, with many of our OEM and EMS customers. We schedule product deliveries upon receipt of purchase orders under the related customer agreements. Generally, these purchase orders and customer agreements, especially those for standard products, also allow customers to change the quantities, reschedule delivery dates and cancel purchase orders without significant penalties. In general, orders, especially for industry standard products, are often made with very short lead times and may be canceled, rescheduled, re-priced or otherwise revised prior to shipment. In addition, certain distributor orders are subject to price adjustments both before and after shipment. For all these reasons, we do not believe that our order backlog is a reliable indicator of future revenues.
Seasonal Trends
Certain of our products are sold in the computing and consumer end markets which generally have followed annual seasonal trends. Historically, sales of products for these end markets have been higher in the second and third quarters of the fiscal year as consumer purchases of PCs and gaming systems increase significantly in the second half of the calendar year due to back-to-school and holiday demand.
Research and Development
Our research and development efforts emphasize the development and design of proprietary, differentiated, high-performance, low-power analog and mixed-signal semiconductor products. We believe that a sustained level of investment in research and development is necessary to maintain our competitive position. We operate research and development centers in Irvine and San Jose, California; Tempe, Arizona; Fort Meyers, Florida; Duluth, Georgia; Westford, Massachusetts; Cary, North Carolina; Smithfield, Rhode Island; Ottawa, Canada and Shanghai, China. Research and development expenses, as a percentage of revenues, were approximately 22%, 29% and 33% in fiscal 2015, 2014 and 2013, respectively.
Our product development activities are focused on the design of integrated circuits that provide differentiated features and enhanced performance primarily for communications, computing and consumer applications.
Competition
The semiconductor industry is characterized by rapid technological advances, cyclical market patterns, erosion of product sale prices and evolving industry standards. Many of our competitors have substantially greater technical, marketing, manufacturing or financial resources than we do. In addition, several foreign competitors receive financial assistance from their governments, which could give them a competitive advantage. We compete in different product areas to varying degrees on the basis of technical innovation and product performance, as well as product quality, availability and price.
Our competitive strategy is to use our applications expertise to develop a deep understanding of customers’ systems and to use our unique combination of analog and digital technologies to develop complete product portfolios that solve our customers’ whole problem. We differentiate our products through innovative configurations, proprietary features, high performance, and breadth of offerings. Our ability to compete successfully and to expand our business will depend on a number of factors, including but not limited to:
▪ | Performance, feature, quality and price of our products; |
▪ | Timing and success of new product introductions by us, our customers and our competitors; |
▪ | Quality of technical service and support and brand awareness; |
▪ | Cost effectiveness of our design, development, manufacturing and marketing efforts; and |
▪ | Global economic conditions. |
We compete with product offerings from numerous companies, including Analog Devices, Inc.; Avago Technologies; Cypress Semiconductor Corporation; Inphi Corporation; Linear Technology Corporation; Maxim Integrated Products, Inc.; Micrel Incorporated; Montage Technology; On Semiconductor Corporation; Pericom Semiconductor Corporation; Silicon Laboratories Inc.; Skyworks Solutions Inc.; and Texas Instruments Inc.
6
Intellectual Property and Licensing
We rely primarily on our patents, trade secrets, contractual provisions, licenses, copyrights, trademarks, and other proprietary rights mechanisms to protect our intellectual property. We believe that our intellectual property is a key corporate asset, and we continue to invest in intellectual property protection. We also intend to increase the breadth of our patent portfolio. There can be no assurance that any patents issued to us will not be challenged, invalidated or circumvented, that the rights granted thereunder will provide competitive advantages to us or that our efforts to protect our intellectual property rights will be successful.
In recent years, there has been a growing trend of companies resorting to litigation to protect their semiconductor technology from unauthorized use by others. We have been involved in patent litigation, which has adversely affected our operating results. Although we have obtained patent licenses from certain semiconductor manufacturers, we do not have licenses from a number of semiconductor manufacturers with broad patent portfolios. While we are not knowingly infringing on any of their patents, these semiconductor manufacturers may resort to litigation or other means in an effort to allege infringement and force us to obtain licenses to their patents. Our success will depend in part on our ability to obtain necessary intellectual property rights and protect our intellectual property rights. While we have filed patent applications, we cannot be certain that these applications will issue into patents or that we will be able to obtain the patent coverage and other intellectual property rights necessary to protect our technology. Further, we cannot be certain that once granted, the intellectual property rights covered by such patents will not be challenged by other parties.
Environmental Regulation
We are committed to protecting the environment and the health and safety of our employees, customers and the public. We endeavor to adhere to the most stringent standards across all of our facilities, to encourage pollution prevention and to strive towards continual improvement. As an integral part of our total quality management system, we strive to exceed compliance with regulatory standards in order to achieve a standard of excellence in environmental, health and safety management practices.
Our manufacturing facilities are subject to numerous environmental laws and regulations, particularly with respect to the storage, handling, use, discharge and disposal of certain chemicals, gases and other substances used or produced in the semiconductor manufacturing process. Compliance with these laws and regulations has not had a material impact on our capital expenditures, earnings, financial condition or competitive position. Although we believe that we are fully compliant with all applicable environmental laws and regulations there can be no assurance that current or future environmental laws and regulations will not impose costly requirements upon us. Any failure by us to comply with applicable environmental laws and regulations could result in fines, suspension of production and legal liability.
Employees
As of March 29, 2015, we had approximately 1,447 employees worldwide, with approximately 651 employees located in the United States. Our future success depends in part on our ability to attract and retain qualified personnel, particularly engineers, who are often in great demand. We have implemented policies enabling our employees to share in our success, including stock option, restricted stock unit, stock purchase and incentive bonus plans. We have never had a work stoppage related to labor issues. With the exception of 41 employees in France, none of our employees are currently represented by a collective bargaining agreement.
ITEM 1A. RISK FACTORS
Investing in our common stock involves a high degree of risk. You should carefully consider the risks and uncertainties described below and all information contained in this report before you decide to purchase our common stock. These risk factors are intended to highlight certain factors that may affect our financial condition and results of operations and are not meant to be an exhaustive discussion of risks that we may face. Our operations could also be affected by factors that are not presently known to us or that we currently consider to be immaterial to our operations. Due to risk and uncertainties, both known and unknown, we may be unable to conduct our business as currently planned and our financial condition and operating results could be adversely impacted. In addition, the price of our securities is subject to volatility and could decline due to the occurrence of any of these risks, causing investors to lose all or part of their investment.
Our operating results can fluctuate dramatically. Our operating results have fluctuated in the past and are likely to vary in the future. Past financial results may not be a reliable indicator of future performance. Fluctuations in operating results can result from a wide variety of factors, including:
• | global economic conditions, including those related to the credit markets; |
• | the cyclicality of the semiconductor industry; |
• | changes in the demand for and mix of products sold and in the markets we and our customers serve; |
7
• | the availability of industry-wide wafer processing capacity; |
• | the availability of industry-wide and package specific assembly subcontract capacity and related raw materials; |
• | competitive pricing pressures; |
• | the success and timing of new product and process technology announcements and introductions from us or our competitors; |
• | potential loss of market share among a concentrated group of customers; |
• | difficulty in attracting and retaining key personnel; |
• | difficulty in predicting customer product requirements; |
• | production difficulties and interruptions caused by our complex manufacturing and logistics operations; |
• | limited control over our manufacturing and product delivery as a result of our reliance on subcontractors, foundry and other manufacturing services; |
• | unrealized potential of acquired businesses and resulting assets impairment; |
• | availability and costs of raw materials from a limited number of suppliers; |
• | political, economic and health conditions in various geographic areas; |
• | timing and execution of plans and programs subject to foreign labor law requirements, including consultation with work councils; |
• | reduced customer demand as a result of the impact from natural and/or man-made disasters which may adversely impact our customer's manufacturing capability or reduce our customer's ability to acquire critical materials or components to manufacture their end products; |
• | costs associated with other events, such as intellectual property disputes or other litigation; and |
• | legislative, tax, accounting, or regulatory changes or changes in their interpretation. |
Global economic and geo-political conditions may adversely affect our business and results of operations.
We have and/or rely on facilities and operations in many countries throughout the world and some of our operations are concentrated in one or more geographic regions. Further, approximately 89% of our revenue comes from shipments to locations outside the United States. As a result of the breadth of our international operations, we are subject to the potential for substantial volatility in global capital markets and the global demand for semiconductor product. Our financial results and operations, including our ability to manufacture, assemble and test, design, develop and sell products, may be adversely affected by various global economic and geo-political conditions which can include:
• | slow, uneven economic growth throughout the world; |
• | uncertainty regarding macroeconomic conditions and/or an institutional or economic collapse in a geographic region; |
• | geo-political events and security breaches throughout the world, such as armed conflict, civil or military unrest, political instability, terrorist activity, cyber attacks and data fraud or theft; |
• | natural disasters and public health issues including pandemics and outbreaks of infectious diseases; and |
• | large scale disruptions in transportation, communications and information technology networks. |
The cyclicality of the semiconductor industry exacerbates the volatility of our operating results.
The semiconductor industry is highly cyclical and has experienced significant downturns, often in connection with product cycles of both semiconductor companies and their customers, but also related to declines in general economic conditions. These downturns have been characterized by volatile customer demand, high inventory levels and accelerated erosion of average selling prices. Any future economic downturns could materially and adversely affect our business from one period to the next relative to demand and product pricing. In addition, the semiconductor industry may experience periods of increased demand, during which we may experience internal and external manufacturing constraints. We may also experience substantial changes in future operating results due to the cyclical nature of the semiconductor industry.
Demand for our products depends primarily on demand in the communications, enterprise computing, personal computer (PC), and consumer markets which can be significantly affected by concerns over macroeconomic issues.
Our product portfolio consists predominantly of semiconductor solutions for the communications, computing, and consumer markets. Our strategy and resources are directed at the development, production and marketing of products for these markets. The markets for our products will depend on continued and growing demand for communications equipment, servers, PCs and consumer electronics. These end-user markets may experience changes in demand that could adversely affect our business and could be greater in periods of economic uncertainty and contraction. To the extent demand or markets for our products do not grow, our business could be adversely affected.
We rely upon subcontractors and third-party foundries.
We are dependent on third-party subcontractors for all of our assembly operations. We are also dependent on third-party outside foundries for the manufacture of our silicon wafers. Our reliance on subcontractors and third-party foundries for our current products presents certain risks because we will have less control over manufacturing quality and delivery schedules, maintenance
8
of sufficient capacity to meet our orders and maintaining in place the manufacturing processes we require. During the fourth quarter of fiscal 2012, we completed the transfer of our internal wafer fabrication production to outside foundries. Due to production lead times and potential capacity constraints, any failure on our part to adequately forecast the mix of product demand and resulting foundry and subcontractor requirements could adversely affect our operating results. In addition, we cannot be certain that these foundries and subcontractors will continue to manufacture, assemble, package and test products for us on acceptable economic and quality terms, or at all, and it may be difficult for us to find alternatives in a timely and cost-effective manner if they do not do so.
We build most of our products based on estimated demand forecasts.
Demand for our products can change rapidly and without advance notice. Demand can also be affected by changes in our customers' levels of inventory and differences in the timing and pattern of orders from their end customers. A large percentage of our revenue in the APAC region is recognized upon shipment to our distributors. Consequently, we have less visibility over both inventory levels at our distributors and end customer demand for our products. Further, the distributors have assumed more risk associated with changes in end demand for our products. Accordingly, significant changes in end demand in the semiconductor business in general, or for our products in particular, may be difficult for us to detect or otherwise measure, which could cause us to incorrectly forecast end-market demand for our products. If we are not able to accurately forecast end demand for our products, we may be left with large amounts of unsold products, may not be able to fill all actual orders, and may not be able to efficiently utilize our existing manufacturing capacity or make optimal investment and other business decisions. As a result, we may end up with excess and obsolete inventory or we may be unable to meet customer short-term demands, either of which could have an adverse impact on our operating results.
If we are unable to execute our business strategy successfully, our revenues and profitability may be adversely affected.
Our future financial performance and success are largely dependent on our ability to execute our business strategy successfully. Our present business strategy to be a leading provider of essential mixed signal semiconductor solutions will be affected, without limitation, by: (1) our ability to continue to aggressively manage, maintain and refine our product portfolio including focus on the development and growth of new applications; (2) our ability to continue to maintain existing customers, aggressively pursue and win new customers; (3) our ability to successfully develop, manufacture and market new products in a timely manner; (4) our ability to develop new products in a more efficient manner; (5) our ability to sufficiently differentiate and enhance our products; (6) our ability to successfully deploy research and development (R&D) investment in the areas of displays, silicon timing, power management, signal integrity and radio frequency, and (7) our ability to improve our results of operations.
Our business strategy is based on our assumptions about the future demand for our current products and the new products and applications that we are developing and on our ability to produce our products profitably. We may not be successful in carrying out our business strategy. Further, some or all of our assumptions may be incorrect and our business strategy may not sustain or improve our results of operations. In particular, we may not be able to build our position in markets with high growth potential, increase our volume or revenue, rationalize our manufacturing operations or reduce our costs and expenses.
In addition, circumstances beyond our control and changes in our business or industry may require us to change our business strategy at any given time.
We face significant competition.
The semiconductor industry is highly competitive and subject to rapid market developments and changes in industry standards, trends and desirable technology. If we do not anticipate and respond to these developments, our competitive position may weaken and our products and/or technologies may become undesirable or obsolete. Further, the price and product development pressures that result from competition may lead to reduced profit margins and lost business opportunities in the event that we are unable to match the price decline or cost efficiencies or advancements of our competitors.
Our results are dependent on the success of new products.
The markets we serve are characterized by competition, rapid technological change, evolving standards, short product life cycles and continuous erosion of average selling prices. Consequently, our future success will be highly dependent upon our ability to continually develop new products using the latest and most cost-effective technologies, introduce our products in commercial quantities to the marketplace ahead of the competition and have our products selected for inclusion in leading system manufacturers' products. In addition, the development of new products will continue to require significant R&D expenditures. If we are unable to successfully develop, produce and market new products in a timely manner, have our products available in commercial quantities ahead of competitive products or have our products selected for inclusion in products of systems manufacturers and sell them at gross margins comparable to or better than our current products, our future results of operations could be adversely affected. In addition, our future revenue growth is also partially dependent on our ability to penetrate new markets in which we have limited experience and where competitors are already entrenched. Future success for certain new products will also depend on the development of product solutions for new emerging markets and new applications for existing markets. The success of such
9
products is dependent on the ability of our customers and their customers to successfully develop new markets and gain market acceptance for new product solutions in those markets. Even if we are able to develop, produce and successfully market new products in a timely manner, such new products may not achieve market acceptance. The above described events could have a variety of negative effects on our competitive position and our financial results, such as reducing our revenue, increasing our costs, lowering our gross margin percentage, and ultimately leading to impairment of assets.
The loss of the services of any key personnel may adversely affect our business and growth prospects.
Our performance is substantially dependent on the performance of our executive officers and key employees. The loss of the services of any of our executive officers, technical personnel or other key employees could adversely affect our business. In addition, our future success depends on our ability to successfully compete with other technology firms in attracting and retaining specialized technical and management personnel. If we are unable to identify, hire, and retain highly qualified technical and managerial personnel, our business and growth prospects could be adversely affected.
We are dependent on a concentrated group of customers for a significant part of our revenues.
A large portion of our revenues depends on sales to a limited number of customers. If these relationships were to diminish, or if these customers were to develop their own solutions or adopt a competitor's solution instead of buying our products, our results could be adversely affected.
Many of our end-customer OEMs have outsourced their manufacturing to a concentrated group of global EMSs and original design manufacturers (ODMs) who then buy products directly from us or from our distributors on behalf of the OEM. These EMSs and ODMs have achieved greater autonomy in the design win, product qualification and product purchasing decisions, especially for commodity products. Competition for the business from EMSs and ODMs is intense and there is no assurance we can remain competitive and retain our existing market share with these customers. If these companies were to allocate a higher share of commodity or second-source business to our competitors instead of buying our products, our results would be adversely affected. Furthermore, as EMSs and ODMs have represented a growing percentage of our overall business, our concentration of credit and other business risks with these customers has increased. Competition among global EMSs and ODMs is intense as they operate on very low margins. If any one or more of our global EMSs or ODMs customers were to file for bankruptcy or otherwise experience significantly adverse financial conditions, our business would be adversely affected as well.
In addition, we utilize a relatively small number of global and regional distributors around the world, who buy product directly from us on behalf of their customers. If our business relationships with any of these distributors were to diminish or any of these distributors were to file for bankruptcy or otherwise experience significantly adverse financial conditions, our business could be adversely affected. Because we continue to be dependent on product demand from a small group of OEM end customers and global and regional distributors, any material delay, cancellation or reduction of orders from or loss of these or other major customers could cause our revenue to decline significantly.
We are dependent on a limited number of suppliers.
Our manufacturing operations depend upon obtaining adequate raw materials on a timely basis. The number of suppliers of certain raw materials, such as silicon wafers, ultra-pure metals and certain chemicals and gases needed for our products, is very limited. In addition, certain packages for our products require long lead times and are available from only a few suppliers. From time to time, suppliers have extended lead times or limited supply to us due to capacity constraints. Our results of operations would be materially and adversely affected if we were unable to obtain adequate supplies of raw materials in a timely manner or if there were significant increases in the costs of raw materials, or if foundry or assembly subcontractor capacity were not available, or if capacity were only available at unfavorable prices.
Our operations and business could be significantly harmed by natural disasters or acts of terrorism.
A majority of the third-party foundries and subcontractors we currently use are located in Malaysia, South Korea, the Philippines, Taiwan, Thailand, and China. In addition, we own a test facility in Malaysia. The risk of an earthquake or tsunami in these Pacific Rim locations is significant. The occurrence of an earthquake, drought, flood, fire, or other natural disaster near any of these locations could cause a significant reduction of end-customer demand and/or availability of materials, a disruption of the global supply chain, an increase in the cost of products that we purchase, and otherwise interfere with our ability to conduct business. In addition, public health issues, acts of terrorism, armed conflicts or other catastrophic events could significantly delay the production or shipment of our products. Although we maintain insurance for some of the damage that may be caused by natural disasters, our insurance coverage may not be sufficient to cover all of our potential losses and would not cover us for lost business. As a result, a natural disaster in one or more of these regions could have a material adverse effect on our financial condition and results of operations.
10
Costs related to product defects and errata may harm our results of operations and business.
Costs associated with unexpected product defects and errata, or deviations from published specifications, due to, for example, unanticipated problems in our design and manufacturing processes, could include:
• | writing off the value of inventory of such products; |
• | disposing of products that cannot be fixed; |
• | recalling such products that have been shipped to customers; |
• | providing product replacements for, or modifications to, such products; and |
• | defending against litigation related to such products. |
These costs could be substantial and may therefore increase our expenses and lower our gross margin. In addition, our reputation with our customers or users of our products could be damaged as a result of such product defects and errata, and the demand for our products could be reduced. The announcement of product defects and/or errata could cause customers to purchase products from our competitors as a result of anticipated shortages of our components or for other reasons. These factors could harm our financial results and the prospects for our business.
Intellectual property claims against and/or on behalf of us could adversely affect our business and operations.
The semiconductor industry is characterized by vigorous protection and pursuit of intellectual property rights, which has resulted in significant and often protracted and expensive litigation. We have been involved with patent litigation and asserted intellectual property claims in the past, both as a plaintiff and a defendant, some of which have adversely affected our operating results. Although we have obtained patent licenses from certain semiconductor manufacturers, we do not have licenses from a number of semiconductor manufacturers that have broad patent portfolios. Claims alleging infringement of intellectual property rights have been asserted against us in the past and could be asserted against us in the future.
As a result of these claims, we may have to discontinue the use of certain processes, license certain technologies, cease the manufacture, use, and sale of infringing products, incur significant litigation costs and damages, indemnify customers against certain claims made against them, and develop non-infringing technology. We might not be able to obtain such licenses on acceptable terms or develop non-infringing technology. Further, the failure to renew or renegotiate existing licenses on favorable terms, or the inability to obtain a key license, could materially and adversely affect our business. Future litigation, either as a plaintiff or a defendant, could adversely affect our operating results, as a result of increased expenses, the cost of settled claims, and/or payment of damages.
We may be unable to enforce or protect our intellectual property rights.
We rely on patents, copyrights, trade secrets, mask rights, and other intellectual property rights as well as confidentiality and licensing agreements to protect our intellectual property interests. Our ability to enforce these rights is subject to general litigation risks, as well as uncertainty as to the enforceability of these rights in various countries. Should we seek to enforce our intellectual property rights, we could be subject to claims that our intellectual property rights are invalid or otherwise not enforceable. Our assertion of our intellectual property rights may result in the other party seeking to assert claims against us, which could be disruptive to and/or harm our business. Our inability to enforce our intellectual property rights under any of these circumstances may harm our competitive position and business.
We rely on access to third-party intellectual property, which may not be available to us on commercially reasonable terms or at all.
Some of our products include third-party intellectual property and/or implement industry standards, which may require licenses from third parties. Based on past experience and industry practice, we believe such licenses generally can be obtained on commercially reasonable terms. However, there is no assurance that the necessary licenses can be obtained on acceptable terms or at all. Failure to obtain the right to use third-party intellectual property, or to use such intellectual property on commercially reasonable terms, could preclude us from selling certain products or otherwise have a material adverse impact on our financial condition and operating results.
Our product manufacturing operations are complex and subject to interruption.
From time to time, we have experienced production difficulties, including lower manufacturing yields or products that do not meet our or our customers' specifications, which has resulted in delivery delays, quality problems and lost revenue opportunities. While delivery delays have been infrequent and generally short in duration, we could experience manufacturing problems, capacity constraints and/or product delivery delays in the future as a result of, among other things, the complexity of our manufacturing processes, changes to our process technologies (including transfers to other facilities and die size reduction efforts), and difficulties in ramping production. In addition, any significant quality problems could damage our reputation with our customers and could
11
take focus away from the development of new and enhanced products. These could have a significant negative impact on our financial results.
We are dependent upon electric power and water provided by public utilities where we operate our manufacturing facility. We maintain limited backup generating capability, but the amount of electric power that we can generate on our own is insufficient to fully operate this facility, and prolonged power interruptions and restrictions on our access to water could have a significant adverse impact on our business.
We have made and may continue to make acquisitions and divestitures which could divert management's attention, cause ownership dilution to our stockholders, be difficult to integrate, and/or adversely affect our financial results.
Acquisitions and divestitures are commonplace in the semiconductor industry and we have acquired and divested, and may continue to acquire or divest, businesses and technologies. Integrating newly acquired businesses or technologies could put a strain on our resources, could be costly and time consuming, and might not be successful. Acquisitions or divestitures could divert our management's attention and other resources from other business concerns. In addition, we might lose key employees while integrating new organizations. Acquisitions and divestitures could also result in customer dissatisfaction, performance problems with an acquired company or technology, dilutive or potentially dilutive issuances of equity securities, the incurrence of debt, the assumption or incurrence of contingent liabilities, or other unanticipated events or circumstances, any of which could harm our business. Consequently, we might not be successful in acquiring or integrating any new businesses, products, or technologies, and might not achieve anticipated revenues and cost benefits. In addition, we might be unsuccessful in finding or completing acquisition or divestiture opportunities on acceptable terms in a timely manner.
Tax benefits we receive may be terminated or reduced in the future, which would increase our costs.
As a result of our international manufacturing operations, a significant portion of our worldwide profits are in jurisdictions outside the United States, primarily Malaysia, which has granted the Company significant reductions in tax rates. These lower tax rates allow us to record a relatively low tax expense on a worldwide basis. If U.S. corporate income tax laws were to change regarding deferral of U.S. income tax on foreign earnings or other matters impacting our operating structure, this would have a significant impact to our financial results.
We were granted a tax incentive in Malaysia during fiscal 2009. The tax incentive was contingent upon us continuing to meet specified investment criteria in fixed assets, and to operate as an APAC regional headquarters center. In the first quarter of fiscal 2012, we entered into an agreement with the Malaysia Industrial Development Board (MIDA) who agreed to cancel the previously granted tax incentive and entered into a new tax incentive. The updated tax incentive provides for a full tax exemption on statutory income for a period of 10 years commencing April 4, 2011. We are required to meet several conditions as to financial targets, investment, headcount and activities in Malaysia to retain this status. Our inability to renew this tax incentive when it expires or meet certain conditions of the agreement with MIDA may adversely impact our effective tax rate.
Our financial results may be adversely affected by higher than expected tax rates or exposure to additional tax liabilities. Tax audits may have a material adverse effect on our profitability.
As a global company, our effective tax rate is highly dependent upon the geographic composition of worldwide earnings and tax regulations governing each region in which we operate. We are subject to income taxes in the United States and various foreign jurisdictions, and significant judgment is required to determine worldwide tax liabilities. The United States and other countries where we do business have been considering changes in relevant tax laws applicable to multinational corporations such as ours. These potential changes could adversely affect our effective tax rate or result in higher cash tax liabilities. In addition, our effective tax rate could be adversely affected by changes in the mix of earnings between countries with differing statutory tax rates, by changes in the valuation of deferred tax assets, or by material audit assessments, which could affect our profitability. In particular, the carrying value of deferred tax assets, which are predominantly in the United States, is dependent upon our ability to generate future taxable income in the United States. In addition, the amount of income taxes we pay is subject to ongoing audits in various jurisdictions, and a material assessment by a governing tax authority such as the Internal Revenue Service in the United States could have a material effect on our profitability.
Also, we have not made a provision for U.S. income tax on the portion of our undistributed earnings of our non-US subsidiaries that is considered permanently reinvested outside the U.S. If in the future we repatriate any of these foreign earnings, we might incur incremental U.S. income tax, which could affect our results of operations.
The costs associated with legal proceedings can be substantial, specific costs are unpredictable and not completely within our control, and unexpected increases in litigation costs could adversely affect our operating results.
We have been, and continue to be, involved in various legal proceedings, such as those described below in Part I, Item 3 "Legal Proceedings." We may face legal claims or regulatory matters involving stockholder, consumer, competition and other issues on a global basis. The costs associated with legal proceedings are typically high, relatively unpredictable, and are not completely within our control. The costs may be materially more than expected, which could adversely affect our operating results. Moreover,
12
we may become involved in unexpected litigation with additional litigants at any time, which would increase our aggregate litigation costs, and could adversely affect our operating results. We are not able to predict the outcome of any legal action, and an adverse decision in any legal action could significantly harm our business and financial performance.
If the credit market conditions deteriorate, it could have a material adverse impact on our investment portfolio.
Although we manage our investment portfolio by purchasing only highly-rated securities and diversifying our investments across various sectors, investment types, and underlying issuers, recent volatility in the short-term financial markets has been high. We have no securities in asset-backed commercial paper and hold no auction rated or mortgage-backed securities. However, it is uncertain as to the full extent of the current credit and liquidity crisis and with possible further deterioration, particularly within one or several of the large financial institutions, the value of our investments could be negatively impacted.
Our results of operations could vary as a result of the methods, estimates, and judgments we use in applying our accounting policies.
The methods, estimates, and judgments we use in applying our accounting policies have a significant impact on our results of operations. Such methods, estimates, and judgments are, by their nature, subject to substantial risks, uncertainties and assumptions, and factors may arise over time that lead us to change our methods, estimates, and judgments. Changes in those methods, estimates, and judgments could significantly affect our results of operations. In particular, the calculation of stock-based compensation expense under the authoritative guidance requires us to use valuation methodologies that were not developed for use in valuing employee stock options and make a number of assumptions, estimates, and conclusions regarding matters such as expected forfeitures, expected volatility of our share price and the exercise behavior of our employees. Changes in these variables could affect our stock-based compensation expense and have a significant and potentially adverse effect on our gross margins, research and development expense and selling, general and administrative expense.
International operations add increased volatility to our operating results.
A substantial percentage of our total revenues are derived from international sales, as summarized below:
(percentage of total revenues) | Fiscal 2015 | Fiscal 2014 | Fiscal 2013 | |||||
APAC | 70 | % | 64 | % | 64 | % | ||
Americas | 12 | % | 15 | % | 16 | % | ||
Japan | 7 | % | 8 | % | 8 | % | ||
Europe | 11 | % | 13 | % | 12 | % | ||
Total | 100 | % | 100 | % | 100 | % | ||
In addition, our test facility in Malaysia, our design centers in Canada and China, and our foreign sales offices incur payroll, facility, and other expenses in local currencies. Accordingly, movements in foreign currency exchange rates can impact our revenues and costs of goods sold, as well as both pricing and demand for our products.
Our non-U.S. offshore sites, manufacturing subcontractors and export sales are also subject to risks associated with foreign operations, including:
• | political instability and acts of war or terrorism, which could disrupt our manufacturing and logistical activities; |
• | regulations regarding use of local employees and suppliers; |
• | exposure to foreign employment practices and labor laws; |
• | currency controls and fluctuations, devaluation of foreign currencies, hard currency shortages and exchange rate fluctuations; |
• | changes in local economic conditions; |
• | governmental regulation of taxation of our earnings and those of our personnel; and |
• | changes in tax laws, import and export controls, tariffs and freight rates. |
Our international locations are subject to local labor laws, which are often significantly different from U.S. labor laws and which may under certain conditions result in large separation costs upon termination.
Contract pricing for raw materials and equipment used in the fabrication and assembly processes, as well as for foundry and subcontract assembly services, may also be affected by currency controls, exchange rate fluctuations and currency devaluations. We sometimes hedge currency risk for currencies that are highly liquid and freely quoted, but may not enter into hedge contracts for currencies with limited trading volume. In addition, as much of our revenues are generated outside the United States, a significant portion of our cash and investment portfolio accumulates in the foreign countries in which we operate. On March 29, 2015, we had cash, cash equivalents and investments of approximately $433.4 million invested overseas in accounts belonging to our foreign subsidiaries. While these amounts are primarily invested in U.S. dollars, a portion is held in foreign currencies, and all offshore
13
balances are exposed to local political, banking, currency control and other risks. In addition, these amounts may be subject to tax and other transfer restrictions.
We rely upon certain critical information systems for the operation of our business.
We maintain and rely upon certain critical information systems for the effective operation of our business. These information systems include telecommunications, the Internet, our corporate intranet, various computer hardware and software applications, network communications, and e-mail. These information systems are subject to attacks, failures, and access denials from a number of potential sources including viruses, destructive or inadequate code, power failures, and physical damage to computers, communication lines and networking equipment. To the extent that these information systems are under our control, we have implemented security procedures, such as virus protection software and emergency recovery processes, to address the outlined risks. While we believe that our information systems are appropriately controlled and that we have processes in place to adequately manage these risks, security procedures for information systems cannot be guaranteed to be failsafe and our inability to use or access these information systems at critical points in time could unfavorably impact the timely and efficient operation of our business.
We are exposed to potential impairment charges on certain assets.
Over the past several years, we have made several acquisitions. As a result of these acquisitions, we had $135.6 million of goodwill and $5.5 million of intangible assets on our balance sheet as of March 29, 2015. In determining fair value, we consider various factors, including our market capitalization, forecasted revenue and costs, risk-adjusted discount rates, future economic and market conditions, determination of appropriate market comparables and expected periods over which our assets will be utilized and other variables. If our assumptions regarding forecasted cash flow, revenue and margin growth rates of certain long-lived asset groups and reporting units are not achieved, an impairment review may be triggered for the remaining balance of goodwill and long-lived assets prior to the next annual review in the fourth quarter of fiscal 2016, which could result in material charges that could impact our operating results and financial position.
Our reported financial results may be adversely affected by new accounting pronouncements or changes in existing accounting standards and practices.
We prepare our financial statements in conformity with accounting principles generally accepted in the United States. These accounting principles are subject to interpretation by the Financial Accounting Standards Board (FASB), SEC and various organizations formed to interpret and create appropriate accounting standards and practices. New accounting pronouncements and varying interpretations of accounting standards and practices have occurred and may occur in the future. New accounting pronouncements or a change in the interpretation of existing accounting standards or practices may have a significant effect on our reported financial results and may even affect our reporting of transactions completed before the change is announced or effective.
Our common stock may experience substantial price volatility.
Our stock price has experienced volatility in the past, and volatility in the price of our common stock may occur in the future, particularly as a result of fluctuations in global economic conditions and quarter-to-quarter variations in our actual or anticipated financial results, or the financial results of other semiconductor companies or our customers. Stock price volatility may also result from product announcements by us or our competitors, or from changes in perceptions about the various types of products we manufacture and sell. In addition, our stock price may fluctuate due to price and volume fluctuations in the stock market, especially in the technology sector, and as a result of other considerations or events described in this section.
We depend on the ability of our personnel, raw materials, equipment and products to move reasonably unimpeded around the world.
Any political, military, world health or other issue which hinders the worldwide movement of our personnel, raw materials, equipment or products or restricts the import or export of materials could lead to significant business disruptions. Furthermore, any strike, economic failure, or other material disruption on the part of major airlines or other transportation companies could also adversely affect our ability to conduct business. If such disruptions result in cancellations of customer orders or contribute to a general decrease in economic activity or corporate spending on information technology, or directly affect our marketing, manufacturing, financial and logistics functions, our results of operations and financial condition could be materially and adversely affected.
We invest in companies for strategic reasons and may not realize a return on our investments.
We make investments in companies around the world to further our strategic objectives and support our key business initiatives. Such investments include equity instruments of private companies, and many of these instruments are non-marketable at the time of our initial investment. These companies range from early-stage companies that are often still defining their strategic direction to more mature companies with established revenue streams and business models. The success of these companies is dependent on product development, market acceptance, operational efficiency, and other key business factors as well as their ability to secure
14
additional funding, obtain favorable investment terms for future financings, or participate in liquidity events such as public offerings, mergers, and private sales. If any of these private companies fail, we could lose all or part of our investment in that company. If we determine that other-than-temporary decline in the fair value exists for an equity investment in a private company in which we have invested, we write down the investment to its fair value and recognize the related write-down as an investment loss.
When the strategic objectives of an investment have been achieved, or if the investment or business diverges from our strategic objectives, we may decide to dispose of the investment. We may incur losses on the disposal of our non-marketable investments.
We are subject to a variety of environmental and other regulations related to hazardous materials used in our manufacturing processes.
The manufacturing and testing of our products require the use of hazardous materials that are subject to a broad array of environmental, health and safety laws and regulations. Any failure by us to adequately control the use or discharge of hazardous materials under present or future regulations could subject us to substantial costs or liabilities or cause our manufacturing operations to be suspended.
Existing and future environmental, health and safety laws and regulations could also require us to acquire pollution abatement or remediation equipment, modify our product designs, or incur other expenses associated with such laws and regulations. Many new materials that we are evaluating for use in our operations may be subject to regulation under existing or future environmental laws and regulations that may restrict our use of one or more of such materials in our manufacturing, and test processes, or products. Any of these restrictions could harm our business and results of operations by increasing our expenses or requiring us to alter our manufacturing and test processes.
Our operations could be affected by the complex laws, rules and regulations to which our business is subject.
We are subject to complex laws, rules and regulations affecting our domestic and international operations relating to, for example, environmental, safety and health; exports and imports; bribery and corruption; tax; data privacy; labor and employment; competition; and intellectual property ownership and infringement. Compliance with these laws, rules and regulations may be onerous and expensive, and if we fail to comply or if we become subject to enforcement activity, our ability to manufacture our products and operate our business could be restricted and we could be subject to fines, penalties or other legal liability. Furthermore, should these laws, rules and regulations be amended or expanded, or new ones enacted, we could incur materially greater compliance costs or restrictions on our ability to manufacture our products and operate our business.
ITEM 1B. UNRESOLVED STAFF COMMENTS
None.
ITEM 2. PROPERTIES
We own and operate a test facility in Malaysia (approximately 145,000 square feet). Our Malaysia facility is subject to ground leases.
Our corporate headquarters and various administrative, engineering and support functions are located in San Jose, California. We own and occupy approximately 263,000 square feet of space at our San Jose headquarters. We also lease various facilities throughout the world for sales and marketing functions and research and development, including design centers in the United States, Canada, Europe and Asia.
We believe that the facilities that we currently own or lease are suitable and adequate for our needs for the immediate future.
ITEM 3. LEGAL PROCEEDINGS
For a discussion of legal proceedings, please see “Note 15 – Commitments and Contingencies – Litigation” in Part II, Item 8 of this Annual Report on Form 10-K.
ITEM 4. MINE SAFETY DISCLOSURES
Not Applicable.
15
PART II
ITEM 5. MARKET FOR REGISTRANT'S COMMON EQUITY, RELATED STOCKHOLDER MATTERS AND ISSUER PURCHASES OF EQUITY SECURITIES
Price Range of Common Stock
Our Common Stock is traded on the NASDAQ Global Select Market under the symbol IDTI. The following table shows the high and low sales prices for our Common Stock as reported by the NASDAQ Global Select Market for the fiscal periods indicated:
High | Low | ||||||
Fiscal 2015 | |||||||
First Quarter | $ | 15.58 | $ | 10.86 | |||
Second Quarter | $ | 17.32 | $ | 13.07 | |||
Third Quarter | $ | 20.41 | $ | 11.94 | |||
Fourth Quarter | $ | 21.73 | $ | 16.66 | |||
Fiscal 2014 | |||||||
First Quarter | $ | 8.78 | $ | 6.48 | |||
Second Quarter | $ | 9.66 | $ | 7.92 | |||
Third Quarter | $ | 11.36 | $ | 9.15 | |||
Fourth Quarter | $ | 13.29 | $ | 9.18 | |||
Stockholders
As of May 15, 2015, there were approximately 650 record holders of our Common Stock. A substantial majority of our shares are held by brokers and other institutions on behalf of individual stockholders.
Dividends
We have never paid cash dividends on our Common Stock. We currently plan to retain any future earnings for use in our business and do not currently anticipate paying cash dividends in the foreseeable future.
Equity Incentive Programs
We primarily issue awards under our equity-based plans in order to provide additional incentive and retention to directors and employees who are considered to be essential to the long-rang success of the Company. Please see “Note 8 – Stock-Based Employee Compensation” in Part II, Item 8 of this Annual Report on Form 10-K.
Other equity plan information required by this Item is incorporated by reference to the information in Part III, Item 12 of this Annual Report on Form 10-K.
Issuer Purchases of Equity Securities
The following table sets forth information with respect to repurchases of our common stock for the three months ended March 29, 2015:
Period | Total Number of Shares Purchased | Average Price Paid Per Share | Total Number of Shares Purchased as Part of Publicly Announced Plans or Programs | Approximate Dollar Value of Shares that May Yet Be Purchased Under the Plans or Programs | |||||||||
December 29, 2014 - January 25, 2015 | 239,234 | $ | 18.49 | 239,234 | $ | 38,884,797 | |||||||
January 26, 2015 - February 22, 2015 | 281,000 | $ | 19.36 | 281,000 | $ | 33,440,310 | |||||||
February 23, 2015 - March 29, 2015 | 325,400 | $ | 20.55 | 325,400 | $ | 26,749,674 | |||||||
Total | 845,634 | $ | 19.57 | 845,634 | |||||||||
16
On October 22, 2013, our Board approved a share repurchase program authorization for $150 million. In fiscal 2013, we made no repurchases under the program. In fiscal 2014, we repurchased 4.1 million shares of our common stock for $44.0 million. In fiscal 2015, we repurchased 5.3 million shares of our common stock for $79.2 million.
As of March 29, 2015, approximately $26.7 million was available for future purchase under this share repurchase program. In April 2015, our Board approved a new share repurchase program authorization for $300 million. Share repurchases were recorded as treasury stock and resulted in a reduction of stockholders’ equity. The program is intended to reduce the number of outstanding shares of our common stock to offset dilution from employee equity grants and increase stockholder value.
Stock Performance Graph
Set forth below is a line graph comparing the percentage change in the cumulative total stockholder return on our common stock against the cumulative total return of the S&P 500 Index and the S&P Electronics (Semiconductors) Index for a period of five fiscal years. Our fiscal year ends on a different day each year because our year ends at midnight on the Sunday nearest to March 31 of each calendar year. However, for convenience, the amounts shown below are based on a March 31 fiscal year end. “Total return,” for the purpose of this graph, assumes reinvestment of all dividends.
The performance of our stock price shown in the following graph is not necessarily indicative of future stock price performance.
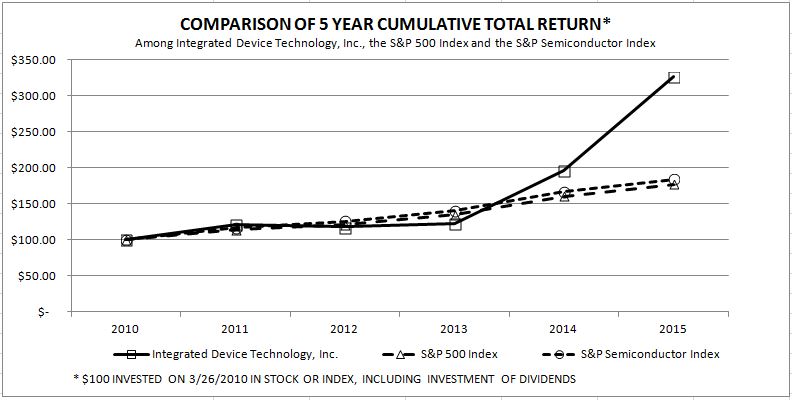
Cumulative Total Return | 2010 | 2011 | 2012 | 2013 | 2014 | 2015 | |||||||||||||||||
Integrated Device Technology, Inc. | $ | 100.00 | $ | 120.92 | $ | 117.79 | $ | 123.06 | $ | 196.71 | $ | 326.03 | |||||||||||
S&P Semiconductor Index | $ | 100.00 | $ | 114.21 | $ | 120.73 | $ | 134.51 | $ | 160.50 | $ | 176.67 | |||||||||||
S&P 500 Index | $ | 100.00 | $ | 116.48 | $ | 125.77 | $ | 139.93 | $ | 167.03 | $ | 183.76 | |||||||||||
17
ITEM 6. SELECTED FINANCIAL DATA
The data set forth below are qualified in their entirety by reference to, and should be read in conjunction with, "Management's Discussion and Analysis of Financial Condition and Results of Operations" and the Consolidated Financial Statements and related notes thereto included in this Annual Report on Form 10-K.
Statements of Operations Data
Fiscal Year Ended | |||||||||||||||||||
(in thousands, except per share data) | March 29, 2015 | March 30, 2014 (1) | March 31, 2013 (2) | April 1, 2012 (4) | April 3, 2011 | ||||||||||||||
Revenues (3) | $ | 572,905 | $ | 484,779 | $ | 484,452 | $ | 526,696 | $ | 605,389 | |||||||||
Net income from continuing operations (3) | $ | 114,581 | $ | 111,313 | $ | 2,711 | $ | 37,953 | $ | 93,826 | |||||||||
Basic net income per share – continuing operations (3) | $ | 0.77 | $ | 0.74 | $ | 0.02 | $ | 0.26 | $ | 0.61 | |||||||||
Diluted net income per share – continuing operations (3) | $ | 0.74 | $ | 0.73 | $ | 0.02 | $ | 0.26 | $ | 0.60 | |||||||||
Net cash provided by operating activities | $ | 171,772 | $ | 75,629 | $ | 44,074 | $ | 33,777 | $ | 74,391 | |||||||||
Balance Sheet Data
(in thousands) | March 29, 2015 | March 30, 2014 | March 31, 2013 | April 1, 2012 | April 3, 2011 | ||||||||||||||
Cash, cash equivalents and investments | $ | 555,060 | $ | 453,815 | $ | 297,170 | $ | 325,459 | $ | 299,192 | |||||||||
Total assets | $ | 913,659 | $ | 830,960 | $ | 728,579 | $ | 717,634 | $ | 727,460 | |||||||||
Other long-term obligations | $ | 17,605 | $ | 18,683 | $ | 22,022 | $ | 16,494 | $ | 15,808 | |||||||||
(1) | In fiscal 2014, we recognized a gain on divestitures of $82.3 million relating to the divestiture of our PCI Express enterprise flash controller business and a $3.7 million loss on divestiture relating to the sale of our Audio business. In addition, associated with the decision to discontinue production and sale of products using technology attained through the acquisitions of Mobius Microsystems in fiscal 2010 and IKOR in fiscal 2011, we recorded an additional $8.7 million in accelerated amortization of intangible assets which was charged to cost of revenues. In addition, we recorded a $2.4 million impairment of in process research and development ("IPR&D"), charged to research and development expense, associated with the decision to discontinue further development required to complete the Mobius Microsystems acquired IPR&D. |
(2) | In fiscal 2013, we recognized a gain on divestitures of $8.0 million relating to the sale of our smart metering business. |
(3) | In fiscal 2014, we initiated a project to divest our High-Speed Data Converter ("HSC") Business. In addition, in fiscal 2012, we completed the sale of certain assets related to IDT's Hollywood Quality Video and Frame Rate Conversion video processing product lines. The results of operations for these discontinued businesses have been segregated and excluded from the continuing operations presented. |
(4) | In fiscal 2012, we recognized a gain on divestitures of $20.7 million relating to the sale of our wafer fabrication facility in Hillsboro, Oregon. |
18
ITEM 7. MANAGEMENT'S DISCUSSION AND ANALYSIS OF FINANCIAL CONDITION AND RESULTS OF OPERATIONS
The following discussion and analysis should be read in conjunction with “Item 6. Selected Financial Data” and “Item 8. Financial Statements and Supplementary Data,” included elsewhere in this Annual Report on Form 10-K.
The information in this Annual Report contains forward looking statements within the meaning of Section 27A of the Securities Act of 1933, as amended, and Section 21E of the Exchange Act. Any statements contained herein that are not statements of historical facts may be deemed to be forward-looking. Forward-looking statements are based upon current expectations that involve a number of risks and uncertainties. These risks and uncertainties include, but are not limited to: operating results; new product introductions and sales; competitive conditions; capital expenditures and resources; manufacturing capacity utilization; customer demand and inventory levels; intellectual property issues; and the risk factors set forth in the section “Risk Factors” in Part I, Item 1A, of this Annual Report on Form 10-K. As a result of these risks and uncertainties, actual results and timing of events could differ significantly from those anticipated in the forward-looking statements. We undertake no obligation to publicly release any revisions to the forward-looking statements for future events or new information after the date of this Annual Report on Form 10-K.
Critical Accounting Policies and Estimates
Our consolidated financial statements have been prepared in accordance with accounting principles generally accepted in the U.S. The preparation of such statements requires us to make estimates and assumptions that affect the reported amounts of revenues and expenses during the reporting period and the reported amounts of assets and liabilities as of the date of the financial statements. Our estimates and assumptions are based on historical experience and other factors that we consider to be appropriate in the circumstances. However, actual future results may vary from our estimates and assumptions.
We believe that the following accounting policies are "critical," as defined by the SEC, in that they are both highly important to the portrayal of our financial condition and results, and they require difficult management judgments, estimates and assumptions about matters that are inherently uncertain.
Revenue Recognition. Our revenue results from semiconductors sold through three channels: direct sales to original equipment manufacturers (OEMs) and electronic manufacturing service providers (EMSs), consignment sales to OEMs and EMSs, and sales through distributors. We recognize revenue when persuasive evidence of an arrangement exists, delivery has occurred or services have been rendered, the price is fixed or determinable and our ability to collect is reasonably assured. For direct sales, we recognize revenue in accordance with the applicable shipping terms. Revenue related to the sale of consignment inventory is not recognized until the product is pulled from inventory stock by the customer.
Distributors who serve our customers worldwide and distributors serving our customers in the U.S. and Europe, have rights to price protection, ship from stock pricing credits and stock rotation. We defer revenue and related cost of revenues on sales to these distributors until the product is sold through by the distributor to an end-customer. Subsequent to shipment to the distributor, we may reduce product pricing through price protection based on market conditions, competitive considerations and other factors. Price protection is granted to distributors on the inventory that they have on hand at the date the price protection is offered. We also grant certain credits to our distributors on specifically identified portions of the distributors’ business to allow them to earn a competitive gross margin on the sale of our products to their end-customers. As a result of our inability to estimate these credits, we have determined that the sales price to these distributors is not fixed or determinable until the final sale to the end-customer.
In the APAC region and Japan, we have distributors for which revenue is recognized upon shipment, with reserves recorded for the estimated return and pricing adjustment exposures. The determination of the amount of reserves to be recorded for stock rotation rights requires that we make estimates as to the amount of product which will be returned by customers within their limited contractual rights. We utilize historical return rates to estimate the exposure in accordance with authoritative guidance for Revenue Recognition - When Right of Return Exists. In addition, from time to time, we offer pricing adjustments to distributors for product purchased in a given quarter that remains in their inventory. These amounts are estimated by management based on discussions with customers, assessment of market trends, as well as historical experience.
Income Taxes. We account for income taxes under an asset and liability approach that requires the expected future tax consequences of temporary differences between book and tax basis of assets and liabilities be recognized as deferred tax assets and liabilities. Generally accepted accounting principles require us to evaluate the ability to realize the value of our net deferred tax assets on an ongoing basis. A valuation allowance is recorded to reduce the net deferred tax assets to an amount that will more likely than not be realized. Accordingly, we consider various tax planning strategies, forecasts of future taxable income and recent operating results in assessing the need for a valuation allowance. Since the fourth quarter of fiscal 2003, we have determined that, under applicable accounting principles, it is more likely than not that we will not realize the value of our net deferred tax assets. We continue to maintain a valuation allowance to reduce our deferred tax assets to an amount that is more likely than not to be realized. However, given the continued improvement in our operations combined with certain tax strategies, we believe that there is a reasonable possibility that within the next 12 months, sufficient positive evidence may become available to allow us to reach a
19
conclusion that a significant portion of the valuation allowance will no longer be needed. Release of the valuation allowance would result in the recognition of certain deferred tax assets and a decrease to income tax expense for the period the release is recorded. The exact timing and amount of the valuation allowance release are subject to change on the basis of the level of profitability that we are able to actually achieve.
We recognize tax liabilities for uncertain income tax positions taken on our income tax return based on the two-step process prescribed under U.S. GAAP. The first step is to determine whether it is more likely than not that each income tax position would be sustained upon audit. The second step is to estimate and measure the tax benefit as the amount that has a greater than 50% likelihood of being realized upon ultimate settlement with the tax authority. Estimating these amounts requires us to determine the probability of various possible outcomes. We evaluate these uncertain tax positions on a quarterly basis. This evaluation is based on the consideration of several factors including changes in facts or circumstances, changes in applicable tax law, settlement of issues under audit, and new exposures. If we later determine that the exposure is lower or that the liability is not sufficient to cover our revised expectations, we adjust the liability and effect a related change in our tax provision during the period in which we make such determination.
Inventories. Inventories are recorded at the lower of standard cost (which approximates actual cost on a first-in, first-out basis) or market value. We record provisions for obsolete and excess inventory based on our forecasts of demand over specific future time horizons. We also record provisions to value our inventory at the lower of cost or market value, which rely on forecasts of average selling prices (ASPs) in future periods. Actual market conditions, demand and pricing levels in the volatile semiconductor markets that we serve may vary from our forecasts, potentially impacting our inventory reserves and resulting in material impacts to our gross margin.
Valuation of Long-Lived Assets and Goodwill. We operate our own test facility in Malaysia, and have also acquired certain businesses and product portfolios in recent years. As a result, we have property, plant and equipment, goodwill and other intangible assets. We evaluate these items for impairment on an annual basis, or sooner, if events or changes in circumstances indicate that carrying values may not be recoverable. Triggering events for impairment reviews may include adverse industry or economic trends, significant restructuring actions, significantly lowered projections of profitability, or a sustained decline in our market capitalization. Evaluations of possible impairment and if applicable, adjustments to carrying values, require us to estimate among other factors, future cash flows, useful lives and fair values of our reporting units and assets. Actual results may vary from our expectations.
We review goodwill for impairment annually and whenever events or changes in circumstances indicate the carrying value of goodwill may not be recoverable. Determining the fair value of a reporting unit is judgmental in nature and involves the use of significant estimates and assumptions. These estimates and assumptions include revenue growth rates and operating margins used to calculate projected future cash flows, risk-adjusted discount rates, future economic and market conditions and determination of appropriate market comparables. We utilize a discounted cash flow analysis to estimate the fair value of our reporting units. Actual future results may differ from those estimates. In addition, we make certain judgments and assumptions in allocating shared assets and liabilities to determine the carrying values for each of our reporting units. For the annual impairment testing in fiscal 2015, there was no evidence of any impairment.
Stock-based Compensation. In accordance with FASB guidance on share-based payments, we measure and recognize compensation expense for all stock-based payments awards, including employee stock options, restricted stock units and rights to purchase shares under employee stock purchase plans, based on their estimated fair value and recognize the costs in the financial statements over the employees’ requisite service period.
The fair value of employee restricted stock units is equal to the market value of our common stock on the date the award is granted. We estimate the fair value of employee stock options and the right to purchase shares under the employee stock purchase plan using the Black-Scholes valuation model. Option-pricing models require the input of highly subjective assumptions, including the expected term of options and the expected price volatility of the stock underlying such options. In addition, we are required to estimate the number of stock-based awards that will be forfeited due to employee turnover and true up these forfeiture rates when actual results are different from our estimates. We attribute the value of stock-based compensation to expense using an accelerated method. Finally, we capitalize into inventory a portion of the periodic stock-based compensation expense that relates to employees working in manufacturing activities.
We update the expected term of stock option grants annually based on our analysis of the stock option exercise behavior over a period of time. The interest rate is based on the average U.S. Treasury interest rate over the expected term during the applicable quarter. We believe that the implied volatility of our common stock is an important consideration of overall market conditions and a good indicator of the expected volatility of our common stock. However, due to the limited volume of options freely traded over the counter, we believe that implied volatility, by itself, is not representative of the expected volatility of our common stock and therefore we use a volatility factor to estimate the fair value of our stock-based awards which reflects a blend of historical volatility of our common stock and implied volatility of call options and dealer quotes on call options, generally having a term of
20
less than twelve months. We have not paid, nor do we have current plans to pay dividends on our common stock in the foreseeable future.
Recent Developments
Discontinued Operations
HSC Business. In the third quarter of fiscal 2014, we initiated a project to divest our HSC business. We believe that this divestiture will allow us to strengthen our focus on analog-intensive mixed-signal, timing and synchronization, and interface and connectivity solutions. As of March 29, 2015, the HSC business was classified as held for sale and all long-lived assets related to it were fully impaired.
The HSC business included the assets of NXP B.V.’s Data Converter Business and Alvand Technologies, Inc., which we acquired during fiscal 2013. The total purchase consideration we paid to acquire Alvand Technologies, Inc. included a liability representing the fair value of contingent cash consideration which was paid based upon the achievement of future product development milestones to be completed within 3 years following the acquisition date. During fiscal 2015, the Company paid $1.6 million and released the remaining contingent liability of $0.5 million to discontinued operations, as the remaining future milestones will not be achieved as a result of the asset sale discussed below.
On May 30, 2014, we completed the sale of certain assets related to the Alvand portion of the HSC business pursuant to an Asset Purchase Agreement. Upon the closing of the transaction, the buyer paid the Company $18.0 million in cash consideration, of which $2.7 million will be held in an escrow account for a period of 18 months. During fiscal 2015, we recorded a gain of $16.8 million to discontinued operations related to this divestiture.
Following the sale of assets related to the Alvand portion of the HSC business, the business had remaining long-lived assets classified as held for sale amounting to $8.5 million, which consisted of $2.9 million in fixed assets and $5.6 million in intangible assets. We evaluated the carrying value of these assets and determined that it exceeded estimated fair value based on estimated selling price less cost to sell. Accordingly, we recorded total impairment charge of $8.5 million to discontinued operations in fiscal 2015.
On April 27, 2015, we completed the sale of the remaining HSC business to eSilicon Corporation (“eSilicon”), for $1.5 million which will be paid on or before April 27, 2017. In connection with the sale, we entered into an Exclusive Intellectual Property License Agreement with eSilicon, whereby we will provide an exclusive license to eSlicon to develop, manufacture, sell and maintain HSC products. In connection with the sale, we and eSilicon also entered into a Transition Services Agreement, whereby we will provide certain transition services over a specific period from the effective date of the sale. Also, as part of the sale, we will transfer to eSilicon certain assets with a nominal carrying value.
The HSC business was included in the our Communications reportable segment. For financial statements purposes, the results of operations for the HSC business have been segregated from those of the continuing operations and are presented in our consolidated financial statements as discontinued operations.
Video Business. On August 1, 2012, we completed the transfer of the remaining assets of our video business to Synaptics for $5.0 million in cash pursuant to an Asset Purchase Agreement. In connection with the divestiture, 47 employees were transferred to Synaptics. During fiscal 2013, we recorded a gain of $0.9 million related to this divestiture.
Divestitures
Sale of Certain Assets of Audio Business. On December 13, 2013, we completed the sale of certain assets of our Audio business to Stravelis, Inc. for $0.2 million in cash and up to a maximum potential of $1.0 million additional consideration contingent upon future revenues. The fair value of the contingent consideration was estimated at the time of sale to be zero based on the estimated probability of attainment of future revenue targets. During fiscal 2015, we received $0.3 million in cash of the contingent consideration, which we recorded in interest and other income, net in the Consolidated Statement of Operations. During fiscal 2014, we recorded a loss of $3.7 million on divestiture related to the sale. Prior to the divestiture, the Audio business was part of a larger cash-flow generating product group and did not, on its own, represent a separate operation of the Company and, therefore, this sale did not qualify as discontinued operations.
Sale of Certain Assets of PCI Express ("PCIe") Enterprise Flash Controller Business. On July 12, 2013, we completed the sale of certain assets of our PCIe enterprise flash controller business to PMC-Sierra, Inc., for $96.1 million in cash. We recorded a gain of $82.3 million on divestiture related to this transaction in fiscal 2014. Prior to the divestiture, the Enterprise Flash Controller business was part of a larger cash-flow generating product group and did not, on its own, represent a separate operation of our company and, therefore, this sale did not qualify as discontinued operations.
Sale of Smart Meter Business. On March 7, 2013, we completed the sale of our smart metering business and related assets to Atmel Corporation for $10.3 million in cash, of which $1.0 million was held in an escrow account for a period of one year and was collected in full in fiscal 2014. During fiscal 2013, we recorded a gain of $8.0 million related to this divestiture. Prior to the
21
divestiture, the smart meter business was part of a larger cash-flow generating product group and did not, on its own, represent a separate operation of the Company and, therefore, this sale did not qualify as discontinued operations.
Termination of Proposed Acquisition of PLX Technology, Inc. (PLX)
On April 30, 2012, we had entered into an Agreement and Plan of Merger with PLX Technology, Inc. (PLX) for the acquisition of PLX by us (the Agreement). On December 19, 2012, the United States Federal Trade Commission (FTC) filed an administrative complaint challenging our proposed acquisition of PLX. In response to the FTC’s determination to challenge the proposed acquisition of PLX by us, effective December 19, 2012, we mutually agreed with PLX to terminate the Agreement. Also on December 19, 2012, we withdrew our related exchange offer (the Offer) to acquire all of the issued and outstanding shares of common stock, $0.001 par value, of PLX and instructed Computershare, the exchange agent for the Offer, to promptly return all previously tendered shares.
Associated with the proposed acquisition of PLX, during fiscal year 2013, we incurred approximately $10.7 million in acquisition related costs, respectively, which were included in selling, general and administrative expenses in the Consolidated Statements of Operations.
Credit Facility Termination
In connection with the termination of the proposed PLX acquisition, our management determined that it was in our best interest to allow the Master Repurchase Agreement with Bank of America, N.A. to lapse undrawn. Associated with the lapse of this credit facility, we expensed $2.5 million in unamortized financing costs to selling, general and administrative expenses in fiscal 2013.
Acquisition of NXP B.V.'s Data Converter Business
On July 19, 2012, we completed an acquisition of certain assets related to technology and products developed for communications analog mixed-signal market applications from NXP B.V. We acquired the communications analog mixed-signal assets for an aggregate cash purchase price of approximately $31.2 million, less a $4.0 million credit from NXP B.V. for certain accrued liabilities assumed from NXP B.V. resulting in a net aggregate purchase price of $27.2 million. We incurred approximately $3.9 million in acquisition related costs, which has been included in loss from discontinued operations for the year ended March 31, 2013.
Acquisition of Fox Enterprises, Inc.
On April 30, 2012, we completed the acquisition of Fox Enterprises, Inc. (Fox), a leading supplier of frequency control products including crystals and crystal oscillators. The purchase price included $3.2 million which was recorded as a liability representing the fair value of contingent cash consideration of up to $4.0 million based upon achievement of future financial milestones. In June 2013, we settled contingent consideration and paid former shareholders of Fox $3.3 million.
Acquisition of Alvand Technologies, Inc.
On April 16, 2012, we completed the acquisition of Alvand Technologies Inc. (Alvand), a leading analog integrated circuits company specializing in data converters, for total purchase consideration of approximately $23.3 million, of which $20.5 million was paid in cash at closing and $2.8 million was recorded as a liability representing the fair value of contingent cash consideration of up to $4.0 million based upon the achievement of future product development milestones to be completed within 3 years following the acquisition date. Payments were to be made on a proportionate basis upon the completion of each milestone. As of March 31, 2013, the fair value of the contingent consideration was re-measured based on a revised product development forecast for the business and increased $0.5 million to $3.3 million. As of March 30, 2014, the fair value of the contingent consideration was again re-measured based on a revised product development forecast for the business and increased $0.6 million. During fiscal year 2014, we paid $1.8 million in contingent liability and the remaining estimated fair value of the unpaid contingent consideration for Alvand as of March 30, 2014 was $2.1 million. During fiscal 2015, we paid $1.6 million and released the remaining contingent consideration of $0.5 million to discontinued operations, as the remaining future milestones will not be achieved as a result of the sale of certain assets related to the Alvand portion of the HSC business .
22
Overview
The following table and discussion provide an overview of our operating results from continuing operations for fiscal 2015, 2014 and 2013:
Fiscal Year End | |||||||||||||
(in thousands, except for percentage) | March 29, 2015 | March 30, 2014 | March 31, 2013 | ||||||||||
Revenues | $ | 572,905 | $ | 484,779 | $ | 484,452 | |||||||
Gross profit | $ | 345,304 | $ | 272,902 | $ | 269,724 | |||||||
As a % of revenues | 60.3 | % | 56.3 | % | 55.7 | % | |||||||
Operating expense | $ | 234,157 | $ | 241,947 | $ | 277,119 | |||||||
As a % of revenues | 40.9 | % | 49.9 | % | 57.2 | % | |||||||
Operating income (loss) | $ | 111,147 | $ | 30,955 | $ | (7,395 | ) | ||||||
As a % of revenues | 19.4 | % | 6.4 | % | (1.5 | )% | |||||||
Net income from continuing operations | $ | 114,581 | $ | 111,313 | $ | 2,711 | |||||||
As a % of revenues | 20.0 | % | 23.0 | % | 0.6 | % | |||||||
Our revenues in fiscal 2015 were $572.9 million as compared to $484.8 million in fiscal 2014. During fiscal 2015, we experienced increased demand for our products in both the Communications and Computing and Consumer market segments. Gross profit as a percentage of net revenues was 60.3% in fiscal 2015 as compared to 56.3% in fiscal 2014. The fiscal 2015 increase in gross profit percentage was primarily due to an improved mix of higher margin products as compared to fiscal 2014. Our operating expenses decreased by $7.8 million, or 3.2%, to $234.2 million in fiscal 2015 as compared to $241.9 million in fiscal 2014, primarily due to divestitures and the implementation of other expense reduction actions, which was partly offset by higher employee bonus and stock-based compensation. Our operating income increased from $31.0 million in fiscal 2014 to $111.1 million in fiscal 2015 primarily due to higher revenue, improved gross profit percentage and decrease in operating expenses. Net income from continuing operations in fiscal 2015 was $114.6 million. This compares to fiscal 2014 net income from continuing operations of $111.3 million which included an $82.3 million gain on the divestiture of the PCI Express enterprise flash controller business and a $3.7 million loss on divestiture of the Audio business. We ended fiscal 2015 with cash and cash equivalents and short-term investments of $555.1 million. We generated $171.8 million in cash from operations in fiscal 2015, received $21.1 million in proceeds from employee stock transactions and received $15.3 million in proceeds from divestitures. These proceeds were offset by $79.2 million used for repurchases of common stock and $17.8 million for purchases of property, plant and equipment.
Results of Operations, Continuing Operations
Revenues
Revenues by segment: | Fiscal Year Ended | ||||||||||
(in thousands) | March 29, 2015 | March 30, 2014 | March 31, 2013 | ||||||||
Communications | $ | 313,630 | $ | 292,435 | $ | 258,184 | |||||
Computing and Consumer | 259,275 | 192,344 | 226,268 | ||||||||
Total revenues | $ | 572,905 | $ | 484,779 | $ | 484,452 | |||||
23
Product groups representing greater than 10% of net revenues: | Fiscal Year Ended | |||||||
As a percentage of net revenues | March 29, 2015 | March 30, 2014 | March 31, 2013 | |||||
Communications: | ||||||||
Communications timing products | 22 | % | 24 | % | 24 | % | ||
Serial RapidIO solutions | 18 | % | 16 | % | * | |||
All others less than 10% individually | 15 | % | 20 | % | 29 | % | ||
Total communications | 55 | % | 60 | % | 53 | % | ||
Computing and Consumer: | ||||||||
Consumer and computing timing products | 14 | % | 18 | % | 19 | % | ||
Memory interface products | 25 | % | 15 | % | 16 | % | ||
All others less than 10% individually | 6 | % | 7 | % | 12 | % | ||
Total computing and consumer | 45 | % | 40 | % | 47 | % | ||
Total | 100 | % | 100 | % | 100 | % | ||
* Represents less than 10% of net revenues
Communications Segment
Revenues in our Communications segment increased $21.2 million, or 7%, to $313.6 million in fiscal 2015 as compared to $292.4 million in fiscal 2014. This increase was driven primarily by a $21.7 million increase in shipments of our Rapid I/O switching solutions products combined with a $10.2 million increase in Radio Frequency product revenues, offset in part by lower revenue from legacy products.
In fiscal 2014, revenues in our Communications segment increased $34.3 million, or 13%, to $292.4 million as compared to $258.2 million in fiscal 2013. This increase was driven primarily by a $36.4 million increase in shipments of our Rapid I/O switching solutions products combined with a $3.5 million increase in Radio Frequency product revenues, offset in part by lower revenue from legacy products.
Computing and Consumer Segment
Revenues in our Computing and Consumer segment increased $66.9 million, or 35%, to $259.3 million in fiscal 2015 as compared to $192.3 million in fiscal 2014. The increase was primarily due to a $71.3 million increase in memory interface product revenues as a result of higher demand combined with a $10.4 million increase in shipments of wireless power products. This was offset in part by the loss of revenue amounting to $9.1 million from sale of our Audio business in fiscal 2014 and a $7.0 million decrease in computing and consumer timing product revenue.
In fiscal 2014, revenues in our Computing and Consumer segment decreased $33.9 million, or 15%, to $192.3 million as compared to $226.3 million in fiscal 2013 as a result of reduced demand. In general, demand in fiscal 2014 for most products within this market segment declined in-line with market conditions.
Revenues by Region
Revenues in APAC (excluding Japan), Americas, Japan and Europe accounted for 70%, 12%, 7% and 11%, respectively, of consolidated revenues in fiscal 2015 compared to 64%, 15%, 8% and 13%, respectively, of our consolidated revenues in fiscal 2014. Revenues in APAC, Americas, Japan and Europe accounted for 64%, 16%, 8% and 12%, respectively, of consolidated revenues in fiscal 2013. The APAC region continues to be our largest region, as many of our customers utilize manufacturers in that region.
24
Deferred Income on Shipments to Distributions
Included in the Balance Sheet caption “Deferred income on shipments to distributors” are amounts related to shipments to certain distributors for which revenue is not recognized until our product has been sold by the distributor to an end customer. The components as of March 29, 2015 and March 30, 2014 are as follows:
(in thousands) | March 29, 2015 | March 30, 2014 | |||||
Gross deferred revenue | $ | 19,299 | $ | 17,261 | |||
Gross deferred costs | (3,605 | ) | (3,255 | ) | |||
Deferred income on shipments to distributors | $ | 15,694 | $ | 14,006 | |||
Gross deferred revenue represents the gross value of shipments to distributors at the list price billed to the distributor less any price protection credits provided to them in connection with reductions in list price while the products remain in their inventory. Based on our history, the amount ultimately recognized as revenue is generally less than the gross deferred revenue as a result of ship from stock pricing credits, which are issued in connection with the sell through of the product to an end customer. As the amount of price adjustments subsequent to shipment is dependent on the overall market conditions, the levels of these adjustments can fluctuate significantly from period to period. Historically, price adjustments have represented an average of approximately 37.7% of the list price billed to the customer. As these credits are issued, there is no impact to working capital as this reduces both accounts receivable and deferred revenue. Gross deferred costs represent the standard costs (which approximate actual costs) of products we sell to the distributors.
Gross Profit
Fiscal Year Ended | |||||||||||
March 29, 2015 | March 30, 2014 | March 31, 2013 | |||||||||
Gross Profit (in thousands) | $ | 345,304 | $ | 272,902 | $ | 269,724 | |||||
Gross Profit Percentage | 60.3 | % | 56.3 | % | 55.7 | % | |||||
Gross profit increased $72.4 million or 27%, in fiscal 2015 as compared to fiscal 2014 primarily due to an increased gross profit percentage of revenues. Gross profit as a percentage of revenues increased 4.0% in fiscal 2015 as compared to fiscal 2014, primarily due to an increased shipment mix of product groups which generally have higher gross profit percentage. In addition, fiscal 2015 gross profit percentage was favorably impacted as compared to fiscal 2014 by reduced manufacturing costs and improved inventory management. As of March 29, 2015, the balance of net buffer stock inventory which was built in anticipation of the transition of wafer fabrication activities totaled approximately $0.4 million.
In fiscal 2014, gross profit increased $3.2 million, or 1%, compared to fiscal 2013 primarily due to an increased gross profit percentage of revenues. Gross profit as a percentage of revenues increased 0.6% in fiscal 2014 as compared to fiscal 2013, primarily due to an increased product shipment mix of communications products, which in general have a higher gross profit percentage than our computing and consumer products. In addition, fiscal 2014 gross profit percentage was favorably impacted as compared to fiscal 2013 by a reduction in manufacturing costs, which was offset in part by increased amortization of acquired intangible assets. Associated with the decision to discontinue certain products attained through the acquisitions of Mobius Microsystems and IKOR, we revised the estimated remaining useful life of the related acquired intangible assets to zero, resulting in additional accelerated amortization charged to cost of revenues in the fourth quarter of fiscal 2014. As of March 30, 2014, the balance of net buffer stock inventory which was built in anticipation of the transition of wafer fabrication activities totaled approximately $1.0 million.
Operating Expenses
The following table presents our operating expenses for fiscal years 2015, 2014 and 2013, respectively:
March 29, 2015 | March 30, 2014 | March 31, 2013 | |||||||||||||||||||
(in thousands, except for percentages) | Dollar Amount | % of Net Revenues | Dollar Amount | % of Net Revenues | Dollar Amount | % of Net Revenues | |||||||||||||||
Research and development | $ | 127,688 | 22 | % | $ | 140,799 | 29 | % | $ | 159,471 | 33 | % | |||||||||
Selling, general and administrative | $ | 106,469 | 19 | % | $ | 101,148 | 21 | % | $ | 117,648 | 24 | % | |||||||||
25
Research and Development (R&D)
R&D expense decreased by $13.1 million, or 9%, to $127.7 million in fiscal 2015 compared to fiscal 2014. The decrease was primarily driven by reduced labor related costs and equipment and maintenance costs resulting from the divestitures of our PCIe enterprise flash controller business and our Audio business combined with other headcount reduction actions taken in fiscal 2014. Significant reductions included $8.2 million in decline in R&D labor related costs, a $7.1 million decrease in engineering design tool license costs, a $3.3 million decrease in R&D materials and outside services, a $2.4 million reduction in severance costs, a $2.4 million decrease in impairment charge which represents the impairment of acquired in-process research and development related to Mobius Microsystems in fiscal 2014, a $1.0 million decrease in facilities costs and a $0.8 million net reduction in other R&D expenses. These decreases were offset in part by a $7.9 million increase in accrued employee bonus expense and a $4.2 million increase in stock-based compensation.
R&D expense decreased by $18.7 million, or 12%, to $140.8 million in fiscal 2014 compared to fiscal 2013. The decrease was primarily driven by reduced headcount costs resulting from the divestitures of our PCIe enterprise flash controller business and our Audio business combined with other headcount reduction actions taken in fiscal 2014 and 2013. Significant decreases included $16.2 million in decreased R&D labor and benefits, a $4.9 million decrease in R&D materials and outside services, a $2.6 million decrease in engineering design tool license costs, a $0.8 million decrease in facilities costs and a $0.8 million reduction in other R&D expenses. These decreases were offset in part by a $4.2 million increase in accrued employee bonus expense and a $2.4 million impairment charge associated with the decision to discontinue further development required to complete the Mobius Microsystems acquired in-process research and development.
Selling, General and Administrative (SG&A)
SG&A expenses increased $5.3 million, or 5%, to $106.5 million in fiscal 2015 compared to fiscal 2014. The increase was primarily driven by a $5.2 million increase in accrued employee bonus expense, a $4.8 million increase in stock-based compensation and a $1.0 million increase in medical claims and insurance-related expense. These increases were partly offset by a $1.6 million decrease in amortization expense for acquired intangibles, reduced headcount costs of $1.5 million from the divestitures of our PCIe enterprise flash controller business and our Audio business in fiscal 2014, a $1.4 million decrease in acquisition related legal and consulting costs due to a reduction in acquisition and divestiture related activities as compared to the prior year and a $1.2 million decrease in severance costs as a result of headcount reductions taken in fiscal 2014.
SG&A expenses decreased $16.5 million, or 14%, to $101.1 million in fiscal 2014 compared to fiscal 2013. Significant decreases included a $3.4 million decrease in SG&A labor and benefits, primarily driven by reduced headcount costs resulting from the divestitures of our PCIe enterprise flash controller business and our Audio business combined with other headcount reduction actions taken in fiscal 2014 and 2013, combined with a $13.0 million decrease in acquisition related legal and consulting costs due to a reduction in acquisition related activities as compared to fiscal 2013, and an additional $2.5 million expense reduction for the amortization of capitalized financing costs which was recognized in fiscal 2013 related to the termination of a credit facility. These expense reductions were offset in part by a $2.4 million increase in accrued employee bonus expense.
Other-Than-Temporary Impairment Loss on Investment
We account for our equity investments in privately held companies under the cost method. These investments are subject to periodic impairment review and measured and recorded at fair value when they are deemed to be other-than-temporarily impaired. In determining whether a decline in value of our investments has occurred and is other than temporary, an assessment is made by considering available evidence, including the general market conditions, the investee’s financial condition, near-term prospects, market comparables and subsequent rounds of financing. The valuation also takes into account the investee’s capital structure, liquidation preferences for its capital and other economic variables. The valuation methodology for determining the decline in value of non-marketable equity securities is based on inputs that require management judgment. In fiscal 2013, we determined that the value of certain non-marketable private equity investments was impaired and we recorded $1.7 million in other-than-temporary impairment losses during the period. There were no impairments recorded during fiscal 2015 and 2014.
Restructuring Charges
As part of an effort to streamline operations with changing market conditions and to create a more efficient organization, we have undertaken restructuring actions to reduce our workforce and consolidate facilities. Our restructuring expenses consisted primarily of: (i) severance and termination benefit costs related to the reduction of our workforce; and (ii) lease termination costs and costs associated with permanently vacating certain facilities.
HSC Business
In fiscal 2015, we prepared a workforce-reduction plan (the Plan) with respect to employees of our HSC business in France and the Netherlands. The Plan sets forth the general parameters, terms and benefits for employee dismissals. The Plan was approved by the French Works Council and Labor Administrator and the related Plan details were communicated to the affected employees in France and the Netherlands. No works council consultation was required in the Netherlands. We have not historically offered
26
similar termination benefits as defined in the Plan for these locations. The Plan identified the number of employees to be terminated, their job classification or function, their location and the date that the Plan was expected to be completed. The Plan also established the terms of the benefit arrangement in sufficient detail to enable the employees to determine the type and amount of benefits that they would receive if terminated. In addition, the actions required to complete the Plan indicated that it was unlikely that substantial changes to the Plan would be made after communication to the employees. Accordingly, we accrued restructuring charges in accordance with ASC 420, Exit or Disposal Cost Obligations. The restructuring charges recorded to discontinued operations in the Consolidated Statement of Operations were approximately $18.3 million for the fiscal year ended March 29, 2015, for a total of 53 employees in France and the Netherlands combined.
We expect to make payments related to these termination benefits and complete the restructuring action by the third quarter of fiscal 2016.
Others
During fiscal 2015, we recorded other restructuring charges of $1.1 million and reduced our headcount by 28 employees in multiple reduction in workforce actions. During fiscal 2015, we paid $0.8 million related to these actions. As of March 29, 2015, the total accrued balance for employee severance costs related to these restructuring actions was $0.3 million. We expect to complete these restructuring actions by the first quarter of fiscal 2016.
During fiscal 2014, we recorded restructuring charges of $5.5 million and reduced our headcount by 117 employees in multiple reduction in workforce actions. During fiscal 2015 and 2014, we paid $0.6 million and $4.9 million, respectively and completed these actions.
During fiscal 2013, we recorded restructuring charges of $4.3 million for multiple reduction in workforce actions. We reduced our total headcount by approximately 132 employees with reductions affecting all functional areas and various locations. During fiscal 2013, we paid $3.2 million in severance costs associated with these actions. During fiscal 2014, we paid $1.1 million in severance costs and completed these actions.
During fiscal 2013, in connection with the divestiture of our video processing product lines in fiscal 2012, we recorded an additional $1.1 million in restructuring expenses for employee retention costs. These costs were recorded within discontinued operations. We paid the accrued amount in fiscal 2013 and completed this restructuring action.
During fiscal 2013, we paid $1.0 million in restructuring expenses for employee retention costs and completed the restructuring action to exit wafer production operations at our Oregon fabrication facility.
Interest Income and Other, Net
The components of interest income and other, net are summarized as follows:
Fiscal Year Ended | |||||||||||
(in thousands) | March 29, 2015 | March 30, 2014 | March 31, 2013 | ||||||||
Interest income | $ | 2,724 | $ | 1,348 | $ | 447 | |||||
Interest expense | (27 | ) | (21 | ) | (1,479 | ) | |||||
Other income, net | 2,094 | 1,380 | 2,740 | ||||||||
Interest income and other, net | $ | 4,791 | $ | 2,707 | $ | 1,708 | |||||
Interest income is derived from earnings on our cash and short term investments. Interest expense is primarily due to charges associated with the credit facility with Bank of America which was established in fiscal 2012 and was terminated in fiscal 2013. Other income, net primarily consists of gains or losses in the value of deferred compensation plan assets, foreign currency gains or losses and other non-operating gains or losses. The increase in interest income was primarily attributable to higher level of short-term investments and interest rates. The increase in other income, net from fiscal 2014 to fiscal 2013 was primarily due to favorable impact of foreign currency fluctuations. Other income, net in fiscal 2013 included $2.0 million of death benefit proceeds received in fiscal 2013 under life insurance policies purchased with the intention of funding deferred compensation plan liabilities.
Income Tax Expense (Benefit)
We recorded an income tax expense of $1.4 million and $1.0 million in fiscal 2015 and 2014, respectively, and an income tax benefit of $2.1 million in fiscal 2013. The income tax expense in fiscal 2015 and 2014 was primarily due to foreign income tax expense. The income tax benefit in fiscal 2013 was primarily due to the release of valuation allowance resulting from a deferred tax liability that arose from an acquisition, and was partially offset by foreign income tax expenses.
27
The Tax Increase Prevention Act of 2014 (the “Act”) was signed into law on December 19, 2014. The Act contains a number of provisions including, most notably, an extension of the U.S. federal research tax credit through December 31, 2014. The Act did not have a material impact on the Company's effective tax rate for fiscal 2015 due to the effect of the valuation allowance on the Company's deferred tax assets.
As of March 29, 2015, we continued to maintain a valuation allowance against our net U.S. and foreign deferred tax assets, as we could not conclude that it is more likely than not that we will be able to realize our U.S. and foreign deferred tax assets. Given the continued improvement in the Company’s operations combined with certain tax strategies, it is reasonably possible that within the next 12 months, positive evidence will be sufficient to release a material amount of the Company’s valuation allowance. Release of the valuation allowance would result in the recognition of certain deferred tax assets and a decrease to income tax expense for the period the release is recorded. The exact timing and amount of the valuation allowance release are subject to change on the basis of the level of profitability that we are able to actually achieve. We will continue to evaluate the release of the valuation allowance on a quarterly basis.
As of March 29, 2015, the Company was under examination in the U.S. federal jurisdiction and in Singapore. Our fiscal years 2010, 2011, and 2012 are under audit by the Internal Revenue Service (IRS). Our fiscal years 2009 through 2012 are under audit by the Inland Revenue Authority of Singapore. Although the final outcome is uncertain, based on currently available information, we believe that the ultimate outcome will not have a material adverse effect on our financial position, cash flows or results of operations.
We believe that within the next 12 months, it is reasonably possible that a decrease of up to $1.9 million in unrecognized tax benefits may occur due to settlements with tax authorities or statute lapses.
After examination of our projected offshore cash flows, and offshore cash requirements, we have determined that beginning in fiscal year 2016, we will no longer require 100% of our foreign generated cash to support our foreign operations. Therefore, we will begin providing for U.S. taxes on the portion of those prospective earnings that will no longer be indefinitely reinvested. This change will allow a portion of our future earnings to be repatriated to the U.S.
Liquidity and Capital Resources
Our cash and cash equivalents and short-term investments were $555.1 million at March 29, 2015, an increase of $101.2 million compared to March 30, 2014. We had no outstanding debt at March 29, 2015 and March 30, 2014.
Cash Flows from Operating Activities
Net cash provided by operating activities totaled $171.8 million in fiscal 2015 compared to $75.6 million in fiscal 2014 and $44.1 million in fiscal 2013. Cash provided by operating activities in fiscal 2015 consisted of our net income of $93.9 million, as adjusted to exclude net gain on divestitures of $16.8 million and to add back depreciation, amortization, asset impairment, stock compensation and other non-cash items totaling $56.1 million and $38.9 million in cash used by changes in working capital requirements primarily related to increases and decreases in assets and liabilities. In fiscal 2015, significant proceeds from changes in working capital requirements included an increase of $19.3 million in accrued compensation and related expenses as a result of higher accrued employee bonus, an increase of $8.1 million in other accrued liabilities and long-term liabilities as a result of accrued severance costs for the HSC business, a decrease of $5.3 million in accounts receivable, a decrease of $4.4 million in inventories, an increase of $2.3 million in accounts payable and an increase of $1.7 million in deferred income. Net use of cash for changes in working capital requirements included a $2.3 million increase in prepayment and other assets.
In fiscal 2014, net cash provided by operating activities consisted of our net income of $88.4 million, as adjusted to exclude net gain on divestitures of $78.6 million and to add back depreciation, amortization, gain on divestitures, stock compensation and other non-cash items totaling $66.2 million; and $0.3 million in cash used by changes in working capital requirements primarily related to increases and decreases in assets and liabilities. In fiscal 2014, excluding the effects of acquisitions, significant proceeds from changes in working capital requirements included a decrease of $4.3 million in prepaid and other assets and a $2.9 million decrease in inventory. Net use of cash for changes in working capital requirements included a $6.8 million increase in accounts receivable, primarily due to increased shipments in the fourth quarter of fiscal 2014 as compared to the same period in fiscal 2013, and $0.7 million net used for all other working capital requirements.
In fiscal 2013, net cash provided by operating activities consisted of our net loss of $20.2 million, as adjusted to add back depreciation, amortization, gain on divestitures, stock compensation and other non-cash items totaling $43.8 million; and $20.4 million in cash provided by changes in working capital requirements primarily related to increases and decreases in assets and liabilities. In fiscal 2013, excluding the effects of acquisitions, proceeds from changes in working capital requirements included a decrease of $15.9 million in prepaid and other assets (primarily due to a $7.7 million reduction in prepaid design tool licenses combined with the receipt of $2.6 million in escrow funds from the wafer fab sale, a $2.9 million reduction in capitalized financing costs and a $2.7 million reduction in all other prepaid and other assets), a $15.5 million decrease in inventory primarily due to shipments exceeding inventory build and a $2.5 million decrease in accounts receivable due to reduced shipment levels. Uses
28
of cash for changes in working capital requirements included a $6.9 million decrease in accrued compensation, which was primarily due to the payout of severance and retention bonus payouts associated with business divestitures, a $3.2 million decrease in accounts payable due to reduced outside subcontract manufacturing activities and a $3.4 million decrease in all other accrued liabilities.
Cash Flows from Investing Activities
Net cash used for investing activities in fiscal 2015 was $81.8 million compared to net cash used for investing activities of $112.1 million in fiscal 2014 and net cash provided by investing activities of $65.8 million in fiscal 2013. Net cash used for investing activities in fiscal 2015 was primarily due to $76.4 million used for the net purchase of short-term investments, $17.8 million in expenditures to purchase capital equipment and $4.0 million used for the purchase of nonmarketable equity securities, which were offset in part by $15.3 million of proceeds from the divestiture of assets of the Alvand portion of the HSC business and receipt of $1.0 million in escrow related to a prior acquisition.
In fiscal 2014, net cash used for investing activities was primarily due to $197.0 million used for the net purchase of short-term investments and $17.4 million of expenditures to purchase capital equipment which was offset in part by $96.3 million received from the sale of our PCI Express enterprise flash controller business to PMC-Sierra Inc. and the sale of certain assets of our Audio business to Stravelis, Inc. combined with $6.0 million receipt of escrow proceeds associated with the sale of our Video Business to Qualcomm in fiscal 2012.
In fiscal 2013, net cash used for investing activities was primarily due to $68.3 million paid for the acquisitions of Fox, Alvand Technologies and NXP B.V. data converter business, $7.8 million paid to escrow in association with these acquisitions, $27.9 million of expenditures to purchase capital equipment partially offset by net proceeds of $24.0 million from the net sale of short-term investments and $14.2 million of proceeds from sale of video processing business and smart meter business.
Cash Flows from Financing Activities
Net cash used for financing activities was $59.8 million in fiscal 2015 as compared to net cash used for financing activities of $3.1 million in fiscal 2014 and net cash provided by financing activities of $17.4 million in fiscal 2013. Cash used by financing activities in fiscal 2015, was primarily due to repurchases of $79.2 million of IDT common stock and $1.6 million payment of acquisition-related consideration, partially offset by proceeds of $21.1 million from the exercise of employee stock options and the issuance of stock under our employee stock purchase plan.
In fiscal 2014, cash used by financing activities was primarily due to repurchases of $44.0 million of IDT common stock combined with $5.1 million payout of the contingent consideration associated with the acquisitions of Fox Enterprises, Inc. and Alvand Technologies, Inc., partially offset by proceeds of $46.1 million from the exercise of employee stock options and the issuance of stock under our employee stock purchase plan.
In fiscal 2013, cash provided by financing activities was primarily due to proceeds of $17.4 million from the exercise of employee stock options and the issuance of stock under our employee stock purchase plan.
We anticipate capital expenditures of approximately $15 million to $25 million during fiscal 2016 to be financed through cash generated from operations and existing cash and investments.
Cash equivalents are highly liquid investments with original maturities of three months or less at the time of purchase. We maintain the cash and cash equivalents with reputable major financial institutions. Deposits with these banks may exceed the Federal Deposit Insurance Corporation (FDIC) insurance limits or similar limits in foreign jurisdictions. These deposits typically may be redeemed upon demand and, therefore, bear minimal risk. In addition, a significant portion of cash equivalents is concentrated in money market funds which are invested primarily in U.S. government treasuries. While we monitor daily the cash balances in our operating accounts and adjust the balances as appropriate, these balances could be affected if one or more of the financial institutions with which we deposit fails or is subject to other adverse conditions in the financial markets. As of March 29, 2015, we had not experienced any loss or lack of access to our invested cash or cash equivalents in our operating accounts. However, we can provide no assurances that access to our invested cash and cash equivalents will not be affected by adverse conditions in the financial markets. See Item 1A-“Risk Factors: Global economic conditions may adversely affect our business and results of operations.”
In addition, as much of our revenues are generated outside the U.S., a significant portion of our cash and investment portfolio accumulates in the foreign countries in which we operate. At March 29, 2015, we had cash, cash equivalents and investments of approximately $433.4 million invested overseas in accounts belonging to various IDT foreign operating entities. While these amounts are primarily invested in U.S. dollars, a portion is held in foreign currencies, and all offshore balances are exposed to local political, banking, currency control and other risks. In addition, these amounts may be subject to tax and other transfer restrictions.
All of our short-term investments which are classified as available-for-sale investments are subject to a periodic impairment review. Investments are considered to be impaired when a decline in fair value is judged to be other-than-temporary. This determination
29
requires significant judgment. For publicly traded investments, impairment is determined based upon the specific facts and circumstances present at the time, including a review of the closing price over the length of time, general market conditions and our intent and ability to hold the investment for a period of time sufficient to allow for recovery. Although we believe the portfolio continues to be comprised of sound investments due to high credit ratings and government guarantees of the underlying investments, a further decline in the capital and financial markets would adversely impact the market values of its investments and their liquidity. We continually monitor the credit risk in our portfolio and future developments in the credit markets and make appropriate changes to our investment policy as deemed necessary. We did not record any other-than-temporary impairment charges related to our short-term investments in fiscal 2015, 2014 and 2013.
Contractual Obligations and Commercial Commitments
The following table summarizes our contractual arrangements at March 29, 2015 and the expected timing and effects of these commitments on our liquidity and cash flow in future periods:
Payments Due by Period (in thousands) | |||||||||||||||||||
Less Than | 1-3 | 3-5 | More Than | ||||||||||||||||
Contractual Obligations | Total | 1 Year | Years | Years | 5 Years | ||||||||||||||
Operating lease obligations | $ | 10,271 | $ | 3,059 | $ | 4,401 | $ | 2,727 | $ | 84 | |||||||||
Other supplier obligations (1) | 4,567 | 2,822 | 1,745 | — | — | ||||||||||||||
Total | $ | 14,838 | $ | 5,881 | $ | 6,146 | $ | 2,727 | $ | 84 | |||||||||
(1) | Other supplier obligations represent payments due under various software design tool and technology license agreements. |
As of March 29, 2015, our net unrecognized tax benefits and related interest and penalties were $28.1 million, of which $0.4 million are classified as long-term liabilities and $27.7 million are netted against deferred tax assets. In addition, we have $13.1 million of amounts payable related to obligations under our deferred compensation plan, which are classified as long-term liabilities. At this time, we are unable to make a reasonably reliable estimate of the timing of payments, if any, in individual years due to uncertainties in the timing or outcomes of either actual or anticipated tax audits and the timing of employee departures. As a result, these amounts are not included in the table above.
Purchase orders or contracts for the purchase of raw materials and other goods and services are not included in the table above. We are not able to determine the aggregate amount of such purchase orders that represent binding contractual obligations, as purchase orders often represent authorizations to purchase rather than binding agreements. Our purchase orders are based on our current manufacturing needs and are fulfilled by our vendors within short time horizons. We also enter into contracts for outsourced services, which generally contain clauses allowing for cancellation prior to services being performed without significant penalty. In addition, the table above excludes leases in which amounts have been accrued for impairment charges.
We believe that existing cash and investment balances, together with cash flows from operations, will be sufficient to meet our working capital and capital expenditure needs through at least fiscal 2016. We may choose to investigate other financing alternatives; however, we cannot be certain that additional financing will be available on satisfactory terms.
Off-Balance Sheet Arrangements
As of March 29, 2015, we did not have any off-balance sheet arrangements, as defined under SEC Regulation S-K Item 303(a)(4)(ii), other than the items discussed in "Note 15 – Commitments and Contingencies – Commitments” in Part II, Item 8 of this Annual Report on Form 10-K.
Recent Accounting Pronouncements
For further information, please see “Note 1 – Summary of Significant Accounting Policies” in Part II, Item 8 of this Annual Report on Form 10-K.
ITEM 7A. QUANTITATIVE AND QUALITATIVE DISCLOSURES ABOUT MARKET RISK
Our interest rate risk relates primarily to our short-term investments of $438.1 million and $362.6 million as of March 29, 2015 and March 30, 2014, respectively. By policy, we limit our exposure to long-term investments and mitigate the credit risk through diversification and adherence to a policy requiring the purchase of highly-rated securities. As of March 29, 2015 and March 30, 2014, our cash, cash equivalents and investment portfolio was concentrated in securities with same day liquidity and at the end of fiscal 2015, a substantial majority of securities in our investment portfolio had maturities of less than two years. A hypothetical 10% change in interest rates will not have a material effect on the value of our investment portfolio as of March 29, 2015. We do not currently use derivative financial instruments in our investment portfolio.
At March 29, 2015 and March 30, 2014, we had no outstanding debt.
30
We are exposed to foreign currency exchange rate risk as a result of international sales, assets and liabilities of foreign subsidiaries, local operating expenses of our foreign entities and capital purchases denominated in foreign currencies. We may use derivative financial instruments to help manage our foreign currency exchange exposures. We do not enter into derivatives for speculative or trading purposes. We have foreign exchange facilities used for hedging arrangements with banks that allow us to enter into foreign exchange contracts totaling approximately $20.0 million, all of which was available at March 29, 2015. We performed a sensitivity analysis as of March 29, 2015 and March 30, 2014 and determined that, without hedging the exposure, a 10% change in the value of the U.S. dollar would result in an approximate 0.4% impact on gross profit margin percentage, as we operate a manufacturing testing facility in Malaysia, and an approximate 0.6% and 1.0% impact to operating expenses (as a percentage of revenue), respectively, as we operate sales offices in Japan, Taiwan and South Korea and throughout Europe and design centers in China and Canada. At March 29, 2015 and March 30, 2014, we had no outstanding foreign exchange contracts.
We did not have any material currency exposure related to any outstanding capital purchases as of March 29, 2015 and March 30, 2014.
31
ITEM 8. FINANCIAL STATEMENTS AND SUPPLEMENTARY DATA
Index to Consolidated Financial Statements
Consolidated Financial Statements: | |
Financial Statement Schedule: | |
32
Report of Independent Registered Public Accounting Firm
To the Board of Directors and Stockholders of
Integrated Device Technology, Inc.:
In our opinion, the consolidated financial statements listed in the accompanying index appearing under item 15(a)(1), present fairly, in all material respects, the financial position of Integrated Device Technology, Inc. and its subsidiaries at March 29, 2015 and March 30, 2014, and the results of their operations and their cash flows for each of the three years in the period ended March 29, 2015 in conformity with accounting principles generally accepted in the United States of America. In addition, in our opinion, the financial statement schedule listed in the accompanying index under item 15(a)(2) presents fairly, in all material respects, the information set forth therein when read in conjunction with the related consolidated financial statements. Also in our opinion, the Company maintained, in all material respects, effective internal control over financial reporting as of March 29, 2015, based on criteria established in Internal Control - Integrated Framework (2013) issued by the Committee of Sponsoring Organizations of the Treadway Commission (COSO). The Company's management is responsible for these financial statements and financial statement schedule, for maintaining effective internal control over financial reporting and for its assessment of the effectiveness of internal control over financial reporting, included in Management's Report on Internal Control over Financial Reporting appearing under Item 9A. Our responsibility is to express opinions on these financial statements, on the financial statement schedule, and on the Company's internal control over financial reporting based on our integrated audits. We conducted our audits in accordance with the standards of the Public Company Accounting Oversight Board (United States). Those standards require that we plan and perform the audits to obtain reasonable assurance about whether the financial statements are free of material misstatement and whether effective internal control over financial reporting was maintained in all material respects. Our audits of the financial statements included examining, on a test basis, evidence supporting the amounts and disclosures in the financial statements, assessing the accounting principles used and significant estimates made by management, and evaluating the overall financial statement presentation. Our audit of internal control over financial reporting included obtaining an understanding of internal control over financial reporting, assessing the risk that a material weakness exists, and testing and evaluating the design and operating effectiveness of internal control based on the assessed risk. Our audits also included performing such other procedures as we considered necessary in the circumstances. We believe that our audits provide a reasonable basis for our opinions.
A company’s internal control over financial reporting is a process designed to provide reasonable assurance regarding the reliability of financial reporting and the preparation of financial statements for external purposes in accordance with generally accepted accounting principles. A company’s internal control over financial reporting includes those policies and procedures that (i) pertain to the maintenance of records that, in reasonable detail, accurately and fairly reflect the transactions and dispositions of the assets of the company; (ii) provide reasonable assurance that transactions are recorded as necessary to permit preparation of financial statements in accordance with generally accepted accounting principles, and that receipts and expenditures of the company are being made only in accordance with authorizations of management and directors of the company; and (iii) provide reasonable assurance regarding prevention or timely detection of unauthorized acquisition, use, or disposition of the company’s assets that could have a material effect on the financial statements.
Because of its inherent limitations, internal control over financial reporting may not prevent or detect misstatements. Also, projections of any evaluation of effectiveness to future periods are subject to the risk that controls may become inadequate because of changes in conditions, or that the degree of compliance with the policies or procedures may deteriorate.
/s/ PricewaterhouseCoopers LLP
San Jose, CA
May 19, 2015
33
INTEGRATED DEVICE TECHNOLOGY, INC.
CONSOLIDATED BALANCE SHEETS
(in thousands) | March 29, 2015 | March 30, 2014 | |||||
Assets | |||||||
Current assets: | |||||||
Cash and cash equivalents | $ | 116,945 | $ | 91,211 | |||
Short-term investments | 438,115 | 362,604 | |||||
Accounts receivable, net of allowances of $4,664 and $3,134 | 63,618 | 68,904 | |||||
Inventories | 45,410 | 49,622 | |||||
Income tax receivable | 405 | 195 | |||||
Prepayments and other current assets | 15,636 | 12,839 | |||||
Total current assets | 680,129 | 585,375 | |||||
Property, plant and equipment, net | 65,508 | 69,827 | |||||
Goodwill | 135,644 | 135,644 | |||||
Acquisition-related intangible assets, net | 5,535 | 18,741 | |||||
Deferred non-current tax assets | 735 | 762 | |||||
Other assets | 26,108 | 20,611 | |||||
Total assets | $ | 913,659 | $ | 830,960 | |||
Liabilities and stockholders' equity | |||||||
Current liabilities: | |||||||
Accounts payable | $ | 28,006 | $ | 25,442 | |||
Accrued compensation and related expenses | 43,649 | 24,343 | |||||
Deferred income on shipments to distributors | 15,694 | 14,006 | |||||
Deferred tax liabilities | 1,401 | 1,346 | |||||
Other accrued liabilities | 17,582 | 11,525 | |||||
Total current liabilities | 106,332 | 76,662 | |||||
Deferred tax liabilities | 1,121 | 1,494 | |||||
Long-term income tax payable | 347 | 266 | |||||
Other long-term liabilities | 17,605 | 18,683 | |||||
Total liabilities | 125,405 | 97,105 | |||||
Commitments and contingencies (Note 15) | — | — | |||||
Stockholders' equity: | |||||||
Preferred stock: $.001 par value: 10,000 shares authorized; no shares issued | — | — | |||||
Common stock: $.001 par value: 350,000 shares authorized; 148,414 and 149,996 shares outstanding at March 29, 2015 and March 30, 2014, respectively | 148 | 150 | |||||
Additional paid-in capital | 2,510,868 | 2,467,341 | |||||
Treasury stock at cost: 99,849 shares and 94,556 shares at March 29, 2015 and March 30, 2014, respectively | (1,100,546 | ) | (1,021,301 | ) | |||
Accumulated deficit | (620,035 | ) | (713,944 | ) | |||
Accumulated other comprehensive income (loss) | (2,181 | ) | 1,609 | ||||
Total stockholders' equity | 788,254 | 733,855 | |||||
Total liabilities and stockholders' equity | $ | 913,659 | $ | 830,960 | |||
The accompanying notes are an integral part of these consolidated financial statements.
34
INTEGRATED DEVICE TECHNOLOGY, INC.
CONSOLIDATED STATEMENTS OF OPERATIONS
Fiscal Year Ended | |||||||||||
(In thousands, except per share data) | March 29, 2015 | March 30, 2014 | March 31, 2013 | ||||||||
Revenues | $ | 572,905 | $ | 484,779 | $ | 484,452 | |||||
Cost of revenues | 227,601 | 211,877 | 214,728 | ||||||||
Gross profit | 345,304 | 272,902 | 269,724 | ||||||||
Operating expenses: | |||||||||||
Research and development | 127,688 | 140,799 | 159,471 | ||||||||
Selling, general and administrative | 106,469 | 101,148 | 117,648 | ||||||||
Total operating expenses | 234,157 | 241,947 | 277,119 | ||||||||
Operating income (loss) | 111,147 | 30,955 | (7,395 | ) | |||||||
Gain on divestitures, net | — | 78,632 | 7,986 | ||||||||
Other-than-temporary impairment loss on investments | — | — | (1,708 | ) | |||||||
Interest income and other, net | 4,791 | 2,707 | 1,708 | ||||||||
Income before income taxes from continuing operations | 115,938 | 112,294 | 591 | ||||||||
Income tax expense (benefit) | 1,357 | 981 | (2,120 | ) | |||||||
Net income from continuing operations | 114,581 | 111,313 | 2,711 | ||||||||
Discontinued operations: | |||||||||||
Gain from divestiture | 16,840 | — | 886 | ||||||||
Loss from discontinued operations before income taxes | (37,237 | ) | (22,938 | ) | (23,653 | ) | |||||
Income tax expense | 275 | 11 | 116 | ||||||||
Net loss from discontinued operations | (20,672 | ) | (22,949 | ) | (22,883 | ) | |||||
Net income (loss) | $ | 93,909 | $ | 88,364 | $ | (20,172 | ) | ||||
Basic net income per share – continuing operations | $ | 0.77 | $ | 0.74 | $ | 0.02 | |||||
Basic net loss per share – discontinued operations | $ | (0.14 | ) | $ | (0.15 | ) | $ | (0.16 | ) | ||
Basic net income (loss) per share | $ | 0.63 | $ | 0.59 | $ | (0.14 | ) | ||||
Diluted net income per share – continuing operations | $ | 0.74 | $ | 0.73 | $ | 0.02 | |||||
Diluted net loss per share – discontinued operations | $ | (0.13 | ) | $ | (0.15 | ) | $ | (0.16 | ) | ||
Diluted net income (loss) per share | $ | 0.61 | $ | 0.58 | $ | (0.14 | ) | ||||
Weighted average shares: | |||||||||||
Basic | 148,714 | 149,480 | 144,014 | ||||||||
Diluted | 153,983 | 153,369 | 145,678 | ||||||||
The accompanying notes are an integral part of these consolidated financial statements.
35
INTEGRATED DEVICE TECHNOLOGY, INC.
CONSOLIDATED STATEMENTS OF COMPREHENSIVE INCOME (LOSS)
Fiscal Year Ended | |||||||||||
(in thousands) | March 29, 2015 | March 30, 2014 | March 31, 2013 | ||||||||
Net income (loss) | $ | 93,909 | $ | 88,364 | $ | (20,172 | ) | ||||
Other comprehensive income (loss), net of tax: | |||||||||||
Currency translation adjustments, net of tax | (5,218 | ) | (66 | ) | 235 | ||||||
Change in net unrealized gain (loss) on investments, net of tax | 666 | 194 | (35 | ) | |||||||
Actuarial gain (loss) on post-employment and post-retirement benefit plans, net of tax | 762 | (5 | ) | (77 | ) | ||||||
Total other comprehensive income (loss) | (3,790 | ) | 123 | 123 | |||||||
Comprehensive income (loss) | $ | 90,119 | $ | 88,487 | $ | (20,049 | ) | ||||
The accompanying notes are an integral part of these consolidated financial statements.
36
INTEGRATED DEVICE TECHNOLOGY, INC.
CONSOLIDATED STATEMENTS OF CASH FLOWS
Fiscal Year Ended | |||||||||||
(in thousands) | March 29, 2015 | March 30, 2014 | March 31, 2013 | ||||||||
Cash flows provided by operating activities: | |||||||||||
Net income (loss) | $ | 93,909 | $ | 88,364 | $ | (20,172 | ) | ||||
Adjustments: | |||||||||||
Depreciation | 18,808 | 20,872 | 20,089 | ||||||||
Amortization of intangible assets | 6,573 | 24,793 | 20,546 | ||||||||
Asset impairment | 8,471 | 7,230 | 584 | ||||||||
Gain from divestitures | (16,840 | ) | (78,632 | ) | (8,872 | ) | |||||
Stock-based compensation expense, net of amounts capitalized in inventory | 22,259 | 13,352 | 13,272 | ||||||||
Other-than-temporary impairment loss on investments | — | — | 1,708 | ||||||||
Deferred tax provision | (293 | ) | (8 | ) | (3,492 | ) | |||||
Changes in assets and liabilities (net of amounts acquired): | |||||||||||
Accounts receivable, net | 5,286 | (6,821 | ) | 2,483 | |||||||
Inventories | 4,412 | 2,935 | 15,510 | ||||||||
Prepayments and other assets | (2,337 | ) | 4,348 | 15,921 | |||||||
Accounts payable | 2,314 | (144 | ) | (3,163 | ) | ||||||
Accrued compensation and related expenses | 19,306 | 1,847 | (6,933 | ) | |||||||
Deferred income on shipments to distributors | 1,688 | (533 | ) | (245 | ) | ||||||
Income taxes payable and receivable | 90 | (888 | ) | 929 | |||||||
Other accrued liabilities and long-term liabilities | 8,126 | (1,086 | ) | (4,091 | ) | ||||||
Net cash provided by operating activities | 171,772 | 75,629 | 44,074 | ||||||||
Cash flows used in investing activities: | |||||||||||
Acquisitions, net of cash acquired | — | — | (68,341 | ) | |||||||
Cash in escrow related to acquisitions | 1,026 | 6,000 | (7,816 | ) | |||||||
Proceeds from divestitures | 15,300 | 96,299 | 14,237 | ||||||||
Purchases of property, plant and equipment, net | (17,765 | ) | (17,448 | ) | (27,854 | ) | |||||
Purchases of non-marketable equity securities | (4,000 | ) | — | — | |||||||
Purchases of short-term investments | (285,817 | ) | (463,283 | ) | (207,576 | ) | |||||
Proceeds from sales of short-term investments | 119,070 | 231,890 | 59,850 | ||||||||
Proceeds from maturities of short-term investments | 90,344 | 34,422 | 171,709 | ||||||||
Net cash used for investing activities | (81,842 | ) | (112,120 | ) | (65,791 | ) | |||||
Cash flows provided by (used for) financing activities: | |||||||||||
Proceeds from issuance of common stock | 21,067 | 46,066 | 17,395 | ||||||||
Repurchase of common stock | (79,245 | ) | (44,005 | ) | — | ||||||
Payment of acquisition related contingent consideration | (1,600 | ) | (5,130 | ) | — | ||||||
Net cash provided by (used for) financing activities | (59,778 | ) | (3,069 | ) | 17,395 | ||||||
Effect of exchange rates on cash and cash equivalents | (4,418 | ) | (66 | ) | 235 | ||||||
Net increase (decrease) in cash and cash equivalents | 25,734 | (39,626 | ) | (4,087 | ) | ||||||
Cash and cash equivalents at beginning of period | 91,211 | 130,837 | 134,924 | ||||||||
Cash and cash equivalents at end of period | $ | 116,945 | $ | 91,211 | $ | 130,837 | |||||
Supplemental disclosure of cash flow information | |||||||||||
Cash paid for: | |||||||||||
Interest | $ | 26 | $ | 22 | $ | 1,374 | |||||
Income taxes, net of refunds | $ | 1,840 | $ | 1,848 | $ | (84 | ) | ||||
Non-cash investing activities: | |||||||||||
Additions to property, plant and equipment included in accounts payable | $ | 473 | $ | 223 | $ | 523 | |||||
The accompanying notes are an integral part of these consolidated financial statements.
37
INTEGRATED DEVICE TECHNOLOGY, INC.
CONSOLIDATED STATEMENTS OF STOCKHOLDERS’ EQUITY
Common Stock and Additional Paid-In Capital | Treasury Stock | Accumulated Deficit | Accumulated Other Comprehensive Income (Loss) | Total Stockholders' Equity | ||||||||||||||||||
(in thousands) | Shares | Dollars | ||||||||||||||||||||
Balance, April 1, 2012 | 142,194 | $ | 2,377,457 | $ | (977,296 | ) | $ | (782,136 | ) | $ | 1,363 | $ | 619,388 | |||||||||
Net loss | — | — | — | (20,172 | ) | — | (20,172 | ) | ||||||||||||||
Other comprehensive income | — | — | — | — | 123 | 123 | ||||||||||||||||
Issuance of common stock | 4,059 | 17,395 | — | — | — | 17,395 | ||||||||||||||||
Stock-based compensation expense | — | 13,292 | — | — | — | 13,292 | ||||||||||||||||
Balance, March 31, 2013 | 146,253 | 2,408,144 | (977,296 | ) | (802,308 | ) | 1,486 | 630,026 | ||||||||||||||
Net income | — | — | — | 88,364 | — | 88,364 | ||||||||||||||||
Other comprehensive income | — | — | — | — | 123 | 123 | ||||||||||||||||
Issuance of common stock | 7,873 | 46,066 | — | — | — | 46,066 | ||||||||||||||||
Repurchase of common stock | (4,130 | ) | — | (44,005 | ) | — | — | (44,005 | ) | |||||||||||||
Stock-based compensation expense | — | 13,281 | — | — | — | 13,281 | ||||||||||||||||
Balance, March 30, 2014 | 149,996 | 2,467,491 | (1,021,301 | ) | (713,944 | ) | 1,609 | 733,855 | ||||||||||||||
Net income | — | — | — | 93,909 | — | 93,909 | ||||||||||||||||
Other comprehensive loss | — | — | — | — | (3,790 | ) | (3,790 | ) | ||||||||||||||
Issuance of common stock | 3,710 | 21,067 | — | — | — | 21,067 | ||||||||||||||||
Repurchase of common stock | (5,292 | ) | — | (79,245 | ) | — | — | (79,245 | ) | |||||||||||||
Stock-based compensation expense | — | 22,458 | — | — | — | 22,458 | ||||||||||||||||
Balance, March 29, 2015 | 148,414 | $ | 2,511,016 | $ | (1,100,546 | ) | $ | (620,035 | ) | $ | (2,181 | ) | $ | 788,254 | ||||||||
The accompanying notes are an integral part of these consolidated financial statements.
38
INTEGRATED DEVICE TECHNOLOGY, INC.
Notes to Consolidated Financial Statements
Note 1. Summary of Significant Accounting Policies
Nature of Business. Integrated Device Technology, Inc. (IDT or the Company) designs, develops, manufactures and markets a broad range of integrated circuits for the advanced communications, computing and consumer industries.
Basis of Presentation. The Company's fiscal year is the 52 or 53 week period ending on the Sunday nearest to March 31. Fiscal 2015 included 52 weeks and ended on March 29, 2015. Fiscal 2014 included 52 weeks and ended on March 30, 2014 and fiscal 2013 included 52 weeks and ended on March 31, 2013.
Principles of Consolidation. The consolidated financial statements include the accounts of the Company and its wholly-owned subsidiaries. All inter-company accounts and transactions have been eliminated.
Use of Estimates. The preparation of financial statements in conformity with generally accepted accounting principles requires management to make estimates and assumptions that affect the amounts reported in the financial statements and accompanying notes. Actual results could differ from those estimates.
Cash and Cash Equivalents. Cash equivalents are highly liquid investments with remaining maturities of three months or less at the time of purchase.
Investments
Available-for-Sale Investments. Investments designated as available-for-sale include marketable debt and equity securities. Available-for-sale investments are classified as short-term, as these investments generally consist of highly marketable securities that are intended to be available to meet near-term cash requirements. Marketable securities classified as available-for-sale are reported at market value, with net unrealized gains or losses recorded in accumulated other comprehensive income (loss), a separate component of stockholders' equity, until realized. Realized gains and losses on investments are computed based upon specific identification, are included in interest income and other, net and have not been significant for all periods presented.
Non-Marketable Equity Securities. Non-marketable equity securities are accounted for at historical cost or, if the Company has significant influence over the investee, using the equity method of accounting.
Other-Than-Temporary Impairment. All of the Company’s available-for-sale investments and non-marketable equity securities are subject to a periodic impairment review. Investments are considered to be impaired when a decline in fair value is judged to be other-than-temporary. This determination requires significant judgment. For publicly traded investments, impairment is determined based upon the specific facts and circumstances present at the time, including a review of the closing price over the previous six months, general market conditions and the Company’s intent and ability to hold the investment for a period of time sufficient to allow for recovery. For non-marketable equity securities, the impairment analysis requires the identification of events or circumstances that would likely have a significant adverse effect on the fair value of the investment, including revenue and earnings trends, overall business prospects and general market conditions in the investees’ industry or geographic area. Investments identified as having an indicator of impairment are subject to further analysis to determine if the investment is other-than-temporarily impaired, in which case the investment is written down to its impaired value.
Inventories. Inventories are recorded at the lower of standard cost (which approximates actual cost on a first-in, first-out basis) or market value. Inventory held at consignment locations is included in finished goods inventory as the Company retains full title and rights to the product. Inventory valuation includes provisions for excess and obsolete inventory based on management’s forecasts of demand over specific future time horizons and reserves to value the Company's inventory at the lower of cost or market which rely on forecasts of average selling prices (ASPs) in future periods.
Property, Plant and Equipment. Property, plant and equipment are stated at cost. Property, plant and equipment acquired in conjunction with mergers or acquisitions are stated at estimated fair value at the time of acquisition. For financial reporting purposes, depreciation is computed using the straight-line method over estimated useful lives of the assets. Estimated useful lives for major asset categories are as follows: machinery and equipment, 3 to 5 years; and buildings and improvements, 10 to 30 years. Leasehold improvements are amortized over the shorter of the estimated useful lives of the assets or the remaining term of the lease.
Long-Lived Assets and Goodwill. The carrying values of long-lived assets, including purchased intangibles are evaluated whenever events or circumstances indicate that the carrying values may not be recoverable. If estimated undiscounted cash flows are not sufficient to recover the carrying values, the affected assets are considered impaired and are written down to their estimated fair value, which is generally determined on the basis of discounted cash flows or outside appraisals.
The Company tests for impairment of goodwill and other indefinite-lived assets on an annual basis, or more frequently if indicators of impairment are present. These tests are performed at the reporting unit level using a two-step, fair-value based approach. The
39
first step, used to determine if impairment possibly exists, is to compare the carrying amount of a reporting unit, including goodwill, to its fair value. If the carrying amount of the reporting unit exceeds the fair value, the second step is to measure the amount of impairment loss by comparing the implied fair value of reporting unit goodwill with the carrying amount of that goodwill.
Income Taxes. The Company accounts for income taxes under an asset and liability approach that requires the expected future tax consequences of temporary differences between book and tax bases of assets and liabilities be recognized as deferred tax assets and liabilities. Generally accepted accounting principles require the Company to evaluate the ability to realize the value of its net deferred tax assets on an ongoing basis. A valuation allowance is recorded to reduce the net deferred tax assets to an amount that will more likely than not be realized. Accordingly, the Company considers various tax planning strategies, forecasts of future taxable income, and recent operating results in assessing the need for a valuation allowance. Since the fourth quarter of fiscal 2003, the Company has determined that, under applicable accounting principles, it is more likely than not that the Company will not realize the value of its net deferred tax assets. The Company continues to maintain a valuation allowance to reduce its deferred tax assets to an amount that is more likely than not to be realized. However, given the continued improvement in the Company's operations combined with certain tax strategies, the Company believes that there is a reasonable possibility that within the next 12 months, sufficient positive evidence may become available to allow the Company to reach a conclusion that a significant portion of the valuation allowance will no longer be needed. Release of the valuation allowance would result in the recognition of certain deferred tax assets and a decrease to income tax expense for the period the release is recorded. The exact timing and amount of the valuation allowance release are subject to change on the basis of the level of profitability that the Company is able to actually achieve.
The Company recognizes the tax liabilities for uncertain income tax positions taken on the income tax return based on the two-step process prescribed under U.S. GAAP. The first step is to determine whether it is more likely than not that each income tax position would be sustained upon audit. The second step is to estimate and measure the tax benefit as the amount that has a greater than 50% likelihood of being realized upon ultimate settlement with the tax authority. Estimating these amounts requires the Company to determine the probability of various possible outcomes. The Company evaluates these uncertain tax positions on a quarterly basis. This evaluation is based on the consideration of several factors including changes in facts or circumstances, changes in applicable tax law, settlement of issues under audit, and new exposures. If the Company later determines that the exposure is lower or that the liability is not sufficient to cover its revised expectations, the Company adjusts the liability and effect a related change in its tax provision during the period in which the Company makes such determination.
Revenue Recognition. The Company’s revenue results from semiconductor products sold through three channels: direct sales to original equipment manufacturers (OEMs) and electronic manufacturing service providers (EMSs), consignment sales to OEMs and EMSs, and sales through distributors. The Company recognizes revenue when persuasive evidence of an arrangement exists, delivery has occurred or services have been rendered, the price is fixed or determinable, and its ability to collect is reasonably assured.
Distributors who serve our customers worldwide and distributors who serve our customers in the U.S. and Europe regions, who have stock rotation, price protection and ship from stock pricing adjustment rights, the Company defers revenue and related cost of revenues on sales to these distributors until the product is sold through by the distributor to an end-customer. Subsequent to shipment to the distributor, the Company may reduce product pricing through price protection based on market conditions, competitive considerations and other factors. Price protection is granted to distributors on the inventory that they have on hand at the date the price protection is offered. The Company also grants certain credits to its distributors on specifically identified portions of the distributors’ business to allow them to earn a competitive gross margin on the sale of the Company’s products to their end customers. As a result of its inability to estimate these credits, the Company has determined that the sales price to these distributors is not fixed or determinable until the final sale to the end-customer.
In the Asia Pacific region and Japan, the Company has distributors for which revenue is recognized upon shipment, with reserves recorded for the estimated return and pricing adjustment exposures. The determination of the amount of reserves to be recorded for stock rotation rights requires the Company to make estimates as to the amount of product which will be returned by customers within their limited contractual rights. The Company utilizes historical return rates to estimate the exposure. In addition, on occasion, the Company can offer pricing adjustments to distributors for product purchased in a given quarter that remains in their inventory. These amounts are estimated by management based on discussions with customers, assessment of market trends, as well as historical practice.
Shipping and Handling Costs. The Company includes shipping and handling costs billed to customers in revenues. The Company’s shipping and handling costs are included in cost of revenues.
Stock-based Compensation. The fair value of employee restricted stock units is equal to the market value of the Company’s common stock on the date the award is granted. For performance-based restricted stock units, the Company is required to assess the probability of achieving certain financial objectives at the end of each reporting period. Based on the assessment of this probability, which requires subjective judgment, the Company records stock-based compensation expense before the performance criteria are actually fully achieved, which may then be reversed in future periods if the Company determines that it is no longer
40
probable that the objectives will be achieved. The expected cost of each award is reflected over the performance period and is reduced for estimated forfeitures. For restricted stock units which are subject to a market condition, compensation cost is recognized regardless of whether the market condition is satisfied, provided that the requisite service period has been provided. The market condition is considered in the estimate of fair value using a method that incorporates the possibility that the market condition may not be satisfied.
The Company estimates the fair value of employee stock options and the right to purchase shares under the employee stock purchase plan using the Black-Scholes valuation model, consistent with the FASB’s authoritative guidance for share-based payments. Option-pricing models require the input of highly subjective assumptions, including the expected term of options and the expected price volatility of the stock underlying such options. In addition, the Company is required to estimate the number of stock-based awards that will be forfeited due to employee turnover and true up these forfeiture rates when actual results are different from the Company's estimates. The Company attributes the value of stock-based compensation to expense on an accelerated method. Finally, the Company capitalizes into inventory a portion of the periodic stock-based compensation expense that relates to employees working in manufacturing activities.
The Company updates the expected term of stock option grants annually based on its analysis of the stock option exercise behavior over a period of time. The interest rate used in the Black-Scholes valuation model to value the stock option is based on the average U.S. Treasury interest rate over the expected term during the applicable quarter. The Company believes that the implied volatility of its common stock is an important consideration of overall market conditions and a good indicator of the expected volatility of its common stock. However, due to the limited volume of options freely traded over the counter, the Company believes that implied volatility, by itself, is not representative of the expected volatility of its common stock. Therefore, the Company's volatility factor used to estimate the fair value of its stock-based awards reflects a blend of historical volatility of its common stock and implied volatility of call options and dealer quotes on call options, generally having a term of less than twelve months. The Company has not paid, nor does it have current plans to pay dividends on its common stock in the foreseeable future.
The Company uses the “with and without” approach in determining the order in which tax attributes are utilized. As a result, the Company recognizes a tax benefit from stock-based awards in additional paid-in capital only if an incremental tax benefit is realized after all other tax attributes currently available to the Company have been utilized. In addition, the Company accounts for the indirect effects of stock-based awards on other tax attributes, such as the research tax credit, through the Consolidated Statements of Operations.
Comprehensive Income (Loss). Comprehensive income (loss) is comprised of net income (loss) and unrealized gains and losses on available-for-sale securities and foreign exchange contracts and changes in pension assets and liabilities. Accumulated other comprehensive income (loss), as presented on the consolidated balance sheets, consists of net unrealized gains and losses on available-for-sale securities and foreign currency translation adjustments, and changes in pension assets and liabilities, net of tax.
Pensions and Other Post-retirement Plans. The Company, through its actuaries, utilizes assumptions when estimating the liabilities for pension and other employee benefit plans. These assumptions, where applicable, include the discount rates used to determine the actuarial present value of projected benefit obligations, the rate of increase in future compensation levels, the long-term rate of return on assets and the growth in health care costs. The cost of these benefits is recognized in the Consolidated Financial Statements over an employee’s term of service with the Company, and the accrued benefits are reported as other long-term liabilities on the Consolidated Balance Sheets.
Translation of Foreign Currencies. For subsidiaries in which the functional currency is the local currency, gains and losses resulting from translation of foreign currency financial statements into U.S. dollars are recorded as a component of accumulated other comprehensive income (loss). For subsidiaries where the functional currency is the U.S. dollar, gains and losses resulting from the process of remeasuring foreign currency financial statements into U.S. dollars are included in interest income and other, net and have not been significant for all periods presented.
Certain Risk and Concentrations. The Company's most significant potential exposure to credit concentration risk includes debt-security investments, foreign exchange contracts and trade accounts receivable. The Company’s investment policy addresses sector and industry concentrations, credit ratings and maturity dates. The Company invests its excess cash primarily in highly-rated money market and short-term debt instruments, diversifies its investments and, by policy, invests only in highly-rated securities to minimize credit risk.
The Company sells integrated circuits to OEMs, distributors and EMSs primarily in the U.S., Europe, Japan and APAC. The Company monitors the financial condition of its major customers, including performing credit evaluations of those accounts which management considers to be high risk, and generally does not require collateral from its customers. When deemed necessary, the Company may limit the credit extended to certain customers. The Company’s relationship with the customer, and the customer’s past and current payment experience, are also factored into the evaluation in instances in which limited financial information is available. The Company maintains an allowance for doubtful accounts for probable credit losses, including reserves based upon a percentage of total receivables. When the Company becomes aware that a specific customer may default on its financial obligation, a specific amount, which takes into account the level of risk and the customer’s outstanding accounts receivable balance,
41
is reserved. These reserved amounts are classified within selling, general and administrative expenses. Write-offs of accounts receivable balances were not significant in each of the three fiscal years presented.
Sales through a distributor, Uniquest, represented approximately 16% and 10%, of the Company's revenues in fiscal 2015 and 2013, respectively. Sales through a distributor, Avnet and its affiliates, represented approximately 11%, 12% and 10% of the Company’s revenues in fiscal 2015, 2014 and 2013, respectively. Sales through a distributor, Maxtek and its affiliates, represented approximately 13% of the Company’s revenues in fiscal 2013. As of March 29, 2015, two distributors represented approximately 11% and 10%, respectively of the Company's account receivable. As of March 30, 2014, two distributors represented approximately 15% and 14%, respectively, of the Company's account receivable.
For foreign exchange contracts, the Company manages its potential credit exposure primarily by restricting transactions with only high-credit quality counterparties.
The semiconductor industry is characterized by rapid technological change, competitive pricing pressures, and cyclical market patterns. The Company's results of operations are affected by a wide variety of factors, including general economic conditions, both at home and abroad; economic conditions specific to the semiconductor industry; demand for the Company's products; the timely introduction of new products; implementation of new manufacturing technologies; manufacturing capacity; the availability and cost of materials and supplies; competition; the ability to safeguard patents and intellectual property in a rapidly evolving market; and reliance on assembly and manufacturing foundries, independent distributors and sales representatives. As a result, the Company may experience substantial period-to-period fluctuations in future operating results due to the factors mentioned above or other factors.
Product Warranty. The Company maintains a reserve for obligations it incurs under its product warranty program. The standard warranty period offered is one year, though in certain instances the warranty period may be extended to as long as two years. Management estimates the fair value of its warranty liability based on actual past warranty claims experience, its policies regarding customer warranty returns and other estimates about the timing and disposition of product returned under the program.
Recent Accounting Pronouncements
Accounting Pronouncements Recently Adopted
In February 2013, the Financial Accounting Standards Board (FASB) issued guidance for the recognition, measurement, and disclosure of certain obligations resulting from joint and several liability arrangements for which the total amount is fixed. Such obligations may include debt arrangements, legal settlements, and other contractual arrangements. The guidance is effective for fiscal years and interim periods within those fiscal years beginning after December 15, 2013 and should be applied retrospectively to all prior periods presented for those obligations within the scope which existed as of the beginning of the fiscal year of adoption. The Company adopted this guidance in the first quarter of fiscal 2015 and the adoption did not have a significant impact on the Company's consolidated financial statements.
In March 2013, the FASB issued guidance on the accounting for the cumulative translation adjustment upon derecognition of certain subsidiaries or groups of assets within a foreign entity or of an investment in a foreign entity. The guidance is effective prospectively for fiscal years and interim periods within those fiscal years beginning after December 15, 2013. The Company adopted this guidance in the first quarter of fiscal 2015 and the adoption did not have a significant impact on the Company's consolidated financial statements.
In July 2013, FASB issued an Accounting Standards Update (ASU) on Income Taxes, to improve the presentation of an unrecognized tax benefit when a net operating loss carryforward, a similar tax loss, or a tax credit carryforward exists. This guidance is expected to reduce diversity in practice and is expected to better reflect the manner in which an entity would settle at the reporting date any additional income taxes that would result from the disallowance of a tax position when net operating loss carryforwards, similar tax losses, or tax credit carryforwards exists. This guidance is effective for interim and annual periods beginning after December 15, 2013, which, for the Company, is the first quarter of fiscal 2015. The Company has historically accounted for its unrecognized tax benefits in accordance with this guidance and as such, adoption of this guidance had no impact on its consolidated financial statements.
Accounting Pronouncements Not Yet Effective for Fiscal 2015
In April 2014, the FASB issued guidance which changes the criteria for identifying a discontinued operation. The guidance limits the definition of a discontinued operation to the disposal of a component or group of components that is disposed of or is classified as held for sale and represents a strategic shift that has, or will have, a major effect on an entity's operations and financial results. This amended guidance is effective for annual and interim reporting periods beginning after December 15, 2014. The Company expects this guidance to have an impact on its financial statements only in the event of a future disposition which meets the criteria.
On May 28, 2014, the FASB issued ASU No. 2014-09, Revenue from Contracts with Customers, which requires an entity to recognize the amount of revenue to which it expects to be entitled for the transfer of promised goods or services to customers.
42
The ASU will replace most existing revenue recognition guidance in U.S. GAAP when it becomes effective. The standard permits the use of either the retrospective or cumulative effect transition method. On April 1, 2015, the FASB proposed deferring the effective date by one year to December 15, 2017 for annual periods beginning after that date. The FASB also proposed permitting early adoption of the standard, but not before the original effective date of December 15, 2016. The Company is currently evaluating the effect that ASU 2014-09 will have on its consolidated financial statements and related disclosures. The Company has not yet selected a transition method nor has it determined the effect of the standard on its ongoing financial reporting.
In August 2014, the FASB issued ASU No. 2014-15, Presentation of Financial Statements - Going Concern, Disclosure of Uncertainties about an Entity’s Ability to Continue as a Going Concern. This standard sets forth management’s responsibility to evaluate, each reporting period, whether there is substantial doubt about an entity’s ability to continue as a going concern, and if so, to provide related footnote disclosures. The standard is effective for annual reporting periods ending after December 15, 2016 and interim periods within annual periods beginning after December 15, 2016. The Company does not believe that the adoption of this guidance will have any material impact on its financial position or results of operations.
Note 2. Net Income Per Share From Continuing Operations
Basic net income per share is computed using the weighted-average number of common shares outstanding during the period. Diluted net income per share is computed using the weighted-average number of common and dilutive potential common shares outstanding during the period. Potential common shares include employee stock options and restricted stock units. For purposes of computing diluted net income per share, weighted-average potential common shares do not include potential common shares that are anti-dilutive under the treasury stock method.
The following table sets forth the computation of basic and diluted net income per share from continuing operations:
Fiscal Year Ended | |||||||||||
(in thousands, except per share amounts) | March 29, 2015 | March 30, 2014 | March 31, 2013 | ||||||||
Numerator (basic and diluted): | |||||||||||
Net income from continuing operations | $ | 114,581 | $ | 111,313 | $ | 2,711 | |||||
Denominator: | |||||||||||
Weighted average common shares outstanding, basic | 148,714 | 149,480 | 144,014 | ||||||||
Dilutive effect of employee stock options, restricted stock units and performance stock units | 5,269 | 3,889 | 1,664 | ||||||||
Weighted average common shares outstanding, diluted | 153,983 | 153,369 | 145,678 | ||||||||
Basic net income per share from continuing operations | $ | 0.77 | $ | 0.74 | $ | 0.02 | |||||
Diluted net income per share from continuing operations | $ | 0.74 | $ | 0.73 | $ | 0.02 | |||||
Potential dilutive common shares of 11 thousand, 1.5 million and 12.0 million pertaining to employee stock options, restricted stock and performance stock units were excluded from the calculation of diluted earnings per share for the fiscal years ended March 29, 2015, March 30, 2014 and March 31, 2013, respectively, because the effect would have been anti-dilutive.
Note 3. Business Combinations
Termination of Proposed Acquisition of PLX Technology, Inc. (PLX)
On April 30, 2012, IDT and PLX had entered into an Agreement and Plan of Merger with PLX Technology, Inc. (PLX) for the acquisition of PLX by IDT (the Agreement). On December 19, 2012, the United States Federal Trade Commission (FTC) filed an administrative complaint challenging IDT’s proposed acquisition of PLX. In response to the FTC’s determination to challenge the proposed acquisition of PLX by IDT, effective December 19, 2012, IDT and PLX mutually agreed to terminate the Agreement. Also on December 19, 2012, IDT withdrew its related exchange offer (the Offer) to acquire all of the issued and outstanding shares of common stock, $0.001 par value, of PLX and instructed Computershare, the exchange agent for the Offer, to promptly return all previously tendered shares.
Associated with the proposed acquisition of PLX, during the fiscal year ended March 31, 2013, the Company incurred approximately $10.7 million in acquisition related costs which were included in selling, general and administrative expense in the Consolidated Statements of Operations.
43
Acquisition of NXP B.V.'s Data Converter Business
On July 19, 2012, the Company completed an acquisition of certain assets related to technology and products developed for communications analog mixed-signal market applications from NXP B.V. for an aggregate cash purchase price of approximately $31.2 million, less a $4.0 million credit from NXP B.V. for certain accrued liabilities assumed by the Company from NXP B.V. resulting in a net aggregate purchase price of $27.2 million. The Company incurred approximately $3.9 million in acquisition related costs, which were included in loss from discontinued operations in the Consolidated Statements of Operations for the fiscal year ended March 31, 2013.
The financial results of the acquired NXP's data converter products have been included in the Company's HSC business since the closing of the acquisition. In fiscal 2014, the Company initiated a plan to divest its HSC business. The HSC business was included in the Company’s Communications reportable segment. For financial statements purposes, the results of operations for the HSC business have been segregated from those of the continuing operations and are presented in the Company's consolidated financial statements as discontinued operations (see Note 4).
Acquisition of Fox Enterprises, Inc.
On April 30, 2012, the Company completed the acquisition of Fox Enterprises, Inc. (Fox), a leading supplier of frequency control products including crystals and crystal oscillators, in an all-cash transaction for approximately $28.9 million, which included $25.7 million in cash paid at closing and $3.2 million which was recorded as a liability representing the fair value of contingent cash consideration of up to $4.0 million based upon the achievement of future financial milestones, which would be payable after 1 year from the acquisition date. In June 2013, the Company settled the contingent consideration and paid former shareholders of Fox $3.3 million.
The Company incurred approximately $0.2 million of acquisition-related costs in fiscal 2014 and these costs were included in selling, general and administrative expenses in the Consolidated Statements of Operations.
The financial results of Fox have been included in the Company’s Consolidated Statements of Operations from April 30, 2012, the closing date of the acquisition.
Acquisition of Alvand Technologies, Inc.
On April 16, 2012, the Company completed the acquisition of Alvand Technologies Inc., a leading analog integrated circuits company specializing in data converters, for total purchase consideration of approximately $23.3 million, of which $20.5 million was paid in cash at closing and $2.8 million was recorded as a liability representing the fair value of contingent cash consideration of up to $4.0 million based upon the achievement of future product development milestones to be completed within 3 years following the acquisition date. Payments would be made on a proportionate basis upon the completion of each milestone. As of March 31, 2013, the fair value of the contingent consideration was re-measured based on a revised product development forecast for the business and increased $0.5 million to $3.3 million. As of March 30, 2014, the fair value of the contingent consideration was again re-measured based on a revised product development forecast for the business and increased $0.6 million. During fiscal year 2014, the Company paid $1.8 million in contingent consideration and the remaining estimated fair value of the unpaid contingent consideration for Alvand Technologies as of March 30, 2014 was $2.1 million. During fiscal year 2015, the Company paid $1.6 million and released the remaining contingent liability of $0.5 million to discontinued operations, as the remaining future milestones will not be achieved as a result of the sale of certain assets related to the Alvand portion of the HSC business (see Note 4).
The financial results of Alvand Technologies have been included in the Company’s HSC business since the closing of the acquisition. In fiscal year 2014, the Company initiated a plan to divest its HSC business. The HSC business was included in the Company’s Communications reportable segment. For financial statements purposes, the results of operations for the HSC business have been segregated from those of the continuing operations and are presented in the Company's consolidated financial statements as discontinued operations (see Note 4).
Note 4. Discontinued Operations
High-Speed Converter (“HSC”) Business
In fiscal 2014, the Company initiated a project to divest its HSC business. The Company believes that this divestiture would allow it to strengthen its focus on its analog-intensive mixed-signal, timing and synchronization, and interface and connectivity solutions. The Company has classified the assets related to the HSC business as held for sale. In fiscal 2014, the Company recorded total impairment charge of $4.8 million to discontinued operations, which consisted of $2.2 million in goodwill and $2.6 million in intangible assets.
The HSC business includes the assets of NXP B.V.’s Data Converter Business and Alvand Technologies, Inc., which were acquired by the Company during fiscal 2013. On May 30, 2014, the Company completed the sale of certain assets related to the Alvand portion of the HSC business to a buyer pursuant to an Asset Purchase Agreement. Upon the closing of the transaction, the buyer paid the Company $18.0 million in cash consideration, of which $2.7 million will be held in an escrow account for a period of 18
44
months. The Company recorded a gain of $16.8 million in discontinued operations related to this divestiture during fiscal 2015. The following table summarizes the components of the gain (in thousands):
Amount | |||
Cash proceeds from sale (including amounts held in escrow) | $ | 18,000 | |
Less book value of assets sold and direct costs related to the sale: | — | ||
Intangible assets | (990 | ) | |
Transaction and other costs | (170 | ) | |
Gain on divestiture | $ | 16,840 | |
Following the sale of assets related to the Alvand portion of the HSC business, the business had remaining long-lived assets classified as held for sale amounting to $8.5 million, which consisted of $2.9 million in fixed assets and $5.6 million in intangible assets. The Company evaluated the carrying value of the disposal group and determined that it exceeded its estimated fair value based on estimated selling price less cost to sell. Accordingly, total impairment charge of 8.5 million was recorded to loss from discontinued operations in the Consolidated Statement of Operations for fiscal 2015.
As of March 29, 2015, all long-lived assets related to the HSC business were fully impaired. Refer to Note 21 for the sale of HSC business subsequent to March 29, 2015.
The HSC business was included in the Company’s Communications reportable segment. For financial statements purposes, the results of operations for the HSC business have been segregated from those of the continuing operations and are presented in the Company's consolidated financial statements as discontinued operations.
The results of the HSC business discontinued operations for the fiscal years 2015, 2014 and 2013 were as follows (in thousands):
For the Twelve Months Ended, | |||||||||||
March 29, 2015 | March 30, 2014 | March 31, 2013 | |||||||||
Revenues | $ | 3,803 | $ | 3,466 | $ | 2,784 | |||||
Cost of revenue | 1,939 | 2,935 | 2,908 | ||||||||
Goodwill and long-lived assets impairment | 8,471 | 4,797 | — | ||||||||
Restructuring charges (see Note 14) | 18,305 | — | — | ||||||||
Operating expenses | 12,325 | 18,622 | 18,398 | ||||||||
Gain on divestiture | 16,840 | — | — | ||||||||
Other income | — | (50 | ) | — | |||||||
Income tax expense | 275 | 11 | 113 | ||||||||
Net loss from discontinued operations | $ | (20,672 | ) | $ | (22,949 | ) | $ | (18,635 | ) | ||
Video Business
On August 1, 2012, the Company completed the transfer of the remaining assets of its video business to Synaptics for $5.0 million in cash pursuant to an Asset Purchase Agreement. In connection with the divestiture, 47 employees were transferred to Synaptics. In the second quarter of fiscal 2013, the Company recorded a gain of $0.9 million related to this divestiture. The following table summarizes the components of the gain (in thousands):
Amount | |||
Cash proceeds from sale | $ | 5,000 | |
Less book value of assets sold and direct costs related to the sale: | |||
Fixed assets | (1,963 | ) | |
Goodwill | (700 | ) | |
Inventories | (1,288 | ) | |
Transaction and other costs | (163 | ) | |
Gain on divestiture | $ | 886 | |
45
Prior to fiscal 2013, the video business was part of the Company’s Computing and Consumer reportable segment. For financial statement purposes, the results of operations for the video business for fiscal 2013 are presented in the Company's consolidated financial statements as discontinued operations.
The results of discontinued operations for fiscal 2013 are as follows (in thousands):
March 31, 2013 | |||||
Revenues | $ | 2,429 | |||
Cost of revenue | 3,006 | ||||
Operating expenses | 4,554 | ||||
Gain on divestiture | 886 | ||||
Income tax expense | 3 | ||||
Net loss from discontinued operations | $ | (4,248 | ) | ||
Note 5. Other Divestitures (not accounted for as discontinued operations)
Sale of Certain Assets of Audio Business
On December 13, 2013, Integrated Device Technology, Inc. and Integrated Device Technology (Malaysia) Sdn. Bhd., a wholly-owned subsidiary of IDT (collectively “IDT”), completed the sale of certain assets of its Audio business to Stravelis, Inc. for $0.2 million in cash and up to a maximum of $1.0 million additional consideration contingent upon future revenues. The Company estimated the fair value of the contingent consideration at the time of sale to be zero based on the estimated probability of attainment of future revenue targets. During fiscal 2015, the Company received $0.3 million in cash of the contingent consideration, which was recorded as interest income and other, net in the Consolidated Statement of Operations. The Company recorded a loss of $3.7 million on divestiture related to the sale in fiscal 2014.
The following table summarizes the components of the loss on divestiture (in thousands):
Amount | ||||
Cash proceeds from sale | $ | 200 | ||
Maximum contingent consideration | 1,000 | |||
Total consideration | $ | 1,200 | ||
Fair value adjustment to contingent consideration | $ | (1,000 | ) | |
Fair value adjustment to transitional services agreement | (300 | ) | ||
Fixed assets | (135 | ) | ||
Inventories | (3,051 | ) | ||
Other assets | (304 | ) | ||
Transaction and other costs | (126 | ) | ||
Loss on divestiture | $ | (3,716 | ) | |
Prior to the divestiture, this business was part of a larger cash-flow generating product group and did not, on its own, represent a separate operation of the Company and, therefore, this sale did not qualify as discontinued operations.
Sale of Certain Assets of PCI Express ("PCIe") Enterprise Flash Controller Business
On July 12, 2013, Integrated Device Technology, Inc. and Integrated Device Technology (Malaysia) Sdn. Bhd., a wholly-owned subsidiary of IDT (collectively “IDT”), completed the sale of certain assets of its PCI Express ("PCIe") enterprise flash controller business to PMC-Sierra, Inc.(“PMC”), for $96.1 million in cash.
The Company recorded a gain of $82.3 million on divestiture related to this transaction in fiscal 2014.
The following table summarizes the components of the gain on divestiture (in thousands):
46
Amount | ||||
Cash proceeds from sale | $ | 96,099 | ||
Less book value of assets sold and direct costs related to the sale: | ||||
Fixed assets | (1,312 | ) | ||
Inventories | (876 | ) | ||
Goodwill allocation | (7,323 | ) | ||
Transaction and other costs | (4,239 | ) | ||
Gain on divestiture | $ | 82,349 | ||
Pursuant to the terms of the Asset Purchase Agreement (the "Purchase Agreement") by and among IDT and PMC, dated May 29, 2013, IDT sold (i) substantially all of the assets that were used by IDT and its subsidiaries in the business of designing, developing, manufacturing, testing, marketing, supporting, maintaining, distributing, provisioning and selling non-volatile memory (flash) controllers and (ii) all technology and intellectual property rights owned by IDT or any of its subsidiaries and used exclusively in, or developed exclusively for use in, (a) switching circuits having the primary function of flexible routing of data from/to multiple switch interface ports, where all switch interface ports conform to the PCIe protocol, or (b) circuits having the primary function of executing all of the capturing, re-timing, re-generating and re-transmitting PCIe signals to help extend the physical reach of the signals in a system (the “Disposition”).
In connection with the closing of the Disposition, a license agreement was entered into by IDT and a subsidiary of PMC simultaneously with the Purchase Agreement, whereby IDT will license certain intellectual property rights and technology to PMC, and PMC will license back to IDT certain of the intellectual property rights and technology acquired by PMC in the Disposition.
In connection with the closing of the Disposition, IDT and PMC also entered into (a) a transition services agreement and (b) a five year supply agreement, whereby IDT will supply wafers for certain products to PMC.
Prior to the divestiture, the operating results for IDTs PCIe flash controller business were included in the Company's Computing and Consumer reportable segment. The PCIe enterprise flash controller business was part of a larger cash-flow generating product group and did not, on its own, represent a separate operation of the Company and, therefore, this sale did not qualify as discontinued operations.
Sale of Smart Meter Business
On March 7, 2013, the Company completed the sale of its smart metering business and related assets to Atmel Corporation for $10.3 million in cash, of which $1.0 million was held in an escrow account for a period of one year and was received in full in fiscal 2014. In fiscal 2013, the Company recorded a gain of $8.0 million related to this divestiture. Prior to the divestiture, the smart meter business was part of a larger cash-flow generating product group and did not, on its own, represent a separate operation of the Company and, therefore, this sale did not qualify as discontinued operations. The following table summarizes the components of the gain on divestiture (in thousands):
Amount | |||
Cash proceeds from sale | $ | 10,264 | |
Less book value of assets sold and direct costs related to the sale: | |||
Fixed assets | (22 | ) | |
Inventories | (1,299 | ) | |
Transaction and other costs | (957 | ) | |
Gain on divestiture | $ | 7,986 | |
Note 6. Fair Value Measurement
Fair value measurement is the price that would be received from selling an asset or paid to transfer a liability in an orderly transaction between market participants at the measurement date. As such, fair value is a market-based measurement that should be determined based on assumptions that market participants would use in pricing assets or liabilities. When determining the fair value measurements for assets and liabilities required or permitted to be recorded at fair value, the Company considers the principal or most advantageous market in which it would transact.
47
Fair Value Hierarchy
The three levels of inputs that may be used to measure fair value are as follows:
Level 1: Quoted market prices for identical assets or liabilities in active markets at the measure date.
Level 2: Observable inputs other than quoted prices included in Level 1, such as quoted prices for similar assets and liabilities in active markets; quoted prices for identical or similar assets and liabilities in markets that are not active; or other inputs that are observable or can be corroborated by observable market data.
Level 3: Inputs reflect management’s best estimate of what market participants would use in pricing the asset or liability at the measurement date. The inputs are unobservable in the market and significant to the instrument’s valuation.
The following table summarizes the Company’s financial assets measured at fair value on a recurring basis as of March 29, 2015:
Fair Value at Reporting Date Using | |||||||||||||||
(in thousands) | Quoted Prices in Active Markets for Identical Assets (Level 1) | Significant Other Observable Inputs (Level 2) | Significant Unobservable Inputs (Level 3) | Total | |||||||||||
Cash equivalents and short-term investments: | |||||||||||||||
U.S. government treasuries and agencies securities | $ | 135,945 | $ | — | $ | — | $ | 135,945 | |||||||
Money market funds | 55,578 | — | — | 55,578 | |||||||||||
Asset-backed securities | — | 31,830 | — | 31,830 | |||||||||||
Corporate bonds | — | 245,675 | — | 245,675 | |||||||||||
International government bonds | — | 1,006 | — | 1,006 | |||||||||||
Corporate commercial paper | — | 4,999 | — | 4,999 | |||||||||||
Bank deposits | — | 16,915 | — | 16,915 | |||||||||||
Repurchase agreements | — | 191 | — | 191 | |||||||||||
Municipal bonds | — | 6,044 | — | 6,044 | |||||||||||
Total assets measured at fair value | $ | 191,523 | $ | 306,660 | $ | — | $ | 498,183 | |||||||
48
The following table summarizes the Company’s financial assets and liabilities measured at fair value on a recurring basis as of March 30, 2014:
Fair Value at Reporting Date Using | |||||||||||||||
(in thousands) | Quoted Prices in Active Markets for Identical Assets (Level 1) | Significant Other Observable Inputs (Level 2) | Significant Unobservable Inputs (Level 3) | Total | |||||||||||
Cash equivalents and short-term investments: | |||||||||||||||
U.S. government treasuries and agencies securities | $ | 112,253 | $ | — | $ | — | $ | 112,253 | |||||||
Money market funds | 53,430 | — | — | 53,430 | |||||||||||
Asset-backed securities | — | 22,332 | — | 22,332 | |||||||||||
Corporate bonds | — | 199,806 | — | 199,806 | |||||||||||
International government bonds | — | 3,014 | — | 3,014 | |||||||||||
Corporate commercial paper | — | 6,246 | — | 6,246 | |||||||||||
Bank deposits | — | 18,538 | — | 18,538 | |||||||||||
Repurchase agreements | — | 46 | — | 46 | |||||||||||
Municipal bonds | — | 9,210 | — | 9,210 | |||||||||||
Total assets measured at fair value | $ | 165,683 | $ | 259,192 | $ | — | $ | 424,875 | |||||||
Liabilities: | |||||||||||||||
Fair value of contingent consideration | — | — | 2,140 | 2,140 | |||||||||||
Total liabilities measured at fair value | $ | — | $ | — | $ | 2,140 | $ | 2,140 | |||||||
U.S. government treasuries and U.S. government agency securities as of March 29, 2015 and March 30, 2014 do not include any U.S. government guaranteed bank issued paper. Corporate bonds include bank-issued securities that are guaranteed by the Federal Deposit Insurance Corporation (FDIC).
The securities in Level 1 are highly liquid and actively traded in exchange markets or over-the-counter markets. Level 2 fixed income securities are priced using quoted market prices for similar instruments, non-binding market prices that are corroborated by observable market data.
In connection with the acquisitions of Fox Enterprises and Alvand Technologies (See "Note 3 - Business Combinations"), liabilities were recognized for the Company’s estimate of the fair value of contingent consideration on the acquisition dates based on probability-based forecasted revenues, gross profits and attainment of product development milestones. These fair value measurements are based on significant inputs not observed in the market and thus represent a Level 3 measurement, which reflect the Company’s own assumptions concerning future revenues, gross profit and product development milestones of the acquired businesses in measuring fair value. During the fiscal year 2014, the Company settled the contingent consideration with Fox and paid $3.3 million to the former shareholders of Fox. Also during the fiscal year 2014, the Company paid $1.8 million in contingent consideration for Alvand Technologies. The remaining estimated fair value of the contingent liability for Alvand Technologies as of March 30, 2014 was $2.1 million. During fiscal 2015, the Company paid $1.6 million and released the remaining contingent consideration of $0.5 million to discontinued operations, as the remaining future milestones were not achieved as a result of the sale of certain assets related to the Alvand portion of the HSC business.
49
The following table summarizes the change in the fair value of liabilities measured using significant unobservable inputs (Level 3) for fiscal 2015 and 2014:
(in thousands) | Estimated Fair Value | ||
Balance as of March 31, 2013 | $ | 6,695 | |
Changes in fair value | 575 | ||
Payment | (5,130 | ) | |
Balance as of March 30, 2014 | 2,140 | ||
Payment | (1,600 | ) | |
Release | (540 | ) | |
Balance as of March 29, 2015 | $ | — | |
Cash equivalents are highly liquid investments with original maturities of three months or less at the time of purchase. The Company maintains its cash and cash equivalents with reputable major financial institutions. Deposits with these banks may exceed the FDIC insurance limits or similar limits in foreign jurisdictions. These deposits typically may be redeemed upon demand and, therefore, bear minimal risk. While the Company monitors daily the cash balances in its operating accounts and adjusts the balances as appropriate, these balances could be affected if one or more of the financial institutions with which the Company deposits fails or is subject to other adverse conditions in the financial markets. As of March 29, 2015, the Company has not experienced any losses in its operating accounts.
All of the Company’s available-for-sale investments are subject to a periodic impairment review. Investments are considered to be impaired when a decline in fair value is judged to be other-than-temporary. This determination requires significant judgment. For publicly traded investments, impairment is determined based upon the specific facts and circumstances present at the time, including a review of the closing price over the length of time, general market conditions and the Company’s intent and ability to hold the investment for a period of time sufficient to allow for recovery. Although the Company believes its portfolio continues to be comprised of sound investments due to high credit ratings and government guarantees of the underlying investments, a further decline in the capital and financial markets would adversely impact the market values of its investments and their liquidity. The Company continually monitors the credit risk in its portfolio and future developments in the credit markets and makes appropriate changes to its investment policy as deemed necessary. The Company did not record any impairment charges related to its available-for-sale investments in fiscal 2015, 2014 and 2013.
Note 7. Investments
Available-for-Sale Securities
Available-for-sale investments at March 29, 2015 were as follows:
(in thousands) | Cost | Gross Unrealized Gains | Gross Unrealized Losses | Estimated Fair Value | |||||||||||
U.S. government treasuries and agencies securities | $ | 135,570 | $ | 398 | $ | (23 | ) | $ | 135,945 | ||||||
Money market funds | 55,578 | — | — | 55,578 | |||||||||||
Asset-backed securities | 31,830 | 9 | (9 | ) | 31,830 | ||||||||||
Corporate bonds | 245,229 | 567 | (121 | ) | 245,675 | ||||||||||
International government bonds | 1,010 | — | (4 | ) | 1,006 | ||||||||||
Corporate commercial paper | 4,999 | — | — | 4,999 | |||||||||||
Bank deposits | 16,915 | — | — | 16,915 | |||||||||||
Repurchase agreements | 191 | — | — | 191 | |||||||||||
Municipal bonds | 6,001 | 45 | (2 | ) | 6,044 | ||||||||||
Total available-for-sale investments | 497,323 | 1,019 | (159 | ) | 498,183 | ||||||||||
Less amounts classified as cash equivalents | (60,068 | ) | — | — | (60,068 | ) | |||||||||
Short-term investments | $ | 437,255 | $ | 1,019 | $ | (159 | ) | $ | 438,115 | ||||||
50
Available-for-sale investments at March 30, 2014 were as follows:
(in thousands) | Cost | Gross Unrealized Gains | Gross Unrealized Losses | Estimated Fair Value | |||||||||||
U.S. government treasuries and agencies securities | $ | 112,268 | $ | 76 | $ | (91 | ) | $ | 112,253 | ||||||
Money market funds | 53,430 | — | — | 53,430 | |||||||||||
Asset-backed securities | 22,330 | 11 | (9 | ) | 22,332 | ||||||||||
Corporate bonds | 199,598 | 335 | (127 | ) | 199,806 | ||||||||||
International government bonds | 3,023 | — | (9 | ) | 3,014 | ||||||||||
Corporate commercial paper | 6,246 | — | — | 6,246 | |||||||||||
Bank deposits | 18,538 | — | — | 18,538 | |||||||||||
Repurchase agreements | 46 | — | — | 46 | |||||||||||
Municipal bonds | 9,196 | 32 | (18 | ) | 9,210 | ||||||||||
Total available-for-sale investments | 424,675 | 454 | (254 | ) | 424,875 | ||||||||||
Less amounts classified as cash equivalents | (62,671 | ) | — | — | (62,671 | ) | |||||||||
Short-term investments | $ | 362,004 | $ | 454 | $ | (254 | ) | $ | 362,204 | ||||||
The cost and estimated fair value of available-for-sale debt securities at March 29, 2015, by contractual maturity, were as follows:
(in thousands) | Amortized Cost | Estimated Fair Value | |||||
Due in 1 year or less | $ | 153,753 | $ | 153,823 | |||
Due in 1-2 years | 132,241 | 132,529 | |||||
Due in 2-5 years | 211,329 | 211,831 | |||||
Total investments in available-for-sale debt securities | $ | 497,323 | $ | 498,183 | |||
The cost and estimated fair value of available-for-sale debt securities at March 30, 2014, by contractual maturity, were as follows:
(in thousands) | Amortized Cost | Estimated Fair Value | |||||
Due in 1 year or less | $ | 173,850 | $ | 173,891 | |||
Due in 1-2 years | 101,275 | 101,378 | |||||
Due in 2-5 years | 149,550 | 149,606 | |||||
Total investments in available-for-sale debt securities | $ | 424,675 | $ | 424,875 | |||
51
The following table shows the gross unrealized losses and fair value of the Company’s investments with unrealized losses as of March 29, 2015, aggregated by investment category and length of time that individual securities have been in a continuous loss position.
Less Than 12 Months | 12 Months or Greater | Total | |||||||||||||||||||||
(in thousands) | Fair Value | Unrealized Loss | Fair Value | Unrealized Loss | Fair Value | Unrealized Loss | |||||||||||||||||
Corporate bonds | $ | 67,367 | $ | (121 | ) | $ | — | $ | — | $ | 67,367 | $ | (121 | ) | |||||||||
Asset-backed securities | 17,736 | (9 | ) | — | — | 17,736 | (9 | ) | |||||||||||||||
U.S. government treasuries and agencies securities | 18,478 | (23 | ) | — | — | 18,478 | (23 | ) | |||||||||||||||
Municipal bonds | 1,001 | (2 | ) | — | — | 1,001 | (2 | ) | |||||||||||||||
International government bonds | 1,006 | (4 | ) | — | — | 1,006 | (4 | ) | |||||||||||||||
Total | $ | 105,588 | $ | (159 | ) | $ | — | $ | — | $ | 105,588 | $ | (159 | ) | |||||||||
The following table shows the gross unrealized losses and fair value of the Company’s investments with unrealized losses, as of March 30, 2014, aggregated by investment category and length of time that individual securities have been in a continuous unrealized loss position.
Less Than 12 Months | 12 Months or Greater | Total | |||||||||||||||||||||
(in thousands) | Fair Value | Unrealized Loss | Fair Value | Unrealized Loss | Fair Value | Unrealized Loss | |||||||||||||||||
Corporate bonds | $ | 52,783 | $ | (127 | ) | $ | — | $ | — | $ | 52,783 | $ | (127 | ) | |||||||||
Asset-backed securities | 11,156 | (9 | ) | 11,156 | (9 | ) | |||||||||||||||||
U.S. government treasuries and agencies securities | 36,403 | (91 | ) | — | — | 36,403 | (91 | ) | |||||||||||||||
Municipal bonds | 4,000 | (18 | ) | — | — | 4,000 | (18 | ) | |||||||||||||||
International government bonds | 3,014 | (9 | ) | — | — | 3,014 | (9 | ) | |||||||||||||||
Total | $ | 107,356 | $ | (254 | ) | $ | — | $ | — | $ | 107,356 | $ | (254 | ) | |||||||||
Currently, a significant portion of the Company’s available-for-sale investments that it holds are high grade instruments. As of March 29, 2015, the unrealized losses on the Company’s available-for-sale investments represented an insignificant amount in relation to its total available-for-sale portfolio. Substantially all of the Company’s unrealized losses on its available-for-sale marketable debt instruments can be attributed to fair value fluctuations in an unstable credit environment that resulted in a decrease in the market liquidity for debt instruments. Because the Company has the ability to hold these investments until a recovery of fair value, which may be maturity, the Company did not consider these investments to be other-than-temporarily impaired at March 29, 2015 or March 30, 2014.
Non-marketable Equity Securities
The Company accounts for its equity investments in privately held companies under the cost method. These investments are subject to periodic impairment review and measured and recorded at fair value when they are deemed to be other-than-temporarily impaired. In determining whether a decline in value of its investment has occurred and is other than temporary, an assessment was made by considering available evidence, including the general market conditions, the investee’s financial condition, near-term prospects, market comparables and subsequent rounds of financing. The valuation also takes into account the investee’s capital structure, liquidation preferences for its capital and other economic variables. The valuation methodology for determining the decline in value of non-marketable equity securities is based on inputs that require management's judgment.
During fiscal 2015, the Company purchased common stock of a privately-held company for $4.0 million. This investment (included in Other Assets on the Consolidated Balance Sheet) is accounted for as a cost-method investment, as the Company owns less than 20% of the voting securities and does not have the ability to exercise significant influence over operating and financial policies of the entity.
The Company did not recognize any impairment loss in fiscal 2015 and 2014. During fiscal 2013, the Company determined that the carrying values of two of its non-marketable equity securities were impaired and recorded a $1.7 million other-than-temporary
52
impairment loss during the period. The aggregate carrying value of the Company’s non-marketable equity securities was $4.0 million and zero as of March 29, 2015 and March 30, 2014, respectively.
Note 8. Stock-Based Employee Compensation
Equity Incentive Programs
The Company currently issues awards under two equity-based plans in order to provide additional incentive and retention to directors and employees who are considered to be essential to the long-range success of the Company. These plans are further described below.
2004 Equity Plan (2004 Plan)
In September 2004, the Company’s stockholders approved the 2004 Plan. On July 21, 2010, the Board of Directors of the Company approved an amendment to the Company’s 2004 Plan to increase the number of shares of common stock reserved for issuance thereunder from 28,500,000 shares to 36,800,000 shares (an increase of 8,300,000 shares), provided, however, that the aggregate number of common shares available for issuance under the 2004 Plan is reduced by 1.74 shares for each common share delivered in settlement of any full value award, which are awards other than stock options and stock appreciation rights, that are granted under the 2004 Plan on or after September 23, 2010. On September 23, 2010, the stockholders of the Company approved the proposed amendment described above, which also includes certain other changes to the 2004 Plan, including an extension of the term of the 2004 Plan. Options granted by the Company under the 2004 Plan generally expire seven years from the date of grant and generally vest over a four-year period from the date of grant, with one-quarter of the shares of common stock vesting on the 1 year anniversary of the grant date and the remaining shares vesting monthly for the 36 months thereafter. The exercise price of the options granted by the Company under the 2004 Plan shall not be less than 100% of the fair market value for a common share subject to such option on the date the option is granted. Full value awards made under the 2004 Plan shall become vested over a period of not less than 3 years (or, if vesting is performance-based, over a period of not less than one year) following the date such award is made; provided, however, that full value awards that result in the issuance of an aggregate of up to 5% of common stock available under the 2004 Plan may be granted to any one or more participants without respect to such minimum vesting provisions. As of March 29, 2015, there were 11.1 million shares available for future grant under the 2004 Plan.
Compensation Expense
The following table summarizes stock-based compensation expense by line items appearing in the Company’s Consolidated Statement of Operations:
Fiscal Year Ended | |||||||||||
(in thousands) | March 29, 2015 | March 30, 2014 | March 31, 2013 | ||||||||
Cost of revenue | $ | 1,936 | $ | 1,189 | $ | 1,113 | |||||
Research and development | 9,813 | 5,601 | 6,692 | ||||||||
Selling, general and administrative | 10,704 | 5,887 | 5,250 | ||||||||
Discontinued operations | (194 | ) | 675 | 217 | |||||||
Total stock-based compensation expense | $ | 22,259 | $ | 13,352 | $ | 13,272 | |||||
The amount of stock-based compensation expense that was capitalized during the periods presented above was immaterial. Stock-based compensation expense recognized in the Consolidated Statements of Operations is based on awards ultimately expected to vest. The authoritative guidance for stock-based compensation requires forfeitures to be estimated at the time of grant and revised, if necessary, in subsequent periods if actual forfeitures differ from those estimates. The Company attributes the value of stock-based compensation to expense on an accelerated method.
53
Valuation Assumptions
The Company uses the Black-Scholes option-pricing model as its method of valuation for stock-based awards. The Company’s determination of the fair value of stock-based payment awards on the date of grant using an option-pricing model is affected by the Company’s stock price, as well as assumptions regarding a number of subjective variables. These variables include, but are not limited to, the Company’s expected stock price volatility over the term of the awards, as well as the expected term of the awards.
Fiscal Year Ended | |||||||||||
March 29, 2015 | March 30, 2014 | March 31, 2013 | |||||||||
Stock option plans: | |||||||||||
Expected term (in years) | 4.00 | 4.60 | 4.64 | ||||||||
Risk-free interest rate | 1.25 | % | 0.95 | % | 0.73 | % | |||||
Volatility | 38.7 | % | 40.1 | % | 45.0 | % | |||||
Dividend yield | — | % | — | % | — | % | |||||
Weighted-average grant-date fair value | $ | 3.84 | $ | 2.99 | $ | 2.18 | |||||
ESPP: | |||||||||||
Expected term (in years) | 0.25 | 0.25 | 0.25 | ||||||||
Risk-free interest rate | 0.04 | % | 0.06 | % | 0.08 | % | |||||
Volatility | 40.5 | % | 35.0 | % | 35.0 | % | |||||
Dividend yield | — | % | — | % | — | % | |||||
Weighted-average grant-date fair value | $ | 3.53 | $ | 1.89 | $ | 1.42 | |||||
The following is a summary of the Company's stock option activity and related weighted average exercise prices for each category:
Fiscal 2015 | ||||||
(shares in thousands) | Shares | Price | ||||
Beginning stock options outstanding | 5,602 | $ | 7.21 | |||
Granted | 411 | 12.10 | ||||
Exercised (1) | (1,843 | ) | 6.96 | |||
Canceled | (490 | ) | 8.48 | |||
Ending stock options outstanding | 3,680 | $ | 7.71 | |||
Ending stock options exercisable | 2,369 | $ | 6.92 | |||
(1) | Upon exercise, the Company issues new shares of common stock. |
54
The following is a summary of information about stock options outstanding at March 29, 2015:
Options Outstanding | Options Exercisable | |||||||||
Range of Exercise Prices | Number Outstanding (in thousands) | Weighted-Average Remaining Contractual Life (in years) | Weighted-Average Exercise Price | Number Exercisable (in thousands) | Weighted-Average Exercise Price | |||||
4.95-5.33 | 393,066 | 2.79 | $5.22 | 310,388 | $5.20 | |||||
5.40-5.75 | 409,984 | 2.62 | 5.72 | 384,604 | 5.73 | |||||
5.77-5.77 | 619,416 | 4.10 | 5.77 | 372,730 | 5.77 | |||||
5.79-6.79 | 390,446 | 2.21 | 6.10 | 366,028 | 6.09 | |||||
6.80-7.24 | 89,263 | 3.16 | 6.97 | 73,309 | 6.97 | |||||
7.67-7.67 | 423,688 | 5.13 | 7.67 | 164,526 | 7.67 | |||||
7.81-7.92 | 18,687 | 2.99 | 7.85 | 17,382 | 7.84 | |||||
8.49-8.49 | 567,005 | 3.12 | 8.49 | 526,265 | 8.49 | |||||
9.39-11.79 | 403,000 | 5.87 | 11.69 | 117,583 | 11.66 | |||||
12.16-20.56 | 365,090 | 5.54 | 12.27 | 36,225 | 12.51 | |||||
3,679,645 | 3.87 | $7.71 | 2,369,040 | $6.92 | ||||||
As of March 29, 2015, the weighted-average remaining contractual life of stock options outstanding was 3.87 years and the aggregate intrinsic value was $44.4 million. The weighted-average remaining contractual life of stock options exercisable was 3.15 years and the aggregate intrinsic value was $30.5 million. Unrecognized compensation cost related to non-vested stock options, net of estimated forfeitures, was $1.2 million and will be recognized over a weighted-average period of 1.03 years.
As of March 29, 2015, stock options vested and expected to vest totaled approximately 3.5 million with a weighted-average exercise price of $7.57 and a weighted-average remaining contractual life of 3.76 years. The aggregate intrinsic value as of March 29, 2015 was approximately $42.2 million.
Restricted Stock Units
Restricted stock units granted by the Company under the 2004 Plan generally vest over at least a three year period from the grant date with one-third of restricted stock units vesting on each one-year anniversary. As of March 29, 2015, 3.5 million restricted stock unit awards were outstanding under the 2004 Plan.
The following table summarizes the Company’s restricted stock unit activity and related weighted-average exercise prices for each category:
Fiscal 2015 | ||||||
(shares in thousands) | Shares | Weighted- Average Grant Date Fair Value Per Share | ||||
Beginning RSUs outstanding | 2,924 | $ | 7.43 | |||
Granted | 2,001 | 13.20 | ||||
Released | (988 | ) | 7.43 | |||
Forfeited | (480 | ) | 8.80 | |||
Ending RSUs outstanding | 3,457 | $ | 10.58 | |||
As of March 29, 2015, restricted stock units expected to vest totaled approximately 2.8 million with a weighted-average remaining contract life of 1.22 years. The aggregate intrinsic value was approximately $56.3 million.
Performance-Based Stock Units
In fiscal 2013, the Compensation Committee (the Committee) of the Board of Directors of IDT approved the Company’s Executive Retention Plan (the Retention Plan), in which each of the President and Chief Executive Officer’s direct reports are eligible to participate. The Retention Plan provides for the grant of performance-based stock units under the 2004 Plan which vest and convert into between zero and one and a half shares of the Company's common stock based on the level of achievement of pre-established
55
performance goals during a specified performance period. The initial performance period under the Retention Plan is the Company’s fiscal year 2014 for which performance goals related to the Company’s annual non-GAAP operating margin and revenue growth relative to a peer group of companies, weighted 60% and 40%, respectively, were established by the Committee. Any shares of Company common stock earned by performance stock unit holders will vest and be issued in two equal installments, the first on the date the Committee determines the achievement of the performance goals and the second on the first anniversary of such determination. Management evaluates, on a quarterly basis, the likelihood of the Company meeting its performance metrics in determining stock-based compensation expense for the Retention Plan.
In addition, the Committee approved the Company's Key Talent Incentive Plan (Incentive Plan). The Incentive Plan provides for the grant of performance-based stock units under the 2004 Plan which vest and convert into one share of the Company's common stock based on the level of achievement of pre-established performance goals during a specified performance period. The initial performance period under the Incentive Plan is the Company's fourth quarter of fiscal 2013 through the fourth quarter of fiscal 2016 for which performance goals relate to cumulative revenue targets for a specific product group. Any shares of Company common stock earned by performance stock unit holders will vest and be issued quarterly based on the achievement of the performance goals. Management evaluates, on a quarterly basis, the likelihood of the Company meeting its performance metrics in determining stock-based compensation expense for the Incentive Plan.
The following table summarizes the Company’s performance stock unit activity and related weighted-average exercise prices for each category:
Fiscal 2015 | ||||||
(shares in thousands) | Shares | Weighted- Average Grant Date Fair Value Per Share | ||||
Beginning PSUs outstanding | 804 | $ | 7.79 | |||
Granted | 105 | 9.86 | ||||
Released | (238 | ) | 8.14 | |||
Forfeited | (154 | ) | 7.80 | |||
Ending PSUs outstanding | 517 | $ | 8.06 | |||
As of March 29, 2015, performance stock units expected to vest totaled approximately 0.4 million with a weighted-average remaining contract life of 0.69 years. The aggregate intrinsic value was approximately $8.4 million.
Market-Based Stock Units
In June 2014, under the 2004 Plan, the Company granted approximately 0.5 million shares of restricted stock units with a market-based condition to a group of executive-level employees. These equity awards vest and convert into shares of the Company’s common stock based on the achievement of the Company’s relative total shareholder return over the performance period of 2 years. The earned market-based stock units will vest in two equal installments, with the first installment of vesting to occur on June 15, 2016, and the second on June 15, 2017.
The fair value of each market-based stock unit award was estimated on the date of grant using a Monte Carlo simulation model that uses the assumptions noted in the table below. The Company uses historical data to estimate employee termination within the valuation model. The expected term of 1.8 years was derived from the output of the valuation model and represents the period of time that restricted stock units granted are expected to be outstanding.
The following weighted average assumptions were used to calculate the fair value of the market-based equity award using a Monte Carlo simulation model:
June 15, 2014 | |||
Estimated fair value | $ | 21.00 | |
Expected volatility | 34.6 | % | |
Expected term (in years) | 1.80 | ||
Risk-free interest rate | 0.38 | % | |
Dividend yield | — | % | |
56
As of March 29, 2015, the total market-based stock units outstanding was approximately 0.5 million.
As of March 29, 2015, market-based stock units vested and expected to vest totaled approximately 0.4 million with a weighted-average remaining contract life of 1.67 years. The aggregate intrinsic value was approximately 8.3 million.
As of March 29, 2015, the unrecognized compensation cost related to market-based stock units granted under the Company’s equity incentive plans was approximately 5.9 million, net of estimated forfeitures, and is expected to be recognized over a weighted-average period of 1.71 years.
2009 Employee Stock Purchase Plan (2009 ESPP)
On June 18, 2009, the Board approved implementation of the 2009 Employee Stock Purchase Plan (2009 ESPP) and authorized the reservation and issuance of up to 9.0 million shares of the Company’s common stock, subject to stockholder approval. On September 17, 2009, the Company’s stockholders approved the plan at the 2009 Annual Meeting of Stockholders. The 2009 ESPP is intended to be implemented in successive quarterly purchase periods commencing on the first day of each fiscal quarter of the Company. In order to maintain its qualified status under Section 423 of the Internal Revenue Code, the 2009 ESPP imposes certain restrictions, including the limitation that no employee is permitted to participate in the 2009 ESPP if the rights of such employee to purchase common stock of the Company under the 2009 ESPP and all similar purchase plans of the Company or its subsidiaries would accrue at a rate which exceeds $25,000 of the fair market value of such stock (determined at the time the right is granted) for each calendar year. At the 2012 annual meeting of stockholders on September 13, 2012, the Company's stockholders approved an additional 5.0 million. The number of shares of common stock reserved for issuance thereunder increased from 9.0 million shares to 14.0 million shares.
Activity under the Company’s ESPP is summarized in the following table:
(in thousands, except per share amounts) | Fiscal 2015 | Fiscal 2014 | Fiscal 2013 | ||||||||
Number of shares issued | 641 | 1,206 | 1,679 | ||||||||
Average issuance price | $ | 12.89 | $ | 7.23 | $ | 5.13 | |||||
Number of shares available at year-end | 4,378 | 5,019 | 1,226 | ||||||||
Note 9. Stockholders' Equity
Stock Repurchase Program. On October 22, 2013, the Company's Board of Directors approved a share repurchase program authorization for $150 million. In fiscal 2013, the Company made no repurchases under the program. In fiscal 2014, the Company repurchased 4.1 million shares for $44.0 million. In fiscal 2015, the Company repurchased 5.3 million shares for $79.2 million. In April 2015, the Company's Board of Directors approved a new share repurchase program authorization for $300 million.
As of March 29, 2015, approximately $26.7 million was available for future purchase under this share repurchase program. Share repurchases were recorded as treasury stock and resulted in a reduction of stockholders’ equity. The program is intended to reduce the number of outstanding shares of Common Stock to offset dilution from employee equity grants and increase stockholder value.
57
Note 10. Balance Sheet Detail
(in thousands) | March 29, 2015 | March 30, 2014 | |||||
Inventories, net | |||||||
Raw materials | $ | 4,709 | $ | 7,745 | |||
Work-in-process | 18,377 | 18,436 | |||||
Finished goods | 22,324 | 23,441 | |||||
Total inventories, net | $ | 45,410 | $ | 49,622 | |||
Property, plant and equipment, net | |||||||
Land | $ | 11,578 | $ | 11,724 | |||
Machinery and equipment | 292,180 | 289,393 | |||||
Building and leasehold improvements | 48,031 | 48,558 | |||||
Total property, plant and equipment, gross | 351,789 | 349,675 | |||||
Less: accumulated depreciation | (286,281 | ) | (279,848 | ) | |||
Total property, plant and equipment, net (1) | $ | 65,508 | $ | 69,827 | |||
Other current liabilities | |||||||
Accrued restructuring costs (2) | 10,512 | 638 | |||||
Other (3) | 7,070 | 10,887 | |||||
Total other current liabilities | $ | 17,582 | $ | 11,525 | |||
Other long-term obligations | |||||||
Deferred compensation related liabilities | $ | 13,143 | $ | 13,786 | |||
Other | 4,462 | 4,897 | |||||
Total other long-term liabilities | $ | 17,605 | $ | 18,683 | |||
(1) As of March 30, 2014, total property, plant and equipment, net includes the HSC business assets held for sale of $2.9 million. As of March 29, 2015, the net carrying value of the HSC business long-lived assets is zero. See Note 4 for additional information.
(2) Includes accrued severance costs related to the HSC business of $10.2 million as of March 29, 2015.
(3) Other current liabilities consist primarily of acquisition related accrued contingent liabilities, accrued royalties and outside commissions, short-term portion of supplier obligations and other accrued unbilled expenses.
Note 11. Deferred Income on Shipments to Distributors
Included in the caption “Deferred income on shipments to distributors” on the Consolidated Balance Sheets are amounts related to shipments to certain distributors for which revenue is not recognized until the Company's product has been sold by the distributor to an end customer. The components of deferred income on shipments to distributors as of March 29, 2015 and March 30, 2014 were as follows:
(in thousands) | March 29, 2015 | March 30, 2014 | |||||
Gross deferred revenue | $ | 19,299 | $ | 17,261 | |||
Gross deferred costs | (3,605 | ) | (3,255 | ) | |||
Deferred income on shipments to distributors | $ | 15,694 | $ | 14,006 | |||
The gross deferred revenue represents the gross value of shipments to distributors at the list price billed to the distributor less any price protection credits provided to them in connection with reductions in list price while the products remain in their inventory. The amount ultimately recognized as revenue will be lower than this amount as a result of ship from stock pricing credits which are issued in connection with the sell through of the Company's products to end customers. Historically, this amount represents on average approximately 37.7% of the list price billed to the customer. The gross deferred costs represent the standard costs (which approximate actual costs) of products the Company sells to the distributors. Although the Company monitors the levels and quality
58
of inventory in the distribution channel, the Company's experience is that products returned from these distributors may be sold to a different distributor or in a different region of the world. As such, inventory write-downs for products in the distribution channel have not been significant.
Note 12. Accumulated Other Comprehensive Income (Loss)
Changes in the balance of accumulated other comprehensive income (loss), net of taxes, by component consisted of the following:
(in thousands) | Cumulative translation adjustments | Unrealized gain on available-for-sale investments | Pension adjustments | Total | |||||||||||
Balance, March 31, 2013 | $ | 1,563 | $ | — | $ | (77 | ) | $ | 1,486 | ||||||
Other comprehensive income (loss) before reclassifications | (66 | ) | 291 | 1 | 226 | ||||||||||
Amounts reclassified out of AOCI | — | (97 | ) | (6 | ) | (103 | ) | ||||||||
Net current-period other comprehensive income (loss) | (66 | ) | 194 | (5 | ) | 123 | |||||||||
Balance, March 30, 2014 | 1,497 | 194 | (82 | ) | $ | 1,609 | |||||||||
Other comprehensive income (loss) before reclassifications | (5,218 | ) | 793 | 814 | (3,611 | ) | |||||||||
Amounts reclassified out of AOCI | — | (127 | ) | (52 | ) | (179 | ) | ||||||||
Net current-period other comprehensive income (loss) | (5,218 | ) | 666 | 762 | (3,790 | ) | |||||||||
Balance as of March 29, 2015 | $ | (3,721 | ) | $ | 860 | $ | 680 | $ | (2,181 | ) | |||||
Comprehensive income (loss) components consisted of:
(in thousands) | March 29, 2015 | March 30, 2014 | March 31, 2013 | Location | ||||||||||
Unrealized holding losses on available-for-sale investments | $ | (127 | ) | $ | (97 | ) | $ | (8 | ) | interest and other, net | ||||
Amortization of pension benefits prior service credits | (52 | ) | (6 | ) | (77 | ) | operating expense | |||||||
Total amounts reclassified out of accumulated other comprehensive income (loss) | $ | (179 | ) | $ | (103 | ) | $ | (85 | ) | |||||
Note 13. Goodwill and Intangible Assets, Net
Goodwill activity for fiscal 2015 and 2014 is summarized as follows:
Reportable Segment | |||||||||||
(in thousands) | Communications | Computing and Consumer | Total | ||||||||
Balance as of March 31, 2013 | $ | 124,205 | $ | 20,719 | $ | 144,924 | |||||
Impairment losses | (2,161 | ) | — | (2,161 | ) | ||||||
Dispositions | — | (7,323 | ) | (7,323 | ) | ||||||
Additions | 204 | — | 204 | ||||||||
Balance as of March 30, 2014 | $ | 122,248 | $ | 13,396 | $ | 135,644 | |||||
Balance as of March 29, 2015 | $ | 122,248 | $ | 13,396 | $ | 135,644 | |||||
In the fiscal year 2014, the Company recorded a $2.2 million goodwill impairment loss associated with its HSC business which was classified as a discontinued operation. The impairment loss was included in loss from discontinued operations.
In fiscal 2014, the Company allocated $7.3 million in goodwill to the sale of certain assets of IDT's PCI Express enterprise flash controller business which was completed on July 12, 2013.
Goodwill balances as of March 29, 2015 and March 30, 2014 are net of $922.5 million, in accumulated impairment losses.
59
Intangible asset balances as of March 29, 2015 and March 30, 2014 are summarized as follows:
March 29, 2015 | |||||||||||
(in thousands) | Gross Assets | Accumulated Amortization | Net Assets | ||||||||
Purchased intangible assets: | |||||||||||
Existing technology | $ | 211,170 | $ | (206,491 | ) | $ | 4,679 | ||||
Trademarks | 4,411 | (3,850 | ) | 561 | |||||||
Customer relationships | 131,045 | (130,750 | ) | 295 | |||||||
Total purchased intangible assets | $ | 346,626 | $ | (341,091 | ) | $ | 5,535 | ||||
March 30, 2014 | |||||||||||
(in thousands) | Gross Assets | Accumulated Amortization | Net Assets (1) | ||||||||
Purchased intangible assets: | |||||||||||
Existing technology | $ | 217,923 | $ | (203,888 | ) | $ | 14,035 | ||||
Trademarks | 4,411 | (2,934 | ) | 1,477 | |||||||
Customer relationships | 131,093 | (128,681 | ) | 2,412 | |||||||
Non-compete agreements | 2,275 | (1,458 | ) | 817 | |||||||
Total purchased intangible assets | $ | 355,702 | $ | (336,961 | ) | $ | 18,741 | ||||
(1) Includes $6.6 million in HSC assets held for sale, which were fully impaired in fiscal 2015.
Amortization expense for identified intangibles is summarized below:
Fiscal Year Ended | |||||||||||
(in thousands) | March 29, 2015 | March 30, 2014 | March 31, 2013 | ||||||||
Existing technology | $ | 4,534 | $ | 19,730 | $ | 14,131 | |||||
Trademarks | 916 | 3,405 | 874 | ||||||||
Customer relationships | 1,123 | 916 | 3,225 | ||||||||
Backlog | — | 91 | 1,509 | ||||||||
Non-compete agreements | — | 651 | 807 | ||||||||
Total | $ | 6,573 | $ | 24,793 | $ | 20,546 | |||||
The intangible assets are being amortized over estimated useful lives of three to seven years.
During fiscal 2015, the Company recorded an impairment charge relating to the HSC assets held for sale of $5.6 million, which consisted of existing technology of $4.6 million, customer relationships of $0.9 million and non-compete agreements of $0.1 million. Refer to Note 4 for additional information.
60
During fiscal 2014, the Company initiated actions to discontinue production and sale of products using technology attained through the acquisitions of Mobius Microsystems in fiscal 2010 and IKOR in fiscal 2011. In connection with the decision to discontinue these products, the Company revised the estimated remaining useful life of the related acquired intangible assets, resulting in an additional $8.7 million in accelerated amortization which was charged to cost of revenues in fiscal 2014. In addition, the Company recorded a $2.4 million impairment charge to research and development expense associated with the decision to discontinue further development required to complete the Mobius Microsystems acquired in-process research and development.
Based on the intangible assets recorded at March 29, 2015, assuming no subsequent additions to or impairment of the underlying assets, the remaining estimated amortization expense is expected to be as follows (in thousands):
Fiscal Year | Amount | ||
2016 | $ | 3,084 | |
2017 | 2,185 | ||
2018 | 256 | ||
2019 | 10 | ||
Total | $ | 5,535 | |
Note 14. Restructuring
The following table shows the provision of the restructuring charges and the liability remaining as of March 29, 2015:
Others | |||||||||||||||
(in thousands) | HSC Business | Cost of Revenues | Operating Expenses | Total | |||||||||||
Balance as of April 1, 2012 | $ | — | $ | 1,606 | $ | 3,592 | $ | 5,198 | |||||||
Provision | — | 557 | 5,277 | 5,834 | |||||||||||
Cash payments | — | (2,137 | ) | (7,233 | ) | (9,370 | ) | ||||||||
Balance as of March 31, 2013 | — | 26 | 1,636 | 1,662 | |||||||||||
Provision | — | — | 5,538 | 5,538 | |||||||||||
Cash payments | — | (26 | ) | (6,536 | ) | (6,562 | ) | ||||||||
Balance as of March 30, 2014 | — | — | 638 | 638 | |||||||||||
Provision | 18,305 | — | 1,078 | 19,383 | |||||||||||
Cash payments | (6,073 | ) | — | (1,421 | ) | (7,494 | ) | ||||||||
Foreign exchange impact | (2,015 | ) | — | — | (2,015 | ) | |||||||||
Balance as of March 29, 2015 | $ | 10,217 | $ | — | $ | 295 | $ | 10,512 | |||||||
As part of an effort to streamline operations with changing market conditions and to create a more efficient organization, the Company has undertaken restructuring actions to reduce its workforce and consolidate facilities. The Company’s restructuring expenses were primarily of: (i) severance and termination benefit costs related to the reduction of its workforce; and (ii) lease termination costs and costs associated with permanently vacating certain facilities.
HSC Business
In fiscal 2015, the Company prepared a workforce-reduction plan (the Plan) with respect to employees of its HSC business in France and the Netherlands. The Plan sets forth the general parameters, terms and benefits for employee dismissals. The Plan was approved by the French Works Council and Labor Administrator and the related Plan details were communicated to the affected employees in France and the Netherlands. No works council consultation was required in the Netherlands. The Company has not historically offered similar termination benefits as defined in the Plan for these locations. The Plan identified the number of employees to be terminated, their job classification or function, their location and the date that the Plan was expected to be completed. The Plan also established the terms of the benefit arrangement in sufficient detail to enable the employees to determine the type and amount of benefits that they would receive if terminated. In addition, the actions required to complete the Plan indicated that it was unlikely that substantial changes to the Plan would be made after communication to the employees. Accordingly, the Company accrued restructuring charges in accordance with ASC 420, Exit or Disposal Cost Obligations. The restructuring
61
charges recorded to discontinued operations in the Consolidated Statement of Operations were approximately $18.3 million for the fiscal year ended March 29, 2015, for a total of 53 employees in France and the Netherlands combined.
The Company expects to make payments related to these termination benefits and complete the restructuring action by the third quarter of fiscal 2016.
Other
During fiscal 2015, the Company recorded other restructuring charges of $1.1 million and reduced our headcount by 28 employees in multiple reduction in workforce actions. During fiscal 2015, the Company paid $0.8 million related to these actions. As of March 29, 2015, the total accrued balance for employee severance costs related to these restructuring actions was $0.3 million. The Company expects to complete these restructuring actions by the first quarter of fiscal 2016.
During fiscal 2014, the Company recorded restructuring charges of $5.5 million and reduced headcount by 117 employees in multiple reduction in workforce actions. During fiscal 2015 and 2014, the Company paid $0.6 million and $4.9 million related to these actions. As of March 29, 2015, the total accrued balance for employee severance costs related to these restructuring actions was zero.
During fiscal 2013, the Company recorded restructuring charges of $4.3 million for multiple reduction in workforce actions. The Company reduced total headcount by approximately 132 employees with reductions affecting all functional areas and various locations. During fiscal 2013, the Company paid $3.2 million in severance costs associated with these actions. During fiscal 2014, the Company paid $1.1 million in severance costs and completed these actions.
During fiscal 2013, in connection with the Company's divestiture of its video processing product lines in fiscal 2012, the Company recorded an additional $1.1 million in restructuring expenses for employee retention costs. These costs were recorded within discontinued operations. The Company paid the accrued amount in fiscal 2013 and completed this restructuring action.
During fiscal 2013, the Company paid $1.0 million in restructuring expenses for employee retention costs and completed the restructuring action to exit wafer production operations at its Oregon fabrication facility.
Note 15. Commitments and Contingencies
Guarantees
As of March 29, 2015, the Company’s financial guarantees consisted of guarantees and standby letters of credit, which are primarily related to the Company’s electrical utilities in Malaysia, utilization of non-country nationals in Malaysia, consumption tax in Japan, office rental in Italy and a workers’ compensation plan in the United States. The maximum amount of potential future payments under these arrangements is approximately $1.7 million.
Commitments
Although the Company owns its corporate headquarters in San Jose, California, the Company leases various administrative facilities under operating leases which expire at various dates through fiscal 2021.
As of March 29, 2015, aggregate future minimum commitments for the next five fiscal years and thereafter under all operating leases, excluding leases in which amounts have been accrued for impairment charges, were as follows (in thousands):
Fiscal Year | Amount | ||
2016 | $ | 3,059 | |
2017 | 2,564 | ||
2018 | 1,837 | ||
2019 | 1,525 | ||
2020 and thereafter | 1,286 | ||
Total | $ | 10,271 | |
Rent expense for the fiscal years ended March 29, 2015, March 30, 2014 and March 31, 2013 totaled approximately $4.2 million, $4.6 million and $4.7 million, respectively. Other supplier obligations including payments due under various software design tool and technology license agreements totaled $4.6 million and $4.2 million as of March 29, 2015 and March 30, 2014, respectively.
Indemnification
During the normal course of business, the Company makes certain indemnifications and commitments under which it may be required to make payments in relation to certain transactions. In addition to indemnifications related to non-infringement of patents and intellectual property, other indemnifications include indemnification of the Company’s directors and officers in connection
62
with legal proceedings, indemnification of various lessors in connection with facility leases for certain claims arising from such facility or lease, and indemnification of other parties to certain acquisition agreements. The duration of these indemnifications and commitments varies, and in certain cases, is indefinite. The Company believes that substantially all of its indemnities and commitments provide for limitations on the maximum potential future payments the Company could be obligated to make. However, the Company is unable to estimate the maximum amount of liability related to its indemnities and commitments because such liabilities are contingent upon the occurrence of events which are not reasonably determinable. The Company believes that any liability for these indemnities and commitments would not be material to its accompanying consolidated financial statements.
The Company maintains an accrual for obligations it incurs under its standard product warranty program and customer, part, or process specific matters. The Company’s standard warranty period is one year; however, in certain instances the warranty period may be extended to as long as two years. Management estimates the fair value of the Company’s warranty liability based on actual past warranty claims experience, its policies regarding customer warranty returns and other estimates about the timing and disposition of product returned under the standard program. Customer, part, or process specific accruals are estimated using a specific identification method. Historical profit and loss impact related to warranty returns activity has been minimal. The total warranty accrual was $0.1 million and $0.3 million as of March 29, 2015 and March 30, 2014, respectively.
Litigation
In January 2012, Maxim I Properties, a general partnership that had purchased a certain parcel of real property (the Property) in 2003, filed a complaint in the Northern District of California naming approximately 30 defendants, including the Company ("Defendants"), alleging various environmental violations of the federal Comprehensive Environmental Response, Compensation, and Liability Act (CERCLA) and Resource Conservation and Recovery Act (RCRA), the California Hazardous Substance Account Act (HSAA), and other common law claims (the Complaint). The Complaint alleges that Defendants including the Company “…generated, transported, and/or arranged for the transport and/or disposal of hazardous waste to the Property.” The Complaint further alleges that Defendants are liable for the costs of investigation and remediation of the Property due to the release of hazardous substances, and that Defendants violated their duty to prevent the release of such hazardous substances. On August 15, 2012, the plaintiff voluntarily dismissed its Complaint against the Company without prejudice. However, Moyer Products, Inc., another defendant, counter-claimed against the plaintiff Maxim and cross-claimed against Defendants, including the Company, and thus the Company remains a cross-defendant in this action. In September 2012, the California Department of Toxic Substances Control (DTSC) notified the Company that it identified the Company, along with more than 50 other entities, as a respondent to DTSC's Enforcement Order, as “a generator of hazardous waste” that was sent to the Property. In April 2013, the Company, along with the other “respondent” parties, entered into a Corrective Action Consent Agreement (CACA) to conduct the Property investigation and corrective action selection. The CACA supersedes the Enforcement Order. In February 2013, the court stayed the Maxim/Moyer litigation pending the Property investigation under the CACA and DTSC's corrective action selection. As of March 29, 2015, the Property investigation continues, and the DTSC continues to evaluate corrective action. The Company will continue to vigorously defend itself against the allegations in the Complaint and evaluate settlement options with Moyer upon completion of the Property investigation and corrective action selection. Because the case continues in the investigation stage and no specific monetary demands have been made, it is not possible for the Company to estimate the potential loss or range of potential losses for these actions.
The Company is also party to various other legal proceedings and claims arising in the normal course of business. As of March 29, 2015, while the Company has accrued for specific amounts based on the probability of settlement in some of these matters, those amounts, both individually and in total, are not material to any aspect of business operations and to the consolidated financial statements. Further, with regards to the other matters, potential liability and probable losses or ranges of possible losses cannot be reasonably estimated at this time. Generally, litigation is subject to inherent uncertainties, and no assurance can be given that the Company will prevail in any particular lawsuit. Accordingly, pending lawsuits, as well as potential future litigation with other companies, could result in substantial costs and diversion of resources and could have a material adverse effect on the Company's financial condition, results of operations or cash flows.
Note 16. Employee Benefit Plans
401(k) Plan
The Company sponsors a 401(k) retirement matching plan for qualified domestic employees. The Company recorded expenses of approximately $2.1 million, $2.1 million and $2.6 million in matching contributions under the plan in fiscal 2015, 2014, and 2013, respectively.
Deferred Compensation Plans
Effective November 1, 2000, the Company established an unfunded deferred compensation plan to provide benefits to executive officers and other key employees. Under the plan, participants can defer any portion of their salary and bonus compensation into the plan and may choose from a portfolio of funds from which earnings are measured. Participant balances are always 100%
63
vested. As of March 29, 2015 and March 30, 2014, obligations under the plan totaled approximately $13.1 million and $13.8 million, respectively. Additionally, the Company has set aside assets in a separate trust that is invested in corporate owned life insurance intended to substantially fund the liability under the plan. As of March 29, 2015 and March 30, 2014, the deferred compensation plan assets were approximately $16.5 million and $16.1 million, respectively. The Company incurred costs for this plan for insurance, administration and other support of $0.1 million, $0.3 million and $0.3 million in fiscal 2015, 2014 and 2013, respectively.
During the first quarter of fiscal 2013, the Company assumed a deferred compensation plan associated with the acquisition of Fox. Under this plan, participants in retirement are entitled to receive a fixed amount from the Company on a monthly basis. The Company has purchased life insurance policies with the intention of funding the liability under this plan. As of March 29, 2015 and March 30, 2014, the deferred compensation plan assets were approximately $0.8 million and $0.7 million, respectively. As of March 29, 2015 and March 30, 2014 the liabilities under this plan were approximately $1.7 million and $1.6 million, respectively.
International Employee Benefit Plans
The Company sponsors defined-benefit pension plans, defined-contribution plans, multi-employer plans and other post-employment benefit plans covering employees in certain of the Company's international locations. As of March 29, 2015 and March 30, 2014, the net liability for all of these international benefit plans totaled $1.0 million and $1.4 million, respectively.
Pension plan benefits are based primarily on participants’ compensation and years of service credited as specified under the terms of each country’s plan. The funding policy is consistent with the local requirements of each country. The Company does not have defined-benefit pension plans for its United States-based employees. The projected obligations of international employee defined-benefit pension plans and related offsetting plan assets were determined based on actuarial calculations. As of March 29, 2015, the net accumulated liability for these defined-benefit plans totaled $0.6 million, with unrecognized actuarial losses of $0.3 million and unrecognized prior service gains of $0.1 million. In fiscal 2015, as a result of a workforce-reduction plan under the HSC business in France, the related pension liability decreased by $0.6 million and long-term pension asset increased by $0.4 million. The net period expense was insignificant during fiscal 2015, 2014 and 2013. Distributions made from plans during fiscal 2015, 2014, and 2013 were not material. The Company includes accrued net defined-benefit plan obligations in other long-term liabilities on the Company's Consolidated Balance Sheets.
Note 17. Income Taxes
The components of income (loss) before income taxes and the income tax expense (benefit) were as follows:
Fiscal Year Ended | |||||||||||
(in thousands) | March 29, 2015 | March 30, 2014 | March 31, 2013 | ||||||||
Income (loss) before income taxes from continuing operations: | |||||||||||
United States | $ | 6,113 | $ | 8,634 | $ | (18,083 | ) | ||||
Foreign | 109,825 | 103,660 | 18,674 | ||||||||
Income before income taxes | $ | 115,938 | $ | 112,294 | $ | 591 | |||||
Income tax expense (benefit) from continuing operations: | |||||||||||
Current: | |||||||||||
United States | $ | — | $ | (118 | ) | $ | (49 | ) | |||
State | 47 | 35 | 128 | ||||||||
Foreign | 1,312 | 867 | 1,368 | ||||||||
1,359 | 784 | 1,447 | |||||||||
Deferred: | |||||||||||
United States | 79 | 240 | (3,222 | ) | |||||||
State | 2 | 14 | (345 | ) | |||||||
Foreign | (83 | ) | (57 | ) | — | ||||||
(2 | ) | 197 | (3,567 | ) | |||||||
Income tax expense (benefit) from continuing operations | $ | 1,357 | $ | 981 | $ | (2,120 | ) | ||||
For fiscal years 2015, 2014 and 2013, there was no U.S. income tax benefit related to the exercise of certain employee stock options that decreased income taxes payable and was credited to additional paid-in capital.
64
Deferred income taxes reflect the net tax effects of temporary differences between the carrying amounts of assets and liabilities for financial reporting purposes and the amounts used for income tax purposes. Significant components of deferred tax assets and liabilities were as follows:
(in thousands) | March 29, 2015 | March 30, 2014 | |||||
Deferred tax assets: | |||||||
Deferred income on shipments to distributors | $ | 3,057 | $ | 2,666 | |||
Non-deductible accruals and reserves | 9,148 | 10,233 | |||||
Inventory related and other expenses | 189 | 1,761 | |||||
Net operating losses and credit carryforwards | 122,178 | 114,858 | |||||
Depreciation and amortization | 12,274 | 13,725 | |||||
Stock options | 1,849 | 1,713 | |||||
Other | 1,737 | 315 | |||||
Total deferred tax assets | 150,432 | 145,271 | |||||
Deferred tax liabilities: | |||||||
Purchased intangibles | (564 | ) | (558 | ) | |||
Other | (2,699 | ) | (3,087 | ) | |||
Total deferred tax liabilities | (3,263 | ) | (3,645 | ) | |||
Valuation allowance | (148,954 | ) | (143,704 | ) | |||
Net deferred tax liabilities | $ | (1,785 | ) | $ | (2,078 | ) | |
The Company maintains a valuation allowance against its deferred tax assets because management is not able to conclude that it is more likely than not that these deferred tax assets will be realized. The Company reached this decision based on judgment, which included consideration of various tax planning strategies, forecasts of future taxable income, and recent operating results. Given the continued improvement in the Company’s operations combined with certain tax strategies, it is reasonably possible that within the next 12 months, positive evidence will be sufficient to release a material amount of the Company’s valuation allowance. Release of the valuation allowance would result in the recognition of certain deferred tax assets and a decrease to income tax expense for the period the release is recorded. The exact timing and amount of the valuation allowance release are subject to change on the basis of the level of profitability that we are able to actually achieve. The valuation allowance for deferred tax assets increased by $5.3 million and $9.1 million in fiscal 2015 and 2014, respectively.
The net deferred tax liability of $1.8 million and $2.1 million as of March 29, 2015 and March 30, 2014, respectively, relates primarily to unremitted Singapore investment earnings sourced outside Singapore.
As of March 29, 2015, the Company had federal and state net operating loss (NOL) carryforwards of approximately $82.3 million and $102.6 million, respectively, which include excess tax benefits related to stock option exercises. The federal NOL carryforwards will expire in various years from fiscal 2020 through 2035, if not utilized. The state NOL carryforwards will expire in various years from fiscal 2016 through 2035, if not utilized. The utilization of NOLs created by acquired companies is subject to annual limitations under Section 382 of the Internal Revenue Code. However, the Company does not expect that such annual limitation will impair the realization of these NOLs.
As of March 29, 2015, the Company had approximately $56.7 million of federal research and development tax credit carryforwards, and $16.8 million of foreign tax credit carryforwards. The federal research and development tax credit carryforwards will expire in fiscal years 2019 through 2035, if not utilized, and the foreign tax credit carryforwards will expire in fiscal years 2016 to 2025, if not utilized. The Company also had, as of March 29, 2015, approximately $80.8 million of state income tax credit carryforwards, of which $5.7 million will expire in fiscal years 2019 through 2035, if not utilized. The Company also had, as of March 29, 2015, approximately $9.0 million of tax credit carryforwards in foreign jurisdictions, which will expire in fiscal years 2018 through 2025.
The federal, state, and foreign NOL and tax credit carryforwards in the income tax returns filed include unrecognized tax benefits. The deferred tax assets recognized for those NOLs and tax credits are presented net of these unrecognized tax benefits.
The Company has approximately $30.5 million, tax effected, of net operating loss and tax credit carryovers related to excess stock compensation benefits, which are not recorded as deferred tax assets. These excess stock compensation benefits will be credited to additional paid-in capital when recognized.
65
Reconciliation between the statutory U.S. income tax rate of 35% and the effective rate is as follows:
Fiscal Year Ended | |||||||||||
(in thousands) | March 29, 2015 | March 30, 2014 | March 31, 2013 | ||||||||
Provision (benefit) from continuing operations at 35% U.S. statutory rate | $ | 40,579 | $ | 39,303 | $ | 207 | |||||
State tax, net of federal benefit | 160 | 32 | (123 | ) | |||||||
Effect of foreign operations | (35,740 | ) | (33,217 | ) | (4,890 | ) | |||||
Repatriation of foreign earnings | — | 5,623 | 1,505 | ||||||||
Net operating losses and tax credits (benefited) not benefited | (1,067 | ) | (10,985 | ) | (3,733 | ) | |||||
Stock-based compensation | (2,740 | ) | (689 | ) | 2,640 | ||||||
Other | 165 | 914 | 2,274 | ||||||||
Income tax expense (benefit) from continuing operations | $ | 1,357 | $ | 981 | $ | (2,120 | ) | ||||
As a result of its international manufacturing operations, a significant portion of the Company's worldwide profits are in jurisdictions outside the United States, primarily Malaysia, which has granted the Company significant reductions in tax rates. These lower tax rates allow us to record a relatively low tax expense on a worldwide basis. The Company was granted a tax incentive in Malaysia during fiscal 2009. The tax incentive was contingent upon the Company continuing to meet specified investment criteria in fixed assets, and to operate as an APAC regional headquarters center. In the first quarter of fiscal 2012, the Company entered into an agreement with the Malaysia Industrial Development Board (MIDA), who agreed to cancel the previously granted tax incentive and entered into a new tax incentive. The updated tax incentive provides for a full tax exemption on statutory income for a period of 10 years commencing April 4, 2011. The Company is required to meet several conditions as to financial targets, investment, headcount and activities in Malaysia to retain this status. The impact of these tax incentives decreased foreign taxes by $9.7 million, $2.0 million and $4.1 million for fiscal 2015, 2014 and 2013, respectively. The benefit of the tax incentives on net income per share (diluted) was approximately $0.06, $0.01, and $0.03 for fiscal 2015, 2014 and 2013, respectively.
The Company intends to reinvest certain of its foreign earnings indefinitely. Accordingly, no U.S. income taxes have been provided for approximately $820.4 million of undistributed earnings of foreign subsidiaries. It is not practicable for the Company to determine the tax impact of remitting these earnings.
The Tax Increase Prevention Act of 2014 (the “Act”) was signed into law on December 19, 2014. The Act contains a number of provisions including, most notably, an extension of the US federal research tax credit through December 31, 2014. The Act did not have a material impact on the Company's effective tax rate for fiscal 2015 due to the effect of the valuation allowance on the Company's deferred tax assets.
The following tables summarize the activities of gross unrecognized tax benefits:
Fiscal Year Ended | |||||||||||
(in thousands) | March 29, 2015 | March 30, 2014 | March 31, 2013 | ||||||||
Beginning balance | $ | 32,237 | $ | 31,066 | $ | 29,718 | |||||
Increases related to prior year tax positions | 549 | 90 | 532 | ||||||||
Decreases related to prior year tax positions | (296 | ) | (301 | ) | (296 | ) | |||||
Increases related to current year tax positions | 803 | 1,498 | 1,427 | ||||||||
Decreases related to the lapsing of statute of limitations | (103 | ) | (116 | ) | (315 | ) | |||||
Ending balance | $ | 33,190 | $ | 32,237 | $ | 31,066 | |||||
The amount of unrecognized tax benefits that would favorably impact the effective tax rate were approximately $0.3 million and $0.2 million as of March 29, 2015 and March 30, 2014, respectively. As of March 29, 2015, approximately $32.9 million of unrecognized tax benefits would be offset by a change in valuation allowance. The Company recognizes potential interest and penalties related to the income tax on the unrecognized tax benefits as a component of income tax expense and accrued approximately $0.1 million and zero for these items in fiscal 2015 and 2014, respectively.
As of March 29, 2015, the Company was under examination in the U.S. federal jurisdiction and in Singapore. The Company's fiscal years 2010, 2011 and 2012 are under audit by the Internal Revenue Service (IRS). The Company's fiscal years 2009 through 2012 are under audit by the Inland Revenue Authority of Singapore. Although the final outcome is uncertain, based on currently
66
available information, the Company believes that the ultimate outcome will not have a material adverse effect on its financial position, cash flows or results of operations.
The Company believes that within the next 12 months, it is reasonably possible that a decrease of up to $1.9 million in unrecognized tax benefits may occur due to settlements with tax authorities or statute lapses.
The Company's open years in the U.S. federal jurisdiction are fiscal 2010 and later years. In addition, the Company is effectively subject to federal tax examination adjustments for tax years ended on or after fiscal year 1999, in that the Company has tax attribute carryforwards from these years that could be subject to adjustments, if and when utilized. The Company's open years in various state and foreign jurisdictions are fiscal years 2008 and later.
Note 18. Segment Information
The Chief Operating Decision Maker is the Company’s President and Chief Executive Officer.
The Company's reportable segments include the following:
• | Communications segment: includes clock and timing solutions, flow-control management devices including Serial RapidIO® switching solutions, multi-port products, telecommunications products, high-speed static random access memory, first in and first out, digital logic, radio frequency, and MEMS Oscillator solutions. |
• | Computing and Consumer segment: includes clock generation and distribution products, high-performance server memory interfaces, PCI Express switching solutions, power management solutions, signal integrity products, and PC audio (divested in the third quarter of fiscal 2014). |
The tables below provide information about these segments:
Revenues by segment | Fiscal Year Ended | ||||||||||
(in thousands) | March 29, 2015 | March 30, 2014 | March 31, 2013 | ||||||||
Communications | $ | 313,630 | $ | 292,435 | $ | 258,184 | |||||
Computing and Consumer | 259,275 | 192,344 | 226,268 | ||||||||
Total revenues | $ | 572,905 | $ | 484,779 | $ | 484,452 | |||||
The Company utilizes global and regional distributors around the world, that buy product directly from the Company on behalf of their customers. Sales through a distributor, Uniquest, represented approximately 16% and 10%, of the Company's revenues in fiscal 2015 and 2013, respectively. Sales through a distributor, Avnet and its affiliates, represented approximately 11%, 12% and 10% of the Company’s revenues in fiscal 2015, 2014 and 2013, respectively. Sales through a distributor, Maxtek and its affiliates, represented approximately 13% of the Company’s revenues in fiscal 2013. Each of these distributors serves customers within both of the Company's reportable segments.
At March 29, 2015, two distributors represented approximately 11% and 10%, respectively of the Company's account receivable. At March 30, 2014, two distributors represented approximately 15% and 14%, respectively, of the Company's account receivable.
67
Income (Loss) by segment from continuing operations | Fiscal Year Ended | ||||||||||
(in thousands) | March 29, 2015 | March 30, 2014 | March 31, 2013 | ||||||||
Communications | $ | 116,018 | $ | 103,457 | $ | 78,995 | |||||
Computing and Consumer | 29,301 | (22,658 | ) | (30,972 | ) | ||||||
Unallocated expenses: | |||||||||||
Amortization of intangible assets | (6,573 | ) | (21,964 | ) | (16,339 | ) | |||||
Inventory fair market value adjustment | — | — | (358 | ) | |||||||
Impairment of acquired in-process R&D | — | (2,433 | ) | — | |||||||
Gain on divestitures | — | 78,632 | 7,986 | ||||||||
Asset impairment and other | (2,968 | ) | (4,113 | ) | (6,096 | ) | |||||
Stock-based compensation | (22,453 | ) | (12,677 | ) | (13,054 | ) | |||||
Severance, retention and facility closure costs | (1,250 | ) | (6,590 | ) | (5,584 | ) | |||||
Acquisition-related income (costs) and other | 125 | (802 | ) | (11,238 | ) | ||||||
Consulting expenses related to stockholder activities | — | — | (1,614 | ) | |||||||
Deferred compensation plan expense (benefit) | (50 | ) | 51 | (194 | ) | ||||||
Life insurance proceeds received | — | — | 2,313 | ||||||||
Other-than-temporary loss on investments | — | — | (1,708 | ) | |||||||
Interest income and other, net | 3,788 | 1,391 | (1,546 | ) | |||||||
Income from continuing operations, before income taxes | $ | 115,938 | $ | 112,294 | $ | 591 | |||||
The Company does not allocate goodwill and intangible assets impairment charge, IPR&D, severance and retention costs, acquisition-related costs, stock-based compensation, interest income and other, and interest expense to its segments. In addition, the Company does not allocate assets to its segments. The Company excludes these items consistent with the manner in which it internally evaluates its results of operations.
Revenues from unaffiliated customers by geographic area, based on the customers' shipment locations, were as follows:
Fiscal Year Ended | |||||||||||
(in thousands) | March 29, 2015 | March 30, 2014 | March 31, 2013 | ||||||||
APAC | $ | 402,694 | $ | 309,121 | $ | 308,409 | |||||
Americas (1) | 68,373 | 71,305 | 76,876 | ||||||||
Japan | 39,519 | 40,829 | 40,281 | ||||||||
Europe | 62,319 | 63,524 | 58,886 | ||||||||
Total revenues | $ | 572,905 | $ | 484,779 | $ | 484,452 | |||||
(1) | Revenues from the customers in the U.S. were $61.7 million, $63.1 million and $69.6 million in fiscal 2015, 2014 and 2013, respectively. |
The Company’s significant operations outside of the United States include test facility in Malaysia, design centers in the U.S., Canada and China, and sales subsidiaries in Japan, APAC and Europe. The Company's net property, plant and equipment are summarized below by geographic area:
(in thousands) | March 29, 2015 | March 30, 2014 | |||||
United States | $ | 38,879 | $ | 40,561 | |||
Canada | 3,997 | 4,660 | |||||
Malaysia | 21,244 | 20,972 | |||||
All other countries | 1,388 | 3,634 | |||||
Total property, plant and equipment, net | $ | 65,508 | $ | 69,827 | |||
68
Note 19. Derivative Financial Instruments
As a result of its international operations, sales and purchase transactions, the Company is subject to risks associated with fluctuating currency exchange rates. The Company may use derivative financial instruments to hedge these risks when instruments are available and cost effective, in an attempt to minimize the impact of currency exchange rate movements on its operating results and on the cost of capital equipment purchases.
As of March 29, 2015 and March 30, 2014, the Company did not have any outstanding foreign currency contracts that were designated as hedges of forecasted cash flows or capital equipment purchases. The Company does not enter into derivative financial instruments for speculative or trading purposes. The Company also has foreign exchange facilities used for hedging arrangements with banks that allow the Company to enter into foreign exchange contracts totaling approximately $20.0 million, all of which was available at March 29, 2015.
Note 20. Credit Facility
On June 13, 2011, the Company entered into a Master Repurchase Agreement (the Repurchase Agreement) with Bank of America, N.A. (Bank of America), pursuant to which the Company had the right, subject to the terms and conditions of the Repurchase Agreement, to sell to Bank of America up to 1,431 shares of Class A preferred shares of one of its wholly-owned subsidiaries (the Subsidiary), in one or more transactions prior to June 13, 2012, for an aggregate purchase price of $135 million in cash. Pursuant to the Repurchase Agreement, to the extent it sells any such shares to Bank of America, the Company will be obligated to repurchase from Bank of America and Bank of America will be obligated to resell to the Company, those preferred shares for the aggregate purchase price paid by Bank of America. On May 17, 2012, the Company entered into an amendment to the Repurchase Agreement which, among other things, extended the availability of the transactions under the Repurchase Agreement until December 13, 2012. On December 4, 2012, the Company entered into another amendment to the Repurchase Agreement which, among other things, extended the availability of the transactions under the Repurchase Agreement until February 14, 2013.
Related to the termination of the planned acquisition of PLX, the Company's management determined that it would be in the best interest of IDT to allow the Repurchase Agreement and the related IDT Agreement with Bank of America to lapse undrawn. As a result, the Repurchase Agreement was allowed to lapse undrawn on February 14, 2013. The related IDT Agreement expired as of the same date. Associated with the Repurchase Agreement, the Company had approximately $2.5 million in remaining unamortized financing costs which were originally recorded as other current assets. The Company recognized these remaining financing costs in fiscal 2013 as selling, general and administrative expense.
Note 21. Subsequent Events
On April 27, 2015, the Company completed the sale of the remaining HSC business to eSilicon Corporation (“eSilicon”), for $1.5 million which will be paid on or before April 27, 2017. In connection with the sale, the Company entered into an Exclusive Intellectual Property License Agreement with eSilicon, whereby the Company will provide an exclusive license to eSilicon to develop, manufacture, sell and maintain HSC products. In connection with the sale, the Company and eSilicon also entered into a Transition Services Agreement, whereby the Company will provide certain transition services over a specific period from the effective date of the sale. Also, as part of the sale, the Company will transfer to eSilicon certain assets with a nominal carrying value.
In April 2015, the Company's Board of Directors approved a new share repurchase program authorization for $300 million.
69
SUPPLEMENTARY FINANCIAL INFORMATION (UNAUDITED)
QUARTERLY RESULTS OF OPERATIONS
(in thousands, except per share data)
Fiscal Year Ended March 29, 2015 | |||||||||||||||
First Quarter (4) | Second Quarter (5) | Third Quarter (5) | Fourth Quarter | ||||||||||||
Revenues | $ | 126,302 | $ | 137,093 | $ | 151,160 | $ | 158,350 | |||||||
Gross profit | 74,009 | 81,876 | 91,364 | 98,055 | |||||||||||
Net income from continuing operations | 17,111 | 24,246 | 32,841 | 40,383 | |||||||||||
Net income (loss) from discontinued operations | 4,732 | (9,804 | ) | (14,483 | ) | (1,117 | ) | ||||||||
Net income | 21,843 | 14,442 | 18,358 | 39,266 | |||||||||||
Basic net income per share – continuing operations | $ | 0.11 | $ | 0.16 | $ | 0.22 | $ | 0.27 | |||||||
Basic net income (loss) per share – discontinued operations | $ | 0.04 | $ | (0.06 | ) | $ | (0.10 | ) | $ | (0.01 | ) | ||||
Basic net income per share | $ | 0.15 | $ | 0.10 | $ | 0.12 | $ | 0.26 | |||||||
Diluted net income per share – continuing operations | $ | 0.11 | $ | 0.16 | $ | 0.21 | $ | 0.26 | |||||||
Diluted net income (loss) per share – discontinued operations | $ | 0.03 | $ | (0.07 | ) | $ | (0.09 | ) | $ | (0.01 | ) | ||||
Diluted net income per share | $ | 0.14 | $ | 0.09 | $ | 0.12 | $ | 0.25 | |||||||
Fiscal Year Ended March 30, 2014 | |||||||||||||||
First Quarter | Second Quarter (1) | Third Quarter (2) | Fourth Quarter (3) | ||||||||||||
Revenues | $ | 117,464 | $ | 124,047 | $ | 124,628 | $ | 118,640 | |||||||
Gross profit | 66,122 | 70,761 | 74,939 | 61,080 | |||||||||||
Net income from continuing operations | 1,501 | 87,411 | 17,339 | 5,062 | |||||||||||
Net loss from discontinued operations | (3,765 | ) | (3,760 | ) | (10,391 | ) | (5,033 | ) | |||||||
Net income (loss) | (2,264 | ) | 83,651 | 6,948 | 29 | ||||||||||
Basic net income per share – continuing operations | $ | 0.01 | $ | 0.58 | $ | 0.11 | $ | 0.03 | |||||||
Basic net loss per share – discontinued operations | $ | (0.03 | ) | $ | (0.02 | ) | $ | (0.06 | ) | $ | (0.03 | ) | |||
Basic net income (loss) per share | $ | (0.02 | ) | $ | 0.56 | $ | 0.05 | $ | — | ||||||
Diluted net income per share – continuing operations | $ | 0.01 | $ | 0.57 | $ | 0.11 | $ | 0.03 | |||||||
Diluted net loss per share – discontinued operations | $ | (0.03 | ) | $ | (0.03 | ) | $ | (0.07 | ) | $ | (0.03 | ) | |||
Diluted net income (loss) per share | $ | (0.02 | ) | $ | 0.54 | $ | 0.04 | $ | — | ||||||
(1) In the second quarter of fiscal 2014, the Company recorded a gain of $82.3 million in net income from continuing operations related to the divestiture of its PCI Express enterprise flash controller business to PMC-Sierra, Inc.
(2) In the third quarter of fiscal 2014, the Company recorded a loss of $3.4 million in net loss from continuing operations related to the divestiture of certain assets of its Audio business to Stravelis, Inc.
(3) In the fourth quarter of fiscal 2014, associated with the decision to discontinue production and sale of products using technology attained through the acquisitions of Mobius Microsystems in fiscal 2010 and IKOR in fiscal 2011, the Company recorded an additional $8.7 million in accelerated amortization of intangible assets which was charged to cost of revenues. In addition, the Company recorded a $2.4 million impairment of IPR&D to research and development expense, associated with the decision to discontinue further development required to complete the Mobius Microsystems acquired IPR&D.
(4) In the first quarter of fiscal 2015, the Company recorded a gain of $16.8 million in net income from discontinued operations related to the divestiture of the Alvand portion of its HSC business.
(5) In the second quarter of fiscal 2015, the Company recorded $6.8 million of minimum statutory benefits to discontinued operations with regards to a workforce-reduction plan that covered certain employees of its HSC business in France and the Netherlands. In the third quarter of fiscal 2015, the Company recorded $11.9 million of restructuring charges to discontinued operations in addition to the minimum statutory amount recognized in the previous quarter.
70
ITEM 9. CHANGES IN AND DISAGREEMENTS WITH ACCOUNTANTS ON ACCOUNTING AND FINANCIAL DISCLOSURE
None.
ITEM 9A. CONTROLS AND PROCEDURES
Evaluation of Disclosure Controls and Procedures
We maintain “disclosure controls and procedures,” as such term is defined in Rule 13a-15(e) under the Exchange Act, as amended (the Exchange Act), that are designed to ensure that information required to be disclosed by us in reports that we file or submit under the Exchange Act is recorded, processed, summarized, and reported within the time periods specified in Securities and Exchange Commission rules and forms, and that such information is accumulated and communicated to our management, including our Chief Executive Officer and Chief Financial Officer, as appropriate, to allow timely decisions regarding required disclosure. Our management, including the Chief Executive Officer and Chief Financial Officer, is engaged in a comprehensive effort to review, evaluate and improve our controls; however, management does not expect that our disclosure controls will prevent all errors and all fraud. A control system, no matter how well designed and operated, can provide only reasonable, not absolute, assurance that the control systems’ objectives are met. Additionally, in designing disclosure controls and procedures, our management necessarily was required to apply its judgment in evaluating the cost-benefit relationship of possible disclosure controls and procedures. The design of any disclosure controls and procedures also is based in part upon certain assumptions about the likelihood of future events, and there can be no assurance that any design will succeed in achieving its stated goals under all potential future conditions.
Based on their evaluation as of the end of the period covered by this Annual Report on Form 10-K, our Chief Executive Officer and Chief Financial Officer have concluded that our disclosure controls and procedures were effective at the reasonable assurance level.
Changes in Internal Control over Financial Reporting
There was no change in our internal control over financial reporting that occurred during our last fiscal quarter that has materially affected, or is reasonably likely to materially affect, our internal control over financial reporting.
Management’s Report on Internal Control over Financial Reporting
Our management is responsible for establishing and maintaining adequate internal control over financial reporting as defined in Rule 13a-15(f) of the Exchange Act. Because of its inherent limitations, internal control over financial reporting may not prevent or detect misstatements. Also, projections of any evaluation of effectiveness to future periods are subject to the risk that controls may become inadequate because of changes in conditions or that the degree of compliance with the policies or procedures may deteriorate.
Our management assessed the effectiveness of our internal control over financial reporting as of March 29, 2015. In making this assessment, our management used the criteria set forth by the Committee of Sponsoring Organizations of the Treadway Commission in Internal Control – Integrated Framework (2013).
Based on our management’s assessment using those criteria, management concluded that our internal control over financial reporting was effective as of March 29, 2015.
PricewaterhouseCoopers LLP, the independent registered public accounting firm that audited our consolidated financial statements included in this report, has issued a report on our internal control over financial reporting as of March 29, 2015, which report appears under Item 8 of this Annual Report on Form 10-K.
ITEM 9B. OTHER INFORMATION
None.
71
PART III
ITEM 10. DIRECTORS, EXECUTIVE OFFICERS AND CORPORATE GOVERNANCE
Our executive officers, and their respective ages as of March 29, 2015, are as follows:
Name | Age | Position | ||
Gregory L. Waters | 54 | President and Chief Executive Officer | ||
Brian C. White | 50 | Vice President, Chief Financial Officer | ||
Sailesh Chittipeddi | 52 | Global Vice President of Operations and Chief Technical Officer | ||
Mario Montana | 53 | Vice President, Chief Sales Officer | ||
Sean Fan | 49 | Vice President and General Manager, Connectivity Division | ||
Arman Naghavi | 52 | Vice President, Analog Power Technology | ||
Louise Gaulin | 48 | Vice President and General Manager, Network Communications Division | ||
Dave Shepard | 53 | Vice President and General Manager, Timing and Radio Freqency Division | ||
Graham Robertson | 47 | Vice President, Corporate Marketing | ||
Anja Hamilton | 44 | Vice President, Worldwide Human Resources | ||
Matthew D. Brandalise | 49 | Vice President, General Counsel and Corporate Secretary | ||
Mr. Waters joined IDT as President and Chief Executive Officer in January 2014. Prior to joining IDT, Mr. Waters served as Senior Vice President and General Manager, Front-End Solutions at Skyworks Solutions, Inc. (“Skyworks”) from 2006 until 2012. Prior to 2006, he served in various positions at Skyworks since joining that company in 2003, including Executive Vice President beginning in 2005, Vice President and General Manager, Cellular Systems beginning in 2004 and Vice President, Linear Products beginning in 2003. From 2001 until 2003, Mr. Waters served as Senior Vice President of Strategy and Business Development at Agere Systems Inc. (“Agere”) and, beginning in 1998, held positions at Agere as Vice President of the Wireless Communications business and Vice President of the Broadband Communications business. Prior to working at Agere, Mr. Waters held a variety of senior management positions at Texas Instruments Inc., including Director of Network Access Products and Director of North American Sales. Mr. Waters holds a B.S. of Engineering from the University of Vermont and an M.S. in Computer Science from Northeastern University.
Mr. White was promoted to the positions of Vice President and Chief Financial Officer in September 2013. Mr. White joined the Company as Vice President, Finance in February 2007 and became Vice President, Finance and Treasurer of the Company in April 2009. From June 2008 to October 2008, he served as the Company’s interim CFO. Prior to joining the Company, Mr. White held management positions with Nvidia, Hitachi GST and IBM. He started his career in public accounting with Deloitte & Touche and Arthur Andersen. Mr. White has 25 years of professional experience in finance, accounting, business line management, strategy and business development. Mr. White is a CPA and holds an MBA from the University of Notre Dame.
Dr. Chittipeddi joined IDT as Global Vice President of Operations and Chief Technical Officer in March 2014. Prior to joining IDT, Dr. Chittipeddi served as President, Chief Executive Officer and a director of Conexant Systems, Inc. (“Conexant”), a semiconductor company, from April 2011 until July 2013 through its emergence from Chapter 11 reorganization. Prior to that, since 2006 he served in various positions at Conexant, including Chief Operating Officer and Chief Technology Officer. From 2001 until 2006, Dr. Chittipeddi served as Head of Foundry Operations and additionally managed the joint venture Silicon Manufacturing Partners between Agere Systems (now LSI Corporation) and Chartered Semiconductor (now Global Foundries). Prior to that, he served in a variety of positions at AT&T, SEMATECH and Lucent Technologies. Dr. Chittipeddi holds an M.B.A. from the University of Texas at Austin and an M.S. and a Ph.D. in Physics from The Ohio State University.
Mr. Montana joined IDT in 1997 and became Vice President, Chief Sales Officer in August 2013. Prior to his current role, Mr. Montana held various management positions at IDT including Vice President, General Manager, Enterprise Computing Division (formerly Serial Switching Division), Director, IDT Serial-Switching Division, Director, IDT Strategic Marketing Group, and Product Line Director, IDT Telecommunications, FIFO, Logic and Timing groups, respectively.
Mr. Fan joined IDT in 1999 and became Vice President and General Manager, Connectivity Division in August 2013. Prior to his current position, Mr. Fan held various management roles at IDT, including Vice President IDT China, Vice President and General Manager of the Memory Interface Division, General Manager of Standard Product Operations, and Senior Director of Silicon Timing Solutions. Prior to joining IDT, Mr. Fan served in various engineering and management roles with Lucent Microelectronics, Mitel Semiconductor, and the National Lab of Telecom Research in China. Mr. Fan holds a Master of Science degree in Computer Engineering from University of Cincinnati, and a B.S. degree in Computer and Telecommunications from Beijing University of Posts and Telecommunications.
72
Mr. Naghavi joined IDT in 2009 and was appointed to his current position in 2015. Prior to joining IDT Mr. Naghavi served as Vice President and General Manager of the Analog, Mixed-signal, and Power Division at Freescale Semiconductor. Prior to Freescale, Mr. Naghavi held various engineering and management positions at Intersil Corporation and Analog Devices, Inc., both semiconductor companies.
Ms. Gaulin joined IDT in November 2011 and became the Vice President and General Manager of Network Communications in April 2014. Ms. Gaulin has more than 20 years experience in the Communications Semiconductor market. Prior to joining IDT, Ms. Gaulin was Vice President of Timing Marketing and Product Management at Zarlink Semiconductor. Ms. Gaulin has also held various roles in application, marketing and management at Mitel Semiconductor. Ms. Gaulin holds a Bachelor of Applied Science in Electrical Engineering from University of Ottawa.
Mr. Shepard joined IDT in April 2014 as Vice President and General Manager, Timing and Radio Frequency. Prior to joining IDT, Mr. Shepard served as Vice President and General Manager with Peregrine Semiconductor from 2004 to 2010. From 2003 to 2009, Mr. Shepard served as President and Chief Executive Officer of Sequoia Communications. Prior to that, Mr. Shepard held various positions at Texas Instruments, including General Manager of the Wireless Infrastructure Business Unit. Mr. Shepard holds a B.A. in Physics from Lawrence University and an M.S. in Electrical Engineering from University of Wisconsin - Madison.
Mr. Robertson joined IDT in March 2010 as Vice President, Corporate Marketing. Prior to joining IDT, Mr. Robertson served as Vice President of Global Marketing and Corporate Communications at International Rectifier from October 1998 to March 2010. Prior to International Rectifier, Mr. Robertson held sales and marketing communications positions at Future Electronics, and other senior marketing positions within various marketing and promotion solutions organizations in Europe. Mr. Robertson earned his Master of Business Administration degree from Edinburgh’s Heriot Watt University and a Master of Science degree in Marketing from the University of Glamorgan South Wales, United Kingdom. He is currently completing his Doctorate degree in Business from Heriot Watt University.
Ms. Hamilton joined IDT in February 2011, and became VP, Worldwide Human Resources in October 2012. Prior to her current role, Ms. Hamilton was the Sr. Director, Worldwide Compensation and HRIS. Prior to joining IDT Ms. Hamilton held various compensation management positions at Atmel, eBay and Electronic Arts. Ms. Hamilton has 21 years of business management experience, with 15 of those in human resources. Ms. Hamilton received her business education in Germany, and holds several certifications in Human Resource Management.
Mr. Brandalise joined IDT in May 2000 and was promoted to General Counsel in October 2012. Prior to his current role, Mr. Brandalise served as Senior Director and Director in IDT's Legal Department. Mr. Brandalise has also held corporate counsel and senior corporate counsel positions in the IDT Legal Department. Mr. Brandalise joined IDT with 8 years of law firm experience in the areas of commercial litigation and commercial transactions.
The information required by this item concerning our directors is incorporated by reference from the information set forth in the sections titled “Proposal 1—Election of Directors” and “Section 16(a) Beneficial Ownership Reporting Compliance” in our Proxy Statement for the 2015 Annual Meeting of Stockholders.
Other information required by this item concerning our executive officers is incorporated by reference from the information set forth in this section titled “Section 16(a) Beneficial Ownership Reporting Compliance” in our Proxy Statement for the 2015 Annual Meeting of Stockholders.
The information required by this item concerning our audit committee and its financial expert is incorporated by reference from the information set forth in the section titled “Corporate Governance-Board of Directors Meetings and Committees” in our Proxy Statement for the 2015 Annual Meeting of Stockholders.
We have adopted a written code of business ethics that applies to all of our employees and to our Board of Directors. A copy of the code is available on our website at http://www.IDT.com. If we make any substantive amendments to the code of business ethics or grant any waiver from a provision of the code of business ethics to any of our directors or officers, we will promptly disclose the nature of the amendment or waiver on our website.
The information required by this item concerning recommendations of director nominees by security holders is incorporated by reference from the information set forth in the section titled "Consideration of Stockholder Nominees for Director” and “Corporate Governance—Board of Directors Meetings and Committees" in our Proxy Statement for the 2015 Annual Meeting of Stockholders.
ITEM 11. EXECUTIVE COMPENSATION
The information required by this item is incorporated herein by reference from our Proxy Statement for the 2015 Annual Meeting of Stockholders.
73
ITEM 12. SECURITY OWNERSHIP OF CERTAIN BENEFICIAL OWNERS AND MANAGEMENT AND RELATED STOCKHOLDER MATTERS
The information required by this item is incorporated herein by reference from our Proxy Statement for the 2015 Annual Meeting of Stockholders.
ITEM 13. CERTAIN RELATIONSHIPS AND RELATED TRANSACTIONS, AND DIRECTOR INDEPENDENCE
The information required by this Item is incorporated herein by reference from our Proxy Statement for the 2015 Annual Meeting of Stockholders.
ITEM 14. PRINCIPAL ACCOUNTANT FEES AND SERVICES
The information required by this item is incorporated herein by reference from our Proxy Statement for the 2015 Annual Meeting of Stockholders.
74
PART IV
ITEM 15. EXHIBITS, FINANCIAL STATEMENT SCHEDULES
(a) | 1. Financial Statements. See "Index to Consolidated Financial Statements" under Part II, Item 8 of this Annual Report. |
2. Financial Statement Schedules. See Schedule II, "Valuation and Qualifying Accounts," included with this Annual Report.
3. Exhibits. The exhibits listed in the Exhibit Index below are filed or incorporated by reference as part of this Annual Report.
75
SIGNATURES
Pursuant to the requirements of Section 13 or 15(d) of the Securities Exchange Act of 1934, the registrant has duly caused this report to be signed on its behalf by the undersigned, thereunto duly authorized.
INTEGRATED DEVICE TECHNOLOGY, INC. Registrant | ||
By: | /s/ GREGORY L. WATERS | |
May 19, 2015 | Gregory L.Waters President and Chief Executive Officer | |
KNOW ALL PERSONS BY THESE PRESENTS, that each person whose signature appears below constitutes and appoints each of Gregory L. Waters and Brian C. White his true and lawful attorney-in-fact and agent, with full power of substitution, for him and in his name, place and stead, in any and all capacities, to sign any and all amendments to this Annual Report on Form 10-K, and to file the same, with all exhibits thereto, and other documents in connection therewith, with the Securities and Exchange Commission, granting unto said attorney-in-fact and agent, full power and authority to do and perform each and every act and thing requisite and necessary to be done in connection therewith, as fully to all intents and purposes as he might or could do in person, hereby ratifying and confirming all that said attorney-in-fact and agent, or his substitutes or substitute, may lawfully do or cause to be done by virtue hereof.
IN WITNESS WHEREOF, each of the undersigned has executed this Power of Attorney as of the date indicated opposite his/her name.
Pursuant to the requirements of the Securities Exchange Act of 1934, this report has been signed below by the following persons on behalf of the registrant and in the capacities and on the date indicated.
Signature | Title | Date | ||
/s/ GREGORY L. WATERS | Chief Executive Officer, President and Director | May 19, 2015 | ||
Gregory L. Waters | (Principal Executive Officer) | |||
/s/ BRIAN C. WHITE | Vice President, Chief Financial Officer | May 19, 2015 | ||
Brian C. White | (Principal Financial and Accounting Officer) | |||
/s/ JOHN SCHOFIELD | Chairman of the Board | May 19, 2015 | ||
John Schofield | ||||
/s/ GORDON PARNELL | Director | May 19, 2015 | ||
Gordon Parnell | ||||
/s/ UMESH PADVAL | Director | May 19, 2015 | ||
Umesh Padval | ||||
/s/ RON SMITH | Director | May 19, 2015 | ||
Ron Smith | ||||
/s/ DONALD SCHROCK | Director | May 19, 2015 | ||
Donald Schrock | ||||
/s/ KEN KANNAPPAN | Director | May 19, 2015 | ||
Ken Kannappan | ||||
/s/ NORMAN TAFFE | Director | May 19, 2015 | ||
Norman Taffe | ||||
/s/ ROBERT RANGO | Director | May 19, 2015 | ||
Robert Rango | ||||
76
INTEGRATED DEVICE TECHNOLOGY, INC.
SCHEDULE II
VALUATION AND QUALIFYING ACCOUNTS
(in thousands) | Balance at Beginning of Period | Additions Charged (Credited) to Revenues, Costs and Expenses | Charged (Credited) to Other Accounts | Deductions and Write-offs | Balance at End of Period | ||||||||||||||
Allowance for returns, pricing credits and doubtful accounts | |||||||||||||||||||
Year ended March 31, 2013 | $ | 3,009 | $ | 134 | $ | — | $ | (356 | ) | $ | 2,787 | ||||||||
Year ended March 30, 2014 | $ | 2,787 | $ | 657 | $ | — | $ | (310 | ) | $ | 3,134 | ||||||||
Year ended March 29, 2015 | $ | 3,134 | $ | 1,680 | $ | — | $ | (150 | ) | $ | 4,664 | ||||||||
Tax valuation allowance | |||||||||||||||||||
Year ended March 31, 2013 | $ | 131,731 | $ | 34,171 | $ | — | $ | (31,269 | ) | $ | 134,633 | ||||||||
Year ended March 30, 2014 | $ | 134,633 | $ | 30,110 | $ | — | $ | (21,039 | ) | $ | 143,704 | ||||||||
Year ended March 29, 2015 | $ | 143,704 | $ | 12,427 | $ | — | $ | (7,177 | ) | $ | 148,954 | ||||||||
77
EXHIBIT INDEX
Exhibit Number | Exhibit Description | Incorporated by Reference | ||||||||||
Form | File Number | Exhibit/ Appendix | Filing Date | Filed Herewith | ||||||||
2.1 | Business Purchase Agreement, dated as of February 22, 2012, by and between Integrated Device Technology, Inc. and NXP B.V. | 8-K | 00-12695 | 2.1 | 7/20/2012 | |||||||
2.2 | Amendment No. 1 to Business Purchase Agreement, dated as of June 21, 2012, by and between Integrated Device Technology, Inc. and NXP B.V. | 8-K | 00-12695 | 2.2 | 7/20/2012 | |||||||
2.3 | Amendment No. 2 and Waiver to Business Purchase Agreement, dated as of July 19, 2012, by and between Integrated Device Technology, Inc. and NXP B.V. | 8-K | 00-12695 | 2.3 | 7/20/2012 | |||||||
3.1 | Restated Certificate of Incorporation, as amended to date. | 10-K | 00-12695 | 3.1 | 5/21/2012 | |||||||
3.2 | Certificate of Designations specifying the terms of the Series A Junior Participating Preferred Stock of Integrated Device Technology, Inc., as filed with the Secretary of State of the State of Delaware. | 8-A | 00-12695 | 3.6 | 12/23/1998 | |||||||
3.3 | Amended and Restated Bylaws of the Company, effective as of July 23, 2013. | 10-Q | 00-12695 | 3.3 | 9/29/2013 | |||||||
10.1 | Amendment to 1994 Stock Option Plan, September 22, 2000.# | 10-Q | 00-12695 | 10.10 | 11/15/2000 | |||||||
10.2 | 1994 Directors Stock Option Plan and related documents.# | 10-Q | 00-12695 | 10.18 | 11/16/1994 | |||||||
10.3 | Form of Indemnification Agreement between the Company and its directors and officers.# | 10-K | 00-12695 | 10.68 | 4/2/1989 | |||||||
10.4 | Amended Form of Indemnification Agreement between the Company and its directors and officers.# | X | ||||||||||
10.5 | Incentive Compensation Plan.# | 10-Q | 00-12695 | 10.27 | 8/11/2005 | |||||||
10.6 | Form of Change of Control Agreement between the Company and certain of its officers.# | 10-K | 00-12695 | 10.13 | 6/23/2003 | |||||||
10.7 | 1997 Stock Option Plan.# | 10-Q | 00-12695 | 10.23 | 8/14/2002 | |||||||
10.8 | Non-Qualified Deferred Compensation Plan effective November 1, 2000.# | 10-K | 00-12695 | 10.21 | 6/29/2001 | |||||||
10.9 | 1984 Employee Stock Purchase Plan, as amended and restated effective September 29, 2003.# | 10-Q | 00-12695 | 10.25 | 11/6/2003 | |||||||
10.10 | 2004 Equity Plan, as amended and restated, effective September 23, 2010.# | DEF 14A | 00-12695 | A | 7/26/2010 | |||||||
10.11 | 2009 Employee Stock Purchase Plan.# | DEF 14A | 00-12695 | A | 8/7/2009 | |||||||
10.12 | Master Purchase Agreement, dated June 13, 2011, by and between Integrated Device Technology, Inc. and Bank of America, N.A. (the Master Purchase Agreement). | 8-K | 00-12695 | 10.1 | 6/17/2011 | |||||||
78
Exhibit Number | Exhibit Description | Incorporated by Reference | ||||||||||
Form | File Number | Exhibit/ Appendix | Filing Date | Filed Herewith | ||||||||
10.13 | Asset Purchase Agreement dated as of August 31, 2011 by and among Qualcomm, Incorporated, Qualcomm Canada Inc., Integrated Device Technology, Inc. and IDT Canada, Inc. | 10-K | 00-12695 | 10.34 | 5/21/2012 | |||||||
10.14 | Foundry Agreement dated August 3, 2009 between the Company and Taiwan Semiconductor Manufacturing Co., Ltd. | 10-K | 00-12695 | 10.35 | 5/21/2012 | |||||||
10.15 | Amendment No. 1 to the Master Purchase Agreement, dated as of May 17, 2012, by and between Integrated Device Technology, Inc. and Bank of America, N.A. | 10-K | 00-12695 | 10.36 | 5/21/2012 | |||||||
10.16 | Amendment No. 2 to the Master Repurchase Agreement, dated as of December 4, 2012, by and between Integrated Device Technology, Inc. and Bank of America, N.A. | 8-K | 00-12695 | 10.1 | 12/7/2012 | |||||||
10.17 | Asset Purchase Agreement by and among PMC-Sierra, Inc., Integrated Device Technology, Inc. and Integrated Device Technology (Malaysia) Sdn. Bhd., dated as of May 29, 2013. | 8-K | 00-12695 | 2.1 | 5/29/2013 | |||||||
10.18 | Integrated Device Technology, Inc. Fiscal 2014 Performance Equity Plan.# | 8-K | 00-12695 | 10.1 | 6/16/2013 | |||||||
10.19 | Separation Agreement, dated August 26, 2013, by and between Theodore L. Tewksbury, III, and Integrated Device Technology, Inc.# | 8-K | 00-12695 | 10.1 | 8/24/2013 | |||||||
10.20 | Offer Letter between the Company and Jeffrey S. McCreary, entered into on September 12, 2013.# | 10-Q | 00-12695 | 10.2 | 11/6/2013 | |||||||
10.21 | Offer Letter between Integrated Device Technology, Inc. and Sailesh Chittipeddi, entered into on February 19, 2014.# | 8-K | 00-12695 | 10.1 | 3/12/2014 | |||||||
10.22 | Offer Letter between Integrated Device Technology, Inc. and Greg Waters, entered into on December 5, 2013.# | 8-K | 00-12695 | 10.1 | 12/17/2013 | |||||||
10.23 | Executive Retention Plan.# | 8-K | 00-12695 | 10.1 | 1/15/2013 | |||||||
79
Exhibit Number | Exhibit Description | Incorporated by Reference | ||||||||||
Form | File Number | Exhibit/ Appendix | Filing Date | Filed Herewith | ||||||||
21.1 | Subsidiaries of the Company. | X | ||||||||||
23.1 | Consent of Independent Registered Public Accounting Firm. | X | ||||||||||
24.1 | Power of Attorney (included on signature page to this Annual Report on Form 10-K). | X | ||||||||||
31.1 | Certification of Chief Executive Officer as required by Rule 13a-14(a) and 15d-14(a) of the Securities Exchange Act of 1934, as amended. | X | ||||||||||
31.2 | Certification of Chief Financial Officer as required by Rule 13a-14(a) and 15d-14(a) of the Securities Exchange Act of 1934, as amended. | X | ||||||||||
32.1 | Certification of Chief Executive Officer pursuant to Section 906 of the Sarbanes-Oxley Act of 2002.* | X | ||||||||||
32.2 | Certification of Chief Financial Officer pursuant to Section 906 of the Sarbanes-Oxley Act of 2002.* | X | ||||||||||
101.INS | XBRL Instance Document. | X | ||||||||||
101.SCH | XBRL Taxonomy Extension Schema Document. | X | ||||||||||
101.CAL | XBRL Taxonomy Extension Calculation Linkbase Document. | X | ||||||||||
101.DEF | XBRL Taxonomy Extension Definition Linkbase Document. | X | ||||||||||
101.LAB | XBRL Taxonomy Extension Label Linkbase Document. | X | ||||||||||
101.PRE | XBRL Taxonomy Extension Presentation Linkbase Document. | X | ||||||||||
*The certifications attached as Exhibits 32.1 and 32.2 that accompany this Annual Report on Form 10-K are not deemed filed with the Securities and Exchange Commission and are not to be incorporated by reference into any filing of Integrated Device Technology, Inc. under the Securities Act of 1933, as amended, or the Securities Exchange Act of 1934, as amended, whether made before or after the date of this Form 10-K, irrespective of any general incorporation language contained in such filing.
#This exhibit is a management contract or compensatory plan or arrangement.
80