Attached files
| file | filename |
|---|---|
| EX-99.1 - PRESS RELEASE - DELTA AIR LINES, INC. | dal_8k-ex9901.htm |
| 8-K - CURRENT REPORT ON FORM 8-K - DELTA AIR LINES, INC. | dal_8k.htm |
Exhibit 99.2

Delta: Capital Evolution Continues May 13, 2015
This presentation contains various projections and other forward - looking statements which represent Delta’s estimates or expectations regarding future events. All forward - looking statements involve a number of assumptions, risks and uncertainties, many of which are beyond Delta’s control, that could cause the actual results to differ materially from the projected results. Factors which could cause such differences include, without limitation, business, economic, competitive, industry, regulatory, market and financial uncertainties and contingencies, as well as the “Risk Factors” discussed in Delta’s SEC filings. Caution should be taken not to place undue reliance on Delta’s forward - looking statements, which represent Delta’s views only as of the date of this presentation, and which Delta has no current intention to update. In this presentation, we will discuss certain non - GAAP financial measures. You can find the reconciliations of those measures to comparable GAAP measures on our website at delta.com. Safe Harbor 2
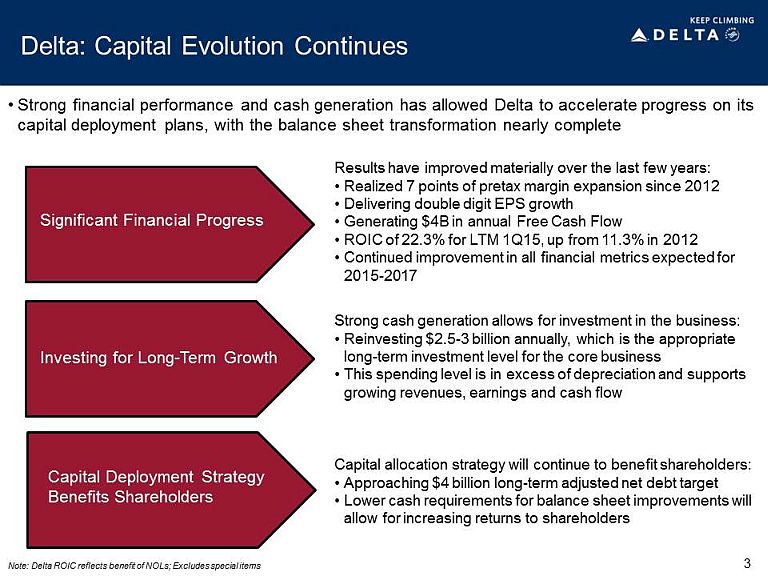
Delta: Capital Evolution Continues Significant Financial Progress Investing for Long - Term Growth Capital Deployment Strategy Benefits Shareholders Strong cash generation allows for investment in the business: • Reinvesting $2.5 - 3 billion annually, which is the appropriate long - term investment level for the core business • This spending level is in excess of depreciation and supports growing revenues, earnings and cash flow Results have improved materially over the last few years: • Realized 7 points of pretax margin expansion since 2012 • Delivering double digit EPS growth • Generating $4B in annual Free Cash Flow • ROIC of 22.3% for LTM 1Q15, up from 11.3% in 2012 • Continued improvement in all financial metrics expected for 2015 - 2017 Capital allocation strategy will continue to benefit shareholders: • Approaching $4 billion long - term adjusted net debt target • Lower cash requirements for balance sheet improvements will allow for increasing returns to shareholders • Strong financial performance and cash generation has allowed Delta to accelerate progress on its capital deployment plans, with the balance sheet transformation nearly complete 3 Note: Delta ROIC reflects benefit of NOLs; Excludes special items

Financial Performance Significantly Improved • Delta’s financial foundation has strengthened considerably since 2012 • Delta’s performance has consistently exceeded targets, with strong margin expansion, free cash flow and returns on invested capital • Initiatives are still in the early stages and will continue to drive strong improvements in the financial and operating performance of the business Note: Delta ROIC reflects benefit of NOLs; Excludes special items $0.8B $2.0B $3.8B 2012 LTM 1Q14 LTM 1Q15 Free Cash Flow 11.3% 16.4% 22.3% 2012 LTM 1Q14 LTM 1Q15 ROIC Prior Target: 11 - 14% Prior Target: $3 Billion Prior Target: 15 - 18% 7.1% 10.3% 13.3% 2012 LTM 1Q14 LTM 1Q15 Operating Margin 4
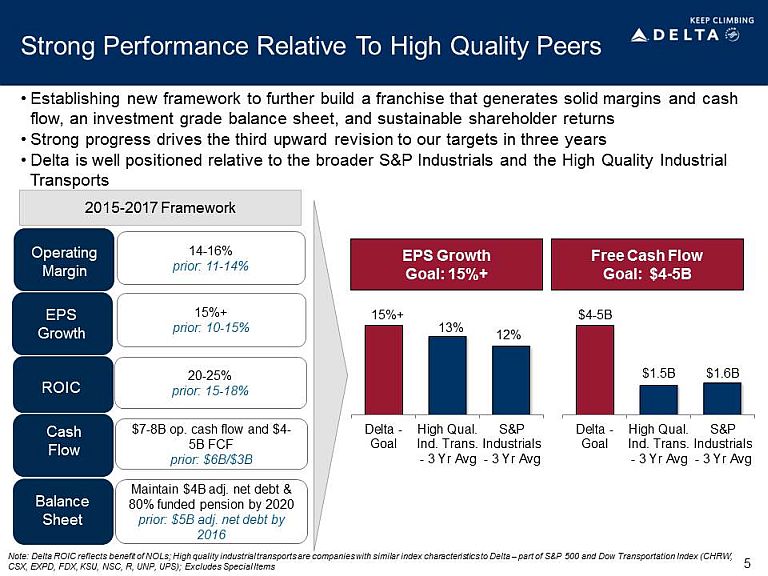
Strong Performance Relative To High Quality Peers • Establishing new framework to further build a franchise that generates solid margins and cash flow, an investment grade balance sheet, and sustainable shareholder returns • Strong progress drives the third upward revision to our targets in three years • Delta is well positioned relative to the broader S&P Industrials and the High Quality Industrial Transports Operating Margin 14 - 16% prior: 11 - 14% 2015 - 2017 Framework EPS Growth 15%+ prior: 10 - 15% 20 - 25% prior: 15 - 18% $7 - 8B op. cash flow and $4 - 5B FCF prior: $6B/$3B Cash Flow Maintain $4B adj. net debt & 80% funded pension by 2020 prior: $5B adj. net debt by 2016 Balance Sheet ROIC Delta - Goal High Qual. Ind. Trans. - 3 Yr Avg S&P Industrials - 3 Yr Avg $4 - 5B Delta - Goal High Qual. Ind. Trans. - 3 Yr Avg S&P Industrials - 3 Yr Avg 13% 15%+ Free Cash Flow Goal: $4 - 5B EPS Growth Goal: 15%+ 12% $1.6B $1.5B 5 Note: Delta ROIC reflects benefit of NOLs; High quality industrial transports are companies with similar index characteristic s t o Delta – part of S&P 500 and Dow Transportation Index (CHRW, CSX, EXPD, FDX, KSU, NSC, R, UNP, UPS); Excludes Special Items

The Path To Further Improvement • 2015 - 2017 plan shows path to achieving our long - term financial goals with margin expansion, free cash flow generation, and balance sheet improvement Revenue Growth Strong Cash Flow Cost Productivity Capacity Discipline Targeting ~5% annual revenue growth. Unit revenue growth is a function of superior brand execution and commercial initiatives. Maintain historical capacity discipline, with 2% annual growth embedded in the plan driven by fleet flexibility and conservative fuel and GDP assumptions. Producing $1 billion in cost productivity each year to maintain non - fuel unit cost growth below 2% annually. Continue interest savings from debt reduction. Generating $7 - 8 billion in annual operating cash flow, with $2.5 - 3 billion allocated to core reinvestment. Resulting $4 - 5 billion free cash flow used to strengthen the balance sheet through debt and pension reductions, and return increasing levels of cash to shareholders. 6

Appropriate Investment In The Business • Supporting long - term growth in the business through $2.5 - 3 billion in annual capital spending CapEx as a % of Depreciation 173% 179% 130% Delta 2015-2017 High Qual. Ind. Transports 3 Yr Avg S&P Industrials 3 Yr Avg • $2.5 - 3 billion of annual spending supports core investments required to sustain long - term growth and is consistent with other high quality industrial transports – This level of investment allows for the replacement of 20% of the Delta mainline fleet over the next 3 years • Rigorous capital process requires projects to have returns well above 15% • Consistent cash generation allows flexibility for strategic investment opportunities – Previous strategic investments (refinery, Virgin Atlantic, GOL, Aeromexico ) are driving higher margins and cash flow 7 Note: High quality industrial transports are companies with similar index characteristics to Delta – part of S&P 500 and Dow Tra nsportation Index (CHRW, CSX, EXPD, FDX, KSU, NSC, R, UNP, UPS)

Strong Cash Generation Funds Reinvestment • Strong operating cash flow, combined with disciplined capital spending, produces sustainable free cash flow of $4 - 5 billion annually Note: Includes pre - merger NWA; Excludes special items Expect to produce over $20 billion in operating cash flow from 2015 - 2017 8 $2.6 $3.8 $4.1 $4.8 $4.1 $2.9 $1.8 $1.3 $1.2 $0.9 $2.1 $2.6 $1.2 $1.3 $1.3 $2.0 $2.9 $2.1 $2.9 ($2.0) $0.0 $2.0 $4.0 $6.0 $8.0 Capital Spending and Operating Cash Flow ($B) CapEx Operating Cash Flow $8.9 $10.7 $11.6 $15.6 $18.6 $22.0 $23.8 $26.5 $12.4 $11.2 $13.2 $17.0 $17.0 $15.0 $12.9 $11.7 $9.4 $7.3 $6.0 Adjusted Net Debt ($B)

Setting Long - Term Adjusted Net Debt Target at $4B • Goal is to achieve and maintain $4 billion adjusted net debt levels by 2017 Adjusted Net Debt $ 17.0B $9.4B $7.3B $4B 2009 2013 2014 LT Target • Determined $4 billion is optimal long - term debt level – Results in investment grade credit metrics and a manageable WACC – Balances EPS efficiency with future flexibility – Lowers financial risk for the business • Debt reduction and optimization of debt portfolio provide earnings tailwind through lower interest expense – Net interest expense at $4 billion adjusted net debt target will be $200 million annually – a reduction of $1.1 billion vs. 2009 – Interest expense levels are similar to S&P Industrial peers • Building a s ignificant unencumbered asset base – Currently $3.2 billion in unencumbered assets – New aircraft deliveries through 2017 will increase this amount 9

2010 2015E 2017E Targeting An Investment Grade Quality Balance Sheet • Significant progress on the balance sheet in the last five years makes Delta’s credit metrics consistent with investment grade industrials • Delta will be operating with investment grade (BBB - ) credit metrics by 2016 12% 34% 2010 2015E 2017E 2010 2015E 2017E FFO/Debt EBITDA/Interest Debt/EBITDA 45 – 50% 2.5x 7.0 – 7.5x 4.9x 1.5 – 2.0x S&P Industrial Average Median BBB 31% BB 25% B 12% S&P Industrial Average Median BBB 8.2x BB 4.8x B 2.3x S&P Industrial Average Median BBB 2.3x BB 3.2x B 5.5x FFO is cash flow from operations before changes in working capital plus implied operating lease depreciation and adjustments of cash flows associated with pension from operating to financing activities. EBITDA includes proprietary adjustments for operating lease rent, pension costs, special items, and for S&P, equi ty comp. Interest includes proprietary adjustments to net interest expense for operating lease and pension interest costs. Benchmarks based on Three Year US Industrial Average Medians as of fiscal yea r e nd 2014, sourced from www.mycreditprofile.standardandpoors.com. 5.6x 2.4x 10

Addressing Long - Term Pension Obligations • Plan to maintain pension funding at $1 billion per year through 2020 – $1.2 billion in 2015 contributions includes additional $200 million to cover 2014 asset return shortfall • Funding strategy has increased pension assets by $1.7 billion, net of $5.2 billion in distributions, since 2009 • Incremental pension funding helps drive balance sheet improvement – At current discount rates, pension would be 80% funded and balance sheet liability reduced to $4 billion by 2020 – Assuming discount rates rise 200bps, pension would be 90% funded by 2020 • Approach maintains flexibility on future funding due to airline relief contained in the Pension Protection Act of 2006, which uniquely applied to Delta – Delta has until 2031 to fully fund pensions Pension Funded Status & Unfunded Liability 40% 50% 60% 70% 80% 90% 100% 2014 2017 2020 Funded status at current discount rate Funded status assuming increased rates (+200bps) • $1 billion annual funding should produce 80% funded status by 2020 11
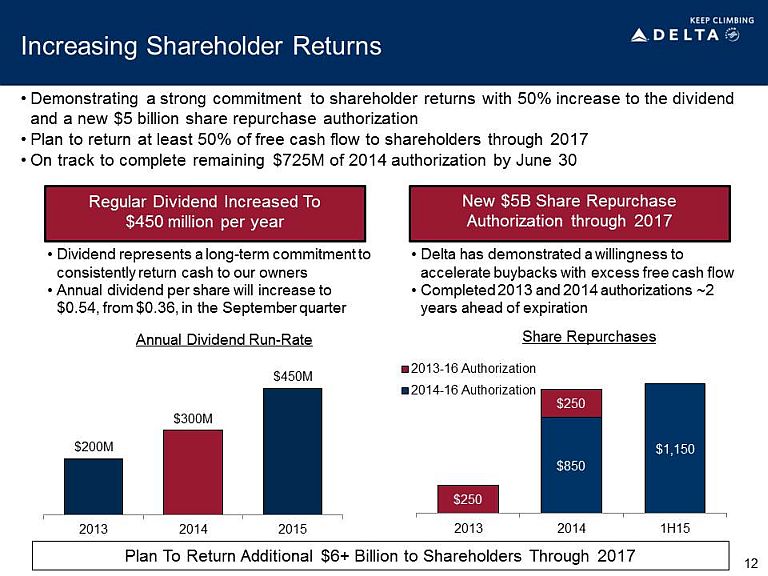
Increasing Shareholder Returns • Demonstrating a strong commitment to shareholder returns with 50% increase to the dividend and a new $5 billion share repurchase authorization • Plan to return at least 50% of free cash flow to shareholders through 2017 • On track to complete remaining $725M of 2014 authorization by June 30 Regular Dividend Increased To $450 million per year New $5B Share Repurchase Authorization through 2017 • Dividend represents a long - term commitment to consistently return cash to our owners • Annual dividend per share will increase to $0.54, from $0.36, in the September quarter • Delta has demonstrated a willingness to accelerate buybacks with excess free cash flow • Completed 2013 and 2014 authorizations ~2 years ahead of expiration Plan To Return Additional $6+ Billion to Shareholders Through 2017 Share Repurchases Annual Dividend Run - Rate $200M $300M $450M 2013 2014 2015 $850 $1,150 $250 $250 2013 2014 1H15 2013-16 Authorization 2014-16 Authorization 12

Delta’s Stock Has Outperformed the Industrial Peers… • Delta’s strong financial performance and balanced capital deployment strategy has driven share price appreciation well in excess of the peer group over the last several years 0% 50% 100% 150% 200% 250% 300% 350% 1Q13 2Q13 3Q13 4Q13 1Q14 2Q14 3Q14 4Q14 1Q15 Delta 279% Airlines (XAL) 130% High Quality Ind. Transports 52% S&P 500 45% Stock Price Performance 2013 - Present 13 Note: High quality industrial transports are companies with similar index characteristics to Delta – part of S&P 500 and Dow Tra nsportation Index (CHRW, CSX, EXPD, FDX, KSU, NSC, R, UNP, UPS)

• Plan targets compare favorably with other industrials and should help drive better valuations …But Valuation Remains at a Significant Discount 15 %+ 13.1% 11.5% Delta High Qual. Ind. Transports S&P Industrials EPS Growth $4 - 5B $1.5B $1.6B Delta High Qual. Ind. Transports S&P Industrials Free Cash Flow Note: High quality industrial transports are companies with similar index characteristics to Delta – part of S&P 500 and Dow Tra nsportation Index (CHRW, CSX, EXPD, FDX, KSU, NSC, R, UNP, UPS); For both peer groups, ROIC is the LTM 1Q15 average, shareholder returns are for FY14, and free cash flow and EPS growth is the 2013 - 15E (cons.) average. Data source is FactSet ; Delta ROIC & P/E reflect benefit of NOLs; P/E and P/FCF as of 3/31/15; Excludes Special Items 23.4% 20.1% Delta High Qual. Ind. Transports S&P Industrials ROIC 20 - 25% 10.1 18.5 17.2 Delta High Qual. Ind. Transports S&P Industrials Forward Price to Earnings 7.7 29.4 19.2 Delta High Qual. Ind. Transports S&P Industrials 14 Forward Price to Free Cash Flow 1.2% 1.6% 1.7% 4.5% 3.1% 3.1% Delta High Qual. Ind. Transports S&P Industrials Repo Yield Dividend Yield 5.7% 4.7% 4.8% Shareholder Returns

| 15 |
Non-GAAP Financial Measures
Delta sometimes uses information ("non-GAAP financial measures") that is derived from the Consolidated Financial Statements, but that is not presented in accordance with accounting principles generally accepted in the U.S. (“GAAP”). Under the U.S. Securities and Exchange Commission rules, non-GAAP financial measures may be considered in addition to results prepared in accordance with GAAP, but should not be considered a substitute for or superior to GAAP results. The tables below show reconciliations of non-GAAP financial measures used in this presentation to the most directly comparable GAAP financial measures.
Forward Looking Projections. Delta is unable to reconcile certain forward-looking projections to GAAP as the nature or amount of special items cannot be estimated at this time.
Pre-Tax Margin, adjusted for special items
Delta adjusts for the following items to determine pre-tax margin, adjusted for special items, for the reasons described below:
Mark-to-market ("MTM") adjustments and settlements. MTM adjustments are defined as fair value changes recorded in periods other than the settlement period. Such fair value changes are not necessarily indicative of the actual settlement value of the underlying hedge in the contract settlement period. Settlements represent cash received or paid on hedge contracts settling during the period. These items adjust fuel expense to show the economic impact of hedging, including cash received or paid on hedge contracts during the period. Adjusting for these items allows investors to better understand and analyze the company's core operational performance in the periods shown.
Restructuring and other. Because of the variability in restructuring and other, the adjustment for this item is helpful to investors to analyze the company’s recurring core operational performance in the periods shown.
Loss on extinguishment of debt. Because of the variability in loss on extinguishment of debt, the adjustment for this item is helpful to investors to analyze the company’s recurring core operational performance in the periods shown.
Virgin Atlantic MTM adjustments. We record our proportionate share of earnings from our equity investment in Virgin Atlantic in other expense. We adjust for Virgin Atlantic's MTM adjustments to allow investors to better understand and analyze the company’s financial performance in the period shown.
| Last Twelve | ||||||
| Months Ended | Full Year | |||||
| March 31, 2015 | 2012 | |||||
| Pre-tax margin | 4.7% | 2.8% | ||||
| Adjusted for: | ||||||
| MTM adjustments and settlements | 4.2% | (0.1)% | ||||
| Restructuring and other | 1.7% | 1.3% | ||||
| Loss on extinguishment of debt | 0.6% | 0.3% | ||||
| Virgin Atlantic MTM adjustments | 0.3% | - | ||||
| Pre-tax margin, adjusted | 11.5% | 4.3% | ||||
| 16 |
Net Income Per Diluted Share, adjusted for special items
Delta adjusts for MTM adjustments and settlements, restructuring and other, loss on extinguishment of debt and Virgin Atlantic MTM adjustments to determine net income per diluted share, adjusted for special items, for the reasons described above under the heading Pre-Tax Margin, adjusted for special items. Delta also adjusts for the following:
Income tax. Income tax is adjusted for the income tax effect of special items. We believe this adjustment allows investors to better understand and analyze the company’s core operational performance in the period shown.
Release of tax valuation allowance. Because of the uniqueness of the net gain related to the reversal of the tax valuation allowance at the end of 2013, the adjustment for this item allows investors to better understand and analyze the company's core operational performance in the period shown.
| Net Income | ||||||||||||
| Net Income | Per Diluted Share | |||||||||||
| Year Ended | Year Ended | Compound Annual | ||||||||||
| (in millions, except per share data) | December 31, 2014 | December 31, 2014 | Growth Rate | |||||||||
| GAAP | $ | 659 | $ | 0.78 | ||||||||
| Adjusted for: | ||||||||||||
| MTM adjustments and settlements | 2,346 | |||||||||||
| Restructuring and other | 716 | |||||||||||
| Loss on extinguishment of debt | 268 | |||||||||||
| Virgin Atlantic MTM adjustments | 134 | |||||||||||
| Income Tax | (1,290 | ) | ||||||||||
| Non-GAAP | $ | 2,833 | $ | 3.35 | 35% | |||||||
| Net Income | Per Diluted Share | |||||||||||
| Year Ended | Year Ended | |||||||||||
| (in millions, except per share data) | December 31, 2013 | December 31, 2013 | ||||||||||
| GAAP | $ | 10,540 | $ | 12.29 | ||||||||
| Adjusted for: | ||||||||||||
| MTM adjustments and settlements | (276 | ) | ||||||||||
| Restructuring and other | 424 | |||||||||||
| Release of tax valuation allowance | (7,989 | ) | ||||||||||
| Non-GAAP | $ | 2,699 | $ | 3.15 | 72% | |||||||
| Net Income | ||||||||
| Net Income | Per Diluted Share | |||||||
| Year Ended | Year Ended | |||||||
| (in millions, except per share data) | December 31, 2012 | December 31, 2012 | ||||||
| GAAP | $ | 1,009 | $ | 1.19 | ||||
| Adjusted for: | ||||||||
| MTM adjustments and settlements | (27 | ) | ||||||
| Restructuring and other | 452 | |||||||
| Loss on extinguishment of debt | 118 | |||||||
| Non-GAAP | $ | 1,552 | $ | 1.83 | ||||
| 17 |
Free Cash Flow
Delta presents free cash flow because management believes this metric is helpful to investors to evaluate the company's ability to generate cash that is available for use for debt service or general corporate initiatives. This metric is adjusted for hedge margin as we believe this adjustment removes the impact of current market volatility on our unsettled hedges and allows investors to better understand and analyze the company’s core operational performance in the period shown.
| Last Twelve Months Ended | ||||||||||||
| Full Year | March 31, | |||||||||||
| (in billions) | 2012 | 2014 | 2015 | |||||||||
| Net cash provided by operating activities | $ | 2.5 | $ | 4.4 | $ | 5.6 | ||||||
| Net cash used in investing activities | (2.0 | ) | (2.7 | ) | (2.7 | ) | ||||||
| Adjustments: | ||||||||||||
| Net purchases of short-term investments and other | – | – | 0.5 | |||||||||
| Hedge margin | – | – | 0.4 | |||||||||
| SkyMiles used pursuant to advance purchase under AMEX agreement and other | 0.3 | 0.3 | – | |||||||||
| Total free cash flow | $ | 0.8 | $ | 2.0 | $ | 3.8 | ||||||
ROIC
Delta presents return on invested capital as management believes this metric is helpful to investors in assessing the company’s ability to generate returns using its invested capital and as a measure against the industry. Return on invested capital is adjusted total operating income divided by average invested capital.
| Full Year | Last Twelve Months Ended March 31, | |||||||||||
| (in billions, except % of return) | 2012 | 2014 | 2015 | |||||||||
| Adjusted book value of equity | $ | 13.9 | $ | 16.1 | $ | 17.6 | ||||||
| Average adjusted net debt | 12.0 | 10.0 | 7.8 | |||||||||
| Average invested capital | $ | 25.9 | $ | 26.1 | $ | 25.4 | ||||||
| Adjusted total operating income | $ | 2.9 | $ | 4.27 | $ | 5.7 | ||||||
| Return on invested capital | 11.3% | 16.4% | 22.3% | |||||||||
| 18 |
Operating Margin, adjusted for special items
Delta adjusts for MTM adjustments and settlements and restructuring and other to determine operating margin, adjusted for special items, for the reasons described above under the heading Pre-Tax Margin, adjusted for special items. Delta also adjusts for the following:
Refinery Sales. Delta's refinery segment provides jet fuel to the airline segment from its own production and from jet fuel obtained through agreements with third parties. Activities of the refinery segment are primarily for the benefit of the airline. However, from time to time, the refinery sells fuel by-products to third parties. These sales are recorded gross within other revenue and other operating expense. We believe adjusting for refinery sales allows investors to better understand and analyze the company's core operational performance in the period shown.
| Full Year | Last Twelve Months Ended March 31, | |||||||||||
| 2012 | 2014 | 2015 | ||||||||||
| Operating margin | 5.9% | 9.9% | 7.3% | |||||||||
| Adjusted for: | ||||||||||||
| MTM adjustments and settlements | (0.1)% | (0.6)% | 4.2% | |||||||||
| Restructuring and other | 1.3% | 1.0% | 1.7% | |||||||||
| Refinery sales | – | – | 0.1% | |||||||||
| Operating margin, adjusted | 7.1% | 10.3% | 13.3% | |||||||||
Capital Expenditures, net
Delta presents net capital expenditures because management believes adjusting for these amounts provides a more meaningful financial measure for investors. This metric is adjusted for reimbursements related to build-to-suit leased facilities and other because management believes investors should be informed that these reimbursements for build-to-suit leased facilities effectively reduce net cash provided by operating activities and related capital expenditures. Delta also presents combined capital expenditures, net as if the company's merger with Northwest Airlines had occurred at the beginning of the period presented because management believes this metric is helpful to investors to evaluate the company's combined investing activities and provide a more meaningful comparison to our post-merger amounts.
| Year Ended | Year Ended | Year Ended | ||||||||||
| (in billions) | December 31, 2008 | December 31, 2013 | December 31, 2014 | |||||||||
| Property and equipment additions | $ | 1.5 | $ | 2.6 | $ | 2.2 | ||||||
| Reimbursements related to build-to-suit leased facilities and other | – | – | (0.1 | ) | ||||||||
| Investment in Virgin Atlantic | – | 0.3 | – | |||||||||
| Northwest capital expenditures | 1.1 | – | – | |||||||||
| Total combined capital expenditures, net | $ | 2.6 | $ | 2.9 | $ | 2.1 | ||||||
| 19 |
Operating Cash Flow, adjusted
Delta presents operating cash flow, adjusted because management believes adjusting for these amounts provides a more meaningful financial measure for investors. This metric is adjusted for hedge margin for the same reason described above under the heading Free Cash Flow. The 2008 metric includes the Northwest Airlines operating cash flow as if the company’s merger with Northwest Airlines had occurred at the beginning of the year because management believes this metric is helpful to investors to evaluate the company’s combined operating cash flows and provide a more meaningful comparison to our post-merger amounts.
| Year Ended | Year Ended | Year Ended | Year Ended | |||||||||||||
| (in billions) | December 31, 2008 | December 31, 2012 | December 31, 2013 | December 31, 2014 | ||||||||||||
| Net cash provided by operating activities (GAAP) | $ | (1.7 | ) | $ | 2.5 | $ | 4.5 | $ | 4.9 | |||||||
| Adjustments: | ||||||||||||||||
| Hedge margin | – | – | – | 0.9 | ||||||||||||
| SkyMiles used pursuant to advance purchase under AMEX agreement | – | 0.3 | 0.3 | – | ||||||||||||
| Northwest operating cash flow | 0.2 | – | – | – | ||||||||||||
| Operating cash flow, adjusted | $ | (1.5 | ) | $ | 2.8 | $ | 4.8 | $ | 5.8 | |||||||
Adjusted Net Debt
Delta uses adjusted total debt, including aircraft rent, in addition to long-term adjusted debt and capital leases, to present estimated financial obligations. Delta reduces adjusted debt by cash, cash equivalents and short-term investments, and hedge margin receivable, resulting in adjusted net debt, to present the amount of assets needed to satisfy the debt. Management believes this metric is helpful to investors in assessing the company’s overall debt profile. Management has reduced adjusted debt by the amount of hedge margin receivable, which reflects cash posted to counterparties, as we believe this removes the impact of current market volatility on our unsettled hedges and is a better representation of the continued progress we have made on our debt initiatives.
| (in billions) | December 31, 2009 | December 31, 2010 | December 31, 2011 | December 31, 2012 | December 31, 2013 | December 31, 2014 | ||||||||||||||||||||||||||||||
| Debt and capital lease obligations | $ | 17.2 | $ | 15.3 | $ | 13.8 | $ | 12.7 | $ | 11.3 | $ | 9.8 | ||||||||||||||||||||||||
| Plus: unamortized discount, net from purchase accounting and fresh start reporting | 1.1 | 0.6 | 0.6 | 0.5 | 0.4 | 0.1 | ||||||||||||||||||||||||||||||
| Adjusted debt and capital lease obligations | $ | 18.3 | $ | 15.9 | $ | 14.4 | $ | 13.2 | $ | 11.7 | $ | 9.9 | ||||||||||||||||||||||||
| Plus: 7x last twelve months' aircraft rent | 3.4 | 2.7 | 2.1 | 1.9 | 1.5 | 1.6 | ||||||||||||||||||||||||||||||
| Adjusted total debt | 21.7 | 18.6 | 16.5 | 15.1 | 13.2 | 11.5 | ||||||||||||||||||||||||||||||
| Less: cash, cash equivalents and short-term investments | (4.7 | ) | (3.6 | ) | (3.6 | ) | (3.4 | ) | (3.8 | ) | (3.3 | ) | ||||||||||||||||||||||||
| Less: hedge margin receivable | – | – | – | – | – | (0.9 | ) | |||||||||||||||||||||||||||||
| Adjusted net debt | $ | 17.0 | $ | 15.0 | $ | 12.9 | $ | 11.7 | $ | 9.4 | $ | 7.3 | ||||||||||||||||||||||||
| 20 |