Attached files
| file | filename |
|---|---|
| 8-K - FORM 8-K - Lumos Networks Corp. | d920376d8k.htm |
| EX-99.1 - EXHIBIT 99.1 - Lumos Networks Corp. | d920376dex991.htm |
| EX-10.1 - EXHIBIT 10.1 - Lumos Networks Corp. | d920376dex101.htm |
 Company Presentation
May 2015
Exhibit 99.2 |
 1
Special Note Regarding Forward-Looking Statements
Any statements contained in this presentation that are not statements of historical fact,
including statements about our beliefs and expectations, are forward-looking
statements and should be evaluated as such. The words “anticipates,” “believes,” “expects,” “intends,”
“plans,” “estimates,” “targets,” “projects,”
“should,” “may,” “will” and similar words and expressions are intended to identify forward-looking
statements. Such forward-looking statements reflect, among other things, our current
expectations, plans and strategies, and anticipated financial results, all of which are
subject to known and unknown risks, uncertainties and factors that may cause our actual results to differ
materially from those expressed or implied by these forward-looking statements. Many of
these risks are beyond our ability to control or predict. Because of these risks,
uncertainties and assumptions, you should not place undue reliance on these forward-looking statements.
Furthermore, forward-looking statements speak only as of the date they are made. We do not
undertake any obligation to update or review any forward-looking information,
whether as a result of new information, future events or otherwise. Important factors with respect to any
such forward-looking statements, including certain risks and uncertainties that could
cause actual results to differ from those contained in the forward-looking
statements, include, but are not limited to: rapid development and intense competition in the telecommunications and
high speed data transport industry; our ability to offset expected revenue declines in legacy
voice and access products related to the recent regulatory actions, wireless
substitution, technology changes and other factors; our ability to effectively allocate capital and implement our
“edge-out” expansion plans in a timely manner; our ability to complete customer
installations in a timely manner; adverse economic conditions; operating and financial
restrictions imposed by our senior credit facility; our cash and capital requirements; declining prices for
our services; our ability to maintain and enhance our network; the potential to experience a
high rate of customer turnover; federal and state regulatory fees, requirements and
developments; our reliance on certain suppliers and vendors; and other unforeseen difficulties that may
occur. These risks and uncertainties are not intended to represent a complete list of all
risks and uncertainties inherent in our business, and should be read in conjunction
with the more detailed cautionary statements and risk factors included in our SEC filings, including our Annual
Report filed on Form 10-K.
Use of Non-GAAP Financial Measures
Included in this presentation are certain non-GAAP financial measures that are not
determined in accordance with US generally accepted accounting principles. These
financial performance measures are not indicative of cash provided or used by operating activities and exclude
the effects of certain operating, capital and financing costs and may differ from comparable
information provided by other companies, and they should not be considered in
isolation, as an alternative to, or more meaningful than measures of financial performance determined in
accordance with US generally accepted accounting principles. These financial performance
measures are commonly used in the industry and are presented because Lumos Networks
Corp. believes they provide relevant and useful information to investors. The Company utilizes
these financial performance measures to assess its ability to meet future capital expenditure
and working capital requirements, to incur indebtedness if necessary, and to fund
continued growth. Lumos Networks Corp. also uses these financial performance measures to
evaluate the performance of its business, for budget planning purposes and as factors in its
employee compensation programs. |
 Advanced Fiber
Network Driving Value for Our Customers 2 |
 Lumos at a
Glance Attractive Fundamentals
2016 Data Revenue target of ~$116m, up 9% yoy
Total data contract value: ~$350mm with avg.
length: ~ 52 months. Target of $500mm by YE15
Targeted 15-20%+ ROI on fiber deals
4G LTE wireless deployments (FTTC)
On-net focus: 60% Data EBITDA margin target
Unique fiber assets in footprint
Enterprise growth of 6% expected in 2015
Favorable interest rate and tax environment
1
Current
¹
Market
Opportunity
²
FTTC Unique Sites
907
~7,400
On-Net Buildings
1,530
104,000
Total Connected
Data Centers
31
100+
7,955 Fiber Route Miles; 363,189 Total Fiber Miles
45+ Average Strand Count
3
Revenue Opportunities
Market Expansion Route
Fiber Network
Edge Out Markets
Internet Exchange Points
Data Centers
“Lit”
Markets
Norfolk
Washington DC
Chicago, IL
Columbus
Ashland
Bristol
Atlanta
Greensboro
Clarksburg
Lewisburg
Richmond
Charlottesville
Harrisonburg
Winchester
Ashburn
Hagerstown
Harrisburg
Altoona
Erie
Morgantown
Blacksburg
Pittsburgh
Cumberland
Culpeper
Waynesboro
Lynchburg
Danville
Bluefield
Huntington
Charleston
Covington
Parkersburg
Norfolk
As of 3/31/2015
Based on Lumos Networks’ internal research and analysis of data from research, surveys
and studies conducted by third parties, such as Tower Source (for FTTC sites), Equifax Telecom
and Stratsoft (for On-Net buildings) and public records databases (for data
centers). Market Opportunity denotes wireless cell sites within 3 miles and buildings within ½ mile of the
Lumos Networks fiber footprint and includes recently announced planned market expansion in
Richmond and Norfolk 2 |
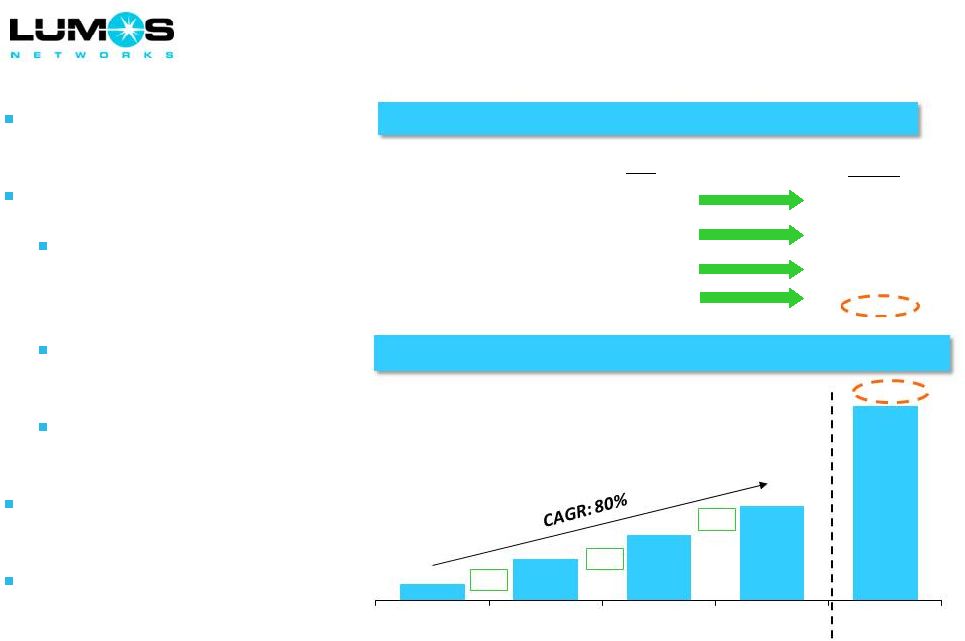
 Exponential
Growth in Bandwidth Demand Bandwidth Demand Drivers
U.S. Mobile IP Traffic
Source: Cisco Visual Networking Index 2015
U.S. Business IP Traffic
4
Proliferation of network-connected devices and
locations
2014 to 2019 tablets, smartphones, and
M2M traffic growth rates of 83%, 60%, and
103%, respectively
Rapid growth in rich media applications
Of the 24.3 exabytes per month crossing
the mobile network by 2019, 17.4 exabytes
will be due to video
Spectrum constraints require increased efficiency
to manage mobile data traffic
Adoption of network-centric computing services,
e.g. Cloud
Increased outsourcing of IT infrastructure
0.0 EB
0.5 EB
1.0 EB
1.5 EB
2.0 EB
2014
2015
2016
2017
2018
Web & Data
Video
0.0 EB
1.0 EB
2.0 EB
3.0 EB
4.0 EB
5.0 EB
2014
2015
2016
2017
2018
Web & Data
Video |
 Data Products
1
Goals highlighted herein are long-term in nature and are subject to various risks and
uncertainties, one or more of which could cause goals to be unattainable. You should not regard the inclusion
of a goal in this presentation as a representation by any personthat the results will be
achieved 5
Enterprise Data
(~40% of 1Q15 Data
Revenue)
Revenue grew 4% yoy and maintain target of 6% in 2015
Targeting renewal of $17.5 million of worth of Enterprise
contracts in 1H15, up almost 55% vs 1H14
Carrier End User: Sales grew 100%+ in ‘14 and ~70% growth tgt
in 2015. Long-term target of ~50% of total Enterprise sales
Transport
(~37% of 1Q15 Data
Revenue)
IP-based Ethernet Transport and wavelength potential
Solid pipeline of long-term (3-7 year) Wavelength/TDM deals
Significant reduction in DS1/DS3 exposure in last 2 years
FTTC
(~23% of 1Q15 Data
Revenue)
FTTC backhaul supports 4G LTE growth
Long-term target of ~$85 million in FTTC revenue
Signed contracts for 54%+ of total connections in long-term plan
Targeted FTTC incremental gross margin of 85%+
1
1
1 |
 6
Planned 665 Mile Fiber Network Expansion in Richmond and Norfolk
Underpinned by 257 unique FTTC site contract (269 total FTTC connections) with major wireless
carrier Vast majority of network expected to be completed by YE15 vs original target of
3Q16 Signed First Enterprise Customer in Norfolk in April 2015
($4,000 monthly recurring revenue) Significant
expansion of Richmond, VA network with the addition of Norfolk, Petersburg and Hampton Roads markets
Increases total Enterprise addressable market by ~$135 million, up ~60% vs. existing
markets Increases tower addressable market to 7,400 within 3 miles of footprint
|
 Dark Fiber
Product Officially Launched May 2015 Targeting a Growing Number of RFPs in our
Footprint: Macro Fiber to the Cell Backhaul
Small Cell Fronthaul
Large Enterprises: Healthcare, Education/Gov’t, Financial
Data Centers
Relatively limited Dark Fiber deployments in our footprint (by any fiber
provider), but activity should increase in 2015 and beyond
Lumos Dark Fiber Product has standardized Monthly Recurring Charge
(MRC) and Non-Recurring Charge (NRC) pricing
Lumos provides Dark Fiber cable and customer supplies equipment and
resources to manage the services
Lumos has $1m+ in annual Dark Fiber revenue, mostly derived from
Alleghany Energy assets purchased in 2009
7 |
 FTTC
Opportunities Accelerate Dramatic Growth in Mobile Data Traffic Driving Increased Backhaul
Bandwidth Requirements Compelling Tower-Like Economics
Scalable bandwidth capability drives margin expansion
Increased
tenants
per
unique
site
combined
with
higher
bandwidth
per
site
magnifies
leverage
Long-term contracts (ranging from 5 to 12 years)
Attractive return on investments
Devices
Use Case
Backhaul Technology
Voice / Text / Email /
Rich Media / Streaming Video
Moving to Carrier Ethernet
2015+
Voice / Text / Email
T1 / SONET
2004 -
2007
Voice / Text
T1
1999 -
2003
8 |
 9
Project Ark Underway: Premier FTTC Network in Footprint
New MEF-certified Carrier Ethernet MPLS/IP fiber network
Fully Redundant/Fast Re-route
A key selling point for a series of contract wins (total of 500+
FTTC sites) with a major US wireless carrier
Core network completed in Sept ’14 using Cisco routers
FTTC traffic already routed onto Ark
Expect 100% of FTTC traffic routed onto Ark by end of 3Q16
Cisco provides new testing tools, thousands of hours of
training, and 2 R&D centers
Ark planned to provide total bandwidth throughput up to ~1
Terabit (equivalent to 2,500 circuits at 400 Mbps each)
Allows for cost effective scalability for upgraded FTTC
connection target of 3,100 |
 10
Long-Term Fiber to the Cell Targets
FTTC Targets (as updated in Nov 2014)
Key Drivers of FTTC Upgrade
Expansion of 4G/LTE coverage and capacity in
Lumos’
footprint by multiple wireless carriers
Continued migration of copper, microwave and
SONET FTTC sites to Carrier Ethernet
Planned 665 route-mile market expansion,
underpinned by 257 FTTC unique tower contract
Pro forma tower addressable market increase to
7,400 (within 3 miles) from 5,400
Added 541 fiber route miles since YE13, including
key routes from Richmond-Charlottesville and
Richmond-Ashburn, VA
Increased RFP activity for small cell and dark fiber
FTTC contracts in our footprint
Expectation for increased tenants per site and
higher bandwidth per site over time
Revised
Prior
Annual
Revenue
¹
~$85 million
~$70 million
Gross
Margin
¹
~$72 million
~$60 million
Total
Unique
Towers
¹
1,875
1,500
Total
FTTC
Connections
²
3,100
2,250
Tenants
(Connections/Tower)
²
1.65
1.50
Monthly Revenue/Connection
²
~$2,300
~$2,600
Addressable
Market
²
7,400
5,400
Goals highlighted herein are long-term in nature and are subject to various risks and
uncertainties, one or more of which could cause goals to be unattainable. You should not
regard the inclusion of a goal in this presentation as a representation by any person that the results will be achieved
Represents management’s long-term estimates prepared using data from industry
publications and its market knowledge and experience. Management’s estimates
have not been verified by any independent source and are subject to various risks and uncertainties, which could cause actual results to materially
deviate from estimates. You should not regard the inclusion of an estimate in this
presentation as a representation by any person of future results 1
2 |
 1Q15
Long-Term
Estimate
¹
FTTC Unique Towers
907
1,875
Tenants/Unique Tower
~1.3-1.4
1.65x
Monthly Revenue/Connection
~$1,750
~$2,300
Monthly Revenue/Unique Tower
~$2,300
~7,400 towers within 3 miles of
Lumos Network fiber footprint
Early stages of 4G LTE rollout
Conversion from T-1,
microwave and SONET to
Carrier Ethernet
Significant new LTE site
builds/network densification
Continued FTTC share gains
expected
Carrier Ethernet more scalable
than SONET of other providers
FTTC operating leverage drives
margin expansion opportunity
Strong FTTC Growth Opportunity in Our Footprint
+250
+228
+274
Anticipated FTTC Trends
1,875
2
~$3,800
FTTC Opportunity
155
405
633
907
1Q12
1Q13
1Q14
1Q15
Long
Term Goal
11
-
1
2
Represents management’s long-term estimates prepared using data from industry
publications and its market knowledge and experience. Management’s estimates have
not been verified by any independent source and are subject to various risks and uncertainties, which could cause actual results to materially deviate from
estimates. You should not regard the inclusion of an estimate in this presentation as a
representation by any person of future results Goals highlighted herein are long-term in nature and are subject to various risks
and uncertainties, one or more of which could cause goals to be unattainable. You
should not regard the inclusion of a goal in this presentation as a representation by any
person that the results will be achieved |
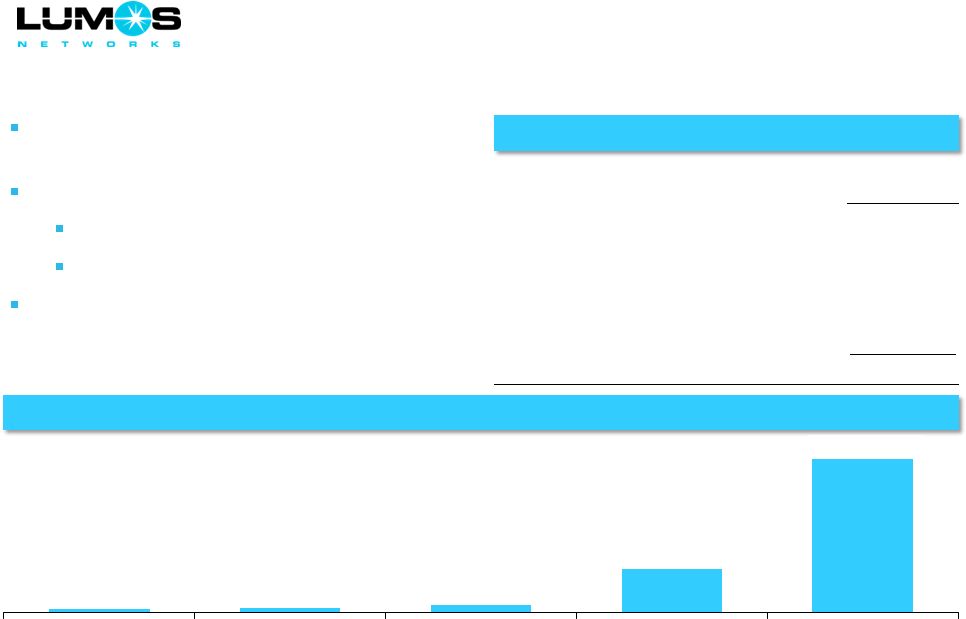
 FTTC as a
percentage of total Lumos fiber Data revenue 2012: ~8%
2013: ~14%
2014: ~19%
2015:
~25%
Annual FTTC Revenue
12
1
Goals highlighted herein are long-term in nature and are subject to various risks and
uncertainties, one or more of which could cause goals to be unattainable. You should not regard the
inclusion of a goal in this presentation as a representation by any person that the results
will be achieved FTTC Revenue Growth
($ in Millions)
Long-term goal of
$85 million
1
$6.8
$14.3
$19.9
$29.0
2012
2013
2014
2015E |
 Monthly
Recurring FTTC Revenue 13
Continued Shift in FTTC Revenue Towards 100% Ethernet
($ in Thousands)
TDM billing is 2.5% of total
FTTC in billing and in
backlog (signed deals)
$231
$125
$124
$105
$75
$1,296
$1,534
$1,638
$1,868
$2,033
$415
$716
$984
$922
$792
$1,942
$2,375
$2,745
$2,895
$2,900
$0
$1,000
$2,000
$3,000
$4,000
Jan-14
Sept-14
Oct-14
Dec-14
Mar-15
TDM Billings
Ethernet Billings
Total Backlog |
 Key Enterprise
Accounts 14 |
 100% fiber
fed portfolio of lit buildings (ALL success-based) Added 53 buildings in 1Q15, well
above avg of ~12 buildings/month since 1Q12 Increases on-net revenue and opens up
opportunity for additional FTTC builds Connected to 31 total data centers
1Q15 On-Net Building Growth Accelerated
On-Net Buildings
15
1,066
1,235
1,387
1,530
1Q12
1Q13
1Q14
1Q15 |
 Enterprise
Renewal Program Results Accelerating New Contract Amounts (MRC)
Total Contract Renewed
16
($ in Thousands)
Renewal program locks-in revenue on increasingly longer term deals, reducing churn
Target 1H15 total contract value renewed of $17.5 million up over 50% from 1H14
18% of Enterprise revenue renewed for an average of 38 months in
2014
Expecting total MRC of $725,000 to be renewed in 2015
($ in Thousands)
$619
$725
2014A
2015E
$11,500
$17,500
1H 2014
1H 2015E |
 Existing
Richmond and Western PA Edge-Out Strategy 17
Richmond, VA
Western PA
110-mile 100G enabled fiber network, which will
expand significantly post completion of
announced market expansion
Anchor Enterprise and Carrier customers signed
Significant data center opportunities, recently
connected Peak 10 and QTS
~$4.8 million in annualized Enterprise and
Transport sales bookings
Pivot point for critical long-haul routes between
Ashburn, VA and Charlottesville, VA
Pittsburgh NOC /sales office opened in 2014
Washington PA PoP opened, with Tier 1 data
center services and adding customer redundancy
Expansion
of
fiber
assets
in
Western
PA
–
leverage
existing fiber by adding on / off ramps
Offer diverse routes in and out of Pittsburgh, PA
Completed key routes from Pittsburgh, PA to
Harrisburg, PA and Ashburn, VA
Requires increased Metro investment to extract full
market potential
Announced 665-mile market build will expand Richmond footprint and add Norfolk
as the 24
Lumos market and a key edge-out market
Contiguous market expansion to pursue new FTTC, Data Center, Transport and Enterprise targets
Leveraging existing customer base and assets with experienced in-market teams
th |
 Leverage
Lumos Networks’ 7,955 mile fiber footprint to target incremental Enterprise
customers with thousands of sales people from leading national service providers
Over 60+ MSAs signed or pending with major U.S. operators, MSOs and fiber companies
operating in our footprint
Pro forma “near-net”
list buildings within ½
mile of our footprint of 104,000 (67,000 pre-
expansion), including planned 665 fiber route-mile build in the Norfolk, Richmond,
Petersburg and Hampton Roads, VA metro markets
18
Carrier End User: Growth Momentum Continues
Strong Growth in 2014 and a Solid Pipeline in Place for 2015
2013: $77,000
2014: $294,000
2015 (target): ~$500,000
Carrier End User Sales Grew Over 100% in 2014
New Distribution Channel for Enterprise Data |
 19
31 total data center connections as of 1Q15
Includes: commercial, private and Lumos operated data centers
Key data center relationships: Peak 10, Iron Mountain, QTS, DC Corp, Alpha
Technologies Increasingly, Enterprise traffic moving to data centers with customers
requesting secure, fiber bandwidth access to those locations
~100+ data center market opportunity within existing footprint
Lumos is under-penetrated in data center connections relative to fiber peers. Data
center connections represent significant fiber bandwidth revenue upside
Data Center Fiber Connection Strategy
31 Total Data Center Connections |
 Key Virginia
100G Long-Haul Fiber Routes 20
Charlottesville, VA to Richmond, VA
Richmond, VA to Ashburn, VA
Completed in June 2014
53 Mile 100G DWDM all-IP Long-Haul Fiber
Route
Reduces Significant Type 2 Leased Access
Costs
Expanded Fiber Breadth to Reach
Incremental Data Centers, Enterprises and
FTTC Opportunities
Lit for Commercial use in January 2015
Creates Fully-Redundant all-IP 100G Route
Between all 3 Virginia Cities
Straight-Shot Fiber Access into Ashburn, the
“Data Center Capital of the World”
Critical Element in Creating the Densest
Fiber Network in the Mid-Atlantic
Richmond, VA to Norfolk, VA
150 Mile Fiber Route-Mile Build Planned
with Announced Market Expansion |
 Selected
Financial Highlights Data Revenue
Data as a % of Total Revenue
Data
Gross
Margin
1
Overall
Adjusted
EBITDA
Margin
2
($ in Millions)
21
$26.1
$26.7
$26.5
$27.3
$27.8
1Q14
2Q14
3Q14
4Q14
1Q15
52.2%
53.2%
52.4%
53.9%
55.0%
1Q14
2Q14
3Q14
4Q14
1Q15
84.0%
85.3%
85.1%
85.5%
86.9%
1Q14
2Q14
3Q14
4Q14
1Q15
45.3%
44.9%
43.2%
44.6%
45.5%
2Q14
3Q14
4Q14
1Q15
2015 Target
Defined as operating revenues less network access costs divided by operating revenues for Data
segment Defined as Adjusted EBITDA divided by operating revenues on a consolidated
basis, excluding the impact of one time cutrailment gain on benefit plans in Q314 and Q414
1
2 |
 Liquidity and
Debt Maturities Debt refinancing completed in April 2013; closed
new Term Loan C in January 2015 for $28 million
Liquidity to support growth capital requirements
~$42 million in cash
$50 million undrawn revolver capacity
As of March 2015, the $0.14 quarterly dividend
suspended in favor of FTTC and network
expansion opportunities with an annual impact of
$12-$13 million
Debt Maturity Profile
Capitalization
($ in Millions)
Note: Excludes capital leases
22
($ in Millions)
As of
3/31/2015
Cash and Marketable Securities
$42.1
Revolving Credit Facility ($50MM)
$0.0
Term Loan A
96.3
Term Loan B
270.2
Term Loan C
28.0
Capital Leases
5.0
Total Debt
$399.4
$6
$8
$13
$81
$287
2015
2016
2017
2018
2019 |
 1Q15
Snapshot 1Q15 Balance Sheet & Valuation
1Q15 Metrics
Data revenue up 6%+ yoy and comprises
55% of total revenue
FTTC and Enterprise revenue grew 35%
and 4% yoy, respectively
Completed installation of 49
FTTC sites
and 83 total FTTC Connections
Maintained 75% ratio for success-
based/growth capital projects
Connected 53
on-net buildings
Added 133
miles of fiber route miles
Key 1Q15 Accomplishments
1
Based on closing share price of $15.46 as of 4/28/2015 and 22,747,205 shares outstanding as of
3/31/2015 23
($ in Millions)
Cash and Marketable Securities
$42.1
Total Long-Term Debt
$399.4
Net Long-Term Debt
$357.3
Market Capitalization¹
$351.7
Enterprise Value
$709.0
($ in Millions)
3Q14
4Q14
1Q15
Revenue
$50.5
$50.7
$50.5
Adjusted EBITDA
$32.9
$22.4
$22.5
% Margin
65.1%
44.3%
44.6%
Capital Expenditures
$26.9
$19.9
$29.2
% of Revenue
53.2%
39.4%
57.9% |
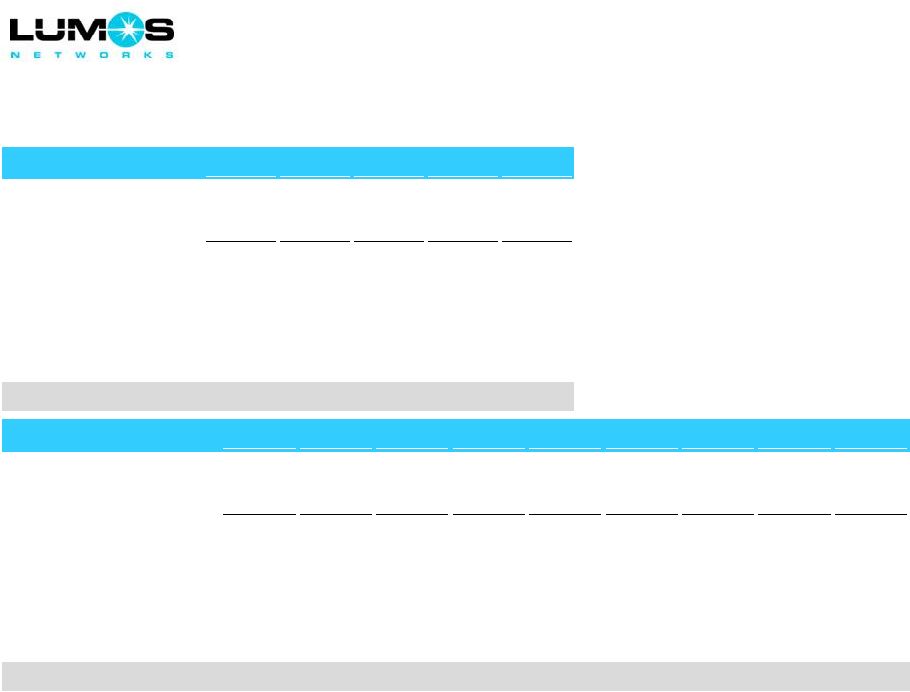
 Historical
Financial Metrics by Segment 24
($ in Thousands)
FYE 2012
FYE 2013
FYE 2014
FYE 2015
% of 1Q15
1Q12
2Q12
3Q12
4Q12
1Q13
2Q13
3Q13
4Q13
1Q14
2Q14
3Q14
4Q14
1Q15
Total
Revenue
Data
$21,322
$21,883
$22,664
$24,424
$25,369
$25,706
$26,094
$26,943
$26,137
$26,707
$26,488
$27,310
$27,767
55.0%
Residential and Small Business
24,004
23,379
23,173
21,905
21,057
20,453
20,055
19,094
18,647
18,290
17,668
17,423
17,265
34.2%
RLEC Access
6,086
5,541
6,140
6,350
6,108
6,152
5,478
4,966
5,306
5,168
6,360
5,952
5,463
10.8%
Total Revenue
$51,412
$50,803
$51,977
$52,679
$52,534
$52,311
$51,627
$51,003
$50,090
$50,165
$50,516
$50,685
$50,495
100.0%
% Sequential Growth
(1.2%)
2.3%
1.4%
(0.3%)
(0.4%)
(1.3%)
(1.2%)
(1.8%)
0.1%
0.7%
1.0%
(0.4%)
% YoY Growth by Segment
Data
19.0%
17.5%
15.1%
10.3%
3.0%
3.9%
1.5%
1.4%
6.2%
Residential and Small Business
(12.3%)
(12.5%)
(13.5%)
(12.8%)
(11.4%)
(10.6%)
(11.9%)
(8.8%)
(7.4%)
RLEC Access
0.4%
11.0%
(10.8%)
(21.8%)
(13.1%)
(16.0%)
16.1%
19.9%
3.0%
Gross Profit
Data
$17,724
$18,080
$18,818
$20,488
$21,338
$21,827
$22,206
$22,940
$21,963
$22,788
$22,551
$23,350
$24,122
59.1%
Residential and Small Business
15,838
15,005
15,490
14,466
13,934
13,831
13,601
12,677
12,107
12,019
11,355
11,670
11,198
27.5%
RLEC Access
6,086
5,541
6,140
6,350
6,108
6,152
5,478
4,966
5,306
5,168
6,360
5,952
5,463
13.4%
Total Gross Profit
$39,648
$38,626
$40,448
$41,304
$41,380
$41,810
$41,285
$40,583
$39,376
$39,975
$40,266
$40,972
$40,783
100.0%
Adjusted EBITDA
Data
$11,171
$11,350
$11,620
$12,822
$13,124
$13,355
$13,012
$14,011
$12,717
$13,395
$12,984
$12,629
$12,367
54.9%
Residential and Small Business
6,735
5,944
6,208
5,639
6,697
6,356
5,691
5,917
5,544
5,230
4,503
4,623
5,627
25.0%
RLEC Access
4,385
3,812
4,453
4,750
4,874
4,840
4,343
4,104
4,306
4,098
5,214
4,621
4,517
20.1%
Adjusted EBITDA, Before Curtailment Gain
$22,291
$21,106
$22,281
$23,211
$24,695
$24,551
$23,046
$24,032
$22,567
$22,723
$22,701
$21,873
$22,511
100.0%
Curtailment Gain
0
0
0
0
0
0
0
0
0
0
10,207
567
0
Total Adjusted EBITDA
$22,291
$21,106
$22,281
$23,211
$24,695
$24,551
$23,046
$24,032
$22,567
$22,723
$32,908
$22,440
$22,511
% Sequential Growth, Normalized
(5.3%)
5.6%
4.2%
6.4%
(0.6%)
(6.1%)
4.3%
(6.1%)
0.7%
(0.1%)
(3.6%)
2.9%
% Margin, Normalized
43.4%
41.5%
42.9%
44.1%
47.0%
46.9%
44.6%
47.1%
45.1%
45.3%
44.9%
43.2%
44.6%
1
1
2
3
1
Defined as operating revenues less network access costs
2
Defined as net income attributable to Lumos Networks before interest, income taxes,
depreciation and amortization, accretion of asset retirement obligations, net income or
loss attributable to noncontrolling interests, other income or expenses, equity-based
compensation charges, acquisition-related charges, amortization of actuarial losses on
retirement plans, employee separation charges, restructuring-related charges, gain or loss
on settlements and gain or loss on interest rate swap derivatives. See note from the
Company on “Use of Non-GAAP Measures” on Slide 1 3
The Company recorded a $10.8 million curtailment gain in the second half of 2014 related to
the elimination of certain medical benefits under the postretirement plan, which was
not allocated to the operating segments |
 Financial
Guidance 1
Guidance as of date of 1Q15 earnings release dated May 5, 2015
2
Normalized Adjusted EBITDA excludes the impact of a $10.8 million curtailment gain for the
elimination of other postretirement plan medical benefits recognized in the second
half of 2014 2014
1Q15
FY 2015
($ in Millions)
Actual
Actual
Guidance¹
Revenue
Data
$106.6
$27.8
~$116
% of Total
52.9%
55.0%
~57%
Residential & Small Business
$72.0
$17.3
~63
% of Total
35.8%
34.2%
~36%
Access
$22.8
$5.5
~$23
% of Total
11.3%
10.8%
~11%
Total
$201.5
$50.5
~$202
Adjusted
EBITDA,
Normalized
²
$89.9
$22.5
~$92
% Margin
44.6%
44.6%
~46%
Total Capex
$84.1
$29.2
~$112
% Success-Based/Growth Capex
75%
85%
75%
25 |
 Reconciliation
of Net Income Attributable to Lumos Networks Corp. to Operating Income
26
($ in Millions)
3/31/2013
6/30/2013
9/30/2013
12/31/2013
3/31/2014
6/30/2014
9/30/2014
12/31/2014
3/31/2015
Net Income Attributable to Lumos
Networks Corp.
$6.4
$4.8
$2.5
$4.1
$4.1
$3.8
$10.2
$3.4
$2.7
Net Income Attributable to
Noncontrolling Interests
0.1
0.0
0.0
-
0.0
0.0
0.0
0.1
0.0
Net Income
6.5
4.8
2.6
4.1
4.1
3.9
10.2
3.5
2.8
Interest Expense
3.1
3.4
3.8
3.8
4.0
3.8
4.0
3.8
3.5
Loss (Gain) on Interest Rate Derivatives
(0.2)
(0.3)
0.6
0.0
(0.1)
0.0
(0.3)
(0.1)
(0.1)
Income Tax Expense
4.3
3.2
1.5
3.0
3.0
2.7
6.7
2.0
2.0
Other (Income) Expense, net
(0.0)
0.9
(0.1)
0.8
(0.2)
(0.2)
(0.2)
(0.1)
0.2
Operating Income
$13.7
$12.1
$8.3
$11.7
$10.8
$10.2
$20.4
$9.1
$8.4
($ in Millions)
FY2010
FY2011
FY2012
FY2013
FY2014
Net Income (Loss) Attributable to Lumos
Networks Corp.
$20.8
($43.9)
$16.3
$17.8
$21.5
Net Income Attributable to
Noncontrolling Interests
0.1
0.1
0.1
0.1
0.1
Net Income (Loss)
20.9
(43.9)
16.4
17.9
21.6
Interest Expense
5.8
12.0
11.9
14.2
15.6
Loss (Gain) on Interest Rate Derivatives
-
-
1.9
0.1
(0.5)
Income Tax Expense (Benefit)
14.5
(4.4)
11.0
12.0
14.4
Other (Income) Expense, net
(0.0)
(0.1)
(0.1)
1.6
(0.7)
Operating Income (Loss)
$41.1
($36.4)
$41.2
$45.8
$50.5 |
 Adjusted EBITDA
Reconciliation 27
1
Guidance as of date of 1Q15 earnings release dated May 5, 2015
($ in Millions)
Year Ended
FY2010
FY2011
FY2012
FY2013
FY2014
FY2015
¹
Operating Income (Loss)
$41.1
($36.4)
$41.2
$45.8
$50.5
~$32
Depreciation and Amortization
31.4
43.2
39.0
42.4
45.3
~53
Equity Based Compensation
1.5
2.4
3.9
6.8
4.3
~6
Asset Impairment Charge
-
86.3
-
-
-
-
Amortization of Actuarial Losses
-
-
1.8
1.2
0.2
~1
Business Separation Charges
-
1.4
-
-
-
-
Acquisition Related Charges
3.0
0.1
-
-
-
-
Employee Separation Charges
-
-
2.3
-
0.2
-
Restructuring Charges
-
-
3.0
0.1
-
-
Gain on Settlements, net
-
-
(2.3)
-
-
-
Adjusted EBITDA
$77.1
$96.9
$88.9
$96.3
$100.6
~$92
($ in Millions)
3/31/2013
6/30/2013
9/30/2013
12/31/2013
3/31/2014
6/30/2014
9/30/2014
12/31/2014
3/31/2015
Operating Income
$13.7
$12.1
$8.3
$11.7
$10.8
$10.2
$20.4
$9.1
$8.4
Depreciation and Amortization
9.6
10.8
11.2
10.8
10.7
11.2
11.3
12.1
11.9
Equity Based Compensation
1.0
1.3
3.2
1.2
0.8
1.2
1.1
1.2
1.2
Amortization of Actuarial Losses
0.3
0.3
0.3
0.3
0.1
0.1
0.1
0.1
0.3
Employee Separation Charges
-
-
-
-
0.2
0.0
-
-
-
Restructuring Charges
0.0
-
0.0
-
-
-
-
-
0.6
Adjusted EBITDA
$24.7
$24.6
$23.0
$24.0
$22.6
$22.7
$32.9
$22.4
$22.5 |