Attached files
| file | filename |
|---|---|
| EX-32.2 - EX-32.2 - Lumos Networks Corp. | lmos-20161231xex32_2.htm |
| EX-32.1 - EX-32.1 - Lumos Networks Corp. | lmos-20161231xex32_1.htm |
| EX-31.2 - EX-31.2 - Lumos Networks Corp. | lmos-20161231xex31_2.htm |
| EX-31.1 - EX-31.1 - Lumos Networks Corp. | lmos-20161231xex31_1.htm |
| EX-23.1 - EX-23.1 - Lumos Networks Corp. | lmos-20161231xex23_1.htm |
| EX-21.1 - EX-21.1 - Lumos Networks Corp. | lmos-20161231xex21_1.htm |
UNITED STATES
SECURITIES AND EXCHANGE COMMISSION
Washington, D.C. 20549
|
FORM 10‑K
|
(Mark One)
☒ANNUAL REPORT PURSUANT TO SECTION 13 OR 15(d) OF THE SECURITIES EXCHANGE ACT OF 1934
For the fiscal year ended December 31, 2016
or
☐TRANSITION REPORT PURSUANT TO SECTION 13 OR 15(d) OF THE SECURITIES EXCHANGE ACT OF 1934
For the transition period from _________________ to ____________________.
Commission File Number: 000-35180
|
Lumos Networks Corp. (Exact name of registrant as specified in its charter)
|
|
Delaware (State or other jurisdiction of incorporation or organization) |
80-0697274 (I.R.S. Employer Identification No.) |
|
|
|
|
One Lumos Plaza, Waynesboro, Virginia 22980 (Address of principal executive offices) (Zip Code) |
|
|
|
|
|
(540) 946-2000 (Registrant’s telephone number, including area code) |
|
Securities registered pursuant to Section 12(b) of the Act:
|
Title of each class |
Name of each exchange on which registered |
|
Common stock, $0.01 par value |
The NASDAQ Stock Market LLC |
|
|
|
Securities registered pursuant to Section 12(g) of the Act: None |
Indicate by check mark if the registrant is a well-known seasoned issuer, as defined in Rule 405 of the Securities Act.
☐ Yes ☒ No
Indicate by check mark if the registrant is not required to file reports pursuant to Section 13 or Section 15(d) of the Act.
☐ Yes ☒ No
Indicate by check mark whether the registrant (1) has filed all reports required to be filed by Section 13 or 15(d) of the Securities Exchange Act of 1934 during the preceding 12 months (or for such shorter period that the registrant was required to file such reports), and (2) has been subject to such filing requirements for the past 90 days. ☒ Yes ☐ No
Indicate by check mark whether the registrant has submitted electronically and posted on its corporate Web site, if any, every Interactive Data File required to be submitted and posted pursuant to Rule 405 of Regulation S-T (§ 232.405 of this chapter) during the preceding 12 months (or for such shorter period that the registrant was required to submit and post such files). ☒ Yes ☐ No
Indicate by check mark if disclosure of delinquent filers pursuant to Item 405 of Regulation S-K (§ 229.405 of this chapter) is not contained herein, and will not be contained, to the best of registrant’s knowledge, in definitive proxy or information statements incorporated by reference in Part III of this Form 10‑K or any amendment to this Form 10‑K. ☒
Indicate by check mark whether the registrant is a large accelerated filer, an accelerated filer, a non-accelerated filer or a smaller reporting company. See definitions of “large accelerated filer”, “accelerated filer” and “smaller reporting company” in Rule 12b-2 of the Exchange Act. (Check one):
|
Large accelerated filer ☐ |
Accelerated filer ☒ |
Non-accelerated filer ☐ |
Smaller reporting company ☐ |
(Do not check if a smaller reporting company)
Indicate by check mark whether the registrant is a shell company (as defined in Rule 12b-2 of the Act). ☐ Yes ☒ No
As of June 30, 2016, the aggregate market value of the Registrant’s common stock was $275,916,131.
There were 23,925,910 shares of the registrant’s common stock outstanding as of the close of business on March 15, 2017.
|
DOCUMENTS INCORPORATED BY REFERENCE |
|
|
Document |
Incorporated Into |
|
Proxy Statement for the 2017 Annual Meeting of Stockholders |
Part III |
LUMOS NETWORKS CORP.
2016 ANNUAL REPORT ON FORM 10-K
TABLE OF CONTENTS
|
|
Page |
|
|
Item 1. |
2 |
|
|
Item 1A. |
10 |
|
|
Item 1B. |
20 |
|
|
Item 2. |
20 |
|
|
Item 3. |
20 |
|
|
Item 4. |
20 |
|
|
|
||
|
Item 5. |
21 |
|
|
Item 6. |
24 |
|
|
Item 7. |
Management’s Discussion and Analysis of Financial Condition and Results of Operations |
26 |
|
Item 7A. |
45 |
|
|
Item 8. |
46 |
|
|
Item 9. |
Changes in and Disagreements with Accountants on Accounting and Financial Disclosure |
79 |
|
Item 9A. |
79 |
|
|
Item 9B. |
82 |
|
|
|
||
|
Item 10. |
82 |
|
|
Item 11. |
82 |
|
|
Item 12. |
Security Ownership of Certain Beneficial Owners and Management and Related Stockholder Matters |
82 |
|
Item 13. |
Certain Relationships and Related Transactions, and Director Independence |
82 |
|
Item 14. |
82 |
|
|
|
||
|
Item 15. |
83 |
|
|
|
||
1
Part I
FORWARD-LOOKING STATEMENTS
Any statements contained in this report that are not statements of historical fact, including statements about our beliefs and expectations, are forward-looking statements and should be evaluated as such. The words “anticipates,” “believes,” “expects,” “intends,” “plans,” “estimates,” “targets,” “projects,” “should,” “may,” “will” and similar words and expressions are intended to identify forward-looking statements. These forward-looking statements are contained throughout this report, for example in “Business,” “Risk Factors,” and “Management’s Discussion and Analysis of Financial Condition and Results of Operations.” Such forward-looking statements reflect, among other things, our current expectations, plans and strategies, and anticipated financial results, all of which are subject to known and unknown risks, uncertainties and factors that may cause our actual results to differ materially from those expressed or implied by these forward-looking statements. Many of these risks are beyond our ability to control or predict. All forward-looking statements attributable to us or persons acting on our behalf are expressly qualified in their entirety by the cautionary statements contained throughout this report. Because of these risks, uncertainties and assumptions, you should not place undue reliance on these forward-looking statements. These risks and other factors include those listed under “Risk Factors” and elsewhere in this report. Furthermore, forward-looking statements speak only as of the date they are made. We do not undertake any obligation to update or review any forward-looking information, whether as a result of new information, future events or otherwise.
Lumos Networks Corp. Overview
Lumos Networks Corp. (“Lumos Networks,” the “Company,” “we,” “us” or “our”) is a fiber-based bandwidth infrastructure and service provider in the Mid-Atlantic region. We provide services to carriers and enterprise customers, including healthcare providers, local government agencies, financial institutions, educational institutions and other enterprises over our approximately 10,100 route-mile fiber network. Our principal products and services include Multiprotocol Label Switching (“MPLS”) based Ethernet, Metro Ethernet (“Metro E”), Fiber to the Cell site (“FTTC”) wireless backhaul and data transport services, wavelength transport services and IP services.
On February 18, 2017, we entered into a definitive agreement (“Merger Agreement”) by and among the Company, MTN Infrastructure TopCo, Inc. (“Parent”) and MTN Infrastructure BidCo, Inc. (“Merger Sub”), pursuant to which we will be acquired by EQT Infrastructure investment strategy (“EQT Infrastructure”), subject to shareholder approval, regulatory approval and other customary closing conditions. Pursuant to the Merger Agreement, each outstanding share of common stock of the Company prior to the effective time of the Merger shall be automatically converted into the right to receive $18.00 in cash. See Part II, Item 7. Managements’ Discussion and Analysis of Financial Condition and Results of Operations of this Annual Report on Form 10-K for more information.
We became an independent, publicly traded company on October 31, 2011, as a result of our spin-off from NTELOS Holdings Corp. (“NTELOS”). Our common stock has been publicly traded on The NASDAQ Stock Market LLC (“NASDAQ”) under the ticker symbol “LMOS” since November 1, 2011. We conduct all of our business through our wholly-owned subsidiary Lumos Networks Operating Company and its subsidiaries. Our principal executive offices are located at One Lumos Plaza, Waynesboro, Virginia 22980. The telephone number at that address is (540) 946-2000.
Business Strategy
Our overall strategy is to transition into a pure-play fiber bandwidth infrastructure company through pursuit of expansion opportunities, both organic and inorganic. To achieve organic growth, our objective is to leverage and expand our fiber assets to capture the growing demand for data and mobility services among our carrier and enterprise customers in our marketplace. Our operating strategy is to (i) monetize our approximately 10,100 route-mile fiber optic network by selling bandwidth infrastructure services to new and existing carriers and enterprise customers while maintaining our ratio of data revenue from on-net traffic at or above 80%; (ii) use our “expansion” and "edge-out” strategies to enter into new markets and extend into markets adjacent to our existing footprint to increase our addressable market size; (iii) leverage our growing fiber network to expand to new fiber to the cell opportunities under long term contracts; (iv) proactively manage our churn through several initiatives including upgrading existing customers from legacy technologies to carrier Ethernet services and continually improving network and operational performance; (v) focus on managing resources from the declining legacy voice products into our faster growing and more profitable data products; and (vi) execute our success-based investment strategy in both organic and inorganic opportunities to grow our data business while maintaining our capital efficiency and expanding margins.
Our data segment, which provided approximately 60% of our total revenue in 2016, represents the main growth opportunity and is the key focal point of our strategy and includes our enterprise data, transport and FTTC product groups. A significant majority of our capital expenditures and sales force are dedicated to increasing revenue and profit from our data segment. Our data product lines are growing at a pace that significantly exceeds the decline in our legacy product lines, and in the aggregate, due to our focus on on-net
2
customers, they also provide a higher gross margin. We believe that a balanced split between enterprise and carrier revenue results in the most effective capital allocation and resulting profitability. We are focused on taking advantage of increased carrier bandwidth demand, particularly for long-term FTTC contracts from wireless carriers that are deploying long-term evolution (“LTE”) data services, selling into our expansion and edge-out markets, maximizing the use of our carrier end user distribution channel, providing connection to data centers for our enterprise customers and improving penetration in existing markets.
Our residential and small business (“R&SB”) and RLEC access segments provided approximately 30% and 10% of our total revenue in 2016, respectively. Our R&SB segment includes legacy voice and IP services products targeted to our residential and small business customers. Our RLEC access segment provides other carriers access to our network within our RLEC territories, primarily through switched access services. These segments require limited incremental capital to maintain the underlying assets and deliver reasonably predictable cash flows. Despite declining revenues as a result of regulatory actions taken to reduce intra-state tariffs, access line loss resulting from residential wireless substitution, technology changes and product replacement of voice service offerings from cable operators in our markets, we expect the cash flows from these legacy businesses to continue to significantly contribute to funding the capital investment in our growing data segment.
The key imperatives for our data growth initiatives are as follows:
Enhance Carrier Ethernet Network and Grow FTTC Revenues
As demand for FTTC services, greater data transport bandwidth and guaranteed network stability continues, there is an increasing demand to provide carrier Ethernet networks to our wireless carrier customers and select large data transport customers. In 2014, we completed the core construction of an approximately 850-mile carrier network within our existing fiber network to provide FTTC solutions to multiple large wireless communication providers and select large enterprise customers who operate in our markets and connected the first FTTC sites to this carrier network. The majority of our existing FTTC traffic has now been migrated to this dedicated network. Additionally, since its construction, new traffic has been and will continue to be added directly to this network, including new cell towers installed in our expansion markets of Richmond, VA and Norfolk, VA. We intend to significantly increase FTTC connectivity to cell sites in close proximity to our fiber network over the next several years to capitalize on the growth opportunity in our expanding footprint. In addition to our initiatives centered on enhancing our network and improving operational performance, we will continue to deliberately and proactively manage our carrier customers with legacy services to our Ethernet-based services with the intent of limiting churn and improving the customer experience.
Enhance Legacy Enterprise Networks and Grow Enterprise Revenues
As demand for greater data bandwidth and guaranteed network stability continues to grow within enterprise services, we continue to invest capital in expanding and enhancing our enterprise networks to accommodate our customer needs. Growing our enterprise revenues using a success-based expansion approach is critical to ensuring the desired returns on invested capital are met. As of December 31, 2016, our 10,100 route-mile fiber network was connected to approximately 2,031 buildings. We believe there is significant prospect to compete for opportunities to connect to additional buildings and data centers in close proximity to our existing fiber network. Our primary sales channels are enterprise-direct and carrier end user. Our carrier end user channel facilitates the sale of enterprise data services for national carrier customers that are within our footprint. Through use of this sales channel we are able to leverage our existing fiber infrastructure to grow revenue and reduce the likelihood of being overbuilt within our markets. In addition to our initiatives centered on enhancing our network and improving operational performance, we will continue to deliberately and proactively manage our enterprise customers with legacy services to our Ethernet-based services, and appropriately incent our sales force to focus on renewal of long-term contracts with the intent of reducing churn and improving the customer experience.
Monetize our Expansion Markets and Edge-Out into Key Markets Adjacent to Our Existing Network Footprint
Driven by demand from existing enterprise and carrier customers, our expansion strategy grows our fiber network into new contiguous markets by leveraging existing and new assets. In 2016, we added 1,505 route miles of new fiber to our network, which includes the remaining portion of our recently completed 822 route mile expansion in the Richmond and Norfolk area. This expansion was underpinned by a long-term FTTC contract with a national U.S. wireless carrier, which connected a total of approximately 257 new cell sites to our fiber network, most of which were added in early 2016. We intend to continue to monetize this expansion by selling bandwidth infrastructure services to new and existing carrier and enterprise customers in the Richmond and Norfolk markets. As we expand into these new markets we are significantly increasing our addressable market size, thus allowing us to bring new FTTC carrier customers and enterprise customers onto our fiber networks. Our edge-out strategy, which focuses on incrementally adding network assets and new customers in markets in close proximity to our existing footprint, is complementary to our expansion strategy in Richmond, VA and Norfolk, VA.
Drive Incremental On-Net Data Traffic
Our on-net strategy focuses on driving traffic through our network, thereby increasing profitability. As our network footprint grows and the bandwidth demand increases, we are able to drive incremental revenue through our existing network with minimal increase in operating expenses or incremental capital expenditures. We evaluate this on-net approach and the associated capital expenditure
3
against the revenue opportunity and have determined that maintaining approximately 80% of our data revenue from on-net traffic is the most effective use of capital.
Use Disciplined, Success-Based Capital Investment Strategy
We seek to maximize our capital expenditure efficiency by requiring that a significant percentage of our capital investment be tied to specific revenue generating products based on customer commitments, which we refer to as “success-based projects”. Our success-based capital investment strategy involves maximizing capital expenditure efficiency by pursuing on-net and near-net customer opportunities and maintaining a balanced mix of carrier (including FTTC) and enterprise business. Our capital investment strategy targets a greater than 15% return on investment and a less than four year payback, along with other strategic considerations.
Additionally, through the pursuit of inorganic growth opportunities, which would be accretive to our overall financial results and serve to accelerate our transition to a pure-play fiber bandwidth infrastructure, we seek to maximize capital efficiency.
Business Segments
We have three reportable business segments, as follows:
Data
Our data segment includes our enterprise data, transport and FTTC product groups. We market and sell these services primarily to carriers and enterprise customers, including healthcare providers, state and local government agencies, financial institutions, educational institutions and other enterprises. Revenues from our data segment accounted for 59.7%, 56.0% and 52.9% of our total revenue for the years ended December 31, 2016, 2015 and 2014, respectively. Data product lines are growing at a pace that significantly exceeds our legacy product lines and in aggregate, they also provide a higher gross margin. The objective of our data segment is to leverage the ever increasing data bandwidth demands from our enterprise and carrier customers in our existing and expanding addressable markets.
Our data segment operations are based upon our expansion, edge-out and on-net strategies that seek to capitalize on new markets by maximizing the use of our fiber assets while optimizing capital efficiency and profitability. In 2016, we continued to invest significant capital towards our growth businesses within our data segment. Our strategy requires disciplined use of capital expenditures on success-based projects to grow our fiber assets and reach an increasing number of both carrier and enterprise customers. We believe our growth strategies, combined with our commitment to customer service, will continue to attract larger customers in our key vertical markets.
We generate growth within our data segment through new long-term FTTC contracts with wireless carriers deploying LTE services and bandwidth upgrades on existing contracts, improving enterprise penetration within our existing and new markets and providing greater Ethernet bandwidth to enterprise customers. In 2016, we added 205 FTTC sites, representing a year-over-year increase of approximately 18.7%, and 299 on-net buildings, representing an increase of approximately 17.3% year-over-year. Our sales force is organized into carrier and enterprise teams to effectively pursue the respective opportunities. Our ability to sustain or accelerate revenue growth in our data segment depends on our ability to obtain and effectively deploy capital to upgrade and expand our fiber network and implement our expansion and edge-out plans in a timely and disciplined manner, attract new customers and successfully manage churn through customer retention programs, including upgrading existing customers from legacy technologies to carrier Ethernet services.
R&SB
Our R&SB segment includes the following voice products: local lines, primary rate interface (“PRI”), long distance, toll and directory advertising and other voice services (excluding voice over IP (“VoIP”) services, which are typically provided to enterprise customers and are included in our data segment) and the following IP services products: fiber-to-the-premise broadband XL, DSL, integrated access and IPTV video. These products are sold to residential and small business customers through our competitive local exchange carrier (“CLEC”) and rural local exchange carrier (“RLEC”) networks. Revenues from our R&SB segment accounted for 30.6%, 32.9% and 35.8% of our total revenue for the years ended December 31, 2016, 2015 and 2014, respectively. Despite declining revenues, we expect the cash flows from our legacy businesses to continue to significantly contribute to funding the capital investment in our growing data segment. As of December 31, 2016, we operated approximately 65,285 CLEC lines and approximately 22,991 RLEC telephone access lines, a portion of which are fiber-fed and have IPTV-based video services and broadband Internet access offering speeds of up to 1 Gigabit. We also provide high-speed DSL bundled services to customers within this segment. This segment also includes revenues from switched access services provided to other carriers in our competitive markets.
RLEC Access
Our RLEC access segment provides carrier customers access to our network within our RLEC footprint and primarily includes switched access services. Revenues from our RLEC access segment accounted for 9.7%, 11.1% and 11.3% of our total revenue for the years ended December 31, 2016, 2015 and 2014, respectively. A significant portion of our RLEC access segment revenues are
4
derived from programs funded by regulatory agencies for recovery of revenue loss resulting from intercarrier compensation reform. We anticipate continuing declines in RLEC access revenues primarily resulting from regulatory actions taken by applicable regulatory authorities as described in the Regulation section below and also due to access line loss.
For detailed financial information about our business segments, see Note 4 in Part II, Item 8. Financial Statements and Supplementary Data of this Annual Report on Form 10-K, and for a detailed review of our financial performance and results of operations by business segment, see Part II, Item 7. Managements’ Discussion and Analysis of Financial Condition and Results of Operations of this Annual Report on Form 10-K.
Products and Services
Data Services:
We provide data services to carriers and enterprise customers including healthcare providers, local government agencies, financial institutions, educational institutions, and other enterprises over our fiber network. Our key data service offerings include the following:
|
Carrier Ethernet 2.0 |
• |
Ethernet connectivity among multiple locations in the same city or region over our fiber optic network. |
|
• |
Connectivity to/from our partner networks through connections to carrier hotels and Network-to-Network Interface (“NNI”) circuits. |
|
|
• |
Metro Ethernet Forum (“MEF”) 2.0 certified products (E-line, E-Tree, E-LAN and E-Access). |
|
|
• |
Fiber to the cell sites (“FTTC”), used by wireless carriers as backhaul. |
|
|
• |
User Network Interfaces (UNIs) offered at 1Gbps, 10Gbps and 100Gbps; Ethernet Virtual Circuit (EVC) bandwidth ranging from 3Mbps to 100Gbps. |
|
|
|
||
|
High-capacity Private Line Service and Wavelength Transport Services |
• |
High-capacity, non-switched transport facilities provided to end users and carriers for voice and data applications. |
|
• |
Wavelength technology provides a point-to-point connection between two locations that is dedicated to a single customer and provisioned on our high-speed fiber optic backbone. Our wavelength services now offer speeds up to 100 Gbps. |
|
|
• |
Point to Point T1/DS3 and SONET OCX based services with speeds from OC3 to OC192. |
|
|
|
||
|
Dedicated Internet Access (DIA) |
• |
Dedicated synchronous bandwidth for large enterprise and ISP customers in speeds from 5 Mbps to 10 Gbps over our protected fiber optic network with resilient connectivity to high speed transit and peering connection locations in Ashburn, VA and Chicago, IL. |
|
|
||
|
Data Center/Collocation Services |
• |
Secure, reliable and high speed access to computing resources for regional data center/collocation facilities that provide security, UPS, generator and HVAC technologies. |
|
|
||
|
Dark Fiber |
• |
We provide leased dark fiber for our customers that want the ability to scale their communications with high bandwidth needs. These customers own the electronics and therefore control their own network requirements. |
Residential and Small Business:
We provide fiber-to-the-premise Broadband XL and DSL Internet, voice, video and IP services to our residential and small business customers. Our voice service offerings include local lines, PRI, long distance, toll and directory advertising and other voice services. Our customers have the option of bundling our voice, broadband and video service offerings. Our IP-enabled product offerings combine voice and data services over dedicated broadband facilities utilizing VoIP protocols allowing customers dynamically allocated bandwidth to maximize voice and data transmission. VoIP technology also enables advanced voice features such as simultaneous ring, remote office, SIP trunks and business continuity. Our IPTV-based video services offer over 300 channels, including approximately 90 high definition channels, video-on-demand, TV Everywhere and DVR capability.
Carrier Access:
In addition to our data services, we also provide carrier customers with access to our network within our footprint, which primarily includes switched access services.
Sales, Marketing and Customer Care
Sales. We serve our carrier and enterprise customers with our suite of fiber-based data products, which include carrier Ethernet, MPLS, VPN, wavelength and dedicated Internet access. We have continued to see increased demand for these products across our customer base, particularly as demand for data transport and mobility services grow. The mission of our sales team is to capitalize on
5
this growing demand by offering customized solutions to our carrier and enterprise customers with a continued focus on expanding within our key vertical markets, which include healthcare, education, financial services and government. Our technical team plays a significant role in our sales approach in order to focus on selling customized, long-term and secure networking and data solutions.
Our specialized sales force is organized into carrier and enterprise teams to effectively pursue opportunities. Our carrier sales team is focused on capitalizing on increased bandwidth demand through new long-term FTTC and data transport contracts and bandwidth upgrades and maximizing on-net growth through our carrier end user sales channel. We expect an increasing portion of new enterprise sales over time will be through this sales channel, which provides access to new enterprise customers through strategic partnerships with national carriers to provide fiber bandwidth solutions over our network. Our enterprise sales team is focused on selling in our expansion and edge-out markets and improving enterprise penetration within our existing markets.
Our recently expanded markets include Richmond, VA and Norfolk, VA (including the City of Petersburg and the Hampton Roads area). Our expansion in these markets significantly increases our addressable market for FTTC and enterprise data. We employ in-market sales teams to drive revenue growth in these markets. In 2016, we hired a Vice President and General Manager with significant sales experience dedicated to leading the recently expanded enterprise sales team for our Richmond and Norfolk markets.
Marketing. Our marketing team is primarily focused on driving revenue growth in our data business, particularly in our expansion markets of Richmond, VA and Norfolk, VA, revenue retention in our residential and small business segment and enhancing the overall customer experience. During 2015, we completed a robust market analysis in our existing, expansion and edge-out markets which provided further visibility into our data business growth opportunities and in 2016 we refreshed the market analysis of the expansion markets based on the placement of our fiber within these regions. We have developed and are implementing a comprehensive outreach and lead generation strategy across our footprint. We also continue to implement a multi-phase customer experience enhancement plan that provides deeper customer data visibility internally and enables proactive management of our top customers’ experience.
Customer Care. We differentiate our customer care teams so our customer care representatives can provide the highest level of service by specializing in servicing and supporting data customers and residential and small business customers. We continue to implement our Elite Care and Platinum Care programs, which are designed to provide a higher level of service to our top wireless carrier and enterprise data customers, respectively. Each customer is assigned a dedicated Client Program Manager who assists in proactively managing the customers’ experience and addresses customer issues and opportunities using a cross functional team approach that engages sales, network, service delivery and customer care teams in both pre- and post-sales support. The Client Program Manager is assisted by a Technical Support Manager who focuses on support of network performance.
Our Network and Platform
We have developed a fiber optic network of long-haul fiber, carrier Ethernet and Ethernet rings located primarily in Virginia and West Virginia, and portions of Pennsylvania, Maryland, Ohio and Kentucky. As of December 31, 2016, our fiber network spanned approximately 10,100 route miles.
Our integrated fiber transport network allows us to offer a suite of advanced next-generation communications services, including, but not limited to, 100Gbps wavelength services, which provides greater throughput and superior latency performance, multi-site networking, dedicated Internet and MEF 2.0 certified Ethernet solutions, high-speed Internet and VoIP services. We use a multi-vendor approach, including Cisco, Alcatel-Lucent and Ciena, among others, to deliver high-bandwidth wavelength services directly to end customers as infrastructure for the MPLS Ethernet and high-speed Internet backbone. Network-to-network interconnection points allow us to engage carrier partners to provide end to end service for carrier and enterprise customers. We continue to invest in our fiber network to support the deployment of next-generation products and services, expand our addressable market and bring new customers on-net.
Over the past three years, we have constructed a new MEF certified Carrier Ethernet MPLS/IP fiber overlay network and migrated the majority of our FTTC traffic to this dedicated network. This overlay network, originally totaling approximately 850 route miles, connects four key markets in our footprint (Pittsburgh, PA, Charleston, WV, Roanoke, VA and Ashburn, VA) and meets carrier class requirements for fast-rerouting, full redundancy and low latency performance. In 2016, we replicated this network design into our newly constructed FTTC network in our expansion markets of Richmond, VA and Norfolk, VA. Our second network operations center located in Pittsburgh, PA, opened in 2014, is compatible with our FTTC all-IP network overlay. The Pittsburgh network operations center provides replication of all traditional functions of our existing network operations center located in Waynesboro, VA, including performance surveillance, repair, upgrade and maintenance of our fiber network and redundancy of our business continuity and disaster recovery functions. Our parallel network operations centers provide technical surveillance of our network using industry leading network management systems.
Our local networks consist of central office digital switches, routers, loop carriers and virtual and physical collocations interconnected primarily with fiber facilities. A mix of fiber optic and copper facilities connect our customers with the core network.
6
Competition
We compete with incumbent local exchange carriers (“ILECs”), broadband service providers, incumbent cable operators, and fiber providers and to a lesser extent, CLECs. We also face competition from potential future market entrants. In the last several years, we have seen increasing competition from the cable operators and ILECs for metro-Ethernet services to mid-size businesses. To remain competitive, we position our company as a customer-focused, leading edge provider with a full portfolio of broadband and IP-based services and a differentiation strategy centered on customizable data solutions.
As a result of the rapid growth in demand for broadband data transport, we expect that our competition will increase from market entrants offering FTTC, metro Ethernet solutions and other high-speed data services, including cable and wireless access. Our competition includes:
|
· |
ILECs including AT&T, Verizon, Frontier, Windstream and CenturyLink; |
|
· |
national fiber service providers and CLECs, including Level 3 and Zayo; and |
|
· |
national and regional cable operators, including Comcast, Shentel, Cox, Time Warner Cable and Suddenlink. |
As the RLEC for the western Virginia cities of Waynesboro, Clifton Forge and Covington and portions of the Virginia counties of Alleghany, Augusta and Botetourt, we have competition from cable companies and are subject to competition from wireless carriers. A portion of residential customers moving into our service area do not purchase landline phone service. Although CLECs have not entered our incumbent markets to compete with us, it is possible that one or more may enter our markets. To minimize potential competition in the RLEC markets, we offer fiber-to-the-premise, DSL, video over copper and a variety of bundled services for broadband, voice and video.
We believe our competitive strengths include our advanced fiber network; our footprint, including contiguous markets, which we believe provides opportunities for growth with a favorable competitive environment relative to first-tier markets; our robust and expanding products and services, including FTTC and metro Ethernet; our disciplined, success-based capital investment strategy aimed at optimizing our capital efficiency and delivering attractive returns; our diverse customer base, our future cash flow visibility from our legacy businesses; and our experienced management team, with deep industry experience and a strong track record of operating and scaling bandwidth infrastructure assets.
Employees
As of December 31, 2016, we employed 564 full-time and two part-time employees. Of these employees, 38 are covered by a collective bargaining agreement that expires September 20, 2019. We believe that we have good relations with our employees.
Access to Public Filings
We routinely post important information on our website at www.lumosnetworks.com. Information contained on our website is not incorporated by reference into this annual report on Form 10-K. We provide public access to our annual reports on Form 10-K, quarterly reports on Form 10-Q, current reports on Form 8-K, and amendments to these reports filed with the U.S. Securities and Exchange Commission (“SEC”) under the Securities Exchange Act of 1934. These documents may be accessed free of charge on our website at the following address: http://ir.lumosnetworks.com. These reports are available as soon as reasonably practicable after we electronically file such material with, or furnish it to, the SEC.
Regulation
The following summary does not describe all present and proposed federal and state legislation and regulations affecting the telecommunications industry. Some legislation and regulations are currently the subject of judicial proceedings, legislative hearings and administrative proposals which could change the manner in which this industry operates. Neither the outcome of any of these developments, nor their potential impact on us, can be predicted at this time. Regulation can change rapidly in the telecommunications industry, and such changes may have an adverse effect on us in the future. See “Risk Factors” elsewhere in this report.
Regulation Overview
Our communications services are subject to varying degrees of federal, state and local regulation. Under the federal Communications Act, the Federal Communications Commission (“FCC”) has jurisdiction over interstate and international common carrier services. Under the Telecommunications Act of 1996, the FCC has jurisdiction over certain aspects of local interconnection terms and rates between carriers.
In addition to FCC regulation, our communications services are regulated to different degrees by state public service commissions and by local authorities. Such local authorities have jurisdiction over public rights-of-way and video and telecommunications franchises.
7
Our operations are subject to various federal and state laws intended to protect the privacy of customers who subscribe to our services. The FCC has regulations that place restrictions on the permissible uses that we can make of customer-specific information, known as Customer Proprietary Network Information (“CPNI”), received from subscribers and that govern procedures for release of such information. The Federal Trade Commission’s “Red Flag” rules require that companies develop and implement written Identity Theft Prevention programs.
Federal Regulation of Interconnection and Interexchange Services
The Communications Act requires all common carriers to interconnect on a non-discriminatory basis with other carriers, imposes additional requirements on incumbent local exchange carriers (such as our RLEC’s), and imposes even more comprehensive requirements on the largest ILECs. The large ILECs are required to provide competitors with physical collocation to allow competitors to place qualifying equipment in ILEC central offices; to unbundle some of their services into unbundled network elements (“UNE”) at “forward looking” rates, permit resale of some of their services, provide access to poles, ducts, conduits and rights-of-way, and to establish reciprocal compensation for the transport and termination of local traffic. The obligations of the large ILECs to provide these network facilities and services could be altered or removed by new legislation, regulations or court order.
ILEC operating entities that serve fewer than 50,000 lines are defined as “rural telephone companies” under the Communications Act and are exempt from the additional requirements applicable to the large ILECs unless and until such exemption is removed by the state regulatory body. Each of our RLEC operations is considered separately and each has this rural telephone company exemption.
Intercarrier Compensation Reform
Intercarrier compensation includes regulated interstate and intrastate access charges that we and other RLECs and CLECs receive from long distance carriers for the origination and termination of long distance calls and reciprocal compensation that interconnected local carriers pay to each other for terminating interconnected local wireline calls.
In 2011, the FCC released a significant order on intercarrier compensation reform. In the order, the FCC adopted a uniform national bill-and-keep framework (in which carriers do not collect or pay access charges or reciprocal compensation) as the ultimate end state for all telecommunications traffic exchanged between carriers. The FCC established the $2 billion Connect America Fund (CAF) for RLECs and RLECs now receive support principally through the CAF rather than through intercarrier compensation. The FCC order permitted ILECs to implement a new charge on end users to partially offset the loss in access charge revenues, the Access Recovery Charge (“ARC”), effective July 1, 2012. The maximum ARC for residential customers is $3 per month after six years. Multi-line business customers have their Subscriber Line Charge and ARC combined capped at $12.20 per line.
Our RLECs began charging the ARC and began receiving funding from the CAF on July 1, 2012. Effective July 1, 2013, our RLECs and CLECs reduced their rates for most intrastate access to interstate rates. Effective July 1, 2014, July 1, 2015, and July 1, 2016, our RLECs and CLECS further reduced interstate and intrastate access charges as required by the FCC.
Net Neutrality.
On March 12, 2015, the FCC released an order reclassifying broadband Internet access service to be a common carrier service subject to regulation under Title II of the Telecommunications Act. The order took effect on June 12, 2015. This “net neutrality” order applies to all wireline and wireless providers of broadband Internet access services. The FCC regulations adopted in the order prohibit blocking, throttling, and paid prioritization by Internet service providers. The net neutrality order also requires providers to disclose certain information to consumers, including rates, fees, and data allowances. To date, the new rules have had no material adverse effect on our consolidated financial position, results of operations or cash flows.
State Regulation of RLEC, CLEC and Interexchange Services
Most states require wireline telecommunications providers to obtain authority from state regulatory commissions prior to offering common carrier services. Our two RLEC subsidiaries are certificated as ILECs in Virginia. As of December 31, 2016, we have subsidiaries certificated as CLECs in Virginia, West Virginia, Pennsylvania, Maryland, Ohio and Kentucky. Through a business acquisition in January 2017, we added subsidiaries certificated as CLECs in North Carolina, South Carolina, Alabama, Tennessee, and Georgia. State regulatory commissions generally regulate RLEC rates for intrastate services and RLECs must file tariffs setting forth the terms, conditions and prices for their intrastate services. Our RLECs are subject to regulation in Virginia by the State Corporation Commission (“SCC”). Although we file tariffs covering our CLEC services, our rates for such CLEC services generally fluctuate based on market conditions.
Local Government Authorizations
Certain governmental authorities require permits to open streets for construction and/or telecommunications franchises to install or expand facilities. Video franchises are also required for most of our video services. We obtain such permits and franchises as required. We hold video franchises in the City of Waynesboro, Botetourt County, City of Lynchburg, portions of the City of Staunton,
8
Bedford County, Alleghany County, City of Covington, Town of Clifton Forge, and Town of Iron Gate. All of these localities are in the Commonwealth of Virginia.
9
RISK FACTORS
The following risk factors and other information included in this Form 10-K should be carefully considered. The risks and uncertainties described below are not the only ones we face. Additional risks and uncertainties not presently known to us or that we currently deem immaterial also may adversely impact our business operations. Our business, financial condition or results of operations could be materially adversely affected by any or all of these risks.
Risks Relating to Our Business:
Adverse economic conditions may harm our business.
Economic uncertainty or a lack of economic growth could negatively impact our business results. Unfavorable economic conditions, including a return to recession or disruptions to the credit and financial markets, could cause customers to slow or delay spending. If demand for our services decreases, our revenues would be adversely affected and churn may increase. In addition, during challenging economic times our customers may face issues gaining timely access to sufficient credit, which may impair the ability of our customers to pay for services they have purchased. Any of the above could have a material effect on our business, financial position, results of operations and cash flows.
We are also susceptible to risks associated with the potential financial instability of the vendors and third parties on which we rely to provide services or to which we outsource certain functions. The same economic conditions that may affect our customers could also adversely affect vendors and third parties and lead to significant increases in prices, reduction in quality or the bankruptcy of our vendors or third parties upon which we rely. Any interruption in the services provided by our vendors or by third parties could adversely affect our business, financial position, results of operations and cash flows.
We may not be able to successfully implement our strategy to grow our data business and thereby sustain our revenue and cash flow growth.
We must grow our data business and manage the decline in our legacy businesses in order to sustain our revenue and cash flow growth. We have pursued several growth initiatives including:
|
· |
Investing in a comprehensive network expansion into the Richmond, VA and Norfolk, VA area; |
|
· |
Increasing network investments in our core markets; |
|
· |
Investing in fiber network expansion into new adjacent geographic markets; |
|
· |
Building fiber to wireless carrier cell sites; and |
|
· |
Launching new products and services that meet customers’ data and IP needs. |
Our ability to manage this expansion depends on many factors, including our ability to:
|
· |
Attract new customers and sell additional services to existing customers by effectively implementing our sales and marketing plans; |
|
· |
Manage churn through successful implementation of our customer retention programs and upgrading existing customers from time division multiplexing (“TDM”) products to advanced Ethernet services; |
|
· |
Offset our revenue declines from churn in our legacy voice and access segments and within our data segment resulting from customers TDM product replacement; |
|
· |
Complete customer installations in a timely manner to meet customer demands; |
|
· |
Successfully train our sales force to adapt to evolutionary demand for advanced data service; |
|
· |
Efficiently manage our capital expansion plans; |
|
· |
Obtain capital necessary to implement our growth plans; |
|
· |
Manage increased competition from other data service providers in existing and new markets; and |
|
· |
Remain competitive with customer pricing and service expectations. |
10
We may require additional capital to fund our strategic growth plan, and if we fail to obtain this capital, we may experience a material adverse effect on our business.
Our strategic growth plans require a significant amount of capital investment in fiber operations through organic and/or inorganic growth. Additionally, to remain competitive, we will need to continue to upgrade the technical requirements of our existing network infrastructure and build out our network with advanced fiber technology within our territories which will require a significant investment of capital resources. Additionally, the cost or extent of the work required for organic growth projects could be more significant than anticipated. Any such unplanned capital expenditures may adversely affect our business, financial condition and operating results.
We expect that the cash we generate from operations combined with our cash on hand and marketable securities will be sufficient to satisfy our working capital requirements, capital expenditures and debt service requirements for the foreseeable future. Additionally, we have access to a revolving credit facility, which is currently undrawn. However, if our assumptions prove incorrect or if there are other factors that increase our need for additional liquidity, such as material unanticipated losses, loss of customers or a significant reduction in demand for our services or other factors, or if we are successful in obtaining additional major FTTC contracts or we make acquisitions, we would expect to seek additional sources of funds through refinancing or other means including additional equity financing. There is no assurance that we could obtain such additional financing on acceptable terms, if at all. If available, additional equity financing may dilute our stockholders and debt financing may restrict our ability to raise future capital.
We may not be able to complete acquisitions and acquisitions we do complete could result in operating difficulties, dilution and other adverse consequences, which could adversely affect our results of operations.
We evaluate potential strategic transactions in order to pursue our strategy. At any given time, we may be engaged in discussions with respect to one or more of such transactions that may be material to our financial condition and results of operations. There can be no assurance that any such discussions will result in the consummation of any transaction or that we will identify appropriate transactions on terms acceptable to us. Adverse capital markets and volatility in our stock price could also negatively impact our ability to make acquisitions.
Future acquisitions may result in the dilutive issuances of equity securities, use of our cash resources and incurrence of debt or contingent liabilities. Acquisitions also may result in significant costs and expenses and charges to earnings, including those related to employee costs, integration costs, unexpected liabilities and legal, accounting and financial advisory fees. Any of these items could adversely affect our business, results of operations and cash flows.
We face substantial competition in our markets; our competitors may have substantial business advantages over us and we may not be able to compete successfully.
We compete with ILECs, broadband service providers, incumbent cable operators, fiber companies and to a lesser extent, CLECs. As a result of the rapid growth in demand for broadband data, we expect that our competition will increase from market entrants offering FTTC, metro Ethernet solutions and other high-speed data services, including cable and wireless access. Our competition includes ILECs, such as AT&T, Verizon, Frontier, Windstream and Centurylink; national fiber service providers and CLECs, including Level 3 and Zayo, and national and regional cable operators, such as Comcast, Shentel, Cox, Time Warner Cable and Suddenlink. In addition, due to consolidation and strategic alliances within the telecommunications industry, we cannot predict the number of competitors that will emerge. Such increased competition from existing and new entities could lead to price reductions, loss of customers, reduced operating margins and/or loss of market share.
11
Many of our competitors have financial resources, corporate backing, customer bases, marketing programs and brand names that are greater than ours. Additionally, competitors may charge less than we do for services, causing us to reduce, or preventing us from raising, our fees.
Network delays or interruptions of service could cause us to lose customers.
To be successful, we must provide our customers reliable network service. Some of the risks to our network and infrastructure include: physical damage to outside plant facilities, power surges or outages; network equipment failures due to aging or other factors; software defects; human error; disruptions beyond our control, including disruptions caused by terrorist activities or severe weather; and failures in operational support systems.
Furthermore, as the demand for increased bandwidth from our customers has grown and as it continues to grow, our fiber optic network could experience greater data loads that may also result in network interruptions in service and reduced capacity for our customers. Service interruptions and lack of redundancy could cause us to incur additional expenses and/or issue network outage credits to our customers and may cause us to lose customers.
The telecommunications industry is generally characterized by rapid development and introduction of new technologies; if we are unable to adapt to these rapid changes, we could suffer price reductions, customer losses, reduced operating margins and/or loss of market share.
The telecommunications industry continues to experience rapid and significant changes in technologies and architectures to deliver new services to customers and to deliver existing services more cost-effectively. We expect that new technologies will continue to enable advances in our customers’ environments that create new demand drivers. We believe that our future success will depend in part on our ability to anticipate and respond to the rapidly changing needs and demands of our customers on a timely basis and to compete with our competitors' offerings. Our failure to obtain and integrate new technologies and applications, and develop new service offerings to meet those customer needs or to keep pace with or exceed the service capabilities of our competitors could impact the breadth of our service portfolio, resulting in less competitive and compelling offerings that could impair our ability to attract and retain customers. We may be unable to keep pace with competitive offerings without making significant additional capital investments or adversely affecting our margins.
Revenue from certain of our more traditional products such as dedicated network services and certain voice services is growing slowly or is declining. As a result, our overall revenue growth is driven primarily by our Ethernet services and we must continue to develop those and other next generation services in order to continue to grow our revenue. New product development may be capital intensive and may pressure margins until the new products begin to generate substantial revenue. New products that are largely software based are increasingly complex and may require more customer support and additional systems development. In addition to investing in new technologies, we must replace equipment that supports our traditional services as that equipment ages or becomes redundant. If we do not properly manage this process, including the migration of customers to our newer technologies, we may lose customers and market share, and our margins and returns could be adversely affected.
Losses or a decrease in usage from certain key customers may result in lower revenues or higher expenses.
We generated approximately 32% of our operating revenue from our five largest carrier customers in the year ended December 31, 2016. No single customer currently represents more than 10% of our operating revenues. If we were to lose one or more of these carrier customers, our revenues would decline, which could have a material adverse effect on our business, financial condition and operating results.
We may have to undertake further restructuring plans which would require additional charges.
From time to time we have incurred restructuring charges as a result of changes in our business strategy. In 2016, we incurred $1.9 million in restructuring costs related to workforce reductions. We plan to continue to evaluate our business, which may result in additional restructuring activities. We may choose to implement workforce reductions, outsource certain functions or consolidate or close certain facilities. Decisions to engage in future restructuring activities could involve realization of losses, wind-up expenses, workforce reductions, impairment of assets and the elimination of revenues along with associated costs, any of which could adversely affect our results of operations and cash flows.
We have substantial indebtedness, which could have a negative impact on our financing options and liquidity position.
Lumos Networks Operating Company, our wholly-owned subsidiary, has a credit facility (the “Credit Facility”) which consists of senior secured term loans and a senior secured revolving credit facility. Our indebtedness under the Credit Facility was $340.4 million at December 31, 2016 and it carries interest expense of approximately $13 million annually.
We also have $150 million in aggregate principal amount of 8% Notes due 2022 (the “8% Notes”) issued to an entity formed by Pamplona Capital Management, LLP (together with another entity formed by Pamplona Capital Management, LLP that acquired
12
warrants to purchase our common stock, the “Pamplona Entities”). Our 8% Notes carry interest expense of approximately $12 million annually.
Our indebtedness could adversely affect our financial health and business and future operations by, among other things:
|
· |
Limiting our ability to obtain any additional financing we may need to operate, develop and expand our business; |
|
· |
Making it more difficult for us to satisfy our obligations with respect to our indebtedness; |
|
· |
Increasing our vulnerability to adverse economic and industry conditions by making it more difficult for us to react quickly to changing conditions; |
|
· |
Requiring us to dedicate a substantial portion of any cash flows from operations to service our debt, which reduces the funds available for operations and future business opportunities; |
|
· |
Potentially making us more highly leveraged than our competitors, which could potentially decrease our ability to compete in our industry; |
|
· |
Exposing us to risks inherent in interest rate fluctuations because some of our borrowings are at variable rates of interest, which could result in higher interest expense in the event of increases in interest rates; and |
|
· |
Limiting our flexibility in planning for, or reacting to, changes in our business, and the industry in which we operate. |
The ability to make payments on our debt will depend upon our future operating performance, which is subject to general economic and competitive conditions and to financial, business and other factors, many of which we cannot control. If the cash flows from our subsidiaries’ operating activities are insufficient to service our debt obligations, we may take actions, such as delaying or reducing capital expenditures, attempting to restructure or refinance our debt, selling assets or operations or seeking additional equity capital. Any or all of these actions may not be sufficient to allow us to service our debt obligations. Further, we may be unable to take any of these actions on satisfactory terms, in a timely manner or at all.
Our Credit Facility and our 8% Notes impose certain operating and financial restrictions, which may prevent us from capitalizing on business opportunities and taking some corporate actions.
Our Credit Facility imposes certain operating and financial restrictions on our subsidiaries. These restrictions generally:
|
· |
Restrict our subsidiaries’ ability to incur additional indebtedness or issue preferred stock; |
|
· |
Restrict our subsidiaries from entering into transactions with affiliates; |
|
· |
Restrict our subsidiaries’ ability to consolidate, merge or sell all or substantially all of their assets; |
|
· |
Impose financial covenants relating to the business of our subsidiaries, including leverage and interest coverage ratios; |
|
· |
Require our subsidiaries to use a portion of “excess cash flow” (as defined in the debt agreement) to repay indebtedness if our leverage ratio exceeds specified levels; and |
|
· |
Restrict our subsidiaries’ ability to agree to liens on assets or agreements (such as leases). |
Our 8% Notes also impose certain financial and operating restrictions. These restrictions generally:
|
· |
Restrict our ability to incur additional indebtedness or issue preferred stock; and |
|
· |
Restrict our ability to agree to liens. |
We cannot provide assurance that these covenants will not adversely affect our ability to finance our future operations or capital needs or pursue available business opportunities. A breach of any of these covenants could result in a default with respect to the Credit Facility or the 8% Notes, as applicable. If a default occurs, our indebtedness under the Credit Facility or the 8% Notes, as applicable, could be declared immediately due and payable.
Our RLEC subsidiaries are subject to competition and to regulatory regimes at the state and federal level and consequently face substantial regulatory burdens and uncertainties; regulatory developments will further reduce revenues that we receive from access charges and/or from the federal Universal Service Fund, the Connect America Fund or other fund allocations.
Our RLECs qualify as rural local telephone companies under the Telecommunications Act and are, therefore, exempt from many of the most burdensome obligations of the Telecommunications Act, such as the obligation to sell unbundled elements of our network to our competitors at “forward-looking” prices that the Telecommunications Act places on larger carriers. Nevertheless, our RLECs face significant competition, particularly from competitors that do not need to rely on access to our network to reach their customers. Wireless carriers, cable companies and other VoIP providers are able to compete with our RLECs even though the “rural exemption”
13
under the Telecommunications Act is in place. If our rural exemption were removed, CLECs could more easily enter our RLECs’ markets. Moreover, the regulatory environment governing wireline local operations has been, and we believe will likely continue to be, very liberal in its approach to promoting competition and network access.
Over time, FCC and state regulations have resulted in reducing the switched access and reciprocal compensation revenue of our RLECs. In 2011, the FCC released an order comprehensively reforming interstate and intrastate intercarrier compensation systems. In the order, the FCC determined that interstate and intrastate access charges, as well as local reciprocal compensation, should be eliminated entirely over time. These FCC pricing reductions commenced on July 1, 2012 and continue through July 1, 2020. A portion of the access revenue previously received by our RLECs from carriers is being recovered through payments from the FCC’s “Connect America Fund” (“CAF”) and from increases in charges to end user subscribers in the form of rate increases and the FCC’s “Access Recovery Charge.” Regulatory changes could impact the amount and timing of the revenues received from these funds in the future. There is no guarantee that we will recover all or a portion of lost revenues resulting from intercarrier compensation system reform or that we will not be subject to further rate reductions in the future. Furthermore, by accepting government funding, we are subject to audit by the FCC or certain other government agencies that administer the funds and our methodologies or approaches taken to determine the amounts of eligible access revenues or costs, as applicable, could be called into question during an audit. Although we believe our methodologies and approaches are compliant and reasonable, there is no assurance that an audit would not result in a demand for a partial refund or nonpayment of future funding by the respective government agency.
Lumos Networks and other industry participants are frequently involved in disputes over issues that, if decided adversely to us, could harm our financial and operational prospects.
We anticipate that we will continue to be subject to risks associated with the resolution of various disputes, lawsuits, arbitrations and proceedings affecting our business. These issues may include, among other things, the administration and enforcement of existing interconnection agreements and tariffs, the terms of new interconnection agreements, operating performance obligations and intercarrier compensation. We also may be included in proceedings and arbitrations before state and regulatory commissions, private arbitration organizations, and courts over many issues that will be important to our financial and operation success. While we believe we have adequate reserves for the probable and estimable losses related to the expected outcomes of our current disputes, the results of these disputes are inherently unpredictable.
The implementation of our business strategy is dependent upon our ability to maintain, expand and update our information technology infrastructure in response to growth and changing business needs.
Our business relies on our data, billing and other operational and financial reporting and business systems. To effectively implement our business strategy, we will need to continue to maintain and, in some cases, make upgrades to modernize our information technology systems and infrastructure, which can be costly. Our inability to maintain, expand or upgrade our technology infrastructure could have adverse consequences, which could include service or billing interruptions, the diversion of critical resources and inhibiting our growth plans due to an inability to scale effectively.
We are dependent on third-party vendors for our information and billing systems. Any significant disruption in our relationship with these vendors could increase our costs and affect our operating efficiencies.
Sophisticated information and billing systems are vital to our ability to monitor and control costs, bill customers, process customer orders, provide customer service and achieve operating efficiencies. We currently rely on a mix of internal systems and third-party supported applications and systems to provide all of our information and data processing needs. Some of our billing, customer service and management information systems have been developed by third parties and may not perform as anticipated or the third parties may experience interruptions or other problems delivering these systems. In addition, our plans for developing and implementing our information and billing systems rely to some extent on the delivery of products and services by third-party vendors. Our right to use these systems is dependent upon license agreements with third-party vendors. Some of these agreements are cancelable by the vendor, and the cancellation or nonrenewable nature of these agreements could impair our ability to process customer information and/or bill our customers. Since we rely on third-party vendors to provide some of these services, any switch in vendors could be costly and affect operating efficiencies.
We rely on a limited number of key suppliers and vendors for timely supply of equipment and services relating to our network infrastructure. If these suppliers or vendors experience problems or favor our competitors, we could fail to obtain sufficient quantities of the products and services we require to operate our businesses successfully.
We depend on a limited number of key suppliers and vendors for equipment and services relating to our network infrastructure. If these suppliers experience interruptions or other problems delivering these network components and related software on a timely basis, our subscriber growth and operating results could suffer significantly. Our initial choice of a network infrastructure supplier can, where proprietary technology of the supplier is an integral component of the network, cause us effectively to be locked into one or a few suppliers for key network components. As a result, we have become reliant upon a limited number of network equipment
14
manufacturers, including Cisco, Alcatel-Lucent, Ciena and others. If alternative suppliers and vendors become necessary, we may not be able to obtain satisfactory and timely replacement supplies on economically attractive terms, or at all.
If we fail to extend or renegotiate our collective bargaining agreements with our labor union when they expire, or if our unionized employees were to engage in a strike or other work stoppage, our business and operating results could be materially harmed.
We are a party to collective bargaining agreements with our labor union, which represented 38 employees as of December 31, 2016. Although we believe that relations with our employees are satisfactory, no assurance can be given that we will be able to successfully extend or renegotiate our collective bargaining agreements when they expire. If we fail to extend or renegotiate our collective bargaining agreements, if disputes with our union arise, or if our unionized workers engage in a strike or a work stoppage, we could experience a significant disruption of operations or incur higher ongoing labor costs, either of which could have an adverse effect to the business. Our collective bargaining agreements are generally renegotiated every three years and the current agreements expire September 20, 2019.
If we cannot obtain and maintain necessary construction permits, rights-of-way and access to pole attachments for our network, our operations may be interrupted, customer installations may be delayed and we would likely face increased costs.
We need to obtain and maintain the necessary rights-of-way for our network from governmental and quasi-governmental entities and third parties, such as railroads, utilities, state highway authorities, local governments, transit authorities and private landowners. Additionally, in many cases we require construction permits to complete fiber installations. We may not be successful in obtaining and maintaining these rights-of-way or construction permits or obtaining them on acceptable terms. Some agreements relating to rights-of-way may be short-term or revocable at will, and we cannot be certain that we will continue to have access to existing rights-of-way after the governing agreements are terminated or expire. If any of our right-of-way agreements were terminated or could not be renewed, we may be forced to remove our network facilities from the affected areas, relocate or abandon our networks. This would interrupt our operations and force us to find alternative rights-of-way and make unexpected capital expenditures. If we are unable to obtain construction permits in a timely manner, or at all, we could face delays in fiber installations, incur unexpected cost for network redesign work, or default on customer contracts. In addition, our failure to maintain the necessary rights-of-way, franchises, easements, licenses and permits may result in an event of default under our credit agreement and may subject us to legal complaints or claims. We may also incur costs resulting from a disruption of service or the relocation of equipment for other carriers that use our network under Indefeasible Rights to Use (“IRU”) arrangements granted by us.
Under federal law, we have a right to use the poles, ducts, and conduits of investor-owned utilities (electric and telephone) at regulated rates for our cables, including fiber optic facilities. Some of the poles we use are exempt from federal regulation because they are owned by utility cooperatives and municipal entities. If the rates, terms and conditions imposed by utilities are unreasonable, or if the utilities do not allow us access to the poles, ducts, and conduits in a timely manner, our business, financial results or financial condition could suffer.
Our rights to the use of fiber that are part of our network may be affected by the ability to continue long term contracts and the financial stability of our IRU fiber providers.
A portion of our services are provided on network fiber facilities licensed or leased from other network service providers through IRUs or similar arrangements. The facilities under these agreements have remaining terms generally ranging from less than 1 year to 24 years. In these agreements, the network owner is responsible for network maintenance for which we pay such network owners. If our network provider under IRU agreements has financial troubles, it could adversely affect our costs, especially maintenance costs and ability to deliver service. Also, if our network providers under IRU agreements are unable to obtain and maintain necessary rights-of-way and access to pole attachments for their fiber networks or if they fail to renew or extend our IRUs, our operations may be interrupted and/or we could incur material expenses if we were required to relocate to alternative network assets.
We are dependent upon interconnection agreements with other carriers to reach some of our customer locations.
We have interconnection agreements with ILECs in the competitive markets we serve. Based on existing customers and our assessment of growth opportunities in these markets, we purchase wholesale voice lines, data circuits and access to collocation facilities under these agreements. From time to time, we are required to negotiate amendments to, extensions of, or replacements for these agreements. Additionally, we may be required to negotiate new interconnection agreements in order to enter new markets in the future. We may not be able to successfully negotiate amendments to existing agreements, negotiate new interconnection agreements, renew our existing interconnection agreements, opt in to new agreements or successfully arbitrate replacement agreements for interconnection on terms and conditions acceptable to us. Our inability to do so would adversely affect our existing operations and opportunities to expand our business in existing and new markets. If rates became unfavorable or we could no longer access collocation facilities, we could be forced to alter our service delivery which could reduce our customer base. As the FCC modifies and implements rules related to unbundling of ILEC network elements and collocation of competitive facilities at ILEC central offices, we generally have to renegotiate our interconnection agreements to implement those new or modified rules.
15
If interest rates increase, our net income could be negatively affected.
Our Credit Facility exposes us to adverse changes in interest rates. We cannot predict whether interest rates for long-term debt will increase, and thus we cannot assure you that our future interest expense will not have a material adverse effect on our business, financial condition, operating results and cash flows. Our interest rate swap contracts, which partially mitigated this exposure, expired on December 31, 2015.
Security breaches to our physical facilities, computer networks, and informational databases, and unauthorized use of, or interference with, our network could disrupt services and result in loss of customer data and customers, and increase our costs.
The nature of our business necessitates that parts of our network remain in the public domain and as a result it is possible that unauthorized use, interference with, or malicious or unintentional disruptions of our network may occur. In addition, computer viruses, theft, attacks by hackers, or similar disruptive problems may occur. If hackers gain improper access to our databases, they may be able to steal, publish, delete or modify confidential personal information concerning our subscribers.
In addition, misuse of our customer information could result in more substantial harm perpetrated by third parties. This could damage our business and reputation, and result in a loss of customers. Misuse of our customer information would also subject us to fines by the FCC. We may incur costs associated with the unauthorized use of our network including administrative and capital costs associated with detecting, monitoring and reducing the incidence of malice and fraud. Malicious and fraudulent use of our network may impact interconnection costs, capacity costs, legal and administrative costs, fraud prevention costs and payments to other carriers for fraudulent use.
Our physical facilities may be vulnerable to physical break-ins which may also result in the misuse of our customer information, malicious and fraudulent use of our networks that may impact interconnection costs, capacity costs, legal and administrative costs, fraud prevention costs and payments to other carriers for fraudulent use.
If or when we lose a member or members of our senior management, our business may be adversely affected.
The success of our business is largely dependent on our senior management team, as well as on our ability to attract and retain other highly qualified technical and management personnel, including talented sales and technical personnel.
We believe that there is, and will continue to be, intense competition for qualified personnel in the telecommunications industry, and we cannot assure you that we will be able to attract and retain the personnel necessary for the development of our business. The unexpected loss of key personnel or the failure to attract additional personnel as required could have a material adverse effect on our business, financial condition and operating results.
If we fail to remediate the identified material weakness in internal controls over financial reporting, our reputation, business or stock price could be adversely affected.
As described in “Part II, Item 9A - Controls and Procedures,” our management identified a control deficiency related to insufficient review procedures over income tax accounting for the 8% Notes that our management has concluded represents a material weakness. As a result, management reported that internal controls over financial reporting were not effective as of December 31, 2016 due to the existence of the material weakness.
A material weakness is a deficiency, or a combination of deficiencies, in internal control over financial reporting, such that there is a reasonable possibility that a material misstatement of our annual or interim financial statements will not be prevented or detected on a timely basis. We have developed and are implementing a plan to remediate this material weakness and believe, based on our evaluation to date, that this material weakness will be remediated during 2017. However, we cannot provide assurance that this will occur within the contemplated timeframe. The occurrence of or failure to remediate this material weakness may adversely affect our reputation and business and the market price of our common stock.
Any significant impairment of our goodwill or intangible assets would lead to a decrease in our assets and a reduction in net income.
As of December 31, 2016, we had goodwill and other intangible assets of approximately $108.8 million (approximately 14.4% of total assets). If the impact or the timing of ongoing regulatory reform actions is significantly different than what we anticipate or if there are other regulatory or operating changes to our business, we may be forced to record an impairment charge, which would lead to a decrease in our assets and reduction in net income. We test goodwill and other indefinite-lived intangible assets for impairment annually or more frequently if events or changes in circumstances indicate an impairment may have occurred. If the testing performed indicates that impairment has occurred, we are required to record an impairment charge for the difference between the carrying value of the goodwill or indefinite-lived intangible asset and the implied fair value of the asset in the period in which the determination is made. The testing of goodwill and indefinite-lived intangible assets for impairment requires us to make significant estimates about the fair values of our reporting units. These estimates can be affected by numerous factors, including changes in economic, industry or
16
market conditions, changes in underlying business operations, future reporting unit operating performance, existing or new product market acceptance, changes in competition or changes in technologies. Any changes in key fair value assumptions, or actual performance compared with those assumptions, about our business and our future prospects or other assumptions could affect the fair value of one or more of the indefinite-lived intangible assets or of the reporting units, resulting in an additional impairment charge.
Risks Related to Our Common Stock:
Outstanding warrants may cause dilution to existing shareholders.
On August 6, 2015, we issued to a Pamplona entity a warrant to purchase up to 5,500,000 shares of our common stock (the “Warrant”). The Warrant is exercisable on a cashless basis at an initial exercise price of $13.99 per share and may be net-share settled only. Exercise of the Warrant may cause dilution to the interests of other stockholders as a result of the additional common stock that would be issued. Additionally, the Warrant contains anti-dilution provisions that could result in further dilution to our stockholders.
17
The Pamplona Entities have influence over our business and their interests may not always coincide with the interests of the holders of our common stock.
Two of our nine current directors that serve on our board of directors are representatives or designees of the Pamplona Entities pursuant to an Investors Rights Agreement between a Pamplona Entity and us. By virtue of the Investors Rights Agreement and such representation on the board of directors, the Pamplona Entities have influence over corporate and management policies and matters submitted to our stockholders, including the election of the directors.
The interest of the Pamplona Entities may not always coincide with the interests of our stockholders. Accordingly, because the Pamplona Entities have influence over our business, they could seek to influence us to enter into transactions or agreements adverse to the interests of our stockholders or to forego entering into transactions or agreements that may be beneficial to our stockholders.
In addition, the Pamplona Entities are in the business of making investments in companies and may, from time to time, acquire and hold interests in business that compete directly or indirectly with us. The Pamplona Entities may also pursue, for their own account, acquisition opportunities that may be complementary to our business, and as a result, those acquisition opportunities may not be available to us. Additionally, we have specifically renounced any interest or expectancy that the Pamplona Entities will offer to us any investment or business opportunity of which they are aware.
Provisions in our charter documents and the General Corporation Law of Delaware could discourage potential acquisition proposals, could delay, deter or prevent a change in control and could limit the price certain investors might be willing to pay for our common stock.
Certain provisions of the General Corporation Law of Delaware, the state in which we are organized, and our certificate of incorporation and bylaws may inhibit a change of control not approved by our board of directors or changes in the composition of our board of directors, which could result in the entrenchment of current management. These provisions include:
|
· |
advance notice requirements for stockholder proposals and director nominations; |
|
· |
limitations on the ability of stockholders to amend, alter or repeal our bylaws; |
|
· |
limitations on the removal of directors; |
|
· |
the inability of the stockholders to act by written consent; and |
|
· |
the authority of the board of directors to issue, without stockholder approval, preferred stock with such terms as the board of directors may determine and additional shares of our common stock. |
Our stock price may be volatile.
The trading price of our common stock is subject to fluctuations in response to certain events and factors, such as quarterly variations in results of operations; entry into major transactions; changes in our business strategy; changes in financial guidance; changes in recommendations or reduced coverage by securities analysts; the operating and stock price performance of other companies that investors may deem comparable to us; industry or stock market trends unrelated to our performance; and general economic conditions.
Our certificate of incorporation designates the Court of Chancery of the State of Delaware as the sole and exclusive forum for certain litigation that may be initiated by our stockholders, which could limit our stockholders’ ability to obtain a favorable judicial forum for disputes with the Company.
Our certificate of incorporation provides that, unless we consent in writing to the selection of an alternative forum, the Court of Chancery of the State of Delaware shall be the sole and exclusive forum for (i) any derivative action or proceeding brought on our behalf, (ii) any action asserting a claim of breach of fiduciary duty owed by any of our directors, officers or other employees or our stockholders, (iii) any action asserting a claim arising pursuant to any provision of the DGCL or our certificate of incorporation or bylaws, or (iv) any action asserting a claim governed by the internal affairs doctrine. Our certificate of incorporation further provides that any person or entity purchasing or acquiring any interest in shares of our capital stock shall be deemed to have notice of and to have consented to the provisions described above. This forum selection provision in our certificate of incorporation may limit our stockholders’ ability to obtain a favorable judicial forum for disputes with the Company.
Risks Related to the Merger:
In connection with the proposed Merger with EQT Infrastructure, we are subject to certain risks including, but not limited to, those set forth below.
Uncertainties associated with the Merger could adversely affect our business, results of operations and financial condition.
Completion of the Merger is subject to various closing conditions, including but not limited to, obtaining necessary approvals and consents from shareholders and other regulatory agencies. There can be no assurance that the Company will receive the necessary approvals for the transaction or receive them within the expected timeframe. The announcement and pendency of the Merger, as well
18
as any delays in the expected timeframe could cause disruption in and create uncertainties, which could have an adverse effect on our business, results of operations and financial condition, regardless of whether the Merger is completed. These risks include:
|
· |
an adverse effect on our relationships with customers, vendors and employees; |
|
· |
a diversion of a significant amount of management time and resources towards the completion of the Merger; |
|
· |
being subject to certain restrictions on the conduct of our business; and |
|
· |
difficulties attracting and retaining key employees |
Failure to complete the Merger could adversely affect our business and the market price of our common stock.
There is no assurance that the closing of the Merger will occur. The Merger may be terminated under certain specified circumstances, including, but not limited to, a termination of the Merger Agreement by us to enter into an agreement for a “superior proposal”. If the Merger Agreement is terminated by us, we may be required to pay Parent a termination fee of $16,069,000. Payment of the breakup fee may require us to use available cash that would otherwise be used for general purposes or strategic initiatives, which could adversely affect our business, results of operations or financial condition.
Potential litigation instituted against the Company and its directors challenging the proposed Merger may prevent the Merger from becoming effective within the expected timeframe or at all.
Potential litigation related to the Merger may result in injunctive or other relief prohibiting, delaying or otherwise adversely affecting the Company’s ability to complete the Merger. Such relief may prevent the Merger from becoming effective within the expected timeframe or at all. In addition, defending against such claims may be expensive and divert management's attention and resources, which could adversely affect our business.
19
Item 1B. Unresolved Staff Comments.
None.
We are headquartered in Waynesboro, Virginia and own offices and facilities in a number of locations within our operating markets. Our offices and facilities are generally shared by our operating segments. We believe that our current facilities are adequate to meet our needs in our existing markets for the foreseeable future. The table below provides the location, description and approximate square footage of our significant owned properties.
|
Location |
Property Description |
Approximate Square Footage |
|
Harrisonburg, VA |
Competitive POP |
2,500 |
|
Troutville, VA |
Switch and Video Headend Building |
11,900 |
|
Clifton Forge, VA |
Switch Building |
6,600 |
|
Covington, VA |
Service Center |
13,000 |
|
Waynesboro, VA |
Service Center |
9,100 |
|
Daleville, VA |
Regional Operations Center |
21,000 |
|
Covington, VA |
Switch Building |
20,800 |
|
Waynesboro, VA |
Corporate Headquarters |
30,000 |
|
Waynesboro, VA |
Switch Building |
33,920 |
|
Daleville, VA |
Service Center |
9,400 |
|
Washington, PA |
Competitive POP |
1,580 |
We also lease the following significant properties:
|
· |
Our Charleston, West Virginia regional operations center (wireline switching) under a sub-lease from a subsidiary of Shenandoah Telecommunications Co. for approximately 3,200 square feet of this space; |
|
· |
Our Charleston, West Virginia switch building under a lease agreement by and between Nelson Trust and FiberNet, LLC dated April 19, 2005, for approximately 9,100 square feet of space; |
|
· |
Our Charleston, West Virginia office and switch building under a lease agreement by and between Williams Land Company and Mountaineer Telecommunications, LLC dated April 12, 2005, for approximately 21,100 square feet of space; |
|
· |
Our Canonsburg, Pennsylvania regional operations center with a parallel NOC under a lease agreement by and between Southpointe Two Lot 12, L.P. and Lumos Networks of West Virginia, Inc. dated April 29, 2014, for approximately 8,800 square feet of space; and |
|
· |
Our Richmond, Virginia regional operations center under a lease agreement by and between Highwoods Realty Limited Partnership and Lumos Networks, Inc. dated October 1, 2014, for approximately 4,200 square feet of space. |
We are involved in routine litigation in the ordinary course of our business, including litigation involving disputes relating to our billings to other carriers for access to our network (see Note 14 in Part II, Item 8. Financial Statements and Supplementary Data). We do not believe that any pending or threatened litigation of which we are aware will have a material adverse effect on our financial condition, results of operations or cash flows.
Item 4. Mine Safety Disclosures.
Not applicable.
20
Item 5. Market for Registrant’s Common Equity, Related Stockholder Matters and Issuer Purchases of Equity Securities.
Market Information
Our common stock is traded on the NASDAQ Global Market under the symbol “LMOS.” On March 15, 2017, the last reported sale price for our common stock was $17.75 per share.
Our common stock has been traded on the NASDAQ Global Market under the symbol “LMOS” since November 1, 2011. Prior to that time, there was no established public trading market for our common stock. The following table sets forth the high and low prices per share of our common stock for each of the quarters in 2016 and 2015, which correspond to our quarterly fiscal periods for financial reporting purposes. No cash dividends were declared during 2016 or 2015.
|
|
Stock Price per Share |
||||||||
|
|
High |
Low |
Cash Dividends Declared per Common Share |
||||||
|
2015: |
|||||||||
|
First Quarter |
$ |
18.29 |
$ |
15.25 |
$ |
- |
|||
|
Second Quarter |
15.95 | 13.33 |
- |
||||||
|
Third Quarter |
14.70 | 11.30 |
- |
||||||
|
Fourth Quarter |
13.65 | 11.12 |
- |
||||||
|
|
|||||||||
|
2016: |
|||||||||
|
First Quarter |
$ |
13.20 |
$ |
10.42 |
$ |
- |
|||
|
Second Quarter |
13.05 | 10.89 |
- |
||||||
|
Third Quarter |
14.54 | 10.94 |
- |
||||||
|
Fourth Quarter |
15.85 | 13.44 |
- |
||||||
21
Stock Performance Graph
The following indexed line graph indicates our total return to stockholders from November 1, 2011 (the first day our Common Stock began trading on the NASDAQ Global Market) to December 31, 2016, as compared to the total return for the NASDAQ Composite index and the NASDAQ Telecommunications Index for the same period. The calculations in the graph assume that $100 was invested on November 1, 2011 in our Common Stock and each index and also assume dividend reinvestment.
Cumulative Total Shareholder Return
Lumos Networks, NASDAQ Composite Index
and NASDAQ Telecommunications Index
(11/1/11 - 12/31/16)
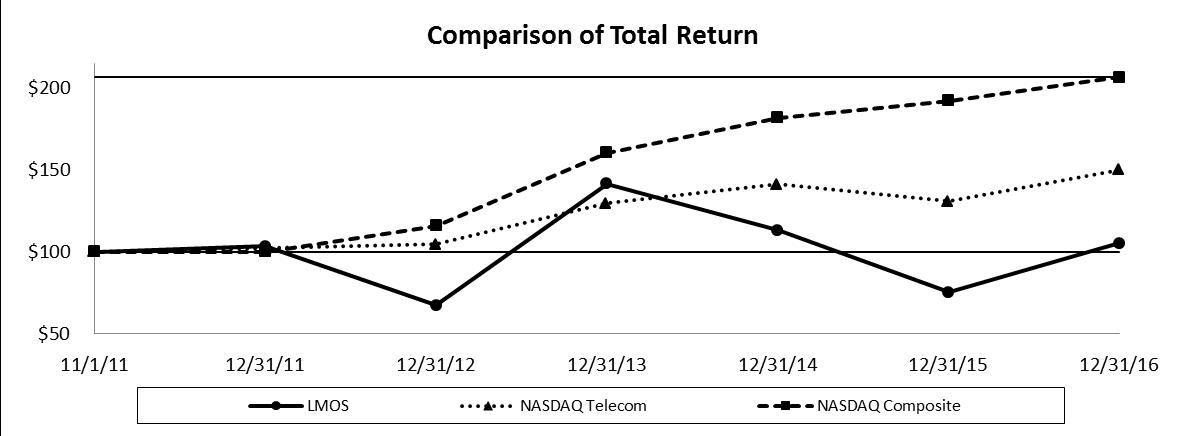
22
|
|
December 31, |
December 31, |
December 31, |
December 31, |
December 31, |
|||||||||
|
Lumos Networks Corp. |
$ |
67 |
$ |
141 |
$ |
113 |
$ |
75 |
$ |
105 | ||||
|
NASDAQ Composite Index |
$ |
116 |
$ |
160 |
$ |
182 |
$ |
192 |
$ |
206 | ||||
|
NASDAQ Telecommunications Index |
$ |
105 |
$ |
130 |
$ |
141 |
$ |
131 |
$ |
150 |
Holders
There were approximately 2,900 holders of our common stock on March 15, 2017.
Dividends
On March 4, 2015, our board of directors terminated our quarterly dividend in favor of allocating capital to growth opportunities. As such, no cash dividends were declared in 2015 or 2016.
Issuer Purchases of Equity Securities
The Company does not currently have a share repurchase program in effect. However, from time to time the Company repurchases shares of common stock from employee plan participants for settlement of tax withholding obligations in connection with the vesting of restricted stock grants issued pursuant to the Company’s 2011 Equity and Cash Incentive Plan. The number of shares repurchased and the average price paid per share for each month in the three-months ended December 31, 2016 are as follows:
|
Period |
(a) |
(b) |
(c) |
(d) |
|||||
|
October 1, 2016 - October 31, 2016 |
2,451 |
$ |
14.42 |
N/A |
N/A |
||||
|
November 1, 2016 - November 30, 2016 |
- |
$ |
- |
N/A |
N/A |
||||
|
December 1, 2016 - December 31, 2016 |
- |
$ |
- |
N/A |
N/A |
||||
|
|
2,451 |
$ |
14.42 |
N/A |
|||||
Credit Agreement
Amounts that can be made available to pay dividends or to repurchase shares are limited by a restricted payment basket in our Credit Agreement.
23
Item 6. Selected Financial Data
SELECTED HISTORICAL FINANCIAL INFORMATION(1)
|
|
Lumos Networks Corp. Year Ended December 31, |
||||||||||||||
|
(In thousands, except per share amounts) |
2016 |
2015 |
2014 |
2013 |
2012 |
||||||||||
|
Consolidated Statements of Income Data: |
|||||||||||||||
|
Operating Revenues |
$ |
206,899 |
$ |
204,269 |
$ |
201,456 |
$ |
207,475 |
$ |
206,871 | |||||
|
|
|||||||||||||||
|
Operating Expenses |
|||||||||||||||
|
Cost of Revenue, exclusive of depreciation and amortization shown separately below |
38,973 | 42,205 | 42,978 | 45,366 | 49,608 | ||||||||||
|
Selling, general and administrative, exclusive of depreciation and amortization shown separately below (2), (3) |
84,978 | 77,292 | 62,672 | 73,800 | 76,413 | ||||||||||
|
Depreciation and amortization and accretion of asset retirement |
|||||||||||||||
|
obligations |
51,394 | 47,666 | 45,330 | 42,424 | 39,008 | ||||||||||
|
Restructuring charges |
1,940 | 638 |
- |
50 | 2,981 | ||||||||||
|
Gain on settlements, net |
- |
- |
- |
- |
(2,335) | ||||||||||
|
Total Operating Expenses, net |
177,285 | 167,801 | 150,980 | 161,640 | 165,675 | ||||||||||
|
Operating Income |
29,614 | 36,468 | 50,476 | 45,835 | 41,196 | ||||||||||
|
|
|||||||||||||||
|
Other Income (Expenses) |
|||||||||||||||
|
Interest expense |
(28,385) | (19,918) | (15,575) | (14,191) | (11,921) | ||||||||||
|
Gain (loss) on interest rate swap derivatives |
- |
665 | 492 | (144) | (1,898) | ||||||||||
|
Other income (expense), net |
389 | 114 | 664 | (1,587) | 81 | ||||||||||
|
Total Other Expenses, net |
(27,996) | (19,139) | (14,419) | (15,922) | (13,738) | ||||||||||
|
Income Before Income Taxes |
1,618 | 17,329 | 36,057 | 29,913 | 27,458 | ||||||||||
|
Income Tax Expense |
1,962 | 7,146 | 14,409 | 12,019 | 11,010 | ||||||||||
|
|
|||||||||||||||
|
Net (Loss) Income |
(344) | 10,183 | 21,648 | 17,894 | 16,448 | ||||||||||
|
|
|||||||||||||||
|
Net Income Attributable to Noncontrolling Interests |
(179) | (157) | (120) | (121) | (108) | ||||||||||
|
Net (Loss) Income Attributable to Lumos Networks Corp. |
$ |
(523) |
$ |
10,026 |
$ |
21,528 |
$ |
17,773 |
$ |
16,340 | |||||
|
|
|||||||||||||||
|
Basic and Diluted Earnings (Loss) per Common Share |
|||||||||||||||
|
Attributable to Lumos Networks Corp. Stockholders |
|||||||||||||||
|
|
|||||||||||||||
|
Basic (Loss) Earnings per Share |
$ |
(0.02) |
$ |
0.44 |
$ |
0.97 |
$ |
0.81 |
$ |
0.78 | |||||
|
Diluted (Loss) Earnings per Share |
$ |
(0.02) |
$ |
0.43 |
$ |
0.95 |
$ |
0.80 |
$ |
0.76 | |||||
|
|
|||||||||||||||
|
Cash Dividends Declared per Share - Common Stock |
$ |
- |
$ |
- |
$ |
0.56 |
$ |
0.56 |
$ |
0.56 | |||||
24
|
|
As of December 31, |
||||||||||||||
|
(In thousands) |
2016 |
2015 |
2014 |
2013 |
2012 |
||||||||||
|
Balance Sheet Data: |
|||||||||||||||
|
Cash and cash equivalents |
$ |
33,575 |
$ |
13,267 |
$ |
14,140 |
$ |
14,114 |
$ |
2 | |||||
|
Marketable securities |
38,081 | 88,811 | 16,870 | 38,480 |
- |
||||||||||
|
Property and equipment, net |
536,288 | 498,944 | 429,451 | 378,723 | 336,589 | ||||||||||
|
Total assets |
753,372 | 745,372 | 611,807 | 592,369 | 509,227 | ||||||||||
|
Total long-term debt |
468,415 | 466,700 | 368,177 | 373,336 | 308,290 | ||||||||||
|
Stockholders' equity attributable to |
|||||||||||||||
|
Lumos Networks Corp. |
$ |
135,174 |
$ |
131,392 |
$ |
92,677 |
$ |
86,333 |
$ |
64,050 | |||||
|
(1) |
During 2016 certain presentation changes have been made within the operating expense line items on the consolidated statements of operations. The operating expense line items for the years ended December 31, 2015, 2014, 2013 and 2012 have been retrospectively revised in order to conform to the current year presentation. Specifically, the previously reported line item “network access costs” has been removed and the new line item “cost of revenue” has been added along with the necessary operating expense reclassifications. These reclassifications were not the result of an error and have no effect on previously reported operating income, net income or earnings per share. |
|
(2) |
Selling, general and administrative expenses include equity-based compensation expense, as follows: |
|
|
Year Ended December 31, |
||||||||||||||
|
(In thousands) |
2016 |
2015 |
2014 |
2013 |
2012 |
||||||||||
|
Equity-based compensation expense |
$ |
9,581 |
$ |
5,881 |
$ |
4,340 |
$ |
6,778 |
$ |
3,912 | |||||
|
(3) |
Selling, general and administrative expenses for the year ended December 31, 2014 include a curtailment gain of approximately $10.8 million recognized in 2014 due to the discontinuance of certain medical benefits under our postretirement medical plan. |
25
Item 7. Management’s Discussion and Analysis of Financial Condition and Results of Operations.
You should read the following discussion of our financial condition in conjunction with our consolidated financial statements and the related notes included herein (Item 8). This discussion contains forward looking statements that involve risks and uncertainties. For additional information regarding some of these risks and uncertainties that affect our business and the industry in which we operate, please see “Risk Factors” and “Forward-Looking Statements” elsewhere in this report.
Overview
Lumos Network Corp. (“Lumos Networks,” the “Company,” “we,” “us,” or “our”) is a fiber-based bandwidth infrastructure and service provider in the Mid-Atlantic region. We provide services to carriers and enterprise customers, including healthcare providers, local government agencies, financial institutions and educational institutions over our approximately 10,100 route-mile fiber network. Our principal products and services include Multiprotocol Label Switching (“MPLS”) based Ethernet, Metro Ethernet (“Metro E”), Fiber to the Cell site (“FTTC”) wireless backhaul and data transport services, wavelength transport services and IP services.
Our overall strategy is to transition into a pure-play fiber bandwidth infrastructure company through pursuit of expansion opportunities, both organic and inorganic. To achieve organic growth, our objective is to leverage and expand our fiber assets to capture the growing demand for data and mobility services among our carrier and enterprise customers in our marketplace. Our operating strategy is to (i) monetize our approximately 10,100 route-mile fiber optic network by selling bandwidth infrastructure services to new and existing carriers and enterprise customers while maintaining our ratio of data revenue from on-net traffic at or above 80%; (ii) use our “expansion” and "edge-out” strategies to enter into new markets and extend into markets adjacent to our existing footprint to increase our addressable market size; (iii) leverage our growing fiber network to expand to new fiber to the cell opportunities under long term contracts; (iv) proactively manage our churn through several initiatives including upgrading existing customers from legacy technologies to carrier Ethernet services and continually improving network and operational performance; (v) focus on managing resources from the declining legacy voice products into our faster growing and more profitable data products; and (vi) execute our success-based investment strategy in both organic and inorganic opportunities to grow our data business while maintaining our capital efficiency and expanding margins.
Merger with EQT Infrastructure
On February 18, 2017, we entered into a definitive agreement (“Merger Agreement”) by and among the Company, MTN Infrastructure TopCo, Inc. (“Parent”) and MTN Infrastructure BidCo, Inc. (“Merger Sub”), pursuant to which we will be acquired by EQT Infrastructure investment strategy (“EQT Infrastructure”), subject to shareholder approval, regulatory approval and other customary closing conditions. Pursuant to the Merger Agreement, each outstanding share of common stock of the Company prior to the effective time of the Merger shall be automatically converted into the right to receive $18.00 in cash. Refer to the Current Reports filed on Form 8-K on February 21, 2017 and February 22, 2017 for further information related to the merger.
Business Segments
Our operating segments generally align with our major product and service offerings and coincide with the way that our chief operating decision makers measured performance and allocated resources during 2016. Our current reportable operating segments are data, residential and small business (“R&SB”) and RLEC access.
Our data segment provided 59.7%, 56.0% and 52.9% of our total revenue for the years ended December 31, 2016, 2015 and 2014, respectively. Revenue for our data segment increased 8.1% for the year ended December 31, 2016, as compared to 2015. This segment, which includes our enterprise data, transport and FTTC product and service groups, represents the main growth opportunity and is the key focal point of our strategy. We market and sell these services primarily to carriers and enterprise customers, including healthcare providers, local government agencies, financial institutions, educational institutions and other enterprises. Our data product lines are growing at a pace that significantly exceeds the decline in our legacy product lines, and in the aggregate, due to our focus on on-net customers, they also provide a higher gross margin. A significant majority of our capital expenditures and sales force are dedicated to increasing revenue and profit from our data segment. We believe that a balanced split between enterprise and carrier revenue results in the most effective capital allocation and resulting profitability. Our ability to sustain or accelerate revenue growth in our data segment depends on our ability to obtain and effectively deploy capital to upgrade and expand our fiber network and implement our expansion and edge-out strategies in a timely and disciplined manner, attract new customers and successfully manage churn through customer retention programs, including upgrading existing customers from legacy technologies to carrier Ethernet services.
The 8.1% growth in our data segment revenues in 2016 was achieved primarily through new FTTC connections with wireless carriers deploying long-term evolution (“LTE”) services and bandwidth upgrades on existing contracts, improving enterprise penetration within our existing and new markets and providing greater Ethernet bandwidth to enterprise customers. This is reflected by the addition of 205 FTTC sites and 299 lit buildings in 2016. Our marketing and sales efforts are focused on taking advantage of increased carrier bandwidth demand, particularly for long-term FTTC contracts from wireless carriers that are deploying long-term evolution (“LTE”) data services, selling into our expansion and edge out markets (with an emphasis on targeting large enterprise customers in
26
our expansion markets of Richmond, VA and Norfolk, VA), maximizing the use of our carrier end user distribution channel, providing connection to data centers for our enterprise customers and improving penetration in existing markets. As of December 31, 2016, we had 1,304 cell towers and 2,031 buildings connected to our fiber network, including 36 data centers. Our FTTC revenue increased $8.2 million, or 28.8%, as a result of the growth in connected towers as well as the addition of second tenants and bandwidth upgrades on existing towers. Revenues from our enterprise data products increased $6.5 million, or 14.2%, due to growth in our metro Ethernet and dedicated Internet product lines. The growth in FTTC and enterprise data revenues was partially offset by the year-over-year decline in our revenue from data transport products, which have been negatively impacted by network grooming as existing customers redesign their networks and upgrade from time division multiplexing (“TDM”) technology to Ethernet products to improve efficiency. As we continue to implement our data growth strategy, which includes monetizing our recently expanded fiber optic network in the key Virginia markets of Richmond and Norfolk, we believe that the effect of churn on legacy product lines will continue to be more than offset by revenues from carrier Ethernet products, including long-term FTTC contracts, new enterprise customers and expanded bandwidth services with existing customers.
Our R&SB segment provided 30.6%, 32.9% and 35.8% of our total revenue for the years ended December 31, 2016, 2015 and 2014, respectively. This segment includes legacy voice and IP services products targeted at our residential and small business customers. Revenue declined 5.8% for our R&SB segment in 2016 as compared to 2015 primarily due to the decline in revenues from legacy voice products. This decline is attributable to voice line loss resulting from residential wireless substitution, technology changes and product replacement by competitive voice service offerings from cable operators in our markets. We currently expect aggregate revenue from these businesses will continue to decline.
Our RLEC access segment provided 9.7%, 11.1% and 11.3% of our total revenue for the years ended December 31, 2016, 2015 and 2014, respectively. This business requires limited incremental capital to maintain the underlying assets and delivers reasonably predictable cash flows. However, revenue decline over time is expected due to access line loss and regulatory actions taken to reduce intra-state tariffs by applicable regulatory authorities, principally the FCC and the SCC. In 2011, the FCC released an order comprehensively reforming its Universal Service Fund (“USF”) and intercarrier compensation systems. In the order, the FCC determined that interstate and intrastate access charges, as well as local reciprocal compensation, should be eliminated entirely over time. These FCC pricing reductions commenced on July 1, 2012 and continue through July 1, 2020. However, a portion of the access revenue previously received from carriers is being recovered through payments from the FCC’s “Connect America Fund” (“CAF”) and from increases in charges to end user subscribers in the form of rate increases and the FCC’s “Access Recovery Charge”. These new payments and revenues were also effective July 1, 2012. These actions directly impact the access rates charged by our RLECs, which provide service to the rural Virginia cities of Waynesboro and Covington, and portions of the Virginia counties of Alleghany, Augusta and Botetourt. Our total revenues derived from cost recovery mechanisms, including the USF and the CAF, were $19.0 million, $21.4 million and $22.5 million for the years ended December 31, 2016, 2015 and 2014, respectively, most of which are reported in our RLEC access segment.
Our R&SB and RLEC access segments require limited incremental capital to maintain the underlying assets and deliver predictable cash flows. Despite declining revenues, we expect cash flows from these legacy businesses to continue to significantly contribute to funding the capital investment in our growing data segment.
Our operating income margins were 14.3%, 17.9% and 25.1% for the years ended December 31, 2016, 2015 and 2014, respectively. Excluding a $10.8 million curtailment gain recognized in 2014 as a result of the discontinuance of certain postretirement medical benefits, our operating income margins were 19.7% in 2014. Our Contribution Margin ratios, as defined below, were 75.0%, 74.2% and 73.7% for the years ended December 31, 2016, 2015 and 2014, respectively. Our Adjusted EBITDA margins, as defined below, were 46.0%, 45.0% and 50.0% for the years ended December 31, 2016, 2015 and 2014, respectively. Excluding the curtailment gain, our Adjusted EBITDA margin was 44.6% for 2014. Our Contribution Margin ratios and our Adjusted EBITDA margin for 2016 increased slightly as compared to 2015 as the result of the increase in operating revenues and lower cost of revenue we experienced, partially offset by higher selling, general and administrative expenses. Our operating income margins are impacted by increased depreciation expense resulting from our capital investments, primarily in our fiber optic network, as well as restructuring charges incurred primarily during 2016 and 2015.
Operating Revenues
Our revenues are generated from the following segments:
|
· |
Data, which includes the following products: enterprise data (metro Ethernet, dedicated Internet, VoIP, and private line), transport, and FTTC; |
|
· |
R&SB, which includes legacy voice products (local lines, PRI, long distance, toll and directory services and other voice services) and IP services (integrated access, DSL, fiber-to-the-premise broadband XL and IP-based video). This segment also includes revenues from switched access services provided to other carriers in our competitive markets; and |
|
· |
RLEC access, which primarily includes switched access provided to other carriers in our RLEC markets. |
27
Operating Expenses
Our operating expenses are incurred from the following categories:
|
· |
Cost of revenue, exclusive of depreciation and amortization, including usage-based access charges, long distance, directory, operator services and other direct costs incurred in accessing other telecommunications providers' networks in order to provide telecommunication services to our end-user customers and leased facility expenses for connection to other carriers; |
|
· |
Selling, general and administrative, exclusive of depreciation and amortization, including: |
|
o |
Direct operating and selling costs, which include salaries, wages and benefits of field personnel, subscriber based third party licensing and maintenance fees, sales commissions and property taxes, repair and maintenance and utilities necessary to own and operate customer equipment and fiber connecting this equipment, |
|
o |
Indirect operating costs, which include salaries, wages and benefits of network operations, customer care, engineering, program management, sales, warehousing, product management and service delivery personnel and costs to maintain and operate our core fiber network, and |
|
o |
Corporate general and administrative costs, which includes billing, bad debt expenses, taxes other than income and property taxes allocable to categories above, executive services, accounting, legal, purchasing, information technology, human resources and other corporate general and administrative expenses, including earned bonuses and equity-based compensation expense related to stock and option instruments held by employees and non-employee directors and amortization of actuarial losses and other gains or losses related to retirement plans; |
|
· |
Depreciation and amortization, including depreciable long-lived property, plant and equipment and amortization of intangible assets where applicable; |
|
· |
Accretion of asset retirement obligations; and |
|
· |
Restructuring charges. |
Contribution Margin
Contribution Margin, as defined by us, is net income or loss attributable to Lumos Networks Corp. before interest, income taxes, depreciation and amortization, accretion of asset retirement obligations, net income attributable to noncontrolling interests, other (income) expenses, net, employee separation charges, restructuring charges, gain or loss on interest rate swap derivatives, corporate general and administrative costs (as defined above), inclusive of equity-based compensation, acquisition and separation related costs and amortization of actuarial gains or losses and indirect operating costs (as defined above). Contribution Margin ratio is calculated as Contribution Margin over operating revenues.
Contribution Margin is a non-GAAP financial performance measure. It should not be considered in isolation, as an alternative to, or more meaningful than measures of financial performance determined in accordance with GAAP. Management believes that Contribution Margin is a meaningful measure related to the incremental cash flow delivered by new billings that provides relevant and useful information to investors for comparing performance period to period against peer companies and for comparing profitability of the Company’s businesses. Management utilizes Contribution Margin internally to assess the profitability of the Company’s product groups and for capital allocation decision-making. Management also uses Contribution Margin for budget planning purposes and for other strategic planning initiatives.
28
The following is a reconciliation of net (loss) income attributable to Lumos Networks Corp. to Contribution Margin, as defined by us, on a consolidated basis for the years ended December 31, 2016, 2015 and 2014:
|
|
Year Ended December 31, |
|||||||||
|
(In thousands) |
2016 |
2015 |
2014 |
|||||||
|
Net (Loss) Income Attributable to Lumos Networks Corp. |
$ |
(523) |
$ |
10,026 |
$ |
21,528 | ||||
|
Net Income Attributable to Noncontrolling Interests |
179 | 157 | 120 | |||||||
|
Net (Loss) Income |
(344) | 10,183 | 21,648 | |||||||
|
Income tax expense |
1,962 | 7,146 | 14,409 | |||||||
|
Interest expense |
28,385 | 19,918 | 15,575 | |||||||
|
Gain on interest rate swap derivatives |
- |
(665) | (492) | |||||||
|
Other income, net |
(389) | (114) | (664) | |||||||
|
Operating Income |
29,614 | 36,468 | 50,476 | |||||||
|
Depreciation and amortization and accretion |
||||||||||
|
of asset retirement obligations |
51,394 | 47,666 | 45,330 | |||||||
|
Restructuring charges |
1,940 | 638 |
- |
|||||||
|
Indirect operating costs |
36,421 | 35,590 | 34,580 | |||||||
|
Corporate general and administrative costs, including equity-based compensation and acquisition and separation related charges |
35,757 | 31,112 | 18,071 | |||||||
|
Contribution Margin |
$ |
155,126 |
$ |
151,474 |
$ |
148,457 | ||||
Adjusted EBITDA
Adjusted EBITDA, as defined by us, is net income or loss attributable to Lumos Networks Corp. before interest, income taxes, depreciation and amortization, accretion of asset retirement obligations, net income attributable to noncontrolling interests, other (income) expenses, net, equity-based compensation, amortization of actuarial gains or losses, employee separation charges, restructuring charges, acquisition and separation related charges and gain on interest rate swap derivatives. Adjusted EBITDA margin is calculated as the ratio of Adjusted EBITDA to operating revenues.
Adjusted EBITDA is a non-GAAP financial performance measure. It should not be considered in isolation, as an alternative to, or more meaningful than measures of financial performance determined in accordance with GAAP. Management believes that Adjusted EBITDA is a standard measure of operating performance and liquidity that is commonly reported in the telecommunications and high speed data transport industry and provides relevant and useful information to investors for comparing performance period to period and for comparing financial performance of similar companies. Management utilizes Adjusted EBITDA internally to assess business performance, the ability to meet future capital expenditure and working capital requirements, to incur indebtedness if necessary, and to fund continued growth. Management also uses Adjusted EBITDA for budget planning purposes and as factors in the Company’s employee compensation programs.
29
The following table provides a reconciliation of net (loss) income attributable to Lumos Networks Corp. to Adjusted EBITDA, as defined by us, on a consolidated basis for the years ended December 31, 2016, 2015 and 2014:
|
|
Year Ended December 31, |
|||||||||
|
(In thousands) |
2016 |
2015 |
2014 |
|||||||
|
Net (Loss) Income Attributable to Lumos Networks Corp. |
$ |
(523) |
$ |
10,026 |
$ |
21,528 | ||||
|
Net Income Attributable to Noncontrolling Interests |
179 | 157 | 120 | |||||||
|
Net (Loss) Income |
(344) | 10,183 | 21,648 | |||||||
|
Income tax expense |
1,962 | 7,146 | 14,409 | |||||||
|
Interest expense |
28,385 | 19,918 | 15,575 | |||||||
|
Gain on interest rate swap derivatives |
- |
(665) | (492) | |||||||
|
Other income, net |
(389) | (114) | (664) | |||||||
|
Operating Income |
29,614 | 36,468 | 50,476 | |||||||
|
Depreciation and amortization and accretion |
||||||||||
|
of asset retirement obligations |
51,394 | 47,666 | 45,330 | |||||||
|
Amortization of actuarial losses |
1,350 | 1,350 | 248 | |||||||
|
Equity-based compensation |
9,581 | 5,881 | 4,340 | |||||||
|
Restructuring charges |
1,940 | 638 |
- |
|||||||
|
Acquisition and separation related charges |
1,211 |
- |
- |
|||||||
|
Employee separation charges |
- |
- |
244 | |||||||
|
Adjusted EBITDA |
$ |
95,090 |
$ |
92,003 |
$ |
100,638 | ||||
Other Income (Expenses)
Our other income (expenses) are generated (incurred) from interest expense on debt instruments and capital lease obligations, including amortization of debt discounts and issuance costs, gains or losses on interest rate swap derivatives and other income or expense, which includes interest income and fees, expenses related to our senior secured credit facility and, as appropriate under the circumstances, secondary public offering and stock registration costs and write-off of unamortized debt issuance costs.
Income Taxes
Our income tax expense and effective tax rate increases or decreases based upon changes in a number of factors, including primarily the amount of our pre-tax income or loss, non-deductible interest and other expenses and state minimum tax assessments.
Noncontrolling Interests in Earnings of Subsidiaries
We have a partnership through our RLEC with a 46.3% noncontrolling interest that owns certain signaling equipment and provides services to a number of small RLECs and to TNS (an inter-operability solution provider).
Results of Operations
Year ended December 31, 2016 compared to year ended December 31, 2015
Operating revenues increased $2.6 million, or 1.3%, from 2015 to 2016 resulting from an increase in data segment revenues of $9.3 million, partially offset by decreases in R&SB segment revenues of $3.9 million and RLEC access segment revenues of $2.8 million. The growth in data segment revenues was primarily driven by increases in FTTC revenue of $8.2 million and enterprise data revenue of $6.5 million, which increases were partially offset by declines in transport revenues. The $3.9 million decline in R&SB segment revenues is due primarily to line loss from legacy voice products. For further information regarding these revenue fluctuations, see “Operating Revenues” below.
Operating income decreased $6.9 million from $36.5 million in 2015 to $29.6 million in 2016 due primarily to a $7.7 million increase in other selling, general and administrative expenses, a $3.8 million increase in depreciation and amortization expense and $1.9 million in restructuring charges. These increased costs were partially offset by a $5.9 million increase in gross margin (operating revenues less cost of revenue). Variances in the individual line items on the consolidated statements of operations are described in the “Operating Expenses” section below.
Net income attributable to Lumos Networks decreased $10.5 million from 2015 to 2016. Reflected in these results was a $6.9 million decrease in operating income and an increase in interest expense of $9.1 million (net of changes in the fair value of interest rate swap derivatives), partially offset by a decrease in income tax expense of $5.2 million.
30
Contribution Margin increased $3.7 million from 2015 to 2016. Adjusted EBITDA was $95.1 million in 2016 compared to Adjusted EBITDA of $92.0 million in 2015. The year-over-year increase in Contribution Margin and Adjusted EBITDA is primarily attributable to the increase in gross margin as described above and discussed in further detail below.
OPERATING REVENUES
The following table identifies our operating revenues by major product group for the years ended December 31, 2016 and 2015:
|
|
Year Ended December 31, |
|||||||||||
|
(Dollars in thousands) |
2016 |
2015 |
$ Variance |
%Variance |
||||||||
|
Operating Revenues: |
||||||||||||
|
Data: |
||||||||||||
|
Enterprise data |
$ |
52,339 |
$ |
45,820 |
$ |
6,519 | 14.2 |
% |
||||
|
Transport |
34,606 | 40,021 | (5,415) | (13.5) |
% |
|||||||
|
FTTC |
36,659 | 28,470 | 8,189 | 28.8 |
% |
|||||||
|
Total data |
123,604 | 114,311 | 9,293 | 8.1 |
% |
|||||||
|
R&SB: |
||||||||||||
|
Legacy voice |
41,322 | 45,235 | (3,913) | (8.7) |
% |
|||||||
|
IP services |
17,404 | 16,726 | 678 | 4.1 |
% |
|||||||
|
CLEC access |
4,602 | 5,253 | (651) | (12.4) |
% |
|||||||
|
Total R&SB |
63,328 | 67,214 | (3,886) | (5.8) |
% |
|||||||
|
RLEC Access |
19,967 | 22,744 | (2,777) | (12.2) |
% |
|||||||
|
Total operating revenues |
$ |
206,899 |
$ |
204,269 |
$ |
2,630 | 1.3 |
% |
||||
Data. Data revenues increased $9.3 million, or 8.1%, in 2016. The overall increase in data revenues is due to growth in FTTC services for wireless carriers and growth in enterprise data revenues, partially offset by churn in data transport revenues due to network grooming activities as described below:
|
· |
Enterprise Data. Enterprise data revenues increased 14.2% in 2016 primarily due to growth in revenues from our metro Ethernet and dedicated Internet products and reduced churn. We connected to 2,031 on-net buildings as of December 31, 2016, as compared to 1,732 as of December 31, 2015. The growth in these product revenues was partially offset by declines in private line and other legacy enterprise data products as a result of churn from competition from national carriers and cable operators in our markets and to a lesser extent due to customers upgrading from TDM to Ethernet products. |
|
· |
Transport. The 13.5% decrease in transport revenue was primarily attributable to network grooming activities by carriers as TDM technology is replaced by Ethernet. |
|
· |
FTTC. Revenues from our FTTC contracts grew 28.8% in 2016. This growth is attributable to a 18.7% increase in our fiber connections to wireless cell sites, from 1,099 at December 31, 2015 to 1,304 at December 31, 2016 and increased bandwidth to existing connected cell towers, primarily in our expansion markets. |
R&SB. Revenue from residential and small business products declined 5.8% in 2016 as compared to 2015. This decline was primarily due to the continuing churn of legacy voice products due to the increasing use of wireless devices and competition from cable operators in our markets as well as our shift in focus to VoIP services (which is included in data segment revenues). As of December 31, 2016, we operated approximately 22,991 RLEC telephone access lines and approximately 65,285 competitive voice lines, compared to approximately 24,421 and 73,794, respectively, as of December 31, 2015. This represents a 5.9% year-over-year decline in RLEC telephone access lines and an 11.5% year-over-year decline in competitive voice lines. Growth in fiber-to-the-premise products within our IP services product group such as Broadband XL and IP video was more than offset by declines in revenue from legacy DSL products. Our total Broadband XL subscribers increased from 7,649 at December 31, 2015 to 8,972 at December 31, 2016.
RLEC Access. Revenue from RLEC access decreased 12.2% from 2015 to 2016, which is the result of the intrastate access rate reductions mandated by regulatory reform and a step-down in the recovery amounts of certain intrastate access charges from the FCC’s Connect America Fund (“CAF”) discussed in the overview section above and a decrease in RLEC telephone access lines.
31
OPERATING EXPENSES
The following table identifies our operating expenses for the years ended December 31, 2016 and 2015:
|
|
Year Ended December 31, |
|||||||||||
|
(Dollars in thousands) |
2016 |
2015 |
$ Variance |
%Variance |
||||||||
|
Consolidated Operating Expenses: |
||||||||||||
|
Cost of Revenue, exclusive of depreciation and amortization shown separately below |
$ |
38,973 |
$ |
42,205 |
$ |
(3,232) | (7.7) |
% |
||||
|
Selling, general and administrative, exclusive of depreciation and amortization shown separately below |
84,978 | 77,292 | 7,686 | 9.9 |
% |
|||||||
|
Depreciation and amortization |
51,279 | 47,527 | 3,752 | 7.9 |
% |
|||||||
|
Accretion of asset retirement obligations |
115 | 139 | (24) | (17.3) |
% |
|||||||
|
Restructuring charges |
1,940 | 638 | 1,302 | 204.1 |
% |
|||||||
|
Total operating expenses |
$ |
177,285 |
$ |
167,801 |
$ |
9,484 | 5.7 |
% |
||||
Cost of Revenue, exclusive of Depreciation and Amortization. Cost of revenue decreased $3.2 million, or 7.7%, from the prior year primarily due to the overall decrease in voice access lines and network grooming, partially offset by increases in collocation costs as we expand and enhance our fiber network.
Selling, General and Administrative, exclusive of Depreciation and Amortization. Selling, general and administrative expenses increased $7.7 million, or 9.9%, in 2016 as compared to 2015 primarily as a result of a $3.7 million increase in equity-based compensation due primarily to an annual employee bonus paid in the form of immediately vested shares of our common stock and an increase in network maintenance and operating costs of $4.5 million and increases in other general and administrative costs, partially offset by a $1.3 million decrease in salaries, wages and benefits primarily due to increased capitalized labor and decreased sales commission in addition to the employee reduction-in-force.
Depreciation and Amortization. Depreciation and amortization increased $3.8 million, or 7.9%, over 2015. This net increase is attributable to a $6.0 million increase in depreciation expense, partially offset by a $2.2 million decrease in amortization expense. The increase in depreciation costs is a result of the year-over-year increase in our depreciable base of assets primarily from capital investment in our fiber network including infrastructure upgrades and enterprise and FTTC site installations. The decrease in amortization cost is attributable to run off of amortization for customer intangible assets under an accelerated amortization method based on these assets’ estimated patterns of benefit.
Restructuring Charges. We incurred $1.9 million in restructuring charges in 2016, which consisted of separation benefits associated with an employee reduction-in-force that was completed in 2016.
The following table identifies our operating expenses by segment for the years ended December 31, 2016 and 2015 and provides a reconciliation from total segment operating expenses to consolidated operating expenses for each period:
|
|
Year Ended December 31, |
|||||||||||
|
(Dollars in thousands) |
2016 |
2015 |
$ Variance |
%Variance |
||||||||
|
Segment Operating Expenses: |
||||||||||||
|
Data |
$ |
67,586 |
$ |
63,592 |
$ |
3,994 | 6.3 |
% |
||||
|
R&SB |
41,611 | 45,788 | (4,177) | (9.1) |
% |
|||||||
|
RLEC Access |
2,612 | 2,886 | (274) | (9.5) |
% |
|||||||
|
Total segment operating expenses |
$ |
111,809 |
$ |
112,266 |
$ |
(457) | (0.4) |
% |
||||
|
|
||||||||||||
|
Reconciliation of Segment Operating Expenses to Consolidated Operating Expenses: |
||||||||||||
|
Total segment operating expenses |
$ |
111,809 |
$ |
112,266 |
$ |
(457) | (0.4) |
% |
||||
|
Depreciation and amortization and |
||||||||||||
|
accretion of asset retirement obligations |
51,394 | 47,666 | 3,728 | 7.8 |
% |
|||||||
|
Equity-based compensation expense |
9,581 | 5,881 | 3,700 | 62.9 |
% |
|||||||
|
Acquisition and separation related charges |
1,211 |
- |
1,211 | (100.0) |
% |
|||||||
|
Restructuring charges |
1,940 | 638 | 1,302 | 204.1 |
% |
|||||||
|
Amortization of actuarial losses |
1,350 | 1,350 |
- |
- |
% |
|||||||
|
Total operating expenses |
$ |
177,285 |
$ |
167,801 |
$ |
9,484 | 5.7 |
% |
||||
32
Data. Total operating expenses attributed to our data segment increased $4.0 million, or 6.3%, from 2015 to 2016 due to a $2.1 million increase in direct operating and selling costs, a $1.4 million increase in indirect operating costs and a $0.5 million increase in corporate general and administrative costs. The increases in the direct operating and selling costs and the indirect operating costs are directly attributable to our investment of resources in our network operations to support the growth in this segment in 2016 and drive future growth. The increase in corporate general and administrative costs is primarily attributable to the increase in allocated corporate expenses as the data segment grows in relation to the other segments.
R&SB. The $4.2 million, or 9.1%, decrease in total operating costs attributed to our R&SB segment is primarily due to a $3.2 million decrease in cost of revenue, a $0.5 million decrease in indirect operating costs and a $0.6 million decrease in corporate general and administrative costs. The decreases in cost of revenue and indirect operating costs are due to an approximate 10.1% year-over-year decrease in voice lines, as reflected in the decline in segment revenues and network grooming activities. The decrease in corporate general and administrative costs is primarily attributable to the decrease in allocated corporate expenses as the data segment grows and we redirect resources to support and grow the data business.
RLEC Access. Operating costs for the RLEC access segment decreased $0.3 million, or 9.5%, primarily attributable to a decrease in allocated corporate general and administrative costs.
OTHER INCOME (EXPENSES) AND INCOME TAXES
The following table summarizes our other income (expenses) and income taxes for the years ended December 31, 2016 and 2015:
|
|
Year Ended December 31, |
|||||||||||
|
(Dollars in thousands) |
2016 |
2015 |
$ Variance |
%Variance |
||||||||
|
Interest expense |
$ |
(28,385) |
$ |
(19,918) |
$ |
(8,467) | 42.5 |
% |
||||
|
Gain on interest rate swap derivatives |
- |
665 | (665) | (100.0) |
% |
|||||||
|
Other income, net |
389 | 114 | 275 | 241.2 |
% |
|||||||
|
Total other expenses, net |
$ |
(27,996) |
$ |
(19,139) |
$ |
(8,857) | 46.3 |
% |
||||
|
Income tax expense |
$ |
1,962 |
$ |
7,146 |
$ |
(5,184) | (72.5) |
% |
||||
|
|
||||||||||||
Interest Expense. Interest expense in 2016 and 2015 primarily consists of incurred interest costs associated with our Credit Facility as well as amortization of debt issuance costs, and beginning in the third quarter of 2015, interest incurred on the 8% Notes as well as amortization of associated debt discounts and debt issuance costs. The year-over-year increase in interest expense of $8.5 million is attributable to the interest on the 8% Notes for the full year of 2016, partially offset by reduced interest costs on the Credit Facility due to lower interest rates and a partial prepayment using proceeds from the 8% Notes in 2015 (see Note 5 in Part II, Item 8. Financial Statements and Supplementary Data).
Gain on Interest Rate Swap Derivatives. This gain is reflective of mark-to-market adjustments to record the liability associated with the interest rate swap derivatives at fair value on the consolidated balance sheets, which is impacted by fluctuations in interest rates and other market factors. The interest rate swap derivatives expired on December 31, 2015 and were not replaced or renewed.
Other Income, net. Other income primarily consists of interest income earned on marketable securities during 2016 and 2015, which was partially offset by costs incurred for the secondary public stock offering (see Note 1 in Part II, Item 8. Financial Statements and Supplementary Data) for 2015.
Income Tax Expense. Income tax expense for the years ended December 31, 2016 and 2015 was $2.0 million and $7.1 million, respectively, which represents the federal statutory tax rate applied to pre-tax income and the effects of state income taxes and certain non-deductible charges for each period. Our recurring non-deductible expenses relate primarily to certain non-cash equity-based compensation and, beginning in the third quarter of 2015, non-deductible interest on the 8% Notes, which are treated as applicable high yield discount obligations (“AHYDO”) within the meaning of Section 163(i)(1) of the Internal Revenue Code, as amended. The decrease in income tax expense was primarily due to a decrease in income before taxes.
At December 31, 2016, we had unused federal net operating losses (“NOLs”) of approximately $69.3 million, net of adjustments for unrecognized income tax benefits (“UTBs”) and unrealized excess tax benefits on stock compensation. Our NOLs, if not utilized to reduce taxable income in future periods, will expire in varying amounts from 2022 through 2036. We believe that it is more likely than not that the reversal of current deferred tax liabilities and the results of future operations will be sufficient to realize the deferred tax assets.
33
Year ended December 31, 2015 compared to year ended December 31, 2014
Operating revenues increased $2.8 million, or 1.4%, from 2014 to 2015 resulting from an increase in data segment revenues of $7.7 million, partially offset by decreases in R&SB segment revenues of $4.8 million and RLEC access segment revenues of $0.1 million. The growth in data segment revenues was primarily driven by increases in FTTC revenue of $8.5 million and enterprise data revenue of $3.5 million, which was partially offset by declines in transport revenues. The $4.8 million decline in R&SB segment revenues is due primarily to line loss from legacy voice products. For further information regarding these revenue fluctuations, see “Operating Revenues” below.
Operating income decreased $14.0 million from $50.5 million in 2014 to $36.5 million in 2015 due primarily to the $10.8 million curtailment gain recognized in 2014 related to discontinuance of benefits under the postretirement medical plan referenced above, a $3.8 million increase in other selling, general and administrative expenses, a $2.3 million increase in depreciation and amortization expense, and $0.6 million in restructuring charges. These were partially offset by a $3.6 million increase in gross margin (operating revenues less cost of revenue). Variances in the individual line items on the consolidated statements of operations are described in the “Operating Expenses” section below.
Net income attributable to Lumos Networks decreased $11.5 million from 2014 to 2015. Reflected in these results was a $14.0 million decrease in operating income and an increase in interest expense of $4.2 million (net of changes in the fair value of interest rate swap derivatives), partially offset by a decrease in income tax expense of $7.3 million.
Contribution Margin increased $3.0 million from 2014 to 2015 due to the revenue increases and cost of revenue decreases discussed above.
Adjusted EBITDA was $92.0 million in 2015 compared to Adjusted EBITDA of $100.6 million in 2014. Excluding the curtailment gain for the postretirement medical plan, Adjusted EBITDA was $89.9 million for 2014. The year-over-year increase in Adjusted EBITDA, excluding the curtailment gain in 2014, is primarily attributable to the increase in total operating revenues, as described above and in further detail below.
OPERATING REVENUES
The following table identifies our operating revenues by major product group for the years ended December 31, 2015 and 2014:
|
|
Year Ended December 31, |
|||||||||||
|
(Dollars in thousands) |
2015 |
2014 |
$ |
% |
||||||||
|
Operating Revenues: |
||||||||||||
|
Data: |
||||||||||||
|
Enterprise data |
$ |
45,820 |
$ |
42,334 |
$ |
3,486 | 8.2 |
% |
||||
|
Transport |
40,021 | 44,373 | (4,352) | (9.8) |
% |
|||||||
|
FTTC |
28,470 | 19,935 | 8,535 | 42.8 |
% |
|||||||
|
Total data |
114,311 | 106,642 | 7,669 | 7.2 |
% |
|||||||
|
R&SB: |
||||||||||||
|
Legacy voice |
45,235 | 49,578 | (4,343) | (8.8) |
% |
|||||||
|
IP services |
16,726 | 16,645 | 81 | 0.5 |
% |
|||||||
|
CLEC access |
5,253 | 5,805 | (552) | (9.5) |
% |
|||||||
|
Total R&SB |
67,214 | 72,028 | (4,814) | (6.7) |
% |
|||||||
|
RLEC Access |
22,744 | 22,786 | (42) | (0.2) |
% |
|||||||
|
Total operating revenues |
$ |
204,269 |
$ |
201,456 |
$ |
2,813 | 1.4 |
% |
||||
Data. Data revenues increased $7.7 million, or 7.2%, in 2015. The overall increase in data revenues is due to growth in contracts with wireless carriers for FTTC services, new enterprise data contracts and increased services with existing customers, partially offset by churn in data transport revenues due to network grooming activities as described below:
|
· |
Enterprise Data. Enterprise data revenues increased 8.2% in 2015 primarily due to growth in revenues from our metro Ethernet and dedicated Internet products. We connected to 1,732 on-net buildings as of December 31, 2015, as compared to 1,477 as of December 31, 2014. The growth in these product revenues was partially offset by declines in private line and other legacy enterprise data products as a result of churn from competition from national carriers and cable operators in our markets and to a lesser extent due to customers upgrading from TDM to Ethernet products. |
|
· |
Transport. The 9.8% decrease in transport revenue was primarily attributable to network grooming activities by carriers as TDM technology is replaced by Ethernet. |
34
|
· |
FTTC. Revenues from our FTTC contracts grew 42.8% in 2015. This growth is attributable to a 28.1% increase in our fiber connections to wireless cell sites, from 858 at December 31, 2014 to 1,099 at December 31, 2015 and the addition of second tenants and increased bandwidth to existing connected cell towers. |
R&SB. Revenue from residential and small business products declined 6.7% in 2015 as compared to 2014. This decline was primarily due to the continuing churn of legacy voice products due to the increasing use of wireless devices and competition from cable operators in our markets as well as our shift in focus to VoIP services (which is included in data segment revenues). Growth in fiber-to-the-premise products within our IP services product group such as Broadband XL and IP video was more than offset by declines in revenue from legacy DSL products. Our total video subscribers increased from 5,352 at December 31, 2014 to 5,904 at December 31, 2015.
RLEC Access. Revenue from RLEC access was essentially flat year-over-year as declines in revenues due to the decrease in telephone access lines and intrastate access rate reductions mandated by regulatory rate reform was offset by recovery of certain additional intrastate access charges from the FCC’s CAF and other support as discussed in the overview section above.
OPERATING EXPENSES
The following table identifies our operating expenses for the years ended December 31, 2015 and 2014:
|
|
Year Ended December 31, |
|||||||||||
|
(Dollars in thousands) |
2015 |
2014 |
$ Variance |
%Variance |
||||||||
|
Consolidated Operating Expenses: |
||||||||||||
|
Cost of Revenue, exclusive of depreciation and amortization shown separately below |
$ |
42,205 |
$ |
42,978 |
$ |
(773) | (1.8) |
% |
||||
|
Selling, general and administrative, exclusive of depreciation and amortization shown separately below |
77,292 | 62,672 | 14,620 | 23.3 |
% |
|||||||
|
Depreciation and amortization |
47,527 | 45,212 | 2,315 | 5.1 |
% |
|||||||
|
Accretion of asset retirement obligations |
139 | 118 | 21 | 17.8 |
% |
|||||||
|
Restructuring charges |
638 |
- |
638 | 100.0 |
% |
|||||||
|
Total operating expenses |
$ |
167,801 |
$ |
150,980 |
$ |
16,821 | 11.1 |
% |
||||
Cost of Revenue, exclusive of Depreciation and Amortization. Cost of revenue decreased $0.8 million, or 1.8%, from the prior year primarily due to the overall decrease in voice access lines and network grooming, partially offset by increases in collocation costs as we expand and enhance our fiber network.
Selling, General and Administrative, exclusive of Depreciation and Amortization. Selling, general and administrative expenses increased $14.6 million, or 23.3%, in 2015 as compared to 2014 primarily as a result of a net curtailment gain of approximately $10.8 million recognized in 2014 due to the discontinuance of certain medical benefits under our postretirement medical plan, in addition to a $2.6 million increase in salaries, wages and benefit related costs due to increased headcount in our data business, partially offset by reduced headcount in our R&SB segment, and increases in retirement benefit plan costs, a $1.5 million increase in equity-based compensation primarily due to grant activity, and increases in operating taxes and other general and administrative costs. These increases were partially offset by decreases in advertising and marketing costs, professional fees and contracted services.
Depreciation and Amortization. Depreciation and amortization increased $2.3 million, or 5.1%, over 2014. This net increase is attributable to a $6.7 million increase in depreciation expense, partially offset by a $4.4 million decrease in amortization expense. The increase in depreciation costs is a result of the year-over-year increase in our depreciable base of assets primarily from capital investment in our fiber network including infrastructure upgrades and FTTC site installations. The decrease in amortization cost is attributable to run off of amortization for customer intangible assets under an accelerated amortization method based on these assets’ estimated patterns of benefit.
Restructuring Charges. We incurred $0.6 million in restructuring charges in 2015, which consisted of separation benefits associated with an employee reduction-in-force, primarily in our legacy businesses, that was completed in March 2015.
35
The following table identifies our operating expenses by segment for the years ended December 31, 2015 and 2014 and provides a reconciliation from total segment operating expenses to consolidated operating expenses for each period:
|
|
Year Ended December 31, |
|||||||||||
|
(Dollars in thousands) |
2015 |
2014 |
$ Variance |
%Variance |
||||||||
|
Segment Operating Expenses: |
||||||||||||
|
Data |
$ |
63,592 |
$ |
59,943 |
$ |
3,649 | 6.1 |
% |
||||
|
R&SB |
45,788 | 48,548 | (2,760) | (5.7) |
% |
|||||||
|
RLEC Access |
2,886 | 3,101 | (215) | (6.9) |
% |
|||||||
|
Total segment operating expenses |
$ |
112,266 |
$ |
111,592 |
$ |
674 | 0.6 |
% |
||||
|
|
||||||||||||
|
Reconciliation of Segment Operating Expenses to Consolidated Operating Expenses: |
||||||||||||
|
Total segment operating expenses |
$ |
112,266 |
$ |
111,592 |
$ |
674 | 0.6 |
% |
||||
|
Depreciation and amortization and |
||||||||||||
|
accretion of asset retirement obligations |
47,666 | 45,330 | 2,336 | 5.2 |
% |
|||||||
|
Equity-based compensation expense |
5,881 | 4,340 | 1,541 | 35.5 |
% |
|||||||
|
Employee separation charges |
- |
244 | (244) | (100.0) |
% |
|||||||
|
Restructuring charges |
638 |
- |
638 | 100.0 |
% |
|||||||
|
Amortization of actuarial losses |
1,350 | 248 | 1,102 | 444.4 |
% |
|||||||
|
Gain on curtailment of retiree medical benefits |
- |
(10,774) | 10,774 | (100.0) |
% |
|||||||
|
Total operating expenses |
$ |
167,801 |
$ |
150,980 |
$ |
16,821 | 11.1 |
% |
||||
Data. Total operating expenses attributed to our data segment increased $3.6 million, or 6.1%, from 2014 to 2015 due to a $1.2 million increase in cost of revenue, a $0.6 million increase in direct operating and selling costs, a $1.1 million increase in indirect operating costs and a $0.7 million increase in corporate general and administrative costs. The increases in cost of revenue, direct operating and selling costs and indirect operating costs are directly attributable to our investment of resources in our network operations to support the growth in this segment in 2015 and drive future growth. The increase in corporate general and administrative costs is primarily attributable to the increase in allocated corporate expenses as the data segment grows in relation to the other segments.
R&SB. The $2.8 million, or 5.7%, decrease in total operating costs attributed to our R&SB segment is primarily due to a $1.9 million decrease in cost of revenue and a $0.7 million decrease in corporate general and administrative costs, as well as slight decreases in direct operating and selling costs and indirect operating costs. The decreases in cost of revenue, direct operating and selling costs and indirect operating costs are due to the year-over-year decrease in voice lines, as reflected in the decline in segment revenues, network grooming activities and internal reorganization to shift resources away from the legacy businesses to our data segment. The decrease in corporate general and administrative costs is primarily attributable to the decrease in allocated corporate expenses as the data segment grows and we redirect resources to support and grow the data business.
RLEC Access. Operating costs for the RLEC access segment decreased $0.2 million, or 6.9%, primarily attributable to a decrease in corporate general and administrative costs.
OTHER INCOME (EXPENSES) AND INCOME TAXES
The following table summarizes our other income (expenses) and income taxes for the years ended December 31, 2015 and 2014:
|
|
Year Ended December 31, |
|||||||||||
|
(Dollars in thousands) |
2015 |
2014 |
$ Variance |
%Variance |
||||||||
|
Interest expense |
$ |
(19,918) |
$ |
(15,575) |
$ |
(4,343) | 27.9 |
% |
||||
|
Gain on interest rate swap derivatives |
665 | 492 | 173 |
N/M |
||||||||
|
Other income, net |
114 | 664 | (550) |
N/M |
||||||||
|
Total other expenses, net |
$ |
(19,139) |
$ |
(14,419) |
$ |
(4,720) | 32.7 |
% |
||||
|
Income tax expense |
$ |
7,146 |
$ |
14,409 |
$ |
(7,263) | (50.4) |
% |
||||
N/M – not meaningful
Interest Expense. Interest expense in 2015 and 2014 primarily consists of incurred interest costs associated with our Credit Facility as well as amortization of debt issuance costs, and beginning in the third quarter of 2015, interest incurred on the 8% Notes as well as amortization of associated debt discounts and debt issuance costs. The year-over-year increase in interest expense of $4.3 million is
36
attributable to the 8% Notes, partially offset by reduced interest costs on the Credit Facility due to lower interest rates and a partial prepayment using proceeds from the 8% Notes (see Note 5 in Part II, Item 8. Financial Statements and Supplementary Data).
Gain on Interest Rate Swap Derivatives. We recognized a gain on interest rate swap derivatives of $0.7 million and $0.5 million for the years ended December 31, 2015 and 2014, respectively. These gains are reflective of mark-to-market adjustments to record the liability associated with the interest rate swap derivatives at fair value on the consolidated balance sheets, which is impacted by fluctuations in interest rates and other market factors. The interest rate swap derivatives expired on December 31, 2015 and were not replaced or renewed.
Other Income, net. Other income primarily consists of interest income earned on marketable securities during 2015 and 2014, which was partially offset by costs incurred for the secondary public stock offering (see Note 1 in Part II, Item 8. Financial Statements and Supplementary Data) for 2015.
Income Tax Expense. Income tax expense for the years ended December 31, 2015 and 2014 was $7.1 million and $14.4 million, respectively, which represents the federal statutory tax rate applied to pre-tax income and the effects of state income taxes and certain non-deductible charges for each period. Our recurring non-deductible expenses relate primarily to certain non-cash equity-based compensation and, beginning in the third quarter of 2015, non-deductible interest on the 8% Notes, which are treated as applicable high yield discount obligations (“AHYDO”) within the meaning of Section 163(i)(1) of the Internal Revenue Code, as amended. The decrease in income tax expense was primarily due to a decrease in income before taxes. Our effective tax rate was 41.2% in 2015 as compared to 40.0% in 2014.
Quarterly Results
The following table sets forth selected unaudited consolidated quarterly statement of operations data for each of the quarters in 2016 and 2015. This unaudited quarterly information has been prepared on substantially the same basis as our consolidated financial statements appearing elsewhere in this report and includes all adjustments (consisting of normal recurring adjustments) we believe necessary for a fair statement of the unaudited consolidated quarterly data. The unaudited consolidated quarterly statement of operations data should be read together with the consolidated financial statements and related notes thereto included elsewhere in this report. The results for any quarter are not necessarily indicative of results for any future period, and you should not rely on them as such.
37
|
|
Quarter Ended: |
||||||||||||||||||||||
|
Summary Operating Results (Unaudited) |
December 31, |
September 30, |
June 30, |
March 31, |
December 31, |
September 30, |
June 30, |
March 31, |
|||||||||||||||
|
(In thousands, except per share amounts) |
2016 |
2016 |
2016 |
2016 |
2015 |
2015 |
2015 |
2015 |
|||||||||||||||
|
Operating Revenues |
|||||||||||||||||||||||
|
Data |
$ |
31,646 |
$ |
31,373 |
$ |
30,956 |
$ |
29,629 |
$ |
29,832 |
$ |
28,623 |
$ |
28,089 |
$ |
27,767 | |||||||
|
R&SB |
15,488 | 15,863 | 16,149 | 15,828 | 16,379 | 16,560 | 17,010 | 17,265 | |||||||||||||||
|
RLEC Access |
4,752 | 4,535 | 5,343 | 5,337 | 5,641 | 5,786 | 5,854 | 5,463 | |||||||||||||||
|
Total Operating Revenues |
51,886 | 51,771 | 52,448 | 50,794 | 51,852 | 50,969 | 50,953 | 50,495 | |||||||||||||||
|
|
|||||||||||||||||||||||
|
Operating Expenses |
|||||||||||||||||||||||
|
Data |
17,335 | 16,806 | 17,130 | 16,315 | 15,646 | 16,514 | 15,971 | 15,461 | |||||||||||||||
|
R&SB |
9,982 | 10,140 | 10,810 | 10,679 | 10,921 | 11,434 | 11,570 | 11,863 | |||||||||||||||
|
RLEC Access |
630 | 565 | 732 | 685 | 734 | 747 | 745 | 660 | |||||||||||||||
|
Operating expenses, before depreciation and |
|||||||||||||||||||||||
|
amortization and accretion of asset |
|||||||||||||||||||||||
|
retirement obligations, equity-based |
|||||||||||||||||||||||
|
compensation expense, employee |
|||||||||||||||||||||||
|
separation charges, restructuring charges, |
|||||||||||||||||||||||
|
amortization of actuarial losses, and |
|||||||||||||||||||||||
|
gain on curtailment of retiree medical benefits |
27,947 | 27,511 | 28,672 | 27,679 | 27,301 | 28,695 | 28,286 | 27,984 | |||||||||||||||
|
Depreciation and amortization and accretion |
|||||||||||||||||||||||
|
of asset retirement obligations |
14,275 | 12,762 | 12,432 | 11,925 | 12,449 | 11,836 | 11,479 | 11,902 | |||||||||||||||
|
Equity-based compensation expense |
1,104 | 1,661 | 1,286 | 5,530 | 1,645 | 1,454 | 1,557 | 1,225 | |||||||||||||||
|
Acquisition and separation related charges |
559 | 652 |
- |
- |
- |
- |
- |
- |
|||||||||||||||
|
Restructuring charges |
117 | (384) |
- |
2,207 | 1 |
- |
4 | 633 | |||||||||||||||
|
Amortization of actuarial losses |
337 | 338 | 337 | 338 | 338 | 337 | 338 | 337 | |||||||||||||||
|
Total Operating Expenses |
44,339 | 42,540 | 42,727 | 47,679 | 41,734 | 42,322 | 41,664 | 42,081 | |||||||||||||||
|
Operating Income |
7,547 | 9,231 | 9,721 | 3,115 | 10,118 | 8,647 | 9,289 | 8,414 | |||||||||||||||
|
|
|||||||||||||||||||||||
|
Other Income (Expenses) |
|||||||||||||||||||||||
|
Interest expense |
(7,220) | (7,164) | (7,012) | (6,989) | (6,896) | (5,817) | (3,719) | (3,486) | |||||||||||||||
|
Gain on interest rate swap derivatives |
- |
- |
- |
- |
220 | 198 | 165 | 82 | |||||||||||||||
|
Other income (expenses) |
69 | 48 | 98 | 174 | 203 | 58 | 96 | (243) | |||||||||||||||
|
Total Other Expenses, net |
(7,151) | (7,116) | (6,914) | (6,815) | (6,473) | (5,561) | (3,458) | (3,647) | |||||||||||||||
|
Income Before Income Taxes |
396 | 2,115 | 2,807 | (3,700) | 3,645 | 3,086 | 5,831 | 4,767 | |||||||||||||||
|
|
|||||||||||||||||||||||
|
Income tax expense (benefit)(1) |
250 | 1,046 | 1,527 | (861) | 925 | 1,774 | 2,438 | 2,009 | |||||||||||||||
|
Net Income (Loss) |
146 | 1,069 | 1,280 | (2,839) | 2,720 | 1,312 | 3,393 | 2,758 | |||||||||||||||
|
Net Income Attributable to |
|||||||||||||||||||||||
|
Noncontrolling Interests |
(42) | (46) | (36) | (55) | (46) | (33) | (44) | (34) | |||||||||||||||
|
Net Income (Loss) Attributable to Lumos |
|||||||||||||||||||||||
|
Networks Corp. |
$ |
104 |
$ |
1,023 |
$ |
1,244 |
$ |
(2,894) |
$ |
2,674 |
$ |
1,279 |
$ |
3,349 |
$ |
2,724 | |||||||
|
|
|||||||||||||||||||||||
|
Basic and Diluted Earnings (Loss) per Common |
|||||||||||||||||||||||
|
Share Attributable to Lumos Networks Corp. |
|||||||||||||||||||||||
|
Stockholders: |
|||||||||||||||||||||||
|
|
|||||||||||||||||||||||
|
Basic Earnings (Loss) per Share |
$ |
0.00 |
$ |
0.06 |
$ |
0.05 | (0.13) |
$ |
0.12 |
$ |
0.06 |
$ |
0.15 | 0.12 | |||||||||
|
Diluted Earnings (Loss) per Share |
$ |
0.00 |
$ |
0.06 |
$ |
0.05 | (0.13) |
$ |
0.12 |
$ |
0.06 |
$ |
0.14 | 0.12 | |||||||||
|
|
|||||||||||||||||||||||
|
Cash Dividends Declared per Share - |
|||||||||||||||||||||||
|
Common Stock |
$ |
- |
$ |
- |
$ |
- |
$ |
- |
$ |
- |
$ |
- |
$ |
- |
$ |
- |
|||||||
|
(1) |
During the fourth quarter of 2016, the Company recorded an adjustment to reduce income tax expense by $1.1 million to correct deferred taxes related to the 8% Notes, of which $0.6 million related to prior quarters in 2016 ($0.2 million per quarter) and $0.2 million related to the fourth quarter 2016. |
38
Liquidity and Capital Resources
For the years ended December 31, 2016, 2015 and 2014, our cash flow from operations totaled approximately $65.4 million, $66.7 million and $79.8 million, respectively. Our cash flows from operations are primarily generated by payments received from customers for data and voice communication services and carrier access to our network offset by payments to other carriers, payments to our employees, payments for interest and taxes and payments for other network operating costs and other selling, general and administrative expenses. We have also generated cash from debt financing activities for the primary purpose of funding investment in our fiber optic network, to facilitate growth and for general working capital requirements. Our cash on hand and marketable securities, which are generally available for operations and to fund long-term FTTC contracts, may also be used to repay debt obligations or fund other capital expenditures.
As of December 31, 2016, we had $570.0 million in aggregate long-term liabilities, consisting of $454.9 million in long-term debt, net of $29.8 million in debt discount and deferred issuance costs, and $115.1 million in other long-term liabilities, inclusive of deferred income tax liabilities of $97.0 million, pension and other postretirement obligations of $16.0 million and other long-term liabilities of $2.1 million. Our Credit Facility includes a revolving credit facility of $50 million (the “Revolver”), all of which was available for our working capital requirements and other general corporate purposes as of December 31, 2016.
Mandatory prepayments include an excess cash flow sweep equal to 50% of Excess Cash Flow, as defined under the Credit Agreement, for each fiscal year commencing in 2013 for so long as the leverage ratio exceeds 3.25:1.00. Based on the excess cash flow calculation as of December 31, 2016, no mandatory prepayment was due for the year ended December 31, 2016.
Under the Credit Agreement, certain of our subsidiaries are also bound by certain financial covenants. Noncompliance with any one or more of the debt covenants may have an adverse effect on our financial condition or liquidity in the event such noncompliance cannot be cured or should we be unable to obtain a waiver from the lenders of the Credit Facility.
As of December 31, 2016, our subsidiaries were in compliance with all of our debt covenants, and our ratios were as follows:
|
|
Actual |
Covenant Requirement at December 31, 2016 |
|
Total debt outstanding to EBITDA (as defined in the Credit Agreement) |
3.68 |
Not more than 4.75 |
|
Minimum interest coverage ratio |
7.27 |
Not less than 3.25 |
On January 2, 2015, we entered into a $28 million senior secured incremental term loan facility under the existing Credit Facility (“Term Loan C”) and amended certain terms of the Credit Facility (the “Amended Credit Facility”). The net proceeds from Term Loan C were used to fund capital expenditures for customer builds related to new FTTC contracts. Term Loan C will mature in 2019 with quarterly payments of 1% per annum. The Amended Credit Facility sets a maximum leverage ratio of 4.75:1.00 through December 31, 2016, 4.50:1.00 through December 31, 2017, 4.25:1.00 through December 31, 2018 and 4.00:1.00 thereafter.
On August 6, 2015, we closed on the issuance of unsecured promissory notes in an aggregate principal amount of $150 million (the “8% Notes”) to an affiliate of Pamplona Capital Management LLC (“Pamplona”). Net proceeds of the 8% Notes, after payment of closing costs, were used to pay off $40 million of our existing Credit Facility, with the remainder to be used for general corporate purposes, including to fund future growth opportunities. The 8% Notes bear interest at an annual fixed rate of 8.00% and mature on August 15, 2022. Interest is payable in arrears on a quarterly basis on August 15, November 15, February 15 and May 15 of each year, beginning on November 15, 2015. Interest is payable in cash or, at our election, through the issuance of additional notes or by adding the amount of the accrued interest to the unpaid principal amount of the 8% Notes outstanding at that time. We currently intend to pay the interest in cash.
In addition to the Credit Facility and the 8% Notes, we have capital leases on vehicles with original lease terms of four to five years and an IRU network capacity arrangement that are included as a component long-term debt on the consolidated balance sheets as of December 31, 2016. As of December 31, 2016, the combined total net present value of our future minimum lease payments was $7.8 million.
39
The following table presents a summary of our cash flow activity for the years ended December 31, 2016, 2015 and 2014.
|
|
Year Ended December 31, |
||||||||
|
(In thousands) |
2016 |
2015 |
2014 |
||||||
|
Net cash provided by operating activities |
$ |
65,376 |
$ |
66,745 |
$ |
79,809 | |||
|
Net cash used in investing activities |
(33,379) | (182,485) | (63,433) | ||||||
|
Net cash (used in) provided by financing activities |
(11,689) | 114,867 | (16,350) | ||||||
|
Increase (decrease) in cash and cash equivalents |
$ |
20,308 |
$ |
(873) |
$ |
26 | |||
Operating. The decrease in cash flows from operations in 2016 as compared to 2015 is primarily due to changes in working capital largely due to timing of payments to vendors.
The decrease in cash flows from operations in 2015 as compared to 2014 was also primarily due to changes in working capital largely due to timing of payments to vendors and a decrease in income taxes paid.
Investing. The decrease in cash used in investing activities from 2015 to 2016 is primarily due to a decrease in capital expenditures of $31.6 million and higher net proceeds from the sale of marketable securities of $122.9 million. Capital expenditures for 2016 were comprised of (i) $78.0 million for success-based customer and network expansion projects, (ii) $5.4 million for infrastructure upgrades and network maintenance, and (iii) $0.6 million for information technology and facility related projects net of decreases in inventory on hand.
The increase in cash used in investing activities from 2014 to 2015 was primarily due to an increase in capital expenditures of $31.6 million and purchases of marketable securities, net of sales and maturities, of $72.3 million in 2015, as compared to net proceeds of $21.2 million in 2014. This was partially offset by cash received from the broadband stimulus grant for reimbursement of qualified expenditures and the corresponding release of restricted funds totaling $8.0 million. Capital expenditures for 2015 were comprised of (i) $103.8 million for success-based customer and network expansion projects, (ii) $4.3 million for infrastructure upgrades and network maintenance, and (iii) $7.6 million for information technology, facility related projects and increase in inventory on hand.
Through December 31, 2016, we have developed a fiber network of approximately 10,100 route miles, of which 43% is owned by us and has been accumulated through our capital investment in fiber builds and strategic acquisitions over the past several years with the remaining approximately 57% of our network under IRU agreements. We intend to continue to invest in our fiber infrastructure. We currently expect to incur capital expenditures in 2017 associated with enterprise and carrier installations, data network enhancements and, to a lesser extent, to fund essential network facility upgrades and fiber-to-the-premise deployments for our R&SB segment. These capital expenditures are in addition to the business acquisitions completed in January 2017 and discussed below.
Financing. The net cash used in financing activities in 2016 consisted of repayment of principal on the Credit Facility and payments under capital lease obligations totaling $10.7 million, capital distributions to noncontrolling interests of $0.2 million and other equity-based compensation items totaling $0.7 million.
The net cash provided by financing activities in 2015 consisted of proceeds from the issuance of Term Loan C and the 8% Notes, net of debt issuance costs, of $168.3 million, partially offset by repayment of principal on the Credit Facility and payments under capital lease obligations totaling $50.4 million and other equity-based compensation items totaling $0.2 million. We also paid approximately $3.2 million in dividends.
As of December 31, 2016, we had approximately $33.6 million in cash and cash equivalents and approximately $38.1 million in marketable securities, all of which we consider to be available for current operations due to the short-term maturities and/or liquid nature of the holdings. In January 2017, the Company closed on its acquisitions of Clarity Communications, LLC and DC74, LLC and paid cash upon closing of approximately $10.0 million and $23.5 million, respectively. As of December 31, 2016 we had working capital (current assets minus current liabilities) of approximately $53.2 million. We expect that the cash we generate from operations combined with our cash on hand and marketable securities will be sufficient to satisfy our working capital requirements, capital expenditures and debt service requirements for the foreseeable future. Additionally, we have access to the Revolver, which is currently undrawn. However, if our assumptions prove incorrect or if there are other factors that increase our need for additional liquidity, such as material unanticipated losses, loss of customers or a significant reduction in demand for our services or other factors, or if we are successful in obtaining additional major FTTC contracts or we make additional acquisitions, we would expect to seek additional sources of funds through refinancing or other means including additional equity financing. There is no assurance that we could obtain such additional financing on acceptable terms, if at all. If available, additional equity financing may dilute our stockholders and debt financing may restrict our ability to raise future capital.
40
As discussed previously in “Regulation” and this “Management’s Discussion and Analysis”, events and actions taken by the FCC are projected to have a significant negative impact on our future cash flows from the RLEC access products, partially offset by the CAF payments to us.
Our board of directors declared cash dividends on our common stock of $0.14 per share in each of the four quarters of 2014. We paid $12.5 million in cash dividends to our common stockholders during the year ended December 31, 2014 and $3.2 million during the year ended December 31, 2015. On March 4, 2015, our board of directors terminated our quarterly dividend in favor of allocating capital to growth opportunities. As such, no dividends were declared in 2016 or 2015.
Contractual Obligations and Commercial Commitments
We have contractual obligations and commercial commitments that may affect our financial condition. The following table summarizes our significant contractual obligations and commercial commitments as of December 31, 2016:
|
|
Payments Due by Period |
||||||||||||||
|
(In thousands) |
Total (2) |
Less than one year |
One to three years |
Three to five years |
More than five years |
||||||||||
|
Long-term debt obligations (1),(3) |
$ |
490,385 |
$ |
13,030 |
$ |
327,355 |
$ |
- |
$ |
150,000 | |||||
|
Capital lease obligations (3) |
7,842 | 494 | 873 | 914 | 5,561 | ||||||||||
|
Operating lease obligations |
12,650 | 3,615 | 5,314 | 2,190 | 1,531 | ||||||||||
|
Purchase obligations (4) |
50,517 | 9,351 | 10,726 | 7,604 | 22,836 | ||||||||||
|
Total |
$ |
561,394 |
$ |
26,490 |
$ |
344,268 |
$ |
10,708 |
$ |
179,928 | |||||
(1)Represents the borrowings under the 2013 Credit Facility and 8% Notes (see Note 5 in Part II, Item 8. Financial Statements and Supplementary Data). Excludes $29.8 million of unamortized discount and debt issuance costs.
(2)Excludes certain benefit obligation projected payments under our qualified and non-qualified pension and other postretirement benefit plans (see Note 11 in Part II, Item 8. Financial Statements and Supplementary Data).
(3)Excludes interest payments.
(4)Purchase obligations include purchase commitments relating to capital expenditures and amounts payable under non-cancellable IRUs and other capacity contracts.
Off Balance Sheet Arrangements
We do not have any off balance sheet arrangements or financing activities with special purpose entities.
Critical Accounting Policies and Estimates
The fundamental objective of financial reporting is to provide useful information that allows a reader to comprehend our business activities. To aid in that understanding, management has identified our critical accounting policies for discussion herein. These policies have the potential to have a more significant impact on our consolidated financial statements, either because of the significance of the financial statement item to which they relate, or because they require judgment and estimation due to the uncertainty involved in measuring, at a specific point in time, events which are continuous in nature.
Principles of Consolidation
The consolidated financial statements include the accounts of the Company, Lumos Networks Operating Company, a wholly-owned subsidiary of the Company, and all of Lumos Networks Operating Company’s wholly-owned subsidiaries and those limited liability corporations where Lumos Networks Operating Company or certain of its subsidiaries, as managing member, exercised control. All significant intercompany accounts and transactions have been eliminated in consolidation.
Revenue Recognition
We recognize revenue when persuasive evidence of an arrangement exists, services are rendered or products are delivered, installed and functional, as applicable, the price to the buyer is fixed or determinable and collectability is reasonably assured. Certain services require payment in advance of service performance. In such cases, we record a service liability at the time of billing and subsequently recognize revenue ratably over the service period. We bill customers certain transactional taxes on service revenues. These transactional taxes are not included in reported revenues as they are recognized as liabilities at the time customers are billed.
We earn revenue by providing services through access to and usage of our network. Local service revenues are recognized as services are provided. Carrier data revenues are earned by providing switched access and other switched and dedicated services to other carriers. Revenues for equipment sales are recognized at the point of sale.
41
Trade Accounts Receivable
We sell our services to other communication carriers and to business and residential customers primarily in Virginia and West Virginia and portions of Maryland, Pennsylvania, Ohio and Kentucky. We have credit and collection policies to maximize collection of trade receivables and require deposits or prepayment of services on certain sales. We estimate an allowance for doubtful accounts based on a review of specific customers with large receivable balances and for the remaining customer receivables use historical results, current and expected trends and changes in credit policies.
Property, Plant and Equipment and Other Long-Lived Assets (Excluding Goodwill and Indefinite-Lived Intangible Assets)
Property, plant and equipment, finite-lived intangible assets and long-term deferred charges are recorded at cost and are reviewed for impairment whenever events or changes in circumstances indicate that the carrying amount should be evaluated pursuant to the subsequent measurement guidance described in Financial Accounting Standards Board (“FASB”) Accounting Standards Codification (“ASC”) 360-10-35. Impairment is determined by comparing the carrying value of these long-lived assets to management’s best estimate of future undiscounted cash flows expected to result from the use of the assets. If the carrying value exceeds the estimated undiscounted cash flows, the excess of the asset’s carrying value over the estimated fair value is recorded as an impairment charge.
We believe that no impairment indicators exist as of December 31, 2016 that would require us to perform impairment testing for long-lived assets, including property, plant and equipment, long-term deferred charges and finite-lived intangible assets to be held and used.
Depreciation of property, plant and equipment is calculated on a straight-line basis over the estimated useful lives of the assets, which we review and update based on historical experiences and future expectations. Buildings are depreciated over a 50-year life and leasehold improvements, which are categorized in land and buildings, are depreciated over the shorter of the estimated useful lives or the remaining lease terms. Network plant and equipment are generally depreciated over various lives from 3 to 50 years. Furniture, fixtures and other equipment are depreciated over various lives from 4 to 24 years.
Plant and equipment held under capital leases are amortized on a straight-line basis over the shorter of the lease term or estimated useful life of the asset. Amortization of assets held under capital leases, including a network capacity IRU arrangement and certain software licenses, is included with depreciation expense.
Goodwill and Indefinite-Lived Intangible Assets
Goodwill and franchise rights are considered to be indefinite-lived intangible assets. Indefinite-lived intangible assets are not subject to amortization but are instead tested for impairment annually or more frequently if an event indicates that the asset might be impaired. Our policy is to assess the recoverability of indefinite-lived assets annually on October 1 or more frequently if adverse events or changes in circumstances indicate that impairment may have occurred.
We first consider whether to take a qualitative approach in determining whether it is more likely than not that a reporting unit’s fair value is less than its carrying amount before applying the two-step quantitative goodwill impairment test promulgated by FASB ASC Topic 350. If we determine that it is more likely than not that a reporting unit’s fair value is less than its carrying amount or if we elect to bypass the qualitative test for a specific period, the two-step process is used to test for goodwill impairment. Step one requires a determination of the fair value of each of the reporting units and, to the extent that the fair value of the reporting unit exceeds its carrying value (including goodwill), the step two calculation of implied fair value of goodwill is not required and no impairment loss is recognized.
We have attributed our goodwill balance to our segments at December 31, 2016, as follows:
|
(In thousands) |
December 31, 2016 |
||
|
Data |
$ |
90,561 | |
|
R&SB |
9,736 | ||
|
RLEC Access |
- |
||
|
Total goodwill |
$ |
100,297 | |
As of October 1, 2016, we performed goodwill impairment testing for each of our reporting units with goodwill, which were two of our three operating segments (data and R&SB). After a preliminary assessment, we elected to bypass the qualitative assessment and applied step one of the quantitative test as described above. We performed the step one quantitative test utilizing a market approach that includes the use of comparable multiples of publicly traded companies whose services are comparable to ours and recent M&A activity. We also reconciled the estimated fair values of the segments to our market capitalization as of October 1, 2016 and concluded that they provided a reasonable basis for fair value. Based on the results of this annual impairment testing, we determined that the fair values of each of the data and R&SB reporting units substantially exceed their respective carrying amounts and that no impairment exists.
42
Pension Benefits and Retirement Benefits Other Than Pensions
We sponsor a non-contributory defined benefit pension plan (“Pension Plan”) covering all employees who meet eligibility requirements and were employed prior to October 1, 2003. We froze the Pension Plan effective December 31, 2012. As such, no further benefits will be accrued by participants for services rendered beyond that date. Vested pension benefits were based on years of service and an average of the five highest consecutive years of compensation and are subject to certain reductions if the employee retires and elects to receive the benefit prior to reaching age 65. Also, we have a nonqualified pension plan that was also frozen as of December 31, 2012.
Sections 412 and 430 of the Internal Revenue Code and ERISA Sections 302 and 303 establish minimum funding requirements for defined benefit pension plans. The minimum required contribution is generally equal to the target normal cost plus the shortfall amortization installments for the current plan year and each of the six preceding plan years less any calculated credit balance. Our policy is to make contributions to stay at or above the threshold required in order to prevent benefit restrictions and related additional notice requirements and is intended to provide for benefits to be paid in the future. No contributions were made during the year ended December 31, 2016 and we do not expect to make a contribution in 2017.
We also provide certain postretirement life insurance benefits for retired employees through the qualified nonpension postretirement benefit plan, which is contributory. Eligibility for the life insurance plan is restricted to active pension participants age 50-64 as of January 5, 1994 and is not eligible to employees hired after April 1993. We previously provided health care benefits for retired employees, however, we terminated those benefits effective December 31, 2014. Eligible retirees received partial compensation for settlement of accrued benefits through a series of supplemental pension payments in 2014.
We account for the pension and postretirement benefits other than pensions by accruing the cost of such benefits over the service period of employees. Unrecognized actuarial gains and losses are amortized over the estimated average remaining service period for active employees and over the estimated average remaining life for retirees. We recognize in our consolidated balance sheets the amount of our unfunded Accumulated Postretirement Benefit Obligation (“APBO”) at the end of the year. Amounts recognized in accumulated other comprehensive income (loss) are adjusted out of accumulated other comprehensive income (loss) when they are subsequently recognized as components of net periodic benefit cost.
We sponsor a contributory defined contribution plan under Internal Revenue Code Section 401(k) for substantially all employees. Our current policy is to match 100% of each participant’s annual contributions for contributions up to 1% of each participant’s annual compensation and 50% of each participant’s annual contributions up to an additional 5% of each participant’s annual compensation. Employer contributions vest after two years of service.
Income Taxes
Deferred income taxes are provided on an asset and liability method whereby deferred tax assets are recognized for deductible temporary differences and deferred tax liabilities are recognized for taxable temporary differences. Temporary differences are the differences between the reported amounts of assets and liabilities and their tax bases. Deferred tax assets and liabilities are adjusted for the effects of changes in tax laws and rates on the date of enactment. We recognize the effect of income tax positions only if those positions are more likely than not of being sustained. Recognized income tax positions are measured at the largest amount that is greater than 50% likely of being realized. We accrue interest and penalties related to unrecognized tax benefits in interest expense and income tax expense, respectively. For balance sheet presentation purposes, we net our deferred tax asset and liability positions by jurisdiction and present the net deferred tax asset and/or liability as non-current in accordance with FASB Accounting Standards Update (“ASU”) 2015-17, Income Taxes (Topic 740) Balance Sheet Classification of Deferred Taxes (“ASU 2015-17”).
Equity-based Compensation
We account for share-based employee compensation plans under FASB ASC 718, Stock Compensation. Equity-based compensation expense from share-based equity awards is recorded with an offsetting increase to additional paid-in capital on the consolidated balance sheet. For equity awards with only service conditions, we recognize compensation cost on a straight-line basis over the requisite service period for the entire award.
The fair value of common stock options granted with service-only conditions is estimated at the respective measurement date using the Black-Scholes option-pricing model with assumptions related to risk-free interest rate, expected volatility, dividend yield and expected term. The fair value of restricted stock awards granted with service-only conditions is estimated based on the market value of the common stock on the date of grant reduced by the present value of expected dividends as applicable. Certain stock options and restricted shares granted by us in 2012 and 2013 contain vesting provisions that are conditional on achievement of a target market price for our common stock. The grant date fair value of these options was determined using a Monte Carlo model to reflect the probability of achieving the market condition. We initially recognize the related compensation cost for these awards that contain a
43
market condition on a straight-line basis over the requisite service period as derived from the valuation model. We accelerate expense recognition if the market conditions are achieved prior to the end of the derived requisite service period.
Recent Accounting Pronouncements
In May 2014, the FASB issued ASU 2014-09, Revenue from Contracts with Customers (“ASU 2014-09”), which will replace most existing revenue recognition guidance in U.S. GAAP when it becomes effective. ASU 2014-09 requires an entity to recognize the amount of revenue to which it expects to be entitled for the transfer of promised goods or services to customers. In August 2015, the FASB issued ASU 2015-14, Revenue from Contracts with Customers (Topic 606) - Deferral of the Effective Date, which defers the effective date of ASU 2014-09 for public business entities from annual reporting periods beginning after December 15, 2016, to annual reporting periods beginning after December 15, 2017. Early application is permitted only as of annual reporting periods beginning after December 15, 2016. ASU 2014-09 permits the use of either the retrospective or cumulative effect transition method. In March 2016, the FASB issued ASU 2016-08, Revenue from Contracts with Customers (Topic 606) – Principal versus Agent Considerations (Reporting Gross versus Net) (“ASU 2016-08”), which clarifies implementation guidance on principal versus agent considerations. In April 2016, the FASB issued ASU 2016-10, Revenue from Contracts with Customers (Topic 606) – Identifying Performance Obligations and Licensing (“ASU 2016-10”), which clarifies guidance related to identifying performance obligations and licensing implementation guidance contained in ASU 2014-09. In May 2016, the FASB issued ASU 2016-12, Revenue from Contracts with Customers (Topic 606) – Narrow-Scope Improvements and Practical Expedients (“ASU 2016-12”), which addresses narrow-scope improvements to the guidance on collectability, noncash consideration, and completed contracts at transition. Additionally, the amendments in ASU 2016-12 provide a practical expedient for contract modifications at transition and an accounting policy election related to the presentation of sales taxes and other similar taxes collected from customers. Finally, in December 2016, the FASB issued ASU 2016-20, Technical Corrections and Improvements to Topic 606, Revenue from Contracts with customers, which makes minor corrections or improvements to ASU 2014-09.
In 2016, we identified a project team and commenced an initial impact assessment process. To date, the Company has reviewed a sample of contracts with its customers and made preliminary assessments of the impact on revenue and expenses based on these reviews; however, the assessment of the impact to the Company’s results of operations, financial position and cash flows as a result of this guidance is ongoing. Additionally, ASU 2014-09 requires increased disclosure, which in turn may require changes to processes and systems. We expect to complete our initial impact assessment in the second quarter of 2017, at which time we will develop an implementation plan to include any potential process or system changes. The Company expects to adopt this new standard as of January 1, 2018 and currently expects to apply the modified retrospective method, which may result in a cumulative effect adjustment as of the date of adoption. Both our initial assessment and our selected transition method may change depending on the results of our final assessment of the impact to our financial statements.
In February 2015, the FASB issued ASU 2015-02, Consolidation (Topic 810): Amendments to the Consolidation Analysis (“ASU 2015-02”). ASU 2015-02 provides a revised consolidation model for all reporting entities to use in evaluating whether they should consolidate certain legal entities. All legal entities will be subject to reevaluation under this revised consolidation model. The revised consolidation model, among other things, (i) modifies the evaluation of whether limited partnerships and similar legal entities are VIEs or voting interest entities, (ii) eliminates the presumption that a general partner should consolidate a limited partnership, and (iii) modifies the consolidation analysis of reporting entities that are involved with VIEs through fee arrangements and related party relationships. ASU 2015-02 is effective for fiscal years, and interim reporting periods within those fiscal years, beginning after September 1, 2016. We do not expect the future adoption of ASU 2015-02 to have a material impact on our consolidated financial statements and disclosures.
In January 2016, the FASB issued ASU 2016-01, Financial Instruments - Overall (Topic 825): Recognition and Measurement of Financial Assets and Financial Liabilities (“ASU 2016-01”). The standard addresses certain aspects of recognition, measurement, presentation and disclosure of financial instruments. ASU 2016-01 is effective for public business entities for fiscal years, and interim periods within those years, beginning after December 15, 2017, and early adoption is not permitted. We do not expect the future adoption of ASU 2016-01 to have a material impact on our consolidated financial statements and disclosures.
In February 2016, the FASB issued ASU 2016-02, Leases (Topic 842) (“ASU 2016-02”), which will replace most existing lease guidance in U.S. GAAP when it becomes effective. ASU 2016-02 requires an entity to recognize most leases, including operating leases, on the consolidated balance sheet of the lessee. ASU 2016-02 is effective for public business entities for annual reporting periods beginning after December 15, 2018, with early adoption permitted. ASU 2016-02 requires the use of a modified retrospective transition method with elective reliefs. We are still evaluating the effect that ASU 2016-02 will have on our consolidated financial statements and disclosures.
44
In April 2016, the FASB issued ASU 2016-09, Compensation – Stock Compensation (Topic 718) (“ASU 2016-09”), which simplifies the accounting for share-based payment transactions. Among other things, ASU 2016-09 provides for (i) the simplification of accounting presentation of excess tax benefits and tax deficiencies, (ii) an accounting policy election regarding forfeitures to use an estimate or account for when incurred, and (iii) simplification of cash flow presentation for statutory tax rate withholding. ASU 2016-09 is effective for public business entities for annual reporting periods beginning after December 15, 2016, with early adoption permitted. The transition method required by ASU 2016-09 varies by amendment. We will implement this new standard on its effective date and we do not expect the adoption of 2016-09 to have a material impact on our consolidated financial statements and disclosures. However, we cannot provide any assurance regarding their future impacts. Additionally, the adoption of the accounting policy election to record forfeitures as incurred may increase the volatility of equity based compensation.
In August 2016, the FASB issued ASU 2016-15, Statement of Cash Flows – Classification of Certain Cash Receipts and Cash Payments (Topic 230) (“ASU 2016-15”), which addresses the following eight classification issues related to the statement of cash flows presentation, with the objective of reducing diversity in practice: 1) debt prepayment or debt extinguishment costs; 2) settlement of zero-coupon debt instruments; 3) contingent consideration payments made after a business combination; 4) proceeds from the settlement of insurance claims; 5) proceeds from the settlement of corporate-owned life insurance policies, including bank-owned life insurance policies; 6) distributions received from equity method investees; 7) beneficial interests in securitization transactions; and 8) separately identifiable cash flows and application of the predominance principle. ASU 2016-15 is effective for public business entities for annual reporting periods beginning after December 31, 2017, with early adoption permitted. Although we are still evaluating the effect that ASU 2016-15 will have on our statement of cash flow and disclosures, we expect the standard will primarily impact the presentation of the earnouts associated with the business acquisitions completed in January 2017. Their presentation in accordance with ASU 2016-15 would depend on whether these payments are deemed to be made soon after the acquisition.
Item 7A. Quantitative and Qualitative Disclosures About Market Risk.
We are exposed to market risks primarily related to interest rates on our variable rate debt obligations. We entered into the $425 million Credit Facility in 2013 and amended the Credit Facility to include Term Loan C for an additional $28 million on January 2, 2015. As of December 31, 2016, $340.4 million was outstanding under our Credit Facility. As of December 31, 2016, we had a leverage ratio of 3.68:1.00 and an interest coverage ratio 7.27:1.00, both of which are in compliance with our debt covenant requirements. We have other fixed rate, long-term debt in the form of unsecured notes and capital lease obligations totaling $150 million and $7.8 million, respectively, as of December 31, 2016.
At December 31, 2016, our financial assets in the consolidated balance sheet included unrestricted cash and cash equivalents of approximately $33.6 million, which is comprised of deposits in non-interest bearing accounts with financial institutions of $26.5 million, highly liquid fixed income securities of $0.4 million, deposits in money market mutual funds of $6.7 million, and marketable securities of $38.1 million, all of which we consider to be available for current operations due to the short-term maturities and/or liquid nature of the holdings. Other non-current securities and investments totaled $1.5 million at December 31, 2016.
As of December 31, 2016, our cash, cash equivalents and marketable securities were held in financial institutions, money market mutual funds, commercial paper and debt securities. Although we actively monitor the depository institutions and the performance and quality of our investments, we are exposed to risks resulting from deterioration in the financial condition or failure of financial institutions holding our cash deposits, decisions of our investment advisors and defaults in securities underlying the funds and investments. In accordance with our Board-approved investment policy we have instructed our investment management firm to prioritize liquidity and safety over investment return in choosing the investment vehicles for cash, cash equivalents and marketable securities and they have diversified these investments to the extent practical in an effort to minimize our exposure to any one investment vehicle or financial institutions.
The following sensitivity analysis indicates the impact at December 31, 2016, on the fair value of certain financial instruments, which would be potentially subject to material market risks, assuming a ten percent increase and a ten percent decrease in the levels of our interest rates:
|
(In thousands) |
Book Value |
Fair Value |
Estimated fair value assuming noted decrease in market pricing |
Estimated fair value assuming noted increase in market pricing |
||||||||
|
Credit Facility |
$ |
337,102 |
$ |
304,571 |
$ |
311,952 |
$ |
297,423 | ||||
|
8% Notes |
$ |
123,471 |
$ |
133,965 |
$ |
140,436 |
$ |
127,851 | ||||
|
Capital lease obligations |
$ |
7,842 |
$ |
7,842 |
$ |
8,190 |
$ |
7,505 | ||||
45
Item 8. Financial Statements and Supplementary Data.
LUMOS NETWORKS CORP.
INDEX TO AUDITED CONSOLIDATED FINANCIAL STATEMENTS
46
Report of Independent Registered Public Accounting Firm
The Board of Directors and Stockholders
Lumos Networks Corp.:
We have audited the accompanying consolidated balance sheets of Lumos Networks Corp. and subsidiaries (the Company) as of December 31, 2016 and 2015, and the related consolidated statements of operations, comprehensive income, cash flows, and equity for each of the years in the three‑year period ended December 31, 2016. These consolidated financial statements are the responsibility of the Company’s management. Our responsibility is to express an opinion on these consolidated financial statements based on our audits.
We conducted our audits in accordance with the standards of the Public Company Accounting Oversight Board (United States). Those standards require that we plan and perform the audit to obtain reasonable assurance about whether the financial statements are free of material misstatement. An audit includes examining, on a test basis, evidence supporting the amounts and disclosures in the financial statements. An audit also includes assessing the accounting principles used and significant estimates made by management, as well as evaluating the overall financial statement presentation. We believe that our audits provide a reasonable basis for our opinion.
In our opinion, the consolidated financial statements referred to above present fairly, in all material respects, the financial position of Lumos Networks Corp. and subsidiaries as of December 31, 2016 and 2015, and the results of their operations and their cash flows for each of the years in the three‑year period ended December 31, 2016, in conformity with U.S. generally accepted accounting principles.
We also have audited, in accordance with the standards of the Public Company Accounting Oversight Board (United States), Lumos Network Corp.’s internal control over financial reporting as of December 31, 2016, based on criteria established in Internal Control – Integrated Framework (2013) issued by the Committee of Sponsoring Organizations of the Treadway Commission (COSO), and our report dated March 28, 2017 expressed an adverse opinion on the effectiveness of Lumos Network Corp.’s internal control over financial reporting.
/s/ KPMG LLP
Richmond, Virginia
March 28, 2017
47
Consolidated Balance Sheets
Lumos Networks Corp.
|
(In thousands) |
December 31, 2016 |
December 31, 2015 |
||||
|
Assets |
||||||
|
|
||||||
|
Current Assets |
||||||
|
Cash and cash equivalents |
$ |
33,575 |
$ |
13,267 | ||
|
Marketable securities |
38,081 | 88,811 | ||||
|
Accounts receivable, net of allowance of $942 ($1,235 in 2015) |
22,609 | 20,796 | ||||
|
Other receivables |
753 | 852 | ||||
|
Income tax receivable |
459 | 568 | ||||
|
Prepaid expenses and other |
5,028 | 7,215 | ||||
|
Total Current Assets |
100,505 | 131,509 | ||||
|
|
||||||
|
Securities and Investments |
1,479 | 1,180 | ||||
|
|
||||||
|
Property, Plant and Equipment |
||||||
|
Land and buildings |
24,867 | 23,019 | ||||
|
Network plant and equipment |
733,154 | 624,360 | ||||
|
Furniture, fixtures and other equipment |
52,030 | 48,266 | ||||
|
Total in service |
810,051 | 695,645 | ||||
|
Under construction |
22,678 | 51,663 | ||||
|
|
||||||
|
|
832,729 | 747,308 | ||||
|
Less accumulated depreciation and amortization |
296,441 | 248,364 | ||||
|
|
||||||
|
Total Property, Plant and Equipment, net |
536,288 | 498,944 | ||||
|
|
||||||
|
Other Assets |
||||||
|
Goodwill |
100,297 | 100,297 | ||||
|
Other intangibles, less accumulated amortization of $97,467 ($94,892 in 2015) |
8,503 | 11,078 | ||||
|
Deferred charges and other assets |
6,300 | 2,364 | ||||
|
Total Other Assets |
115,100 | 113,739 | ||||
|
|
||||||
|
Total Assets |
$ |
753,372 |
$ |
745,372 | ||
See accompanying Notes to Consolidated Financial Statements.
48
Consolidated Balance Sheets
Lumos Networks Corp.
|
(In thousands, except par value per share amounts) |
December 31, 2016 |
December 31, 2015 |
||||
|
Liabilities and Equity |
||||||
|
|
||||||
|
Current Liabilities |
||||||
|
Current portion of long-term debt |
$ |
13,530 |
$ |
10,400 | ||
|
Accounts payable |
8,607 | 14,182 | ||||
|
Advance billings and customer deposits |
14,140 | 13,849 | ||||
|
Accrued compensation |
1,491 | 1,191 | ||||
|
Accrued operating taxes |
4,518 | 3,907 | ||||
|
Other accrued liabilities |
5,000 | 4,974 | ||||
|
Total Current Liabilities |
47,286 | 48,503 | ||||
|
|
||||||
|
Long-term Liabilities |
||||||
|
Long-term debt, net of unamortized discount and debt issuance costs, excluding current portion |
454,885 | 456,300 | ||||
|
Retirement benefits |
16,029 | 17,029 | ||||
|
Deferred income taxes, net |
96,988 | 89,193 | ||||
|
Other long-term liabilities |
2,124 | 1,923 | ||||
|
Income tax payable |
- |
93 | ||||
|
|
||||||
|
Total Long-term Liabilities |
570,026 | 564,538 | ||||
|
|
||||||
|
Commitments and Contingencies |
- |
- |
||||
|
|
||||||
|
Equity |
||||||
|
Preferred stock, par value $0.01 per share, authorized 100 shares, none issued |
- |
- |
||||
|
Common stock, par value $0.01 per share, authorized 55,000 shares; 23,607 shares issued and 23,605 shares outstanding (23,005 shares issued and 22,992 shares outstanding in 2015) |
236 | 230 | ||||
|
Additional paid-in capital |
175,008 | 171,746 | ||||
|
Treasury stock, 2 shares at cost (13 shares in 2015) |
(2) | (103) | ||||
|
Accumulated deficit |
(29,064) | (28,541) | ||||
|
Accumulated other comprehensive loss, net of tax |
(11,004) | (11,940) | ||||
|
Total Lumos Networks Corp. Stockholders' Equity |
135,174 | 131,392 | ||||
|
Noncontrolling Interests |
886 | 939 | ||||
|
|
||||||
|
Total Equity |
136,060 | 132,331 | ||||
|
|
||||||
|
Total Liabilities and Equity |
$ |
753,372 |
$ |
745,372 | ||
See accompanying Notes to Consolidated Financial Statements.
49
Consolidated Statements of Operations
Lumos Networks Corp.
|
|
Year Ended December 31, |
||||||||
|
(In thousands, except per share amounts) |
2016 |
2015 |
2014 |
||||||
|
|
|||||||||
|
Operating Revenues |
$ |
206,899 |
$ |
204,269 |
$ |
201,456 | |||
|
|
|||||||||
|
Operating Expenses |
|||||||||
|
Cost of Revenue, exclusive of depreciation and amortization shown separately below |
38,973 | 42,205 | 42,978 | ||||||
|
Selling, general and administrative, exclusive of depreciation and amortization shown separately below |
84,978 | 77,292 | 62,672 | ||||||
|
Depreciation and amortization |
51,279 | 47,527 | 45,212 | ||||||
|
Accretion of asset retirement obligations |
115 | 139 | 118 | ||||||
|
Restructuring charges |
1,940 | 638 |
- |
||||||
|
Total Operating Expenses, net |
177,285 | 167,801 | 150,980 | ||||||
|
Operating Income |
29,614 | 36,468 | 50,476 | ||||||
|
|
|||||||||
|
Other Income (Expenses) |
|||||||||
|
Interest expense |
(28,385) | (19,918) | (15,575) | ||||||
|
Gain on interest rate swap derivatives |
- |
665 | 492 | ||||||
|
Other income, net |
389 | 114 | 664 | ||||||
|
Total Other Expenses, net |
(27,996) | (19,139) | (14,419) | ||||||
|
Income Before Income Taxes |
1,618 | 17,329 | 36,057 | ||||||
|
|
|||||||||
|
Income Tax Expense |
1,962 | 7,146 | 14,409 | ||||||
|
|
|||||||||
|
Net (Loss) Income |
(344) | 10,183 | 21,648 | ||||||
|
|
|||||||||
|
Net Income Attributable to Noncontrolling Interests |
(179) | (157) | (120) | ||||||
|
|
|||||||||
|
Net (Loss) Income Attributable to Lumos Networks Corp. |
$ |
(523) |
$ |
10,026 |
$ |
21,528 | |||
|
|
|||||||||
|
|
|||||||||
|
Basic and Diluted Earnings (Loss) Per Common Share Attributable to Lumos Networks Corp. Stockholders: |
|||||||||
|
|
|||||||||
|
Basic (loss) earnings per share |
$ |
(0.02) |
$ |
0.44 |
$ |
0.97 | |||
|
Diluted (loss) earnings per share |
$ |
(0.02) |
$ |
0.43 |
$ |
0.95 | |||
|
|
|||||||||
|
Cash Dividends Declared per Share - Common Stock |
$ |
- |
$ |
- |
$ |
0.56 | |||
See accompanying Notes to Consolidated Financial Statements.
50
Consolidated Statements of Comprehensive Income
Lumos Networks Corp.
|
|
Year Ended December 31, |
||||||||
|
(In thousands) |
2016 |
2015 |
2014 |
||||||
|
Net (Loss) Income |
$ |
(344) |
$ |
10,183 |
$ |
21,648 | |||
|
|
|||||||||
|
Other Comprehensive Income (Loss): |
|||||||||
|
Adjustment to unrecognized loss due to curtailment of postretirement medical plan benefits |
- |
- |
1,188 | ||||||
|
Net unrecognized gain (loss) from defined benefit plans |
155 | (435) | (15,215) | ||||||
|
Reclassification adjustment for amortization of unrealized loss from defined benefit plans included in net (loss) income (see Note 2) |
1,350 | 1,350 | 248 | ||||||
|
Unrealized gain (loss) on available-for-sale marketable securities |
26 | (19) | (23) | ||||||
|
Income taxes |
(595) | (350) | 5,389 | ||||||
|
Other Comprehensive Income (Loss), Net of Tax |
936 | 546 | (8,413) | ||||||
|
|
|||||||||
|
Total Comprehensive Income |
592 | 10,729 | 13,235 | ||||||
|
|
|||||||||
|
Less: Comprehensive Income Attributable to Noncontrolling Interests |
(179) | (157) | (120) | ||||||
|
|
|||||||||
|
Comprehensive Income Attributable to Lumos Networks Corp. |
$ |
413 |
$ |
10,572 |
$ |
13,115 | |||
See accompanying Notes to Consolidated Financial Statements.
51
Consolidated Statements of Cash Flows
Lumos Networks Corp
|
|
Year Ended December 31, |
||||||||
|
(In thousands) |
2016 |
2015 |
2014 |
||||||
|
Cash Flows from Operating Activities: |
|||||||||
|
Net (loss) income |
$ |
(344) |
$ |
10,183 |
$ |
21,648 | |||
|
Adjustments to reconcile net (loss) income to net cash provided by operating activities: |
|||||||||
|
Depreciation |
48,704 | 42,721 | 36,025 | ||||||
|
Amortization |
2,575 | 4,806 | 9,187 | ||||||
|
Accretion of asset retirement obligations |
115 | 139 | 118 | ||||||
|
Deferred income taxes |
1,551 | 6,767 | 14,477 | ||||||
|
Gain on interest rate swap derivatives |
- |
(665) | (492) | ||||||
|
Equity-based compensation expense |
9,818 | 5,881 | 4,340 | ||||||
|
Amortization of debt discount and issuance costs |
4,500 | 2,688 | 1,461 | ||||||
|
Curtailment gain |
- |
- |
(10,774) | ||||||
|
Retirement benefits, net of cash distributions |
505 | (314) | (1,628) | ||||||
|
Excess tax benefits from share-based compensation |
- |
(165) |
- |
||||||
|
Other |
1,566 | 789 | 221 | ||||||
|
Changes in assets and liabilities from operations: |
|||||||||
|
(Increase) decrease in accounts receivable |
(2,253) | 1,938 | 845 | ||||||
|
Increase in other assets |
(2,593) | (4,889) | (124) | ||||||
|
Changes in income taxes |
16 | (433) | 615 | ||||||
|
(Decrease) increase in accounts payable |
(80) | (923) | 3,112 | ||||||
|
Increase (decrease) in other current liabilities |
1,296 | (1,778) | 778 | ||||||
|
Net Cash Provided by Operating Activities |
65,376 | 66,745 | 79,809 | ||||||
|
|
|||||||||
|
Cash Flows from Investing Activities: |
|||||||||
|
Purchases of property, plant and equipment |
(84,027) | (115,675) | (84,100) | ||||||
|
Broadband network expansion funded by stimulus grant |
- |
(2,578) | (878) | ||||||
|
Purchases of available-for-sale marketable securities |
(74,393) | (114,478) | (19,516) | ||||||
|
Proceeds from sale or maturity of available-for-sale marketable securities |
125,041 | 42,200 | 40,679 | ||||||
|
Change in restricted cash |
- |
4,208 | 116 | ||||||
|
Cash reimbursement received from broadband stimulus grant |
- |
3,838 | 116 | ||||||
|
Other |
- |
- |
150 | ||||||
|
Net Cash Used in Investing Activities |
(33,379) | (182,485) | (63,433) | ||||||
|
|
|||||||||
|
Cash Flows from Financing Activities: |
|||||||||
|
Proceeds from issuance of senior secured term loan |
- |
28,000 |
- |
||||||
|
Proceeds from issuance of unsecured notes, net of debt discount |
- |
148,500 |
- |
||||||
|
Payment of financing costs |
- |
(8,192) |
- |
||||||
|
Principal payments on senior secured term loans |
(8,030) | (47,960) | (5,250) | ||||||
|
Cash dividends paid on common stock |
- |
(3,152) | (12,456) | ||||||
|
Capital distributions to noncontrolling interests |
(232) |
- |
- |
||||||
|
Principal payments under capital lease obligations |
(2,683) | (2,471) | (1,468) | ||||||
|
Proceeds from stock option exercises and employee stock purchase plan |
1,670 | 356 | 2,892 | ||||||
|
Excess tax benefits from share-based compensation |
- |
165 |
- |
||||||
|
Repurchases of common stock to settle tax withholding obligations on employee stock awards |
(2,414) | (371) | (66) | ||||||
|
Other |
- |
(8) | (2) | ||||||
|
Net Cash (Used in) Provided by Financing Activities |
(11,689) | 114,867 | (16,350) | ||||||
|
Increase (decrease) in cash and cash equivalents |
20,308 | (873) | 26 | ||||||
|
Cash and Cash Equivalents: |
|||||||||
|
Beginning of Year |
13,267 | 14,140 | 14,114 | ||||||
|
|
|||||||||
|
End of Year |
$ |
33,575 |
$ |
13,267 |
$ |
14,140 | |||
See accompanying Notes to Consolidated Financial Statements
52
Consolidated Statements of Equity
Lumos Networks Corp.
|
(In thousands, except per share amounts) |
Common Shares |
Treasury Shares |
Common Stock |
Additional Paid-in Capital |
Treasury Stock |
Accumulated Deficit |
Accumulated Other Comprehensive Loss |
Total Lumos Networks Corp. Stockholders' Equity |
Noncontrolling Interests |
Total Equity |
|||||||||||||||||
|
Balance, December 31, 2013 |
22,158 | 49 |
$ |
222 |
$ |
138,166 |
$ |
(404) |
$ |
(47,578) |
$ |
(4,073) |
$ |
86,333 |
$ |
673 |
$ |
87,006 | |||||||||
|
Net income attributable to Lumos |
|||||||||||||||||||||||||||
|
Networks Corp. |
21,528 | 21,528 | 21,528 | ||||||||||||||||||||||||
|
Other comprehensive loss, |
|||||||||||||||||||||||||||
|
net of tax |
(8,413) | (8,413) | (8,413) | ||||||||||||||||||||||||
|
Equity-based compensation |
|||||||||||||||||||||||||||
|
expense |
3,377 | 3,377 | 3,377 | ||||||||||||||||||||||||
|
Adjustments to excess tax benefit |
|||||||||||||||||||||||||||
|
from stock-based compensation |
(1,488) | (1,488) | (1,488) | ||||||||||||||||||||||||
|
Restricted shares issued, shares |
|||||||||||||||||||||||||||
|
issued through the employee stock purchase plan and 401(k) matching contributions (net of shares reacquired through restricted stock forfeits and settlement of tax withholding obligations on vesting of shares) |
211 | (14) | 4 | 673 | 363 | 1,040 | 1,040 | ||||||||||||||||||||
|
Stock option exercises |
210 | 2,817 | 2,817 | 2,817 | |||||||||||||||||||||||
|
Cash dividends declared ($0.56 per |
|||||||||||||||||||||||||||
|
share) |
(12,517) | (12,517) | (12,517) | ||||||||||||||||||||||||
|
Net income attributable to |
|||||||||||||||||||||||||||
|
noncontrolling interests |
109 | 109 | |||||||||||||||||||||||||
|
Balance, December 31, 2014 |
22,579 | 35 |
$ |
226 |
$ |
143,545 |
$ |
(41) |
$ |
(38,567) |
$ |
(12,486) |
$ |
92,677 |
$ |
782 |
$ |
93,459 | |||||||||
|
Net income attributable to Lumos |
|||||||||||||||||||||||||||
|
Networks Corp. |
10,026 | 10,026 | 10,026 | ||||||||||||||||||||||||
|
Other comprehensive income, |
|||||||||||||||||||||||||||
|
net of tax |
546 | 546 | 546 | ||||||||||||||||||||||||
|
Equity-based compensation expense |
4,721 | 4,721 | 4,721 | ||||||||||||||||||||||||
|
Adjustments to excess tax benefit |
|||||||||||||||||||||||||||
|
from stock-based compensation |
165 | 165 | 165 | ||||||||||||||||||||||||
|
Restricted shares issued, shares |
|||||||||||||||||||||||||||
|
issued through the employee stock purchase plan and 401(k) matching contributions (net of shares reacquired through restricted stock forfeits and settlement of tax withholding obligations on vesting of shares) |
399 | (22) | 4 | 881 | (62) | 823 | 823 | ||||||||||||||||||||
|
Stock warrants issued (net of discount and deferred |
|||||||||||||||||||||||||||
|
issuance fees) |
22,147 | 22,147 | 22,147 | ||||||||||||||||||||||||
|
Stock option exercises |
27 | 287 | 287 | 287 | |||||||||||||||||||||||
|
Net income attributable to |
|||||||||||||||||||||||||||
|
noncontrolling interests |
157 | 157 | |||||||||||||||||||||||||
|
Balance, December 31, 2015 |
23,005 | 13 |
$ |
230 |
$ |
171,746 |
$ |
(103) |
$ |
(28,541) |
$ |
(11,940) |
$ |
131,392 |
$ |
939 |
$ |
132,331 | |||||||||
|
Net loss attributable to |
|||||||||||||||||||||||||||
|
Lumos Networks Corp. |
(523) | (523) | (523) | ||||||||||||||||||||||||
|
Other comprehensive income, |
|||||||||||||||||||||||||||
|
net of tax |
936 | 936 | 936 | ||||||||||||||||||||||||
|
Equity-based compensation expense |
8,671 | 8,671 | 8,671 | ||||||||||||||||||||||||
|
Tax shortfalls from share-based |
|||||||||||||||||||||||||||
|
compensation |
(172) | (172) | (172) | ||||||||||||||||||||||||
|
Restricted shares issued, shares |
|||||||||||||||||||||||||||
|
issued through the employee stock purchase plan and 401(k) matching contributions (net of shares reacquired through restricted stock forfeits and settlement of tax withholding obligations on vesting of shares) |
545 | 55 | 6 | (841) | (383) | (1,218) | (1,218) | ||||||||||||||||||||
|
Adjustment for deferred taxes upon issuance of 8% Notes |
(5,486) | (5,486) | (5,486) | ||||||||||||||||||||||||
|
Stock option exercises |
57 | (66) | 1,090 | 484 | 1,574 | 1,574 | |||||||||||||||||||||
|
Capital distribution to noncontrolling |
|||||||||||||||||||||||||||
|
interests |
(232) | (232) | |||||||||||||||||||||||||
|
Net income attributable to |
|||||||||||||||||||||||||||
|
noncontrolling interests |
179 | 179 | |||||||||||||||||||||||||
|
Balance, December 31, 2016 |
23,607 | 2 |
$ |
236 |
$ |
175,008 |
$ |
(2) |
$ |
(29,064) |
$ |
(11,004) |
$ |
135,174 |
$ |
886 |
$ |
136,060 | |||||||||
See accompanying Notes to Consolidated Financial Statements.
53
Notes to Consolidated Financial Statements
Lumos Networks Corp.
Note 1. Organization
Lumos Networks Corp. (“Lumos Networks” or the “Company”) is a fiber-based bandwidth infrastructure and service provider in the Mid-Atlantic region with a network of long-haul fiber, metro Ethernet and Ethernet rings located primarily in Virginia and West Virginia, and portions of Maryland, Pennsylvania, Ohio and Kentucky. The Company serves carrier, business and residential customers over its fiber network offering data, voice and IP services. The Company’s principal products and services include Multiprotocol Label Switching (“MPLS”) based Ethernet, Metro Ethernet (“Metro E”), Fiber to the Cell (“FTTC”) wireless backhaul and fiber transport services, wavelength transport services, IP services and other voice services.
On March 17, 2015, in a secondary offering of the Company’s common stock, Quadrangle Capital Partners LP. (“Quadrangle”) sold 1,600,000 shares on an underwritten basis. On September 14, 2015, Quadrangle distributed its remaining 591,898 shares to its investors (the “Distribution”). As a result, the shareholder agreement between Quadrangle and the Company expired as of the effective date of the Distribution. The Company did not receive any proceeds from the offerings, and the Company’s total shares outstanding did not change. All direct costs of these offerings, which were primarily legal, printing and accounting fees related to the preparation of the registration statement, which totaled $0.3 million are included in other expenses in the consolidated statements of operations for the year ended December 31, 2015. The Company did not incur any direct costs related to offerings during the years ended December 31, 2016 or 2014.
Note 2. Summary of Significant Accounting Policies
Principles of Consolidation and Basis of Presentation
The consolidated financial statements include the accounts of the Company, Lumos Networks Operating Company, a wholly-owned subsidiary of the Company, and all of Lumos Networks Operating Company’s wholly-owned subsidiaries and those limited liability corporations where Lumos Networks Operating Company or certain of its subsidiaries, as managing member, exercised control. All significant intercompany accounts and transactions have been eliminated in consolidation. Certain presentation changes have been made within the operating expense line items on the consolidated statements of operations and prior period amounts have been reclassified in order to conform to the current year presentation. Specifically, the previously reported line item “network access costs” has been removed and the new line item “cost of revenue” has been added along with the necessary operating expense reclassifications. These reclassifications were not the result of an error and have no effect on previously reported operating income, net income or earnings per share.
Accounting Estimates
The preparation of consolidated financial statements in conformity with U.S. generally accepted accounting principles (GAAP) requires management to make estimates and assumptions that affect the reported amounts of assets and liabilities and disclosures of contingent assets and liabilities at the date of the financial statements and the reported amounts of revenues and expenses during the reporting periods. Actual results could differ from those estimates. Significant items subject to such estimates and assumptions include the useful lives of fixed assets; the allowance for doubtful accounts; the valuation of deferred tax assets and/or liabilities, asset retirement obligations and equity-based compensation; goodwill impairment assessments; actuarial determination of employee benefit obligations; stock warrants; and reserve for uncertain income tax positions.
Revenue Recognition
The Company recognizes revenue when persuasive evidence of an arrangement exists, services are rendered or products are delivered, installed and functional, as applicable, the price to the buyer is fixed or determinable and collectability is reasonably assured. Certain services of the Company require payment in advance of service performance. In such cases, the Company records a service liability at the time of billing and subsequently recognizes revenue ratably over the service period. The Company bills customers certain transactional taxes on service revenues. These transactional taxes are not included in reported revenues as they are recognized as liabilities at the time customers are billed.
The Company earns revenue by providing services through access to and usage of its networks. Local service revenues are recognized as services are provided. Carrier data revenues are earned by providing switched access and other switched and dedicated services to other carriers.
Cash Equivalents and Marketable Securities
The Company considers its investments in all highly liquid debt instruments with an original maturity of three months or less, when purchased, to be cash equivalents. The Company’s marketable securities at December 31, 2016 and 2015 consist of debt securities not
54
classified as cash equivalents. The Company classifies such debt securities as either held-to-maturity, when the Company has the positive intent and ability to hold the securities to maturity, or available-for-sale. Held-to-maturity debt securities are carried at amortized cost, adjusted for the amortization of premiums or accretion of discounts. Available-for-sale securities are carried at fair value, with unrealized gains and losses reported in other comprehensive income or loss, net of tax. All of the Company’s debt securities not classified as cash equivalents were classified as available-for-sale securities as of December 31, 2016 and 2015.
Trade Accounts Receivable
The Company sells its services to other communication carriers and to business and residential customers primarily in Virginia and West Virginia and portions of Maryland, Pennsylvania, Ohio and Kentucky. The Company has credit and collection policies to maximize collection of trade receivables and requires advance payment for certain services. The Company estimates an allowance for doubtful accounts based on a review of specific customers with large receivable balances and for the remaining customer receivables the Company uses historical results, current and expected trends and changes in credit policies. Management believes the allowance adequately covers all anticipated losses with respect to trade receivables. Actual credit losses could differ from such estimates. The Company includes bad debt expense in selling, general and administrative expense in the consolidated statements of operations. The following table shows the activity in the allowance for doubtful accounts and customer credits for the years ended December 31, 2016, 2015 and 2014:
|
|
|||||||||
|
(In thousands) |
2016 |
2015 |
2014 |
||||||
|
Allowance for doubtful accounts and customer credits, beginning |
$ |
1,235 |
$ |
1,217 |
$ |
1,485 | |||
|
Additions: |
|||||||||
|
Charged to expense |
236 | 461 | 604 | ||||||
|
(Deducted from) charged to other accounts |
(97) | 96 | (19) | ||||||
|
Deductions |
(432) | (539) | (853) | ||||||
|
Allowance for doubtful accounts and customer credits, ending |
$ |
942 |
$ |
1,235 |
$ |
1,217 | |||
Property, Plant and Equipment and Other Long-Lived Assets (Excluding Goodwill and Indefinite-Lived Intangible Assets)
Property, plant and equipment, finite-lived intangible assets and long-term deferred charges are recorded at cost and are reviewed for impairment whenever events or changes in circumstances indicate that the carrying amount should be evaluated pursuant to the subsequent measurement guidance described in Financial Accounting Standards Board (“FASB”) Accounting Standards Codification (“ASC”) 360-10-35. Impairment is determined by comparing the carrying value of these long-lived assets to management’s best estimate of future undiscounted cash flows expected to result from the use of the assets. If the carrying value exceeds the estimated undiscounted cash flows, the excess of the asset’s carrying value over the estimated fair value is recorded as an impairment charge.
The Company believes that no impairment indicators exist as of December 31, 2016 that would require it to perform impairment testing for long-lived assets, including property, plant and equipment, long-term deferred charges and finite-lived intangible assets to be held and used.
Depreciation of property, plant and equipment is calculated on a straight-line basis over the estimated useful lives of the assets, which the Company reviews and updates based on historical experience and future expectations. As of December 31, 2016 the estimated lives for each category of property, plant and equipment are as follows:
|
|
Estimated Life |
|
|
Buildings |
50 years |
|
|
Network plant and equipment |
3 to 50 years |
|
|
Furniture, fixtures and other equipment |
4 to 24 years |
Leasehold improvements, which are categorized in land and buildings, are depreciated over the shorter of the estimated useful lives or the remaining lease terms. Plant and equipment held under capital leases are amortized on a straight-line basis over the shorter of the lease term or estimated useful life of the asset. Amortization of assets held under capital leases, including an indefeasible right of use agreement (“IRU”), is included with depreciation expense.
Intangibles with a finite life are classified as other intangibles on the consolidated balance sheets. At December 31, 2016 and 2015, other intangibles were comprised of the following:
55
|
|
2016 |
2015 |
|||||||||||
|
(Dollars in thousands) |
Estimated Life |
Gross Amount |
Accumulated Amortization |
Gross Amount |
Accumulated Amortization |
||||||||
|
Customer relationships |
6 to 15 yrs |
$ |
103,108 |
$ |
(95,463) |
$ |
103,108 |
$ |
(93,051) | ||||
|
Trademarks and franchise rights |
10 to 15 yrs |
2,862 | (2,004) | 2,862 | (1,841) | ||||||||
|
Total |
$ |
105,970 |
$ |
(97,467) |
$ |
105,970 |
$ |
(94,892) | |||||
|
|
|||||||||||||
Included in the above amounts are indefinite-lived intangible assets of $0.3 million, which are not subject to amortization. The Company amortizes its finite-lived intangible assets using the straight-line method unless it determines that another systematic method is more appropriate. The amortization for certain customer relationship intangibles is being recognized using an accelerated amortization method based on the pattern of estimated earnings from these assets.
The estimated life of amortizable intangible assets is determined from the unique factors specific to each asset and the Company reviews and updates estimated lives based on current events and future expectations. The Company capitalizes costs incurred to renew or extend the term of a recognized intangible asset and amortizes such costs over the remaining life of the asset. No such costs were incurred during the years ended December 31, 2016 or 2015. Amortization expense for the years ended December 31, 2016, 2015 and 2014 was $2.6 million, $4.8 million and $9.2 million, respectively.
Amortization expense for the next five years is expected to be as follows:
|
|
|||||||||
|
(In thousands) |
Customer Relationships |
Trademarks and |
Total |
||||||
|
2017 |
$ |
2,093 |
$ |
163 |
$ |
2,256 | |||
|
2018 |
1,781 | 163 | 1,944 | ||||||
|
2019 |
1,513 | 152 | 1,665 | ||||||
|
2020 |
1,146 | 48 | 1,194 | ||||||
|
2021 |
1,112 |
- |
1,112 | ||||||
Goodwill and Indefinite-Lived Intangible Assets
Goodwill and franchise rights are considered to be indefinite-lived intangible assets. Indefinite-lived intangible assets are not subject to amortization but are instead tested for impairment annually or more frequently if an event indicates that the asset might be impaired. The Company’s policy is to assess the recoverability of indefinite-lived assets annually on October 1 and whenever adverse events or changes in circumstances indicate that impairment may have occurred.
The Company first considers whether to take a qualitative approach in determining whether it is more likely than not that a reporting unit’s fair value is less than its carrying amount before applying the two-step quantitative goodwill impairment test promulgated by FASB ASC Topic 350. If the Company determines that it is more likely than not that a reporting unit’s fair value is less than its carrying amount or if the Company elects to bypass the qualitative test for a specific period, the two-step process is used to test for goodwill impairment. Step one requires a determination of the fair value of each of the reporting units and, to the extent that the fair value of the reporting unit exceeds its carrying value (including goodwill), the step two calculation of implied fair value of goodwill is not required and no impairment loss is recognized. In testing for goodwill impairment, the Company utilizes a market approach that includes the use of comparable multiples of publicly traded companies whose services are comparable to ours and recent M&A activity.
As of December 31, 2016, goodwill was attributed to the Company’s segments as follows:
|
(In thousands) |
December 31, 2016 |
||
|
Data |
$ |
90,561 | |
|
R&SB |
9,736 | ||
|
RLEC Access |
- |
||
|
Total goodwill |
$ |
100,297 | |
As of October 1, 2016, the Company performed its annual goodwill impairment test for each of its reporting units with goodwill, which are two of our three operating segments (data and R&SB). After a preliminary assessment, the Company elected to bypass the qualitative assessment and applied step one of the quantitative test as described above. Based on the results of this annual impairment
56
testing, the Company determined that the fair values of each of the data and R&SB reporting units substantially exceed their respective carrying amounts and that no impairment exists.
The gross amount of goodwill was $133.7 million and the accumulated impairment loss was $33.4 million for a net carrying amount of $100.3 million as of December 31, 2016 and 2015. There was no activity in the consolidated goodwill accounts for the years ended 2016 and 2015.
Accounting for Asset Retirement Obligations
An asset retirement obligation is evaluated and recorded as appropriate on assets for which the Company has a legal obligation to retire. The Company records a liability for an asset retirement obligation and the associated asset retirement cost capitalized at the time the underlying asset is acquired. Subsequent to the initial measurement of the asset retirement obligation, the obligation is adjusted at the end of each period to reflect the passage of time and changes in the estimated future cash flows underlying the obligation.
The Company enters into various facility collocation agreements and is subject to locality franchise ordinances. The Company constructs assets at these locations and, in accordance with the terms of many of these agreements, the Company is obligated to restore the premises to their original condition at the conclusion of the agreements, generally at the demand of the other party to these agreements. The Company recognizes the fair value of a liability for an asset retirement obligation and capitalizes that cost as part of the cost basis of the related asset, depreciating it over the useful life of the related asset.
Included in certain of the franchise ordinances under which the Company’s RLECs and CLECs operate are clauses that require the removal of the RLEC’s and CLEC’s equipment at the termination of the franchise agreement. The Company has not recognized an asset retirement obligation for these liabilities as the removal of the equipment is not estimable due to an indeterminable end date and the fact that the equipment is part of the public switched telephone network and it is not reasonable to assume the jurisdictions would require its removal.
The following table indicates the changes to the Company’s asset retirement obligation liability, which is included in other long-term liabilities, for the years ended December 31, 2016 and 2015:
|
(In thousands) |
2016 |
2015 |
||||
|
Asset retirement obligations, beginning |
$ |
1,720 |
$ |
1,500 | ||
|
Additional asset retirement obligations recorded, net of |
||||||
|
adjustments in estimates |
- |
81 | ||||
|
Accretion of asset retirement obligations |
115 | 139 | ||||
|
Asset retirement obligations, ending |
$ |
1,835 |
$ |
1,720 | ||
Advertising Costs
The Company expenses advertising costs and marketing production costs as incurred (included within selling, general and administrative expenses in the consolidated statements of operations). Advertising expense for the years ended December 31, 2016, 2015 and 2014 was $0.9 million, $0.7 million and $1.4 million, respectively.
Pension Benefits and Retirement Benefits Other Than Pensions
The Company sponsors a non-contributory defined benefit pension plan (“Pension Plan”) covering all employees who meet eligibility requirements and were employed prior to October 1, 2003. The Company froze the Pension Plan effective December 31, 2012. As such, no further benefits are being accrued by participants for services rendered beyond that date. Vested pension benefits were based on years of service and an average of the five highest consecutive years of compensation and are subject to certain reductions if the employee retires and elects to receive the benefit prior to reaching age 65. The Company has a nonqualified pension plan that was also frozen as of December 31, 2012.
Sections 412 and 430 of the Internal Revenue Code and ERISA Sections 302 and 303 establish minimum funding requirements for defined benefit pension plans. The minimum required contribution is generally equal to the target normal cost plus the shortfall amortization installments for the current plan year and each of the six preceding plan years less any calculated credit balance. The Company’s policy is to make contributions to stay at or above the threshold required in order to prevent benefit restrictions and related additional notice requirements and is intended to provide for benefits to be paid in the future. No contributions were made during the year ended December 31, 2016 and the Company does not expect to make a contribution in 2017.
The Company also provides certain postretirement life insurance benefits for retired employees through the qualified nonpension postretirement welfare benefit plan (the “Other Postretirement Benefit Plan”), which is contributory. Eligibility for the life insurance plan is restricted to active pension participants age 50-64 as of January 5, 1994 and is not eligible to employees hired after April 1993.
57
The Company previously provided health care benefits for retired employees, however, the Company terminated those benefits effective December 31, 2014. Eligible retirees received partial compensation for settlement of accrued benefits through a series of supplemental pension payments in 2014. As a result, the Company recognized a curtailment gain of $10.8 million in the year ended December 31, 2014 (see Note 11).
The Company accounts for the pension and postretirement benefits other than pensions by accruing the cost of such benefits over the service periods of employees. Unrecognized actuarial gains and losses are amortized over the estimated average remaining service period for active employees and over the estimated average remaining life for retirees. The Company recognizes in its consolidated balance sheets the amount of the Company’s unfunded Accumulated Postretirement Benefit Obligation (“APBO”) at the end of the year. Amounts recognized in accumulated other comprehensive income (loss) are adjusted out of accumulated other comprehensive income (loss) when they are subsequently recognized as components of net periodic benefit cost (income).
The Company sponsors a contributory defined contribution plan under Internal Revenue Code Section 401(k) for substantially all employees. The Company’s policy is to match 100% of each participant’s annual contributions for contributions up to 1% of each participant’s annual compensation and 50% of each participant’s annual contributions up to an additional 5% of each participant’s annual compensation. Company contributions vest after two years of service.
Operating Leases
The Company has operating leases for administrative office space and equipment, certain of which have renewal options. These leases, with few exceptions, provide for automatic renewal options and escalations that are either fixed or based on the consumer price index. Any rent abatements, along with rent escalations, are included in the computation of rent expense calculated on a straight-line basis over the lease term. The Company’s minimum lease term for most leases includes the initial non-cancelable term and at least one renewal period to the extent that the exercise of the related renewal option or options is reasonably assured. A renewal option or options is determined to be reasonably assured if failure to renew the leases imposes an in-substance economic penalty on the Company. Leasehold improvements are capitalized and depreciated over the shorter of the assets’ useful life or the lease term, including renewal option periods that are reasonably assured.
Income Taxes
Deferred income taxes are provided on an asset and liability method whereby deferred tax assets are recognized for deductible temporary differences and deferred tax liabilities are recognized for taxable temporary differences. Temporary differences are the differences between the reported amounts of assets and liabilities and their tax bases. Deferred tax assets and liabilities are adjusted for the effects of changes in tax laws and rates on the date of enactment. The Company recognizes the effect of income tax positions only if those positions are more likely than not of being sustained. Recognized income tax positions are measured at the largest amount that is greater than 50% likely of being realized. The Company accrues interest and penalties related to unrecognized tax benefits in interest expense and income tax expense, respectively. For balance sheet presentation purposes, the Company nets its deferred tax asset and deferred tax liability positions by tax jurisdiction and classifies the resulting net deferred tax asset and/or net deferred tax liability as noncurrent in accordance with FASB Accounting Standards Update (“ASU”) 2015-17, Income Taxes (Topic 740) Balance Sheet Classification of Deferred Taxes (“ASU 2015-17”).
Equity-based Compensation
The Company accounts for share-based employee compensation plans under FASB ASC 718, Stock Compensation. Equity-based compensation expense from share-based equity awards is recorded with an offsetting increase to additional paid-in capital on the consolidated balance sheet. For equity awards with only service conditions, the Company recognizes compensation cost on a straight-line basis over the requisite service period for the entire award.
The fair value of common stock options granted with service-only conditions is estimated at the respective measurement date using the Black-Scholes option-pricing model with assumptions related to risk-free interest rate, expected volatility, dividend yield and expected term. The fair value of restricted stock awards granted with service-only conditions is estimated based on the market value of the common stock on the date of grant reduced by the present value of expected dividends as applicable. Certain stock options and restricted shares granted by the Company in 2012 and 2013 contain vesting provisions that are conditional on achievement of a target market price for the Company’s common stock. The grant date fair value of these options was determined using a Monte Carlo model to reflect the probability of achieving the market condition. The Company initially recognizes the related compensation cost for these awards that contain a market condition on a straight-line basis over the requisite service period as derived from the valuation model. The Company accelerates expense recognition if the market conditions are achieved prior to the end of the derived requisite service period.
58
Total equity-based compensation expense related to all of the share-based awards (Note 9), annual employee bonuses paid in the form of immediately vested shares and the Company’s 401(k) matching contributions, was $9.6 million, $5.9 million and $4.3 million for the years ended December 31, 2016, 2015 and 2014, respectively, which amounts are included in selling, general and administrative expenses in the consolidated statements of operations.
Future charges for equity-based compensation related to instruments outstanding at December 31, 2016 for the years 2017 through 2019 are estimated to be $3.5 million, $1.7 million, $0.4 million and less than $0.1 million for each of 2020 and 2021, respectively.
Fair Value Measurements
Fair value is defined as the amount that would be received to sell an asset or paid to transfer a liability in an orderly transaction between market participants at the measurement date. When determining the fair value measurements for assets and liabilities required to be recorded at fair value or for certain financial instruments for which disclosure of fair value is required, the Company uses fair value techniques that maximize the use of observable inputs and minimize the use of unobservable inputs to the extent possible. However, in situations where there is little, if any, market activity for the asset or liability at the measurement date, the fair value measurement reflects the Company’s own judgments about the assumptions that market participants would use in pricing the asset or liability. Those judgments are developed by the Company based on the best information available in the circumstances, including expected cash flows and appropriately risk-adjusted discount rates, available observable and unobservable inputs.
GAAP establishes a fair value hierarchy with three levels of inputs that may be used to measure fair value:
|
· |
Level 1 - Unadjusted quoted prices in active markets for identical assets or liabilities. |
|
· |
Level 2 - Unadjusted quoted prices for similar assets or liabilities in active markets, or unadjusted quoted prices for identical or similar assets or liabilities in markets that are not active, or other inputs other than quoted prices that are observable for the asset or liability. |
|
· |
Level 3 - Unobservable inputs for the asset or liability. |
Recent Accounting Pronouncements
In May 2014, the FASB issued ASU 2014-09, Revenue from Contracts with Customers (“ASU 2014-09”), which will replace most existing revenue recognition guidance in U.S. GAAP when it becomes effective. ASU 2014-09 requires an entity to recognize the amount of revenue to which it expects to be entitled for the transfer of promised goods or services to customers. In August 2015, the FASB issued ASU 2015-14, Revenue from Contracts with Customers (Topic 606) - Deferral of the Effective Date, which defers the effective date of ASU 2014-09 for public business entities from annual reporting periods beginning after December 15, 2016, to annual reporting periods beginning after December 15, 2017. Early application is permitted only as of annual reporting periods beginning after December 15, 2016. ASU 2014-09 permits the use of either the retrospective or cumulative effect transition method. In March 2016, the FASB issued ASU 2016-08, Revenue from Contracts with Customers (Topic 606) – Principal versus Agent Considerations (Reporting Gross versus Net) (“ASU 2016-08”), which clarifies implementation guidance on principal versus agent considerations. In April 2016, the FASB issued ASU 2016-10, Revenue from Contracts with Customers (Topic 606) – Identifying Performance Obligations and Licensing (“ASU 2016-10”), which clarifies guidance related to identifying performance obligations and licensing implementation guidance contained in ASU 2014-09. In May 2016, the FASB issued ASU 2016-12, Revenue from Contracts with Customers (Topic 606) – Narrow-Scope Improvements and Practical Expedients (“ASU 2016-12”), which addresses narrow-scope improvements to the guidance on collectability, noncash consideration, and completed contracts at transition. Additionally, the amendments in ASU 2016-12 provide a practical expedient for contract modifications at transition and an accounting policy election related to the presentation of sales taxes and other similar taxes collected from customers. Finally, in December 2016, the FASB issued ASU 2016-20, Technical Corrections and Improvements to Topic 606, Revenue from Contracts with customers, which makes minor corrections or improvements to ASU 2014-09.
In 2016, the Company identified a project team and commenced an initial impact assessment process. To date, the Company has reviewed a sample of contracts with its customers and made preliminary assessments of the impact on revenue and expenses based on these reviews; however, the assessment of the impact to the Company’s results of operations, financial position and cash flows as a result of this guidance is ongoing. Additionally, ASU 2014-09 requires increased disclosure, which in turn may require changes to processes and systems. The Company expects to complete its initial impact assessment in the second quarter of 2017, at which time it will develop an implementation plan to include any potential process or system changes. The Company expects to adopt this new standard as of January 1, 2018 and currently expects to apply the modified retrospective method, which may result in a cumulative effect adjustment as of the date of adoption. Both the Company’s initial assessment and its selected transition method may change depending on the results of the Company’s final assessment of the impact to its financial statements.
In February 2015, the FASB issued ASU 2015-02, Consolidation (Topic 810): Amendments to the Consolidation Analysis (“ASU 2015-02”). ASU 2015-02 provides a revised consolidation model for all reporting entities to use in evaluating whether they should
59
consolidate certain legal entities. All legal entities will be subject to reevaluation under this revised consolidation model. The revised consolidation model, among other things, (i) modifies the evaluation of whether limited partnerships and similar legal entities are VIEs or voting interest entities, (ii) eliminates the presumption that a general partner should consolidate a limited partnership, and (iii) modifies the consolidation analysis of reporting entities that are involved with VIEs through fee arrangements and related party relationships. ASU 2015-02 is effective for fiscal years, and interim reporting periods within those fiscal years, beginning after September 1, 2016. The Company does not expect the future adoption of ASU 2015-02 to have a material impact on its consolidated financial statements and disclosures.
In January 2016, the FASB issued ASU 2016-01, Financial Instruments - Overall (Topic 825): Recognition and Measurement of Financial Assets and Financial Liabilities (“ASU 2016-01”). The standard addresses certain aspects of recognition, measurement, presentation and disclosure of financial instruments. ASU 2016-01 is effective for public business entities for fiscal years, and interim periods within those years, beginning after December 15, 2017, and early adoption is not permitted. The Company does not expect the future adoption of ASU 2016-01 to have a material impact on its consolidated financial statements and disclosures.
In February 2016, the FASB issued ASU 2016-02, Leases (Topic 842) (“ASU 2016-02”), which will replace most existing lease guidance in U.S. GAAP when it becomes effective. ASU 2016-02 requires an entity to recognize most leases, including operating leases, on the consolidated balance sheet of the lessee. ASU 2016-02 is effective for public business entities for annual reporting periods beginning after December 15, 2018, with early adoption permitted. ASU 2016-02 requires the use of a modified retrospective transition method with elective reliefs. The Company is still evaluating the effect that ASU 2016-02 will have on its consolidated financial statements and disclosures.
In March 2016, the FASB issued ASU 2016-09, Compensation – Stock Compensation (Topic 718) (“ASU 2016-09”), which simplifies the accounting for share-based payment transactions. Among other things, ASU 2016-09 provides for (i) the simplification of accounting presentation of excess tax benefits and tax deficiencies, (ii) an accounting policy election regarding forfeitures to use an estimate or account for when incurred, and (iii) simplification of cash flow presentation for statutory tax rate withholding. ASU 2016-09 is effective for public business entities for annual reporting periods beginning after December 15, 2016, with early adoption permitted. The transition method required by ASU 2016-09 varies by amendment. The Company will implement this new standard on its effective date and it does not expect the adoption of 2016-09 to have a material impact on its consolidated financial statements and disclosures. However, the Company cannot provide any assurance regarding their future impacts. Additionally, the adoption of the accounting policy election to record forfeitures as incurred may increase the volatility of equity based compensation.
In August 2016, the FASB issued ASU 2016-15, Statement of Cash Flows (Topic 230) (“ASU 2016-15”), which addresses eight classification issues related to the statement of cash flows presentation, with the objective of reducing diversity in practice. The amendments in this ASU provide guidance on the following cash flow issues: 1) debt prepayment or debt extinguishment costs; 2) settlement of zero-coupon debt instruments; 3) contingent consideration payments made after a business combination; 4) proceeds from the settlement of insurance claims; 5) proceeds from the settlement of corporate-owned life insurance policies, including bank-owned life insurance policies; 6) distributions received from equity method investees; 7) beneficial interests in securitization transactions; and 8) separately identifiable cash flows and application of the predominance principle. ASU 2016-15 is effective for public business entities for annual reporting periods beginning after December 31, 2017, with early adoption permitted. Although the Company is still evaluating the effect that ASU 2016-15 will have on its statement of cash flow and disclosures, the Company expects the standard will primarily impact of the presentation of the earnouts associated with the business acquisitions completed in January 2017. Their presentation in accordance with ASU 2016-15 would depend on whether they were deemed to be paid soon after the acquisition.
60
Note 3. Cash Equivalents and Marketable Securities
The Company’s cash equivalents and available-for-sale securities reported at fair value as of December 31, 2016 and 2015 are summarized below:
|
(In thousands) |
December 31, 2016 |
December 31, 2015 |
|||
|
Cash equivalents: |
|||||
|
Money market mutual funds |
$ |
6,742 |
$ |
6,746 | |
|
Commercial paper |
- |
1,000 | |||
|
Corporate debt securities |
413 | 1,055 | |||
|
Total cash equivalents |
7,155 | 8,801 | |||
|
Marketable securities: |
|||||
|
Commercial paper |
7,370 | 8,684 | |||
|
Debt securities issued by U.S. Government agencies |
- |
35,155 | |||
|
Corporate debt securities |
16,716 | 44,972 | |||
|
Variable rate demand notes |
13,995 |
- |
|||
|
Total marketable securities, available-for-sale |
38,081 | 88,811 | |||
|
|
|||||
|
Total cash equivalents and marketable securities |
$ |
45,236 |
$ |
97,612 | |
At December 31, 2016 and 2015, the carrying values of the investments included in cash and equivalents approximated fair value. The amortized cost basis of the available-for-sale securities was not materially different from the aggregate fair value.
The contractual maturities of the Company’s available-for-sale debt securities were as follows as of December 31, 2016:
|
(In thousands) |
Total |
|
|
Due in one year or less |
$ |
24,086 |
|
Due after one year through five years |
- |
|
|
Due after five through ten years |
4,695 | |
|
Due after ten years |
9,300 | |
|
Total debt securities |
$ |
38,081 |
The Company received total proceeds of $125.0 million, $42.2 million and $40.7 million from the sale or maturity of available-for-sale marketable securities during the years ended December 31, 2016, 2015 and 2014. Net unrealized holding gains on available-for-sale securities were less than $0.1 million for each of the years ended December 31, 2016 and 2015 and are included in accumulated other comprehensive loss on the consolidated balance sheets as of December 31, 2016 and 2015.
Note 4. Disclosures About Segments of an Enterprise and Related Information
The Company’s operating segments generally align with its major product and service offerings and coincide with the way that the Company’s chief operating decision makers measure performance and allocate resources. The Company’s chief operating decision makers are its Chief Executive Officer and its Chief Financial Officer (collectively, the “CODMs”). The Company’s current reportable operating segments are Data, Residential and Small Business (“R&SB”) and RLEC Access. A general description of the products and services offered and the customers served by each of these segments is as follows:
61
|
· |
Data: This segment includes the Company’s enterprise data (metro Ethernet, dedicated Internet, voice over IP (“VoIP”) and private line), transport, and FTTC product and service groups. These businesses primarily serve enterprise and carrier customers utilizing the Company’s network of long-haul fiber, metro Ethernet and Ethernet rings located primarily in Virginia and West Virginia, and portions of Pennsylvania, Maryland, Ohio and Kentucky. |
|
· |
R&SB: This segment includes the following voice products: local lines, primary rate interface (“PRI”), long distance, toll and directory advertising and other voice services (excluding VoIP which are typically provided to enterprise customers and are included in the Company’s data segment) and the following IP services products: fiber-to-the-premise broadband XL, DSL, integrated access and video. These products are sold to residential and small business customers on the Company’s network and within the Company’s footprint. This segment also provides carrier customers access to our network located in competitive markets. |
|
· |
RLEC Access: This segment provides carrier customers access to the Company’s network within the Company’s RLEC footprint and primarily includes switched access services. |
Summarized financial information concerning the Company’s reportable segments for the years ended December 31, 2016, 2015 and 2014 is presented in the following table:
|
(In thousands) |
Data |
R&SB |
RLEC |
Corporate (Unallocated) |
Total |
||||||||||
|
For the year ended December 31, 2016 |
|||||||||||||||
|
Operating revenues |
$ |
123,604 |
$ |
63,328 |
$ |
19,967 |
$ |
- |
$ |
206,899 | |||||
|
Cost of revenue |
17,909 | 21,064 |
- |
- |
38,973 | ||||||||||
|
Gross profit |
105,695 | 42,264 | 19,967 |
N/A |
|||||||||||
|
Direct operating and selling costs |
7,489 | 4,658 | 653 |
- |
12,800 | ||||||||||
|
Indirect operating costs |
26,717 | 9,494 | 210 |
- |
36,421 | ||||||||||
|
Corporate general and administrative costs |
15,471 | 6,395 | 1,749 | 12,142 | 35,757 | ||||||||||
|
Adjusted EBITDA(1),(2) |
56,018 | 21,717 | 17,355 |
- |
N/A |
||||||||||
|
Capital expenditures |
73,328 | 10,050 |
- |
649 | 84,027 | ||||||||||
|
|
|||||||||||||||
|
For the year ended December 31, 2015: |
|||||||||||||||
|
Operating revenues |
$ |
114,311 |
$ |
67,214 |
$ |
22,744 |
$ |
- |
$ |
204,269 | |||||
|
Cost of revenues |
17,934 | 24,271 |
- |
- |
42,205 | ||||||||||
|
Gross profit |
96,377 | 42,943 | 22,744 |
N/A |
|||||||||||
|
Direct operating and selling costs |
5,403 | 4,521 | 666 |
- |
10,590 | ||||||||||
|
Indirect operating costs |
25,322 | 10,043 | 225 |
- |
35,590 | ||||||||||
|
Corporate general and administrative costs |
14,933 | 6,953 | 1,995 | 7,231 | 31,112 | ||||||||||
|
Adjusted EBITDA(1),(2) |
50,719 | 21,426 | 19,858 |
- |
N/A |
||||||||||
|
Capital expenditures |
98,535 | 9,545 |
- |
7,595 | 115,675 | ||||||||||
|
|
|||||||||||||||
|
For the year ended December 31, 2014: |
|||||||||||||||
|
Operating revenues |
$ |
106,642 |
$ |
72,028 |
$ |
22,786 |
$ |
- |
$ |
201,456 | |||||
|
Cost of revenue |
16,767 | 26,211 |
- |
- |
42,978 | ||||||||||
|
Gross profit |
89,875 | 45,817 | 22,786 |
N/A |
|||||||||||
|
Direct operating and selling costs |
4,755 | 4,600 | 667 |
- |
10,022 | ||||||||||
|
Indirect operating costs |
24,194 | 10,077 | 309 |
- |
34,580 | ||||||||||
|
Corporate general and administrative costs |
14,227 | 7,660 | 2,125 | (5,942) | 18,071 | ||||||||||
|
Adjusted EBITDA(1),(2) |
46,699 | 23,480 | 19,685 | 10,774 |
N/A |
||||||||||
|
Capital expenditures |
66,570 | 7,089 |
- |
10,441 | 84,100 | ||||||||||
|
(1) |
Adjusted EBITDA (a non-GAAP measure), is used by the Company’s CODMs to evaluate performance. Adjusted EBITDA, as defined by the Company, is net income or loss attributable to Lumos Networks Corp. before interest, income taxes, depreciation and amortization, accretion of asset retirement obligations, net income or loss attributable to noncontrolling interests, other income or expenses, equity-based compensation charges, amortization of actuarial losses on retirement plans,
62 |
employee separation charges, restructuring-related charges, acquisition and separation related charges, gain or loss on settlements and gain or loss on interest rate swap derivatives. See Item 7. Management’s Discussion and Analysis of Financial Condition and Results of Operations for additional disclosures regarding Adjusted EBITDA |
|
(2) |
In 2016, the Company refined its methodology for allocating certain operating costs to the segments, resulting in immaterial changes to previously reported segment Adjusted EBITDA amounts for the years ended December 31, 2015 and 2014. |
N/A – Not Applicable (as totals are not presented in the consolidated statements of operations).
The Company’s CODMs do not currently review total assets by segment since the assets are centrally managed and some of the assets are shared by the segments. Management does review capital expenditures using success-based metrics that allow the Company to determine which segment product groups are driving investment in the network. Depreciation and amortization expense and certain corporate expenses that are excluded from the measurement of segment profit or loss are not allocated to the operating segments. The Company did not allocate the curtailment gain of $10.8 million recognized in 2014 due to the discontinuance of certain medical benefits under the postretirement medical plan to the segments and this amount is included in corporate unallocated charges for the year ended December 31, 2014 in the table above.
The following table provides a reconciliation of the total of the Company’s reportable segments measure of profit to the Company’s consolidated income before income taxes for the years ended December 31, 2016, 2015 and 2014:
|
|
Year Ended December 31, |
||||||||
|
(In thousands) |
2016 |
2015 |
2014 |
||||||
|
Data Adjusted EBITDA |
$ |
56,018 |
$ |
50,719 |
$ |
46,699 | |||
|
R&SB Adjusted EBITDA |
21,717 | 21,426 | 23,480 | ||||||
|
Access Adjusted EBITDA |
17,355 | 19,858 | 19,685 | ||||||
|
Corporate (Unallocated) Adjusted EBITDA |
- |
- |
10,774 | ||||||
|
Total reportable segments measure of profit |
95,090 | 92,003 | 100,638 | ||||||
|
Interest expense |
(28,385) | (19,918) | (15,575) | ||||||
|
Gain on interest rate swap derivatives |
- |
665 | 492 | ||||||
|
Other (income) expenses, net |
389 | 114 | 664 | ||||||
|
Depreciation and amortization and accretion |
|||||||||
|
of asset retirement obligations |
(51,394) | (47,666) | (45,330) | ||||||
|
Amortization of actuarial losses |
(1,350) | (1,350) | (248) | ||||||
|
Equity-based compensation |
(9,581) | (5,881) | (4,340) | ||||||
|
Restructuring charges |
(1,940) | (638) |
- |
||||||
|
Employee separation charges |
- |
- |
(244) | ||||||
|
Acquisition and separation related charges |
(1,211) |
- |
- |
||||||
|
Income before income taxes |
$ |
1,618 |
$ |
17,329 |
$ |
36,057 | |||
One of the Company's carrier customers, AT&T, individually accounted for 7% of the Company’s total revenue for each of the years ended December 31, 2016 and 2015 and 10% of the Company’s total revenue for the year ended December 31, 2014. The Company’s five largest carrier customers, in the aggregate, accounted for 32% of the Company’s total operating revenues for the year ended December 31, 2016 and 31% for each of the years ended December 31, 2015 and 2014. Revenue from these carrier customers was derived primarily from network access, data transport and FTTC services.
63
Note 5. Long-Term Debt
As of December 31, 2016 and 2015, the Company’s outstanding long-term debt consisted of the following:
|
|
December 31, 2016 |
December 31, 2015 |
||||||||||
|
(In thousands) |
Principal |
Unamortized Discount and Debt Issuance Costs |
Principal |
Unamortized Discount and Debt Issuance Costs |
||||||||
|
Credit Facility |
$ |
340,385 |
$ |
3,283 |
$ |
348,415 |
$ |
4,705 | ||||
|
8% Notes |
150,000 | 26,529 | 150,000 | 29,607 | ||||||||
|
Capital lease obligations |
7,842 |
- |
2,597 |
- |
||||||||
|
Long-term debt |
498,227 | 29,812 | 501,012 | 34,312 | ||||||||
|
Less: Current portion of long-term debt |
13,530 |
- |
10,400 |
- |
||||||||
|
Long-term debt, excluding current portion |
$ |
484,697 |
$ |
29,812 |
$ |
490,612 |
$ |
34,312 | ||||
Credit Facility
On April 30, 2013, Lumos Networks Operating Company, a wholly-owned subsidiary of the Company, entered into a $425 million credit facility (the “Credit Facility”). The Credit Facility consists of a $100 million senior secured five-year term loan (the “Term Loan A”), a $275 million senior secured six-year term loan (the “Term Loan B”); a $28 million senior secured incremental term loan, which was added through an amendment to the Credit Facility dated January 2, 2015 (“Term Loan C”); and a $50 million senior secured five-year revolving credit facility (the “Revolver”). The proceeds from the Term Loan A and the Term Loan B were used to retire the prior credit facility outstanding amount of approximately $311 million and to pay closing costs and other expenses related to the transaction, with the remaining proceeds available for normal course capital expenditures and working capital purposes. The Company used the net proceeds from Term Loan C to fund new FTTC projects. As of December 31, 2016, no borrowings were outstanding under the Revolver.
On August 6, 2015, the Company prepaid $40.0 million of the outstanding principal of the Credit Facility, which was allocated ratably to Term Loans A, B and C. The Company used proceeds from the issuance of the 8% Notes, discussed below, to fund these prepayments.
Pricing of the amended Credit Facility is LIBOR plus 3.00% for the Revolver and Term Loan A and LIBOR plus 3.25% for Term Loan B and C. The Credit Facility does not require a minimum LIBOR rate. The Term Loan A matures in 2018 with quarterly payments of 1.25% per annum through December 31, 2016 and 2.50% per annum thereafter. The Term Loan B matures in 2019 with quarterly payments of 1% per annum. The Term Loan C matures in 2019 with quarterly payments of 1% per annum. The Revolver matures in full in 2018. The Credit Facility is secured by a first priority pledge of substantially all property and assets of Lumos Networks Operating Company and all material subsidiaries, as guarantors, excluding the RLECs.
The amended Credit Facility includes various restrictions and conditions, including a maximum leverage ratio of 4.75:1.00 through December 31, 2016, 4.50:1.00 through December 31, 2017, 4.25:1.00 through December 31, 2018 and 4.00:1.00 thereafter. The Credit Facility also sets a minimum interest rate coverage ratio of 3.25:1.00. At December 31, 2016, the Company’s leverage ratio was 3.68:1.00 and its interest coverage ratio was 7.27:1.00. The Company was in compliance with its debt covenants as of December 31, 2016.
Mandatory prepayments include an excess cash flow sweep equal to 50% of Excess Cash Flow, as defined under the Credit Agreement, for each fiscal year commencing in 2013 for so long as the leverage ratio exceeds 3.25:1.00. Based on the excess cash flow calculation as of December 31, 2016, no mandatory prepayment was due for the year ended December 31, 2016.
In accordance with the terms of the Credit Facility, the Company entered into interest rate swap agreements with a combined notional amount of 50 percent of the aggregate outstanding balance of Term Loan A and Term Loan B. Under the interest rate swap agreements, the Company swapped one-month LIBOR with a fixed rate of approximately 0.5% for certain agreements entered into in 2012 and 0.8% for certain agreements entered into in 2013. The interest rate swap agreements expired on December 31, 2015. The Company recognized a net gain on interest rate swap derivatives of $0.7 and $0.5 million for the years ended December 31, 2015 and 2014, respectively.
The Company’s effective interest rate on its Credit Facility for the year ended December 31, 2016 was 3.95%.
8% Notes due 2022
On August 6, 2015, the Company issued $150 million in unsecured promissory notes (the “8% Notes”) to an affiliate of Pamplona Capital Management LLC (“Pamplona”). The net proceeds of the 8% Notes, after a $1.5 million purchasers discount and payment of $7.1 million of closing costs, were used to prepay $40.0 million of the Company’s existing Credit Facility with the remainder to be
64
used for general corporate purposes, including to fund future growth opportunities. The 8% Notes bear interest at an annual fixed rate of 8.00% and mature on August 15, 2022. Interest is payable in arrears on a quarterly basis on August 15, November 15, February 15, and May 15 of each year, beginning on November 15, 2015. Interest is payable in cash or, at the election of the Company, through the issuance of additional notes or by adding the amount of the accrued interest to the unpaid principal amount of the 8% Notes outstanding at that time. The 8% Notes were also issued with 5,500,000 warrants for no additional consideration to purchase shares of the Company’s common stock (the “Warrants”). The Company allocated the net proceeds received from the debt issuance to the 8% Notes and the equity-classified Warrants based on the relative fair value of the instruments. As a result, the Company recognized a total discount on the 8% Notes of $24.8 million, of which $23.5 million represents the value assigned to the Warrants and $1.3 million represents the allocated portion of the aforementioned $1.5 million purchasers discount. The discount on the 8% Notes is being amortized to interest expense over the life of the debt using the effective interest method. See Note 9 for additional information regarding the valuation of the Warrants.
In connection with the issuance of the 8% Notes in August 2015 and the Term Loan C financing in January 2015, the Company deferred an additional $6.0 million and $0.9 million, respectively, in debt issuance costs. Total unamortized debt issuance costs associated with the 8% Notes and Credit Facility are included in the table above, which amounts are presented as a reduction of long-term debt in the consolidated balance sheets in accordance with ASU 2015-03, Simplifying the Presentation of Debt Issuance Costs (“ASU 2015-03”). These costs are being amortized to interest expense over the life of the debt using the effective interest method. Amortization of debt issuance costs for the years ended December 31, 2016, 2015 and 2014 was $4.5 million, $2.7 million and $1.5 million, respectively.
The Company’s effective interest rate on the 8% Notes for the year ended December 31, 2016 was 12.55%, which represents the contractual rate adjusted for the aforementioned discount and deferred debt issuance costs.
The Company receives patronage credits from CoBank and certain other of the Farm Credit System lending institutions (collectively referred to as “patronage banks”) which are not reflected in the interest rates above. The patronage banks hold a portion of the credit facility and are cooperative banks that are required to distribute their profits to their members. Patronage credits are calculated based on the patronage banks’ ownership percentage of the credit facility and are received by the Company as either a cash distribution or as equity in the patronage banks. The current patronage credit percentages are 75% in cash and 25% in equity. These credits are recorded in the consolidated statements of operations as an offset to interest expense. The patronage credits were $1.0 million, $1.2 million and $0.7 million for the years ended December 31, 2016, 2015 and 2014, respectively.
The aggregate maturities of the Term Loan A, Term Loan B and Term Loan C under the Credit Facility are $13.0 million in 2017, $70.9 million in 2018 and $256.5 million in 2019. The revolver under the Credit Facility, under which no borrowings are outstanding as of December 31, 2016, matures in full in 2018. The 8% Notes mature for $150.0 million in 2022.
Capital lease obligations
In addition to the long-term debt discussed above, the Company has capital leases on vehicles with original lease terms of four to five years. The Company also has a fiber indefeasible right of use (“IRU”) agreement classified as a capital lease, which was entered into in January 2016. The IRU network capacity arrangement extends through 2035 with payments due monthly. During the second quarter of 2016, the Company fully satisfied a financing obligation related to a software licensing agreement entered into during 2013. As of December 31, 2016, the combined total net present value of the Company’s future minimum lease payments is $7.8 million and the principal portion of these capital lease obligations was due as follows $0.5 million in 2017 and 2018, $0.4 million in 2019 through 2021 and $5.6 million thereafter.
The historical cost and accumulated amortization for each of the related assets associated with the capital leases is as follows as of December 31, 2016:
|
|
||||||
|
|
December 31, 2016 |
|||||
|
(In thousands) |
Historical Cost |
Accumulated Amortization |
||||
|
Vehicles |
$ |
2,723 |
$ |
(1,755) | ||
|
Network capacity IRU |
8,871 | (444) | ||||
|
Total |
$ |
11,594 |
$ |
(2,199) | ||
65
Note 6. Supplementary Disclosures of Cash Flow Information
The following information is presented as supplementary disclosures for the consolidated statements of cash flows for the years ended December 31, 2016, 2015 and 2014:
|
(In thousands) |
2016 |
2015 |
2014 |
||||||
|
Cash payments (receipts): |
|||||||||
|
Interest (net of amounts capitalized) |
$ |
23,873 |
$ |
15,467 |
$ |
13,206 | |||
|
Income taxes |
395 | 843 | (680) | ||||||
|
Supplemental investing and financing |
|||||||||
|
activities: |
|||||||||
|
Additions to property and equipment |
|||||||||
|
included in accounts payable and |
|||||||||
|
other accrued liabilities |
2,750 | 6,906 | 8,373 | ||||||
|
Capital lease obligations |
7,928 |
- |
123 | ||||||
|
Dividend declared not paid |
$ |
- |
$ |
- |
$ |
3,152 | |||
Cash payments for interest for the years ended December 31, 2016, 2015 and 2014 in the table above are net of $0.8 million, $0.8 million and $0.9 million, respectively, of cash received from CoBank for patronage credits (Note 5). The amount of interest capitalized was $1.0 million, $1.2 million and $0.3 million for the years ended December 31, 2016, 2015 and 2014, respectively.
Note 7. Fair Value of Financial Instruments
The Company’s financial instruments consist of cash and cash equivalents, marketable securities, accounts receivable, accounts payable, capital lease obligations (including the current portion), accrued liabilities, the Credit Facility (including the current portion) and the 8% Notes as of December 31, 2016 and 2015. The carrying values of cash and cash equivalents, restricted cash, accounts receivable, accounts payable, capital lease obligations and accrued liabilities approximated their fair values at December 31, 2016 and 2015. Marketable securities are recorded in the consolidated balance sheets at fair value (see Note 3 and Note 5).
66
The following table presents the placement in the fair value hierarchy of financial assets and liabilities that are measured at fair value on a recurring basis at December 31, 2016 and 2015:
|
|
Fair Value Measurements at |
|||||||||||
|
(In thousands) |
Level 1 |
Level 2 |
Level 3 |
Total Fair Value |
||||||||
|
Assets: |
||||||||||||
|
Cash equivalents: |
||||||||||||
|
Money market mutual funds |
$ |
6,742 |
$ |
- |
$ |
- |
$ |
6,742 | ||||
|
Corporate debt securities |
- |
413 |
- |
413 | ||||||||
|
Total cash equivalents |
6,742 | 413 |
- |
7,155 | ||||||||
|
Marketable securities: |
||||||||||||
|
Commercial paper |
- |
7,370 |
- |
7,370 | ||||||||
|
Corporate debt securities |
- |
16,716 |
- |
16,716 | ||||||||
|
Variable rate demand notes |
- |
13,995 |
- |
13,995 | ||||||||
|
Total marketable securities |
- |
38,081 |
- |
38,081 | ||||||||
|
Total financial assets |
$ |
6,742 |
$ |
38,494 |
$ |
- |
$ |
45,236 | ||||
|
|
||||||||||||
|
|
Fair Value Measurements at |
|||||||||||
|
(In thousands) |
Level 1 |
Level 2 |
Level 3 |
Total Fair Value |
||||||||
|
Assets: |
||||||||||||
|
Cash equivalents: |
||||||||||||
|
Money market mutual funds |
$ |
6,746 |
$ |
- |
$ |
- |
$ |
6,746 | ||||
|
Commercial paper |
- |
1,000 |
- |
1,000 | ||||||||
|
Corporate debt securities |
- |
1,055 |
- |
1,055 | ||||||||
|
Total cash equivalents |
6,746 | 2,055 |
- |
8,801 | ||||||||
|
Marketable securities: |
||||||||||||
|
Commercial paper |
- |
8,684 |
- |
8,684 | ||||||||
|
Debt securities issued by U.S. Government agencies |
- |
35,155 |
- |
35,155 | ||||||||
|
Corporate debt securities |
- |
44,972 |
- |
44,972 | ||||||||
|
Total marketable securities |
- |
88,811 |
- |
88,811 | ||||||||
|
Total financial assets |
$ |
6,746 |
$ |
90,866 |
$ |
- |
$ |
97,612 | ||||
|
|
||||||||||||
The fair value of commercial paper, variable rate demand notes and corporate, municipal and U.S. government debt securities are provided by a third-party pricing service and are estimated using pricing models. The underlying inputs to the pricing models are directly observable from active markets. However, the pricing models used do entail a certain amount of subjectivity and therefore differing judgments in how the underlying inputs are modeled could result in different estimates of fair value. As such, the Company classifies these fair value measurements as Level 2 within the fair value hierarchy.
67
The following table summarizes the carrying amounts and estimated fair values of the components included in the Company’s long-term debt, including the current portion.
|
|
December 31, 2016 |
December 31, 2015 |
||||||||||
|
(In thousands) |
Carrying Value |
Fair Value |
Carrying Value |
Fair Value |
||||||||
|
Credit Facility |
$ |
337,102 |
$ |
304,571 |
$ |
343,710 |
$ |
298,400 | ||||
|
8% Notes |
123,471 | 133,965 | 120,393 | 132,028 | ||||||||
|
Capital lease obligations |
7,842 | 7,842 | 2,597 | 2,597 | ||||||||
The respective fair values of the Credit Facility and the 8% Notes were estimated based on an internal discounted cash flows analysis that schedules out the estimated cash flows for the future debt and interest repayments and applies a discount factor that is adjusted to reflect estimated changes in market conditions and credit factors.
The Company also has certain non-marketable long-term investments for which it is not practicable to estimate fair value with a total carrying value of $1.5 million and $1.2 million as of December 31, 2016 and 2015, respectively, of which $1.4 million and $1.1 million, respectively, represents the Company’s investment in CoBank. This investment is primarily related to patronage distributions of restricted equity and is a required investment related to the portion of the Credit Facility held by CoBank. This investment is carried under the cost method.
Note 8. Earnings (Loss) per Share
The Company computes basic earnings (loss) per share by dividing net income (loss) attributable to Lumos Networks Corp. applicable to common shares by the weighted average number of common shares outstanding during the period. The impact on earnings (loss) per share of nonvested restricted shares outstanding that contain a non-forfeitable right to receive dividends on a one-to-one per share ratio to common shares is included in the computation of basic earnings per share pursuant to the two-class method. The Company issues restricted shares from time to time with vesting terms that are based on achievement of certain stock price performance conditions. These nonvested restricted shares are excluded from the computation of basic and diluted weighted average shares until the period in which the applicable performance or market conditions are attained. The Company uses the treasury stock method to determine the number of potentially dilutive common shares from stock options and nonvested restricted shares during the period.
The computations of basic and diluted earnings (loss) per share for the years ended December 31, 2016, 2015 and 2014 are as follows:
|
(In thousands, except per share amounts) |
2016 |
2015 |
2014 |
||||||
|
Numerator: |
|||||||||
|
Net (loss) income attributable to Lumos Networks Corp. |
$ |
(523) |
$ |
10,026 |
$ |
21,528 | |||
|
Less: net income attributable to Lumos Networks Corp. allocable to participating securities |
- |
(338) | (540) | ||||||
|
Numerator for basic and diluted (loss) earnings per common share |
(523) | 9,688 | 20,988 | ||||||
|
|
|||||||||
|
Denominator: |
|||||||||
|
Weighted average basic shares outstanding |
23,370 | 22,825 | 22,328 | ||||||
|
Less: weighted average participating securities and nonvested performance-based restricted shares |
(813) | (791) | (581) | ||||||
|
Denominator for basic (loss) earnings per common share |
22,557 | 22,034 | 21,747 | ||||||
|
Plus: potentially dilutive stock options |
- |
275 | 363 | ||||||
|
Denominator for diluted (loss) earnings per common share |
22,557 | 22,309 | 22,110 | ||||||
|
|
|||||||||
|
Basic (loss) earnings per share |
$ |
(0.02) |
$ |
0.44 |
$ |
0.97 | |||
|
|
|||||||||
|
Diluted (loss) earnings per share |
$ |
(0.02) |
$ |
0.43 |
$ |
0.95 | |||
For the year ended December 31, 2016, the denominator for diluted loss per common share is equivalent to the denominator for basic loss per common share because the addition of stock options and unvested restricted stock (984,144 and 526,957, respectively) would be antidilutive for the period. For the year ended December 31, 2015, the denominator for diluted earnings per common share excludes 740,214 shares related to stock options and 24,000 shares related to restricted stock awards which would be antidilutive for the period. For the year ended December 31, 2014, the denominator for diluted earnings per common share excludes 598,463 shares related to stock options and 17,383, shares related to restricted stock awards which would be antidilutive for the period. The earnings
68
per share calculation for the year ended December 31, 2016 and 2015 also exclude the 5,500,000 outstanding stock warrants described in Note 9 as they would be antidilutive for the respective periods.
Note 9. Stock Options, Restricted Stock and Stock Warrants
Stock Options and Restricted Stock
The Company has an Equity and Cash Incentive Plan administered by the Compensation Committee of the Company’s board of directors, which permits the grant of long-term incentives to employees and non-employee directors, including stock options, stock appreciation rights, restricted stock awards, restricted stock units, incentive awards, other stock-based awards and dividend equivalents. As of December 31, 2016, the maximum number of shares of common stock available for awards under the Equity and Cash Incentive Plan is 5,500,000 and 901,558 securities remained available for issuance under the Equity and Cash Incentive Plan. Upon the exercise of stock options or upon the grant of restricted stock under the Equity and Cash Incentive Plan, new common shares are issued or treasury stock is reissued.
The Company didn’t issue any stock options under the Equity and Cash Incentive Plan during the year ended December 31, 2016 and issued 323,804 shares of restricted stock. Options issued to employees with service-only conditions generally vest on a graded vesting schedule over a four to five year period. Restricted shares generally cliff vest on the third anniversary of the grant date for employees and generally cliff vest on the first anniversary of the grant date for non-employee directors. Some restricted stock awards vest on a graded vesting schedule over a five year period. Certain stock options and restricted shares granted by the Company contain vesting provisions that are conditional on achievement of a target market price for the Company’s common stock.
Dividend rights applicable to restricted stock with service-only vesting conditions are equivalent to the Company’s common stock. Restricted stock awards that vest based on achievement of a market condition are not eligible for dividends during the vesting period unless the Compensation Committee determines otherwise.
Stock options must be granted under the Equity and Cash Incentive Plan at not less than 100% of fair value on the date of grant and have a maximum life of ten years from the date of grant. Options and other awards under the Equity and Cash Incentive Plan may be exercised in compliance with such requirements as determined by a committee of the board of directors. Substantially all options outstanding were issued at a strike price equal to or greater than the fair value on the date of grant.
The fair value of each option award with service-only vesting conditions is estimated on the grant date using the Black-Scholes option-pricing model with assumptions related to risk-free interest rate, expected volatility, dividend yield and expected term. The risk-free rate is based on the zero-coupon U.S. Treasury rate in effect at the time of grant, with a term equal to the expected life of the options. The expected option life represents the period of time that the options granted are expected to be outstanding and is determined using the simplified method. The expected dividend yield is estimated based on the Company’s actual dividend yield at the date of the grant.
There were no stock options granted during the year ended December 31, 2016. The weighted-average grant date fair value per share of stock options granted during the years ended December 31, 2015 and 2014 was $8.09 and $6.68, respectively. The following weighted-average assumptions were used in estimating the grant date fair value of these awards:
|
|
||||
|
|
Year Ended |
Year Ended |
||
|
Risk-free interest rate |
1.90% |
1.96% |
||
|
Expected volatility |
55.93% |
59.52% |
||
|
Expected dividend yield |
0.00% |
3.54% |
||
|
Expected term |
6.3 years |
6.1 years |
The fair value of each restricted stock award with service-only vesting conditions is based on the closing price of the Company’s common stock on the grant date. The fair value for option awards and restricted stock awards with vesting that is conditional on achievement of market conditions is adjusted to reflect the probability of satisfying the market condition based on a Monte Carlo valuation model.
69
The summary of the activity and status of the Company’s stock options for the year ended December 31, 2016 is as follows:
|
(In thousands, except per share amounts) |
Shares |
Weighted-Average Exercise Price per Share |
Weighted-Average Remaining Contractual Term |
Aggregate Intrinsic Value |
||||||
|
Stock options outstanding at December 31, 2015 |
2,182 |
$ |
12.57 | |||||||
|
Granted during the period |
- |
- |
||||||||
|
Exercised during the period |
(123) | 12.59 | ||||||||
|
Forfeited during the period |
(35) | 13.96 | ||||||||
|
Expired during the period |
(275) | 13.78 | ||||||||
|
Stock options outstanding at December 31, 2016 |
1,749 |
$ |
12.35 |
5.2 years |
$ |
6,279 | ||||
|
|
||||||||||
|
Stock options exercisable at December 31, 2016 |
1,325 |
$ |
12.17 |
4.9 years |
$ |
4,997 | ||||
|
Total stock options outstanding, vested and expected to vest |
||||||||||
|
at December 31, 2016 |
1,727 |
$ |
12.36 |
$ |
6,180 | |||||
The total intrinsic value of stock options exercised during the years ended December 31, 2016, 2015 and 2014 was $0.2 million, $0.1 million and $0.3 million, respectively. The total fair value of options that vested during the years ended December 31, 2016, 2015 and 2014 was $0.8 million, $1.3 million and $0.5 million, respectively. As of December 31, 2016, there was $0.8 million of total unrecognized compensation cost related to unvested stock options, which is expected to be recognized over a weighted-average period of 1.5 years.
The summary of the activity and status of the Company’s restricted stock for the year ended December 31, 2016 is as follows:
|
(In thousands, except per share amounts) |
Shares |
Weighted-Average Grant Date Fair Value per Share |
|||
|
Restricted stock outstanding at December 31, 2015 |
861 |
$ |
14.37 | ||
|
Granted during the period |
324 | 12.17 | |||
|
Vested during the period |
(240) | 12.46 | |||
|
Forfeited during the period |
(96) | 15.91 | |||
|
Restricted stock outstanding at December 31, 2016 |
849 |
$ |
13.85 |
As of December 31, 2016, there was $4.7 million of total unrecognized compensation cost related to unvested restricted stock awards, which is expected to be recognized over a weighted-average period of 1.8 years. The total fair value of restricted stock awards that vested during the years ended December 31, 2016, 2015 and 2014 was $3.0 million, $1.7 million and $1.7 million, respectively.
In addition to the Equity and Cash Incentive Plan discussed above, the Company has an employee stock purchase plan which commenced in November 2011 with 100,000 shares available. As of December 31, 2016, 61,657 shares remained available for issuance under the employee stock purchase plan. New common shares will be issued for purchases under this plan or treasury shares will be reissued. Shares are priced at 85% of the closing price on the last trading day of the month and settle on the second business day of the following month. During the year ended December 31, 2016, 6,126 shares were issued under the employee stock purchase plan. Compensation expense associated with the employee stock purchase plan was less than $0.1 million for the years ended December 31, 2016, 2015 and 2014.
70
Stock Warrants
On August 6, 2015, in conjunction with the 8% Notes issuance discussed in Note 5, the Company issued for no additional consideration 5,500,000 warrants (the “Warrants”) to purchase shares of the Company’s common stock at an exercise price of $13.99. The Warrants are fully vested and exercisable and may be net-share settled on a cashless basis only until they expire on August 6, 2022. The grant date fair value of the Warrants was $4.44 per share, which was estimated using the Black-Scholes option pricing model and the following assumptions:
|
Risk-free interest rate |
1.61 |
% |
|
Expected volatility |
41.53 |
% |
|
Expected dividend yield |
0 |
% |
|
Expected term |
5 years |
A portion of the net proceeds from the 8% Notes issuance was allocated to the equity-classified Warrants based on the relative fair value of the instruments. The allocated proceeds of $23.5 million were recorded in additional paid-in capital on the consolidated balance sheet as of December 31, 2016 and 2015, net of $1.3 million in issuance costs.
A summary of the activity and status of the Company’s stock warrants for the year ended December 31, 2016, is as follows:
|
(In thousands, except per share amounts) |
Shares |
Weighted Average Exercise Price per Share |
|||
|
Stock warrants outstanding at December 31, 2015 |
5,500 |
$ |
13.99 | ||
|
Granted during the period |
- |
- |
|||
|
Exercised during the period |
- |
- |
|||
|
Expired during the period |
- |
- |
|||
|
Stock warrants outstanding at December 31, 2016 |
5,500 |
$ |
13.99 |
Note 10. Income Taxes
The components of income tax expense are as follows for the years ended December 31, 2016, 2015 and 2014:
|
(In thousands) |
2016 |
2015 |
2014 |
||||||
|
Current tax expense (benefit): |
|||||||||
|
Federal |
$ |
- |
$ |
- |
$ |
- |
|||
|
State |
411 | 379 | (68) | ||||||
|
Total current tax expense (benefit) |
411 | 379 | (68) | ||||||
|
|
|||||||||
|
Deferred tax expense: |
|||||||||
|
Federal |
1,341 | 6,319 | 11,908 | ||||||
|
State |
210 | 448 | 2,569 | ||||||
|
Total deferred tax expense |
1,551 | 6,767 | 14,477 | ||||||
|
Total income tax expense |
$ |
1,962 |
$ |
7,146 |
$ |
14,409 | |||
71
Total income tax expense was different than an amount computed by applying the graduated federal statutory income tax rates to income before taxes. The reasons for the differences are as follows for the years ended December 31, 2016, 2015 and 2014:
|
(In thousands) |
2016 |
2015 |
2014 |
||||||
|
Computed tax expense at federal statutory |
|||||||||
|
rate of 35% |
$ |
567 |
$ |
6,065 |
$ |
12,620 | |||
|
Nondeductible compensation |
532 | 122 | 27 | ||||||
|
Noncontrolling interests |
(69) | (61) | (47) | ||||||
|
Nondeductible public offering costs |
- |
112 |
- |
||||||
|
State income taxes, net of federal income |
|||||||||
|
tax impact |
403 | 538 | 1,626 | ||||||
|
Nondeductible interest on 8% Notes |
28 | 578 |
- |
||||||
|
Other, net |
501 | (208) | 183 | ||||||
|
Total income tax expense |
$ |
1,962 |
$ |
7,146 |
$ |
14,409 | |||
During the years ended December 31, 2016 and 2015, the Company recognized excess tax expense (benefits) of approximately $0.2 million and ($0.2) million in additional paid-in capital related to stock compensation plans. During the year ended December 31, 2014, the Company reclassified tax benefits of approximately $1.5 million from additional paid-in capital to deferred tax liabilities associated with unrealized excess tax benefits related to stock compensation plans. As of December 31, 2016, these tax benefits are available to offset future taxable income. The Company recognized tax expense of $0.6 million and $0.4 million and tax benefits of $5.4 million in accumulated other comprehensive income associated with the adjustments to various employee benefit plan liabilities for the years ended December 31, 2016, 2015 and 2014, respectively, in accordance with FASB ASC 715.
The tax effects of temporary differences that give rise to significant portions of the deferred income tax assets and deferred income tax liabilities at December 31, 2016 and 2015 are presented below:
|
(In thousands) |
2016 |
2015 |
||||
|
Deferred income tax assets: |
||||||
|
Retirement benefits other than pension |
$ |
2,181 |
$ |
2,167 | ||
|
Pension and related plans |
4,159 | 4,588 | ||||
|
Net operating loss |
26,704 | 16,509 | ||||
|
Accrued expenses |
7,096 | 6,848 | ||||
|
Interest and discount on 8% Notes |
809 |
- |
||||
|
Other |
546 | 425 | ||||
|
Total deferred income tax assets |
41,495 | 30,537 | ||||
|
|
||||||
|
Deferred income tax liabilities: |
||||||
|
Property and equipment |
(128,515) | (111,846) | ||||
|
Intangibles |
(9,968) | (7,884) | ||||
|
Total deferred income tax liabilities |
(138,483) | (119,730) | ||||
|
Net deferred income tax liability |
$ |
(96,988) |
$ |
(89,193) | ||
In the fourth quarter of 2016, the Company recorded an out-of-period adjustment to establish deferred tax liabilities associated with the 2015 issuance of the 8% Notes with an offset to additional paid-in capital in the amount of $5.5 million.
At December 31, 2016, the Company had federal net operating losses (“NOLs”) of $69.3 million, net of adjustments for unrecognized income tax benefits (“UTBs”) and unrealized excess tax benefits on stock compensation. The Company’s NOLs, if not utilized to reduce taxable income in future periods, will expire in varying amounts from 2022 through 2036. The Company believes that it is more likely than not that the reversal of current deferred tax liabilities and the results of future operations will be sufficient to realize the deferred tax assets.
72
The Company recognizes interest related to UTBs in interest expense and penalties on UTBs in income tax expense. A reconciliation of the change in the UTB balance for the years ended December 31, 2016 and 2015 is as follows:
|
(In thousands) |
2016 |
2015 |
||||
|
Balance at beginning of year |
$ |
1,356 |
$ |
1,112 | ||
|
Additions for tax positions related to the current year |
235 | 297 | ||||
|
Increases for tax positions related to prior years |
(96) | 109 | ||||
|
Statute of limitations expiration |
(342) | (162) | ||||
|
Balance at end of year |
$ |
1,153 |
$ |
1,356 | ||
All of the Company’s UTBs as of December 31, 2016 and 2015 were adjusted through income tax expense. The Company does not expect to have any material changes to its UTBs over the next twelve months.
While the Company believes it has adequately provided for all tax positions, amounts asserted by taxing authorities could be greater than its accrued position. Accordingly, additional provisions could be recorded in the future as revised estimates are made or the underlying matters are settled or otherwise resolved. In general, the tax years that remain open and subject to federal and state audit examinations are 2013-2016 as of December 31, 2016.
Note 11. Pension Plans and Other Postretirement Benefits
The Company sponsors a non-contributory defined benefit pension plan (“Pension Plan”), as well as non-qualified pension plans and other postretirement benefit plan (“OPEB”) for its eligible employees. The Company recognized total income of $0.7 million, $1.3 million and $1.1 million (excluding the curtailment gain discussed below) in 2016, 2015 and 2014 respectively, for all qualified and non-qualified pension and OPEB plans. Effective December 31, 2012, the Company froze the accumulation of benefits under the Pension Plan and the supplemental executive retirement plan. As such, no further benefits will be accrued by plan participants for services rendered after that date under either of these plans. Effective December 31, 2014, the Company terminated the health care benefits under the Other Postretirement Benefit Plans. Eligible retirees received partial compensation for settlement of accrued benefits through a series of supplemental pension payments. As a result, the Company recognized a curtailment gain of approximately $10.8 million in the year ended December 31, 2014, which was calculated as the decrease in the accumulated benefit obligation resulting from the termination of the medical portion of the Other Postretirement Benefit Plans less unrecognized losses in accumulated other comprehensive loss and less the actuarially determined cost of the benefit obligation that was transferred to the Pension Plan in the form of supplemental benefit payments on December 31, 2014.
73
The following tables provide a reconciliation of the changes in the qualified plans’ benefit obligations and fair value of assets and a statement of the funded status as of December 31, 2016, 2015 and 2014 and the classification of amounts recognized in the consolidated balance sheets:
|
|
Defined Benefit Pension Plan |
Other Postretirement Benefit Plans |
||||||||||||||||||||||||
|
(In thousands) |
Year Ended December 31, 2016 |
Year Ended December 31, 2015 |
Year Ended December 31, 2014 |
Year Ended December 31, 2016 |
Year Ended December 31, 2015 |
Year Ended December 31, 2014 |
||||||||||||||||||||
|
Change in benefit obligations: |
||||||||||||||||||||||||||
|
Benefit obligations, beginning of period |
$ |
65,725 |
$ |
70,892 |
$ |
57,209 |
$ |
765 |
$ |
844 |
$ |
12,800 | ||||||||||||||
|
Service cost |
- |
- |
- |
- |
- |
80 | ||||||||||||||||||||
|
Interest cost |
2,696 | 2,664 | 2,622 | 30 | 31 | 373 | ||||||||||||||||||||
|
Actuarial loss (gain) |
763 | (4,550) | 13,547 | 22 | (83) | 887 | ||||||||||||||||||||
|
Benefits paid, net |
(2,891) | (3,281) | (2,956) | (115) | (27) | (671) | ||||||||||||||||||||
|
Curtailment gain |
- |
- |
- |
- |
- |
(12,625) | ||||||||||||||||||||
|
Transfer |
- |
- |
470 |
- |
- |
- |
||||||||||||||||||||
|
Benefit obligations, end of period |
$ |
66,293 |
$ |
65,725 |
$ |
70,892 |
$ |
702 |
$ |
765 |
$ |
844 | ||||||||||||||
|
|
||||||||||||||||||||||||||
|
Change in plan assets: |
||||||||||||||||||||||||||
|
Fair value of plan assets, beginning of period |
$ |
53,912 |
$ |
58,403 |
$ |
57,847 |
$ |
- |
$ |
- |
$ |
- |
||||||||||||||
|
Actual return on plan assets |
4,606 | (1,166) | 3,555 |
- |
- |
- |
||||||||||||||||||||
|
Employer contributions |
- |
- |
- |
115 | 27 | 671 | ||||||||||||||||||||
|
Benefits paid |
(2,945) | (3,325) | (2,999) | (115) | (27) | (671) | ||||||||||||||||||||
|
Transfer |
- |
- |
- |
- |
- |
- |
||||||||||||||||||||
|
Fair value of plan assets, end of period |
$ |
55,573 |
$ |
53,912 |
$ |
58,403 |
$ |
- |
$ |
- |
$ |
- |
||||||||||||||
|
|
||||||||||||||||||||||||||
|
Funded status: |
||||||||||||||||||||||||||
|
Non-current asset |
$ |
- |
$ |
- |
$ |
- |
$ |
- |
$ |
- |
$ |
- |
||||||||||||||
|
Current liabilities |
- |
- |
- |
56 | 111 | 72 | ||||||||||||||||||||
|
Non-current liabilities |
10,720 | 11,813 | 12,489 | 646 | 654 | 772 | ||||||||||||||||||||
|
Funded status recognized in the consolidated balance sheets |
$ |
10,720 |
$ |
11,813 |
$ |
12,489 |
$ |
702 |
$ |
765 |
$ |
844 | ||||||||||||||
|
|
||||||||||||||||||||||||||
|
Amounts recognized in accumulated other comprehensive loss: |
||||||||||||||||||||||||||
|
Net actuarial (loss) gain |
$ |
(16,598) |
$ |
(17,899) |
$ |
(18,119) |
$ |
111 |
$ |
18 |
$ |
(65) | ||||||||||||||
|
Income taxes |
6,440 | 6,981 | 7,066 | (43) | (7) | 25 | ||||||||||||||||||||
|
Net amount recognized in accumulated other comprehensive loss |
$ |
(10,158) |
$ |
(10,918) |
$ |
(11,053) |
$ |
68 |
$ |
11 |
$ |
(40) | ||||||||||||||
The accumulated benefit obligation for the defined benefit pension plan at December 31, 2016 and 2015 was $66.3 million and $65.7 million, respectively. The increase in the projected benefit obligation is primarily attributable to actuarial losses resulting from a decrease in the discount rate from 4.20% at December 31, 2015 to 4.00% at December 31, 2016 and adjusted mortality tables. The accumulated benefit obligation represents the present value of pension benefits based on service and salary earned to date. The benefit obligation indicated in the table above is the projected benefit obligation which represents the present value of pension benefits taking into account projected future service and salary increases. The projected benefit obligation is equal to the accumulated benefit obligation as of December 31, 2016 and 2015 since the Pension Plan was frozen effective as of December 31, 2012.
The total amounts reclassified out of accumulated other comprehensive income related to amortization of actuarial losses for the pension and other postretirement benefit plans for each of the years ended December 31, 2016 and 2015 were $0.9 million, net of income taxes of $0.5 million, and $0.1 million, net of income taxes of less than $0.1 million, for the year ended December 31, 2014. Amortization of actuarial losses is included in selling, general and administrative expenses on the consolidated statements of operations.
74
The following table provides the components of net periodic (benefit) expense for the plans for the years ended December 31, 2016, 2015 and 2014:
|
|
Defined Benefit Pension Plan |
Other Postretirement Benefit Plans |
||||||||||||||||
|
(In thousands) |
Year Ended December 31, 2016 |
Year Ended December 31, 2015 |
Year Ended December 31, 2014 |
Year Ended December 31, 2016 |
Year Ended December 31, 2015 |
Year Ended December 31, 2014 |
||||||||||||
|
Components of net periodic (benefit) expense: |
||||||||||||||||||
|
Service cost |
$ |
- |
$ |
- |
$ |
- |
$ |
- |
$ |
- |
$ |
80 | ||||||
|
Interest cost |
2,696 | 2,664 | 2,622 | 30 | 31 | 373 | ||||||||||||
|
Expected return on plan assets |
(3,536) | (4,111) | (4,373) |
- |
- |
- |
||||||||||||
|
Amortization of loss |
1,049 | 991 |
- |
- |
- |
23 | ||||||||||||
|
Net periodic expense (benefit) |
$ |
209 |
$ |
(456) |
$ |
(1,751) |
$ |
30 |
$ |
31 |
$ |
476 | ||||||
Actuarial gains and losses in excess of 10% of the greater of the benefit obligation and the market-related value of assets are amortized over the average remaining service period of active participants.
The assumptions used in the measurements of the Company’s benefit obligations at December 31, 2016 and 2015 are shown in the following table:
|
|
Defined Benefit Pension Plan |
Other Postretirement Benefit Plans |
|||||||||||
|
|
December 31, 2016 |
December 31, 2015 |
December 31, 2016 |
December 31, 2015 |
|||||||||
|
Discount rate |
4.00 |
% |
4.20 |
% |
4.00 |
% |
4.20 |
% |
|||||
|
Rate of compensation increase |
N/A |
N/A |
N/A |
N/A |
|||||||||
The assumptions used in the measurements of the Company’s net income or expense for the consolidated statements of operations for the years ended December 31, 2016, 2015 and 2014 were as follows:
|
|
Defined Benefit Pension Plan |
Other Postretirement Benefit Plans |
|||||||||||||||||
|
|
Year Ended December 31, 2016 |
Year Ended December 31, 2015 |
Year Ended December 31, 2014 |
Year Ended December 31, 2016 |
Year Ended December 31, 2015 |
Year Ended December 31, 2014 |
|||||||||||||
|
Discount rate |
4.20 |
% |
3.85 |
% |
4.70 |
% |
4.20 |
% |
3.85 |
% |
4.70 |
% |
|||||||
|
Expected return on plan assets |
6.75 |
% |
7.25 |
% |
7.75 |
% |
N/A |
N/A |
N/A |
||||||||||
|
Rate of compensation increase |
N/A |
N/A |
N/A |
N/A |
N/A |
N/A |
|||||||||||||
The Company reviews the assumptions noted in the above table annually or more frequently to reflect anticipated future changes in the underlying economic factors used to determine these assumptions. The discount rates assumed reflect the rate at which the Company could invest in high quality corporate bonds in order to settle future obligations. In doing so, the Company utilizes a Citigroup Pension Discount Curve applied against the Company’s estimated defined benefit payments to derive a blended rate. The Citigroup Pension Discount Curve is derived from over 350 Aa corporate bonds. The Company also compares this to a Moody’s ten year Aa bond index for reasonableness.
In developing the expected long-term rate of return assumption for the assets of the Pension Plan, the Company evaluated input from its third party pension plan asset managers, including their review of asset class return expectations and long-term inflation assumptions. The Company also considered the related historical ten-year average asset return at December 31, 2016 as well as considering input from the Company’s third party pension plan asset managers.
75
The weighted average actual asset allocations by asset category and the fair value by asset category as of December 31, 2016 and 2015 were as follows:
|
(Dollars in thousands) |
December 31, 2016 |
December 31, 2015 |
||||||||||
|
Asset Category |
Actual Allocation |
Fair Value |
Actual Allocation |
Fair Value |
||||||||
|
Large Cap Value |
23 |
% |
$ |
12,518 | 23 |
% |
$ |
12,193 | ||||
|
Large Cap Blend |
11 |
% |
6,237 | 11 |
% |
6,085 | ||||||
|
Mid Cap Blend |
7 |
% |
3,676 | 6 |
% |
3,342 | ||||||
|
Small Cap Blend |
4 |
% |
2,308 | 4 |
% |
2,080 | ||||||
|
Foreign Stock - Large Cap |
6 |
% |
3,586 | 7 |
% |
3,817 | ||||||
|
Bond |
33 |
% |
18,633 | 34 |
% |
18,239 | ||||||
|
Cash and cash equivalents |
16 |
% |
8,615 | 15 |
% |
8,156 | ||||||
|
Total |
100 |
% |
$ |
55,573 | 100 |
% |
$ |
53,912 | ||||
The actual and target allocation for plan assets is broadly defined and measured as follows:
|
|
December 31, 2016 |
December 31, 2015 |
||||||||||
|
Asset Category |
Actual Allocation |
Target Allocation |
Actual Allocation |
Target Allocation |
||||||||
|
Equity securities |
51 |
% |
50 |
% |
51 |
% |
50 |
% |
||||
|
Bond securities and cash equivalents |
49 |
% |
50 |
% |
49 |
% |
50 |
% |
||||
|
Total |
100 |
% |
100 |
% |
100 |
% |
100 |
% |
||||
It is the Company’s policy to invest pension plan assets in a diversified portfolio consisting of an array of asset classes. The investment risk of the assets is limited by appropriate diversification both within and between asset classes. The assets are primarily invested in investment funds that invest in a broad mix of publicly traded equities, bonds and cash equivalents (and fair value is based on quoted market prices (Level 1 input within the fair value hierarchy previously defined)). The allocation between equity and bonds is reset quarterly to the target allocations. Updates to the allocation are considered in the normal course and changes may be made when appropriate. The bond holdings consist of three bond funds split relatively evenly between these funds at December 31, 2016. At December 31, 2016, the Company believes that there are no material concentrations of risk within the portfolio of plan assets.
The assumed long term return noted above is the target long term return. Overall return, risk adjusted return, and management fees are assessed against a peer group and benchmark indices. Reporting on asset performance is provided quarterly and review meetings are held semi-annually. In addition to normal rebalancing to maintain an adequate cash reserve, projected cash flow needs of the plan are reviewed at least annually to ensure liquidity is properly managed.
The Company did not contribute to the Pension Plan in 2016, 2015 or 2014 and does not expect to contribute to the Pension Plan in 2017. The Company expects the net periodic expense for the Pension Plan in 2017 to be $0.6 million and the expense for the other postretirement benefit plans in 2017 to be less than $0.1 million.
The following estimated future pension benefit payments and other postretirement benefit plan payments which reflect expected future service, as appropriate, are expected to be paid in the years indicated:
|
(In thousands) |
Defined Benefit Pension Plan |
Other Postretirement Benefit Plans |
||||
|
2017 |
$ |
3,074 |
$ |
57 | ||
|
2018 |
3,111 | 57 | ||||
|
2019 |
3,214 | 56 | ||||
|
2020 |
3,247 | 55 | ||||
|
2021 |
3,315 | 54 | ||||
|
2022-2026 |
17,197 | 245 | ||||
Other Benefit Plans
The Company also has a supplemental executive retirement plan (“SERP”). The Company froze the SERP effective December 31, 2012. As such, no further benefits will be accrued by plan participants for services rendered and the accumulated benefit obligation is equivalent to the projected benefit obligation for periods ending after that date. The projected benefit obligation was $4.8 million, $4.6 million and $4.9 million as of December 31, 2016, 2015 and 2014, respectively. The Company recognized $0.2 million, $0.4
76
million and $0.2 million of expense from previously unrecognized loss related to the supplemental executive retirement plan during the years ended December 31, 2016, 2015 and 2014, respectively, all of which is included in selling, general and administrative expenses in the consolidated statements of operations. The total amount of unrecognized actuarial losses recognized in accumulated other comprehensive income at December 31, 2016 and 2015 related to this plan was $0.9 million, net of income taxes of $0.6 million, and $1.0 million, net of income taxes of $0.6 million, respectively.
The estimated future benefit payments are expected to be $0.2 million annually for each of the years 2017 through 2019, $0.3 million annually for each of the years 2020 through 2021 and $1.4 million in aggregate for the years 2022 through 2026.
The Company also sponsors a defined contribution 401(k) plan. The Company’s matching contributions to this plan were $1.1 million, $1.1 million and $1.0 million for the years ended December 31, 2016, 2015 and 2014, respectively. The Company funds its 401(k) matching contributions in shares of the Company’s common stock.
Note 12. Related Party Transactions
ValleyNet, an equity method investee of the Company, resells capacity on the Company’s fiber network under an operating lease agreement. Facility lease revenue from ValleyNet was approximately $4.4 million, $4.7 million and $5.0 million in the years ended December 31, 2016, 2015 and 2014, respectively, which is presented in the Company’s data segment revenues. At both December 31, 2016 and 2015, the Company had accounts receivable from ValleyNet of approximately $0.4 million. The Company also leases and resells capacity from ValleyNet. The total lease expense was $1.2 million, $1.2 million and $0.9 million in the years ended December 31, 2016, 2015 and 2014, respectively, which is presented as cost of revenue in the consolidated statements of operations.
Note 13. Restructuring Charges
In 2016, the Company completed an employee reduction-in-force. Restructuring costs, consisting of employee severance and termination benefits, of $1.9 million were recognized during the year ended December 31, 2016. The Company does not expect to incur additional costs associated with these restructuring activities in future periods.
The following table provides a break-down of these costs by business segment for the year ended December 31, 2016:
|
(In thousands) |
Data |
R&SB |
RLEC |
Total |
||||||||
|
Employee severance and termination benefits |
$ |
1,451 |
$ |
412 |
$ |
77 |
$ |
1,940 | ||||
|
Total restructuring charges |
$ |
1,451 |
$ |
412 |
$ |
77 |
$ |
1,940 | ||||
A liability for restructuring charges in the amount of $0.4 million is included in accrued compensation in the Company’s consolidated balance sheet as of December 31, 2016, related to employee termination costs accrued, but not yet paid.
Below is a summary of the restructuring liability balance as of December 31, 2016:
|
(In thousands) |
Employee Severance and Termination Benefits |
Total |
||||
|
Beginning balance at December 31, 2015 |
$ |
- |
$ |
- |
||
|
Additions, net of adjustment |
1,940 | 1,940 | ||||
|
Payments |
(1,542) | (1,542) | ||||
|
Ending balance at December 31, 2016 |
$ |
398 |
$ |
398 | ||
Note 14. Commitments and Contingencies
Operating Leases
Rental expense, including certain related lease costs, which are not separately identifiable, for all operating leases for the years ended December 31, 2016, 2015 and 2014 was $12.1 million, $12.0 million and $10.2 million, respectively. The total amount committed under these lease agreements at December 31, 2016 is: $3.6 million in 2017, $3.0 million in 2018, $2.3 million in 2019, $1.2 million in 2020, $0.7 million in 2021 and $1.5 million for the years thereafter. These amounts include leases for office space and office equipment and collocation and other network facilities.
77
Capital Leases
See Note 5 for information regarding the Company’s capital lease obligations and future commitments associated with those obligations.
Other Commitments and Contingencies
The Company periodically makes claims or receives disputes and is involved in legal actions related to billings to other carriers for access to the Company’s network. The Company does not recognize revenue related to such matters until collection of the claims is reasonably assured. In addition to this, the Company periodically disputes access charges that are assessed by other companies with which the Company interconnects and is involved in other disputes and legal and tax proceedings and filings arising from normal business activities.
The Company is involved in routine litigation and disputes in the ordinary course of its business. While the results of litigation and disputes are inherently unpredictable, management does not expect that the ultimate costs to resolve these matters will have a material adverse effect on the Company’s consolidated financial position, results of operations or cash flows, and believes that adequate provision for any probable and estimable losses has been made in the Company’s consolidated financial statements.
The Company has other purchase commitments relating to capital expenditures totaling $2.8 million as of December 31, 2016, which are expected to be satisfied during 2017.
Note 15. Subsequent Events
On January 4, 2017, the Company closed on an acquisition of Clarity Communications, LLC, a North Carolina based fiber bandwidth provider for a total purchase price of approximately $15 million, $10 million of which was paid in cash upon closing with the remaining $5 million subject to certain earnout provisions over a two year period following the closing date, which would be accelerated upon a change in control.
On January 31, 2017, the Company closed on an acquisition of DC74 LLC, a North Carolina based data center and managed services provider for a total purchase price of approximately $28 to $29 million, $23.5 million of which was paid in cash upon closing with the remaining $5 to $6 million subject to certain earnout provisions over a 12-month period following the closing date, which would vest upon a change in control.
On February 18, 2017, we entered into a definitive agreement (“Merger Agreement”) by and among the Company, MTN Infrastructure TopCo, Inc. (“Parent”) and MTN Infrastructure BidCo, Inc. (“Merger Sub”), pursuant to which we will be acquired by EQT Infrastructure investment strategy (“EQT Infrastructure”), subject to shareholder approval, regulatory approval and other customary closing conditions. Pursuant to the Merger Agreement, each outstanding share of common stock of the Company prior to the effective time of the Merger shall be automatically converted into the right to receive $18.00 in cash.
78
Item 9. Changes in and Disagreements with Accountants on Accounting and Financial Disclosure.
None.
Item 9A. Controls and Procedures.
Evaluation of Disclosure Controls and Procedures
Under the supervision and with the participation of our management, including our principal executive officer and principal financial officer, we conducted an evaluation of the effectiveness of the design and operation of our disclosure controls and procedures, as defined in Rules 13a-15(e) under the Securities Exchange Act of 1934, as amended (the “Exchange Act”), as of the end of the period covered by this report. Based on this evaluation and the identification of a material weakness in our internal control over financial reporting for income taxes, as discussed below, our principal executive officer and principal financial officer have concluded that the Company’s disclosure controls and procedures were not effective as of December 31, 2016.
Management’s Report on Internal Control over Financial Reporting
Our management is responsible for establishing and maintaining adequate internal control over financial reporting as defined in Rules 13a-15(f) under the Securities Exchange Act of 1934, as amended. The Company’s internal controls are designed to provide reasonable assurance as to the reliability of its financial reporting and the preparation of financial statements for external purposes in accordance with U.S. generally accepted accounting principles. The Company's internal control over financial reporting includes those policies and procedures that (1) pertain to the maintenance of records that in reasonable detail accurately and fairly reflect the transactions and dispositions of the assets of the Company; (2) provide reasonable assurance that transactions are recorded as necessary to permit preparation of financial statements in accordance with generally accepted accounting principles, and that receipts and expenditures of the Company are being made only in accordance with authorizations of management and directors of the Company; and (3) provide reasonable assurance regarding prevention or timely detection of unauthorized acquisition, use or disposition of the Company’s assets that could have a material effect on the financial statements.
Due to inherent limitations, internal control over financial reporting may not prevent or detect misstatement. Also, projections of any evaluation of effectiveness to future periods are subject to the risk that controls may become inadequate because of changes in conditions, or that the degree of compliance with the policies or procedures may deteriorate.
A material weakness is a deficiency or combination of deficiencies in internal control over financial reporting such that there is a reasonable possibility that a material misstatement of the annual or interim financial statements will not be prevented or detected on a timely basis.
Our management, including our principal executive officer and principal financial officer, assessed the effectiveness of our internal control over financial reporting as of December 31, 2016 using the criteria set forth by the Committee of Sponsoring Organizations of the Treadway Commission (“COSO”) in Internal Control- Integrated Framework (2013) and has identified the following material weakness:
The Company had ineffective controls over the accounting for the income tax consequences of certain complex financing arrangements. Specifically, the review performed by the Company and its third-party tax service provider did not sufficiently address the application of GAAP for book and tax basis differences resulting from the issuance of the 8% Notes, which are treated as applicable high yield discount obligations (“AHYDO”) for tax purposes.
These control deficiencies resulted in certain immaterial errors to the consolidated financial statements that were corrected before the issuance of our December 31, 2016 Form 10-K. However, the control deficiencies create a reasonable possibility that a material misstatement to the consolidated financial statements would not be prevented or detected on a timely basis. As such, we concluded that the control deficiencies represent a material weakness in the Company’s internal control over financial reporting and our internal control over financial reporting was not effective as of December 31, 2016.
Our independent registered public accounting firm, KPMG LLP, has issued an adverse report on our internal control over financial reporting as of December 31, 2016. KPMG LLP’s report appears on page 81 of this annual report on Form 10-K.
Remediation Plan
The Company intends to take steps during 2017 to remediate its material weakness in internal control over financial reporting. The Company has begun and will continue to:
|
· |
Improve the coordination between the Company and its third-party service provider regarding the financial reporting process and internal controls over the accounting for tax consequences of non-routine, complex transactions; and |
79
|
· |
Improve the design and documentation of our income tax controls, incorporate additional technical oversight based on assessment of expertise requirements and improve the technical training of our tax personnel as it relates to non-routine, complex transactions. |
The Company has begun to implement the remediation efforts described above; however, until the remediation actions are fully implemented and the operational effectiveness of related internal controls validated through testing, the material weakness described above will continue to exist.
Changes in Internal Control over Financial Reporting
Except for the Company’s identification and assessment of the material weakness described above during the fourth quarter of 2016 relating to a transaction originating in fiscal year 2015, there were no changes in our internal control over financial reporting (as such term is defined in Exchange Act Rule 13a-15(f)) that occurred during the three months ended December 31, 2016 that have materially affected, or are reasonably likely to materially affect, our internal control over financial reporting.
80
Report of Independent Registered Public Accounting Firm
The Board of Directors and Stockholders
Lumos Networks Corp.:
We have audited Lumos Networks Corp.’s internal control over financial reporting as of December 31, 2016, based on criteria established in Internal Control – Integrated Framework (2013) issued by the Committee of Sponsoring Organizations of the Treadway Commission (COSO). Lumos Networks Corp.’s management is responsible for maintaining effective internal control over financial reporting and for its assessment of the effectiveness of internal control over financial reporting, included in the accompanying Management’s Report on Internal Control Over Financial Reporting. Our responsibility is to express an opinion on the Company’s internal control over financial reporting based on our audit.
We conducted our audit in accordance with the standards of the Public Company Accounting Oversight Board (United States). Those standards require that we plan and perform the audit to obtain reasonable assurance about whether effective internal control over financial reporting was maintained in all material respects. Our audit included obtaining an understanding of internal control over financial reporting, assessing the risk that a material weakness exists, and testing and evaluating the design and operating effectiveness of internal control based on the assessed risk. Our audit also included performing such other procedures as we considered necessary in the circumstances. We believe that our audit provides a reasonable basis for our opinion.
A company’s internal control over financial reporting is a process designed to provide reasonable assurance regarding the reliability of financial reporting and the preparation of financial statements for external purposes in accordance with generally accepted accounting principles. A company’s internal control over financial reporting includes those policies and procedures that (1) pertain to the maintenance of records that, in reasonable detail, accurately and fairly reflect the transactions and dispositions of the assets of the company; (2) provide reasonable assurance that transactions are recorded as necessary to permit preparation of financial statements in accordance with generally accepted accounting principles, and that receipts and expenditures of the company are being made only in accordance with authorizations of management and directors of the company; and (3) provide reasonable assurance regarding prevention or timely detection of unauthorized acquisition, use, or disposition of the company’s assets that could have a material effect on the financial statements.
Because of its inherent limitations, internal control over financial reporting may not prevent or detect misstatements. In addition, projections of any evaluation of effectiveness to future periods are subject to the risk that controls may become inadequate because of changes in conditions, or that the degree of compliance with the policies or procedures may deteriorate.
A material weakness is a deficiency, or a combination of deficiencies, in internal control over financial reporting, such that there is a reasonable possibility that a material misstatement of the company’s annual or interim financial statements will not be prevented or detected on a timely basis. A material weakness related to ineffective controls over the accounting for the income tax consequences of certain complex financing arrangements has been identified and included in management’s assessment.
We also have audited, in accordance with the standards of the Public Company Accounting Oversight Board (United States), the consolidated balance sheets of Lumos Networks Corp. and subsidiaries as of December 31, 2016 and 2015, and the related consolidated statements of operations, comprehensive income, cash flows, and equity for each of the years in the three‑year period ended December 31, 2016. The material weakness was considered in determining the nature, timing, and extent of audit tests applied in our audit of the 2016 consolidated financial statements, and this report does not affect our report dated March 28, 2017, which expressed an unqualified opinion on those consolidated financial statements.
In our opinion, because of the effect of the aforementioned material weakness on the achievement of the objectives of the control criteria, Lumos Networks Corp. has not maintained effective internal control over financial reporting as of December 31, 2016, based on criteria established in Internal Control – Integrated Framework (2013) issued by the Committee of Sponsoring Organizations of the Treadway Commission (COSO).
/s/ KPMG LLP
Richmond, Virginia
March 28, 2017
81
None.
Item 10. Directors, Executive Officers and Corporate Governance.
The information required by this item is incorporated herein by reference from the registrant’s definitive Proxy Statement for the 2017 Annual Meeting of Stockholders to be filed with the Commission pursuant to Regulation 14A.
We have adopted a Code of Business Conduct and Ethics pursuant to section 406 of the Sarbanes-Oxley Act. A copy of our Code of Business Conduct and Ethics is publicly available on our Company website at http://ir.lumosnetworks.com. The information contained on our website is not incorporated by reference into this Annual Report on Form 10-K.
Item 11. Executive Compensation.
The information required by this item is incorporated herein by reference from the registrant’s definitive Proxy Statement for the 2017 Annual Meeting of Stockholders.
Item 12. Security Ownership of Certain Beneficial Owners and Management and Related Stockholder Matters.
Securities Authorized for Issuance under Equity Compensation Plans
The following table sets forth information as of December 31, 2016 concerning the shares of common stock which are authorized for issuance under our equity compensation plans.
|
Plan Category |
Number of Securities to be Issued on Exercise of Outstanding Options, Warrants and Rights (a) |
Weighted Average Exercise Price of Outstanding Options, Warrants and Rights |
Number of Securities Remaining Available for Issuance Under Equity Compensation Plans (Excluding Securities Reflected in Column (a)) |
||||
|
Equity Compensation Plans Approved by Stockholders |
|||||||
|
2011 Equity and Cash Incentive Plan |
1,749,105 |
$ |
12.35 | 901,558 | |||
|
Employee Stock Purchase Plan |
- |
- |
- |
||||
|
Equity Compensation Plans Not Approved by Stockholders |
- |
- |
- |
||||
|
Total |
1,749,105 |
$ |
12.35 | 901,558 | |||
All other information required by this item is incorporated herein by reference from the registrant’s definitive Proxy Statement for the 2017 Annual Meeting of Stockholders.
Item 13. Certain Relationships and Related Transactions, and Director Independence.
The information required by this item is incorporated herein by reference from the registrant’s definitive Proxy Statement for the 2017 Annual Meeting of Stockholders.
Item 14. Principal Accountant Fees and Services.
The information required by this item is incorporated herein by reference from the registrant’s definitive Proxy Statement for the 2017 Annual Meeting of Stockholders.
82
Part IV
Item 15. Exhibits and Financial Statement Schedules.
(a) The following documents are filed as a part of this Annual Report on Form 10-K:
(1) Consolidated Financial Statements
The consolidated financial statements required to be filed in the Annual Report on Form 10-K are listed in Item 8 hereof.
(2) Financial Statement Schedules
Schedules are omitted either because they are not required or they are inapplicable.
(3) Exhibits
The exhibits on the accompanying Exhibits Index below are filed as part of, or incorporated by reference into, this Annual Report on Form 10-K.
83
EXHIBIT INDEX
|
|
||
|
Exhibit No. |
Description |
|
|
2.1(1) |
Agreement and Plan of Merger, dated February 18, 2017, by and among Lumos Networks Corp. MTN Infrastructure TopCo, Inc. and MTN Infrastructure BidCo, Inc. |
|
|
3.1(2) |
Amended and Restated Certificate of Incorporation of Lumos Networks Corp. |
|
|
3.2(2) |
Amended and Restated Bylaws of Lumos Networks Corp. |
|
|
4.1(3) |
Form of Common Stock Certificate of Lumos Networks Corp. |
|
|
10.1(4) |
Lumos Networks Corp. 2011 Equity and Cash Incentive Plan (Amended as of March 5, 2014) |
|
|
10.2(5) |
Lumos Networks Corp. 2011 Employee Stock Purchase Plan |
|
|
10.3(6) |
Credit Agreement, dated as of April 30, 2013, among Lumos Networks Operating Company, certain subsidiaries of the Borrower (as defined in the Credit Agreement) party thereto and the Lenders (as defined in the Credit Agreement) party thereto |
|
|
10.4(7) |
First Amendment, dated as of October 8, 2013, to the Credit Agreement dated as of April 30, 2013, among Lumos Networks Operating Company, certain subsidiaries of the Borrower (as defined in the Credit Agreement) party thereto and the Lenders (as defined in the Credit Agreement) party thereto |
|
|
10.5(8) |
Joinder Agreement and Second Amendment to the Credit Agreement dated as of January 2, 2015, among Lumos Networks Operating Company, certain subsidiaries of the Borrower (as defined in the Credit Agreement) party thereto and the Lenders (as defined in the Credit Agreement) party thereto |
|
|
10.6(9) |
Notes Purchase Agreement dated August 5, 2015, between Lumos Operating Company and Lumos Holdings, L.P. |
|
|
10.7(9) |
Warrants Purchase Agreement dated August 5, 2015, between Lumos Operating Company and Lumos Holdings, L.P. |
|
|
10.8(9) |
8% Notes due August 15, 2022 |
|
|
10.9(9) |
Warrants to Purchase 5,500,000 shares of Common Stock of Lumos Networks |
|
|
10.10(9) |
Investors Rights Agreement dated August 6, 2015, between Lumos Operating Company and Lumos Holdings, L.P. |
|
|
10.11(9) |
Third Amendment to the Credit Agreement, dated August 5, 2015. |
|
|
10.12(10) |
Form of performance vesting stock option award agreement, dated as of April 26, 2012, between Timothy G. Biltz and Lumos Networks Corp. |
|
|
10.13(10) |
Form of time vested stock option award agreement, dated as of April 26, 2012, between Timothy G. Biltz and Lumos Networks Corp. |
|
|
10.14(10) |
Form of restricted stock award agreement, dated as of April 26, 2012, between Timothy G. Biltz and Lumos Networks Corp. |
|
|
10.15(11) |
Employment Agreement, dated as of May 15, 2013, between Jeffrey Miller and Lumos Networks Operating Company |
|
|
10.16(121) |
Employment Agreement, dated as of October 3, 2014, between Johan G. Broekhuysen and Lumos Networks Operating Company |
|
|
10.17(13) |
Employment Agreement, dated as of June 25, 2014, between Mary McDermott and Lumos Networks Corp. Operating Company |
|
|
10.18(14) |
Employment Agreement, dated May 5, 2015, between Timothy G. Biltz and Lumos Networks Corp. |
|
|
10.20(15) |
First Amendment to Employment Agreement, dated March 4, 2016, between Johan G. Broekhuysen and Lumos Networks Corp. |
|
|
10.21(15) |
Employment Agreement, dated as of August 28, 2012 and First Amendment to the Employment agreement dated March 4, 2016, between Diego Anderson and Lumos Networks Corp. |
|
|
10.22(16) |
Form of Stock Option Award Letter (Service-based) |
|
|
10.23(16) |
Form of Stock Option Award Letter (Performance-based) |
|
|
10.24(16) |
Form of Restricted Stock Award Letter (Service-based) |
|
|
10.25(16) |
Form of Restricted Stock Award Letter (Performance-based) |
|
|
10.26(17) |
Restricted Stock award grant, dated as of May 6, 2015, between Timothy G. Biltz and Lumos Networks Corp. |
|
|
10.27(18) |
Lumos Severance Plan for Eligible Officers |
|
|
|
||
|
21.1* |
Subsidiaries of Lumos Networks Corp. |
|
|
23.1* |
Consent of KPMG LLP |
|
|
31.1* |
Certificate of Timothy G. Biltz, President and Chief Executive Officer pursuant to Rule 13a-14(a) |
|
|
31.2* |
Certificate of Johan G. Broekhuysen, Executive Vice President and Chief Financial Officer pursuant to Rule 13a-14(a) |
|
|
32.1* |
Certificate of Timothy G. Biltz, President and Chief Executive Officer pursuant to 18 U.S.C., Section 1350, as adopted pursuant to Section 906 of the Sarbanes-Oxley Act of 2002 |
|
|
32.2* |
Certificate of Johan G. Broekhuysen, Executive Vice President and Chief Financial Officer pursuant to 18 U.S.C., Section 1350, as adopted pursuant to Section 906 of the Sarbanes-Oxley Act of 2002 |
|
|
101.INS* |
XBRL Instance Document. |
|
|
101.SCH* |
XBRL Taxonomy Extension Schema Document. |
|
|
101.CAL* |
XBRL Taxonomy Extension Calculation Linkbase Document. |
|
|
101.DEF* |
XBRL Taxonomy Extension Definition Linkbase Document. |
|
|
101.LAB* |
XBRL Taxonomy Extension Label Linkbase Document. |
|
|
101.PRE* |
XBRL Taxonomy Extension Presentation Linkbase Document. |
|
* |
|
Filed herewith. |
|
(1) |
|
Filed as an exhibit to Form 8-K filed on February 22, 2017. |
|
(2) |
|
Filed as an exhibit to Current Report on Form 8-K filed November 4, 2011. |
|
(3) |
|
Filed as an exhibit to Amended Registration of Securities on Form 10-12B/A filed September 8, 2011. |
|
(4) |
|
Filed as appendix to Proxy Statement on Schedule 14A filed on March 18, 2014. |
|
(5) |
|
Filed as an exhibit to Registration Statement on Form S-8 filed on October 31, 2011. |
|
(6) |
|
Filed as an exhibit to Form 8-K filed on April 30, 2013. |
|
(7) |
|
Filed as an exhibit to Form 10-K filed on March 7, 2014. |
|
(8) |
|
Filed as an exhibit to Form 8-K filed on January 2, 2015. |
|
(9) |
|
Filed as an exhibit to Form 8-K filed on August 6, 2015. |
|
(10) |
|
Filed as an exhibit to Quarterly Report on Form 10-Q filed November 1, 2012. |
|
(11) |
|
Filed as an exhibit to Form 10-K filed on March 10, 2016. |
|
(12) |
|
Filed as an exhibit to Form 8-K filed on October 6, 2014 |
84
|
(13) |
|
Filed as an exhibit to Quarterly Report on Form 10-Q filed August 7, 2014. |
|
(14) |
|
Filed as an exhibit to Form 8-K filed on May 5, 2015. |
|
(15) |
|
Filed as an exhibit to Form 8-K filed on March 9, 2016. |
|
(16) |
|
Filed as an exhibit to Quarterly Report on Form 10-Q filed May 3, 2013. |
|
(17) |
|
Filed as an exhibit to Quarterly Report on Form 10-Q filed August 6, 2015. |
|
(18) |
|
Filed as an exhibit to Quarterly Report on Form 10-Q filed November 9, 2016. |
85
Signatures
Pursuant to the requirements of Section 13 or 15(d) of the Securities Exchange Act of 1934, the registrant has duly caused this report on Annual Report on Form 10-K to be signed on its behalf by the undersigned thereunto duly authorized.
Lumos Networks Corp.
|
By: |
/s/ Timothy G. Biltz |
|
Name: |
Timothy G. Biltz |
|
Title: |
President and Chief Executive Officer |
|
Signature |
Title |
Date |
|||
|
|
|||||
|
/s/ Timothy G. Biltz |
President and Chief Executive Officer, Director |
March 28, 2017 |
|||
|
Timothy G. Biltz |
(principal executive officer) |
||||
|
|
|||||
|
/s/ Johan G. Broekhuysen |
Executive Vice President, Chief Financial Officer |
March 28, 2017 |
|||
|
Johan G. Broekhuysen |
and Chief Accounting Officer |
||||
|
|
(principal accounting officer) |
||||
|
|
|||||
|
/s/ Peter D. Aquino |
Director |
March 28, 2017 |
|||
|
Peter D. Aquino |
|||||
|
|
|||||
|
/s/ Lawrence J. Askowitz |
Director |
March 28, 2017 |
|||
|
Lawrence J. Askowitz |
|||||
|
|
|||||
|
/s/ Robert E. Guth |
Director |
March 28, 2017 |
|||
|
Robert E. Guth |
|||||
|
|
|||||
|
/s/ Shawn F. O'Donnell |
Director |
March 28, 2017 |
|||
|
Shawn F. O'Donnell |
|||||
|
|
|||||
|
/s/ William M. Pruellage |
Director |
March 28, 2017 |
|||
|
William M. Pruellage |
|||||
|
|
|||||
|
/s/ Michael K. Robinson |
Director |
March 28, 2017 |
|||
|
Michael K. Robinson |
|||||
|
|
|||||
|
/s/ Michael T. Sicoli |
Director |
March 28, 2017 |
|||
|
Michael T. Sicoli |
|||||
|
|
|||||
|
/s/ Jerry E. Vaughn |
Director |
March 28, 2017 |
|||
|
Jerry E. Vaughn |
|||||