Attached files
| file | filename |
|---|---|
| 8-K - 8-K - Matson, Inc. | a15-10194_18k.htm |
| EX-99.1 - EX-99.1 - Matson, Inc. | a15-10194_1ex99d1.htm |
Exhibit 99.2
|
|
First Quarter 2015 Earnings Conference Call First Quarter 2015 Earnings Conference Call | May 4, 2015 – Slide 1 |
|
|
Forward Looking Statements Statements made during this call and presentation that set forth expectations, predictions, projections or are about future events are based on facts and situations that are known to us as of today, May 4, 2015. We believe that our expectations and assumptions are reasonable. Actual results may differ materially, due to risks and uncertainties, such as those described on pages 7-15 of the 2014 Form 10-K filed on February 27, 2015, and other subsequent filings by Matson with the SEC. Statements made during this call and presentation are not guarantees of future performance. We do not undertake any obligation to update our forward-looking statements. First Quarter 2015 Earnings Conference Call | May 4, 2015 – Slide 2 |
|
|
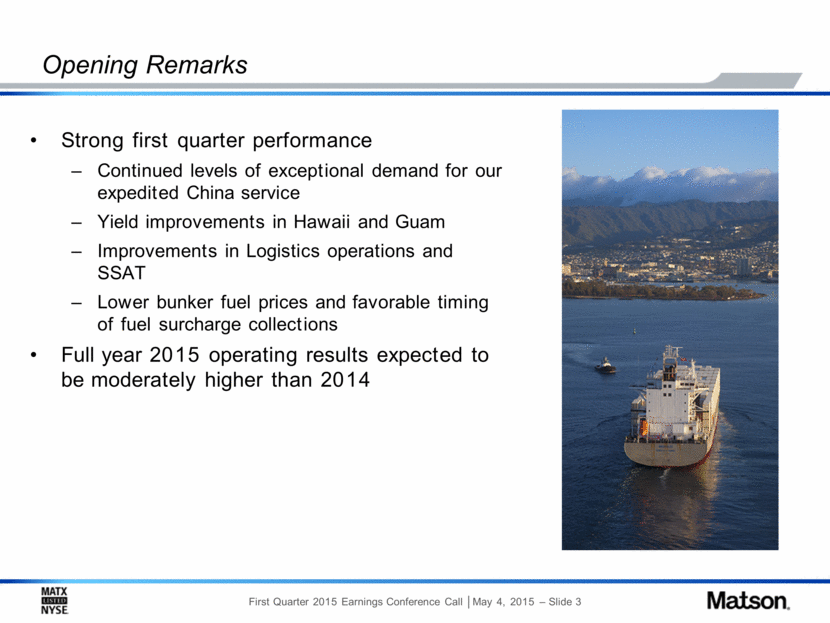
Strong first quarter performance Continued levels of exceptional demand for our expedited China service Yield improvements in Hawaii and Guam Improvements in Logistics operations and SSAT Lower bunker fuel prices and favorable timing of fuel surcharge collections Full year 2015 operating results expected to be moderately higher than 2014 Opening Remarks First Quarter 2015 Earnings Conference Call | May 4, 2015 – Slide 3 |
|
|
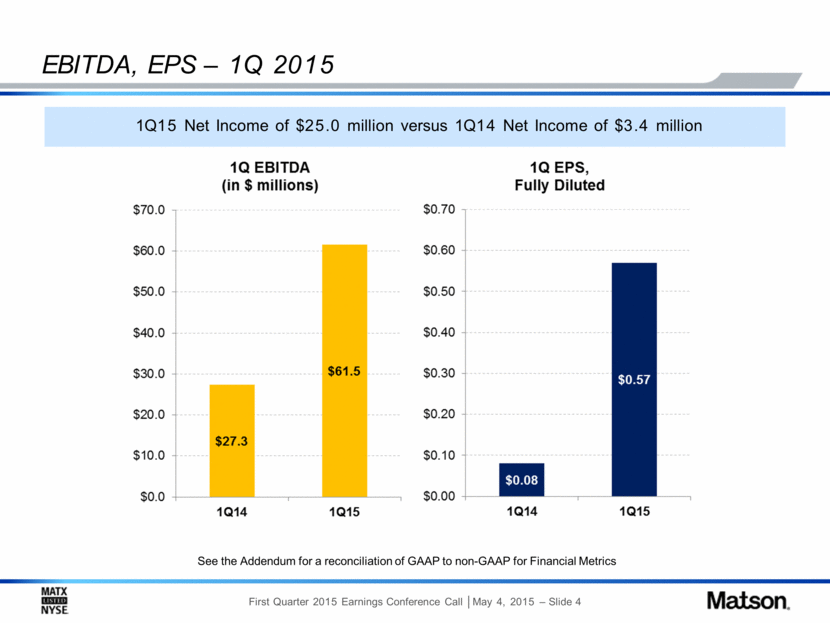
EBITDA, EPS – 1Q 2015 1Q15 Net Income of $25.0 million versus 1Q14 Net Income of $3.4 million See the Addendum for a reconciliation of GAAP to non-GAAP for Financial Metrics First Quarter 2015 Earnings Conference Call | May 4, 2015 – Slide 4 |
|
|
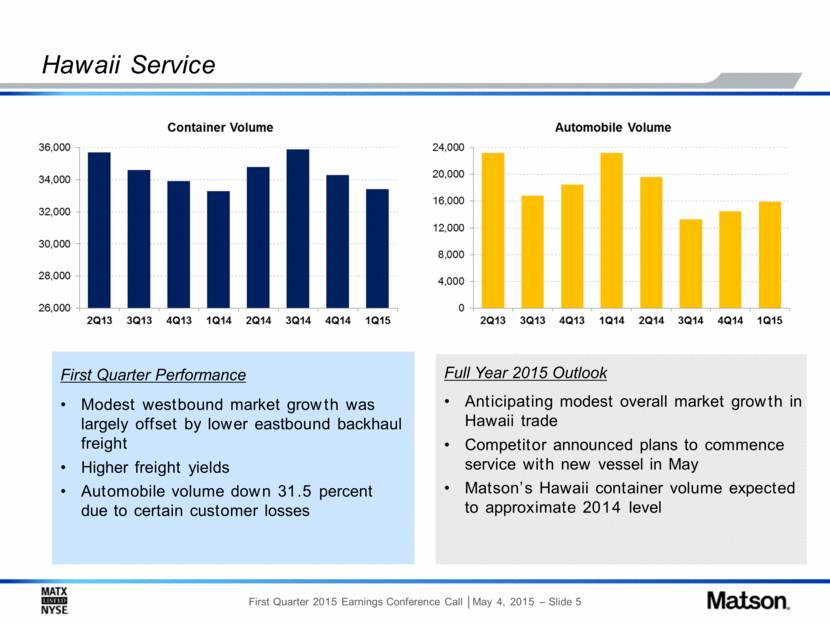
Hawaii Service First Quarter Performance Modest westbound market growth was largely offset by lower eastbound backhaul freight Higher freight yields Automobile volume down 31.5 percent due to certain customer losses Full Year 2015 Outlook Anticipating modest overall market growth in Hawaii trade Competitor announced plans to commence service with new vessel in May Matson’s Hawaii container volume expected to approximate 2014 level First Quarter 2015 Earnings Conference Call | May 4, 2015 – Slide 5 |
|
|
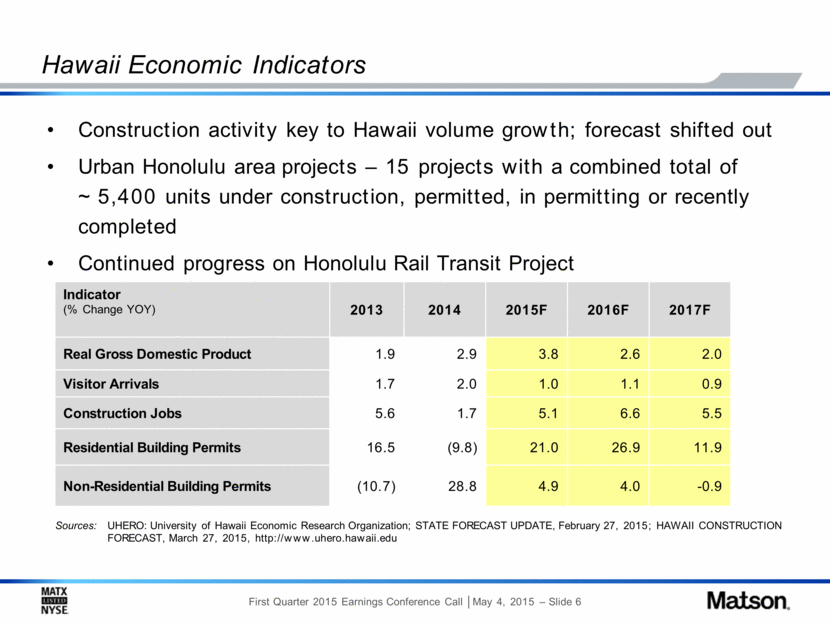
Hawaii Economic Indicators Indicator (% Change YOY) 2013 2014 2015F 2016F 2017F Real Gross Domestic Product 1.9 2.9 3.8 2.6 2.0 Visitor Arrivals 1.7 2.0 1.0 1.1 0.9 Construction Jobs 5.6 1.7 5.1 6.6 5.5 Residential Building Permits 16.5 (9.8) 21.0 26.9 11.9 Non-Residential Building Permits (10.7) 28.8 4.9 4.0 -0.9 Sources: UHERO: University of Hawaii Economic Research Organization; STATE FORECAST UPDATE, February 27, 2015; HAWAII CONSTRUCTION FORECAST, March 27, 2015, http://www.uhero.hawaii.edu Construction activity key to Hawaii volume growth; forecast shifted out Urban Honolulu area projects – 15 projects with a combined total of ~5,400 units under construction, permitted, in permitting or recently completed Continued progress on Honolulu Rail Transit Project First Quarter 2015 Earnings Conference Call | May 4, 2015 – Slide 6 |
|
|
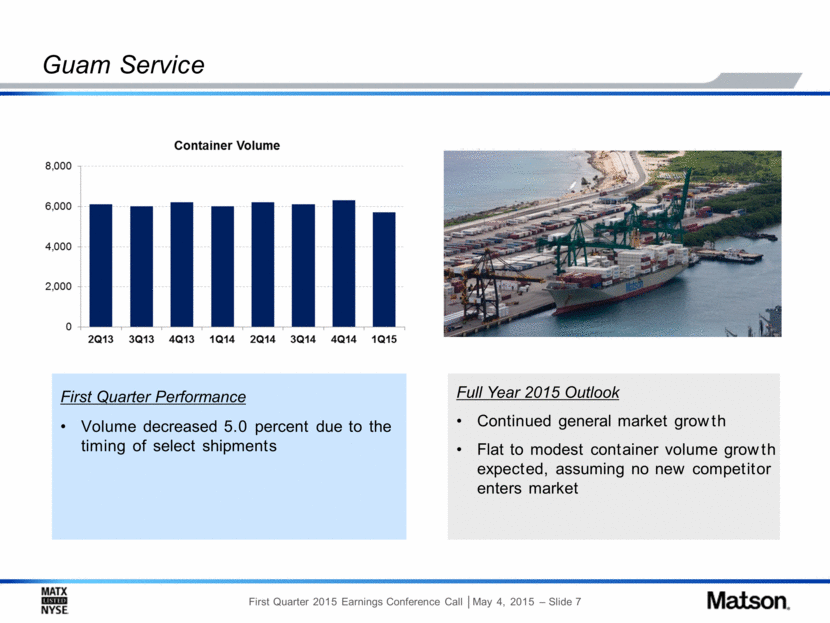
Guam Service Full Year 2015 Outlook Continued general market growth Flat to modest container volume growth expected, assuming no new competitor enters market First Quarter Performance Volume decreased 5.0 percent due to the timing of select shipments First Quarter 2015 Earnings Conference Call | May 4, 2015 – Slide 7 |
|
|
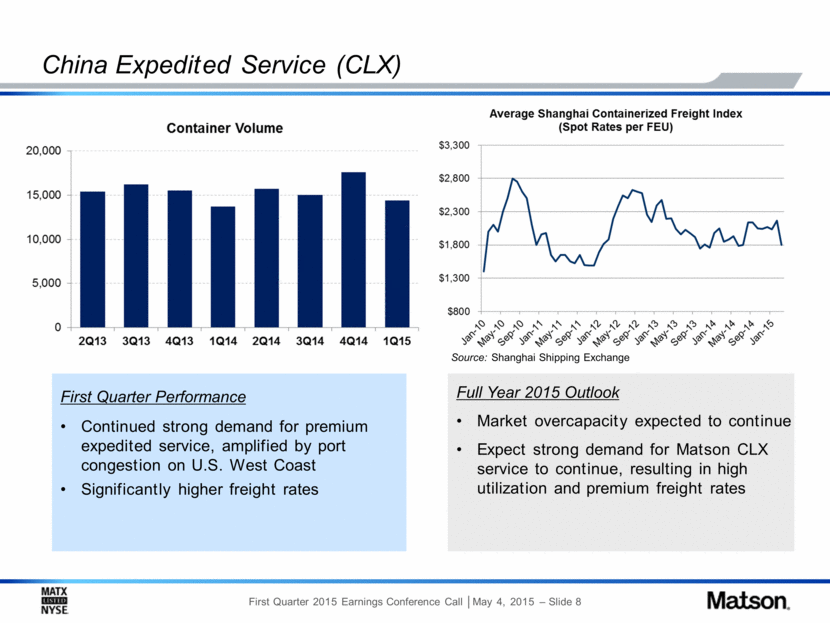
China Expedited Service (CLX) Source: Shanghai Shipping Exchange First Quarter Performance Continued strong demand for premium expedited service, amplified by port congestion on U.S. West Coast Significantly higher freight rates Full Year 2015 Outlook Market overcapacity expected to continue Expect strong demand for Matson CLX service to continue, resulting in high utilization and premium freight rates First Quarter 2015 Earnings Conference Call | May 4, 2015 – Slide 8 |
|
|
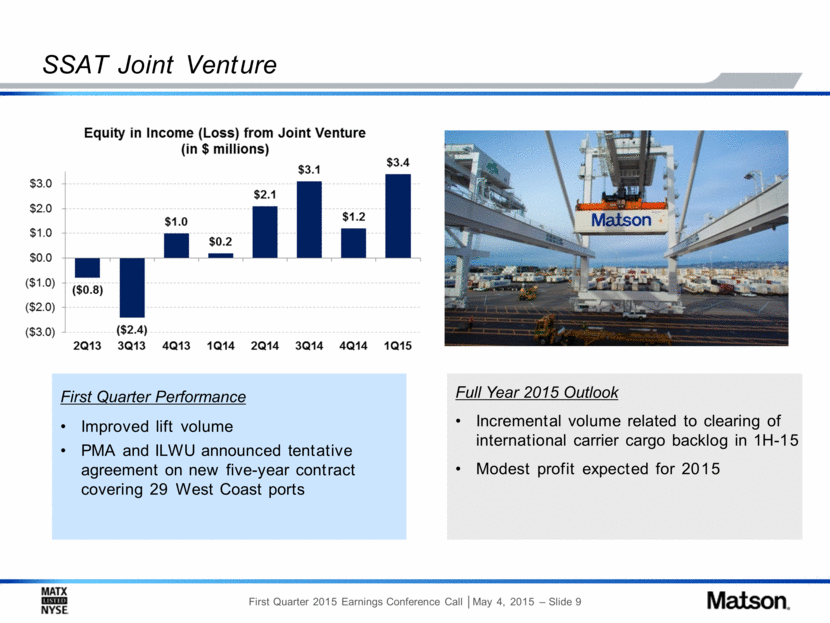
SSAT Joint Venture First Quarter Performance Improved lift volume PMA and ILWU announced tentative agreement on new five-year contract covering 29 West Coast ports Full Year 2015 Outlook Incremental volume related to clearing of international carrier cargo backlog in 1H-15 Modest profit expected for 2015 First Quarter 2015 Earnings Conference Call | May 4, 2015 – Slide 9 |
|
|
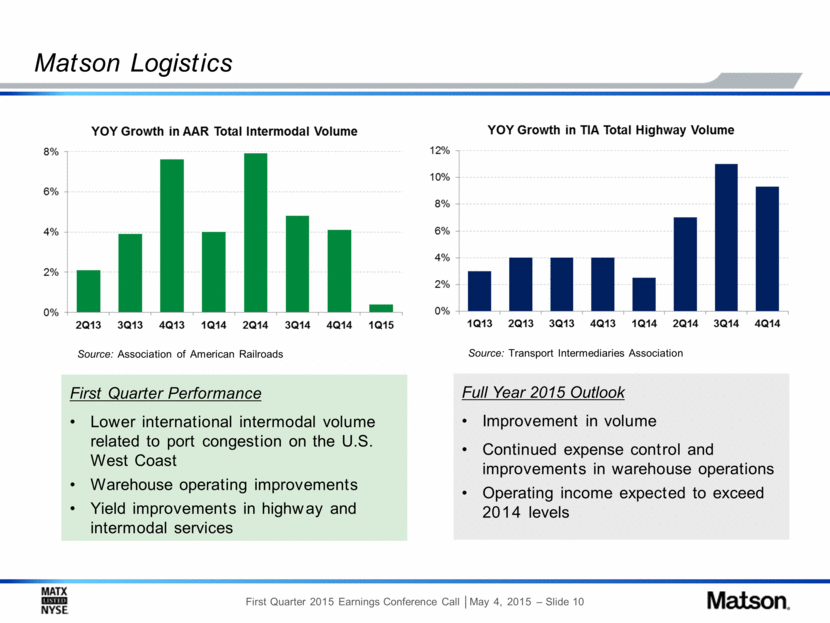
Matson Logistics First Quarter Performance Lower international intermodal volume related to port congestion on the U.S. West Coast Warehouse operating improvements Yield improvements in highway and intermodal services Source: Association of American Railroads Full Year 2015 Outlook Improvement in volume Continued expense control and improvements in warehouse operations Operating income expected to exceed 2014 levels Source: Transport Intermediaries Association First Quarter 2015 Earnings Conference Call | May 4, 2015 – Slide 10 |
|
|
On April 21, the U.S. Federal Trade Commission cleared Pasha’s acquisition of Horizon’s Hawaii service Pasha’s acquisition of Horizon’s Hawaii service expected to close by the end of the second quarter Matson’s acquisition of Horizon’s Alaska operations expected to close immediately after Pasha transaction closes If the transaction closes by the end of the second quarter, Horizon’s net debt will be significantly lower than it would have been if the transaction had closed at the end of 2015 Matson’s integration planning progressing well Update on Pending Alaska Acquisition First Quarter 2015 Earnings Conference Call | May 4, 2015 – Slide 11 |
|
|
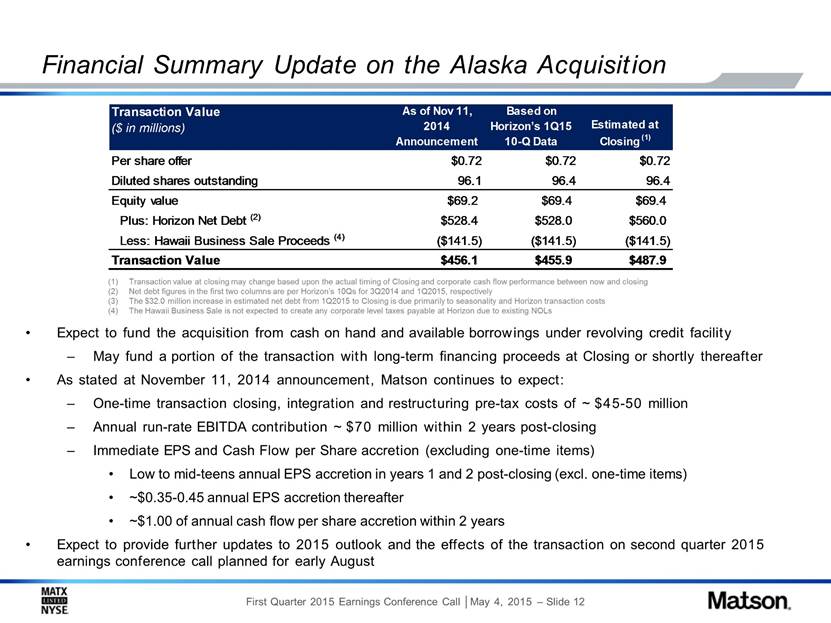
Expect to fund the acquisition from cash on hand and available borrowings under revolving credit facility May fund a portion of the transaction with long-term financing proceeds at Closing or shortly thereafter As stated at November 11, 2014 announcement, Matson continues to expect: One-time transaction closing, integration and restructuring pre-tax costs of ~$45-50 million Annual run-rate EBITDA contribution ~$70 million within 2 years post-closing Immediate EPS and Cash Flow per Share accretion (excluding one-time items) Low to mid-teens annual EPS accretion in years 1 and 2 post-closing (excl. one-time items) ~$0.35-0.45 annual EPS accretion thereafter ~$1.00 of annual cash flow per share accretion within 2 years Expect to provide further updates to 2015 outlook and the effects of the transaction on second quarter 2015 earnings conference call planned for early August Financial Summary Update on the Alaska Acquisition Transaction value at closing may change based upon the actual timing of Closing and corporate cash flow performance between now and closing Net debt figures in the first two columns are per Horizon’s 10Qs for 3Q2014 and 1Q2015, respectively The $32.0 million increase in estimated net debt from 1Q2015 to Closing is due primarily to seasonality and Horizon transaction costs The Hawaii Business Sale is not expected to create any corporate level taxes payable at Horizon due to existing NOLs Transaction Value ($ in millions) As of Nov 11, 2014 Announcement Based on Horizon’s 1Q15 10-Q Data Estimated at Closing (1) Per share offer $0.72 $0.72 $0.72 Diluted shares outstanding 96.1 96.4 96.4 Equity value $69.2 $69.4 $69.4 Plus: Horizon Net Debt (2) $528.4 $528.0 $560.0 Less: Hawaii Business Sale Proceeds (4) ($141.5) ($141.5) ($141.5) Transaction Value $456.1 $455.9 $487.9 First Quarter 2015 Earnings Conference Call | May 4, 2015 – Slide 12 |
|
|
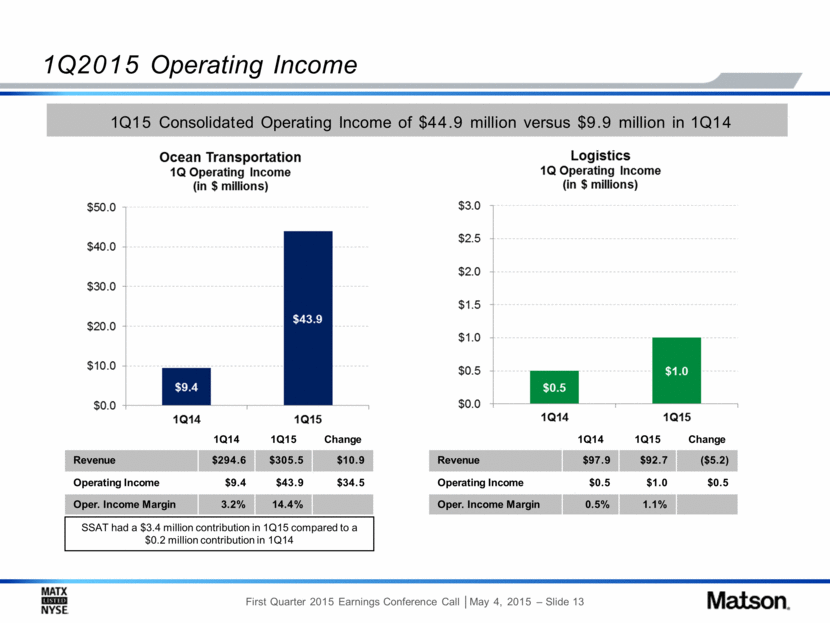
1Q2015 Operating Income SSAT had a $3.4 million contribution in 1Q15 compared to a $0.2 million contribution in 1Q14 1Q14 1Q15 Change Revenue $294.6 $305.5 $10.9 Operating Income $9.4 $43.9 $34.5 Oper. Income Margin 3.2% 14.4% 1Q14 1Q15 Change Revenue $97.9 $92.7 ($5.2) Operating Income $0.5 $1.0 $0.5 Oper. Income Margin 0.5% 1.1% 1Q15 Consolidated Operating Income of $44.9 million versus $9.9 million in 1Q14 First Quarter 2015 Earnings Conference Call | May 4, 2015 – Slide 13 |
|
|
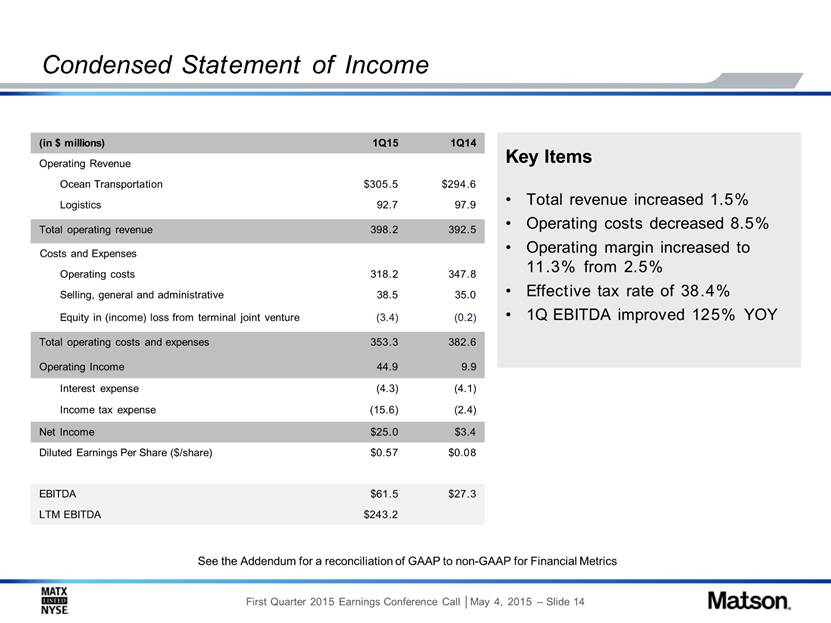
Condensed Statement of Income Key Items Total revenue increased 1.5% Operating costs decreased 8.5% Operating margin increased to 14.4% from 3.2% Effective tax rate of 38.4% 1Q EBITDA improved 125% YOY See the Addendum for a reconciliation of GAAP to non-GAAP for Financial Metrics (in $ millions) 1Q15 1Q14 Operating Revenue Ocean Transportation $305.5 $294.6 Logistics 92.7 97.9 Total operating revenue 398.2 392.5 Costs and Expenses Operating costs 318.2 347.8 Selling, general and administrative 38.5 35.0 Equity in (income) loss from terminal joint venture (3.4) (0.2) Total operating costs and expenses 353.3 382.6 Operating Income 44.9 9.9 Interest expense (4.3) (4.1) Income tax expense (15.6) (2.4) Net Income $25.0 $3.4 Diluted Earnings Per Share ($/share) $0.57 $0.08 EBITDA $61.5 $27.3 LTM EBITDA $243.2 First Quarter 2015 Earnings Conference Call | May 4, 2015 – Slide 14 |
|
|
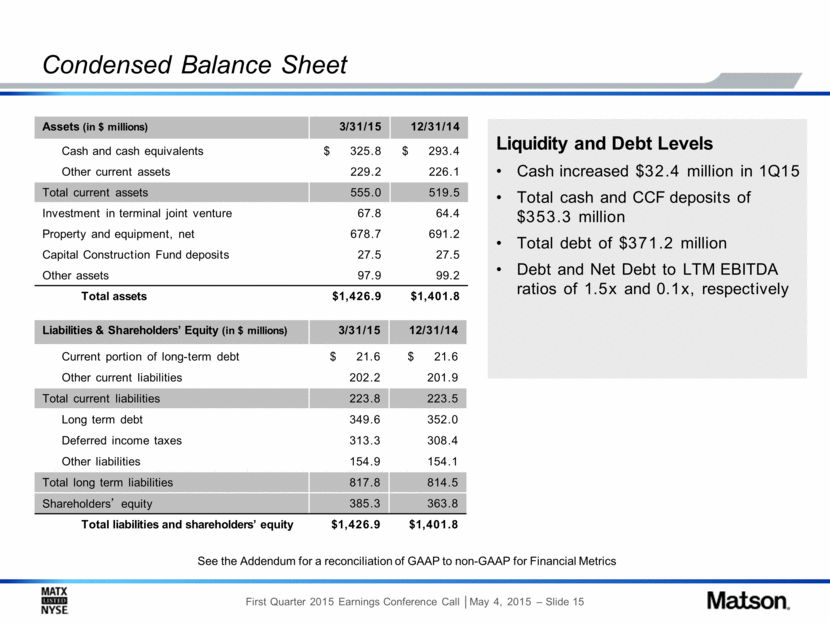
Condensed Balance Sheet Assets (in $ millions) 3/31/15 12/31/14 Cash and cash equivalents $ 325.8 $ 293.4 Other current assets 229.2 226.1 Total current assets 555.0 519.5 Investment in terminal joint venture 67.8 64.4 Property and equipment, net 678.7 691.2 Capital Construction Fund deposits 27.5 27.5 Other assets 97.9 99.2 Total assets $1,426.9 $1,401.8 Liabilities & Shareholders’ Equity (in $ millions) 3/31/15 12/31/14 Current portion of long-term debt $ 21.6 $ 21.6 Other current liabilities 202.2 201.9 Total current liabilities 223.8 223.5 Long term debt 349.6 352.0 Deferred income taxes 313.3 308.4 Other liabilities 154.9 154.1 Total long term liabilities 817.8 814.5 Shareholders’ equity 385.3 363.8 Total liabilities and shareholders’ equity $1,426.9 $1,401.8 Liquidity and Debt Levels Cash increased $32.4 million in 1Q15 Total cash and CCF deposits of $353.3 million Total debt of $371.2 million Debt and Net Debt to LTM EBITDA ratios of 1.5x and 0.1x, respectively See the Addendum for a reconciliation of GAAP to non-GAAP for Financial Metrics First Quarter 2015 Earnings Conference Call | May 4, 2015 – Slide 15 |
|
|
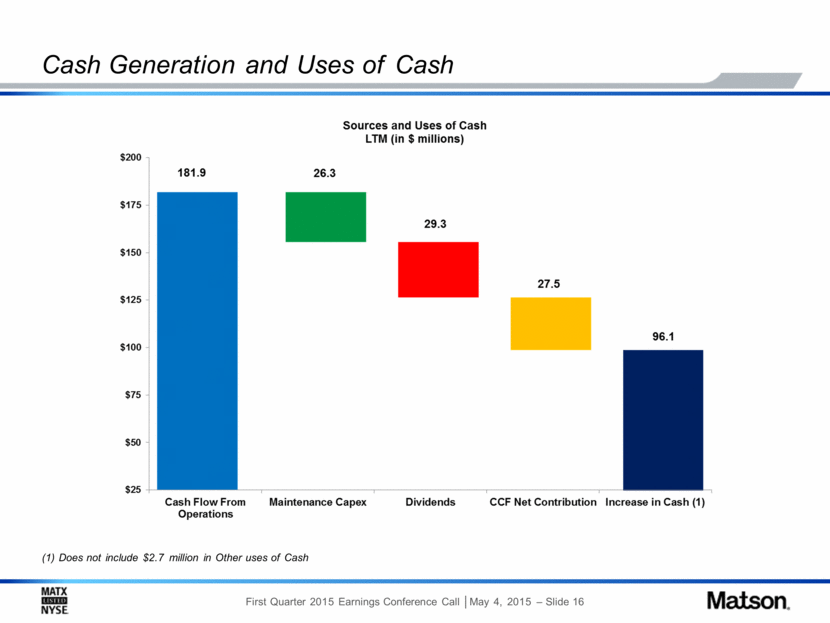
Cash Generation and Uses of Cash (1) Does not include $2.7 million in Other uses of Cash First Quarter 2015 Earnings Conference Call | May 4, 2015 – Slide 16 |
|
|
Outlook excludes any future impact of the molasses incident, the pending transaction with Horizon, and is being provided relative to 2014 operating income Ocean Transportation operating income for 2015 expected to be moderately higher than 2014 levels Hawaii volume to approximate 2014 level Flat to modest volume growth in Guam Continued premium freight rates and high utilization in China Modest profit at SSAT Logistics 2015 operating income expected to exceed 2014 levels Volume growth Continued expense control and improvements in warehouse operations Full Year 2015 Outlook First Quarter 2015 Earnings Conference Call | May 4, 2015 – Slide 17 |
|
|
Summary Remarks Positive outlook for the remainder of 2015 driven by: Closing the pending acquisition of Horizon’s Alaska Hawaii construction activity and market growth Sustained premium rates in our China expedited service Continued improvement in Logistics Businesses continue to generate substantial cash flow that, combined with strong balance sheet, provides ample capacity to: Close the pending Alaska acquisition Fund new vessel construction commitments Comfortably sustain dividend First Quarter 2015 Earnings Conference Call | May 4, 2015 – Slide 18 |
|
|
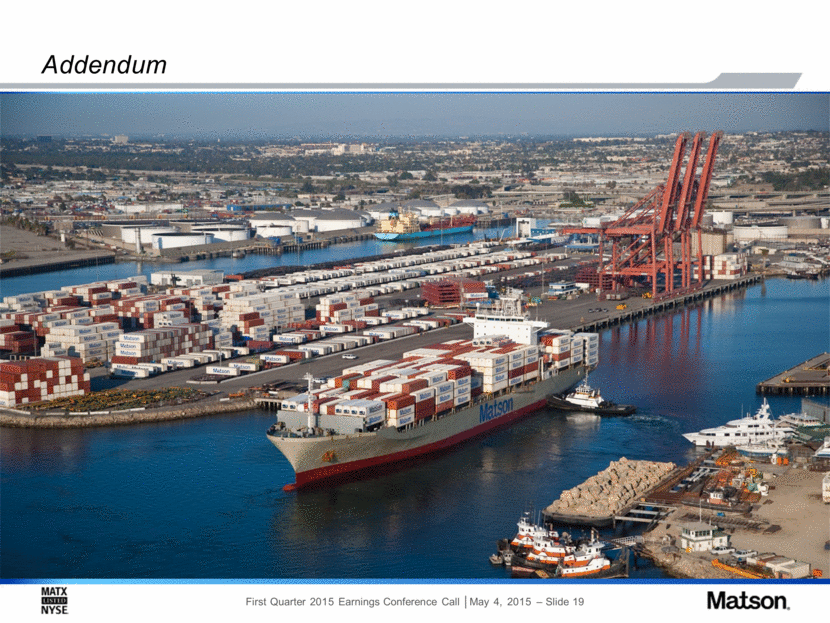
Addendum First Quarter 2015 Earnings Conference Call | May 4, 2015 – Slide 19 |
|
|
Addendum – Use of Non-GAAP Measures Matson reports financial results in accordance with U.S. generally accepted accounting principles (“GAAP”). The Company also considers other non-GAAP measures to evaluate performance, make day-to-day operating decisions, help investors understand our ability to incur and service debt and to make capital expenditures, and to understand period-over-period operating results separate and apart from items that may, or could, have a disproportional positive or negative impact on results in any particular period. These non-GAAP measures include, but are not limited to, Earnings Before Interest, Depreciation and Amortization (“EBITDA”), and Net Debt/EBITDA. First Quarter 2015 Earnings Conference Call | May 4, 2015 – Slide 20 |
|
|
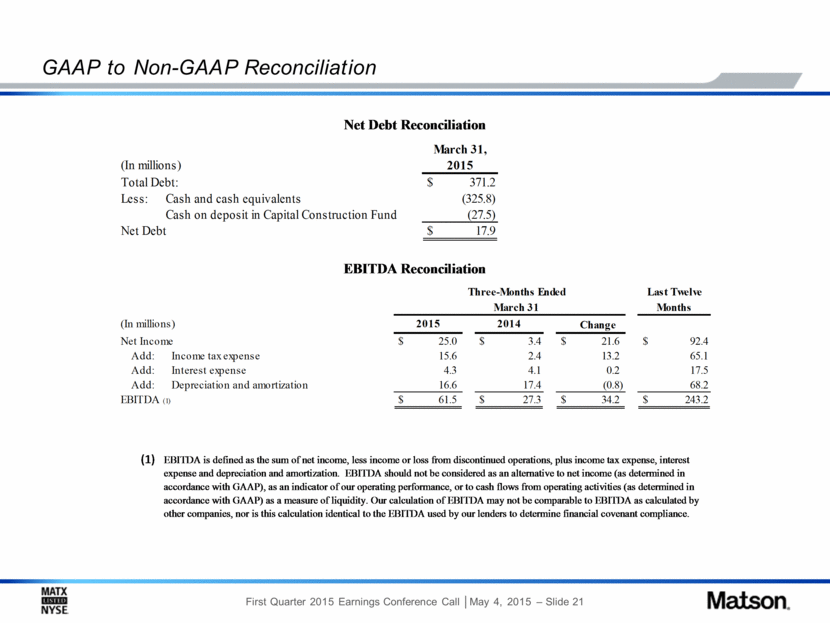
GAAP to Non-GAAP Reconciliation Net Debt Reconciliation EBITDA Reconciliation (1) EBITDA is defined as the sum of net income, less income or loss from discontinued operations, plus income tax expense, intere st expense and depreciation and amortization. EBITDA should not be considered as an alternative to net income (as determined in accordance with GAAP), as an indicator of our operating performance, or to cash flows from operating activities (as determine d in accordance with GAAP) as a measure of liquidity. Our calculation of EBITDA may not be comparable to EBITDA as calculated by other companies, nor is this calculation identical to the EBITDA used by our lenders to determine financial covenant compliance. $ 371.2 Less: Cash and cash equivalents (325.8) Cash on deposit in Capital Construction Fund (27.5) $ 17.9 Total Debt: (In millions) Net Debt March 31, 2015 Change $ 25.0 $ 3.4 $ 21.6 $ 92.4 Add: Income tax expense 15.6 2.4 13.2 65.1 Add: Interest expense 4.3 4.1 0.2 17.5 Add: Depreciation and amortization 16.6 17.4 (0.8) 68.2 $ 61.5 $ 27.3 $ 34.2 $ 243.2 EBITDA (1) 2015 Net Income (In millions) 2014 Months Last Twelve March 31 Three-Months Ended First Quarter 2015 Earnings Conference Call | May 4, 2015 – Slide 21 |

