Attached files
| file | filename |
|---|---|
| 8-K - 8-K - First NBC Bank Holding Co | nbcb-2015331xinvestorprese.htm |

EXHIBIT 99.1 Gulf South Bank Conference May 5-6, 2015 NASDAQ: FNBC

Forward Looking Statements Statements contained in this presentation that are not historical facts, including statements accompanied by words such as “will,” “believe,” “anticipate,” “expect,” “estimate,” “preliminary,” or similar words, constitute “forward-looking statements” within the meaning of the Private Securities Litigation Reform Act of 1995. These forward-looking statements are based on management’s estimates, assumptions, and projections as of the date of the presentation and are not guarantees of future performance. Actual results may differ materially from the results expressed or implied by these forward-looking statements as the result of risks, uncertainties and other factors, including, but are not limited to, those discussed in the company’s periodic reports and filings with the Securities and Exchange Commission (SEC). Copies of the company’s SEC filings may be downloaded from the Internet at no charge from www.sec.gov or ir.firstnbcbank.com/sec.cfm. First NBC Bank Holding Company cautions you not to place undue reliance on the forward-looking statements contained in this presentation, which the company undertakes no obligation to update or revise to reflect future events, information or circumstances arising after the date of this presentation. Market data used in this presentation has been obtained from independent industry sources and publications as well as from research reports prepared for other purposes. Industry publications and surveys and forecasts generally state that the information contained therein has been obtained from sources believed to be reliable. The company has not independently verified the data obtained from these sources. Forward-looking information obtained from these sources is subject to the same qualifications and the additional uncertainties regarding the other forward-looking statements in this presentation. 2
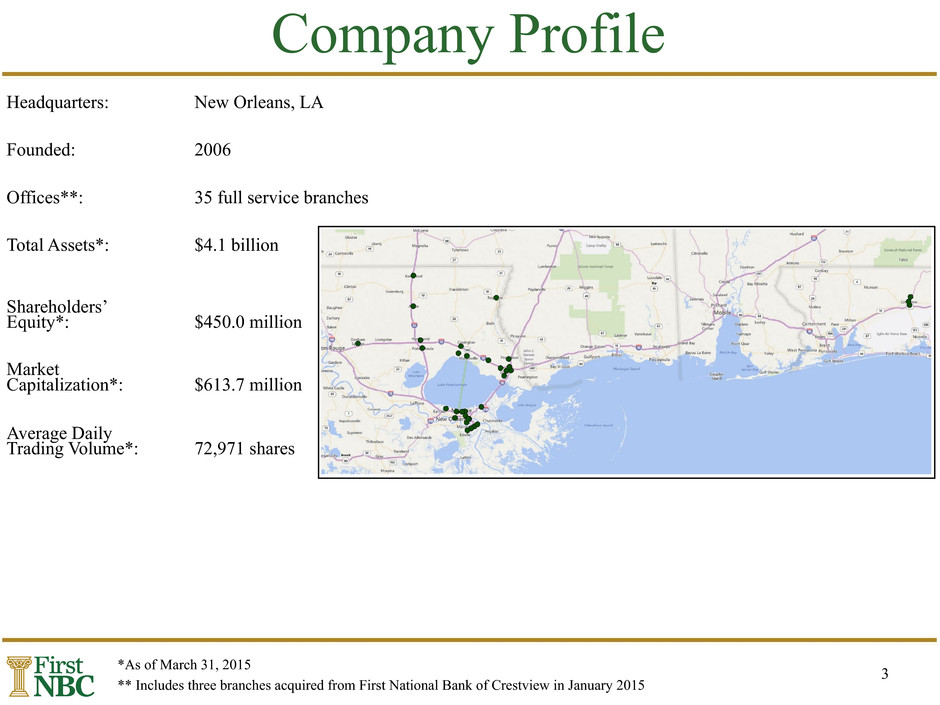
Company Profile 3 Headquarters: New Orleans, LA Founded: 2006 Offices**: 35 full service branches Total Assets*: $4.1 billion Shareholders’ Equity*: $450.0 million Market Capitalization*: $613.7 million Average Daily Trading Volume*: 72,971 shares *As of March 31, 2015 ** Includes three branches acquired from First National Bank of Crestview in January 2015
Performance Highlights • FDIC assisted acquisition of First National Bank of Crestview completed in January 2015 • Acquired approximately $62.3 million of assets • Acquired approximately $72.3 million of deposits • Private placement of Subordinated Notes completed in 1Q 2015 • Completed private placement of $60.0 million in aggregate principal amount of 5.75% fixed rate subordinated notes due 2025 • Strong loan growth - 4.7% compared to December 31, 2014 and 17.5% compared to March 31, 2014 • Driven by increases in construction, commercial real estate and commercial loans • Crestview acquisition added $25.1 million, or 1.0%, to the loan portfolio, primarily consumer real estate loans as of March 31, 2015 • Strong deposit growth – 7.9% compared to December 31, 2014 and 16.5% compared to March 31, 2014 • Driven by increases in noninterest-bearing demand and money market deposit accounts • Shift from NOW to money market deposits due to implementation of tiered pricing • Assumption of Crestview deposit liabilities added $70.8 million, or 2.1%, to total deposits as of March 31, 2015 • Growth in net income – 25.3% over the first quarter of 2014 4

5 Quarter Highlights • Improvement in EPS over the linked- quarter and prior year quarter • Continued loan growth and loan demand • Strong credit quality ($ in thousands; except per share data) 1Q15 4Q14 Linked - Quarter Change 1Q14 1Q15 vs. 1Q14 Change Net Income $16,068 $15,703 2.3% $12,828 25.3% Earnings Per Share (basic) $0.84 $0.82 2.4% $0.68 23.5% Earnings Per Share (diluted) $0.82 $0.80 2.5% $0.66 24.2% Return On Average Assets(%) 1.65% 1.68% (3) bps 1.54% 11 bps Return on Average Common Equity(%) 16.32% 16.10% 22 bps 15.01% 131 bps Total Loans $2,904,039 $2,774,264 4.7% $2,470,963 17.5% Net Interest Margin(%) 3.16% 3.33% (17) bps 3.30% (14) bps Net Interest Income $27,622 $28,091 (1.7)% $24,848 11.2% Tangible Common Equity $399,820 $386,245 3.5% $344,700 16.0% Efficiency Ratio(%) 74.69% 73.40% 129 bps 61.46% 1,323 bps
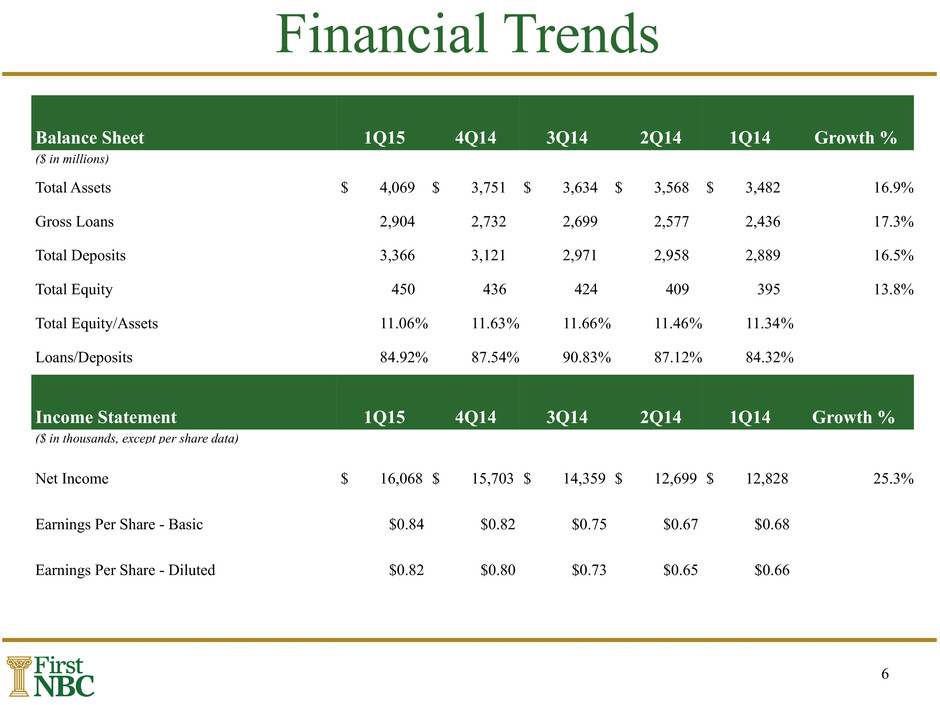
6 Financial Trends Balance Sheet 1Q15 4Q14 3Q14 2Q14 1Q14 Growth % ($ in millions) Total Assets $ 4,069 $ 3,751 $ 3,634 $ 3,568 $ 3,482 16.9% Gross Loans 2,904 2,732 2,699 2,577 2,436 17.3% Total Deposits 3,366 3,121 2,971 2,958 2,889 16.5% Total Equity 450 436 424 409 395 13.8% Total Equity/Assets 11.06% 11.63% 11.66% 11.46% 11.34% Loans/Deposits 84.92% 87.54% 90.83% 87.12% 84.32% Income Statement 1Q15 4Q14 3Q14 2Q14 1Q14 Growth % ($ in thousands, except per share data) Net Income $ 16,068 $ 15,703 $ 14,359 $ 12,699 $ 12,828 25.3% Earnings Per Share - Basic $0.84 $0.82 $0.75 $0.67 $0.68 Earnings Per Share - Diluted $0.82 $0.80 $0.73 $0.65 $0.66

7 Financial Trends Asset Quality 1Q15 4Q14 3Q14 2Q14 1Q14 Nonperforming Loans to Total Loans 0.84% 0.82% 0.90% 0.85% 0.81% Nonperforming Assets to Total Assets 0.73% 0.76% 0.82% 0.76% 0.69% Allowance for Loan Losses to Total Loans 1.56% 1.53% 1.49% 1.45% 1.39% Allowance for Loan Losses to Nonperforming Loans 185.15% 185.71% 165.47% 171.6% 172.99% Net Charge-offs to Average Loans 0.01% 0.07% 0.03% 0.03% 0.03% Profitability 1Q15 4Q14 3Q14 2Q14 1Q14 Return on Average Common Equity 16.32% 16.10% 15.30% 14.18% 15.01% Return on Average Assets 1.65% 1.68% 1.59% 1.45% 1.54% Net Interest Margin 3.16% 3.33% 3.37% 3.35% 3.30% Efficiency Ratio 74.69% 73.40% 65.10% 62.98% 61.46%

8 Income Statement Trends 1Q15 4Q14 3Q14 2Q14 1Q14 ($in thousands, except per share data) Interest income $ 39,106 $ 38,956 $ 38,668 $ 37,193 $ 35,161 Interest expense 11,484 10,865 10,908 10,643 10,313 Net interest income 27,622 28,091 27,760 26,550 24,848 Provision for loan losses 3,000 3,000 3,000 3,000 3,000 Net interest income after provision for loan losses 24,622 25,091 24,760 23,550 21,848 Noninterest income 2,510 2,287 3,034 2,933 3,359 Noninterest expense 22,504 22,297 20,047 18,568 17,337 Income before income taxes 4,628 5,081 7,747 7,915 7,870 Income tax (benefit) expense (11,440) (10,622) (6,612) (4,784) (4,958) Net income 16,068 15,703 14,359 12,699 12,828 Less net income attributable to noncontrolling interest — — — — — Net income attributable to Company 16,068 15,703 14,359 12,699 12,828 Less preferred stock dividends (95) (94) (95) (95) (95) Less earnings allocated to participating securities (308) (302) (275) (243) (246) Income available to common shareholders $ 15,665 $ 15,307 $ 13,989 $ 12,361 $ 12,487 Earnings per common share-basic $ 0.84 $ 0.82 $ 0.75 $ 0.67 $ 0.68 Earnings per common share-diluted $ 0.82 $ 0.80 $ 0.73 $ 0.65 $ 0.66
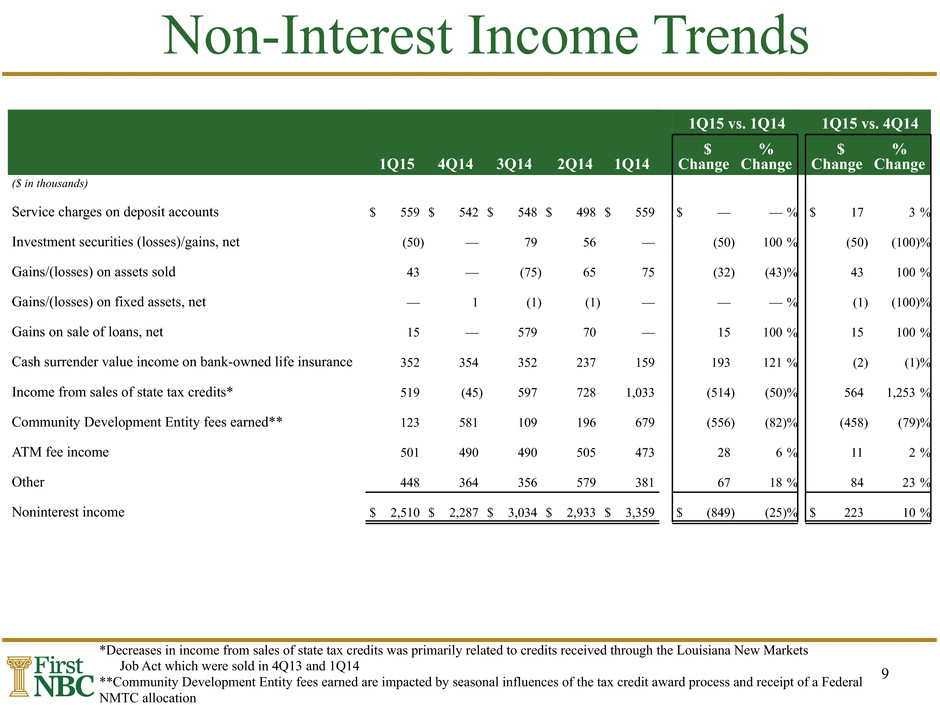
9 Non-Interest Income Trends 1Q15 vs. 1Q14 1Q15 vs. 4Q14 1Q15 4Q14 3Q14 2Q14 1Q14 $ Change % Change $ Change % Change ($ in thousands) Service charges on deposit accounts $ 559 $ 542 $ 548 $ 498 $ 559 $ — — % $ 17 3 % Investment securities (losses)/gains, net (50) — 79 56 — (50) 100 % (50) (100)% Gains/(losses) on assets sold 43 — (75) 65 75 (32) (43)% 43 100 % Gains/(losses) on fixed assets, net — 1 (1) (1) — — — % (1) (100)% Gains on sale of loans, net 15 — 579 70 — 15 100 % 15 100 % Cash surrender value income on bank-owned life insurance 352 354 352 237 159 193 121 % (2) (1)% Income from sales of state tax credits* 519 (45) 597 728 1,033 (514) (50)% 564 1,253 % Community Development Entity fees earned** 123 581 109 196 679 (556) (82)% (458) (79)% ATM fee income 501 490 490 505 473 28 6 % 11 2 % Other 448 364 356 579 381 67 18 % 84 23 % Noninterest income $ 2,510 $ 2,287 $ 3,034 $ 2,933 $ 3,359 $ (849) (25)% $ 223 10 % *Decreases in income from sales of state tax credits was primarily related to credits received through the Louisiana New Markets Job Act which were sold in 4Q13 and 1Q14 **Community Development Entity fees earned are impacted by seasonal influences of the tax credit award process and receipt of a Federal NMTC allocation

10 Non-Interest Expense Trends 1Q15 vs. 1Q14 1Q15 vs. 4Q14 1Q15 4Q14 3Q14 2Q14 1Q14 $ Change % Change $ Change % Change ($ in thousands) Salaries and employee benefits $ 6,907 $ 7,072 $ 6,456 $ 5,942 $ 5,397 $ 1,510 28 % $ (165) (2)% Occupancy and equipment expenses 2,928 2,843 2,737 2,684 2,584 344 13 % 85 3 % Professional fees 2,141 2,433 1,628 1,511 1,899 242 13 % (292) (12)% Taxes, licenses and FDIC assessments 1,239 1,364 1,240 1,343 1,199 40 3 % (125) (9)% Tax credit investment amortization* 4,852 3,881 3,974 3,377 2,827 2,025 72 % 971 25 % Write-down of foreclosed assets 58 198 1 20 166 (108) (65)% (140) (71)% Data processing 1,422 1,275 1,207 1,141 1,098 324 30 % 147 12 % Advertising and marketing 1,018 1,067 685 556 578 440 76 % (49) (5)% Other 1,939 2,164 2,119 1,994 1,589 350 22 % (225) (10)% Noninterest expense $ 22,504 $ 22,297 $ 20,047 $ 18,568 $ 17,337 $ 5,167 30 % $ 207 1 % *Tax credit amortization increased due to increases in completion of tax credit projects and tax credit investments

11 Increasing Profitability Net Income Net Income by Quarter 17,000 16,000 15,000 14,000 13,000 12,000 $ (T ho us an ds ) 1Q14 2Q14 3Q14 4Q14 1Q15 Basic EPS Basic EPS 0.90 0.85 0.80 0.75 0.70 0.65 0.60 $ (D ol la rs ) 1Q14 2Q14 3Q14 4Q14 1Q15

12 Profitability Return on Average Common Equity Return on Average Common Equity 17% 16% 15% 14% 13% 12% 11% 10% 2010 2011 2012 2013 2014 2015 YTD 11.42% 14.28% 15.77% 14.88% 15.17% 16.32% Return on Average Assets Return on Average Assets 1.8% 1.6% 1.4% 1.2% 1.0% 0.8% 0.6% 2010 2011 2012 2013 2014 2015 YTD 0.79% 1.17% 1.19% 1.37% 1.57% 1.65% First NBC completed its initial public offering, which raised $115 million, in May 2013.

13 Profitability Net Interest Margin 4% 3% 2% 1% 0% 2010 2011 2012 2013 2014 2015 YTD 3.09% 3.44% 3.36% 3.11% 3.34% 3.16% Efficiency Ratio 76% 74% 72% 70% 68% 66% 64% 62% 60% 2010 2011 2012 2013 2014 2015 YTD 62.57% 61.86% 62.56% 68.50% 65.83% 74.69%

14 Loan Composition Loan Composition at 3/31/15 Loan Composition at 3/31/14 3/31/2015 12/31/2014 3/31/2014 Loan Growth 1,400,000 1,300,000 1,200,000 1,100,000 1,000,000 900,000 800,000 $( Th ou sa nd s) Commercial real estate Commercial Loan Composition by Industry • Yield on loans: 5.01% • 26% of real estate loans are owner-occupied • 38% fixed rate/62% variable rate • Average loan size - $864,000 for commercial and $926,000 for commercial real estate * Commercial loans include loans to the oil and gas industry, primarily to oil and gas service companies. The oil and gas commercial loan portfolio is approximately 3.4% of the Company's total loan portfolio and the Company has outstanding loan commitments related to the oil and gas portfolio of approximately $10.5 million as of March 31, 2015. The Company is actively monitoring these credits. Consumer, 1% Construction, 12% Commercial real estate, 44% Consumer real estate, 6% Commercial*, 37% Commercial, 38% Consumer, 1% Construction, 10% Commercial real estate, 46% Consumer real estate, 5% Other, 32% Other services, 8% Accommodation and food services, 13% Real estate, rental and leasing, 32% Finance and insurance, 5% Construction, 10%

Total Loans Percentage Change 3,500,000 3,000,000 2,500,000 2,000,000 1,500,000 1,000,000 500,000 0 $ (T ho us an ds ) 2010 2011 2012 2013 2014 2015 YTD 15 Annual Loan Growth • Experienced double-digit loan growth over each of the last five years • Expects to achieve similar growth results in 2015 • Driven by increases in construction, commercial real estate, and commercial loans • Favorable economic market conditions in the New Orleans trade area 48.4% 16.4% 22.7% 17.7% 4.7%

16 Deposit Composition Deposit Composition at 3/31/15 Deposit Composition at 3/31/14 3/31/15 12/31/14 3/31/14 Deposit Growth 1,400,000 1,200,000 1,000,000 800,000 600,000 400,000 200,000 $ (T ho us an ds ) NOW deposits MMA deposits Certificates of deposit • Rate on Interest-Bearing Deposits: 1.44% • Average deposit size - $56,000 for transaction accounts and $62,000 for certificates of deposit • Competitively priced deposit base drives customer loyalty • Locally sourced • Significant migration towards transaction accounts Noninterest- bearing, 13% Certificates of deposit, 36% NOW deposits,16% MMA deposits, 33% Savings deposits, 2% Certificates of deposit, 42% Noninterest- bearing, 12% NOW deposits, 18% MMA deposits, 26% Savings deposits, 2%
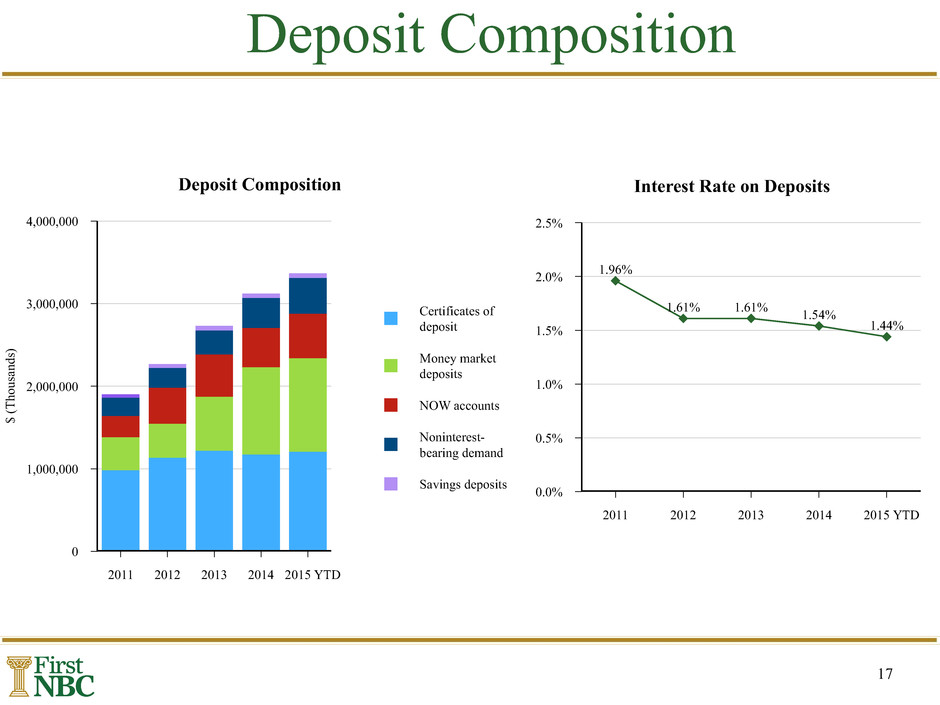
17 Deposit Composition Certificates of deposit Money market deposits NOW accounts Noninterest- bearing demand Savings deposits Deposit Composition 4,000,000 3,000,000 2,000,000 1,000,000 0 $ (T ho us an ds ) 2011 2012 2013 2014 2015 YTD Interest Rate on Deposits 2.5% 2.0% 1.5% 1.0% 0.5% 0.0% 2011 2012 2013 2014 2015 YTD 1.96% 1.61% 1.61% 1.54% 1.44%

18 Net Interest Margin Loan Yield NIM Cost of Funds 6% 5% 4% 3% 2% 1% 0% 1Q14 2Q14 3Q14 4Q14 1Q15 5.22% 5.28% 5.18% 5.08% 5.01% 3.30% 3.35% 3.37% 3.33% 3.16% 1.57% 1.55% 1.54% 1.50% 1.44% • Cost of deposits decreased 13 bps compared to 1Q14

19 Tax Credit Overview • Tax credits are an integral part of First NBC’s commercial banking business • Management has a deep understanding of this business which is core to First NBC’s corporate strategy • Well-established federal and state programs • Promotes private investment in low income areas, builds affordable housing and rehabilitates historic buildings • Includes Federal Historic Rehabilitation Tax Credits which was established as part of the Tax Reform Act of 1976 • Includes Low-Income Housing Tax Credits which was created under the Tax Reform Act of 1986 • Includes Federal New Markets Tax Credits which was established as part of the Community Renewal Tax Relief Act of 2000 • First NBC plays three roles • Investor in the underlying project • Lender to the developer • Allocator of Federal New Markets Tax Credits to the project • First NBC receives tax credits in exchange for investment in the project • Loans underwritten to normal credit standards • Underlying projects have low LTVs (40% - 70%) • Strong financial returns
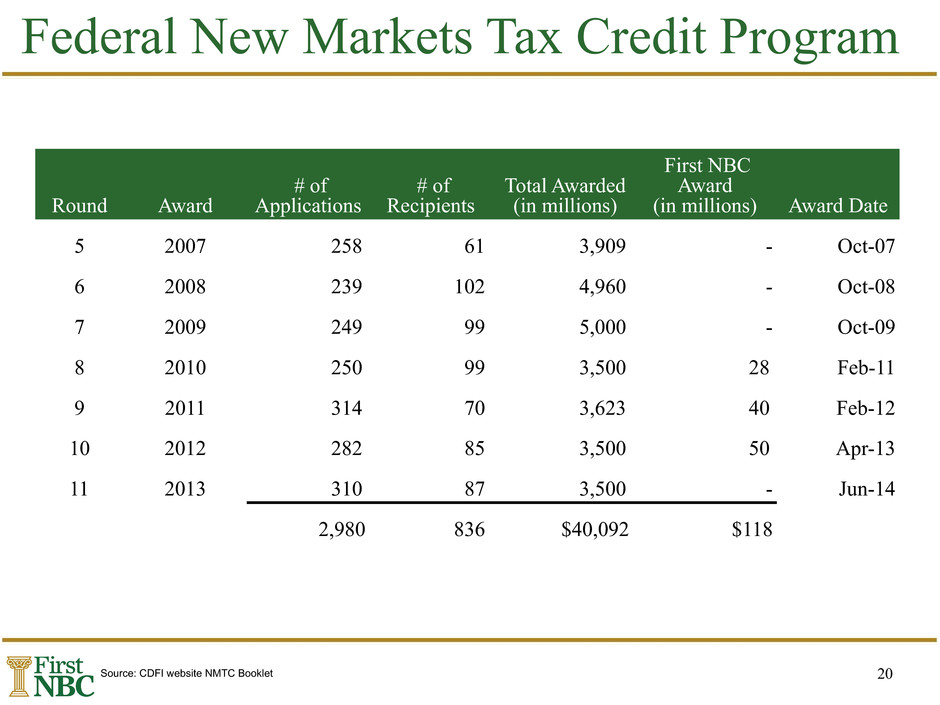
20 Federal New Markets Tax Credit Program Round Award # of Applications # of Recipients Total Awarded (in millions) First NBC Award (in millions) Award Date 5 2007 258 61 3,909 - Oct-07 6 2008 239 102 4,960 - Oct-08 7 2009 249 99 5,000 - Oct-09 8 2010 250 99 3,500 28 Feb-11 9 2011 314 70 3,623 40 Feb-12 10 2012 282 85 3,500 50 Apr-13 11 2013 310 87 3,500 - Jun-14 2,980 836 $40,092 $118 Source: CDFI website NMTC Booklet

21 Tax Credit Investments & Loans (1) Bank Owned is First NBC Bank Federal NMTC allocations from 2011-2013 of $118.0 million (2) The Company made an equity investment of $5.7 million in various Federal NMTC projects. This investment generated Federal NMTC. (3) Non-Bank Owned CDE gross investment includes loans made to the investment fund of $127.5 million. Tax Credit Federal NMTC Allocations QEI % ($ in thousands) Bank Owned CDE (1) $ 118.0 40% Bank Owned CDE Equity Investment (2) 5.7 2 Non-Bank Owned CDE(3) 172.2 58 Total QEI Invested $ 295.9 100% Tax Credit Investment & Loan Detail 3/31/15 • $147.1 million invested in tax credit entities • $304.4 million loaned to tax credit related projects New Markets Investments, 13% Low Income Housing Investments, 8% Historic Rehabilitation Investments, 11% Construction Loans, 18% Commercial Real Estate Loans, 18% Commercial and Industrial Loans, 31%

22 Future Tax Credits As of December 31, 2014 TOTAL FEDERAL NMTCs TOTAL FEDERAL LIHTCs TOTAL FEDERAL HTCs 50.0 40.0 30.0 20.0 10.0 0.0 $ (M ill io ns ) 2015 2016 2017 2018 2019 2020 Period Ending • $101.3 million of Federal New Market and Low Income Housing tax credits have been awarded ($29.7 million realized through December 31, 2014, $71.6 million in remaining benefits to be realized) • Beginning in years 2015 and 2016, the Company expects to recognize Federal Historic tax credits of approximately $27.4 million and $32.6 million, respectively. Historic tax credits are based on committed projects in construction and credits are recognized when certificates of occupancy are received.

23 Acquisition Activity • On December 30, 2014, First NBC entered into an Agreement and Plan of Reorganization with State Investors Bancorp, Inc. (SIBC), a full-service commercial bank headquartered in Metairie, Louisiana. • On January 16, 2015, First NBC entered into an agreement with the FDIC to purchase certain assets and assume certain liabilities of First National Bank of Crestview, a national full-service commercial bank headquartered in Crestview, Florida. Source: SNL Financial, MapPoint FNBC (32 Branches) SIBC (4 Branches) Crestview (3 Branches)
