Attached files
| file | filename |
|---|---|
| 8-K - 8-K - MAINSOURCE FINANCIAL GROUP | a15-10426_18k.htm |
Exhibit 99.1
|
|
MainSource FINANCIAL GROUP Meeting the financial needs of our customers...for life! |
|
|
Welcome 2015 Annual Meeting of Shareholders Archie M. Brown, Jr., Chairman |
|
|
Introduction of Director Nominees Charles J. Thayer |
|
|
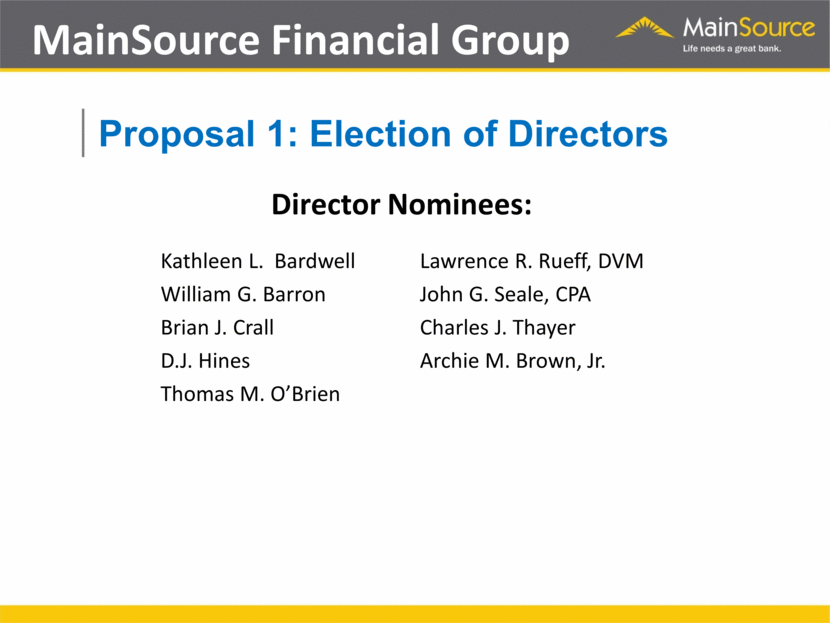
Kathleen L. Bardwell William G. Barron Brian J. Crall D.J. Hines Thomas M. O’Brien MainSource Financial Group Proposal 1: Election of Directors Lawrence R. Rueff, DVM John G. Seale, CPA Charles J. Thayer Archie M. Brown, Jr. Director Nominees: |
|
|
Vote on 2015 Stock Incentive Plan |
|
|
Vote on 2015 Stock Incentive Plan Proposal 2: Approve 2015 Stock Incentive Plan |
|
|
Advisory Vote on Executive Compensation Policies and Procedures |
|
|
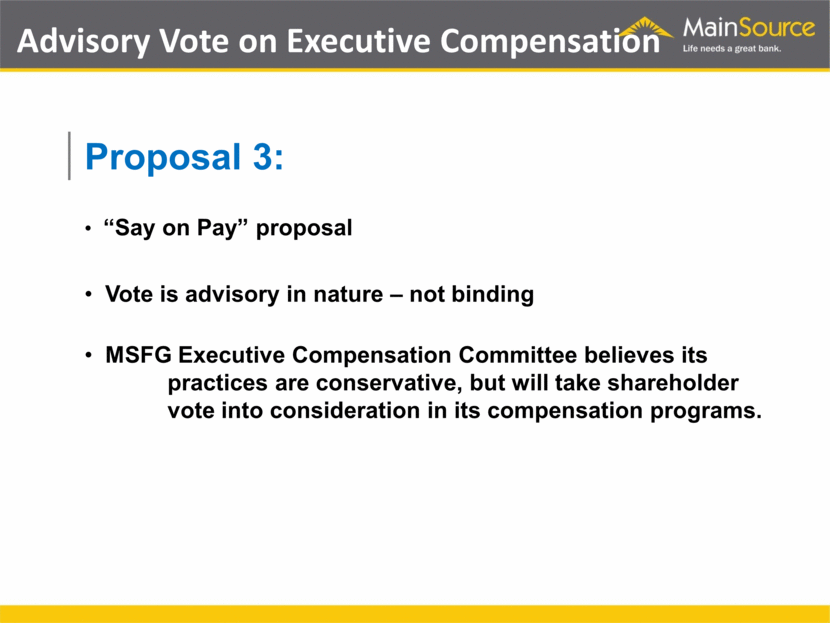
Advisory Vote on Executive Compensation “Say on Pay” proposal Vote is advisory in nature – not binding MSFG Executive Compensation Committee believes its practices are conservative, but will take shareholder vote into consideration in its compensation programs. Proposal 3: |
|
|
Ratification of Independent Auditors |
|
|
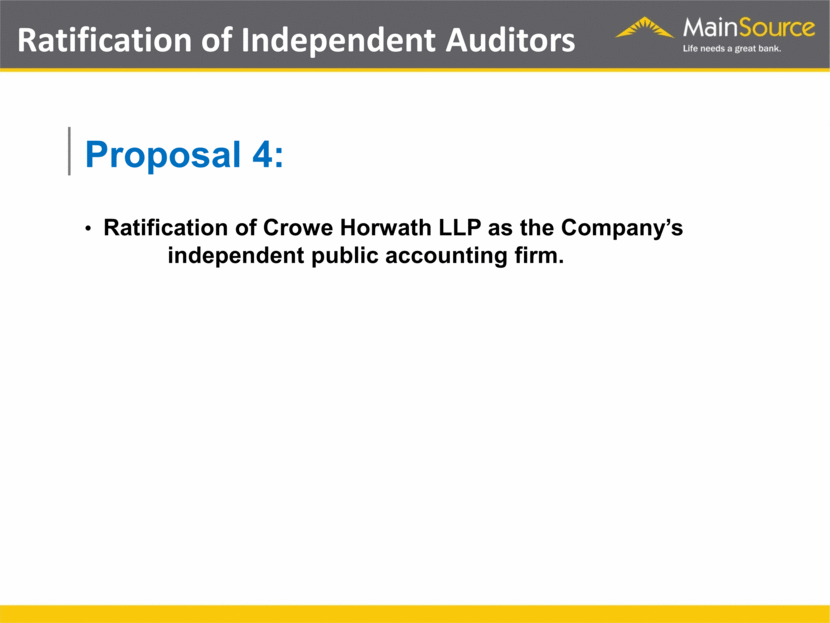
Ratification of Independent Auditors Ratification of Crowe Horwath LLP as the Company’s independent public accounting firm. Proposal 4: |
|
|
Introductions |
|
|
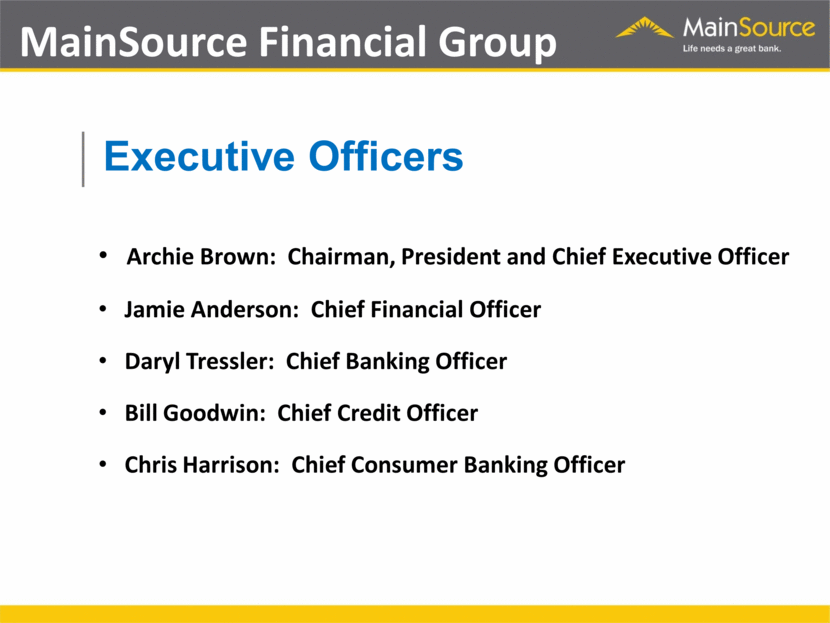
MainSource Financial Group Archie Brown: Chairman, President and Chief Executive Officer Jamie Anderson: Chief Financial Officer Daryl Tressler: Chief Banking Officer Bill Goodwin: Chief Credit Officer Chris Harrison: Chief Consumer Banking Officer Executive Officers |
|
|
Results of Shareholder Vote |
|
|
Official Business Meeting Concluded |
|
|
Recognition of Phil Frantz |
|
|
2014 Financial Performance Jamie Anderson Chief Financial Officer |
|
|
Disclosure Regarding Forward Looking Statements This presentation may include comments or information that constitute forward-looking statements (within the meaning of the Private Securities Litigation Reform Act of 1995) based on current expectations that involve a number of risks and uncertainties. These forward looking statements are subject to a number of factors and uncertainties which could cause MainSource’s actual results and experience to differ from the anticipated results and expectations expressed in such forward looking statements. Forward looking statements speak only as of the date they are made and MainSource does not assume any duty to update forward looking statements. These forward-looking statements include, but are not limited to, statements about MainSource’s business strategy, financial position and prospects, dividend policy, business results, strategic initiatives, credit quality including reserve levels, capital expenditures, and various other matters. These statements can be identified by the use of forward-looking terminology such as “believes,” “estimates,” “expects,” “intends,” “may,” “will,” “should,” “could” or “anticipates”, or the negative or other variation of these similar words, or by discussions of strategy or risks and uncertainties. Factors that could cause actual results to differ materially from such forward-looking statements include, without limitation, general economic conditions, legislative and regulatory initiatives, changes in the quality of MainSource’s loan portfolios, and other risks set forth in MainSource’s Annual Report on Form 10-K for the fiscal year ending December 31, 2014, on file with the SEC. |
|
|
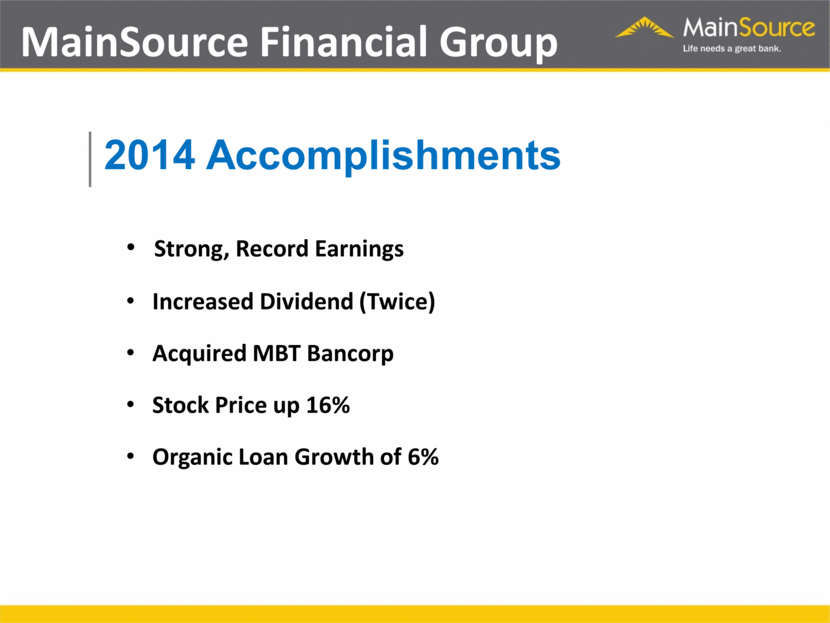
MainSource Financial Group Strong, Record Earnings Increased Dividend (Twice) Acquired MBT Bancorp Stock Price up 16% Organic Loan Growth of 6% 2014 Accomplishments |
|
|
2014 Balance Sheet |
|
|
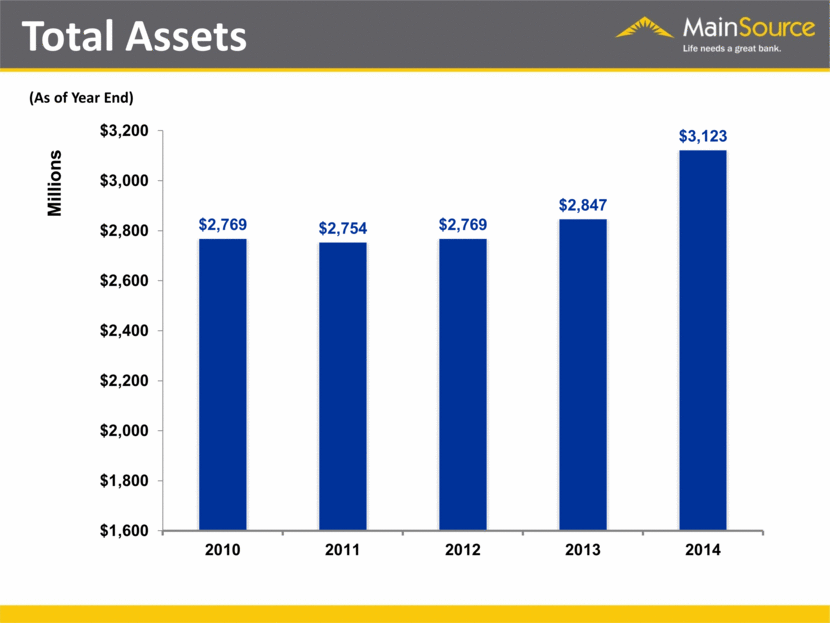
Total Assets (As of Year End) $ 2,769 $2,754 $2,769 $2,847 $3,123 $1,600 $1,800 $2,000 $2,200 $2,400 $2,600 $2,800 $3,000 $3,200 2010 2011 2012 2013 2014 Millions |
|
|
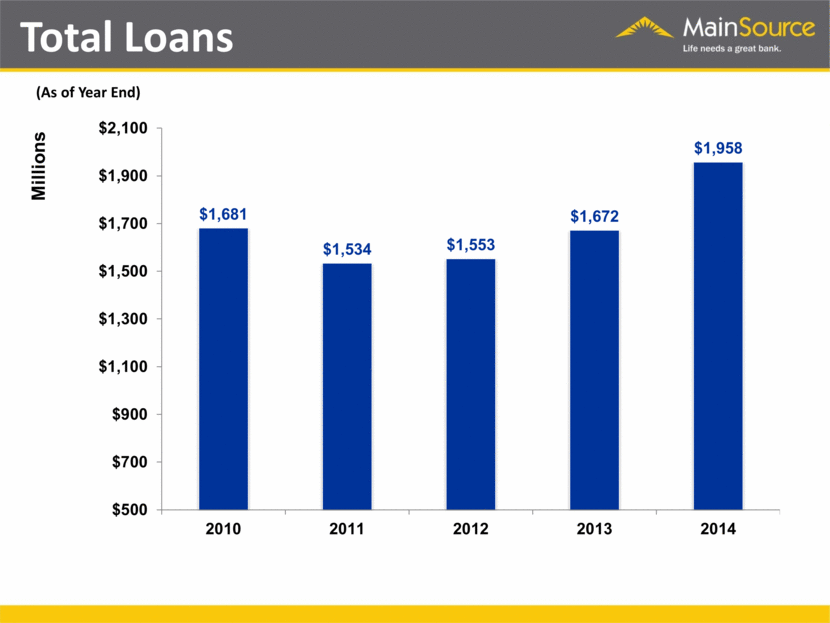
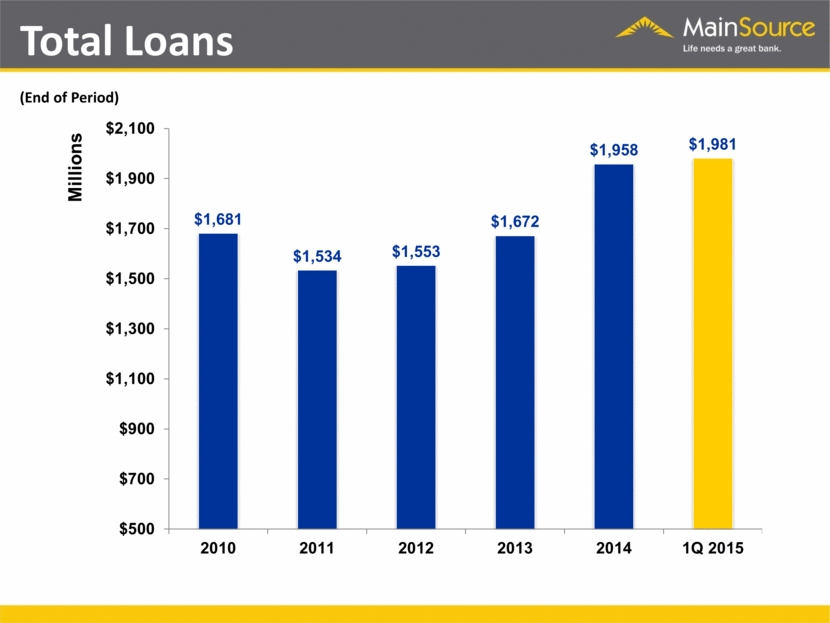
Total Loans (As of Year End) $1,681 $1,534 $1,553 $1,672 $1,958 $500 $700 $900 $1,100 $1,300 $1,500 $1,700 $1,900 $2,100 2010 2011 2012 2013 2014 Millions |
|
|
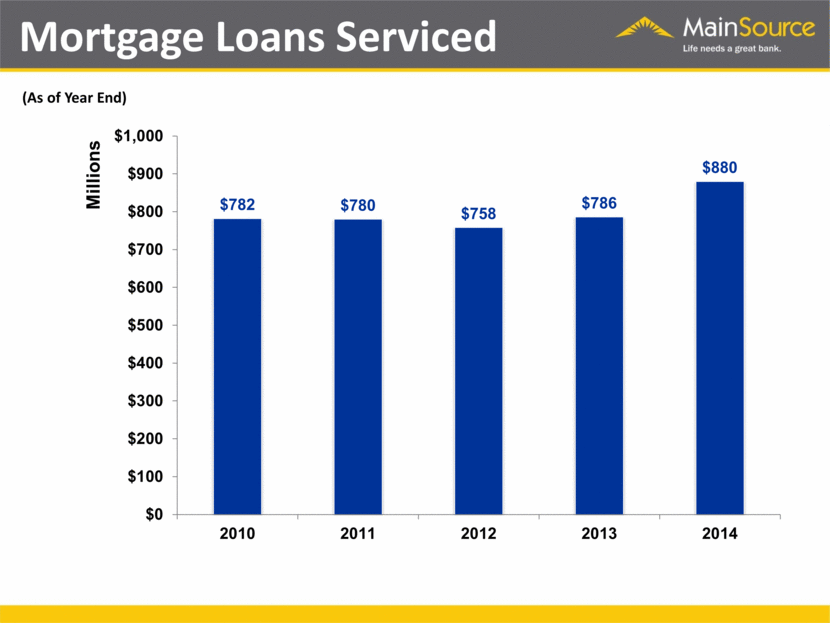
Mortgage Loans Serviced (As of Year End) $782 $780 $758 $786 $880 $0 $100 $200 $300 $400 $500 $600 $700 $800 $900 $1,000 2010 2011 2012 2013 2014 Millions |
|
|
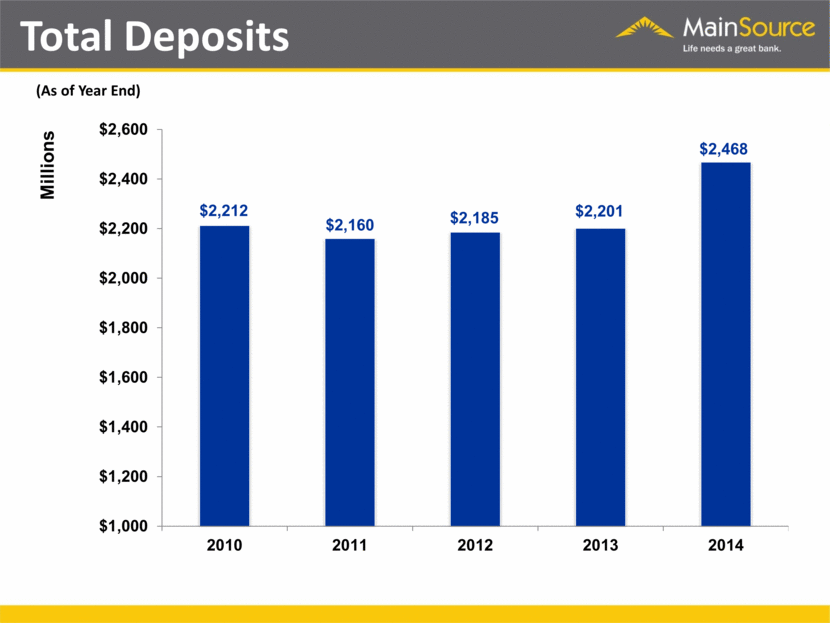
Total Deposits (As of Year End) $2,212 $2,160 $2,185 $2,201 $2,468 $1,000 $1,200 $1,400 $1,600 $1,800 $2,000 $2,200 $2,400 $2,600 2010 2011 2012 2013 2014 Millions |
|
|
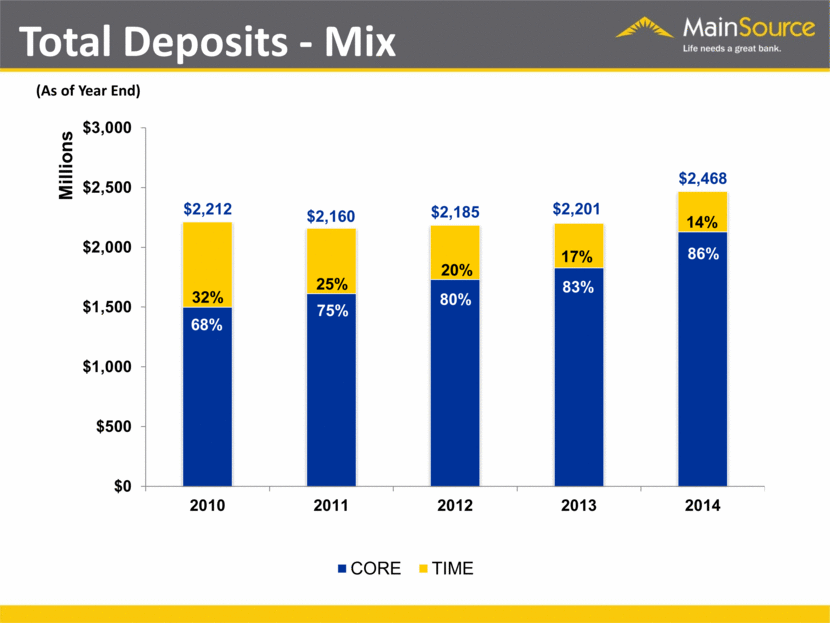
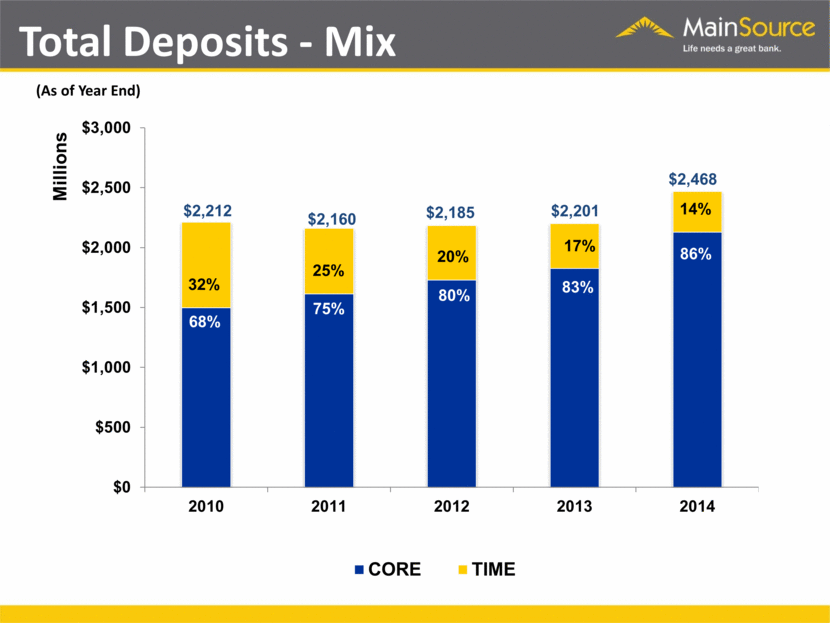
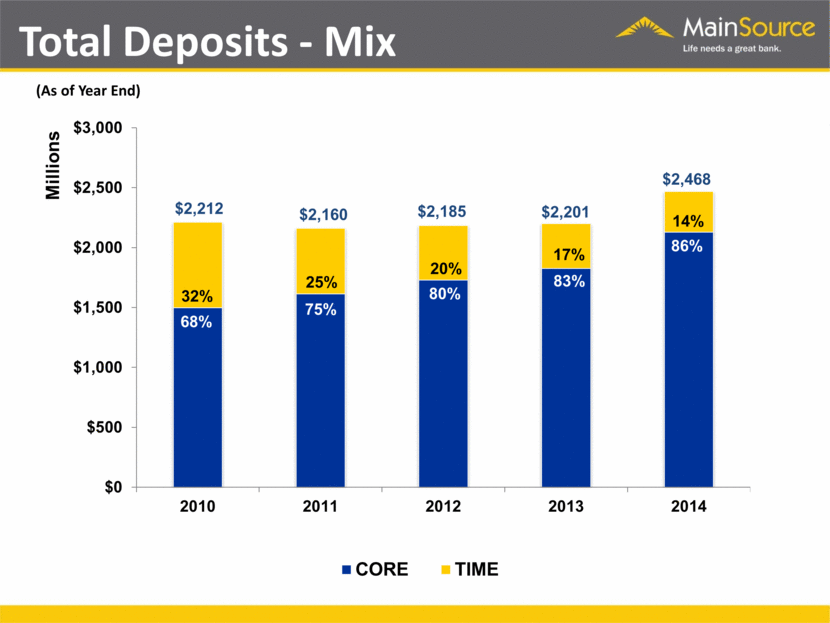
Total Deposits - Mix (As of Year End) 32% 25% 20% 17% $2,212 $2,160 $2,185 $2,201 $2,468 $0 $500 $1,000 $1,500 $2,000 $2,500 $3,000 2010 2011 2012 2013 2014 Millions CORE TIME 68% 75% 80% 83% 86% 14% |
|
|
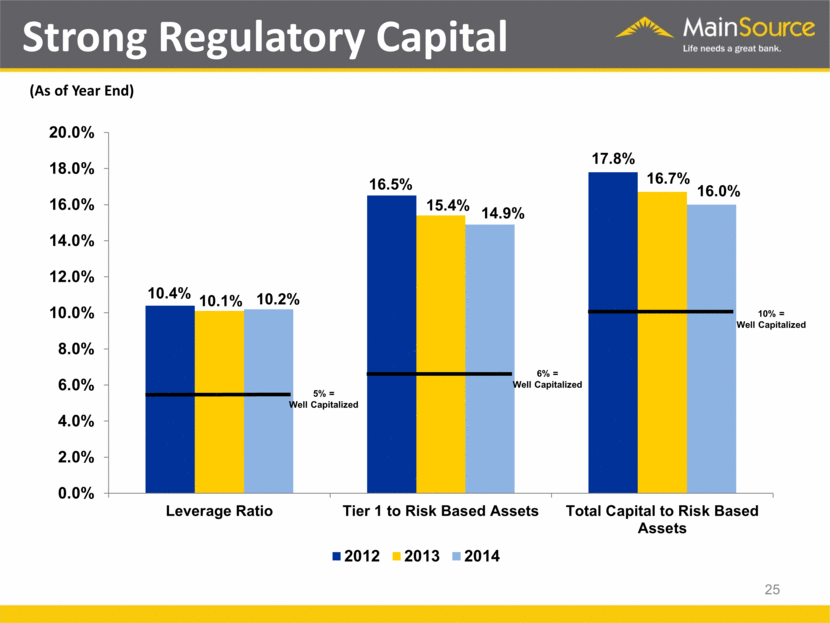
5% = Well Capitalized 6% = Well Capitalized 10% = Well Capitalized Strong Regulatory Capital 25 (As of Year End) 10.4% 16.5% 17.8% 10.1% 15.4% 16.7% 10.2% 14.9% 16.0% 0.0% 2.0% 4.0% 6.0% 8.0% 10.0% 12.0% 14.0% 16.0% 18.0% 20.0% Leverage Ratio Tier 1 to Risk Based Assets Total Capital to Risk Based Assets 2012 2013 2014 |
|
|
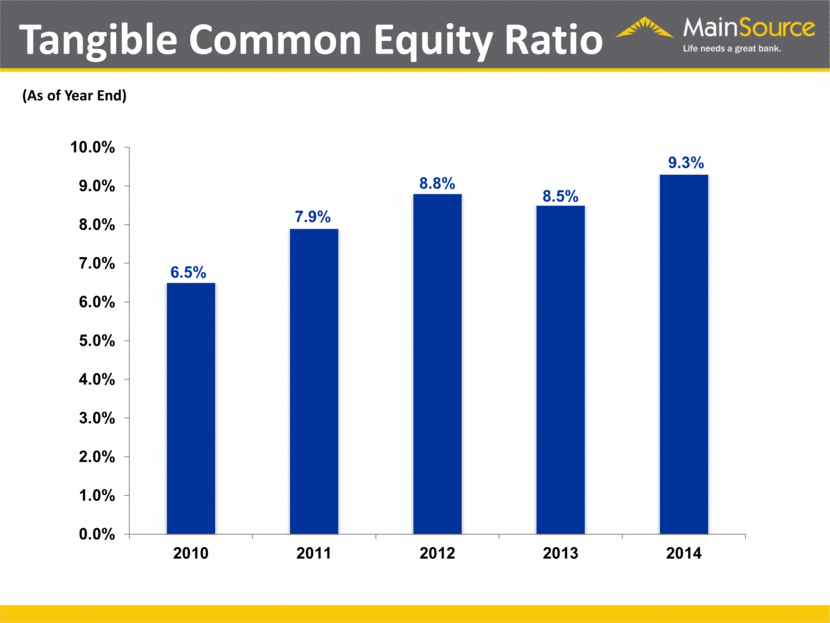
Tangible Common Equity Ratio (As of Year End) |
|
|
2014 Operating Results |
|
|
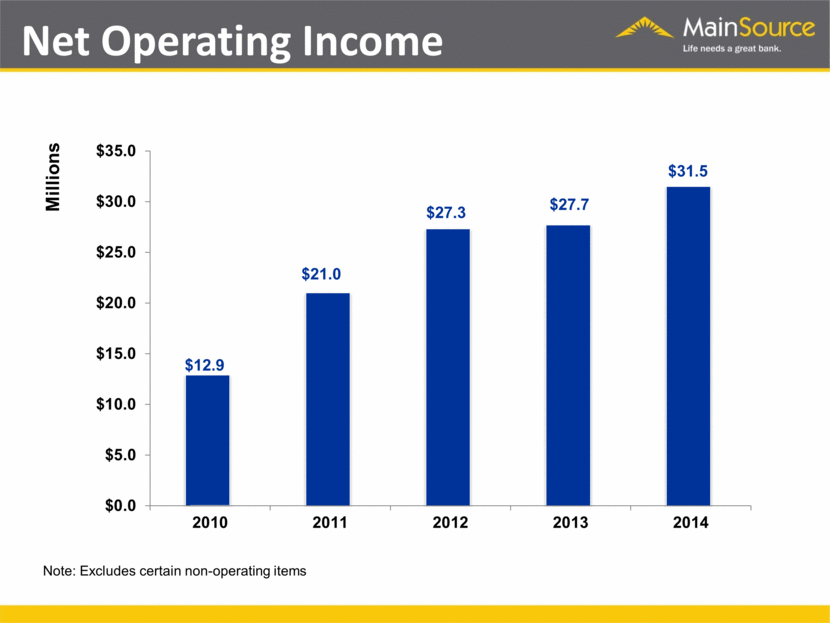
Net Operating Income Note: Excludes certain non-operating items $31.5 $12.9 $21.0 $27.3 $27.7 $0.0 $5.0 $10.0 $15.0 $20.0 $25.0 $30.0 $35.0 2010 2011 2012 2013 2014 Millions |
|
|
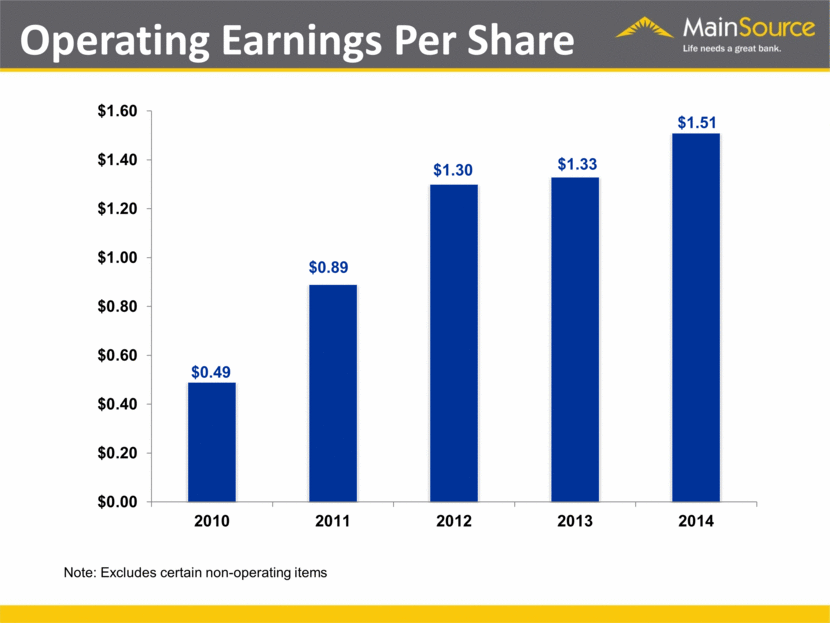
Operating Earnings Per Share Note: Excludes certain non-operating items |
|
|
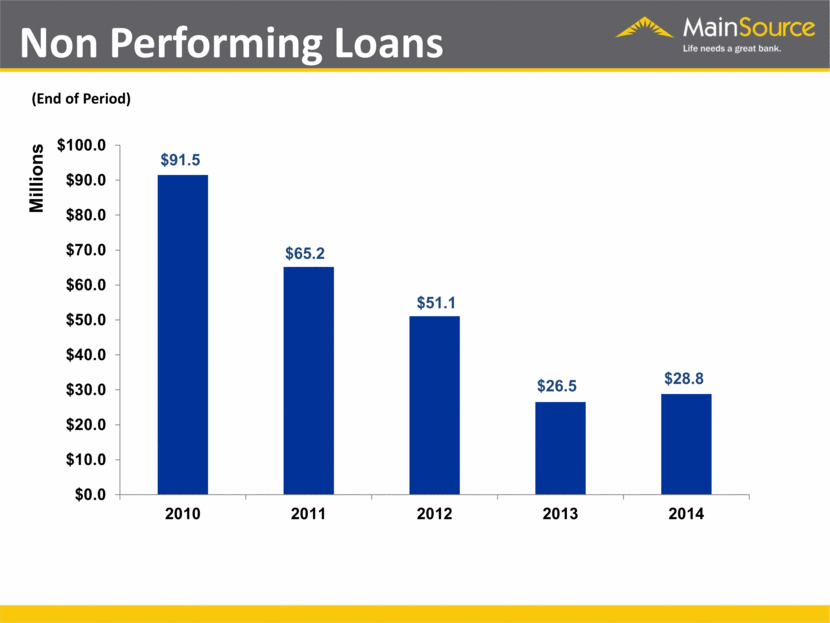
Non Performing Loans Millions (End of Period) |
|
|
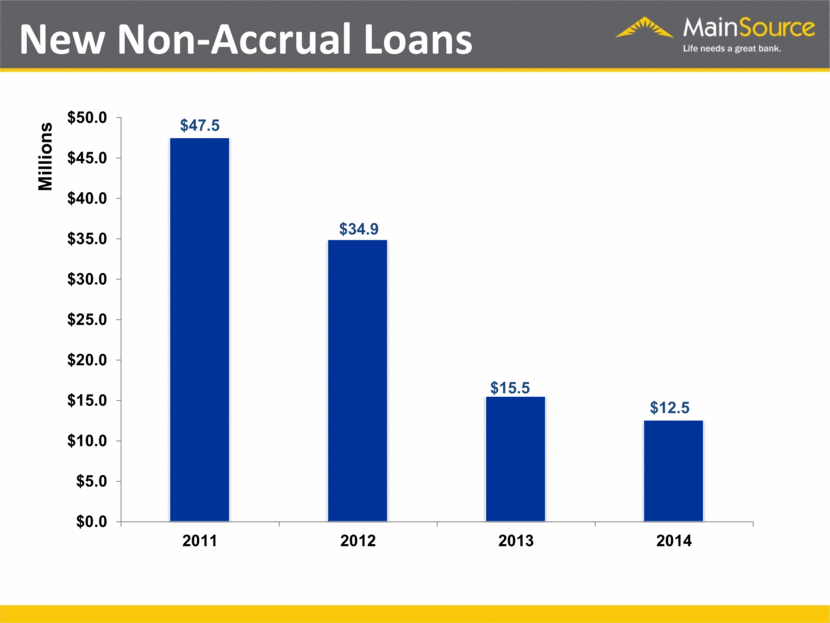
New Non-Accrual Loans |
|
|
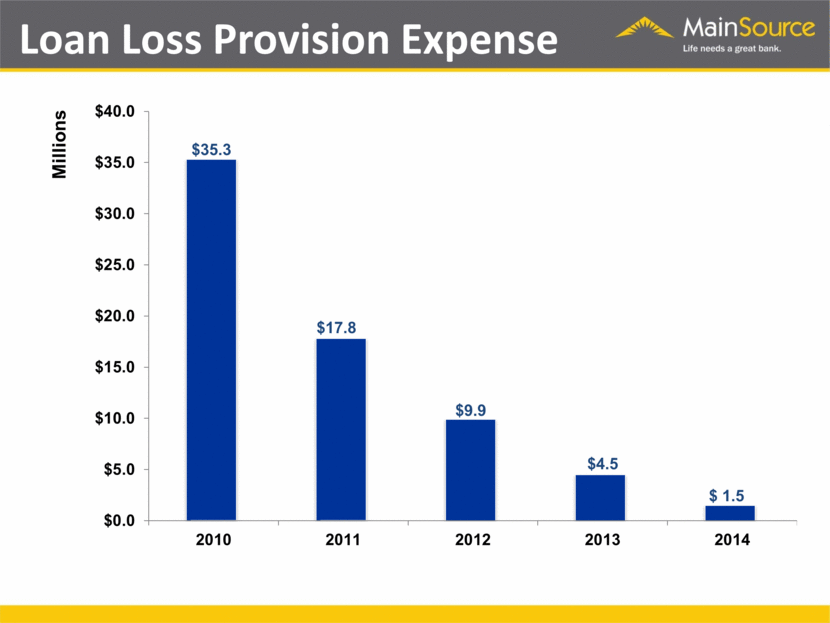
Loan Loss Provision Expense |
|
|
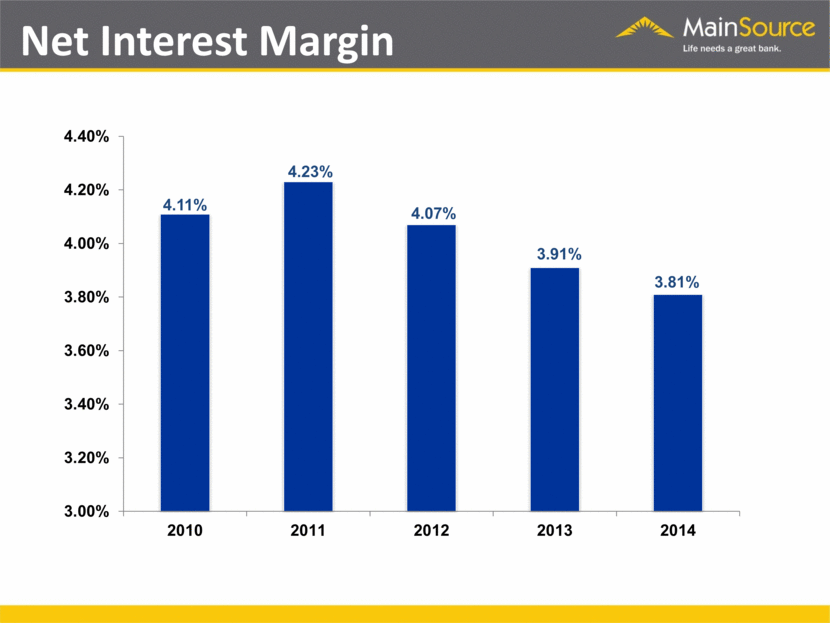
Net Interest Margin |
|
|
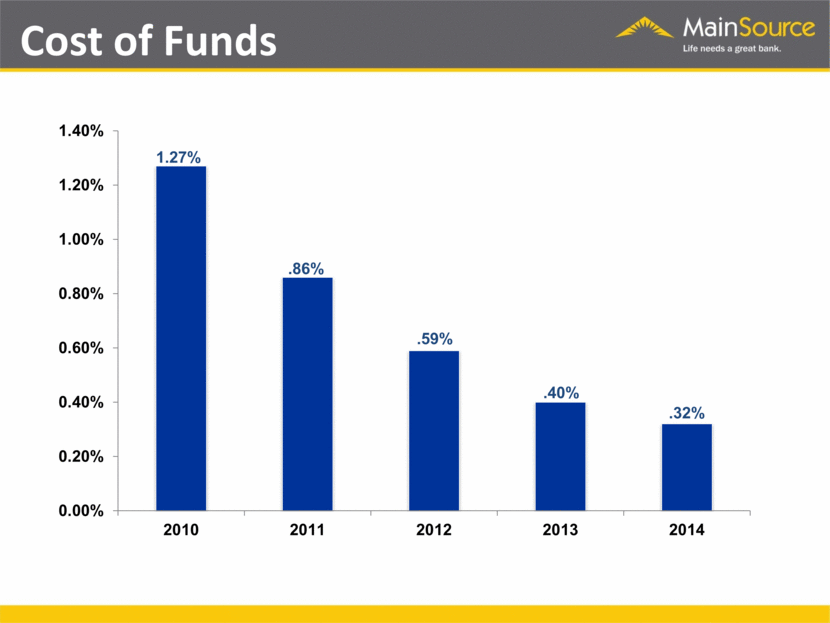
Cost of Funds |
|
|
Total Deposits - Mix (As of Year End) 14% 32% 25% 20% 17% $2,468 $2,212 $2,160 $2,185 $2,201 $0 $500 $1,000 $1,500 $2,000 $2,500 $3,000 2010 2011 2012 2013 2014 Millions CORE TIME 86% 68% 75% 80% 83% |
|
|
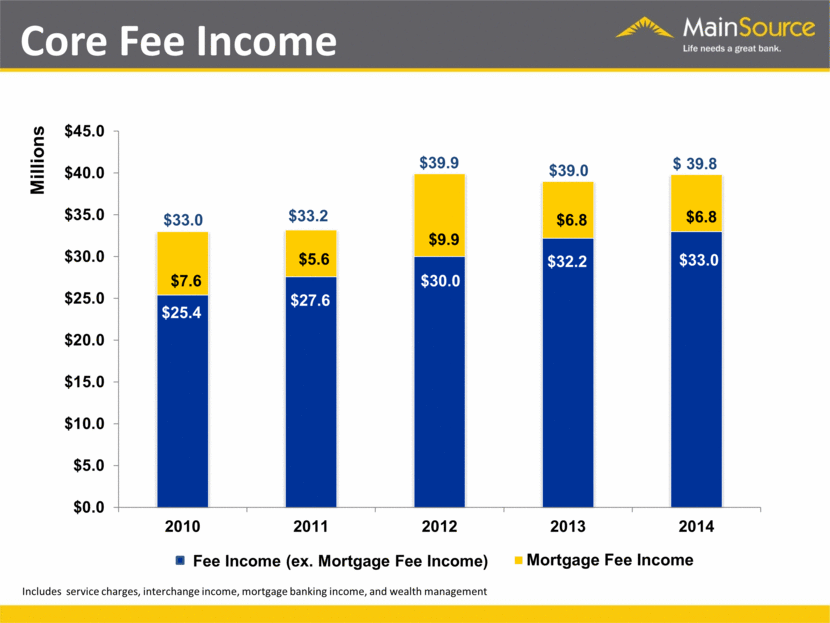
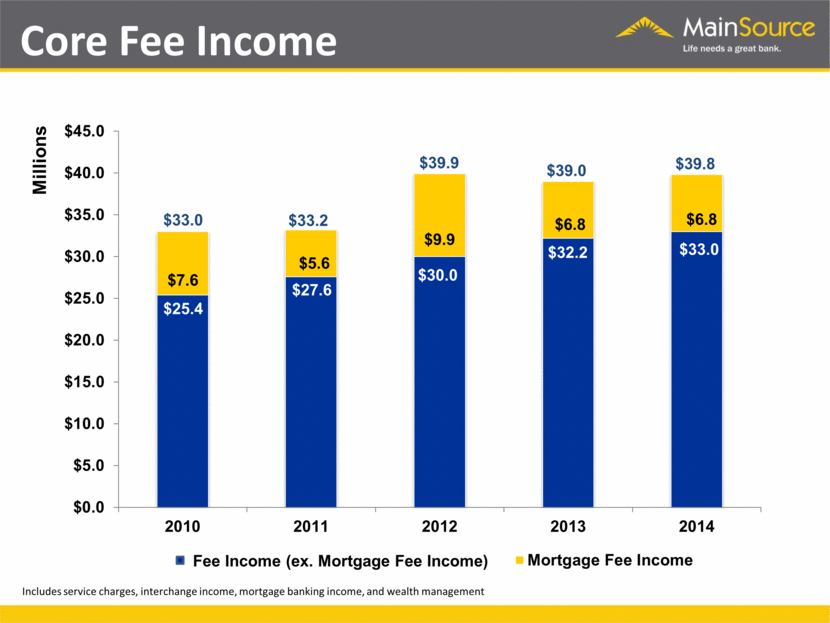
Core Fee Income Includes service charges, interchange income, mortgage banking income, and wealth management $7.6 $9.9 $6.8 $27.6 $30.0 $32.2 |
|
|
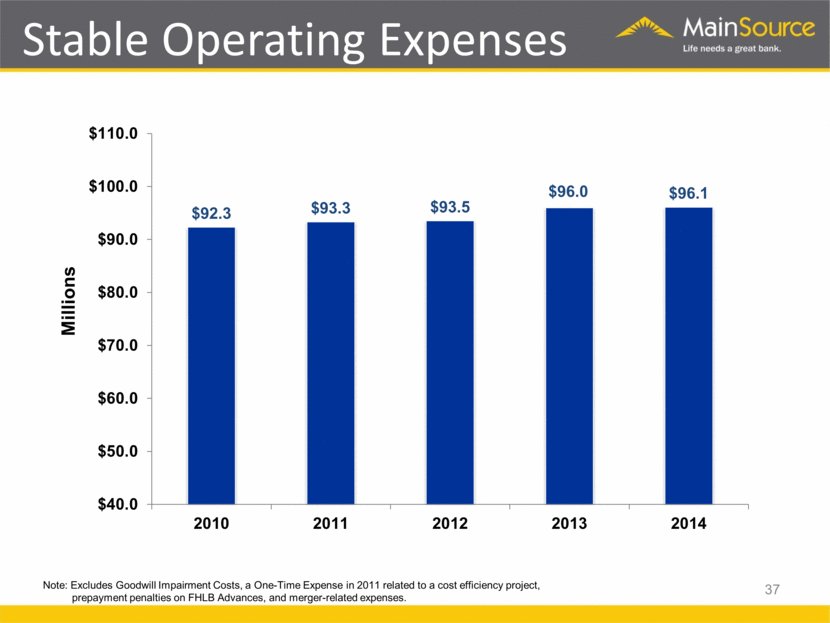
Stable Operating Expenses Millions 37 Note: Excludes Goodwill Impairment Costs, a One-Time Expense in 2011 related to a cost efficiency project, prepayment penalties on FHLB Advances, and merger-related expenses. |
|
|
MainSource Financial Group NASDAQ Stock Symbol MSFG |
|
|
2014 Stock Performance |
|
|
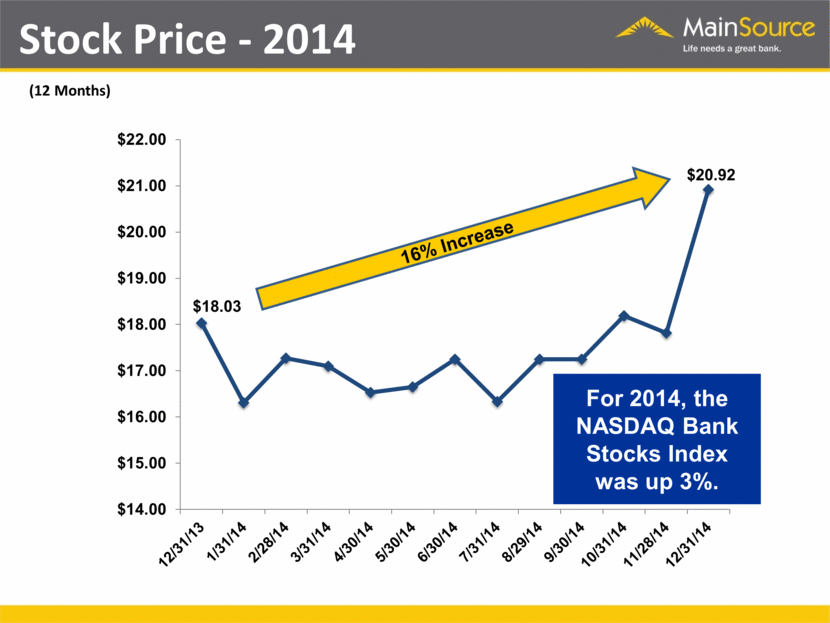
Stock Price - 2014 16% Increase For 2014, the NASDAQ Bank Stocks Index was up 3%. (12 Months) |
|
|
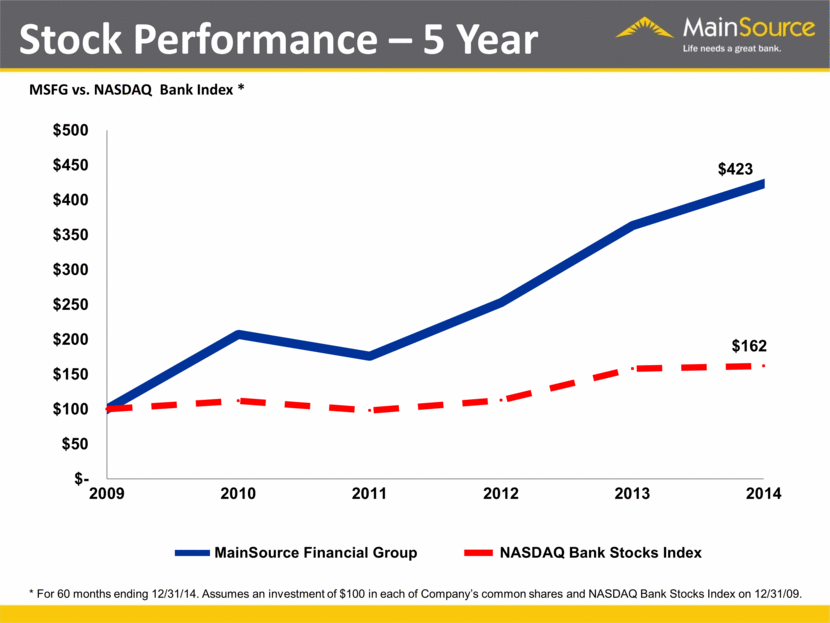
Stock Performance – 5 Year MSFG vs. NASDAQ Bank Index * * For 60 months ending 12/31/14. Assumes an investment of $100 in each of Company’s common shares and NASDAQ Bank Stocks Index on 12/31/09. |
|
|
First Quarter 2015 |
|
|
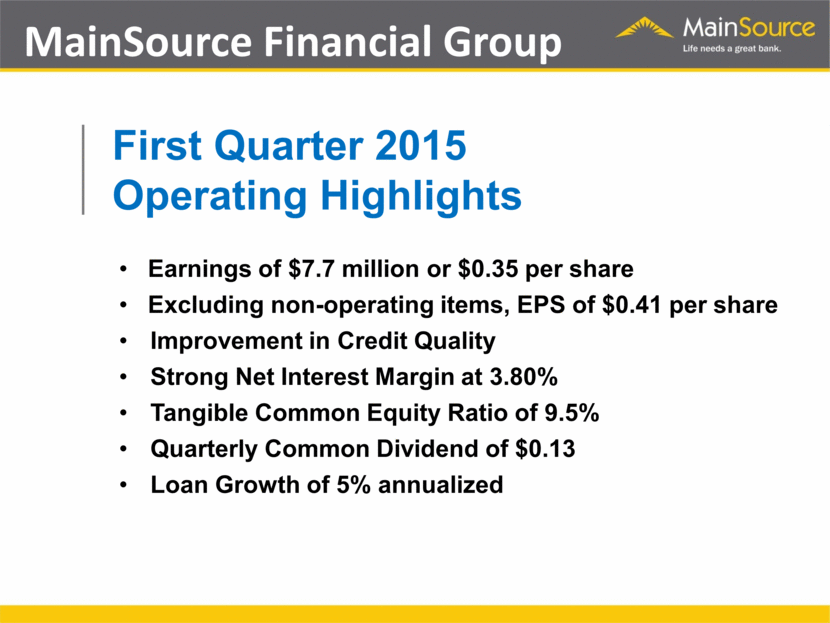
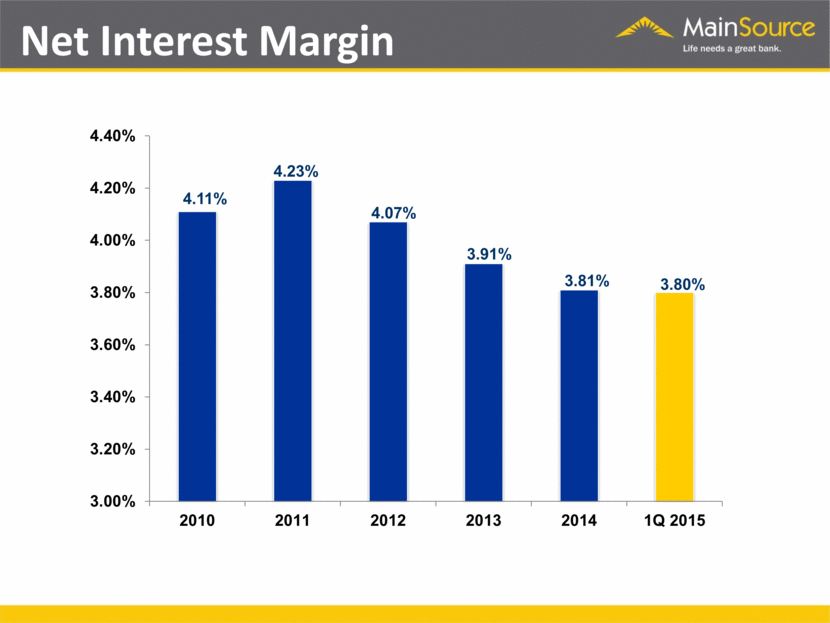
MainSource Financial Group First Quarter 2015 Operating Highlights Earnings of $7.7 million or $0.35 per share Excluding non-operating items, EPS of $0.41 per share Improvement in Credit Quality Strong Net Interest Margin at 3.80% Tangible Common Equity Ratio of 9.5% Quarterly Common Dividend of $0.13 Loan Growth of 5% annualized |
|
|
2015 Outlook Archie M. Brown, Jr. |
|
|
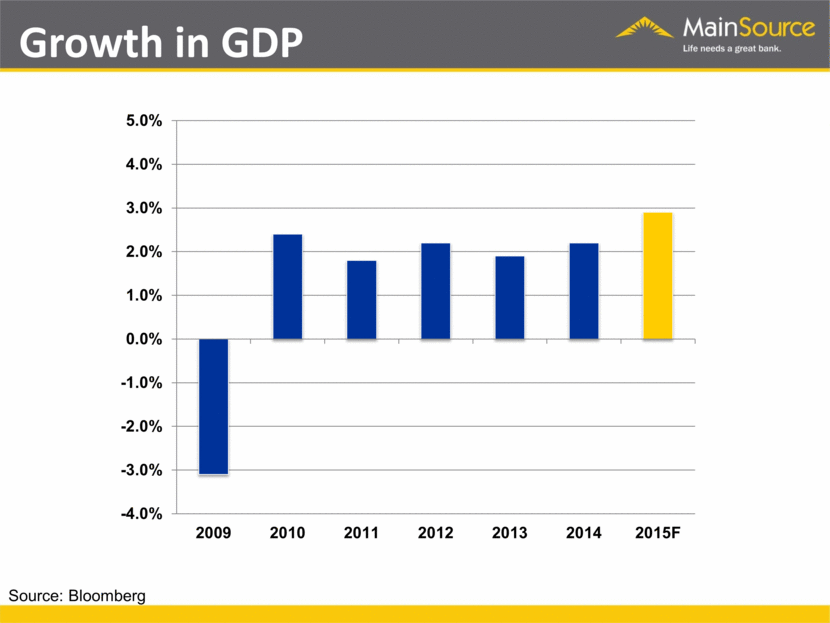
Growth in GDP Source: Bloomberg |
|
|
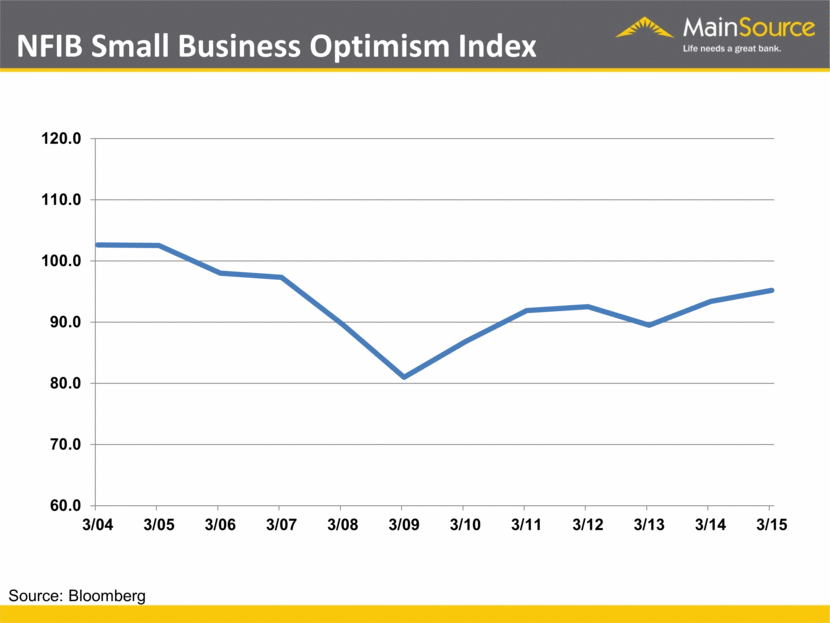
NFIB Small Business Optimism Index Source: Bloomberg |
|
|
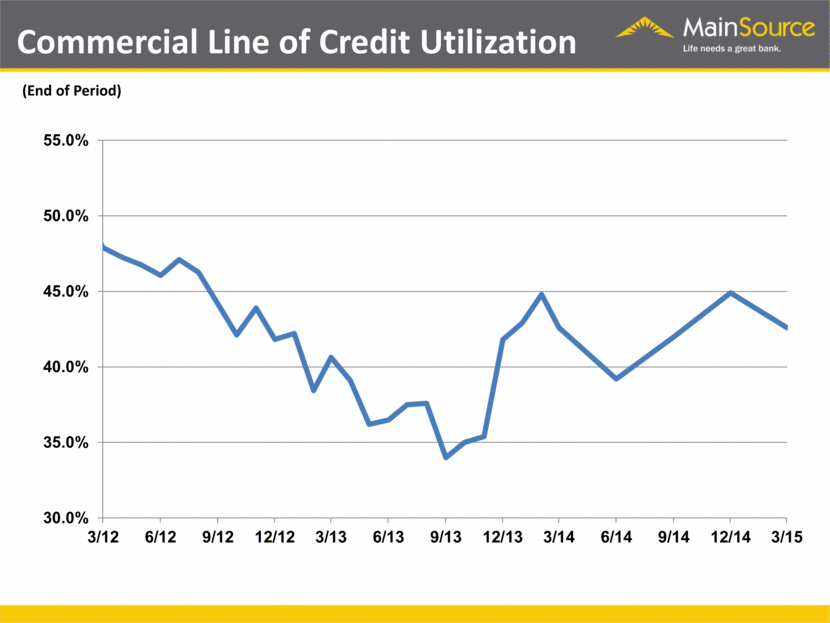
Commercial Line of Credit Utilization (End of Period) |
|
|
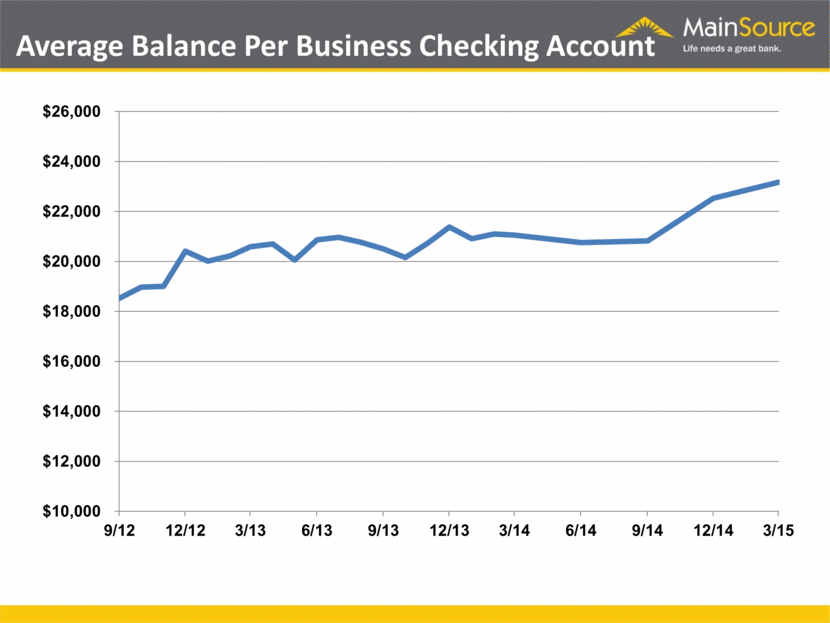
Average Balance Per Business Checking Account $10,000 $12,000 $14,000 $16,000 $18,000 $20,000 $22,000 $24,000 $26,000 9/12 12/12 3/13 6/13 9/13 12/13 3/14 6/14 9/14 12/14 3/15 |
|
|
Net Interest Margin |
|
|
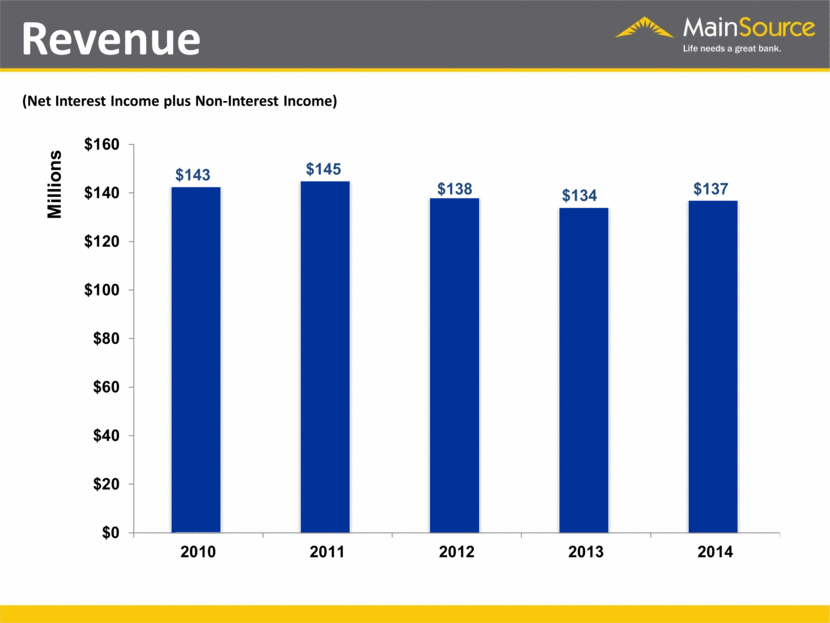
Revenue (Net Interest Income plus Non-Interest Income) |
|
|
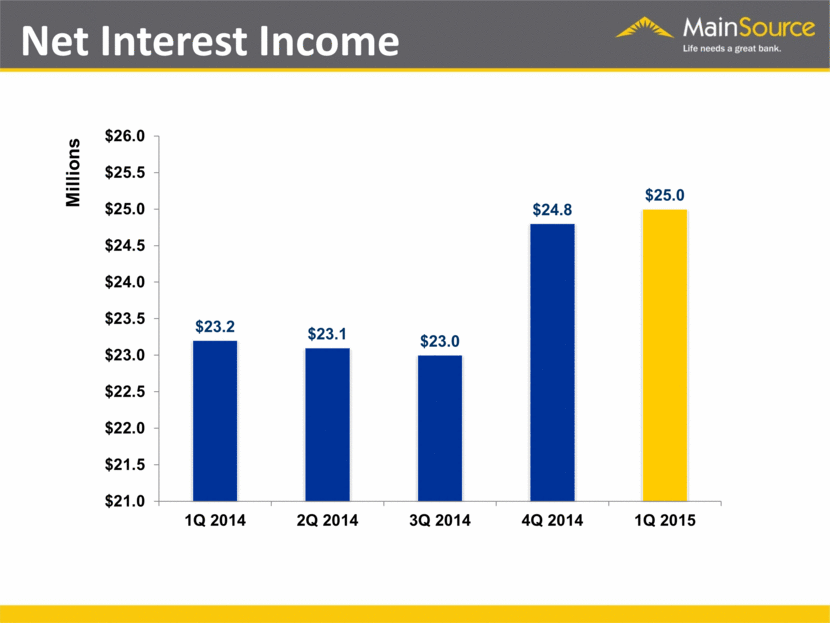
Net Interest Income |
|
|
Total Deposits - Mix (As of Year End) 14% 32% 25% 20% 17% $2,468 $2,212 $2,160 $2,185 $2,201 $0 $500 $1,000 $1,500 $2,000 $2,500 $3,000 2010 2011 2012 2013 2014 Millions CORE TIME 86% 68% 75% 80% 83% |
|
|
Total Loans (End of Period) $ 1,681 $1,534 $1,553 $ 1,672 $ 1,958 $ 1,981 $500 $700 $900 $1,100 $1,300 $1,500 $1,700 $1,900 $2,100 2010 2011 2012 2013 2014 1Q 2015 Millions |
|
|
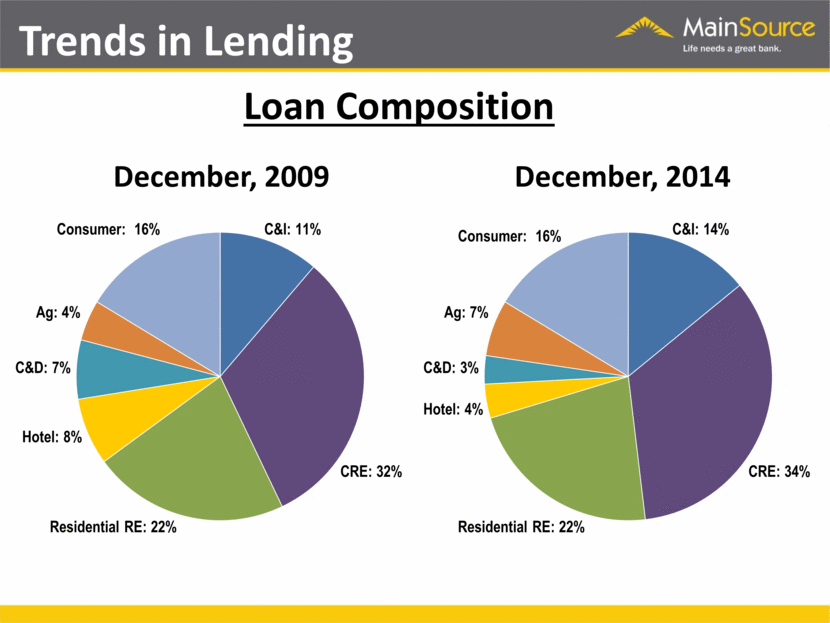
Trends in Lending Loan Composition December, 2009 December, 2014 C&I: 11% CRE: 32% Residential RE: 22% Hotel: 8% C&D: 7% Ag: 4% Consumer: 16% C&I: 14% CRE: 34% Residential RE: 22% Hotel: 4% C&D: 3% Ag: 7% Consumer: 16% |
|
|
Core Fee Income Includes service charges, interchange income, mortgage banking income, and wealth management $7.6 $9.9 $6.8 $27.6 $30.0 $32.2 |
|
|
Strategy for Growth |
|
|
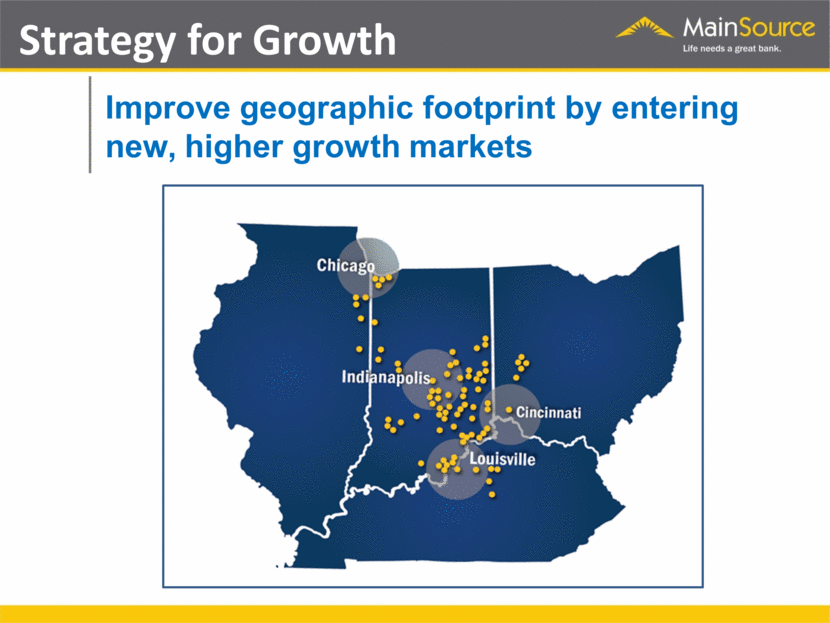
Improve geographic footprint by entering new, higher growth markets Strategy for Growth |
|
|
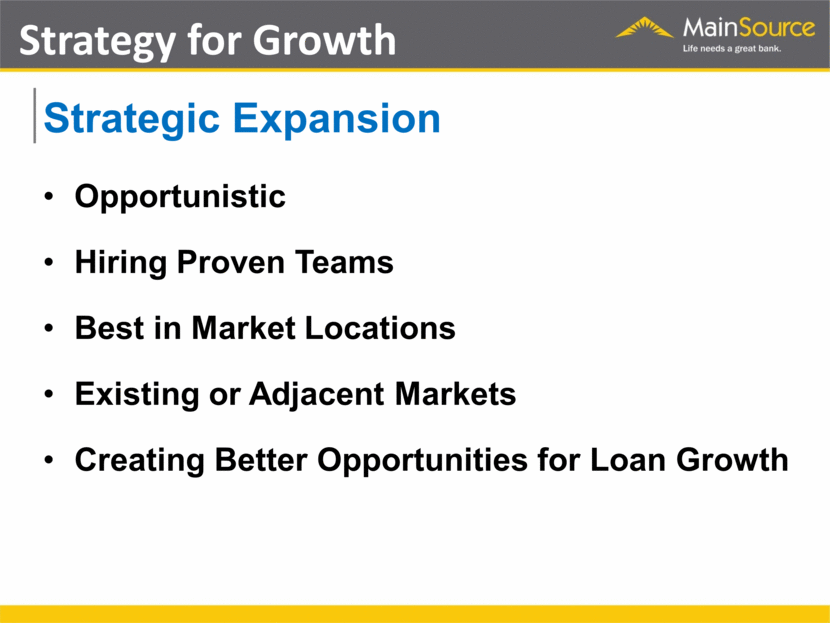
Strategic Expansion Strategy for Growth Opportunistic Hiring Proven Teams Best in Market Locations Existing or Adjacent Markets Creating Better Opportunities for Loan Growth |
|
|
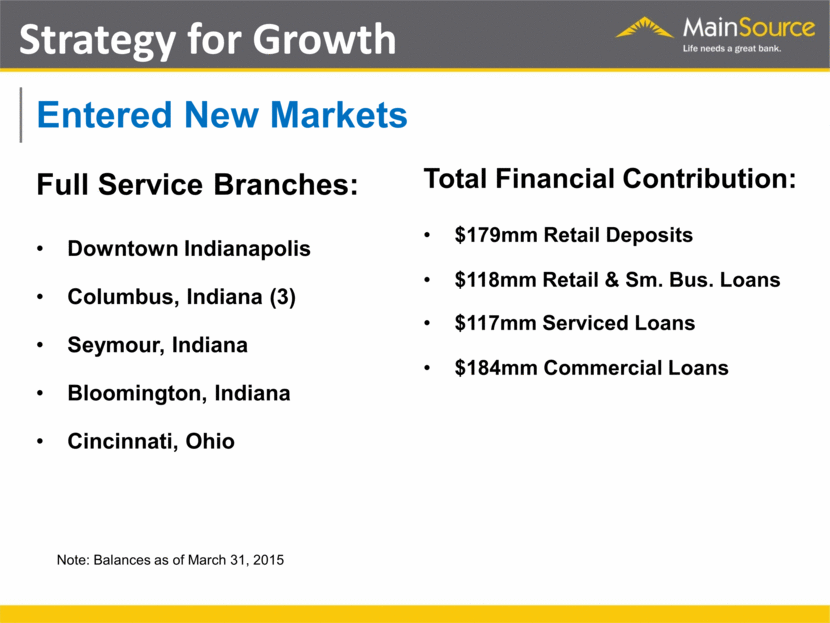
Entered New Markets Full Service Branches: Downtown Indianapolis Columbus, Indiana (3) Seymour, Indiana Bloomington, Indiana Cincinnati, Ohio Strategy for Growth Total Financial Contribution: $179mm Retail Deposits $118mm Retail & Sm. Bus. Loans $117mm Serviced Loans $184mm Commercial Loans Note: Balances as of March 31, 2015 |
|
|
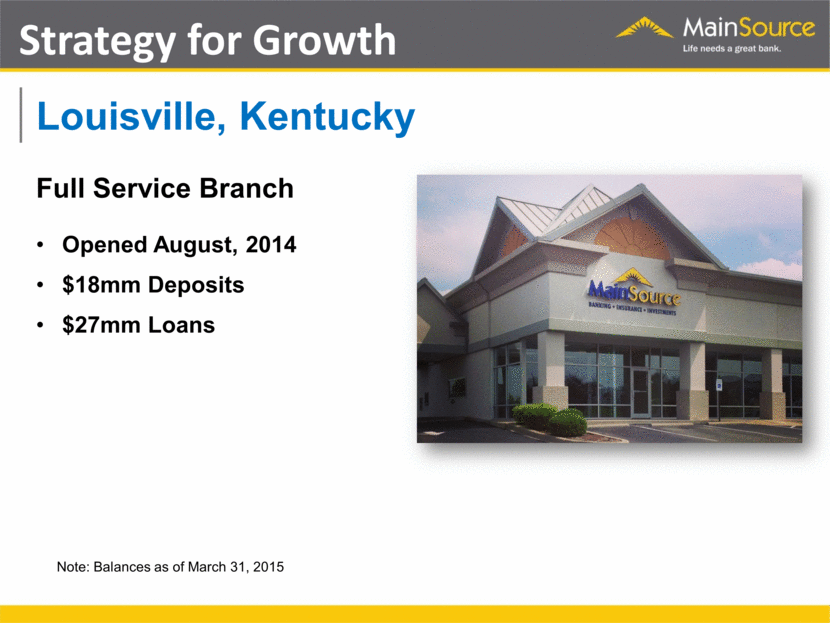
Louisville, Kentucky Full Service Branch Opened August, 2014 $18mm Deposits $27mm Loans Strategy for Growth Note: Balances as of March 31, 2015 |
|
|
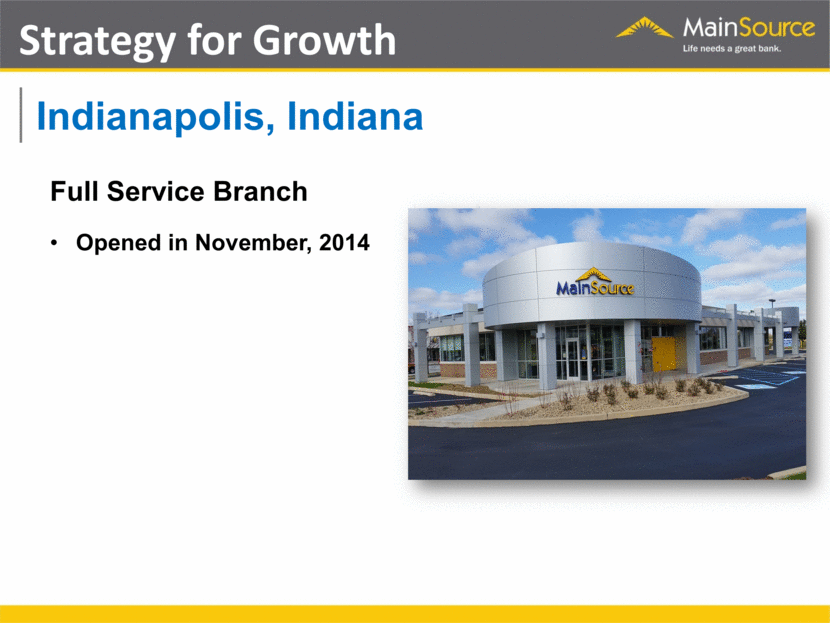
Indianapolis, Indiana Strategy for Growth Full Service Branch Opened in November, 2014 |
|
|
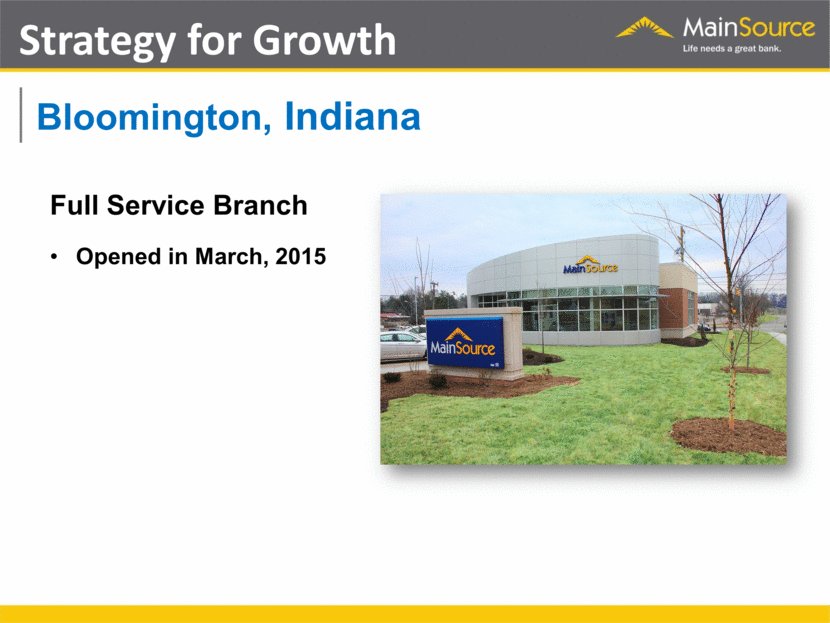
Bloomington, Indiana Strategy for Growth Full Service Branch Opened in March, 2015 |
|
|
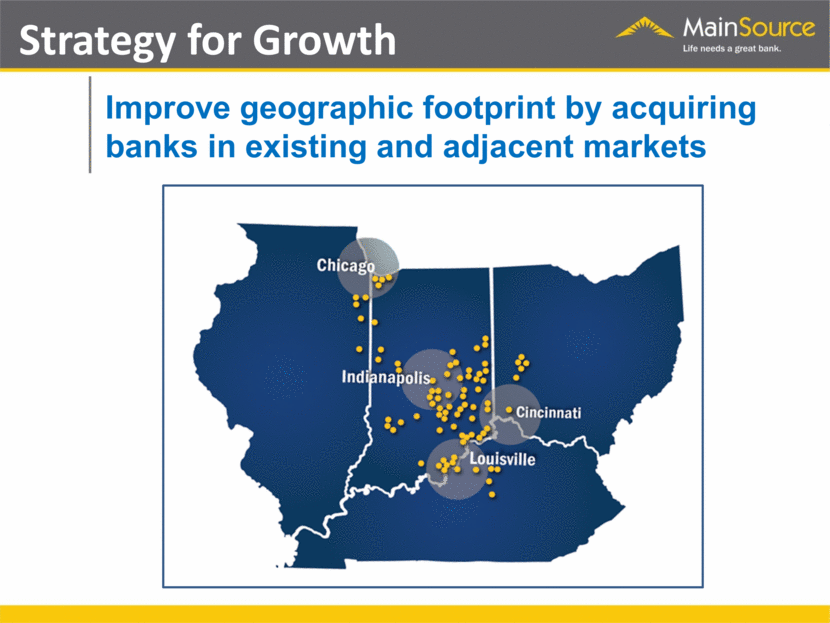
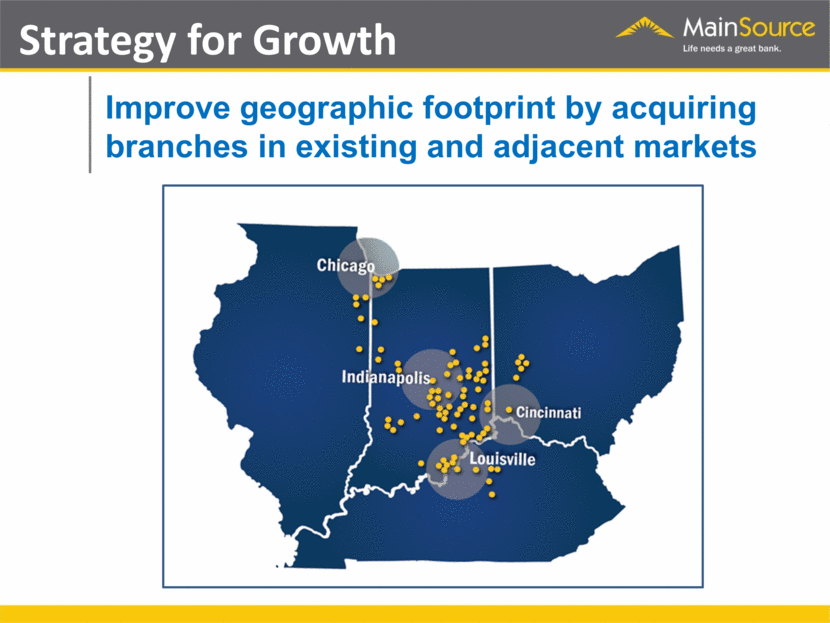
Improve geographic footprint by acquiring banks in existing and adjacent markets Strategy for Growth |
|
|
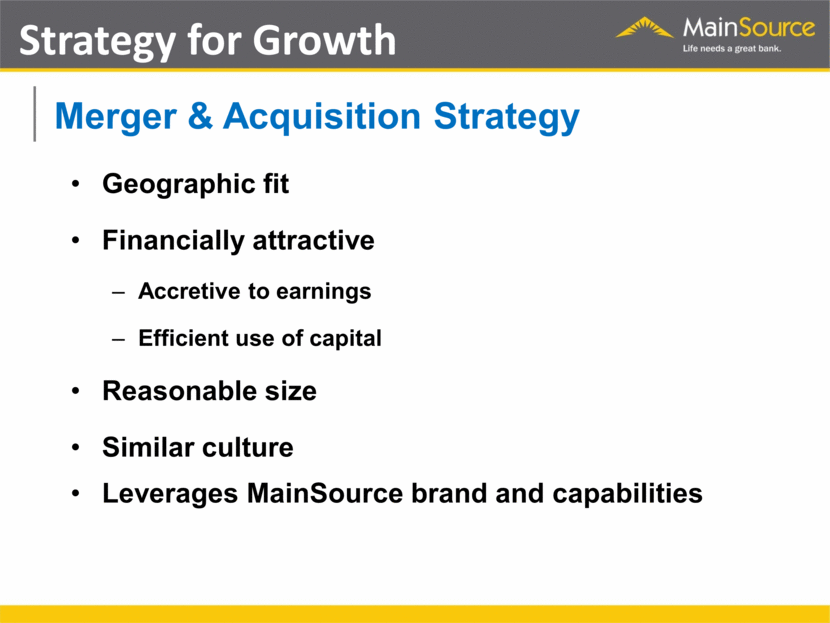
Merger & Acquisition Strategy Geographic fit Financially attractive Accretive to earnings Efficient use of capital Reasonable size Similar culture Leverages MainSource brand and capabilities Strategy for Growth |
|
|
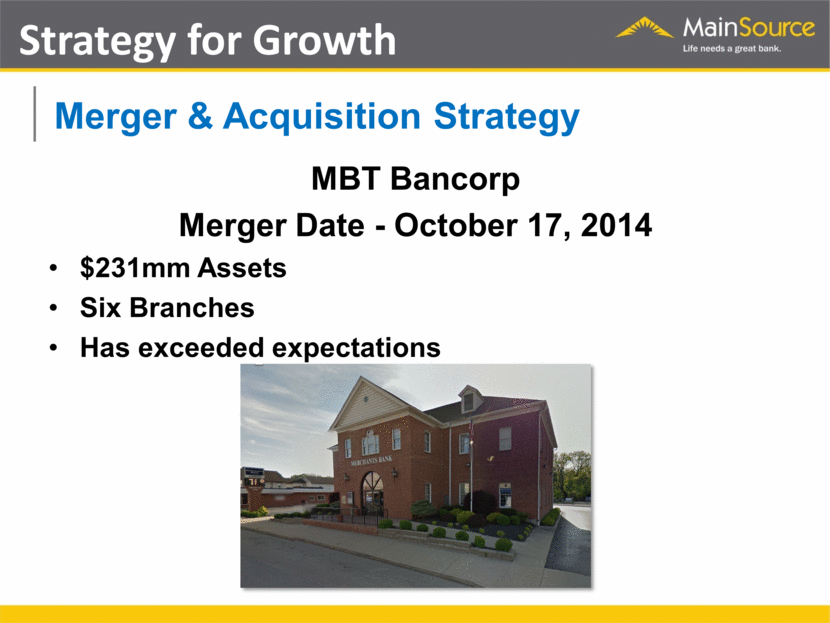
Merger & Acquisition Strategy MBT Bancorp Merger Date - October 17, 2014 $231mm Assets Six Branches Has exceeded expectations Strategy for Growth |
|
|
Improve geographic footprint by acquiring branches in existing and adjacent markets Strategy for Growth |
|
|
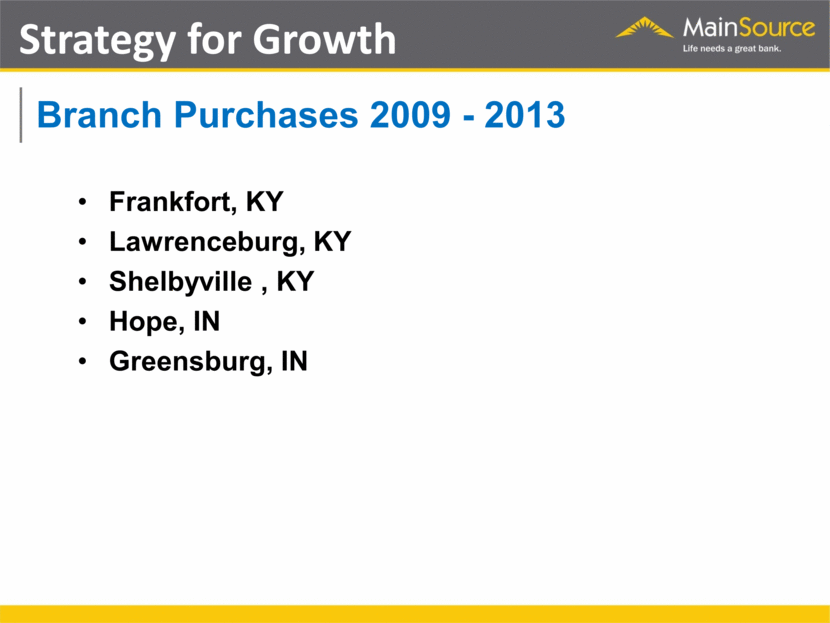
Branch Purchases 2009 - 2013 Frankfort, KY Lawrenceburg, KY Shelbyville , KY Hope, IN Greensburg, IN Strategy for Growth |
|
|
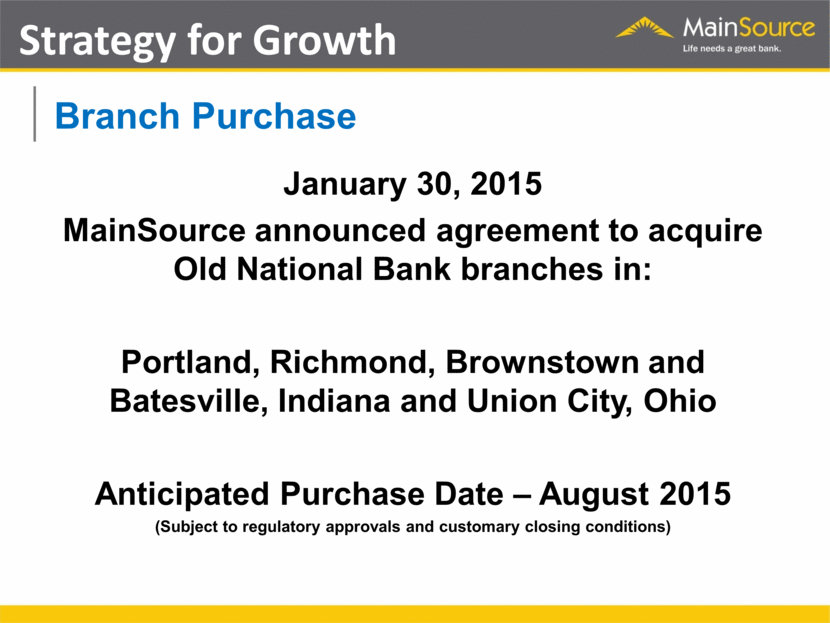
Branch Purchase January 30, 2015 MainSource announced agreement to acquire Old National Bank branches in: Portland, Richmond, Brownstown and Batesville, Indiana and Union City, Ohio Anticipated Purchase Date – August 2015 (Subject to regulatory approvals and customary closing conditions) Strategy for Growth |
|
|
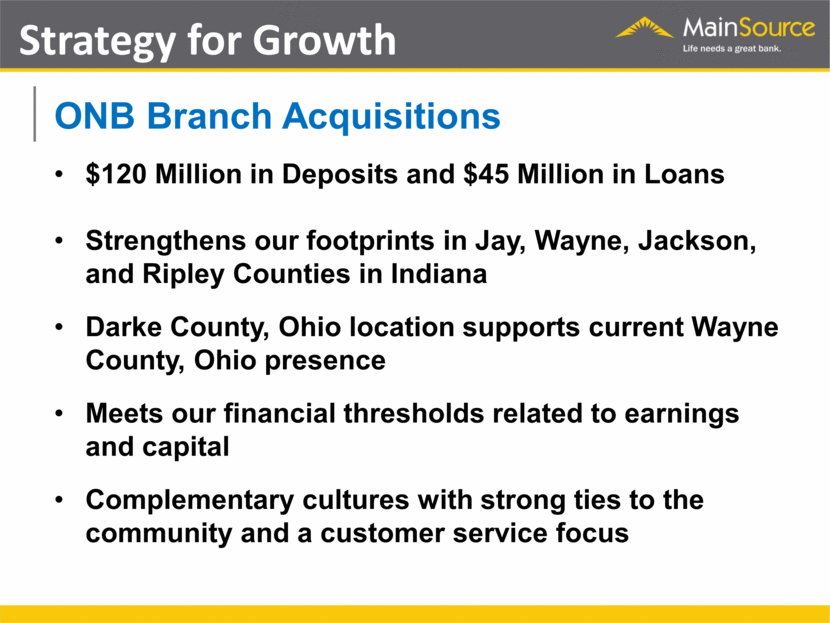
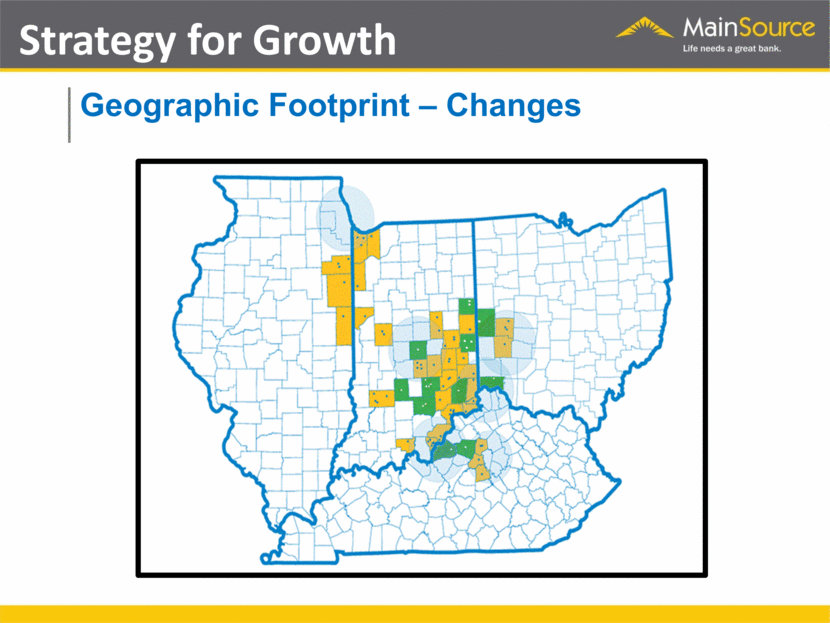
ONB Branch Acquisitions $120 Million in Deposits and $45 Million in Loans Strengthens our footprints in Jay, Wayne, Jackson, and Ripley Counties in Indiana Darke County, Ohio location supports current Wayne County, Ohio presence Meets our financial thresholds related to earnings and capital Complementary cultures with strong ties to the community and a customer service focus Strategy for Growth |
|
|
Geographic Footprint – Changes Strategy for Growth |
|
|
Expenses |
|
|
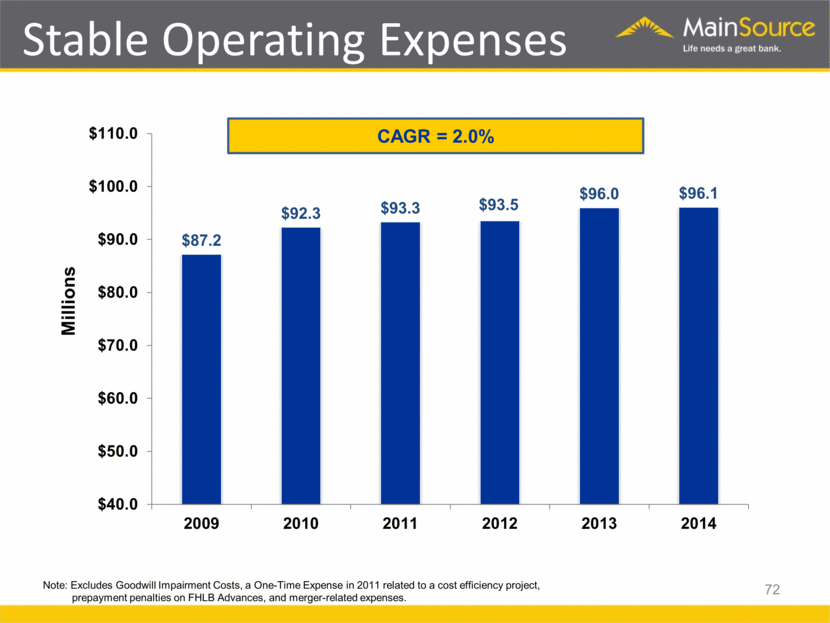
Stable Operating Expenses Millions 72 CAGR = 2.0% Note: Excludes Goodwill Impairment Costs, a One-Time Expense in 2011 related to a cost efficiency project, prepayment penalties on FHLB Advances, and merger-related expenses. |
|
|
Credit Quality |
|
|
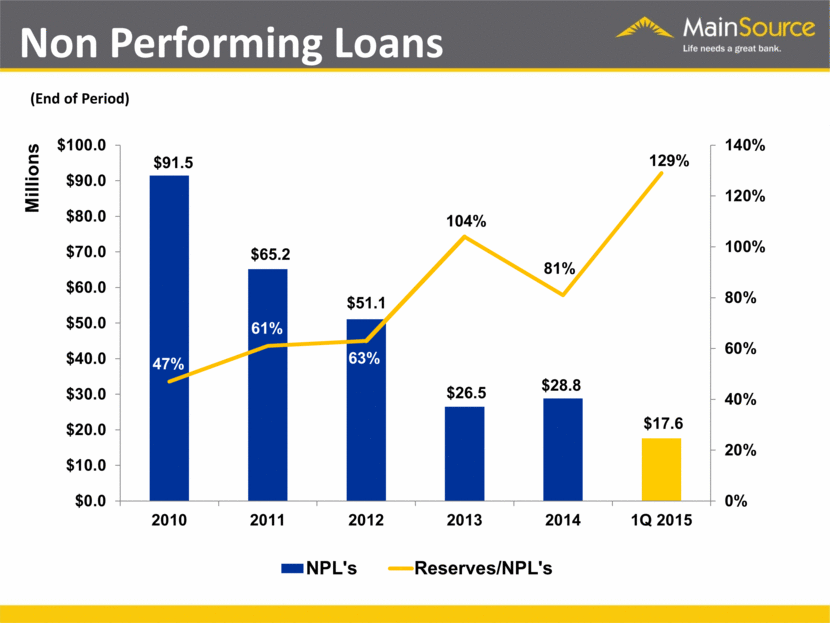
Non Performing Loans Millions (End of Period) |
|
|
Capital |
|
|
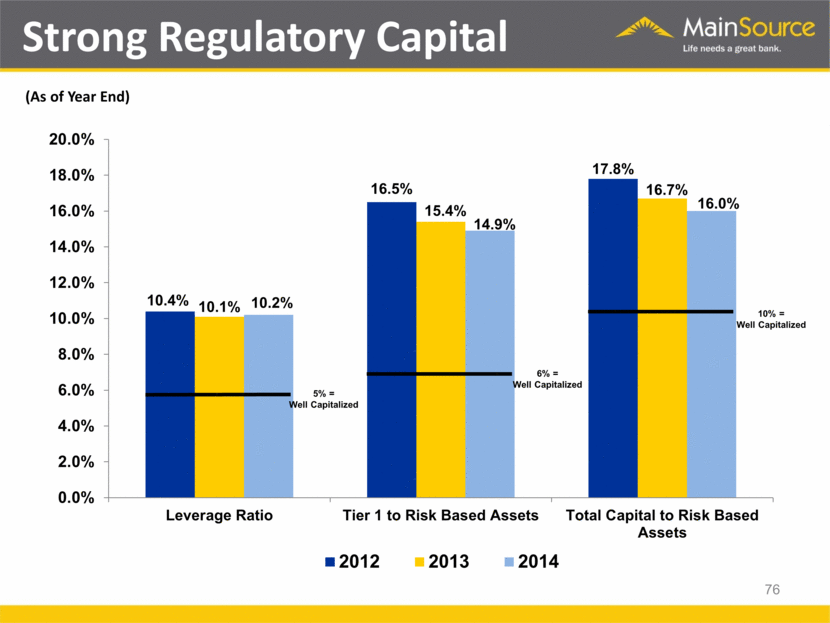
5% = Well Capitalized 6% = Well Capitalized 10% = Well Capitalized Strong Regulatory Capital 76 (As of Year End) 10.4% 16.5% 17.8% 10.1% 15.4% 16.7% 10.2% 14.9% 16.0% 0.0% 2.0% 4.0% 6.0% 8.0% 10.0% 12.0% 14.0% 16.0% 18.0% 20.0% Leverage Ratio Tier 1 to Risk Based Assets Total Capital to Risk Based Assets 2012 2013 2014 |
|
|
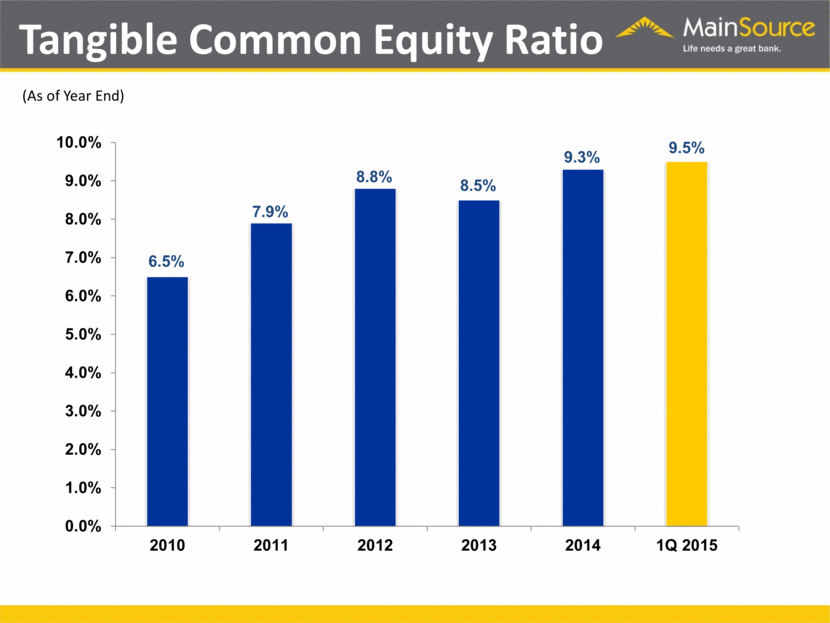
Tangible Common Equity Ratio (As of Year End) |
|
|
Common Dividend |
|
|
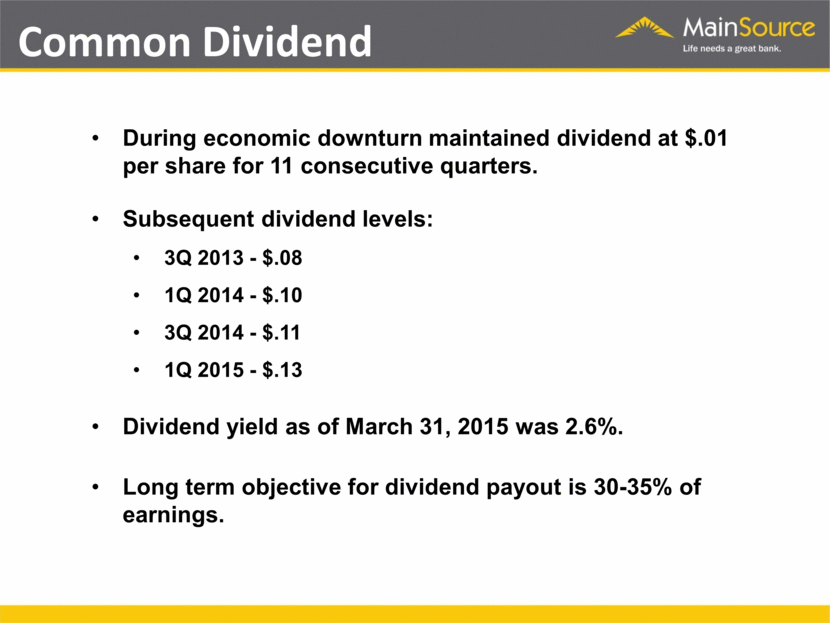
Common Dividend (As of 4.14.11) During economic downturn maintained dividend at $.01 per share for 11 consecutive quarters. Subsequent dividend levels: 3Q 2013 - $.08 1Q 2014 - $.10 3Q 2014 - $.11 1Q 2015 - $.13 Dividend yield as of March 31, 2015 was 2.6%. Long term objective for dividend payout is 30-35% of earnings. |
|
|
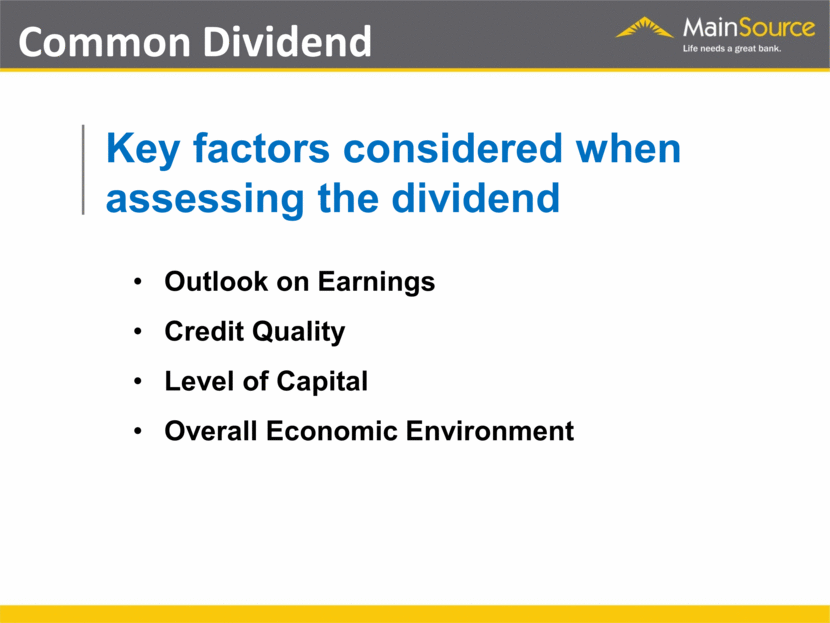
Key factors considered when assessing the dividend Outlook on Earnings Credit Quality Level of Capital Overall Economic Environment Common Dividend (As of 4.14.11) |
|
|
Stock Repurchase Program |
|
|
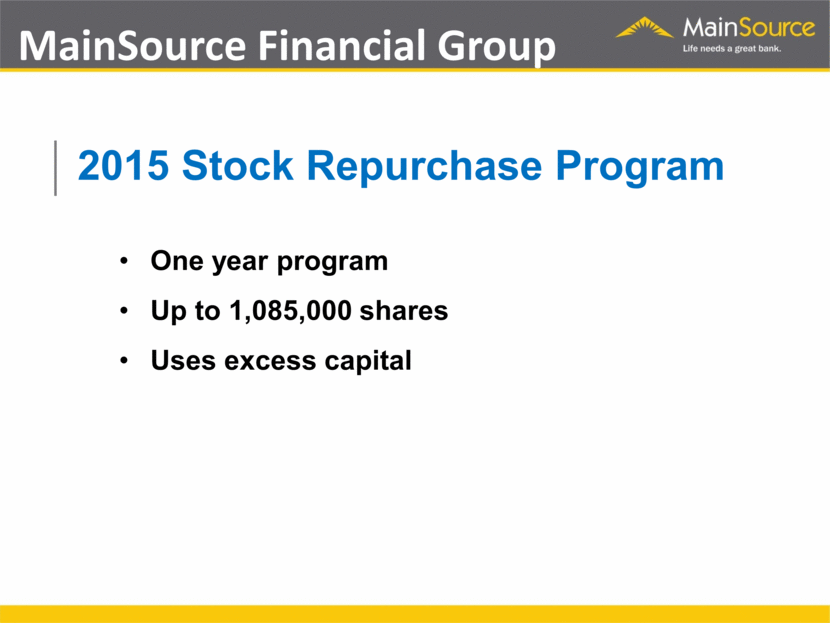
MainSource Financial Group (As of 4.14.11) 2015 Stock Repurchase Program One year program Up to 1,085,000 shares Uses excess capital |
|
|
2015 Strategic Priorities |
|
|
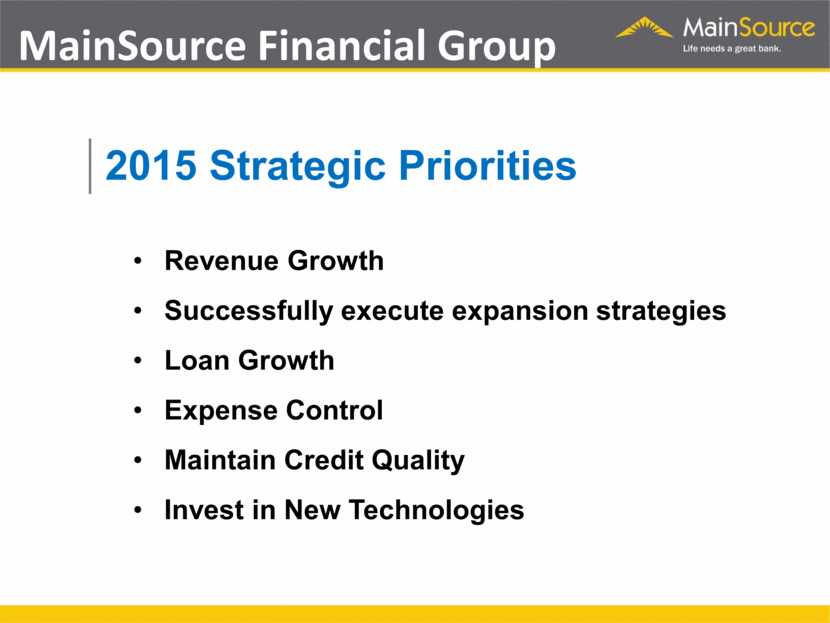
MainSource Financial Group (As of 4.14.11) 2015 Strategic Priorities Revenue Growth Successfully execute expansion strategies Loan Growth Expense Control Maintain Credit Quality Invest in New Technologies |
|
|
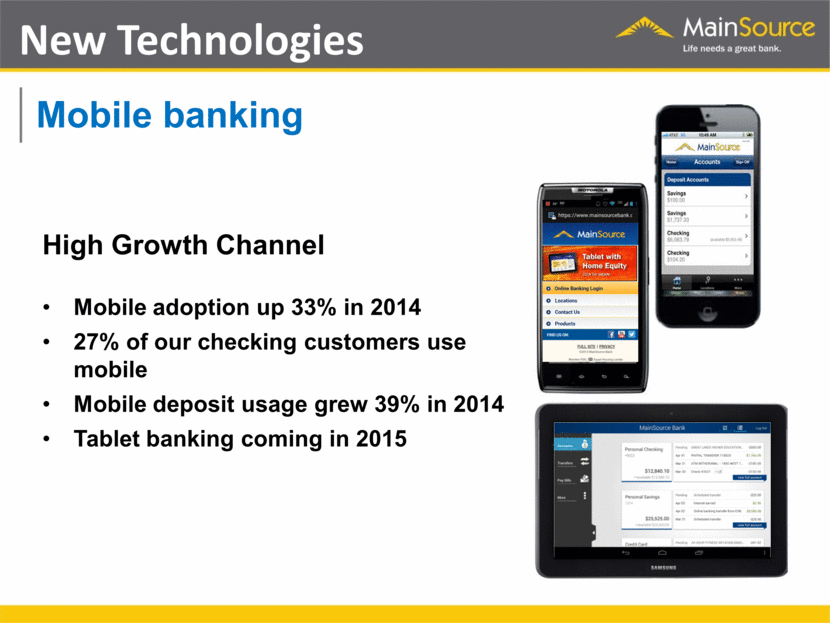
Mobile banking High Growth Channel Mobile adoption up 33% in 2014 27% of our checking customers use mobile Mobile deposit usage grew 39% in 2014 Tablet banking coming in 2015 New Technologies |
|
|
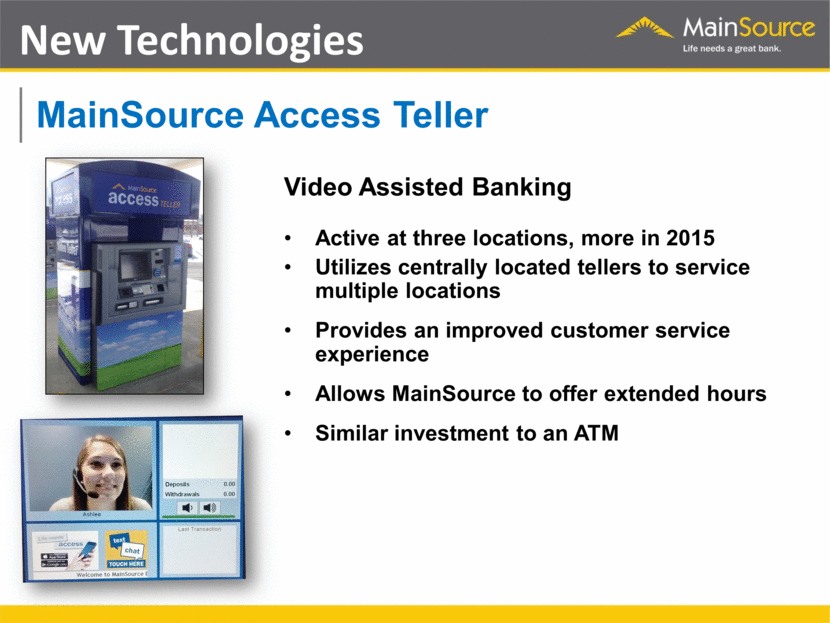
MainSource Access Teller Video Assisted Banking Active at three locations, more in 2015 Utilizes centrally located tellers to service multiple locations Provides an improved customer service experience Allows MainSource to offer extended hours Similar investment to an ATM New Technologies |
|
|
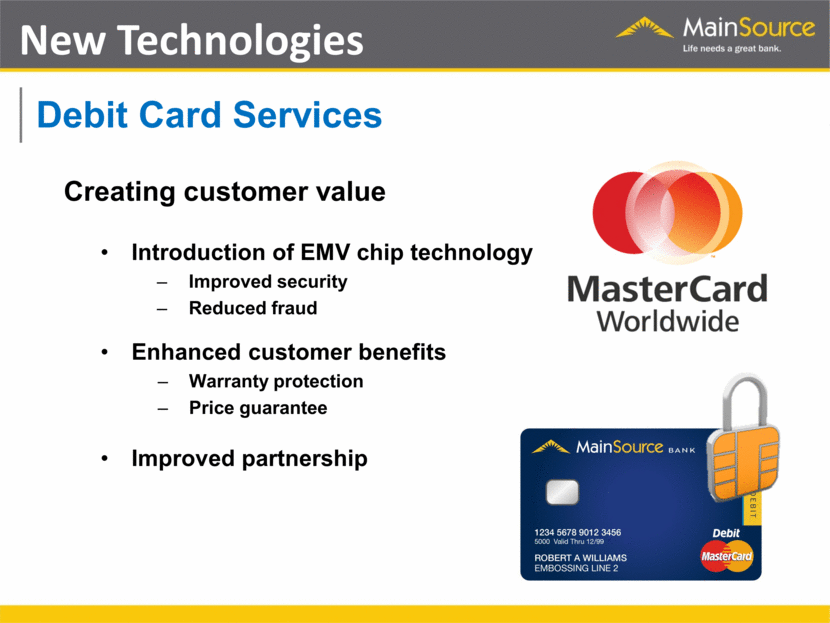
Debit Card Services Creating customer value Introduction of EMV chip technology Improved security Reduced fraud Enhanced customer benefits Warranty protection Price guarantee Improved partnership New Technologies |
|
|
Questions |
|
|
[LOGO] |
|
|
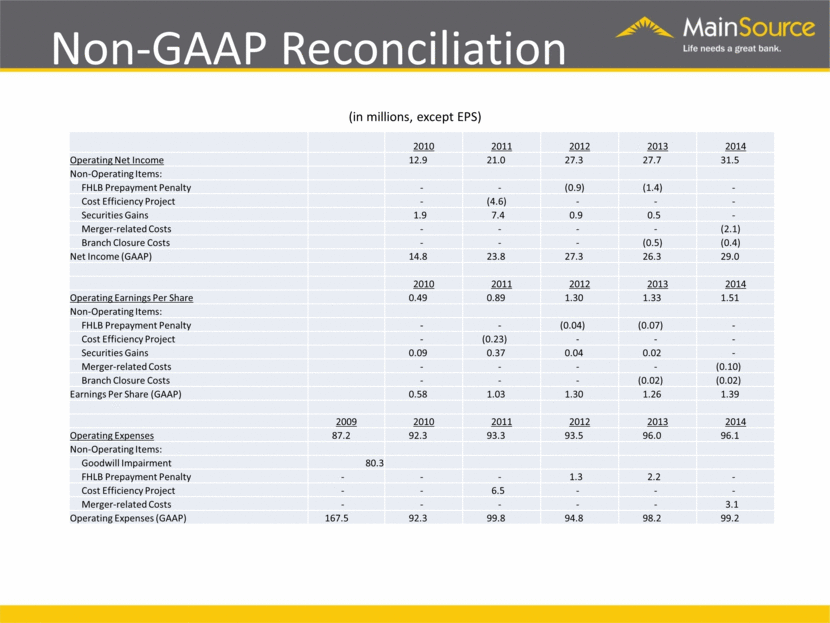
Non-GAAP Measures This presentation contains certain financial information determined by methods other than in accordance with accounting principles generally accepted in the United States (GAAP). Such non-GAAP financial measures include the following: net income (excluding loan loss provision, taxes and goodwill impairment charges), earnings per share (excluding loan loss provision, taxes and goodwill impairment charges) and operating expenses (excluding goodwill impairment charges, one-time expenses and prepayment penalties on FHLB advances). Non-GAAP financial information should be considered supplemental to, and not as a substitute for, or superior to, financial measures calculated in accordance with GAAP. However, we believe that non-GAAP reporting provides meaningful information and therefore we use it to supplement our GAAP information. We have chosen to provide this supplemental information to investors, analysts and other interested parties to enable them to perform additional analyses of operating results, to illustrate the results of operations giving effect to the non-GAAP adjustments and to provide an additional measure of performance. We believe this information is helpful in understanding the results of operations separate and apart from items that may, or could, have a disproportional positive or negative impact in any given period. For a reconciliation of the differences between the non-GAAP financial measures the most comparable GAAP measures, please refer to the following reconciliation tables. |
|
|
Non-GAAP Reconciliation (in millions, except EPS) 2010 2011 2012 2013 2014 Operating Net Income 12.9 21.0 27.3 27.7 31.5 Non-Operating Items: FHLB Prepayment Penalty - - (0.9) (1.4) - Cost Efficiency Project - (4.6) - - - Securities Gains 1.9 7.4 0.9 0.5 - Merger-related Costs - - - - (2.1) Branch Closure Costs - - - (0.5) (0.4) Net Income (GAAP) 14.8 23.8 27.3 26.3 29.0 2010 2011 2012 2013 2014 Operating Earnings Per Share 0.49 0.89 1.30 1.33 1.51 Non-Operating Items: FHLB Prepayment Penalty - - (0.04) (0.07) - Cost Efficiency Project - (0.23) - - - Securities Gains 0.09 0.37 0.04 0.02 - Merger-related Costs - - - - (0.10) Branch Closure Costs - - - (0.02) (0.02) Earnings Per Share (GAAP) 0.58 1.03 1.30 1.26 1.39 2009 2010 2011 2012 2013 2014 Operating Expenses 87.2 92.3 93.3 93.5 96.0 96.1 Non-Operating Items: Goodwill Impairment 80.3 FHLB Prepayment Penalty - - - 1.3 2.2 - Cost Efficiency Project - - 6.5 - - - Merger-related Costs - - - - - 3.1 Operating Expenses (GAAP) 167.5 92.3 99.8 94.8 98.2 99.2 |

