Attached files
| file | filename |
|---|---|
| EX-21 - EXHIBIT 21 - MAINSOURCE FINANCIAL GROUP | a2197150zex-21.htm |
| EX-32.1 - EXHIBIT 32.1 - MAINSOURCE FINANCIAL GROUP | a2197150zex-32_1.htm |
| EX-31.1 - EXHIBIT 31.1 - MAINSOURCE FINANCIAL GROUP | a2197150zex-31_1.htm |
| EX-31.2 - EXHIBIT 31.2 - MAINSOURCE FINANCIAL GROUP | a2197150zex-31_2.htm |
| EX-23.1 - EXHIBIT 23.1 - MAINSOURCE FINANCIAL GROUP | a2197150zex-23_1.htm |
| EX-99.1 - EXHIBIT 99.1 - MAINSOURCE FINANCIAL GROUP | a2197150zex-99_1.htm |
| EX-32.2 - EXHIBIT 32.2 - MAINSOURCE FINANCIAL GROUP | a2197150zex-32_2.htm |
| EX-99.2 - EXHIBIT 99.2 - MAINSOURCE FINANCIAL GROUP | a2197150zex-99_2.htm |
Use these links to rapidly review the document
TABLE OF CONTENTS
SECURITIES AND EXCHANGE COMMISSION
WASHINGTON, D. C. 20549
FORM 10-K
Annual Report Pursuant to Section 13 or 15(d) of the
Securities Exchange Act of 1934
For the fiscal year ended December 31, 2009
Commission file number 0-12422
MAINSOURCE FINANCIAL GROUP, INC.
(Exact name of registrant as specified in its charter)
| Indiana (State or other jurisdiction of incorporation or organization) |
35-1562245 (I.R.S. Employer Identification No.) |
|
2105 North State Road 3 Bypass Greensburg, Indiana 47240 (Address of principal executive offices) (Zip code) |
||
Registrant's telephone number, including area code: (812) 663-6734 |
||
Securities registered pursuant to Section 12(b) of the Act: |
||
Title of each class Common shares, no par value |
Name of each exchange on which registered The NASDAQ Stock Market LLC |
|
Securities registered pursuant to Section 12(g) of the Act: None |
||
Indicate by check mark if the registrant is a well-known seasoned issuer, as defined in Rule 405 of the Securities Act. Yes o No ý
Indicate by check mark if the registrant is not required to file reports pursuant to Section 13 or Section 15(d) of the Act. Yes o No ý
Indicate by check mark whether the registrant (1) has filed all reports required to be filed by Section 13 or 15(d) of the Securities Exchange Act of 1934 during the preceding 12 months (or for such shorter period that the registrant was required to file such reports), and (2) has been subject to such filing requirements for the past 90 days. Yes ý No o
Indicate by check mark whether the registrant has submitted electronically and posted on its corporate Website, if any, every Interactive Data File required to be submitted and posted pursuant to Rule 405 of Regulation S-T during the previous 12 months (or for such shorter period that the registrant was required to submit and post such files). Yes o No o
Indicate by check mark if disclosure of delinquent filers pursuant to Item 405 of Regulation S-K is not contained herein, and will not be contained, to the best of registrant's knowledge, in definitive proxy or information statements incorporated by reference in Part III of this Form 10-K or any amendment to this Form 10-K. o
Indicate by check mark whether the registrant is a large accelerated filer, an accelerated filer, a non-accelerated filer, or a smaller reporting company. See definitions of "large accelerated filer", "accelerated filer", and "smaller reporting company" in Rule 12b-2 of the Exchange Act.
| Large accelerated filer o | Accelerated filer ý | Non-accelerated filer o (Do not check if a smaller reporting company) |
Smaller reporting company o |
Indicate by check mark whether the registrant is a shell company (as defined in Rule 12b-2 of the Act). Yes o No ý
The aggregate market value (not necessarily a reliable indication of the price at which more than a limited number of shares would trade) of the voting stock held by non-affiliates of the registrant was $149,411,806 as of June 30, 2009.
As of March 10, 2010, there were outstanding 20,136,362 common shares, without par value, of the registrant.
DOCUMENTS INCORPORATED BY REFERENCE
Documents
|
Part of Form 10-K Into Which Incorporated |
|
|---|---|---|
| Definitive Proxy Statement for Annual Meeting of Shareholders to be held April 28, 2010 |
Part III (Items 10 through 14) |
Pursuant to General Instruction G, the information called for by Items 10-14 is omitted by MainSource Financial Group, Inc. since MainSource Financial Group, Inc. will file with the Commission a definitive proxy statement to shareholders pursuant to Regulation 14A not later than 120 days after the close of the fiscal year containing the information required by Items 10-14.
2
(Dollar amounts in thousands except per share data)
General
MainSource Financial Group, Inc. ("MainSource" or the "Company") is a financial holding company based in Greensburg, Indiana. As of December 31, 2009, the Company operated one banking subsidiary: MainSource Bank ("the Bank"), an Indiana state chartered bank. During 2009, three wholly owned subsidiaries, MainSource Bank of Illinois, MainSource Bank — Ohio and MainSource Bank — Hobart, were merged into MainSource Bank. Through its non-bank affiliates, the Company provides services incidental to the business of banking. Since its formation in 1982, the Company has acquired and established various institutions and financial services companies and may acquire additional financial institutions and financial services companies in the future. For further discussion of the business of the Company see Management's Discussion and Analysis in Part II, Item 7.
As of December 31, 2009, the Company operated 85 branch banking offices in Indiana, Illinois, Ohio, and Kentucky as well as twelve insurance offices in Indiana and one in Illinois. As of December 31, 2009, the Company had consolidated assets of $2,906,530, consolidated deposits of $2,270,650 and shareholders' equity of $294,462.
Through the Bank, the Company offers a broad range of financial services, including: accepting time and transaction deposits; making consumer, commercial, agribusiness and real estate mortgage loans; renting safe deposit facilities; providing general agency personal and business insurance services; providing personal and corporate trust services; and providing other corporate services such as letters of credit and repurchase agreements.
The lending activities of the Bank are separated into primarily the categories of commercial/agricultural, real estate and consumer. Loans are originated by the lending officers of the Bank subject to limitations set forth in lending policies. The Board of Directors of the Bank reviews loans up to the Bank's legal lending limits, monitors concentrations of credit, problem and past due loans and charge-offs of uncollectible loans, and formulates loan policy. The Bank maintains conservative loan policies and underwriting practices in order to address and manage loan risks. These policies and practices include granting loans on a sound and collectible basis, serving the legitimate needs of the community and the general market area while obtaining a balance between maximum yield and minimum risk, ensuring that primary and secondary sources of repayment are adequate in relation to the amount of the loan, developing and maintaining adequate diversification of the loan portfolio as a whole and of the loans within each category and developing and applying adequate collection policies.
Commercial loans include secured and unsecured loans, including real estate loans, to individuals and companies and to governmental units predominantly within the market area of the Bank for a myriad of business purposes.
Agricultural loans are generated in the Bank's markets. Most of the loans are real estate loans on farm properties. Loans are also made for agricultural production and such loans are generally reviewed annually.
Residential real estate lending has been the largest component of the loan portfolio for many years. The Bank generates residential mortgages for its own portfolio. However, the Company elects to sell the majority of its fixed rate mortgages into the secondary market while maintaining the servicing of such loans. At December 31, 2009, the Company was servicing a $726 million residential real estate loan portfolio. By originating loans for sale in the secondary market, the Company can more fully satisfy customer demand for fixed rate residential mortgages and increase fee income, while reducing the risk of loss caused by rising interest rates.
The principal source of revenues for the Company is interest and fees on loans, which accounted for 63.2% of total revenues in 2009, 67.9% in 2008 and 69.1% in 2007.
The Company's investment securities portfolio is primarily comprised of U. S. Treasuries, federal agencies, state and municipal bonds, U. S. government sponsored entity's mortgage-backed securities and corporate securities. The Company has classified its entire investment portfolio as available for sale, with fair value changes reported separately in shareholders' equity. Funds invested in the investment portfolio generally represent funds not immediately required to meet loan demand. Income related to the Company's investment portfolio accounted for 14.8% of total revenues in 2009, 15.0% in 2008 and 14.2% in 2007. As of December 31, 2009, the Company had not identified any securities as being "high risk" as defined by the FFIEC Supervisory Policy Statement on Securities Activities.
The primary source of funds for the Bank is deposits generated in local market areas. To attract and retain stable depositors, the Bank markets various programs for demand, savings and time deposit accounts. These programs include interest and non-interest bearing demand and individual retirement accounts.
3
Currently, national retailing and manufacturing subsidiaries, brokerage and insurance firms and credit unions are fierce competitors within the financial services industry. Mergers between financial institutions within Indiana and neighboring states, which became permissible under the Interstate Banking and Branching Efficiency Act of 1994, have also added competitive pressure.
The branches of the Bank are located in predominantly non-metropolitan areas and the Bank's business is centered in loans and deposits generated within markets considered largely rural in nature. In addition to competing vigorously with other banks, thrift institutions, credit unions and finance companies located within their service areas, we also compete, directly and indirectly, with all providers of financial services.
Employees
As of December 31, 2009, the Company and its subsidiaries had 934 full-time equivalent employees to whom it provides a variety of benefits and with whom it enjoys excellent relations. None of our employees are subject to collective bargaining agreements.
Regulation and Supervision
The Company is a financial holding company ("FHC") within the meaning of the Bank Holding Company Act of 1956, as amended. As a financial holding company, the Company is subject to regulation by the Federal Reserve Board ("FRB"). The Bank is an Indiana state chartered bank subject to supervision and regulation by the Federal Deposit Insurance Corporation ("FDIC") and the Indiana Department of Financial Institutions. The following is a discussion of material statutes and regulations affecting the Company and the Bank. The discussion is qualified in its entirety by reference to such statutes and regulations.
Bank Holding Company Act of 1956, as amended (the "BHC Act").
Generally, the BHC Act governs the acquisition and control of banks and nonbanking companies by bank holding companies. A bank holding company is subject to regulation under the BHC Act and is required to register with the FRB under the BHC Act. The BHC Act requires a bank holding company to file an annual report of its operations and such additional information as the FRB may require. The FRB has issued regulations under the BHC Act requiring a bank holding company to serve as a source of financial and managerial strength to its subsidiary banks. It is the policy of the FRB that, pursuant to this requirement, a bank holding company should stand ready to use its resources to provide adequate capital funds to its subsidiary banks during periods of financial stress or adversity.
The acquisition of 5% or more of the voting shares of any bank or bank holding company generally requires the prior approval of the FRB and is subject to applicable federal and state law, including the Riegle-Neal Interstate Banking and Branching Efficiency Act of 1994 ("Riegle-Neal") for interstate transactions. The FRB evaluates acquisition applications based on, among other things, competitive factors, supervisory factors, adequacy of financial and managerial resources, and banking and community needs considerations.
The BHC Act also prohibits, with certain exceptions, a bank holding company from acquiring direct or indirect ownership or control of more than 5% of the voting shares of any "nonbanking" company unless the nonbanking activities are found by the FRB to be "so closely related to banking . . . as to be a proper incident thereto." Under current regulations of the FRB, a bank holding company and its nonbank subsidiaries are permitted, among other activities, to engage in such banking-related business ventures as consumer finance, equipment leasing, data processing, mortgage banking, financial and investment advice, and securities brokerage services. The BHC Act does not place territorial restrictions on the activities of a bank holding company or its nonbank subsidiaries.
Federal law prohibits acquisition of "control" of a bank or bank holding company without prior notice to certain federal bank regulators. "Control" is defined in certain cases as the acquisition of as little as 10% of the outstanding shares of any class of voting stock. Furthermore, under certain circumstances, a bank holding company may not be able to purchase its own stock, where the gross consideration will equal 10% or more of the company's net worth, without obtaining approval of the FRB. Under the Federal Reserve Act, banks and their affiliates are subject to certain requirements and restrictions when dealing with each other (affiliate transactions include transactions between a bank and its bank holding company).
Gramm-Leach-Bliley Financial Modernization Act of 1999.
The Gramm-Leach-Bliley Financial Modernization Act of 1999 (the "Modernization Act") was enacted on November 12, 1999. The Modernization Act, which amended the BHC Act, provides the following:
- •
- it allows bank holding companies that qualify as "financial holding companies" to engage in a broad range of financial and
related activities;
- •
- it allows insurers and other financial services companies to acquire banks;
4
- •
- it removes various restrictions that applied to bank holding company ownership of securities firms and mutual fund
advisory companies; and
- •
- it establishes the overall regulatory structure applicable to bank holding companies that also engage in insurance and securities operations.
The Company initially qualified as a financial holding company in December, 2004. Thus the Company is authorized to operate as a financial holding company and is eligible to engage in, or acquire companies engaged in, the broader range of activities that are permitted by the Modernization Act. These activities include those that are determined to be "financial in nature," including insurance underwriting, securities underwriting and dealing, and making merchant banking investments in commercial and financial companies. If a banking subsidiary ceases to be "well capitalized" or "well managed" under applicable regulatory standards, the FRB may, among other things, place limitations on our ability to conduct these broader financial activities or, if the deficiencies persist, require us to divest the banking subsidiary. In addition, if a banking subsidiary receives a rating of less than satisfactory under the Community Reinvestment Act of 1977 ("CRA"), we would be prohibited from engaging in any additional activities other than those permissible for bank holding companies that are not financial holding companies.
Bank Secrecy Act and USA Patriot Act
In 1970, Congress enacted the Currency and Foreign Transactions Reporting Act, commonly known as the Bank Secrecy Act (the "BSA"). The BSA requires financial institutions to maintain records of certain customers and currency transactions and to report certain domestic and foreign currency transactions, which may have a high degree of usefulness in criminal, tax, or regulatory investigations or proceedings. Under this law, financial institutions are required to develop a BSA compliance program.
In 2001, the President signed into law comprehensive anti-terrorism legislation known as the USA Patriot Act. Title III of the USA Patriot Act requires financial institutions, including the Company and the Bank, to help prevent and detect international money laundering and the financing of terrorism and prosecute those involved in such activities. The Department of the Treasury has adopted additional requirements to further implement Title III.
Under these regulations, a mechanism has been established for law enforcement officials to communicate names of suspected terrorists and money launderers to financial institutions to enable financial institutions to promptly locate accounts and transactions involving those suspects. Financial institutions receiving names of suspects must search their account and transaction records for potential matches and report positive results to the U.S. Department of the Treasury Financial Crimes Enforcement Network ("FinCEN"). Each financial institution must designate a point of contact to receive information requests. These regulations outline how financial institutions can share information concerning suspected terrorist and money laundering activity with other financial institutions under the protection of a statutory safe harbor if each financial institution notifies FinCEN of its intent to share information. The Department of the Treasury has also adopted regulations intended to prevent money laundering and terrorist financing through correspondent accounts maintained by U.S. financial institutions on behalf of foreign banks. Financial institutions are required to take reasonable steps to ensure that they are not providing banking services directly or indirectly to foreign shell banks. In addition, banks must have procedures in place to verify the identity of the persons with whom they deal.
FDIC Improvement Act of 1991
The Federal Deposit Insurance Corporation Improvement Act of 1991 ("FDICIA") requires, among other things, federal bank regulatory authorities to take "prompt corrective action" with respect to banks which do not meet minimum capital requirements. For these purposes, FDICIA establishes five capital tiers: well capitalized, adequately capitalized, undercapitalized, significantly undercapitalized and critically undercapitalized. The FDIC has adopted regulations to implement the prompt corrective action provisions of FDICIA.
"Undercapitalized" banks are subject to growth limitations and are required to submit a capital restoration plan. A bank's compliance with such plan is required to be guaranteed by the bank's parent holding company. If an "undercapitalized" bank fails to submit an acceptable plan, it is treated as if it is significantly undercapitalized. "Significantly undercapitalized" banks are subject to one or more restrictions, including an order by the FDIC to sell sufficient voting stock to become adequately capitalized, requirements to reduce total assets and cease receipt of deposits from correspondent banks, and restrictions on compensation of executive officers. "Critically undercapitalized" institutions may not, beginning 60 days after becoming "critically undercapitalized," make any payment of principal or interest on certain subordinated debt or extend credit for a highly leveraged transaction or enter into any transaction outside the ordinary course of business. In addition, "critically undercapitalized" institutions are subject to appointment of a receiver or conservator.
A "well capitalized" institution is one that has a total risk-based capital ratio of at least 10%, a Tier 1 risk-based capital ratio of at least 6%, a leverage ratio of at least 5% and is not subject to regulatory direction to maintain a specific level for any capital measure. An "adequately capitalized" institution is one that has ratios greater than 8%, 4% and 4%. An institution is "undercapitalized" if its respective ratios are less than 8%, 4% and 4%. "Significantly undercapitalized" institutions have ratios of
5
less than 6%, 3% and 3%. An institution is deemed to be "critically undercapitalized" if it has a ratio of tangible equity to total assets that is 2% or less.
The Sarbanes-Oxley Act
The Sarbanes-Oxley Act of 2002 ("Sarbanes-Oxley Act"), which became law on July 30, 2002, added new legal requirements for public companies affecting corporate governance, accounting and corporate reporting. The Sarbanes-Oxley Act provides for, among other things:
- •
- a prohibition on personal loans made or arranged by the issuer to its directors and executive officers (except for loans
made by a bank subject to Regulation O);
- •
- independence requirements for audit committee members;
- •
- independence requirements for company auditors;
- •
- certification of financial statements on Forms 10-K and 10-Q reports by the chief executive
officer and the chief financial officer;
- •
- the forfeiture by the chief executive officer and chief financial officer of bonuses or other incentive-based compensation
and profits from the sale of an issuer's securities by such officers in the twelve-month period following initial publication of any financial statements that later require restatement due to
corporate misconduct;
- •
- disclosure of off-balance sheet transactions;
- •
- two-business day filing requirements for insiders filing Form 4s;
- •
- disclosure of a code of ethics for financial officers and filing a Form 8-K for a change in or waiver
of such code;
- •
- the reporting of securities violations "up the ladder" by both in-house and outside attorneys;
- •
- restrictions on the use of non-GAAP financial measures in press releases and SEC filings;
- •
- the formation of a public accounting oversight board; and
- •
- various increased criminal penalties for violations of securities laws.
The SEC has been delegated the task of enacting rules to implement various provisions of the Sarbanes-Oxley Act. In addition, each of the national stock exchanges developed new corporate governance rules, including rules strengthening director independence requirements for boards, the adoption of corporate governance codes and charters for the nominating, corporate governance and audit committees.
Deposit Insurance Fund
The deposits of the Bank are insured to the maximum extent permitted by law by the Deposit Insurance Fund ("DIF") of the FDIC, which was created in 2006 as the result of the merger of the Bank Insurance Fund and the Savings Association Insurance Fund in accordance with the Federal Deposit Insurance Reform Act of 2005 (the "FDI Act"). The FDI Act provided for several additional changes to the deposit insurance system, including adjusting the deposit insurance limits every 5 years beginning in 2011 based on an inflation index, increasing the insurance limit for retirement accounts from $100 to $250, and allocating an aggregate of $4.7 billion of one-time credits to banks to offset the insurance premiums charged to such banks by the FDIC.
During the second quarter of 2009, the FDIC levied an industry-wide special assessment charge on insured financial institutions as part of the agency's efforts to rebuild the DIF. In November 2009, the FDIC amended regulations that required insured institutions to prepay their estimated quarterly risk-based assessments for the fourth quarter of 2009 and for all of the years 2010-2012. The prepaid assessments will be applied against future quarterly assessments (as they may be so revised) until the prepaid assessment is exhausted or the balance of the prepayment is returned, whichever occurs first.
In addition, on January 12, 2010, the FDIC announced that it would seek public comment on whether financial institutions with compensation plans that encourage risky behavior should be charged higher deposit assessment rates than such financial institutions would otherwise be charged. The FDIC is not precluded from changing assessment rates or from further revising the risk-based assessment system during the prepayment period or thereafter. Thus, the Company may also be required to pay significantly higher FDIC insurance assessment premiums in the future because market developments have significantly depleted the DIF and reduced the ratio of reserves to insured deposits.
6
Dividends
The Company is a legal entity separate and distinct from the Bank. There are various legal limitations on the extent to which the Bank can supply funds to the Company. The principal source of the Company's funds consists of dividends from the Bank. State and Federal law restricts the amount of dividends that may be paid by banks. In addition, the Bank is subject to certain restrictions on extensions of credit to the Company, on investments in the stock or other securities of the Company and in taking such stock or securities as collateral for loans.
Recent Legislative and Regulatory Initiatives to Address Financial and Economic Crises
Congress, the United States Department of the Treasury ("Treasury") and the federal banking regulators, including the FDIC, have taken broad action since early September 2008 to address volatility in the U.S. banking system and financial markets.
In October 2008, the Emergency Economic Stabilization Act of 2008 ("EESA") was enacted. The EESA authorizes Treasury to purchase from financial institutions and their holding companies up to $700 billion in mortgage loans, mortgage-related securities and certain other financial instruments, including debt and equity securities issued by financial institutions and their holding companies in a troubled asset relief program ("TARP"). The purpose of TARP is to restore confidence and stability to the U.S. banking system and to encourage financial institutions to increase their lending to customers and to each other. As part of TARP, Treasury has allocated $250 billion towards the Capital Purchase Program. Under the Capital Purchase Program, Treasury will purchase debt or equity securities from participating institutions. Participants in the Capital Purchase Program are subject to executive compensation limits and are encouraged to expand their lending and mortgage loan modifications. EESA also increased FDIC deposit insurance on most accounts from $100 to $250.
Following a systemic risk determination, on October 14, 2008, the FDIC established a Temporary Liquidity Guarantee Program ("TLGP"). The TLGP includes the Transaction Account Guarantee Program ("TAGP"), which provides unlimited deposit insurance coverage for noninterest-bearing transaction accounts (typically business checking accounts) and certain funds swept into noninterest-bearing savings accounts. As originally enacted, the TAGP expired on December 31, 2009, and banks participating in the TAGP paid a 10 basis point fee (annualized) on the balance of each covered account in excess of $250. On October 1, 2009, the FDIC extended the TAGP for six months until June 30, 2010. Any insured depository institution that was participating in the TAGP program as of October 1, 2009 was permitted to continue in the TAGP during the extension period. The annual assessment rate that applies to participating institutions during the extension period is either 15 basis points, 20 basis points or 25 basis points, depending on the "Risk Category" assigned to the institution under the FDIC's risk-based premium system. Any institution participating in the TAGP program as of October 1, 2009 that desired to opt out of the TAGP extension was required to submit its opt-out election to the FDIC on or before November 2, 2009. The Company elected to participate in the TAGP through December 31, 2009, but did not elect to participate in the extension of the program.
The TLGP also includes the Debt Guarantee Program ("DGP"), under which the FDIC guaranteed certain senior unsecured debt of FDIC-insured institutions and their holding companies issued on or after October 14, 2008 and not later than June 30, 2009. The guarantee is effective through the earlier of the maturity date or June 30, 2012. The DGP coverage limit is generally 125% of the entity's eligible debt outstanding on September 30, 2008 and scheduled to mature on or before June 30, 2009 or, for certain insured institutions, 2% of their total liabilities as of September 30, 2008. Depending on the term of the debt maturity, the nonrefundable DGP fee ranges from 50 to 100 basis points (annualized) for covered debt outstanding until the earlier of maturity or June 30, 2012. The DGP is in effect for all eligible entities, unless the entity opted out on or before December 5, 2008. The Company did not opt out of the DGP, although it does not have any eligible debt and therefore will not pay any premium associated with the DGP.
On February 17, 2009, President Barack Obama signed the American Recovery and Reinvestment Act of 2009 ("ARRA"), more commonly known as the economic stimulus or economic recovery package. ARRA includes a wide variety of programs intended to stimulate the economy and provide for extensive infrastructure, energy, health and education needs. In addition, ARRA imposes new executive compensation and corporate governance limits on current and future participants in the Treasury's Capital Purchase Program ("CPP"), including the Company, which are in addition to those previously announced by Treasury. The new limits remain in place until the participant has redeemed the preferred stock sold to Treasury, which is now permitted under ARRA without penalty and without the need to raise new capital, subject to Treasury's consultation with the recipient's appropriate federal regulator. On June 10, 2009, Treasury released an interim final rule, effective June 15, 2009, that provided guidance on the compensation and governance standards for participants in the CPP, and promulgated regulations to implement the restrictions and standards set forth in ARRA. Among other things, Treasury's final rule and ARRA significantly expanded the executive compensation restrictions previously imposed by EESA.
On May 20, 2009, the Helping Families Save Their Homes Act of 2009, which extended the temporary increase in the standard maximum deposit insurance amount provided by the FDIC to $250 per depositor through December 31, 2013, was signed into law. This extension of the temporary $250 coverage limit (pursuant to EESA) became effective immediately upon the President's
7
signature. The legislation provides that the standard maximum deposit insurance amount provided by the FDIC will return to $100 on January 1, 2014.
On October 22, 2009, the Federal Reserve issued a comprehensive proposal on incentive compensation policies (the "Incentive Compensation Proposal") intended to ensure that the incentive compensation policies of banking organizations do not undermine the safety and soundness of such organizations by encouraging excessive risk-taking. This guidance sets expectations for banking organizations concerning their incentive compensation arrangements and related risk-management, control and governance processes. The Incentive Compensation Proposal, which covers all employees that have the ability to materially affect the risk profile of an organization, either individually or as part of a group, is based upon three primary principles: (i) balanced risk-taking incentives, (ii) compatibility with effective controls and risk management, and (iii) strong corporate governance. Any deficiencies in compensation practices that are identified may be incorporated into the organization's supervisory ratings, which can affect its ability to make acquisitions or perform other actions. In addition, under the Incentive Compensation Proposal, the Federal Reserve in appropriate circumstances may take enforcement action against a banking organization.
On January 14, 2010, the current administration announced a proposal to impose a fee (the "Financial Crisis Responsibility Fee") on those financial institutions that benefited from recent actions taken by the U.S. government to stabilize the financial system. If implemented as initially proposed, the Financial Crisis Responsibility Fee will be applied to firms with over $50 billion in consolidated assets, and, therefore, by its terms would not apply to the Company. The Financial Crisis Responsibility Fee would be collected by the Internal Revenue Service and would be approximately fifteen basis points, or 0.15%, of an amount calculated by subtracting a covered institution's Tier 1 capital and FDIC-assessed deposits (and/or an adjustment for insurance liabilities covered by state guarantee funds) from such institution's total assets. The Financial Crisis Responsibility Fee, if implemented as proposed by the current administration, would go into effect on June 30, 2010 and remain in place for at least ten years. The U.S. Treasury would be asked to report after five years on the effectiveness of the Financial Crisis Responsibility Fee as well as its progress in repaying projected losses to the U.S. government as a result of TARP. If losses to the U.S. government as a result of TARP have not been recouped after ten years, the Financial Crisis Responsibility Fee would remain in place until such losses have been recovered.
Other Regulations
In addition to the statutes and regulations discussed above, the Company and the Bank are subject to additional regulation of their activities, including a variety of consumer protection regulations affecting lending, deposit and collection activities and regulations affecting secondary mortgage market activities.
Capital Requirements
As discussed above, the Company and the Bank must meet certain minimum capital requirements mandated by each of their state or federal regulators. These regulatory agencies require BHCs and banks to maintain certain minimum ratios of primary capital to total assets and total capital to total assets. The FRB requires BHCs to maintain a minimum Tier 1 leverage ratio of 3% capital to total assets; however, for all but the most highly rated institutions which do not anticipate significant growth, the minimum Tier 1 leverage ratio is 3% plus an additional cushion of 100 to 200 basis points. As of December 31, 2009, the Company's leverage ratio of capital to total assets was 8.8%. The FRB and FDIC each have approved the imposition of "risk-adjusted" capital ratios on BHCs and financial institutions. The Company's Tier 1 Capital to Risk-Weighted Assets Ratio was 13.5% and its Total Capital to Risk-Weighted Assets Ratio was 14.8% at December 31, 2009. The Bank had capital to asset ratios and risk- adjusted capital ratios at December 31, 2009, in excess of the applicable minimum regulatory requirements.
In addition to the other information contained in this report, the following risks may affect us. If any of these risks actually occur, our business, financial condition or results of operations may suffer. As a result, the price of our common shares could decline.
Risks Related to the Company's Business
Difficult conditions in the capital markets and the economy generally may materially adversely affect our business and results of operations.
Our results of operations are materially affected by conditions in the capital markets and the economy generally. The capital and credit markets continue to experience extreme volatility and disruption. In many cases, these markets have produced downward pressure on stock prices of, and credit availability to, certain companies without regard to those companies' underlying financial strength. The impact of this situation, together with concerns regarding the financial strength of financial institutions, has led to distress in financial markets and issues relating to liquidity among financial institutions. As a result, and because of concerns about the stability of the financial markets generally, the resulting credit availability issues, the lack of confidence in the financial sector, the increased volatility in the financial markets and the reduced business activity could have a material adverse effect on the
8
Company's ability to access capital and manage liquidity. If current levels of financial market volatility and disruption continue or worsen, there can be no assurance that the Company's business, financial condition and results of operations will not be materially and adversely affected.
There can be no assurance that actions of the U.S. government, Federal Reserve and other governmental and regulatory bodies for the purpose of stabilizing the financial markets will achieve the intended effect.
In response to the financial crises affecting the banking system and financial markets and going concern threats to investment banks and other financial institutions, on October 3, 2008, President Bush signed EESA into law. Pursuant to EESA, the Treasury has the authority to utilize up to $700 billion to purchase distressed assets from financial institutions or infuse capital into financial institutions for the purpose of stabilizing the financial markets. The Treasury announced the Capital Purchase Program under EESA pursuant to which it has purchased and will continue to purchase senior preferred stock in participating financial institutions such as the Company. Then, on February 17, 2009, President O'Bama signed ARRA as a sweeping economic recovery package intended to stimulate the economy and provide for broad infrastructure, energy, health and education needs. There can be no assurance as to the actual impact that EESA or its programs, including the Capital Purchase Program and ARRA, will have on the financial markets or on us. The failure of these programs to help stabilize the financial markets and a continuation or worsening of current financial market conditions could materially and adversely affect our business, financial condition, results of operations, access to credit or the trading price of our common stock.
The federal government, Federal Reserve, FDIC, SEC and other governmental and regulatory bodies have taken, or are considering taking, other actions to address the financial crisis. There can be no assurance as to what impact such actions will have on the financial markets, including the extreme levels of volatility currently being experienced. Such continued volatility could materially and adversely affect our business, financial condition and results of operations, or the trading price of our common stock.
Like most banking organizations, a significant portion of our assets consists of loans, which if not repaid could result in losses to the Company.
As a lender, we are exposed to the risk that our customers will be unable to repay their loans according to their terms and that the collateral securing the payment of their loans (if any) may not be sufficient to assure repayment. Credit losses could have a material adverse effect on our operating results.
As of December 31, 2009, our total loan portfolio was approximately $1,885,447 or 65% of our total assets. Three major components of the loan portfolio are loans principally secured by real estate, approximately $1,553,076 or 82% of total loans; other commercial loans, approximately $237,398 or 13% of total loans; and consumer loans, approximately $94,973 or 5% of total loans. Our credit risk with respect to our consumer installment loan portfolio and commercial loan portfolio relates principally to the general creditworthiness of individuals and businesses within our local market area. Our credit risk with respect to our residential and commercial real estate mortgage and construction loan portfolio relates principally to the general creditworthiness of individuals and businesses and the value of real estate serving as security for the repayment of the loans. A related risk in connection with loans secured by commercial real estate is the effect of unknown or unexpected environmental contamination, which could make the real estate effectively unmarketable or otherwise significantly reduce its value as security. Credit issues, particularly within our residential and commercial real estate mortgage and construction loan portfolio, may continue to broaden during 2010 depending on the severity and duration of the declining economy and the current credit cycle.
Our allowance for loan losses may not be sufficient to cover actual loan losses, which could adversely affect our earnings.
We maintain an allowance for loan losses at a level estimated by management to be sufficient to cover probable incurred loan losses in our loan portfolio. Loan losses will likely occur in the future and may occur at a rate greater than we have experienced to date. In determining the size of the allowance, our management makes various assumptions and judgments about the collectability of our loan portfolio, including the diversification by industry of our commercial loan portfolio, the effect of changes in the local real estate markets on collateral values, the results of recent regulatory examinations, the effects on the loan portfolio of current economic indicators and their probable impact on borrowers, the amount of charge-offs for the period, the amount of nonperforming loans and related collateral security, and the evaluation of our loan portfolio by an external loan review. If our assumptions and judgments prove to be incorrect, our current allowance may not be sufficient and adjustments may be necessary to allow for different economic conditions or adverse developments in our loan portfolio. Additionally, continuing deterioration in economic conditions affecting borrowers, new information regarding existing loans, identification of additional problem loans and other factors, both within and outside the Company's control, may require an increase in the allowance for loan losses. Federal and state regulators also periodically review our allowance for loan losses and may require us to increase our provision for loan losses or recognize further loan charge-offs, based on judgments different than those of our management. Any increase in our allowance for loan losses or loan charge-offs could have an adverse effect on our operating results and financial condition. There can be no assurance that our
9
monitoring procedures and policies will reduce certain lending risks or that our allowance for loan losses will be adequate to cover actual losses.
If we foreclose on collateral property, we may be subject to the increased costs associated with ownership of real property, resulting in reduced revenues and earnings.
We may have to foreclose on collateral property to protect our investment and may thereafter own and operate such property, in which case we will be exposed to the risks inherent in the ownership of real estate. The amount that we, as a mortgagee, may realize after a default is dependent upon factors outside of our control, including, but not limited to: (i) general or local economic conditions; (ii) neighborhood values; (iii) interest rates; (iv) real estate tax rates; (v) operating expenses of the mortgaged properties; (vi) environmental remediation liabilities; (vii) ability to obtain and maintain adequate occupancy of the properties; (viii) zoning laws; (ix) governmental rules, regulations and fiscal policies; and (x) acts of God. Certain expenditures associated with the ownership of real estate, principally real estate taxes, insurance, and maintenance costs, may adversely affect the income from the real estate. Therefore, the cost of operating real property may exceed the income earned from such property, and we may have to advance funds in order to protect our investment, or we may be required to dispose of the real property at a loss. The foregoing expenditures and costs could adversely affect our ability to generate revenues, resulting in reduced levels of profitability.
Significant interest rate volatility could reduce our profitability.
Our results of operations are affected principally by net interest income, which is the difference between interest earned on loans and investments and interest expense paid on deposits and other borrowings. We cannot predict or control changes in interest rates. National, regional and local economic conditions and the policies of regulatory authorities, including monetary policies of the Board of Governors of the Federal Reserve System, affect market interest rates. While we have instituted policies and procedures designed to manage the risks from changes in market interest rates, at any given time our assets and liabilities will likely be affected differently by a given change in interest rates, principally because we do not match the maturities of our loans and investments precisely with our deposits and other funding sources. Changes in interest rates may also affect the level of voluntary prepayments on our loans and the level of financing or refinancing by customers. As of December 31, 2009, we had a negative interest rate gap of 18% of interest earning assets in the one-year time frame. Although this is within our internal policy limits, our earnings will be adversely affected in periods of rising interest rates because, during such periods, the interest expense paid on deposits and borrowings will generally increase more rapidly than the interest income earned on loans and investments. If such an interest rate increase occurred gradually, we would use our established procedures to attempt to mitigate the effects over time. However, if such an interest rate increase occurred rapidly, or interest rates exhibited volatile increases and decreases, we might be unable to mitigate the effects, and our net interest income could suffer significant adverse effects. While management intends to continue to take measures to mitigate interest rate risk, we cannot assure you that such measures will be entirely effective in minimizing our exposure to the risk of rapid changes in interest rates.
We may be required to pay significantly higher Federal Deposit Insurance Corporation (FDIC) premiums in the future.
Recent insured institution failures, as well as deterioration in banking and economic conditions, have significantly increased FDIC loss provisions, resulting in a decline in the designated reserve ratio to historical lows. The FDIC expects a higher rate of insured institution failures in the next few years compared to recent years; thus, the reserve ratio may continue to decline. In addition, EESA increased the limit on FDIC coverage of deposit accounts to $250. These developments will cause the premiums assessed to us by the FDIC to increase.
On December 16, 2008, the FDIC Board of Directors determined deposit insurance assessment rates for the first quarter of 2009 at 12 to 14 basis points of deposits. Beginning April 1, 2009, the rates increased to 12 to 16 basis points of deposits. Additionally, the FDIC implemented a 5 basis point special emergency assessment on June 30, 2009, payable September 30, 2009. These higher FDIC assessment rates and any future special assessments could have an adverse impact on our results of operations.
Future growth or operating results may require the Company to raise additional capital but that capital may not be available or it may be dilutive.
The Company is required by federal and state regulatory authorities to maintain adequate levels of capital to support its operations. To the extent the Company's future operating results erode capital or the Company elects to expand through loan growth or acquisition it may be required to raise capital. The Company's ability to raise capital will depend on conditions in the capital markets, which are outside of its control, and on the Company's financial performance. Accordingly, the Company cannot be assured of its ability to raise capital if needed or on favorable terms. If the Company cannot raise additional capital when needed, it will be subject to increased regulatory supervision and the imposition of restrictions on its growth and business. These could negatively impact the Company's ability to operate or further expand its operations through acquisitions or the establishment of additional
10
branches and may result in increases in operating expenses and reductions in revenues that could have a material adverse effect on its financial condition and results of operations.
We rely heavily on our management and other key personnel, and the loss of any of them may adversely affect our operations.
We are and will continue to be dependent upon the services of our management team. The loss of any of our senior managers could have an adverse effect on our growth and performance because of their skills, knowledge of the markets in which we operate and years of industry experience and the difficulty of promptly finding qualified replacement personnel. The loss of key personnel in a particular market could have an adverse effect on our performance in that market because it may be difficult to find qualified replacement personnel who are already located in or would be willing to relocate to a non-metropolitan market.
Our ability to retain key officers and employees may be further impacted by legislation and regulation affecting the financial services industry. On June 10, 2009, the U.S. Treasury released an interim final rule (the "IFR"), effective June 15, 2009, that provided guidance on the compensation and governance standards for participants in Treasury's Capital Purchase Program, and promulgated regulations to implement the restrictions and standards set forth in Section 7001 of ARRA. Among other things, the IFR and ARRA significantly expanded the executive compensation restrictions previously imposed by EESA. Such restrictions apply to any entity that has received or will receive financial assistance under the Capital Purchase Program, and shall generally continue to apply for as long as any obligation arising from such financial assistance, including preferred stock issued under the Capital Purchase Program, remains outstanding. These ARRA restrictions shall not apply to any participant during such time when the federal government (i) only holds any warrants to purchase common stock of such recipient or (ii) does not hold any preferred stock or warrants to purchase common stock of such recipient. As a result of our participation in the Capital Purchase Program, the restrictions and standards set forth in Section 7001 of ARRA, as well as the IFR promulgated by the U.S. Treasury, shall be applicable to us. Such restrictions and standards may further impact management's ability to compete with financial institutions that are not subject to the same limitations as we are under Section 7001 of ARRA and the IFR.
The geographic concentration of our markets makes our business highly susceptible to local economic conditions.
Unlike larger banking organizations that are more geographically diversified, our operations are currently concentrated in 32 counties in Indiana, three counties in Illinois, two counties in Ohio, and three counties in Kentucky. As a result of this geographic concentration in four fairly contiguous markets, our financial results depend largely upon economic conditions in these market areas. A deterioration in economic conditions in one or all of these markets could result in one or more of the following:
- •
- an increase in loan delinquencies;
- •
- an increase in problem assets and foreclosures;
- •
- a decrease in the demand for our products and services; or
- •
- a decrease in the value of collateral for loans, especially real estate, in turn reducing customers' borrowing power, the value of assets associated with problem loans and collateral coverage.
If we do not adjust to rapid changes in the financial services industry, our financial performance may suffer.
We face substantial competition for deposit, credit and trust relationships, as well as other sources of funding in the communities we serve. Competing providers include other banks, thrifts and trust companies, insurance companies, mortgage banking operations, credit unions, finance companies, money market funds and other financial and nonfinancial companies which may offer products functionally equivalent to those offered by our banks. Competing providers may have greater financial resources than we do and offer services within and outside the market areas we serve. In addition to this challenge of attracting and retaining customers for traditional banking services, our competitors now include securities dealers, brokers, mortgage bankers, investment advisors and finance and insurance companies who seek to offer one-stop financial services to their customers that may include services that banks have not been able or allowed to offer to their customers in the past. The increasingly competitive environment is primarily a result of changes in regulation, changes in technology and product delivery systems and the accelerating pace of consolidation among financial service providers. If we are unable to adjust both to increased competition for traditional banking services and changing customer needs and preferences, it could adversely affect our financial performance and your investment in our common stock.
Our historical growth and financial performance trends may not continue if our acquisition strategy is not successful.
Growth in asset size and earnings through acquisitions has been an important part of our business strategy. As consolidation of the banking industry continues, the competition for suitable acquisition candidates may increase. We compete with other banking companies for acquisition opportunities, and many of these competitors have greater financial resources and acquisition experience than we do and may be able to pay more for an acquisition than we are able or willing to pay. We also may need additional debt or
11
equity financing in the future to fund acquisitions. We may not be able to obtain additional financing or, if available, it may not be in amounts and on terms acceptable to us. We may use our common stock as the consideration for an acquisition or we may issue additional common stock and use the proceeds for the acquisition. Our issuance of additional securities will dilute your equity interest in us and may have a dilutive effect on our earnings per share. If we are unable to locate suitable acquisition candidates willing to sell on terms acceptable to us, or we are otherwise unable to obtain additional debt or equity financing necessary for us to continue our acquisition strategy, we would be required to find other methods to grow our business and we may not grow at the same rate we have in the past, or at all.
Acquisitions entail risks which could negatively affect our operations.
Acquisitions involve numerous risks, including:
- •
- exposure to asset quality problems of the acquired institution;
- •
- maintaining adequate regulatory capital;
- •
- diversion of management's attention from other business concerns;
- •
- risks and expenses of entering new geographic markets;
- •
- potential significant loss of depositors or loan customers from the acquired institution; or
- •
- exposure to undisclosed or unknown liabilities of an acquired institution.
Any of these acquisition risks could result in unexpected losses or expenses and thereby reduce the expected benefits of the acquisition.
Unanticipated costs related to our acquisitions could reduce MainSource's future earnings per share.
MainSource believes it has reasonably estimated the likely costs of integrating the operations of the banks it acquires into MainSource and the incremental costs of operating such banks as a part of the MainSource family. However, it is possible that unexpected transaction costs such as taxes, fees or professional expenses or unexpected future operating expenses, such as increased personnel costs or increased taxes, as well as other types of unanticipated adverse developments, could have a material adverse effect on the results of operations and financial condition of MainSource. If unexpected costs are incurred, acquisitions could have a dilutive effect on MainSource's earnings per share. Current accounting guidance requires expensing of acquisition costs. In prior years, these costs could be capitalized. In other words, if MainSource incurs such unexpected costs and expenses as a result of its acquisitions, MainSource believes that the earnings per share of MainSource common stock could be less than they would have been if those acquisitions had not been completed.
MainSource may be unable to successfully integrate the operations of the banks it has acquired and may acquire in the future and retain employees of such banks.
MainSource's acquisition strategy involves the integration of the banks MainSource has acquired and may acquire in the future as MainSource subsidiary banks. The difficulties of integrating the operations of such banks with MainSource and its other subsidiary banks include:
- •
- coordinating geographically separated organizations;
- •
- integrating personnel with diverse business backgrounds;
- •
- combining different corporate cultures; or
- •
- retaining key employees.
The process of integrating operations could cause an interruption of, or loss of momentum in, the activities of one or more of MainSource, its subsidiary banks and the banks MainSource has acquired and may acquire in the future and the loss of key personnel. The integration of such banks as MainSource subsidiary banks requires the experience and expertise of certain key employees of such banks who are expected to be retained by MainSource. We cannot be sure, however, that MainSource will be successful in retaining these employees for the time period necessary to successfully integrate such banks' operations as subsidiary banks of MainSource. The diversion of management's attention and any delays or difficulties encountered in connection with the mergers, along with the integration of the banks as MainSource subsidiary banks, could have an adverse effect on the business and results of operation of MainSource.
12
Risks Relating to the Banking Industry
Changes in governmental regulation and legislation could limit our future performance and growth.
We are subject to extensive state and federal regulation, supervision and legislation that govern almost all aspects of our operations, as well as any acquisitions we may propose to make. Any change in applicable federal or state laws or regulations could have a substantial impact on us, our subsidiary banks and our operations. While we cannot predict what effect any presently contemplated or future changes in the laws or regulations or their interpretations would have on us, these changes could reduce the value of your investment.
Changes in regulation or oversight may have a material adverse impact on our operations.
We are subject to extensive regulation, supervision and examination by the Indiana Department of Financial Institutions, the Federal Deposit Insurance Corporation, the Board of Governors of the Federal Reserve System, the Securities and Exchange Commission and other regulatory bodies. Such regulation and supervision governs the activities in which we may engage. Regulatory authorities have extensive discretion in their supervisory and enforcement activities, including the imposition of restrictions on our operations, investigations and limitations related to our securities, the classification of our assets and determination of the level of our allowance for loan losses. In light of the current conditions in the U.S. financial markets and economy, Congress and regulators have increased their focus on the regulation of the financial services industry. Any change in such regulation and oversight, whether in the form of regulatory policy, regulations, legislation or supervisory action, may have a material adverse impact on our business, financial condition or results of operations.
The Company may be subject to future goodwill impairment charges
During 2009, the Company recorded $80,310 in goodwill impairment charges in the second and fourth quarters. While the Company does not currently anticipate that there will be additional impairment charges required in the future, it can make no guarantees that none will be taken. If more impairment is recorded, it will have a negative impact on future earnings.
Risks Related to the Company's Stock
We may not be able to pay dividends in the future in accordance with past practice.
The Company has traditionally paid a quarterly dividend to common stockholders. The payment of dividends is subject to legal and regulatory restrictions. Any payment of dividends in the future will depend, in large part, on the Company's earnings, capital requirements, financial condition and other factors considered relevant by the Company's Board of Directors. Starting in the second quarter of 2009 and continuing to the present, the Company reduced the amount of cash dividends paid. This reduction was made to preserve capital levels at the Company. The Company may also be limited in the amount of dividends paid out as a result of its participation in the Department of the Treasury Capital Purchase Program.
The price of the Company's common stock may be volatile, which may result in losses for investors.
General market price declines or market volatility in the future could adversely affect the price of the Company's common stock. In addition, the following factors may cause the market price for shares of the Company's common stock to fluctuate:
- •
- announcements of developments related to the Company's business;
- •
- fluctuations in the Company's results of operations;
- •
- sales or purchases of substantial amounts of the Company's securities in the marketplace;
- •
- general conditions in the Company's banking niche or the worldwide economy;
- •
- a shortfall or excess in revenues or earnings compared to securities analysts' expectations;
- •
- changes in analysts' recommendations or projections; and
- •
- the Company's announcement of new acquisitions or other projects.
13
The Company's participation in Treasury's Capital Purchase Program (CPP) may adversely affect the value of its common stock and the rights of its common stockholders.
The rights of the holders of the Company's common stock may be adversely affected by the Company's participation in the CPP. For example:
- •
- Prior to the earlier of January 16, 2012 and the date on which all of the Preferred Shares have been redeemed by
the Company or transferred by Treasury to third parties, the Company may not, without the consent of Treasury, subject to limited exceptions, redeem, repurchase, or otherwise acquire shares of the
Company's common stock or preferred stock.
- •
- The Company may not pay dividends on its common stock unless it has fully paid all required dividends on the Preferred
Shares. Although the Company fully expects to be able to pay all required dividends on the Preferred Shares, there is no guarantee that it will be able to do so.
- •
- As long as the Treasury owns the securities purchased from the Company under the CPP, the Company may not, without the
prior consent of the Treasury, increase the quarterly dividends it pays on its common stock above $0.145 per share.
- •
- The Preferred Shares will receive preferential treatment in the event of liquidation, dissolution, or winding up of the
Company.
- •
- The ownership interest of the existing holders of the Company's common stock will be diluted to the extent the warrant the Company issued to Treasury in conjunction with the sale to Treasury of the Preferred Shares is exercised.
In addition, terms of the Preferred Shares require that quarterly dividends be paid on the Preferred Shares at the rate of 5% per annum for the first five years and 9% per annum thereafter until the stock is redeemed by the Company. The payments of these dividends will decrease the excess cash the Company otherwise has available to pay dividends on its common stock and to use for general corporate purposes, including working capital.
The Company's charter documents and federal regulations may inhibit a takeover, prevent a transaction that may favor or otherwise limit the Company's growth opportunities, which could cause the market price of the Company's common stock to decline.
Certain provisions of the Company's charter documents and federal regulations could have the effect of making it more difficult for a third party to acquire, or of discouraging a third party from attempting to acquire, control of the Company. In addition, the Company must obtain approval from regulatory authorities before acquiring control of any other company.
ITEM 1B. UNRESOLVED STAFF COMMENTS.
None.
As of December 31, 2009, the Company leased an office building from one of its subsidiaries for use as its corporate headquarters. The Company's subsidiaries own, or lease, all of the facilities from which they conduct business. All leases are comparable to other leases in the respective market areas and do not contain provisions materially detrimental to the Company or its subsidiaries. As of December 31, 2009 the Company had 85 banking locations. In addition, the Company operates twelve insurance offices in Indiana and one in Illinois. At December 31, 2009, the Company had approximately $49,499 invested in premises and equipment.
The Company and its subsidiaries may be parties (both plaintiff and defendant) to ordinary litigation incidental to the conduct of business. Management is presently not aware of any material pending or contemplated legal proceedings.
ITEM 4. (REMOVED AND RESERVED)
14
ITEM 5. MARKET FOR THE REGISTRANT'S COMMON EQUITY, RELATED STOCKHOLDER MATTERS AND ISSUER'S PURCHASES OF EQUITY SECURITIES
Market Information
The Company's Common Stock is traded on the NASDAQ Stock Market under the symbol MSFG. The Common Stock was held by approximately 5,000 shareholders at March 10, 2010. The quarterly high and low closing prices for the Company's common stock as reported by NASDAQ and quarterly cash dividends declared and paid are set forth in the tables below. All per share data is retroactively restated for all stock dividends and splits.
The range of known per share prices by calendar quarter, based on actual transactions, excluding commissions, is shown below.
| |
Market Prices | ||||||||||||
|---|---|---|---|---|---|---|---|---|---|---|---|---|---|
| 2009 |
Q1 |
Q2 |
Q3 |
Q4 |
|||||||||
High |
$ | 15.16 | $ | 10.35 | $ | 7.74 | $ | 7.04 | |||||
Low |
$ | 4.85 | $ | 7.00 | $ | 5.64 | $ | 4.45 | |||||
2008 |
Q1 |
Q2 |
Q3 |
Q4 |
|||||||||
High |
$ | 16.51 | $ | 17.59 | $ | 21.27 | $ | 21.02 | |||||
Low |
$ | 12.15 | $ | 13.45 | $ | 13.98 | $ | 12.74 | |||||
| |
Cash Dividends | ||||||||||||
2009 |
Q1 |
Q2 |
Q3 |
Q4 |
|||||||||
|
$ | 0.145 | $ | 0.050 | $ | 0.050 | $ | 0.010 | |||||
2008 |
Q1 |
Q2 |
Q3 |
Q4 |
|||||||||
|
$ | 0.140 | $ | 0.145 | $ | 0.145 | $ | 0.145 | |||||
It is expected that the Company will continue to pay its reduced dividend for the foreseeable future, until the Company determines that its results of operations, its capital levels and other external factors beyond management's control make it prudent to raise the dividend, and until the Company determines that its earnings are sufficient to repurchase the preferred shares held by the U.S. Treasury pursuant to Treasury's Capital Purchase Program. As a participant in the U.S. Treasury's Capital Purchase Program, the Company is prohibited from increasing cash dividends on common stock above $0.145 per share per quarter without prior government permission for a period of three years from the date of participation, which was January 16, 2009, unless the preferred shares issued to Treasury are no longer held by Treasury. Additionally, no dividends may be paid on the common stock unless and until all accrued and unpaid dividends for all past dividend periods owed to the Treasury on the preferred shares are fully paid. See Note 27 to the Consolidated Financial Statements for additional details on the Company's participation in the Capital Purchase Program.
Equity Compensation Plan Information
The following table sets forth information regarding securities authorized for issuance under the Company's equity compensation plans as of December 31, 2009:
| Plan category |
Number of securities to be issued upon exercise of outstanding options, warrants and rights (a) |
Weighted-average exercise price of outstanding options, warrants and rights (b) |
Number of securities remaining available for future issuance under equity compensation plans (excluding securities reflected in column (a)) (c) |
|||||||
|---|---|---|---|---|---|---|---|---|---|---|
Equity compensation plans approved by security holders |
429,608 | $ | 13.30 | 453,833 | ||||||
Equity compensation plans not approved by security holders |
— | — | — | |||||||
Total |
429,608 | $ | 13.30 | 453,833 | ||||||
15
Stock Performance Graph
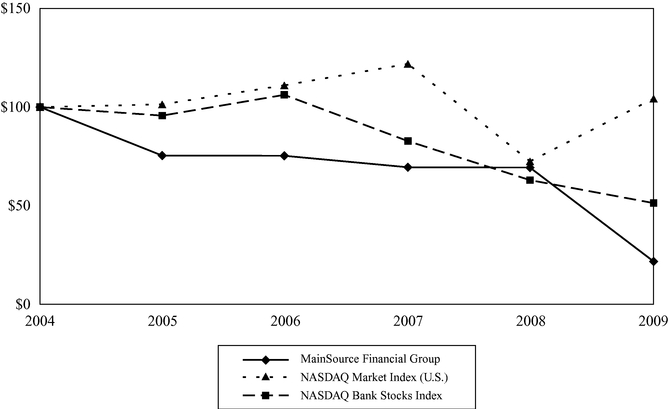
The following performance graph compares the performance of our common shares to the performance of the NASDAQ Market Index (U.S.) and the NASDAQ Bank Stocks Index for the 60 months ended December 31, 2009. The graph assumes an investment of $100 in each of the Company's common shares, the NASDAQ Market Index (U.S.) and the NASDAQ Bank Stocks Index on December 31, 2004.
| |
12/31/04 |
12/31/05 |
12/31/06 |
12/31/07 |
12/31/08 |
12/31/09 |
|||||||||||||
|---|---|---|---|---|---|---|---|---|---|---|---|---|---|---|---|---|---|---|---|
MainSource Financial Group |
$ | 100.00 | $ | 75.41 | $ | 75.30 | $ | 69.48 | $ | 69.31 | $ | 21.72 | |||||||
NASDAQ MARKET INDEX (U.S.) |
100.00 | 101.37 | 111.03 | 121.92 | 72.49 | 104.31 | |||||||||||||
NASDAQ Bank Stocks Index |
100.00 | 95.67 | 106.20 | 82.76 | 62.96 | 51.31 | |||||||||||||
16
ITEM 6. SELECTED FINANCIAL DATA
Selected Financial Data
(Dollar amounts in thousands except per share data)
| |
2009 |
2008 |
2007 |
2006 |
2005 |
|||||||||||||
|---|---|---|---|---|---|---|---|---|---|---|---|---|---|---|---|---|---|---|
Results of Operations |
||||||||||||||||||
Net interest income |
$ | 98,008 | $ | 87,525 | $ | 74,397 | $ | 68,268 | $ | 53,648 | ||||||||
Provision for loan losses |
46,310 | 20,918 | 5,745 | 1,819 | 1,040 | |||||||||||||
Noninterest income |
40,050 | 29,697 | 28,126 | 23,039 | 17,332 | |||||||||||||
Noninterest expense |
167,532 | 72,773 | 68,020 | 59,642 | 48,576 | |||||||||||||
Income (loss) before income tax |
(75,784 | ) | 23,531 | 28,758 | 29,846 | 21,364 | ||||||||||||
Income tax (benefit) |
(11,645 | ) | 4,379 | 6,888 | 7,605 | 5,172 | ||||||||||||
Net income (loss) |
(64,139 | ) | 19,152 | 21,870 | 22,241 | 16,192 | ||||||||||||
Preferred dividends and accretion |
(2,919 | ) | — | — | — | — | ||||||||||||
Net income (loss) available to common shareholders |
(67,058 | ) | 19,152 | 21,870 | 22,241 | 16,192 | ||||||||||||
Dividends paid on common stock |
5,135 | 11,133 | 10,392 | 8,944 | 6,514 | |||||||||||||
Per Common Share* |
||||||||||||||||||
Earnings (loss) per share (basic) |
$ | (3.33 | ) | $ | 1.00 | $ | 1.17 | $ | 1.30 | $ | 1.23 | |||||||
Earnings (loss) per share (diluted) |
(3.33 | ) | 1.00 | 1.17 | 1.29 | 1.23 | ||||||||||||
Dividends paid |
0.255 | 0.575 | 0.555 | 0.529 | 0.495 | |||||||||||||
Book value — end of period |
11.84 | 14.90 | 14.22 | 13.50 | 11.39 | |||||||||||||
Market price — end of period |
4.78 | 15.50 | 15.56 | 16.94 | 17.00 | |||||||||||||
At Year End |
||||||||||||||||||
Total assets |
$ | 2,906,530 | $ | 2,899,835 | $ | 2,536,437 | $ | 2,429,773 | $ | 1,645,605 | ||||||||
Investment securities |
714,607 | 513,310 | 489,739 | 485,259 | 450,814 | |||||||||||||
Loans, excluding held for sale |
1,885,447 | 1,995,601 | 1,693,678 | 1,574,384 | 957,995 | |||||||||||||
Allowance for loan losses |
46,648 | 34,583 | 14,331 | 12,792 | 10,441 | |||||||||||||
Total deposits |
2,270,650 | 2,009,324 | 1,901,829 | 1,859,689 | 1,352,697 | |||||||||||||
Federal Home Loan Bank advances |
222,265 | 433,167 | 257,099 | 208,443 | 41,547 | |||||||||||||
Subordinated debentures |
49,966 | 49,816 | 41,239 | 41,239 | 29,898 | |||||||||||||
Shareholders' equity |
294,462 | 299,949 | 264,102 | 253,247 | 161,069 | |||||||||||||
Financial Ratios |
||||||||||||||||||
Return on average assets |
(2.19 | )% | 0.73 | % | 0.90 | % | 1.06 | % | 1.04 | % | ||||||||
Return on average common shareholders' equity |
(22.61 | ) | 6.90 | 8.49 | 10.39 | 11.27 | ||||||||||||
Allowance for loan losses to total loans (year end, excluding held for sale) |
2.47 | 1.73 | 0.85 | 0.81 | 1.09 | |||||||||||||
Allowance for loan losses to total non-performing loans (year end) |
58.05 | 58.31 | 69.93 | 73.18 | 102.19 | |||||||||||||
Shareholders' equity to total assets (year end) |
10.13 | 10.34 | 10.41 | 10.42 | 9.79 | |||||||||||||
Average equity to average total assets |
11.59 | 10.57 | 10.57 | 10.13 | 9.18 | |||||||||||||
Dividend payout ratio |
NM | 58.13 | 47.52 | 40.21 | 40.23 | |||||||||||||
- *
- Adjusted
for stock split and dividends
- NM
- Not meaningful
17
ITEM 7. MANAGEMENT'S DISCUSSION AND ANALYSIS OF FINANCIAL CONDITION AND RESULTS OF OPERATIONS
Management's Discussion and Analysis
(Dollar amounts in thousands except per share data)
Forward-Looking Statements
Except for historical information contained herein, the discussion in this Annual Report includes certain forward-looking statements based upon management expectations. Actual results and experience could differ materially from the anticipated results or other expectations expressed in the Company's forward-looking statements. The Company disclaims any intent or obligation to update such forward looking statements. Factors which could cause future results to differ from these expectations include the following: general economic conditions; legislative and regulatory initiatives; monetary and fiscal policies of the federal government; deposit flows; the cost of funds; general market rates of interest; interest rates on competing investments; demand for loan products; demand for financial services; changes in accounting policies or guidelines; changes in the quality or composition of the Company's loan and investment portfolios; the Company's ability to integrate acquisitions, the impact of our continuing acquisition strategy, and other factors, including the risk factors set forth in Item 1A of this Annual Report on Form 10-K and in other reports we file from time to time with the Securities and Exchange Commission. The Company intends the forward looking statements set forth herein to be covered by the safe harbor provisions for forward looking statements contained in the Private Securities Litigation Reform Act of 1995.
Overview
MainSource Financial Group, Inc. ("MainSource" or the "Company") is a financial holding company whose principal activity is the ownership and management of its wholly owned subsidiary bank: MainSource Bank headquartered in Greensburg, Indiana (the "Bank"). The Bank operates under an Indiana state charter and is subject to regulation by the Indiana Department of Financial Institutions and the Federal Deposit Insurance Corporation. Non-banking subsidiaries include MainSource Insurance, LLC and MainSource Title, LLC. Both of these subsidiaries are subject to regulation by the Indiana Department of Insurance.
Business Strategy
The Company operates under the broad tenets of a long-term strategic plan ("Plan") designed to improve the Company's financial performance, expand its competitive position and enhance long-term shareholder value. The Plan is premised on the belief of the Company's Board of Directors that it can best promote long-term shareholder interests by pursuing strategies which will continue to preserve its community-focused philosophy. The dynamics of the Plan assure continually evolving goals, with the enhancement of shareholder value being the constant, overriding objective. The extent of the Company's success will depend upon how well it anticipates and responds to competitive changes within its markets, the interest rate environment and other external forces.
Results of Operations
Net income/(loss) attributable to common shareholders was $(67,058) in 2009, $19,152 in 2008, and $21,870 in 2007. Earnings/(loss) per common share on a fully diluted basis were $(3.33) in 2009, $1.00 in 2008, and $1.17 in 2007. The primary drivers that led to the decrease in net income in 2009 were an $80,310 goodwill impairment charge and an increase in the Company's loan loss provision expense of $25,392. Offsetting these items was an increase in net interest income of $10,483 and mortgage banking income of $6,463. An increase in earning assets of $311,303 primarily due to acquisition activity resulted in higher net interest income and the low mortgage interest rate environment during 2009 led to increased refinancing activity. The decrease from 2007 to 2008 in overall net income and earnings per share was primarily attributable to the $15,173 increase in the Company's loan loss provision expense. The increase in provision expense was partially offset by an increase of $13,128 in net interest income as the Company's net interest margin increased by 30 basis points year over year and average earning assets increased $187,237. Key measures of the operating performance of the Company are return on average assets, return on average common shareholders' equity, and efficiency ratio. The Company's return on average assets was (2.19)% for 2009 compared to 0.73% for 2008 and 0.90% in 2007. The Company's return on average common shareholders' equity was (22.6)% in 2009 compared to 6.9% in 2008 and 8.5% in 2007. The Company's efficiency ratio, which measures the non-interest expenses of the Company as a percentage of its net interest income (on a fully taxable equivalent basis) and its non-interest income, was 61.6% in 2009 (excluding the goodwill impairment charge of $80,310) compared to 60.7% in 2008 and 64.4% in 2007.
Net Interest Income
Net interest income and net interest margin are influenced by the volume and yield or cost of earning assets and interest-bearing liabilities. Tax equivalent net interest income of $103,173 in 2009 increased from $91,358 in 2008. Net interest margin, on a
18
fully-taxable equivalent basis, was 3.89% for 2009 compared to 3.90% for the same period a year ago. The Company was able to match reductions in its yield on earning assets with a corresponding reduction in its cost of funds. Over the three year period interest income has been stable as increases in earning assets have offset decreases in yield. Yields on loans decreased over the past three years as variable rate loans have adjusted downward. This is most notable in commercial loans, as the prime rate was flat throughout 2009 at 3.25%, after trending downward during 2008. The Federal Reserve Bank continues to target the fed funds rate at 0%-.25%. A significant portion of the Company's CDs matured in 2009 and we were able to reprice those deposits to current, lower market rates.
The following table summarizes net interest income (on a tax-equivalent basis) for each of the past three years.
Average Balance Sheet and Net Interest Analysis (Taxable Equivalent Basis)*
| |
2009 |
2008 |
2007 |
||||||||||||||||||||||||||||
|---|---|---|---|---|---|---|---|---|---|---|---|---|---|---|---|---|---|---|---|---|---|---|---|---|---|---|---|---|---|---|---|
| |
|||||||||||||||||||||||||||||||
| Assets |
Average Balance |
Interest |
Average Rate |
Average Balance |
Interest |
Average Rate |
Average Balance |
Interest |
Average Rate |
||||||||||||||||||||||
| |
|||||||||||||||||||||||||||||||
Short-term investments |
$ | 1,933 | $ | 11 | 0.57 | % | $ | 1,993 | $ | 36 | 1.81 | % | $ | 2,601 | $ | 131 | 5.04 | % | |||||||||||||
Federal funds sold and money market accounts |
54,496 | 128 | 0.23 | 8,303 | 158 | 1.90 | 10,458 | 575 | 5.50 | ||||||||||||||||||||||
Securities |
|||||||||||||||||||||||||||||||
Taxable |
432,091 | 19,565 | 4.53 | 398,851 | 20,395 | 5.11 | 401,006 | 19,661 | 4.90 | ||||||||||||||||||||||
Non-taxable* |
181,591 | 11,789 | 6.49 | 139,498 | 8,763 | 6.28 | 121.737 | 7,621 | 6.26 | ||||||||||||||||||||||
Total securities |
613,682 | 31,354 | 5.11 | 538,349 | 29,158 | 5.42 | 522,743 | 27,282 | 5.22 | ||||||||||||||||||||||
Loans** |
|||||||||||||||||||||||||||||||
Commercial |
1,203,955 | 67,585 | 5.61 | 975,499 | 63,272 | 6.49 | 770,269 | 55,243 | 7.17 | ||||||||||||||||||||||
Residential real estate |
465,462 | 29,753 | 6.39 | 508,019 | 33,802 | 6.65 | 556,136 | 41,625 | 7.48 | ||||||||||||||||||||||
Consumer |
312,149 | 19,575 | 6.27 | 308,211 | 22,066 | 7.16 | 290,930 | 23,177 | 7.97 | ||||||||||||||||||||||
Total loans |
1,981,566 | 116,913 | 5.90 | 1,791,729 | 119,140 | 6.65 | 1,617,335 | 120,045 | 7.42 | ||||||||||||||||||||||
Total earning assets |
2,651,677 | 148,406 | 5.60 | 2,340,374 | 148,492 | 6.34 | 2,153,137 | 148,033 | 6.88 | ||||||||||||||||||||||
Cash and due from banks |
44,266 |
52,698 |
56,498 |
||||||||||||||||||||||||||||
Unrealized gains (losses) on securities |
14,036 | 1,896 | (4,634 | ) | |||||||||||||||||||||||||||
Allowance for loan losses |
(46,308 | ) | (19,747 | ) | (13,296 | ) | |||||||||||||||||||||||||
Premises and equipment,net |
51,086 | 43,885 | 39,829 | ||||||||||||||||||||||||||||
Intangible assets |
129,180 | 138,079 | 136,189 | ||||||||||||||||||||||||||||
Accrued interest receivable and other assets |
86,966 | 71,367 | 70,789 | ||||||||||||||||||||||||||||
Total assets |
$ | 2,930,903 | $ | 2,628,552 | $ | 2,438,512 | |||||||||||||||||||||||||
Liabilities |
|||||||||||||||||||||||||||||||
Interest-bearing deposits DDA, savings, and money market accounts |
$ | 1,029,035 | $ | 7,177 | 0.70 | $ | 864,842 | $ | 10,017 | 1.16 | $ | 776,693 | $ | 14,853 | 1.91 | ||||||||||||||||
Certificates of deposit |
928,689 | 25,320 | 2.73 | 873,731 | 32,052 | 3.67 | 864,074 | 38,820 | 4.49 | ||||||||||||||||||||||
Total interest-bearing deposits |
1,957,724 | 32,497 | 1.66 | 1,738,573 | 42,069 | 2.42 | 1,640,767 | 53,673 | 3.27 | ||||||||||||||||||||||
Short-term borrowings |
50,885 | 442 | 0.87 | 44,913 | 1,293 | 2.88 | 48,943 | 1,856 | 3.79 | ||||||||||||||||||||||
Subordinated debentures |
49,000 | 2,059 | 4.20 | 43,000 | 2,782 | 6.47 | 41,239 | 3,333 | 8.08 | ||||||||||||||||||||||
Notes payable and FHLB borrowings |
269,443 | 10,235 | 3.80 | 297,333 | 10,990 | 3.70 | 236,706 | 11,568 | 4.89 | ||||||||||||||||||||||
Total interest-bearing liabilities |
2,327,052 | 45,233 | 1.94 | 2,123,819 | 57,134 | 2.69 | 1,967,655 | 70,430 | 3.58 | ||||||||||||||||||||||
Demand deposits |
238,411 | 203,979 | 190,162 | ||||||||||||||||||||||||||||
Other liabilities |
25,886 | 23,059 | 23,062 | ||||||||||||||||||||||||||||
Total liabilities |
2,591,349 | 2,350,857 | 2,180,879 | ||||||||||||||||||||||||||||
Shareholders' equity |
339,554 | 277,695 | 257,633 | ||||||||||||||||||||||||||||
Total liabilities and shareholders' equity |
$ | 2,930,903 | 45,233 | 1.71 | *** | $ | 2,628,552 | 57,134 | 2.44 | *** | $ | 2,438,512 | 70,430 | 3.27 | *** | ||||||||||||||||
Net interest income |
$ | 103,173 | 3.89 | **** | $ | 91,358 | 3.90 | **** | $ | 77,603 | 3.60 | **** | |||||||||||||||||||
Conversion of tax exempt income to a fully taxable equivalent basis using a marginal rate of 35% |
$ | 5,165 | $ | 3,833 | $ | 3,206 | |||||||||||||||||||||||||
- *
- Adjusted
to reflect income related to securities and loans exempt from Federal income taxes.
- **
- Nonaccruing
loans have been included in the average balances.
- ***
- Total
interest expense divided by total earning assets.
- ****
- Net interest income divided by total earning assets.
19
The following table sets forth for the periods indicated a summary of the changes in interest income and interest expense resulting from changes in volume and changes in rates.
Volume/Rate Analysis of Changes in Net Interest Income
(Tax Equivalent Basis)
| |
2009 OVER 2008 | 2008 OVER 2007 | ||||||||||||||||||||
|---|---|---|---|---|---|---|---|---|---|---|---|---|---|---|---|---|---|---|---|---|---|---|
| |
Volume |
Rate |
Total |
Volume |
Rate |
Total |
||||||||||||||||
Interest income |
||||||||||||||||||||||
Loans |
$ | 11,211 | $ | (13,438 | ) | $ | (2,227 | ) | $ | 11,548 | $ | (12,453 | ) | $ | (905 | ) | ||||||
Securities |
3,865 | (1,669 | ) | 2,196 | 831 | 1,045 | 1,876 | |||||||||||||||
Federal funds sold and money market funds |
109 | (139 | ) | (30 | ) | (41 | ) | (376 | ) | (417 | ) | |||||||||||
Short-term investments |
— | (25 | ) | (25 | ) | (11 | ) | (84 | ) | (95 | ) | |||||||||||
Total interest income |
15,185 | (15,271 | ) | (86 | ) | 12,327 | (11,868 | ) | 459 | |||||||||||||
Interest expense |
||||||||||||||||||||||
Interest-bearing DDA, savings, and money market accounts |
$ | 1,138 | $ | (3,978 | ) | $ | (2,840 | ) | $ | 1,021 | $ | (5,857 | ) | $ | (4,836 | ) | ||||||
Certificates of deposit |
1,481 | (8,213 | ) | (6,732 | ) | 354 | (7,122 | ) | (6,768 | ) | ||||||||||||
Borrowings |
(716 | ) | (890 | ) | (1,606 | ) | 2,125 | (3,266 | ) | (1,141 | ) | |||||||||||
Subordinated debentures |
253 | (976 | ) | (723 | ) | 114 | (665 | ) | (551 | ) | ||||||||||||
Total interest expense |
2,156 | (14,057 | ) | (11,901 | ) | 3,614 | (16,910 | ) | (13,296 | ) | ||||||||||||
Change in net interest income |
$ | 13,029 | $ | (1,214 | ) | 11,815 | $ | 8,713 | $ | 5,042 | 13,755 | |||||||||||
Change in tax equivalent adjustment |
1,332 | 627 | ||||||||||||||||||||
Change in net interest income before tax equivalent adjustment |
$ | 10,483 | $ | 13,128 | ||||||||||||||||||
Variances not attributed to rate or volume are allocated equally between rate and volume.
Provision for Loan Losses
The Company expensed $46,310 in provision for loan losses in 2009. This level of provision allowed the Company to maintain an adequate allowance for loan losses. This topic is discussed in detail under the heading "Loans, Credit Risk and the Allowance and Provision for Loan Losses".
Non-interest Income and Expense
| |
|
|
|
Percent Change | |||||||||||||||
|---|---|---|---|---|---|---|---|---|---|---|---|---|---|---|---|---|---|---|---|
| |
2009 |
2008 |
2007 |
09/08 |
08/07 |
||||||||||||||
Non-interest income |
|||||||||||||||||||
Insurance commissions |
$ | 2,071 | $ | 2,073 | $ | 1,864 | -0.1% | 11.2% | |||||||||||
Mortgage banking |
9,028 | 2,565 | 2,921 | 252.0% | -12.2% | ||||||||||||||
Trust and investment product fees |
1,743 | 1,575 | 1,569 | 10.7% | 0.4% | ||||||||||||||
Service charges on deposit accounts |
16,537 | 14,555 | 13,312 | 13.6% | 9.3% | ||||||||||||||
Net realized gains on securities sales |
1,263 | 1,118 | 114 | 13.0% | 880.7% | ||||||||||||||
Increase in cash surrender value of life insurance |
890 | 967 | 1,535 | -8.0% | -37.0% | ||||||||||||||
Interchange income |
5,178 | 3,600 | 3,159 | 43.8% | 14.0% | ||||||||||||||
Other |
3,340 | 3,244 | 3,652 | 3.0% | -11.2% | ||||||||||||||
Total non-interest income |
$ | 40,050 | $ | 29,697 | $ | 28,126 | 34.9% | 5.6% | |||||||||||
Non-interest expense |
|||||||||||||||||||
Salaries and employee benefits |
$ | 46,342 | $ | 41,033 | $ | 38,063 | 12.9% | 7.8% | |||||||||||
Net occupancy |
6,660 | 6,061 | 5,347 | 9.9% | 13.4% | ||||||||||||||
Equipment |
7,468 | 6,496 | 5,788 | 15.0% | 12.2% | ||||||||||||||
Intangibles amortization |
2,199 | 2,607 | 2,666 | -15.7% | -2.2% | ||||||||||||||
Telecommunications |
2,015 | 1,863 | 1,924 | 8.2% | -3.2% | ||||||||||||||
Stationery, printing, and supplies |
1,608 | 1,374 | 1,475 | 17.0% | -6.8% | ||||||||||||||
FDIC assessment |
4,976 | 741 | 215 | 571.5% | 244.7% | ||||||||||||||
Marketing |
3,040 | 1,645 | 1,225 | 84.8% | 34.3% | ||||||||||||||
Goodwill impairment |
80,310 | — | — | — | — | ||||||||||||||
Other |
12,914 | 10,953 | 11,317 | 17.9% | -3.2% | ||||||||||||||
Total non-interest expense |
$ | 167,532 | $ | 72,773 | $ | 68,020 | 130.2% | 7.0% | |||||||||||
20
Non-interest Income
Non-interest income was $40,050 for 2009 compared to $29,697 for the same period in 2008, an increase of $10,353 or 34.9%. Increases in mortgage banking, service charges on deposit accounts, and interchange income were the primary causes of the increase. The low mortgage rates offered by Freddie Mac throughout the year resulted in increased mortgage refinance activity throughout 2009. In addition, the Company expanded its geographic footprint and the markets it serves through acquisition activity in the latter part of 2008 and the first half of 2009. An increase in deposit accounts from the full year effect of recent acquisitions resulted in increased service charges and interchange income. Non-interest income as a percent of non-interest expense was 23.9% for 2009 compared to 40.8% for 2008. The decrease was caused by the goodwill impairment charge taken in 2009.
Total non-interest income was $29,697 for 2008 compared to $28,126 for 2007, an increase of $1,571 and 5.6% Increases in service charges on deposit accounts, interchange income and gains on the sale of investment securities were offset by the decrease in mortgage banking income and a reduction in income related to bank-owned life insurance policies as the Company recorded a $400 charge on its separate account investments. Despite an increase in the level of mortgage loans originated for sale, mortgage banking income decreased as the Company incurred an impairment charge of $1,226 related to its mortgage servicing rights.
Non-interest Expense
Total non-interest expense was $167,532 in 2009 compared to $72,773 in 2008, an increase of $94,759 and 130.2%. The increase was primarily attributable to goodwill impairment charges of $80,310. Based on the Company's annual testing of goodwill for impairment, it was determined that goodwill was impaired and an impairment charge of $45,076 was taken in the second quarter and a $35,234 charge was taken in the fourth quarter. To a smaller degree, additional FDIC premiums of $4,235 and normal employee merit increases, a slight increase in the number of full-time equivalent employees, and additional branches as a result of acquisition activity caused increases in non-interest expenses.
Total non-interest expense was $72,773 in 2008 compared to $68,020 in 2007, an increase of $4,753 and 7.0%. The increase was primarily attributable to the acquisition of 1st Independence Bancorp, Inc. in August 2008, severance costs related to the resignation of the Company's former Chief Executive Officer, and normal employee merit increases.
Income Taxes
The effective tax rate was 15.4% in 2009, 18.6% in 2008, and 24.0% in 2007. The decrease in the Company's effective tax rate from 2008 to 2009 was primarily due to the non-deductibility of a portion of the goodwill impairment taken as well as lower pretax earnings. The decrease in the Company's effective tax rate from 2007 to 2008 was primarily attributable to lower pretax earnings with earnings from tax exempt assets remaining relatively flat. The Company and its subsidiaries file consolidated income tax returns.
Balance Sheet
At December 31, 2009, total assets were $2,906,530 compared to $2,899,835 at December 31, 2008, an increase of $7 million. Increases in securities and other assets were offset by decreases in cash and cash equivalents, loans, and goodwill.
Loans, Credit Risk and the Allowance and Provision for Loan Losses
Loans remain the Company's largest concentration of assets and continue to represent the greatest potential risk. The loan underwriting standards observed by the Bank are viewed by management as a means of controlling problem loans and the resulting charge-offs. The Company also believes credit risks may be elevated if undue concentrations of loans in specific industry segments and to out-of-area borrowers are incurred. Accordingly, the Company's Board of Directors regularly monitors such concentrations to determine compliance with its loan concentration policy. The Company believes it has no undue concentrations of loans.
Total loans (excluding those held for sale) decreased by $110,154 from year-end 2008. Approximately half of this decrease was in the Company's residential real estate portfolio as the majority of newly-originated fixed rate mortgage loans were sold to the secondary market. The remaining decrease was the result of reduced loan demand primarily in the construction and development area during 2009. Residential real estate loans continue to represent the largest portion of the total loan portfolio and were 43% of total loans at December 31, 2009 compared to 44% of total loans at the end of 2008.
21
The following table details the Company's loan portfolio by type of loan.
Loan Portfolio
| |
December 31 | |||||||||||||||||
|---|---|---|---|---|---|---|---|---|---|---|---|---|---|---|---|---|---|---|
| |
2009 |
2008 |
2007 |
2006 |
2005 |
|||||||||||||
Types of loans |
||||||||||||||||||
Commercial and industrial |
$ | 195,509 | $ | 226,696 | $ | 214,393 | $ | 173,557 | $ | 149,074 | ||||||||
Agricultural production financing |
41,889 | 40,334 | 29,812 | 25,588 | 23,871 | |||||||||||||
Farm real estate |
45,332 | 45,918 | 42,185 | 46,051 | 38,833 | |||||||||||||
Commercial real estate mortgage |
551,670 | 515,964 | 376,759 | 326,284 | 202,047 | |||||||||||||
Residential real estate mortgage |
813,602 | 877,145 | 780,102 | 790,962 | 368,953 | |||||||||||||
Construction and development |
142,472 | 173,551 | 123,611 | 82,261 | 51,736 | |||||||||||||
Consumer |
94,973 | 115,993 | 126,816 | 129,681 | 123,481 | |||||||||||||
Total loans |
$ | 1,885,447 | $ | 1,995,601 | $ | 1,693,678 | $ | 1,574,384 | $ | 957,995 | ||||||||
The following table indicates the amounts of loans (excluding residential and commercial mortgages and consumer loans) outstanding as of December 31, 2009 which, based on remaining scheduled repayments of principal, are due in the periods indicated.
Maturities and Sensitivity to Changes in Interest Rates of Commercial and Construction Loans
| |
Due: |
Within 1 Year |
1-5 Years |
Over 5 years |
Total |
|||||||||||
|---|---|---|---|---|---|---|---|---|---|---|---|---|---|---|---|---|
| Loan Type | ||||||||||||||||
| Commercial and industrial | $ | 13,678 | $ | 129,800 | $ | 52,031 | $ | 195,509 | ||||||||
| Agricultural production financing | 35,239 | 3,811 | 2,839 | 41,889 | ||||||||||||
| Construction and development | 102,658 | 19,989 | 19,825 | 142,472 | ||||||||||||
| Totals | $ | 151,575 | $ | 153,600 | $ | 74,695 | $ | 379,870 | ||||||||
| Percent | 40% | 40% | 20% | 100% | ||||||||||||
Rate Sensitivity |
||||||||||||||||
| Fixed Rate | $ | 37,815 | $ | 26,606 | $ | 12,892 | $ | 77,313 | ||||||||
| Variable Rate | 251,874 | 49,259 | 1,424 | 302,557 | ||||||||||||
| Totals | $ | 289,689 | $ | 75,865 | $ | 14,316 | $ | 379,870 | ||||||||
Loans are placed on "non-accrual" status when, in management's judgment, the collateral value and/or the borrower's financial condition does not justify accruing interest. As a general rule, commercial and real estate loans are reclassified to nonaccrual status at or before becoming 90 days past due. Interest previously recorded is reversed and charged against current income. Subsequent interest payments collected on nonaccrual loans are thereafter applied as a reduction of the loan's principal balance. Non-performing loans were $80,353 as of December 31, 2009 compared to $59,310 as of December 31, 2008 and represented 4.26% of total loans at December 31, 2009 versus 2.97% one year ago.
The following table details the Company's non-performing loans as of December 31 for the years indicated.
Non-performing Loans
| |
2009 |
2008 |
2007 |
2006 |
2005 |
|||||||||||||
|---|---|---|---|---|---|---|---|---|---|---|---|---|---|---|---|---|---|---|
Nonaccruing loans |
$ | 77,074 | $ | 55,671 | $ | 18,800 | $ | 16,021 | $ | 9,984 | ||||||||
Accruing loans contractually past due 90 days or more |
3,279 | 3,639 | 1,693 | 1,460 | 233 | |||||||||||||
Total |
$ | 80,353 | $ | 59,310 | $ | 20,493 | $ | 17,481 | $ | 10,217 | ||||||||
% of total loans |
4.26% | 2.97% | 1.21% | 1.11% | 1.07% | |||||||||||||
22
Over 50% of the non-accrual loan balance was attributable to 13 large credit relationships over $1,000. These loans are primarily land development and real estate backed loans. The Company is working with these borrowers in an attempt to minimize its losses. The provision for loan losses was $46,310 in 2009, $20,918 in 2008, and $5,745 in 2007. The increase in the Company's provision in 2009 was primarily due to the increase in non-performing loans, the increase in net charge-offs during 2009, and the deterioration of the economy and real estate market. Net charge-offs were $34,245 in 2009 compared to $6,230 in 2008 and $4,206 in 2007. As a percentage of average loans, net charge-offs equaled 1.73%, 0.35%, and 0.26% in 2009, 2008 and 2007, respectively. The large increase in charge-offs in 2009 was primarily related to the deterioration in the economy and its effect on the real estate market.
Substandard loans that were not classified as non-accrual were $73,024 at December 31, 2009 and $39,339 at December 31, 2008. The large increase in this category of loans related to substandard commercial loans as they increased $33,735 from $34,793 at December 31, 2008 to $68,528 at December 31, 2009. Substandard mortgage loans totaled $4,070 and substandard installment loans were $426 at December 31, 2009. These loans are reviewed at least quarterly by senior management. Management believes these loans were well secured and had adequate allowance allocations at December 31, 2009.
Summary of the Allowance for Loan Losses
| |
2009 |
2008 |
2007 |
2006 |
2005 |
||||||||||||||
|---|---|---|---|---|---|---|---|---|---|---|---|---|---|---|---|---|---|---|---|
Balance at January 1 |
$ | 34,583 | $ | 14,331 | $ | 12,792 | $ | 10,441 | $ | 11,698 | |||||||||
Chargeoffs |
|||||||||||||||||||
Commercial |
8,686 | 1,866 | 1,642 | 1,653 | 1,164 | ||||||||||||||
Commercial real estate mortgage |
21,140 | 948 | 136 | — | 594 | ||||||||||||||
Residential real estate mortgage |
1,899 | 1,421 | 446 | 412 | 869 | ||||||||||||||
Consumer |
4,477 | 3,032 | 3,134 | 1,834 | 956 | ||||||||||||||
Total Chargeoffs |
36,202 | 7,267 | 5,358 | 3,899 | 3,583 | ||||||||||||||
Recoveries |
|||||||||||||||||||
Commercial |
350 | 214 | 258 | 65 | 46 | ||||||||||||||
Commercial real estate mortgage |
226 | 17 | — | — | — | ||||||||||||||
Residential real estate mortgage |
37 | 16 | 26 | 66 | 35 | ||||||||||||||
Consumer |
1,344 | 790 | 868 | 405 | 203 | ||||||||||||||
Total Recoveries |
1,957 | 1,037 | 1,152 | 536 | 284 | ||||||||||||||
Net Chargeoffs |
34,245 | 6,230 | 4,206 | 3,363 | 3,299 | ||||||||||||||
Addition resulting from acquisition |
— | 5,564 | — | 3,895 | 1,002 | ||||||||||||||
Provision for loan losses |
46,310 | 20,918 | 5,745 | 1,819 | 1,040 | ||||||||||||||
Balance at December 31 |
$ | 46,648 | $ | 34,583 | $ | 14,331 | $ | 12,792 | $ | 10,441 | |||||||||
Net Chargeoffs to average loans |
1.73% | 0.35% | 0.26% | 0.25% | 0.35% | ||||||||||||||
Provision for loan losses to average loans |
2.35% | 1.17% | 0.36% | 0.13% | 0.11% | ||||||||||||||
Allowance to total loans at year end |
2.47% | 1.73% | 0.85% | 0.81% | 1.09% | ||||||||||||||
23
Although the allowance for loan loss is available for any loan that, in management's judgment, should be charged off, the following table details the allowance for loan losses by loan category and the percent of loans in each category compared to total loans at December 31.
Allocation of the Allowance for Loan Losses
| |
2009 | 2008 | 2007 | 2006 | 2005 | |||||||||||||||||||||||||||||
|---|---|---|---|---|---|---|---|---|---|---|---|---|---|---|---|---|---|---|---|---|---|---|---|---|---|---|---|---|---|---|---|---|---|---|
| December 31 |
Amount |
Percent of loans to total loans |
Amount |
Percent of loans to total loans |
Amount |
Percent of loans to total loans |
Amount |
Percent of loans to total loans |
Amount |
Percent of loans to total loans |
||||||||||||||||||||||||
Real estate |
||||||||||||||||||||||||||||||||||
Residential |
$ | 9,449 | 43 | % | $ | 3,882 | 44 | % | $ | 2,652 | 46 | % | $ | 2,514 | 50 | % | $ | 1,018 | 39 | % | ||||||||||||||
Farm real estate |
647 | 2 | 344 | 2 | 251 | 3 | 247 | 3 | 625 | 4 | ||||||||||||||||||||||||
Commercial |
14,754 | 29 | 11,448 | 26 | 4,386 | 22 | 4,045 | 21 | 3,233 | 21 | ||||||||||||||||||||||||
Construction and development |
10,205 | 8 | 6,500 | 9 | 1,085 | 7 | 359 | 5 | 763 | 5 | ||||||||||||||||||||||||
Total real estate |
35,055 | 82 | 22,174 | 81 | 8,374 | 78 | 7,165 | 79 | 5,639 | 69 | ||||||||||||||||||||||||
Commercial |
||||||||||||||||||||||||||||||||||
Agribusiness |
1,126 | 2 | 303 | 2 | 167 | 2 | 138 | 2 | 412 | 3 | ||||||||||||||||||||||||
Other commercial |
7,880 | 11 | 7,632 | 11 | 2,593 | 13 | 2,189 | 11 | 2,440 | 16 | ||||||||||||||||||||||||
Total Commercial |
9,006 | 13 | 7,935 | 13 | 2,760 | 15 | 2,327 | 13 | 2,852 | 19 | ||||||||||||||||||||||||
Consumer |
2,587 | 5 | 4,072 | 6 | 3,114 | 7 | 2,053 | 8 | 1,435 | 12 | ||||||||||||||||||||||||
Unallocated |
— | 402 | 83 | 1,247 | 515 | |||||||||||||||||||||||||||||
Total |
$ | 46,648 | 100 | % | $ | 34,583 | 100 | % | $ | 14,331 | 100 | % | $ | 12,792 | 100 | % | $ | 10,441 | 100 | % | ||||||||||||||
Management maintains a list of loans warranting either the assignment of a specific reserve amount or other special administrative attention. This watch list, together with a listing of all classified loans, nonaccrual loans and delinquent loans, is reviewed monthly by management and the Board of Directors. Additionally, the Company evaluates its consumer and residential real estate loan pools for probable losses incurred based on historical trends, adjusted by current delinquency and non-performing loan levels.
The Company has both internal and external loan review personnel who annually review approximately 40% of all loans. External loan review personnel examine all commercial credit relationships over $1,000.
The ability to absorb loan losses promptly when problems are identified is invaluable to a banking organization. Most often, losses incurred as a result of prompt, aggressive collection actions are much lower than losses incurred after prolonged legal proceedings. Accordingly, the Company observes the practice of quickly initiating stringent collection efforts in the early stages of loan delinquency. During the latter part of 2008, the Company established a separate group to address its deteriorating credit quality. This group consists of six full-time equivalent employees and reports directly to the Chief Credit Officer of the Company. At the present time, this group is charged with the task of efficiently resolving non-performing credits and disposing of foreclosed properties.
During the fourth quarter of 2009, the Company realized a significant amount of loan charge-offs. Approximately $12 million of these charge-offs related to collateral dependent loans where the value of the collateral no longer supported the value of the loan due to declines in collateral values since origination. These charge-offs will impact future calculations of the allowance for loan losses as the historical loss ratios will increase for the commercial loan homogeneous pools.
The adequacy of the allowance for loan losses is reviewed at least quarterly. The determination of the provision amount in any period is based upon management's continuing review and evaluation of loan loss experience, changes in the composition of the loan portfolio, classified loans including non-accrual and impaired loans, current economic conditions, the amount of loans presently outstanding, and the amount and composition of loan growth. The Company's allowance for loan losses was $46,648, or 2.47% of total loans, at December 31, 2009 compared to $34,583, or 1.73% of total loans, at the end of 2008. The largest increases in the allowance occurred in the commercial, residential real estate, and construction and development loans. As the economy is still in the depth of the recession, home buying has virtually ceased, placing builders and developers in stressed financial condition. Borrowers have also been unable to continue to cash flow their business.
During 2008 the Company purchased certain loans that were subject to the accounting treatment under ASC 310 (see Note 5 to the Consolidated Financial Statements). At the time of acquisition, these loans had evidence of credit deterioration. In applying this
24
accounting standard, an allowance for loan losses was not carried over or established for these loans. Instead these loans are carried at their fair value at date of acquisition including consideration of expected cash flows to be received. The valuation allowance for these purchased loans as of December 31, 2009 was $818. Before the adoption of ASC 310, this valuation allowance would have been included in the allowance for loan losses balance. Had this amount been included in the allowance for loan losses amount at December 31, 2009, the allowance would have been $47,466, or 2.52% of total loans.
Investment Securities, at Fair Value
| |
December 31, | |||||||||||
|---|---|---|---|---|---|---|---|---|---|---|---|---|
| |
2009 |
2008 |
2007 |
|||||||||
Available for Sale |
||||||||||||
U.S. Government-sponsored entities |
$ | 14,387 | $ | 33,046 | $ | 31,964 | ||||||
State and municipal |
233,485 | 153,200 | 127,697 | |||||||||
Mortgage-backed |
459,049 | 318,500 | 323,206 | |||||||||
Equity and other |
7,686 | 8,564 | 6,872 | |||||||||
Total securities |
$ | 714,607 | $ | 513,310 | $ | 489,739 | ||||||
Securities offer flexibility in the Company's management of interest rate risk, and are the primary means by which the Company provides liquidity and responds to changing maturity characteristics of assets and liabilities. The Company's investment policy prohibits trading activities and does not allow investment in high-risk derivative products or junk bonds.
As of December 31, 2009, all of the securities are classified as "available for sale" ("AFS") and are carried at fair value with unrealized gains and losses, net of taxes, excluded from earnings and reported as a separate component of shareholders' equity. A net unrealized gain of $19,397 was recorded to adjust the AFS portfolio to current market value at December 31, 2009 compared to a net unrealized gain of $4,843 at December 31, 2008.
Investment Securities
(Carrying Values at December 31)
| |
Within 1 Year |
2-5 Yrs |
6-10 Yrs |
Beyond 10 Years |
Total 2009 |
||||||||||||||
|---|---|---|---|---|---|---|---|---|---|---|---|---|---|---|---|---|---|---|---|
Available for sale |
|||||||||||||||||||
Federal agencies |
$ | — | $ | 9,934 | $ | 4,453 | $ | — | $ | 14,387 | |||||||||
State and municipal |
1,268 | 17,615 | 66,606 | 147,996 | 233,485 | ||||||||||||||
Mortgage-backed securities |
2 | 1,260 | 79,723 | 378,064 | 459,049 | ||||||||||||||
Other securities |
— | — | — | 3,319 | 3,319 | ||||||||||||||
Total available for sale |
$ | 1,270 | $ | 28,809 | $ | 150,782 | $ | 529,379 | $ | 710,240 | |||||||||
Weighted average yield* |
6.33% | 5.12% | 5.01% | 5.14% | 5.11% | ||||||||||||||
- *
- Adjusted to reflect income related to securities exempt from federal income taxes.
Amounts in the table above are based on scheduled maturity dates. Variable interest rates are subject to change not less than annually based upon certain interest rate indexes. Expected maturities will differ from contractual maturities because issuers may have the right to call or prepay obligations with or without call or prepayment penalties. Equity securities of $4,367 do not have contractual maturities and are excluded from the table above.
As of December 31, 2009, there were no corporate bonds and other securities which represented more than 10% of shareholders' equity.
For 2009 the tax equivalent yield of the investment securities portfolio was 5.11%, compared to 5.42% and 5.22% for 2008 and 2007, respectively. The average life of the Company's investment securities portfolio was 5.06 years at December 31, 2009. During 2009 the investment portfolio significantly increased in size as excess cash, a by-product of loan run-off and deposit growth, was invested in portfolio holdings. Spreads on investment products tightened as confidence grew in an economic recovery leading to lower overall investment rates. The combination of these two events — lower reinvestment rates and increased portfolio size — caused the portfolio yield to decline. The portfolio credit risk remained low and allowed the portfolio to avoid any credit losses. Throughout 2009 investment opportunities were focused on balancing shorter cash flow horizons and maximizing earnings potential. Entering 2010 the portfolio is well positioned to manage the eventual increase in rates and improved lending environment.
25
The Company and its investment advisor monitor the securities portfolio on at least a quarterly basis for other-than-temporary impairment ("OTTI"). The amount of the OTTI recognized in earnings depends on whether the Company intends to sell the security or it is more likely than not it will be required to sell the security before recovery of its amortized cost basis, less any current-period credit loss. If an entity intends to sell or it is more likely than not it will be required to sell the security before recovery of its amortized cost basis, less any current-period credit loss, the OTTI shall be recognized in earnings equal to the entire difference between the investment's amortized cost basis and its fair value at the balance sheet date. If an entity does not intend to sell the security and it is not more likely than not that the entity will be required to sell the security before recovery of its amortized cost basis less any current-period loss, the OTTI shall be separated into the amount representing the credit loss and the amount related to all other factors. The amount of the total OTTI related to the credit loss is determined based on the present value of cash flows expected to be collected and is recognized in earnings. The amount of the total OTTI related to other factors is recognized in other comprehensive income, net of applicable taxes.
Sources of Funds
The Company relies primarily on customer deposits and securities sold under agreement to repurchase ("repurchase agreements"), along with shareholders' equity to fund earning assets. Federal Home Loan Bank ("FHLB") advances are used to provide additional funding. The Company also attempts to obtain deposits through branch and whole bank acquisitions.
Deposits generated within local markets provide the major source of funding for earning assets. Average total deposits were 82.9% of total average earning assets for both 2009 and 2008, respectively. Total interest-bearing deposits averaged 89.1% and 89.5% of average total deposits during 2009 and 2008. Management is continuing its efforts to increase the percentage of transaction-related deposits to total deposits due to the positive effect on earnings.
Repurchase agreements are high denomination investments utilized by public entities and commercial customers as an element of their cash management responsibilities. During 2009, repurchase agreements averaged $47,312, with an average cost of 0.85%.
Another source of funding is the Federal Home Loan Bank (FHLB). The Company had FHLB advances of $222,265 outstanding at December 31, 2009. These advances have interest rates ranging from 2.5% to 5.9% (see note 11 to the consolidated financial statements for the maturity schedule of these advances). The Company averaged $266,533 in FHLB advances during 2009 compared to $285,271 during 2008. This decrease in the average balance of FHLB borrowings was primarily due to the increased deposits generated by the Company which reduced the need for other funding sources. One final source of funding is federal funds purchased. The Company had no federal funds purchased as of December 31, 2009 and $41,715 at December 31, 2008.
Average Deposits
| |
2009 |
2008 |
2007 |
||||||||||||||||
|---|---|---|---|---|---|---|---|---|---|---|---|---|---|---|---|---|---|---|---|
| |
|||||||||||||||||||
| |
Amount |
Rate |
Amount |
Rate |
Amount |
Rate |
|||||||||||||
Demand |
$ | 238,411 | $ | 203,979 | $ | 190,162 | |||||||||||||
Interest Bearing Demand |
631,905 | 0.65% | 509,370 | 1.00% | 446,152 | 1.93% | |||||||||||||
Savings/Money Markets |
397,130 | 0.75 | 355,472 | 1.35 | 330,541 | 1.89 | |||||||||||||
Certificates of Deposit |
928,689 | 2.73 | 873,731 | 3.67 | 864,074 | 4.49 | |||||||||||||
Totals |
$ | 2,196,135 | 1.47% | $ | 1,942,552 | 2.16% | $ | 1,830,929 | 2.93% | ||||||||||
As of December 31, 2009, certificates of deposit and other time deposits of $100 or more mature as follows:
| |
3 months or less |
4-6 months |
6-12 months |
over 12 months |
Total |
|||||||||||
|---|---|---|---|---|---|---|---|---|---|---|---|---|---|---|---|---|
Amount |
$ | 61,417 | $ | 53,793 | $ | 76,232 | $ | 99,401 | $ | 290,843 | ||||||
Percent |
21% | 19% | 26% | 34% | ||||||||||||
Capital Resources
The Federal Reserve Board and other regulatory agencies have adopted risk-based capital guidelines that assign risk weightings to assets and off-balance sheet items. The Company's core capital ("Tier 1") consists of common shareholders' equity adjusted for unrealized gains or losses on available for sale (AFS) securities plus limited amounts of Trust Preferred Securities less goodwill and intangible assets. Total capital consists of core capital, certain debt instruments and a portion of the allowance for loan losses. At December 31, 2009, Tier 1 capital to average assets was 8.8%. Total capital to risk-weighted assets was 14.8%. Both ratios exceed all required ratios established for bank holding companies. Risk-adjusted capital levels of the Company's subsidiary bank also exceed regulatory definitions of well-capitalized institutions.
26
The Trust Preferred Securities (which are classified as subordinated debentures) qualify as Tier 1 capital or core capital with respect to the Company under the risk-based capital guidelines established by the Federal Reserve. Under such guidelines, capital received from the proceeds of the sale of these securities cannot constitute more than 25% of the total Tier 1 capital of the Company. Consequently, the amount of Trust Preferred Securities in excess of the 25% limitation constitutes Tier 2 capital, or supplementary capital, of the Company. As of December 31, 2009, all of the Company's Trust Preferred Securities qualify as Tier 1 capital.
Common shareholders' equity is impacted by the Company's decision to categorize its securities portfolio as available for sale (AFS). Securities in this category are carried at fair value, and common shareholders' equity is adjusted to reflect unrealized gains and losses, net of taxes.
The Company declared and paid common dividends of $.255 per share in 2009 compared to $.575 and $.555 in 2008 and 2007 respectively. Book value per common share decreased to $11.84 at December 31, 2009 compared to $14.90 at the end of 2008. The net adjustment for AFS securities increased book value per share by $.63 at December 31, 2009 and increased book value per share by $.15 at December 31, 2008. Depending on market conditions, the adjustment for AFS securities can cause significant fluctuations in shareholders' equity.
On January 16, 2009, the Company entered into an agreement with the United States Department of Treasury (the "Treasury Department") as part of the Treasury Department's Capital Purchase Program. Under this agreement, the Company issued to the Treasury Department 57,000 shares of Fixed Rate Cumulative Perpetual Preferred Stock, Series A ("preferred stock") and a warrant to purchase up to 571,906 shares ("warrant shares") of the Company's common stock, at an initial per share exercise price of $14.95. Like stock options, the warrant issued through the Capital Purchase Program is potentially dilutive. The average stock price for the Company for 2009 was $7.40 per share and the warrant issued in 2009 has an exercise price of $14.95 per share. This results in no additional potentially dilutive shares during 2009.
The preferred stock pays cumulative dividends at a rate of 5% per year for the first five years and 9% per year thereafter. The Company may, at its option and at any time, redeem the preferred stock for the liquidation amount of $1,000 per share, plus any accrued and unpaid dividends. While the preferred stock is outstanding, the Company may only pay dividends on common stock if all accrued and unpaid dividends for the preferred stock have been paid. The Company cannot increase its quarterly cash dividend above the level paid in October 2008 without the prior consent of Treasury until the earlier of three years following the date of the sale of the preferred stock to the Treasury or the date the preferred stock is no longer held by Treasury. See Note 27 to the consolidated financial statements for additional details on the Company's participation in the Capital Purchase Program.
Liquidity
Liquidity management involves maintaining sufficient cash levels to fund operations and to meet the requirements of borrowers, depositors and creditors. Higher levels of liquidity bear higher corresponding costs, measured in terms of lower yields on short-term, more liquid earning assets and higher interest expense involved in extending liability maturities. Liquid assets include cash and cash equivalents, loans and securities maturing within one year and money market instruments. In addition, the Company holds approximately $708,970 of AFS securities maturing after one year, which can be sold to meet liquidity needs.
Maintaining a relatively stable funding base, which is achieved by diversifying funding sources, supports liquidity, extends the contractual maturity of liabilities, and limits reliance on volatile short-term purchased funds. Short-term funding needs may arise from declines in deposits or other funding sources, funding of loan commitments and requests for new loans. The Company's strategy is to fund assets to the maximum extent possible with core deposits, which provide a sizable source of relatively stable low-cost funds. The Company defines core deposits as all deposits except certificates of deposits greater than $100. Average core deposits funded approximately 71.4% of total earning assets during 2009 and approximately 71.2% in 2008.
Management believes the Company has sufficient liquidity to meet all reasonable borrower, depositor and creditor needs in the present economic environment. The Company has not received any directives from regulatory authorities that would materially affect liquidity, capital resources or operations.
Contractual Obligations as of December 31, 2009
| |
Total |
Less than 1 Year |
1-3 Years |
3-5 Years |
More than 5 Years |
|||||||||||||
|---|---|---|---|---|---|---|---|---|---|---|---|---|---|---|---|---|---|---|
Time Deposits |
$ | 874,215 | $ | 580,877 | $ | 256,451 | $ | 16,193 | $ | 20,694 | ||||||||
FHLB Advances |
222,265 | 70,297 | 36,248 | 40,633 | 75,087 | |||||||||||||
Subordinated Debentures |
49,966 | — | — | — | 49,966 | |||||||||||||
Operating Lease Commitments |
4,386 | 859 | 1,450 | 1,274 | 803 | |||||||||||||
Total |
$ | 1,150,832 | $ | 652,033 | $ | 294,149 | $ | 58,100 | $ | 146,550 | ||||||||
27
Off-balance Sheet Arrangements
The Bank incurs off-balance sheet risks in the normal course of business in order to meet the financing needs of its customers. These risks derive from commitments to extend credit and standby letters of credit. Off-balance sheet risk to credit loss exists up to the face amount of these instruments, although material losses are not anticipated. See Note 16 to the Consolidated Financial Statements for additional details on the Company's off-balance sheet arrangements.
Interest Rate Risk Management
Interest rate risk is the exposure of the Company's financial condition to adverse changes in market interest rates. In an effort to estimate the impact of sustained interest rate movements to the Company's earnings, the Company monitors interest rate risk through computer-assisted simulation modeling of its net interest income. The Company's simulation modeling monitors the potential impact to net interest income under various interest rate scenarios. The Company's objective is to actively manage its asset/liability position within a one-year interval and to limit the risk in any of the interest rate scenarios to a reasonable level of tax-equivalent net interest income within that interval. The Company monitors compliance within established guidelines of the Funds Management Policy. See Item 7A. Quantitative and Qualitative Disclosures About Market Risk section for further discussion regarding interest rate risk.
Critical Accounting Policies
The accounting and reporting policies of the Company comply with accounting principles generally accepted in the United States and conform to general practices within the banking industry. These policies require estimates and assumptions. Changes in underlying factors, assumptions, or estimates in any of these areas could have a material impact on the Company's future financial condition and results of operations. In management's opinion, some of these areas have a more significant impact than others on the Company's financial reporting. These areas currently include accounting for the allowance for loan losses, goodwill, income taxes, and mortgage servicing rights.
Allowance for Loan Losses — The level of the allowance for loan losses is based upon management's evaluation of the loan and lease portfolios, past loan loss experience, known and inherent risks in the portfolio, adverse situations that may affect the borrower's ability to repay (including the timing of future payments), the estimated value of any underlying collateral, composition of the loan portfolio, economic conditions, and other pertinent factors. This evaluation is inherently subjective as it requires material estimates including the amounts and timing of future cash flows expected to be received on impaired loans that may be susceptible to significant change. The level of allowance maintained is believed by management to be adequate to cover losses inherent in the portfolio. The allowance is increased by provisions charged to expense and decreased by charge-offs, net of recoveries of amounts previously charged-off.
Goodwill — Accounting Standards Codification 350 states that goodwill and intangible assets deemed to have indefinite lives, if any, are subject to annual impairment tests in accordance with the Statement. The Company has selected June 30 as its date for annual impairment testing, but will test more frequently if circumstances warrant. During 2009, the Company determined that goodwill might be impaired and tested it for impairment at May 31, 2009 and November 30, 2009. See Note 8 in the financial statements for further discussion of the goodwill impairment charges for the year.
Income taxes — The Company is subject to the income tax laws of the U.S., its states and the municipalities in which it operates. These tax laws are complex and subject to different interpretations by the taxpayer and the relevant government taxing authorities. The Company reviews income tax expense and the carrying value of deferred tax assets; and as new information becomes available, the balances are adjusted as appropriate. In establishing a provision for income tax expense, the Company makes judgments and interpretations about the application of these inherently complex tax laws and also makes estimates about when in the future certain items will affect taxable income in the various tax jurisdictions.
Mortgage servicing rights — The Company originally records mortgage servicing rights at fair value and amortizes them over the period of the estimated future net servicing income of the underlying loans. The servicing rights are evaluated for impairment based upon the fair value of the rights as compared to the carrying amount. Impairment is determined by stratifying rights into groupings based on predominant risk characteristics, such as interest rate, loan type and investor type. Impairment is recognized through a valuation allowance for an individual grouping, to the extent that fair value is less than the carrying amount.
New Accounting Matters
See Note 1 to the Consolidated Financial Statements regarding the adoption of new accounting standards in 2009.
28
ITEM 7A. QUANTITATIVE AND QUALITATIVE DISCLOSURES ABOUT MARKET RISK
The Company's exposure to market risk is reviewed on a regular basis by the Asset/Liability Committee and Boards of Directors of the Company and its subsidiary bank. Primary market risks, which impact the Company's operations, are liquidity risk and interest rate risk, as discussed above.
As discussed previously, the Company monitors interest rate risk by the use of computer simulation modeling to estimate the potential impact on its net interest income under various interest rate scenarios. Another method by which the Company's interest rate risk position can be estimated is by computing estimated changes in its net portfolio value ("NPV"). This method estimates interest rate risk exposure from movements in interest rates by using interest rate sensitivity analysis to determine the change in the NPV of discounted cash flows from assets and liabilities. Computations are based on a number of assumptions, including the relative levels of market interest rates and prepayments in mortgage loans and certain types of investments. These computations do not contemplate any actions management may undertake in response to changes in interest rates, and should not be relied upon as indicative of actual results. In addition, certain shortcomings are inherent in the method of computing NPV. Should interest rates remain or decrease below current levels, the proportion of adjustable rate loans could decrease in future periods due to refinancing activity. In the event of an interest rate change, prepayment levels would likely be different from those assumed in the table. Lastly, the ability of many borrowers to repay their adjustable rate debt may decline during a rising interest rate environment.
The following tables provide an assessment of the risk to NPV in the event of sudden and sustained 1% and 2% increases and decreases in prevailing interest rates. The table indicates that as of December 31, 2009 the Company's estimated NPV might be expected to increase in the event of a decrease in prevailing interest rates, and might be expected to generally decrease in the event of a increase in prevailing interest rates (dollars in thousands). As of December 31, 2008 the Company's estimated NPV would generally decrease in the event of a increase in prevailing rates and decrease in the event of an decrease in rates.
December 31, 2009
| |
Change in Rates |
$ Amount |
$ Change |
NPV Ratio |
Change |
||||||||||
|---|---|---|---|---|---|---|---|---|---|---|---|---|---|---|---|
| +2% | 382,429 | $ | (51,107 | ) | 13.09% | (133)bp | |||||||||
| +1% | 439,093 | 5,557 | 14.68% | 26bp | |||||||||||
| Base | 433,536 | — | 14.42% | — | |||||||||||
| -1% | 492,568 | 59,032 | 16.00% | 158bp | |||||||||||
| -2% | 513,360 | 79,824 | 16.50% | 208bp | |||||||||||
December 31, 2008
| |
Change in Rates |
$ Amount |
$ Change |
NPV Ratio |
Change |
||||||||||
|---|---|---|---|---|---|---|---|---|---|---|---|---|---|---|---|
| +2% | 319,587 | $ | (23,157 | ) | 11.48% | (84)bp | |||||||||
| +1% | 345,087 | 2,343 | 12.40% | 8bp | |||||||||||
| Base | 342,744 | — | 12.32% | — | |||||||||||
| -1% | 338,252 | (4,492 | ) | 12.16% | (16)bp | ||||||||||
| -2% | 307,904 | (34,840 | ) | 11.06% | (126)bp | ||||||||||
The above discussion, and the portions of MANAGEMENT'S DISCUSSION AND ANALYSIS in Item 7 of this Report that are referenced in the above discussion contains statements relating to future results of the Company that are considered "forward-looking-statements" within the meaning of the Private Securities Litigation Reform Act of 1995. These statements relate to, among other things, simulation of the impact on net interest income from changes in interest rates. Actual results may differ materially from those expressed or implied therein as a result of certain risks and uncertainties, including those risks and uncertainties expressed above, those that are described in MANAGEMENT'S DISCUSSION AND ANALYSIS in Item 7 of this Report, those that are described in Item 1 of this Report, "Business," under the caption "Forward-Looking-Statements and Associated Risks," and those that are described in Item 1A of this Report, "Risk Factors", all of which discussions are incorporated herein by reference.
29
ITEM 8. FINANCIAL STATEMENTS AND SUPPLEMENTARY DATA

REPORT OF INDEPENDENT REGISTERED PUBLIC ACCOUNTING FIRM
Board
of Directors and Shareholders
MainSource Financial Group, Inc.
Greensburg, Indiana
We have audited the accompanying consolidated balance sheets of MainSource Financial Group, Inc. as of December 31, 2009 and 2008 and the related consolidated statements of operations, shareholders' equity, and cash flows for each of the three years in the period ended December 31, 2009. We also have audited MainSource Financial Group, Inc.'s internal control over financial reporting as of December 31, 2009, based on criteria established in Internal Control — Integrated Framework issued by the Committee of Sponsoring Organizations of the Treadway Commission (COSO). MainSource Financial Group, Inc.'s management is responsible for these financial statements, for maintaining effective internal control over financial reporting, and for its assessment of the effectiveness of internal control over financial reporting, included in the accompanying Management's Report on Internal Control over Financial Reporting. Our responsibility is to express an opinion on these financial statements and an opinion on the company's internal control over financial reporting based on our audits.
We conducted our audits in accordance with the standards of the Public Company Accounting Oversight Board (United States). Those standards require that we plan and perform the audit to obtain reasonable assurance about whether the financial statements are free of material misstatement and whether effective internal control over financial reporting was maintained in all material respects. Our audits of the financial statements included examining, on a test basis, evidence supporting the amounts and disclosures in the financial statements, assessing the accounting principles used and significant estimates made by management, and evaluating the overall financial statement presentation. Our audit of internal control over financial reporting included obtaining an understanding of internal control over financial reporting, assessing the risk that a material weakness exists, and testing and evaluating the design and operating effectiveness of internal control based on the assessed risk. Our audits also included performing such other procedures as we considered necessary in the circumstances. We believe that our audits provide a reasonable basis for our opinions.
A company's internal control over financial reporting is a process designed to provide reasonable assurance regarding the reliability of financial reporting and the preparation of financial statements for external purposes in accordance with generally accepted accounting principles. A company's internal control over financial reporting includes those policies and procedures that (1) pertain to the maintenance of records that, in reasonable detail, accurately and fairly reflect the transactions and dispositions of the assets of the company; (2) provide reasonable assurance that transactions are recorded as necessary to permit preparation of financial statements in accordance with generally accepted accounting principles, and that receipts and expenditures of the company are being made only in accordance with authorizations of management and directors of the company; and (3) provide reasonable assurance regarding prevention or timely detection of unauthorized acquisition, use, or disposition of the company's assets that could have a material effect on the financial statements.
Because of its inherent limitations, internal control over financial reporting may not prevent or detect misstatements. Also, projections of any evaluation of effectiveness to future periods are subject to the risk that controls may become inadequate because of changes in conditions, or that the degree of compliance with the policies or procedures may deteriorate.
In our opinion, the consolidated financial statements referred to above present fairly, in all material respects, the financial position of MainSource Financial Group, Inc. as of December 31, 2009 and 2008, and the results of its operations and its cash flows for each of the three years in the period ended December 31, 2009, in conformity with accounting principles generally accepted in the United States of America. Also, in our opinion MainSource Financial Group, Inc. maintained, in all material respects, effective internal control over financial reporting as of December 31, 2009, based on criteria established in Internal Control — Integrated Framework issued by the COSO.
| /s/ Crowe Horwath LLP | ||
Louisville, Kentucky March 10, 2010 |
30
MAINSOURCE FINANCIAL GROUP, INC.
CONSOLIDATED BALANCE SHEETS
(Dollar amounts in thousands except per share data)
| |
December 31, 2009 |
December 31, 2008 |
|||||||||
|---|---|---|---|---|---|---|---|---|---|---|---|
Assets |
|||||||||||
Cash and due from banks |
$ | 57,578 | $ | 72,141 | |||||||
Money market funds and federal funds sold |
14,111 | 23,347 | |||||||||
Cash and cash equivalents |
71,689 | 95,488 | |||||||||
Interest bearing time deposits |
— | 116 | |||||||||
Securities available for sale |
714,607 | 513,310 | |||||||||
Loans held for sale |
5,128 | 4,947 | |||||||||
Loans, net of allowance for loan losses of $46,648 and $34,583 |
1,838,799 | 1,961,018 | |||||||||
Restricted stock, at cost |
27,359 | 29,721 | |||||||||
Premises and equipment, net |
49,499 | 49,155 | |||||||||
Goodwill |
62,909 | 137,217 | |||||||||
Purchased intangible assets |
11,168 | 13,146 | |||||||||
Cash surrender value of life insurance |
46,567 | 45,991 | |||||||||
Interest receivable and other assets |
78,805 | 49,726 | |||||||||
Total assets |
$ | 2,906,530 | $ | 2,899,835 | |||||||
Liabilities |
|||||||||||
Deposits |
|||||||||||
Noninterest bearing |
$ | 250,438 | $ | 232,024 | |||||||
Interest bearing |
2,020,212 | 1,777,300 | |||||||||
Total deposits |
2,270,650 | 2,009,324 | |||||||||
Other borrowings |
47,631 | 84,448 | |||||||||
Federal Home Loan Bank (FHLB) advances |
222,265 | 433,167 | |||||||||
Subordinated debentures |
49,966 | 49,816 | |||||||||
Other liabilities |
21,556 | 23,131 | |||||||||
Total liabilities |
2,612,068 | 2,599,886 | |||||||||
Commitments and contingent liabilities (Note 16) |
|||||||||||
Shareholders' equity |
|||||||||||
Preferred stock, no par value |
|||||||||||
Authorized shares — 400,000 |
|||||||||||
Issued and outstanding shares — 57,000 and 0 |
55,979 | — | |||||||||
Common stock $.50 stated value: |
|||||||||||
Authorized shares — 100,000,000 and 25,000,000 |
|||||||||||
Issued shares — 20,710,764 |
|||||||||||
Outstanding shares — 20,136,362 |
10,394 | 10,394 | |||||||||
Treasury stock — 574,402, at cost |
(9,367 | ) | (9,367 | ) | |||||||
Additional paid-in capital |
223,020 | 221,789 | |||||||||
Retained earnings |
1,825 | 74,018 | |||||||||
Accumulated other comprehensive income |
12,611 | 3,115 | |||||||||
Total shareholders' equity |
294,462 | 299,949 | |||||||||
Total liabilities and shareholders' equity |
$ | 2,906,530 | $ | 2,899,835 | |||||||
The accompanying notes are an integral part of these consolidated financial statements.
31
MAINSOURCE FINANCIAL GROUP, INC.
CONSOLIDATED STATEMENTS OF OPERATIONS
YEARS ENDED DECEMBER 31, 2009, 2008, AND 2007
(Dollar amounts in thousands except per share data)
| |
2009 |
2008 |
2007 |
|||||||||||
|---|---|---|---|---|---|---|---|---|---|---|---|---|---|---|
Interest income |
||||||||||||||
Loans, including fees |
$ | 115,873 | $ | 118,379 | $ | 119,546 | ||||||||
Securities |
||||||||||||||
Taxable |
19,490 | 20,387 | 19,621 | |||||||||||
Tax exempt |
7,663 | 5,696 | 4,954 | |||||||||||
Federal funds sold and money market funds |
128 | 155 | 575 | |||||||||||
Deposits with financial institutions |
87 | 42 | 131 | |||||||||||
Total interest income |
143,241 | 144,659 | 144,827 | |||||||||||
Interest expense |
||||||||||||||
Deposits |
32,497 | 42,069 | 53,673 | |||||||||||
Federal Home Loan Bank advances |
10,235 | 10,990 | 10,894 | |||||||||||
Subordinated debentures |
2,059 | 2,782 | 3,333 | |||||||||||
Other borrowings |
442 | 1,293 | 2,530 | |||||||||||
Total interest expense |
45,233 | 57,134 | 70,430 | |||||||||||
Net interest income |
98,008 | 87,525 | 74,397 | |||||||||||
Provision for loan losses |
46,310 | 20,918 | 5,745 | |||||||||||
Net interest income after provision for loan losses |
51,698 | 66,607 | 68,652 | |||||||||||
Non-interest income |
||||||||||||||
Insurance commissions |
2,071 | 2,073 | 1,864 | |||||||||||
Mortgage banking |
9,028 | 2,565 | 2,921 | |||||||||||
Trust and investment product fees |
1,743 | 1,575 | 1,569 | |||||||||||
Service charges on deposit accounts |
16,537 | 14,555 | 13,312 | |||||||||||
Net realized gains on securities |
1,263 | 1,118 | 114 | |||||||||||
Increase in cash surrender value of life insurance |
890 | 967 | 1,535 | |||||||||||
Interchange income |
5,178 | 3,600 | 3,159 | |||||||||||
Other income |
3,340 | 3,244 | 3,652 | |||||||||||
Total non-interest income |
40,050 | 29,697 | 28,126 | |||||||||||
Non-interest expense |
||||||||||||||
Salaries and employee benefits |
46,342 | 41,033 | 38,063 | |||||||||||
Net occupancy |
6,660 | 6,061 | 5,347 | |||||||||||
Equipment |
7,468 | 6,496 | 5,788 | |||||||||||
Intangibles amortization |
2,199 | 2,607 | 2,666 | |||||||||||
Telecommunications |
2,015 | 1,863 | 1,924 | |||||||||||
Stationery printing and supplies |
1,608 | 1,374 | 1,475 | |||||||||||
FDIC assessment |
4,976 | 741 | 215 | |||||||||||
Marketing |
3,040 | 1,645 | 1,225 | |||||||||||
Goodwill impairment |
80,310 | — | — | |||||||||||
Other expenses |
12,914 | 10,953 | 11,317 | |||||||||||
Total non-interest expense |
167,532 | 72,773 | 68,020 | |||||||||||
Income/(loss) before income tax |
(75,784 | ) | 23,531 | 28,758 | ||||||||||
Income tax expense/(benefit) |
(11,645 | ) | 4,379 | 6,888 | ||||||||||
Net income/(loss) |
$ | (64,139 | ) | $ | 19,152 | $ | 21,870 | |||||||
Preferred dividends and discount accretion |
(2,919 | ) | — | — | ||||||||||
Net income/(loss) attributable to common shareholders |
$ | (67,058 | ) | $ | 19,152 | $ | 21,870 | |||||||
Net income/(loss) per common share — basic |
$ |
(3.33 |
) |
$ |
1.00 |
$ |
1.17 |
|||||||
Net income/(loss) per common share — diluted |
$ | (3.33 | ) | $ | 1.00 | $ | 1.17 | |||||||
The accompanying notes are an integral part of these consolidated financial statements.
32
MAINSOURCE FINANCIAL GROUP, INC.
CONSOLIDATED STATEMENTS OF SHAREHOLDERS' EQUITY
YEARS ENDED DECEMBER 31, 2009, 2008, AND 2007
(Dollar amounts in thousands except per share data)
| |
|
Common Stock | |
|
|
|
|
|
||||||||||||||||||||||||
|---|---|---|---|---|---|---|---|---|---|---|---|---|---|---|---|---|---|---|---|---|---|---|---|---|---|---|---|---|---|---|---|---|
| |
|
|
Additional Paid-in Capital |
|
Accumulated Other Comprehensive Income/(Loss) |
|
|
|||||||||||||||||||||||||
| |
Preferred Stock |
Shares Outstanding |
Amount |
Treasury Stock |
Retained Earnings |
Total |
Comprehensive Income |
|||||||||||||||||||||||||
Balance, January 1, 2007 |
— | 18,771,641 | $ | 9,595 | $ | (6,586 | ) | $ | 196,788 | $ | 54,914 | $ | (1,464 | ) | $ | 253,247 | ||||||||||||||||
Net income |
$ | 21,870 | $ | 21,870 | $ | 21,870 | ||||||||||||||||||||||||||
Change in fair value of securities, net |
2,732 | 2,732 | 2,732 | |||||||||||||||||||||||||||||
Total comprehensive income |
$ | 24,602 | ||||||||||||||||||||||||||||||
Cash dividends ($.555 per share) |
(10,374 | ) | (10,374 | ) | ||||||||||||||||||||||||||||
Adjustment to initially apply income tax guidance |
(411 | ) | (411 | ) | ||||||||||||||||||||||||||||
Stock option expense |
115 | 115 | ||||||||||||||||||||||||||||||
Purchase of treasury stock |
(212,256 | ) | (3,407 | ) | (3,407 | ) | ||||||||||||||||||||||||||
5% Stock Dividend — Treasury shares |
(19,058 | ) | — | |||||||||||||||||||||||||||||
Fractional Shares — 5% stock dividend |
(1,051 | ) | (1 | ) | (17 | ) | (18 | ) | ||||||||||||||||||||||||
Exercise of stock options |
30,863 | 16 | 506 | (174 | ) | 348 | ||||||||||||||||||||||||||
Balance, December 31, 2007 |
— | 18,570,139 | 9,610 | (9,487 | ) | 196,712 | 65,999 | 1,268 | 264,102 | |||||||||||||||||||||||
Net income |
$ |
19,152 |
$ |
19,152 |
$ |
19,152 |
||||||||||||||||||||||||||
Change in fair value of securities, net |
1,847 | 1,847 | 1,847 | |||||||||||||||||||||||||||||
Total comprehensive income |
$ | 20,999 | ||||||||||||||||||||||||||||||
Stock option expense |
101 | 101 | ||||||||||||||||||||||||||||||
Cash dividends ($.575 per share) |
(11,133 | ) | (11,133 | ) | ||||||||||||||||||||||||||||
Purchase of treasury stock |
(1,463 | ) | (22 | ) | (22 | ) | ||||||||||||||||||||||||||
Issuance of common stock in acquisitions |
1,559,005 | 780 | 25,006 | 25,786 | ||||||||||||||||||||||||||||
Exercise of stock options |
8,681 | 4 | 142 | (30 | ) | 116 | ||||||||||||||||||||||||||
Balance, December 31, 2008 |
— | 20,136,362 | 10,394 | (9,367 | ) | 221,789 | 74,018 | 3,115 | 299,949 | |||||||||||||||||||||||
Net loss |
$ |
(64,139 |
) |
$ |
(64,139 |
) |
$ |
(64,139 |
) |
|||||||||||||||||||||||
Change in fair value of securities, net |
9,496 | 9,496 | 9,496 | |||||||||||||||||||||||||||||
Total comprehensive income |
$ | (54,643 | ) | |||||||||||||||||||||||||||||
Stock option expense |
115 | 115 | ||||||||||||||||||||||||||||||
Cash dividends ($.255 per share) — common stock |
(5,135 | ) | (5,135 | ) | ||||||||||||||||||||||||||||
Issuance of preferred stock, net of issuance costs |
55,783 | 55,783 | ||||||||||||||||||||||||||||||
Issuance of warrants to purchase common stock |
1,116 | 1,116 | ||||||||||||||||||||||||||||||
Dividends — preferred stock |
(2,723 | ) | (2,723 | ) | ||||||||||||||||||||||||||||
Accretion of preferred stock discount |
196 | (196 | ) | — | ||||||||||||||||||||||||||||
Balance, December 31, 2009 |
$ | 55,979 | 20,136,362 | $ | 10,394 | $ | (9,367 | ) | $ | 223,020 | $ | 1,825 | $ | 12,611 | $ | 294,462 | ||||||||||||||||
The accompanying notes are an integral part of these consolidated financial statements.
33
MAINSOURCE FINANCIAL GROUP, INC.
CONSOLIDATED STATEMENTS OF CASH FLOW
YEARS ENDED DECEMBER 31, 2009, 2008, AND 2007
(Dollars in thousands)
| |
2009 |
2008 |
2007 |
|||||||||||
|---|---|---|---|---|---|---|---|---|---|---|---|---|---|---|
Operating Activities |
||||||||||||||
Net income (loss) |
$ | (64,139 | ) | $ | 19,152 | $ | 21,870 | |||||||
Adjustments to reconcile net income to net cash provided by operating activities: |
||||||||||||||
Provision for loan losses |
46,310 | 20,918 | 5,745 | |||||||||||
Depreciation expense |
5,351 | 4,523 | 4,174 | |||||||||||
Amortization of mortgage servicing rights |
2,317 | 706 | 567 | |||||||||||
Valuation allowance on mortgage servicing rights |
(600 | ) | 1,226 | — | ||||||||||
Securities amortization, net |
(72 | ) | (731 | ) | (725 | ) | ||||||||
Amortization of purchased intangible assets |
2,199 | 2,607 | 2,666 | |||||||||||
Increase in cash surrender value of life insurance policies |
(890 | ) | (967 | ) | (1,535 | ) | ||||||||
Gain on life insurance benefit |
(128 | ) | — | — | ||||||||||
Securities (gains) |
(1,263 | ) | (1,118 | ) | (114 | ) | ||||||||
Gain on loans sold |
(5,548 | ) | (1,904 | ) | (1,166 | ) | ||||||||
Loans originated for sale |
(419,192 | ) | (111,968 | ) | (79,034 | ) | ||||||||
Proceeds from loan sales |
424,559 | 112,956 | 79,923 | |||||||||||
Stock based compensation expense |
115 | 101 | 115 | |||||||||||
Goodwill impairment |
80,310 | — | — | |||||||||||
Change in other assets and liabilities |
(25,679 | ) | (1,709 | ) | (10,660 | ) | ||||||||
Net cash provided by operating activities |
43,650 | 43,792 | 21,826 | |||||||||||
Investing Activities |
||||||||||||||
Net change in time deposits |
116 | — | — | |||||||||||
Purchases of securities available for sale |
(451,603 | ) | (168,697 | ) | (140,466 | ) | ||||||||
Proceeds from calls, maturities, and payments on securities available for sale |
172,390 | 67,531 | 50,017 | |||||||||||
Proceeds from sales of securities available for sale |
93,855 | 98,647 | 91,057 | |||||||||||
Loan originations and payments, net |
124,944 | (75,325 | ) | (121,411 | ) | |||||||||
Purchases of premises and equipment |
(2,490 | ) | (6,252 | ) | (5,718 | ) | ||||||||
Purchases of restricted stock |
— | (4,232 | ) | — | ||||||||||
Proceeds from redemption of restricted stock |
2,362 | — | — | |||||||||||
Proceeds from life insurance benefit |
442 | — | — | |||||||||||
Cash received from bank acquisitions, net |
17,566 | 20,345 | — | |||||||||||
Net cash provided (used) by investing activities |
(42,418 | ) | (67,983 | ) | (126,521 | ) | ||||||||
Financing Activities |
||||||||||||||
Net change in deposits |
173,291 | (153,297 | ) | 42,140 | ||||||||||
Net change in other borrowings |
(36,817 | ) | 34,292 | 7,850 | ||||||||||
Proceeds from FHLB advances |
50,000 | 690,850 | 345,000 | |||||||||||
Repayment of FHLB advances |
(260,902 | ) | (525,782 | ) | (296,344 | ) | ||||||||
Cash dividends on preferred stock |
(2,367 | ) | — | — | ||||||||||
Purchase of treasury shares |
— | (22 | ) | (3,407 | ) | |||||||||
Cash dividends |
(5,135 | ) | (11,133 | ) | (10,392 | ) | ||||||||
Issuance of preferred shares, net of issuance costs |
55,783 | — | — | |||||||||||
Issuance of warrants to purchase common stock |
1,116 | — | — | |||||||||||
Proceeds from exercise of stock options |
— | 116 | 348 | |||||||||||
Net cash provided (used) by financing activities |
(25,031 | ) | 35,024 | 85,195 | ||||||||||
Net change in cash and cash equivalents |
(23,799 | ) | 10,833 | (19,500 | ) | |||||||||
Cash and cash equivalents, beginning of year |
95,488 | 84,655 | 104,155 | |||||||||||
Cash and cash equivalents, end of year |
$ | 71,689 | $ | 95,488 | $ | 84,655 | ||||||||
Supplemental cash flow information |
||||||||||||||
Interest paid |
$ | 47,011 | $ | 59,550 | $ | 69,482 | ||||||||
Income taxes paid |
1,820 | 5,862 | 6,315 | |||||||||||
Supplemental non cash disclosure |
||||||||||||||
Loan balances transferred to foreclosed real estate |
11,957 | 8,136 | 2,544 | |||||||||||
See Note 2 regarding non-cash transactions included in acquisitions.
The accompanying notes are an integral part of these consolidated financial statements.
34
NOTES TO THE CONSOLIDATED FINANCIAL STATEMENTS
(Dollar amounts in thousands except per share data)
NOTE 1 — SUMMARY OF SIGNIFICANT ACCOUNTING POLICIES
Nature of Operations and Principles of Consolidation: The consolidated financial statements include MainSource Financial Group, Inc. and its wholly owned subsidiaries, together referred to as "the Company". Intercompany transactions and balances are eliminated in consolidation.
The Company's wholly owned subsidiaries include MainSource Bank ("the Bank"), MainSource Insurance, LLC, MainSource Title, LLC, and Insurance Services Marketing, LLC. In November 2009, the Company merged MainSource Bank of Illinois into MainSource Bank. In December 2009, the Company merged MainSource Bank — Ohio into MainSource Bank. In the second quarter of 2009, the Company established Insurance Services Marketing, LLC ("ISM"), an Indiana limited liability company. ISM is an insurance brokerage agency that sells insurance products to customers and non-customers of the Company.
The Company provides financial services through its offices in Indiana, Illinois, Ohio, and Kentucky. Its primary deposit products are checking, savings, and term certificate accounts, and its primary lending products are residential mortgage, commercial, and installment loans. Substantially all loans are secured by specific items of collateral including business assets, consumer assets and real estate. Commercial loans are expected to be repaid from cash flow from operations of businesses. Real estate loans are secured by both residential and commercial real estate. Other financial instruments which potentially represent concentrations of credit risk include deposit accounts in other financial institutions and federal funds sold.
Use of Estimates: To prepare financial statements in conformity with accounting principles generally accepted in the United States of America, management makes estimates and assumptions based on available information. These estimates and assumptions affect the amounts reported in the financial statements and the disclosures provided and actual results could differ. The allowance for loan losses, carrying value of goodwill, loan servicing rights, and fair values of financial instruments are particularly subject to change.
Cash Flows: Cash and cash equivalents include cash and due from banks, interest bearing deposits with other financial institutions with maturities under 90 days, money market funds and federal funds sold. Net cash flows are reported for loan and deposit transactions, federal funds purchased and repurchase agreements.
Interest-bearing Deposits in Other Financial Institutions: Interest-bearing deposits in other financial institutions mature within one year and are carried at cost.
Securities: Securities are classified as available for sale when they might be sold before maturity. Securities available for sale are carried at fair value, with unrealized holding gains and losses reported in other comprehensive income, net of tax.
Interest income includes amortization of purchase premium or discount. Premiums and discounts on securities are amortized on the level-yield method, which considers prepayments only on mortgage-backed securities. Gains and losses on sales are recorded on the trade date and are based on the amortized cost of the security sold.
The Company evaluates securities for other-than-temporary impairment ("OTTI") at least on a quarterly basis, and more frequently when economic or market conditions warrant such an evaluation.
Loans Held for Sale: Loans originated and intended for sale in the secondary market are carried at the lower of cost or market in the aggregate, as determined by outstanding commitments from investors. Net unrealized losses, if any, are recorded as a valuation allowance and charged to earnings.
Mortgage loans held for sale are generally sold with servicing rights retained. The carrying value of mortgage loans sold is reduced by the amount allocated to the servicing right. Gains and losses on sales of mortgage loans are based on the difference between the selling price and the carrying value of the related loan sold.
Loans: Loans that management has the intent and ability to hold for the foreseeable future or until maturity or payoff are reported at the principal balance outstanding, net of purchase premiums or discounts, unearned interest, deferred loan fees and costs, and an allowance for loan losses. Interest income is accrued on the unpaid principal balance. Loan origination fees, net of certain direct origination costs, are deferred and recognized in interest income using the level-yield method without anticipating prepayments.
Interest income is not reported when full loan repayment is in doubt, typically when the loan is impaired or payments are past due over 90 days. Past due status is based on the contractual terms of the loan. Loans are placed on non-accrual or charged-off at an earlier date if collection of principal or interest is considered doubtful.
All interest accrued but not received for loans placed on nonaccrual is reversed against interest income. Payments received on such loans subsequent to being placed on non-accrual are applied to the principal balance of the loans. Loans are returned to accrual
35
status when all the principal and interest amounts contractually due are brought current and future payments are reasonably assured. Nonaccrual loans and loans past due 90 days still on accrual include both smaller balance homogeneous loans that are collectively evaluated for impairment and individually classified impaired loans.
Certain Purchased Loans: The Company purchases individual loans and groups of loans. Purchased loans that show evidence of credit deterioration since origination are recorded at the amount paid (or allocated fair value in a purchase business combination), such that there is no carryover of the seller's allowance for loan losses. After acquisition, incurred losses are recognized by an increase in the allowance for loan losses.
Such purchased loans are accounted for individually or aggregated into pools of loans based on common risk characteristics (e.g., credit score, loan type, and date of origination). The Company estimates the amount and timing of expected cash flows for each purchased loan, and the expected cash flows in excess of amount paid is recorded as interest income over the remaining life of the loan or pool (accretable yield). The excess of the loan's or pool's contractual principal and interest over expected cash flows is not recorded (nonaccretable difference).
Over the life of the loan, expected cash flows continue to be estimated. If the present value of expected cash flows is less than the carrying amount, a loss is recorded. If the present value of expected cash flows is greater than the carrying amount, it is recognized as part of future interest income.
Allowance for Loan Losses: The allowance for loan losses is a valuation allowance for probable incurred credit losses. Loan losses are charged against the allowance when management believes the uncollectibility of a loan balance is confirmed. Subsequent recoveries, if any, are credited to the allowance. Management estimates the allowance balance required using past loan loss experience, the nature and volume of the portfolio, information about specific borrower situations and estimated collateral values, economic conditions, and other factors. Allocations of the allowance may be made for specific loans, but the entire allowance is available for any loan that, in management's judgment, should be charged-off.
The allowance consists of specific and general components. The specific component relates to loans that are individually classified as impaired or loans otherwise classified as substandard or doubtful. The general component covers non-classified loans and is based on historical loss experience adjusted for current factors.
A loan is considered impaired when, based on current information and events, it is probable that the Company will be unable to collect the scheduled payments of principal or interest when due according to the contractual terms of the loan agreement. Loans that experience insignificant payment delays and payment shortfalls generally are not classified as impaired. Management determines the significance of payment delays and payment shortfalls on a case-by-case basis, taking into consideration all of the circumstances surrounding the loan and the borrower, including the length of the delay, the reasons for the delay, the borrower's prior payment record, and the amount of the shortfall in relation to the principal and interest owed. Loans, for which the terms have been modified, and for which the borrower is experiencing financial difficulties, are considered troubled debt restructurings and classified as impaired. Impairment is measured on a loan by loan basis for commercial and construction loans by either the present value of expected future cash flows discounted at the loan's effective interest rate, the loan's obtainable market price, or the fair value of the collateral if the loan is collateral dependent. Large groups of smaller balance homogeneous loans are collectively evaluated for impairment. Accordingly, the Company does not separately identify individual consumer and residential real estate loans for impairment disclosures. Troubled debt restructurings are measured at the present value of estimated future cash flows using the loan's effective rate at inception.
Restricted Stock: The Bank is a member of the Federal Home Loan Bank ("FHLB") system. Members are required to own a certain amount of stock based on the level of borrowings and other factors, and may invest in additional amounts. FHLB stock is carried at cost, classified as a restricted security, and periodically evaluated for impairment. Because this stock is viewed as a long-term investment, impairment is based on ultimate recovery of par value. Both cash and stock dividends are reported as income.
Premises and Equipment: Land is carried at cost. Premises and equipment are stated at cost less accumulated depreciation. Buildings and related components are depreciated using the straight-line method with useful lives ranging from 30 to 39 years for buildings and 5 to 15 years for related components. Furniture, fixtures and equipment are depreciated using the straight-line method with useful lives ranging from 3 to 10 years.
Foreclosed Assets: Assets acquired through or instead of loan foreclosure are initially recorded at lower of cost or fair value net of estimated selling costs when acquired, establishing a new cost basis. If fair value declines after acquisition, a valuation allowance is recorded through expense. Costs after acquisition are expensed.
Company Owned Life Insurance: The Company has purchased life insurance policies on certain employees. Company owned life insurance is recorded at its cash surrender value, or the amount that can be realized. Company owned life insurance is recorded at the amount that can be realized under the insurance contract at the balance sheet date, which is the cash surrender value adjusted for other charges or other amounts due that are probable at settlement.
36
Servicing Assets: Servicing rights are recognized separately when they are acquired through sales of loans. When mortgage loans are sold, servicing rights are initially recorded at fair value with the income statement effect recorded in mortgage banking. Fair value is based on market prices for comparable mortgage servicing contracts, when available, or alternatively, is based on a valuation model that calculates the present value of estimated future net servicing income. All classes of servicing assets are subsequently measured using the amortization method which requires servicing rights to be amortized into non-interest income in proportion to, and over the period of, the estimated future net servicing income of the underlying loans.
Servicing assets are evaluated for impairment based upon the fair value of the rights as compared to carrying amount. Impairment is determined by stratifying rights into groupings based on predominant risk characteristics, such as interest rate, loan type and investor type. Impairment is recognized through a valuation allowance for an individual grouping, to the extent that fair value is less than the carrying amount. If the Company later determines that all or a portion of the impairment no longer exists for a particular grouping, a reduction of the allowance may be recorded as an increase to income. Changes in valuation allowances are reported with mortgage banking on the income statement. The fair values of servicing rights are subject to significant fluctuations as a result of changes in estimated and actual prepayment speeds and default rates and losses.
Servicing fee income which is reported on the income statement as mortgage banking is recorded for fees earned for servicing loans. The fees are based on a contractual percentage of the outstanding principal, or a fixed amount per loan and are recorded as income when earned. The amortization of mortgage servicing rights is netted against loan servicing fee income. Servicing fees totaled $1,521, $1,242 and $1,303 for the years ended December 31, 2009, 2008 and 2007. Late fees and ancillary fees related to loan servicing are not material.
Transfers of Financial Assets: Transfers of financial assets are accounted for as sales when control over the assets has been surrendered. Control over transferred assets is deemed to be surrendered when the assets have been isolated from the Company, the transferee obtains the right (free of conditions that constrain it from taking advantage of that right) to pledge or exchange the transferred assets, and the Company does not maintain effective control over the transferred assets through an agreement or option to repurchase them before their maturity.
Goodwill and Other Intangible Assets: Goodwill resulting from business combinations prior to January 1, 2009 represents the excess of the purchase price over the fair value of acquired tangible assets and liabilities and identifiable intangible assets. Goodwill resulting from business combinations after January 1, 2009, is generally determined as the excess of the fair value of the consideration transferred, plus the fair value of any noncontrolling interests in the acquiree, over the fair value of the net assets acquired and liabilities assumed as of the acquisition date. Goodwill and intangible assets acquired in a purchase business combination and determined to have an indefinite useful life are not amortized, but tested for impairment at least annually. Intangible assets with definite useful lives are amortized over their estimated useful lives to their estimated residual values. Goodwill is the only intangible asset with an indefinite life on the Company's balance sheet.
Other intangible assets consist largely of core deposit and acquired customer relationship intangibles arising from whole bank and branch acquisitions. They are initially measured at fair value and then are amortized on an accelerated method over their estimated useful lives, generally ten years.
Long-term Assets: Premises and equipment and other long-term assets are reviewed for impairment when events indicate their carrying amount may not be recoverable from future undiscounted cash flows. If impaired, the assets are recorded at fair value.
Repurchase Agreements: Substantially all repurchase agreement liabilities represent amounts advanced by various customers. Securities are pledged to cover these liabilities, which are not covered by federal deposit insurance. Repurchase agreements are included in other borrowings on the consolidated balance sheets.
Income Taxes: Income tax expense is the total of the current year income tax due or refundable and the change in deferred tax assets and liabilities. Deferred tax assets and liabilities are the expected future tax amounts for the temporary differences between carrying amounts and tax bases of assets and liabilities, computed using enacted tax rates. A valuation allowance, if needed, reduces deferred tax assets to the amount expected to be realized.
The Company adopted guidance issued by FASB with respect to accounting for uncertainty in income taxes as of January 1, 2007. A tax position is recognized as a benefit only if it is "more likely than not" that the tax position would be sustained in a tax examination, with a tax examination being presumed to occur. The amount recognized is the largest amount of tax benefit that is greater than 50% likely of being realized on examination. For tax positions not meeting the "more likely than not" test, no tax benefit is recorded. The adoption resulted in an increase in the Company's tax liability of $411 at January 1, 2007.
The Company recognizes interest and/or penalties related to income tax matters in income tax expense.
Loan Commitments and Related Financial Instruments: Financial instruments include off-balance sheet credit instruments, such as commitments to make loans and commercial letters of credit, issued to meet customer financing needs. The face amount for
37
these items represents the exposure to loss, before considering customer collateral or ability to repay. Such financial instruments are recorded when they are funded.
Stock-Based Compensation: Compensation cost is recognized for stock options and restricted stock awards issued to employees, based on the fair value of these awards at the date of grant. A Black-Scholes model is utilized to estimate the fair value of stock options. Compensation cost is recognized over the required service period, generally defined as the vesting period. For awards with graded vesting, compensation cost is recognized on a straight-line basis over the requisite service period for the entire award.
Retirement Plans: Employee 401(k) and profit sharing plan expense is the amount of matching contributions and discretionary contributions, respectively.
Earnings (Loss) Per Common Share: Basic earnings (loss) per common share is net income available to common shareholders divided by the weighted average number of common shares outstanding during the period. Diluted earnings (loss) per common share include the dilutive effect of additional potential common shares issuable under stock options. Earnings and dividends per share are restated for all stock splits and dividends through the date of issuance of the financial statements.
Comprehensive Income (Loss): Comprehensive income (loss) consists of net income (loss) and other comprehensive income. Other comprehensive income includes unrealized gains and losses on securities available for sale which are also recognized as a separate component of equity.
Loss Contingencies: Loss contingencies, including claims and legal actions arising in the ordinary course of business, are recorded as liabilities when the likelihood of loss is probable and an amount or range of loss can be reasonably estimated. Management does not believe there are now any such matters that will have a material effect on the financial statements.
Restrictions on Cash: Cash on hand or on deposit with the Federal Reserve Bank was required to meet regulatory reserve and clearing requirements.
Equity: Stock dividends in excess of 20% are reported by transferring the par value of the stock issued from retained earnings to common stock. Stock dividends for 20% or less are reported by transferring the fair value, as of the ex-dividend date, of the stock issued from retained earnings to common stock and additional paid-in capital. Fractional share amounts are paid in cash with a reduction in retained earnings.
Dividend Restriction: Banking regulations require maintaining certain capital levels and may limit the dividends paid by the banks to the holding company or by the holding company to shareholders.
Fair Value of Financial Instruments: Fair values of financial instruments are estimated using relevant market information and other assumptions, as more fully disclosed in a Note 6. Fair value estimates involve uncertainties and matters of significant judgment regarding interest rates, credit risk, prepayments, and other factors, especially in the absence of broad markets for particular items. Changes in assumptions or in market conditions could significantly affect the estimates.
Operating Segments: While the Company's chief decision-makers monitor the revenue streams of the various Company products and services, the identifiable segments are not material and operations are managed and financial performance is evaluated on a Company-wide basis. Accordingly, all of the Company's financial service operations are considered by management to be aggregated in one reportable operating segment.
Reclassifications: Some items in the prior year financial statements were reclassified to conform to the current presentation.
Recently Issued Accounting Standards: During 2009, the Company adopted the following accounting standards and guidance:
In September 2006, the FASB issued guidance that defines fair value, establishes a framework for measuring fair value and expands disclosures about fair value measurements. This guidance also establishes a fair value hierarchy about the assumptions used to measure fair value and clarifies assumptions about risk and the effect of a restriction on the sale or use of an asset. The guidance was effective for fiscal years beginning after November 15, 2007. In February 2008, the FASB issued guidance that delayed the effective date of this fair value guidance for all nonfinancial assets and nonfinancial liabilities, except those that are recognized or disclosed at fair value on a recurring basis (at least annually) to fiscal years beginning after November 15, 2008, and interim periods within those fiscal years. The effect of adopting this guidance was not material to the Company.
In December 2007, the FASB issued guidance that establishes principles and requirements for how an acquirer recognizes and measures in its financial statements the identifiable assets acquired, the liabilities assumed, and any noncontrolling interest in an acquiree, including the recognition and measurement of goodwill acquired in a business combination. The guidance is effective for fiscal years beginning on or after December 15, 2008. The Company believes the impact of this standard on the Company's results of operations or financial position is dependent on the nature of the acquisition. The adoption of this guidance did not have a material effect on the acquisition completed in 2009 (see Note 2).
38
In December 2007, the FASB issued guidance that changes the accounting and reporting for minority interests, which is recharacterized as noncontrolling interests and classified as a component of equity within the consolidated balance sheets. The guidance was effective as of the beginning of the first fiscal year beginning on or after December 15, 2008. The adoption of this standard did not have a material effect on the Company's results of operations or financial condition.
In June 2008, the FASB issued guidance which addresses whether instruments granted in share-based payment transactions are participating securities prior to vesting and, therefore, included in the earnings allocation in computing earnings per share (EPS) under the two-class method. Unvested share-based payment awards that contain non-forfeitable rights to dividends or dividend equivalents (whether paid or unpaid) are participating securities and shall be included in the computation of EPS pursuant to the two-class method. This guidance was effective for financial statements issued for fiscal years beginning after December 15, 2008, and interim periods within those years. All prior-period EPS data presented was to be adjusted retrospectively (including interim financial statements, summaries of earnings, and selected financial data) to conform to the provisions of this guidance. This guidance became effective for the Company on January 1, 2009 and did not have a material impact on the Company's earnings per share data.
In April 2009, the FASB issued guidance that emphasizes that the objective of a fair value measurement does not change even when market activity for the asset or liability has decreased significantly. Fair value is the price that would be received for an asset sold or paid to transfer a liability in an orderly transaction (that is, not a forced liquidation or distressed sale) between market participants at the measurement date under current market conditions. When observable transactions or quoted prices are not considered orderly, then little, if any, weight should be assigned to the indication of the asset or liability's fair value. Adjustments to those transactions or prices should be applied to determine the appropriate fair value. The guidance, which was applied prospectively, was effective for interim and annual reporting periods ending after June 15, 2009 early adoption for periods ending after March 15, 2009. The adoption of this guidance on April 1, 2009 did not have a material impact on the Company's results of operations or financial position.
In April 2009, the FASB amended existing guidance for determining whether impairment is other-than-temporary for debt securities. The guidance requires an entity to assess whether it intends to sell, or it is more likely than not that it will be required to sell, a security in an unrealized loss position before recovery of its amortized cost basis. If either of these criteria is met, the entire difference between amortized cost and fair value is recognized as impairment through earnings. For securities that do not meet the aforementioned criteria, the amount of impairment is split into two components as follows: 1) other-than-temporary impairment (OTTI) related to other factors, which is recognized in other comprehensive income and 2) OTTI related to credit loss, which must be recognized in the income statement. The credit loss is defined as the difference between the present value of the cash flows expected to be collected and the amortized cost basis. Additionally, disclosures about other-than-temporary impairments for debt and equity securities were expanded. This guidance was effective for interim and annual reporting periods ending after June 15, 2009, with early adoption permitted for periods ending after March 15, 2009. The adoption of this guidance on April 1, 2009 did not have a material impact on the Company's results of operations or financial position.
In June 2009, the FASB replaced The Hierarchy of Generally Accepted Accounting Principles, with the FASB Accounting Standards Codification™ (The Codification) as the source of authoritative accounting principles recognized by the FASB to be applied by nongovernmental entities in the preparation of financial statements in conformity with GAAP. Rules and interpretive releases of the Securities and Exchange Commission under authority of federal securities laws are also sources of authoritative GAAP for SEC registrants. The Codification was effective for financial statements issued for periods ending after September 15, 2009. The adoption of this guidance for the reporting period ending September 30, 2009 did not have a material effect on the Company's results of operations or financial position.
In August 2009, the FASB amended existing guidance for the fair value measurement of liabilities by clarifying that in circumstances in which a quoted price in an active market for the identical liability is not available, a reporting entity is required to measure fair value using a valuation technique that uses the quoted price of the identical liability when traded as an asset, quoted prices for similar liabilities or similar liabilities when traded as assets, or that is consistent with existing fair value guidance. The amendments in this guidance also clarify that both a quoted price in an active market for the identical liability at the measurement date and the quoted price for the identical liability when traded as an asset in an active market when no adjustments to the quoted price of the asset are required are Level 1 fair value measurements. The guidance was effective for the first reporting period beginning after issuance. This update became effective for the Company for the reporting period ending September 30, 2009 and did not have a material impact on the Company's results of operations or financial position.
39
Newly Issued Not Yet Effective Standards
In June 2009, the FASB amended previous guidance relating to transfers of financial assets and eliminates the concept of a qualifying special purpose entity. This guidance must be applied as of the beginning of each reporting entity's first annual reporting period that begins after November 15, 2009, for interim periods within that first annual reporting period and for interim and annual reporting periods thereafter. This guidance must be applied to transfers occurring on or after the effective date. Additionally, on and after the effective date, the concept of a qualifying special-purpose entity is no longer relevant for accounting purposes. Therefore, formerly qualifying special-purpose entities should be evaluated for consolidation by reporting entities on and after the effective date in accordance with the applicable consolidation guidance. The disclosure provisions were also amended and apply to transfers that occurred both before and after the effective date of this guidance. The Company does not expect the adoption of this guidance to have a material effect on the results of operations or financial position.
In June 2009, the FASB amended guidance for consolidation of variable interest entity guidance by replacing the quantitative-based risks and rewards calculation for determining which enterprise, if any, has a controlling financial interest in a variable interest entity with an approach focused on identifying which enterprise has the power to direct the activities of a variable interest entity that most significantly impact the entity's economic performance and (1) the obligation to absorb losses of the entity or (2) the right to receive benefits from the entity. Additional disclosures about an enterprise's involvement in variable interest entities are also required. This guidance is effective as of the beginning of each reporting entity's first annual reporting period that begins after November 15, 2009, for interim periods within that first annual reporting period, and for interim and annual reporting periods thereafter. Early adoption is prohibited. The Company does not expect the adoption of this guidance to have a material effect on its results of operations or financial position.
NOTE 2 — ACQUISITION
On May 2, 2009, the Company completed an acquisition of three branches from American Founders Bank ("AFB"). Two branches are located in Frankfort, Kentucky and the third in Lawrenceburg, Kentucky. Concurrent with this purchase, the Company sold one of its branches in Louisville, Kentucky, to AFB. Pursuant to the terms of the purchase agreement, AFB paid the Company approximately $18,400 in cash. The Company expensed approximately $78 of direct acquisition costs and recorded goodwill of $6,002 and $222 of core deposit intangible assets. The core deposits intangible is being amortized on an accelerated basis over 10 years. On the date of acquisition, the Company assumed net deposit liabilities valued at approximately $88,000, acquired a net portfolio of loans valued at approximately $61,000, and premises and equipment valued at $3,000. All loans acquired were performing loans and none were within the scope of ASC 310.
As a result of this acquisition, the Company has expanded its geographical presence in the state of Kentucky. The Company believes that the acquisition will allow it to increase its customer base to enhance deposit fee income and market additional products and services to new customers.
NOTE 3 — RESTRICTION ON CASH AND DUE FROM BANKS
The Banks are required to maintain reserve funds in cash or on deposit with the Federal Reserve Bank. The reserves required at December 31, 2009 and 2008 were $7,574 and $11,789. The Company also had compensating balances of $0 and $2,861 at December 31, 2009 and 2008.
40
NOTE 4 — SECURITIES
The fair value of securities available for sale and related gross unrealized gains and losses recognized in accumulated other comprehensive income (loss) was as follows:
| |
Amortized Cost |
Gross Unrealized Gains |
Gross Unrealized Losses |
Fair Value |
||||||||||||
|---|---|---|---|---|---|---|---|---|---|---|---|---|---|---|---|---|
As of December 31, 2009 |
||||||||||||||||
Available for Sale |
||||||||||||||||
U.S. government agency |
$ | 14,386 | $ | 1 | $ | — | $ | 14,387 | ||||||||
State and municipal |
225,845 | 8,588 | (948 | ) | 233,485 | |||||||||||
Mortgage-backed securities-residential (Government Sponsored Entity) |
234,851 | 9,043 | (186 | ) | 243,708 | |||||||||||
Collateralized mortgage obligations |
211,123 | 4,595 | (377 | ) | 215,341 | |||||||||||
Equity securities |
4,463 | — | (96 | ) | 4,367 | |||||||||||
Other securities |
4,542 | — | (1,223 | ) | 3,319 | |||||||||||
Total available for sale |
$ | 695,210 | $ | 22,227 | $ | (2,830 | ) | $ | 714,607 | |||||||
As of December 31, 2008 |
||||||||||||||||
Available for Sale |
||||||||||||||||
U.S. government agency |
$ | 32,898 | $ | 148 | $ | — | $ | 33,046 | ||||||||
State and municipal |
155,389 | 1,127 | (3,316 | ) | 153,200 | |||||||||||
Mortgage-backed securities-residential (Government Sponsored Entity) |
197,986 | 6,056 | (1 | ) | 204,041 | |||||||||||
Collateralized mortgage obligations |
112,291 | 2,169 | (1 | ) | 114,459 | |||||||||||
Equity securities |
2,563 | — | (76 | ) | 2,487 | |||||||||||
Other securities |
7,340 | 2 | (1,265 | ) | 6,077 | |||||||||||
Total available for sale |
$ | 508,467 | $ | 9,502 | $ | (4,659 | ) | $ | 513,310 | |||||||
Contractual maturities of securities at December 31, 2009 were as follows. Securities not due at a single maturity or with no maturity at year end are shown separately.
| |
|
Available for Sale |
|||||||
|---|---|---|---|---|---|---|---|---|---|
| |
Amortized Cost |
||||||||
| |
Fair Value |
||||||||
Within one year |
$ | 1,252 | $ | 1,268 | |||||
One through five years |
26,845 | 27,549 | |||||||
Six through ten years |
68,514 | 71,059 | |||||||
After ten years |
148,162 | 151,315 | |||||||
Mortgage-backed securities-residential (GSE's) |
234,851 | 243,708 | |||||||
Collateralized mortgage obligations |
211,123 | 215,341 | |||||||
Equity securities |
4,463 | 4,367 | |||||||
Total available for sale securities |
$ | 695,210 | $ | 714,607 | |||||
Gross proceeds from sales and calls of securities available for sale during 2009 and sales during 2008 and 2007 were $136,340, $98,647, and $91,057. Gross gains of $1,518, $1,255, and $642 and gross losses of $105, $137, and $28 were realized on those sales in 2009, 2008 and 2007, respectively. The tax benefit (provision) related to these net realized gains and losses was ($495), ($401), and ($221) respectively.
Securities with a carrying value of $272,675 and $303,810 were pledged at December 31, 2009 and 2008 to secure certain deposits, repurchase agreements and for other purposes as permitted or required by law.
At year end 2009 and 2008, there were no holdings of securities of any one issuer, other than the U.S. Government and its sponsored entities, in an amount greater than 10% of shareholders' equity.
41
Below is a summary of securities with unrealized losses as of year-end 2009 and 2008 presented by length of time the securities have been in a continuous unrealized loss position.
| 2009 |
Less than 12 months |
12 months or longer |
Total |
||||||||||||||||
|---|---|---|---|---|---|---|---|---|---|---|---|---|---|---|---|---|---|---|---|
| |
|||||||||||||||||||
| Description of securities |
Fair Value |
Unrealized Losses |
Fair Value |
Unrealized Losses |
Fair Value |
Unrealized Losses |
|||||||||||||
State and municipal |
$ | 12,937 | $ | (675 | ) | $ | 7,542 | $ | (273 | ) | $ | 20,479 | $ | (948 | ) | ||||
Mortgage-backed securities-residential (GSE's) |
43,904 | (186 | ) | — | — | 43,904 | (186 | ) | |||||||||||
Collateralized mortgage obligations |
50,124 | (376 | ) | 3 | (1 | ) | 50,127 | (377 | ) | ||||||||||
Equity securites |
— | — | 888 | (96 | ) | 888 | (96 | ) | |||||||||||
Other securities |
— | — | 3,319 | (1,223 | ) | 3,319 | (1,223 | ) | |||||||||||
Total temporarily impaired |
$ | 106,965 | $ | (1,237 | ) | $ | 11,752 | $ | (1,593 | ) | $ | 118,717 | $ | (2,830 | ) | ||||
|
|||||||||||||||||||
| 2008 |
Less than 12 months |
12 months or longer |
Total |
||||||||||||||||
| |
|||||||||||||||||||
| Description of securities |
Fair Value |
Unrealized Losses |
Fair Value |
Unrealized Losses |
Fair Value |
Unrealized Losses |
|||||||||||||
State and municipal |
$ | 92,756 | $ | (3,205 | ) | $ | 1,568 | $ | (111 | ) | $ | 94,324 | $ | (3,316 | ) | ||||
Mortgage-backed securities-residential (GSE's) |
58 | (1 | ) | — | — | 58 | (1 | ) | |||||||||||
Collateralized mortgage obligations |
1,344 | (1 | ) | — | — | 1,344 | (1 | ) | |||||||||||
Equity securites |
— | — | 981 | (76 | ) | 981 | (76 | ) | |||||||||||
Other securities |
5,326 | (1,265 | ) | 5,326 | (1,265 | ) | |||||||||||||
Total temporarily impaired |
$ | 99,484 | $ | (4,472 | ) | $ | 2,549 | $ | (187 | ) | $ | 102,033 | $ | (4,659 | ) | ||||
Other-Than-Temporary-Impairment
Management evaluates securities for other-than-temporary impairment ("OTTI") at least on a quarterly basis, and more frequently when economic or market conditions warrant such an evaluation. The investment securities portfolio is evaluated for OTTI by segregating the portfolio into two general segments and applying the appropriate OTTI model. Investment securities are generally evaluated for OTTI under ASC 320. However, certain purchased beneficial interests, including non-agency mortgage-backed securities, asset-backed securities, and collateralized debt obligations, that had credit ratings at the time of purchase of below AA are evaluated using the model outlined in ASC 325-10 (formerly EITF Issue No. 99-20, Recognition of Interest Income and Impairment on Purchased Beneficial Interests and Beneficial Interests that Continue to be Held by a Transfer in Securitized Financial Assets). The Company holds none of these type securities.
In determining OTTI under ASC 320, management considers many factors, including: (1) the length of time and the extent to which the fair value has been less than cost, (2) the financial condition and near-term prospects of the issuer, (3) whether the market decline was affected by macroeconomic conditions, and (4) whether the entity has the intent to sell the debt security or more likely than not will be required to sell the debt security before its anticipated recovery. The assessment of whether an other-than-temporary decline exists involves a high degree of subjectivity and judgment and is based on the information available to management at a point in time.
When OTTI occurs under either model, the amount of the OTTI recognized in earnings depends on whether the Company intends to sell the security or it is more likely than not it will be required to sell the security before recovery of its amortized cost basis, less any current-period credit loss. If an entity intends to sell or it is more likely than not it will be required to sell the security before recovery of its amortized cost basis, less any current-period credit loss, the OTTI shall be recognized in earnings equal to the entire difference between the investment's amortized cost basis and its fair value at the balance sheet date. If an entity does not intend to sell the security and it is not more likely than not that the entity will be required to sell the security before recovery of its amortized cost basis less any current-period loss, the OTTI shall be separated into the amount representing the credit loss and the amount related to all other factors. The amount of the total OTTI related to the credit loss is determined based on the present value of cash flows expected to be collected and is recognized in earnings. The amount of the total OTTI related to other factors is recognized in other comprehensive income, net of applicable taxes. The previous amortized cost basis less the OTTI recognized in earnings becomes the new amortized cost basis of the investment.
As of December 31, 2009, the Company's security portfolio consisted of 787 securities, 63 of which were in an unrealized loss position. Unrealized losses on state and municipal securities have not been recognized into income because management has the ability to hold for a period of time sufficient to allow for any anticipated recovery in fair value and it is unlikely that management will be required to sell the securities before their anticipated recovery. The decline in value is primarily attributable to temporary
42
illiquidity and the financial crisis affecting these markets and not necessarily the expected cash flows of the individual securities. The fair value of these debt securities is expected to recover as the securities approach their maturity date.
The unrealized losses on other securities are related to four single issue trust preferred securities and have not been recognized into income because management has the ability to hold for a period of time sufficient to allow for any anticipated recovery in fair value and it is unlikely that management will be required to sell the securities before their anticipated recovery. All but one of these investments are currently rated investment grade. The other investment is not rated. The Company performs a quarterly review of these securities and based on this review, no evidence of adverse changes in expected cash flows is anticipated. The decline in value is primarily attributable to temporary illiquidity and the financial crisis affecting these markets and not necessarily the expected cash flows of the individual securities. Currently, the issuers have made all contractual payments and given no indication that they will not be able to make them into the future. The fair value of these debt securities is expected to recover as the securities approach their maturity date. As of December 31, 2009, the Company owned $3,319 of these securities with an unrealized loss of $1,223.
During 2009, the Company identified one of its equity holdings to be other than temporarily impaired and wrote down the security by $150 to its fair value ($0). During 2007, the Company identified one corporate bond that was considered to be other-than-temporarily impaired. The Company wrote down the value of that security by $500 to its fair value ($0). These amounts were included in net realized gains/(losses) on securities.
NOTE 5 — LOANS AND ALLOWANCE FOR LOAN LOSSES
Loans were as follows:
| |
December 31, 2009 |
December 31, 2008 |
|||||||
|---|---|---|---|---|---|---|---|---|---|
Commercial and industrial loans |
$ | 195,509 | $ | 226,696 | |||||
Agricultural production financing |
41,889 | 40,334 | |||||||
Farm real estate |
45,332 | 45,918 | |||||||
Commercial real estate |
407,658 | 411,317 | |||||||
Hotel |
144,012 | 104,647 | |||||||
Residential real estate |
813,602 | 877,145 | |||||||
Construction and development |
142,472 | 173,551 | |||||||
Consumer |
94,973 | 115,993 | |||||||
Total loans |
1,885,447 | 1,995,601 | |||||||
Allowance for loan losses |
(46,648 | ) | (34,583 | ) | |||||
Net loans |
$ | 1,838,799 | $ | 1,961,018 | |||||
Activity in the allowance for loan losses was as follows:
| |
2009 |
2008 |
2007 |
|||||||||
|---|---|---|---|---|---|---|---|---|---|---|---|---|
Allowance for loan losses |
||||||||||||
Balances, January 1 |
$ | 34,583 | $ | 14,331 | $ | 12,792 | ||||||
Addition resulting from acquisitions |
— | 5,564 | — | |||||||||
Provision for losses |
46,310 | 20,918 | 5,745 | |||||||||
Recoveries on loans |
1,957 | 1,037 | 1,152 | |||||||||
Loans charged off |
(36,202 | ) | (7,267 | ) | (5,358 | ) | ||||||
Balances, December 31 |
$ | 46,648 | $ | 34,583 | $ | 14,331 | ||||||
Impaired loans were as follows:
| December 31 |
2009 |
2008 |
2007 |
|||||||||
|---|---|---|---|---|---|---|---|---|---|---|---|---|
Impaired loans with an allowance allocated |
$ | 67,336 | $ | 28,769 | $ | 12,964 | ||||||
Impaired loans with no allocated allowances |
26,793 | 26,902 | 8,327 | |||||||||
Total impaired loans |
$ | 94,129 | $ | 55,671 | $ | 21,291 | ||||||
Allowance allocated for impaired loans |
$ | 24,499 | $ | 7,677 | $ | 2,346 | ||||||
Average balance of impaired loans during the year |
$ | 84,387 | $ | 37,591 | $ | 21,761 | ||||||
Interest income recognized on impaired loans |
101 | 432 | 644 | |||||||||
Cash basis interest included above |
101 | 432 | 644 | |||||||||
43
At December 31, 2009, the Company had charged down nine impaired loans by $14,071. The Company had also committed to extend additional funds of less than $50 to these impaired borrowers.
Nonperforming loans were as follows:
| December 31 |
2009 |
2008 |
|||||
|---|---|---|---|---|---|---|---|
Loans past due 90 days or more still on accrual |
$ | 3,279 | $ | 3,639 | |||
Nonaccrual loans |
77,074 | 55,671 | |||||
Total |
$ | 80,353 | $ | 59,310 | |||
Nonperforming loans include both smaller balance homogeneous loans that are collectively evaluated for impairment and individually classified impaired loans.
The Company has allocated $1,756 of specific reserves to customers whose loan terms have been modified in troubled debt restructurings as of December 31, 2009. The Company has committed to lend additional amounts totaling $1,968 to customers with outstanding loans that are classified as troubled debt restructurings.
Purchased Loans subject to ASC 310
The Company has purchased loans for which there was, at acquisition, evidence of deterioration of credit quality since origination and it was probable, at acquisition, that all contractually required payments would not be collected. The carrying amount of those loans is as follows as of December 31:
| |
2009 |
2008 |
2007 |
|||||||||
|---|---|---|---|---|---|---|---|---|---|---|---|---|
Commercial real estate |
$ | 3,718 | $ | 4,548 | $ | 6,945 | ||||||
Construction & development |
1,036 | 10,153 | — | |||||||||
Mortgage |
881 | 3,905 | 354 | |||||||||
Consumer |
— | — | 249 | |||||||||
Outstanding balance |
5,635 | 18,606 | 7,548 | |||||||||
Carrying amount, net of allowance of $1,297, $67, and $565. |
$ | 3,520 | $ | 12,149 | $ | 5,951 | ||||||
For those purchased loans disclosed above, the Company increased the allowance for loan losses by $1,230, $0 and $565 during 2009, 2008 and 2007. $498 of allowance for loan losses was reversed in 2008 only.
Purchased loans for which it was probable at acquisition that all contractually required payments would not be collected are shown below. No such loans were acquired in 2009 or 2007.
| |
2008 |
||||||
|---|---|---|---|---|---|---|---|
Contractually required payments receivable of loans purchased during the year: |
|||||||
Commercial real estate |
$ | 5,005 | |||||
Construction & development |
12,429 | ||||||
Mortgage loans |
4,384 | ||||||
Consumer |
— | ||||||
Total |
$ | 21,818 | |||||
Cash flows expected to be collected at acquisition |
$ | 12,604 | |||||
Basis in acquired loans at acquisition |
12,604 | ||||||
NOTE 6 — FAIR VALUE
Fair value is the exchange price that would be received for an asset or paid to transfer a liability (exit price) in the principal or most advantageous market for the asset or liability in an orderly transaction between market participants on the measurement date. There are three levels of inputs that may be used to measure fair values:
Level 1: Quoted prices (unadjusted) for identical assets or liabilities in active markets that the entity has the ability to access as of the measurement date.
Level 2: Significant other observable inputs other than Level 1 prices such as quoted prices for similar assets or liabilities; quoted prices in markets that are not active; or other inputs that are observable or can be corroborated by observable market data.
Level 3: Significant unobservable inputs that reflect a reporting entity's own assumptions about the assumptions that market participants would use in pricing an asset or liability.
44
The Company used the following methods and significant assumptions to estimate the fair values of each type of financial instrument:
The fair values of securities available for sale are determined by obtaining quoted prices on nationally recognized securities exchanges (Level 1 inputs) or using market data utilizing pricing models, primarily Interactive Data Corporation (IDC), that vary based upon asset class and include available trade, bid, and other market information. Matrix pricing is used for most municipals, which is a mathematical technique widely used in the industry to value debt securities without relying exclusively on quoted prices for the specific securities but rather by relying on the securities' relationship to other benchmark quoted securities. The grouping of securities is done according to insurer, credit support, state of issuance, and rating to incorporate additional spreads and municipal curves. For the general market municipals, the Thomson Municipal Market Data curve is used to determine the initial curve for determining the price, movement, and yield relationships with the municipal market (Level 2 inputs). Level 3 securities are largely comprised of small, local municipality issuances, Community Reinvestment Act (CRA) qualified credits, and equity securities. Fair values are derived through consideration of funding type, maturity and other features of the issuance, and include reviewing financial statements, earnings forecasts, industry trends and the valuation of comparative issuers.
The fair value of servicing rights is based on a valuation model that incorporates assumptions that market participants would use in estimating future net servicing income, such as the cost to service, the discount rate, the custodial earnings rate, an inflation rate, ancillary income, prepayment speeds and default rates and losses. The Company compares the valuation model inputs and results to published industry data in order to validate the model results and assumptions. (Level 2 inputs).
The fair value of impaired loans with specific allocations of the allowance for loan losses is generally based on recent real estate appraisals. These appraisals may utilize a single valuation approach or a combination of approaches including comparable sales and the income approach. Adjustments are routinely made in the appraisal process by the appraisers to adjust for differences between the comparable sales and income data available. Such adjustments are typically significant and result in a Level 3 classification of the inputs for determining fair value.
The fair value of goodwill is based on a two step test. The first step, used to identify potential impairment, involves determining and comparing the fair value of a company, including a control premium, with its carrying value, or shareholders equity. If the fair value of a company exceeds its carrying value, goodwill is not impaired. If the carrying value exceeds fair value, there is an indication of impairment and the second step is performed to determine the amount of impairment, if any. The second step compares the fair value of the Company to the aggregate fair values of its individual assets, liabilities and identified intangibles (Level 3 inputs).
The fair value of other real estate owned is measured based on the value of the collateral securing those assets and is determined using several methods. The fair value of real estate is generally determined based on appraisals by qualified licensed appraisers. The appraisers typically determine the value of the real estate by utilizing an income or market valuation approach. If an appraisal is not available, the fair value may be determined by using a cash flow analysis (Level 3 inputs).
Assets and Liabilities Measured on a Recurring Basis
Assets and liabilities measured at fair value on a recurring basis, including financial assets and liabilities for which the Company has elected the fair value option, are summarized below:
| |
|
Fair Value Measurements at December 31, 2009 Using: | |||||||||||||
|---|---|---|---|---|---|---|---|---|---|---|---|---|---|---|---|
| (Dollars in thousands) |
Carrying Value |
Quoted Prices in Active Markets for Identical Assets (Level 1) |
Significant Other Observable Inputs (Level 2) |
Significant Unobservable Inputs (Level 3) |
|||||||||||
Financial Assets |
|||||||||||||||
Investment securities available-for sale |
|||||||||||||||
U.S. government agencies |
$ | 14,387 | $ | 14,387 | |||||||||||
States and municipal |
233,485 | 232,556 | 929 | ||||||||||||
Mortgage-backed securities — residential |
243,708 | 243,708 | |||||||||||||
Collateralized mortgage obligations |
215,341 | 215,340 | 1 | ||||||||||||
Equity securities |
4,367 | 111 | 4,256 | ||||||||||||
Other securities |
3,319 | 1,779 | 1,540 | ||||||||||||
Total investment securities available-for-sale |
$ | 714,607 | $ | 111 | $ | 707,770 | $ | 6,726 | |||||||
45
| |
|
Fair Value Measurements at December 31, 2008 Using | |||||||||||||
|---|---|---|---|---|---|---|---|---|---|---|---|---|---|---|---|
| |
Carrying Value |
Quoted Prices in Active Markets for Identical Assets (Level 1) |
Significant Other Observable Inputs (Level 2) |
Significant Unobservable Inputs (Level 3) |
|||||||||||
Financial Assets |
|||||||||||||||
Investment securities available-for sale U.S. government agencies |
$ | 33,046 | $ | 33,046 | |||||||||||
States and municipal |
153,200 | 152,270 | 930 | ||||||||||||
Mortgage-backed securities — residential |
204,041 | 204,041 | |||||||||||||
Collateralized mortgage obligations |
114,459 | 114,459 | |||||||||||||
Equity securities |
2,487 | 131 | 2,356 | ||||||||||||
Other securities |
6,077 | 4,807 | 1,270 | ||||||||||||
Total investment securities available-for-sale |
$ | 513,310 | $ | 131 | $ | 508,623 | $ | 4,556 | |||||||
The table below presents a reconciliation and income statement classification of gains and losses for all assets measured at fair value on a recurring basis using significant unobservable inputs (Level 3) for the year ended December 31, 2009:
| |
Available for sale securities |
|||||||
|---|---|---|---|---|---|---|---|---|
Beginning balance, January 1, 2009 |
$ | 4,556 | ||||||
Total gains or losses (realized / unrealized) |
||||||||
Included in earnings |
||||||||
Other changes in fair value |
— | |||||||
Gains (losses) on sales of securities |
(204 | ) | ||||||
Included in other comprehensive income |
704 | |||||||
Purchases, issuances, and settlements |
2,183 | |||||||
Transfers in and / or out of Level 3 |
(513 | ) | ||||||
Ending balance, December 31, 2009 |
$ | 6,726 | ||||||
| |
Available for sale securities |
|||||||
|---|---|---|---|---|---|---|---|---|
Beginning balance, January 1, 2008 |
$ | 4,988 | ||||||
Total gains or losses (realized / unrealized) |
||||||||
Included in earnings |
||||||||
Other changes in fair value |
— | |||||||
Gains (losses) on securities |
— | |||||||
Included in other comprehensive income |
(529 | ) | ||||||
Purchases, issuances, and settlements |
1,945 | |||||||
Transfers in and / or out of Level 3 |
(1,848 | ) | ||||||
Ending balance, December 31, 2008 |
$ | 4,556 | ||||||
Transfers out of Level 3 are primarily due to the availability of Level 2 data.
46
Assets and Liabilities Measured on a Non-Recurring Basis
Assets and liabilities measured at fair value on a non-recurring basis are summarized below:
| |
|
Fair Value Measurements at December 31, 2009 Using | |||||||||||||
|---|---|---|---|---|---|---|---|---|---|---|---|---|---|---|---|
| |
December 31, 2009 |
Quoted Prices in Active Markets for Identical Assets (Level 1) |
Significant Other Observable Inputs (Level 2) |
Significant Unobservable Inputs (Level 3) |
|||||||||||
Assets: |
|||||||||||||||
Impaired loans |
$ | 52,133 | $ | 52,133 | |||||||||||
Servicing rights |
5,042 | $ | 5,042 | ||||||||||||
Goodwill |
62,909 | 62,909 | |||||||||||||
Other real estate owned |
1,369 | 1,369 | |||||||||||||
| |
|
Fair Value Measurements at December 31, 2008 Using | |||||||||||||
|---|---|---|---|---|---|---|---|---|---|---|---|---|---|---|---|
| |
December 31, 2008 |
Quoted Prices in Active Markets for Identical Assets (Level 1) |
Significant Other Observable Inputs (Level 2) |
Significant Unobservable Inputs (Level 3) |
|||||||||||
Assets: |
|||||||||||||||
Impaired loans |
$ | 21,092 | $ | 21,092 | |||||||||||
Servicing rights |
3,359 | $ | 3,359 | ||||||||||||
The following represent impairment charges recognized during the period:
Impaired loans, which are measured for impairment using the fair value of the collateral for collateral dependent loans, had a gross carrying amount of $67,336, with a valuation allowance of $15,203, resulting in an additional provision for loan losses of $7,526 in 2009. At December 31, 2008, impaired loans had a gross carrying amount of $28,769, with a valuation allowance of $7,677, resulting in an additional provision for loan losses of $7,398 for the year ending December 31, 2008.
Servicing rights, which are carried at lower of cost or fair value, were carried at a fair value of $5,042, which is made up of the gross outstanding balance of $5,668, net of a valuation allowance of $626. A credit of $600 was included in 2009 earnings. In 2008, servicing rights were written down to a fair value of $3,359, resulting in a valuation allowance of $1,226. A charge of $1,226 was included in 2008 earnings.
Goodwill, which is evaluated for impairment on an annual basis, or more frequently if the situation warrants, was written down to a fair value of $62,909. $80,310 of impairment was incurred in 2009.
Other real estate owned is evaluated at the time a property is acquired through foreclosure or shortly thereafter. Fair value is based on appraisals by qualified licensed appraisers. During 2009, these properties were written down by $615 which was included in 2009 earnings.
Carrying amount and estimated fair values of financial instruments, not previously presented, at year end were as follows:
| |
2009 | 2008 | |||||||||||||
|---|---|---|---|---|---|---|---|---|---|---|---|---|---|---|---|
| December 31 |
Carrying Amount |
Fair Value |
Carrying Amount |
Fair Value |
|||||||||||
Assets |
|||||||||||||||
Cash and cash equivalents |
$ | 71,689 | $ | 71,689 | $ | 95,488 | $ | 95,488 | |||||||
Interest-bearing time deposits |
— | — | 116 | 116 | |||||||||||
Loans including loans held for sale, net |
1,843,927 | 1,750,265 | 1,965,965 | 2,048,006 | |||||||||||
Restricted stock |
27,359 | N/A | 29,833 | N/A | |||||||||||
Interest receivable |
7,965 | 7,965 | 12,603 | 12,603 | |||||||||||
Liabilities |
|||||||||||||||
Deposits |
(2,270,650 | ) | (2,283,151 | ) | (2,009,324 | ) | (2,009,750 | ) | |||||||
Other borrowings |
(47,631 | ) | (47,631 | ) | (84,448 | ) | (84,448 | ) | |||||||
FHLB advances |
(222,265 | ) | (195,946 | ) | (433,167 | ) | (443,486 | ) | |||||||
Interest payable |
(4,786 | ) | (4,786 | ) | (6,564 | ) | (6,564 | ) | |||||||
Subordinated debentures |
(49,966 | ) | (26,485 | ) | (49,816 | ) | (29,019 | ) | |||||||
47