Attached files
| file | filename |
|---|---|
| 8-K - 8-K - LTC PROPERTIES INC | a15-10368_18k.htm |
| EX-99.1 - EX-99.1 - LTC PROPERTIES INC | a15-10368_1ex99d1.htm |
Exhibit 99.2
|
|
Supplemental Operating and Financial Data March 31, 2015 (Unaudited) Skilled Nursing Property – Granbury, TX Operated by Senior Care Centers |
|
|
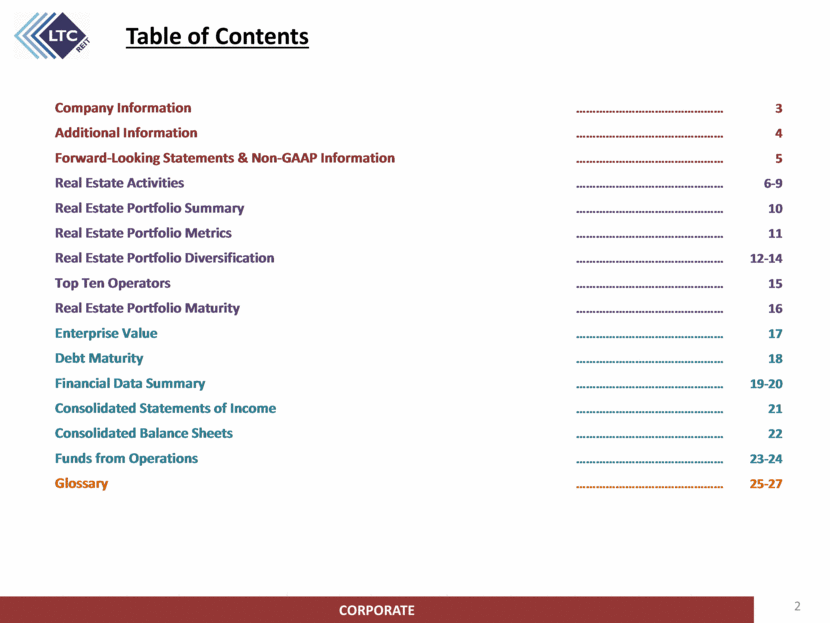
Table of Contents 2 CORPORATE Company Information 3 Additional Information 4 Forward-Looking Statements & Non-GAAP Information 5 Real Estate Activities 6-9 Real Estate Portfolio Summary 10 Real Estate Portfolio Metrics 11 Real Estate Portfolio Diversification 12-14 Top Ten Operators 15 Real Estate Portfolio Maturity 16 Enterprise Value 17 Debt Maturity 18 Financial Data Summary 19-20 Consolidated Statements of Income 21 Consolidated Balance Sheets 22 Funds from Operations 23-24 Glossary 25-27 |
|
|
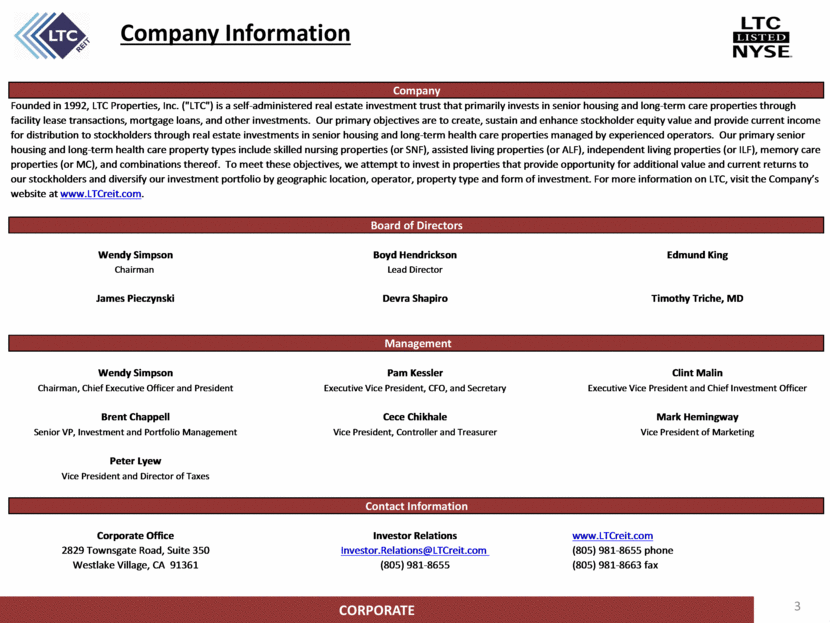
3 Company Information CORPORATE Wendy Simpson Boyd Hendrickson Edmund King Chairman Lead Director James Pieczynski Devra Shapiro Timothy Triche, MD Wendy Simpson Pam Kessler Clint Malin Chairman, Chief Executive Officer and President Executive Vice President, CFO, and Secretary Executive Vice President and Chief Investment Officer Brent Chappell Cece Chikhale Mark Hemingway Senior VP, Investment and Portfolio Management Vice President, Controller and Treasurer Vice President of Marketing Peter Lyew Vice President and Director of Taxes Corporate Office Investor Relations www.LTCreit.com 2829 Townsgate Road, Suite 350 Investor.Relations@LTCreit.com (805) 981-8655 phone Westlake Village, CA 91361 (805) 981-8655 (805) 981-8663 fax Board of Directors Management Contact Information Company Founded in 1992, LTC Properties, Inc. ("LTC") is a self-administered real estate investment trust that primarily invests in senior housing and long-term care properties through facility lease transactions, mortgage loans, and other investments. Our primary objectives are to create, sustain and enhance stockholder equity value and provide current income for distribution to stockholders through real estate investments in senior housing and long-term health care properties managed by experienced operators. Our primary senior housing and long-term health care property types include skilled nursing properties (or SNF), assisted living properties (or ALF), independent living properties (or ILF), memory care properties (or MC), and combinations thereof. To meet these objectives, we attempt to invest in properties that provide opportunity for additional value and current returns to our stockholders and diversify our investment portfolio by geographic location, operator, property type and form of investment. For more information on LTC, visit the Company’s website at www.LTCreit.com. |
|
|
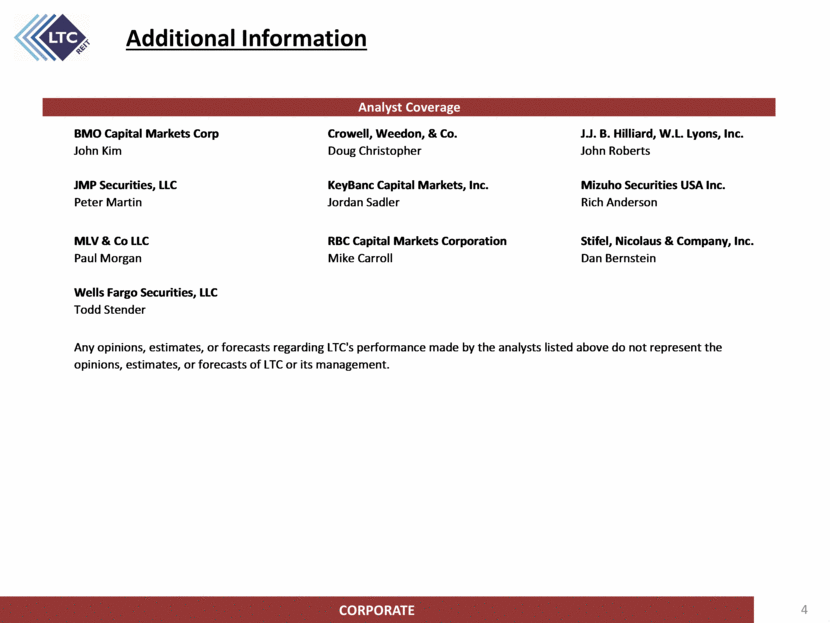
4 CORPORATE Additional Information BMO Capital Markets Corp Crowell, Weedon, & Co. J.J. B. Hilliard, W.L. Lyons, Inc. John Kim Doug Christopher John Roberts JMP Securities, LLC KeyBanc Capital Markets, Inc. Mizuho Securities USA Inc. Peter Martin Jordan Sadler Rich Anderson MLV & Co LLC RBC Capital Markets Corporation Stifel, Nicolaus & Company, Inc. Paul Morgan Mike Carroll Dan Bernstein Wells Fargo Securities, LLC Todd Stender Any opinions, estimates, or forecasts regarding LTC's performance made by the analysts listed above do not represent the opinions, estimates, or forecasts of LTC or its management. Analyst Coverage |
|
|
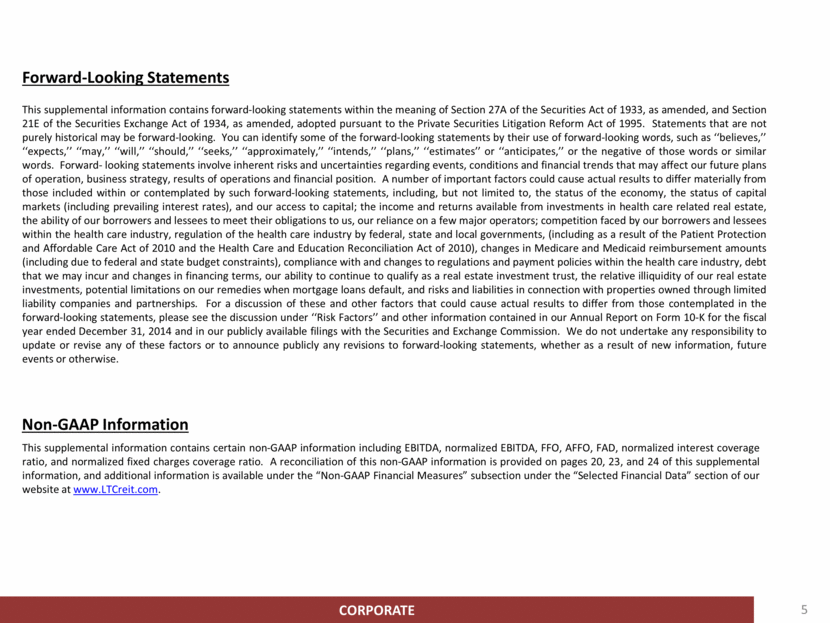
5 Forward-Looking Statements This supplemental information contains forward-looking statements within the meaning of Section 27A of the Securities Act of 1933, as amended, and Section 21E of the Securities Exchange Act of 1934, as amended, adopted pursuant to the Private Securities Litigation Reform Act of 1995. Statements that are not purely historical may be forward-looking. You can identify some of the forward-looking statements by their use of forward-looking words, such as ‘‘believes,’’ ‘‘expects,’’ ‘‘may,’’ ‘‘will,’’ ‘‘should,’’ ‘‘seeks,’’ ‘‘approximately,’’ ‘‘intends,’’ ‘‘plans,’’ ‘‘estimates’’ or ‘‘anticipates,’’ or the negative of those words or similar words. Forward- looking statements involve inherent risks and uncertainties regarding events, conditions and financial trends that may affect our future plans of operation, business strategy, results of operations and financial position. A number of important factors could cause actual results to differ materially from those included within or contemplated by such forward-looking statements, including, but not limited to, the status of the economy, the status of capital markets (including prevailing interest rates), and our access to capital; the income and returns available from investments in health care related real estate, the ability of our borrowers and lessees to meet their obligations to us, our reliance on a few major operators; competition faced by our borrowers and lessees within the health care industry, regulation of the health care industry by federal, state and local governments, (including as a result of the Patient Protection and Affordable Care Act of 2010 and the Health Care and Education Reconciliation Act of 2010), changes in Medicare and Medicaid reimbursement amounts (including due to federal and state budget constraints), compliance with and changes to regulations and payment policies within the health care industry, debt that we may incur and changes in financing terms, our ability to continue to qualify as a real estate investment trust, the relative illiquidity of our real estate investments, potential limitations on our remedies when mortgage loans default, and risks and liabilities in connection with properties owned through limited liability companies and partnerships. For a discussion of these and other factors that could cause actual results to differ from those contemplated in the forward-looking statements, please see the discussion under ‘‘Risk Factors’’ and other information contained in our Annual Report on Form 10-K for the fiscal year ended December 31, 2014 and in our publicly available filings with the Securities and Exchange Commission. We do not undertake any responsibility to update or revise any of these factors or to announce publicly any revisions to forward-looking statements, whether as a result of new information, future events or otherwise. Non-GAAP Information This supplemental information contains certain non-GAAP information including EBITDA, normalized EBITDA, FFO, AFFO, FAD, normalized interest coverage ratio, and normalized fixed charges coverage ratio. A reconciliation of this non-GAAP information is provided on pages 20, 23, and 24 of this supplemental information, and additional information is available under the “Non-GAAP Financial Measures” subsection under the “Selected Financial Data” section of our website at www.LTCreit.com. CORPORATE |
|
|
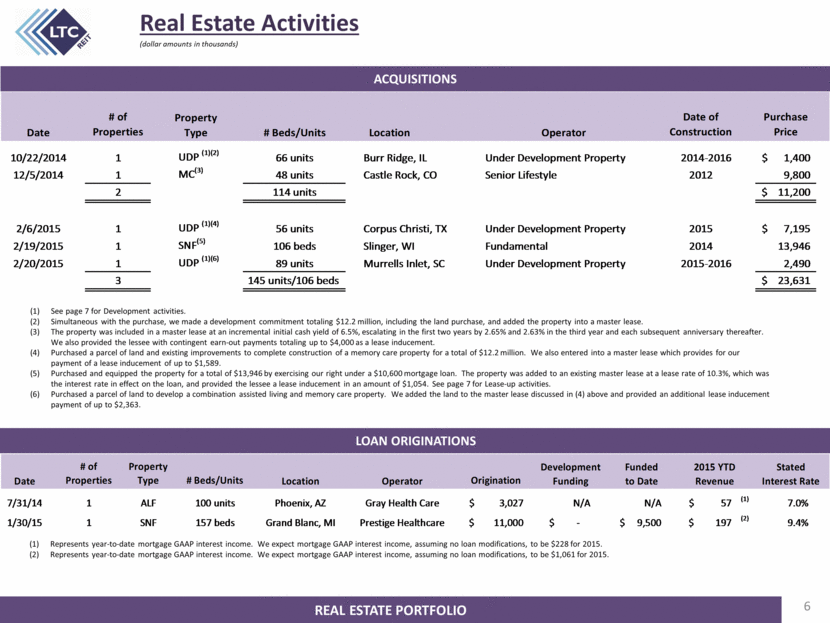
6 Real Estate Activities REAL ESTATE PORTFOLIO (dollar amounts in thousands) ACQUISITIONS (1) See page 7 for Development activities. (2) Simultaneous with the purchase, we made a development commitment totaling $12.2 million, including the land purchase, and added the property into a master lease. (3) The property was included in a master lease at an incremental initial cash yield of 6.5%, escalating in the first two years by 2.65% and 2.63% in the third year and each subsequent anniversary thereafter. We also provided the lessee with contingent earn-out payments totaling up to $4,000 as a lease inducement. (4) Purchased a parcel of land and existing improvements to complete construction of a memory care property for a total of $12.2 million. We also entered into a master lease which provides for our payment of a lease inducement of up to $1,589. (5) Purchased and equipped the property for a total of $13,946 by exercising our right under a $10,600 mortgage loan. The property was added to an existing master lease at a lease rate of 10.3%, which was the interest rate in effect on the loan, and provided the lessee a lease inducement in an amount of $1,054. See page 7 for Lease-up activities. (6) Purchased a parcel of land to develop a combination assisted living and memory care property. We added the land to the master lease discussed in (4) above and provided an additional lease inducement payment of up to $2,363. LOAN ORIGINATIONS Represents year-to-date mortgage GAAP interest income. We expect mortgage GAAP interest income, assuming no loan modifications, to be $228 for 2015. Represents year-to-date mortgage GAAP interest income. We expect mortgage GAAP interest income, assuming no loan modifications, to be $1,061 for 2015. Date # of Properties # Beds/Units Location Operator Date of Construction Purchase Price 10/22/2014 1 UDP (1)(2) 66 units Burr Ridge, IL Under Development Property 2014-2016 1,400 $ 12/5/2014 1 MC (3) 48 units Castle Rock, CO Senior Lifestyle 2012 9,800 2 114 units 11,200 $ 2/6/2015 1 UDP (1)(4) 56 units Corpus Christi, TX Under Development Property 2015 7,195 $ 2/19/2015 1 SNF (5) 106 beds Slinger, WI Fundamental 2014 13,946 2/20/2015 1 UDP (1)(6) 89 units Murrells Inlet, SC Under Development Property 2015-2016 2,490 3 145 units/106 beds 23,631 $ Property Type Date # of Properties Property Type # Beds/Units Location Operator Origination 7/31/14 1 ALF 100 units Phoenix, AZ Gray Health Care 3,027 $ N/A N/A 57 $ (1) 7.0% 1/30/15 1 SNF 157 beds Grand Blanc, MI Prestige Healthcare 11,000 $ - $ 9,500 $ 197 $ (2) 9.4% Stated Interest Rate 2015 YTD Revenue Development Funding Funded to Date |
|
|
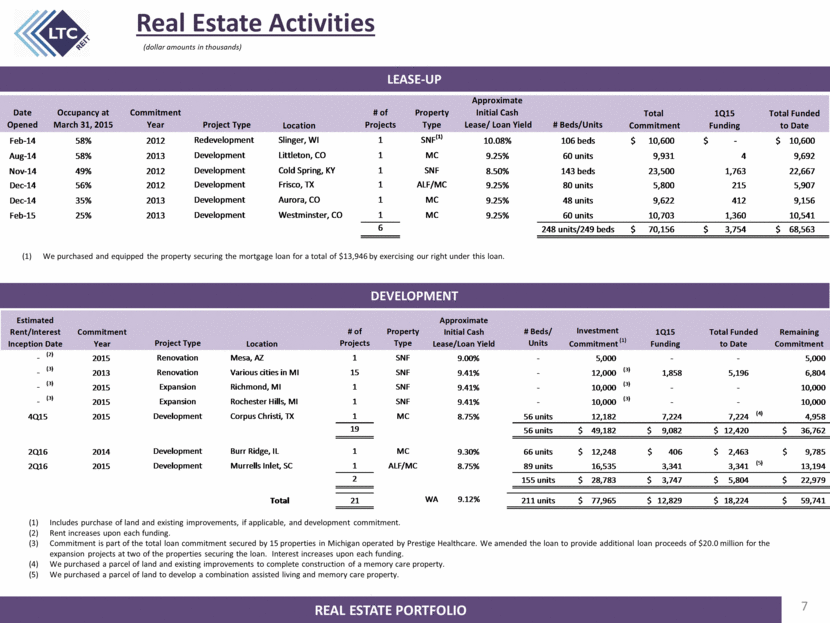
7 Real Estate Activities REAL ESTATE PORTFOLIO (dollar amounts in thousands) Includes purchase of land and existing improvements, if applicable, and development commitment. Rent increases upon each funding. Commitment is part of the total loan commitment secured by 15 properties in Michigan operated by Prestige Healthcare. We amended the loan to provide additional loan proceeds of $20.0 million for the expansion projects at two of the properties securing the loan. Interest increases upon each funding. We purchased a parcel of land and existing improvements to complete construction of a memory care property. We purchased a parcel of land to develop a combination assisted living and memory care property. DEVELOPMENT LEASE-UP We purchased and equipped the property securing the mortgage loan for a total of $13,946 by exercising our right under this loan. Project Type # of Projects Property Type # Beds/ Units - (2) 2015 Renovation Mesa, AZ 1 SNF 9.00% - 5,000 - - 5,000 - (3) 2013 Renovation Various cities in MI 15 SNF 9.41% - 12,000 (3) 1,858 5,196 6,804 - (3) 2015 Expansion Richmond, MI 1 SNF 9.41% - 10,000 (3) - - 10,000 - (3) 2015 Expansion Rochester Hills, MI 1 SNF 9.41% - 10,000 (3) - - 10,000 4Q15 2015 Development Corpus Christi, TX 1 MC 8.75% 56 units 12,182 7,224 7,224 (4) 4,958 19 56 units 49,182 $ 9,082 $ 12,420 $ 36,762 $ 2Q16 2014 Development Burr Ridge, IL 1 MC 9.30% 66 units 12,248 $ 406 $ 2,463 $ 9,785 $ 2Q16 2015 Development Murrells Inlet, SC 1 ALF/MC 8.75% 89 units 16,535 3,341 3,341 (5) 13,194 2 155 units 28,783 $ 3,747 $ 5,804 $ 22,979 $ Total 21 WA 9.12% 211 units 77,965 $ 12,829 $ 18,224 $ 59,741 $ Estimated Rent/Interest Inception Date Commitment Year Location Approximate Initial Cash Lease/Loan Yield Investment Commitment (1) 1Q15 Funding Total Funded to Date Remaining Commitment Date Opened Occupancy at March 31, 2015 Commitment Year Project Type Location # of Projects Property Type Approximate Initial Cash Lease/ Loan Yield # Beds/Units Feb-14 58% 2012 Redevelopment Slinger, WI 1 SNF (1) 10.08% 106 beds 10,600 $ - $ 10,600 $ Aug-14 58% 2013 Development Littleton, CO 1 MC 9.25% 60 units 9,931 4 9,692 Nov-14 49% 2012 Development Cold Spring, KY 1 SNF 8.50% 143 beds 23,500 1,763 22,667 Dec-14 56% 2012 Development Frisco, TX 1 ALF/MC 9.25% 80 units 5,800 215 5,907 Dec-14 35% 2013 Development Aurora, CO 1 MC 9.25% 48 units 9,622 412 9,156 Feb-15 25% 2013 Development Westminster, CO 1 MC 9.25% 60 units 10,703 1,360 10,541 6 248 units/249 beds 70,156 $ 3,754 $ 68,563 $ Total Commitment 1Q15 Funding Total Funded to Date |
|
|
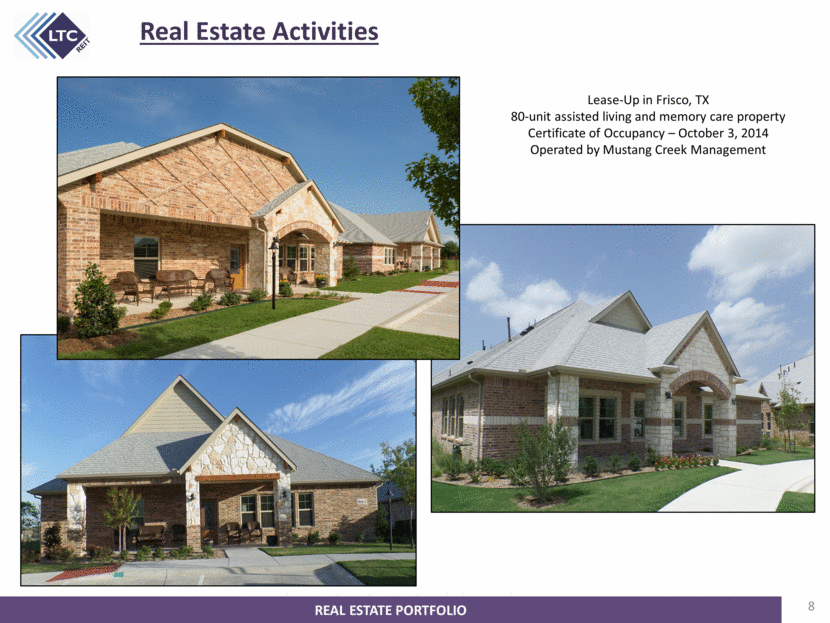
8 REAL ESTATE PORTFOLIO Real Estate Activities Lease-Up in Frisco, TX 80-unit assisted living and memory care property Certificate of Occupancy – October 3, 2014 Operated by Mustang Creek Management |
|
|
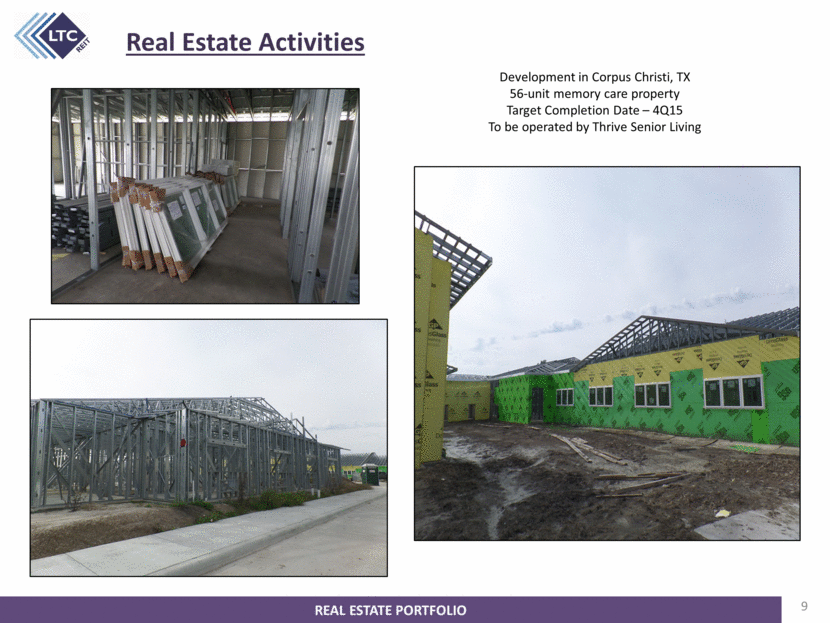
9 REAL ESTATE PORTFOLIO Real Estate Activities Development in Corpus Christi, TX 56-unit memory care property Target Completion Date – 4Q15 To be operated by Thrive Senior Living |
|
|
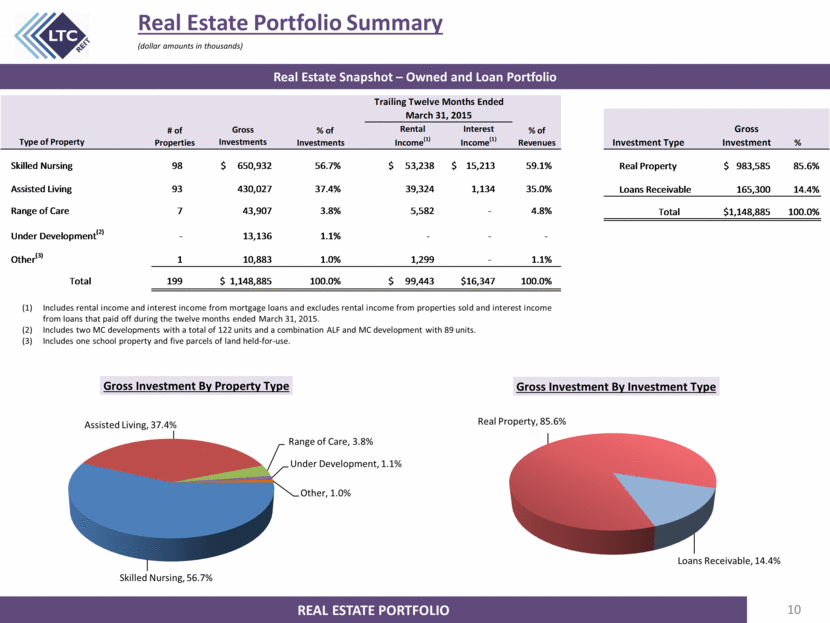
10 Real Estate Portfolio Summary REAL ESTATE PORTFOLIO (dollar amounts in thousands) Real Estate Snapshot – Owned and Loan Portfolio Includes rental income and interest income from mortgage loans and excludes rental income from properties sold and interest income from loans that paid off during the twelve months ended March 31, 2015. Includes two MC developments with a total of 122 units and a combination ALF and MC development with 89 units. Includes one school property and five parcels of land held-for-use. Real Property, 85.6% Loans Receivable, 14.4% Gross Investment By Investment Type Skilled Nursing, 56.7% Assisted Living, 37.4% Range of Care, 3.8% Under Development, 1.1% Other, 1.0% Gross Investment By Property Type Type of Property Gross Investments Investment Type Skilled Nursing 98 $ 650,932 56.7% $ 53,238 $ 15,213 59.1% Real Property 983,585 $ 85.6% Assisted Living 93 430,027 37.4% 39,324 1,134 35.0% Loans Receivable 165,300 14.4% Range of Care 7 43,907 3.8% 5,582 - 4.8% Total 1,148,885 $ 100.0% Under Development (2) - 13,136 1.1% - - - Other (3) 1 10,883 1.0% 1,299 - 1.1% Total 199 $ 1,148,885 100.0% $ 99,443 $16,347 100.0% # of Properties Gross Investment % of Revenues % Trailing Twelve Months Ended March 31, 2015 % of Investments Rental Income (1) Interest Income (1) (1) (2) (3) |
|
|
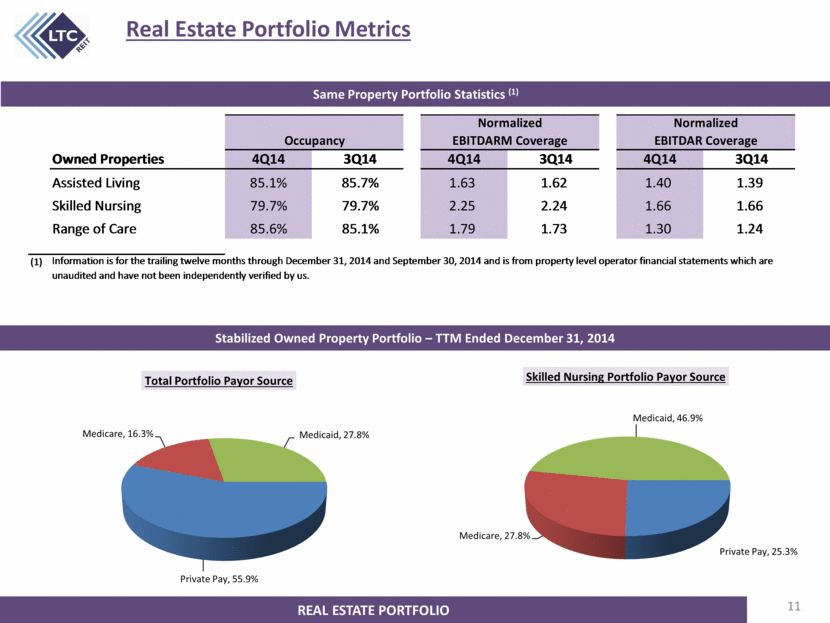
11 Same Property Portfolio Statistics (1) Real Estate Portfolio Metrics REAL ESTATE PORTFOLIO Stabilized Owned Property Portfolio – TTM Ended December 31, 2014 Owned Properties 4Q14 3Q14 4Q14 3Q14 4Q14 3Q14 Assisted Living 85.1% 85.7% 1.63 1.62 1.40 1.39 Skilled Nursing 79.7% 79.7% 2.25 2.24 1.66 1.66 Range of Care 85.6% 85.1% 1.79 1.73 1.30 1.24 (1) Information is for the trailing twelve months through December 31, 2014 and September 30, 2014 and is from property level operator financial statements which are unaudited and have not been independently verified by us. Occupancy Normalized EBITDAR Coverage Normalized EBITDARM Coverage Private Pay, 55.9% Medicare, 16.3% Medicaid, 27.8% Total Portfolio Payor Source Private Pay, 25.3% Medicare, 27.8% Medicaid, 46.9% Skilled Nursing Portfolio Payor Source |
|
|
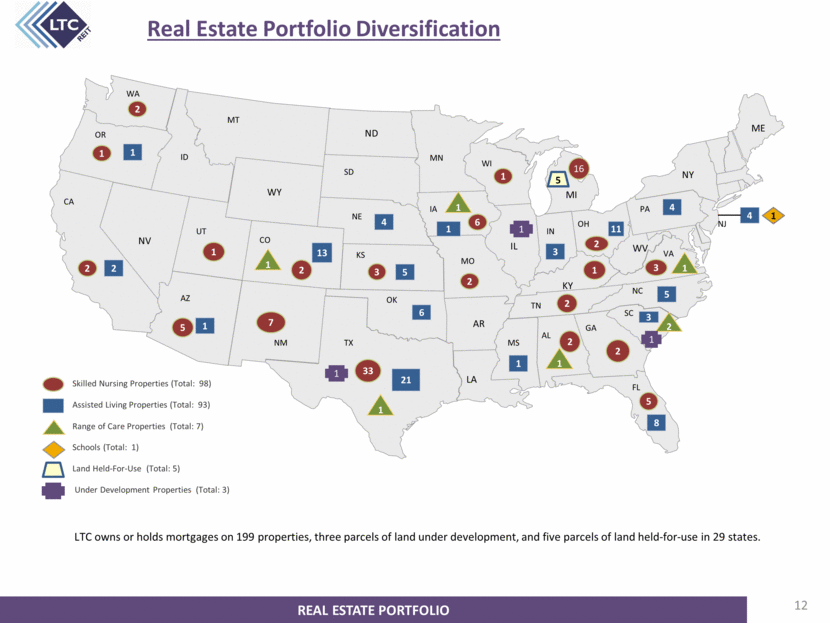
LTC owns or holds mortgages on 199 properties, three parcels of land under development, and five parcels of land held-for-use in 29 states. 12 Real Estate Portfolio Diversification REAL ESTATE PORTFOLIO WA ME 1 5 NV WY MI IL AR LA KY WV ND NY 33 2 1 2 3 5 1 2 3 2 2 2 2 1 6 21 3 5 4 8 11 4 5 2 6 1 4 2 13 7 3 1 1 1 1 1 1 2 1 1 OR CA AZ NM TX UT ID MT SD NE KS OK MS MN WI FL AL GA SC TN MO IA IN OH PA NJ NC VA CO Skilled Nursing Properties (Total: 98) Assisted Living Properties (Total: 93) Schools (Total: 1) Range of Care Properties (Total: 7) Under Development Properties (Total: 3) 16 Land Held-For-Use (Total: 5) 5 1 1 1 1 |
|
|
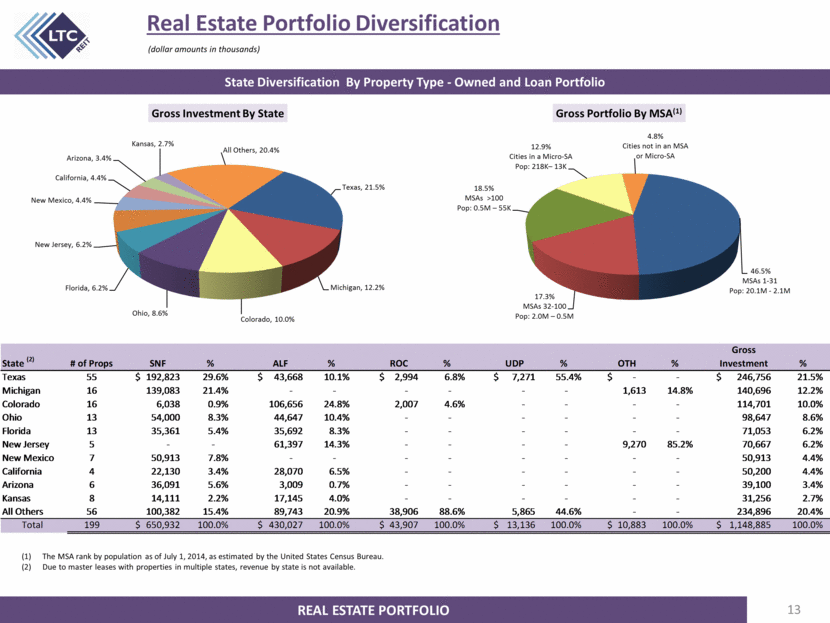
13 Real Estate Portfolio Diversification REAL ESTATE PORTFOLIO State Diversification By Property Type - Owned and Loan Portfolio The MSA rank by population as of July 1, 2014, as estimated by the United States Census Bureau. Due to master leases with properties in multiple states, revenue by state is not available. (dollar amounts in thousands) 46.5% MSAs 1 - 31 Pop : 20.1M - 2.1M 17.3% MSAs 32 - 100 Pop: 2.0M – 0.5M 18.5% MSAs >100 Pop: 0.5M – 55K 12.9% Cities in a Micro - SA Pop: 218K – 13K 4.8% Cities not in an MSA or Micro - SA Gross Portfolio By MSA (1) Texas, 21.5% Michigan, 12.2% Colorado, 10.0% Ohio, 8.6% Florida, 6.2% New Jersey, 6.2% New Mexico, 4.4% California, 4.4% Arizona, 3.4% Kansas, 2.7% All Others, 20.4% Gross Investment By State State (2) # of Props SNF % ALF % ROC % UDP % OTH % Gross Investment % Texas 55 192,823 $ 29.6% 43,668 $ 10.1% 2,994 $ 6.8% 7,271 $ 55.4% - $ - 246,756 $ 21.5% Michigan 16 139,083 21.4% - - - - - - 1,613 14.8% 140,696 12.2% Colorado 16 6,038 0.9% 106,656 24.8% 2,007 4.6% - - - - 114,701 10.0% Ohio 13 54,000 8.3% 44,647 10.4% - - - - - - 98,647 8.6% Florida 13 35,361 5.4% 35,692 8.3% - - - - - - 71,053 6.2% New Jersey 5 - - 61,397 14.3% - - - - 9,270 85.2% 70,667 6.2% New Mexico 7 50,913 7.8% - - - - - - - - 50,913 4.4% California 4 22,130 3.4% 28,070 6.5% - - - - - - 50,200 4.4% Arizona 6 36,091 5.6% 3,009 0.7% - - - - - - 39,100 3.4% Kansas 8 14,111 2.2% 17,145 4.0% - - - - - - 31,256 2.7% All Others 56 100,382 15.4% 89,743 20.9% 38,906 88.6% 5,865 44.6% - - 234,896 20.4% Total 199 650,932 $ 100.0% 430,027 $ 100.0% 43,907 $ 100.0% 13,136 $ 100.0% 10,883 $ 100.0% 1,148,885 $ 100.0% |
|
|
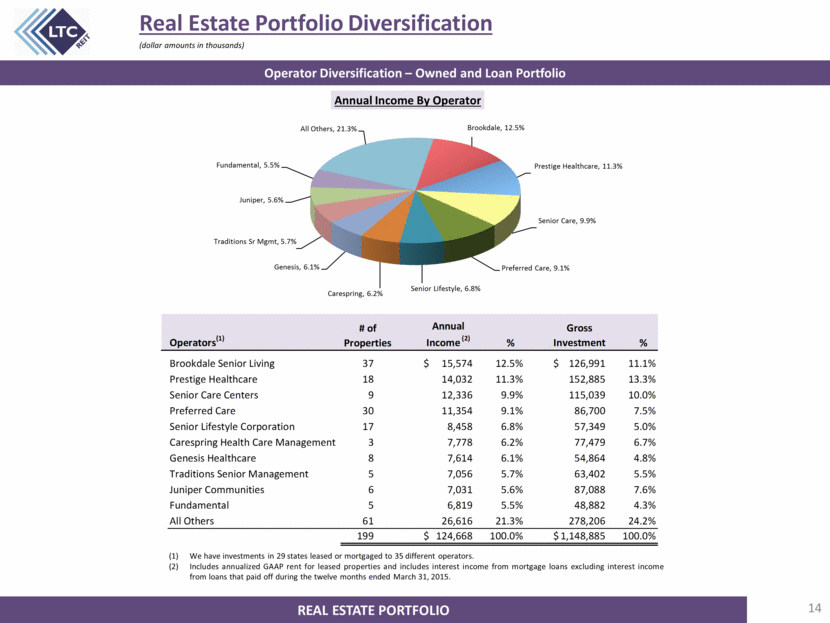
14 Real Estate Portfolio Diversification REAL ESTATE PORTFOLIO Operator Diversification – Owned and Loan Portfolio We have investments in 29 states leased or mortgaged to 35 different operators. Includes annualized GAAP rent for leased properties and includes interest income from mortgage loans excluding interest income from loans that paid off during the twelve months ended March 31, 2015. (dollar amounts in thousands) Brookdale, 12.5% Prestige Healthcare, 11.3% Senior Care, 9.9% Preferred Care, 9.1% Senior Lifestyle, 6.8% Carespring, 6.2% Genesis, 6.1% Traditions Sr Mgmt, 5.7% Juniper, 5.6% Fundamental, 5.5% All Others, 21.3% Annual Income By Operator Operators (1) Annual Income (2) % Gross Investment % Brookdale Senior Living 37 15,574 $ 12.5% 126,991 $ 11.1% Prestige Healthcare 18 14,032 11.3% 152,885 13.3% Senior Care Centers 9 12,336 9.9% 115,039 10.0% Preferred Care 30 11,354 9.1% 86,700 7.5% Senior Lifestyle Corporation 17 8,458 6.8% 57,349 5.0% Carespring Health Care Management 3 7,778 6.2% 77,479 6.7% Genesis Healthcare 8 7,614 6.1% 54,864 4.8% Traditions Senior Management 5 7,056 5.7% 63,402 5.5% Juniper Communities 6 7,031 5.6% 87,088 7.6% Fundamental 5 6,819 5.5% 48,882 4.3% All Others 61 26,616 21.3% 278,206 24.2% 199 124,668 $ 100.0% 1,148,885 $ 100.0% # of Properties |
|
|
15 Top Ten Operators REAL ESTATE PORTFOLIO Brookdale Senior Living (NYSE: BKD) operates nearly 1,150 independent living, assisted living, and memory care communities and continuing care retirement centers, with the ability to serve over 11 1,000 residents. As of March 31, 2015, the LTC portfolio consisted of 37 assisted living properties in nine states with a gross investment balance of $127.0 million. Prestige Healthcare (privately held) provides skilled nursing, assisted living, and independent living services, and other rehabilitative and healthcare services at 35 facilities in seven states. As o f March 31, 2015, the LTC portfolio consisted of 1 6 skilled nursing properties and five parcels of land held - for - use in Michigan and two range of care properties in South Carolina with a gross investment balance of $152.9 million. Senior Care Centers (privately held) provides skilled nursing care, memory care, assisted living, and independent living services in 94 facilities exclusively in Texas. As of March 31, 2015, the LTC portfolio consisted of nine skilled nursing properties in Texas with a gross investment balance of $115.0 million. Preferred Care (privately held) operates 108 facilities comprised of skilled nursing, assisted living, and independent living facilities, as well as five specialty care facilities, in 12 states. As of March 31, 2015, t he LTC portfolio consisted of 28 skilled nursing and two range of care properties in six states with a g ross investment balance of $86.7 million. Senior Lifestyle Corporation (privately held) manages 167 communities consisting of independent living, assisted living, memory care, skilled nursing and rehabilitative, affordable senior apartments, and short term stays i n 27 states. As of March 31, 2015, the LTC portfolio consisted of 17 assisted living properties in seven states, with a gross investment balance of $57.3 million. Carespring Health Care Management (privately held) provides skilled nursing, assisted living, and independent living services, and other rehabilitative and healthcare services at 11 facilities in two states. As of March 31, 2015, the LTC portfolio consisted of three skilled nursing properties in two states with a gross investment balance of $77.5 million. Genesis Healthcare ( NYSE: GEN ) provides skilled nursing and assisted/senior living communities at more than 500 facilities in 34 states They also supply rehabilitation and repiratory therapy to more than 1,600 locations in 46 states and the District of Columbia. As of March 31, 2015, the LTC portfolio consisted of seven skilled nursing properties and one range of care property in three states, with a gross investment balance of $54.9 million. Traditions Senior Management (privately held) operates 28 facilities consisting of independent living, assisted living, and skilled nursing facilities in eight states. As of March 31, 2015, the LTC portfolio consisted of four skilled nursing properties and one range of care property in three states with a gross investment balance of $63. 4 million. They also operate two skilled nursing properties under a sub - lease with Preferred Care, Inc. which is not included in the Traditions Senior Management annual income. Juniper Communities (privately held) operates 20 facilities comprised of skilled nursing, assisted living, memory care, and independent living facilities in four states. As of March 31, 2015, the LTC portfolio consisted of six assisted living and memory care properties in three states with a gross investment balance of $87.1 million. Fundamental (privately held) provides skilled nursing facilities, assisted living facilities, long term acute care hospitals, hospices, outpatient clinics, behavioral health services and other healthcare services at 76 locations in 9 states. As of March 31, 2015, the LTC portfolio consisted of five skilled nursing properties in three states, with a gross investment balance of $48.9 million. |
|
|
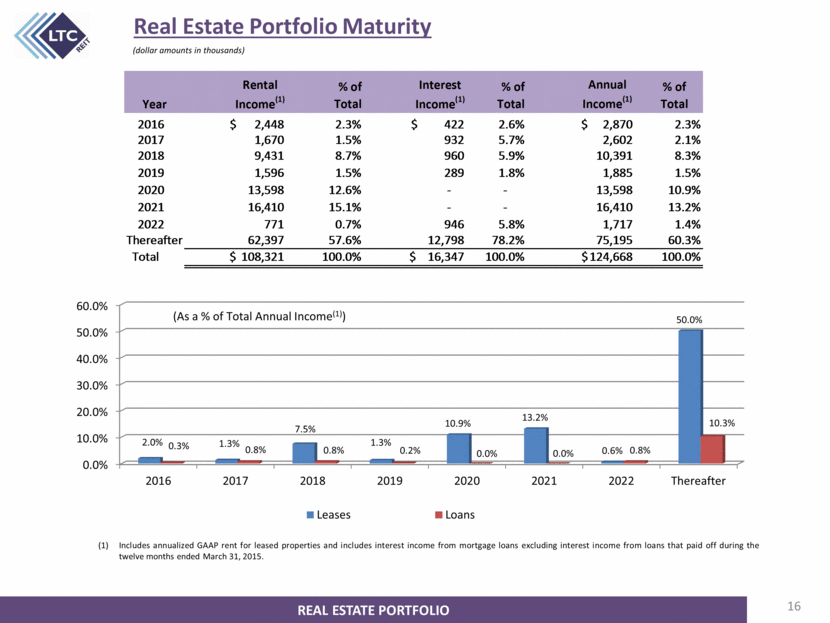
16 Real Estate Portfolio Maturity (dollar amounts in thousands) (1) Includes annualized GAAP rent for leased properties and includes interest income from mortgage loans excluding interest income from loans that paid off during the twelve months ended March 31, 2015. (As a % of Total Annual Income(1)) REAL ESTATE PORTFOLIO 0.0% 10.0% 20.0% 30.0% 40.0% 50.0% 60.0% 2016 2017 2018 2019 2020 2021 2022 Thereafter 2.0% 1.3% 7.5% 1.3% 10.9% 13.2% 0.6% 50.0% 0.3% 0.8% 0.8% 0.2% 0.0% 0.0% 0.8% 10.3% Leases Loans % of Total % of Total Annual Income (1) % of Total 2016 2,448 $ 2.3% 422 $ 2.6% 2,870 $ 2.3% 2017 1,670 1.5% 932 5.7% 2,602 2.1% 2018 9,431 8.7% 960 5.9% 10,391 8.3% 2019 1,596 1.5% 289 1.8% 1,885 1.5% 2020 13,598 12.6% - - 13,598 10.9% 2021 16,410 15.1% - - 16,410 13.2% 2022 771 0.7% 946 5.8% 1,717 1.4% 62,397 57.6% 12,798 78.2% 75,195 60.3% Total 108,321 $ 100.0% 16,347 $ 100.0% 124,668 $ 100.0% Year Rental Income (1) Interest Income (1) Thereafter |
|
|
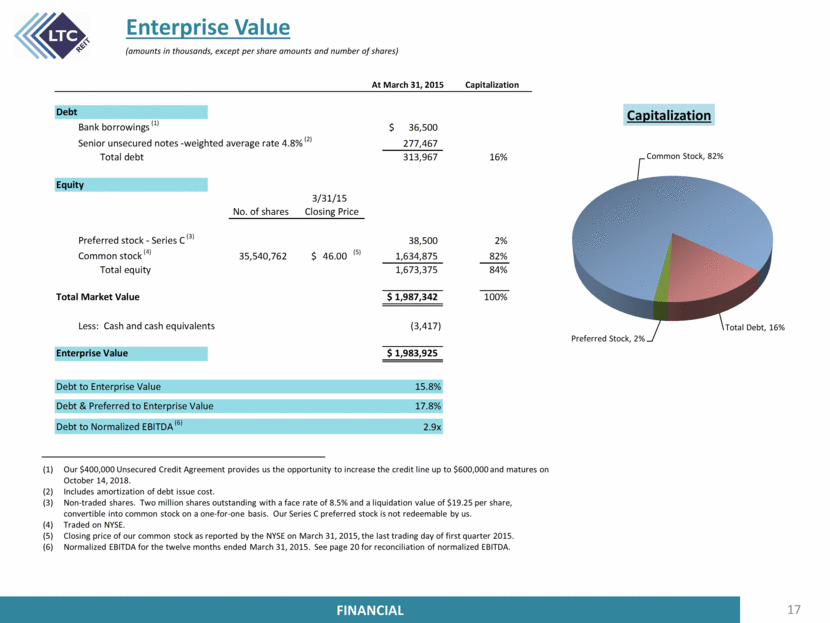
17 Enterprise Value FINANCIAL Our $400,000 Unsecured Credit Agreement provides us the opportunity to increase the credit line up to $600,000 and matures on October 14, 2018. Includes amortization of debt issue cost. Non-traded shares. Two million shares outstanding with a face rate of 8.5% and a liquidation value of $19.25 per share, convertible into common stock on a one-for-one basis. Our Series C preferred stock is not redeemable by us. Traded on NYSE. Closing price of our common stock as reported by the NYSE on March 31, 2015, the last trading day of first quarter 2015. Normalized EBITDA for the twelve months ended March 31, 2015. See page 20 for reconciliation of normalized EBITDA. (amounts in thousands, except per share amounts and number of shares) Common Stock, 82% Total Debt, 16% Preferred Stock, 2% Capitalization Capitalization Bank borrowings (1) 36,500 $ Senior unsecured notes -weighted average rate 4.8% (2) 277,467 Total debt 313,967 16% 3/31/15 No. of shares Preferred stock - Series C (3) 38,500 2% Common stock (4) 35,540,762 46.00 $ (5) 1,634,875 82% Total equity 1,673,375 84% 1,987,342 $ 100% Less: Cash and cash equivalents (3,417) 1,983,925 $ Debt to Enterprise Value 15.8% Debt & Preferred to Enterprise Value 17.8% Debt to Normalized EBITDA (6) 2.9x Enterprise Value At March 31, 2015 Debt Equity Closing Price Total Market Value |
|
|
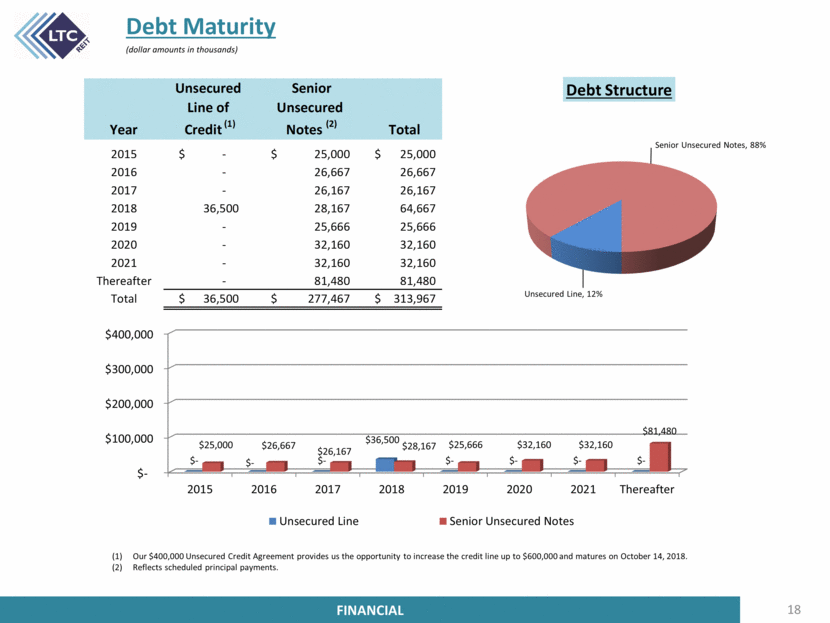
18 Debt Maturity FINANCIAL (dollar amounts in thousands) Our $400,000 Unsecured Credit Agreement provides us the opportunity to increase the credit line up to $600,000 and matures on October 14, 2018. Reflects scheduled principal payments. Unsecured Line, 12% Senior Unsecured Notes, 88% Debt Structure $- $100,000 $200,000 $300,000 $400,000 2015 2016 2017 2018 2019 2020 2021 Thereafter $ - $ - $ - $36,500 $ - $ - $ - $ - $25,000 $26,667 $26,167 $28,167 $25,666 $32,160 $32,160 $81,480 Unsecured Line Senior Unsecured Notes $ - $ 25,000 $ 25,000 - 26,667 26,667 - 26,167 26,167 36,500 28,167 64,667 - 25,666 25,666 - 32,160 32,160 - 32,160 32,160 - 81,480 81,480 $ 36,500 $ 277,467 $ 313,967 Year Unsecured Line of Credit (1) Senior Unsecured Notes (2) Total 2020 2017 2016 2015 2019 2018 Total Thereafter 2021 (1) (2) |
|
|
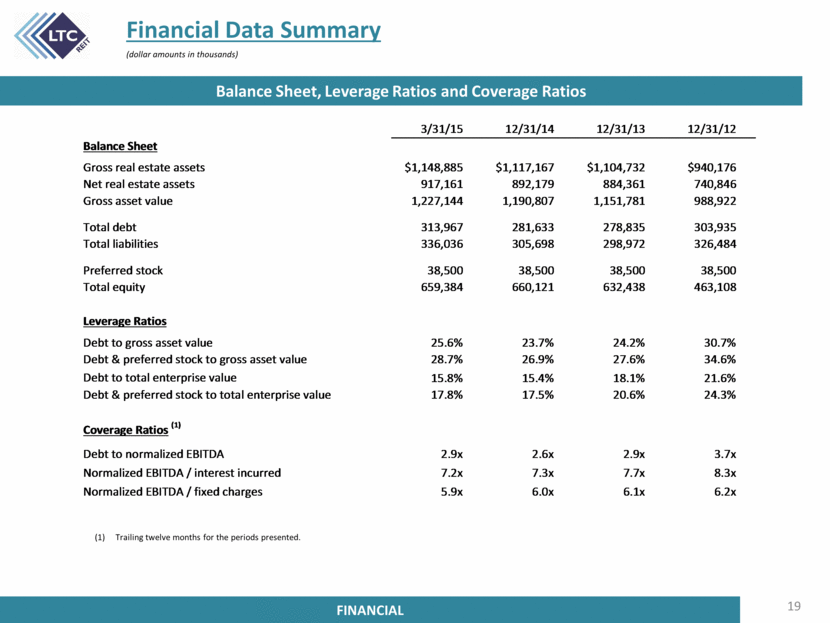
19 Financial Data Summary FINANCIAL (dollar amounts in thousands) Balance Sheet, Leverage Ratios and Coverage Ratios Trailing twelve months for the periods presented. 3/31/15 12/31/14 12/31/13 12/31/12 Balance Sheet Gross real estate assets $1,148,885 $1,117,167 $1,104,732 $940,176 Net real estate assets 917,161 892,179 884,361 740,846 Gross asset value 1,227,144 1,190,807 1,151,781 988,922 Total debt 313,967 281,633 278,835 303,935 Total liabilities 336,036 305,698 298,972 326,484 Preferred stock 38,500 38,500 38,500 38,500 Total equity 659,384 660,121 632,438 463,108 Leverage Ratios Debt to gross asset value 25.6% 23.7% 24.2% 30.7% Debt & preferred stock to gross asset value 28.7% 26.9% 27.6% 34.6% Debt to total enterprise value 15.8% 15.4% 18.1% 21.6% Debt & preferred stock to total enterprise value 17.8% 17.5% 20.6% 24.3% Coverage Ratios (1) Debt to normalized EBITDA 2.9x 2.6x 2.9x 3.7x Normalized EBITDA / interest incurred 7.2x 7.3x 7.7x 8.3x Normalized EBITDA / fixed charges 5.9x 6.0x 6.1x 6.2x (1) |
|
|
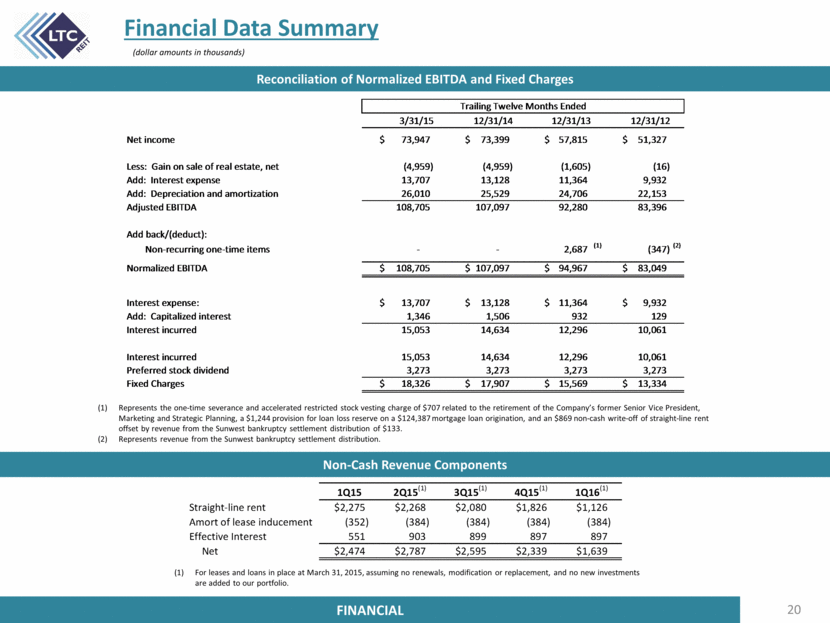
20 Financial Data Summary FINANCIAL FINANCIAL (dollar amounts in thousands) Non-Cash Revenue Components For leases and loans in place at March 31, 2015, assuming no renewals, modification or replacement, and no new investments are added to our portfolio. Reconciliation of Normalized EBITDA and Fixed Charges Represents the one-time severance and accelerated restricted stock vesting charge of $707 related to the retirement of the Company’s former Senior Vice President, Marketing and Strategic Planning, a $1,244 provision for loan loss reserve on a $124,387 mortgage loan origination, and an $869 non-cash write-off of straight-line rent offset by revenue from the Sunwest bankruptcy settlement distribution of $133. Represents revenue from the Sunwest bankruptcy settlement distribution. Net income 73,947 $ 73,399 $ 57,815 $ 51,327 $ Less: Gain on sale of real estate, net (4,959) (4,959) (1,605) (16) Add: Interest expense 13,707 13,128 11,364 9,932 Add: Depreciation and amortization 26,010 25,529 24,706 22,153 Adjusted EBITDA 108,705 107,097 92,280 83,396 Add back/(deduct): Non-recurring one-time items - - 2,687 (1) (347) (2) Normalized EBITDA 108,705 $ 107,097 $ 94,967 $ 83,049 $ Interest expense: 13,707 $ 13,128 $ 11,364 $ 9,932 $ Add: Capitalized interest 1,346 1,506 932 129 Interest incurred 15,053 14,634 12,296 10,061 Interest incurred 15,053 14,634 12,296 10,061 Preferred stock dividend 3,273 3,273 3,273 3,273 Fixed Charges 18,326 $ 17,907 $ 15,569 $ 13,334 $ Trailing Twelve Months Ended 3/31/15 12/31/14 12/31/13 12/31/12 2,275 $ 2,268 $ 2,080 $ 1,826 $ 1,126 $ (352) (384) (384) (384) (384) 551 903 899 897 897 2,474 $ 2,787 $ 2,595 $ 2,339 $ 1,639 $ Straight-line rent Amort of lease inducement Net Effective Interest 1Q15 2Q15 (1) 3Q15 (1) 4Q15 (1) 1Q16 (1) (1) (2) |
|
|
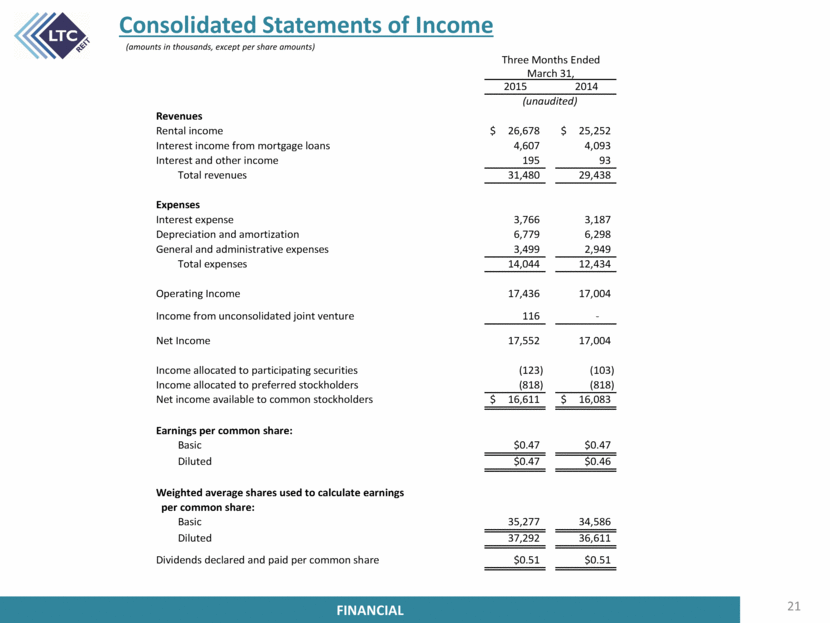
Consolidated Statements of Income 21 FINANCIAL FINANCIAL (amounts in thousands, except per share amounts) 2015 2014 Revenues Rental income 26,678 $ 25,252 $ Interest income from mortgage loans 4,607 4,093 Interest and other income 195 93 Total revenues 31,480 29,438 Expenses Interest expense 3,766 3,187 Depreciation and amortization 6,779 6,298 General and administrative expenses 3,499 2,949 Total expenses 14,044 12,434 Operating Income 17,436 17,004 Income from unconsolidated joint venture 116 - Net Income 17,552 17,004 Income allocated to participating securities (123) (103) Income allocated to preferred stockholders (818) (818) Net income available to common stockholders 16,611 $ 16,083 $ Earnings per common share: Basic $0.47 $0.47 Diluted $0.47 $0.46 Weighted average shares used to calculate earnings per common share: Basic 35,277 34,586 Diluted 37,292 36,611 Dividends declared and paid per common share $0.51 $0.51 (unaudited) Three Months Ended March 31, |
|
|
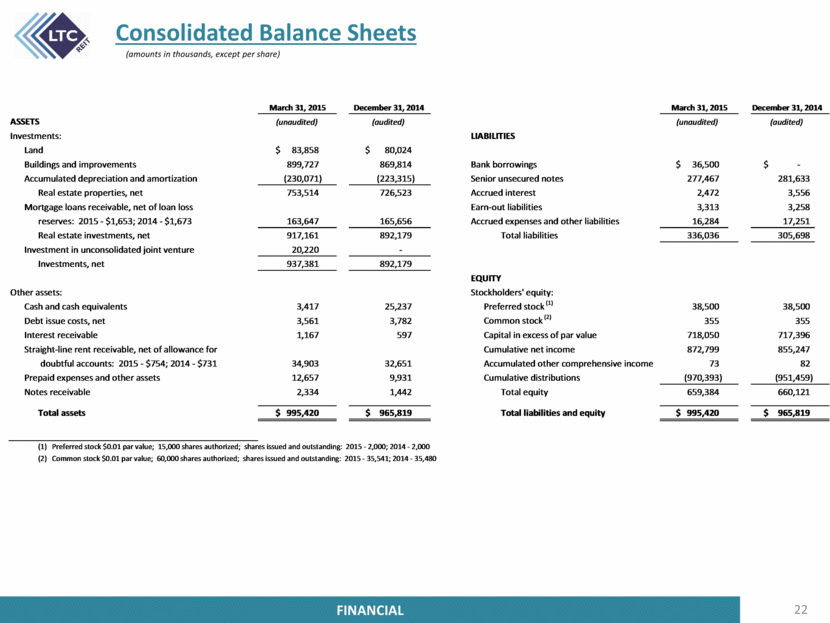
Consolidated Balance Sheets 22 FINANCIAL FINANCIAL (amounts in thousands, except per share) December 31, 2014 December 31, 2014 ASSETS (unaudited) (audited) (unaudited) (audited) Investments: LIABILITIES Land 83,858 $ 80,024 $ Buildings and improvements 899,727 869,814 Bank borrowings 36,500 $ - $ Accumulated depreciation and amortization (230,071) (223,315) Senior unsecured notes 277,467 281,633 Real estate properties, net 753,514 726,523 Accrued interest 2,472 3,556 Mortgage loans receivable, net of loan loss Earn-out liabilities 3,313 3,258 reserves: 2015 - $1,653; 2014 - $1,673 163,647 165,656 Accrued expenses and other liabilities 16,284 17,251 Real estate investments, net 917,161 892,179 Total liabilities 336,036 305,698 Investment in unconsolidated joint venture 20,220 - Investments, net 937,381 892,179 EQUITY Other assets: Stockholders' equity: Cash and cash equivalents 3,417 25,237 Preferred stock (1) 38,500 38,500 Debt issue costs, net 3,561 3,782 Common stock (2) 355 355 Interest receivable 1,167 597 Capital in excess of par value 718,050 717,396 Straight-line rent receivable, net of allowance for Cumulative net income 872,799 855,247 doubtful accounts: 2015 - $754; 2014 - $731 34,903 32,651 Accumulated other comprehensive income 73 82 Prepaid expenses and other assets 12,657 9,931 Cumulative distributions (970,393) (951,459) Notes receivable 2,334 1,442 Total equity 659,384 660,121 Total assets 995,420 $ 965,819 $ Total liabilities and equity 995,420 $ 965,819 $ (1) Preferred stock $0.01 par value; 15,000 shares authorized; shares issued and outstanding: 2015 - 2,000; 2014 - 2,000 (2) Common stock $0.01 par value; 60,000 shares authorized; shares issued and outstanding: 2015 - 35,541; 2014 - 35,480 March 31, 2015 March 31, 2015 |
|
|
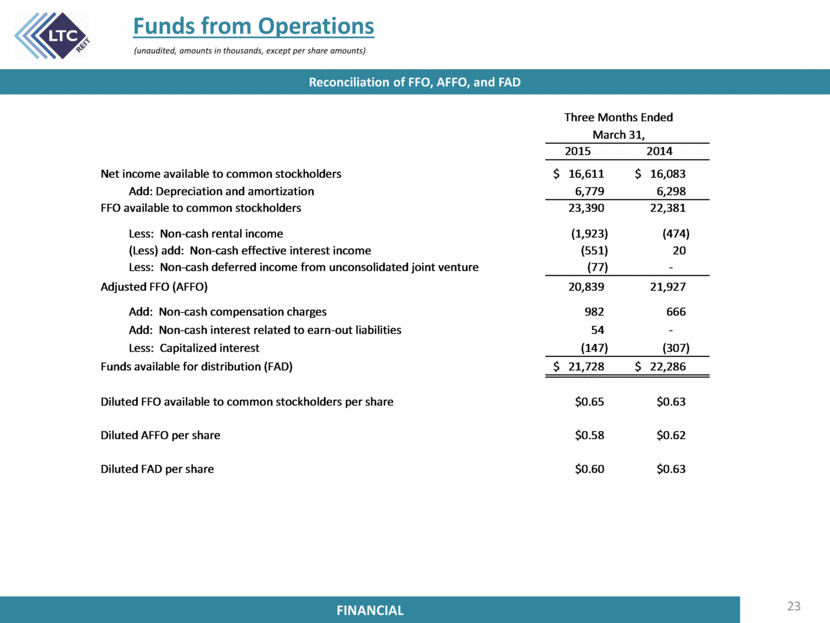
Funds from Operations 23 FINANCIAL FINANCIAL (unaudited, amounts in thousands, except per share amounts) Reconciliation of FFO, AFFO, and FAD 2015 2014 Net income available to common stockholders 16,611 $ 16,083 $ Add: Depreciation and amortization 6,779 6,298 FFO available to common stockholders 23,390 22,381 Less: Non-cash rental income (1,923) (474) (Less) add: Non-cash effective interest income (551) 20 Less: Non-cash deferred income from unconsolidated joint venture (77) - Adjusted FFO (AFFO) 20,839 21,927 Add: Non-cash compensation charges 982 666 Add: Non-cash interest related to earn-out liabilities 54 - Less: Capitalized interest (147) (307) Funds available for distribution (FAD) 21,728 $ 22,286 $ $0.65 $0.63 $0.58 $0.62 $0.60 $0.63 Diluted FFO available to common stockholders per share Diluted AFFO per share Diluted FAD per share March 31, Three Months Ended |
|
|
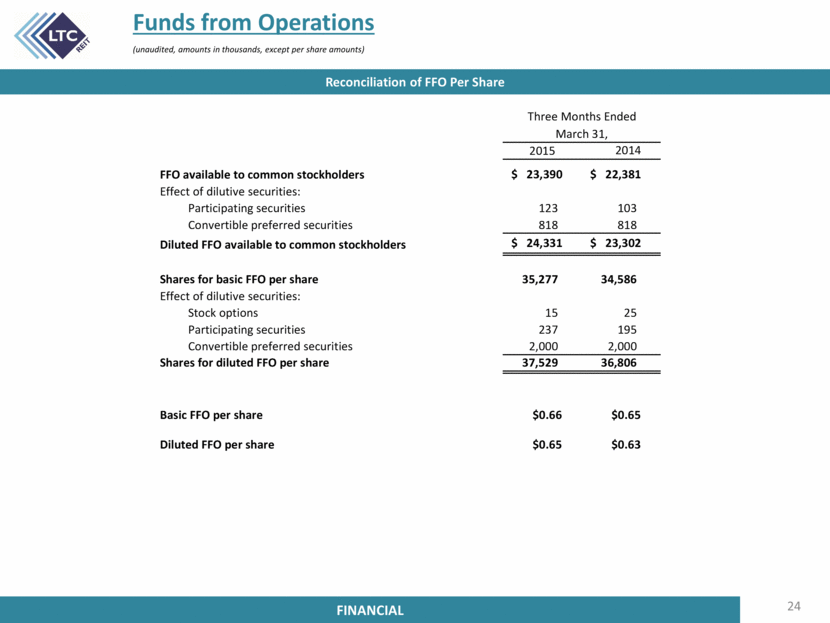
Funds from Operations 24 FINANCIAL FINANCIAL Reconciliation of FFO Per Share (unaudited, amounts in thousands, except per share amounts) 2014 FFO available to common stockholders $ 23,390 $ 22,381 Effect of dilutive securities: Participating securities 123 103 Convertible preferred securities 818 818 Diluted FFO available to common stockholders $ 24,331 $ 23,302 35,277 34,586 Effect of dilutive securities: Stock options 15 25 Participating securities 237 195 Convertible preferred securities 2,000 2,000 Shares for diluted FFO per share 37,529 36,806 $0.66 $0.65 $0.65 $0.63 Diluted FFO per share Shares for basic FFO per share Basic FFO per share 2015 Three Months Ended March 31, |
|
|
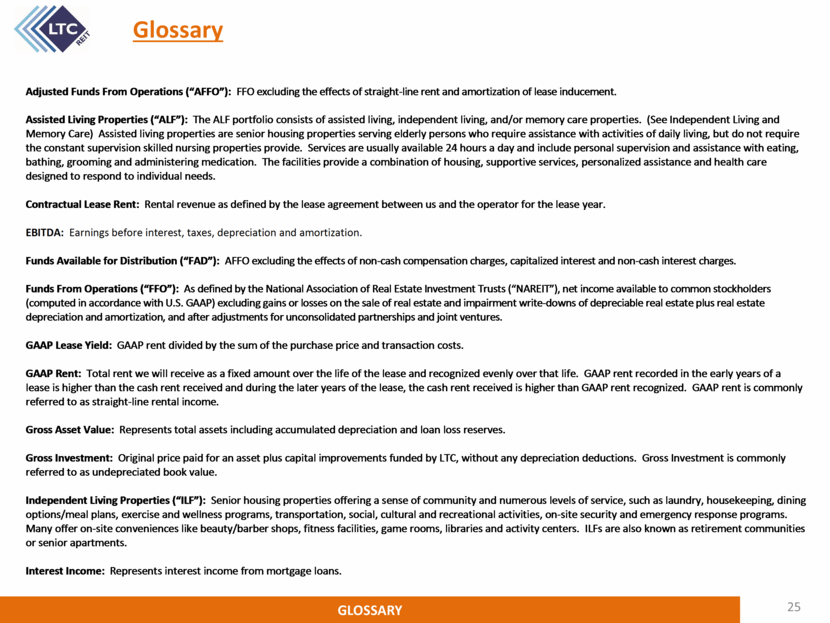
25 GLOSSARY Glossary Adjusted Funds From Operations (“AFFO”): FFO excluding the effects of straight - line rent and amortization of lease inducement. Assisted Living Properties (“ALF”) : The ALF portfolio consists of assisted living, independent living, and/or memory care properties. (See Independent Living and Memory Care) Assisted living properties are senior housing properties serving elderly persons who require assistance with activities of daily living, but do not require the constant supervision skilled nursing properties provide. Services are usually available 24 hours a day and include personal supervision and assistance with eating, bathing, grooming and administering medication. The facilities provide a combination of housing, supportive services, personalized assistance and health care designed to respond to individual needs. Contractual Lease Rent: Rental revenue as defined by the lease agreement between us and the operator for the lease year. EBITDA: Earnings before interest, taxes, depreciation and amortization. Funds Available for Distribution (“FAD”): A FFO excluding the effects of n on - cash compensation charges, capitalized interest and non - cash interest charges. Funds From Operations (“FFO”): A s defined by the National Association of Real Estate Investment Trusts (“NAREIT”), net income available to common stockholder s (computed in accordance with U.S. GAAP) excluding gains or losses on the sale of real estate and impairment write - downs of depreciable real estate plus real estate depreciation and amortization, and after adjustments for unconsolidated partnerships and joint ventures. GAAP Lease Yield: GAAP rent divided by the sum of the purchase p rice and transaction costs. GAAP Rent: Total rent we will receive as a fixed amount over the life of the lease and recognize d evenly over that life. GAAP rent recorded in the early years of a lease is higher than the cash rent received and during the later years of the lease, the cash rent received is higher than GAAP rent recognized. GAAP rent is commonly referred to as straight - line rental income. Gross Asset Value: Represents total assets including accumulated depreciation and loan lo ss reserves. Gross Investment: Original price paid for an asset plus capital improvements funded by LTC, without any depreciation deductions. Gross Investment is commonly referred to as undepreciated book value. Independent Living Properties (“ILF”) : Senior housing properties offering a sense of community and numerous levels of service, such as laundry, housekeeping, dining options/meal plans, exercise and wellness programs, transportation, social, cultural and recreational activities, on - site security and emergency response programs. Many offer on - site conveniences like beauty/barber shops, fitness facilities, game rooms, libraries and activity centers. ILFs are also known as retirement communities or senior apartments. Interest Income: Represents interest income from mortgage loans. |
|
|
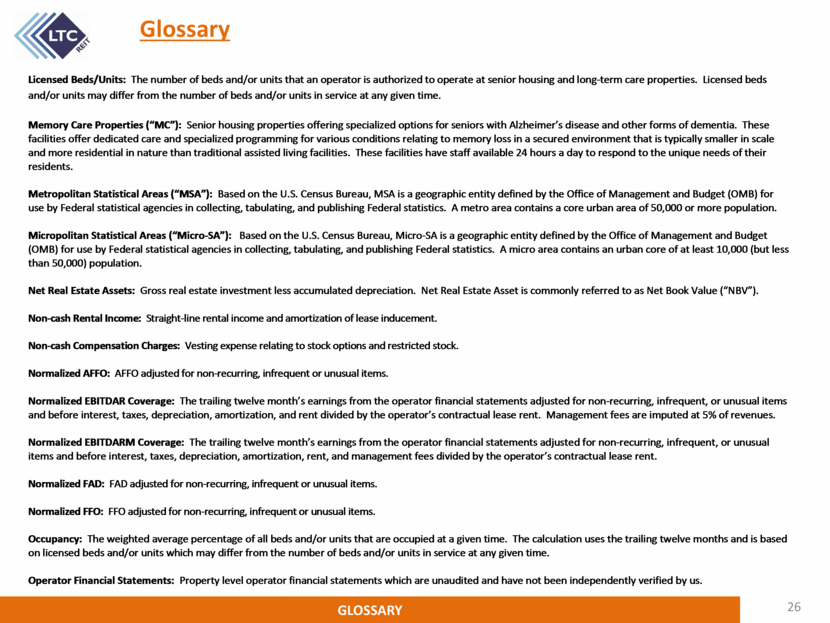
26 GLOSSARY Glossary Licensed Beds/Units: The number of beds and/or units that an operator is authorized to operate at senior housing and long - term care properties. Licensed beds and/or u nits may differ from the number of beds and/or units in service at any given time. Memory Care Properties (“MC”) : Senior housing properties offering specialized options for seniors with Alzheimer’s disease and other forms of dementia. The se facilities offer dedicated care and specialized programming for various conditions relating to memory loss in a secured environment that is typically smaller in scale and more residential in nature than traditional assisted living facilities. These facilities have staff available 24 hours a day to respond to the unique needs of their residents. Metropolitan Statistical Areas ( “ MSA ” ) : Based on the U.S. Census Bureau, MSA is a geographic entity defined by the Office of Management and Budget (OMB) for use by Federal statistical agencies in collecting, tabulating, and publishing Federal statistics. A metro area contains a core urban area of 50,00 0 or more population. Micropolitan Statistical Areas ( “ Micro - SA ” ) : Based on the U.S. Census Bureau, Micro - SA is a geographic entity defined by the Office of Management and Budget (OMB) for use by Federal statistical agencies in collecting, tabulating, and publishing Federal statistics. A micro area contains an urban core of at least 10,000 (but less than 50,000) population. Net Real Estate Assets: G ross real estate investment less accumulated depreciation. Net Real Estate Asset is commonly referred to as Net Book Value (“NBV”). Non - cash Rental Income: Straight - line rental income and amortization of lease inducement. Non - cash Compensation Charges: Vesting expense relating to stock option s and restricted stock. Normalized AFFO: A FFO adjusted for non - recurring, infrequent or unusual items. Normalized EBITDAR Coverage: The trailing twelve month’s earnings from the operator financial statements adjusted for non - recurring, infrequent, or unusual items and before interest, taxes, depreciation, amortization, and rent divided by the operator’s contractual lease rent. Management fees are imputed at 5% of revenues. Normalized EBITDARM Coverage: The trailing twelve month’s earnings from the operator financial statements adjusted for non - recurring, infrequent, or unusual items and before interest, taxes, depreciation, amortization, rent, and management fees divided by the operator’s contractual lease ren t. Normalized FAD: FAD adjusted for non - recurring, infrequent or unusual items. Normalized FFO: FFO adjusted for non - recurring, infrequent or unusual items. Occupancy: The weighted average percentage of all beds and/or units that are occupied at a given time. The calculation uses the trailing twelve months and is based on licensed beds and/or units which may differ from the number of beds and/or units in service at any given time. Operator Financial Statements: Property level operator financial statements which are unaudited and have not been independently verified by us. |
|
|
27 GLOSSARY Glossary Glossary Payor Source : LTC revenue by operator underlying payor source for the quarter presented. LTC is not a Medicaid or a Medicare recipient. Statistics represent LTC's rental revenues times operators' underlying payor source revenue percentage. Underlying payor source revenue percentage is calculated from property level operator financial statements which are unaudited and have not been independently verified by us. Private Pay: Private pay includes private insurance, HMO, VA, and other payors. Purchase Price: Represents the fair value price of an asset that is exchanged in an orderly transaction between market participants at the measurement date. An orderly transaction is a transaction that assumes exposure to the market for a period prior to the measurement date to allow for marketing activities that are usual and customary for transactions involving such assets; it is not a forced transaction (for example, a forced liquidation or distress sale). Range of Care ( “ ROC ” ): Range of care properties consist of properties providing skilled nursing and any combination of assisted living, independent living and/or memory care services. Rental Income: Represents GAAP rent net of amortized lease inducement cost. Same Property Portfolio (“SPP”) : Same property statistics allow for the comparative evaluation of performance across a consistent population of LTC’s leased property portfolio. Our SPP is comprised of stabilized properties owned and operated throughout the duration of the quarter - over - quarter comparison periods presented (excluding assets sold and assets held - for - sale). Accordingly, a leased property must be owned and stabilized for a minimum of 1 5 months to be included in our SSP. School : An institution for educating students which include s a charter school. Charter schools provide an alternative to the traditional public school and are generally autonomous entities authorized by the state or locality to conduct operations independent from the surrounding public school district. Laws vary by state, but generally charters are granted by state boards of education either directly or in conjunction with local school districts or public universities. Operators are granted charters to establish and operate schools based on the goals and objectives set forth in the charter. Upon receipt of a char ter, schools receive a n annuity from the state for each student enrolled. Skilled Nursing Properties (“SNF”) : Senior housing properties providing restorative, rehabilitative and nursing care for people not requiring the more extensive and sophisticated treatment available at acute care hospitals. Many SNF s provide ancillary services that include occupational, speech, physical, respiratory and IV therapies, as well as sub - acute care services which are paid either by the patient, the patient’s family, private health insurance, or through the federal Medicare or state Medicaid programs. Stabilized: Properties are generally considered stabilized upon the earlier of achieving certain occupancy thresholds ( e.g. 80% for SNF s and 90% for ALF s ) and, as applicable, 12 months from the date of acquisition or, in the event of a de novo development, redevelopment, major renovations or addition, 24 months from the date the property is first placed in or returned to service. Under Development Properties (“UDP”): Development project s to construct senior housing properties. |