Attached files
| file | filename |
|---|---|
| EX-32.1 - EXHIBIT 32.1 - LIFELOCK, INC. | lock-ex321x20150331x10q.htm |
| EX-31.1 - EXHIBIT 31.1 - LIFELOCK, INC. | lock-ex311x20150331x10q.htm |
| EX-31.2 - EXHIBIT 31.2 - LIFELOCK, INC. | lock-ex312x20150331x10q.htm |
| EXCEL - IDEA: XBRL DOCUMENT - LIFELOCK, INC. | Financial_Report.xls |
| EX-10.1 - EXHIBIT 10.1 - LIFELOCK, INC. | lock-ex101xcerdaemployment.htm |
UNITED STATES
SECURITIES AND EXCHANGE COMMISSION
WASHINGTON, D.C. 20549
FORM 10-Q |
ý | QUARTERLY REPORT PURSUANT TO SECTION 13 OR 15(d) OF THE SECURITIES EXCHANGE ACT OF 1934 |
For the quarterly period ended March 31, 2015
Commission file number: 001-35671
LifeLock, Inc. (Exact name of registrant as specified in its charter) |
Delaware | 56-2508977 | |
(State or other jurisdiction of incorporation or organization) | (I.R.S. Employer Identification No.) | |
60 East Rio Salado Parkway, Suite 400 Tempe, Arizona 85281 (Address of principal executive offices and zip code) (480) 682-5100 (Registrant’s telephone number, including area code) |
Securities registered pursuant to Section 12(b) of the Act: |
Indicate by check mark whether the registrant: (1) has filed all reports required to be filed by Section 13 or 15(d) of the Securities Exchange Act of 1934 during the preceding 12 months (or for such shorter period that the registrant was required to file such reports), and (2) has been subject to such filing requirements for the past 90 days. Yes ý No ¨
Indicate by check mark whether the registrant has submitted electronically and posted on its corporate Web site, if any, every Interactive Data File required to be submitted and posted pursuant to Rule 405 of Regulation S-T (§232.405 of this chapter) during the preceding 12 months (or for such shorter period that the registrant was required to submit and post such files). Yes ý No ¨
Indicate by check mark whether the registrant is a large accelerated filer, an accelerated filer, a non-accelerated filer, or a smaller reporting company. See the definitions of “large accelerated filer,” “accelerated filer” and “smaller reporting company” in Rule 12b-2 of the Exchange Act. (Check one):
Large accelerated filer | ý | Accelerated filer | ¨ | |
Non-accelerated filer (Do not check if a smaller reporting company) | ¨ | Smaller reporting company | ¨ | |
Indicate by check mark whether the registrant is a shell company (as defined in Rule 12b-2 of the Exchange Act). Yes ¨ No ý
As of April 24, 2015, there were outstanding 94,370,253 shares of the registrant’s common stock, $0.001 par value.
LIFELOCK, INC.
QUARTERLY REPORT ON FORM 10-Q
FOR THE QUARTER ENDED MARCH 31, 2015
TABLE OF CONTENTS
Page | |
i
PART I - FINANCIAL INFORMATION
Item 1. | Financial Statements (Unaudited) |
LIFELOCK, INC.
CONDENSED CONSOLIDATED BALANCE SHEETS
(in thousands, except share data)
(unaudited)
March 31, 2015 | December 31, 2014 | ||||||
Assets | |||||||
Current assets: | |||||||
Cash and cash equivalents | $ | 159,885 | $ | 146,569 | |||
Marketable securities | 133,467 | 127,305 | |||||
Trade and other receivables, net | 9,502 | 10,220 | |||||
Deferred tax assets, net | 27,269 | 21,243 | |||||
Prepaid expenses and other current assets | 12,159 | 7,841 | |||||
Total current assets | 342,282 | 313,178 | |||||
Property and equipment, net | 23,359 | 24,204 | |||||
Goodwill | 159,342 | 159,342 | |||||
Intangible assets, net | 36,231 | 38,315 | |||||
Deferred tax assets, net – non-current | 22,494 | 22,494 | |||||
Other non-current assets | 5,827 | 5,783 | |||||
Total assets | $ | 589,535 | $ | 563,316 | |||
Liabilities and stockholders’ equity | |||||||
Current liabilities: | |||||||
Accounts payable | $ | 13,556 | $ | 11,543 | |||
Accrued expenses and other liabilities | 70,764 | 67,025 | |||||
Deferred revenue | 167,983 | 145,206 | |||||
Total current liabilities | 252,303 | 223,774 | |||||
Other non-current liabilities | 6,712 | 6,706 | |||||
Total liabilities | 259,015 | 230,480 | |||||
Commitments and contingencies | |||||||
Stockholders’ equity: | |||||||
Common stock, $0.001 par value, 300,000,000 authorized at March 31, 2015 and December 31, 2014; 94,188,225 and 93,944,742 shares issued and 94,143,451 and 93,899,968 outstanding at March 31, 2015 and December 31, 2014, respectively | 94 | 94 | |||||
Preferred stock, $0.001 par value, 10,000,000 shares authorized and no shares issued and outstanding at March 31, 2015 and December 31, 2014 | — | — | |||||
Additional paid-in capital | 502,712 | 495,912 | |||||
Accumulated other comprehensive loss | (75 | ) | (116 | ) | |||
Accumulated deficit | (172,211 | ) | (163,054 | ) | |||
Total stockholders’ equity | 330,520 | 332,836 | |||||
Total liabilities and stockholders’ equity | $ | 589,535 | $ | 563,316 | |||
See accompanying notes to condensed consolidated financial statements.
1
LIFELOCK, INC.
CONDENSED CONSOLIDATED STATEMENTS OF OPERATIONS
(in thousands, except per share amounts)
(unaudited)
For the Three Months Ended March 31, | |||||||
2015 | 2014 | ||||||
Revenue: | |||||||
Consumer revenue | $ | 128,201 | $ | 100,995 | |||
Enterprise revenue | 6,207 | 6,591 | |||||
Total revenue | 134,408 | 107,586 | |||||
Cost of services | 34,556 | 29,957 | |||||
Gross profit | 99,852 | 77,629 | |||||
Costs and expenses: | |||||||
Sales and marketing | 77,079 | 56,539 | |||||
Technology and development | 16,866 | 12,729 | |||||
General and administrative | 18,955 | 13,335 | |||||
Amortization of acquired intangible assets | 2,084 | 2,231 | |||||
Total costs and expenses | 114,984 | 84,834 | |||||
Loss from operations | (15,132 | ) | (7,205 | ) | |||
Other income (expense): | |||||||
Interest expense | (89 | ) | (87 | ) | |||
Interest income | 117 | 60 | |||||
Other | (80 | ) | (11 | ) | |||
Total other expense | (52 | ) | (38 | ) | |||
Loss before provision for income taxes | (15,184 | ) | (7,243 | ) | |||
Income tax benefit | (6,026 | ) | (2,948 | ) | |||
Net loss | (9,158 | ) | (4,295 | ) | |||
Net loss per share | |||||||
Basic and diluted | $ | (0.10 | ) | $ | (0.05 | ) | |
Weighted-average common shares outstanding used in computing net loss per share: | |||||||
Basic and diluted | 94,033 | 91,903 | |||||
See accompanying notes to condensed consolidated financial statements.
2
LIFELOCK, INC.
CONDENSED CONSOLIDATED STATEMENTS OF COMPREHENSIVE LOSS
(in thousands)
(unaudited)
For the Three Months Ended March 31, | |||||||
2015 | 2014 | ||||||
Net loss | $ | (9,158 | ) | $ | (4,295 | ) | |
Other comprehensive income, net of tax | |||||||
Unrealized gain on marketable securities | 42 | 8 | |||||
Comprehensive loss | $ | (9,116 | ) | $ | (4,287 | ) | |
See accompanying notes to condensed consolidated financial statements.
3
LIFELOCK, INC.
CONDENSED CONSOLIDATED STATEMENTS OF CASH FLOWS
(in thousands)
(unaudited)
For the Three Months Ended March 31, | |||||||
2015 | 2014 | ||||||
Operating activities | |||||||
Net loss | $ | (9,158 | ) | $ | (4,295 | ) | |
Adjustments to reconcile net loss to net cash provided by operating activities: | |||||||
Depreciation and amortization | 4,295 | 3,861 | |||||
Share-based compensation | 5,370 | 4,001 | |||||
Provision for doubtful accounts | 52 | 272 | |||||
Amortization of premiums on marketable securities | 670 | 366 | |||||
Deferred income tax benefit | (6,026 | ) | (2,951 | ) | |||
Other | 82 | 7 | |||||
Change in operating assets and liabilities: | |||||||
Trade and other receivables | (295 | ) | (305 | ) | |||
Prepaid expenses and other current assets | (4,319 | ) | (2,816 | ) | |||
Other non-current assets | (44 | ) | 251 | ||||
Accounts payable | 2,563 | 2,776 | |||||
Accrued expenses and other liabilities | 4,556 | (835 | ) | ||||
Deferred revenue | 22,777 | 17,213 | |||||
Other non-current liabilities | 7 | 771 | |||||
Net cash provided by operating activities | 20,530 | 18,316 | |||||
Investing activities | |||||||
Acquisition of property and equipment | (2,816 | ) | (3,927 | ) | |||
Purchases of marketable securities | (39,379 | ) | (5,797 | ) | |||
Sale and maturities of marketable securities | 33,438 | 6,921 | |||||
Net cash used in investing activities | (8,757 | ) | (2,803 | ) | |||
Financing activities | |||||||
Proceeds from stock-based compensation plans | 1,773 | 4,432 | |||||
Payments for employee tax withholdings related to restricted stock units and awards | (230 | ) | (154 | ) | |||
Net cash provided by financing activities | 1,543 | 4,278 | |||||
Net increase in cash and cash equivalents | 13,316 | 19,791 | |||||
Cash and cash equivalents at beginning of period | 146,569 | 123,911 | |||||
Cash and cash equivalents at end of period | $ | 159,885 | $ | 143,702 | |||
See accompanying notes to condensed consolidated financial statements.
4
LIFELOCK, INC.
NOTES TO CONDENSED CONSOLIDATED FINANCIAL STATEMENTS
(in thousands, except share and per share data)
(unaudited)
1. Corporation Information
We provide proactive identity theft protection services to our consumer subscribers, whom we refer to as our members, on an annual or monthly subscription basis. We also provide consumer risk management services to our enterprise customers.
We were incorporated in Delaware on April 12, 2005, and are headquartered in Tempe, Arizona. On March 14, 2012, we acquired ID Analytics, LLC (formerly, ID Analytics, Inc.) and its wholly owned subsidiary SageStream, LLC (formerly IDA Inc.), each of which is incorporated in Delaware. On December 11, 2013, we acquired Lemon, LLC (formerly, Lemon, Inc.), or Lemon, which is incorporated in Delaware.
Basis of Presentation
The accompanying unaudited condensed consolidated financial statements have been prepared in conformity with accounting principles generally accepted in the United States of America (U.S. GAAP), and applicable Securities and Exchange Commission, or SEC, rules and regulations regarding interim financial reporting. Certain information and note disclosures normally included in financial statements prepared in accordance with U.S. GAAP have been condensed or omitted pursuant to such rules and regulations. Therefore, these condensed consolidated financial statements should be read in conjunction with the consolidated financial statements and notes included in our Annual Report on Form 10-K for the fiscal year ended December 31, 2014, or 2014 Form 10-K.
The condensed consolidated balance sheet as of December 31, 2014 included herein was derived from the audited financial statements as of that date, but does not include all disclosures including notes required by U.S. GAAP.
The accompanying unaudited condensed consolidated financial statements reflect all normal recurring adjustments necessary to present fairly the financial position, results of operations, and cash flows for the interim periods, but are not necessarily indicative of the anticipated results of operations for the entire year ending December 31, 2015 or any future period.
Basis of Consolidation
The condensed consolidated financial statements include our accounts and those of our wholly and indirectly owned subsidiaries. We eliminate all intercompany balances and transactions, including intercompany profits, in consolidation.
Use of Estimates
The preparation of condensed consolidated financial statements in conformity with U.S. GAAP requires us to make certain estimates and assumptions that affect the amounts reported in the consolidated financial statements and accompanying notes. We continually evaluate our estimates, including those related to the allocation of the purchase price associated with acquisitions; the carrying value of long-lived assets; the amortization period of long-lived assets; the carrying value, capitalization, and amortization of software and website development costs; the carrying value of goodwill and other intangible assets; the amortization period of intangible assets; the provision for income taxes and related deferred tax accounts, and realizablity of deferred tax assets, certain accrued expenses; incurred but not reported medical claims, contingencies, litigation, and related legal accruals; and the value attributed to employee stock options and other stock-based awards. We base our estimates on historical experience, current business factors, and various other assumptions that we believe are necessary to consider to form a basis for making judgments. Actual results could be materially different from these estimates.
2. Summary of Significant Accounting Policies
There have been no material changes to our significant accounting policies as compared to the significant accounting policies described in our 2014 Form 10-K.
Recently Issued Accounting Standards
In May 2014, the Financial Accounting Standards Board, or FASB, issued Accounting Standards Update (ASU) 2014-09, Revenue from Contracts with Customers, which provides guidance for revenue recognition. The standard’s core principle is that a company will recognize revenue when it transfers promised goods or services to customers in an amount that reflects the consideration to which the company expects to be entitled in exchange for those goods or services. In doing so, companies will need to use more judgment and make more estimates than under today’s guidance. These may include identifying performance obligations in the contract, estimating the amount of variable consideration to include in the transaction price, and allocating the transaction price to each separate performance obligation. This guidance will be effective for us in the first quarter of our fiscal year ending December 31, 2017. Early adoption is not permitted. On April 1, 2015, the
5
FASB proposed a one-year deferral of the effective date. Under the proposal, the standard would be effective for public entities for annual reporting periods beginning after December 15, 2017 and interim periods therein. The guidance permits the use of either the retrospective or cumulative effect transition method. We are currently in the process of evaluating the impact of the adoption of this ASU on our consolidated financial statements and have not yet selected a transition method.
In February 2015, the FASB issued ASU 2015-02, Consolidation, which changes the analysis that a reporting entity must perform to determine whether it should consolidate certain legal entities. The amendments in the standard affect limited partnerships and similar legal entities, evaluating fees paid to a decision maker or a service provider as a variable interest, the effect of fee arrangements on the primary beneficiary determination, the effect of related parties on the primary beneficiary determination, and certain investment funds. This guidance is effective for public business entities for fiscal years, and for interim fiscal periods within those fiscal years, beginning after December 15, 2015. Early adoption is permitted. We do not expect the adoption of this ASU to have a significant impact on our consolidated financial statements.
In April 2015, the FASB issued ASU 2015-03, Simplifying the Presentation of Debt Issuance Costs, which changes the presentation of debt issuance costs in financial statements. The guidance requires an entity to present such costs in the balance sheet as a direct deduction from the related debt liability rather than as an asset, with amortization of the costs continuing to be reported as interest expense. This guidance is effective for annual reporting periods beginning after December 15, 2016, and will be applied retrospectively to each prior period presented. Early adoption is permitted. We do not expect the adoption of this ASU to have a material impact on our consolidated financial statements as this ASU would only apply in the event we incurred debt.
3. Marketable Securities
The following is a summary of marketable securities designated as available-for-sale as of March 31, 2015 and December 31, 2014:
Amortized Cost | Gross Unrealized Gains | Gross Unrealized Losses | Estimated Fair Value | ||||||||||||
March 31, 2015 | |||||||||||||||
Corporate bonds | $ | 112,187 | $ | 6 | $ | (87 | ) | $ | 112,106 | ||||||
Municipal bonds | 15,073 | 1 | (5 | ) | 15,069 | ||||||||||
Commercial paper | 5,794 | — | — | 5,794 | |||||||||||
Certificates of deposit | 498 | — | — | 498 | |||||||||||
Total marketable securities | $ | 133,552 | $ | 7 | $ | (92 | ) | $ | 133,467 | ||||||
December 31, 2014 | |||||||||||||||
Corporate bonds | $ | 99,592 | $ | 1 | $ | (119 | ) | $ | 99,474 | ||||||
Municipal bonds | 18,146 | 1 | (10 | ) | 18,137 | ||||||||||
Commercial paper | 9,196 | — | — | 9,196 | |||||||||||
Certificates of deposit | 498 | — | — | 498 | |||||||||||
Total marketable securities | $ | 127,432 | $ | 2 | $ | (129 | ) | $ | 127,305 | ||||||
We classify all marketable securities as current regardless of contractual maturity dates because we consider such investments to represent cash available for current operations.
As of March 31, 2015 and December 31, 2014, we did not consider any of our marketable securities to be other-than-temporarily impaired. When evaluating our investments for other-than-temporary impairment, we review factors such as the length of time and extent to which fair value has been below its cost basis, the financial condition of the issuer, our ability and intent to hold the security, and whether it is more likely than not that we will be required to sell the investment before recovery of its cost basis.
6
The following is a summary of amortized cost and estimated fair value of marketable securities as of March 31, 2015 and December 31, 2014, by maturity:
Amortized Cost | Gross Unrealized Gains | Gross Unrealized Losses | Estimated Fair Value | ||||||||||||
March 31, 2015 | |||||||||||||||
Due in one year or less | $ | 133,099 | $ | 7 | $ | (92 | ) | $ | 133,014 | ||||||
Due after one year | 453 | — | — | 453 | |||||||||||
Total marketable securities | $ | 133,552 | $ | 7 | $ | (92 | ) | $ | 133,467 | ||||||
December 31, 2014 | |||||||||||||||
Due in one year or less | $ | 127,029 | $ | 2 | $ | (129 | ) | $ | 126,902 | ||||||
Due after one year | 403 | — | — | 403 | |||||||||||
Total marketable securities | $ | 127,432 | $ | 2 | $ | (129 | ) | $ | 127,305 | ||||||
4. Stockholders’ Equity
Share-Based Compensation
We issue share-based awards to our employees in the form of stock options, restricted stock units, and restricted stock. We also have an Employee Stock Purchase Plan, or ESPP. The following table summarizes the components of share-based compensation expense included in our condensed consolidated statements of operations:
For the Three Months Ended March 31, | |||||||
2015 | 2014 | ||||||
(in thousands) | |||||||
Cost of services | $ | 372 | $ | 232 | |||
Sales and marketing | 932 | 586 | |||||
Technology and development | 1,709 | 1,555 | |||||
General and administrative | 2,357 | 1,628 | |||||
Total share-based compensation | $ | 5,370 | $ | 4,001 | |||
Unrecognized share-based compensation expenses totaled $70,310 as of March 31, 2015, which we expect to recognize over a weighted-average time period of 3.2 years.
Stock Warrants
As of March 31, 2015, we had the following warrants to purchase common stock outstanding:
Expiration Date | Shares | Exercise Price | |||
October 3, 2016 | 2,334,044 | 0.70 | |||
7
5. Fair Value Measurements
As of March 31, 2015 and December 31, 2014, the fair value of our financial assets was as follows:
Level 1 | Level 2 | Level 3 | Total | ||||||||||||
March 31, 2015 | |||||||||||||||
Assets: | |||||||||||||||
Money market funds (1) | $ | 5,775 | $ | — | $ | — | $ | 5,775 | |||||||
Corporate bonds (2) | — | 112,106 | — | 112,106 | |||||||||||
Municipal bonds (3) | — | 15,246 | — | 15,246 | |||||||||||
Commercial paper (4) | — | 51,019 | — | 51,019 | |||||||||||
Certificates of deposit (2) | — | 498 | — | 498 | |||||||||||
Total assets measured at fair value | $ | 5,775 | $ | 178,869 | $ | — | $ | 184,644 | |||||||
December 31, 2014 | |||||||||||||||
Assets: | |||||||||||||||
Money market funds (1) | $ | 11,903 | $ | — | $ | — | $ | 11,903 | |||||||
Corporate bonds (2) | — | 99,474 | — | 99,474 | |||||||||||
Municipal bonds (2) | — | 18,137 | — | 18,137 | |||||||||||
Commercial paper (5) | — | 54,399 | — | 54,399 | |||||||||||
Certificates of deposit (2) | — | 498 | — | 498 | |||||||||||
Total assets measured at fair value | $ | 11,903 | $ | 172,508 | $ | — | $ | 184,411 | |||||||
(1) | Classified in cash and cash equivalents |
(2) | Classified in marketable securities |
(3) | Includes a municipal bond with an original maturity date of three months or less at time purchase of $176 classified in cash and cash equivalents. |
(4) | Includes commercial paper with maturities of three months or less at time of purchase of $45,225 classified in cash and cash equivalents and commercial paper with maturities of greater than three months of $5,794 classified in marketable securities. |
(5) | Includes commercial paper with maturities of three months or less at time of purchase of $45,203 classified in cash and cash equivalents and commercial paper with maturities of greater than three months of $9,196 classified in marketable securities. |
6. Net Loss Per Share
We compute basic net loss per share by dividing net loss by the weighted-average number of common shares outstanding for the period. We compute diluted net loss per share giving effect to all potential dilutive common stock, including awards granted under our equity compensation plans and warrants to acquire common stock.
The following table sets forth the computation of basic and diluted net loss:
For the Three Months Ended March 31, | |||||||
2015 | 2014 | ||||||
Net loss | $ | (9,158 | ) | $ | (4,295 | ) | |
Denominator (basic and diluted): | |||||||
Weighted average common shares outstanding | 94,033,035 | 91,903,036 | |||||
Net loss per share: | |||||||
Basic and diluted | $ | (0.10 | ) | $ | (0.05 | ) | |
8
For the three-month periods ended March 31, 2015 and 2014, potentially dilutive securities were not included in the calculation of diluted net loss per share, as their impact would be anti-dilutive. The following weighted-average number of outstanding employee stock options, restricted stock units and restricted stock awards, warrants to purchase common stock, and shares purchased under our ESPP were excluded from the computation of diluted net loss per share:
For the Three Months Ended March 31, | |||||
2015 | 2014 | ||||
Stock options outstanding | 2,898,461 | 5,131,673 | |||
Restricted stock units and restricted stock awards | 145,676 | 217,010 | |||
Common equivalent shares from stock warrants | 2,219,671 | 2,378,641 | |||
Shares purchased under ESPP | — | 25,105 | |||
5,263,808 | 7,752,429 | ||||
7. Income Taxes
Income taxes for the interim periods presented have been included in the accompanying condensed consolidated financial statements on the basis of an estimated annual effective tax rate. Based on an estimated annual effective tax rate and discrete items, the estimated tax benefit from operations for the three-month periods ended March 31, 2015 and 2014 was $6,026 and $2,948, respectively. The determination of the interim period income tax provision utilizes the effective tax rate method, which requires us to estimate certain annualized components of the calculation of the income tax provision, including the annual effective tax rate by entity and jurisdiction.
8. Segment Reporting
We operate our business and our Chief Operating Decision Maker, or CODM, reviews and assesses our operating performance using two reportable segments: our consumer segment and our enterprise segment. In our consumer segment, we offer proactive identity theft protection services to consumers on an annual or monthly subscription basis. In our enterprise segment, we offer consumer risk management services to our enterprise customers.
Financial information about our segments for the three-month periods ended March 31, 2015 and as of March 31, 2015 was as follows:
Consumer | Enterprise | Eliminations | Total | ||||||||||||
Revenue | |||||||||||||||
External customers | $ | 128,201 | $ | 6,207 | $ | — | $ | 134,408 | |||||||
Intersegment revenue | — | 2,056 | (2,056 | ) | — | ||||||||||
Loss from operations | (10,755 | ) | (4,377 | ) | — | (15,132 | ) | ||||||||
Goodwill | 99,805 | 59,537 | — | 159,342 | |||||||||||
Total assets | 485,016 | 105,219 | (700 | ) | 589,535 | ||||||||||
Financial information about our segments for the three-month periods ended March 31, 2014 and as of December 31, 2014 was as follows:
Consumer | Enterprise | Eliminations | Total | ||||||||||||
Revenue | |||||||||||||||
External customers | $ | 100,995 | $ | 6,591 | $ | — | $ | 107,586 | |||||||
Intersegment revenue | — | 1,514 | (1,514 | ) | — | ||||||||||
Loss from operations | (3,268 | ) | (3,937 | ) | — | (7,205 | ) | ||||||||
Goodwill | 99,805 | 59,537 | — | 159,342 | |||||||||||
Total assets | 455,035 | 108,905 | (624 | ) | 563,316 | ||||||||||
We allocate goodwill between our segments by estimating the expected synergies to each segment.
We derive all of our revenue from sales in the United States, and substantially all of our long-lived assets are located in the United States.
9
9. Contingencies
As part of our consumer services, we offer 24x7x365 member service support. If a member’s identity has been compromised, our member service team and remediation specialists will assist the member until the issue has been resolved. This includes our $1 million service guarantee, which is backed by an identity theft insurance policy, under which we will spend up to $1 million to cover certain third-party costs and expenses incurred in connection with the remediation, such as legal and investigatory fees. This insurance also covers certain out-of-pocket expenses, such as loss of income, replacement of fraudulent withdrawals, and costs associated with child and elderly care, travel, stolen purse/wallet, and replacement of documents. While we have reimbursed members for claims under this guarantee, the amounts in aggregate for the three-month periods ended March 31, 2015 and 2014 were not material.
On March 13, 2014, we received a request from the FTC for documents and information related to our compliance with the FTC Order. Prior to our receipt of the FTC’s request, we met with FTC staff on January 17, 2014, at our request, to discuss issues regarding allegations that have been asserted in a whistleblower claim against us relating to our compliance with the FTC Order. On October 29, 2014, we completed our responses to the FTC’s March 13, 2014 request for information. On January 5, 2015, we completed our responses to the FTC’s subsequent requests for clarification regarding certain information that we previously submitted. We have engaged in ongoing discussions with the FTC Staff regarding the FTC's inquiry into our compliance with the FTC Order. On February 4, 2015, we made a $20,000 settlement offer to the FTC Staff and we remain in ongoing discussions with the FTC Staff regarding a possible settlement of this inquiry. As a result of those discussions, we have accrued $20,000 as of December 31, 2014 for a possible settlement with the FTC. The ultimate resolution of the matter could result in a loss of up to $100,000.
On January 19, 2015, plaintiffs Napoleon Ebarle and Jeanne Stamm filed a nationwide putative consumer class action against us in the United States District Court for the Northern District of California. The plaintiffs allege that we have engaged in deceptive marketing and sales practices in connection with our membership plans in violation of the Arizona Consumer Fraud Act, and are seeking declaratory judgment under the Federal Declaratory Judgment Act. The plaintiffs also seek certification of a nationwide class of consumers who are or were subscribers of our identity theft protection services since January 19, 2014, compensatory damages, and attorneys’ fees and costs. We were served with the complaint on January 22, 2015. On March 6, we filed a motion to dismiss. Plaintiffs filed an amended complaint on March 27, 2015. Our response to that amended complaint is due on May 12, 2015.
On January 29, 2015, plaintiff Etan Goldman filed a California putative consumer class action complaint against us in Santa Clara Superior Court in San Jose, California. The complaint alleges that we violated California’s Automatic Renewal Law and Unfair Competition Law by failing to provide required disclosures concerning our auto renewal terms and cancellation policies. The complaint also seeks certification of a class consisting of all persons in California who have purchased subscriptions to identity theft protection services from us since December 1, 2010, injunctive relief, compensatory damages, restitution, and attorneys’ fees and costs. On April 15, 2015, the parties participated in a mediation, and signed a Confidential Memorandum of Agreement for a Settlement Agreement. The motion for preliminary approval of the class action settlement is currently scheduled to be filed on May 22, 2015.
On February 2, 2015, plaintiff, Thomas A. Trax, filed a class action complaint against us in the United States District Court for the Southern District of California. The complaint asserted that we violated California’s Automatic Renewal Law and Unfair Competition Law by failing to provide required disclosures concerning our auto renewal terms and cancellation policies. The complaint seeks certification of a class consisting of all persons in California who have purchased products and/or services from us as part of an automatic renewal plan or continuous service offer since February 2, 2011, injunctive relief, compensatory damages, restitution, a constructive trust and/or disgorgement, and attorneys’ fees and costs. We have not yet been served with the complaint. On April 15, 2015, Mr. Trax agreed to dismiss the lawsuit without prejudice and we expect that to occur shortly.
On March 3, 2014, Dawn B. Bien, representing herself and seeking to represent a class of persons who acquired our securities from February 26, 2013 to February 19, 2014, inclusive, filed a class action complaint in United States District Court for the District of Arizona alleging violations of Sections 10(b) and 20(a) of the Exchange Act against us, Todd Davis, and Chris Power. We refer to this complaint as the Bien Complaint. On March 10, 2014, Joseph F. Scesny also filed a class action complaint in the same court against the same parties that made substantively similar allegations and requested substantially similar relief as the Bien Complaint. We refer to this complaint as the Scesny Complaint. On June 16, 2014, the court consolidated the Bien Complaint and Scesny Complaint into a single action captioned In re LifeLock, Inc. Securities Litigation. The court also appointed a lead plaintiff and lead counsel. On August 15, 2014, the lead plaintiff filed the Consolidated Amended Class Action Complaint, or the Consolidated Amended Complaint, against us, Mr. Davis, Mr. Power, and Hilary Schneider seeking to represent a class of persons who acquired our securities from February 26, 2013 to May 16, 2014, inclusive, or the Class Period. The Consolidated Amended Complaint alleged that we, along with Ms. Schneider and Messrs. Davis and Power, violated Sections 10(b) and 20(a) of the Exchange Act by making materially false or misleading statements, or failing to disclose material facts regarding certain of our business, operational, and compliance policies, including with regard to certain of our services, our data security program, and our and Mr. Davis’ compliance with the FTC Order. The
10
Consolidated Amended Complaint alleged that, as a result, certain public statements made by Ms. Schneider and Messrs. Davis and Power during the Class Period, and certain of our financial statements issued during the Class Period, were false and misleading. The Consolidated Amended Complaint sought certification as a class action, compensatory damages, and attorneys’ fees and costs. On September 15, 2014, we, along with Ms. Schneider and Messrs. Davis and Power, filed a motion to dismiss the Consolidated Amended Complaint. A hearing on our motion to dismiss was held on December 1, 2014. On December 17, 2014, the court dismissed the Consolidated Amended Complaint and gave the lead plaintiff 21 days to seek leave to amend. The lead plaintiff filed his Second Consolidated Amended Complaint, on January 16, 2015. The Second Consolidated Amended Complaint no longer names Ms. Schneider as a defendant, but otherwise makes substantively similar allegations as the Consolidated Amended Complaint. It alleges that we, along with Messrs. Davis and Power, violated Sections 10(b) and 20(a) of the Exchange Act by making materially false or misleading statements, or failing to disclose material facts regarding certain of our business, operational, and compliance policies, including with regard to certain of our services, our data security program, and our and Mr. Davis’ compliance with the FTC Order. The Second Consolidated Amended Complaint alleges that, as a result, certain public statements made by Messrs. Davis and Power during the Class Period, and certain of our financial statements issued during the Class Period, were false and misleading. The Second Consolidated Amended Complaint seeks certification as a class action, compensatory damages, and attorney’s fees and costs. We, along with Messrs. Davis and Power, filed a motion to dismiss the Second Consolidated Amended Complaint on January 30, 2015. A hearing on our motion to dismiss was held on March 16, 2015. We are waiting for the court to rule on our motion.
On March 20, 2014, Michael D. Peters filed a complaint in United States District Court for the District of Arizona against our company, Kim Jones, and Cristy Schaan. Mr. Jones is not affiliated with us. Ms. Schaan is our Chief Information Security Officer. In his complaint, Mr. Peters alleges that we violated the whistleblower protection provisions of the Sarbanes-Oxley Act and the Dodd-Frank Act by terminating Mr. Peters’ employment as a result of alleged disclosures that he made to us, and that Ms. Schaan defamed Mr. Peters. Mr. Peters seeks from us two times his back pay, two times the value of certain stock options and bonus, moving expenses, damages for emotional harm and anxiety, damages for harm to reputation, litigation costs including attorneys’ fees, and interest, and sought from Ms. Schaan actual damages, punitive damages, and interest. On April 21, 2014, we filed an answer, affirmative defenses, and counterclaims, answering Mr. Peters’ claim under the Sarbanes-Oxley Act and asserting counterclaims against Mr. Peters for fraud, negligent misrepresentation, breach of contract, and unjust enrichment, based on our allegations that we were induced to hire Mr. Peters by his false statements and misrepresentations regarding his employment history and seeking to recover actual and consequential damages, punitive damages, attorneys’ fees, and the signing bonus paid to Mr. Peters. Mr. Peters answered our counterclaims on May 7, 2014. On April 21, 2014, we also filed a motion to dismiss Mr. Peters’ claim under the Dodd-Frank Act. On April 25, 2014, Ms. Schaan filed a motion to dismiss Mr. Peters’ claim against her. On June 2, 2014, Mr. Peters filed a motion for judgment on the pleadings directed to our unjust enrichment counterclaim, one of the four counterclaims we brought against Mr. Peters. The court ruled on all of the pending motions on September 19, 2014. Ms. Schaan’s motion to dismiss the defamation claim against her was granted and she was dismissed from the case. Our motion and the motion filed by Mr. Peters and LifeLock were denied. In addition, Mr. Peters dismissed his claim against Mr. Jones pursuant to a settlement. On October 3, 2014, we filed an amended answer responding to both of the claims Mr. Peters asserted against us. On January 22, 2015, the court entered a scheduling order containing certain deadlines for the case, including the completion of all discovery by October 30, 2015, the filing of any dispositive motions by December 4, 2015, and the filing of certain pre-trial submissions by March 4, 2016. A status hearing is set in the case for August 14, 2015.
On August 1, 2014, our subsidiaries Lemon and Lemon Argentina, S.R.L. (Lemon Argentina, and together, the Lemon Entities) filed a lawsuit in Santa Clara Superior Court in San Jose, California against Wenceslao Casares, former General Manager of Lemon, Cynthia McAdam, former General Counsel of Lemon, and Federico Murrone, Martin Apesteguia and Fabian Cuesta, each a former employee and former member of the Board of Directors of Lemon Argentina (the Argentine Executives). The complaint alleges breaches of employment-related contracts and breaches of fiduciary duty involving each named individual’s work for third-party Xapo, Inc. and/or Xapo, Ltd. during their employment by the applicable Lemon Entity. Mr. Casares and Ms. McAdam have been served. The Lemon Entities are in the process of serving the Argentine Executives through the procedures set forth in the Hague Convention. Mr. Casares and Ms. Cynthia McAdam, through their counsel, have demanded that we and Lemon defend them against the claims brought by the Lemon Entities and advance them the costs of their attorneys’ fees. We and Lemon have rejected those demands. The parties, including the Argentine Executives, engaged in mediation in August 2014 in Buenos Aires, Argentina, and again in December 2014 in San Francisco, California but were unable to settle any claims. On January 30, 2015, the Lemon entities filed a second amended complaint alleging breaches of employment-related contracts, breaches of fiduciary duties and fraud, and seeking declaratory relief against Mr. Casares, Ms. McAdam and the Argentine Executives. The parties have begun discovery and Mr. Casares and Ms. McAdam are required to respond to the second amended complaint no later than May 1, 2015. Although no counterclaims have been asserted against us or the Lemon Entities to date in connection with this matter, it is possible that they will be asserted in the future.
11
We are subject to other legal proceedings and claims that have arisen in the ordinary course of business. Although there can be no assurance as to the ultimate disposition of these matters, we believe, based upon the information available at this time, that, except as disclosed above, a material adverse outcome related to the matters is neither probable nor estimable.
12
Item 7. | Management's Discussion and Analysis of Financial Condition and Results of Operations |
You should read the following discussion of our financial condition and results of operations in conjunction with the condensed consolidated financial statements and the notes thereto included elsewhere in this Quarterly Report on Form 10-Q and with our audited consolidated financial statements included in our 2014 Form 10-K. This Quarterly Report on Form 10-Q contains “forward-looking statements” that involve substantial risks and uncertainties. The statements contained in this Quarterly Report on Form 10-Q that are not purely historical are forward-looking statements within the meaning of Section 27A of the Securities Act of 1933, as amended, or the Securities Act, and Section 21E of the Exchange Act, including, but not limited to, statements regarding our expectations, beliefs, intentions, strategies, future operations, future financial position, future revenue, projected expenses, and plans and objectives of management. In some cases, you can identify forward-looking statements by terms such as “anticipate,” “believe,” “estimate,” “expect,” “intend,” “may,” “might,” “plan,” “project,” “will,” “would,” “should,” “could,” “can,” “predict,” “potential,” “continue,” “objective,” or the negative of these terms, and similar expressions intended to identify forward-looking statements. However, not all forward-looking statements contain these identifying words. These forward-looking statements reflect our current views about future events and involve known risks, uncertainties, and other factors that may cause our actual results, levels of activity, performance, or achievement to be materially different from those expressed or implied by the forward-looking statements. Factors that could cause or contribute to such differences include, but are not limited to, those identified below, and those discussed in the section titled “Risk Factors” included in this Quarterly Report on Form 10-Q and our 2014 Form 10-K. Furthermore, such forward-looking statements speak only as of the date on which they are made. Except as required by law, we undertake no obligation to update any forward-looking statements to reflect events or circumstances after the date of such statements.
Overview
We are a leading provider of proactive identity theft protection services for consumers and consumer risk management services for enterprises. We protect our members by monitoring identity-related events, such as new account openings and credit-related applications. If we detect that someone is using a member’s personally identifiable information, we offer notifications and alerts, including actionable alerts for new account openings and applications, in order to provide our members peace of mind that we are monitoring use of their identity and allow our members to confirm valid or unauthorized identity use. If a member confirms that the use of his or her identity is unauthorized, we can take actions designed to help protect the member’s identity and help determine whether there has been an identity theft. In the event that an identity theft has actually occurred, we can take actions designed to help restore the member’s identity through our remediation services. Our remediation service team works directly with government agencies, merchants, and creditors to remediate the impact of the identity theft event utilizing our remediation expertise on behalf of our members. We protect our enterprise customers by delivering on-demand identity risk, identity-authentication, and credit information about consumers. Our enterprise customers utilize this information in real-time to make decisions about opening or modifying accounts and providing products, services, or credit to consumers to reduce financial losses from identity fraud.
The foundation of our identity theft protection services is the LifeLock ecosystem. This ecosystem combines large data repositories of personally identifiable information and consumer transactions, proprietary predictive analytics, and a highly scalable technology platform. Our members and enterprise customers enhance our ecosystem by continually contributing to the identity and transaction data in our repositories. We apply predictive analytics to the data in our repositories to provide our members and enterprise customers actionable intelligence that helps protect against identity theft and identity fraud. As a result of our combination of scale, reach, and technology, as well as our comprehensive transaction and new account alerting, remediation services, and $1 million service guarantee backed by an identity theft insurance policy, we believe that we have the most proactive and comprehensive identity theft protection services available, as well as the most recognized brand in the identity theft protection services industry.
We derive the substantial majority of our revenue from member subscription fees. We also derive revenue from transaction fees from our enterprise customers.
At the end of July 2014, we launched our LifeLock Standard, LifeLock Advantage, and LifeLock Ultimate Plus services. We will also continue to offer our LifeLock Junior services and, on a limited basis and for a limited time in connection with certain of our partnerships, our basic LifeLock, LifeLock Command Center, and LifeLock Ultimate services. We will continue to provide services to our existing members currently enrolled in our basic LifeLock, LifeLock Command Center, and LifeLock Ultimate services. Our consumer services are offered on a monthly or annual subscription basis. Our average revenue per member is lower than our retail list prices due to wholesale or bulk pricing that we offer to strategic partners in our embedded product, employee benefits, and breach distribution channels to drive our membership growth. In our embedded product channel, our strategic partners embed our consumer services into their products and services and pay us on behalf of their customers; in our employee benefit channel, our strategic partners offer our consumer services as a voluntary benefit as part of their employee benefit enrollment process; and in our breach channel, enterprises that have experienced a data breach pay us a fee to provide our services to the victims of the data breach. We also offer special discounts and promotions from time to time
13
as incentives to prospective members to enroll in one of our consumer services. Our members pay us the full subscription fee at the beginning of each subscription period, in most cases by authorizing us to directly charge their credit or debit cards. We initially record the subscription fee as deferred revenue and then recognize it ratably on a daily basis over the subscription period. The prepaid subscription fees enhance our visibility of revenue and allow us to collect cash prior to paying our fulfillment partners. In December 2013, we acquired mobile wallet innovator Lemon and launched our LifeLock Wallet mobile application. The LifeLock Wallet mobile application allows consumers to replicate and store a digital copy of their personal wallet contents on their smart device for records backup, as well as mobile use of items such as credit, identification, ATM, insurance, and loyalty cards. The LifeLock Wallet mobile application also offers our members access to our identity theft protection services.
Our enterprise customers pay us based on their monthly volume of transactions with us, with approximately 30% of our enterprise customers committed to monthly transaction minimums. We recognize revenue at the end of each month based on transaction volume for that month and bill our enterprise customers at the conclusion of each month.
We have historically invested significantly in new member acquisition and expect to continue to do so for the foreseeable future. Our largest operating expense is advertising for member acquisition, which we record as a sales and marketing expense. This includes radio, television, and print advertisements; direct mail campaigns; online display advertising; paid search and search-engine optimization; third-party endorsements; and education programs. We also pay internal and external sale commissions, which we record as a sales and marketing expense. In general, increases in revenue and cumulative ending members occur during and after periods of significant and effective direct retail marketing efforts.
Our revenue grew from $107.6 million for the three-month period ended March 31, 2014 to $134.4 million for the three-month period ended March 31, 2015, an increase of 24.9%, including year-over-year growth within our consumer segment of 26.9%. We generated a loss from operations of $15.1 million and a net loss of $9.2 million for the three-month period ended March 31, 2015.
Our Business Model
We operate our business and our CODM reviews and assesses our operating performance using two reportable segments: our consumer segment and our enterprise segment. We review and assess our operating performance using segment revenue, income (loss) from operations, and total assets. These performance measures include the allocation of operating expenses to our reportable segments based on management’s specific identification of costs associated to those segments.
Consumer Services
We evaluate the lifetime value of a member relationship over its anticipated lifecycle. While we generally incur member acquisition costs in advance of or at the time we acquire the member, we recognize revenue ratably over the subscription period. As a result, a member relationship is not profitable at the beginning of the subscription period even though it is likely to have value to us over the lifetime of the member relationship.
When a member’s subscription automatically renews in each successive period, the relative value of that member increases because we do not incur significant incremental acquisition costs. We also benefit from decreasing fulfillment and member support costs related to that member, as well as economies of scale in our capital and operating and other support expenditures.
Enterprise Services
In our enterprise business, the majority of our costs relate to personnel primarily responsible for data analytics, data management, software development, sales and operations, and various support functions. Our enterprise customers typically provide us with their customer transaction data as part of our service, allowing us to build and refine our models without incurring significant third-party data expenses. We continually evaluate third-party data sources and acquire data from such sources when we believe such data will enhance the performance of our models. New customer acquisition is often a lengthy process. We make a significant investment in the sales team, including costs related to detailed retrospective data analysis to help demonstrate the return on investment to prospective customers had our services been deployed over a specific period of time. Because most of our enterprise business expenses are fixed, we typically incur modest incremental costs when we add new enterprise customers, resulting in additional economies of scale.
Key Metrics
We regularly review a number of operating and financial metrics to evaluate our business, determine the allocation of our resources, measure the effectiveness of our sales and marketing efforts, make corporate strategy decisions, and assess operational efficiencies.
14
Key Operating Metrics
The following table summarizes our key operating metrics:
For the Three Months Ended March 31, | |||||||
2015 | 2014 | ||||||
(in thousands, except percentages and per member data) (Unaudited) | |||||||
Cumulative ending members | 3,888 | 3,221 | |||||
Gross new members | 421 | 344 | |||||
Member retention rate | 87.8 | % | 87.5 | % | |||
Average cost of acquisition per member | $ | 176 | $ | 155 | |||
Monthly average revenue per member | $ | 11.38 | $ | 10.81 | |||
Enterprise transactions | 61,535 | 52,709 | |||||
Cumulative ending members. We calculate cumulative ending members as the total number of members at the end of the relevant period. The majority of our members are paying subscribers who have enrolled in our consumer services directly with us on a monthly or annual basis. Our remaining members receive our consumer services through third-party enterprises that pay us directly, because of a breach within the enterprise. Those enterprises embed our service within a broader third- party offering, or as an employee benefit paid for by the member's employer. We monitor cumulative ending members because it provides an indication of the revenue and expenses that we expect to recognize in the future.
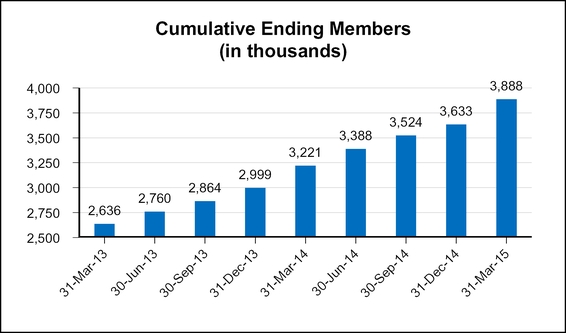
As of March 31, 2015, we had approximately 3.9 million cumulative ending members, an increase of 21% from March 31, 2014. Several factors drove this increase, including the success of our marketing campaigns, increased awareness of data breaches, media coverage of identity theft, and our member retention rate.
15
Gross new members. We calculate gross new members as the total number of new members who enroll in one of our consumer services during the relevant period. Many factors may affect the volume of gross new members in each period, including the effectiveness of our marketing campaigns, the timing of our marketing programs, the effectiveness of our strategic partnerships, and the general level of identity theft coverage in the media. We monitor gross new members because it provides an indication of the revenue and expenses that we expect to recognize in the future. For the three-month period ended March 31, 2015, we enrolled approximately 421,000 gross new members, up from approximately 344,000 for the three-month period ended March 31, 2014. This increase was driven by the success of our marketing campaigns, our product enhancements, including the release of our new suite of products in July 2014, and increased awareness of data breaches, including the Anthem breach in February 2014, and identity theft.
Member retention rate. We define member retention rate as the percentage of members on the last day of the prior year who remain members on the last day of the current year. Similarly, for quarterly presentations, we use the percentage of members on the last day of the comparable quarterly period in the prior year who remain members on the last day of the current quarterly period. A number of factors may increase our member retention rate, including increases in the number of members enrolled on an annual subscription, increases in the number of alerts a member receives, and increases in the number of members enrolled through strategic partners with whom the member has a strong association. Conversely, factors that may reduce our member retention rate include increases in the number of members enrolled on a monthly subscription and the end of enrollment programs in our embedded product and breach channels. In addition, the length of time a member has been enrolled in one of our services will affect our member retention rate with longer-term members having a positive impact. Historically, the member retention rate for our premium services has been lower than the member retention rate for our basic-level services, which we believe is driven primarily by price.
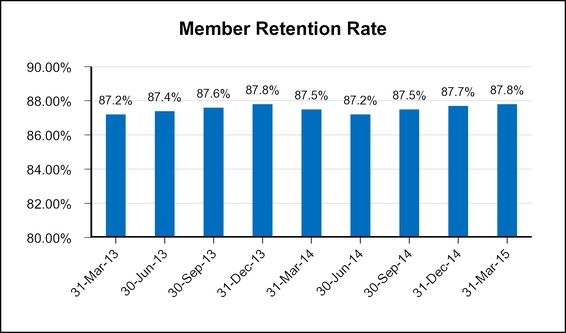
As of March 31, 2015, our member retention rate was 87.8%, which was our tenth consecutive quarter above 87%.
Average cost of acquisition per member. We calculate average cost of acquisition per member as our sales and marketing expense for our consumer segment during the relevant period divided by our gross new members for the period. A number of factors may influence this metric, including shifts in the mix of our media spend. For example, when we engage in marketing efforts to build our brand, our short-term cost of acquisition per member increases with the expectation that it will decrease over the long term. In addition, when we introduce new partnerships, such as partnerships in our embedded product channel, our average cost of acquisition per member may decrease due to the volume of members that enroll in our consumer services in a relatively short period of time. We monitor average cost of acquisition per member to evaluate the efficiency of our marketing programs in acquiring new members. For the three-month period ended March 31, 2015, our average cost of acquisition per member was $176, up from $155 for the three-month period ended March 31, 2014. Our member retention rate and the increasing monthly average revenue per member, primarily from the continued penetration of our premium service offerings, results in a higher lifetime value of a member relationship. This enables us to absorb a higher average cost of acquisition per member. Average cost of acquisition was positively impacted during the three-months ended March 31, 2015 by the members acquired as a result of the news of the Anthem breach.
16
Monthly average revenue per member. We calculate monthly average revenue per member as our consumer revenue during the relevant period divided by the average number of cumulative ending members during the relevant period (determined by taking the average of the cumulative ending members at the beginning of the relevant period and the cumulative ending members at the end of each month in the relevant period), divided by the number of months in the relevant period. A number of factors may influence this metric, including whether a member enrolls in one of our premium services; whether we offer the member any promotional discounts upon enrollment; the distribution channel through which we acquire the member, as we offer wholesale pricing in our embedded product, employee benefit, and breach channels; and whether a new member subscribes on a monthly or annual basis, as members enrolling on an annual subscription receive a discount for paying for a year in advance. While our retail list prices have historically remained unchanged, we have seen our monthly average revenue per member increase primarily due to increased adoption of our higher-priced premium services by a greater percentage of our members, a trend we expect to continue. We monitor monthly average revenue per member because it is a strong indicator of revenue in our consumer business and of the performance of our premium services.
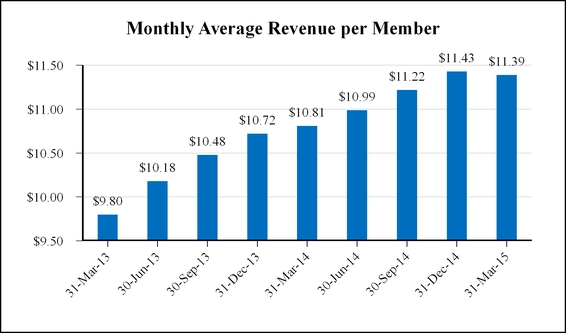
Our monthly average revenue per member for the three-month period ended March 31, 2015 was $11.38, an increase of 5% from the three-month period ended March 31, 2014. The increase in our monthly average revenue per member resulted primarily from the continued success of our premium service offerings, which accounted for more than 40% of our gross new members for the three-month period ended March 31, 2015. Our monthly average revenue per member for the three-month period ended March 31, 2015 decreased less than 1% on a sequential basis, primarily due to the accelerated gross new members near the end of the first quarter from the Anthem, Inc. data breach and the percentage increase of such members coming in through our 30-day free promotional offering. Monthly average revenue per member is also impacted by the lower number of days in the first quarter of our fiscal year when compared to the fourth quarter of our fiscal year.
Enterprise transactions. We calculate enterprise transactions as the total number of enterprise transactions processed for either an identity risk or credit risk score during the relevant period. ID Analytics, which we acquired in the first quarter of 2012, processes our enterprise transactions. Enterprise transactions have historically been higher in the fourth quarter as the level of credit applications and general consumer spending increases. We monitor the volume of enterprise transactions because it is a strong indicator of revenue in our enterprise business.
We processed 61.5 million enterprise transactions for the three-month period ended March 31, 2015, an increase of 17% from the three-month period ended March 31, 2014. We saw an increase in enterprise transactions as we continued to add new customers and expand our offerings with our current customer base.
17
Key Financial Metrics
The following table summarizes our key financial metrics:
For the Three Months Ended March 31, | |||||||
2015 | 2014 | ||||||
(in thousands) | |||||||
Consumer revenue | $ | 128,201 | $ | 100,995 | |||
Enterprise revenue | 6,207 | 6,591 | |||||
Total revenue | 134,408 | 107,586 | |||||
Adjusted net loss | (5,230 | ) | (1,014 | ) | |||
Adjusted EBITDA | (2,967 | ) | 657 | ||||
Free cash flow | 17,714 | 14,389 | |||||
Adjusted Net Income (Loss)
Adjusted net income (loss) is a non-U.S. GAAP financial measure that we calculate as net income (loss) excluding amortization of acquired intangible assets, share-based compensation, income tax benefits and expenses resulting from changes in our deferred tax assets, and acquisition related expenses. For the quarter ended March 31, 2015, we have excluded also the impact of the legal reserve for a possible settlement with a class action lawsuit. We have included adjusted net income (loss) in this Quarterly Report on Form 10-Q because it is a key measure we used to understand and evaluate our core operating performance and trends. In particular, the exclusion of certain expenses in calculating adjusted net income (loss) can provide a useful measure for period-to-period comparisons of our core business.
Accordingly, we believe that adjusted net income (loss) provides useful information to investors and others in understanding and evaluating our operating results in the same manner as we do. We believe that the exclusion of certain items of income and expense from net income (loss) in calculating adjusted net income (loss) is useful because (i) the amount of such income and expense in any specific period may not directly correlate to the underlying operational performance of our business, and/or (ii) such income and expense can vary significantly between periods as a result of new acquisitions and full amortization of previously acquired intangible assets.
Our use of adjusted net income (loss) has limitations as an analytical tool, and you should not consider it in isolation or as a substitute for analysis of our operating results as reported under U.S. GAAP. Some of these limitations include the following:
• | although amortization of intangible assets is a non-cash charge, additional intangible assets may be acquired in the future and adjusted net income (loss) does not reflect cash capital expenditure requirements for new acquisitions; |
• | adjusted net income (loss) does not reflect the cash requirements for new acquisitions; |
• | adjusted net income (loss) does not reflect changes in, or cash requirements for, our working capital needs; |
• | adjusted net income (loss) does not consider the potentially dilutive impact of share-based compensation; |
• | adjusted net income (loss) does not reflect the deferred income tax benefit from the release of the valuation allowance or income tax expenses which reduce our deferred tax asset for net operating losses or other net changes in deferred tax assets; |
• | adjusted net income (loss) does not reflect the expenses incurred for new acquisitions; and |
• | other companies, including companies in our industry, may calculate adjusted net income (loss) or similarly titled measures differently, limiting their usefulness as a comparative measure. |
18
Because of these limitations, you should consider adjusted net income (loss) alongside other financial performance measures, including various cash flow metrics, net income (loss), and our other U.S. GAAP results. The following table presents a reconciliation of net income (loss) to adjusted net income (loss) for applicable items of income and expense that impacted each of the periods indicated:
For the Three Months Ended March 31, | ||||||||
2015 | 2014 | |||||||
Reconciliation of Net Loss to Adjusted Net Loss: | (in thousands) | |||||||
Net loss | $ | (9,158 | ) | $ | (4,295 | ) | ||
Amortization of acquired intangible assets | 2,084 | 2,231 | ||||||
Share-based compensation | 5,370 | 4,001 | ||||||
Deferred income tax benefit | (6,026 | ) | (2,951 | ) | ||||
Legal reserves and settlements | 2,500 | — | ||||||
Adjusted net loss | $ | (5,230 | ) | $ | (1,014 | ) | ||
Adjusted EBITDA
Adjusted EBITDA is a non-U.S. GAAP financial measure that we calculate as net income (loss) excluding depreciation and amortization, share-based compensation, interest expense, interest income, other income (expense), income tax (benefit) expense, and acquisition related expenses. For the quarter ended March 31, 2015, we have excluded also the impact of the legal reserve for a possible settlement with a class action lawsuit. We have included adjusted EBITDA in this Quarterly Report on Form 10-Q because it is a key measure used by us to understand and evaluate our core operating performance and trends, to prepare and approve our annual budget, and to develop short- and long-term operational plans. In particular, the exclusion of certain expenses in calculating adjusted EBITDA can provide a useful measure for period-to-period comparisons of our core business. Additionally, adjusted EBITDA is a key financial measure used in determining management’s incentive compensation.
Accordingly, we believe that adjusted EBITDA provides useful information to investors and others in understanding and evaluating our operating results in the same manner as we do. We believe that the exclusion of certain items of income and expense from net income (loss) in calculating adjusted EBITDA is useful because (i) the amount of such income and expense in any specific period may not directly correlate to the underlying operational performance of our business, and/or (ii) such income and expense can vary significantly between periods as a result of new acquisitions and full amortization of previously acquired intangible assets.
Our use of adjusted EBITDA has limitations as an analytical tool, and you should not consider it in isolation or as a substitute for analysis of our operating results as reported under U.S. GAAP. Some of these limitations include the following:
• | although depreciation and amortization are non-cash charges, the assets being depreciated and amortized may have to be replaced in the future, and adjusted EBITDA does not reflect cash capital expenditure requirements for such replacements or for new capital expenditure requirements; |
• | adjusted EBITDA does not reflect changes in, or cash requirements for, our working capital needs; |
• | adjusted EBITDA does not consider the potentially dilutive impact of share-based compensation; |
• | adjusted EBITDA does not reflect cash interest income or expense; |
• | adjusted EBITDA does not reflect tax payments that may represent a reduction in cash available to us; |
• | adjusted EBITDA does not reflect the expenses incurred for new acquisitions; and |
• | other companies, including companies in our industry, may calculate adjusted EBITDA or similarly titled measures differently, limiting their usefulness as a comparative measure. |
19
Because of these limitations, you should consider adjusted EBITDA alongside other financial performance measures, including various cash flow metrics, net income (loss), and our other U.S. GAAP results. The following table presents a reconciliation of net income (loss) to adjusted EBITDA for applicable items of income and expense that impacted each of the periods indicated:
For the Three Months Ended March 31, | ||||||||
2015 | 2014 | |||||||
Reconciliation of Net Loss to Adjusted EBITDA: | (in thousands) | |||||||
Net loss | $ | (9,158 | ) | $ | (4,295 | ) | ||
Depreciation and amortization | 4,295 | 3,861 | ||||||
Share-based compensation | 5,370 | 4,001 | ||||||
Interest expense | 89 | 87 | ||||||
Interest income | (117 | ) | (60 | ) | ||||
Other expense | 80 | 11 | ||||||
Income tax benefit | (6,026 | ) | (2,948 | ) | ||||
Legal reserves and settlements | 2,500 | — | ||||||
Adjusted EBITDA | $ | (2,967 | ) | $ | 657 | |||
Free Cash Flow
Free cash flow is a non-U.S. GAAP financial measure that we calculate as net cash provided by (used in) operating activities less net cash used in investing activities for acquisitions of property and equipment. We use free cash flow as a measure of our operating performance; for planning purposes, including the preparation of our annual operating budget; to allocate resources to enhance the financial performance of our business; to evaluate the effectiveness of our business strategies; to provide consistency and comparability with past financial performance; to determine capital requirements; to facilitate a comparison of our results with those of other companies; and in communications with our board of directors concerning our financial performance.
We use free cash flow to evaluate our business because, although it is similar to net cash provided by (used in) operating activities, we believe it typically presents a more conservative measure of cash flow as purchases of property and equipment are necessary components of ongoing operations. We believe that this non-U.S. GAAP financial measure is useful in evaluating our business because free cash flow reflects the cash surplus available to fund the expansion of our business after payment of capital expenditures relating to the necessary components of ongoing operations. We also believe that the use of free cash flow provides consistency and comparability with our past financial performance, facilitates period-to-period comparisons of operations, and also facilitates comparisons with other companies, many of which use similar non-U.S. GAAP financial measures to supplement their U.S. GAAP results.
Although free cash flow is frequently used by investors in their evaluations of companies, free cash flow has limitations as an analytical tool, and you should not consider it in isolation or as a substitute for analysis of our operating results as reported under U.S. GAAP. Some of these limitations include the following:
• | free cash flow does not reflect our future requirements for contractual commitments to third- party providers; |
• | free cash flow does not reflect the non-cash component of employee compensation or depreciation and amortization of property and equipment; and |
• | other companies, including companies in our industry, may calculate free cash flow or similarly titled measures differently, limiting their usefulness as comparative measures. |
20
Because of these limitations, you should consider free cash flow alongside other financial performance measures, including net cash provided by (used in) operating activities, net income (loss), and our other U.S. GAAP results. The following table presents a reconciliation of net cash provided by (used in) operating activities to free cash flow for each of the periods indicated:
For the Three Months Ended March 31, | ||||||||
2015 | 2014 | |||||||
Reconciliation of Net Cash Provided By Operating Activities to Free Cash Flow: | (in thousands) | |||||||
Net cash provided by operating activities | $ | 20,530 | $ | 18,316 | ||||
Acquisitions of property and equipment | (2,816 | ) | (3,927 | ) | ||||
Free cash flow | $ | 17,714 | $ | 14,389 | ||||
Factors Affecting Our Performance
Customer acquisition costs. We expect to continue to make significant expenditures to grow our member and enterprise customer bases. Our average cost of acquisition per member and the number of new members we generate depends on a number of factors, including the effectiveness of our marketing campaigns, changes in cost of media, the competitive environment in our markets, the prevalence of identity theft issues in the media, publicity about our company, and the level of differentiation of our services. Shifts in the mix of our media spend also influence our member acquisition costs. For example, when we engage in marketing efforts to build our brand, our member acquisition costs increase in the short term with the expectation that they will decrease over the long term. We also continually test new media outlets, marketing campaigns, and call center scripting, each of which impacts our average cost of acquisition per member. In addition, given the past success of our premium services, we expect to be able to absorb a higher average cost of acquisition per member and still recognize value over the lifetime of our member relationships.
Mix of members by services, billing cycle, and distribution channel. Our performance is affected by the mix of members subscribing to our various consumer services, by billing cycle (annual versus monthly), and by the distribution channel through which we acquire the member. Our adjusted EBITDA, adjusted net income, free cash flow, and average cost of acquisition per member are all affected by this mix. We have seen a recent shift to more monthly members, in large part due to the increase in the number of members enrolling through our embedded product and employee benefits channels in which our members enroll on a monthly basis. We also have seen an increase in the number of members enrolling in our premium services as a percentage of our gross new members.
Customer retention. Our ability to maintain our current member retention rate may be affected by a number of factors, including the effectiveness of our services, the performance of our member services organization, external media coverage of identity theft, the continued evolution of our service offerings, the competitive environment, the effectiveness of our media spend, the timing of employee benefit and breach service enrollments, and other developments.
Our enterprise business relies on the retention of enterprise customers to maintain the effectiveness of our services because our enterprise customers typically provide us with their customer transaction data as part of our service. Losing a significant number of these customers would reduce the breadth and effectiveness of our services. In addition, we believe less than 1% of our overall revenue for the three-month period ended March 31, 2015 was derived from direct competitors to our consumer business. As we have given notice of non-renewal to competitors in our consumer segment, we have allowed such contracts to lapse, and accordingly, this percentage may decline over time.
Investments to grow our business. We will continue to invest to grow our business. Investments in the development and marketing of new services, including the new services we introduced in July 2014, and the continued enhancement of our existing services will increase our operating expenses in the near term and thus may negatively impact our operating results in the short term, although we anticipate that these investments will grow and improve our business over the long term.
Regulatory developments. Our business is subject to regulation by federal, state, local, and foreign authorities. Any changes to the existing applicable laws, regulations, or rules; any determination that other laws, regulations, or rules are applicable to us; or any determination that we have violated any of these laws, regulations, or rules could adversely affect our operating results. As previously disclosed, at our request, we met with the FTC Staff on January 17, 2014, to discuss allegations asserted in a whistleblower claim against us relating to our compliance with the FTC Order. On March 13, 2014, we received a request from the FTC for documents and information related to our compliance with the FTC Order. On October 29, 2014, we completed our responses to the FTC’s March 13, 2014 request for information. On January 5, 2015, we completed our responses to the FTC’s subsequent requests for clarification regarding certain information that we previously submitted. We are
21
in ongoing discussions with the FTC Staff regarding the FTC's inquiry into our compliance with the FTC Order. On February 4, 2015, we made a $20 million settlement offer to the FTC Staff and we remain in ongoing discussions with the FTC Staff regarding a possible settlement of this inquiry. There is no guarantee that we will settle this inquiry for $20 million, if at all, and any settlement with the FTC regarding this inquiry, in addition to the payment of the settlement amount, could result in liability for damages and other penalties, require us to make changes to our services and business practices, and cause us to lose customers, any of which could have a material adverse impact on our business, operating results, financial condition, and prospects.
In addition, on May 16, 2014, we announced that we had determined that certain aspects of the LifeLock Wallet mobile application did not fully comply with applicable payment card industry (PCI) security standards. As a result, we temporarily suspended the LifeLock Wallet mobile application, and deleted the affected data from our servers. On May 15, 2014, on our initiative, we informed the FTC Staff of these issues with the LifeLock Wallet mobile application. On October 28, 2014, the aspects of the LifeLock Wallet mobile application that we previously identified as not meeting applicable PCI security standards were confirmed as meeting applicable PCI security standards. We do not expect to receive further requests for information about this from the FTC . On October 29, 2014, we relaunched the LifeLock Wallet mobile application. If the FTC's review of our PCI non-compliance results in a determination that we violated the FTC Order, we could be liable for fines, damages, or other penalties, or the FTC could require us to make changes to our services and business practices and cause us to lose customers. If we received any of these fines, damages, other penalties, or changes could have a material adverse impact on our business, operating results, financial condition, and prospects.
We also collect and remit sales tax in several states related to the sale of our consumer services. Other states or one or more countries or other jurisdictions could seek to impose sales or other tax collection obligations on us in the future. A successful assertion by any state, country, or other jurisdiction that we should be collecting sales or other taxes on the sale of our services could, among other things, increase the cost of our services, create significant administrative burdens for us, result in substantial tax liabilities, discourage current members and other consumers from purchasing our services, or otherwise substantially harm our business and operating results.
For a discussion of additional factors and risks facing our business, see “Risk Factors” in our 2014 Form 10-K, and as amended in this Form 10-Q.
Basis of Presentation and Key Components of Our Results of Operations
We operate our business and our CODM reviews and assesses our operating performance using two reportable segments: our consumer segment and our enterprise segment. We review and assess our operating performance using segment revenue, income (loss) from operations, and total assets. These performance measures include the allocation of operating expenses to our reportable segments based on management’s specific identification of costs associated to those segments.
Revenue
We derive revenue in our consumer segment primarily from fees paid by our members for identity theft protection services offered on a subscription basis. Our members subscribe to our consumer services on a monthly or annual, automatically renewing basis and pay us the full subscription fee at the beginning of each subscription period, in most cases by authorizing us to directly charge their credit or debit cards. In some cases, we offer members a free trial period, which is typically 30 days. Our members may cancel their membership with us at any time without penalty and, when they do, we issue a refund for the unused portion of the canceled membership. We recognize revenue for member subscriptions ratably on a daily basis from the latter of cash receipt, activation of a member’s account, or expiration of free trial periods to the end of the subscription period.
We also provide consumer services for which the primary customer is an enterprise purchasing identity theft protection services on behalf of its employees or customers. In such cases, we defer revenue for each member until the member’s account has been activated. We then recognize revenue ratably on a daily basis over the term of the subscription period.
We derive revenue in our enterprise segment from fees paid by our enterprise customers for fraud and risk solutions, which we generally provide under multi-year contracts, many of which renew automatically. Our enterprise customers pay us based on their monthly volume of transactions with us, and approximately 30% of them are committed to paying monthly minimum fees. We recognize revenue based on a negotiated fee per transaction. Transaction fees in excess of any of the monthly minimum fees are billed and recorded as revenue in addition to the monthly minimum fees. In some instances, we receive up-front non-refundable payments against which the monthly minimum fees are applied. The up-front non-refundable payments are recorded as deferred revenue and recognized as revenue monthly over the usage period. If an enterprise customer does not meet its monthly minimum fee, we bill the negotiated monthly minimum fee and recognize revenue for that amount. We derive a small portion of our enterprise revenue from special projects in which we are engaged to deliver a report at the end of the analysis, which we record upon delivery and acceptance of the report.
22
Cost of Services
Cost of services in our consumer segment consists primarily of costs associated with our member services organization and fulfillment partners. Our member support operations include wages and benefits for personnel performing these functions and facility costs directly associated with our sales and service delivery functions. We also pay fees to third-party service providers related to the fulfillment of our consumer services, including the premiums associated with the identity theft insurance that we provide to our members, and merchant credit card fees.
Costs of services in our enterprise segment includes primarily wages and benefits of personnel, and the facility costs that are directly associated with the data analytics and data management.
We expect our cost of services to increase if we continue to increase the number of our members and enterprise customers. Our cost of services is heavily affected by prevailing salary levels, which affect our internal direct costs and fees paid to third-party service providers. Accordingly, increases in the market rate for wages would increase our cost of services.
Gross Margin
Gross profit as a percentage of total revenue, or gross margin, has been and will continue to be affected by a variety of factors. Increases in personnel and facility costs directly associated with the provision of our services can negatively affect our gross margin. Our gross margin can also be affected by higher fulfillment costs due to enhancements in our services or the introduction of new services, such as the addition of insurance coverage in our consumer services. A significant increase in the number of members we enroll through our strategic partner distribution channels can also negatively affect our gross margin because we offer wholesale pricing to our strategic partners. In prior periods, sales taxes we paid on behalf of our members, and settlements with state tax authorities, also negatively affected our gross margin. Conversely, operating efficiencies in our member services organization can improve our gross margin. We expect our gross margin to fluctuate from period to period depending on all of these factors.
Sales and Marketing
Sales and marketing expenses consist primarily of direct response advertising and online search costs, commissions paid on a per-member basis to our online affiliates and on a percentage of revenue basis to our co-marketing partners, and wages and benefits for sales and marketing personnel. Direct response marketing costs include television, radio, and print advertisements as well as costs to create and produce these advertisements. Online search costs consist primarily of pay-per-click payments to search engines and other online advertising media, such as banner ads. We expense advertising costs as incurred, and historically, they have occurred unevenly across periods. Our sales and marketing expenses also include payments related to our sponsorship and promotional partners. In order to continue to grow our business and the awareness of our services, we plan to continue to commit substantial resources to our sales and marketing efforts. As a result, for the near term, we expect our sales and marketing expenses will continue to increase in absolute dollars and vary as a percentage of revenue, depending on the timing of those expenses.
Technology and Development
Technology and development expenses consist primarily of personnel costs incurred in product development, maintenance and testing of our websites, enhancing our existing services and developing new services, internal information systems and infrastructure, data privacy and security systems, third-party development, and other internal-use software systems. Our development costs are primarily incurred in the United States and are directed at enhancing our existing service offerings and developing new service offerings. In order to continue to grow our business and enhance our services, we plan to continue to commit resources to technology and development. In addition, ID Analytics has historically spent a higher portion of its revenue on technology and development. As a result, we expect our technology and development expenses will continue to increase in absolute dollars for the foreseeable future.
General and Administrative
General and administrative expenses consist primarily of personnel costs, professional fees, and facility-related expenses associated with our executive, finance, human resources, legal, and governmental affairs organizations. Our professional fees principally consist of outside legal, auditing, accounting, and other consulting fees. Legal costs included within our general and administrative expenses also include costs incurred to litigate and settle various legal matters. We expect our general and administrative expenses will increase in absolute dollars for the foreseeable future as we hire additional personnel and expand our office facilities to support our overall growth and incur additional costs associated with our public company and regulatory compliance.
23
Amortization of Acquired Intangible Assets
Amortization of acquired intangible assets is the amortization expense associated with core technology, customer relationships, and trade names and trademarks resulting from business acquisitions. As of March 31, 2015, we had $36.2 in intangible assets, net of amortization, as a result of our acquisitions of ID Analytics and Lemon. The acquired intangible assets have useful lives of between one and ten years and we expect to recognize approximately $8.3 million of amortization expense in the year ending December 31, 2015.
Provision for Income Taxes
We are subject to federal income tax as well as state income tax in various states in which we conduct business. Our effective tax rate for the three-month periods ended March 31, 2015 and 2014, approximated the U.S. federal statutory tax rate plus the impact of state taxes and permanent and other temporary differences.
Results of Operations
Comparison of the Three-Month Periods Ended March 31, 2015 and 2014
Total Revenue
For the Three Months Ended March 31, | ||||||||||
2015 | 2014 | % Change | ||||||||
(in thousands) | ||||||||||
Consumer revenue | $ | 128,201 | $ | 100,995 | 26.9 | % | ||||
Enterprise revenue | 6,207 | 6,591 | (5.8 | )% | ||||||
Total revenue | $ | 134,408 | $ | 107,586 | ||||||
Consumer revenue for the three-month period ended March 31, 2015 was $128.2 million, an increase of $27.2 million, or 26.9%, over consumer revenue for the three-month period ended March 31, 2014. The increase in our consumer revenue related primarily to an increase in the number of our members, which grew from approximately 3.2 million as of March 31, 2014 to approximately 3.9 million as of March 31, 2015, an increase of 21%. In addition, our monthly average revenue per member increased 5% to $11.38 for the three-month period ended March 31, 2015 from $10.81 for the three-month period ended March 31, 2014. The increase in members and monthly average revenue per member resulted from the continued success of our premium service offerings, including the release of our new LifeLock Advantage and LifeLock Ultimate Plus services at the end of July 2014, and our advertising and marketing campaigns designed to increase the overall awareness of our services and identity theft.
Enterprise revenue for the three-month period ended March 31, 2015, was $6.2 million, a decrease of $0.4 million, or 5.8%, over enterprise revenue for the three-month period ended March 31, 2014. Enterprise revenue decreased primarily due to the continued reduction in revenue because we gave notice of non-renewal to several customers who compete in our consumer business and we allowed those contracts to lapse, which was partially offset by growth as we continue to add new customers and expand our offerings within our current customer base.
Cost of Services and Gross Profit
For the Three Months Ended March 31, | ||||||||||
2015 | 2014 | % Change | ||||||||
(in thousands) | ||||||||||
Cost of services | $ | 34,556 | $ | 29,957 | 15.4 | % | ||||
Percentage of revenue | 25.7 | % | 27.8 | % | ||||||
Gross profit | 99,852 | 77,629 | 28.6 | % | ||||||
Percentage of revenue | 74.3 | % | 72.2 | % | ||||||
Gross profit for the three-month period ended March 31, 2015, was $99.9 million, or 74.3% of revenue, an increase of $22.2 million, or 28.6%, over gross profit of $77.6 million, or 72.2% of revenue, for the three-month period ended March 31, 2014. The increase in our gross profit resulted primarily from increased revenue associated with the growth in the number of our members and increased monthly average revenue per member. The increase in our gross profit percentage is primarily attributable to efficiencies in our member services organization and scalability within certain third-party fulfillment contracts as our member base continued to grow.
24
Sales and Marketing
For the Three Months Ended March 31, | ||||||||||
2015 | 2014 | % Change | ||||||||
(in thousands) | ||||||||||
Sales and marketing | $ | 77,079 | $ | 56,539 | 36.3 | % | ||||
Percentage of revenue | 57.3 | % | 52.6 | % | ||||||
Sales and marketing expenses for the three-month period ended March 31, 2015, were $77.1 million, or 57.3% of revenue, compared with $56.5 million, or 52.6% of revenue, for the three-month period ended March 31, 2014. The increase in our sales and marketing expenses resulted from increases in our advertising expenses, external sales commissions, and personnel costs, including increases in our non-cash share-based compensation. The increase in our sales and marketing expenses reflected our investment to drive new membership growth, our continued advertising of our premium service offerings, and our efforts to highlight the growing identity theft issue and to educate consumers.
Technology and Development
For the Three Months Ended March 31, | ||||||||||
2015 | 2014 | % Change | ||||||||
(in thousands) | ||||||||||
Technology and development | $ | 16,866 | $ | 12,729 | 32.5 | % | ||||
Percentage of revenue | 12.5 | % | 11.8 | % | ||||||
Technology and development expenses for the three-month period ended March 31, 2015, were $16.9 million, or 12.5% of revenue, compared with $12.7 million, or 11.8% of revenue, for the three-month period ended March 31, 2014. The increase in our technology and development expenses resulted primarily from increases in our personnel costs, including non-cash share-based compensation, which were primarily the result of a reorganization of our product and technology group. Through that effort, we invested in new talent and in a geographic consolidation of our product teams. In addition, we also made investments in product enhancements, security, infrastructure, and market research.
General and Administrative
For the Three Months Ended March 31, | ||||||||||
2015 | 2014 | % Change | ||||||||
(in thousands) | ||||||||||
General and administrative | $ | 18,955 | $ | 13,335 | 42.1 | % | ||||
Percentage of revenue | 14.1 | % | 12.4 | % | ||||||
General and administrative expenses for the three-month period ended March 31, 2015, were $19.0 million, or 14.1% of revenue, compared with $13.3 million, or 12.4% of revenue, for the three-month period ended March 31, 2014. The increase in general and administrative expenses resulted primarily from additional costs associated with our regulatory compliance, acquisition integration and related intellectual property audits, the expansion of our office facilities, and additional personnel costs, including non-cash share-based compensation. In addition, during the three-month period ended March 31, 2015, we resolved, subject to court approval, two of the California consumer class action lawsuits against previously filed against us, resulting in a total settlement accrual of $2.5 million.
25
Amortization of Acquired Intangible Assets
For the Three Months Ended March 31, | ||||||||||
2015 | 2014 | % Change | ||||||||
(in thousands) | ||||||||||
Amortization of acquired intangible assets | $ | 2,084 | $ | 2,231 | (6.6 | )% | ||||
Percentage of revenue | 1.6 | % | 2.1 | % | ||||||
Amortization of acquired intangible assets for the three-month period ended March 31, 2015,was $2.1 million, or 1.6% of revenue, compared with $2.2 million, or 2.1% of revenue, for the three-month period ended March 31, 2014.
Other Income (Expense)
For the Three Months Ended March 31, | ||||||||||
2015 | 2014 | % Change | ||||||||
(in thousands) | ||||||||||
Interest expense | $ | (89 | ) | $ | (87 | ) | 2.3 | % | ||
Interest income | 117 | 60 | 95.0 | % | ||||||
Other | (80 | ) | (11 | ) | 627.3 | % | ||||
Total other expense | $ | (52 | ) | $ | (38 | ) | 36.8 | % | ||
Other expense for the three-month period ended March 31, 2015, was $0.1 million compared with less than $0.1 million for the three-month period ended March 31, 2014.
Income Tax Benefit
For the Three Months Ended March 31, | ||||||||||
2015 | 2014 | % Change | ||||||||
(in thousands) | ||||||||||
Income tax benefit | $ | (6,026 | ) | $ | (2,948 | ) | 104.4 | % | ||
Effective tax rate | 39.7 | % | 40.7 | % | ||||||
Income tax expense for the three-month period ended March 31, 2015, was $6.0 million compared with income tax benefit of $2.9 million for the three-month period ended March 31, 2014. Our effective tax rate for the three-month periods ended March 31, 2015, and 2014, approximated the U.S. federal statutory tax rate plus the impact of state taxes.
Liquidity and Capital Resources
As of March 31, 2015, we had $159.9 million in cash and cash equivalents, which consisted of cash, money market funds, open commercial paper with original maturity dates of less than three months at the time of purchase, and a municipal bond with an original maturity date of less than three months at the time of purchase, and $133.5 million in marketable securities, which consisted of corporate bonds, municipal bonds, commercial paper, and certificates of deposit. We classify our marketable securities as short-term regardless of contractual maturity based on our ability to liquidate those investments for use in current operations. Additionally, we have an $85 million revolving line of credit. We did not draw on the line of credit during the three-month period ended March 31, 2015. As of March 31, 2015, we had no outstanding debt. We believe that our existing cash and cash equivalents and marketable securities together with cash generated from operations will be sufficient to fund our operations for at least the next 12 months.
Operating Activities
For the three-month period ended March 31, 2015, operating activities generated $20.5 million in cash as a result of a net loss of $9.2 million, adjusted by non-cash items such as depreciation and amortization of $4.3 million, share-based compensation of $5.4 million, and an income tax benefit of $6.0 million. An increase in deferred revenue related to the overall growth of our business provided operating cash of $22.8 million and positive net operating cash flows of $2.5 million from other operating assets and liabilities.
26
For the three-month period ended March 31, 2014, operating activities generated $18.3 million in cash as a result of a net loss of $4.3 million, adjusted by non-cash items such as depreciation and amortization of $3.9 million, share-based compensation of $4.0 million, and an income tax benefit of $3.0 million. An increase in deferred revenue related to the overall growth of our business provided operating cash of $17.2 million and we had a decrease in operating cash as a result of changes in other operating assets and liabilities of $0.2 million.
Investing Activities
For the three-month period ended March 31, 2015, we used $2.8 million of cash to acquire property and equipment primarily attributable to the expansion of our office locations, and we invested a net $5.9 million of cash in marketable securities.
For the three-month period ended March 31, 2014, we used $3.9 million of cash to acquire property and equipment and net proceeds from the maturities and purchases of marketable securities provided $1.1 million of cash.
Financing Activities
For the three-month period ended March 31, 2015, financing activities generated net cash of $1.5 million as a result of cash received from the exercise of stock options of $1.8 million, offset by $0.2 million paid for employee withholding tax related to net distributions of restricted stock units and restricted stock awards.
For the three-month period ended March 31, 2014, our financing activities generated net cash of $4.3 million as a result of cash received from the exercise of stock options of $4.4 million, offset by $0.1 million paid for employee withholding tax related to net distributions of restricted stock units.
Debt Obligations
Senior Credit Facility
On January 9, 2013, we refinanced our existing credit agreement and entered into a new credit agreement, or the Credit Agreement, with Bank of America, N.A. as administrative agent, swing line lender and L/C issuer, Silicon Valley Bank as syndication agent, Merrill Lynch, Pierce, Fenner & Smith Incorporated as sole lead arranger and sole book manager, and the lenders from time to time party thereto. We refer to the Credit Agreement and related documents as the Senior Credit Facility.
The Senior Credit Facility provides for an $85.0 million revolving line of credit, which we can increase to $110.0 million subject to the conditions set forth in the Credit Agreement. The revolving line of credit also includes a letter of credit subfacility of $10.0 million and a swing line loan subfacility of $5.0 million. The Senior Credit Facility has a maturity date of January 9, 2018. As of March 31, 2015, we had no debt outstanding under our Senior Credit Facility. For the three-month period ended March 31, 2015, we incurred unused commitment fees of $0.1 million, which are included in interest expense in the consolidated statements of operations.
Borrowings under the Senior Credit Facility bear interest at a per annum rate equal to, at our option, either (a) a base rate equal to the highest of (i) the Federal Funds Rate plus 0.50%, (ii) the rate of interest in effect for such day as publicly announced from time to time by Bank of America as its “prime rate,” and (iii) the eurodollar rate for base rate loans plus 1.00%, plus an applicable rate ranging from 0.50% to 1.25%, or (b) the eurodollar rate for eurodollar rate loans plus an applicable rate ranging from 1.50% to 2.25%. The initial applicable rate is 0.50% for base rate loans and 1.50% for eurodollar rate loans, subject to adjustment from time to time based upon our achievement of a specified consolidated leverage ratio.
In addition to paying interest on the outstanding principal under the Senior Credit Facility, we are also required to pay a commitment fee to the administrative agent at a rate per annum equal to the product of (a) an applicable rate ranging from 0.25% to 0.50% multiplied by (b) the actual daily amount by which the aggregate revolving commitments exceed the sum of (1) the outstanding amount of revolving borrowings, and (2) the outstanding amount of letter of credit obligations. The initial applicable rate is 0.25%, subject to adjustment from time to time based upon our achievement of a specified consolidated leverage ratio.
We also will pay a letter of credit fee to the administrative agent for the account of each lender in accordance with its applicable percentage of a letter of credit for each letter of credit, equal to the applicable rate then in effect, multiplied by the daily maximum amount available to be drawn under the letter of credit. The initial applicable rate for the letter of credit is 1.50%, subject to adjustment from time to time based upon our achievement of a specified consolidated leverage ratio.
We have the right to prepay our borrowings under the Senior Credit Facility from time to time in whole or in part, without premium or penalty, subject to the procedures set forth in the Senior Credit Facility.
All of our obligations under the Senior Credit Facility are unconditionally and jointly and severally guaranteed by each of our existing and future, direct or indirect, domestic subsidiaries, subject to certain exceptions. In addition, all of our
27
obligations under the Senior Credit Facility, and the guarantees of those obligations, are secured, subject to permitted liens and certain other exceptions, by a first-priority lien on our and our subsidiaries’ tangible and intangible personal property, including a pledge of all of the capital stock of our subsidiaries.
The Senior Credit Facility requires us to maintain certain financial covenants. In addition, the Senior Credit Facility requires us to maintain all material proprietary databases and software with a third-party escrow agent in accordance with an escrow agreement that we reaffirmed in connection with the Senior Credit Facility. The Senior Credit Facility also contains certain affirmative and negative covenants limiting, among other things, additional liens and indebtedness, investments and distributions, mergers and acquisitions, liquidations, dissolutions, sales of assets, prepayments and modification of debt instruments, transactions with affiliates, and other matters customarily restricted in such agreements. The Senior Credit Facility also contains customary events of default, including payment defaults, breaches of representations and warranties, covenant defaults, cross defaults to other contractual agreements, events of bankruptcy and insolvency, and a change of control. As of March 31, 2015, we were in compliance with all financial covenants under the Senior Credit Facility.
As of March 31, 2015, we had no outstanding letters of credit.
Contractual Obligations
There were no material changes in our commitments under contractual obligations to those disclosed in our Form 10-K for the fiscal year ended December 31, 2014.
Off-Balance Sheet Arrangements
We do not engage in any off-balance sheet financing activities, nor do we have any interest in entities referred to as variable interest entities.
Critical Accounting Policies and Estimates
Our consolidated financial statements are prepared in accordance with accounting principles generally accepted in the United States of America. The preparation of these consolidated financial statements requires us to make estimates and assumptions that affect the reported amounts of assets, liabilities, revenue, costs and expenses, and related disclosures. These estimates form the basis for judgments we make about the carrying values of our assets and liabilities, which are not readily apparent from other sources. We base our estimates and judgments on historical experience and on various other assumptions that we believe are reasonable under the circumstances. On an ongoing basis, we evaluate our estimates and assumptions. Our actual results may differ from these estimates under different assumptions or conditions.
We believe that the assumptions and estimates associated with revenue recognition for payments and other fees, income taxes, and share-based compensation have the greatest potential impact on our condensed consolidated financial statements. Therefore we consider these to be our critical accounting policies and estimates.
There have been no material changes to our critical accounting policies and estimates as compared to the critical accounting policies and estimates described in our 2014 Form 10-K.
Item 3. | Quantitative and Qualitative Disclosures About Market Risk |
There have been no material changes in our primary market risk exposures or how we manage those exposures from the information disclosed in Part II, Item 7A of our 2014 Form 10-K. For further discussion of quantitative and qualitative disclosures about market risk, reference is made to our 2014 Form 10-K.
Item 4. | Controls and Procedures |
Evaluation of Disclosure Controls and Procedures
Management, together with our CEO and CFO, evaluated the effectiveness of our disclosure controls and procedures (as defined in Rules 13a-15(e) and 15d-15(e) under the Exchange Act) as of the end of the period covered by this Quarterly Report on Form 10-Q. Based on that evaluation, our CEO and CFO concluded that, as of such date, our disclosure controls and procedures were effective as of March 31, 2015.
Changes in Internal Control Over Financial Reporting
There were no changes in our internal control over financial reporting identified in management's evaluation pursuant to Rules 13a-15(d) or 15d-15(d) of the Exchange Act during the period covered by this Quarterly Report on Form 10-Q that materially affected, or are reasonably likely to material affect, our internal control over financial reporting.
Limitations on Effectiveness of Controls and Procedures
28
Management, including our CEO and CFO, does not expect that our disclosure controls and procedures or our internal controls over financial reporting will prevent all error and all fraud. A control system, no matter how well conceived and operated, can provide only reasonable, not absolute, assurance that the objectives of the control system are met. Further, the design of a control system must reflect the fact that there are resource constraints, and the benefits of controls must be considered relative to their costs. Because of the inherent limitations in all control systems, no evaluation of controls can provide absolute assurance that all control issues, misstatements, errors, and instances of fraud, if any, within our company have been or will be prevented or detected. These inherent limitations include the realities that judgments in decision-making can be faulty and that breakdowns can occur because of simple error or mistake. Controls also can be circumvented by the individual acts of some persons, by collusion of two or more people, or by management override of the controls. The design of any system of controls is based in part on certain assumptions about the likelihood of future events, and there can be no assurance that any design will succeed in achieving its stated goals under all potential future conditions. Projections of any evaluation of controls effectiveness to future periods are subject to risks that internal controls may become inadequate as a result of changes in conditions, or through the deterioration of the degree of compliance with policies or procedures.
29
PART II - OTHER INFORMATION
Item 1. | Legal Proceedings |
On March 13, 2014, we received a request from the FTC for documents and information related to our compliance with the FTC Order. Prior to our receipt of the FTC’s request, we met with FTC Staff on January 17, 2014, at our request, to discuss issues regarding allegations that have been asserted in a whistleblower claim against us relating to our compliance with the FTC Order. On October 29, 2014, we completed our responses to the FTC’s March 13, 2014 request for information. On January 5, 2015, we completed our responses to the FTC’s subsequent requests for clarification regarding certain information that we previously submitted. We have engaged in ongoing discussions with the FTC Staff regarding the FTC's inquiry into our compliance with the FTC Order. On February 4, 2015, we made a $20 million settlement offer to the FTC Staff and we remain in ongoing discussions with the FTC Staff regarding a possible settlement of this inquiry.
On January 19, 2015, plaintiffs Napoleon Ebarle and Jeanne Stamm filed a nationwide putative consumer class action against us in the United States District Court for the Northern District of California. The plaintiffs allege that we have engaged in deceptive marketing and sales practices in connection with our membership plans in violation of the Arizona Consumer Fraud Act, and are seeking declaratory judgment under the Federal Declaratory Judgment Act. The plaintiffs also seek certification of a nationwide class of consumers who are or were subscribers of our identity theft protection services since January 19, 2014, compensatory damages, and attorneys’ fees and costs. We were served with the complaint on January 22, 2015. On March 6, we filed a motion to dismiss. Plaintiffs filed an amended complaint on March 27, 2015. Our response to that amended complaint is due on May 12, 2015.
On January 29, 2015, plaintiff Etan Goldman filed a California putative consumer class action complaint against us in Santa Clara Superior Court in San Jose, California. The complaint alleges that we violated California’s Automatic Renewal Law and Unfair Competition Law by failing to provide required disclosures concerning our auto renewal terms and cancellation policies. The complaint also seeks certification of a class consisting of all persons in California who have purchased subscriptions to identity theft protection services from us since December 1, 2010, injunctive relief, compensatory damages, restitution, and attorneys’ fees and costs. On April 15, 2015, the parties participated in a mediation, and signed a Confidential Memorandum of Agreement for a Settlement Agreement. The motion for preliminary approval of the class action settlement is currently scheduled to be filed on May 22, 2015.
On February 2, 2015, plaintiff, Thomas A. Trax, filed a class action complaint against us in the United States District Court for the Southern District of California. The complaint asserted that we violated California’s Automatic Renewal Law and Unfair Competition Law by failing to provide required disclosures concerning our auto renewal terms and cancellation policies. The complaint seeks certification of a class consisting of all persons in California who have purchased products and/or services from us as part of an automatic renewal plan or continuous service offer since February 2, 2011, injunctive relief, compensatory damages, restitution, a constructive trust and/or disgorgement, and attorneys’ fees and costs. We have not yet been served with the complaint. On April 15, 2015, Mr. Trax agreed to dismiss the lawsuit without prejudice and we expect that to occur shortly.
On March 3, 2014, Dawn B. Bien, representing herself and seeking to represent a class of persons who acquired our securities from February 26, 2013 to February 19, 2014, inclusive, filed a class action complaint in United States District Court for the District of Arizona alleging violations of Sections 10(b) and 20(a) of the Exchange Act against us, Todd Davis, and Chris Power. On March 10, 2014, Joseph F. Scesny also filed a class action complaint in the same court against the same parties that made substantively similar allegations and requested substantially similar relief as the complaint that Ms. Bien filed. On June 16, 2014, the court consolidated Mses. Bien and Scesny's complaints into a single action captioned In re LifeLock, Inc. Securities Litigation. The court also appointed a lead plaintiff and lead counsel. On August 15, 2014, the lead plaintiff filed the Consolidated Amended Class Action Complaint, or the Consolidated Amended Complaint, against us, Mr. Davis, Mr. Power, and Hilary Schneider seeking to represent a class of persons who acquired our securities from February 26, 2013 to May 16, 2014, inclusive, or the Class Period. The Consolidated Amended Complaint alleged that we, along with Ms. Schneider and Messrs. Davis and Power, violated Sections 10(b) and 20(a) of the Exchange Act by making materially false or misleading statements, or failing to disclose material facts regarding certain of our business, operational, and compliance policies, including with regard to certain of our services, our data security program, and our and Mr. Davis’ compliance with the FTC Order. The Consolidated Amended Complaint alleged that, as a result, certain public statements made by Ms. Schneider and Messrs. Davis and Power during the Class Period, and certain of our financial statements issued during the Class Period, were false and misleading. The Consolidated Amended Complaint sought certification as a class action, compensatory damages, and attorneys’ fees and costs. On September 15, 2014, we, along with Ms. Schneider and Messrs. Davis and Power, filed a motion to dismiss the Consolidated Amended Complaint. On October 15, 2014, the lead plaintiff filed a Memorandum in Opposition to our motion to dismiss. Pursuant to the court's order of September 17, 2014, on December 1, 2014, there was a hearing on our motion to dismiss. On December 17, 2014, the court dismissed the Consolidated Amended Complaint and gave the lead plaintiff 21 days to seek leave to amend. The lead plaintiff filed his Second Consolidated Amended Complaint on January 16, 2015. The Second Consolidated Amended Complaint no longer names Ms. Schneider as a defendant, but otherwise makes substantively similar allegations as the Consolidated Amended Complaint. It alleges that we, along with Messrs. Davis and
30
Power, violated Sections 10(b) and 20(a) of the Exchange Act by making materially false or misleading statements, or failing to disclose material facts regarding certain of our business, operational, and compliance policies, including with regard to certain of our services, our data security program, and our and Mr. Davis’ compliance with the FTC Order. The Second Consolidated Amended Complaint alleges that, as a result, certain public statements made by Messrs. Davis and Power during the Class Period, and certain of our financial statements issued during the Class Period, were false and misleading. The Second Consolidated Amended Complaint seeks certification as a class action, compensatory damages, and attorney’s fees and costs. We, along with Messrs. Davis and Power, filed a motion to dismiss the Second Consolidated Amended Complaint on January 30, 2015. A hearing on our motion to dismiss was held on March 16, 2015. We are waiting for the court to rule on our motion.
On March 20, 2014, Michael D. Peters filed a complaint in United States District Court for the District of Arizona against our company, Kim Jones, and Cristy Schaan. Mr. Jones is not affiliated with us. Ms. Schaan is our Chief Information Security Officer. In his complaint, Mr. Peters alleges that we violated the whistleblower protection provisions of the Sarbanes-Oxley Act and the Dodd-Frank Act by terminating Mr. Peters’ employment as a result of alleged disclosures that he made to us, and that Ms. Schaan defamed Mr. Peters. Mr. Peters seeks from us two times his back pay, two times the value of certain stock options and bonus, moving expenses, damages for emotional harm and anxiety, damages for harm to reputation, litigation costs including attorneys’ fees, and interest, and sought from Ms. Schaan actual damages, punitive damages, and interest. On April 21, 2014, we filed an answer, affirmative defenses, and counterclaims, answering Mr. Peters’ claim under the Sarbanes-Oxley Act and asserting counterclaims against Mr. Peters for fraud, negligent misrepresentation, breach of contract, and unjust enrichment, based on our allegations that we were induced to hire Mr. Peters by his false statements and misrepresentations regarding his employment history and seeking to recover actual and consequential damages, punitive damages, attorneys’ fees, and the signing bonus paid to Mr. Peters. Mr. Peters answered our counterclaims on May 7, 2014. On April 21, 2014, we also filed a motion to dismiss Mr. Peters’ claim under the Dodd-Frank Act. On April 25, 2014, Ms. Schaan filed a motion to dismiss Mr. Peters’ claim against her. On June 2, 2014, Mr. Peters filed a motion for judgment on the pleadings directed to our unjust enrichment counterclaim, one of the four counterclaims we brought against Mr. Peters. The court ruled on all of the pending motions on September 19, 2014. Ms. Schaan’s motion to dismiss the defamation claim against her was granted and she was dismissed from the case. Our motion and the motion filed by Mr. Peters were denied. In addition, Mr. Peters dismissed his claim against Mr. Jones pursuant to a settlement. On October 3, 2014, we filed an amended answer responding to both of the claims Mr. Peters asserted against us. On January 22, 2015, the court entered a scheduling order containing certain deadlines for the case, including the completion of all discovery by October 30, 2015, the filing of any dispositive motions by December 4, 2015, and the filing of certain pre-trial submissions by March 4, 2016. A status hearing is set in the case for August 14, 2015.
On August 1, 2014, the Lemon Entities filed a lawsuit in Santa Clara Superior Court in San Jose, California against Wenceslao Casares, former General Manager of Lemon, Cynthia McAdam, former General Counsel of Lemon, and Federico Murrone, Martin Apesteguia and Fabian Cuesta, each a former employee and former member of the Board of Directors of Lemon Argentina (the Argentine Executives). The complaint alleges breaches of employment-related contracts and breaches of fiduciary duty involving each named individual’s work for third-party Xapo, Inc. and/or Xapo, Ltd. during their employment by the applicable Lemon Entity. Mr. Casares and Ms. McAdam have been served. The Lemon Entities are in the process of serving the Argentine Executives through the procedures set forth in the Hague Convention. Mr. Casares and Ms. McAdam, through their counsel, have demanded that we and Lemon defend them against the claims brought by the Lemon Entities and advance them the costs of their attorneys’ fees. We and Lemon have rejected those demands. The parties, including the Argentine Executives, engaged in mediation in August 2014 in Buenos Aires, Argentina, and again in December 2014 in San Francisco, California but were unable to settle any claims. On January 30, 2015, the Lemon Entities filed a second amended complaint alleging breaches of employment-related contracts, breaches of fiduciary duties and fraud, and seeking declaratory relief against Mr. Casares, Ms. McAdam, and the Argentine Executives. The parties have begun discovery and Mr. Casares and Ms. McAdam are required to respond to the second amended complaint no later than May 1, 2015. Although no counterclaims have been asserted against us or the Lemon Entities to date in connection with this matter, it is possible that they will be asserted in the future.
On September 25, 2012, Denise Richardson filed a complaint against our company and Todd Davis in the United States District Court for the Southern District of Florida. Ms. Richardson claimed that she was improperly classified as an independent contractor instead of an employee and that we breached the terms of an alleged employment agreement. Ms. Richardson claimed she was entitled to equitable relief, compensatory damages, liquidated damages, statutory penalties, punitive damages, interest, costs, and attorneys’ fees. On January 9, 2015, we entered into a full and final settlement agreement with Ms. Richardson and, on January 20, 2015, the case was dismissed with prejudice.
31
Item 1A. Risk Factors
Investing in our common stock involves a high degree of risk. Before deciding to invest in our common stock, you should carefully consider each of the risk factors described in “Part I – Item 1A. Risk Factors” in our 2014 Form 10-K, and all information set forth in this Quarterly Report on Form 10-Q. Those risks and the risks described in this Quarterly Report on Form 10-Q, including in the section entitled “Management’s Discussion and Analysis of Financial Condition and Results of Operations”, could materially harm our business, financial condition, operating results, cash flow, and prospects. If that occurs, the trading price of our common stock could decline, and you may lose all or part of your investment.
There have been no material changes to the Risk Factors under "Part I - Item 1A. Risk Factors" in our 2014 Form 10-K.
Item 2. | Unregistered Sales of Equity Securities and Use of Proceeds |
The following table provides information regarding our repurchases of common stock during the three-months ended March 31, 2015. All of the shares of common stock were surrendered to us to satisfy tax withholding obligations associated with the vesting of restricted stock.
Period | Total Number of Shares Purchased | Average Price Paid Per Share | Total Number of Shares Purchased as Part of Publicly Announced Plans or Programs | Maximum Number (or Approximate Dollar Value) of Shares that May Yet Be Purchased Under the Plans or Programs | |||||||||
January 1, 2015 - January 31, 2015 | — | — | — | — | |||||||||
February 1, 2015 - February 28, 2015 | — | — | — | — | |||||||||
March 1, 2015 - March 31, 2015 | 2,531 | $ | 14.16 | — | — | ||||||||
32
Item 6. | Exhibits. |
Exhibit No. | ||
10.1 | Third Amended and Restated Employment Agreement between LIfeLock, Inc. and Clarissa Cerda, dated February 13, 2015. | |
31.1 | Certification of Chief Executive Officer required by Rule 13a-14(a) or Rule 15d-14(a) of the Securities Exchange Act of 1934, as adopted pursuant to Section 302 of the Sarbanes-Oxley Act of 2002. | |
31.2 | Certification of Chief Financial Officer required by Rule 13a-14(a) or Rule 15d-14(a) of the Securities Exchange Act of 1934, as adopted pursuant to Section 302 of the Sarbanes-Oxley Act of 2002. | |
32.1 | Certifications of Chief Executive Officer and Chief Financial Officer pursuant to 18 U.S.C. 1350, as adopted pursuant to Section 906 of the Sarbanes-Oxley Act of 2002. | |
101.INS | XBRL Instance Document. | |
101.SCH | XBRL Taxonomy Extension Schema Document. | |
101.CAL | XBRL Taxonomy Extension Calculation Linkbase Document. | |
101.DEF | XBRL Taxonomy Extension Definition Linkbase Document. | |
101.LAB | XBRL Taxonomy Extension Label Linkbase Document. | |
101.PRE | XBRL Taxonomy Extension Presentation Linkbase Document. | |
33
SIGNATURES
Pursuant to the requirements of the Securities Exchange Act of 1934, the registrant has duly caused this report to be signed on its behalf by the undersigned thereunto duly authorized.
LIFELOCK, INC. | |||
Date: | April 30, 2015 | By: | /s/ Todd Davis |
Name: | Todd Davis | ||
Title: | Chairman and Chief Executive Officer | ||
(Principal Executive Officer) | |||
Date: | April 30, 2015 | By: | /s/ Chris Power |
Name: | Chris Power | ||
Title: | Chief Financial Officer | ||
(Principal Financial and Accounting Officer) | |||
34