Attached files
| file | filename |
|---|---|
| 8-K - FORM 8-K - QUAKER CHEMICAL CORP | v408812_8k.htm |
| EX-99.1 - EXHIBIT 99.1 - QUAKER CHEMICAL CORP | v408812_ex99-1.htm |
Exhibit 99.2

1 First Quarter 2015 Results Investor Conference Call April 30, 2015 Quaker Chemical Corporation
Regulation G The attached charts include Company information that does not conform to generally accepted accounting principles ( “GAAP”). Management believes that an analysis of this data is meaningful to investors because it provides insight with respect to ongoing operating results of the Company and allows investors to better evaluate the financial results of the Company. These measures should not be viewed as an alternative to GAAP measures of performance. Furthermore, these measures may not be consis tent with similar measures provided by other companies. This data should be read in conjunction with the Company’s first quarter earnings news release dated April 29, 2015, which has been furnished to the SEC on Form 8-K and the Company’s Form 10-Q for the period ended March 31, 2015, which has been filed with the SEC. Forward-Looking Statements This presentation may contain forward-looking statements that are subject to certain risks and uncertainties that could cause actual results to differ material ly from those projected in such statements. A major risk is that the Company’s demand is largely derived from the demand for its customers’ products, which subjects the Company to downturns in a customer’s business and unanticipated customer production shutdowns. Other major risks and uncertainties include, but are not limited to, significant increases in raw material costs, customer financial stability, worldwide economic and political conditions, foreign currency fluctuations, future terrorist attacks and other acts of violence. Other factors could also adversely affect us. Therefore, we caution you not to place undue reliance on our forward-looking statements. This discussion is provided as permitted by the Private Securities Litigation Reform Act of 1995. Risks and Uncertainties Statement

Speakers Chart #1 Michael F. Barry Chairman of the Board, Chief Executive Officer & President Margaret M. Loebl Vice President, Chief Financial Officer & Treasurer Robert T. Traub Vice President, General Counsel & Corporate Secretary
First Quarter 2015 Headlines ▪ Volume gains and gross margin drive good results despite foreign exchange impact ▪ Foreign currency exchange negatively impacts sales by 7% and EPS by $0.08 per share ▪ Strong operating cash flow generation, up $10 million from the prior year period Chart #2
Chairman Comments First Quarter 2015 ▪ First Quarter 2015 x Volume gains largely offset foreign exchange impact to net sales x Lower oil prices and stronger U.S. Dollar changing the dynamics of customers’ markets x Market share gains continue in a challenging global environment x Strong cash flow generation and balance sheet will continue to enable key strategic initiatives and acquisitions ▪ 2015 Outlook x Global end use markets expect to be relatively stable x Continued foreign exchange impacts expected from strong U.S. Dollar x Anticipate growth from increasing market share and leveraging acquisitions “Overall, we remain confident in our future and expect 2015 to be another good year for Quaker with increased earnings for the sixth consecutive year.” -- Michael F. Barry, Chairman, CEO & President Chart #3
1) Increased volumes, including recent acquisitions, offset 7% decline on net sales from foreign currency exchange 2) Changes in foreign exchange rates decrease earnings by $0.08 per share 3) Increased gross margin in the current quarter driven by changes in price and product mix 4) Currency related charge of $2.8 million related to the Company’s Venezuelan affiliate 5) Strong operating cash flow of $8.1 million 6) Continued strength in balance sheet for future acquisitions Chart #4 Chief Financial Officer – Highlights First Quarter 2015
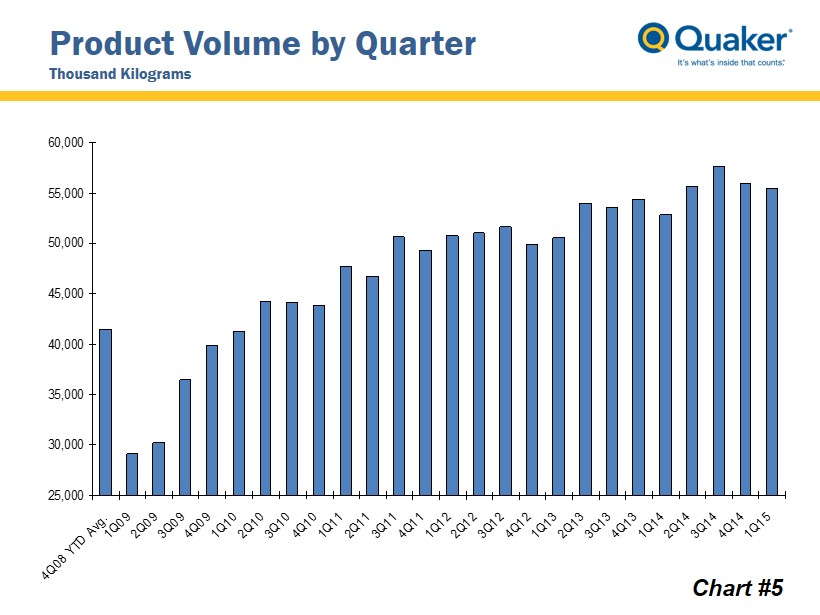
Product Volume by Quarter Thousand Kilograms 25,000 30,000 35,000 40,000 45,000 50,000 55,000 60,000 4Q08 YTD Avg. 1Q092Q093Q094Q091Q102Q103Q104Q101Q112Q113Q114Q111Q122Q123Q124Q121Q132Q133Q134Q131Q142Q143Q144Q141Q15 Chart #5

Financial Snapshot Q1 2015 Q1 2014 Net Sales ($Mils.) 181.3 181.7 Gross Margin (%) 36.6 35.8 Operating Margin (%) 9.9 10.7 Net Income attributable to Quaker Chemical Corporation ($Mils.) 10.4 12.7 Adjusted EBITDA ($Mils.) – Trailing Twelve Months 99.3 92.0 Adjusted EBITDA Margin (%) 13.0 12.5 Earnings Per Diluted Share 0.78 0.96 Non - GAAP Earnings Per Diluted Share 0.94 0.95 Debt ($Mils.) 73.1 18.5 Equity ($Mils.) 365.1 358.0 Net Operating Cash Flow ($Mils.) 8.1 (1.8) Chart #6
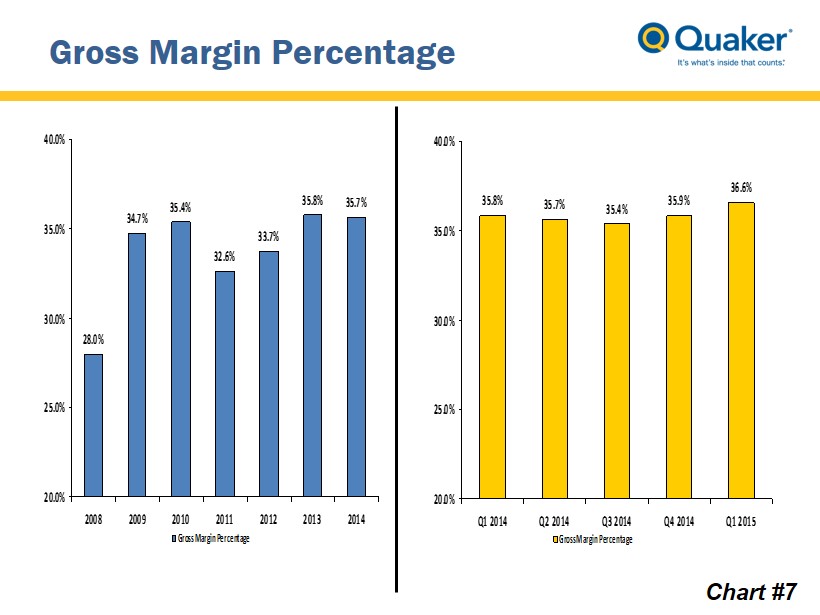
Gross Margin Percentage 28.0% 34.7% 35.4% 32.6% 33.7% 35.8% 35.7% 20.0% 25.0% 30.0% 35.0% 40.0% 2008 2009 2010 2011 2012 2013 2014 Gross Margin Percentage 35.8% 35.7% 35.4% 35.9% 36.6% 20.0% 25.0% 30.0% 35.0% 40.0% Q1 2014 Q2 2014 Q3 2014 Q4 2014 Q1 2015 Gross Margin Percentage Chart #7
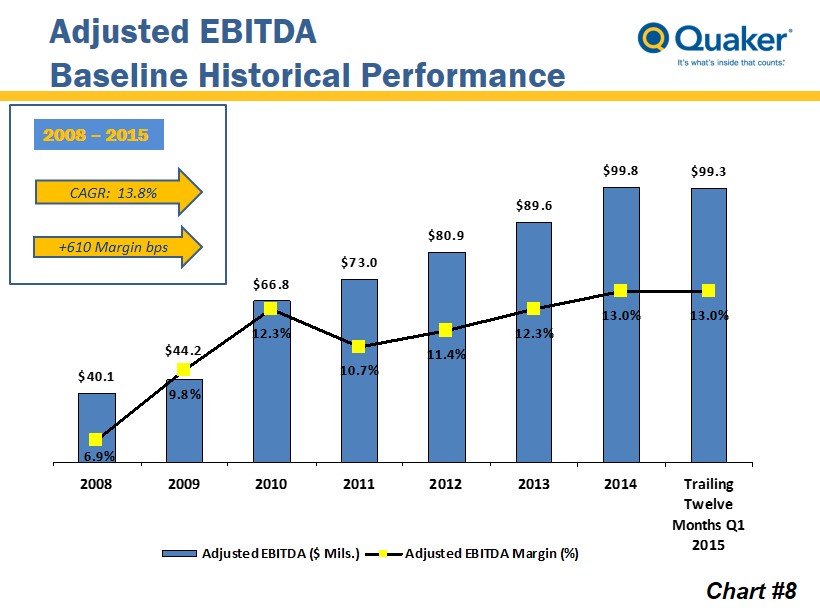
Adjusted EBITDA Baseline Historical Performance $40.1 $66.8 $73.0 $80.9 $89.6 $99.8 $99.3 $44.2 9.8% 12.3% 10.7% 11.4% 12.3% 13.0% 13.0% 6.9% 2008 2009 2010 2011 2012 2013 2014 Trailing Twelve Months Q1 2015 Adjusted EBITDA ($ Mils.) Adjusted EBITDA Margin (%) 2008 – 2015 CAGR: 13.8% +610 Margin bps Chart #8
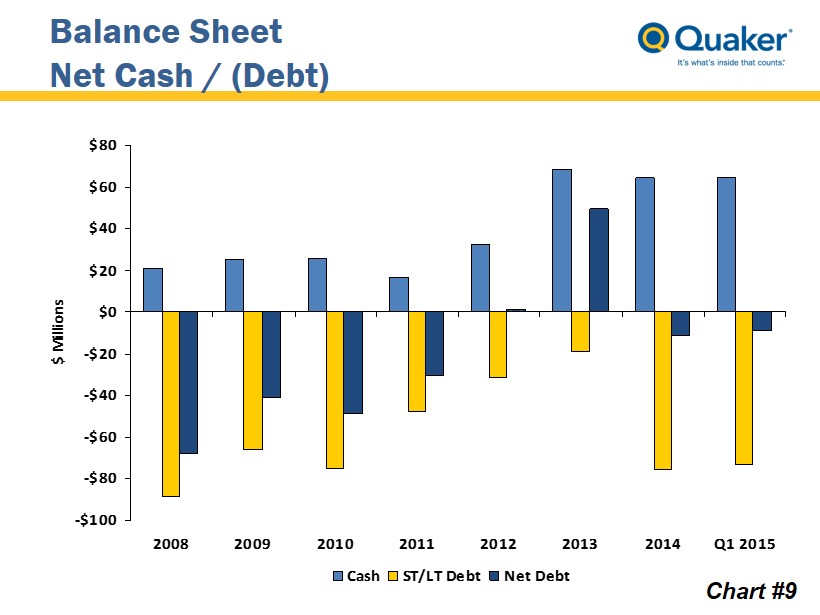
Balance Sheet Net Cash / (Debt) -$100 -$80 -$60 -$40 -$20 $0 $20 $40 $60 $80 2008 2009 2010 2011 2012 2013 2014 Q1 2015 $ Millions Cash ST/LT Debt Net Debt Chart #9

APPENDIX
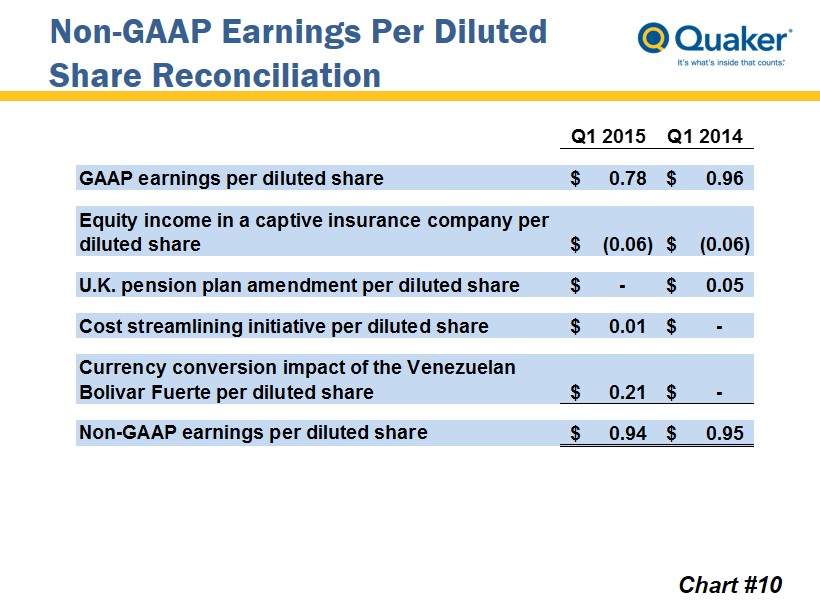
Non - GAAP Earnings Per Diluted Share Reconciliation Chart #10 Q1 2015 Q1 2014 GAAP earnings per diluted share 0.78$ 0.96$ Equity income in a captive insurance company per diluted share (0.06)$ (0.06)$ U.K. pension plan amendment per diluted share -$ 0.05$ Cost streamlining initiative per diluted share 0.01$ -$ Currency conversion impact of the Venezuelan Bolivar Fuerte per diluted share 0.21$ -$ Non-GAAP earnings per diluted share 0.94$ 0.95$
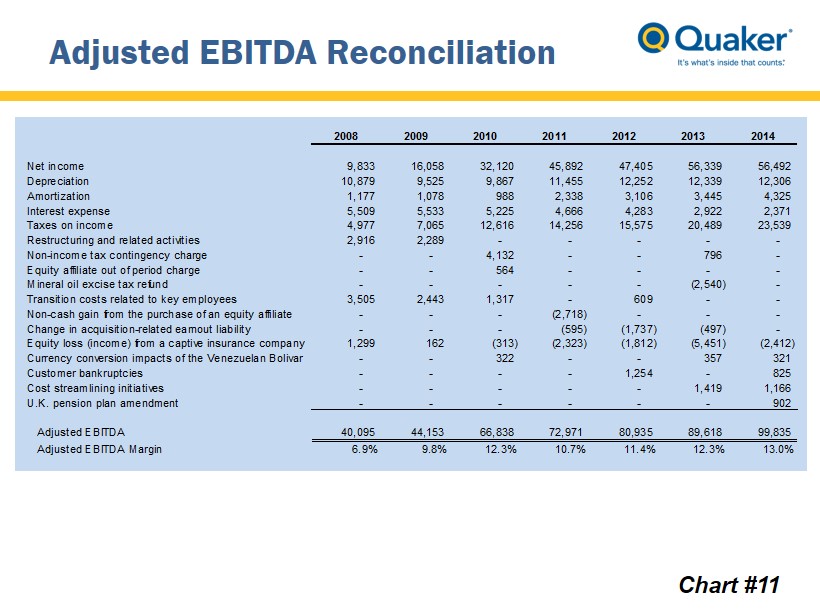
Adjusted EBITDA Reconciliation Chart #11 2008 2009 2010 2011 2012 2013 2014 Net income 9,833 16,058 32,120 45,892 47,405 56,339 56,492 Depreciation 10,879 9,525 9,867 11,455 12,252 12,339 12,306 Amortization 1,177 1,078 988 2,338 3,106 3,445 4,325 Interest expense 5,509 5,533 5,225 4,666 4,283 2,922 2,371 Taxes on income 4,977 7,065 12,616 14,256 15,575 20,489 23,539 Restructuring and related activities 2,916 2,289 - - - - - Non-income tax contingency charge - - 4,132 - - 796 - Equity affiliate out of period charge - - 564 - - - - Mineral oil excise tax refund - - - - - (2,540) - Transition costs related to key employees 3,505 2,443 1,317 - 609 - - Non-cash gain from the purchase of an equity affiliate - - - (2,718) - - - Change in acquisition-related earnout liability - - - (595) (1,737) (497) - Equity loss (income) from a captive insurance company 1,299 162 (313) (2,323) (1,812) (5,451) (2,412) Currency conversion impacts of the Venezuelan Bolivar - - 322 - - 357 321 Customer bankruptcies - - - - 1,254 - 825 Cost streamlining initiatives - - - - - 1,419 1,166 U.K. pension plan amendment - - - - - - 902 Adjusted EBITDA 40,095 44,153 66,838 72,971 80,935 89,618 99,835 Adjusted EBITDA Margin 6.9% 9.8% 12.3% 10.7% 11.4% 12.3% 13.0%
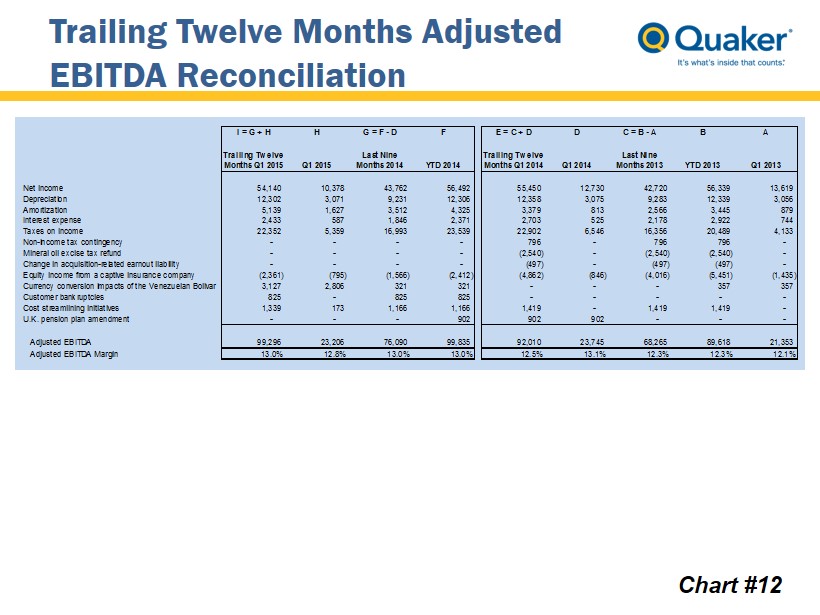
Trailing Twelve Months Adjusted EBITDA Reconciliation Chart #12 I = G + H H G = F - D F E = C + D D C = B - A B A Trailing Twelve Months Q1 2015 Q1 2015 Last Nine Months 2014 YTD 2014 Trailing Twelve Months Q1 2014 Q1 2014 Last Nine Months 2013 YTD 2013 Q1 2013 Net income 54,140 10,378 43,762 56,492 55,450 12,730 42,720 56,339 13,619 Depreciation 12,302 3,071 9,231 12,306 12,358 3,075 9,283 12,339 3,056 Amortization 5,139 1,627 3,512 4,325 3,379 813 2,566 3,445 879 Interest expense 2,433 587 1,846 2,371 2,703 525 2,178 2,922 744 Taxes on income 22,352 5,359 16,993 23,539 22,902 6,546 16,356 20,489 4,133 Non-income tax contingency - - - - 796 - 796 796 - Mineral oil excise tax refund - - - - (2,540) - (2,540) (2,540) - Change in acquisition-related earnout liability - - - - (497) - (497) (497) - Equity income from a captive insurance company (2,361) (795) (1,566) (2,412) (4,862) (846) (4,016) (5,451) (1,435) Currency conversion impacts of the Venezuelan Bolivar 3,127 2,806 321 321 - - - 357 357 Customer bankruptcies 825 - 825 825 - - - - - Cost streamlining initiatives 1,339 173 1,166 1,166 1,419 - 1,419 1,419 - U.K. pension plan amendment - - - 902 902 902 - - - Adjusted EBITDA 99,296 23,206 76,090 99,835 92,010 23,745 68,265 89,618 21,353 Adjusted EBITDA Margin 13.0% 12.8% 13.0% 13.0% 12.5% 13.1% 12.3% 12.3% 12.1%