Attached files
| file | filename |
|---|---|
| EX-99.1 - EXHIBIT 99.1 - US BANCORP \DE\ | d910546dex991.htm |
| 8-K - FORM 8-K - US BANCORP \DE\ | d910546d8k.htm |
 Richard K. Davis
Kathy Rogers
U.S. Bancorp
1Q15 Earnings
Conference Call
U.S. Bancorp
1Q15 Earnings
Conference Call
April 15, 2015
Exhibit 99.2
Chairman, President and CEO
Vice Chairman and CFO |
 Forward-looking Statements and Additional Information
The following information appears in accordance with the Private Securities Litigation Reform
Act of 1995: This presentation contains forward-looking statements about U.S. Bancorp. Statements
that are not historical or current facts, including statements about beliefs and
expectations, are forward-looking statements and are based on the information available to, and assumptions and
estimates made by, management as of the date made. These forward-looking statements
cover, among other things, anticipated future revenue and expenses and the future
plans and prospects of U.S. Bancorp. Forward-looking statements involve inherent risks and
uncertainties, and important factors could cause actual results to differ materially from
those anticipated. A reversal or slowing of the current economic recovery or
another severe contraction could adversely affect U.S. Bancorp’s revenues and the values of its assets and liabilities.
Global financial markets could experience a recurrence of significant turbulence, which could
reduce the availability of funding to certain financial institutions and lead to a
tightening of credit, a reduction of business activity, and increased market volatility. Stress in the commercial
real estate markets, as well as a downturn in the residential real estate markets, could cause
credit losses and deterioration in asset values. In addition, U.S. Bancorp’s
business and financial performance is likely to be negatively impacted by recently enacted and future legislation and
regulation. U.S. Bancorp’s results could also be adversely affected by
deterioration in general business and economic conditions; changes in interest rates;
deterioration in the credit quality of its loan portfolios or in the value of the collateral securing those loans; deterioration in the
value of securities held in its investment securities portfolio; legal and regulatory
developments; litigation; increased competition from both banks and non-banks;
changes in customer behavior and preferences; breaches in data security; effects of mergers and acquisitions and related
integration; effects of critical accounting policies and judgments; and management’s
ability to effectively manage credit risk, residual value risk, market risk,
operational risk, compliance risk, strategic risk, interest rate risk, liquidity risk and reputational risk.
For discussion of these and other risks that may cause actual results to differ from
expectations, refer to U.S. Bancorp’s Annual Report on
Form 10-K for the year ended December 31, 2014, on file with the Securities and Exchange
Commission, including the sections entitled “Risk Factors” and
“Corporate Risk Profile” contained in Exhibit 13, and all subsequent filings with the Securities and Exchange Commission under
Sections 13(a), 13(c), 14 or 15(d) of the Securities Exchange Act of 1934. Forward-looking
statements speak only as of the date they are made, and U.S. Bancorp undertakes no
obligation to update them in light of new information or future events. This presentation includes non-GAAP financial measures to describe U.S. Bancorp’s
performance. The calculations of these measures are provided within or in the
appendix of the presentation. These disclosures should not be viewed as a substitute for operating results determined
in accordance with GAAP, nor are they necessarily comparable to non-GAAP performance
measures that may be presented by other companies. |
 1Q15 Earnings
Conference Call
1Q15 Highlights
Net income of $1.4 billion; $0.76 per diluted common share
Average loan growth of 5.1% vs. 1Q14 and 0.6% vs. 4Q14 (0.8% excluding the
reclassification of certain municipal loans to securities)
Average deposit growth of 8.1% vs. 1Q14 (6.4% excluding Charter One
acquisition) and 1.1% vs. 4Q14
Net charge-offs declined 18.2% vs. 1Q14 and 9.4% vs 4Q14
Nonperforming assets declined 15.2% vs. 1Q14 and 6.2% vs 4Q14
Capital generation continues to reinforce capital position
•
Common equity tier 1 capital ratio of 9.2% estimated for the Basel III fully
implemented standardized approach
Returned 70% of earnings to shareholders in 1Q15
•
Repurchased 12 million shares of common stock during the quarter
3 |
 1Q15 Earnings
Conference Call
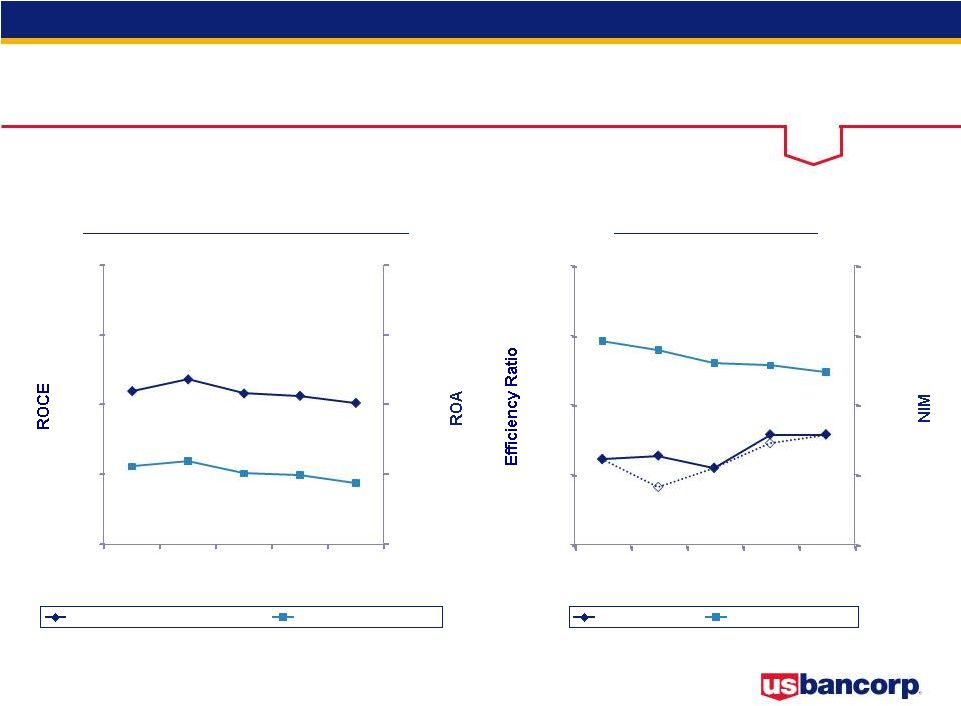
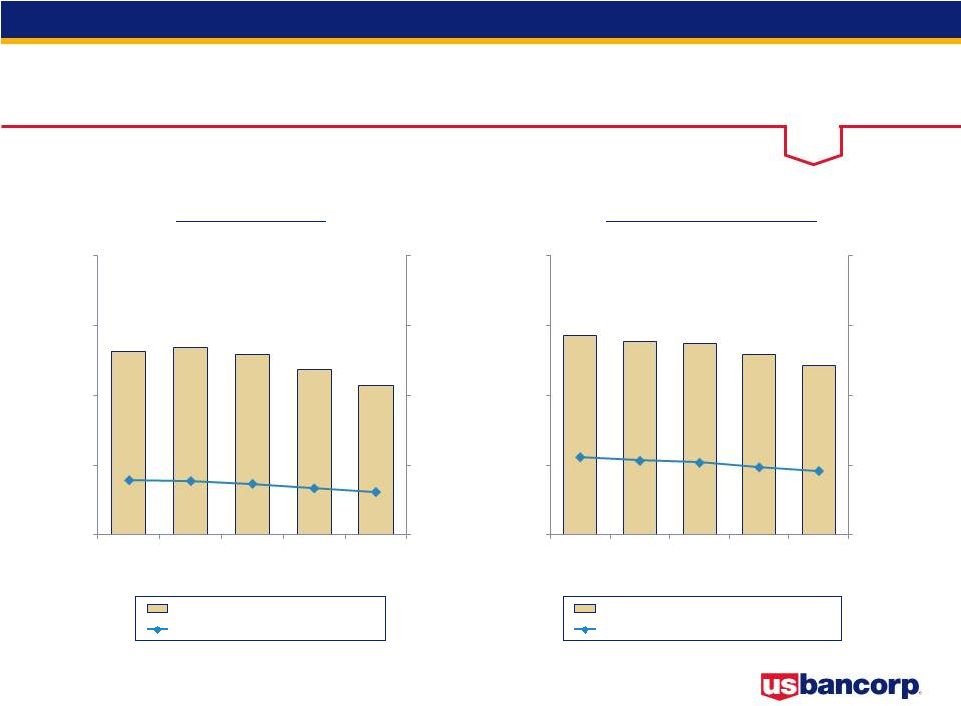
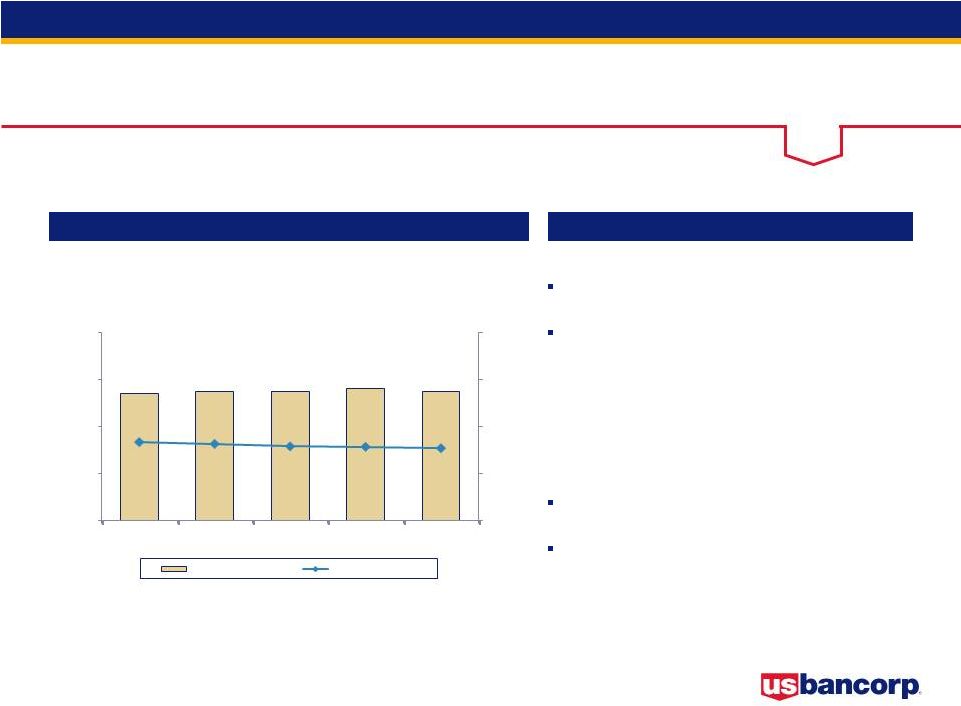
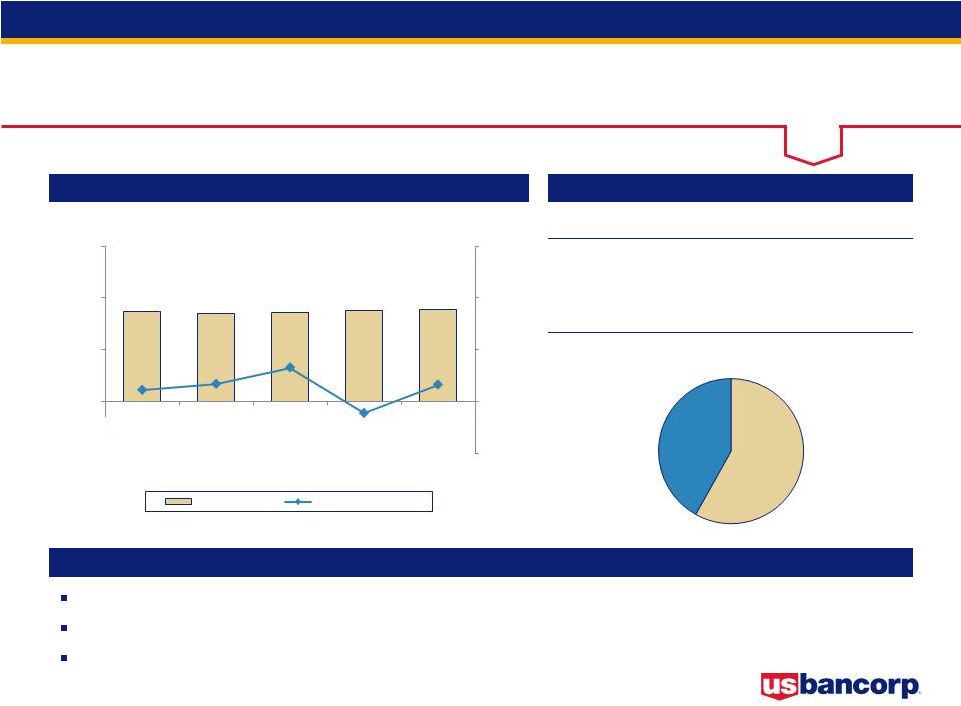
Performance Ratios
Return on Average Common Equity
and Return on Average Assets
Efficiency Ratio and
Net Interest Margin
Return on Avg Common Equity
Return on Avg Assets
Efficiency Ratio
Net Interest Margin
* Excluding $214 million gain on Visa Inc. Class B common stock sale and $200
million FHA DOJ settlement ** Excluding $124 million gain related to an
equity interest in Nuveen and $88 million expense for charitable contributions and legal accruals
Efficiency ratio computed as noninterest expense divided by the sum of net interest
income on a taxable-equivalent basis and noninterest income excluding
securities gains (losses) net 14.6%
15.1%
14.5%
14.4%
14.1%
1.56%
1.60%
1.51%
1.50%
1.44%
1.0%
1.5%
2.0%
2.5%
3.0%
8%
11%
14%
17%
20%
1Q14
2Q14
3Q14
4Q14
1Q15
52.9%
53.1%
52.4%
54.3%
53.8%**
51.3%*
3.35%
3.27%
3.16%
3.14%
3.08%
1.6%
2.2%
2.8%
3.4%
4.0%
48%
52%
56%
60%
64%
1Q14
2Q14
3Q14
4Q14
1Q15
54.3%
4 |
 1Q15 Earnings
Conference Call
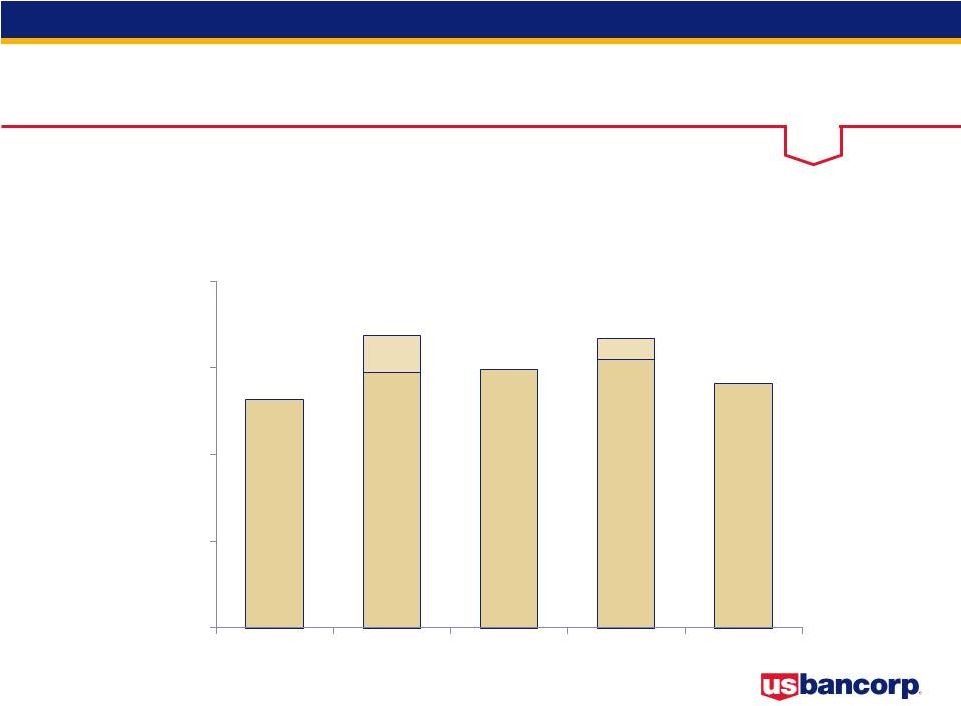
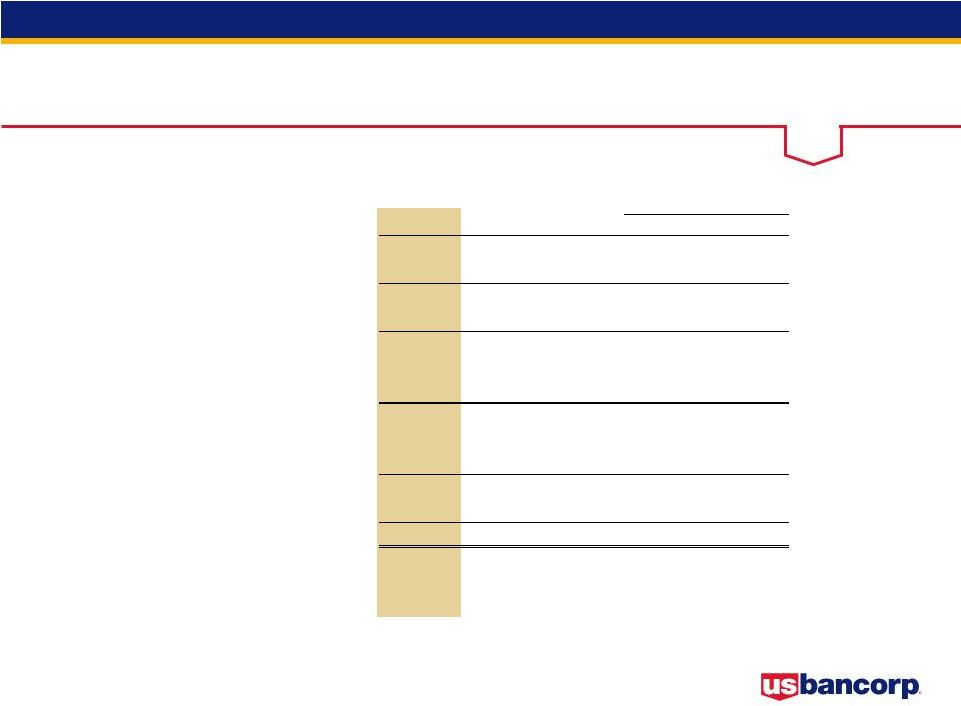
* Gain on Visa Inc. Class B common stock sale
** Gain related to an equity interest in Nuveen
Taxable-equivalent basis
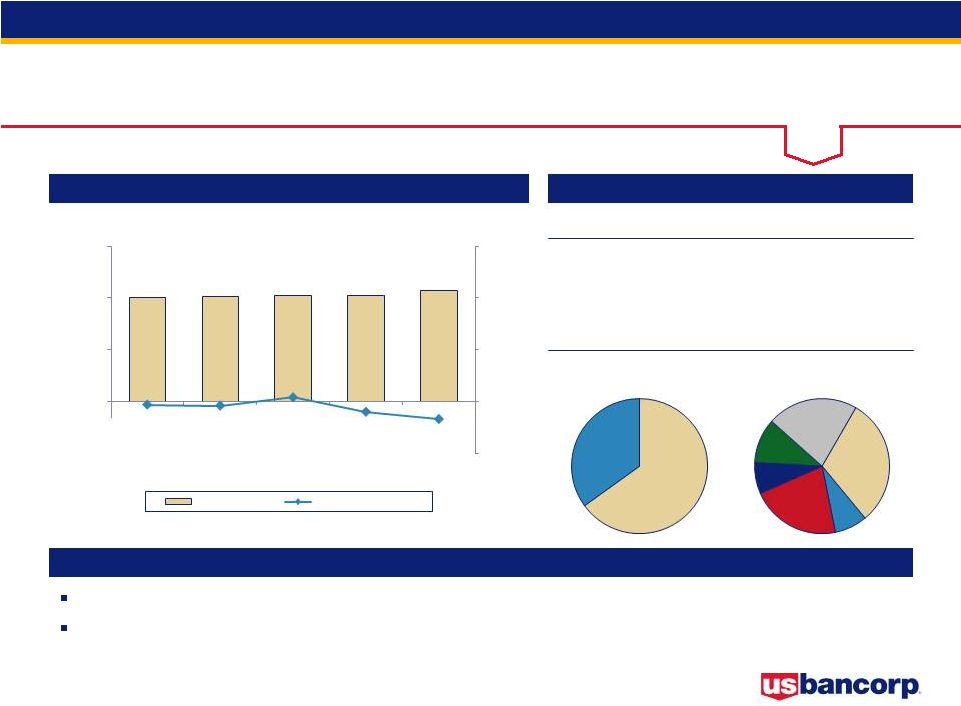
Revenue Growth
Year-Over-Year Change
(1.2%)
4.9%
2.0%
5.7%
1.9%
$ in millions
$4,906
$4,814
$4,990
$5,188
$214*
$124**
3,500
4,000
4,500
5,000
5,500
1Q14
2Q14
3Q14
4Q14
1Q15
$5,169
5 |
 1Q15 Earnings
Conference Call
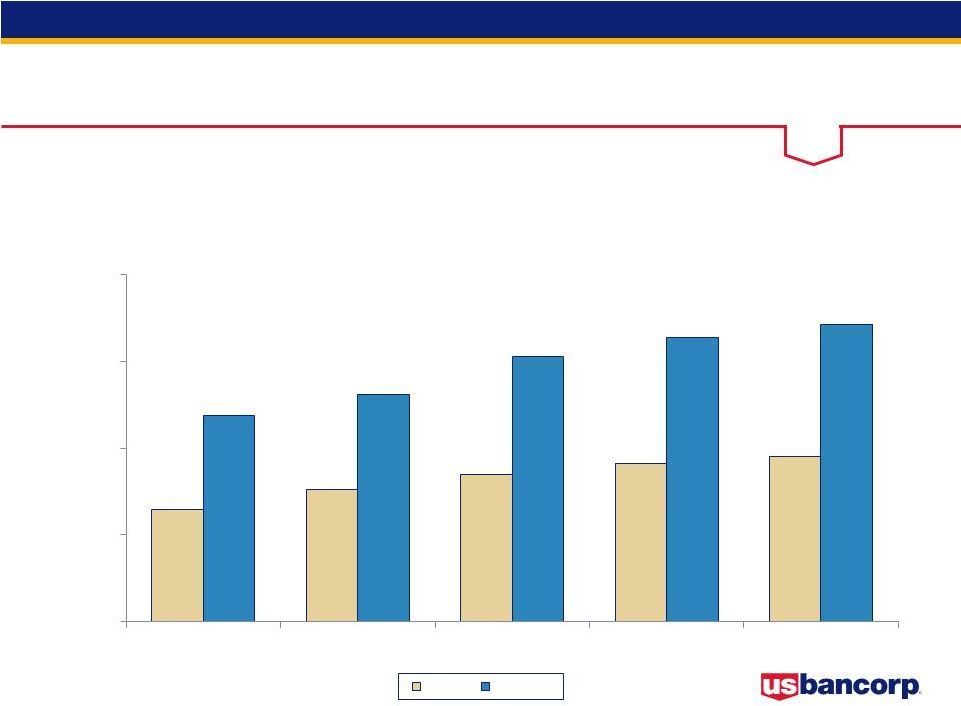
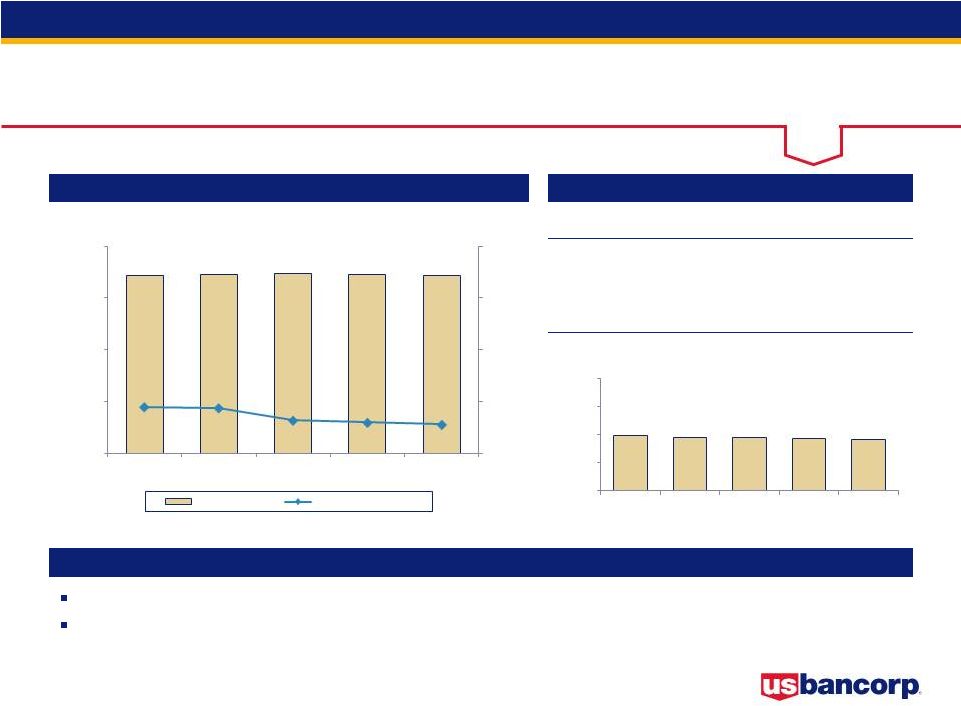
Loan and Deposit Growth
Year-Over-Year Growth
Average Balances
$ in billions
5.9%
$246.4
5.1%
$248.0
6.0%
$235.9
6.8%
$240.5
6.3%
$243.9
7.2%
$275.5
8.1%
$278.5
5.1%
$257.5
6.0%
$262.4
7.4%
$271.0
210.0
230.0
250.0
270.0
290.0
1Q14
2Q14
3Q14
4Q14
1Q15
Loans
Deposits
6 |
 1Q15 Earnings
Conference Call
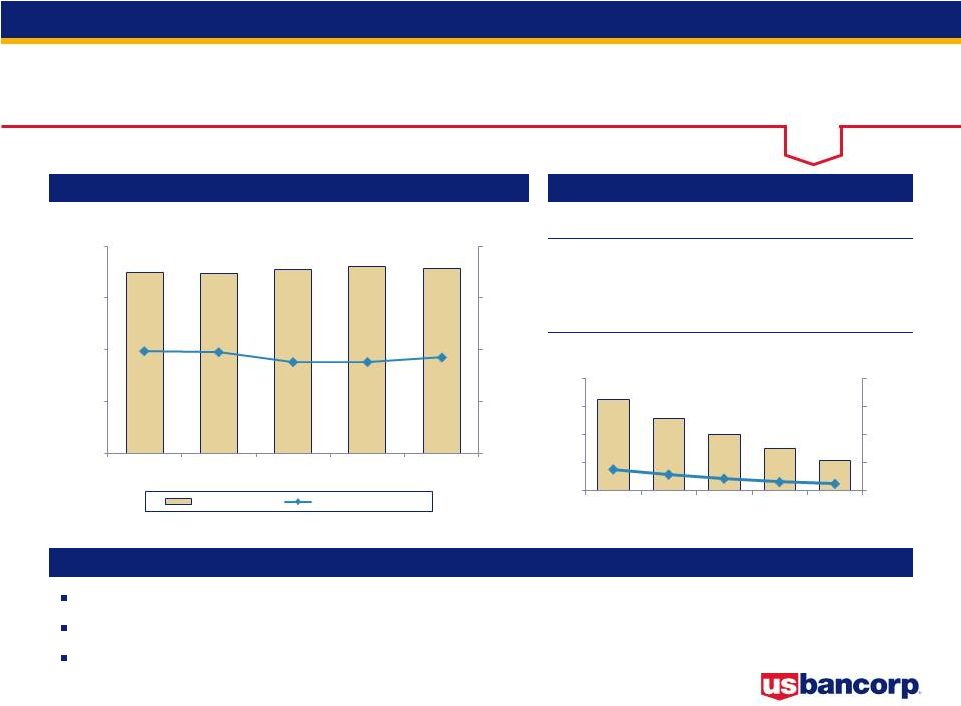
Credit Quality
Net Charge-offs
Nonperforming Assets
$ in millions
Net Charge-offs (Left Scale)
NCOs to Avg Loans (Right Scale)
Nonperforming Assets (Left Scale)
NPAs to Loans plus ORE (Right Scale)
$341
$349
$336
$308
$279
0.59%
0.58%
0.55%
0.50%
0.46%
0.00%
0.75%
1.50%
2.25%
3.00%
0
130
260
390
520
1Q14
2Q14
3Q14
4Q14
1Q15
$1,999
$1,943
$1,923
$1,808
$1,696
0.84%
0.80%
0.78%
0.73%
0.69%
0.00%
0.75%
1.50%
2.25%
3.00%
0
700
1,400
2,100
2,800
1Q14
2Q14
3Q14
4Q14
1Q15
7 |
 1Q15 Earnings
Conference Call
Earnings Summary
$ and shares in millions, except per-share data
Taxable-equivalent basis
1Q15
4Q14
1Q14
vs 4Q14
vs 1Q14
Net Interest Income
2,752
$
2,799
$
2,706
$
(1.7)
1.7
Noninterest Income
2,154
2,370
2,108
(9.1)
2.2
Net Revenue
4,906
5,169
4,814
(5.1)
1.9
Noninterest Expense
2,665
2,804
2,544
5.0
(4.8)
Operating Income
2,241
2,365
2,270
(5.2)
(1.3)
Net Charge-offs
279
308
341
9.4
18.2
Excess Provision
(15)
(20)
(35)
(25.0)
(57.1)
Income before Taxes
1,977
2,077
1,964
(4.8)
0.7
Applicable Income Taxes
533
576
552
7.5
3.4
Noncontrolling Interests
(13)
(13)
(15)
-
13.3
Net Income
1,431
1,488
1,397
(3.8)
2.4
Preferred Dividends/Other
66
68
66
2.9
-
NI to Common
1,365
$
1,420
$
1,331
$
(3.9)
2.6
Diluted EPS
0.76
$
0.79
$
0.73
$
(3.8)
4.1
Average Diluted Shares
1,789
1,796
1,828
0.4
2.1
% B/(W)
8 |
 1Q15 Earnings
Conference Call
1Q15 Results -
Key Drivers
vs. 1Q14
Net Revenue increase of 1.9%
•
Net interest income increase of 1.7%; net interest margin of 3.08% vs. 3.35% in
1Q14 •
Noninterest income increase of 2.2%
Noninterest expense increase of 4.8%
Provision for credit losses declined by $42 million
•
Net charge-offs lower by $62 million, or 18.2%
•
Provision lower than NCOs by $15 million vs. $35 million in 1Q14
vs. 4Q14
Net Revenue decrease of 5.1% (2.8% decrease excluding notable item in 4Q14)
•
Net interest income decrease of 1.7%; net interest margin
of 3.08% vs. 3.14% in 4Q14
•
Noninterest income decrease of 9.1% (4.1% decrease
excluding notable item in 4Q14)
Noninterest expense decrease of 5.0% (1.9% decrease
excluding notable items in 4Q14)
Provision for credit losses lower by $24 million
•
Net charge-offs decreased by $29 million, or 9.4%
•
Provision lower than NCOs by $15 million vs. $20 million in 4Q14
9 |
 10
1Q15 Earnings
Conference Call
Capital Position
$ in billions
RWA = risk-weighted assets
1Q15
4Q14
3Q14
2Q14
1Q14
Total U.S. Bancorp shareholders' equity
44.3
$
43.5
$
43.1
$
42.7
$
42.1
$
Standardized Approach
Basel III transitional standardized approach
Common equity tier 1 capital
31.3
30.9
30.2
29.8
29.5
Tier 1 capital
36.4
36.0
35.4
34.9
34.6
Total risk-based capital
43.6
43.2
42.5
41.0
40.7
Common equity tier 1 capital ratio
9.6%
9.7%
9.7%
9.6%
9.7%
Tier 1 capital ratio
11.1%
11.3%
11.3%
11.3%
11.4%
Total risk-based capital ratio
13.3%
13.6%
13.6%
13.2%
13.5%
Leverage ratio
9.3%
9.3%
9.4%
9.6%
9.7%
Common equity tier 1 capital to RWA estimated for the
Basel III fully implemented standardized approach
9.2%
9.0%
9.0%
8.9%
9.0%
Advanced Approaches
Common equity tier 1 capital to RWA for the Basel III
transitional advanced approaches
12.3%
12.4%
12.4%
12.3%
Common equity tier 1 capital to RWA estimated for the
Basel III fully implemented advanced approaches
11.8%
11.8%
11.8%
11.7%
Tangible common equity ratio
7.6%
7.5%
7.6%
7.5%
7.8%
Tangible common equity as a % of RWA
9.3%
9.3%
9.3%
9.2%
9.3%
10 |
 11
1Q15 Earnings
Conference Call
Capital Actions
Reinvest and
Acquisitions
Dividends
Share
Repurchases
20 -
40%
Targets:
30 -
40%
30 -
40%
30%
1Q15
Actual:
38%
32%
Earnings Distribution
Share repurchase authorization and expected dividend increase announced
March 11
•
Expect to increase annual dividend from $0.98 to $1.02, a 4.1% increase, effective
2Q15 •
Five-quarter authorization to repurchase up to $3.022 billion of outstanding
common stock effective April 1, 2015
Returned 70% of earnings to shareholders during 1Q15
th |
 12
1Q15 Earnings
Conference Call |
 1Q15 Earnings
Conference Call
Appendix
13 |
 1Q15 Earnings
Conference Call
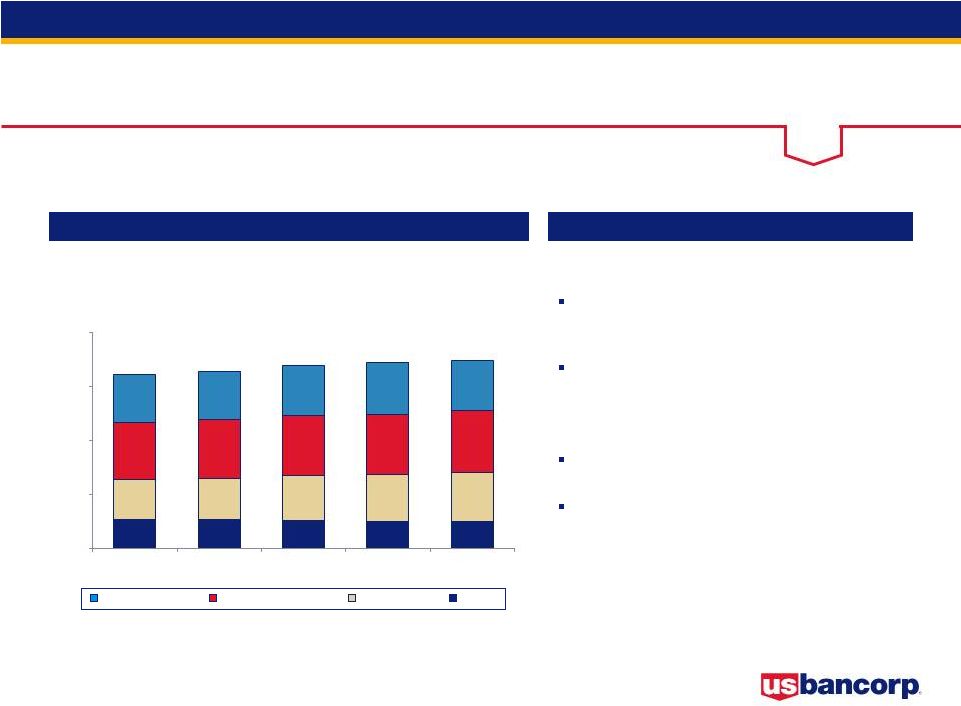
Average Loans
Key Points
$ in billions
vs. 1Q14
Average total loans grew by $12.1 billion, or
5.1% (4.8% excluding Charter One acquisition)
Average total commercial loans increased
$10.7 billion, or 15.1%; average commercial
real estate loans increased $2.6 billion, or 6.5%
vs. 4Q14
Average total loans grew by $1.6 billion, or
0.6% (0.8% increase excluding reclassification
of certain municipal loans to securities at the
end of 4Q14)
Average total commercial loans increased $1.9
billion, or 2.4%; average commercial real estate
loans increased $1.7 billion, or 4.2%
Year-Over-Year Growth
6.0%
6.8%
6.3%
5.9%
5.1%
Covered
Commercial
CRE
Res Mtg
Retail
Credit Card
Average Loans
8.5%
12.4%
13.6%
15.5%
15.1%
7.6%
6.9%
6.1%
4.2%
6.5%
14.4%
10.5%
5.8%
2.2%
(0.3%)
5.3%
5.9%
4.9%
3.6%
2.4%
0
70
140
280
1Q14
2Q14
3Q14
4Q14
1Q15
0.9%
2.3%
3.6%
3.6%
3.5%
210
14
$235.9
$240.5
$243.9
$246.4
$248.0 |
 1Q15 Earnings
Conference Call
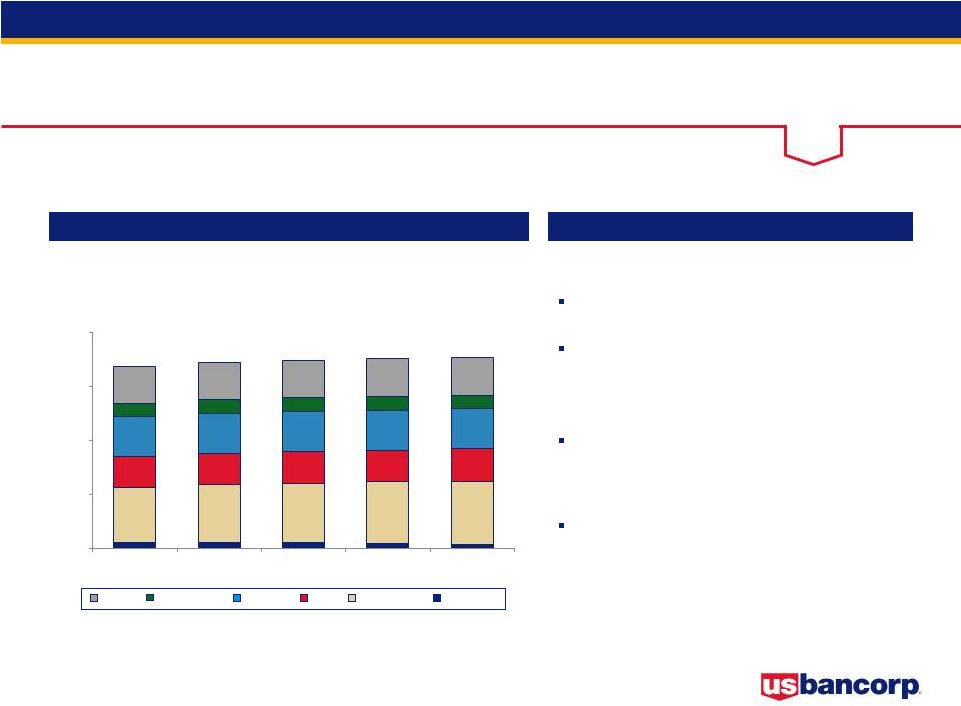
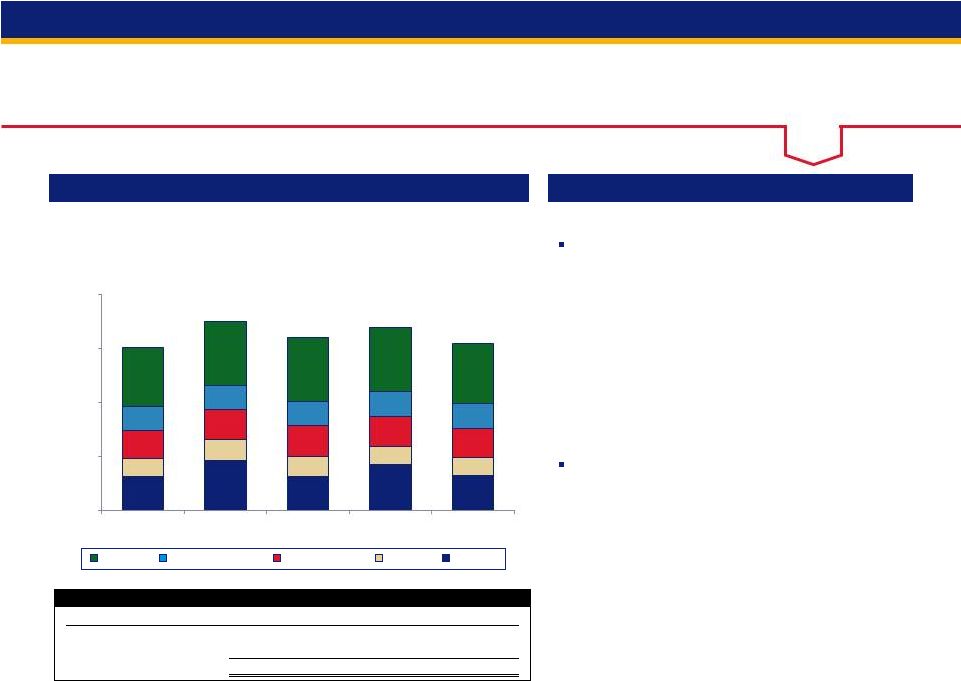
Average Deposits
Average Deposits
Key Points
$ in billions
vs. 1Q14
Average total deposits increased by $21.0
billion, or 8.1% (6.4% excluding Charter One
acquisition)
Average low-cost deposits (NIB, interest
checking, money market and savings)
increased by $24.5 billion, or 11.4%
vs. 4Q14
Average total deposits increased by $3.0
billion, or 1.1%
Average low-cost deposits increased by $4.1
billion, or 1.7%
Year-Over-Year Growth
5.1%
6.0%
7.4%
7.2%
8.1%
Time
Money Market
Checking and Savings
Noninterest-bearing
$257.5
$262.4
$271.0
$275.5
$278.5
(6.1%)
(5.9%)
(13.1%)
(4.9%)
(8.2%)
11.6%
10.8%
18.3%
19.7%
24.7%
5.9%
8.3%
10.9%
8.3%
7.3%
6.7%
7.4%
8.6%
3.3%
5.2.%
0
80
160
240
320
1Q14
2Q14
3Q14
4Q14
1Q15
15 |
 1Q15 Earnings
Conference Call
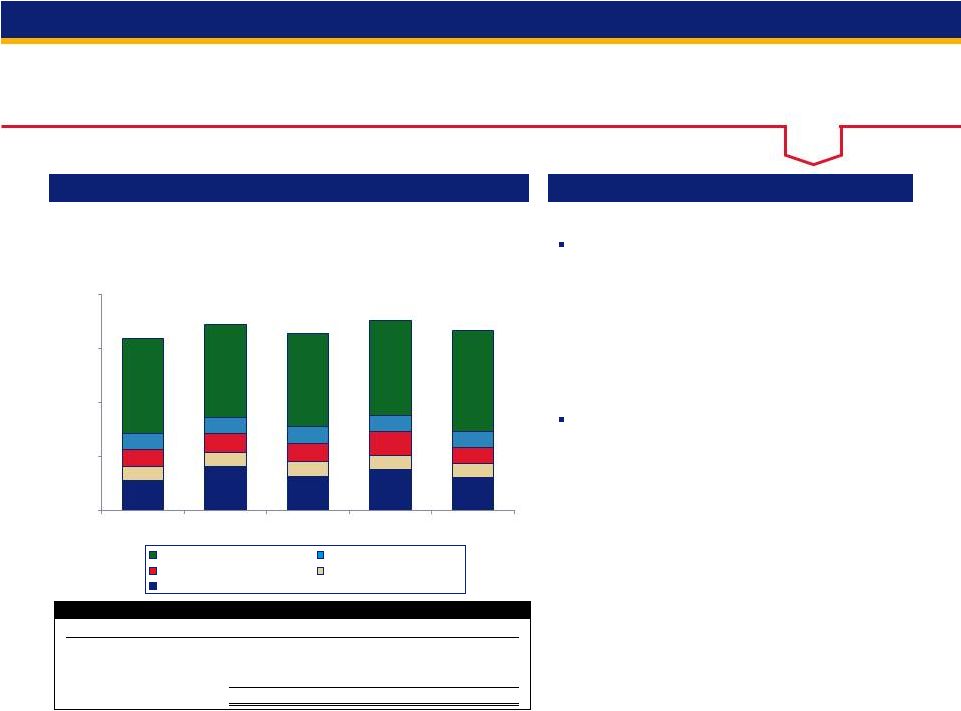
Net Interest Income
Net Interest Income
Key Points
$ in millions
Taxable-equivalent basis
vs. 1Q14
Average earning assets grew by $34.6 billion,
or 10.6%
Net interest margin lower by 27 bps (3.08% vs. 3.35%)
driven by:
•
growth in the investment portfolio at lower average rates, as
well as lower reinvestment rates on investment securities,
lower loan fees due to the CAA product wind down, lower
rates on new loans and a change in loan portfolio mix
•
Partially offset by lower funding costs
vs. 4Q14
Average earning assets grew by $5.9 billion,
or 1.7%
Net interest margin lower by 6 bps (3.08% vs. 3.14%)
driven by:
•
Growth in lower rate investment securities and lower
reinvestment rates, lower interest recoveries, lower rates on
new loans and a change in loan portfolio mix, along with the
impact of higher cash balances at the Federal Reserve as a
result of continued deposit growth
Year-Over-Year Change
(0.1%)
2.7%
1.3%
2.4%
1.7%
$2,706
$2,744
$2,748
$2,799
$2,752
3.35%
3.27%
3.16%
3.14%
3.08%
0.0%
2.0%
4.0%
6.0%
8.0%
0
1,000
2,000
3,000
4,000
1Q14
2Q14
3Q14
4Q14
1Q15
Net Interest Income
Net Interest Margin
16 |
 1Q15 Earnings
Conference Call
Noninterest Income
Noninterest Income
Key Points
$ in millions
Payments = credit and debit card revenue, corporate payment products revenue and
merchant processing; Service charges = deposit service charges,
treasury management fees and ATM processing services vs. 1Q14
Noninterest income increased by $46 million, or
2.2%, driven by:
•
Higher trust and investment management fees (5.9% increase)
due to account growth and improved market conditions
•
Higher other income due primarily to equity investment gains
•
Mortgage revenue increase of $4 million
•
Partially offset by lower commercial products revenue (2.4%
decrease) due to lower wholesale transaction activity and lower
commercial leasing revenue, partially offset by increased bond
underwriting fees
vs. 4Q14
Noninterest income decreased by $216 million, or
9.1%, driven by:
•
Lower credit and debit card revenue (11.4% decrease) primarily
due to seasonally lower sales volume and fewer days
•
Lower merchant processing revenue (6.5% decrease) due to
seasonally lower product fees and fewer days
•
Lower deposit service charges (10.6% decrease) due to fewer
days and seasonally lower volumes
•
Lower commercial products revenue (8.7% decrease) due to
lower wholesale transaction activity partially offset by increased
bond underwriting fees
•
Lower other income due primarily to 4Q Nuveen gain
•
Partially offset by mortgage revenue increase of $5 million
Year-Over-Year Change
(2.6%)
7.4%
3.0%
9.9%
2.2%
$2,108
$2,444
$2,242
$2,370
All Other
Mortgage
Service Charges
Trust and Inv Mgmt
Payments
1Q14
2Q14
3Q14
4Q14
1Q15
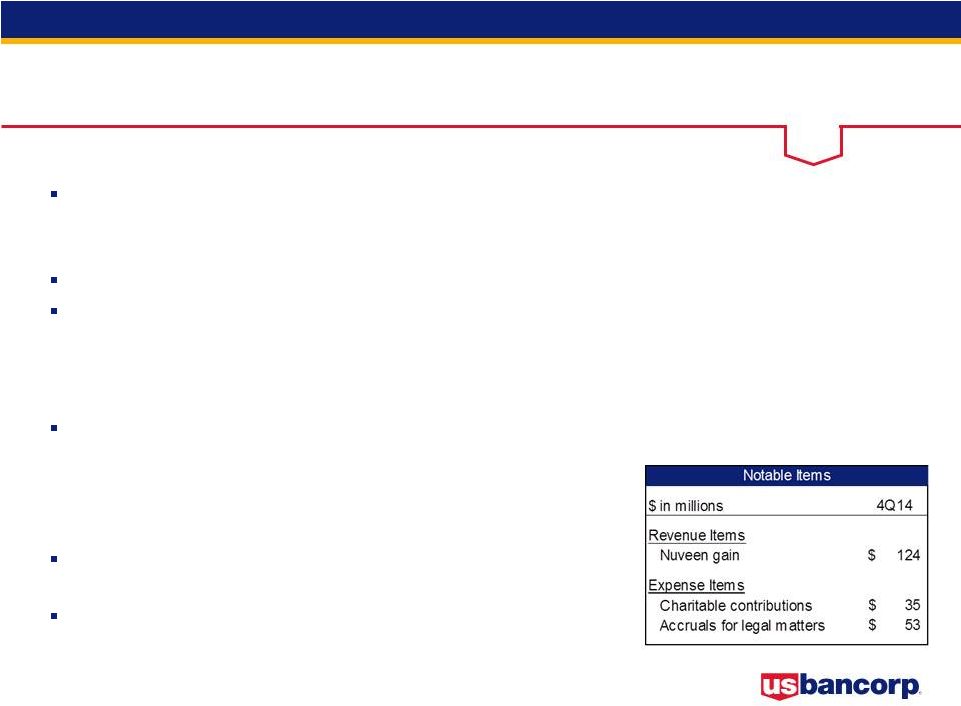
Nuveen Gain
-
$
-
$
-
$
124
$
-
$
Visa Gain
-
214
-
-
-
Total
-
$
214
$
-
$
124
$
-
$
Notable Noninterest Income Items
0
700
1,400
2,100
2,800
1Q14
2Q14
3Q14
4Q14
1Q15
$2,154
3.2%
1.7%
2.2%
5.9%
0.3%
17 |
 1Q15 Earnings
Conference Call
Noninterest Expense
Noninterest Expense
Key Points
$ in millions
vs. 1Q14
Noninterest expense was higher by $121 million,
or 4.8%, driven by:
•
Higher compensation expense (5.7% increase) reflecting the
impact of merit increases, acquisitions, and higher staffing for
risk and compliance activities, and higher employee benefits
expense (9.7% increase) due to higher pension costs
•
Higher other expense (12.4% increase) primarily due to higher
mortgage servicing-related expenses
vs. 4Q14
Noninterest expense was lower by $139 million, or
5.0%, driven by:
•
Lower marketing and business development expense (45.7%
decrease) due to the fourth quarter 2014 charitable
contributions and lower advertising costs
•
Lower professional services expense (41.7% decrease) due to
seasonally lower costs
•
Lower other expense due to seasonally lower costs related to
investments in tax-advantaged projects and the impact of the
fourth quarter 2014 legal accruals, partially offset by increased
mortgage servicing-related expenses
•
Partially offset by higher employee benefit expense (29.4%
increase) due to increased pension costs and seasonally
higher payroll taxes and higher compensation expense (2.4%
increase) reflecting the seasonal impact of stock based
compensation grants and commissions related to mortgage
production
Year-Over-Year Change
3.0%
7.7%
1.9%
4.5%
4.8%
$2,544
$2,753
$2,614
$2,804
$2,665
All Other
Tech and Communications
Prof Svcs, Marketing and PPS
Occupancy and Equipment
Compensation and Benefits
1Q14
2Q14
3Q14
4Q14
1Q15
Charitable contributions
-
$
-
$
-
$
35
$
-
$
Accruals for legal matters
-
-
-
53
-
FHA DOJ settlement
-
200
-
-
-
Total
-
$
200
$
-
$
88
$
-
$
Notable Noninterest Expense Items
9.6%
1.4%
(0.8%)
6.6%
0
800
1,600
2,400
3,200
1Q14
2Q14
3Q14
4Q14
1Q15
(5.8%)
18 |
 19
1Q15 Earnings
Conference Call
Credit Quality
-
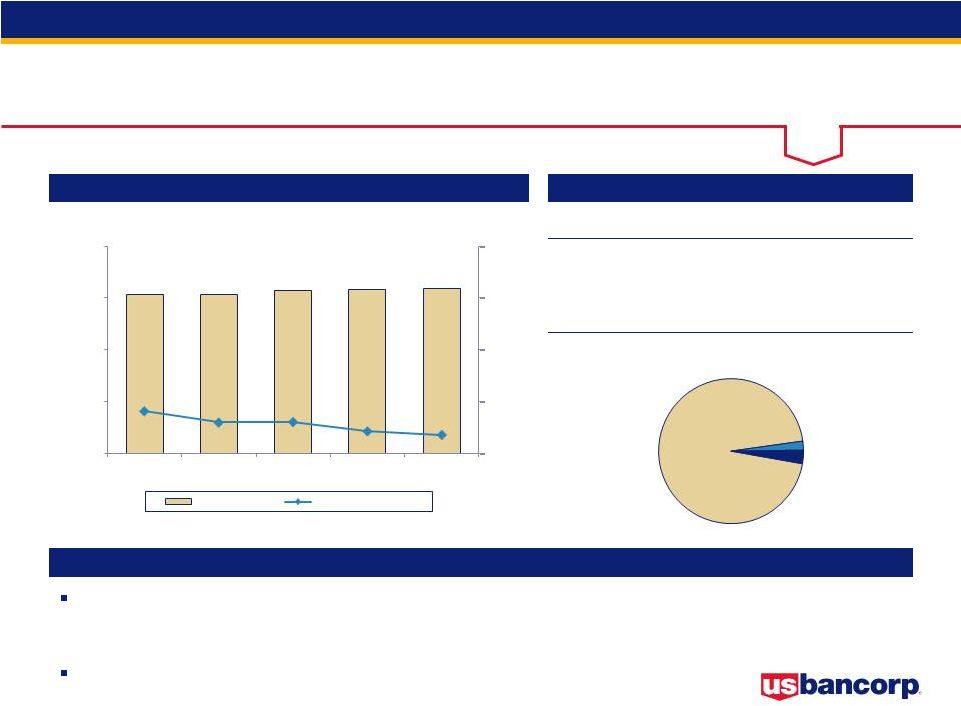
Commercial Loans
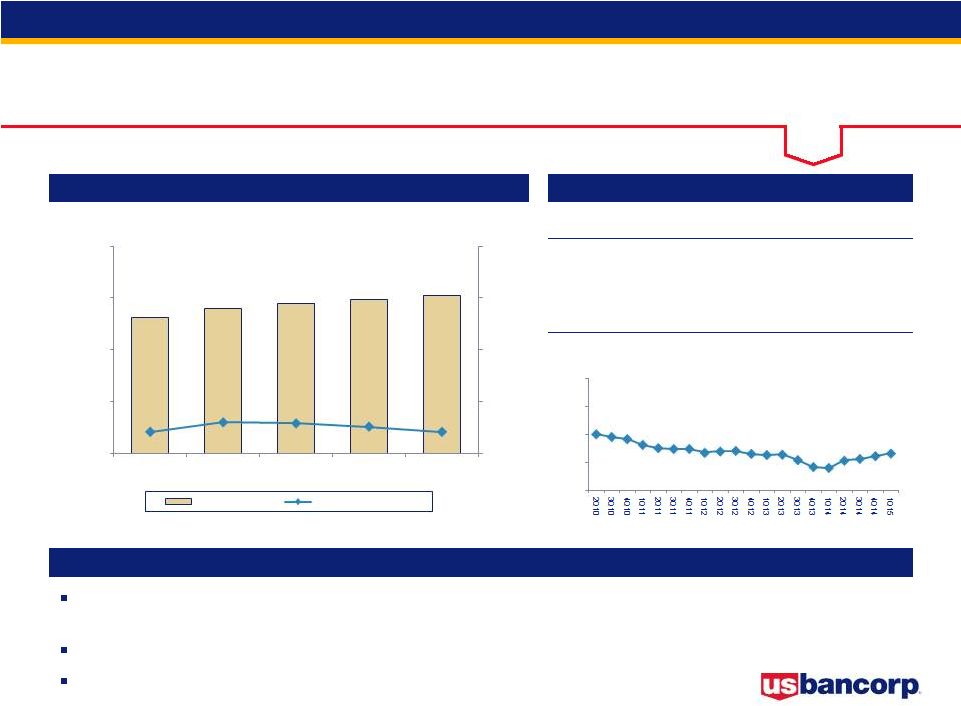
Average Loans and Net Charge-offs Ratios
Key Statistics
Key Points
Continued new client growth led to 2.5% linked quarter loan growth and 16.1%
year-over-year growth; utilization rates improved modestly
Net charge-offs declined on a linked quarter basis and the NCO ratio was flat
year-over-year Nonperforming loans and delinquencies continued at
historically low levels 1Q14
4Q14
1Q15
Average Loans
$65,645
$74,333
$76,183
30-89 Delinquencies
0.25%
0.27%
0.19%
90+ Delinquencies
0.07%
0.05%
0.06%
Nonperforming Loans
0.25%
0.13%
0.10%
$ in millions
$65,645
$69,920
$72,190
$74,333
$76,183
0.21%
0.30%
0.29%
0.26%
0.21
0.0%
0.5%
1.0%
1.5%
2.0%
0
25,000
50,000
75,000
100,000
1Q14
2Q14
3Q14
4Q14
1Q15
Average Loans
Net Charge
-offs Ratio
20%
24%
28%
32%
36%
Revolving Line Utilization Trend |
 20
1Q15 Earnings
Conference Call
Credit Quality
-
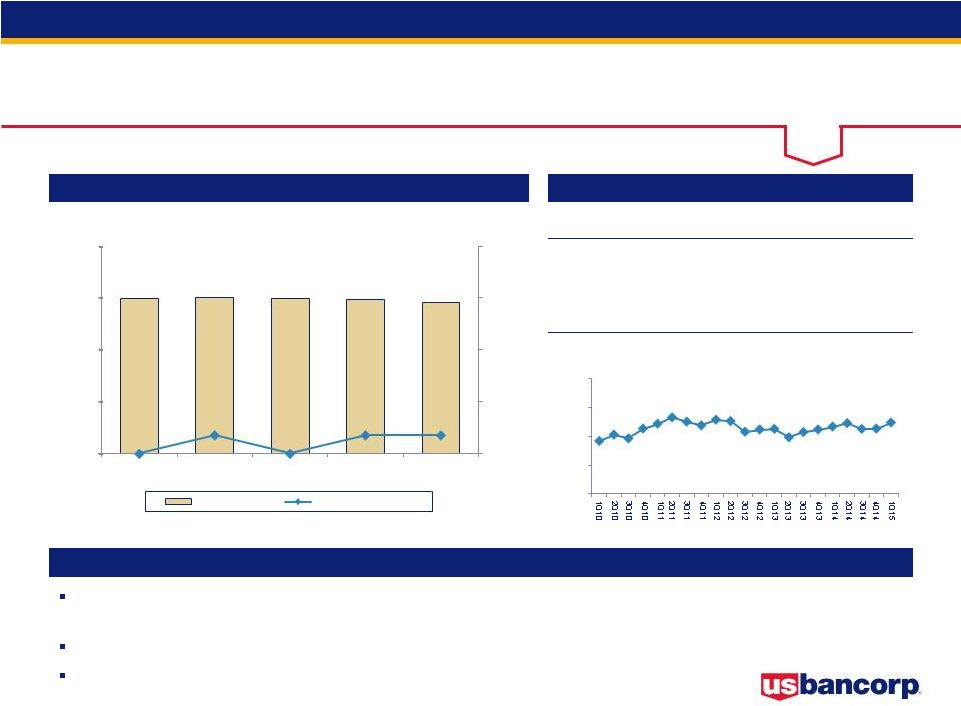
Commercial Leases
Average Loans and Net Charge-offs Ratios
Key Statistics
Key Points
Commercial
lease
balances
increased
slightly
on
a
linked
quarter
basis
Net charge-offs increased as recoveries returned to normal levels
Nonperforming loans and delinquencies continued at modest levels
1Q14
4Q14
1Q15
Average Loans
$5,189
$5,292
$5,325
30-89 Delinquencies
0.74%
0.78%
0.84%
90+ Delinquencies
0.00%
0.00%
0.00%
Nonperforming Loans
0.27%
0.24%
0.24%
$ in millions
Small Ticket
$3,095
Equipment
Finance
$2,230
Commercial Leases
$5,189
$5,100
$5,155
$5,292
$5,325
0.16%
0.24%
0.46%
-0.15%
0.23%
-0.7%
0.0%
0.7%
1.4%
2.1%
0
3,000
6,000
9,000
1Q14
2Q14
3Q14
4Q14
1Q15
Average Loans
Net Charge
-offs Ratio |
 1Q15 Earnings
Conference Call
Credit
Quality
-
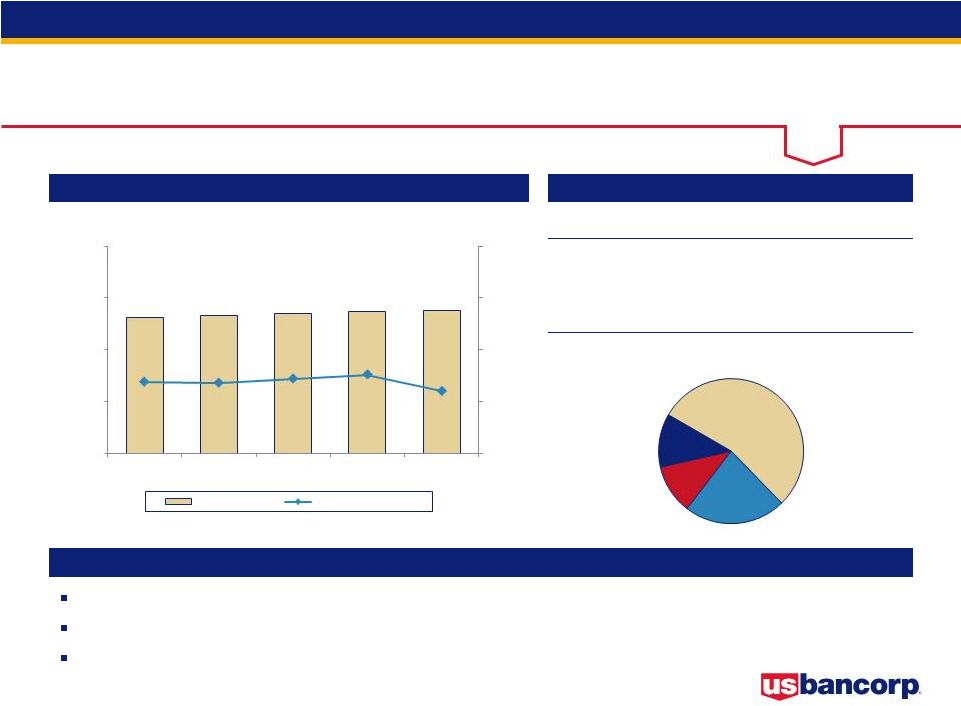
Commercial
Real
Estate
Average Loans and Net Charge-offs Ratios
Key Statistics
Key Points
Credit quality is stable at low levels; non-performing loans improved
quarter-over-quarter Net
recovery
ratio
of
0.17%,
continuing
a
trend
of
recoveries
in
the
portfolio
1Q14
4Q14
1Q15
Average Loans
$40,050
$40,966
$42,671
30-89 Delinquencies
0.14%
0.26%
0.24%
90+ Delinquencies
0.06%
0.05%
0.07%
Nonperforming Loans
0.67%
0.61%
0.51%
Performing TDRs*
$359
$365
$259
$ in millions
Investor
$21,551
Owner
Occupied
$11,568
Multi-family
$2,931
Retail
$745
Residential
Construction
$2,061
A&D
Construction
$714
Office
$1,024
Other
$2,077
* TDR = troubled debt restructuring
$40,050
$40,497
$40,839
$40,966
$42,671
-0.03%
-0.04%
0.04%
-0.10%
-0.17%
-0.5%
0.0%
0.5%
1.0%
1.5%
0
20,000
40,000
60,000
1Q14
2Q14
3Q14
4Q14
1Q15
Average Loans
Net Charge
-offs Ratio
CRE Mortgage
CRE Construction
21 |
 1Q15 Earnings
Conference Call
Credit Quality
-
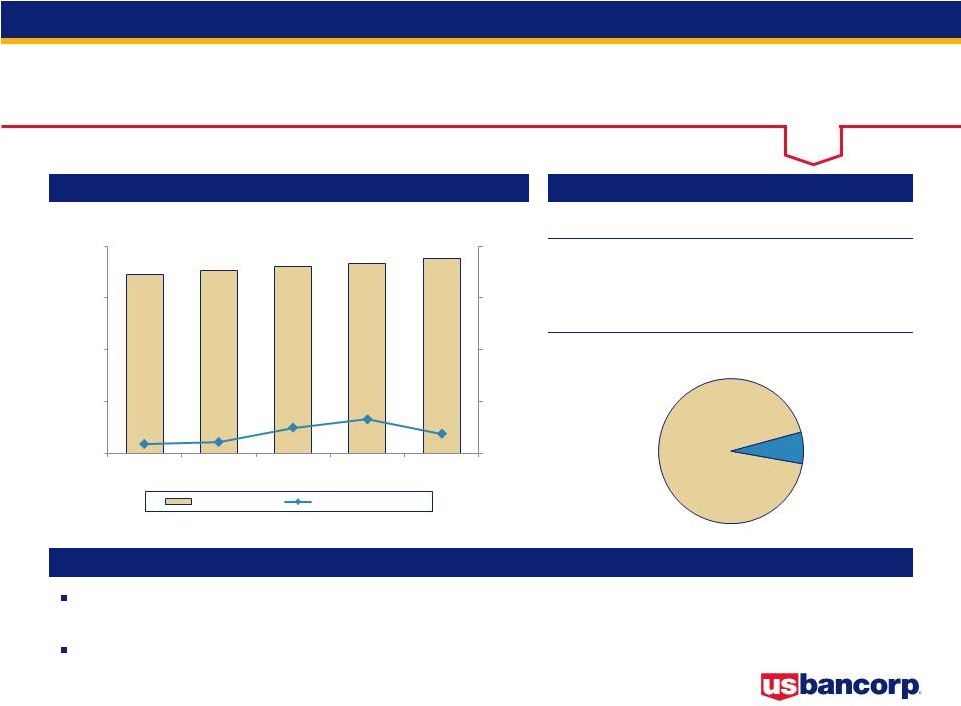
Residential Mortgage
Average Loans and Net Charge-offs Ratios
Key Statistics
Key Points
Originations are of high credit quality (weighted average FICO 755, weighted
average LTV 69%) 82% of the balances have been originated since the beginning
of 2009; the origination quality metrics and performance to date have
significantly outperformed prior vintages with similar seasoning
1Q14
4Q14
1Q15
Average Loans
$51,584
$51,872
$51,426
30-89 Delinquencies
0.59%
0.43%
0.38%
90+ Delinquencies
0.64%
0.40%
0.33%
Nonperforming Loans
1.50%
1.67%
1.61%
$ in millions
*Excludes
GNMA
loans,
whose
repayments
are
insured
by
the
FHA
or
guaranteed
by
the
Department
of
VA
($2,157
million
in
1Q15)
$51,584
$51,815
$51,994
$51,872
$51,426
0.45%
0.44%
0.32%
0.30%
0.0%
0.5%
1.0%
1.5%
2.0%
0
15,000
30,000
45,000
60,000
1Q14
2Q14
3Q14
4Q14
1Q15
Average Loans
Net Charge
-offs Ratio
$1,962
$1,922
$1,899
$1,866
$1,851
0
1,000
2,000
3,000
4,000
1Q14
2Q14
3Q14
4Q14
1Q15
Residential Mortgage Performing TDRs*
22
0.28% |
 23
1Q15 Earnings
Conference Call
1Q14
4Q14
1Q15
Average Loans
$17,407
$17,990
$17,823
30-89 Delinquencies
1.19%
1.24%
1.16%
90+ Delinquencies
1.21%
1.13%
1.19%
Nonperforming Loans
0.38%
0.16%
0.13%
Credit Quality -
Credit Card
Average Loans and Net Charge-offs Ratios
Key Statistics
Key Points
Average loans seasonally declined 0.9% on a linked quarter basis; up 2.4%
year-over-year Delinquencies and losses remain near historically low
levels with some seasonal impacts Nonperforming loans continued to
decline $ in millions
0
5,000
10,000
15,000
20,000
1Q14
2Q14
3Q14
4Q14
1Q15
0.0%
2.0%
4.0%
6.0%
8.0%
$17,407
$17,384
$17,753
$17,990
$17,823
3.96%
3.92%
3.53%
3.53%
3.71%
Average Loans
Net Charge
-offs Ratio
Credit Card Nonperforming Loans
0.0%
0.5%
1.0%
1.5%
2.0%
0
20
40
60
80
1Q14
2Q14
3Q14
4Q14
1Q15
$65
$52
$40
$30
$22
0.38%
0.29%
0.22%
0.16%
0.13% |
 1Q15 Earnings
Conference Call
Credit Quality -
Home Equity
Average Loans and Net Charge-offs Ratios
Key Statistics
Key Points
High-quality originations (weighted average FICO on commitments was 766,
weighted average CLTV
71%)
originated
primarily
through
the
retail
branch
network
to
existing
bank
customers
on
their primary residences
Net charge-offs ratio declined on a linked quarter and year-over-year
basis 1Q14
4Q14
1Q15
Average Loans
$15,366
$15,853
$15,897
30-89 Delinquencies
0.57%
0.54%
0.41%
90+ Delinquencies
0.33%
0.26%
0.25%
Nonperforming Loans
1.09%
1.07%
1.07%
Subprime: 1%
Wtd Avg LTV*: 90%
NCO: 3.51%
$ in millions
Prime: 96%
Wtd Avg LTV*: 72%
NCO: 0.29%
*LTV at origination
Other: 3%
Wtd Avg LTV*: 72%
NCO: 0.81%
$15,366
$15,327
$15,704
$15,853
$15,897
0.82%
0.60%
0.61%
0.43%
0.36%
0.0%
1.0%
2.0%
3.0%
4.0%
0
5,000
10,000
15,000
20,000
1Q14
2Q14
3Q14
4Q14
1Q15
Average Loans
Net Charge
-offs Ratio
Home Equity
24 |
 1Q15 Earnings
Conference Call
Credit Quality -
Retail Leasing
Average Loans and Net Charge-offs Ratios
Key Statistics
Key Points
Continued high-quality originations (weighted average FICO 789) support the
portfolio’s stable credit profile
Delinquencies remained relatively stable at very low levels
Strong used auto values continued to contribute to historically low net
charge-offs 1Q14
4Q14
1Q15
Average Loans
$5,979
$5,939
$5,819
30-89 Delinquencies
0.16%
0.18%
0.12%
90+ Delinquencies
0.02%
0.02%
0.00%
Nonperforming Loans
0.02%
0.02%
0.02%
$ in millions
* Manheim Used Vehicle Value Index source: www.manheimconsulting.com, January 1995
= 100, quarter value = average of monthly ending values $5,979
$6,014
$5,991
$5,939
$5,819
0.00%
0.07%
0.00%
0.07%
0.07%
0.0%
0.2%
0.4%
0.6%
0.8%
0
2,000
4,000
6,000
8,000
1Q14
2Q14
3Q14
4Q14
1Q15
Average Loans
Net Charge
-offs Ratio
100
110
120
130
140
Manheim
Used Vehicle Index*
25 |
 26
1Q15 Earnings
Conference Call
Credit Quality -
Other Retail
Average Loans and Net Charge-offs Ratios
Key Statistics
Key Points
Growth in auto and installment loans continued to offset declines in student
lending loan balances Student lending balances were moved to held for sale at
the end of the quarter Net charge-offs and delinquencies improved
on a linked quarter basis reflecting seasonality and remained low
year-over-year 1Q14
4Q14
1Q15
Average Loans
$26,312
$27,317
$27,604
30-89 Delinquencies
0.40%
0.51%
0.44%
90+ Delinquencies
0.13%
0.12%
0.11%
Nonperforming Loans
0.08%
0.06%
0.06%
Installment
$6,274
Auto Loans
$15,013
Revolving
Credit
$3,272
Student
Lending
$3,045
$ in millions
$26,312
$26,587
$27,003
$27,317
$27,604
0.69%
0.68%
0.72%
0.76%
0.60%
0.0%
0.5%
1.0%
1.5%
2.0%
0
10,000
20,000
30,000
40,000
1Q14
2Q14
3Q14
4Q14
1Q15
Average Loans
Net Charge
-offs Ratio
Other Retail |
 27
1Q15 Earnings
Conference Call
Credit Quality -
Auto Loans
Average Loans and Net Charge-offs Ratios
Key Statistics
Key Points
Continued growth (8.7% year-over-year) in auto loans driven by
high-quality originations in the indirect channel (weighted average FICO
765) Net charge-offs seasonally improved on a linked quarter basis, and
as expected, increased year-over-year as growth initiatives
continued to mature 1Q14
4Q14
1Q15
Average Loans
$13,815
$14,644
$15,013
30-89 Delinquencies
0.26%
0.45%
0.30%
90+ Delinquencies
0.03%
0.03%
0.01%
Nonperforming Loans
0.02%
0.03%
0.03%
$ in millions
Auto Loans are included in Other Retail category
Direct: 6%
Wtd Avg FICO: 748
NCO: 0.05%
Indirect: 94%
Wtd Avg FICO: 763
NCO: 0.20%
$13,815
$14,108
$14,404
$14,644
$15,013
0.09%
0.11%
0.25%
0.33%
0.19%
0.0%
0.5%
1.0%
1.5%
2.0%
0
4,000
8,000
12,000
16,000
1Q14
2Q14
3Q14
4Q14
1Q15
Average Loans
Net Charge
-offs Ratio
Indirect and Direct Channel |
 28
1Q15 Earnings
Conference Call
Mortgage Repurchase
Mortgages Repurchased and Make-whole Payments
Mortgage Representation and Warranties Reserve
$ in millions
1Q15
4Q14
3Q14
2Q14
1Q14
Beginning Reserve
$46
$62
$69
$75
$83
Net Realized Losses
(2)
(15)
(1)
(2)
(10)
Change in Reserve
2
(1)
(6)
(4)
2
Ending Reserve
$46
$46
$62
$69
$75
Mortgages
repurchased
and make-whole
payments
$12
$14
$19
$30
$36
Repurchase activity lower than
peers due to:
•
Conservative credit and
underwriting culture
•
Disciplined origination process -
primarily conforming
loans
(
95%
sold
to
GSEs)
Do not participate in private
placement securitization market
Outstanding repurchase and
make-whole requests balance
of $22 million |
 1Q15 Earnings
Conference Call
Non-GAAP Financial Measures
March 31,
December 31,
September 30,
June 30,
March 31,
(Dollars in Millions, Unaudited)
2015
2014
2014
2014
2014
Total equity
$44,965
$44,168
$43,829
$43,386
$42,743
Preferred stock
(4,756)
(4,756)
(4,756)
(4,756)
(4,756)
Noncontrolling interests
(688)
(689)
(688)
(686)
(689)
Goodwill (net of deferred tax liability) (1)
(8,360)
(8,403)
(8,503)
(8,548)
(8,352)
Intangible assets, other than mortgage servicing rights
(783)
(824)
(877)
(925)
(804)
Tangible common equity (a)
30,378
29,496
29,005
28,471
28,142
Tangible common equity (as calculated above)
30,378
29,496
29,005
28,471
28,142
Adjustments (2)
158
172
187
224
239
Common equity tier 1 capital estimated for the Basel III fully
implemented standardized and advanced approaches (b)
30,536
29,668
29,192
28,695
28,381
Total assets
410,233
402,529
391,284
389,065
371,289
Goodwill (net of deferred tax liability) (1)
(8,360)
(8,403)
(8,503)
(8,548)
(8,352)
Intangible assets, other than mortgage servicing rights
(783)
(824)
(877)
(925)
(804)
Tangible assets (c)
401,090
393,302
381,904
379,592
362,133
Risk-weighted assets, determined in accordance with
prescribed regulatory requirements (d)
327,709
*
317,398
311,914
309,929
302,841
Adjustments (3)
3,153
*
11,110
12,837
12,753
13,238
Risk-weighted assets estimated for the Basel III fully
implemented standardized approach
(e) 330,862
*
328,508
324,751
322,682
316,079
Risk-weighted assets, determined in accordance with
prescribed transitional advanced approaches regulatory
requirements 254,892
*
248,596
243,909
241,929
Adjustments (4)
3,321
*
3,270
3,443
3,383
Risk-weighted assets estimated for the Basel III fully
implemented advanced approaches
(f) 258,213
*
251,866
247,352
245,312
Ratios *
Tangible common equity to tangible assets (a)/(c)
7.6
%
7.5
%
7.6
%
7.5
%
7.8
%
Tangible common equity to risk-weighted assets (a)/(d)
9.3
9.3
9.3
9.2
9.3
Common equity tier 1
capital to risk-weighted assets estimated for the Basel III
fully implemented standardized approach (b)/(e) 9.2
9.0
9.0
8.9
9.0
Common equity tier 1 capital to risk-weighted assets estimated for
the Basel III fully implemented advanced approaches (b)/(f)
11.8
11.8
11.8
11.7
*
Preliminary data. Subject to change prior to filings with
applicable regulatory agencies. (1) Includes goodwill
related to certain investments in unconsolidated financial institutions per prescribed regulatory requirements.
(2) Includes net losses on cash flow hedges included in accumulated
other comprehensive income and other adjustments. (3) Includes
higher risk-weighting for unfunded loan commitments, investment securities, residential mortgages, mortgage servicing rights and other adjustments.
(4)
Primarily reflects higher risk-weighting for mortgage servicing
rights. 29 |
 April 15, 2015
U.S. Bancorp
1Q15 Earnings
Conference Call
U.S. Bancorp
1Q15 Earnings
Conference Call |