Attached files
| file | filename |
|---|---|
| EXCEL - IDEA: XBRL DOCUMENT - VINCE HOLDING CORP. | Financial_Report.xls |
| EX-32.1 - EX-32.1 - VINCE HOLDING CORP. | d880193dex321.htm |
| EX-31.1 - EX-31.1 - VINCE HOLDING CORP. | d880193dex311.htm |
| EX-31.2 - EX-31.2 - VINCE HOLDING CORP. | d880193dex312.htm |
| EX-23.1 - EX-23.1 - VINCE HOLDING CORP. | d880193dex231.htm |
| EX-32.2 - EX-32.2 - VINCE HOLDING CORP. | d880193dex322.htm |
| EX-10.13 - EX-10.13 - VINCE HOLDING CORP. | d880193dex1013.htm |
Table of Contents
UNITED STATES
SECURITIES AND EXCHANGE COMMISSION
Washington, D.C. 20549
FORM 10-K
(Mark One)
| x | ANNUAL REPORT PURSUANT TO SECTION 13 OR 15(d) OF THE SECURITIES EXCHANGE ACT OF 1934 |
For the fiscal year ended January 31, 2015
| ¨ | TRANSITION REPORT PURSUANT TO SECTION 13 OR 15(d) OF THE SECURITIES EXCHANGE ACT OF 1934 |
Commission File Number: 001-36212
VINCE HOLDING CORP.
(Exact name of registrant as specified in its charter)
| Delaware | 75-3264870 | |
| (State or other jurisdiction of incorporation or organization) |
(I.R.S. Employer Identification No.) |
500 5th Avenue—20th Floor
New York, New York 10110
(Address of principal executive offices) (Zip code)
(212) 515-2600
(Registrant’s telephone number, including area code)
Securities registered pursuant to Section 12(b) of the Act:
| Title of Each Class |
Name of Exchange on Which Registered | |
| Common Stock, $0.01 par value per share | New York Stock Exchange |
Securities registered pursuant to Section 12(g) of the Act: None
Indicate by check mark if the registrant is a well-known seasoned issuer, as defined in Rule 405 of the Securities Act. Yes ¨ No x
Indicate by check mark if the registrant is not required to file reports pursuant to Section 13 or Section 15(d) of the Act. Yes ¨ No x
Indicate by check mark whether the registrant: (1) has filed all reports required to be filed by Section 13 or 15(d) of the Securities Exchange Act of 1934 during the preceding 12 months (or for such shorter period that the registrant was required to file such reports), and (2) has been subject to such filing requirements for the past 90 days. Yes x No ¨
Indicate by check mark whether the registrant has submitted electronically and posted on its corporate Web site, if any, every Interactive Data File required to be submitted and posted pursuant to Rule 405 of Regulation S-T (§ 232.405 of this chapter) during the preceding 12 months (or for such shorter period that the registrant was required to submit and post such files). Yes x No ¨
Indicate by check mark if disclosure of delinquent filers pursuant to Item 405 of Regulation of S-K (§ 229.405 of this chapter) is not contained herein, and will not be contained, to the best of the registrant’s knowledge, in definitive proxy or information statements incorporated by reference in Part III of this Form 10-K or any amendment to this Form 10-K. x
Indicate by check mark whether the registrant is a large accelerated filer, an accelerated filer, a non-accelerated filer, or a smaller reporting company. See the definitions of “large accelerated filer,” “accelerated filer” and “smaller reporting company” in Rule 12b-2 of the Exchange Act. (Check one):
| Large accelerated filer | ¨ | Accelerated filer | x | |||
| Non-accelerated filer | ¨ (Do not check if a smaller reporting company) | Smaller reporting company | ¨ | |||
Indicate by check mark whether the registrant is a shell company (as defined in Rule 12b-2 of the Exchange Act). Yes ¨ No x
The aggregate market value of the registrant’s Common Stock held by non-affiliates as of August 2, 2014, the last day of the registrant’s most recently completed second quarter, was approximately $553.1 million based on a closing price per share of $33.16 as reported on the New York Stock Exchange on August 1, 2014. As of March 20, 2015, there were 36,748,245 shares of the registrant’s Common Stock outstanding.
Portions of the registrant’s definitive proxy statement to be filed with the Securities and Exchange Commission in connection with the registrant’s 2015 annual meeting of stockholders are incorporated by reference into Part III of this annual report on Form 10-K.
Table of Contents
| Page Number |
||||||
| PART I. | ||||||
| Item 1. | 3 | |||||
| Item 1A. | 9 | |||||
| Item 1B. | 30 | |||||
| Item 2. | 30 | |||||
| Item 3. | 32 | |||||
| Item 4. | 32 | |||||
| PART II. | ||||||
| Item 5. | Market for Registrant’s Common Equity, Related Stockholder Matters and Issuer Purchases of Equity Securities | 33 | ||||
| Item 6. | 35 | |||||
| Item 7. | Management’s Discussion and Analysis of Financial Condition and Results of Operations |
37 | ||||
| Item 7A. | 57 | |||||
| Item 8. | 57 | |||||
| Item 9. | Changes in and Disagreements With Accountants on Accounting and Financial Disclosure |
57 | ||||
| Item 9A. | 57 | |||||
| Item 9B. | 58 | |||||
| PART III. | ||||||
| Item 10. | 59 | |||||
| Item 11. | 59 | |||||
| Item 12. | Security Ownership of Certain Beneficial Owners and Management and Related Stockholder Matters | 59 | ||||
| Item 13. | Certain Relationships and Related Transactions, and Director Independence |
59 | ||||
| Item 14. | 59 | |||||
| PART IV. | ||||||
| Item 15. | 60 | |||||
1
Table of Contents
INTRODUCTORY NOTE
On November 27, 2013, Vince Holding Corp. (“VHC” or the “Company”), previously known as Apparel Holding Corp., closed an initial public offering (“IPO”) of its common stock and completed a series of restructuring transactions (the “Restructuring Transactions”) through which (i) Kellwood Holding, LLC acquired the non-Vince businesses, which include Kellwood Company, LLC (“Kellwood Company” or “Kellwood”), from the Company and (ii) the Company continues to own and operate the Vince business, which includes Vince, LLC.
Prior to the IPO and the Restructuring Transactions, VHC was a diversified apparel company operating a broad portfolio of fashion brands, which included the Vince business. As a result of the IPO and Restructuring Transactions, the non-Vince businesses were separated from the Vince business, and the stockholders immediately prior to the consummation of the Restructuring Transactions (the “Pre-IPO Stockholders”) (through their ownership of Kellwood Holding, LLC) retained the full ownership and control of the non-Vince businesses. The Vince business is now the sole operating business of Vince Holding Corp. Historical financial information for the non-Vince businesses has been presented as a component of discontinued operations, until the businesses were separated on November 27, 2013, in this annual report on Form 10-K and our Consolidated Financial Statements and related notes included herein.
DISCLOSURES REGARDING FORWARD-LOOKING STATEMENTS
This annual report on Form 10-K, and certain information incorporated by reference herein, contains forward-looking statements under the Private Securities Litigation Reform Act of 1995. Such statements often include words such as “may,” “will,” “should,” “believe,” “expect,” “seek,” “anticipate,” “intend,” “estimate,” “plan,” “target,” “project,” “forecast,” “envision” and other similar phrases. Although we believe the assumptions and expectations reflected in these forward-looking statements are reasonable, these assumptions and expectations may not prove to be correct and we may not achieve the financial results or benefits anticipated. These forward-looking statements are not guarantees of actual results. Our actual results may differ materially from those suggested in the forward-looking statements. These forward-looking statements involve a number of risks and uncertainties, some of which are beyond our control, including, without limitation: our ability to remain competitive in the areas of merchandise quality, price, breadth of selection, and customer service; our ability to anticipate and/or react to changes in customer demand and attract new customers; changes in consumer confidence and spending; our ability to maintain projected profit margins; unusual, unpredictable and/or severe weather conditions; the execution and management of our retail store growth, including the availability and cost of acceptable real estate locations for new store openings; the execution and management of our international expansion, including our ability to promote our brand and merchandise outside the U.S. and find suitable partners in certain geographies, our ability to expand our product offerings into new product categories including the ability find suitable licensing partners; our ability to successfully implement our marketing initiatives; our ability to protect our trademarks in the U.S. and internationally; our ability to maintain the security of electronic and other confidential information; serious disruptions and catastrophic events; changes in global economies and credit and financial markets; competition; our ability to attract and retain key personnel; commodity, raw material and other cost increases; compliance with laws, regulations and orders; changes in laws and regulations; outcomes of litigation and proceedings and the availability of insurance, indemnification and other third-party coverage of any losses suffered in connection therewith; tax matters and other factors as set forth from time to time in our Securities and Exchange Commission (“SEC”) filings, including those described in this annual report on Form 10-K under “Item 1A—Risk Factors.” We intend these forward-looking statements to speak only as of the time of this annual report on Form 10-K and do not undertake to update or revise them as more information becomes available.
2
Table of Contents
Part I
| ITEM 1. | BUSINESS. |
For purposes of this annual report on Form 10-K, “Vince,” the “Company,” “we,” “us,” and “our,” refer to Vince Holding Corp. (“VHC”) and its wholly owned subsidiaries, including Vince Intermediate Holding, LLC and Vince, LLC. References to “Kellwood” refer, as applicable, to Kellwood Holding, LLC and its consolidated subsidiaries (including Kellwood Company, LLC) or the operations of the non-Vince businesses after giving effect to the Restructuring Transactions.
Overview
Vince is a leading contemporary fashion brand best known for modern effortless style and everyday luxury essentials. Founded in 2002, the brand now offers a wide range of women’s, men’s and children’s apparel, women’s and men’s footwear, and handbags. Vince products are sold in prestige distribution worldwide, including over 2,400 distribution points across 45 countries. Vince has generated strong sales momentum over the last decade. We believe that we will achieve continued success by expanding our product assortment distributed through premier wholesale partners in the U.S. and select international markets, as well as in our own branded retail locations and on our e-commerce platform. We have a small number of wholesale partners who account for a significant portion of our net sales. Net sales to the full-price, off-price and e-commerce operations of our three largest wholesale partners were 49% of our total revenue for fiscal 2014 and 46% of our total revenue for fiscal 2013. These partners include Nordstrom, Saks Fifth Avenue and Neiman Marcus, each accounting for more than 10% of our total revenue for fiscal 2014 and fiscal 2013. We design our products in the U.S. and source the vast majority of our products from contract manufacturers outside the U.S., primarily in Asia and South America.
We serve our customers through a variety of channels that reinforce the Vince brand image. Our diversified channel strategy allows us to introduce our products to customers through multiple distribution points that are reported in two segments: wholesale and direct-to-consumer. Our wholesale segment is comprised of sales to premier department stores and specialty stores in the U.S. and in select international markets, with U.S. wholesale representing 67% of our fiscal 2014 sales and the total wholesale segment representing 76% of our fiscal 2014 sales. We believe that our success in the U.S. wholesale channel and our strong relationships with premier wholesale partners provide opportunities for continued growth. These growth initiatives include creating enhanced product assortments and brand extensions through both in-house development activities and licensing arrangements, as well as continuing the build-out of branded shop-in-shops in select wholesale partner locations. We also believe international wholesale, which represented 9% of net sales for fiscal 2014 compared to 8% in fiscal 2013, presents a significant growth opportunity as we strengthen our presence in existing geographies and introduce Vince in new markets globally. Our wholesale segment also includes our licensing business related to our licensing arrangements for our women’s and men’s footwear and children’s apparel line.
Our direct-to-consumer segment includes our retail and outlet stores and our e-commerce business. In 2008, we initiated a direct-to-consumer strategy with the opening of our first retail store. During fiscal year 2014, we opened nine new stores consisting of six full-price retail stores and three outlet locations. As of January 31, 2015, we operated 37 stores, consisting of 28 full-price retail stores and nine outlet locations. Based on a combination of third-party analyses and internal projections, we believe that the U.S. market can currently support at least 100 free-standing Vince store locations. The direct-to-consumer segment also includes our e-commerce website, www.vince.com, which was launched in 2008 and re-launched with enhancements to the website during fiscal 2014. The direct-to-consumer segment accounted for 24% of fiscal 2014 net sales compared to 21% of net sales in the prior year. We expect sales from this channel to continue to grow as we drive productivity in existing stores, open new stores and continue to make improvements in our e-commerce business.
3
Table of Contents
Vince operates on a fiscal calendar widely used by the retail industry that results in a given fiscal year consisting of a 52 or 53-week period ending on the Saturday closest to January 31 of the following year.
| • | References to “fiscal year 2014” or “fiscal 2014” refer to the fiscal year ended January 31, 2015; |
| • | References to “fiscal year 2013” or “fiscal 2013” refer to the fiscal year ended February 1, 2014; |
| • | References to “fiscal year 2012” or “fiscal 2012” refer to the fiscal year ended February 2, 2013. |
Each of fiscal years 2014 and 2013 consisted of a 52-week period and fiscal year 2012 consisted of a 53-week period.
Vince Holding Corp., previously named Apparel Holding Corp., was incorporated in Delaware in February 2008 in connection with the acquisition of Kellwood Company by affiliates of Sun Capital Partners, Inc. (“Sun Capital”). In September 2012, Kellwood Company formed Vince, LLC and all assets constituting the Vince business were contributed to Vince, LLC at such time (the “Vince Transfer”). On November 27, 2013, Apparel Holding Corp. was renamed Vince Holding Corp. in connection with the consummation of the IPO. Certain restructuring transactions were completed in connection with the consummation of the IPO. These transactions, among other things, included Kellwood Holding, LLC acquiring the non-Vince businesses, which include Kellwood Company, LLC, from the Company; and the Company continues to own and operate the Vince business, which includes Vince, LLC. The restructuring transactions separated the Vince and non-Vince businesses on November 27, 2013. Any and all debt obligations outstanding at the time of the restructuring transactions either remained with Kellwood Holding, LLC and its subsidiaries (i.e. the non-Vince businesses) and/or were discharged, repurchased or refinanced in connection with the consummation of the IPO. Historical financial information for the non-Vince businesses has been presented as a component of discontinued operations, until the businesses were separated on November 27, 2013, in this annual report on Form 10-K and our Consolidated Financial Statements and related notes included herein. Our principal executive office is located at 500 Fifth Avenue, 20th Floor, New York, New York 10110 and our telephone number is (212) 515-2600. Our corporate website address is www.vince.com.
Brand and Products
Vince is a leading contemporary fashion brand best known for modern effortless style and every luxury essentials. The Vince brand was founded in 2002 with a collection of stylish women’s knits and cashmere sweaters that rapidly attracted a loyal customer base drawn to the casual sophistication and luxurious feel of our products. Over the last decade, Vince has generated strong sales momentum and has successfully grown to include a men’s collection in 2007, denim, leather and outerwear lines in 2010 and a women’s handbag line in 2014. In addition, through licensing partnerships, we launched women’s footwear in 2012, men’s footwear in 2014 and children’s apparel in 2014. The Vince brand is synonymous with a clean, timeless aesthetic, sophisticated design and superior quality. We believe these attributes have generated strong customer loyalty and have enabled us to hold a distinctive position among contemporary fashion brands. We also believe that we will achieve continued success by expanding our product assortment and distributing this expanded product assortment through our premier wholesale partners in the U.S. and select international markets, as well as through our growing number of branded retail locations and on our e-commerce platform.
Since our inception in 2002, we have offered contemporary apparel with a focus on clean and authentic design and superior quality. We believe that our differentiated design aesthetic and strong attention to detail and fit allow us to maintain premium pricing, and that the combination of quality and value positions Vince as an everyday luxury brand that encourages repeat purchases among our customers.
Over 88% of Vince’s sales were comprised of women’s products in fiscal 2014, with particular strength in sweaters, dresses, pants and outerwear. The women’s line under the Vince brand includes seasonal collections of
4
Table of Contents
luxurious cashmere sweaters and silk blouses, leather and suede leggings and jackets, dresses, denim, pants, tanks and t-shirts, handbags and a growing assortment of outerwear. The men’s collection under the Vince brand includes t-shirts, knit and woven tops, sweaters, denim, pants, blazers, outerwear and stylish leather jackets.
We have identified additional brand extension opportunities, including elevating our men’s collection, expanding outerwear, women’s pants and dresses, and implementing a replenishment program for core items. In addition, through our licensing arrangements, we also offer women’s and men’s footwear and children’s apparel. We continue to evaluate other brand extension opportunities through both in-house development activities as well as through potential licensing arrangements with third parties.
Design and Merchandising
Our product design and merchandising efforts are led by our President and Chief Creative Officer and a team of designers and merchandisers. Our design team is focused on developing an elevated collection of Vince apparel and accessories that build upon the brand’s product heritage of modern, effortless style and everyday luxury essentials. The current design vision is to create a cohesive and compelling product assortment with sophisticated head-to-toe looks for multiple wear occasions. Our design efforts are supported by well-established product development and production teams and processes that enable us to bring new products to market quickly. We are looking to further build our merchant capabilities and believe continued collaboration between design and merchandising will ensure we respond to consumer preferences and market trends with new innovative product offerings while maintaining our core fashion foundation.
Business Segments
We serve our customers through a variety of channels that reinforce the Vince brand image. Our diversified channel strategy allows us to introduce our products to customers through multiple distribution points that are reported in two segments: wholesale and direct-to-consumer.
| Net Sales by Segment | ||||||||||||
| Fiscal Year | ||||||||||||
| (in thousands) | 2014 | 2013 | 2012(a) | |||||||||
| Wholesale |
$ | 259,418 | $ | 229,114 | $ | 203,107 | ||||||
| Direct-to-consumer |
80,978 | 59,056 | 37,245 | |||||||||
|
|
|
|
|
|
|
|||||||
| Total net sales |
$ | 340,396 | $ | 288,170 | $ | 240,352 | ||||||
|
|
|
|
|
|
|
|||||||
| (a) | Fiscal 2012 contained 53 weeks. The additional week contributed approximately $17.6 million and $0.9 million of net sales to the wholesale and direct-to-consumer segments, respectively. |
Wholesale Segment
Our wholesale segment is comprised of sales to premier department stores and specialty stores in the U.S. and in select international markets, with U.S. wholesale representing 67% and international wholesale representing 9% of our net sales for fiscal 2014. Our products are currently sold in 45 countries. As of January 31, 2015, our products were sold to consumers at approximately 2,400 doors through our wholesale partners. In addition, we also have shop-in-shops which are operated by our domestic and international wholesale partners where we sell the merchandise to the partners on a wholesale basis, recognizing revenue upon shipment of goods when title and risk of loss passes to the wholesale partner. The shop-in-shops are dedicated spaces within the selling floors of select domestic and international wholesale partners where Vince product is prominently displayed and sold. Vince generally provides the shop-in-shop fixtures needed to build out the spaces within the department stores operated by our wholesale partners. As of January 31, 2015, there were 42 shop-in-shops consisting of 29 shop-in-shops with our U.S. wholesale partners and 13 shop-in-shops with our international wholesale partners. We also have two international free-standing stores in Tokyo and Istanbul that
5
Table of Contents
are owned and operated through distribution arrangements whereby Vince provides the merchandise to the distribution partners for sale in the free-standing store which solely sells Vince product. Our wholesale segment also includes our licensing business related to our licensing arrangements for our women’s and men’s footwear and children’s apparel line. Under these licensing arrangements we launched women’s footwear in fiscal 2012 and in fiscal 2014 we launched men’s footwear and children’s apparel. The licensed products, including footwear and children’s apparel are sold in our own stores and by our licensee to select wholesale partners, and we earn a royalty based on net sales to the wholesale partners.
Direct-to-Consumer Segment
Our direct-to-consumer segment includes our retail and outlet stores and our e-commerce business. In 2008, we initiated a direct-to-consumer strategy with the opening of our first retail store. As of January 31, 2015, we operated 37 stores, which consisted of 28 full-price retail stores and nine outlet locations. The direct-to-consumer segment also includes our e-commerce website, www.vince.com, which was launched in 2008 and re-launched with website enhancements during fiscal 2014. The direct-to-consumer segment accounted for approximately 24% of fiscal 2014 net sales compared to 21% in the prior year. We expect sales from this channel to continue to grow as we drive productivity in existing stores, open new stores and continue to make improvements in our e-commerce business.
The following table details the number of retail stores we operated for the past three fiscal years:
| Fiscal 2014 |
Fiscal 2013 |
Fiscal 2012 |
||||||||||
| Beginning of fiscal year |
28 | 22 | 19 | |||||||||
| Opened |
9 | 7 | 3 | |||||||||
| Closed |
— | (1 | ) | — | ||||||||
|
|
|
|
|
|
|
|||||||
| End of fiscal year |
37 | 28 | 22 | |||||||||
|
|
|
|
|
|
|
|||||||
Marketing, Advertising and Public Relations
We use marketing, advertising and public relations as critical tools to deliver a consistent and compelling brand message. Our marketing is focused on showcasing our product and sophisticated style, as well as building an emotional connection with the customer. The Vince brand image is developed and cultivated by dedicated creative, marketing, visual merchandising and public relations teams that, along with the Vince design team and select outside agencies, work closely to communicate a consistent brand message across various consumer touchpoints.
We engage in a wide range of marketing programs that include traditional media (direct mail, print advertising, cooperative advertising with wholesale partners and outdoor advertising), digital media (email and web) and social media (Facebook, Twitter, Instagram and Pinterest) to drive traffic across channels. We believe our customers will continue to be receptive to our marketing and social media efforts, which, in management’s opinion, have presented us with a strong new marketing channel to reach existing and prospective customers. We use Facebook as the main social media hub to generate conversation about the brand through daily lifestyle posts, focusing on product launches, style tips and in-store events. Social media platforms like Instagram allow us to tell our brand story creatively by offering behind-the-scenes access to events, press reviews and the Vince showroom, as well as featuring Vince enthusiasts wearing our products. In addition, the growing number of visits to www.vince.com, which totaled 3.9 million in fiscal 2014, representing a 50% increase from fiscal 2013, provides an opportunity to grow our customer base and communicate directly with our customers.
Our public relations team conducts a wide variety of press activities to reinforce the Vince brand image and create excitement around the brand. Vince apparel, handbags and footwear have appeared in the pages of major fashion magazines such as Vogue, Harper’s Bazaar, Elle, W, GQ, Esquire and Vanity Fair. Well-known trend setters in entertainment and fashion are also regularly seen wearing the Vince brand.
6
Table of Contents
Sourcing and Manufacturing
Vince does not own or operate any manufacturing facilities. We contract for the purchase of finished goods with manufacturers who are responsible for the entire manufacturing process, including the purchase of piece goods and trim. Although we do not have long-term written contracts with manufacturers, we have long-standing relationships with a diverse base of vendors which we believe to be mutually satisfactory. We work with over 30 manufacturers across five countries, with 88% of our products produced in China in fiscal 2014. For cost and control purposes, we contract with select third-party vendors in the U.S. to produce a small portion of our merchandise that includes woven pants and products manufactured with man-made fibers.
All of our garments are produced according to our specifications, and we require that all of our manufacturers adhere to strict regulatory compliance and standards of conduct. Our vendors’ factories are monitored by our production team to ensure quality control, and they are monitored by independent third-party inspectors we employ for compliance with local manufacturing standards and regulations on an annual basis. Our quality assurance staff in the U.S. and Asia also monitors our vendors’ manufacturing facilities regularly, providing technical assistance and performing in-line and final audits to ensure the highest possible quality.
Shared Services Agreement
In connection with the consummation of the IPO, Vince, LLC entered into a shared services agreement with Kellwood Company, LLC on November 27, 2013 (the “Shared Services Agreement”) pursuant to which Kellwood Company, LLC provides certain support services, including distribution, information technology and back office support. Kellwood will provide these services until we elect to terminate the provision thereof in accordance with the terms of such agreement. Some of the Kellwood systems we continue to use following the IPO include enterprise resourcing planning, or “ERP”, human resource management systems and distribution applications. In conjunction with our separation from Kellwood, we are in the process of separating our assets from those of Kellwood. We have recently commenced the development and implementation of our own ERP system and IT infrastructure, engaged with a new e-commerce platform provider and migrated the human resource recruitment system. Refer to the discussion under “Information Systems” below for further information on our ERP implementation. See also “Item 1A. Risk Factors—Kellwood provides us with certain key services for our business, some of which we are in the process of transitioning to our own systems. If Kellwood fails to perform its obligations to us during the period of transition or if we cannot successfully transition these services to our own systems, our business, financial condition, results of operations and cash flows could be materially harmed.” In addition, see “Shared Services Agreement” under Note 15 to the Consolidated Financial Statements in this annual report on Form 10-K for further information.
Distribution Facilities
Pursuant to the Shared Services Agreement, Kellwood provides distribution facilities and services to us in the U.S. These services include distribution, storage and fulfillment. Kellwood will continue to provide these services to us until such time as we elect to terminate the provision of such services in accordance with the terms of the Shared Services Agreement. See “Shared Services Agreements” under Note 15 to the Consolidated Financial Statements in this annual report on Form 10-K for additional information regarding the Shared Services Agreement.
As of January 31, 2015, we operated out of three distribution centers, two located in the U.S. and one in Belgium. The primary warehouse, located in City of Industry, California, includes 75,000 square feet dedicated to fulfilling orders for our wholesale partners and retail locations. An adjacent warehouse spanning 22,000 square feet supports Vince’s e-commerce business and offers additional capacity to support our projected growth over the next several years. Our space in both of the California warehouses utilize warehouse management systems that are fully customer and vendor compliant and are completely integrated with our current ERP and accounting systems.
7
Table of Contents
The warehouse in Belgium is operated by a third-party logistics provider and supports our wholesale orders for customers located primarily in Europe. The warehouse management systems of the Belgium warehouse are integrated with our current ERP systems to provide us with near real-time visibility into our international distribution.
We believe we have sufficient capacity in our domestic and international distribution facilities to support our continued growth.
Information Systems
Kellwood has continued to provide certain information technology services to us and will continue to do so until such time as we elect to terminate provision of such services in accordance with the terms of the Shared Services Agreement. These services currently include information technology planning and administration, desktop support and help desk, our ERP system, financial applications, warehouse systems, reporting and analysis applications and our retail and e-commerce interfaces.
Our current ERP system was developed from a core system that is widely used in the apparel and fashion industry, which we have customized to suit our inventory management and order processing requirements. We have integrated Oracle Financials with our ERP system to meet our financial reporting and accounting requirements. Additionally, we use a suite of third-party hosted retail applications integrated with our ERP system that provide us with merchandising, retail inventory management, point-of-sale systems, customer relationship management and retail accounting. Our retail applications are supported through a “Software as a Service” model, which allows for new implementations to occur quickly. Our ERP and warehouse management systems are also integrated with a hosted, third-party e-commerce platform. During fiscal 2014, we commenced the development and implementation of our own ERP system and IT infrastructure, engaged with a new e-commerce platform provider and migrated the human resource recruitment system. The ERP implementation is expected to be completed by the end of the third quarter of fiscal 2015. The new ERP system is based on a system from Microsoft Dynamics AX and is cloud based. It will replace our current Oracle Financials and retail related sub systems.
See “—Shared Services Agreement,” “Item 1A. Risk Factors—Kellwood provides us with certain key services for our business, some of which we are in the process of transitioning to our own systems. If Kellwood fails to perform its obligations to us during the period of transition or if we cannot successfully transition these services to our own systems, our business, financial condition, results of operations and cash flows could be materially harmed.” In addition, see “Shared Services Agreement” under Note 15 to the Consolidated Financial Statements in this annual report on form 10-K for further information.
Seasonality
The apparel and fashion industry in which we operate is cyclical and, consequently, our revenues are affected by general economic conditions and the seasonal trends characteristic to the apparel and fashion industry. Purchases of apparel are sensitive to a number of factors that influence the level of consumer spending, including economic conditions and the level of disposable consumer income, consumer debt, interest rates, consumer confidence as well as the impact from adverse weather conditions. In addition, fluctuations in sales in any fiscal quarter are affected by the timing of seasonal wholesale shipments and other events affecting direct-to-consumer sales; as such, the financial results for any particular quarter may not be indicative of results for the fiscal year.
Competition
We face strong competition in each of the product categories and markets where we compete on the basis of style, quality, price and brand recognition. Some of our competitors have achieved significant recognition for their brand names or have substantially greater financial, marketing, distribution and other resources than us. However, we believe that we have established a sustainable advantage and distinct position in the current
8
Table of Contents
marketplace, driven by a product assortment that combines classic and fashion-forward styling, and a pricing strategy that offers customers accessible luxury. Our competitors are varied but include Theory, Helmut Lang, Rag & Bone, Joie, J Brand, James Perse and J. Crew, among others.
Employees
As of January 31, 2015, we had 498 employees, of which 272 were employed in retail stores. Except for one employee in France, who is covered by a collective bargaining agreement pursuant to French law, none of our employees are currently covered by a collective bargaining agreement, and we believe our employee relations are good.
Trademarks and Licensing
We own the Vince trademark for the production, marketing and distribution of our products in the U.S. and internationally. We have registered the trademark domestically and have registrations on file or pending in a number of foreign jurisdictions. We intend to continue to strategically register, both domestically and internationally, trademarks that we use today and those we develop in the future. We license the domain name for our website, www.vince.com, pursuant to a license agreement. Under this license agreement, we have an exclusive, irrevocable license to use the www.vince.com domain name without restriction at a nominal annual cost. While we may terminate such license agreement at our discretion, the agreement does not provide for termination by the licensor. We also own unregistered copyright rights in our design marks.
Available Information
We make available free of charge on our website, www.vince.com, copies of our annual reports on Form 10-K, quarterly reports on Form 10-Q, current reports on Form 8-K and all amendments to these reports filed or furnished pursuant to Section 13(a) or 15(d) of the Securities Exchange Act of 1934, as amended (the “Exchange Act”), as soon as reasonably practicable after filing such material electronically with, or otherwise furnishing it to, the Securities and Exchange Commission (the “SEC”). The reference to our website address does not constitute incorporation by reference of the information contained on the website, and the information contained on the website is not part of this annual report on Form 10-K.
| ITEM 1A. | RISK FACTORS. |
The following risk factors should be carefully considered when evaluating our business and the forward-looking statements in this annual report on Form 10-K. See “Disclosures Regarding Forward-Looking Statements.”
Risks Related to Our Business
Intense competition in the apparel and fashion industry could reduce our sales and profitability.
As a fashion company, we face intense competition from other domestic and foreign apparel, footwear and accessories manufacturers and retailers. Competition may result in pricing pressures, reduced profit margins, lost market share or failure to grow our market share, any of which could substantially harm our business and results of operations. Competition is based on many factors including, without limitation, the following:
| • | establishing and maintaining favorable brand recognition; |
| • | developing products that appeal to consumers; |
| • | pricing products appropriately; |
| • | determining and maintaining product quality; |
| • | obtaining access to sufficient floor space in retail locations; |
9
Table of Contents
| • | providing appropriate services and support to retailers; |
| • | maintaining and growing market share; |
| • | hiring and retaining key employees; and |
| • | protecting intellectual property. |
Competition in the apparel and fashion industry is intense and is dominated by a number of very large brands, many of which have longer operating histories, larger customer bases, more established relationships with a broader set of suppliers, greater brand recognition and greater financial, research and development, marketing, distribution and other resources than we do. These capabilities of our competitors may allow them to better withstand downturns in the economy or apparel and fashion industry. Any increased competition, or our failure to adequately address any of these competitive factors, could result in reduced sales, which could adversely affect our business, financial condition and operating results.
Competition, along with such other factors as consolidation within the retail industry and changes in consumer spending patterns, could also result in significant pricing pressure and cause the sales environment to be more promotional, as it was in 2014. If promotional pressure remains intense, either through actions of our competitors or through customer expectations, this may cause us to reduce our sales prices to our wholesale partners and retail consumers, which could cause our gross margins to decline if we are unable to appropriately manage inventory levels and/or otherwise offset price reductions with comparable reductions in our operating costs. If our sales prices decline and we fail to sufficiently reduce our product costs or operating expenses, our profitability may decline, which could have a material adverse effect on our business, financial condition and operating results.
General economic conditions in the U.S. and other parts of the world, including a continued weakening of the economy and restricted credit markets, can affect consumer confidence and consumer spending patterns.
The apparel industry has historically been subject to cyclical variations, recessions in the general economy or uncertainties regarding future economic prospects that affect consumer spending habits which could negatively impact our business overall, the carrying value of our tangible and intangible assets and specifically sales, gross margins and profitability. The success of our operations depends on consumer spending. Consumer spending is impacted by a number of factors, including actual and perceived economic conditions affecting disposable consumer income (such as unemployment, wages, energy costs and consumer debt levels), business conditions, interest rates and availability of credit and tax rates in the general economy and in the international, regional and local markets in which our products are sold.
Recent global economic conditions have included significant recessionary pressures and declines in employment levels, disposable income and actual and/or perceived wealth and further declines in consumer confidence and economic growth. The recent depressed economic environment was characterized by a decline in consumer discretionary spending and has disproportionately affected retailers and sellers of consumer goods, particularly those whose goods are viewed as discretionary or luxury purchases, including fashion apparel and accessories such as ours. During such recessionary periods, we may have to increase the number of promotional sales or otherwise dispose of inventory which we have previously paid to manufacture. While we have seen occasional signs of stabilization in the North American markets during 2013 and 2014, the recent recession may have resulted in a shift in consumer spending habits that makes it unlikely that spending will return to prior levels for the foreseeable future as the promotional environment has continued and may continue going forward. Such factors as well as another shift towards recessionary conditions could adversely impact our sales volumes and overall profitability in the future.
Further, growing concerns that European countries could default on their national debt have caused instability in the European economy, which is one of the areas that we are currently targeting for international expansion. Continued economic and political volatility and declines in the value of the Euro or other foreign
10
Table of Contents
currencies could negatively impact the global economy as a whole and have a material adverse effect on the profitability and liquidity of our international operations, as well as hinder our ability to grow through expansion in the international markets. In addition, domestic and international political situations also affect consumer confidence. The threat, outbreak or escalation of terrorism, military conflicts or other hostilities around the world could lead to decreases in consumer spending.
Our business depends on a strong brand image, and if we are not able to maintain or enhance our brand, particularly in new markets where we have limited brand recognition, we may be unable to sell sufficient quantities of our merchandise, which would harm our business and cause our results of operations to suffer.
We believe that maintaining and enhancing the Vince brand is critical to maintaining and expanding our customer base. Maintaining and enhancing our brand may require us to make substantial investments in areas such as visual merchandising (including working with our wholesale partners to transform select Vince displays into branded shop-in-shops), marketing and advertising, employee training and store operations. A primary component of our strategy involves expanding into other geographic markets and working with existing wholesale partners, particularly within the U.S. We anticipate that, as our business expands into new markets and further penetrates existing markets, and as the markets in which we operate become increasingly competitive, maintaining and enhancing our brand may become increasingly difficult and expensive. Certain of our competitors in the fashion industry have faced adverse publicity surrounding the quality, attributes and performance of their products. Our brand may similarly be adversely affected if our public image or reputation is tarnished by failing to maintain high standards for merchandise quality and integrity. Any negative publicity about these types of concerns may reduce demand for our merchandise. Maintaining and enhancing our brand will depend largely on our ability to be a leader in the contemporary fashion industry and to continue to provide high quality products. If we are unable to maintain or enhance our brand image, our results of operations may suffer and our business may be harmed.
A substantial portion of our revenue is derived from a small number of large wholesale partners, and the loss of any of these wholesale partners could substantially reduce our total revenue.
We have a small number of wholesale partners who account for a significant portion of our net sales. Net sales to the full-price, off-price and e-commerce operations of our three largest wholesale partners were 49% of our total revenue for fiscal 2014. These partners include Nordstrom, Saks Fifth Avenue and Neiman Marcus, each accounting for more than 10% of our total revenue for fiscal 2014. We do not have written agreements with any of our wholesale partners, and purchases generally occur on an order-by-order basis. A decision by any of our major wholesale partners, whether motivated by marketing strategy, competitive conditions, financial difficulties or otherwise, to significantly decrease the amount of merchandise purchased from us or our licensing partners, or to change their manner of doing business with us or our licensing partners, could substantially reduce our revenue and have a material adverse effect on our profitability. Furthermore, due to the concentration of our wholesale partner base, our results of operations could be adversely affected if any of these wholesale partners fails to satisfy its payment obligations to us when due. During the past several years, the retail industry has experienced a great deal of ownership change, and we expect such change will continue. In addition, store closings by our wholesale partners decrease the number of stores carrying our products, while the remaining stores may purchase a smaller amount of our products and may reduce the retail floor space designated for our brand. In the future, retailers may further consolidate, undergo restructurings or reorganizations, realign their affiliations or reposition their stores’ target markets. Any of these types of actions could decrease the number of stores that carry our products or increase the ownership concentration within the retail industry. These changes could decrease our opportunities in the market, increase our reliance on a diminishing number of large wholesale partners and decrease our negotiating strength with our wholesale partners. These factors could have a material adverse effect on our business, financial condition and operating results.
11
Table of Contents
We may not be able to successfully expand our wholesale partnership base or grow our presence with existing wholesale partners.
As part of our growth strategy, we intend to increase productivity and penetration with existing wholesale partners and form relationships with new, international wholesale partners. These initiatives may include the establishment of additional shop-in-shops within select department stores. The location of Vince displays or shop-in-shops within department stores is controlled in large part by our wholesale partners. Although the investments made by us and our wholesale partners in the development and installation of Vince displays and shop-in-shops decreases the risk that our wholesale partners will require us to move to a less desirable area of their store or reduce the space allocated to such displays and shops, they are not contractually prohibited from doing so or required to grant additional or more desirable space to us. While expanding the number of shop-in-shops is part of our growth strategy, there can be no assurances we will be able to align our wholesale partners with this strategy and continue to receive floor space from our wholesale partners to open or expand shop-in-shops.
Our ability to attract customers to our stores depends heavily on successfully locating our stores in suitable locations and any impairment of a store location, including any decrease in customer traffic, could cause our sales to be less than expected.
Our approach to identifying locations for our retail stores typically favors street and mall locations near luxury and contemporary retailers that we believe are consistent with our key customers’ demographics and shopping preferences. Sales at these stores are derived, in part, from the volume of foot traffic in these locations. Changes in areas around our existing retail locations that result in reductions in customer foot traffic or otherwise render the locations unsuitable could cause our sales to be less than expected and the related leases are generally non-cancelable. Store locations may become unsuitable due to, and our sales volume and customer traffic generally may be harmed by, among other things:
| • | economic downturns in a particular area; |
| • | competition from nearby retailers selling similar apparel or accessories; |
| • | changing consumer demographics in a particular market; |
| • | changing preferences of consumers in a particular market; |
| • | the closing or decline in popularity of other businesses located near our stores; and |
| • | store impairments due to acts of God or terrorism. |
Our ability to successfully open and operate new retail stores depends on many factors, including, among others, our ability to:
| • | identify new markets where our products and brand image will be accepted or the performance of our retail stores will be successful; |
| • | obtain desired locations, including store size and adjacencies, in targeted malls or streets; |
| • | negotiate acceptable lease terms, including desired rent and tenant improvement allowances, to secure suitable store locations; |
| • | achieve brand awareness, affinity and purchase intent in the new markets; |
| • | hire, train and retain store associates and field management; |
| • | assimilate new store associates and field management into our corporate culture; |
| • | source and supply sufficient inventory levels; and |
| • | successfully integrate new retail stores into our existing operations and information technology systems, which will initially be provided by Kellwood under the terms of the Shared Services Agreement. |
12
Table of Contents
As of January 31, 2015, we had 37 stores, which consisted of 28 full-price retail stores and nine outlet locations. We plan to increase our store base over the next three to five years, including the expected openings of eight to 10 new stores in fiscal 2015. Our new stores, however, may not be immediately profitable and we may incur losses until these stores become profitable. Unavailability of desired store locations, delays in the acquisition or opening of new stores, delays or costs resulting from a decrease in commercial development due to capital restraints, difficulties in staffing and operating new store locations or a lack of customer acceptance of stores in new market areas may negatively impact our new store growth and the costs or the profitability associated with new stores. There can be no assurance that we will open the planned number of stores in fiscal 2015 or thereafter. Any failure to successfully open and operate new stores may adversely affect our business, financial condition and operating results.
As we expand our store base, we may be unable to maintain or grow comparable store sales or average sales per square foot at the same rates that we have achieved in the past, which could cause our share price to decline.
As we expand our store base, we may not be able to maintain or grow at the same rates of comparable store sales growth that we have achieved historically. In addition, we may not be able to maintain or grow our historic average sales per square foot as we move into new markets. If our future comparable store sales or average sales per square foot decline or fail to meet market expectations, the price of our common stock could decline. In addition, the aggregate results of operations through our wholesale partners and at our retail locations have fluctuated in the past and can be expected to continue to fluctuate in the future. A variety of factors affect both comparable store sales and average sales per square foot, including, among others, consumer spending patterns, fashion trends, competition, current economic conditions, pricing, inflation, the timing of the release of new merchandise and promotional events, changes in our product assortment, the success of marketing programs and weather conditions. If we misjudge the market for our products, we may incur excess inventory for some of our products and miss opportunities for other products. These factors may cause our comparable store sales results and average sales per square foot in the future to be materially lower than recent periods or our expectations, which could harm our results of operations and result in a decline in the price of our common stock.
We have grown rapidly in recent years and we have limited operating experience as a team at our current scale of operations. If we are unable to manage our operations at our current size or are unable to manage any future growth effectively, our business results and financial performance may suffer.
We have expanded our operations rapidly since our inception in 2002, and we have limited operating experience at our current size. Our business has grown significantly over the past three years, as we have grown our total net sales from $240.4 million in fiscal 2012 to $340.4 million in fiscal 2014. We have made and are making investments to support our near and longer-term growth. If our operations continue to grow over the longer term, of which there can be no assurance, we will be required to expand our sales and marketing, product development and distribution functions, to upgrade our management information systems and other processes, and to obtain more space for our expanding administrative support and other headquarters personnel. Our expansion may exceed the capacity that Kellwood is able to provide, on attractive pricing terms or at all, under the terms of the Shared Services Agreement (as more fully described below in “—Problems with our distribution system could harm our ability to meet customer expectations, manage inventory, complete sales and achieve targeted operating efficiencies”). Our continued growth could strain our existing resources, and we could experience operating difficulties, including obtaining sufficient raw materials at acceptable prices, securing manufacturing capacity to produce our products and experiencing delays in production and shipments. These difficulties would likely lead to a decrease in net revenue, income from operations and the price of our common stock.
13
Table of Contents
Kellwood provides us with certain key services for our business, some of which we are in the process of transitioning to our own systems. If Kellwood fails to perform its obligations to us during the period of transition or if we cannot successfully transition these services to our own systems, our business, financial condition, results of operations and cash flows could be materially harmed.
Prior to the IPO and Restructuring Transactions that closed on November 27, 2013, we operated as a business unit of Kellwood, and we historically relied on the financial resources and the administrative and operational support systems of Kellwood to run our business. Some of the Kellwood systems we continue to use following the IPO and Restructuring Transactions include ERP, human resource management systems and distribution applications. In conjunction with our separation from Kellwood, we are in the process of separating our assets from those of Kellwood. We have recently commenced the development and implementation of our own ERP system and IT infrastructure, engaged with a new e-commerce platform provider and migrated the human resource recruitment system. The new systems we implement may not operate as successfully as the systems we historically used as such systems are highly customized or proprietary. Moreover, we may be unable to obtain necessary goods, technology and services to continue replacing the Kellwood systems at prices and on terms as favorable as those available to us prior to the separation, which could increase our costs and reduce our profitability. If we fail to successfully transition the systems, our business and results of operations may be materially and adversely affected.
We entered into a Shared Services Agreement in connection with the IPO and Restructuring Transactions on November 27, 2013. The Shared Services Agreement governs the provisions by which Kellwood provides certain support services to us, including distribution, information technology and back office support. Kellwood will provide these services until we elect to terminate the provision thereof in accordance with the terms of such agreement or, for services which require a term as a matter of law or which are based on a third-party agreement with a set term, the related termination date specified in the schedule thereto. Upon the termination of certain services, Kellwood may no longer be in a position to provide certain other related services. Assuming we proceed with our request to terminate the original services, such related services shall also be terminated in connection with such termination. The Shared Services Agreement will terminate automatically upon the termination of all services provided thereunder, unless earlier terminated by either party in connection with the other party’s material breach upon 30 days prior notice to such defaulting party. After termination of the agreement, Kellwood will have no obligation to provide any services to us. See “Shared Services Agreement” under Note 15 to the Consolidated Financial Statements in this annual report on Form 10-K for a description of these services. The services provided under the Shared Services Agreement (as may be amended from time to time) may not be sufficient to meet our needs and we may not be able to replace these services at favorable costs and on favorable terms, if at all. In addition, Kellwood has experienced financial difficulty in the past. For example, in 2009, Kellwood’s independent auditors raised substantial doubt regarding Kellwood’s ability to continue as a going concern. If Kellwood encounters any issues during the transitional period which impact its ability to provide services pursuant to the Shared Services Agreement, our business could be materially harmed. Any failure or significant downtime in our own financial or administrative systems or in Kellwood’s financial or administrative systems during the transitional period and any difficulty in separating our assets from Kellwood’s assets and integrating newly acquired assets into our business could result in unexpected costs, impact our results or prevent us from paying our suppliers and employees and performing other administrative services on a timely basis and materially harm our business, financial condition, results of operations and cash flows.
System security risk issues could disrupt our internal operations or information technology services, and any such disruption could negatively impact our net sales, increase our expenses and harm our reputation.
Experienced computer programmers and hackers, and even internal users, may be able to penetrate our network security and misappropriate our confidential information or that of third parties, including our customers, create system disruptions or cause shutdowns. In addition, employee error, malfeasance or other errors in the storage, use or transmission of any such information could result in a disclosure to third parties outside of our network. As a result, we could incur significant expenses addressing problems created by any such
14
Table of Contents
inadvertent disclosure or any security breaches of our network. This risk is heightened because we collect and store customer information, including credit card information, and use certain customer information for our marketing purposes. In addition, we rely on third parties for the operation of our website, www.vince.com, and for the various social media tools and websites we use as part of our marketing strategy.
Consumers are increasingly concerned over the security of personal information transmitted over the internet, consumer identity theft and user privacy, and any compromise of customer information could subject us to customer or government litigation and harm our reputation, which could adversely affect our business and growth. Moreover, we could incur significant expenses or disruptions of our operations in connection with system failures or breaches. In addition, sophisticated hardware and operating system software and applications that we procure form third parties may contain defects in design or manufacture, including “bugs” and other problems that could unexpectedly interfere with the operation of our systems. The costs to us to eliminate or alleviate security problems, viruses and bugs, or any problems associated with the outsourced services could be significant, and the efforts to address these problems could result in interruptions, delays or cessation of service that may impede our sales, distribution or other critical functions. In addition to taking the necessary precautions ourselves, we require that third-party service providers implement reasonable security measures to protect our customers’ identity and privacy. We do not, however, control these third-party service providers and cannot guarantee that no electronic or physical computer break-ins and security breaches will occur in the future. Finally, we could incur significant costs in complying with the multitude of state, federal and foreign laws regarding the use and unauthorized disclosure of personal information, to the extent they are applicable.
Any disputes that arise between us and Kellwood with respect to our past and ongoing relationships could harm our business operations.
Disputes may arise between Kellwood and us in a number of areas relating to our past and ongoing relationships, including:
| • | intellectual property and technology matters; |
| • | labor, tax, employee benefit, indemnification and other matters arising from our separation from Kellwood; |
| • | employee retention and recruiting; |
| • | business combinations involving us; |
| • | the nature, quality and pricing of transitional services Kellwood has agreed to provide us; and |
| • | business opportunities that may be attractive to both Kellwood and us. |
We may not be able to resolve any potential conflicts, and even if we do, the resolution may be less favorable than if we were dealing with an unaffiliated party. As of January 31, 2015, affiliates of Sun Capital, who also control Kellwood, owned approximately 55% of our common stock. Additionally, Sun Cardinal, LLC, an affiliate of Sun Capital, has the ability to designate a majority of our directors.
Our limited operating experience and brand recognition in international markets may delay our expansion strategy and cause our business and growth to suffer.
We face additional risks with respect to our strategy to expand internationally, including our efforts to further expand our business in Canada, select European countries, Asia and the Middle East through arrangements with international partners. Our current operations are based largely in the U.S., with international sales representing approximately 9% of net sales for fiscal 2014. Therefore we have a limited number of customers and experience in operating outside of the U.S. We also do not have extensive experience with regulatory environments and market practices outside of the U.S. and cannot guarantee, notwithstanding our international partners’ familiarity with such environments and market practices, that we will be able to penetrate or successfully operate in any market outside of the U.S. Many of these markets have different operational
15
Table of Contents
characteristics, including employment and labor regulations, transportation, logistics, real estate (including lease terms) and local reporting or legal requirements. Furthermore, consumer demand and behavior, as well as style preferences, size and fit, and purchasing trends, may differ in these markets and, as a result, sales of our product may not be successful, or the margins on those sales may not be in line with those that we currently anticipate. In addition, in many of these markets there is significant competition to attract and retain experienced and talented employees. Failure to develop new markets outside of the U.S. or disappointing sales growth outside of the U.S. may harm our business and results of operations.
Our plans to improve and expand our product offerings may not be successful, and the implementation of these plans may divert our operational, managerial and administrative resources, which could harm our competitive position and reduce our net revenue and profitability.
In addition to our store expansion strategy, we plan to grow our business by increasing our core product offerings, which includes expanding our men’s collection and women’s bottoms, dresses and outerwear assortment. We also plan to develop and introduce select new product categories and may pursue select additional licensing opportunities such as eyewear, fragrance and fashion accessories.
The principal risks to our ability to successfully carry out our plans to improve and expand our product offerings are that:
| • | if our expected product offerings fail to maintain and enhance our brand identity, our image may be diminished or diluted and our sales may decrease; |
| • | if we fail to find and enter into relationships with external partners with the necessary specialized expertise or execution capabilities, we may be unable to offer our planned product extensions or to realize the additional revenue we have targeted for those extensions; and |
| • | the use of licensing partners may limit our ability to conduct comprehensive final quality checks on merchandise before it is shipped to our stores or to our wholesale partners. |
In addition, our ability to successfully carry out our plans to improve and expand our product offerings may be affected by economic and competitive conditions, changes in consumer spending patterns and changes in consumer preferences and style trends. These plans could be abandoned, could cost more than anticipated and could divert resources from other areas of our business, any of which could impact our competitive position and reduce our net revenue and profitability.
Our current and future licensing arrangements may not be successful and may make us susceptible to the actions of third parties over whom we have limited control.
We currently have licensing agreements for women’s footwear, men’s footwear and children’s apparel. In the future, we may enter into select additional licensing arrangements for product offerings which require specialized expertise. We may also enter into select licensing agreements pursuant to which we may grant third parties the right to distribute and sell our products in certain geographic areas. Although we have taken and will continue to take steps to select potential licensing partners carefully and monitor the activities of our licensing partners (through, among other things, approval rights over product design, production quality, packaging, merchandising, marketing, distribution and advertising), such arrangements may not be successful. Our licensing partners may fail to fulfill their obligations under their license agreements or have interests that differ from or conflict with our own, such as the pricing of our products and the offering of competitive products. In addition, the risks applicable to the business of our licensing partners may be different than the risks applicable to our business, including risks associated with each such partner’s ability to:
| • | obtain capital; |
| • | exercise operational and financial control over its business; |
16
Table of Contents
| • | manage its labor relations; |
| • | maintain relationships with suppliers; |
| • | manage its credit and bankruptcy risks; and |
| • | maintain customer relationships. |
Any of the foregoing risks, or the inability of any of our licensing partners to successfully market our products or otherwise conduct its business, may result in loss of revenue and competitive harm to our operations in regions or product categories where we have entered into such licensing arrangements.
Our business will suffer if we fail to respond to changing customer tastes.
Customer tastes can change rapidly. We may not be able to anticipate, gauge or respond to these changes within a timely manner. We may also not be able to continue to satisfy our customers’ existing tastes and preferences. If we misjudge the market for products or product groups, or if we fail to identify and respond appropriately to changing consumer demands, we may be faced with unsold finished goods inventory, which could materially adversely affect expected operating results and decrease sales, gross margins and profitability.
If we are unable to accurately forecast customer demand for our products, our manufacturers may not be able to deliver products to meet our requirements, and this could result in delays in the shipment of products to our stores and to wholesale partners.
We stock our stores, and provide inventory to our wholesale partners, based on our or their estimates of future demand for particular products. Our inventory management and planning team determines the number of pieces of each product that we will order from our manufacturers based upon past sales of similar products, sales trend information and anticipated demand at our suggested retail prices. However, if our inventory and planning team fails to accurately forecast customer demand, we may experience excess inventory levels or a shortage of products. There can be no assurance that we will be able to successfully manage our inventory at a level appropriate for future customer demand.
Factors that could affect our inventory management and planning team’s ability to accurately forecast customer demand for our products include:
| • | a substantial increase or decrease in demand for our products or for products of our competitors; |
| • | our failure to accurately forecast customer acceptance for our new products; |
| • | new product introductions or pricing strategies by competitors; |
| • | more limited historical store sales information for our newer markets; |
| • | weakening of economic conditions or consumer confidence in the future, which could reduce demand for discretionary items, such as our products; and |
| • | acts or threats of war or terrorism which could adversely affect consumer confidence and spending or interrupt production and distribution of our products and our raw materials. |
Because of our rapid growth, we have occasionally placed insufficient levels of desirable product with our wholesale partners and in our retail locations such that we were unable to fully satisfy customer demand at those locations. We cannot guarantee that we will be able to match supply with demand in all cases in the future, whether as a result of our inability to produce sufficient levels of desirable product or our failure to forecast demand accurately. As a result of these inabilities or failures, we may encounter difficulties in filling customer orders or in liquidating excess inventory at discount prices and may experience significant write-offs. Additionally, if we over-produce a product based on an aggressive forecast of demand, retailers may not be able to sell the product and cancel future orders or require give backs. These outcomes could have a material adverse effect on brand image and adversely impact sales, gross margins and profitability.
17
Table of Contents
Our senior management team has limited experience working together as a group, and may not be able to manage our business effectively.
Our CEO, Jill Granoff, and CFO, Lisa Klinger, joined the company in 2012. Many of the other members of our senior management team, including our President and Chief Creative Officer, Karin Gregersen, have been with us less than 2 years. As a result, our senior management team has limited experience working together as a group. This lack of shared experience could negatively impact our senior management team’s ability to quickly and efficiently respond to problems and effectively manage our business. If our management team is not able to work together as a group, our results of operations may suffer and our business may be harmed.
If we lose key personnel, or are unable to attract, assimilate and retain new employees, we may not be able to successfully operate or grow our business.
Our continued success is dependent on the ability to attract, assimilate, retain and motivate qualified management, designers, administrative talent and sales associates to support existing operations and future growth. Competition for qualified talent in the apparel and fashion industry is intense, and we compete for these individuals with other companies that in many cases have greater financial and other resources. The loss of the services of any members of senior management or the inability to attract and retain other qualified executives could have a material adverse effect on our business, results of operations and financial condition. In addition, we will need to continue to attract, assimilate, retain and motivate highly talented employees with a range of other skills and experience, especially at the store management levels. Although we have hired and trained new store managers and experienced sales associates at several of our retail locations, competition for employees in our industry is intense and we may from time to time experience difficulty in retaining our associates or attracting the additional talent necessary to support the growth of our business. These problems could be exacerbated as we embark on our strategy of opening new retail stores over the next several years. We will also need to attract, assimilate and retain other professionals across a range of disciplines, including design, production, sourcing and international business, as we develop new product categories and continue to expand our international presence. Furthermore, we will need to continue to recruit employees to provide, or enter into consulting or outsourcing arrangements with respect to the provision of, services provided by Kellwood under the Shared Services Agreement when Kellwood no longer provides such services thereunder. If we are unable to attract, assimilate and retain additional employees with the necessary skills, we may not be able to grow or successfully operate our business.
Our competitive position could suffer if our intellectual property rights are not protected.
We believe that our trademarks and designs are of great value. From time to time, third parties have challenged, and may in the future try to challenge, our ownership of our intellectual property. In some cases, third parties with similar trademarks or other intellectual property may have pre-existing and potentially conflicting trademark registrations. We rely on cooperation from third parties with similar trademarks to be able to register our trademarks in jurisdictions in which such third parties have already registered their trademarks. We are susceptible to others imitating our products and infringing our intellectual property rights. Imitation or counterfeiting of our products or infringement of our intellectual property rights could diminish the value of our brands or otherwise adversely affect our revenues. The actions we have taken to establish and protect our trademarks and other intellectual property rights may not be adequate to prevent imitation of our products by others or to prevent others from seeking to invalidate our trademarks or block sales of our products as a violation of the trademarks and intellectual property rights of others. In addition, others may assert rights in, or ownership of, our trademarks and other intellectual property rights or in similar marks or marks that we license and/or market and we may not be able to successfully resolve these conflicts to our satisfaction. We may need to resort to litigation to enforce our intellectual property rights, which could result in substantial costs and diversion of resources. Successful infringement claims against us could result in significant monetary liability or prevent us from selling some of our products. In addition, resolution of claims may require us to redesign our products, license rights from third parties or cease using those rights altogether. Any of these events could harm our business and cause our results of operations, liquidity and financial condition to suffer.
18
Table of Contents
We license our website domain name from a third-party. Pursuant to the license agreement (the “Domain License Agreement”), our license to use www.vince.com will expire in 2018 and will automatically renew for successive one year periods, subject to our right to terminate the arrangement with or without cause; provided, that we must pay the applicable early termination fee and provide 30 days prior notice in connection with a termination without cause. The licensor has no termination rights under the Domain License Agreement. Any failure by the licensor to perform its obligations under the License Agreement could adversely affect our brand and make it more difficult for users to find our website.
Problems with our distribution system could harm our ability to meet customer expectations, manage inventory, complete sales and achieve targeted operating efficiencies.
In the U.S., we rely on a distribution facility operated by Kellwood in City of Industry, California. Our ability to meet the needs of our wholesale partners and our own retail stores depends on the proper operation of this distribution facility. Kellwood will continue to provide distribution services, until we elect to terminate such services, as part of the Shared Services Agreement. We also have a warehouse in Belgium operated by a third-party logistics provider to support our wholesale orders for customers located primarily in Europe. There can be no assurance that we will be able to enter into other contracts for an alternate or replacement distribution centers on acceptable terms or at all. Such an event could disrupt our operations. In addition, because substantially all of our products are distributed from one location, our operations could also be interrupted by labor difficulties, or by floods, fires, earthquakes or other natural disasters near such facility. For example, a majority of our ocean shipments go through the ports in Los Angeles, which were recently subject to significant processing delays due to labor issues involving the port workers. We maintain business interruption insurance and are a beneficiary under similar Kellwood insurance policies related to Kellwood assets or services we utilize under the Shared Services Agreement. These policies, however, may not adequately protect us from the adverse effects that could result from significant disruptions to our distribution system. If we encounter problems with our distribution system, our ability to meet customer expectations, manage inventory, complete sales and achieve targeted operating efficiencies could be harmed. Any of the foregoing factors could have a material adverse effect on our business, financial condition and operating results.
The extent of our foreign sourcing may adversely affect our business.
Our products are primarily produced by, and purchased or procured from, independent manufacturing contractors located outside of the U.S., with approximately 96% of our total revenue for fiscal 2014 attributable to manufacturing contractors located outside of the U.S. These manufacturing contractors are located mainly in countries in Asia and South America, with approximately 88% of our purchases for fiscal 2014 attributable to manufacturing contractors located in China. A manufacturing contractor’s failure to ship products to us in a timely manner or to meet the required quality standards could cause us to miss the delivery date requirements of our customers for those items. The failure to make timely deliveries may cause customers to cancel orders, refuse to accept deliveries or demand reduced prices, any of which could have a material adverse effect on us. As a result of the magnitude of our foreign sourcing, our business is subject to the following risks:
| • | political and economic instability in countries or regions, especially Asia, including heightened terrorism and other security concerns, which could subject imported or exported goods to additional or more frequent inspections, leading to delays in deliveries or impoundment of goods; |
| • | imposition of regulations, quotas and other trade restrictions relating to imports, including quotas imposed by bilateral textile agreements between the U.S. and foreign countries; |
| • | imposition of increased duties, taxes and other charges on imports; |
| • | labor union strikes at ports through which our products enter the U.S.; |
| • | labor shortages in countries where contractors and suppliers are located; |
| • | a significant decrease in availability or an increase in the cost of raw materials; |
19
Table of Contents
| • | restrictions on the transfer of funds to or from foreign countries; |
| • | disease epidemics and health-related concerns, which could result in closed factories, reduced workforces, scarcity of raw materials and scrutiny or embargoing of goods produced in infected areas; |
| • | the migration and development of manufacturing contractors, which could affect where our products are or are planned to be produced; |
| • | increases in the costs of fuel, travel and transportation; |
| • | reduced manufacturing flexibility because of geographic distance between our foreign manufacturers and us, increasing the risk that we may have to mark down unsold inventory as a result of misjudging the market for a foreign-made product; and |
| • | violations by foreign contractors of labor and wage standards and resulting adverse publicity. |
If these risks limit or prevent us from manufacturing products in any significant international market, prevent us from acquiring products from foreign suppliers, or significantly increase the cost of our products, our operations could be seriously disrupted until alternative suppliers are found or alternative markets are developed, which could negatively impact our business.
We do not have written agreements with any of our third-party manufacturing contractors. As a result, any single manufacturing contractor could unilaterally terminate its relationship with us at any time. One of our manufacturers in China, with whom we have worked for over five years, accounted for the production of approximately 16% of our finished products during fiscal 2014. Supply disruptions from this manufacturer (or any of our other manufacturers) could have a material adverse effect on our ability to meet customer demands, if we are unable to source suitable replacement materials at acceptable prices or at all. Our inability to promptly replace manufacturing contractors that terminate their relationships with us or cease to provide high quality products in a timely and cost-efficient manner could have a material adverse effect on our business, financial condition and operating results.
Fluctuations in the price, availability and quality of raw materials could cause delays and increase costs and cause our operating results and financial condition to suffer.
Fluctuations in the price, availability and quality of the fabrics or other raw materials, particularly cotton, silk, leather and synthetics used in our manufactured apparel, could have a material adverse effect on cost of sales or our ability to meet customer demands. The prices of fabrics depend largely on the market prices of the raw materials used to produce them. The price and availability of the raw materials and, in turn, the fabrics used in our apparel may fluctuate significantly, depending on many factors, including crop yields, weather patterns, labor costs and changes in oil prices. We may not be able to create suitable design solutions that utilize raw materials with attractive prices or, alternatively, to pass higher raw materials prices and related transportation costs on to our customers. We are not always successful in our efforts to protect our business from the volatility of the market price of raw materials, and our business can be materially affected by dramatic movements in prices of raw materials. The ultimate effect of this change on our earnings cannot be quantified, as the effect of movements in raw materials prices on industry selling prices are uncertain, but any significant increase in these prices could have a material adverse effect on our business, financial condition and operating results.
Our reliance on independent manufacturers could cause delays or quality issues which could damage customer relationships.
We use independent manufacturers to assemble or produce all of our products, whether inside or outside the U.S. We are dependent on the ability of these independent manufacturers to adequately finance the production of goods ordered and maintain sufficient manufacturing capacity. The use of independent manufacturers to produce finished goods and the resulting lack of direct control could subject us to difficulty in obtaining timely delivery of products of acceptable quality. We generally do not have long-term contracts with any independent
20
Table of Contents
manufacturers. Alternative manufacturers, if available, may not be able to provide us with products or services of a comparable quality, at an acceptable price or on a timely basis. Identifying a suitable supplier is an involved process that requires us to become satisfied with their quality control, responsiveness and service, financial stability and labor and other ethical practices. There can be no assurance that there will not be a disruption in the supply of our products from independent manufacturers or, in the event of a disruption, that we would be able to substitute suitable alternative manufacturers in a timely manner. The failure of any independent manufacturer to perform or the loss of any independent manufacturer could have a material adverse effect on our business, results of operations and financial condition.
If our independent manufacturers fail to use ethical business practices and comply with applicable laws and regulations, our brand image could be harmed due to negative publicity.
We have established and currently maintain operating guidelines which promote ethical business practices such as fair wage practices, compliance with child labor laws and other local laws. While we monitor compliance with those guidelines, we do not control our independent manufacturers or their business practices. Accordingly, we cannot guarantee their compliance with our guidelines. A lack of demonstrated compliance could lead us to seek alternative suppliers, which could increase our costs and result in delayed delivery of our products, product shortages or other disruptions of our operations.
Violation of labor or other laws by our independent manufacturers or the divergence of an independent manufacturer’s labor or other practices from those generally accepted as ethical in the U.S. or other markets in which we do business could also attract negative publicity for us and our brand. From time to time, our audit results have revealed a lack of compliance in certain respects, including with respect to local labor, safety and environmental laws. Other fashion companies have faced criticism after highly-publicized incidents or compliance issues have occurred or been exposed at factories producing their products. To the extent our manufacturers do not bring their operations into compliance with such laws or resolve material issues identified in any of our audit results, we may face similar criticism and negative publicity. This could diminish the value of our brand image and reduce demand for our merchandise. In addition, other fashion companies have encountered organized boycotts of their products in such situations. If we, or other companies in our industry, encounter similar problems in the future, it could harm our brand image, stock price and results of operations.
Monitoring compliance by independent manufacturers is complicated by the fact that expectations of ethical business practices continually evolve, may be substantially more demanding than applicable legal requirements and are driven in part by legal developments and by diverse groups active in publicizing and organizing public responses to perceived ethical shortcomings. Accordingly, we cannot predict how such expectations might develop in the future and cannot be certain that our guidelines would satisfy all parties who are active in monitoring and publicizing perceived shortcomings in labor and other business practices worldwide.
Our operating results are subject to seasonal and quarterly variations in our net revenue and income from operations, which could cause the price of our common stock to decline.
We have experienced, and expect to continue to experience, seasonal variations in our net revenue and income from operations. Seasonal variations in our net revenue are primarily related to increased sales of our products during our fiscal third and fourth quarters, reflecting our historical strength in sales during the fall and holiday seasons. Historically, seasonable variations in our income from operations have been driven principally by increased net revenue in such fiscal quarters.
Our rapid growth may have overshadowed whatever seasonal or cyclical factors might have influenced our business to date. In addition, as our revenue mix evolves over time to include more sales from additional retail stores, we may see an increase in the percentage of sales occurring during the fourth quarter. Such seasonal or cyclical variations in our business may harm our results of operations in the future, if we do not plan inventory appropriately, if customer shopping patterns fluctuate during such seasonal periods or if bad weather during the fourth quarter constrains shopping activity.
21
Table of Contents
Any future seasonal or quarterly fluctuations in our results of operations may not match the expectations of market analysts and investors to assess the longer-term profitability and strength of our business at any particular point, which could lead to increased volatility in our stock price. Increased volatility could cause our stock price to suffer in comparison to less volatile investments.
We are subject to risks associated with leasing retail and office space, are generally subject to long-term non-cancelable leases and are required to make substantial lease payments under our operating leases, and any failure to make these lease payments when due would likely harm our business, profitability and results of operations.
We do not own any of our stores, or our offices including our New York and Los Angeles offices, or our showroom space in Paris but instead lease all of such space under operating leases. Our leases generally have initial terms of 10 years, and generally can be extended only for one additional 5-year term. All of our leases require a fixed annual rent, and most require the payment of additional rent if store sales exceed a negotiated amount. Most of our leases are “net” leases, which require us to pay all of the cost of insurance, taxes, maintenance and utilities, and we generally cannot cancel these leases at our option. Additionally, certain of our leases allow the lessor to terminate the lease if we do not achieve a specified gross sales threshold. We have experienced circumstances in the past where landlords have attempted to invoke these contractual provisions. Although we believe we will achieve the required threshold to continue those leases, we cannot assure you that we will do so. Any loss of our store locations due to underperformance may harm our results of operations, stock price and reputation.
Payments under these leases account for a significant portion of our selling, general and administrative expenses. For example, as of January 31, 2015, we were a party to operating leases associated with our retail stores and our office and showroom spaces requiring future minimum lease payments of $15.6 million in the aggregate through fiscal 2015 and approximately $134.5 million thereafter. We expect that any new retail stores we open will also be leased by us under operating leases, which will further increase our operating lease expenses and require significant capital expenditures. Our substantial operating lease obligations could have significant negative consequences, including, among others:
| • | increasing our vulnerability to general adverse economic and industry conditions; |
| • | limiting our ability to obtain additional financing; |
| • | requiring a substantial portion of our available cash to pay our rental obligations, thus reducing cash available for other purposes; |
| • | limiting our flexibility in planning for or reacting to changes in our business or in the industry in which we compete; and |
| • | placing us at a disadvantage with respect to some of our competitors. |
We depend on cash flow from operations to pay our lease expenses and to fulfill our other cash needs. If our business does not generate sufficient cash flow from operating activities, and sufficient funds are not otherwise available to us from borrowings under our credit facilities or from other sources, we may not be able to service our operating lease expenses, grow our business, respond to competitive challenges or fund our other liquidity and capital needs, which would harm our business.
In addition, additional sites that we lease are likely to be subject to similar long-term non-cancelable leases. If an existing or future store is not profitable, and we decide to close it, we may nonetheless be committed to perform our obligations under the applicable lease including, among other things, paying the base rent for the balance of the lease term if we cannot negotiate a mutually acceptable termination payment. In addition, as our leases expire, we may fail to negotiate renewals, either on commercially acceptable terms or at all, which could cause us to close stores in desirable locations or incur costs in relocating our office space. Of our existing leases, no existing retail leases expire in fiscal 2015. If we are unable to enter into new leases or renew existing leases on terms acceptable to us or be released from our obligations under leases for stores that we close, our business, profitability and results of operations may be harmed.
22
Table of Contents
The Patient Protection and Affordable Care Act may materially increase our costs and/or make it harder for us to compete as an employer.
The Patient Protection and Affordable Care Act imposed new mandates on employers, requiring employers with 50 or more full-time employees to provide “credible” health insurance to employees or pay a financial penalty. Given our current health plan design, and assuming the law is implemented without significant changes, these mandates could materially increase our costs. Moreover, if we choose to opt out of offering health insurance to our employees, we may become less attractive as an employer and it may be harder for us to compete for qualified employees.
Changes in laws, including employment laws and laws related to our merchandise, could make conducting our business more expensive or otherwise change the way we do business.
We are subject to numerous regulations, including labor and employment, customs, truth-in-advertising, consumer protection, and zoning and occupancy laws and ordinances that regulate retailers generally or govern the importation, promotion and sale of merchandise and the operation of stores and warehouse facilities. If these regulations were to change or were violated by our management, employees, vendors, independent manufacturers or partners, the costs of certain goods could increase, or we could experience delays in shipments of our products, be subject to fines or penalties, or suffer reputational harm, which could reduce demand for our merchandise and hurt our business and results of operations.
In addition to increased regulatory compliance requirements, changes in laws could make ordinary conduct of business more expensive or require us to change the way we do business. For example, changes in federal and state minimum wage laws could raise the wage requirements for certain of our employees at our retail locations, which would increase our selling costs and may cause us to reexamine our wage structure for such employees. Other laws related to employee benefits and treatment of employees, including laws related to limitations on employee hours, supervisory status, leaves of absence, mandated health benefits, overtime pay, unemployment tax rates and citizenship requirements, could negatively impact us, by increasing compensation and benefits costs which would in turn reduce our profitability.
Moreover, changes in product safety or other consumer protection laws could lead to increased costs to us for certain merchandise, or additional labor costs associated with readying merchandise for sale. It is often difficult for us to plan and prepare for potential changes to applicable laws and future actions or payments related to such changes could be material to us.
Our operations are restricted by our new credit facilities entered into on November 27, 2013.
We entered into a revolving credit facility and a term loan facility in connection with the IPO and Restructuring Transactions closed on November 27, 2013. Our new facilities contain significant restrictive covenants. These covenants may impair our financing and operational flexibility and make it difficult for us to react to market conditions and satisfy our ongoing capital needs and unanticipated cash requirements. Specifically, such covenants will likely restrict our ability and, if applicable, the ability of our subsidiaries to, among other things:
| • | incur additional debt; |
| • | make certain investments and acquisitions; |
| • | enter into certain types of transactions with affiliates; |
| • | use assets as security in other transactions; |
| • | pay dividends; |
| • | sell certain assets or merge with or into other companies; |
23
Table of Contents
| • | guarantee the debt of others; |
| • | enter into new lines of businesses; |
| • | make capital expenditures; |
| • | prepay, redeem or exchange our debt; and |
| • | form any joint ventures or subsidiary investments. |
Our ability to comply with the covenants and other terms of our debt obligations will depend on our future operating performance. If we fail to comply with such covenants and terms, we would be required to obtain waivers from our lenders to maintain compliance with our debt obligations. If we are unable to obtain any necessary waivers and the debt is accelerated, a material adverse effect on our financial condition and future operating performance would likely result. The terms of our debt obligations may restrict or delay our ability to fulfill our obligations under the Tax Receivable Agreement. In accordance with the terms of the Tax Receivable Agreement, delayed or unpaid amounts thereunder would accrue interest at a default rate of one-year LIBOR plus 200 basis points until paid. Our obligations under the Tax Receivable Agreement could result in a failure to comply with covenants or financial ratios required by our debt financing agreements and could result in an event of default under such a debt financing. See “Tax Receivable Agreement” under Note 15 to the Consolidated Financial Statements in this annual report on Form 10-K for further information.
We are required to pay to the Pre-IPO Stockholders 85% of certain tax benefits, and could be required to make substantial cash payments in which our stockholders will not participate.
We entered into a Tax Receivable Agreement with the Pre-IPO Stockholders in connection with the IPO and Restructuring Transactions which closed on November 27, 2013. Under the Tax Receivable Agreement, we will be obligated to pay to the Pre-IPO Stockholders an amount equal to 85% of the cash savings in federal, state and local income tax realized by us by virtue of our future use of the federal, state and local net operating losses (“NOLs”) held by us as of November 27, 2013, together with section 197 intangible deductions (collectively, the “Pre-IPO Tax Benefits”). “Section 197 intangible deductions” means amortization deductions with respect to certain amortizable intangible assets which are held by us and our subsidiaries immediately after November 27, 2013. Cash tax savings generally will be computed by comparing our actual federal, state and local income tax liability to the amount of such taxes that we would have been required to pay had such Pre-IPO Tax Benefits not been available to us. While payments made under the Tax Receivable Agreement will depend upon a number of factors, including the amount and timing of taxable income we generate in the future and any future limitations that may be imposed on our ability to use the Pre-IPO Tax Benefits, the payments could be substantial. Assuming the federal, state and local corporate income tax rates presently in effect, no material change in applicable tax law and no limitation on our ability to use the Pre-IPO Tax Benefits under Section 382 of the U.S. Internal Revenue Code, as amended (the “Code”), the estimated cash benefit of the full use of these Pre-IPO Tax Benefits would be approximately $202 million, of which 85%, or approximately $172 million, is potentially payable to the Pre-IPO Stockholders under the terms of the Tax Receivable Agreement. The Tax Receivable Agreement accordingly could require us to make substantial cash payments.
Although we are not aware of any issue that would cause the U.S. Internal Revenue Service (the “IRS”) to challenge any tax benefits arising under the Tax Receivable Agreement, the affiliates of Sun Capital will not reimburse us for any payments previously made if such benefits subsequently were disallowed, although the amount of any tax savings subsequently disallowed will reduce any future payment otherwise owed to the Pre-IPO Stockholders. For example, if our determinations regarding the applicability (or lack thereof) and amount of any limitations on the NOLs under Section 382 of the Code were to be successfully challenged by the IRS after payments relating to such NOLs had been made to the Pre-IPO Stockholders, we would not be reimbursed by the Pre-IPO Stockholders and our recovery would be limited to the extent of future payments (if any) otherwise remaining under the Tax Receivable Agreement. As a result, in such circumstances we could make payments to the Pre-IPO Stockholders under the Tax Receivable Agreement in excess of our actual cash
24
Table of Contents
tax savings. Furthermore, while we will generally only make payments under the Tax Receivable Agreement after we have recognized a cash flow benefit from the utilization of the Pre-IPO Tax Benefits (other than upon a change of control or other acceleration event), the payments required under the agreement could require us to use a substantial portion of our cash from operations for those purposes.
At the effective date of the Tax Receivable Agreement, the liability recognized was accounted for in our financial statements as a reduction of additional paid-in capital. Subsequent changes in the Tax Receivable Agreement liability will be recorded through earnings in operating expenses. Even if the NOLs are available to us, the Tax Receivable Agreement will operate to transfer 85% of the benefit to the Pre-IPO Stockholders. Additionally, the payments we make to the Pre-IPO Stockholders under the Tax Receivable Agreement are not expected to give rise to any incidental tax benefits to us, such as deductions or an adjustment to the basis of our assets.
Federal and state laws impose substantial restrictions on the utilization of NOL carry-forwards in the event of an “ownership change,” as defined in Section 382 of the Code. Under the rules, such an ownership change is generally any change in ownership of more than 50 percent of a company’s stock within a rolling three-year period, as calculated in accordance with the rules. The rules generally operate by focusing on changes in ownership among stockholders considered by the rules as owning directly or indirectly 5% or more of the stock of the company and any change in ownership arising from new issuances of stock by the company.
While we have performed an analysis under Section 382 of the Code that indicates the IPO and Restructuring Transactions would not constitute an ownership change, such technical guidelines are complex and subject to significant judgment and interpretation. With the IPO and Restructuring Transactions and other transactions that have occurred over the past three years, we may trigger or have already triggered an “ownership change” limitation. We may also experience ownership changes in the future as a result of subsequent shifts in stock ownership. As a result, if we earn net taxable income, our ability to use the pre-change NOL carry-forwards (after giving effect to payments to be made to the Pre-IPO Stockholders under the Tax Receivable Agreement) to offset U.S. federal taxable income may be subject to limitations, which could potentially result in increased future tax liability to us. Notwithstanding the foregoing, our analysis to date under Section 382 of the Code indicates that the IPO Restructuring Transactions have not triggered an “ownership change” limitation.
If we did not enter into the Tax Receivable Agreement, we would be entitled to realize the full economic benefit of the Pre-IPO Tax Benefits, to the extent allowed by federal, state and local law, including Section 382 of the Code. Subject to exceptions, the Tax Receivable Agreement is designed with the objective of causing our annual cash costs attributable to federal state and local income taxes (without regard to our continuing 15% interest in the Pre-IPO Tax Benefits) to be the same as we would have paid had we not had the Pre-IPO Tax Benefits available to offset our federal, state and local taxable income. As a result, we will not be entitled to the economic benefit of the Pre-IPO Tax Benefits that would have been available if the Tax Receivable Agreement were not in effect (except to the extent of our continuing 15% interest in the Pre-IPO Tax Benefits).
In certain cases, payments under the Tax Receivable Agreement to the Pre-IPO stockholders may be accelerated and/or significantly exceed the actual benefits we realize in respect of the Pre-IPO Tax Benefits.
Upon the election of an affiliate of Sun Capital to terminate the Tax Receivable Agreement pursuant to a change in control (as defined in the Tax Receivable Agreement) or upon our election to terminate the Tax Receivable Agreement early, all of our payment and other obligations under the Tax Receivable Agreement will be accelerated and will become due and payable. Additionally, the Tax Receivable Agreement provides that in the event that we breach any of our material obligations under the Tax Receivable Agreement by operation of law as a result of the rejection of the Tax Receivable Agreement in a case commenced under Title 11 of the United States Code (the “Bankruptcy Code”) then all of our payment and other obligations under the Tax Receivable Agreement will be accelerated and will become due and payable.
25
Table of Contents
In the case of any such acceleration, we would be required to make an immediate payment equal to 85% of the present value of the tax savings represented by any portion of the Pre-IPO Tax Benefits for which payment under the Tax Receivable Agreement has not already been made, which upfront payment may be made years in advance of the actual realization of such future benefits. Such payments could be substantial and could exceed our actual cash tax savings from the Pre-IPO Tax Benefits. In these situations, our obligations under the Tax Receivable Agreement could have a substantial negative impact on our liquidity and could have the effect of delaying, deferring or preventing certain mergers, asset sales, other forms of business combinations or other changes of control. There can be no assurance that we will have sufficient cash available or that we will be able to finance our obligations under the Tax Receivable Agreement.
If we were to elect to terminate the Tax Receivable Agreement, based on a discount rate equal to monthly LIBOR plus 200 basis points, we estimate that we would be required to pay approximately $159 million in the aggregate under the Tax Receivable Agreement.
We could incur significant costs in complying with environmental, health and safety laws or as a result of satisfying any liability or obligation imposed under such laws.
Our operations are subject to various federal, state, local and foreign environmental, health and safety laws and regulations. We could be held liable for the costs to address contamination of any real property ever owned, operated or used as a disposal site. In addition, in the event that Kellwood becomes financially incapable of addressing the environmental liability incurred prior to the structural reorganization separating Kellwood from Vince that occurred on November 27, 2013, a third party may file suit and attempt to allege that Kellwood and Vince engaged in a fraudulent transfer by arguing that the purpose of the separation of the non-Vince assets from Vince Holding Corp. was to insulate our assets from the environmental liability. For example, pursuant to a Consent Decree with the U.S. Environmental Protection Agency (“EPA”) and the State of Missouri, a non-Vince subsidiary, which was separated from us in the Restructuring Transactions, is conducting a cleanup of contamination at the site of a plant in New Haven, Missouri, which occurred between 1973 and 1985. Kellwood has posted a letter of credit in the amount of $5.9 million as a performance guarantee for the estimated cost of the required remediation work. If, despite the financial assurance provided by Kellwood as required by the EPA, Kellwood became financially unable to address this remediation, and if the corporate separateness of Vince is disregarded or if a fraudulent transfer is found to have occurred, we could be liable for the full amount of the remediation. If this were to occur or if we were to become liable for other environmental liabilities or obligations, it could have a material adverse effect on our business, financial condition or results of operations.
We will continue to incur significant expenses as a result of being a public company, which will negatively impact our financial performance and could cause our results of operations and financial condition to suffer.
We will continue to incur significant legal, accounting, insurance, share-based compensation and other expenses as a result of being a public company. The Sarbanes-Oxley Act, as well as related rules implemented by the SEC and the securities regulators and by the NYSE, have required changes in corporate governance practices of public companies. We expect that compliance with these laws, rules and regulations, including compliance with Section 404(b) of the Sarbanes-Oxley Act once we are no longer an emerging growth company, will substantially increase our expenses, including our legal and accounting costs, and make some activities more time-consuming and costly. We also expect these laws, rules and regulations to make it more expensive for us to obtain director and officer liability insurance and we may be required to accept reduced policy limits and coverage or to incur substantially higher costs to obtain the same or similar coverage. As a result, it may be more difficult for us to attract and retain qualified persons to serve on our board of directors or as officers. To assist in the recruitment of qualified directors, officers and other members of senior management and to help align their interests with those of our stockholders, we have made and intend to continue to make equity grants under our current management equity incentive plan (the “Vince 2013 Incentive Plan”). As a result of the foregoing, we expect an increase in legal, accounting, insurance, share-based compensation and certain other expenses in the future, which will negatively impact our financial performance and could cause our results of operations and financial condition to suffer.
26
Table of Contents
Risks Related to Our Structure and Ownership
We are a “controlled company,” controlled by investment funds advised by affiliates of Sun Capital, whose interests in our business may be different from yours.
Affiliates of Sun Capital owned approximately 55% of our outstanding common stock as of March 20, 2015. As such, affiliates of Sun Capital will, for the foreseeable future, have significant influence over our reporting and corporate management and affairs, and will be able to control virtually all matters requiring stockholder approval. For so long as affiliates of Sun Capital own 30% or more of our outstanding shares of common stock, Sun Cardinal, LLC, an affiliate of Sun Capital, will have the right to designate a majority of our board of directors. For so long as affiliates of Sun Capital have the right to designate a majority of our board of directors, the directors designated by affiliates of Sun Capital are expected to constitute a majority of each committee of our board of directors, other than the Audit Committee, and the chairman of each of the committees, other than the Audit Committee, is expected to be a director serving on such committee who is designated by affiliates of Sun Capital, provided that, at such time as we are not a “controlled company” under the NYSE corporate governance standards, our committee membership will comply with all applicable requirements of those standards and a majority of our board of directors will be “independent directors,” as defined under the rules of the NYSE (subject to applicable phase-in rules).
As a “controlled company,” the rules of the NYSE exempt us from the obligation to comply with certain corporate governance requirements, including the requirements that a majority of our board of directors consists of “independent directors,” as defined under such rules, and that we have nominating and corporate governance and compensation committees that are each composed entirely of independent directors. These exemptions do not modify the requirement for a fully independent audit committee, which we have. Similarly, once we are no longer a “controlled company,” we must comply with the independent board committee requirements as they relate to the nominating and corporate governance and compensation committees, which are permitted to be phased-in as follows: (1) one independent committee member on the date we cease to be a “controlled company”; (2) a majority of independent committee members within 90 days of such date; and (3) all independent committee members within one year of such date. Additionally, we will have 12 months from the date we cease to be a “controlled company” to have a majority of independent directors on our board of directors.
Affiliates of Sun Capital control actions to be taken by us, our board of directors and our stockholders, including amendments to our amended and restated certificate of incorporation and amended and restated bylaws and approval of significant corporate transactions, including mergers and sales of substantially all of our assets. The directors designated by affiliates of Sun Capital have the authority, subject to the terms of our indebtedness and the rules and regulations of the NYSE, to issue additional stock, implement stock repurchase programs, declare dividends and make other decisions. The NYSE independence standards are intended to ensure that directors who meet the independence standard are free of any conflicting interest that could influence their actions as directors. Our amended and restated certificate of incorporation provides that the doctrine of “corporate opportunity” does not apply against Sun Capital or its affiliates, or any of our directors who are associates of, or affiliated with, Sun Capital, in a manner that would prohibit them from investing in competing businesses or doing business with our partners or customers. It is possible that the interests of Sun Capital and its affiliates may in some circumstances conflict with our interests and the interests of our other stockholders, including you. For example, Sun Capital may have different tax positions from other stockholders which could influence their decisions regarding whether and when we should dispose of assets, whether and when we should incur new or refinance existing indebtedness, especially in light of the existence of the Tax Receivable Agreement, and whether and when we should terminate the Tax Receivable Agreement and accelerate our obligations thereunder. In addition, the structuring of future transactions may take into consideration tax or other considerations of Sun Capital and its affiliates even where no similar benefit would accrue to us. See “Tax Receivable Agreement” under Note 15 to the Consolidated Financial Statements in this annual report on Form 10-K for additional information.
27
Table of Contents
We are a holding company and we are dependent upon distributions from our subsidiaries to pay dividends, taxes and other expenses.
Vince Holding Corp. is a holding company with no material assets other than its ownership of membership interests in Vince Intermediate Holding, LLC, a holding company that has no material assets other than its interest in Vince, LLC. Neither Vince Holding Corp. nor Vince Intermediate Holding, LLC have any independent means of generating revenue. To the extent that we need funds, for a cash dividend to holders of our common stock or otherwise, and Vince Intermediate Holding, LLC or Vince, LLC is restricted from making such distributions under applicable law or regulation or is otherwise unable to provide such funds, it could materially adversely affect our liquidity and financial condition.
We file consolidated income tax returns on behalf of Vince Holding Corp. and Vince Intermediate Holding, LLC. Most of our future tax obligations will likely be attributed to the operations of Vince, LLC. Accordingly, most of the payments against the Tax Receivable Agreement will be attributed to the operations of Vince, LLC. We intend to cause Vince, LLC to pay distributions or make funds available to us in an amount sufficient to allow us to pay our taxes and any payments due to certain of our stockholders under the Tax Receivable Agreement. If, as a consequence of these various limitations and restrictions, we do not have sufficient funds to pay tax or other liabilities, we may have to borrow funds and thus our liquidity and financial condition could be materially adversely affected. To the extent that we are unable to make payments under the Tax Receivable Agreement for any reason, such payments will be deferred and will accrue interest at a default rate of one-year LIBOR plus 500 basis points until paid. See “Tax Receivable Agreement” under Note 15 to the Consolidated Financial Statements in this annual report on Form 10-K for more information regarding the terms of the Tax Receivable Agreement.
Anti-takeover provisions of Delaware law and our amended and restated certificate of incorporation and bylaws could delay and discourage takeover attempts that stockholders may consider to be favorable.
Our amended and restated certificate of incorporation and amended and restated bylaws contain provisions that may make the acquisition of our Company more difficult without the approval of our board of directors. These provisions include:
| • | the classification of our board of directors so that not all members of our board of directors are elected at one time; |
| • | the authorization of the issuance of undesignated preferred stock, the terms of which may be established and the shares of which may be issued without stockholder approval, and which may include super voting, special approval, dividend, or other rights or preferences superior to the rights of the holders of common stock; |
| • | stockholder action can only be taken at a special or regular meeting and not by written consent following the time that Sun Capital and its affiliates cease to beneficially own a majority of our common stock; |
| • | advance notice procedures for nominating candidates to our board of directors or presenting matters at stockholder meetings; |
| • | removal of directors only for cause following the time that Sun Capital and its affiliates cease to beneficially own a majority of our common stock; |
| • | allowing Sun Cardinal to fill any vacancy on our board of directors for so long as affiliates of Sun Capital own 30% or more of our outstanding shares of common stock and thereafter, allowing only our board of directors to fill vacancies on our board of directors; and |
| • | following the time that Sun Capital and its affiliates cease to beneficially own a majority of our common stock, super-majority voting requirements to amend our bylaws and certain provisions of our certificate of incorporation. |
28
Table of Contents
Our amended and restated certificate of incorporation also contains a provision that provides us with protections similar to Section 203 of the Delaware General Corporation Law (“DGCL”), and prevents us from engaging in a business combination, such as a merger, with a person or group who acquires at least 15% of our voting stock for a period of three years from the date such person became an interested stockholder, unless board or stockholder approval is obtained prior to acquisition. However, our amended and restated certificate of incorporation also provides that both Sun Capital and its affiliates and any persons to whom a Sun Capital affiliate sells its common stock will be deemed to have been approved by our board of directors.
These anti-takeover provisions and other provisions under Delaware law could discourage, delay or prevent a transaction involving a change of control of our Company, even if doing so would benefit our stockholders. These provisions could also discourage proxy contests and make it more difficult for you and other stockholders to elect directors of your choosing and to cause us to take other corporate actions you desire.
Our amended and restated certificate of incorporation also provides that the Court of Chancery of the State of Delaware will be the sole and exclusive forum for substantially all disputes between us and our stockholders, which could limit our stockholders’ ability to obtain a favorable judicial forum for disputes with us or our directors, officers or employees.
Our amended and restated certificate of incorporation provides that the Court of Chancery of the State of Delaware is, to the fullest extent permitted by applicable law, the sole and exclusive forum for any of the following: any derivative action or proceeding brought on our behalf; any action asserting a breach of fiduciary duty; any action asserting a claim against us arising under the Delaware General Corporation Law, our amended and restated certificate of incorporation or our amended and restated bylaws; or any action asserting a claim against us that is governed by the internal affairs doctrine. The choice of forum provision may limit a stockholder’s ability to bring a claim in a judicial forum that it finds favorable for disputes with us or our directors, officers or other employees, which may discourage such lawsuits against us and our directors, officers and other employees. Alternatively, if a court were to find the choice of forum provision contained in our amended and restated certificate of incorporation to be inapplicable or unenforceable in an action, we may incur additional costs associated with resolving such action in other jurisdictions, which could adversely affect our business and financial condition.
We are an “emerging growth company” and have elected to comply with reduced public company reporting requirements, which could make our common stock less attractive to investors.
We are an “emerging growth company,” as defined by the JOBS Act. For as long as we continue to be an emerging growth company, we have chosen to take advantage of certain exemptions from various public company reporting requirements. These exemptions include, but are not limited to, (i) not being required to comply with the auditor attestation requirements of Section 404 of the Sarbanes-Oxley Act, (ii) reduced disclosure obligations regarding executive compensation in our periodic reports, proxy statements and registration statements, and (iii) exemptions from the requirements of holding a nonbinding advisory vote on executive compensation and stockholder approval of any golden parachute payments not previously approved. We could be an emerging growth company for up to five years after the first sale of our common equity securities pursuant to an effective registration statement under the Securities Act of 1933, as amended (the “Securities Act”), which such fifth anniversary will occur in 2018. However, if certain events occur prior to the end of such five-year period, including if we become a “large accelerated filer,” our annual gross revenues exceed $1.0 billion or we issue more than $1.0 billion of non-convertible debt in any three-year period, we would cease to be an emerging growth company prior to the end of such five-year period. We will become a large accelerated filer the year after we have an aggregate worldwide market value of the voting and non-voting common equity held by non-affiliates of $700 million or more. We have taken advantage of certain of the reduced disclosure obligations regarding executive compensation in this annual report on Form 10-K and may elect to take advantage of other reduced burdens in future filings. As a result, the information we provide to holders of our common stock may be different than you might receive from other public reporting companies in
29
Table of Contents
which you hold equity interests. We cannot predict if investors will find our common stock less attractive as a result of our reliance on these exemptions. If some investors find our common stock less attractive as a result of any choice we make to reduce disclosure, there may be a less active trading market for our common stock and the price for our common stock may be more volatile.
As an emerging growth company we are not required to comply with the rules of the SEC implementing Section 404(b) of the Sarbanes-Oxley Act and therefore our independent registered public accounting firm is not required to formally attest to the effectiveness of our internal controls over financial reporting until the year following the year we cease to be an emerging growth company. We are required, however, to comply with the SEC’s rules implementing Section 302 and 404 other than 404(b) of the Sarbanes-Oxley Act. These rules require management to certify financial and other information in our quarterly and annual reports and provide an annual management report on the effectiveness of controls over financial reporting. If we are unable to conclude that we have effective internal control over financial reporting, our independent registered public accounting firm is unable to provide us with an unqualified report as and when required by Section 404 or we are required to restate our financial statements, we may fail to meet our public reporting obligations and investors could lose confidence in our reported financial information, which could have a negative impact on the trading price of our stock.
Under the JOBS Act, emerging growth companies can delay adopting new or revised accounting standards until such time as those standards apply to private companies. However, we have irrevocably elected not to avail ourselves of this extended transition period for complying with new or revised accounting standards and, therefore, we will be subject to the same new or revised accounting standards as other public companies that are not emerging growth companies.
| ITEM 1B. | UNRESOLVED STAFF COMMENTS. |
None.
| ITEM 2. | PROPERTIES. |
We do not own any real estate. Our 33,009 square-foot principal executive and administrative offices are located at 500 Fifth Avenue, 19th and 20th Floors, New York, New York 10110 and are leased under an agreement expiring in April 2025. In July 2014, we signed a lease for a 28,541 square-foot design studio located at 900 N. Cahuenga Blvd., Los Angeles, California leased under an agreement expiring in July 2020. We moved into the new design studio space in February 2015 after the expiration in January 2015 of our previous 17,640 square-foot design studio at 5410 Wilshire Boulevard, Los Angeles, California. In December 2014, we signed a lease for a 4,209 square-foot showroom space in Paris, France which opened in March 2015, and is leased under an agreement expiring in December 2020.
As of January 31, 2015, we leased approximately 81,374 gross square feet related to our 37 retail stores. Our leases generally have initial terms of 10 years and cannot be extended or can be extended for one additional 5-year term. Our leases require a fixed annual rent, and most require the payment of additional rent if store sales exceed a negotiated amount. Most of our leases are “net” leases, which require us to pay all of the cost of insurance, taxes, maintenance and utilities. Although we generally cannot cancel these leases at our option, certain of our leases allow us, and in some cases, the lessor, to terminate the lease if we do not achieve a specified gross sales threshold.
30
Table of Contents
The following store list shows the location, opening date, type and size of our retail locations as of January 31, 2015:
| Vince Location |
State | Opening Date | Type | Gross Square Feet |
Selling Square Feet |
|||||||||||
| Robertson (Los Angeles) |
CA | April 9, 2008 | Street | 1,151 | 938 | |||||||||||
| Melrose (Los Angeles) |
CA | September 4, 2008 | Street | 1,537 | 1,385 | |||||||||||
| Washington St. (Meatpacking - Women’s) |
NY | February 3, 2009 | Street | 2,000 | 1,600 | |||||||||||
| Prince St. (Nolita) |
NY | July 25, 2009 | Street | 1,396 | 1,108 | |||||||||||
| San Francisco |
CA | October 15, 2009 | Street | 1,895 | 1,408 | |||||||||||
| Chicago |
IL | October 1, 2010 | Street | 2,590 | 1,371 | |||||||||||
| Madison Ave. |
NY | August 3, 2012 | Street | 3,503 | 1,928 | |||||||||||
| Westport |
CT | March 28, 2013 | Street | 1,801 | 1,344 | |||||||||||
| Greenwich |
CT | July 19, 2013 | Street | 2,463 | 1,724 | |||||||||||
| Mercer St. (Soho) |
NY | August 22, 2013 | Street | 4,500 | 3,080 | |||||||||||
| Columbus Ave. (Upper West Side) |
NY | December 18, 2013 | Street | 4,465 | 3,126 | |||||||||||
| Washington St. (Meatpacking - Men’s) |
NY | June 2, 2014 | Street | 1,827 | 1,027 | |||||||||||
| Newbury St. (Boston) |
MA | May 24, 2014 | Street | 4,124 | 3,100 | |||||||||||
| Pasadena |
CA | August 7, 2014 | Street | 3,475 | 2,200 | |||||||||||
| Walnut St. (Philadelphia) |
PA | August 4, 2014 | Street | 3,250 | 2,000 | |||||||||||
|
|
|
|
|
|||||||||||||
| Total Street (15): |
39,977 | 27,339 | ||||||||||||||
|
|
|
|
|
|||||||||||||
| Malibu |
CA | August 9, 2009 | Mall | 797 | 705 | |||||||||||
| Dallas |
TX | August 28, 2009 | Mall | 1,368 | 1,182 | |||||||||||
| Boca Raton |
FL | October 13, 2009 | Mall | 1,547 | 1,199 | |||||||||||
| Copley Place (Boston) |
MA | October 20, 2009 | Mall | 1,370 | 1,015 | |||||||||||
| White Plains |
NY | November 6, 2009 | Mall | 1,325 | 1,045 | |||||||||||
| Atlanta |
GA | April 16, 2010 | Mall | 1,643 | 1,356 | |||||||||||
| Palo Alto |
CA | September 17, 2010 | Mall | 2,028 | 1,391 | |||||||||||
| Bellevue Square |
WA | November 5, 2010 | Mall | 1,460 | 1,113 | |||||||||||
| Manhasset (Long Island) |
NY | April 22, 2011 | Mall | 1,414 | 1,000 | |||||||||||
| Newport Beach |
CA | May 20, 2011 | Mall | 1,656 | 1,242 | |||||||||||
| The Grove |
CA | November 20, 2012 | Mall | 1,862 | 1,160 | |||||||||||
| Bal Harbour |
FL | October 4, 2014 | Mall | 2,600 | 1,820 | |||||||||||
| Chestnut Hill |
MA | July 25, 2014 | Mall | 2,357 | 1,886 | |||||||||||
|
|
|
|
|
|||||||||||||
| Total Mall and Lifestyle Centers (13) |
21,427 | 16,114 | ||||||||||||||
|
|
|
|
|
|||||||||||||
| Total Full-Price (28) |
61,404 | 43,453 | ||||||||||||||
|
|
|
|
|
|||||||||||||
| Orlando |
FL | June 17, 2009 | Outlet | 2,065 | 1,446 | |||||||||||
| Cabazon |
CA | November 11, 2011 | Outlet | 2,066 | 1,653 | |||||||||||
| Riverhead |
NY | November 30, 2012 | Outlet | 2,100 | 1,490 | |||||||||||
| Chicago |
IL | August 1, 2013 | Outlet | 2,611 | 1,828 | |||||||||||
| Seattle |
WA | August 30, 2013 | Outlet | 2,214 | 1,550 | |||||||||||
| Las Vegas |
NV | October 3, 2013 | Outlet | 2,028 | 1,420 | |||||||||||
| San Marcos |
TX | October 10, 2014 | Outlet | 2,433 | 1,703 | |||||||||||
| Carlsbad |
CA | October 24, 2014 | Outlet | 2,453 | 1,717 | |||||||||||
| Wrentham |
MA | September 29, 2014 | Outlet | 2,000 | 1,400 | |||||||||||
|
|
|
|
|
|||||||||||||
| Total Outlets (9) |
19,970 | 14,207 | ||||||||||||||
|
|
|
|
|
|||||||||||||
| Total (37) |
81,374 | 57,660 | ||||||||||||||
|
|
|
|
|
|||||||||||||
31
Table of Contents
| ITEM 3. | LEGAL PROCEEDINGS. |
We are subject to various legal proceedings and claims, which arise in the ordinary course of our business. Although the outcome of these and other claims cannot be predicted with certainty, management does not believe that the ultimate resolution of these matters will have a material adverse effect on our financial condition, cash flows or results of operation.
| ITEM 4. | MINE SAFETY DISCLOSURES. |
Not applicable.
32
Table of Contents
Part II
ITEM 5. MARKET FOR REGISTRANT’S COMMON EQUITY, RELATED STOCKHOLDER MATTERS AND ISSUER PURCHASES OF EQUITY SECURITIES.
Market Information
Our common stock has been traded on the New York Stock Exchange under the symbol “VNCE” since November 22, 2013. Prior to that time there was no public market for our stock. The following table sets forth the high and low sale prices of our common stock as reported on the New York Stock Exchange:
| Market Price | ||||||||
| High | Low | |||||||
| Fiscal 2014: |
||||||||
| Fourth quarter |
$ | 37.68 | $ | 22.07 | ||||
| Third quarter |
$ | 39.08 | $ | 29.67 | ||||
| Second quarter |
$ | 38.00 | $ | 24.19 | ||||
| First quarter |
$ | 28.00 | $ | 22.53 | ||||
| Fiscal 2013: |
||||||||
| Fourth quarter (since November 22, 2013) |
$ | 32.76 | $ | 22.84 | ||||
Record Holders
As of March 20, 2015 there were 3 record holders of our common stock.
Dividends
We have never paid cash dividends on our common stock. We currently intend to retain all available funds and any future earnings to fund the development and growth of our business, and we do not anticipate paying any cash dividends in the foreseeable future. In addition, because we are a holding company, our ability to pay dividends depends on our receipt of cash distributions from our subsidiaries. The terms of our indebtedness substantially restrict the ability to pay dividends. See “Current Existing Credit Facilities and Debt (Post IPO and Restructuring Transactions)” under “Item 7—Management’s Discussion and Analysis of Financial Condition and Results of Operations—Liquidity and Capital Resources” of this annual report on Form 10-K for a description of the related restrictions.
Any future determination to pay dividends will be at the discretion of our board of directors and will depend on our financial condition, results of operations, capital requirements, restrictions contained in current and future financing instruments and other factors that our board of directors deems relevant.
33
Table of Contents
Performance Graph
The following graph shows a monthly comparison of the cumulative total return on a $100 investment in the Company’s common stock, the Standard & Poor’s 500 Stock Index and the Standard & Poor’s Retail Select Industry Index. The cumulative total return for the Vince Holding Corp. common stock assumes an initial investment of $100 in the common stock of the Company on November 22, 2013, which was the Company’s first day of trading on the New York Stock Exchange after its IPO. The cumulative total returns for the Standard & Poor’s 500 Stock Index and the Standard & Poor’s Retail Select Industry Index assume an initial investment of $100 on October 31, 2013. The comparison also assumes the reinvestment of any dividends. The stock price performance included in this graph is not necessarily indicative of future stock price performance.
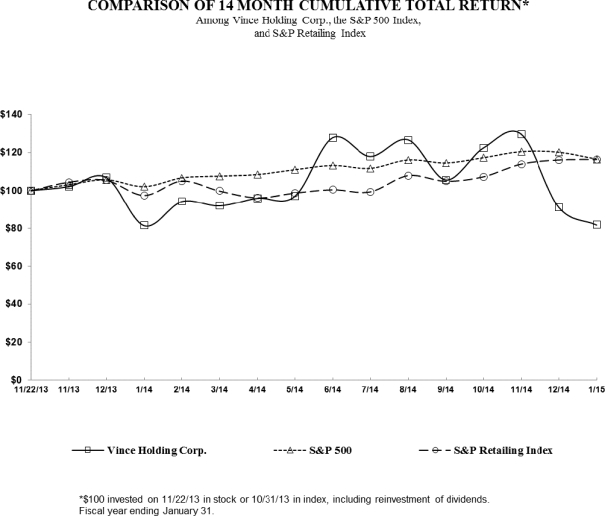
This performance graph and related information shall not be deemed “soliciting material” or to be “filed” with the SEC, nor shall such information be incorporated by reference into any future filing under the Securities or the Securities Exchange Act of 1934, as amended (the “Exchange Act”) except to the extent we specifically incorporate it by reference into such filing.
34
Table of Contents
Purchases of Equity Securities by the Issuer and Affiliated Purchasers
We did not repurchase any shares of common stock during the three months ended January 31, 2015.
Unregistered Sales of Equity Securities
We did not sell any unregistered securities during fiscal year 2014.
| ITEM 6. | SELECTED CONSOLIDATED FINANCIAL DATA. |
The selected historical consolidated financial data set forth below for each of the years in the four-year period ended January 31, 2015 and as of January 31, 2015 have been derived from our audited consolidated financial statements.
The historical results presented below are not necessarily indicative of the results expected for any future period. The information should be read in conjunction with “Item 7—Management’s Discussion and Analysis of Financial Condition and Results of Operations” of this annual report on Form 10-K and our Consolidated Financial Statements and related notes included herein.
| Fiscal Year (1) | ||||||||||||||||
| (In thousands, except for share data) | 2014 | 2013 | 2012 | 2011 | ||||||||||||
| Statement of Operations Data |
||||||||||||||||
| Net sales |
$ | 340,396 | $ | 288,170 | $ | 240,352 | $ | 175,255 | ||||||||
| Cost of products sold |
173,567 | 155,154 | 132,156 | 89,545 | ||||||||||||
|
|
|
|
|
|
|
|
|
|||||||||
| Gross profit |
166,829 | 133,016 | 108,196 | 85,710 | ||||||||||||
| Selling, general and administrative expenses (2) |
96,579 | 83,663 | 67,260 | 42,793 | ||||||||||||
|
|
|
|
|
|
|
|
|
|||||||||
| Income from operations |
70,250 | 49,353 | 40,936 | 42,917 | ||||||||||||
| Interest expense, net (3) |
9,698 | 18,011 | 68,684 | 81,364 | ||||||||||||
| Other expense, net |
835 | 679 | 769 | 478 | ||||||||||||
|
|
|
|
|
|
|
|
|
|||||||||
| Income (loss) before income taxes |
59,717 | 30,663 | (28,517 | ) | (38,925 | ) | ||||||||||
| Provision for income taxes |
23,994 | 7,268 | 1,178 | 2,997 | ||||||||||||
|
|
|
|
|
|
|
|
|
|||||||||
| Net income (loss) from continuing operations |
35,723 | 23,395 | (29,695 | ) | (41,922 | ) | ||||||||||
| Net loss from discontinued operations, net of tax |
— | (50,815 | ) | (78,014 | ) | (105,944 | ) | |||||||||
|
|
|
|
|
|
|
|
|
|||||||||
| Net income (loss) |
$ | 35,723 | $ | (27,420 | ) | $ | (107,709 | ) | $ | (147,866 | ) | |||||
|
|
|
|
|
|
|
|
|
|||||||||
| Basic earnings (loss) per share: |
||||||||||||||||
| Basic earnings (loss) per share from continuing operations |
$ | 0.97 | $ | 0.83 | $ | (1.13 | ) | $ | (1.60 | ) | ||||||
| Basic loss per share from discontinued operations |
— | (1.81 | ) | (2.98 | ) | (4.04 | ) | |||||||||
|
|
|
|
|
|
|
|
|
|||||||||
| Basic earnings (loss) per share |
$ | 0.97 | $ | (0.98 | ) | $ | (4.11 | ) | $ | (5.64 | ) | |||||
|
|
|
|
|
|
|
|
|
|||||||||
| Diluted earnings (loss) per share: |
||||||||||||||||
| Diluted earnings (loss) per share from continuing operations |
$ | 0.93 | $ | 0.83 | $ | (1.13 | ) | $ | (1.60 | ) | ||||||
| Diluted loss per share from discontinued operations |
— | (1.81 | ) | (2.98 | ) | (4.04 | ) | |||||||||
|
|
|
|
|
|
|
|
|
|||||||||
| Diluted earnings (loss) per share |
$ | 0.93 | $ | (0.98 | ) | $ | (4.11 | ) | $ | (5.64 | ) | |||||
|
|
|
|
|
|
|
|
|
|||||||||
| Weighted average shares outstanding: |
||||||||||||||||
| Basic |
36,730,490 | 28,119,794 | 26,211,130 | 26,211,130 | ||||||||||||
| Diluted |
38,244,906 | 28,272,925 | 26,211,130 | 26,211,130 | ||||||||||||
35
Table of Contents
| As of | ||||||||||||||||
| (In thousands) | January 31, 2015 |
February 1, 2014 |
February 2, 2013 |
January 28, 2012 |
||||||||||||
| Balance Sheet Data: |
||||||||||||||||
| Cash and cash equivalents |
$ | 112 | $ | 21,484 | $ | 317 | $ | 1,839 | ||||||||
| Working capital |
16,650 | 65,398 | 9,746 | (2,149 | ) | |||||||||||
| Total assets |
382,198 | 414,342 | 442,124 | 468,445 | ||||||||||||
| Long-term debt |
88,000 | 170,000 | 391,434 | 605,292 | ||||||||||||
| Other liabilities (long-term) (4) |
146,063 | 169,015 | — | — | ||||||||||||
| Stockholders’ equity (deficit) |
71,969 | 33,551 | (561,265 | ) | (743,021 | ) | ||||||||||
| Fiscal Year (1) | ||||||||||||||||
| (In thousands, except for percentages, door counts and store counts) | 2014 | 2013 | 2012 | 2011 | ||||||||||||
| Other Operating and Financial Data: |
||||||||||||||||
| Net Sales by Segment: |
||||||||||||||||
| Wholesale |
$ | 259,418 | $ | 229,114 | $ | 203,107 | $ | 151,921 | ||||||||
| Direct-to-Consumer |
80,978 | 59,056 | 37,245 | 23,334 | ||||||||||||
|
|
|
|
|
|
|
|
|
|||||||||
| Total net sales |
$ | 340,396 | $ | 288,170 | $ | 240,352 | $ | 175,255 | ||||||||
|
|
|
|
|
|
|
|
|
|||||||||
| Total wholesale doors at end of period |
2,394 | 2,300 | 2,145 | 1,761 | ||||||||||||
| Total stores at end of period |
37 | 28 | 22 | 19 | ||||||||||||
| Comparable store sales growth (5) |
7.8 | % | 20.6 | % | 20.8 | % | 7.6 | % | ||||||||
| Depreciation and amortization |
$ | 5,267 | $ | 2,785 | $ | 2,009 | $ | 1,701 | ||||||||
| Capital expenditures |
$ | 19,699 | $ | 10,073 | $ | 1,821 | $ | 1,450 | ||||||||
| (1) | Fiscal year ends on Saturday closest to January 31. Fiscal 2014 (ended January 31, 2015), fiscal 2013 (ended February 1, 2014) and fiscal 2011 (ended January 28, 2012) consisted of 52 weeks. Fiscal 2012 (ended February 2, 2013) consisted of 53 weeks. |
| (2) | Includes the impact of public company transition costs of approximately $9,751 and $9,331 in fiscal 2013 and 2012, respectively. Also includes costs associated with the Secondary Offering (as defined herein) of $571 in fiscal 2014. |
| (3) | Interest expense prior to the Company’s IPO in November 2013 is associated with the Sun Promissory Notes and the Sun Capital Loan Agreement (both as defined herein). Interest expense after the IPO in November 2013 represents interest and amortization of deferred financing costs incurred in connection with the Company’s $175,000 Term Loan Facility and $50,000 Revolving Credit Facility. |
| (4) | Other liabilities includes the impact of recording the long-term portion of the Tax Receivable Agreement with the Pre-IPO Stockholders entered into in November 2013, which represents our obligation to pay 85% of estimated cash savings on federal, state and local income taxes realized by us through our use of certain net tax assets retained by us subsequent to the completion of the IPO and Restructuring Transactions executed in November 2013. |
| (5) | Comparable Store Sales Policy: |
A store is included in the comparable store sales calculation after it has completed at least 12 full fiscal months of operations. Non-comparable store sales include new stores which have not completed at least 12 full fiscal months of operations and sales from closed stores. In the event that we relocate, or change square footage of an existing store, we would treat that store as a non-comparable store until it has completed at least 12 full fiscal months of operation following the relocation or square footage adjustment. For 53-week fiscal years, we do not adjust comparable store sales to exclude the additional week.
36
Table of Contents
ITEM 7. MANAGEMENT’S DISCUSSION AND ANALSIS OF FINANCIAL CONDITION AND RESULTS OF OPERATIONS.
This discussion summarizes our consolidated operating results, financial condition and liquidity during each of the years in the three-year period ended January 31, 2015. Our fiscal year ends on the Saturday closest to January 31. Fiscal years 2014, 2013 and 2012 ended on January 31, 2015, February 1, 2014 and February 2, 2013, respectively. Fiscal years 2014 and 2013 consisted of 52 weeks and fiscal year 2012 consisted of 53 weeks. The following discussion and analysis should be read in conjunction with our consolidated financial statements and related notes included elsewhere in this annual report on Form 10-K.
On November 27, 2013, Vince Holding Corp. completed the IPO and the Restructuring Transactions. As a result, the non-Vince businesses were separated from the Vince business. The Vince business is now the sole operating business of Vince Holding Corp. Historical financial information for the non-Vince businesses has been included as discontinued operations until the businesses were separated on November 27, 2013.
This discussion contains forward-looking statements involving risks, uncertainties and assumptions that could cause our results to differ materially from expectations. Factors that might cause such differences include those described under “Item 1A—Risk Factors,” “Disclosures Regarding Forward-Looking Statements” and elsewhere in this annual report on Form 10-K.
Executive Overview
Vince is a leading contemporary fashion brand best known for modern effortless style and everyday luxury essentials. Founded in 2002, the brand now offers a wide range of women’s, men’s and children’s apparel, women’s and men’s footwear, and handbags. Vince products are sold in prestige distribution worldwide, including over 2,400 distribution points across 45 countries. Vince has generated strong sales momentum over the last decade. We believe that we will achieve continued success by expanding our product assortment distributed through premier wholesale partners in the U.S. and select international markets, as well as in our own branded retail locations and on our e-commerce platform.
As of January 31, 2015, we sold our products at 2,394 doors through our wholesale partners in the U.S. and international markets and we operated 37 retail stores, including 28 full price stores and nine outlet stores, throughout the United States.
The following is a summary of fiscal 2014 highlights:
| • | Our net sales totaled $340.4 million, reflecting an 18.1% increase over prior year net sales of $288.2 million. |
| • | Our wholesale net sales increased 13.2% to $259.4 million and our direct-to-consumer net sales increased 37.1% to $81.0 million. |
| • | Operating income increased 42.3% to $70.3 million, or 20.6% of net sales, which represents a 340 basis point improvement over the prior year. |
| • | We made voluntary prepayments totaling $105.0 million on the Term Loan Facility. As of January 31, 2015, we had $88.0 million of total debt outstanding comprised of $65.0 million outstanding on our Term Loan Facility and $23.0 million outstanding on our Revolving Credit Facility. |
| • | We opened nine new retail stores during fiscal year 2014 and increased our wholesale door count by 94 additional doors. |
| • | Certain selling stockholders of the Company, including affiliates of Sun Capital (collectively with the other selling stockholders, the “Selling Stockholders”), completed a secondary offering (the “Secondary Offering”) of common stock of the Company on July 1, 2014. Following the Secondary Offering, affiliates of Sun Capital held 54.6% of the Company’s common stock. We did not receive any proceeds from the Secondary Offering. |
37
Table of Contents
We serve our customers through a variety of channels that reinforce the Vince brand image. Our diversified channel strategy allows us to introduce our products to customers through multiple distribution points that are reported in two segments: wholesale and direct-to-consumer.
The following is a summary of our wholesale and direct-to-consumer net sales for fiscal years 2014, 2013 and 2012:
| Net Sales by Segment | ||||||||||||
| Fiscal Year | ||||||||||||
| (in thousands) | 2014 | 2013 | 2012 | |||||||||
| Wholesale |
$ | 259,418 | $ | 229,114 | $ | 203,107 | ||||||
| Direct-to-consumer |
80,978 | 59,056 | 37,245 | |||||||||
|
|
|
|
|
|
|
|||||||
| Total net sales |
$ | 340,396 | $ | 288,170 | $ | 240,352 | ||||||
|
|
|
|
|
|
|
|||||||
We have expanded our operations rapidly since our inception in 2002, and we have limited operating experience at our current size. Our growth in net sales has also led to increased selling, general and administrative expenses. We have made and are making investments to support our near and longer-term growth. If our operations continue to grow over the longer term, of which there can be no assurance, we will be required to expand our sales and marketing, product development and distribution functions, to upgrade our management information systems and other processes, and to obtain more space for our expanding administrative support and other headquarters personnel.
While we believe our growth strategy offers significant opportunities, it also presents risks and challenges, including among others, the risks that we may not be able to hire and train qualified associates, that our new product offerings and expanded sales channels may not maintain or enhance our brand image and that our distribution facilities and information systems may not be adequate to support our growth plans. For a more complete discussions of risks facing our business see “Item 1A—Risk Factors” of this annual report on Form 10-K.
38
Table of Contents
Results of Operations
Fiscal 2014 Compared to Fiscal 2013
The following table presents, for the periods indicated, our operating results as a percentage of net sales as well as earnings per share data:
| Fiscal Year Ended | ||||||||||||||||||||||||
| January 31, 2015 | February 1, 2014 | Variances | ||||||||||||||||||||||
| (In thousands, except share data, store and door counts, and percentages) |
Amount | % of Net Sales |
Amount | % of Net Sales |
Amount | Percent | ||||||||||||||||||
| Statement of Operations: |
||||||||||||||||||||||||
| Net sales |
$ | 340,396 | 100.0 | % | $ | 288,170 | 100.0 | % | $ | 52,226 | 18.1 | % | ||||||||||||
| Cost of products sold |
173,567 | 51.0 | % | 155,154 | 53.8 | % | 18,413 | 11.9 | % | |||||||||||||||
|
|
|
|
|
|
|
|
|
|
|
|
|
|||||||||||||
| Gross profit |
166,829 | 49.0 | % | 133,016 | 46.2 | % | 33,813 | 25.4 | % | |||||||||||||||
| Selling, general and administrative expenses |
96,579 | 28.4 | % | 83,663 | 29.0 | % | 12,916 | 15.4 | % | |||||||||||||||
|
|
|
|
|
|
|
|
|
|
|
|
|
|||||||||||||
| Income from operations |
70,250 | 20.6 | % | 49,353 | 17.2 | % | 20,897 | 42.3 | % | |||||||||||||||
| Interest expense, net |
9,698 | 2.8 | % | 18,011 | 6.3 | % | (8,313 | ) | (46.2 | )% | ||||||||||||||
| Other expense, net |
835 | 0.3 | % | 679 | 0.2 | % | 156 | 23.0 | % | |||||||||||||||
|
|
|
|
|
|
|
|
|
|
|
|
|
|||||||||||||
| Income before income taxes |
59,717 | 17.5 | % | 30,663 | 10.7 | % | 29,054 | 94.8 | % | |||||||||||||||
| Provision for income taxes |
23,994 | 7.0 | % | 7,268 | 2.5 | % | 16,726 | 230.1 | % | |||||||||||||||
|
|
|
|
|
|
|
|
|
|
|
|
|
|||||||||||||
| Net income from continuing operations |
35,723 | 10.5 | % | 23,395 | 8.2 | % | 12,328 | 52.7 | % | |||||||||||||||
| Net loss from discontinued operations, net of taxes |
— | — | (50,815 | ) | (17.6 | )% | 50,815 | (100.0 | )% | |||||||||||||||
|
|
|
|
|
|
|
|
|
|
|
|
|
|||||||||||||
| Net income (loss) |
$ | 35,723 | 10.5 | % | $ | (27,420 | ) | (9.4 | )% | $ | 63,143 | (230.3 | )% | |||||||||||
|
|
|
|
|
|
|
|
|
|
|
|
|
|||||||||||||
| Basic earnings (loss) per share: |
||||||||||||||||||||||||
| Basic EPS—continuing operations |
$ | 0.97 | $ | 0.83 | ||||||||||||||||||||
| Basic EPS—discontinued operations |
— | (1.81 | ) | |||||||||||||||||||||
|
|
|
|
|
|||||||||||||||||||||
| Basic EPS—Total |
$ | 0.97 | $ | (0.98 | ) | |||||||||||||||||||
|
|
|
|
|
|||||||||||||||||||||
| Diluted earnings (loss) per share: |
||||||||||||||||||||||||
| Diluted EPS—continuing operations |
$ | 0.93 | $ | 0.83 | ||||||||||||||||||||
| Diluted EPS—discontinued operations |
— | (1.81 | ) | |||||||||||||||||||||
|
|
|
|
|
|||||||||||||||||||||
| Diluted EPS—Total |
$ | 0.93 | $ | (0.98 | ) | |||||||||||||||||||
|
|
|
|
|
|||||||||||||||||||||
| Other Operating and Financial Data: |
||||||||||||||||||||||||
| Total wholesale doors at end of period |
2,394 | 2,300 | ||||||||||||||||||||||
| Total stores at end of period |
37 | 28 | ||||||||||||||||||||||
| Comparable store sales growth |
7.8 | % | 20.6 | % | ||||||||||||||||||||
Net Sales for the fiscal year ended January 31, 2015 were $340.4 million, increasing $52.2 million, or 18.1% versus $288.2 million for the fiscal year ended February 1, 2014. The increase in sales compared to the prior year is due to an increase in volume across both of our business segments. The following is a summary of our net sales by segment for the fiscal year ended January 31, 2015 and the fiscal year ended February 1, 2014:
| Net Sales by Segment | ||||||||
| Fiscal Year Ended | ||||||||
| (in thousands) | January 31, 2015 |
February 1, 2014 |
||||||
| Net Sales: |
||||||||
| Wholesale |
$ | 259,418 | $ | 229,114 | ||||
| Direct-to-consumer |
80,978 | 59,056 | ||||||
|
|
|
|
|
|||||
| Total net sales |
$ | 340,396 | $ | 288,170 | ||||
|
|
|
|
|
|||||
39
Table of Contents
Net sales from our wholesale segment increased $30.3 million, or 13.2%, to $259.4 million in the fiscal year ended January 31, 2015 from $229.1 million in the fiscal year ended February 1, 2014 driven by strong performance in both our domestic and international markets. The expansion of our wholesale business contributed to the sales increase as our wholesale door counts increased by a net 94 wholesale doors and we opened 21 additional shop-in-shops that are operated by our domestic and international partners. Additionally, there are two international free-standing stores which are operated by our distribution partners, one in Tokyo that opened in the fall of 2013, and one in Istanbul that opened in the spring of 2014.
Net sales from our direct-to-consumer segment increased $21.9 million, or 37.1%, to $81.0 million in the fiscal year ended January 31, 2015 from $59.1 million in the fiscal year ended February 1, 2014. This sales growth was due to (i) comparable retail store sales growth of 7.8% which was driven primarily by increased transactions and contributed $3.3 million, (ii) opening nine new stores as compared to the end of the prior fiscal year (bringing our total retail store count to 37 as of January 31, 2015, compared to 28 as of February 1, 2014) inclusive of non-comparable sales growth contributing $15.3 million, and (iii) e-commerce sales growth contributing $3.3 million.
Gross Profit/Gross Margin rate increased 280 basis points to 49.0% for the fiscal year ended January 31, 2015 compared to 46.2% for the fiscal year ended February 1, 2014. The total gross margin rate increase was driven primarily by the following factors:
| • | Increased sales penetration of the international and licensing businesses contributed 80 basis points of improvement; |
| • | Continued supply chain efficiencies including our strategic shift to transport more of our product by sea versus air as well as other operational improvements contributed 80 basis points of improvement; |
| • | Increased sales penetration of the direct-to-consumer segment contributed 90 basis points of improvement; and |
| • | Favorable impact from inventory reserve related adjustments contributed 50 basis points of improvement. |
| • | The above increases were partially offset by the impact of certain product mix which had a negative impact of (20) basis points. |
Selling, general and administrative expenses (“SG&A”) for the fiscal year ended January 31, 2015 were $96.6 million, increasing $12.9 million, or 15.4%, versus $83.7 million for the fiscal year ended February 1, 2014. The increase in SG&A expenses compared to the prior year period were primarily due to:
| • | Increase in compensation expense of $7.3 million, including share-based and incentive compensation, employee benefits and related increases due to hiring and retaining additional employees to support our growth plans; |
| • | Increase in rent and occupancy costs of $5.6 million due primarily to new retail store openings and our new headquarter office spaces; |
| • | Increase in marketing, advertising and promotional expenses of $2.6 million to support our efforts to increase brand awareness, drive traffic and build customer loyalty; |
| • | Increase in depreciation expense of $2.4 million due to new stores, shop-in-shop expenditures and our new headquarter office spaces; |
| • | Increase in other costs of $2.2 million consisting of increases in areas such as design and development, travel, consulting and legal; |
| • | Increase in public company expenses of $1.9 million due to costs incurred to be a stand-alone public company; and |
40
Table of Contents
| • | Increase of $0.6 million related to fees incurred in connection with the Secondary Offering completed in July 2014. |
| • | The above increases were partially offset by the decrease in public company transition costs of $9.8 million incurred in the prior fiscal year in preparation for our IPO that was completed on November 27, 2013. |
The following is a summary of our operating income by segment for the fiscal year ended January 31, 2015 and the fiscal year ended February 1, 2014:
| Operating Income by Segment | ||||||||
| Fiscal Year Ended | ||||||||
| (in thousands) | January 31, 2015 |
February 1, 2014 |
||||||
| Wholesale |
$ | 100,623 | $ | 81,822 | ||||
| Direct-to-consumer |
14,556 | 10,435 | ||||||
|
|
|
|
|
|||||
| Subtotal |
115,179 | 92,257 | ||||||
| Unallocated expenses |
(44,929 | ) | (42,904 | ) | ||||
|
|
|
|
|
|||||
| Total operating income |
$ | 70,250 | $ | 49,353 | ||||
|
|
|
|
|
|||||
Operating income from our wholesale segment increased $18.8 million, or 23.0%, to $100.6 million in the fiscal year ended January 31, 2015 from $81.8 million in the fiscal year ended February 1, 2014. This increase was driven primarily from the sales volume increase of $30.3 million and gross margin rate improvement noted above as well as the impact of wholesale segment operating expenses which were lower as a percentage of net sales versus the prior fiscal year.
Operating income from our direct-to-consumer segment increased $4.1 million, or 39.5% to $14.6 million in the fiscal year ended January 31, 2015 from $10.4 million in the fiscal year ended February 1, 2014. The increase resulted primarily from the sales volume increase of $21.9 million and gross margin rate improvement noted above which more than offset the additional operating expenses incurred, primarily as a result of opening new stores, during the period to support the sales growth.
Interest expense for the fiscal year ended January 31, 2015 was $9.7 million, decreasing $8.3 million, or 46.2%, versus $18.0 million for the fiscal year ended February 1, 2014. Interest expense decreased as we had lower average debt balances period over period. The decrease in overall debt balances was primarily due to certain affiliates of Sun Capital contributing certain outstanding indebtedness to the Company in June 2013, thus eliminating interest expense on approximately $407.5 million in debt at that time. On November 27, 2013, in connection with the IPO and Restructuring Transactions, we entered into a $175.0 million Term Loan Facility and a $50.0 million Revolving Credit Facility. Interest expense for fiscal 2014 relates to interest charges under these facilities.
Other expense, net, was $0.8 million for the fiscal year ended January 31, 2015 compared to $0.7 million for the fiscal year ended February 1, 2014.
Provision for income taxes for the fiscal year ended January 31, 2015 was $24.0 million as compared to $7.3 million for the fiscal year ended February 1, 2014. Our effective tax rate on pretax income for the fiscal year ended January 31, 2015 and the fiscal year ended February 1, 2014 was 40.2% and 23.7%, respectively. The rate for the fiscal year ended January 31, 2015 differed from the U.S. statutory rate of 35.0% primarily due to state taxes. The rate for the fiscal year ended February 1, 2014 differed from the U.S. statutory rate of 35.0% primarily due to changes in our valuation allowance offset in part by state taxes and nondeductible interest.
41
Table of Contents
Net loss from discontinued operations
The separation of the non-Vince businesses was completed on November 27, 2013. Net loss from discontinued operations was $50.8 million for the fiscal year ended February 1, 2014.
Net income (loss)
Net income was $35.7 million for the fiscal year ended January 31, 2015, increasing $63.1 million from a net loss of $(27.4) million for the fiscal year ended February 1, 2014. The increase in net income was primarily due to increased income from operations of $20.9 million, reduced interest expense of $8.3 million and a lower net loss from discontinued operations of $50.8 million, partially offset by the increase in income taxes of $16.7 million.
Results of Operations
Fiscal 2013 Compared to Fiscal 2012
The following table presents, for the periods indicated, our operating results as a percentage of net sales as well as earnings per share data:
| Fiscal Year Ended | ||||||||||||||||||||||||
| February 1, 2014 | February 2, 2013 | Variances | ||||||||||||||||||||||
| (In thousands, except share data, store and door counts, and percentages) |
Amount | % of Net Sales |
Amount | % of Net Sales |
Amount | Percent | ||||||||||||||||||
| Statement of Operations: |
||||||||||||||||||||||||
| Net sales |
$ | 288,170 | 100.0 | % | $ | 240,352 | 100.0 | % | $ | 47,818 | 19.9 | % | ||||||||||||
| Cost of products sold |
155,154 | 53.8 | % | 132,156 | 55.0 | % | 22,998 | 17.4 | % | |||||||||||||||
|
|
|
|
|
|
|
|
|
|
|
|
|
|||||||||||||
| Gross profit |
133,016 | 46.2 | % | 108,196 | 45.0 | % | 24,820 | 22.9 | % | |||||||||||||||
| Selling, general and administrative expenses |
83,663 | 29.0 | % | 67,260 | 28.0 | % | 16,403 | 24.4 | % | |||||||||||||||
|
|
|
|
|
|
|
|
|
|
|
|
|
|||||||||||||
| Income from operations |
49,353 | 17.2 | % | 40,936 | 17.0 | % | 8,417 | 20.6 | % | |||||||||||||||
| Interest expense, net |
18,011 | 6.3 | % | 68,684 | 28.6 | % | (50,673 | ) | (73.8 | )% | ||||||||||||||
| Other expense, net |
679 | 0.2 | % | 769 | 0.3 | % | (90 | ) | (11.7 | )% | ||||||||||||||
|
|
|
|
|
|
|
|
|
|
|
|
|
|||||||||||||
| Income (loss) before income taxes |
30,663 | 10.7 | % | (28,517 | ) | (11.9 | )% | 59,180 | (207.5 | )% | ||||||||||||||
| Provision for income taxes |
7,268 | 2.5 | % | 1,178 | 0.5 | % | 6,090 | 517.0 | % | |||||||||||||||
|
|
|
|
|
|
|
|
|
|
|
|
|
|||||||||||||
| Net income (loss) from continuing operations |
23,395 | 8.2 | % | (29,695 | ) | (12.4 | )% | 53,090 | (178.8 | )% | ||||||||||||||
| Net loss from discontinued operations, net of taxes |
(50,815 | ) | (17.6 | )% | (78,014 | ) | (32.5 | )% | 27,199 | (34.9 | )% | |||||||||||||
|
|
|
|
|
|
|
|
|
|
|
|
|
|||||||||||||
| Net loss |
$ | (27,420 | ) | (9.4 | )% | $ | (107,709 | ) | (44.9 | )% | $ | 80,289 | (74.5 | )% | ||||||||||
|
|
|
|
|
|
|
|
|
|
|
|
|
|||||||||||||
| Basic earnings (loss) per share: |
||||||||||||||||||||||||
| Basic EPS—continuing operations |
$ | 0.83 | $ | (1.13 | ) | |||||||||||||||||||
| Basic EPS—discontinued operations |
(1.81 | ) | (2.98 | ) | ||||||||||||||||||||
|
|
|
|
|
|||||||||||||||||||||
| Basic EPS—Total |
$ | (0.98 | ) | $ | (4.11 | ) | ||||||||||||||||||
|
|
|
|
|
|||||||||||||||||||||
| Diluted earnings (loss) per share: |
||||||||||||||||||||||||
| Diluted EPS—continuing operations |
$ | 0.83 | $ | (1.13 | ) | |||||||||||||||||||
| Diluted EPS—discontinued operations |
(1.81 | ) | (2.98 | ) | ||||||||||||||||||||
|
|
|
|
|
|||||||||||||||||||||
| Diluted EPS—Total |
$ | (0.98 | ) | $ | (4.11 | ) | ||||||||||||||||||
|
|
|
|
|
|||||||||||||||||||||
| Other Operating and Financial Data: |
||||||||||||||||||||||||
| Total wholesale doors at end of period |
2,300 | 2,145 | ||||||||||||||||||||||
| Total stores at end of period |
28 | 22 | ||||||||||||||||||||||
| Comparable store sales growth |
20.6 | % | 20.8 | % | ||||||||||||||||||||
42
Table of Contents
Net Sales for the fiscal year ended February 1, 2014 were $288.2 million, increasing $47.8 million, or 19.9%, versus $240.4 million for the fiscal year ended February 2, 2013. The increase in sales compared to the prior year is due to an increase in volume across both of our business segments. The following is a summary of our net sales by segment for the fiscal year ended February 1, 2014 and the fiscal year ended February 2, 2013:
| Net Sales by Segment | ||||||||
| Fiscal Year Ended | ||||||||
| (in thousands) | February 1, 2014 |
February 2, 2013 |
||||||
| Net Sales: |
||||||||
| Wholesale |
$ | 229,114 | $ | 203,107 | ||||
| Direct-to-consumer |
59,056 | 37,245 | ||||||
|
|
|
|
|
|||||
| Total net sales |
$ | 288,170 | $ | 240,352 | ||||
|
|
|
|
|
|||||
Net sales from our wholesale segment increased $26.0 million, or 12.8%, to $229.1 million in the fiscal year ended February 1, 2014 from $203.1 million in the fiscal year ended February 2, 2013. We increased volume with many of our premier wholesale partners through increased sales productivity in existing doors, including our first women’s shop-in-shop at Saks Fifth Avenue, opened in September 2012, and the opening of 20 additional shop-in-shops with our domestic and international partners. Additionally, there is one international free-standing store in Tokyo that is operated by one of our distribution partners that opened in the fall of 2013.
Net sales from our direct-to-consumer segment increased $21.8 million, or 58.6%, to $59.1 million in the fiscal year ended February 1, 2014 from $37.2 million in the fiscal year ended February 2, 2013. This sales growth was due to (i) comparable retail store sales growth of 20.6% contributing $5.5 million, (ii) opening six net new stores as compared to the prior year (bringing our total retail store count to 28 as of February 1, 2014, compared to 22 as of February 2, 2013) inclusive of non-comparable sales growth contributing $12.7 million, and (iii) e-commerce sales growth contributing $3.5 million.
Gross Profit/Gross Margin rate increased 120 basis points to 46.2% for the fiscal year ended February 1, 2014 compared to 45.0% for the fiscal year ended February 2, 2013. The total margin rate increase was driven by a higher percentage of our sales coming from the direct-to-consumer segment, in which we generally recognize higher margins, and an increased percentage of full-price to off-price sales in our wholesale segment. The margin rate was unfavorably impacted during the fiscal year ended February 1, 2014 by increased inventory reserves, and increased margin assistance provided to our wholesale partners.
Selling, general and administrative expenses for the fiscal year ended February 1, 2014 were $83.7 million, increasing $16.4 million, or 24.4%, versus $67.3 million for the fiscal year ended February 2, 2013. The increase in SG&A expenses compared to the prior year period was primarily due to:
| • | Increased compensation expense of $5.5 million related to hiring and retaining certain key employees; |
| • | Increased store expenses and depreciation expense of $4.5 million due primarily to new retail store openings; and |
| • | Increased design, development and marketing expenses of $6.0 million to support our efforts to increase brand awareness, drive traffic, build customer loyalty and open new retail stores. |
43
Table of Contents
The following is a summary of our operating income by segment for the fiscal year ended February 1, 2014 and the fiscal year ended February 2, 2013:
| Operating Income by Segment | ||||||||
| Fiscal Year Ended | ||||||||
| (in thousands) | February 1, 2014 |
February 2, 2013 |
||||||
| Wholesale |
$ | 81,822 | $ | 72,913 | ||||
| Direct-to-consumer |
10,435 | 4,465 | ||||||
|
|
|
|
|
|||||
| Subtotal |
92,257 | 77,378 | ||||||
| Unallocated expenses |
(42,904 | ) | (36,442 | ) | ||||
|
|
|
|
|
|||||
| Total operating income |
$ | 49,353 | $ | 40,936 | ||||
|
|
|
|
|
|||||
Operating income from our wholesale segment increased $8.9 million, or 12.2%, to $81.8 million in the fiscal year ended February 1, 2014 from $72.9 million in the fiscal year ended February 2, 2013. This increase was driven primarily from the sales volume increase of $26.0 million and a decrease in operating expenses as a percentage of wholesale sales, partially offset by a reduction in the gross margin rate primarily due to charges associated with recording additional inventory reserves. The decrease in operating expenses as a percentage of net wholesale sales resulted as our net wholesale sales grew at a rate greater than our expenses during fiscal 2013.
Operating income from our direct-to-consumer segment increased $6.0 million, or 133.7% to $10.4 million in the fiscal year ended February 1, 2014 from $4.5 million in the fiscal year ended February 2, 2013. The increase resulted primarily from the sales volume increase of $21.8 million which more than offset the additional operating expenses incurred during the period to support the sales growth.
Interest expense for the fiscal year ended February 1, 2014 was $18.0 million, decreasing $50.7 million, or 73.8%, versus $68.7 million for the fiscal year ended February 2, 2013. Interest expense decreased as we had lower average debt balances period over period. The decrease in overall debt balances was primarily due to certain affiliates of Sun Capital contributing certain outstanding indebtedness to the Company in June 2013, thus eliminating interest expense on approximately $407.5 million in debt at that time. On November 27, 2013, in connection with the IPO and Restructuring Transactions, we entered into the Term Loan Facility and the Revolving Credit Facility.
Other expense, net, was $0.7 million for the fiscal year ended February 1, 2014 as compared to $0.8 million for the fiscal year ended February 2, 2013.
Provision for income taxes for the fiscal year ended February 1, 2014 was $7.3 million, increasing $6.1 million versus $1.2 million for the fiscal year ended February 2, 2013. Our effective tax rate on pretax income for the fiscal year ended February 1, 2014 and the fiscal year ended February 2, 2013 was 23.7% and (4.1%), respectively. The rates for the fiscal year ended February 1, 2014 and the fiscal year ended February 2, 2013 differed from the U.S. statutory rate of 35.0% primarily due to state taxes, nondeductible interest and changes in our valuation allowances.
Net loss from discontinued operations
The separation of the non-Vince businesses was completed on November 27, 2013. Net loss from discontinued operations was $50.8 million for the fiscal year ended February 1, 2014, decreasing $27.2 million, or 34.9%, from a net loss of $78.0 million for the fiscal year ended February 2, 2013.
44
Table of Contents
Net loss
Net loss was $27.4 million for the fiscal year ended February 1, 2014, decreasing $80.3 million, or 74.5%, from a net loss of $107.7 million for the fiscal year ended February 2, 2013. The reduction in our net loss was primarily due to increased income from operations of $8.4 million, reduced interest expense of $50.7 million and a lower net loss from discontinued operations of $27.2 million, partially offset by the increase in income taxes of $6.1 million.
Discontinued Operations
On November 27, 2013, in connection with the IPO and Restructuring Transactions, we separated the Vince and non-Vince businesses whereby the non-Vince businesses are now owned by Kellwood Holding, LLC, which is controlled by affiliates of Sun Capital. As the Company and Kellwood Holding, LLC were under the common control of affiliates of Sun Capital, this separation transaction resulted in a $73.1 million adjustment to additional paid-in capital on our Consolidated Balance Sheet at February 1, 2014.
As a result of the separation with the non-Vince businesses, the financial results for the non-Vince businesses, through the separation on November 27, 2013, are now included in results from discontinued operations. The non-Vince businesses continue to operate as a stand-alone company. Due to differences in the basis of presentation for discontinued operations and the basis of presentation as a stand-alone company, the financial results of the non-Vince businesses included within discontinued operations of the Company may not be indicative of actual financial results of the non-Vince businesses as a stand-alone company.
In connection with the Restructuring Transactions, the Company issued a promissory note (the “Kellwood Note Receivable”) to Kellwood Company, LLC, in the amount of $341.5 million. Following the completion of the IPO and the Company’s entry into the Term Loan Facility and the Revolving Credit Facility, the Company used proceeds from the IPO and borrowings under the Term Loan Facility to repay the Kellwood Note Receivable, which proceeds, in turn, were primarily used by Kellwood to repay, discharge or repurchase indebtedness of Kellwood Company, LLC. As a result, neither Vince Holding Corp. nor any of its consolidated subsidiaries have any obligations with respect to the Wells Fargo Facility, the Cerberus Term Loan, the Sun Term Loan Agreements, any 12.875% Notes or any 7.625% Notes, which are each described below under “Financing Activities”.
The separation of the non-Vince businesses was completed on November 27, 2013. Accordingly, there are no results from discontinued operations reflected on the Consolidated Financial Statements for the fiscal year ended January 31, 2015. The results of the non-Vince businesses included in discontinued operations for the fiscal years ended February 1, 2014 and February 2, 2013 are summarized in the following table below (in thousands, except effective tax rates).
| Fiscal Year | ||||||||
| 2013 | 2012 | |||||||
| Net sales |
$ | 400,848 | $ | 514,806 | ||||
| Cost of products sold |
313,620 | 409,763 | ||||||
|
|
|
|
|
|||||
| Gross profit |
87,228 | 105,043 | ||||||
| Selling, general and administrative expenses |
98,016 | 132,871 | ||||||
| Restructuring, environmental and other charges |
1,628 | 5,732 | ||||||
| Impairment of long-lived assets |
1,399 | 6,497 | ||||||
| Change in fair value of contingent consideration |
1,473 | (7,162 | ) | |||||
| Interest expense, net |
46,677 | 55,316 | ||||||
| Other expense, net |
498 | (9,776 | ) | |||||
|
|
|
|
|
|||||
| Loss before income taxes |
(62,463 | ) | (78,435 | ) | ||||
| Income taxes |
(11,648 | ) | (421 | ) | ||||
|
|
|
|
|
|||||
| Net loss from discontinued operations, net of taxes |
$ | (50,815 | ) | $ | (78,014 | ) | ||
|
|
|
|
|
|||||
| Effective tax rate |
18.6 | % | 0.5 | % | ||||
|
|
|
|
|
|||||
45
Table of Contents
Net loss from discontinued operations—Fiscal 2013 Compared to Fiscal 2012
The separation of the non-Vince businesses was completed on November 27, 2013. Net loss from discontinued operations was $50.8 million for the fiscal year ended February 1, 2014, decreasing $27.2 million, or 34.9%, from a net loss of $78.0 million for the fiscal year ended February 2, 2013. Results for fiscal 2013 include two fewer months compared to fiscal 2012 and were positively impacted by income tax benefit of $11.6 million. This tax benefit was generated primarily as a result of the release of valuation allowance related to the allocation of a disallowed tax loss on the sale of a trademark to intangibles with indefinite lives, resulting in fewer deferred tax liabilities that cannot be offset against deferred tax assets for valuation allowance purposes.
Liquidity and Capital Resources
Vince Holding Corp.’s sources of liquidity are our cash and cash equivalents, cash flows from operations and borrowings available under the Revolving Credit Facility. Our primary cash needs are capital expenditures for new stores and related leasehold improvements, for our new offices and showroom spaces, meeting our debt service requirements, paying amounts due per the Tax Receivable Agreement, and funding working capital requirements. The most significant components of our working capital are cash and cash equivalents, accounts receivable, inventories, accounts payable and other current liabilities. See “—Outlook” below.
On November 27, 2013, in connection with the consummation of the IPO and Restructuring Transactions, all previously outstanding debt obligations either remained with Kellwood (i.e. the non-Vince businesses) or were discharged, repurchased or refinanced. In connection with the consummation of these transactions, Vince Holding Corp. entered into the Term Loan Facility and Revolving Credit Facility, which are discussed further below.
Operating Activities
| Fiscal Year | ||||||||||||
| (in thousands) | 2014 | 2013 | 2012 | |||||||||
| Operating activities |
||||||||||||
| Net income (loss) |
$ | 35,723 | $ | (27,420 | ) | $ | (107,709 | ) | ||||
| Less: Net loss from discontinued operations |
— | (50,815 | ) | (78,014 | ) | |||||||
| Add (deduct) items not affecting operating cash flows: |
||||||||||||
| Depreciation |
4,668 | 2,186 | 1,411 | |||||||||
| Amortization of intangible assets |
599 | 599 | 598 | |||||||||
| Amortization of deferred financing costs |
1,532 | 178 | — | |||||||||
| Amortization of deferred rent |
3,045 | 465 | 426 | |||||||||
| Deferred income taxes |
23,248 | 7,225 | 1,147 | |||||||||
| Share-based compensation expense |
1,896 | 347 | — | |||||||||
| Capitalized PIK Interest |
— | 15,883 | 68,684 | |||||||||
| Loss on disposal of property, plant and equipment |
— | 262 | — | |||||||||
| Changes in assets and liabilities: |
||||||||||||
| Receivable, net |
6,401 | (6,265 | ) | (7,459 | ) | |||||||
| Inventories, net |
(3,463 | ) | (15,069 | ) | (8,360 | ) | ||||||
| Prepaid expenses and other current assets |
2,809 | 1,681 | (2,455 | ) | ||||||||
| Accounts payable and accrued expenses |
3,066 | 3,235 | 17,208 | |||||||||
| Other assets and liabilities |
742 | (156 | ) | (131 | ) | |||||||
|
|
|
|
|
|
|
|||||||
| Net cash provided by operating activities—continuing operations |
80,266 | 33,966 | 41,374 | |||||||||
| Net cash used in operating activities—discontinued operations |
— | (54,667 | ) | (67,408 | ) | |||||||
|
|
|
|
|
|
|
|||||||
| Net cash provided by/(used in) operating activities |
$ | 80,266 | $ | (20,701 | ) | $ | (26,034 | ) | ||||
|
|
|
|
|
|
|
|||||||
46
Table of Contents
Continuing operations
Net cash provided by operating activities during fiscal 2014 was $80.3 million, which consisted of net income from continuing operations of $35.7 million, impacted by non-cash items of $35.0 million and cash provided by working capital of $9.6 million. Net cash provided by working capital was, in part, due to a decrease in receivables of $6.4 million driven largely by higher trade deductions, a decrease of $2.8 million in prepaid expenses and other current assets and a $3.1 million increase in accounts payable and accrued expenses. This was partially offset by a $3.5 million increase in inventory due to increased inventory purchases to support new stores and shop-in-shops and the impact of higher intransit inventory resulting primarily from a change in our shipping strategy to an FOB shipment basis.
Net cash provided by operating activities during fiscal 2013 primarily consists of net income (loss), adjusted for certain non-cash items including PIK interest on the Sun Promissory Notes and Sun Capital Loan Agreement, which was later contributed as capital, as well as depreciation, amortization and changes in deferred income taxes and the effects of changes in working capital and other activities.
Net cash provided by operating activities during fiscal 2012 was $41.4 million, which consisted of net loss of $29.7 million, impacted by non-cash items of $72.3 million and cash used in working capital of $1.2 million. Non-cash expenses primarily consisted of PIK interest expense of $68.7 million. Net cash used in working capital primarily resulted from an increase in inventories, net of $8.4 million due to timing of inventory receipts and an increase in receivables, net of $7.5 million due to the timing of customer receipts. This was partially offset by increases in our accounts payable and other accrued expenses of $17.2 million due to the timing of vendor payments as well as the accrual of $6.4 million in transition payment to our founders, which was subsequently paid during fiscal 2013.
Discontinued operations
Net cash used in operating activities for 2013 was $54.7 million, which consisted of net loss of $50.8 million adjusted for non-cash charges of $15.3 million, and cash used in working capital of $19.2 million.
Net cash used in operating activities for 2012 was $67.4 million, which consisted of net loss of $78.0 million adjusted for non-cash charges of $25.5 million, and cash used in working capital of $14.9 million.
Investing Activities
| Fiscal Year | ||||||||||||
| (in thousands) | 2014 | 2013 | 2012 | |||||||||
| Investing activities |
||||||||||||
| Payments for capital expenditures |
$ | (19,699 | ) | $ | (10,073 | ) | $ | (1,821 | ) | |||
| Payments for contingent purchase price |
— | — | (806 | ) | ||||||||
|
|
|
|
|
|
|
|||||||
| Net cash used in investing activities—continuing operations |
(19,699 | ) | (10,073 | ) | (2,627 | ) | ||||||
| Net cash (used in)/provided by investing activities—discontinued operations |
— | (5,936 | ) | 20,088 | ||||||||
|
|
|
|
|
|
|
|||||||
| Net cash (used in)/provided by investing activities |
$ | (19,699 | ) | $ | (16,009 | ) | $ | 17,461 | ||||
|
|
|
|
|
|
|
|||||||
Continuing operations
Net cash used in investing activities of $19.7 million during fiscal 2014 represents capital expenditures related to retail store build-outs, including leasehold improvements and store fixtures as well as expenditures for our shop-in-shop spaces operated by certain distribution partners and the costs related to the build-out of our new corporate office spaces and showroom facilities.
47
Table of Contents
Net cash used in investing activities of $10.1 million during fiscal 2013 represents capital expenditures, primarily related to retail store build-outs, including leasehold improvements and store fixtures
Net cash used in investing activities of $2.6 million during fiscal 2012 is primarily attributable to capital expenditures and cash payments paid to CRL Group (former owners of the Vince business) related to the acquisition of the Vince business as a result of achievement of performance goals as specified in the related purchase agreement.
Discontinued operations
Net cash used in investing activities for 2013 was $5.9 million, primarily consisting of $7.1 million of cash and cash equivalents retained by the non-Vince business after the Restructuring Transactions. Additionally there were $4.8 million in payments for capital expenditures and other assets related to the non-Vince business during the year, offset in part by proceeds from the sale of various assets of the non-Vince business prior to the Restructuring Transactions of $5.4 million, net of selling costs.
Net cash provided by investing activities for 2012 was $20.1 million, consisting of proceeds from the sale of various assets of the non-Vince business of $28.9 million, net of selling costs, offset in part by payments for capital expenditures and other assets of the non-Vince business of $8.3 million.
Financing Activities
| Fiscal Year | ||||||||||||
| (in thousands) | 2014 | 2013 | 2012 | |||||||||
| Financing activities |
||||||||||||
| Proceeds from borrowings under the Revolving Credit Facility |
$ | 50,500 | $ | — | $ | — | ||||||
| Payments for Revolving Credit Facility |
(27,500 | ) | — | — | ||||||||
| Proceeds from borrowings under the Term Loan Facility |
— | 175,000 | — | |||||||||
| Payments for Term Loan Facility |
(105,000 | ) | (5,000 | ) | — | |||||||
| Payment for Kellwood Note Receivable |
— | (341,500 | ) | — | ||||||||
| Fees paid for Term Loan Facility and Revolving Credit Facility |
(114 | ) | (5,146 | ) | — | |||||||
| Proceeds from common stock issuance, net of certain transaction costs |
— | 186,000 | — | |||||||||
| Stock option exercise |
175 | 42 | — | |||||||||
|
|
|
|
|
|
|
|||||||
| Net cash (used in)/provided by financing activities—continuing operations |
(81,939 | ) | 9,396 | — | ||||||||
| Net cash provided by financing activities—discontinued operations |
— | 46,917 | 8,615 | |||||||||
|
|
|
|
|
|
|
|||||||
| Net cash (used in)/provided by financing activities |
$ | (81,939 | ) | $ | 56,313 | $ | 8,615 | |||||
|
|
|
|
|
|
|
|||||||
Continuing operations
Net cash provided by financing activities primarily relates to borrowings and repayments of the debt obligations and debt issuance costs related thereto, as well as activity related to the issuance of our common stock and exercise of employee stock options.
Net cash used by financing activities was $81.9 million during fiscal 2014, primarily consisting of voluntary prepayments totaling $105.0 million on the Term Loan Facility, partially offset by $23.0 million of net borrowings under our Revolving Credit Facility.
Net cash provided by financing activities was $9.4 million during fiscal 2013, primarily consisting of $186.0 million of proceeds from the issuance of common stock, net of certain transactions costs, on November 27, 2013. In connection with the IPO and the Restructuring Transactions discussed elsewhere in this
48
Table of Contents
annual report in Form 10-K, the Company made borrowings of $175.0 million under the Term Loan Facility and also entered into an agreement for the Revolving Credit Facility, for which we paid $5.1 million in debt issuance costs. Proceeds from the IPO and borrowings under the Term Loan Facility were then used to repay the Kellwood Note Receivable of $341.5 million. In January of fiscal 2013, the Company made a voluntary prepayment of $5.0 million on the Term Loan Facility.
Discontinued operations
Net cash provided by financing activities during fiscal 2013 was $46.9 million, primarily consisting of $5.0 million borrowings under the Sun Term Loan Agreements, as well a $41.9 million net increase in borrowings under the Kellwood revolving credit facilities, net of fees paid.
Net cash provided by financing activities during fiscal 2012 was $8.6 million, primarily consisting of $30.0 million borrowings under the Sun Term Loan Agreements and $1.9 million in payments under the Rebecca Taylor earnout agreement, offset in part by $15.0 million payments for debt extinguishment during the year as well as $1.0 million in fees paid related to financing agreements.
Current Existing Credit Facilities and Debt (Post IPO and Restructuring Transactions)
Revolving Credit Facility
On November 27, 2013, in connection with the closing of the IPO and Restructuring Transactions, Vince, LLC entered into a senior secured revolving credit facility (the “Revolving Credit Facility”). Bank of America, N.A. (“BofA”) serves as administrative agent under this facility. This Revolving Credit Facility provides for a revolving line of credit of up to $50.0 million maturing on November 27, 2018. The Revolving Credit Facility also provides for a letter of credit sublimit of $25.0 million (plus any increase in aggregate commitments) and for an increase in aggregate commitments of up to $20.0 million. Vince, LLC is the borrower and Vince Holding Corp. and Vince Intermediate Holding, LLC are the guarantors under the Revolving Credit Facility. Interest is payable on the loans under the Revolving Credit Facility, at either the LIBOR or the Base Rate, in each case, with applicable margins subject to a pricing grid based on an excess availability calculation. The “Base Rate” means, for any day, a fluctuating rate per annum equal to the highest of (i) the rate of interest in effect for such day as publicly announced from time to time by BofA as its prime rate; (ii) the Federal Funds Rate for such day, plus 0.50%; and (iii) the LIBOR Rate for a one month interest period as determined on such day, plus 1.0%. During the continuance of an event of default and at the election of the required lender, interest will accrue at a rate of 2% in excess of the applicable non-default rate.
The Revolving Credit Facility contains a requirement that, at any point when “Excess Availability” is less than the greater of (i) 15% percent of the loan cap or (ii) $7.5 million, and continuing until Excess Availability exceeds the greater of such amounts for 30 consecutive days, during which time, Vince, LLC must maintain a consolidated EBITDA (as defined in the related credit agreement) equal to or greater than $20.0 million. We have not been subject to this maintenance requirement since Excess Availability has been greater than the required minimum.
The Revolving Credit Facility contains representations and warranties, other covenants and events of default that are customary for this type of financing, including limitations on the incurrence of additional indebtedness, liens, negative pledges, guarantees, investments, loans, asset sales, mergers, acquisitions, prepayment of other debt, the repurchase of capital stock, transactions with affiliates, and the ability to change the nature of its business or its fiscal year. The Revolving Credit Facility generally permits dividends in the absence of any event of default (including any event of default arising from the contemplated dividend), so long as (i) after giving pro-forma effect to the contemplated dividend, for the following six months Excess Availability will be at least the greater of 20% of the aggregate lending commitments and $7.5 million and (ii) after giving pro forma effect to the contemplated dividend, the “Consolidated Fixed Charge Coverage Ratio” for the 12 months preceding
49
Table of Contents
such dividend shall be greater than or equal to 1.1 to 1.0 (provided that the Consolidated Fixed Charge Coverage Ratio may be less than 1.1 to 1.0 if, after giving pro forma effect to the contemplated dividend, Excess Availability for the six fiscal months following the dividend is at least the greater of 35% of the aggregate lending commitments and $10 million). We are in compliance with applicable financial covenants.
As of January 31, 2015, the availability under the $50.0 million Revolving Credit Facility was $19.4 million. As of January 31, 2015, there was $23.0 million of borrowings outstanding and $7.6 million of letters of credit outstanding under the Revolving Credit Facility. The weighted average interest rate for borrowings outstanding under the Revolving Credit Facility as of January 31, 2015 was 2.1%. There were no borrowings outstanding under the Revolving Credit Facility as of February 1, 2014.
Term Loan Facility
On November 27, 2013, in connection with the closing of the IPO and Restructuring Transactions, Vince, LLC and Vince Intermediate entered into a $175.0 million senior secured term loan credit facility (the “Term Loan Facility”) with the lenders party thereto, BofA, as administrative agent, JPMorgan Chase Bank and Merrill Lynch, Pierce, Fenner & Smith Incorporated, as joint lead arrangers, and Cantor Fitzgerald as documentation agent. The Term Loan Facility will mature on November 27, 2019. On November 27, 2013, net borrowings under the Term Loan Facility were used at closing, together with proceeds from the IPO, to repay the Kellwood Note Receivable issued by Vince Intermediate to Kellwood Company, LLC immediately prior to the consummation of the IPO as part of the Restructuring Transactions.
The Term Loan Facility also provides for an incremental facility of up to the greater of $50.0 million and an amount that would result in the consolidated net total secured leverage ratio not exceeding 3.00 to 1.00, in addition to certain other rights to refinance or repurchase portions of the term loan. The Term Loan Facility is subject to quarterly amortization of principal equal to 0.25% of the original aggregate principal amount of the Term Loan Facility, with the balance payable at final maturity. Interest is payable on loans under the Term Loan Facility at a rate of either (i) the Eurodollar rate (subject to a 1.00% floor) plus an applicable margin of 4.75% to 5.00% based on a leverage ratio or (ii) the base rate applicable margin of 3.75% to 4.00% based on a leverage ratio. During the continuance of a payment or bankruptcy event of default, interest will accrue (i) on the overdue principal amount of any loan at a rate of 2% in excess of the rate otherwise applicable to such loan and (ii) on any overdue interest or any other outstanding overdue amount at a rate of 2% in excess of the non-default interest rate then applicable to base rate loans.
The Term Loan Facility contains a requirement that Vince, LLC and Vince Intermediate maintain a “Consolidated Net Total Leverage Ratio” as of the last day of any period of four fiscal quarters not to exceed 3.75 to 1.00 for the fiscal quarters ending February 1, 2014 through November 1, 2014, 3.50 to 1.00 for the fiscal quarters ending January 31, 2015, through October 31, 2015, and 3.25 to 1.00 for the fiscal quarter ending January 30, 2016 and each fiscal quarter thereafter. In addition, the Term Loan Facility contains customary representations and warranties, other covenants, and events of default, including but not limited to, limitations on the incurrence of additional indebtedness, liens, negative pledges, guarantees, investments, loans, asset sales, mergers, acquisitions, prepayment of other debt, the repurchase of capital stock, transactions with affiliates, and the ability to change the nature of its business or its fiscal year, and distributions and dividends. The Term Loan Facility generally permits dividends to the extent that no default or event of default is continuing or would result from the contemplated dividend and the pro forma Consolidated Net Total Leverage Ratio after giving effect to such contemplated dividend is at least 0.25 lower than the maximum Consolidated Net Total Leverage Ratio for such quarter. All obligations under the Term Loan Facility are guaranteed by Vince Holding Corp. and any future material domestic restricted subsidiaries of Vince, LLC and secured by a lien on substantially all of the assets of Vince Holding Corp., Vince, LLC and Vince Intermediate and any future material domestic restricted subsidiaries. We are in compliance with applicable financial covenants.
50
Table of Contents
Through January 31, 2015, on an inception to date basis, we have made voluntary prepayments totaling $110.0 million in the aggregate on the original $175.0 million Term Loan Facility entered into on November 27, 2013. Of the total $110.0 million aggregate voluntary prepayments, $105.0 million were paid during fiscal 2014. The voluntary prepayments of $105.0 million made during the current fiscal year were partially funded by $23.0 million of net borrowings under the Revolving Credit Facility. As of January 31, 2015 we had $65.0 million of debt outstanding under the Term Loan Facility.
Credit Facilities and Debt Prior to IPO and Restructuring Transactions which occurred on November 27, 2013
Sun Promissory Notes
On May 2, 2008, Vince Holding Corp. issued the Sun Promissory Notes in amounts totaling $300.0 million. The unpaid principal balance of the note accrued interest at 12% per annum until the maturity date of October 15, 2016, at which point any unpaid principal balance of the note would have accrued interest at a rate of 14% per annum until the note was paid in full. No interest was paid on the Sun Promissory Notes.
On December 28, 2012, all interest accrued under the note prior to July 19, 2012 was waived. This resulted in an increase to additional paid-in-capital in the amount of $270.8 million as both parties were under the common control of affiliates of Sun Capital.
Effective June 18, 2013, an affiliate of Sun Capital contributed $407.5 million of indebtedness under the Sun Capital Loan Agreement and the Sun Promissory Notes as a capital contribution to Vince Holding Corp., and as a result, no amount remains outstanding under either instrument.
Sun Capital Loan Agreement
Vince Holding Corp. was party to the Sun Capital Loan Agreement with SCSF Kellwood Finance, LLC (“SCSF Finance”) and Sun Kellwood Finance (as successors to Bank of Montreal) for a $72.0 million line of credit. Under the terms of this agreement, as amended from time to time, interest accrued at the greater of prime plus 2% per annum or LIBOR plus 4.75% per annum and was due by the last day of each fiscal quarter.
On December 28, 2012, Sun Kellwood Finance and SCSF Finance waived all interest capitalized and accrued under the loan authorization agreement prior to July 19, 2012 (which was the scheduled maturity date). As all parties were under the common control of affiliates of Sun Capital, this transaction resulted in a capital contribution of $18.2 million, which was recorded as an adjustment to additional paid-in-capital as of February 2, 2013.
Effective June 18, 2013, an affiliate of Sun Capital contributed $407.5 million of indebtedness under the Sun Capital Loan Agreement and the Sun Promissory Notes as a capital contribution to Vince Holding Corp., and as a result, no amount remains outstanding under either instrument.
Wells Fargo Facility
On October 19, 2011 Kellwood Company and certain of its domestic subsidiaries, as borrowers, entered into a credit agreement with Wells Fargo Bank, National Association, as agent, and lenders from time to time party thereto (“the “Wells Fargo Facility”). The Wells Fargo Facility provided a non-amortizing senior revolving credit facility with aggregate lending commitments of $155.0 million. The borrowings were secured by a first-priority security interest in substantially all of the assets of the borrowers, including the assets of Vince, LLC. Borrowings bore interest at a rate per annum equal to an applicable margin (generally 1.25%-1.75% per annum plus, at the borrowers’ election, LIBOR or a Base Rate). On November 27, 2013, in connection with the consummation of the IPO and Restructuring Transactions, the Wells Fargo Facility was amended and restated in accordance with its terms. After giving effect to such amendment and restatement, neither Vince Holding Corp. nor any of its subsidiaries have any obligations thereunder.
51
Table of Contents
Cerberus Term Loan
On October 19, 2011, Kellwood Company and certain of its domestic subsidiaries, as borrowers, entered into a Term Loan Agreement (the “Term Loan Agreement”), as amended, with Cerberus Business Finance, LLC, as agent and the lenders from time to time party thereto. The Term Loan Agreement provided the borrowers with a non-amortizing secured term loan in an aggregate amount of $55.0 million (the “Cerberus Term Loan”), of which $10.0 million was repaid during fiscal 2012. All borrowings under the Cerberus Term Loan bore interest at a rate per annum equal to an applicable margin (10.25%-11.25% per annum for LIBOR Rate Loans and 8.25%-8.75% for Reference Rate Loans) plus, at the borrower’s election, LIBOR or a Reference Rate as defined in the Term Loan Agreement. The Term Loan Agreement also provided for a portion of such interest equal to 1.0% per annum to be paid-in-kind and added to the principal amount of such term loans. The Cerberus Term Loan was secured by a security interest in substantially all of the assets of the borrowers, including the assets of Vince, LLC. On November 27, 2013, in connection with the closing of the IPO and Restructuring Transactions, the Cerberus Term Loan was repaid with the proceeds from the Company’s repayment of the Kellwood Note Receivable, as such neither Vince Holding Corp. nor any of its subsidiaries have any obligations thereunder.
Sun Term Loan Agreements
Since fiscal year 2009, Kellwood Company and certain of its domestic subsidiaries, as borrowers, entered into various term loan agreements (“Sun Term Loan Agreements”) with affiliates of Sun Capital, as lenders, and Sun Kellwood Finance, as collateral agent. The Sun Term Loan Agreements were secured by a security interest in substantially all of the assets of the borrowers, which included the assets of Vince, LLC, which security interest was contractually subordinated to the security interests of the lenders under Wells Fargo Facility and the Cerberus Term Loan. The borrowings under the Sun Term Loan Agreements bore interest at a rate per annum of 5.0%-6.0%, paid-in-kind and added to the principal amount of such term loans. On November 27, 2013, in connection with the closing of the IPO and Restructuring Transactions, the obligations under the Sun Term Loan Agreements were discharged through (i) the application of Kellwood Note Receivable proceeds repaid by the Company and (ii) capital contributions by Sun Capital affiliates, as such neither Vince Holding Corp. nor any of its subsidiaries have any obligations thereunder.
12.875% Notes
Interest on the 12.875% Second-Priority Senior Secured Payment-In-Kind Notes due 2014 (the “12.875% Notes”) of Kellwood Company was paid (a) in cash at a rate of 7.875% per annum payable in January and July; and (b) in the form of PIK interest at a rate of 5.0% per annum (“PIK Interest”) payable either by increasing the principal amount of the outstanding 12.875% Notes, or by issuing additional 12.875% Notes with a principal amount equal to the PIK Interest accrued for the interest period. The 12.875% Notes were guaranteed by various of Kellwood Company’s subsidiaries on a secured basis (including the assets of Vince, LLC), which security interest was contractually subordinated to security interests of lenders under the Wells Fargo Facility, the Cerberus Term Loan and the Sun Term Loan Agreements. On November 27, 2013, in connection with the closing of the IPO and Restructuring Transactions, the 12.875% Notes were redeemed with proceeds from the repayment of the Kellwood Note Receivable by the Company, at which time Vince, LLC was released as a guarantor and the obligations under the indenture were satisfied and discharged.
7.625% Notes
Interest on the 7.625% 1997 Debentures due October 15, 2017 of Kellwood Company (the “7.625% Notes”) was payable in April and October. On November 27, 2013, in connection with the closing of the IPO and as an early settlement of the tender offer, Kellwood Company, LLC accepted for purchase (and cancelled) approximately $33.5 million in aggregate principal amount of the 7.625% Notes. On December 12, 2013, as part of the final settlement of the tender offer, Kellwood Company, LLC accepted for purchase (and cancelled) an additional approximately $4.6 million in aggregate principal amount of the 7.625% Notes. After giving effect to
52
Table of Contents
these settlements, approximately $48.8 million of the 7.625% Notes remain issued and outstanding; provided, that neither Vince Holding Corp. nor its subsidiaries are a guarantor or obligor of such notes.
Outlook
Currently, our short-term and long-term liquidity needs arise primarily from debt service, amounts payable under our Tax Receivable Agreement, capital expenditures and working capital requirements associated with our growth strategies. Management believes that our current balances of cash and cash equivalents, cash flow from operations and amounts available under the Revolving Credit Facility will be adequate to fund our debt service requirements, obligations under our Tax Receivable Agreement, planned capital expenditures and working capital needs for at least the next twelve months. Our ability to make planned capital expenditures, to fund our debt service requirements and to remain in compliance with our financial covenants, and to fund operations depends on our future operating performance, which in turn, may be impacted by prevailing economic conditions and other financial and business factors, some of which are beyond our control.
Capital expenditures are expected to increase as we continue to invest in the direct-to-consumer store expansion and wholesale shop-in-shop build-out. In fiscal 2015, we project capital expenditures to aggregate $17.0 million to $20.0 million related to our new and remodeled stores, shop-in-shop build-outs, our new Paris showroom, LA design studio and other corporate activities, including capital spending on our information system infrastructure.
Off-Balance Sheet Arrangements
Vince Holding Corp. did not have any relationships with unconsolidated organizations or financial partnerships, such as structured finance or special purpose entities, that would have been established for the purpose of facilitating off-balance sheet arrangements or other contractually narrow or limited purposes during the periods presented herein.
Contractual Obligations
The following table summarizes our contractual obligations as of January 31, 2015 and the effect such obligations are expected to have on our liquidity and cash flows in future periods:
| Future payments due by period (1) | ||||||||||||||||||||
| (In thousands) | Less than 1 Year |
1 to 3 years | 3 to 5 years | More than 5 Years |
Total | |||||||||||||||
| Operating lease obligations |
$ | 15,593 | $ | 35,789 | $ | 35,169 | $ | 63,516 | $ | 150,067 | ||||||||||
| Unrecognized tax benefits (2) |
||||||||||||||||||||
| Long-term debt obligations |
— | — | 88,000 | — | 88,000 | |||||||||||||||
| Interest on long-term debt (3) |
— | — | — | — | — | |||||||||||||||
| Tax Receivable Agreement (4) |
22,869 | — | — | — | 168,932 | |||||||||||||||
|
|
|
|
|
|
|
|
|
|
|
|||||||||||
| Total |
$ | 38,462 | $ | 35,789 | $ | 123,169 | $ | 63,516 | $ | 406,999 | ||||||||||
|
|
|
|
|
|
|
|
|
|
|
|||||||||||
| (1) | Vince, LLC has entered into the Shared Services Agreement with Kellwood Company, LLC pursuant to which Kellwood provides support services in various operational areas including, among other things, distribution, information technology and back office support (as described in “Certain Relationships and Related Party Transactions—Shared Services Agreement”). We have excluded the amounts due under such agreement from the table herein as we cannot precisely estimate the future payments to be made thereunder and timing thereof. However, we currently expect to pay between $7.0 million to $9.0 million on an annualized basis for services provided by Kellwood under the Shared Services Agreement. |
| (2) | As of January 31, 2015, we have recorded $4.5 million of unrecognized tax benefits, excluding interest and penalties. We are unable to make reliable estimates of cash flows by period due to the inherent uncertainty surrounding the effective settlement of these positions. |
53
Table of Contents
| (3) | The Term Loan Facility has interest payable at LIBOR (subject to a 1.00% floor) plus 4.75% or the base rate (subject to a 2% floor) plus 3.75%. The weighted average interest rate on the borrowings under the Revolving Credit Facility as of January 31, 2015 was 2.1%. |
| (4) | Vince Holding Corp. entered into the Tax Receivable Agreement with the Pre-IPO Stockholders (as described in “Shared Services Agreement” under Note 15 to the Consolidated Financial Statements in this annual report on Form 10-K.) We cannot, however, reliably estimate in which future periods these amounts would become due, other than those amounts expected to be paid within one year. The amount set forth in the “Total” column represents the remaining obligation as of January 31, 2015 under the Tax Receivable Agreement. |
Inflation
While inflation may impact our sales, cost of goods sold and expenses, we believe the effects of inflation on our results of operations and financial condition are not significant. While it is difficult to accurately measure the impact of inflation, management believes it has not been significant and cannot provide any assurances that our results of operations and financial condition will not be materially impacted by inflation in the future.
Critical Accounting Policies
Management’s discussion and analysis of financial condition and results of operations is based upon our consolidated financial statements, which have been prepared in accordance with accounting principles generally accepted in the United States of America. The preparation of these financial statements requires estimates and judgments that affect the reported amounts of our assets, liabilities, revenues and expenses. Management bases estimates on historical experience and other assumptions it believes to be reasonable under the circumstances and evaluates these estimates on an on-going basis. Actual results may differ from these estimates under different assumptions or conditions.
The following critical accounting polices reflect the significant estimates and judgments used in the preparation of our consolidated financial statements. With respect to critical accounting policies, even a relatively minor variance between actual and expected experience can potentially have a materially favorable or unfavorable impact on subsequent consolidated results of operations. For more information on our accounting policies, please refer to the Notes to Consolidated Financial Statements in this annual report on Form 10-K.
Revenue Recognition
Sales are recognized when goods are shipped in accordance with customer orders for the wholesale and e-commerce businesses, and at the time of sale to consumer for the retail business. The estimated amounts of sales discounts, returns and allowances are accounted for as reductions of sales when the associated sale occurs. These estimated amounts are adjusted periodically based on changes in facts and circumstances when the changes become known. Accrued discounts, returns and allowances are included as an offset to accounts receivable.
Accounts Receivable—Reserves for Allowances
Accounts receivable are recorded net of allowances for expected future chargebacks and margin support from wholesale partners. It is the nature of the apparel industry that suppliers like us face significant pressure from wholesale partners in the retail industry to provide allowances to compensate for their margin shortfalls. This pressure often takes the form of customers requiring us to provide price concessions on prior shipments as a prerequisite for obtaining future orders. Pressure for these concessions is largely determined by overall retail sales performance and, more specifically, the performance of our products at retail. To the extent our wholesale partners have more of our goods on hand at the end of the season, there will be greater pressure for us to grant
54
Table of Contents
markdown concessions on prior shipments. Our accounts receivable balances are reported net of expected allowances for these matters based on the historical level of concessions required and our estimates of the level of markdowns and allowances that will be required in the coming season in order to collect the receivables. We evaluate the allowance balances on a continual basis and adjust them as necessary to reflect changes in anticipated allowance activity. We also provide an allowance for sales returns based on historical return rates.
Accounts Receivable—Allowance for Doubtful Accounts
We maintain an allowance for doubtful accounts receivable for estimated losses resulting from wholesale partners that are unable to meet their financial obligations. Our estimation of the allowance for doubtful accounts involves consideration of the financial condition of specific customers as well as general estimates of future collectability based on historical experience and expected future trends. The estimation of these factors involves significant judgment. In addition, actual collection experience, and thus bad debt expense, can be significantly impacted by the financial difficulties of as few as one customer.
Inventory Valuation
Inventory values are reduced to net realizable value when there are factors indicating that certain inventories will not be sold on terms sufficient to recover their cost. Our products can be classified into two types: replenishment and non-replenishment. Replenishment items are those basics that are not highly seasonal or dependent on fashion trends. The same products are sold by retailers 12 months a year and styles evolve slowly. Retailers generally replenish their stocks of these items as they are sold. Only a relatively small portion of our business involves replenishment items.
The majority of our products consist of items that are non-replenishment as a result of being tied to a season. For these products, the selling season generally ranges from three to six months. The value of this seasonal merchandise might be sufficient for us to generate a profit over its cost throughout the season, but after its season a few months later the same inventory might be saleable at less than cost. The value may rise again the following year when the season in which the goods sell approaches—or it may not, depending on the level of prior year merchandise on the market and on year-to-year fashion changes.
The majority of out-of-season inventories may be sold to off-price retailers and other customers who serve a customer base that will purchase prior year fashions in addition to liquidation through our Vince outlets. The amount, if any, that these customers will pay for prior year fashions is determined by the desirability of the inventory itself as well as the general level of prior year goods available to these customers. The assessment of inventory value, as a result, is highly subjective and requires an assessment of the seasonality of the inventory, its future desirability, and future price levels in the off-price sector.
Many of our products are purchased for and sold to specific customers’ orders. Others are purchased in anticipation of selling them to a specific customer based on historical trends. The loss of a major customer, whether due to the customer’s financial difficulty or other reasons, could have a significant negative impact on the value of the inventory expected to be sold to that customer. This negative impact can also extend to purchase obligations for goods that have not yet been received. These obligations involve product to be received into inventory over the next one to six months.
Deferred Rent and Deferred Lease Incentives
We lease various office spaces, showrooms and retail stores. Many of these operating leases contain predetermined fixed escalations of the minimum rentals during the original term of the lease. For these leases, we recognize the related rental expense on a straight-line basis over the life of the lease and record the difference between the amount charged to operations and amounts paid as deferred rent. Certain of our retail store leases contain provisions for contingent rent, typically a percentage of retail sales once a predetermined threshold has
55
Table of Contents
been met. These amounts are expensed as incurred. Additionally, we received lease incentives in certain leases. These allowances have been deferred and are amortized on a straight-line basis over the life of the lease as a reduction of rent expense.
Fair Value Assessments of Goodwill and Other Intangible Assets
Goodwill and other indefinite-lived intangible assets are tested for impairment at least annually and in an interim period if a triggering event occurs. We completed our annual impairment testing on our goodwill and indefinite-lived intangible assets during the fourth quarters of fiscal 2014, fiscal 2013 and fiscal 2012.
In September 2011, the Financial Accounting Standards Board (“FASB”) issued an amendment to ASC Topic 350 Intangibles-Goodwill and Other. Under this amendment, an entity may elect to perform a qualitative impairment assessment for goodwill. If adverse trends are identified during the qualitative assessment that indicate that it is more likely than not that the fair value of a reporting unit is less than its carrying amount, a quantitative impairment test is required. “Step one” of this quantitative impairment test requires that the fair value of the reporting unit be estimated and compared to its carrying amount. If the carrying amount exceeds the estimated fair value of the asset, “step two” of the impairment test is performed to calculate the impairment loss. An impairment loss is recognized to the extent the carrying amount of the reporting unit exceeds the implied fair value.
An entity may pass on performing the qualitative assessment for a reporting unit and directly perform “step one” of the assessment. This determination can be made on an asset by asset basis, and an entity may resume performing a qualitative assessment in subsequent periods. The amendment is effective for annual and interim impairment tests for goodwill performed for fiscal years beginning after December 15, 2011. We adopted this amendment during fiscal 2012.
In fiscal 2014, fiscal 2013 and fiscal 2012, we performed a qualitative assessment on the goodwill and determined that it was not more likely than not that the carrying value of the reporting unit was greater than the fair value. As such, we were not required to perform “step two” of the impairment test.
In July 2012, FASB issued Accounting Standards Update No. 2012-02, Intangibles—Goodwill and Other (Topic 350): Testing Indefinite Lived Assets for Impairment. Under this amendment, an entity may elect to perform a qualitative impairment assessment for indefinite-lived intangible assets similar to the goodwill impairment testing guidance discussed above.
An entity may pass on performing the qualitative assessment for an indefinite-lived intangible asset and directly perform “step one” of the assessment. This determination can be made on an asset by asset basis, and an entity may resume performing a qualitative assessment in subsequent periods. The amendment is effective for annual and interim impairment tests for indefinite-lived intangible assets performed for fiscal years beginning after September 15, 2012. We early adopted this amendment during fiscal 2012.
In fiscal 2014, fiscal 2013 and fiscal 2012, we elected to perform a qualitative assessment on indefinite-lived intangible assets and determined that it was not more likely than not that the carrying value of the assets exceeded the fair value, as such we were not required to perform “step two” of the impairment test.
Determining the fair value of goodwill and other intangible assets is judgmental in nature and requires the use of significant estimates and assumptions, including revenue growth rates and operating margins, discount rates and future market conditions, among others. It is possible that estimates of future operating results could change adversely and impact the evaluation of the recoverability of the carrying value of goodwill and intangible assets and that the effect of such changes could be material.
Definite-lived intangible assets are comprised of customer relationships and are being amortized on a straight-line basis over their useful lives of 20 years.
56
Table of Contents
Provision for income taxes
We account for income taxes using the asset and liability method. Under this method, deferred tax assets and liabilities are recognized for the future tax consequences of temporary differences between the carrying amounts and tax bases of assets and liabilities at enacted rates. We determine the appropriateness of valuation allowances in accordance with the “more likely than not” recognition criteria. We recognize tax positions in our Consolidated Balance Sheets as the largest amount of tax benefit that is greater than 50% likely of being realized upon ultimate settlement with tax authorities assuming full knowledge of the position and all relevant facts.
Recent Accounting Pronouncements
For information on certain recently issued or proposed accounting standards which may impact Vince Holding Corp., please refer to the notes to Consolidated Financial Statements in this annual report on Form 10-K.
| ITEM 7A. | QUANTITATIVE AND QUALITATIVE DISCLOSURES ABOUT MARKET RISK. |
Our principal market risk relates to interest rate sensitivity, which is the risk that changes in interest rates will reduce our net income or net assets. Our variable rate debt consists of borrowings under the Term Loan Facility and Revolving Credit Facility. Our current interest rate on the Term Loan Facility is based on the Eurodollar rate (subject to a 1.00% floor) plus 4.75%. Our interest rate on the Revolving Credit Facility is based on the Eurodollar rate or the Base Rate (as defined in the Revolving Credit Facility) with applicable margins subject to a pricing grid based on excess availability. As of January 31, 2015, a one percentage point increase in the interest rate on our variable rate debt would result in additional interest expense of approximately $0.9 million for the $88.0 million borrowings outstanding under the Term Loan Facility and Revolving Credit Facility as of such date, calculated on an annual basis.
We do not believe that foreign currency risk, commodity price or inflation risks are expected to be material to our business or our consolidated financial position, results of operations or cash flows. Substantially all of our foreign sales and purchases are made in U.S. dollars.
| ITEM 8. | FINANCIAL STATEMENTS AND SUPPLEMENTARY DATA. |
See “Index to Financial Statements,” which is located on page F-1 appearing at the end of this annual report on Form 10-K.
ITEM 9. CHANGES IN AND DISAGREEMENTS WITH ACCOUNTANTS ON ACCOUNTING AND FINANCIAL DISCLOSURE.
None.
| ITEM 9A. | CONTROLS AND PROCEDURES. |
Disclosure Controls and Procedures
Attached as exhibits to this Annual Report on Form 10-K are certifications of our Chief Executive Officer and Chief Financial Officer. Rule 13a-14 of the Exchange Act requires that we include these certifications with this report. This Controls and Procedures section includes information concerning the disclosure controls and procedures referred to in the certifications. You should read this section in conjunction with the certifications.
Under the supervision and with the participation of our Chief Executive Officer and Chief Financial Officer, management has evaluated the effectiveness of the design and operation of our disclosure controls and procedures (as defined in Rules 13a-15(e) or 15d-15(e) of the Exchange Act) as of January 31, 2015.
We evaluate the effectiveness of our disclosure controls and procedures on at least a quarterly basis. Based upon that evaluation, our Chief Executive Officer and Chief Financial Officer concluded that our disclosure controls
57
Table of Contents
and procedures are effective to ensure information is recorded, processed, summarized and reported within the periods specified in the Securities and Exchange Commission’s rules and forms and to provide reasonable assurance that such information is accumulated and communicated to our management, including our Chief Executive Officer and Chief Financial Officer as appropriate, to allow timely decisions regarding required disclosure.
Limitations on the Effectiveness of Disclosure Controls and Procedures
In designing and evaluating our disclosure controls and procedures, we recognized that disclosure controls and procedures, no matter how well conceived and well operated, can provide only reasonable, not absolute, assurance that the objectives of the disclosure controls and procedures are met. Additionally, in designing disclosure controls and procedures, our management necessarily was required to apply its judgment in evaluating the cost-benefit relationship of possible disclosure controls and procedures. We have also designed our disclosure controls and procedures based in part upon assumptions about the likelihood of future events, and there can be no assurance that any design will succeed in achieving its stated goals under all potential future conditions.
Changes in Internal Control Over Financial Reporting
There was no change in our internal control over financial reporting that occurred during our latest fiscal quarter that has materially affected, or is reasonably likely to materially affect, our internal control over financial reporting.
Management’s Annual Report on Internal Control Over Financial Reporting
Management, including our Chief Executive Officer and Chief Financial Officer, is responsible for establishing and maintaining adequate internal control over financial reporting (as defined in Rule 13a-15(f) and 15d-15(f) under the Exchange Act). Our internal control over financial reporting is a process to provide reasonable assurance regarding the reliability of financial reporting and the preparation of financial statements for external purposes in accordance with generally accepted accounting principles. Our internal control over financial reporting includes those policies and procedures that (i) pertain to the maintenance of records that, in reasonable detail, accurately and fairly reflect the transactions and dispositions of our assets; (ii) provide reasonable assurance that transactions are recorded as necessary to permit preparation of financial statements in accordance with generally accepted accounting principles, and that our receipts and expenditures are being made only in accordance with authorizations of our management and directors; and (iii) provide reasonable assurance regarding prevention or timely detection of unauthorized acquisition, use or disposition of our assets that could have a material effect on our financial statements.
Because of its inherent limitations, internal control over financial reporting may not prevent or detect misstatements. Therefore, even those systems determined to be effective can provide only reasonable assurance with respect to financial statement preparation and presentation. Also, projections of any evaluation of effectiveness to future periods are subject to the risk that controls may become inadequate because of changes in conditions or that the degree of compliance with the policies or procedures may deteriorate.
Management assessed the effectiveness of our internal control over financial reporting as of January 31, 2015. In making this assessment, management used the criteria established by the Committee of Sponsoring Organizations of the Treadway Commission (“COSO”) in Internal Control-Integrated Framework (2013). Based on this assessment, management has concluded that, as of January 31, 2015, our internal control over financial reporting was effective, at a reasonable assurance level.
Because we are an emerging growth company under the JOBS Act, this Annual Report on Form 10-K does not include an attestation report of our independent registered public accounting firm.
| ITEM 9B. | OTHER INFORMATION. |
None.
58
Table of Contents
PART III
| ITEM 10. | DIRECTORS, EXECUTIVE OFFICERS AND CORPORATE GOVERNANCE. |
The information required by this Item is incorporated herein by reference from the Company’s definitive proxy statement to be filed with the Securities and Exchange Commission in connection with the registrant’s 2015 annual meeting of stockholders.
| ITEM 11. | EXECUTIVE COMPENSATION. |
The information required by this Item is incorporated herein by reference from the Company’s definitive proxy statement to be filed with the Securities and Exchange Commission in connection with the registrant’s 2015 annual meeting of stockholders.
ITEM 12. SECURITY OWNERSHIP OF CERTAIN BENEFICIAL OWNERS AND MANAGEMENT AND RELATED STOCKHOLDERS MATTERS.
The information required by this Item is incorporated herein by reference from the Company’s definitive proxy statement to be filed with the Securities and Exchange Commission in connection with the registrant’s 2015 annual meeting of stockholders.
ITEM 13. CERTAIN RELATIONSHIPS AND RELATED TRANSACTIONS, AND DIRECTOR INDEPENDENCE.
The information required by this Item is incorporated herein by reference from the Company’s definitive proxy statement to be filed with the Securities and Exchange Commission in connection with the registrant’s 2015 annual meeting of stockholders.
| ITEM 14. | PRINCIPAL ACCOUNTANT FEES AND SERVICES. |
The information required by this Item is incorporated herein by reference from the Company’s definitive proxy statement to be filed with the Securities and Exchange Commission in connection with the registrant’s 2015 annual meeting of stockholders.
59
Table of Contents
Part IV
| ITEM 15. | EXHIBITS, FINANCIAL STATEMENT SCHEDULES. |
| (a) | Financial Statements and Financial statement Schedules. See “Index to the Audited Consolidated Financial Statements” which is located on F-1 of this annual report on Form 10-K. |
| (b) | Exhibits. See the exhibit index which is included herein. |
Exhibit Listing:
| Exhibit Number |
Exhibit Description | |
| 3.1 | Amended & Restated Certificate of Incorporation of Vince Holding Corp. (incorporated by reference to Exhibit 3.1 to the Company’s Current Report on Form 8-K filed with the Securities Exchange Commission on November 27, 2013) | |
| 3.2 | Amended & Restated Bylaws of Vince Holding Corp. (incorporated by reference to Exhibit 3.1 to the Company’s Current Report on Form 8-K filed with the Securities Exchange Commission on November 27, 2013) | |
| 4.1 | Form of Stock certificate (incorporated by reference to Exhibit 4.1 to the Company’s Registration Statement on Form S-1 (File No. 333-191336) filed with the Securities Exchange Commission on November 12, 2013) | |
| 4.2 | Registration Agreement, dated as of February 20, 2008, among Apparel Holding Corp., Sun Cardinal, LLC, SCSF Cardinal, LLC and the Other Investors party thereto (incorporated by reference to Exhibit 4.2 to the Company’s Registration Statement on Form S-1 (File No. 333-191336) filed with the Securities Exchange Commission on September 24, 2013) | |
| 10.1 | Shared Services Agreement, dated as of November 27, 2013, between Vince, LLC and Kellwood Company, LLC (incorporated by reference to Exhibit 10.1 to the Company’s Current Report on Form 8-K filed with the Securities Exchange Commission on November 27, 2013) | |
| 10.2 | Tax Receivable Agreement, dated as of November 27, 2013, between Vince Intermediate Holding, LLC, the Stockholders, and Sun Cardinal, LLC as Stockholder Representative (incorporated by reference to Exhibit 10.2 to the Company’s Current Report on Form 8-K filed with the Securities Exchange Commission on November 27, 2013) | |
| 10.3 | Consulting Agreement, dated as of November 27, 2013, between Vince Holding Corp. and Sun Capital Partners Management V, LLC (incorporated by reference to Exhibit 10.3 to the Company’s Current Report on Form 8-K filed with the Securities Exchange Commission on November 27, 2013) | |
| 10.4 | Credit Agreement, dated as of November 27, 2013, by and among Vince, LLC, Vince Intermediate Holding, LLC, Bank of America, N.A., as Administrative Agent, J.P. Morgan Securities LLC, as Syndication Agent, Bank of America, N.A., Merrill Lynch, Pierce, Fenner & Smith Incorporated and J.P. Morgan Securities LLC, as Joint Lead Arrangers and Joint Bookrunners, and Cantor Fitzgerald Securities, as Documentation Agent (incorporated by reference to Exhibit 10.5 to the Company’s Current Report on Form 8-K filed with the Securities Exchange Commission on November 27, 2013) | |
| 10.5 | Credit Agreement, dated as of November 27, 2013, by and among Vince, LLC, the guarantors party thereto, Bank of America, N.A., as Agent, the other lenders party thereto and Merrill Lynch, Pierce, Fenner & Smith Incorporated, as Sole Lead Arranger and Sole Book Runner ( incorporated by reference to Exhibit 10.4 to the Company’s Current Report on Form 8-K filed with the Securities Exchange Commission on November 27, 2013 ) | |
60
Table of Contents
| Exhibit Number |
Exhibit Description | |
| 10.6† | Employment Agreement, dated as of May 4, 2012, between Jill Granoff and Kellwood Company (incorporated by reference to Exhibit 10.48 to the Company’s Registration Statement on Form S-1 (File No. 333-191336) filed with the Securities Exchange Commission on September 24, 2013) | |
| 10.7† | Amendment to Employment Agreement, dated as of December 30, 2012, between Jill Granoff and Kellwood Company (incorporated by reference to Exhibit 10.49 to the Company’s Registration Statement on Form S-1 (File No. 333-191336) filed with the Securities Exchange Commission on September 24, 2013) | |
| 10.8† | Amendment No. 2 to Employment Agreement, dated as of September 24, 2013, between Jill Granoff and Kellwood Company (incorporated by reference to Exhibit 10.50 to the Company’s Registration Statement on Form S-1 (File No. 333-191336) filed with the Securities Exchange Commission on September 24, 2013) | |
| 10.9† | Debt Recovery Bonus Side Letter Agreement, dated June 11, 2013, between Jill Granoff and Kellwood Company (incorporated by reference to Exhibit 10.51 to the Company’s Registration Statement on Form S-1 (File No. 333-191336) filed with the Securities Exchange Commission on September 24, 2013) | |
| 10.10† | Employment Agreement, dated March 2013, between Karin Gregersen and Vince, LLC (incorporated by reference to Exhibit 10.51 to the Company’s Annual Report on Form 10-K filed on April 4, 2014) | |
| 10.11† | Employment Agreement, dated April 5 2013, between Michele Sizemore and Vince, LLC (incorporated by reference to Exhibit 10.52 to the Company’s Annual Report on Form 10-K filed on April 4, 2014) | |
| 10.12† | Employment Agreement, dated September 25, 2013, between Jay Dubiner and Vince, LLC (incorporated by reference to Exhibit 10.53 to the Company’s Annual Report on Form 10-K filed on April 4, 2014) | |
| 10.13† | Employment Agreement, dated November 21, 2014, between Melissa Wallace and Vince Holding Corp. | |
| 10.14† | Assignment and Assumption Agreement, dated as of November 27, 2013, by and among Kellwood Company, LLC, Apparel Holding Corp. and Jill Granoff (incorporated by reference to Exhibit 10.55 to the Company’s Annual Report on Form 10-K filed on April 4, 2014) | |
| 10.15† | Employment Offer Letter, dated as of November 2, 2012, between Lisa Klinger and Kellwood Company (incorporated by reference to Exhibit 10.52 to the Company’s Registration Statement on Form S-1 (File No. 333-191336) filed with the Securities Exchange Commission on September 24, 2013) | |
| 10.16† | Assignment and Assumption Agreement, dated as of November 27, 2013, by and between Kellwood Company, LLC and Apparel Holding Corp. (incorporated by reference to Exhibit 10.57 to the Company’s Annual Report on Form 10-K filed on April 4, 2014) | |
| 10.17† | 2010 Stock Option Plan of Kellwood Company (incorporated by reference to Exhibit 10.56 to the Company’s Registration Statement on Form S-1 (File No. 333-191336) filed with the Securities Exchange Commission on September 24, 2013) | |
| 10.18† | Form of 2010 Stock Option Plan grant agreement for executive officers (incorporated by reference to Exhibit 10.57 to the Company’s Registration Statement on Form S-1 (File No. 333-191336) filed with the Securities Exchange Commission on September 24, 2013) | |
61
Table of Contents
| Exhibit Number |
Exhibit Description | |
| 10.19† | 2010 Stock Plan of Kellwood Company Grant Agreement, dated as of May 4, 2012, by and between Kellwood Company and Jill Granoff (incorporated by reference to Exhibit 10.43 to the Company’s Registration Statement on Form S-1 (File No. 333-191336) filed with the Securities Exchange Commission on September 24, 2013) | |
| 10.20† | Amendment to Grant Agreement, between Kellwood Company and Jill Granoff (incorporated by reference to Exhibit 10.59 to the Company’s Registration Statement on Form S-1 (File No. 333-191336) filed with the Securities Exchange Commission on September 24, 2013) | |
| 10.21† | First Amendment to Grant Agreement, dated December 30, 2012, between Kellwood Company and Jill Granoff ( incorporated by reference to Exhibit 10.60 to the Company’s Registration Statement on Form S-1 (File No. 333-191336) filed with the Securities Exchange Commission on September 24, 2013 ) | |
| 10.22† | Second Amendment to Grant Agreement, dated November 26, 2013, between Kellwood Company and Jill Granoff (incorporated by reference to Exhibit 10.12 to the Company’s Current Report on Form 8-K filed with the Securities Exchange Commission on November 27, 2013) | |
| 10.23† | 2010 Stock Plan of Kellwood Company Grant Agreement, dated as of December 10, 2012, by and between Kellwood Company and Lisa Klinger (incorporated by reference to Exhibit 10.61 to the Company’s Registration Statement on Form S-1 (File No. 333-191336) filed with the Securities Exchange Commission on September 24, 2013) | |
| 10.24† | First Amendment to Grant Agreement, dated November 26, 2013, between Kellwood Company and Lisa Klinger (incorporated by reference to Exhibit 10.13 to the Company’s Current Report on Form 8-K filed with the Securities Exchange Commission on November 27, 2013) | |
| 10.25† | Form of Indemnification Agreement (for directors and officers affiliated with Sun Capital Partners) (incorporated by reference to Exhibit 10.6 to the Company’s Current Report on Form 8-K filed on November 27, 2013) | |
| 10.26† | Form of Indemnification Agreement (for directors and officers not affiliated with Sun Capital Partners) (incorporated by reference to Exhibit 10.7 to the Company’s Current Report on Form 8-K filed on November 27, 2013) | |
| 10.27† | Vince Holding Corp. 2013 Incentive Plan (incorporated by reference to Exhibit 10.66 to the Company’s Registration Statement on Form S-1 (File No. (333-191336) filed with the Securities Exchange Commission on November 12, 2013) | |
| 10.28† | Form of Non-Qualified Stock Option Agreement (incorporated by reference to Exhibit 10.15 to the Company’s Current Report on Form 8-K filed on November 27, 2013) | |
| 10.29† | Form of Restricted Stock Unit Agreement (incorporated by reference to Exhibit 10.16 to the Company’s Current Report on Form 8-K filed on November 27, 2013) | |
| 10.30† | Form of Vince Holding Corp. 2013 Employee Stock Purchase Plan (incorporated by reference to Exhibit 10.67 to the Company’s Registration Statement on Form S-1 (File No. (333-191336) filed with the Securities Exchange Commission on November 12, 2013) | |
| 21.1 | List of subsidiaries of Vince Holding Corp. (incorporated by reference to Exhibit 21.1 to the Company’s Annual Report on Form 10-K filed on April 4, 2014) | |
| 23.1 | Consent of PricewaterhouseCoopers LLP | |
| 31.1 | CEO Certification pursuant to Section 302 of the Sarbanes-Oxley Act of 2002 | |
| 31.2 | CFO Certification pursuant to Section 302 of the Sarbanes-Oxley Act of 2002 | |
62
Table of Contents
| Exhibit Number |
Exhibit Description | |
| 32.1 | CEO Certification pursuant to 18 U.S.C. Section 1350, as adopted pursuant to Section 906 of the Sarbanes-Oxley Act of 2002 | |
| 32.2 | CFO Certification pursuant to 18 U.S.C. Section 1350, as adopted pursuant to Section 906 of the Sarbanes-Oxley Act of 2002 | |
| 101 | Financial Statements in XBRL Format | |
| † | Indicates exhibits that constitute management contracts or compensatory plans or arrangements |
63
Table of Contents
SIGNATURES
Pursuant to the requirements of Section 13 or 15(d) of the Securities Exchange Act of 1934, as amended, the registrant has duly caused this report to be signed on its behalf by the undersigned, thereunto duly authorized.
| VINCE HOLDING CORP. | ||
| By: | /s/ Jill Granoff | |
| Name: | Jill Granoff | |
| Title: | Chairman and Chief Executive Officer | |
Pursuant to the requirements of the Securities Exchange Act of 1934, as amended, this report has been signed by the following persons in the capacities and on the dates listed.
| Signature |
Title |
Date | ||
| /s/ Jill Granoff Jill Granoff |
Chairman and Chief Executive Officer (principal executive officer) | March 27, 2015 | ||
| /s/ Lisa Klinger Lisa Klinger |
Chief Financial Officer and Treasurer (principal financial and accounting officer) | March 27, 2015 | ||
| /s/ Jonathan H. Borell Jonathan H. Borell |
Director | March 27, 2015 | ||
| /s/ Robert A. Bowman Robert A. Bowman |
Director | March 27, 2015 | ||
| /s/ Mark E. Brody Mark E. Brody |
Director | March 27, 2015 | ||
| /s/ Jerome Griffith Jerome Griffith |
Director | March 27, 2015 | ||
| /s/ Marc J. Leder Marc J. Leder |
Director | March 27, 2015 | ||
| /s/ Steven M. Liff Steven M. Liff |
Director | March 27, 2015 | ||
| /s/ Eugenia Ulasewicz Eugenia Ulasewicz |
Director | March 27, 2015 | ||
64
Table of Contents
INDEX TO THE AUDITED CONSOLIDATED FINANCIAL STATEMENTS
| Consolidated Financial Statements |
||||
| F-2 | ||||
| F-3 | ||||
| F-4 | ||||
| F-5 | ||||
| F-6 | ||||
| F-7 | ||||
| F-9 | ||||
| Financial Statement Schedules |
||||
| F-39 | ||||
F-1
Table of Contents
Report of Independent Registered Public Accounting Firm
To the Board of Directors and Shareholders of Vince Holding Corp.:
In our opinion, the consolidated financial statements listed in the accompanying index present fairly, in all material respects, the financial position of Vince Holding Corp. and its subsidiaries at January 31, 2015 and February 1, 2014, and the results of their operations and their cash flows for each of the three years in the period ended January 31, 2015 in conformity with accounting principles generally accepted in the United States of America. In addition, in our opinion, the financial statement schedule listed in the accompanying index presents fairly, in all material respects, the information set forth therein when read in conjunction with the related consolidated financial statements. These financial statements and financial statement schedule are the responsibility of the Company’s management. Our responsibility is to express an opinion on these financial statements and financial statement schedule based on our audits. We conducted our audits of these statements in accordance with the standards of the Public Company Accounting Oversight Board (United States). Those standards require that we plan and perform the audit to obtain reasonable assurance about whether the financial statements are free of material misstatement. An audit includes examining, on a test basis, evidence supporting the amounts and disclosures in the financial statements, assessing the accounting principles used and significant estimates made by management, and evaluating the overall financial statement presentation. We believe that our audits provide a reasonable basis for our opinion.
| /s/ PricewaterhouseCoopers LLP |
| New York, New York |
| March 27, 2015 |
F-2
Table of Contents
VINCE HOLDING CORP. AND SUBSIDIARIES
CONSOLIDATED BALANCE SHEETS
(In thousands, except share amounts)
| January 31, 2015 |
February 1, 2014 |
|||||||
| Assets |
||||||||
| Current assets: |
||||||||
| Cash and cash equivalents |
$ | 112 | $ | 21,484 | ||||
| Trade receivables, net |
33,797 | 40,198 | ||||||
| Inventories, net |
37,419 | 33,956 | ||||||
| Prepaid expenses and other current assets |
9,812 | 8,093 | ||||||
|
|
|
|
|
|||||
| Total current assets |
81,140 | 103,731 | ||||||
| Property, plant and equipment: |
||||||||
| Building and improvements |
27,645 | 15,355 | ||||||
| Machinery and equipment |
5,384 | 2,439 | ||||||
| Capitalized software |
1,341 | 630 | ||||||
| Construction in process |
3,369 | 1,200 | ||||||
|
|
|
|
|
|||||
| Total property, plant and equipment |
37,739 | 19,624 | ||||||
| Less: accumulated depreciation and amortization |
(9,390 | ) | (6,009 | ) | ||||
|
|
|
|
|
|||||
| Property, plant and equipment, net |
28,349 | 13,615 | ||||||
| Intangible assets, net |
109,644 | 110,243 | ||||||
| Goodwill |
63,746 | 63,746 | ||||||
| Deferred income taxes and other assets |
99,319 | 123,007 | ||||||
|
|
|
|
|
|||||
| Total assets |
$ | 382,198 | $ | 414,342 | ||||
|
|
|
|
|
|||||
| Liabilities and Stockholders’ Equity |
||||||||
| Current liabilities: |
||||||||
| Accounts payable |
$ | 29,118 | $ | 23,847 | ||||
| Accrued salaries and employee benefits |
7,380 | 5,425 | ||||||
| Other accrued expenses |
27,992 | 9,061 | ||||||
|
|
|
|
|
|||||
| Total current liabilities |
64,490 | 38,333 | ||||||
| Long-term debt |
88,000 | 170,000 | ||||||
| Deferred rent |
11,676 | 3,443 | ||||||
| Other liabilities |
146,063 | 169,015 | ||||||
| Commitments and contingencies (Note 13) |
||||||||
| Stockholders’ equity: |
||||||||
| Common stock at $0.01 par value (100,000,000 shares authorized, 36,748,245 and 36,723,727 shares issued and outstanding at January 31, 2015 and February 1, 2014, respectively) |
367 | 367 | ||||||
| Additional paid-in capital |
1,011,244 | 1,008,549 | ||||||
| Accumulated deficit |
(939,577 | ) | (975,300 | ) | ||||
| Accumulated other comprehensive loss |
(65 | ) | (65 | ) | ||||
|
|
|
|
|
|||||
| Total stockholders’ equity |
71,969 | 33,551 | ||||||
|
|
|
|
|
|||||
| Total liabilities and stockholders’ equity |
$ | 382,198 | $ | 414,342 | ||||
|
|
|
|
|
|||||
See accompanying notes to Consolidated Financial Statements.
F-3
Table of Contents
VINCE HOLDING CORP. AND SUBSIDIARIES
CONSOLIDATED STATEMENTS OF OPERATIONS
(In thousands, except per share data and share amounts)
| Fiscal Year | ||||||||||||
| 2014 | 2013 | 2012 | ||||||||||
| Net sales |
$ | 340,396 | $ | 288,170 | $ | 240,352 | ||||||
| Cost of products sold |
173,567 | 155,154 | 132,156 | |||||||||
|
|
|
|
|
|
|
|||||||
| Gross profit |
166,829 | 133,016 | 108,196 | |||||||||
| Selling, general and administrative expenses |
96,579 | 83,663 | 67,260 | |||||||||
|
|
|
|
|
|
|
|||||||
| Income from operations |
70,250 | 49,353 | 40,936 | |||||||||
| Interest expense, net |
9,698 | 18,011 | 68,684 | |||||||||
| Other expense, net |
835 | 679 | 769 | |||||||||
|
|
|
|
|
|
|
|||||||
| Income (loss) before income taxes |
59,717 | 30,663 | (28,517 | ) | ||||||||
| Provision for income taxes |
23,994 | 7,268 | 1,178 | |||||||||
|
|
|
|
|
|
|
|||||||
| Net income (loss) from continuing operations |
35,723 | 23,395 | (29,695 | ) | ||||||||
| Net loss from discontinued operations, net of tax |
— | (50,815 | ) | (78,014 | ) | |||||||
|
|
|
|
|
|
|
|||||||
| Net income (loss) |
$ | 35,723 | $ | (27,420 | ) | $ | (107,709 | ) | ||||
|
|
|
|
|
|
|
|||||||
| Basic earnings (loss) per share: |
||||||||||||
| Basic earnings (loss) per share from continuing operations |
$ | 0.97 | $ | 0.83 | $ | (1.13 | ) | |||||
| Basic loss per share from discontinued operations |
— | (1.81 | ) | (2.98 | ) | |||||||
|
|
|
|
|
|
|
|||||||
| Basic earnings (loss) per share |
$ | 0.97 | $ | (0.98 | ) | $ | (4.11 | ) | ||||
|
|
|
|
|
|
|
|||||||
| Diluted earnings (loss) per share: |
||||||||||||
| Diluted earnings (loss) per share from continuing operations |
$ | 0.93 | $ | 0.83 | $ | (1.13 | ) | |||||
| Diluted loss per share from discontinued operations |
— | (1.81 | ) | (2.98 | ) | |||||||
|
|
|
|
|
|
|
|||||||
| Diluted earnings (loss) per share |
$ | 0.93 | $ | (0.98 | ) | $ | (4.11 | ) | ||||
|
|
|
|
|
|
|
|||||||
| Weighted average shares outstanding: |
||||||||||||
| Basic |
36,730,490 | 28,119,794 | 26,211,130 | |||||||||
| Diluted |
38,244,906 | 28,272,925 | 26,211,130 | |||||||||
See accompanying notes to Consolidated Financial Statements.
F-4
Table of Contents
VINCE HOLDING CORP. AND SUBSIDIARIES
CONSOLIDATED STATEMENTS OF COMPREHENSIVE INCOME (LOSS)
(In thousands)
| Fiscal Year | ||||||||||||
| 2014 | 2013 | 2012 | ||||||||||
| Net income (loss) |
$ | 35,723 | $ | (27,420 | ) | $ | (107,709 | ) | ||||
| Foreign currency translation adjustment |
— | 1 | (3 | ) | ||||||||
|
|
|
|
|
|
|
|||||||
| Comprehensive income (loss) |
$ | 35,723 | $ | (27,419 | ) | $ | (107,712 | ) | ||||
|
|
|
|
|
|
|
|||||||
See accompanying notes to Consolidated Financial Statements
F-5
Table of Contents
VINCE HOLDING CORP. AND SUBSIDIARIES
CONSOLIDATED STATEMENTS OF STOCKHOLDERS’ EQUITY (DEFICIT)
(In thousands, except share amounts)
| Common Stock | ||||||||||||||||||||||||
| Number of Shares Outstanding |
Par Value |
Additional Paid-In Capital |
Accumulated Deficit |
Accumulated Other Comprehensive Loss |
Total Stockholders’ Equity (Deficit) |
|||||||||||||||||||
| Balance as of January 28, 2012 |
26,211,130 | $ | 262 | $ | 96,951 | $ | (840,171 | ) | $ | (63 | ) | $ | (743,021 | ) | ||||||||||
| Comprehensive loss: |
||||||||||||||||||||||||
| Net loss |
— | — | — | (107,709 | ) | — | (107,709 | ) | ||||||||||||||||
| Foreign currency translation adjustment |
— | — | — | — | (3 | ) | (3 | ) | ||||||||||||||||
| Share-based compensation expense |
— | — | 367 | — | — | 367 | ||||||||||||||||||
| Capital contribution from stockholders |
— | — | 289,101 | — | — | 289,101 | ||||||||||||||||||
|
|
|
|
|
|
|
|
|
|
|
|
|
|||||||||||||
| Balance as of February 2, 2013 |
26,211,130 | 262 | 386,419 | (947,880 | ) | (66 | ) | (561,265 | ) | |||||||||||||||
| Comprehensive loss: |
||||||||||||||||||||||||
| Net loss |
— | — | — | (27,420 | ) | — | (27,420 | ) | ||||||||||||||||
| Foreign currency translation adjustment |
— | — | — | — | 1 | 1 | ||||||||||||||||||
| Common stock issuance, net of certain costs |
10,000,000 | 100 | 185,900 | — | — | 186,000 | ||||||||||||||||||
| Share-based compensation expense |
— | — | 898 | — | — | 898 | ||||||||||||||||||
| Exercise of stock options |
512,597 | 5 | 37 | — | — | 42 | ||||||||||||||||||
| Capital contribution from stockholders |
— | — | 407,527 | — | — | 407,527 | ||||||||||||||||||
| Recognition of certain deferred tax assets, net |
— | — | 127,833 | — | — | 127,833 | ||||||||||||||||||
| Recognition of tax receivable agreement obligation |
— | — | (173,146 | ) | — | — | (173,146 | ) | ||||||||||||||||
| Separation of non-Vince businesses and settlement of Kellwood Note Receivable |
— | — | 73,081 | — | — | 73,081 | ||||||||||||||||||
|
|
|
|
|
|
|
|
|
|
|
|
|
|||||||||||||
| Balance as of February 1, 2014 |
36,723,727 | 367 | 1,008,549 | (975,300 | ) | (65 | ) | 33,551 | ||||||||||||||||
| Comprehensive income: |
||||||||||||||||||||||||
| Net income |
— | — | — | 35,723 | — | 35,723 | ||||||||||||||||||
| Share-based compensation expense |
— | — | 1,896 | — | — | 1,896 | ||||||||||||||||||
| Exercise of stock options |
22,018 | — | 175 | — | — | 175 | ||||||||||||||||||
| Restricted stock unit vesting |
2,500 | — | — | — | — | — | ||||||||||||||||||
| Tax receivable agreement obligation adjustment |
— | — | 624 | — | — | 624 | ||||||||||||||||||
|
|
|
|
|
|
|
|
|
|
|
|
|
|||||||||||||
| Balance as of January 31, 2015 |
36,748,245 | $ | 367 | $ | 1,011,244 | $ | (939,577 | ) | $ | (65 | ) | $ | 71,969 | |||||||||||
|
|
|
|
|
|
|
|
|
|
|
|
|
|||||||||||||
See accompanying notes to Consolidated Financial Statements.
F-6
Table of Contents
VINCE HOLDING CORP. AND SUBSIDIARIES
CONSOLIDATED STATEMENTS OF CASH FLOWS
(In thousands)
| Fiscal Year | ||||||||||||
| 2014 | 2013 | 2012 | ||||||||||
| Operating activities |
||||||||||||
| Net income (loss) |
$ | 35,723 | $ | (27,420 | ) | $ | (107,709 | ) | ||||
| Less: Net loss from discontinued operations |
— | (50,815 | ) | (78,014 | ) | |||||||
| Add (deduct) items not affecting operating cash flows: |
||||||||||||
| Depreciation |
4,668 | 2,186 | 1,411 | |||||||||
| Amortization of intangible assets |
599 | 599 | 598 | |||||||||
| Amortization of deferred financing costs |
1,532 | 178 | — | |||||||||
| Amortization of deferred rent |
3,045 | 465 | 426 | |||||||||
| Deferred income taxes |
23,248 | 7,225 | 1,147 | |||||||||
| Share-based compensation expense |
1,896 | 347 | — | |||||||||
| Capitalized PIK Interest |
— | 15,883 | 68,684 | |||||||||
| Loss on disposal of property, plant and equipment |
— | 262 | — | |||||||||
| Changes in assets and liabilities: |
||||||||||||
| Receivable, net |
6,401 | (6,265 | ) | (7,459 | ) | |||||||
| Inventories, net |
(3,463 | ) | (15,069 | ) | (8,360 | ) | ||||||
| Prepaid expenses and other current assets |
2,809 | 1,681 | (2,455 | ) | ||||||||
| Accounts payable and accrued expenses |
3,066 | 3,235 | 17,208 | |||||||||
| Other assets and liabilities |
742 | (156 | ) | (131 | ) | |||||||
|
|
|
|
|
|
|
|||||||
| Net cash provided by operating activities—continuing operations |
80,266 | 33,966 | 41,374 | |||||||||
| Net cash used in operating activities—discontinued operations |
— | (54,667 | ) | (67,408 | ) | |||||||
|
|
|
|
|
|
|
|||||||
| Net cash provided by/(used in) operating activities |
80,266 | (20,701 | ) | (26,034 | ) | |||||||
|
|
|
|
|
|
|
|||||||
| Investing activities |
||||||||||||
| Payments for capital expenditures |
(19,699 | ) | (10,073 | ) | (1,821 | ) | ||||||
| Payments for contingent purchase price |
— | — | (806 | ) | ||||||||
|
|
|
|
|
|
|
|||||||
| Net cash used in investing activities—continuing operations |
(19,699 | ) | (10,073 | ) | (2,627 | ) | ||||||
| Net cash (used in)/provided by investing activities—discontinued operations |
— | (5,936 | ) | 20,088 | ||||||||
|
|
|
|
|
|
|
|||||||
| Net cash (used in)/provided by investing activities |
(19,699 | ) | (16,009 | ) | 17,461 | |||||||
|
|
|
|
|
|
|
|||||||
| Financing activities |
||||||||||||
| Proceeds from borrowings under the Revolving Credit Facility |
50,500 | — | — | |||||||||
| Payments for Revolving Credit Facility |
(27,500 | ) | — | — | ||||||||
| Proceeds from borrowings under the Term Loan Facility |
— | 175,000 | — | |||||||||
| Payments for Term Loan Facility |
(105,000 | ) | (5,000 | ) | — | |||||||
| Payment for Kellwood Note Receivable |
— | (341,500 | ) | — | ||||||||
| Fees paid for Term Loan Facility and Revolving Credit Facility |
(114 | ) | (5,146 | ) | — | |||||||
| Proceeds from common stock issuance, net of certain transaction costs |
— | 186,000 | — | |||||||||
| Stock option exercise |
175 | 42 | — | |||||||||
|
|
|
|
|
|
|
|||||||
| Net cash (used in)/provided by financing activities—continuing operations |
(81,939 | ) | 9,396 | — | ||||||||
| Net cash provided by financing activities—discontinued operations |
— | 46,917 | 8,615 | |||||||||
|
|
|
|
|
|
|
|||||||
| Net cash (used in)/provided by financing activities |
(81,939 | ) | 56,313 | 8,615 | ||||||||
|
|
|
|
|
|
|
|||||||
| (Decrease) increase in cash and cash equivalents |
(21,372 | ) | 19,603 | 42 | ||||||||
| Cash and cash equivalents, beginning of period |
21,484 | 1,881 | 1,839 | |||||||||
|
|
|
|
|
|
|
|||||||
| Cash and cash equivalents, end of period |
112 | 21,484 | 1,881 | |||||||||
| Less: Cash and cash equivalents of discontinued operations, end of period |
— | — | (1,564 | ) | ||||||||
|
|
|
|
|
|
|
|||||||
| Cash and cash equivalents of continuing operations, end of period |
$ | 112 | $ | 21,484 | $ | 317 | ||||||
|
|
|
|
|
|
|
|||||||
See accompanying notes to Consolidated Financial Statements
F-7
Table of Contents
VINCE HOLDING CORP. AND SUBSIDIARIES
CONSOLIDATED STATEMENTS OF CASH FLOWS
(In thousands)
| Fiscal Year | ||||||||||||
| 2014 | 2013 | 2012 | ||||||||||
| Supplemental Disclosures of Cash Flow Information, continuing operations |
||||||||||||
| Cash payments on TRA obligation |
$ | 3,199 | $ | — | $ | — | ||||||
| Cash payments for interest |
8,737 | 1,018 | — | |||||||||
| Cash payments for income taxes, net of refunds |
88 | 31 | 18 | |||||||||
| Supplemental Disclosures of Cash Flow Information, discontinued operations |
||||||||||||
| Cash payments for interest |
— | 20,644 | 30,454 | |||||||||
| Cash payments for income taxes, net of refunds |
— | 566 | 882 | |||||||||
| Supplemental Disclosures of Non-Cash Investing and Financing Activities |
||||||||||||
| Capital expenditures in accounts payable |
452 | 222 | 160 | |||||||||
| Forgiveness of principal and capitalized and accrued interest on related-party debt |
— | (407,527 | ) | (289,101 | ) | |||||||
| Capital contribution from stockholder |
— | 407,527 | 289,101 | |||||||||
| Supplemental Disclosures of Non-Cash Investing and Financing Activities, discontinued operations |
||||||||||||
| Accrued adjustment to sale proceeds from disposed business |
— | — | 221 | |||||||||
See accompanying notes to Consolidated Financial Statements
F-8
Table of Contents
VINCE HOLDING CORP. AND SUBSIDIARIES
NOTES TO CONSOLIDATED FINANCIAL STATEMENTS
(In thousands, except per share data and share amounts)
Note 1. Description of Business and Summary of Significant Accounting Policies
On November 27, 2013, Vince Holding Corp. (“VHC”), previously known as Apparel Holding Corp., closed an initial public offering of its common stock and completed a series of restructuring transactions through which (i) Kellwood Holding, LLC acquired the non-Vince businesses, which include Kellwood Company, LLC, from the Company and (ii) the Company continues to own and operate the Vince business, which includes Vince, LLC.
The historical financial information presented herein as of January 31, 2015 includes only the Vince businesses and all historical financial information prior to November 27, 2013 includes the Vince business as continuing operations and the non-Vince businesses as a component of discontinued operations.
(A) Description of Business: Vince is a leading contemporary fashion brand best known for modern effortless style and everyday luxury essentials. Established in 2002, the brand now offers a wide range of women’s, men’s and children’s apparel, women’s and men’s footwear, and handbags. We reach our customers through a variety of channels, specifically through premier wholesale department stores and specialty stores in the United States (“U.S.”) and select international markets, as well as through our branded retail locations and our website. We design our products in the U.S. and source the vast majority of our products from contract manufacturers outside the U.S., primarily in Asia and South America. Products are manufactured to meet our product specifications and labor standards.
(B) Basis of Presentation: The accompanying consolidated financial statements have been prepared in conformity with accounting principles generally accepted in the United States of America (“GAAP”) and the rules and regulations of the U.S. Securities and Exchange Commission (“SEC”).
The consolidated financial statements include our accounts and the accounts of our wholly-owned subsidiaries. All intercompany accounts and transactions have been eliminated in consolidation. The amounts and disclosures included in the notes to the consolidated financial statements, unless otherwise indicated, are presented on a continuing operations basis. In the opinion of management, the financial statements contain all adjustments (consisting solely of normal recurring adjustments) and disclosures necessary to make the information presented therein not misleading. As used in this report, unless the context requires otherwise, “our,” “us” and “we” refer to VHC and its consolidated subsidiaries.
Certain reclassifications have been made to the prior periods’ financial information in order to conform to the current period’s presentation. The reclassification had no impact on previously reported net income or stockholders’ equity.
(C) Fiscal Year: VHC operates on a fiscal calendar widely used by the retail industry that results in a given fiscal year consisting of a 52 or 53-week period ending on the Saturday closest to January 31 of the following year.
| • | References to “fiscal year 2014” or “fiscal 2014” refer to the fiscal year ended January 31, 2015; |
| • | References to “fiscal year 2013” or “fiscal 2013” refer to the fiscal year ended February 1, 2014; |
| • | References to “fiscal year 2012” or “fiscal 2012” refer to the fiscal year ended February 2, 2013. |
Fiscal years 2014 and 2013 consisted of a 52-week period and fiscal year 2012 consisted of a 53-week period.
F-9
Table of Contents
(D) Use of Estimates: The preparation of consolidated financial statements in conformity with GAAP requires that management make estimates and assumptions that affect the reported amounts of assets and liabilities and disclosure of contingent assets and liabilities at the date of the financial statements which affect revenues and expenses during the period reported. Estimates are adjusted when necessary to reflect actual experience. Significant estimates and assumptions may affect many items in the financial statements. Actual results could differ from estimates and assumptions in amounts that may be material to the consolidated financial statements.
Significant estimates inherent in the preparation of the consolidated financial statements include accounts receivable allowances, customer returns, the realizability of inventory, reserves for contingencies, useful lives and impairments of long-lived tangible and intangible assets, accounting for income taxes and related uncertain tax positions and valuation of share-based compensation, among others.
(E) Cash and cash equivalents: All demand deposits and highly liquid short-term deposits with original maturities of three months or less maintained under cash management activities are considered cash equivalents. The effect of foreign currency exchange rate fluctuations on cash and cash equivalents was not significant for fiscal 2014, fiscal 2013, or fiscal 2012.
(F) Accounts Receivable and Concentration of Credit Risk: We maintain an allowance for accounts receivable estimated to be uncollectible. The activity in this allowance for continuing operations is summarized as follows (in thousands).
| 2014 | 2013 | 2012 | ||||||||||
| Balance, beginning of year |
$ | 353 | $ | 279 | $ | 450 | ||||||
| Provisions for bad debt expense |
168 | 249 | 314 | |||||||||
| Bad debts written off |
(142 | ) | (175 | ) | (485 | ) | ||||||
|
|
|
|
|
|
|
|||||||
| Balance, end of year |
$ | 379 | $ | 353 | $ | 279 | ||||||
|
|
|
|
|
|
|
|||||||
The provision for bad debts is included in selling, general and administrative expense. Substantially all of our trade receivables are derived from sales to retailers and are recorded at the invoiced amount and do not bear interest. We perform ongoing credit evaluations of our wholesale partners’ financial condition and require collateral as deemed necessary. Account balances are charged off against the allowance when we believe the receivable will not be collected.
Accounts receivable are recorded net of allowances for expected future chargebacks and margin support from wholesale partners. It is the nature of the apparel and fashion industry that suppliers like us face significant pressure from customers in the retail industry to provide allowances to compensate for wholesale partner margin shortfalls. This pressure often takes the form of customers requiring us to provide price concessions on prior shipments as a prerequisite for obtaining future orders. Pressure for these concessions is largely determined by overall retail sales performance and, more specifically, the performance of our products at retail. To the extent our wholesale partners have more of our goods on hand at the end of the season, there will be greater pressure for us to grant markdown concessions on prior shipments. Our accounts receivable balances are reported net of expected allowances for these matters based on the historical level of concessions required and our estimates of the level of markdowns and allowances that will be required in the coming season in order to collect the receivables. We evaluate the allowance balances on a continual basis and adjust them as necessary to reflect changes in anticipated allowance activity. We also provide an allowance for sales returns based on historical return rates.
In fiscal 2014, sales to three wholesale partners each accounted for more than ten percent of our net sales from continuing operations. These sales represented 23.2%, 13.2% and 12.3% of fiscal 2014 net sales. In fiscal 2013, sales to three wholesale partners each accounted for more than ten percent of our net sales from continuing
F-10
Table of Contents
operations. These sales represented 19.8%, 12.8% and 12.8% of fiscal 2013 net sales. In fiscal 2012, sales to three wholesale partners each accounted for more than ten percent of our net sales from continuing operations. These sales represented 21.4%, 15.5% and 14.3% of fiscal 2012 net sales.
In fiscal 2014 accounts receivable from four wholesale partners each accounted for more than ten percent of our gross accounts receivable in continuing operations. These receivables represented 24.5%, 13.8%, 12.7% and 11.4% of fiscal 2014 gross accounts receivable. In fiscal 2013, accounts receivable from three wholesale partners each accounted for more than ten percent of our gross accounts receivable in continuing operations. These receivables represented 25.7%, 24.8% and 13.4% of fiscal 2013 gross accounts receivable.
(G) Inventories: Inventories are stated at the lower of cost or market. Cost is determined on the first-in, first-out basis. The cost of inventory includes manufacturing or purchase cost as well as sourcing, transportation, duty and other processing costs associated with acquiring, importing and preparing inventory for sale. Inventory costs are included in cost of products sold at the time of their sale. Product development costs are expensed in selling, general and administrative expense when incurred. Inventory values are reduced to net realizable value when there are factors indicating that certain inventories will not be sold on terms sufficient to recover their cost.
Inventories of continuing operations consist of the following (in thousands).
| January 31, 2015 |
February 1, 2014 |
|||||||
| Finished goods |
$ | 37,395 | $ | 32,946 | ||||
| Work in process |
— | 98 | ||||||
| Raw materials |
24 | 912 | ||||||
|
|
|
|
|
|||||
| Total inventories, net |
37,419 | 33,956 | ||||||
|
|
|
|
|
|||||
| Net of reserves of: |
$ | 6,471 | $ | 3,929 | ||||
|
|
|
|
|
|||||
(H) Property, Plant and Equipment: Property, plant and equipment are stated at cost. Depreciation is computed on the straight-line method over estimated useful lives of 3 to 10 years for furniture, fixtures, and computer equipment. Leasehold improvements are amortized on the straight-line basis over the shorter of their estimated useful lives or the remaining lease term, excluding renewal terms. Capitalized software is amortized on the straight-line basis over the estimated economic useful life of the software, generally three to five years. Depreciation expense related to continuing operations was $4,668, $2,186 and $1,411 for fiscal 2014, 2013 and 2012, respectively.
(I) Impairment of Long-lived Assets: We review long-lived assets with a finite life for existence of facts and circumstances which indicate that the useful life is shorter than previously estimated or the carrying amount may not be recoverable from future operations based on undiscounted expected future cash flows. Impairment losses are then recognized in operating results to the extent discounted expected future cash flows are less than the carrying value of the asset. There were no impairment charges for continuing operations related to long-lived assets recorded in fiscal 2014, fiscal 2013 or fiscal 2012.
(J) Goodwill and Other Intangible Assets: Goodwill and other indefinite-lived intangible assets are tested for impairment at least annually and in an interim period if a triggering event occurs. We completed our annual impairment testing on our goodwill and indefinite-lived intangible assets during the fourth quarters of fiscal 2014, fiscal 2013 and fiscal 2012. Goodwill is not allocated to our operating segments in the measure of segment assets regularly reported to and used by management, however goodwill is allocated to operating segments (goodwill reporting units) for the sole purpose of the annual impairment test for goodwill.
Goodwill represents the excess of the cost of acquired businesses over the fair market value of the identifiable net assets. Indefinite-lived intangible assets are primarily company-owned trademarks. As the
F-11
Table of Contents
acquisition by Kellwood Company of the net assets of Vince occurred prior to the current requirements of ASC Topic 805 Business Combinations, the additional purchase consideration paid to the former owners of Vince subsequent to the acquisition date was recorded as an addition to the purchase price, and therefore goodwill, once determined.
In September 2011, the Financial Accounting Standards Board (“FASB”) issued an amendment to the Intangibles-Goodwill and Other topic of Accounting Standards Codification (“ASC”). Under this amendment, an entity may elect to perform a qualitative impairment assessment for goodwill. If adverse qualitative trends are identified during the qualitative assessment that indicate that it is more likely than not that the fair value of a reporting unit is less than its carrying amount, a quantitative impairment test is required. “Step one” of this quantitative impairment test requires that the fair value of the reporting unit be estimated and compared to its carrying amount. If the carrying amount exceeds the estimated fair value of the asset, “step two” of the impairment test is performed to calculate the impairment loss. An impairment loss is recognized to the extent the carrying amount of the reporting unit exceeds the implied fair value.
An entity may pass on performing the qualitative assessment for a reporting unit and directly perform “step one” of the assessment. This determination can be made on an asset by asset basis, and an entity may resume performing a qualitative assessment in subsequent periods. This amendment is effective for annual and interim goodwill impairment tests performed for fiscal years beginning after December 15, 2011. We adopted this amendment during fiscal year 2012.
In fiscal 2014, 2013 and fiscal 2012, we performed a qualitative assessment on the goodwill and determined that it was not more likely than not that the carrying value of the reporting unit was greater than the fair value. As such, we were not required to perform “step two” of the impairment test.
In July 2012, the FASB issued Accounting Standards Update No. 2012-02, Intangibles—Goodwill and Other (Topic 350): Testing Indefinite Lived Assets for Impairment (“ASU 2012-02”). Under this amendment, an entity may elect to perform a qualitative impairment assessment for indefinite-lived intangible assets similar to the goodwill impairment testing guidance discussed above.
An entity may pass on performing the qualitative assessment for an indefinite-lived intangible asset and directly perform “step one” of the assessment. This determination can be made on an asset by asset basis, and an entity may resume performing a qualitative assessment in subsequent periods. The amendment is effective for annual and interim impairment tests for indefinite-lived intangible assets performed for fiscal years beginning after September 15, 2012. We early adopted this amendment during fiscal 2012.
In fiscal 2014, 2013 and fiscal 2012, we elected to perform a qualitative assessment on indefinite-lived intangible assets and determined that it was not more likely than not that the carrying value of the assets exceeded the fair value, as such we were not required to perform “step two” of the impairment test.
Determining the fair value of goodwill and other intangible assets is judgmental in nature and requires the use of significant estimates and assumptions, including revenue growth rates and operating margins, discount rates and future market conditions, among others. It is possible that estimates of future operating results could change adversely and impact the evaluation of the recoverability of the carrying value of goodwill and intangible assets and that the effect of such changes could be material.
Definite-lived intangible assets are comprised of customer relationships and are being amortized on a straight-line basis over their useful lives of 20 years.
See Note 4 for more information on the details surrounding goodwill and intangible assets.
F-12
Table of Contents
(K) Deferred Financing Costs: Deferred financing costs, such as underwriting, financial advisory, professional fees, and other similar fees are capitalized and recognized in interest expense over the contractual life of the related debt instrument using the straight-line method, as this method results in recognition of interest expense that is materially consistent with that of the effective interest method.
(L) Deferred Rent and Deferred Lease Incentives: We lease various office spaces, showrooms and retail stores. Many of these operating leases contain predetermined fixed escalations of the minimum rentals during the original term of the lease. For these leases, we recognize the related rental expense on a straight-line basis over the life of the lease and record the difference between the amount charged to operations and amounts paid as deferred rent. Certain of our retail store leases contain provisions for contingent rent, typically a percentage of retail sales once a predetermined threshold has been met. These amounts are expensed as incurred. Additionally, we received lease incentives in certain leases. These allowances have been deferred and are amortized on a straight-line basis over the life of the lease as a reduction of rent expense.
(M) Revenue Recognition: Sales are recognized when goods are shipped in accordance with customer orders for our wholesale business and e-commerce businesses, and at the time of sale to the consumer for our retail business. The estimated amounts of sales discounts, returns and allowances are accounted for as reductions of sales when the associated sale occurs. These estimated amounts are adjusted periodically based on changes in facts and circumstances when the changes become known to us. Accrued discounts, returns and allowances are included as an offset to accounts receivable in the Consolidated Balance Sheets for our wholesale business. The activity in the accrued discounts, returns and allowances account for continuing operations is summarized as follows (in thousands).
| 2014 | 2013 | 2012 | ||||||||||
| Balance, beginning of year |
$ | 9,265 | $ | 7,179 | $ | 4,347 | ||||||
| Provision |
54,467 | 39,171 | 29,400 | |||||||||
| Utilization |
(47,634 | ) | (37,085 | ) | (26,568 | ) | ||||||
|
|
|
|
|
|
|
|||||||
| Balance, end of year |
$ | 16,098 | $ | 9,265 | $ | 7,179 | ||||||
|
|
|
|
|
|
|
|||||||
For our wholesale business, amounts billed to customers for shipping and handling costs are not significant. Our stated terms are FOB shipping point. There is no stated obligation to customers after shipment, other than specifically set forth allowances or discounts that are accrued at the time of sale. The rights of inspection or acceptance contained in certain sales agreements are limited to whether the goods received by our wholesale partners are in conformance with the order specifications.
(N) Cost of Products Sold: Our cost of products sold and gross margins may not necessarily be comparable to that of other entities as a result of different practices in categorizing costs. The primary components of our cost of products sold are as follows:
| • | the cost of purchased merchandise, including raw materials; |
| • | the cost of inbound transportation, including freight; |
| • | the cost of our production and sourcing departments; |
| • | other processing costs associated with acquiring and preparing the inventory for sale as charged by Kellwood Company, LLC as part of the Shared Services Agreement; and |
| • | shrink and valuation reserves. |
(O) Marketing and Advertising: We provide cooperative advertising allowances to certain of our customers. These allowances are accounted for as reductions in sales as discussed in “Revenue Recognition” above. Production expense related to company-directed advertising is deferred until the first time at which the advertisement runs. Communication expense related to company-directed advertising is expensed as incurred.
F-13
Table of Contents
Marketing and advertising expense recorded in selling, general and administrative expenses for continuing operations was $7,427, $4,858, and $2,591 in fiscal 2014, 2013 and 2012, respectively. At January 31, 2015 and February 1, 2014, deferred production expenses associated with company-directed advertising were $643 and $305, respectively.
(P) Income Taxes: We account for income taxes using the asset and liability method. Under this method, deferred tax assets and liabilities are recognized for the future tax consequences of temporary differences between the carrying amounts and tax bases of assets and liabilities at enacted rates. We determine the appropriateness of valuation allowances in accordance with the “more likely than not” recognition criteria. We recognize tax positions in the Consolidated Balance Sheets as the largest amount of tax benefit that is greater than 50% likely of being realized upon ultimate settlement with tax authorities assuming full knowledge of the position and all relevant facts. Accrued interest and penalties related to unrecognized tax benefits are included in income taxes in the Consolidated Statements of Operations.
(Q) Earnings Per Share: Basic net income (loss) per share is calculated by dividing net income (loss) by the weighted average number of shares outstanding during the period. Diluted net income (loss) per share is calculated similarly, but includes potential dilution from the exercise of stock options for which future service is required as a condition to deliver the underlying stock.
(R) Recent Accounting Pronouncements
In January 2015, the Financial Accounting Standards Board (“FASB”) issued ASU 2015-01, Income Statement-Extraordinary and Unusual Items—Simplifying Income Statement Presentation by Eliminating the Concept of Extraordinary Items. ASU 2015-01 eliminates from GAAP the concept of extraordinary items. ASU 2015-01 is effective for fiscal years, and interim periods within those fiscal years, beginning after December 15, 2015, with early adoption permitted. The standard primarily involves presentation and disclosure and, therefore, is not expected to have a material impact on our financial position and results of operations.
F-14
Table of Contents
Note 2. The IPO and Restructuring Transactions
Initial Public Offering
On November 27, 2013, VHC completed an initial public offering (“IPO”) of 10,000,000 shares of VHC common stock at a public offering price of $20.00 per share. The selling stockholders in the offering sold an additional 1,500,000 shares of VHC common stock to the underwriters in the IPO. Shares of the Company’s common stock are listed on the New York Stock Exchange under the ticker symbol “VNCE”. VHC received net proceeds of $177,000, after deducting underwriting discounts, commissions and offering expenses from its sale of shares in the IPO. The Company retained approximately $5,000 of such proceeds for general corporate purposes and used the remaining net proceeds, together with net borrowings under the Term Loan Facility (described under Note 7 “Long-Term Debt) to repay a promissory note (“the Kellwood Note Receivable”) issued to Kellwood Company, LLC in connection with the Restructuring Transactions (described below) which occurred immediately prior to the consummation of the IPO. Proceeds from the repayment of the Kellwood Note Receivable were used to repay or discharge certain existing debt of Kellwood Company.
In connection with the IPO and the Restructuring Transactions described below, we separated the Vince and non-Vince businesses on November 27, 2013. Any and all debt obligations outstanding at the time of the transactions either remain with Kellwood Intermediate Holding, LLC and its subsidiaries (i.e. the non-Vince businesses) and/or were discharged, repurchased or refinanced. See information below for a summary of the Company’s Revolving Credit Facility and Term Loan Facility.
Stock split
In connection with the IPO, VHC’s board of directors approved the conversion of all non-voting common stock into voting common stock on a one for one basis, and a 28.5177 for one split of its common stock. Accordingly, all references to share and per share information in all periods presented have been adjusted to reflect the stock split. The par value per share of common stock was changed to $0.01 per share.
Restructuring Transactions
The following transactions were consummated as part of the Restructuring Transactions:
| • | Affiliates of Sun Capital contributed certain indebtedness under the Sun Term Loan Agreements as a capital contribution to Vince Holding Corp. (the “Additional Sun Capital Contribution”); |
| • | Vince Holding Corp. contributed such indebtedness to Kellwood Company as a capital contribution, at which time such indebtedness was cancelled; |
| • | Vince Intermediate Holding, LLC was formed and became a direct subsidiary of Vince Holding Corp.; |
| • | Kellwood Company, LLC (which was converted from Kellwood Company in connection with the Restructuring Transactions) was contributed to Vince Intermediate Holding, LLC; |
| • | Vince Holding Corp. and Vince Intermediate Holding, LLC entered into the Transfer Agreement with Kellwood Company, LLC; |
| • | Kellwood Company, LLC distributed 100% of Vince, LLC’s membership interests to Vince Intermediate Holding, LLC, who issued the Kellwood Note Receivable to Kellwood Company, LLC. Proceeds from the repayment of the Kellwood Note Receivable were used to, among other things, repay, discharge or repurchase indebtedness of Kellwood Company, LLC; |
| • | Kellwood Holding, LLC was formed by Vince Intermediate Holding, LLC and Vince Intermediate Holding, LLC, through a series of steps, contributed 100% of the membership interests of Kellwood Company, LLC to Kellwood Intermediate Holding, LLC (which was formed as a wholly-owned subsidiary of Kellwood Holding, LLC); |
F-15
Table of Contents
| • | 100% of the membership interests of Kellwood Holding, LLC were distributed to the Pre-IPO Stockholders; |
| • | Revolving Credit Facility—Vince, LLC entered into a new senior secured revolving credit facility. Bank of America, N.A. (“BofA”) serves as administrative agent under this new facility. This revolving credit facility provides for a revolving line of credit of up to $50,000; |
| • | Term Loan Facility—Vince, LLC and Vince Intermediate Holding, LLC entered into a new $175,000 senior secured term loan credit facility with the lenders party thereto, BofA, as administrative agent, J.P. Morgan Chase Bank and Merrill Lynch, Pierce, Fenner & Smith Incorporated, as joint lead arrangers; |
| • | Shared Services Agreement—Vince, LLC entered into the Shared Services Agreement with Kellwood Company, LLC pursuant to which Kellwood Company, LLC provides support services to Vince, LLC in various operational areas including, among other things, distribution, logistics, information technology, accounts payable, credit and collections, and payroll and benefits; |
| • | Tax Receivable Agreement—The Company entered into the Tax Receivable Agreement with its stockholders immediately prior to the consummation of the Restructuring Transactions (the “Pre-IPO Stockholders”). The Tax Receivable Agreement provides for payments to the Pre-IPO Stockholders in an amount equal to 85% of the aggregate reduction in taxes payable realized by the Company and its subsidiaries from the utilization of certain tax benefits (including net operating losses and tax credits generated prior to the IPO and certain section 197 intangible deductions); and |
| • | The conversion of all of our issued and outstanding non-voting common stock into common stock on a one-for-one basis and the subsequent stock split of our common stock on a 28.5177 for one basis, at which time Apparel Holding Corp. became Vince Holding Corp. |
As a result of the IPO and Restructuring Transactions, the non-Vince businesses were separated from the Vince business, and the Pre-IPO Stockholders (through their ownership of Kellwood Holding, LLC) retained the full ownership and control of the non-Vince businesses. The Vince business is now the sole operating business of Vince Holding Corp., with the Pre-IPO stockholders retaining approximately a 68% ownership (calculated immediately after consummation of the IPO).
Immediately after the consummation of the IPO and as described below, Vince Holding Corp. contributed the net proceeds from the IPO to Vince Intermediate Holding, LLC. Vince Intermediate Holding, LLC used such proceeds, less approximately $5,000 retained for general corporate purposes, and approximately $169,500 of net borrowings under its Term Loan Facility to immediately repay the Kellwood Note Receivable. There was no outstanding balance on the Kellwood Note Receivable after giving effect to such repayment. Proceeds from the repayment of the Kellwood Note Receivable were used to (i) repay, discharge or repurchase indebtedness of Kellwood Company, LLC in connection with the closing of the IPO (including approximately $9,100 of accrued and unpaid interest on such indebtedness), and (ii) pay (A) the restructuring fee payable to Sun Capital Management and (B) the debt recovery bonus payable to our Chief Executive Officer, all after giving effect to the Additional Sun Capital Contribution. The Kellwood Note Receivable did not include amounts outstanding under the Wells Fargo Facility. Kellwood Company, LLC refinanced the Wells Fargo Facility in connection with the consummation of the IPO. Neither Vince Holding Corp. nor Vince, LLC guarantee or are a borrower party to the refinanced credit facility.
Kellwood Company, LLC used the proceeds from the repayment of the Kellwood Note Receivable to, after giving effect to the Additional Sun Capital Contribution, (i) repay, at closing, all indebtedness outstanding under (A) the Cerberus Term Loan and (B) the Sun Term Loan Agreements, (ii) redeem at par all of the 12.875% Notes, pursuant to an unconditional redemption notice issued at the closing of the IPO, plus, with respect to clauses (i) and (ii), fees, expenses and accrued and unpaid interest thereon, (iii) pay a restructuring fee equal to $3,300 to Sun Capital Management pursuant to the Management Services Agreement, and (iv) pay a debt recovery bonus to our Chief Executive Officer.
F-16
Table of Contents
In addition, Kellwood Company conducted a tender offer for all of its outstanding 7.625% Notes, at par plus accrued and unpaid interest thereon, using proceeds from the repayment of the Kellwood Note Receivable. On November 27, 2013, in connection with the closing of the IPO and as an early settlement of the tender offer, Kellwood Company, LLC accepted for purchase (and cancelled) approximately $33,474 in aggregate principal amount of the 7.625% Notes. On December 12, 2013, as part of the final settlement of the tender offer, Kellwood Company, LLC accepted for purchase (and cancelled) an additional $4,670 in aggregate principal amount of the 7.625% Notes. After giving effect to these settlements, approximately $48,808 of the 7.625% Notes remain issued and outstanding; provided, that neither VHC, nor Vince Intermediate nor Vince, LLC are a guarantor or obligor of such notes.
In addition, Kellwood Company, LLC refinanced the Wells Fargo Facility (as defined below), to among other things, remove Vince, LLC as an obligor thereunder.
After completion of these various transactions (including the Additional Sun Capital Contribution) and payments and application of the net proceeds from the repayment of the Kellwood Note Receivable, Vince, LLC’s obligations under the Wells Fargo Facility, the Cerberus Term Loan, the Sun Term Loan Agreements and the 12.875% Notes were terminated or discharged. Neither VHC, nor Vince Intermediate Holding, LLC nor Vince, LLC is a guarantor or obligor of the 7.625% Notes or the refinanced Wells Fargo Facility. Thereafter, VHC is not responsible for the obligations described above and the only outstanding obligations of Vince Holding Corp. and its subsidiaries immediately after the consummation of the IPO is $175,000 outstanding under our new Term Loan Facility.
Note 3. Discontinued Operations
On November 27, 2013, in connection with the IPO and Restructuring Transactions, we separated the Vince and non-Vince businesses whereby the non-Vince business is now owned by Kellwood Holding, LLC, of which 100% of the membership interests are owned by the Pre-IPO Stockholders. In connection with the Restructuring Transactions, the Company issued the Kellwood Note Receivable to Kellwood Company, LLC, in the amount of $341,500, which was immediately repaid with proceeds from the IPO and borrowings under the new term loan facility. There was no remaining balance on the Kellwood Note Receivable after such repayment. Proceeds from the repayment of the Kellwood Note Receivable were used by Kellwood to (i) repay, discharge or repurchase indebtedness of Kellwood Company, LLC (including approximately $9,100 of accrued and unpaid interest on such indebtedness), and (ii) pay (A) the restructuring fee payable to Sun Capital Management and (B) the debt recovery bonus payable to our Chief Executive Officer.
As the Company and Kellwood Holding, LLC are under the common control of affiliates of Sun Capital, this separation transaction resulted in a $73,081 adjustment to additional paid in capital on our Consolidated Balance Sheet at February 1, 2014.
As a result of the separation with the non-Vince businesses, the financial results of the non-Vince businesses, through the separation date of November 27, 2013, are now included in results from discontinued operations. The non-Vince businesses continue to operate as a stand-alone company. Due to differences in the basis of presentation for discontinued operations and the basis of presentation as a stand-alone company, the financial results of the non-Vince businesses included within discontinued operations of the Company may not be indicative of actual financial results of the non-Vince businesses as a stand-alone company.
On November 27, 2013, we entered into a Shared Services agreement with Kellwood pursuant to which Kellwood provides support services in various operational areas as further discussed in Note 15. Other than the payments for services provided under this agreement, we do not expect any future cash flows related to the non-Vince business.
F-17
Table of Contents
The results of the non-Vince businesses included in discontinued operations (through the separation of the non-Vince businesses on November 27, 2013) for the fiscal years ended February 1, 2014 and February 2, 2013 are summarized in the following table (in thousands).
| Fiscal Year | ||||||||
| 2013 | 2012 | |||||||
| Net sales |
$ | 400,848 | $ | 514,806 | ||||
| Cost of products sold |
313,620 | 409,763 | ||||||
|
|
|
|
|
|||||
| Gross profit |
87,228 | 105,043 | ||||||
| Selling, general and administrative expenses |
98,016 | 132,871 | ||||||
| Restructuring, environmental and other charges |
1,628 | 5,732 | ||||||
| Impairment of long-lived assets |
1,399 | 6,497 | ||||||
| Change in fair value of contingent consideration |
1,473 | (7,162 | ) | |||||
| Interest expense, net |
46,677 | 55,316 | ||||||
| Other expense, net |
498 | (9,776 | ) | |||||
|
|
|
|
|
|||||
| Loss before income taxes |
(62,463 | ) | (78,435 | ) | ||||
| Income taxes |
(11,648 | ) | (421 | ) | ||||
|
|
|
|
|
|||||
| Net loss from discontinued operations, net of taxes |
$ | (50,815 | ) | $ | (78,014 | ) | ||
|
|
|
|
|
|||||
| Effective tax rate |
18.6 | % | 0.5 | % | ||||
|
|
|
|
|
|||||
The fiscal 2013 effective tax rate for discontinued operations differs from the U.S. statutory rate of 35% primarily due to the release of valuation allowance. The release in valuation allowance is primarily due to the allocation of the disallowed tax loss on the sale of a trademark to intangible assets with indefinite lives resulting in fewer deferred tax liabilities that cannot be offset against deferred tax assets for valuation allowance purposes.
The fiscal 2012 effective tax rate for discontinued operations differ from the U.S. statutory rate of 35% primarily due to a full valuation allowance on current year deferred tax assets offset in part by state taxes.
At February 1, 2014, there are no remaining assets or liabilities of the non-Vince businesses reflected in the consolidated balance sheet.
Financing arrangements of the non-Vince business
Short-term borrowings represent borrowings under the Wells Fargo Facility (as defined herein), as amended. On October 19, 2011 Kellwood Company and certain of its domestic subsidiaries, as borrowers, entered into a credit agreement with Wells Fargo Bank, National Association, as agent, and lenders from time to time (the “Wells Fargo Facility”). The Wells Fargo Facility provided a non-amortizing senior revolving credit facility with aggregate lending commitments of $160,000, of which $5,000 was permanently extinguished during fiscal 2012. The amount which the borrowers could borrow was determined on the basis of a borrowing base formula, and borrowings were secured by a first-priority security interest in substantially all of the assets of the borrowers, including the assets of Vince, LLC. Borrowings bore interest at a rate per annum equal to an applicable margin (generally 1.25%-1.75% per annum at the borrowers’ election, LIBOR or a Base Rate (as defined in the Wells Fargo Facility)). On November 27, 2013, in connection with the consummation of the IPO and Restructuring Transactions, the Wells Fargo Facility was amended and restated in accordance with its terms. After such amendment and restatement, neither VHC nor any of its subsidiaries have any obligations thereunder.
Cerberus Term Loan
On October 19, 2011, Kellwood Company and certain of its domestic subsidiaries, as borrowers (the “Cerberus Borrowers”), entered into a term loan agreement (the “Term Loan Agreement”), as amended, with
F-18
Table of Contents
Cerberus Business Finance, LLC (the “Agent”), as agent and the lenders from time to time party thereto. The Term Loan Agreement provided the Cerberus Borrowers with a non-amortizing secured Cerberus Term Loan in an aggregate amount of $55,000 (the “Cerberus Term Loan”), of which $10,000 was repaid during fiscal 2012. All borrowings under the Cerberus Term Loan bore interest at a rate per annum equal to an applicable margin (10.25%-11.25% per annum for LIBOR Rate Loans (as defined in the Term Loan Agreement) and 7.75%-8.75% for Reference Rate Loans (as defined in the Term Loan Agreement)) plus, at the Cerberus Borrowers’ election, LIBOR or a Reference Rate as defined in the Term Loan Agreement. The agreement also provided for a portion of such interest equal to 1% per annum to be paid-in-kind and added to the principal amount of such term loans. The Cerberus Term Loan was secured by a security interest in substantially all of the assets of the Cerberus Borrowers, including Vince, LLC. On November 27, 2013, in connection with the closing of the IPO and Restructuring Transactions, the Cerberus Term Loan was repaid with the proceeds from the repayment of the Kellwood Note Receivable, as such neither VHC nor any of its subsidiaries have any obligations thereunder.
Sun Term Loan Agreements
Since fiscal year 2009, Kellwood Company and certain of its domestic subsidiaries, as borrowers (the “Sun Term Loan Borrowers”), entered into various term loan agreements (“Sun Term Loan Agreements”) with affiliates of Sun Capital, as lenders, and Sun Kellwood Finance, as collateral agent. The Sun Term Loan Agreements were secured by a security interest in substantially all of the assets of the Sun Term Loan Borrowers, which included the assets of Vince, LLC, which security interest was contractually subordinated to the security interests of the lenders under the Wells Fargo Facility and the Cerberus Term Loan. These term loans bore interest at a rate per annum of 5.0%-6.0% paid-in-kind and added to the principal amounts of such term loans. On November 27, 2013, in connection with the closing of the IPO and Restructuring Transactions, the Sun Term Loan Agreements were discharged through (i) the application of the Kellwood Note Receivable proceeds and (ii) capital contributions by Sun Capital affiliates, as such neither VHC nor any of its subsidiaries have any obligations thereunder.
12.875% Notes
Interest on the 12.875% 2009 Debentures due December 31, 2014 of Kellwood Company (the “12.875% Notes”) was paid (a) in cash at a rate of 7.875% per annum payable in January and July; and (b) in the form of PIK interest at a rate of 5.0% per annum (“PIK Interest”) payable either by increasing the principal amount of the outstanding 12.875% Notes, or by issuing additional 12.875% Notes with a principal amount equal to the PIK Interest accrued for the interest period. The 12.875% Notes were guaranteed by various of Kellwood Company’s subsidiaries on a secured basis (including the assets of Vince, LLC), which security interest was contractually subordinated to security interests of lenders under the Wells Fargo Facility, the Cerberus Term Loan and the Sun Term Loan Agreements. On November 27, 2013, in connection with the closing of the IPO and Restructuring Transactions, the 12.875% Notes were redeemed with proceeds from the repayment of the Kellwood Note Receivable, at which time VHC and all subsidiaries were released as a guarantor and the obligations under the indenture were satisfied and discharged.
7.625% Notes
Interest on the 7.625% 1997 Debentures due October 15, 2017 of Kellwood Company (the “7.625% Notes”) was payable in cash at a rate of 7.625% per annum in April and October. On November 27, 2013, in connection with the closing of the IPO and as an early settlement of the tender offer, Kellwood Company, LLC accepted for purchase (and cancelled) approximately $33,474 in aggregate principal amount of the 7.625% Notes. On December 12, 2013, as part of the final settlement of the tender offer, Kellwood Company, LLC accepted for purchase (and cancelled) an additional $4,670 in aggregate principal amount of the 7.625% Notes. After giving effect to these settlements, approximately $48,809 of the 7.625% Notes remain issued and outstanding; provided, that neither VHC nor its subsidiaries are a guarantor or obligor of such notes.
F-19
Table of Contents
Note 4. Goodwill and Intangible Assets
Goodwill balances and changes therein subsequent to the February 2, 2013 Consolidated Balance Sheet are as follows (in thousands).
| Gross Goodwill | Accumulated Impairment |
Net Goodwill | ||||||||||
| Balance as of February 2, 2013 |
$ | 110,688 | $ | (46,942 | ) | $ | 63,746 | |||||
|
|
|
|
|
|
|
|||||||
| Balance as of February 1, 2014 |
$ | 110,688 | $ | (46,942 | ) | $ | 63,746 | |||||
|
|
|
|
|
|
|
|||||||
| Balance as of January 31, 2015 |
$ | 110,688 | $ | (46,942 | ) | $ | 63,746 | |||||
|
|
|
|
|
|
|
|||||||
Identifiable intangible assets summary (in thousands):
| Gross Amount | Accumulated Amortization |
Net Book Value |
||||||||||
| Balance as of February 1, 2014: |
||||||||||||
| Amortizable intangible assets: |
||||||||||||
| Customer relationships |
$ | 11,970 | $ | (3,577 | ) | $ | 8,393 | |||||
| Indefinite-lived intangible assets: |
||||||||||||
| Trademarks |
101,850 | — | 101,850 | |||||||||
|
|
|
|
|
|
|
|||||||
| Total intangible assets |
$ | 113,820 | $ | (3,577 | ) | $ | 110,243 | |||||
|
|
|
|
|
|
|
|||||||
| Gross Amount | Accumulated Amortization |
Net Book Value |
||||||||||
| Balance as of January 31, 2015: |
||||||||||||
| Amortizable intangible assets: |
||||||||||||
| Customer relationships |
$ | 11,970 | $ | (4,176 | ) | $ | 7,794 | |||||
| Indefinite-lived intangible assets: |
||||||||||||
| Trademarks |
101,850 | — | 101,850 | |||||||||
|
|
|
|
|
|
|
|||||||
| Total intangible assets |
$ | 113,820 | $ | (4,176 | ) | $ | 109,644 | |||||
|
|
|
|
|
|
|
|||||||
Amortization of identifiable intangible assets was $599, $599 and $598 for fiscal 2014, 2013 and 2012, respectively, which is included in selling, general and administrative expenses on the Consolidated Statements of Operations. Amortization expense for each of the fiscal years 2015 to 2019 is expected to be as follows (in thousands).
| Future Amortization |
||||
| 2015 |
$ | 598 | ||
| 2016 |
598 | |||
| 2017 |
598 | |||
| 2018 |
598 | |||
| 2019 |
598 | |||
|
|
|
|||
| Total next 5 fiscal years |
$ | 2,990 | ||
|
|
|
|||
Identifiable indefinite-lived intangible assets represent the Vince trademark. No impairments of the Vince trademark were recorded as a result of our annual asset impairment tests during fiscal years 2014, 2013 or 2012. In fiscal 2014, 2013 and 2012, we performed the qualitative assessment on the Vince Trademark as allowed by the Intangible—Goodwill and Other Topic of ASC and determined that it was not more likely than not that the carrying value exceeded the fair value of the asset.
F-20
Table of Contents
Additionally, there were no impairments recorded as a result of our annual goodwill impairment test during fiscal 2014, 2013 or 2012. In fiscal 2014, 2013 and 2012, we used a qualitative analysis to assess the goodwill and determined that it was not more likely than not that the fair value was less than the carrying value, as allowed by the Intangible—Goodwill and Other Topic of ASC.
Note 5. Fair Value
ASC Subtopic 820-10 defines fair value as the price that would be received to sell an asset or paid to transfer a liability in an orderly transaction between market participants at the measurement date. This guidance outlines a valuation framework, creates a fair value hierarchy to increase the consistency and comparability of fair value measurements, and details the disclosures that are required for items measured at fair value. Financial assets and liabilities are to be measured using inputs from three levels of the fair value hierarchy as follows:
| Level 1— | quoted market prices in active markets for identical assets or liabilities | |
| Level 2— | observable market-based inputs (quoted prices for similar assets and liabilities in active markets and quoted prices for identical or similar assets or liabilities in markets that are not active) or inputs that are corroborated by observable market data | |
| Level 3— | significant unobservable inputs that reflect our assumptions and are not substantially supported by market data | |
The Company did not have any non-financial assets or non-financial liabilities recognized at fair value on a recurring basis at January 31, 2015 or February 1, 2014. At January 31, 2015 and February 1, 2014, the Company believes that the carrying value of cash and cash equivalents, receivables and accounts payable approximates fair value, due to the short maturity of these instruments. As the Company’s debt obligation as of January 31, 2015 is at variable rates, there is no significant difference between the fair value and carrying value of the Company’s debt.
The Company’s non-financial assets, which primarily consist of goodwill, intangible assets, and property and equipment, are not required to be measured at fair value on a recurring basis and are reported at their carrying value. However, on a periodic basis whenever events or changes in circumstances indicate that their carrying value may not be fully recoverable (and at least annually for goodwill and intangible assets), non-financial assets are assessed for impairment, if applicable, written down to (and recorded at) fair value.
Note 6. Financing Arrangements
Revolving Credit Facility
On November 27, 2013, Vince, LLC entered into the Revolving Credit Facility in connection with the closing of the IPO and Restructuring Transactions. Bank of America, N.A. (“BofA”) serves as administrative agent for this facility. The Revolving Credit Facility provides for a revolving line of credit of up to $50,000 and matures on November 27, 2018. The Revolving Credit Facility also provides for a letter of credit sublimit of $25,000 (plus any increase in aggregate commitments) and for an increase in aggregate commitments of up to $20,000. Vince, LLC is the borrower and VHC and Vince Intermediate Holding, LLC (“Vince Intermediate”) are the guarantors under the new Revolving Credit Facility. Interest is payable on the loans under the Revolving Credit Facility, at either the LIBOR or the Base Rate, in each case, with applicable margins subject to a pricing grid based on an excess availability calculation. The “Base Rate” means, for any day, a fluctuating rate per annum equal to the highest of (i) the rate of interest in effect for such day as publicly announced from time to time by BofA as its prime rate; (ii) the Federal Funds Rate for such day, plus 0.50%; and (iii) the LIBOR Rate for a one month interest period as determined on such day, plus 1.0%. During the continuance of an event of default and at the election of the required lender, interest will accrue at a rate of 2% in excess of the applicable non-default rate.
F-21
Table of Contents
The Revolving Credit Facility contains a requirement that, at any point when “Excess Availability” is less than the greater of (i) 15% percent of the loan cap or (ii) $7,500, and continuing until Excess Availability exceeds the greater of such amounts for 30 consecutive days, during which time, Vince must maintain a consolidated EBITDA (as defined in the Revolving Credit Facility) equal to or greater than $20,000. We have not been subject to this maintenance requirement since Excess Availability has been greater than the required minimum.
The Revolving Credit Facility contains representations and warranties, other covenants and events of default that are customary for this type of financing, including limitations on the incurrence of additional indebtedness, liens, negative pledges, guarantees, investments, loans, asset sales, mergers, acquisitions, prepayment of other debt, the repurchase of capital stock, transactions with affiliates, and the ability to change the nature of its business or its fiscal year. The Revolving Credit Facility generally permits dividends in the absence of any event of default (including any event of default arising from the contemplated dividend), so long as (i) after giving pro forma effect to the contemplated dividend, for the following six months Excess Availability will be at least the greater of 20% of the aggregate lending commitments and $7,500 and (ii) after giving pro forma effect to the contemplated dividend, the “Consolidated Fixed Charge Coverage Ratio” for the 12 months preceding such dividend shall be greater than or equal to 1.1 to 1.0 (provided that the Consolidated Fixed Charge Coverage Ratio may be less than 1.1 to 1.0 if, after giving pro forma effect to the contemplated dividend, Excess Availability for the six fiscal months following the dividend is at least the greater of 35% of the aggregate lending commitments and $10,000).
As of January 31, 2015, the availability under the $50,000 Revolving Credit Facility was $19,353. As of January 31, 2015, there was $23,000 of borrowings outstanding and $7,647 of letters of credit outstanding under the Revolving Credit Facility. The weighted average interest rate for borrowings outstanding under the Revolving Credit Facility as of January 31, 2015 was 2.1%. There were no borrowings outstanding under the Revolving Credit Facility as of February 1, 2014.
Note 7. Long-Term Debt
Long-term debt consisted of the following as of, January 31, 2015 and February 1, 2014 (in thousands).
| January 31, 2015 |
February 1, 2014 |
|||||||
| Term Loan Facility |
$ | 65,000 | $ | 170,000 | ||||
| Revolving Credit Facility |
23,000 | — | ||||||
|
|
|
|
|
|||||
| Total long-term debt |
$ | 88,000 | $ | 170,000 | ||||
|
|
|
|
|
|||||
Term Loan Facility
On November 27, 2013, in connection with the closing of the IPO and Restructuring Transactions, Vince, LLC and Vince Intermediate entered into the $175,000 Term Loan Facility with the lenders party thereto, BofA, as administrative agent, JPMorgan Chase Bank and Merrill Lynch, Pierce, Fenner & Smith Incorporated, as joint lead arrangers, and Cantor Fitzgerald as documentation agent. The Term Loan Facility will mature on November 27, 2019. On November 27, 2013, net proceeds from the Term Loan Facility were used, at closing, to repay the Kellwood Note Receivable.
The Term Loan Facility also provides for an incremental facility of up to the greater of $50,000 and an amount that would result in the consolidated net total secured leverage ratio not exceeding 3.00 to 1.00, in addition to certain other rights to refinance or repurchase portions of the term loan. The Term Loan Facility is subject to quarterly amortization of principal equal to 0.25% of the original aggregate principal amount of the Term Loan Facility, with the balance payable at final maturity. Interest is payable on loans under the Term Loan
F-22
Table of Contents
Facility at a rate of either (i) the Eurodollar rate (subject to a 1.00% floor) plus an applicable margin of 4.75% to 5.00% based on a leverage ratio or (ii) the base rate applicable margin of 3.75% to 4.00% based on a leverage ratio. During the continuance of a payment or bankruptcy event of default, interest will accrue (i) on the overdue principal amount of any loan at a rate of 2% in excess of the rate otherwise applicable to such loan and (ii) on any overdue interest or any other outstanding overdue amount at a rate of 2% in excess of the nondefault interest rate then applicable to base rate loans.
The Term Loan Facility contains a requirement that Vince, LLC and Vince Intermediate maintain a “Consolidated Net Total Leverage Ratio” as of the last day of any period of four fiscal quarters not to exceed 3.75 to 1.00 for the fiscal quarters ending February 1, 2014 through November 1, 2014, 3.50 to 1.00 for the fiscal quarters ending January 31, 2015 through October 31, 2015, and 3.25 to 1.00 for the fiscal quarter ending January 30, 2016 and each fiscal quarter thereafter. In addition, the Term Loan Facility contains customary representations and warranties, other covenants, and events of default, including but not limited to, limitations on the incurrence of additional indebtedness, liens, negative pledges, guarantees, investments, loans, asset sales, mergers, acquisitions, prepayment of other debt, the repurchase of capital stock, transactions with affiliates, and the ability to change the nature of its business or its fiscal year, and distributions and dividends. The Term Loan Facility generally permits dividends to the extent that no default or event of default is continuing or would result from the contemplated dividend and the pro forma Consolidated Net Total Leverage Ratio after giving effect to such contemplated dividend is at least 0.25 lower than the maximum Consolidated Net Total Leverage Ratio for such quarter. All obligations under the Term Loan Facility are guaranteed by VHC and any future material domestic restricted subsidiaries of Vince, LLC and secured by a lien on substantially all of the assets of VHC, Vince, LLC and Vince Intermediate and any future material domestic restricted subsidiaries. We are in compliance with applicable financial covenants.
Through January 31, 2015, on an inception to date basis, the Company has made voluntary prepayments totaling $110,000 in the aggregate on the original $175,000 Term Loan Facility entered into on November 27, 2013. Of the $110,000 aggregate voluntary prepayments made to date, $105,000 was paid during fiscal 2014. The voluntary prepayments of $105,000 made during the current fiscal year were partially funded by $23,000 of net borrowings under the Revolving Credit Facility. As of January 31, 2015 the Company had $65,000 of debt outstanding under the Term Loan Facility.
Sun Promissory Notes
On May 2, 2008, VHC entered into a $225,000 Senior Subordinated Promissory Note and a $75,000 Senior Subordinated Promissory Note with Sun Kellwood Finance, LLC (“Sun Kellwood Finance”), an affiliate of Sun Capital Partners, Inc. We collectively refer to these notes as our “Sun Promissory Notes”. The unpaid principal balance of the notes accrue interest at 15% per annum until the maturity date of October 15, 2011, at which point any unpaid principal balance of the notes shall accrue interest at a rate of 17% per annum until the notes are paid in full. All interest which is not paid in cash on or before the last day of each calendar month are deemed paid in kind and added to the principal balance of the notes unless an election is made otherwise.
On July 19, 2012, Vince Holding Corp. amended the Sun Promissory Notes to extend the maturity date to October 15, 2016 and reduce the interest rate to 12% per annum until maturity, at which point any unpaid principal balance of the notes shall accrue interest at a rate of 14% per annum until the notes are paid in full.
On December 28, 2012, Sun Kellwood Finance, LLC (“Sun Capital Finance”) waived all interest capitalized and accrued under the notes prior to July 19, 2012. As both parties were under the common control of affiliates of Sun Capital Partners, Inc. (“Sun Capital”), this transaction resulted in a capital contribution of $270,852 which was recorded as an adjustment to additional paid in capital on our Consolidated Balance Sheet as of February 2, 2013.
F-23
Table of Contents
On June 18, 2013, Sun Kellwood Finance assigned all title and interest in the Sun Promissory Notes to Sun Cardinal, LLC (“Sun Cardinal”). Immediately following the assignment, Sun Cardinal contributed all outstanding principal and interest due under these notes as of June 18, 2013 to the capital of VHC. As both parties were under common control of affiliates of Sun Capital at such time, this transaction resulted in a capital contribution of $334,595, which was recorded as an adjustment to VHC’s additional paid in capital on the Consolidated Balance Sheet as of February 1, 2014.
Sun Capital Loan Agreement
VHC was party to a Loan Authorization Agreement, originally dated February 13, 2008, by and between VHC (as the successor entity to Cardinal Integrated, LLC), SCSF Kellwood Finance, LLC (“SCSF Finance”) and Sun Kellwood Finance (as successors to Bank of Montreal) for a $72,000 line of credit, and $69,485 principal balance, which we refer to as the “Sun Capital Loan Agreement”. Under the terms of this agreement, as amended from time to time, interest accrued at a rate equal to the rate per annum announced by the Bank of Montreal, Chicago, Illinois, from time to time as its prime commercial rate, or equivalent, for U.S. dollar loans to borrowers located in the U.S. plus 2%. Interest on the loan was due by the last day of each fiscal quarter and is payable either in immediately available funds on each interest payment date or by adding such interest to the unpaid principal balance of the loan on each interest payment date. The original maturity date of the loan was August 6, 2009. On July 19, 2012, the maturity date of the loan was extended to August 6, 2014.
On December 28, 2012, Sun Kellwood Finance and SCSF Finance waived all interest capitalized and accrued under the loan authorization agreement prior to July 19, 2012. As all parties were under the common control of affiliates of Sun Capital, this transaction resulted in a capital contribution of $18,249, which was recorded as an adjustment to additional paid in capital on our Consolidated Balance Sheet as of February 2, 2013.
On June 18, 2013, Sun Kellwood Finance and SCSF Finance assigned all title and interest in the note under the Sun Capital Loan Agreement to Sun Cardinal. Immediately following the assignment, Sun Cardinal contributed all outstanding principal and interest due under this note as of June 18, 2013 to the capital of VHC. As all parties were under common control of affiliates of Sun Capital at such time, this transaction resulted in a capital contribution of $72,932, which was recorded as an adjustment to VHC’s additional paid in capital on the Consolidated Balance Sheet as of February 1, 2014.
Note 8. Leases
We lease substantially all of our office and showroom space, retail stores and certain machinery and equipment under operating leases having remaining terms up to eleven years, excluding renewal terms. Most of our real estate leases contain covenants that require us to pay real estate taxes, insurance, and other executory costs. Certain of these leases require contingent rent payments, kick-out clauses and/or opt-out clauses, based on the operating results of the retail operations utilizing the leased premises. Rent under leases with scheduled rent changes or lease concessions are recorded on a straight-line basis over the lease term. Rent expense under all operating leases was $16,161, $10,467 and $7,448 for 2014, 2013 and 2012, respectively.
The future minimum lease payments under operating leases at January 31, 2015 were as follows (in thousands):
| Minimum Lease Payments |
||||
| 2015 |
$ | 15,593 | ||
| 2016 |
17,877 | |||
| 2017 |
17,912 | |||
| 2018 |
17,655 | |||
| 2019 |
17,514 | |||
| Thereafter |
63,516 | |||
|
|
|
|||
| Total minimum lease payments |
$ | 150,067 | ||
|
|
|
|||
F-24
Table of Contents
Note 9. Share-Based Compensation
Prior to November 27, 2013, Vince Holding Corp. did not have convertible equity or convertible debt securities, any of which could result in share-based compensation expense. In connection with the IPO, which closed on November 27, 2013, and the separation of the Vince and non-Vince businesses, VHC assumed Kellwood Company’s remaining obligations under the 2010 Stock Option Plan of Kellwood Company (the “2010 Option Plan”) and all Kellwood Company stock options previously issued to Vince employees under such plan became options to acquire shares of VHC common stock. Additionally, VHC assumed Kellwood Company’s obligations with respect to the vested Kellwood Company stock options previously issued to Kellwood Company employees, which options were cancelled in exchange for shares of VHC common stock. Accordingly, option information presented below for previously issued Kellwood Company stock options under the 2010 Option Plan has been adjusted to account for the split of the Company’s common stock and applicable conversion to options to acquire shares of Vince Holding Corp. common stock.
Employee Stock Plans
2010 Option Plan
Kellwood Company had convertible equity securities that result in recognition of share-based compensation expense. On June 30, 2010, the board of directors approved the 2010 Stock Option Plan. On November 21, 2013 and as discussed above, VHC assumed Kellwood Company’s remaining obligations under the 2010 Option Plan; provided, that none of the issued and outstanding options (after giving effect to such assumption and the stock split effected as part of the Restructuring Transactions) were exercisable until the consummation of the IPO. Additionally, prior to the consummation of the IPO and after giving effect to the assumption described in this paragraph, VHC and the Vince employees to whom options had been previously granted under the 2010 Option Plan, amended the related grant agreements to eliminate, effective as of the consummation of the IPO, restrictions on the exercisability of the subject employees vested options.
Prior to the IPO, the 2010 Option Plan, as amended, provided for the grant of options to acquire up to 2,752,155 shares of Kellwood Company common stock. The options granted pursuant to the 2010 Option Plan (i) vest in five equal installments on the first, second, third, fourth, and fifth anniversary of the grant date, subject to the employee’s continued employment and, (ii) expire on the earlier of the tenth anniversary of the grant date or upon termination of employment. We will not grant any future awards under the 2010 Option Plan. Future awards shall be granted under the Vince 2013 Incentive Plan described further below.
Vince 2013 Incentive Plan
In connection with the IPO, the Company adopted the Vince 2013 Incentive Plan, which provides for grants of stock options, stock appreciation rights, restricted stock and other stock-based awards. The aggregate number of shares of common stock which may be issued or used for reference purposes under the Vince 2013 Incentive Plan or with respect to which awards may be granted may not exceed 3,400,000 shares. The shares available for issuance under the Vince 2013 Incentive Plan may be, in whole or in part, either authorized and unissued shares of our common stock or shares of common stock held in or acquired for our treasury. In general, if awards under the Vince 2013 Incentive Plan are for any reason cancelled, or expire or terminate unexercised, the shares covered by such award may again be available for the grant of awards under the Vince 2013 Incentive Plan. As of January 31, 2015, there were 2,514,959 shares under the Vince 2013 Incentive Plan available for future grants. Options granted pursuant to the Vince 2013 Incentive Plan (i) vest in equal installments over three or four years or at 33 1/3% per year beginning in year two, over four years, subject to the employees’ continued employment and (ii) expire on the earlier of the tenth anniversary of the grant date or upon termination as outlined in the Vince 2013 Incentive Plan.
F-25
Table of Contents
Stock Options
A summary of stock option activity for fiscal 2014 is as follows:
| Stock Options | Weighted Average Exercise Price |
Weighted Average Remaining Contractual Term (years) |
Aggregate Intrinsic Value |
|||||||||||||
| Outstanding at February 1, 2014 |
2,289,530 | $ | 8.26 | 8.8 | ||||||||||||
| Granted |
577,437 | $ | 32.82 | |||||||||||||
| Exercised |
(22,018 | ) | $ | 7.99 | ||||||||||||
| Forfeited or expired |
(118,780 | ) | $ | 14.88 | ||||||||||||
|
|
|
|||||||||||||||
| Outstanding at January 31, 2015 |
2,726,169 | $ | 13.18 | 8.2 | $ | 33,367 | ||||||||||
|
|
|
|||||||||||||||
| Vested or expected to vest at January 31, 2015 |
2,726,169 | $ | 13.18 | 8.2 | $ | 33,367 | ||||||||||
| Vested and exercisable at January 31, 2015 |
653,861 | $ | 6.35 | 7.5 | $ | 11,181 | ||||||||||
The aggregate intrinsic value in the table above represents the total pre-tax intrinsic value (the difference between the Company’s closing stock price on the last trading day of fiscal 2014 and the exercise price, multiplied by the number of such in-the-money options) that would have been received by the option holders had all options holders exercised their options on January 31, 2015. This amount changes based on the fair market value of the Company’s common stock. Total intrinsic value of options exercised during fiscal 2014 (based on the differences between the Company’s stock price on the respective exercise date and the respective exercise price, multiplied by the number of respective options exercised) was $620.
The Company’s weighted average assumptions used to estimate the fair value of stock options granted on November 21, 2013 in connection with our IPO and the options granted during fiscal 2014 were estimated using a Black-Scholes option valuation model and were as follows. Expected term of 4.5 years, expected volatility of 51.1%, risk-free interest rate of 1.4% and expected dividend yield of 0.0%. Due to the limited trading history of the Company’s common stock, the volatility and expected term assumptions used were based on averages from a peer group of publicly traded retailers. The risk-free interest rate was based upon the U.S. Treasury five year yield curve. Based on these assumptions used, the weighted average grant date fair value for options granted during fiscal 2014 and for the options granted on November 21, 2013 in connection with our IPO was $14.13 per share and $8.82 per share, respectively.
The fair value of stock options granted in fiscal 2012 through October 2013 was determined at the grant date using a Black-Scholes option valuation model, which requires us to make several significant assumptions including risk-free interest rate, volatility, expected term, and discount factors for shareholders in a privately-held company. The estimated term of 6.5 years for these options was developed using a simplified method permitted by SEC Staff Accounting Bulletin Topic 14: Share-Based Payment, available for companies with “plain-vanilla” options and have limited historical exercise data. Our selected volatility rate of 55.0% was estimated using both: (i) volatility reported by companies comparable to Kellwood Company with publicly-traded stock, and (ii) calculated volatility of companies comparable to Kellwood Company with publicly-traded stock using historical stock prices. We applied a cumulative discount factor to the price per share of 36.25% to adjust for the lack of marketability of the shares, as well as the impact of the shares representing a minority interest in a privately-held company. Our estimates were developed using market data for companies comparable to Kellwood Company and empirical studies regarding the impact on the value of private-company shares resulting from transfer restrictions. Finally, the risk-free rate of 0.85% is based upon the U.S. Treasury five year yield curve.
At January 31, 2015 there was $11,504 of unrecognized compensation costs related to stock options that will be recognized over a remaining weighted average period of 3.3 years.
F-26
Table of Contents
Restricted Stock Units
A summary of restricted stock unit activity for fiscal 2014 is as follows:
| Restricted Stock Units |
Weighted Average Grant Date Fair Value |
|||||||
| Nonvested restricted stock units at February 1, 2014 |
7,500 | $ | 20.00 | |||||
| Granted |
7,384 | $ | 30.47 | |||||
| Vested |
(2,500 | ) | $ | 20.00 | ||||
| Forfeited |
— | — | ||||||
|
|
|
|||||||
| Nonvested restricted stock units at January 31, 2015 |
12,384 | $ | 26.24 | |||||
|
|
|
|||||||
The fair value of restricted stock units is based on the market price of the Company’s stock on the date of the grant and is amortized to compensation expense on a straight-line basis over the requisite service period, which is generally over a three year vesting period, subject to continued service and applicable conditions of the Vince 2013 Incentive Plan.
At January 31, 2015 there was $289 of unrecognized compensation costs related to restricted stock units that will be recognized over a remaining weighted average period of 2.4 years.
Share-Based Compensation Expense
Share-based compensation expense is recognized over the requisite service period of the each share-based payment award and the expense is included as a component of selling, general and administrative expenses in the Consolidated Statements of Operations. During fiscal 2014 we recognized share-based compensation expense of $1,896 and a related tax benefit of approximately $758. During fiscal 2013, from our IPO through the end of the fiscal year, we recognized share-based compensation expense of $347 and a related tax benefit of approximately $139. During fiscal year 2013, from the beginning of the fiscal year through our IPO date, and in fiscal 2012 we recognized share-based compensation expense of $551 and $367, respectively, which was included in net loss from discontinued operations as such expense was a component of the non-Vince businesses which were separated from the Vince business on November 27, 2013. In addition, as a result of the deferred tax valuation allowance during these periods, the Company did not recognize the related tax benefit on the share-based compensation expense.
Note 10. Stockholders’ Equity
Common Stock:
We currently have authorized for issuance 100,000,000 shares of our Voting Common Stock, par value of $0.01 per share. As of January 31, 2015 and February 1, 2014 we had 36,748,245 and 36,723,727 shares issued and outstanding, respectively (after giving effect to the conversion of all our issued and outstanding non-voting common stock into common stock on a one-for-one basis and the subsequent split of our common stock on a one for 28.5177 basis, as part of the Restructuring Transactions).
Secondary Offering of Common Stock:
In July 2014, certain selling stockholders of VHC, including affiliates of Sun Capital (the “Selling Stockholders”), sold 4,975,254 shares of VHC’s common stock at a public offering price of $34.50 per share in a secondary public offering (the “Secondary Offering”). The total shares sold include 648,946 shares sold by the Selling Stockholders pursuant to the exercise by the underwriters of their option to purchase additional shares. The Company did not receive any proceeds from the Secondary Offering. Immediately following the Secondary
F-27
Table of Contents
Offering, affiliates of Sun Capital beneficially owned 54.6% of VHC’s issued and outstanding common stock. The Company incurred approximately $571 of expenses in connection with the Secondary Offering during fiscal 2014.
Dividends:
We have not paid dividends, and our current ability to pay such dividends is restricted by the terms of our debt agreements. Our future dividend policy will be determined on a yearly basis and will depend on earnings, financial condition, capital requirements, and certain other factors. We do not expect to declare dividends with respect to our common stock in the foreseeable future.
Note 11. Earnings Per Share
All share information presented below and herein has been adjusted to reflect the stock split approved by VHC’s board of directors as of November 27, 2013. The fiscal year ended February 1, 2014 includes the impact of 10,000,000 shares issued by the Company on November 21, 2013. As fiscal year ended February 2, 2013 included a net loss, there were no dilutive securities as the impact would have been anti-dilutive.
The following is a reconciliation of weighted average basic shares to weighted average diluted shares outstanding:
| Fiscal Year Ended | ||||||||||||
| January 31, 2015 |
February 1, 2014 |
February 2, 2013 |
||||||||||
| Weighted-average shares—basic |
36,730,490 | 28,119,794 | 26,211,130 | |||||||||
| Effect of dilutive equity securities |
1,514,416 | 153,131 | — | |||||||||
|
|
|
|
|
|
|
|||||||
| Weighted-average shares—diluted |
38,244,906 | 28,272,925 | 26,211,130 | |||||||||
|
|
|
|
|
|
|
|||||||
For the fiscal year ended January 31, 2015, 123,959 options to purchase common stock were excluded from the computation of weighted average shares for diluted earnings per share since the related exercises prices exceeded the average market price of the Company’s common stock and such inclusion would be anti-dilutive. There were no antidilutive securities in the fiscal year ended February 1, 2014 and February 2, 2013.
Note 12. Income Taxes
The provision for income taxes for continuing operations consists of the following (in thousands):
| 2014 | 2013 | 2012 | ||||||||||
| Current: |
||||||||||||
| Domestic: |
||||||||||||
| Federal |
$ | 759 | $ | — | $ | — | ||||||
| State |
344 | 43 | 31 | |||||||||
| Foreign |
— | — | — | |||||||||
|
|
|
|
|
|
|
|||||||
| Total current |
1,103 | 43 | 31 | |||||||||
| Deferred: |
||||||||||||
| Domestic: |
||||||||||||
| Federal |
20,416 | 6,333 | 1,030 | |||||||||
| State |
2,475 | 905 | 124 | |||||||||
| Foreign |
— | (13 | ) | (7 | ) | |||||||
|
|
|
|
|
|
|
|||||||
| Total deferred |
22,891 | 7,225 | 1,147 | |||||||||
|
|
|
|
|
|
|
|||||||
| Total provision for income taxes |
$ | 23,994 | $ | 7,268 | $ | 1,178 | ||||||
|
|
|
|
|
|
|
|||||||
F-28
Table of Contents
The sources of income (loss) for continuing operations before provision for income taxes are from the United States for all years. We file U.S. federal income tax returns and income tax returns in various state and local jurisdictions.
Current income taxes are the amounts payable under the respective tax laws and regulations on each year’s earnings. A reconciliation of the federal statutory income tax rate to the effective tax rate is as follows:
| 2014 | 2013 | 2012 | ||||||||||
| Statutory federal rate |
35.0 | % | 35.0 | % | (35.0 | )% | ||||||
| State taxes, net of federal benefit |
5.7 | % | 9.5 | % | 7.4 | % | ||||||
| Nondeductible interest |
0.0 | % | 18.1 | % | 84.3 | % | ||||||
| Nondeductible transaction costs |
0.0 | % | 6.7 | % | 0.0 | % | ||||||
| Valuation allowance |
(0.7 | )% | (45.5 | )% | (52.7 | )% | ||||||
| Other |
0.2 | % | (0.1 | )% | 0.1 | % | ||||||
|
|
|
|
|
|
|
|||||||
| Total |
40.2 | % | 23.7 | % | 4.1 | % | ||||||
|
|
|
|
|
|
|
|||||||
Deferred income tax assets and liabilities for continuing operations consisted of the following (in thousands):
| January 31, 2015 |
February 1, 2014 |
|||||||
| Deferred tax assets: |
||||||||
| Depreciation and amortization |
$ | 29,935 | $ | 44,742 | ||||
| Employee related costs |
3,503 | 2,048 | ||||||
| Allowance for asset valuations |
3,172 | 2,454 | ||||||
| Accrued expenses |
3,933 | 1,589 | ||||||
| Net operating losses |
65,111 | 80,936 | ||||||
| Tax credits |
888 | — | ||||||
| Other |
90 | 1,067 | ||||||
|
|
|
|
|
|||||
| Total deferred tax assets |
106,632 | 132,836 | ||||||
| Less: valuation allowances |
(1,074 | ) | (1,843 | ) | ||||
|
|
|
|
|
|||||
| Net deferred tax assets |
105,558 | 130,993 | ||||||
|
|
|
|
|
|||||
| Deferred tax liabilities: |
||||||||
| Cancellation of debt income |
(8,876 | ) | (11,095 | ) | ||||
| Other |
(493 | ) | — | |||||
|
|
|
|
|
|||||
| Total deferred tax liabilities |
(9,369 | ) | (11,095 | ) | ||||
|
|
|
|
|
|||||
| Net deferred tax assets |
$ | 96,189 | $ | 119,898 | ||||
|
|
|
|
|
|||||
| Included in: |
||||||||
| Prepaid expenses and other current assets |
$ | 4,015 | $ | 4,476 | ||||
| Deferred income taxes and other assets |
92,174 | 115,422 | ||||||
|
|
|
|
|
|||||
| Net deferred income tax assets |
$ | 96,189 | $ | 119,898 | ||||
|
|
|
|
|
|||||
As of January 31, 2015, various federal and state net operating losses were available for carryforward to offset future taxable income. Substantially all of these net operating losses will expire between 2030 and 2034. The valuation allowance of $1,074 at January 31, 2015 and $1,843 at February 1, 2014, reflects management’s assessment, based on available information, that it is more likely than not that a portion of the deferred tax assets will not be realized due to the inability to generate sufficient state taxable income. Adjustments to the valuation allowance are made when there is a change in management’s assessment of the amount of deferred tax assets that are realizable.
F-29
Table of Contents
Net operating losses as of January 31, 2015 presented above do not include fiscal 2014 and 2013 deductions related to stock options that exceeded expenses previously recognized for financial reporting purposes since they have not yet reduced income taxes payable. The excess deduction will reduce income taxes payable and increase additional paid in capital by $2,675 when ultimately deducted in a future year.
As discussed in Note 2, we completed an IPO during fiscal 2013. The completion of the IPO and Restructuring Transactions resulted in the non-Vince businesses being separated from the Vince business. As a result, the Company determined that the full valuation allowance on the U.S. net deferred tax assets was no longer necessary. Since the IPO and Restructuring Transactions occurred between related parties and were considered one integrated transaction along with the establishment of the Tax Receivable Agreement liability, the offset of the release of the valuation allowance was recorded as an adjustment to additional paid-in capital on our Consolidated Balance Sheet at February 1, 2014 in accordance with ASC 740-20-45-11(g). The total valuation allowance on deferred tax assets for continuing operations decreased on a net basis by $769 in the fiscal year ended January 31, 2015 and decreased by $62,924 in the fiscal year ended February 1, 2014.
A reconciliation of the beginning and ending amount of unrecognized tax benefits, excluding interest and penalties, is as follows (in thousands):
| 2014 | 2013 | 2012 | ||||||||||
| Beginning balance |
$ | 3,693 | $ | 9,378 | $ | 11,057 | ||||||
| Increases for tax positions in current year |
2,397 | 3,743 | 2,199 | |||||||||
| Increases for tax positions in prior years |
135 | 356 | 52 | |||||||||
| Decreases for tax positions in prior years |
(1,738 | ) | (4,186 | ) | (102 | ) | ||||||
| Settlements |
— | (3,022 | ) | (2,105 | ) | |||||||
| Lapse in statute of limitations |
— | (102 | ) | (1,723 | ) | |||||||
| Restructuring Transactions |
— | (2,474 | ) | — | ||||||||
|
|
|
|
|
|
|
|||||||
| Ending balance |
$ | 4,487 | $ | 3,693 | $ | 9,378 | ||||||
|
|
|
|
|
|
|
|||||||
As of January 31, 2015 and February 1, 2014, unrecognized tax benefits in the amount of $2,195 (net of tax) and $2,155 (net of tax), respectively, would impact our effective tax rate if recognized. It is reasonably possible that within the next 12 months certain temporary unrecognized tax benefits could fully reverse. Should this occur, our unrecognized tax benefits could be reduced by up to $2,054.
We include accrued interest and penalties on underpayments of income taxes in our income tax provision. As of January 31, 2015 and February 1, 2014, we did not have any interest and penalties accrued on our Consolidated Balance Sheets. Net interest and penalty provisions (benefit) of $0, $(232) and $600 were recognized in our Consolidated Statements of Operations for the years ended January 31, 2015, February 1, 2014 and February 2, 2013, respectively. Interest is computed on the difference between the tax position recognized net of any unrecognized tax benefits and the amount previously taken or expected to be taken in our tax returns.
All amounts above related to unrecognized tax benefits include continuing and discontinued operations until the separation of the Vince and non-Vince businesses on November 27, 2013, and the Vince business after such date.
With limited exceptions, we are no longer subject to examination for U.S. federal and state income tax for 2007 and prior.
Note 13. Commitments and Contingencies
We are currently party to various legal proceedings. While management currently believes that the ultimate outcome of these proceedings, individually and in the aggregate, will not have a material adverse impact on our financial position or results of operations or cash flows, litigation is subject to inherent uncertainties.
F-30
Table of Contents
Note 14. Segment and Geographical Financial Information
We operate and manage our business by distribution channel and have identified two reportable segments, as further described below. We considered both similar and dissimilar economic characteristics, internal reporting and management structures, as well as products, customers, and supply chain logistics to identify the following reportable segments:
| • | Wholesale segment—consists of our operations to distribute products to premier department stores and specialty stores in the United States and select international markets. |
| • | Direct-to-consumer segment—consists of our operations to distribute products directly to the consumer through our branded full-price specialty retail stores, outlet stores, and e-commerce platform. |
The accounting policies of our segments are consistent with those described in Note 1 to the Consolidated Financial Statements. Unallocated corporate expenses are comprised of selling, general, and administrative expenses attributable to corporate and administrative activities, and other charges that are not directly attributable to our operating segments. Unallocated corporate assets are comprised of capitalized deferred financing costs, the carrying values of our goodwill and unamortized trademark, debt and deferred tax assets, and other assets that will be utilized to generate revenue for both of our reportable segments.
Our wholesale segment sells apparel to our direct-to-consumer segment at cost. The wholesale intercompany sales of $22,595, $16,916, and $9,907 have been excluded from the net sales totals presented below for fiscal 2014, fiscal 2013, and fiscal 2012, respectively. Furthermore, as intercompany sales are sold at cost, no intercompany profit is reflected in operating income presented below.
Summary information for our operating segments is presented below (in thousands).
| Fiscal Year | ||||||||||||
| 2014 | 2013 | 2012 | ||||||||||
| Net Sales: |
||||||||||||
| Wholesale |
$ | 259,418 | $ | 229,114 | $ | 203,107 | ||||||
| Direct-to-consumer |
80,978 | 59,056 | 37,245 | |||||||||
|
|
|
|
|
|
|
|||||||
| Total net sales |
$ | 340,396 | $ | 288,170 | $ | 240,352 | ||||||
|
|
|
|
|
|
|
|||||||
| Operating Income: |
||||||||||||
| Wholesale |
$ | 100,623 | $ | 81,822 | $ | 72,913 | ||||||
| Direct-to-consumer |
14,556 | 10,435 | 4,465 | |||||||||
|
|
|
|
|
|
|
|||||||
| Subtotal |
115,179 | 92,257 | 77,378 | |||||||||
| Unallocated expenses |
(44,929 | ) | (42,904 | ) | (36,442 | ) | ||||||
|
|
|
|
|
|
|
|||||||
| Total operating income |
$ | 70,250 | $ | 49,353 | $ | 40,936 | ||||||
|
|
|
|
|
|
|
|||||||
| Depreciation & Amortization: |
||||||||||||
| Wholesale |
$ | 1,962 | $ | 1,204 | $ | 915 | ||||||
| Direct-to-consumer |
2,950 | 1,581 | 1,094 | |||||||||
| Unallocated corporate |
355 | — | — | |||||||||
|
|
|
|
|
|
|
|||||||
| Total depreciation & amortization |
$ | 5,267 | $ | 2,785 | $ | 2,009 | ||||||
|
|
|
|
|
|
|
|||||||
| Capital Expenditures: |
||||||||||||
| Wholesale |
$ | 2,076 | $ | 1,832 | $ | 459 | ||||||
| Direct-to-consumer |
8,117 | 8,241 | 1,362 | |||||||||
| Unallocated corporate |
9,506 | — | — | |||||||||
|
|
|
|
|
|
|
|||||||
| Total capital expenditure |
$ | 19,699 | $ | 10,073 | $ | 1,821 | ||||||
|
|
|
|
|
|
|
|||||||
| January 31, 2015 |
February 1, 2014 |
|||||||
| Total Assets: |
||||||||
| Wholesale |
$ | 70,635 | $ | 78,122 | ||||
| Direct-to-consumer |
33,793 | 24,169 | ||||||
| Unallocated corporate |
277,770 | 312,051 | ||||||
|
|
|
|
|
|||||
| Total assets |
$ | 382,198 | $ | 414,342 | ||||
|
|
|
|
|
|||||
F-31
Table of Contents
Sales results are presented on a geographic basis below, in thousands. We predominately operate within the U.S. and sell our products in 45 countries either directly to premier department and specialty stores, or through distribution relationships with highly-regarded international partners with exclusive rights to certain territories. Sales are presented based on customer location. Substantially all long-lived assets, including property, plant and equipment and fixtures installed at our retailer sites, are located in the U.S.
| Fiscal Year | ||||||||||||
| 2014 | 2013 | 2012 | ||||||||||
| Net Sales: |
||||||||||||
| Domestic |
$ | 310,179 | $ | 265,622 | $ | 221,632 | ||||||
| International |
30,217 | 22,548 | 18,720 | |||||||||
|
|
|
|
|
|
|
|||||||
| Total net sales |
$ | 340,396 | $ | 288,170 | $ | 240,352 | ||||||
|
|
|
|
|
|
|
|||||||
Note 15. Related Party Transactions
Shared Services Agreement
On November 27, 2013, Vince, LLC entered into the Shared Services Agreement with Kellwood pursuant to which Kellwood provides support services in various operational areas including, among other things, e-commerce operations, distribution, logistics, information technology, accounts payable, credit and collections and payroll and benefits.
The Shared Services Agreement may be modified or supplemented to include new services under terms and conditions to be mutually agreed upon in good faith by the parties. The fees for all services received by Vince, LLC from Kellwood, including any new services mutually agreed upon by the parties, will be at cost. Such costs shall be the full amount of any and all actual and direct out-of-pocket expenses (including base salary and wages but without providing for any margin of profit or allocation of depreciation or amortization expense) incurred by the service provider or its affiliates in connection with the provision of the services.
We may terminate any or all of the services at any time for any reason (with or without cause) upon giving Kellwood the required advance notice for termination for that particular service. Additionally, the provision of the following services, which are services which require a term as a matter of law and services which are based on a third-party agreement with a set term, shall terminate automatically upon the related date specified on the schedules to the Shared Services Agreement: Building Services NY; Tax; and Compensation & Benefits. If no specific notice requirement has been provided, 90 days prior written notice shall be required to be given. Upon the termination of certain services, Kellwood may no longer be in a position to provide certain other related services. Kellwood must notify us within 10 days following our request to terminate any services if they will no longer be able to provide other related services. Assuming we proceed with our request to terminate the original services, such related services shall also be terminated in connection with such termination.
We are invoiced by Kellwood monthly for these amounts and generally be required to pay within 15 business days of receiving such invoice. The payments will be trued-up and can be disputed once each fiscal quarter. As of January 31, 2015, we have recorded $753 in other accrued expenses to recognize amounts payable to Kellwood under the Shared Services Agreement.
Tax Receivable Agreement
Vince Holding Corp. entered into the Tax Receivable Agreement with the Pre-IPO Stockholders on November 27, 2013. We and our former subsidiaries generated certain tax benefits (including NOLs and tax credits) prior to the Restructuring Transactions consummated in connection with our IPO and will generate certain section 197 intangible deductions (the “Pre-IPO Tax Benefits”), which would reduce the actual liability
F-32
Table of Contents
for taxes that we might otherwise be required to pay. The Tax Receivable Agreement provides for payments to the Pre-IPO Stockholders in an amount equal to 85% of the aggregate reduction in taxes payable realized by us and our subsidiaries from the utilization of the Pre-IPO Tax Benefits (the “Net Tax Benefit”).
For purposes of the Tax Receivable Agreement, the Net Tax Benefit equals (i) with respect to a taxable year, the excess, if any, of (A) our liability for taxes using the same methods, elections, conventions and similar practices used on the relevant company return assuming there were no Pre-IPO Tax Benefits over (B) our actual liability for taxes for such taxable year (the “Realized Tax Benefit”), plus (ii) for each prior taxable year, the excess, if any, of the Realized Tax Benefit reflected on an amended schedule applicable to such prior taxable year over the Realized Tax Benefit reflected on the original tax benefit schedule for such prior taxable year, minus (iii) for each prior taxable year, the excess, if any, of the Realized Tax Benefit reflected on the original tax benefit schedule for such prior taxable year over the Realized Tax Benefit reflected on the amended schedule for such prior taxable year; provided, however, that to extent any of the adjustments described in clauses (ii) and (iii) were reflected in the calculation of the tax benefit payment for any subsequent taxable year, such adjustments shall not be taken into account in determining the Net Tax Benefit for any subsequent taxable year.
While the Tax Receivable Agreement is designed with the objective of causing our annual cash costs attributable to federal, state and local income taxes (without regard to our continuing 15% interest in the Pre-IPO Tax Benefits) to be the same as that which we would have paid had we not had the Pre-IPO Tax Benefits available to offset our federal, state and local taxable income, there are circumstances in which this may not be the case. In particular, the Tax Receivable Agreement provides that any payments by us thereunder shall not be refundable. In that regard, the payment obligations under the Tax Receivable Agreement differ from a payment of a federal income tax liability in that a tax refund would not be available to us under the Tax Receivable Agreement even if we were to incur a net operating loss for federal income tax purposes in a future tax year. Similarly, the Pre-IPO Stockholders will not reimburse us for any payments previously made if any tax benefits relating to such payments are subsequently disallowed, although the amount of any such tax benefits subsequently disallowed will reduce future payments (if any) otherwise owed to such Pre-IPO Stockholders. In addition, depending on the amount and timing of our future earnings (if any) and on other factors including the effect of any limitations imposed on our ability to use the Pre-IPO Tax Benefits, it is possible that all payments required under the Tax Receivable Agreement could become due within a relatively short period of time following consummation of our IPO.
If we had not entered into the Tax Receivable Agreement, we would be entitled to realize the full economic benefit of the Pre-IPO Tax Benefits to the extent allowed by federal, state and local law. The Tax Receivable Agreement is designed with the objective of causing our annual cash costs attributable to federal, state and local income taxes (without regard to our continuing 15% interest in the Pre-IPO Tax Benefits) to be the same as we would have paid had we not had the Pre-IPO Tax Benefits available to offset our federal, state and local taxable income. As a result, stockholders who purchased shares in the IPO are not entitled to the economic benefit of the Pre-IPO Tax Benefits that would have been available if the Tax Receivable Agreement were not in effect, except to the extent of our continuing 15% interest in the Pre-IPO Benefits.
Additionally, the payments we make to the Pre-IPO Stockholders under the Tax Receivable Agreement are not expected to give rise to any incidental tax benefits to us, such as deductions or an adjustment to the basis of our assets.
An affiliate of Sun Capital may elect to terminate the Tax Receivable Agreement upon the occurrence of a Change of Control (as defined below). In connection with any such termination, we are obligated to pay the present value (calculated at a rate per annum equal to LIBOR plus 200 basis points as of such date) of all remaining Net Tax Benefit payments that would be required to be paid to the Pre-IPO Stockholders from such termination date, applying the valuation assumptions set forth in the Tax Receivable Agreement (the “Early Termination Period”). “Change of control,” as defined in the Tax Receivable Agreement shall mean an event or series of events by which (i) Vince Holding Corp. shall cease directly or indirectly to own 100% of the capital
F-33
Table of Contents
stock of Vince, LLC; (ii) any “person” or “group” (as such terms are used in Section 13(d) and 14(d) of the Exchange Act), other than one or more permitted investors, shall be the “beneficial owner” (as defined in Rules 13d-3 and 13d-5 under the Exchange Act) of capital stock having more, directly or indirectly, than 35% of the total voting power of all outstanding capital stock of Vince Holding Corp. in the election of directors, unless at such time the permitted investors are direct or indirect “beneficial owners” (as so defined) of capital stock of Vince Holding Corp. having a greater percentage of the total voting power of all outstanding capital stock of Vince Holding Corp. in the election of directors than that owned by each other “person” or “group” described above; (iii) for any reason whatsoever, a majority of the board of directors of Vince Holding Corp. shall not be continuing directors; or (iv) a “Change of Control” (or comparable term) shall occur under (x) any term loan or revolving credit facility of Vince Holding Corp. or its subsidiaries or (y) any unsecured, senior, senior subordinated or subordinated indebtedness of Vince Holding Corp. or its subsidiaries, if, in each case, the outstanding principal amount thereof is in excess of $15,000. We may also terminate the Tax Receivable Agreement by paying the Early Termination Payment to the Pre-IPO Stockholders. Additionally, the Tax Receivable Agreement provides that in the event that we breach any material obligations under the Tax Receivable Agreement by operation of law as a result of the rejection of the Tax Receivable Agreement in a case commenced under the Bankruptcy Code, then the Early Termination Payment plus other outstanding amounts under the Tax Receivable Agreement shall become due and payable.
The Tax Receivable Agreement will terminate upon the earlier of (i) the date all such tax benefits have been utilized or expired, (ii) the last day of the tax year including the tenth anniversary of the IPO Restructuring Transactions and (iii) the mutual agreement of the parties thereto, unless earlier terminated in accordance with the terms thereof.
As of January 31, 2015, our obligation under the Tax Receivable Agreement was $168,932, which has a remaining term of nine years. The obligation was originally recorded in connection with the IPO as an adjustment to additional paid-in capital on our Consolidated Balance Sheet. Approximately $22,869 is recorded as a component of other accrued expenses and $146,063 as other liabilities on our Consolidated Balance Sheet as of January 31, 2015. During fiscal year 2014, we adjusted the obligation under the Tax Receivable Agreement in connection with the filing of our 2013 income tax returns. The return to provision adjustment resulted in a net reduction of $818 to the pre-IPO deferred tax assets and a net reduction of $1,442 to the liability under the Tax Receivable Agreement with the corresponding net increase of $624 accounted for as an adjustment to additional paid in-capital. In addition, we made our first tax benefit payment with respect to the 2013 taxable year of $3,199 including accrued interest which was paid during the fourth quarter of fiscal 2014. The tax benefit payment with respect to the 2014 taxable year totaling approximately $22,869 plus accrued interest is expected to be paid in the fourth quarter of 2015.
Transfer Agreement
On November 27, 2013, Kellwood and Vince Intermediate Holding, LLC entered into a transfer agreement (the “Transfer Agreement”). Pursuant to the terms of the Transfer Agreement, the following transactions occurred:
| • | Kellwood distributed the Vince, LLC equity interests to Vince Intermediate Holding, LLC in exchange for a $341,500 promissory note issued by Vince Intermediate Holding, LLC (the “Kellwood Note Receivable”). |
| • | Vince Intermediate Holding, LLC immediately repaid the Kellwood Note Receivable in full using approximately $172,000 of net proceeds from the IPO along with $169,500 of net borrowings under the new Term Loan Facility. Using the proceeds from the repayment of the Kellwood Note Receivable, after giving effect to the contribution of $70,100 of indebtedness under the Sun Term Loan Agreements to the capital of Vince Holding Corp. by affiliates of Sun Capital, Kellwood repaid and discharged the indebtedness outstanding under its revolving credit facility and the Sun Term Loan Agreements, and redeemed all of its issued and outstanding 12.875% Notes. Kellwood also redeemed $38,100 aggregate |
F-34
Table of Contents
| principal amount of its 7.125% Notes, at par pursuant to a tender offer. In addition, Kellwood also used such proceeds to pay certain restructuring fees to Sun Capital Management. Kellwood also paid a debt recovery bonus of $6,000 to our Chief Executive Officer. |
| • | Kellwood refinanced its Wells Fargo Facility to, among other things, release Vince, LLC as a guarantor or obligor thereunder. |
In accordance with the terms of the Transfer Agreement, Kellwood has agreed to indemnify us for any losses which we may suffer, sustain or become subject to, relating to the Kellwood business or in connection with any contract contributed to us by Kellwood which is not by its terms permitted to be assigned. Kellwood has also agreed to indemnify us for any losses associated with its failure to satisfy its obligations under the Transfer Agreement with respect to the repayment, repurchase, discharge or refinancing of certain of its indebtedness, as described in the immediately prior paragraph (including with respect to the removal of Vince, LLC as an obligor or guarantor under its refinanced revolving credit facility). Additionally, Vince Intermediate Holding, LLC has agreed to indemnify Kellwood against any losses which Kellwood may suffer, sustain or become subject to relating to the Vince business. The parties also agreed, upon the request of either the other party to, without further consideration, execute and deliver, or cause to be executed and delivered, such other instruments of conveyance, transfer, assignment and confirmation, and shall take or cause to be taken, such further or other actions as the other party may deem necessary or desirable to carry out the intent and purpose of the Transfer Agreement and give effect to the transactions contemplated thereby.
Kellwood Note Receivable
Vince Intermediate Holding, LLC issued the Kellwood Note Receivable in the aggregate principal amount of $341,500 to Kellwood Company, LLC on November 27, 2013, immediately prior to the consummation of our IPO. Vince Intermediate Holding, LLC repaid the Kellwood Note Receivable on the same day, using net proceeds from our IPO and net borrowings under the Term Loan Facility. No interest accrued under the Kellwood Note Receivable as the Kellwood Note Receivable was repaid on the date of issuance.
Debt Recovery Bonus to Our Chief Executive Officer
Our CEO received a debt recovery bonus of $6,000 (which included $440 of a prior unpaid debt recovery bonus) in connection with the repayment of certain Kellwood indebtedness, calculated as 4.4% of the related debt recovery, on November 27, 2013. Kellwood used proceeds from the repayment of the Kellwood Note Receivable to pay this bonus to our CEO at the closing of our IPO.
Earnout Agreement
In connection with the acquisition of the Vince business, Kellwood entered into an earnout agreement with CRL Group (former owners of the Vince business) providing for contingent earnout payments as additional consideration for the purchase of substantially all of the assets and properties of CRL Group (the “Earnout Agreement”). The Earnout Agreement provides for the payment of contingent annual earnout payments to CRL Group for five periods between 2007 and 2011, with the contingent amounts earned based on the amount of net sales and gross margin in each such period. The Earnout Agreement also provides for a cumulative contingent payment based on the amount of net sales during the Earnout Agreement period. Kellwood made payments under the Earnout Agreement of $806 during fiscal 2012 and no payments were made during fiscal 2014 and fiscal 2013.
Certain Indebtedness to Affiliates of Sun Capital
We had substantial indebtedness owed to affiliates of Sun Capital after giving effect to the acquisition of Kellwood Company by affiliates of Sun Capital Partners, Inc. in February 2008 under the Sun Promissory Notes
F-35
Table of Contents
and Sun Capital Loan Agreement (as defined in Note 7). Subsequent to 2008, Kellwood Company made borrowings under the Sun Term Loan Agreements (as defined in Note 3) to fund negative cash flows of the non-Vince business. All amounts owed by Vince Holding Corp. under these agreements were discharged as of February 1, 2014, as further discussed below.
On December 28, 2012, Sun Kellwood Finance waived all interest capitalized and accrued under the Sun Promissory notes prior to July 19, 2012. Additionally, Sun Kellwood Finance and SCSF Finance waived all interest capitalized and accrued under the Sun Capital Loan Agreement prior to July 19, 2012. As all parties were under the common control of affiliates of Sun Capital, both transactions resulted in capital contributions of $270,852 and $18,249 for the Sun Promissory Notes and Sun Capital Loan Agreement, respectively. The capital contributions were recorded as adjustments to additional paid in capital on our Consolidated Balance Sheet as of February 2, 2013. These transactions had no significant income tax consequences. The remaining principal and capitalized PIK interest owed under these agreements of $391,434 were reported within long-term debt on the Consolidated Balance Sheet as of February 2, 2013.
On June 18, 2013, Sun Kellwood Finance and SCSF Finance assigned all title and interest in both the Sun Promissory Notes and note under our Sun Capital Loan Agreement to Sun Cardinal, LLC. Immediately following the assignment of these notes, Sun Cardinal contributed all outstanding principal and interest due under these notes as of June 18, 2013 to the capital of Vince Holding Corp. As all parties were under the common control of Sun Capital at such time, these transactions were recorded in the second quarter of fiscal 2013 as increases to Vince Holding Corp.’s additional paid in capital in the amounts of $334,595 and $72,932 for the Sun Promissory Notes and Sun Capital Loan Agreement, respectively. As a result, Vince Holding Corp. has been discharged of all obligations under both agreements. See Note 7. Immediately prior to the Restructuring Transactions, affiliates of Sun Capital contributed $38,683 of principal under the Sun Term Loan Agreements to the capital of Kellwood Company.
On November 27, 2013, subsequent to the closing of the IPO and in connection with the Restructuring Transactions, all remaining debt obligations to affiliates of Sun Capital under the Sun Term Loan Agreements were retained by Kellwood Company, amounting to $83,355 (including accrued interest). Kellwood Company immediately discharged all obligations under these agreements through the application of a portion of the Kellwood Note Receivable proceeds. See Note 3.
Management Services Agreement
In connection with the acquisition of Kellwood Company by affiliates of Sun Capital in 2008, Sun Capital Partners Management V, LLC, an affiliate of Sun Capital, entered into the Management Services Agreement (the “Management Services Agreement”) with Kellwood Company. Under this agreement, Sun Capital Management provided Kellwood Company with consulting and advisory services, including services relating to financing alternatives, financial reporting, accounting and management information systems. In exchange, Kellwood Company reimbursed Sun Capital Management for reasonable out-of-pocket expenses incurred in connection with providing consulting and advisory services, additional and customary and reasonable fees for management consulting services provided in connection with corporate events, and also paid an annual management fee equal to $2,200 which was prepaid in equal quarterly installments, a portion of which was charged to the Vince business. We reported $79, $404 and $779 for management fees to Sun Capital in other expense, net, in the Consolidated Statements of Operations for fiscal 2014, fiscal 2013, and fiscal 2012, respectively. The remaining fees charged to the non-Vince businesses of $1,537, and $1,668 are included within net loss from discontinued operations in the Consolidated Statements of Operations for fiscal 2013 and fiscal 2012, respectively.
Upon the consummation of certain corporate events involving Kellwood Company or its direct or indirect subsidiaries, Kellwood Company was required to pay Sun Capital Management a transaction fee in an amount equal to 1% of the aggregate consideration paid to or by Kellwood Company and any of its direct or indirect subsidiaries or stockholders. We incurred no material transaction fees payable to Sun Capital Management during all periods presented on the Consolidated Statement of Operations.
F-36
Table of Contents
On November 27, 2013, in connection with the closing of the IPO and Restructuring Transactions, VHC was released from the terms of the Management Services Agreement between Kellwood Company and Sun Capital Management.
Sun Capital Consulting Agreement
On November 27, 2013, we entered into an agreement with Sun Capital Management to (i) reimburse Sun Capital Management or any of its affiliates providing consulting services under the agreement for out-of-pocket expenses incurred in providing consulting services to us and (ii) provide Sun Capital Management with customary indemnification for any such services.
The agreement is scheduled to terminate on the tenth anniversary of our IPO (i.e. November 27, 2023). Under the consulting agreement, we have no obligation to pay Sun Capital Management or any of its affiliates any consulting fees other than those which are approved by a majority of our directors that are not affiliated with Sun Capital. To the extent such fees are approved in the future, we will be obligated to pay such fees in addition to reimbursing Sun Capital Management or any of its affiliates that provide us services under the consulting agreement for all reasonable out-of-pocket fees and expenses incurred by such party in connection with the provision of consulting services under the consulting agreement and any related matters. Reimbursement of such expenses shall not be conditioned upon the approval of a majority of our directors that are not affiliated with Sun Capital Management, and shall be payable in addition to any fees that such directors may approve.
Neither Sun Capital Management nor any of its affiliates are liable to us or our affiliates, security holders or creditors for (1) any liabilities arising out of, related to, caused by, based upon or in connection with the performance of services under the consulting agreement, unless such liability is proven to have resulted directly and primarily from the willful misconduct or gross negligence of such person or (2) pursuing any outside activities or opportunities that may conflict with our best interests, which outside activities we consent to and approve under the consulting agreement, and which opportunities neither Sun Capital Management nor any of its affiliates will have any duty to inform us of. In no event will the aggregate of any liabilities of Sun Capital Management or any of its affiliates exceed the aggregate of any fees paid under the consulting agreement.
In addition, we are required to indemnify Sun Capital Management, its affiliates and any successor by operation of law against any and all liabilities, whether or not arising out of or related to such party’s performance of services under the consulting agreement, except to the extent proven to result directly and primarily from such person’s willful misconduct or gross negligence. We are also required to defend such parties in any lawsuits which may be brought against such parties and advance expenses in connection therewith. In the case of affiliates of Sun Capital Management that have rights to indemnification and advancement from affiliates of Sun Capital, we agree to be the indemnitor of first resort, to be liable for the full amounts of payments of indemnification required by any organizational document of such entity or any agreement to which such entity is a party, and that we will not make any claims against any affiliates of Sun Capital Partners for contribution, subrogation, exoneration or reimbursement for which they are liable under any organizational documents or agreement. Sun Capital Management may, in its sole discretion, elect to terminate the consulting agreement at any time. We may elect to terminate the consulting agreement if SCSF Cardinal, Sun Cardinal or any of their respective affiliates’ aggregate ownership of our equity securities falls below 30%.
Indemnification Agreements
We entered into indemnification agreements with each of our executive officers and directors on November 27, 2013. The indemnification agreements provide the executive officers and directors with contractual rights to indemnification, expense advancement and reimbursement, to the fullest extent permitted under the DGCL.
F-37
Table of Contents
Amended and Restated Certificate of Incorporation
Our amended and restated certificate of incorporation provides that for so long as affiliates of Sun Capital own 30% or more of our outstanding shares of common stock, Sun Cardinal, a Sun Capital affiliate, has the right to designate a majority of our board of directors. For so long as Sun Cardinal has the right to designate a majority of our board of directors, the directors designated by Sun Cardinal are expected to constitute a majority of each committee of our board of directors (other than the Audit Committee), and the chairman of each of the committees (other than the Audit Committee) is expected to be a director serving on the committee who is selected by affiliates of Sun Capital, provided that, at such time as we are not a “controlled company” under the NYSE corporate governance standards, our committee membership will comply with all applicable requirements of those standards and a majority of our board of directors will be “independent directors,” as defined under the rules of the NYSE, subject to any applicable phase in requirements.
Note 16. Quarterly Financial Information (unaudited)
Summarized quarterly financial results for fiscal 2014 and fiscal 2013 (in thousands, except per share data):
| First Quarter |
Second Quarter |
Third Quarter |
Fourth Quarter |
|||||||||||||
| Fiscal 2014: |
||||||||||||||||
| Net sales |
$ | 53,452 | $ | 89,326 | $ | 102,947 | $ | 94,671 | ||||||||
| Gross profit |
26,411 | 44,014 | 50,648 | 45,756 | ||||||||||||
| Net income from continuing operations |
1,384 | 10,501 | 13,311 | 10,527 | ||||||||||||
| Net loss from discontinued operations, net of tax |
— | — | — | — | ||||||||||||
| Net income |
1,384 | 10,501 | 13,311 | 10,527 | ||||||||||||
| Basic earnings per share (1): |
||||||||||||||||
| Basic earnings per share from continuing operations |
$ | 0.04 | $ | 0.29 | $ | 0.36 | $ | 0.29 | ||||||||
| Basic loss per share from discontinued operations |
$ | — | $ | — | $ | — | $ | — | ||||||||
| Diluted earnings per share (1): |
||||||||||||||||
| Diluted earnings per share from continuing operations |
$ | 0.04 | $ | 0.27 | $ | 0.35 | $ | 0.28 | ||||||||
| Diluted loss per share from discontinued operations |
$ | — | $ | — | $ | — | $ | — | ||||||||
| Fiscal 2013: |
||||||||||||||||
| Net sales |
$ | 40,363 | $ | 74,294 | $ | 85,755 | $ | 87,758 | ||||||||
| Gross profit |
17,513 | 33,638 | 41,723 | 40,142 | ||||||||||||
| Net (loss) income from continuing operations |
(9,779 | ) | 8,395 | 16,468 | 8,311 | |||||||||||
| Net loss from discontinued operations, net of tax |
(5,330 | ) | (18,929 | ) | (18,827 | ) | (7,729 | ) | ||||||||
| Net (loss) income |
(15,109 | ) | (10,534 | ) | (2,359 | ) | 582 | |||||||||
| Basic earnings (loss) per share (1): |
||||||||||||||||
| Basic (loss) earnings per share from continuing operations |
$ | (0.37 | ) | $ | 0.32 | $ | 0.63 | $ | 0.24 | |||||||
| Basic loss per share from discontinued operations |
$ | (0.21 | ) | $ | (0.72 | ) | $ | (0.72 | ) | $ | (0.22 | ) | ||||
| Diluted earnings (loss) per share (1): |
||||||||||||||||
| Diluted (loss) earnings per share from continuing operations |
$ | (0.37 | ) | $ | 0.32 | $ | 0.62 | $ | 0.24 | |||||||
| Diluted loss per share from discontinued operations |
$ | (0.21 | ) | $ | (0.72 | ) | $ | (0.71 | ) | $ | (0.22 | ) | ||||
| (1) | The sum of the quarterly earnings per share may not equal the full-year amount as the computation of weighted-average number of shares outstanding for each quarter and the full-year are performed independently. |
F-38
Table of Contents
VALUATION AND QUALIFYING ACCOUNTS
(In thousands)
| Beginning of Period |
Expenses Charges, net of Reversals |
Deductions and Write-offs net of Recoveries |
End of Period |
|||||||||||||
| Sales Allowances |
||||||||||||||||
| Fiscal 2014 |
$ | (9,265 | ) | $ | (54,467 | ) | $ | 47,634 | $ | (16,098 | ) | |||||
| Fiscal 2013 |
(7,179 | ) | (39,171 | ) | 37,085 | (9,265 | ) | |||||||||
| Fiscal 2012 |
(4,347 | ) | (29,400 | ) | 26,568 | (7,179 | ) | |||||||||
| Allowance for Doubtful Accounts |
||||||||||||||||
| Fiscal 2014 |
(353 | ) | (168 | ) | 142 | (379 | ) | |||||||||
| Fiscal 2013 |
(279 | ) | (249 | ) | 175 | (353 | ) | |||||||||
| Fiscal 2012 |
(450 | ) | (314 | ) | 485 | (279 | ) | |||||||||
| Valuation Allowances on Deferred Income Taxes |
||||||||||||||||
| Fiscal 2014 |
(1,843 | ) | — | 769 | (1,074 | ) | ||||||||||
| Fiscal 2013 |
(64,767 | ) | (78,855 | ) | 141,779 | (a) | (1,843 | ) | ||||||||
| Fiscal 2012 |
$ | (49,933 | ) | $ | (28,362 | ) | $ | 13,528 | $ | (64,767 | ) | |||||
| (a) | The reduction in the Valuation Allowance on Deferred Income Taxes recorded in Fiscal 2013 includes $127,833 that was recognized as in increase to additional paid-in capital in Stockholders’ Equity. |
F-39