Attached files
| file | filename |
|---|---|
| EX-3.1(C) - EXHIBIT 3.1(C) - MAGNETEK, INC. | magdec201410kex31c.htm |
| EXCEL - IDEA: XBRL DOCUMENT - MAGNETEK, INC. | Financial_Report.xls |
| EX-31.1 - EXHIBIT 31.1 - MAGNETEK, INC. | magdec201410kex311.htm |
| EX-21.1 - EXHIBIT 21.1 - MAGNETEK, INC. | magdec201410kex211.htm |
| EX-32.1 - EXHIBIT 32.1 - MAGNETEK, INC. | magdec201410kex321.htm |
| EX-23.1 - EXHIBIT 23.1 - MAGNETEK, INC. | magdec201410kex231.htm |
| EX-31.2 - EXHIBIT 31.2 - MAGNETEK, INC. | magdec201410kex312.htm |
UNITED STATES SECURITIES AND EXCHANGE COMMISSION
Washington, D.C. 20549
FORM 10-K
(Mark One) | |
[ X ] | ANNUAL REPORT PURSUANT TO SECTION 13 OR 15(d) OF THE SECURITIES EXCHANGE ACT OF 1934 |
For the fiscal year ended December 28, 2014 | |
OR | |
[ ] | TRANSITION REPORT PURSUANT TO SECTION 13 OR 15(d) OF THE SECURITIES EXCHANGE ACT OF 1934 |
Commission file number 1-10233
MAGNETEK, INC.
(Exact name of Registrant as specified in its charter)
DELAWARE | 95-3917584 | |
(State or other jurisdiction of incorporation or organization) | (I.R.S. Employer Identification No.) | |
N49 W13650 Campbell Drive Menomonee Falls, Wisconsin | 53051 | |
(Address of Principal Executive Offices) | (Zip Code) | |
Registrant’s telephone number, including area code: (262) 783-3500
Securities registered pursuant to Section 12(b) of the Act:
Title of each class | Name of each exchange on which registered |
Common Stock, $.01 par value | The NASDAQ Global Market |
Securities registered pursuant to Section 12(g) of the Act: None
Indicate by check mark if the registrant is a well known seasoned issuer, as defined in Rule 405 of the Securities Act. | Yes [ ] | No [X] |
Indicate by check mark if the registrant is not required to file reports pursuant to Section 13 or Section 15(d) of the Act. | Yes [ ] | No [X] |
Indicate by check mark whether the registrant (1) has filed all reports required to be filed by Section 13 or 15(d) of the Securities Exchange Act of 1934 during the preceding 12 months (or for such shorter period that the registrant was required to file such reports), and (2) has been subject to such filing requirements for the past 90 days. | Yes [X] | No [ ] |
Indicate by check mark whether the registrant has submitted electronically and posted on its corporate Web site, if any, every Interactive Data File required to be submitted and posted pursuant to Rule 405 of Regulation S-T (§232.405 of this chapter) during the preceding 12 months (or for such shorter period that the registrant was required to submit and post such files). | Yes [ X ] | No [ ] |
Indicate by check mark if disclosure of delinquent filers pursuant to Item 405 of Regulation S-K is not contained herein, and will not be contained, to the best of registrant’s knowledge, in definitive proxy or information statements incorporated by reference in Part III of this Form 10-K or any amendment to this Form 10-K. | [X] | |
Indicate by check mark whether the registrant is a large accelerated filer, an accelerated filer, a non-accelerated filer, or a smaller reporting company. See definition of “large accelerated filer,” “accelerated filer”, and “smaller reporting company” in Rule 12b-2 of the Exchange Act. (Check one):
Large accelerated filer [ ] | Accelerated filer [ ] | Non-accelerated filer [ ] | Smaller reporting company [ X ] | ||||
Indicate by check mark whether the registrant is a shell company (as defined in Rule 12b-2 of the Exchange Act). | Yes [ ] | No [X] | |||||
The aggregate market value of the voting stock held by non-affiliates of the registrant, based on the closing price of $23.65 per share as reported by the NASDAQ Stock Market, on June 27, 2014 (the last business day of the Company’s most recently completed second fiscal quarter), was $72,768,803. Shares of common stock held by each executive officer and director have been excluded since such persons may be deemed affiliates. This determination of affiliate status is not necessarily a conclusive determination for other purposes.
The number of shares outstanding of the registrant’s Common Stock, as of February 20, 2015, was 3,534,875 shares.
DOCUMENTS INCORPORATED BY REFERENCE
Portions of the Magnetek, Inc. definitive 2015 Proxy Statement, to be filed with the Securities and Exchange Commission within 120 days after the close of the fiscal year ended December 28, 2014, are incorporated by reference into Part II and Part III of this Form 10-K.
TABLE OF CONTENTS
Page | ||
PART I | ||
Business | ||
Risk Factors | ||
Unresolved Staff Comments | ||
Properties | ||
Legal Proceedings | ||
Mine Safety Disclosures | ||
PART II | ||
Market for Registrant's Common Equity, Related Stockholder Matters and Issuer Purchases | ||
of Equity Securities | ||
Selected Financial Data | ||
Management's Discussion and Analysis of Financial Condition and Results of Operations | ||
Quantitative and Qualitative Disclosures About Market Risk | ||
Financial Statements and Supplementary Data | ||
Changes in and Disagreements with Accountants on Accounting and Financial Disclosure | ||
Controls and Procedures | ||
Other Information | ||
PART III | ||
Directors, Executive Officers and Corporate Governance | ||
Executive Compensation | ||
Security Ownership of Certain Beneficial Owners and Management and | ||
Related Stockholder Matters | ||
Certain Relationships and Related Transactions and Director Independence | ||
Principal Accountant Fees and Services | ||
PART IV | ||
Exhibits and Financial Statement Schedules | ||
Signatures | ||
2
PART I
CAUTION REGARDING FORWARD-LOOKING STATEMENTS
This Annual Report on Form 10-K, including documents incorporated herein by reference, contains forward-looking statements within the meaning of the Private Securities Litigation Reform Act of 1995. The words “believe”, “expect”, “estimate”, “anticipate”, “intend”, “may”, “might”, “will”, “would”, “could”, “project”, "objective", and “predict”, or similar words and phrases generally identify forward-looking statements. Forward-looking statements contained or incorporated by reference in this document, including those set forth in Part II, Item 7 entitled “Management’s Discussion and Analysis of Financial Condition and Results of Operations" and in Item 1 of this Annual Report on Form 10-K entitled “Business” include, but are not limited to, statements regarding our plans, objectives, goals, strategies, future events, future sales or performance, projections of revenues, income or loss, capital expenditures, plans for future operations, products or services, legal issues, financing needs or expectations, and other information that is not historical information, as well as assumptions relating to the foregoing. All forward-looking statements are based upon our current expectations, beliefs, projections, and assumptions.
Our expectations, beliefs, projections and assumptions are expressed in good faith and we believe there is a reasonable basis for them. However, there can be no assurance that our financial condition or results of operations will meet the expectations set forth in our forward-looking statements. Forward-looking statements are inherently subject to risks and uncertainties which in many cases are beyond the control of the Company and which cannot be predicted or quantified. As a result, future events and actual results could differ materially from those set forth in, contemplated by, or underlying forward-looking statements. Such risks and uncertainties include, but are not limited to, economic conditions in general, sensitivity to industry conditions, competitive factors such as technology and pricing pressures, business conditions in electronics, industrial equipment and energy markets, international sales and operations, dependence on major customers, increased material costs, risks and costs associated with acquisitions, litigation and environmental matters, and the risk that the Company’s ultimate costs of doing business exceed present estimates. A discussion of these and other specific risks is included in Part I, Item 1A. “Risk Factors” of this Annual Report on Form 10-K. Forward-looking statements contained in this Annual Report speak only as of the date of this document or, in the case of any document incorporated by reference, the date of that document. The Company does not have an obligation to publicly update or revise any forward-looking statement contained or incorporated by reference in these documents to reflect changed assumptions, the occurrence of unanticipated events, or changes to future operating results over time.
ITEM 1. BUSINESS
General
Magnetek, Inc. (“Magnetek,” the “Company,” “we,” or “us” ) is a global provider of digital power control systems that are used to control motion and power primarily in material handling, elevator, and mining applications. Magnetek is listed on the NASDAQ Global Market (NASDAQ: MAG) and was founded in 1984 as a Delaware corporation. However, certain businesses we have acquired have a long history of technical innovation that predates the founding of Magnetek. Our digital power control systems serve the needs of selected niches of traditional and emerging markets that are becoming increasingly dependent on “smart” power. Over the past ten years, we have successfully transitioned the Company from a component supplier to a provider of systems solutions. Today, much of our focus is on developing and introducing innovative electronic drive solutions that both enhance our customers' operational efficiency and save energy. Our products are sold directly or through manufacturers' representatives to original equipment manufacturers (“OEMs”) for incorporation into their products, to system integrators and value-added resellers for assembly and incorporation into end-user systems, to distributors for resale to OEMs and contractors, and to end users for repair and replacement purposes. We operate in a single segment, Digital Power Control Systems. Revenue and profit information, additional financial data, and commentary on recent financial results, which are provided in Part II, Item 7. “Management’s Discussion and Analysis of Financial Condition and Results of Operations” and in Part II, Item 8. “Financial Statements and Supplementary Data” of this Annual Report Report on Form 10-K, should be read in conjunction with this section.
We believe we are North America's largest independent supplier of digital drives, radio controls, software, and accessories for industrial cranes and hoists, and we believe we are also the largest independent supplier of digital direct current (“DC”) motion control systems for elevators. Customers include most of the industrial crane and hoist companies in North America and the world's leading elevator builders. In addition, we have a growing range of motion control products for mining equipment applications. Our operations are located in North America, predominantly in Menomonee Falls, Wisconsin, the location of our headquarters.
3
One of our primary goals is to expand our position in markets offering long-term stability, excellent growth potential, and profitability. Our focus is on markets where we can apply both our industry expertise and our systems integration model to add value to our customers by improving their productivity, throughput, energy efficiency, or safety, while reducing labor costs, downtime, and maintenance costs.
Product Offerings
Magnetek is a leading provider of innovative power control and delivery systems and solutions for overhead material handling applications used in a number of diverse industries, including aerospace, automotive, steel, aluminum, paper, logging, mining, ship loading, nuclear power plants, and heavy movable structures. We are a major supplier in North America of power and motion control systems, which include alternating current (“AC”) and DC drive systems, radio remote controls, push button pendant stations, brakes, and collision avoidance and power delivery subsystems. While we sell primarily to OEMs of overhead cranes and hoists, we spend a great deal of effort understanding the needs of end users to gain specification. We can combine our products with engineered services to provide complete customer-specific systems solutions.
Magnetek also designs, builds, sells, and supports elevator application-specific drive products that efficiently deliver power used to control motion, primarily in high-rise, high-speed elevator applications. We are recognized as an industry leader for DC high-performance elevator drives, as well as for AC drives used with low- and high-performance traction elevators, due to our extensive application expertise and product reliability. Our elevator product offerings are comprised of highly integrated subsystems and drives, sold mainly to elevator OEMs. In addition, our product options include a number of regenerative controls for both new building installations and elevator modernization projects that help building owners save energy. We estimate over 90,000 Magnetek elevator drives have been installed worldwide.
We are also a leading independent supplier of AC and DC digital motion control systems for underground coal mining equipment. Our systems are used in coal hauling vehicles, shuttle cars, scoops, and other heavy mining equipment. We estimate that nearly 11,000 Magnetek drive systems have been installed in mining equipment throughout the world.
We intend to continue to build on our competitive strengths in established material handling, elevator, and mining markets and continue to invest in research and development to expand our product portfolio aimed at penetrating growing and emerging markets for digital power-based systems.
Growth Drivers in our Served Markets
We believe that future demand for our products will be aided by certain trends that we expect to drive growth in our served markets, including the following:
Focus on Increasing Efficiency and Productivity
In response to increasingly competitive economic conditions, many manufacturers seek to increase productivity and efficiency while controlling costs, and many of our product offerings enable our customers to achieve these goals. Our variable frequency AC drive products and DC digital controls are highly reliable, operate at high speeds, and improve production output, while reducing labor and maintenance costs. Technology advancements in control products and engineering enable us to convert manual processes and systems to automated systems, providing a wide range of benefits, including labor and space savings, improved productivity, efficient material flow, more accurate positioning, and safer operation. As a result, we can demonstrate many opportunities to improve our customers' operations and provide them with quantifiable, and in many cases, significant returns on invested capital.
Modernization and Upgrade of Existing Equipment
Overhead cranes, elevators, and mining equipment represent significant investments in capital which in most cases operate under severe duty and in some cases, in harsh environments. Many of the structural components of these systems are manufactured to withstand significant mechanical forces, and to have useful lives in excess of 30 years. For example, it is not uncommon to find cranes that are more than 50 years old still operating today, or elevators or mining equipment operating with aging and inefficient power control equipment. Rather than scrap structurally sound but outdated equipment, it is often more cost-effective to modernize the equipment to meet current operational needs by upgrading the power control systems. Our current drive technology along with our application expertise can provide reduced energy consumption, greater reliability, improved throughput, lower operational costs, enhanced features, and prolonged equipment life over older drive technology. We believe our large installed base of product combined with our industry expertise provides us with opportunities to expand our business through modernization projects.
Technological advancements have resulted in a shift away from electro-mechanical control to digital power control. For example, a number of years ago, cranes relied mainly on contactors, relays, and static controls for their operation, whereas today, AC and DC drives are the preferred method of control. Improvements in drive technology have also allowed for the downsizing of power platforms and the inclusion of many high-performance features valued by the marketplace. AC power control is generally used for new installations in overhead material handling systems, elevators, and mining equipment.
4
However, DC drive solutions are also a viable alternative for existing installations that wish to retain existing DC power sources. We believe this trend will benefit us in the future as our primary core competency is in digital power control.
Conversion to Wireless Applications
Many industries, including the overhead material handling, mobile hydraulic, construction, and mining markets, are rapidly adopting remote wireless control solutions. While wireless control has been available for a number of years, technology has improved significantly in recent years, enabling enhancements that have resulted in products that are safer, more reliable, ergonomically designed, versatile, and cost-effective. Over the past several years, through both acquisition and internal development, we have invested in expanding the breadth of our wireless control product offering, which we believe will help us to meet demand, increase market share, and enter new markets in this growing field.
Systems Solutions
In an effort to reduce costs and streamline operations, many customers are recognizing increased value in consolidating purchasing requirements with suppliers who can provide increasingly integrated solutions. We benefit from this trend as we can bundle a wide breadth of products together with engineered services to provide customer-specific solutions that will result in reduced installation costs as well as lower operating and maintenance costs for our customers. In many of our served markets, we can provide turnkey service, including project evaluation, project management, installation services, field start-up, operator training, and after-sales service and systems support.
Communication and Diagnostic Features
In many electrical applications today, electronic devices controlled by microprocessors are increasingly being networked together, resulting in smart devices with greater productivity and user benefits. The benefits of this trend on control systems for industrial applications include lower installation costs, better monitoring of performance, improved integration with supervisory systems, and improved uptime. We believe the power of embedded and connected microprocessors within our power electronic devices provide a tremendous benefit for users at all levels from maintenance to production to finance.
Growing Energy Needs and Focus on Energy Efficiency
Total global energy consumption is projected to increase 30% by the year 2040 according to the U.S. Energy Information Administration ("EIA"). The vast majority of energy consumed today comes from traditional energy sources such as coal, oil, and natural gas, and the EIA projects that fossil fuels will supply nearly 80% of world energy use through 2040. Approximately 40% of the electricity used in the U.S. today comes from coal, and coal is expected to remain the leading source of global electricity generation through 2040, per the EIA. We have a wide variety of product offerings across all of our major served markets which are engineered to efficiently use available power, or which convert energy to usable power in an energy efficient manner. We have been a leading supplier of AC and DC digital motion control systems to underground coal mining equipment manufacturers for nearly 30 years. In addition, our regenerative elevator drives can provide energy savings of 25% to 45% over other elevator solutions. We also recently introduced a new line of regenerative drives for the material handling market that, when coupled with our existing motor drive technology, have the ability to provide energy savings of over 40% compared to non-regenerative solutions in the market. We believe our energy efficient product offerings have us well positioned to benefit from the expected growing demand for energy and energy efficient solutions in the future.
Safer Workplace Environments
In an effort to comply with increasing workplace safety regulations and to reduce ongoing costs associated with health insurance, workplace accidents, and workers' compensation expenses, many employers are focused on providing safer workplace environments. We offer a vast number of optional features that can further enhance workplace safety and reduce the risk of accidents and personal injury, including collision avoidance software, programmable acceleration and deceleration, and other safeguards that prevent overheating, eliminate load swing, and prevent uneven lifting.
Competitive Strengths
We believe that we benefit from competitive advantages in the following areas:
Industry Expertise and Technological Capabilities
We emphasize and leverage our ability to provide customized solutions for power and motion control applications through digital power technology. We have a long history of technical innovation and a highly skilled and experienced technical staff. Our technical personnel possess substantial expertise in disciplines central to digital power systems and applications. These include analog-to-digital circuit design, thermal management technology, and the application of microprocessors, digital signal processors, and software algorithms in the development of smart power products. We are widely recognized for our expertise in our served markets, regularly hosting training and technology seminars for customers and end users. We believe we are at the forefront of innovation in the industries we have traditionally served, continuously developing new products to provide cost-effective, value-added solutions to meet the changing needs of our customers.
5
Customer and End-User Relationships
We have established long-term relationships with major manufacturers of cranes and hoists, elevators, and mining equipment, among others. We believe that these relationships have resulted from our reliability and responsiveness, readiness to meet special customer requirements based on innovative technology and application expertise, and the quality and performance of our products, all of which ultimately adds value to our customers by improving their operations and reducing their costs.
Product Breadth and Brand Name Recognition
We provide a wide variety of products in most of our major served markets, and we are among the leaders in the U.S. in many of our served markets. For material handling customers, we serve as a one-stop source, providing a full range of AC and DC crane controls as well as subsystems, including radio controls, push button stations, motors, brakes, and power delivery products. For elevator customers, we offer both AC and DC integrated digital motion control subsystems for mid- to high-rise buildings at varying speed and performance levels. Our elevator control systems can be found in many of the world's most recognizable buildings. Over the past several years, we've introduced a number of new innovative products to further broaden our product offerings, including severe duty AC traction drives for mining applications, regenerative AC and DC drives for elevator applications, and a new generation of lower-cost AC elevator drives for mid-rise applications.
Our brand names, including Telemotive, Electromotive Systems, OmniPulse, IMPULSE, Enrange, Mondel, M-FORCE, and Quattro, are among the most known and respected in the industries we serve. We believe our strong brand name recognition enables us to retain and leverage existing customer relationships while also providing opportunities to gain market share with new customers and grow our business by entering new markets.
Large Installed Base with Proven Technology
Our many years of experience combined with leading share positions in our served markets has resulted in a significant installed base of our products operating in material handling systems, elevators, and mining equipment around the world. We believe the large installed base of our quality products not only demonstrates our technical capability and expertise, but also serves as a potential source for future business from service, repair, retrofit, and modernization opportunities. As production requirements change and existing installed equipment ages, reliability may deteriorate, resulting in reduced productivity, increased downtime, unscheduled repair costs, and safety issues. In these situations, it is often prudent to replace and upgrade power control systems with state-of-the-art controls that can meet present operational needs, enhance performance, and prolong the life of the equipment.
Sales Channels
Our sales force is comprised of a combination of direct employees, sales representatives, and distributors. Although we sell our products to OEMs, our sales and marketing efforts are also aimed at gaining end-user specification. Our sales and marketing team is focused on targeted markets, and has extensive experience and a great deal of application expertise in those markets. We believe that our well established sales network constitutes a significant competitive advantage in the North American marketplace.
Aftermarket Service and Support
We have a highly trained team of experienced service technicians dedicated to aftermarket support to provide prompt service to end users of our products, 24 hours a day, every day of the year. We believe we are able to attract and retain customers in part due to our commitment to quality, service, and customer satisfaction.
Strategy
Invest in Innovation and New Product Development
We continue to invest in research and development (“R&D”) in an effort to grow our business and remain competitive, refreshing our product offerings and developing new products and services to address the changing needs of our customers. Developing and offering a broad range of products for each of our served markets is an integral part of our strategy. We make innovative modifications to existing products in an effort to add features and special application software that improve performance. We continue to expand our bundling opportunities in material handling with our radio drive serial interface (“RDSI”). An RDSI module allows a wireless radio to communicate directly with the crane control system, providing improved diagnostic and troubleshooting information.
We believe opportunities for growth exist in available elevator markets through the expansion of the breadth of available product offerings to include additional competitive products for AC applications. We also believe opportunities for growth exist in available material handling, elevator, and mining markets through the introduction of new energy-saving product offerings. Over the past several years, we've developed an AC version of our Quattro regenerative elevator drive, and a severe duty AC traction drive for mining equipment.
6
Gain Market Share in Served Markets
Our long-standing customer relationships, sales network, and end-user relationships provide us with insights into our served markets that help us to anticipate changes in market conditions and customer requirements. We believe we can leverage our close relationships with our channel partners to grow our business by further enhancing strategic partnerships with key customers. We also believe we can use our knowledge and application expertise to increase our share in our served markets by expanding our level of sales with existing customers and by providing value-added solutions to displace our competition.
Entry into New Markets
We continue to seek to grow our business by migrating our proven technology and application expertise into new markets. Over the past several years, we've strategically allocated R&D, sales, and marketing resources to markets such as automation and mobile hydraulic in material handling and non-coal applications in mining markets in an effort to understand the dynamics and requirements of those markets. We've had success in growing our business in those markets, and will continue to look for opportunities where we believe we can take advantage of our competitive strengths to enter into and gain share in new markets.
Expand Geographically
We have leading North American market positions and derive the majority of our revenue from North American, and more specifically, U.S. customers. We believe that certain non-U.S. markets may provide us with compelling growth opportunities for our products. We also believe that, with our commitment to technological innovation and our demonstrated ability to reduce our customers' costs and improve efficiency, our business model may transfer well to markets outside the U.S. where cost-effective, high quality, reliable power solutions are also valued. In addition, certain of our customers are increasing their global footprint, which could provide us with opportunities to partner with them and service those customers locally. We intend to evaluate these opportunities, and prudently allocate sales resources to those markets outside the U.S. where we think we have the best growth prospects relative to the level of investment required to enter the market.
Generate Sufficient Cash to Fund our Growth Initiatives and our Obligations
Our business has consistently generated positive cash flow from operating activities, prior to funding pension obligations, even during periods of economic downturns by focusing on controlling our costs and effectively managing our working capital. Since January 2007, our unrestricted cash balances have increased from $7 million to nearly $10 million at the end of December 2014. During that time, we've contributed cash of approximately $94 million to our defined benefit pension plan while also experiencing some of the worst economic conditions since the 1930s. In addition, we've continued to spend approximately $3 to $4 million annually on R&D activities aimed at growing our business through innovative new product introductions and entry into new markets. We intend to continue to focus on retaining discipline in our resource allocation, controlling our costs, and effectively managing our assets. At the same time, we intend to continue to prudently invest in our business to drive future growth, in an effort to maximize our profitability and cash flow, while we reduce our pension obligation over time through contributions.
In summary, we intend to continue to pursue internal growth opportunities in our core product lines, seeking to increase our market share, enter new markets, and expand our current business model geographically. We may also selectively pursue external growth through acquisitions in our served or related markets, adding products, technology, or capabilities that complement our existing business. Our focus over the next 12 months will be directed toward aligning our resources and investments with the best growth and profit opportunities, maximizing those opportunities through new product introductions and penetration of new markets. At the same time, we'll strive to effectively manage our cost structure and our assets to optimize cash flow and profitability.
Seasonality
Our power control systems for material handling applications represented nearly 74% of our revenue in fiscal year 2014. Sales of these products tend to follow capital budgeting and spending patterns of the customer base. As a result, our revenues are generally strongest in our June and December fiscal quarters, with relatively lower revenues in our March and September fiscal quarters.
Backlog
Our backlog as of the end of fiscal 2014 was $12.7 million, comparable to our backlog of $12.8 million at the end of fiscal 2013. While we use our backlog figure as an indicator of future sales activity, we have historically had a significant amount of revenue derived from orders that are booked and shipped within the same reporting period. We expect most of the orders in our backlog to be filled during fiscal 2015.
7
Competition
Our primary competitors include: Konecranes Inc., Power Electronics International, Inc., Cattron Group International (a division of Laird Technologies), Conductix-Wampfler (a division of Delachaux Group), Control Techniques (a division of Emerson Electric), OMRON Corporation, KEB GmbH, and Fujitec. Some of these companies have substantially greater financial, marketing, and other resources, larger product portfolios, and greater global reach than us.
Suppliers and Raw Materials
Virtually all materials and components that we purchase are available from multiple suppliers. During fiscal 2014, raw material purchases accounted for approximately 75% of our total cost of sales. Production of digital power control systems depends heavily on various electronic components as well as steel and aluminum enclosures and wire harnesses. We seek to obtain competitive pricing on these raw materials by utilizing multiple suppliers and leveraging our total purchasing requirements.
Research and Development
Our research and development activities, which are conducted primarily in Menomonee Falls, Wisconsin, are directed toward developing new products, improving existing products by, among other things, adding features or reducing costs, and customizing or modifying products to meet customers’ specific needs. Total research and development expenditures were approximately $3.2 million, $3.2 million, and $3.8 million for fiscal 2014, 2013 and 2012, respectively.
Intellectual Property
Magnetek holds numerous patents, trademarks, and copyrights, and we believe that we hold or license all of the patent, trademark, copyright, and other intellectual property rights necessary to conduct our business. We generally rely upon patents, copyrights, trademarks, and trade secret laws to establish and maintain our proprietary rights in our technology and products. There can be no assurance that any of our patents, trademarks or other intellectual property rights will not be challenged, invalidated, or circumvented, or that any rights granted thereunder will provide competitive advantages to us. In addition, there can be no assurance that patents will be issued from pending patent applications filed by us, or that claims allowed on any future patents will be sufficiently broad to protect Magnetek's technology. Further, the laws of some foreign countries may not permit the protection of our proprietary rights to the same extent as do the laws of the United States. Although we believe the protection afforded by our patents, patent applications, trademarks, and copyrights have value, Magnetek's future success will depend primarily on the innovative skills, technological expertise, research and development, and management capabilities of our employees rather than on patent, copyright, and trademark protection.
International Operations
International sales accounted for $11.8 million, or 11% of our net sales, while domestic sales were $97.9 million, or 89% of our net sales in fiscal year 2014. We define international sales as sales of products manufactured by our facilities outside the U.S. that are sold outside of the U.S., as well as sales of products manufactured in the U.S. sold to purchasers outside of the U.S. International sales accounted for $11.3 million, or 11% of our net sales, while domestic sales were $92.0 million, or 89% of our net sales, in fiscal 2013. International sales accounted for $13.9 million, or 12% of our net sales, while domestic sales were $100.4 million, or 88% of our net sales in fiscal year 2012. We hold assets in Canada and the United Kingdom totaling $6.5 million, of which $4.4 million are held in Canada and $2.1 million are in the United Kingdom.
Employee Relations
As of February 20, 2015, we had 130 salaried employees and 188 hourly employees, none of whom were covered by collective bargaining agreements with unions. We believe that our relationships with our employees are favorable.
Available Information
Our Internet website address is www.magnetek.com. Our annual reports on Form 10-K, quarterly reports on Form 10-Q, current reports on Form 8-K, and any amendments to these reports that are filed by the Company with the Securities and Exchange Commission (SEC) pursuant to Section 13(a) or 15(d) of the Securities Exchange Act of 1934 are available free of charge at or through our website.
8
Environmental Matters
From time to time, Magnetek has taken action to bring certain facilities associated with previously owned businesses into compliance with applicable environmental laws and regulations. Upon the subsequent sale of certain businesses, we agreed to indemnify the buyers against environmental claims associated with the divested operations, subject to certain conditions and limitations. Remediation activities, including those related to our indemnification obligations, did not involve material expenditures during fiscal 2014, fiscal 2013, or in fiscal year 2012.
We have been identified by the United States Environmental Protection Agency and certain state agencies as a potentially responsible party for cleanup costs associated with alleged past waste disposal practices at several previously utilized, owned or leased facilities and offsite locations. Our remediation activities as a potentially responsible party were not material in fiscal 2014, fiscal 2013, or in fiscal year 2012. Although the materiality of future expenditures for environmental activities may be affected by the level and type of contamination, the extent and nature of cleanup activities required by governmental authorities, the nature of our alleged connection to the contaminated sites, the number and financial resources of other potentially responsible parties, the availability of indemnification rights against third parties and the identification of additional contaminated sites, our estimated share of liability, if any, for environmental remediation, including our indemnification obligations, is not expected to be material.
For a discussion of environmental-related litigation matters in which we are engaged, please refer to Item 3 - “Legal Proceedings” of this Annual Report on Form 10-K.
Supplemental Information-Executive Officers of the Company
The following table sets forth certain information regarding the current executive officers of the Company, each of whom serves a one-year term of office, as appointed by the Board of Directors.
Name | Age | Position | ||
Peter M. McCormick | 54 | Director, President and Chief Executive Officer | ||
Marty J. Schwenner | 54 | Vice President, Chief Financial Officer | ||
Scott S. Cramer | 62 | Vice President, General Counsel and Corporate Secretary | ||
Michael J. Stauber | 41 | Vice President, Corporate Controller | ||
Hungsun S. Hui | 52 | Vice President, Operations | ||
Peter McCormick has been President and Chief Executive Officer of Magnetek since October 2008. Prior to that, Mr. McCormick served as Chief Operating Officer of Magnetek since November 2006 and served as the Executive Vice President responsible for the Company's power control systems group since 2002. Prior to that, he served as the President of the Company’s industrial controls group from 1999 until 2002. Since joining the Company in 1993, Mr. McCormick has also served as the Vice President of Operations for the Company’s drives group from 1998 until 1999 and as Vice President of the custom products business group from 1996 until 1998.
Marty Schwenner has been Chief Financial Officer of Magnetek since November 2006. Mr. Schwenner has served as a Vice President of the Company since 2003 and was Controller of the Company from 2002 until November 2006. Mr. Schwenner was Vice President of Finance for the Company’s power electronics group from 1998 until 2002. Mr. Schwenner also served as the Chief Financial Officer of the Company's European operations from 1992 to 1998 and as Internal Audit Manager from 1991 until 1992. Mr. Schwenner joined Magnetek as an Internal Auditor in 1989. Mr. Schwenner is a Certified Public Accountant and a Certified Internal Auditor.
Scott Cramer has been Vice President, General Counsel and Corporate Secretary of Magnetek since March 2010. Prior to joining Magnetek, Mr. Cramer served as Senior Vice President and General Counsel with Bucyrus International, Inc. in South Milwaukee, WI from 2006 until 2010. From 2005 to 2006, Mr. Cramer was Senior Legal Counsel with Regal Beloit Corporation following private practice from 2004 to 2005. Mr. Cramer served as Vice President, General Counsel and Secretary from 1997 until 2004 with Superior Services, Inc. following his tenure with Browning-Ferris Industries in Houston, TX and Utrecht, The Netherlands, where he served respectively as Senior Counsel and EMEA General Counsel from 1984 to 1997.
9
Michael Stauber has been Vice President, Corporate Controller since February 2011. Prior to that, Mr. Stauber served as Operations Controller for the Company since November 2007 and prior thereto served as Finance Manager of the Company’s Power Control Division since joining the Company in December 2004. Prior to joining Magnetek, from August 1995 to December 2004, Mr. Stauber was with Rockwell Automation in a variety of financial roles of increasing responsibility.
Hungsun Hui has served as Vice President, Operations since February 2001. Mr. Hui previously held the positions of Magnetek’s Vice President, Engineering from June 1999 to January 2001, and Magnetek’s Director of Advance Manufacturing from March 1998 to June 1999. Prior to joining Magnetek, from June 1985 to February 1998, Mr. Hui was with Rockwell Automation in a variety of operational roles of increasing responsibility.
10
ITEM 1A. RISK FACTORS
Our future results of operations and the other forward-looking statements contained in this Annual Report on Form 10-K, including the section titled “Management’s Discussion and Analysis of Financial Condition and Results of Operations” under Item 7, involve a number of risks and uncertainties. In particular, the statements regarding future goals and strategies, opportunities for growth in certain markets, new product introductions, penetration of new markets, projections of sales revenues, manufacturing costs and operating costs, pricing of our products and raw materials required to manufacture our products, gross margin expectations, relocation and outsourcing of production capacity, capital spending, research and development expenses, the outcome of pending legal proceedings and environmental matters, tax rates, sufficiency of funds to meet our needs including contributions to our defined benefit pension plan, and our plans for future operations, as well as our assumptions relating to the foregoing, are all subject to risks and uncertainties.
A number of other factors could cause our actual results to differ materially from our expectations. We are subject to all of the business risks facing public companies, including business cycles and trends in the general economy, financial market conditions, demand variations and volatility, potential loss of key personnel, supply chain disruptions, government legislation and regulation, and natural causes. The following list of risk factors is not all-inclusive. Other factors and unanticipated events could adversely affect our financial position or results of operations. We believe that the most significant potential risk factors that could adversely impact us are the following:
Economic conditions, primarily in the U.S., may adversely affect our served markets, our business, demand for our products, and our results of operations and cash flows
Demand for our products, which impacts our revenue and gross profit, is affected by general business and economic conditions as well as by changes in customer order patterns. Adverse developments in business conditions, economic activity, or capital spending levels could result in reduced demand for our products and impair our ability to accurately forecast and plan future business activities. We cannot predict the timing, duration, or strength of any economic recovery or the timing, duration, or severity of a subsequent economic slowdown, worldwide, in the U.S., or in the specific end markets we serve. In the event of a future prolonged slowdown in economic activity, our business, financial condition, results of operations, and cash flows could be adversely and materially affected. Additionally, our stock price could decrease if investors have concerns that our business and financial condition will be negatively impacted by weakening economic conditions.
We operate in a highly competitive industry
We operate in a competitive industry characterized by periodic changes in technology, product demand, prices and lead times. Our future profitability depends on our ability to successfully identify and react to these changing trends. Specifically, achievement of our sales and profit goals is dependent in part upon our ability to successfully anticipate product demand, to introduce quality products to meet that demand in a timely manner at competitive prices, to gain acceptance of our products in the marketplace, to achieve cost reductions during the product life cycle, and to adapt our existing product platforms in the event of changes in technology. Failure to do so could result in low returns on investment in new products and technologies, a loss of competitive position relative to our peers, obsolete products and technologies, and an adverse impact on our operating results. In addition, price erosion in response to competition in our served markets could have a material impact on our financial position or results of operations.
Our future sales growth is partially dependent on the successful introduction of new products
Achievement of our Company objectives of sales growth of at least 5% on a year-over year basis and gross margins in excess of 35% are in part dependent upon the successful introduction of new products, acceptance of these new products by customers in those markets, and successful cost reduction efforts related to new products. Any delay in introduction of new products, customer acceptance of new products, or cost reduction actions could have an adverse impact on our financial position or results of operations.
Changes in technology could reduce demand for our products
We believe that our intellectual property is equal or superior to our competitors’ and we do not know of any new technologies that could cause a shift away from digital power electronic solutions in the end markets we serve. However, major advancements in digital power electronic technologies by competitors or the advent of technologies obviating digital power electronic solutions could have an adverse effect on our financial position or results of operations.
11
The loss of one or more major customers could adversely affect our results of operations or financial condition
We rely on several large customers for a significant portion of our sales. The loss of one or more of these customers or significant decreases in these customers' purchase levels could have an adverse effect on our business and on our results of operations.
Certain of our competitors have substantially greater resources and greater global reach than us
We compete with crane and hoist drive manufacturers and drive system integrators, radio control manufacturers, elevator drive manufacturers and control system integrators, and mining machinery drive builders. The total number of such enterprises with whom we compete directly is believed to be fewer than 100. However, certain of our competitors are significantly larger and have substantially greater resources than we do, and some are global in scope, whereas we currently compete primarily in the North American market.
We have pension liabilities and funding obligations which are subject to changes in interest rates, asset return rates, and mortality assumptions
Our defined benefit pension plan was underfunded as of December 28, 2014, due primarily to reductions in interest rates over the past decade, which impact the discount rate used to estimate the net present value of our pension obligations. Current actuarial estimates indicate that we will be required to make contributions of $25 million to our defined benefit pension plan to achieve fully funded status.
In addition, changes in interest rates, investment returns, mortality assumptions, and other factors could adversely affect the funded status of our pension plan in the future and require that we contribute additional cash to the pension plan over and above the amounts currently estimated. Such volatility could also increase pension expense in periods beyond fiscal 2014. As a result, we may be required to seek additional sources of cash to fund both our operations and our required pension contributions.
We may seek additional capital through private or public sales of equity, debt or convertible debt securities, which could have negative effects on our existing investors
We may seek to raise additional funding through equity or certain forms of debt financing in the future that could dilute the percentage ownership held by existing stockholders. In addition, new investors may demand rights or privileges that are preferable to, or senior to, those of our existing stockholders, such as interest payments, dividends or warrants, as a condition to completing a transaction that provides us with capital.
We may have limited access to additional financing
Macroeconomic conditions several years ago led to volatility in security prices, the failure of financial institutions, diminished liquidity and credit availability, and deflation in the valuation of investment vehicles across varied asset classes.
In the event capital and credit markets again become illiquid and the availability of funds becomes limited, we could incur increased costs associated with future equity or debt financing transactions. Our ability to access the capital and credit markets may be limited by these or other factors unique to our Company. Limited access to financing opportunities in the future could have a material adverse impact on our ability to fund our operations or meet our corporate obligations.
We are subject to credit risk
We are exposed to the credit risk of our customers, including risk of bankruptcy, and are subject to losses from uncollectable accounts receivable. If the financial condition of any of our customers deteriorates and impairs their ability to make payments, we could incur future write-offs of accounts receivable that could have a material impact on our financial position, results of operations, or cash flows.
We are reliant on suppliers
We purchase raw materials and subassemblies used in our products from third-party suppliers, and also purchase finished goods for resale to customers from third-party subcontractors. If our suppliers or subcontractors cannot meet their commitments to us in terms of price, delivery, or quality, it may negatively impact our ability to meet our commitments to our customers. This could result in disruption of production, delay in shipments to customers, higher material costs, quality issues
12
with our products and damage to customer relationships. In addition, increases in the cost of raw materials purchased from third-party suppliers could negatively impact our gross profit and results of operations.
We may face claims of infringement on the intellectual property of others, or others may infringe upon our intellectual property
Our future success depends in part on our ability to prevent others from infringing on our proprietary rights, as well as our ability to operate without infringing upon the proprietary rights of others. We may be required at times to take legal action to protect our proprietary rights and, despite our best efforts, we may be sued for infringing on the patent rights of others. Patent litigation is costly and, even if we prevail, the cost of such litigation could adversely affect our financial condition. In addition, we could be adversely affected financially should we be judged to have infringed upon the intellectual property of others.
We may suffer losses resulting from legal and environmental issues
Our results of operations could be adversely impacted by pending and future litigation, including claims related to, but not limited to, product liability, patent infringement, contracts, employment and labor issues, personal injury, and property damage, including damage to the environment.
In some cases, we have agreed to provide indemnification against legal and environmental liabilities and potential liabilities associated with operations that we have divested, including certain motor, generator, lighting ballast, transformer, drive and power supply manufacturing operations. If we are required to make payments under such indemnification obligations, such payments could have a material adverse impact on our financial position, results of operations, or cash flows. Further, we have been indemnified against potential legal and environmental liabilities and potential liabilities associated with operations that we have acquired, including lighting ballast, transformer, capacitor, and crane brake manufacturing operations that were subsequently divested. If not borne by the indemnifying party, such liabilities, if any, could be borne by us and have an adverse effect on our financial position or results of operations.
Our business, operations, and financial results could be adversely impacted in the event of a failure or security breach of our information technology systems
The efficient operation of our business is dependent on our information technology systems. We rely on those systems to manage the day-to-day operation of our business, manage relationships with our business partners, and maintain our financial and accounting records. The failure of our information technology systems, or any compromise of the integrity or security of the data we generate from our information technology systems, could disrupt our business and severely limit our ability to operate our business. In addition, our information technology systems are vulnerable to damage or interruption from natural disasters, theft, computer viruses and hackers, hardware or software failures, and power outages. Any interruption of our information technology systems could result in decreased revenue, increased expenses, increased capital expenditures, customer dissatisfaction, and potential legal actions, any of which could have a material adverse effect on our results of operations or financial condition.
Ordinary transfers of our common stock between shareholders could result in an ownership change as defined in Section 382 of the Internal Revenue Code, limiting our ability to fully utilize our net operating loss carryforwards for U.S. federal tax purposes
We had net operating loss (“NOL”) carryforwards for U.S. federal tax purposes of $242 million as of December 28, 2014. Our NOLs have a carryforward period of 20 years with expiration dates ranging from 2019 to 2034. We anticipate that no federal income tax liability, other than alternative minimum tax, would be recorded if and when we generate U.S. taxable income and such carryforwards are utilized.
We periodically evaluate whether ordinary transfers of our common stock between shareholders have resulted in an ownership change as defined in Section 382 of the Internal Revenue Code. Based on available information, we have determined that no such ownership change has occurred. If such ownership change had occurred, utilization of the Company’s NOLs would be subject to annual limitation provisions per the Internal Revenue Code and similar state laws. Such annual limitations could defer the utilization of NOL carryforwards and accelerate payment of federal income taxes, and could result in the expiration of a portion of the NOL carryforwards before utilization. An ownership change under Section 382 of the Internal Revenue Code would not have a material adverse effect on our results of operations or financial position, as we have provided a full valuation allowance against substantially all of our deferred tax assets. Ordinary transfers of our common stock between
13
shareholders in future periods could result in an ownership change in such periods and accordingly, at that time, limit the utilization of our NOLs as described above.
14
ITEM 1B. UNRESOLVED STAFF COMMENTS
Not applicable.
ITEM 2. PROPERTIES
Magnetek’s headquarters and each of our facilities for the continuing operations of the Company are listed below, each of which is leased.
Location | Lease Term | Approximate Size (Sq. Ft.) | Principal Use | ||||
Menomonee Falls, Wisconsin | 2020 | 143,700 | Power control systems manufacturing and corporate headquarters | ||||
Mississauga, Canada | 2016 | 11,180 | Sales and service | ||||
Pittsburgh, Pennsylvania | 2017 | 11,400 | Power control systems manufacturing | ||||
Bedford, England | 2023 | 7,000 | Sales and service | ||||
Bridgeville, Pennsylvania | 2017 | 6,800 | Engineering | ||||
We believe our facilities are in satisfactory condition and are adequate for our continuing operations.
ITEM 3. LEGAL PROCEEDINGS
We are involved from time to time in legal actions for product liability and other matters that arise in the ordinary course of our business. We are also involved in legal actions associated with our discontinued business operations, including product liability, asbestos-related liability, and environmental proceedings relating to cleanup costs associated with alleged past waste disposal practices at several previously utilized, owned or leased facilities and offsite locations. It is not possible to predict with certainty the outcome of any of these unresolved legal actions or proceedings or the range of possible loss or recovery. A discussion of these matters appears in Note 10 of the Notes to Consolidated Financial Statements under Item 8, including a discussion of whether or not these unresolved matters will have a material impact on our financial position or results of operations.
Litigation - Product Liability
We have been named, along with multiple other defendants, in asbestos-related lawsuits associated with business operations we previously acquired, but which are no longer owned. During our ownership, none of the businesses produced or sold asbestos-containing products. For such claims, we are either contractually indemnified against liability, or contractually obligated to defend and indemnify the purchaser of these former Magnetek business operations. With respect to these claims, we are uninsured, but we believe that we have no such liability and we aggressively seek dismissal from these proceedings. Management does not believe the asbestos proceedings, individually or in the aggregate, will have a material adverse effect on our financial position or results of operations. Given the nature of the above issues, uncertainty of the ultimate outcome, and the inability to estimate the potential loss, no amounts have been reserved for these matters.
Litigation - Patent Infringement and Related Proceedings
In August 2008, we filed a complaint in the Circuit Court of Cook County, Illinois, County Department, Law Division, against Kirkland & Ellis, LLP (“K&E”). The lawsuit involved a claim for breach of professional responsibility arising out of K&E’s representation of Magnetek in the patent infringement action, Ole K. Nilssen v. Magnetek, Inc. We alleged that, as a result of K&E’s negligent breach of professional duty in failing to discover or investigate the existence of prior art and prior misconduct which would have made Nilssen’s patent claim unenforceable or invalidated his patent, we suffered an arbitration award and judgment in the amount of $23.4 million, which judgment was ultimately settled by the payment to Nilssen of $18.75 million. Accordingly, we sought damages in the amount of $18.75 million. Following a December 2011 mediation, we entered into a settlement agreement with K&E. Under the terms of the settlement agreement all outstanding claims were settled and released with prejudice in consideration of K&E making a $5 million settlement payment to us, which we received in January 2012. The federal proceeding and the Illinois Supreme Court proceeding were subsequently dismissed, also in January 2012. We entered into the settlement agreement to eliminate the uncertainties, burden, and expense of further litigation. We recorded the settlement payment as a gain in discontinued operations in fiscal 2012.
15
Litigation - Other
In November 2007, a lawsuit was filed by Antonio Canova in Italy, in the Court of Arezzo, Labor Law Section, against us and Power-One Italy, S.p.A. Mr. Canova is a former Executive Vice President of Magnetek and was Deputy Chairman and Managing Director of our former Italian subsidiary, Magnetek, S.p.A. Mr. Canova asserted claims for damages in the amount of 3.5 million Euros (approximately US$4.3 million) allegedly incurred in connection with the termination of his employment at the time of the sale of our power electronics business to Power-One, Inc. ("Power One") in October 2006. The claims against us relate to a change of control agreement and restricted stock grant. In March 2012, the Court of Arezzo ruled in our favor, dismissing Mr. Canova's claims against us as invalid. Mr. Canova appealed the ruling in September 2012. On October 16, 2013, the Labor Court of Appeals issued its decision rejecting all claims of Mr. Canova against Magnetek, Inc. and ordered Mr. Canova to pay a nominal amount in favor of Magnetek, Inc. toward our legal expenses incurred in the appeal. Mr. Canova did not appeal the ruling to the Supreme Court on or before October 16, 2014, and thereby relinquished any right to appeal. Accordingly we consider this matter closed.
In October 2010, we received a request for indemnification from Power-One for an Italian tax matter arising out of the sale of our power electronics business to Power-One in October 2006. With a reservation of rights, we affirmed our obligation to indemnify Power-One for certain pre-closing taxes. The sale included an Italian company, Magnetek, S.p.A., and its wholly owned subsidiary, Magnetek Electronics (Shenzhen) Co. Ltd. (the “Power-One China Subsidiary”). The tax authority in Arezzo, Italy, issued a notice of audit report in September 2010 wherein it asserted that the Power-One China Subsidiary had its administrative headquarters in Italy with fiscal residence in Italy and, therefore, was subject to taxation in Italy. In November 2010, the tax authority issued a notice of tax assessment for the period of July 2003 to June 2004, alleging that taxes of approximately Euro 1.9 million (approximately US$2.3 million) were due in Italy on taxable income earned by the Power-One China Subsidiary during this period. In addition, the assessment alleged potential penalties calculated at 120% of the tax amount claimed together with interest in the amount of approximately Euro 2.6 million (or approximately US$3.2 million) for the alleged failure of the Power-One China Subsidiary to file its Italian tax return. A hearing before the Tax Court of Arezzo ("Tax Court") was held July 5, 2012, on the tax assessment for the period July 2003 to June 2004. In September 2012, the Tax Court ruled in favor of the Power-One China Subsidiary dismissing the tax assessment for the period of July 2003 to June 2004. In February 2013, the tax authority filed an appeal of the Tax Court's September 2012 ruling. The Regional Tax Commission of Florence heard the appeal of the tax assessment dismissal for the period of July 2003 to June 2004 and on October 6, 2014, issued its ruling finding in favor of the tax authority. We believe the commission's decision was based upon erroneous interpretation of the applicable law and we intend to to appeal the ruling to the Italian Supreme Court.
In August 2012, the tax authority in Arezzo, Italy issued additional notices of tax assessment for the periods July 2002 to June 2003 and July 2004 to December 2006, alleging that taxes of approximately Euro 9.5 million (approximately US$11.6 million) were due in Italy on taxable income earned by the Power-One China Subsidiary together with an allegation of potential penalties in the amount of approximately 2.8 million Euro (approximately US$3.4 million) for the alleged failure of the Power-One China Subsidiary to file its Italian tax returns for the reporting periods. The tax authority asserted that the Power-One China Subsidiary had its administrative headquarters in Italy with fiscal residence in Italy and, therefore, was subject to taxation in Italy. The Tax Court held a hearing on December 4, 2014 and thereafter scheduled another hearing for April 16, 2015. We believe the Italian tax claims are without merit and intend to vigorously defend against them.
Litigation - Environmental Matters
From time to time, we have taken action to bring certain facilities associated with previously owned businesses into compliance with applicable environmental laws and regulations. Upon the subsequent sale of certain businesses, we agreed to indemnify the buyers against environmental claims associated with the divested operations, subject to certain conditions and limitations. Remediation activities, including those related to our indemnification obligations, did not involve material expenditures during fiscal years 2014, 2013 or 2012.
We have also been identified by the United States Environmental Protection Agency and certain state agencies as a potentially responsible party for clean-up costs associated with alleged past waste disposal practices at several previously utilized, owned, or leased facilities and offsite locations. Our remediation activities as a potentially responsible party were not material in fiscal years 2014, 2013 or 2012. Although the materiality of future expenditures for environmental activities may be affected by the level and type of contamination, the extent and nature of clean-up activities required by governmental authorities, the nature of our alleged connection to the contaminated sites, the number and financial resources of other potentially responsible parties, the availability of indemnification rights against third parties and the identification of additional contaminated sites, our estimated share of liability, if any, for environmental remediation, including its indemnification obligations, is not expected to be material.
16
Bridgeport, Connecticut Facility
In 1986, we acquired the stock of Universal Manufacturing Company (“Universal”) from a predecessor of Fruit of the Loom (“FOL”), and the predecessor agreed to indemnify us against certain environmental liabilities arising from pre-acquisition activities at a facility in Bridgeport, Connecticut. Environmental liabilities covered by the indemnification agreement included completion of additional clean-up activities, if any, at the Bridgeport facility and defense and indemnification against liability for potential response costs related to offsite disposal locations. Our leasehold interest in the Bridgeport facility was assigned to the buyer in connection with the sale of our transformer business in June 2001. FOL, the successor to the indemnification obligation, filed a petition for Reorganization under Chapter 11 of the Bankruptcy Code in 1999 and we filed a proof of claim in the proceeding for obligations related to the environmental indemnification agreement. We believe that FOL had substantially completed the clean-up obligations required by the indemnification agreement prior to the bankruptcy filing. In November 2001, we entered into an agreement with FOL involving the allocation of certain potential tax benefits and we withdrew our claims in the bankruptcy proceeding. We further believe that FOL's obligation to the state of Connecticut was not discharged in the reorganization proceeding.
In January 2007, the Connecticut Department of Environmental Protection (“DEP”) requested parties, including us, to submit reports summarizing the investigations and remediation performed to date at the site and the proposed additional investigations and remediation necessary to complete those actions at the site. DEP requested additional information from us relating to site investigations and remediation. We retained an environmental consultant to review and prepare reports on historical operations and environmental activities at the Bridgeport facility. In November 2009, we submitted our site summary report and proposed work plan to the DEP and in October 2010 submitted a revised work plan to the DEP. We agreed to the scope of the work plan with the DEP in November 2010. We have recorded a liability of $0.4 million related to the Bridgeport facility, representing our best estimate of future site investigation costs and remediation costs which are expected to be incurred in the future. The liability is included in accrued liabilities in the consolidated balance sheet as of December 28, 2014.
FOL's inability to satisfy its remaining obligations to the state of Connecticut related to the Bridgeport facility and any offsite disposal locations or the discovery of additional environmental contamination at the Bridgeport facility could have a material adverse effect on our financial position, cash flows, or results of operations.
ITEM 4. MINE SAFETY DISCLOSURES
Not applicable.
17
PART II
ITEM 5. MARKET FOR REGISTRANT'S COMMON EQUITY, RELATED STOCKHOLDER MATTERS AND ISSUER PURCHASES OF EQUITY SECURITIES
Our common stock trades on the NASDAQ Global Market under the symbol "MAG." As of February 20, 2015, there were 117 record holders of Magnetek’s common stock.
The following table sets forth the high and low sales prices of our common stock during each quarter of fiscal years 2014 and 2013:
Fiscal Year 2014 | High | Low | |||||
Fourth Quarter | $ | 45.71 | $ | 25.58 | |||
Third Quarter | 35.00 | 23.21 | |||||
Second Quarter | 23.71 | 19.00 | |||||
First Quarter | 25.75 | 18.68 | |||||
Fiscal Year 2013 | High | Low | |||||
Fourth Quarter | $ | 23.71 | $ | 17.08 | |||
Third Quarter | 18.33 | 16.22 | |||||
Second Quarter | 18.21 | 12.71 | |||||
First Quarter | 14.12 | 10.25 | |||||
We have not paid any cash dividends on our common stock and do not anticipate paying cash dividends in the near future. Our ability to pay dividends on our common stock is restricted by provisions in our 2007 revolving loan agreement, as amended, which provides that we may not declare or pay any dividend or make any distribution with respect to our capital stock.
There were no unregistered sales of equity securities during fiscal year 2014.
Securities Authorized for Issuance Under Equity Compensation Plans
The information required by this Item 5 is hereby incorporated by reference to the section of the Company's 2015 Proxy Statement entitled "Equity Compensation Plan Information Table."
Stock Performance Graph – Return to Shareholders
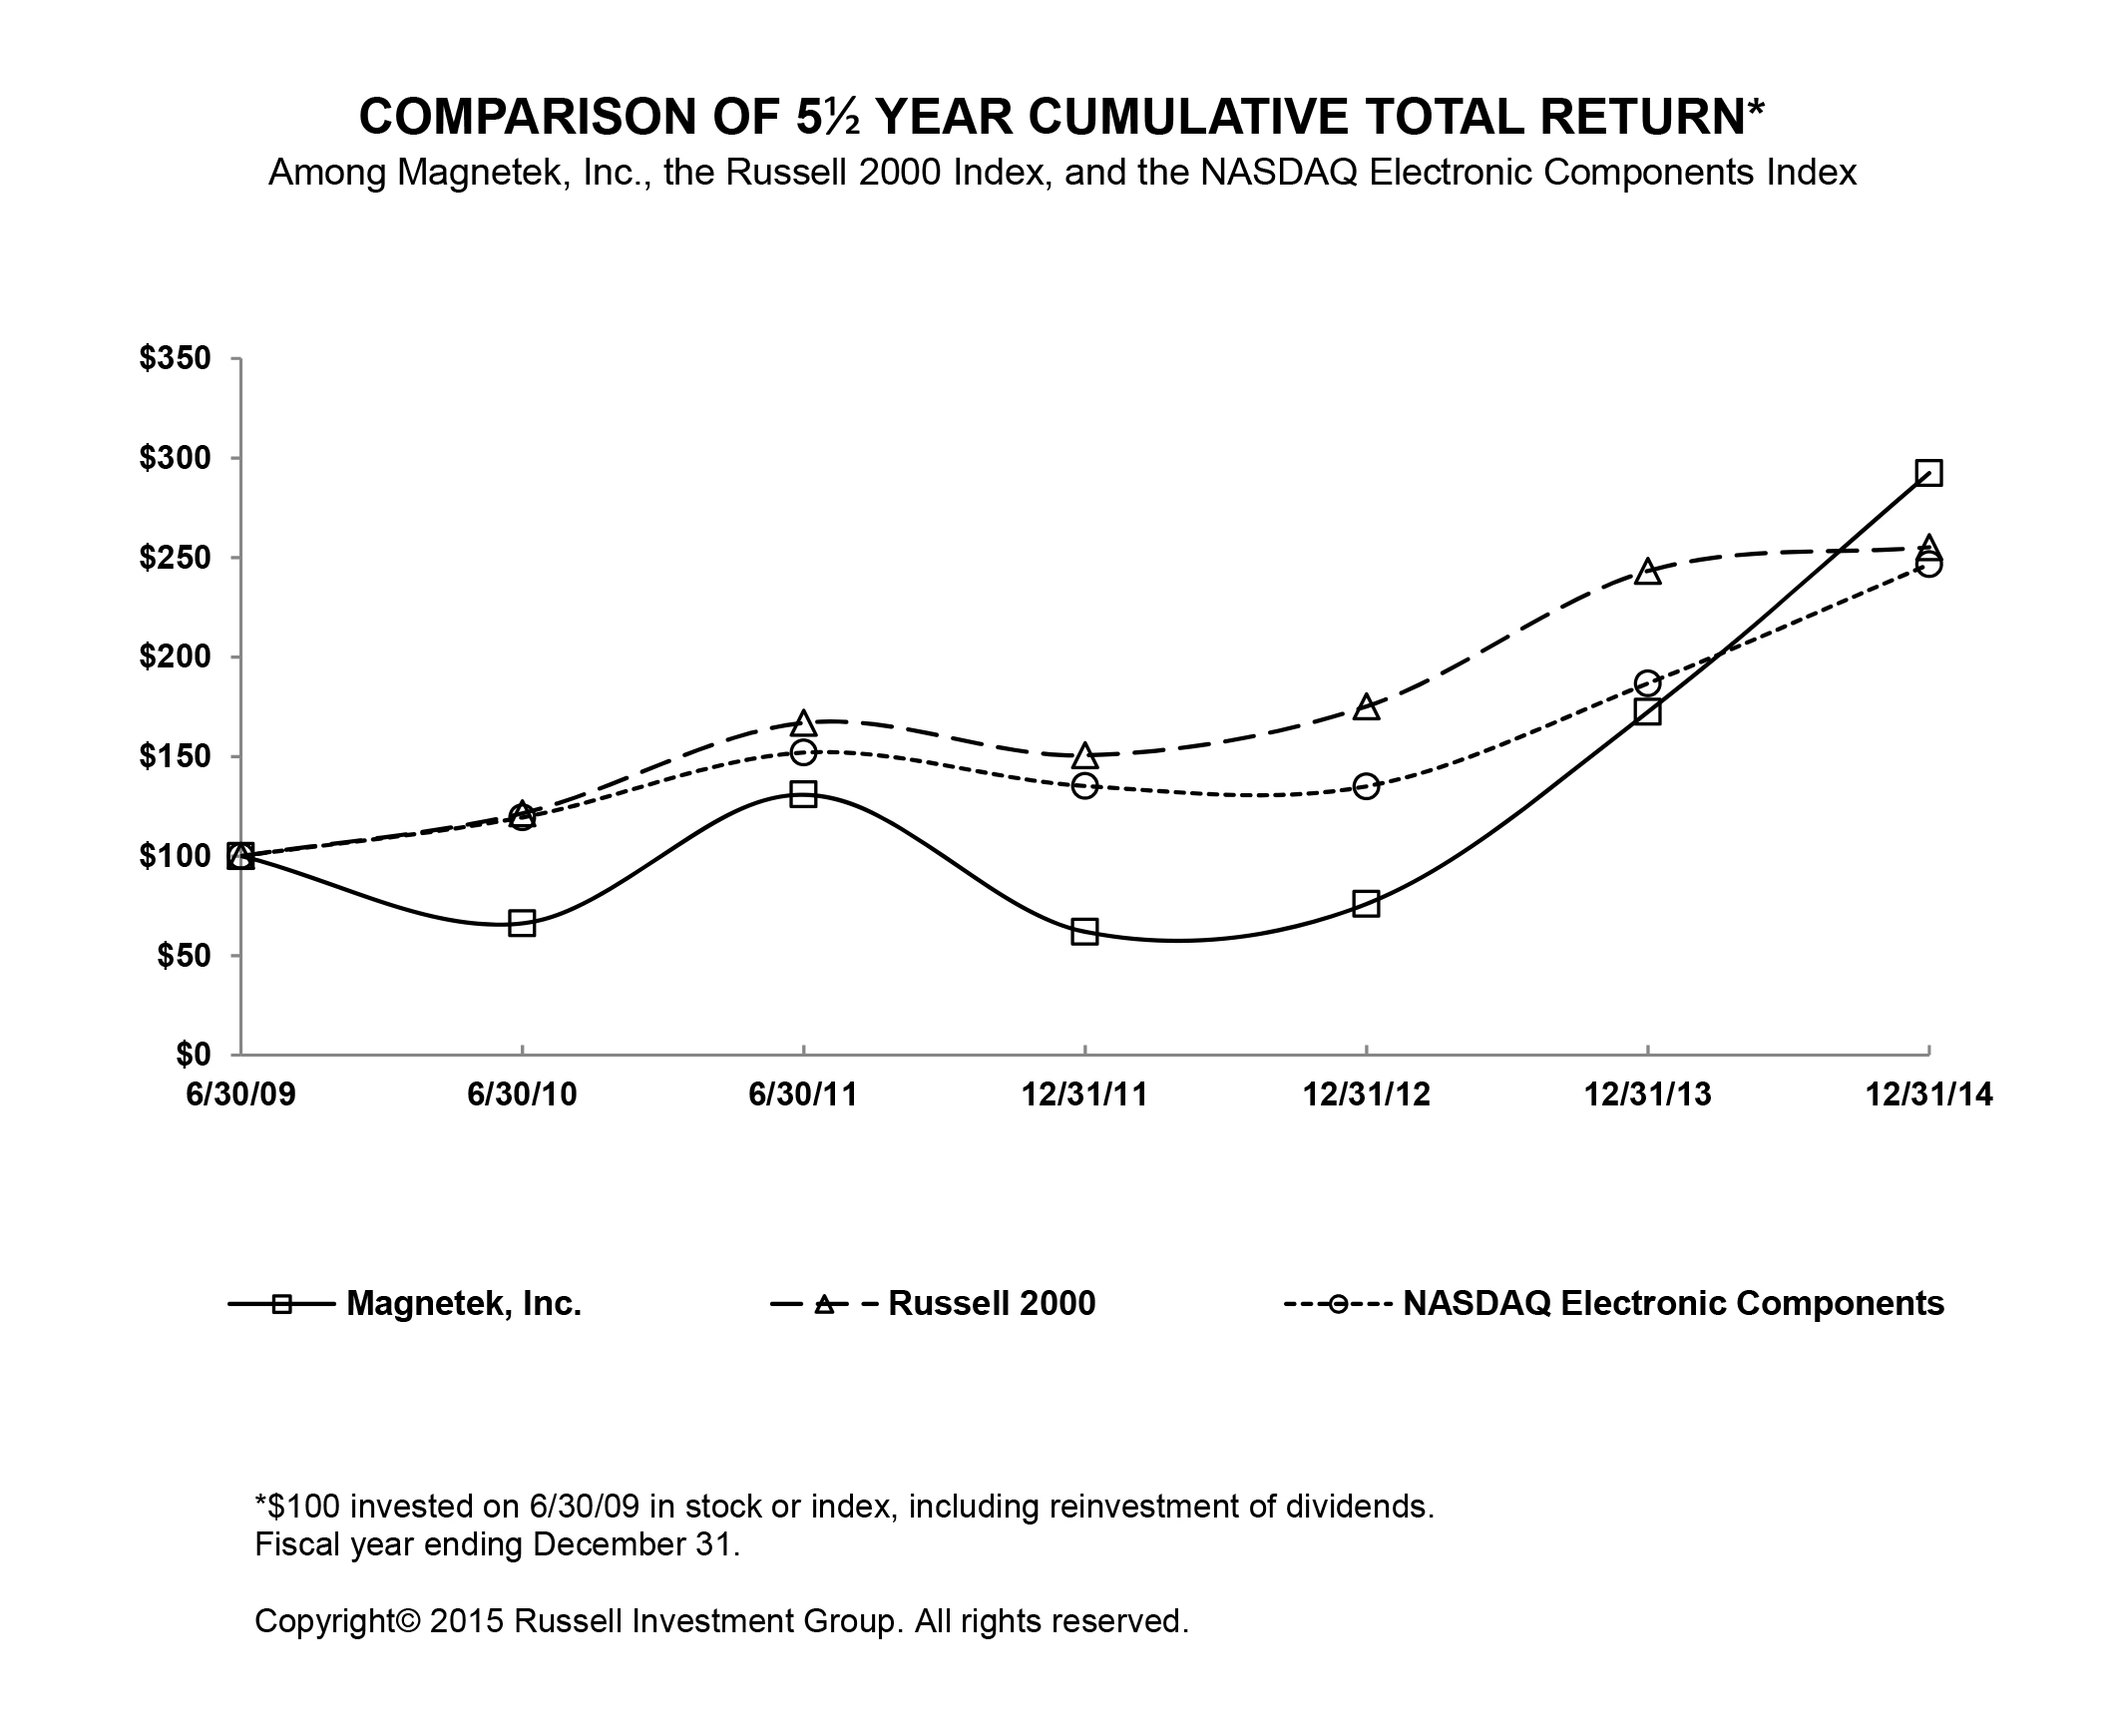
The table and line graph shown below compare the cumulative total return for the last five years and six months to holders of Magnetek common stock with the cumulative total return of the Russell 2000 Index and the NASDAQ Electronics Components index.
The table and line graph below assume an investment of $100 in the Company’s common stock and in each of the comparison groups beginning June 28, 2009, and assumes the reinvestment of all dividends, through December 28, 2014. The stock price performance information shown below should not be considered indicative of potential future stock price performance.
Jun-09 | Jun-10 | Jun-11 | Dec-11 | Dec-12 | Dec-13 | Dec-14 | |||||||||||||||
Magnetek, Inc. | 100.00 | 66.19 | 130.94 | 61.94 | 75.97 | 172.45 | 292.45 | ||||||||||||||
Russell 2000 | 100.00 | 121.48 | 166.93 | 150.61 | 175.24 | 243.27 | 255.17 | ||||||||||||||
NASDAQ Electronic Components | 100.00 | 119.40 | 152.01 | 135.18 | 135.01 | 186.76 | 246.59 | ||||||||||||||
18
Issuer Purchases of Equity Securities
We did not purchase any shares of our common stock during the fourth quarter of fiscal year 2014.
19
ITEM 6. SELECTED FINANCIAL DATA
The following table sets forth selected historical financial data for Magnetek, Inc. for fiscal years 2014, 2013 and 2012, the six-month transition period ended January 1, 2012, and the previous two fiscal years. The financial data presented below is derived from our audited consolidated financial statements. For additional information, see our financial statements and the notes thereto included elsewhere in this Annual Report on Form 10-K. The following table should be read in conjunction with Item 7, “Management’s Discussion and Analysis of Financial Condition and Results of Operations” below.
Statement of Operations Data | Fiscal Year Ended | Six Months Ended | Fiscal Year Ended | |||||||||||||||||||||
December 28, 2014 | December 29, 2013 | December 30, 2012 | January 1, 2012 | July 3, 2011 | June 27, 2010 | |||||||||||||||||||
(Amounts in thousands, except per share data) | ||||||||||||||||||||||||
Net sales | $ | 109,713 | $ | 103,316 | $ | 114,274 | $ | 58,721 | $ | 109,832 | $ | 80,571 | ||||||||||||
Gross profit | 39,951 | 35,325 | 39,844 | 20,333 | 35,157 | 24,128 | ||||||||||||||||||
Gross profit % | 36.4 | % | 34.2 | % | 34.9 | % | 34.6 | % | 32.0 | % | 29.9 | % | ||||||||||||
Income (loss) from operations | $ | (25,730 | ) | $ | 4,775 | $ | 8,022 | $ | 4,880 | $ | 5,446 | $ | (2,314 | ) | ||||||||||
Net income (loss): | ||||||||||||||||||||||||
Continuing operations | $ | (26,445 | ) | $ | 3,759 | $ | 6,926 | $ | 4,331 | $ | 4,817 | $ | (3,158 | ) | ||||||||||
Discontinued operations | (818 | ) | (627 | ) | 5,697 | (39 | ) | (1,154 | ) | (1,943 | ) | |||||||||||||
Net income (loss) | $ | (27,263 | ) | $ | 3,132 | $ | 12,623 | $ | 4,292 | $ | 3,663 | $ | (5,101 | ) | ||||||||||
Earnings (loss) per common share - basic | ||||||||||||||||||||||||
Continuing operations | $ | (7.89 | ) | $ | 1.16 | $ | 2.18 | $ | 1.38 | $ | 1.54 | $ | (1.02 | ) | ||||||||||
Discontinued operations | $ | (0.24 | ) | $ | (0.19 | ) | $ | 1.79 | $ | (0.01 | ) | $ | (0.37 | ) | $ | (0.62 | ) | |||||||
Net income (loss) | $ | (8.13 | ) | $ | 0.97 | $ | 3.97 | $ | 1.36 | $ | 1.17 | $ | (1.64 | ) | ||||||||||
Earnings (loss) per common share - diluted | ||||||||||||||||||||||||
Continuing operations | $ | (7.89 | ) | $ | 1.13 | $ | 2.14 | $ | 1.35 | $ | 1.51 | $ | (1.02 | ) | ||||||||||
Discontinued operations | $ | (0.24 | ) | $ | (0.19 | ) | $ | 1.76 | $ | (0.01 | ) | $ | (0.37 | ) | $ | (0.62 | ) | |||||||
Net income (loss) | $ | (8.13 | ) | $ | 0.94 | $ | 3.90 | $ | 1.34 | $ | 1.15 | $ | (1.64 | ) | ||||||||||
Balance Sheet Data | ||||||||||||||||||||||||
(Amounts in thousands) | December 28, 2014 | December 29, 2013 | December 30, 2012 | January 1, 2012 | July 3, 2011 | June 27, 2010 | ||||||||||||||||||
Total assets | $ | 78,700 | $ | 81,969 | $ | 98,815 | $ | 92,005 | $ | 85,433 | $ | 76,100 | ||||||||||||
Long-term debt, including current portion | — | — | — | — | — | 4 | ||||||||||||||||||
Other long term obligations | 845 | 911 | 1,095 | 1,517 | 1,318 | 1,461 | ||||||||||||||||||
Pension benefit obligations | 27,360 | 48,461 | 102,340 | 98,108 | 61,382 | 77,914 | ||||||||||||||||||
Stockholders' equity (deficit) | 23,619 | 8,236 | (30,875 | ) | (35,745 | ) | (4,462 | ) | (23,937 | ) | ||||||||||||||
20
ITEM 7. MANAGEMENT'S DISCUSSION AND ANALYSIS OF FINANCIAL CONDITION AND RESULTS OF OPERATIONS
Overview
We are a global provider of digital power control systems that are used to control motion and power primarily in material handling, elevator, and mining applications. Our digital power control systems serve the needs of selected niches of traditional and emerging markets that are becoming increasingly dependent on “smart” power. We believe we are North America's largest independent supplier of digital drives, radio controls, software, and accessories for industrial cranes and hoists, and believe we are also the largest independent supplier of digital DC motion control systems for elevators. Customers include most of the industrial crane and hoist companies in North America and the world's leading elevator builders. In addition, we have a growing range of products for motion control systems used in mining equipment. We are focused on providing our customers cost-effective power solutions that will improve efficiency, reduce costs, and save energy. Other trends in our served markets we believe we can capitalize on include the adoption of wireless control solutions, modernization and upgrading of installed equipment, and an increasing appreciation in our served markets for communication and diagnostic features, enhanced performance, and safer workplace environments. We believe that with our focus on innovation and our application expertise, combined with strong brand name recognition, broad product offerings and sales channel capabilities, we are well positioned to grow our business by gaining share in both our served markets as well as in new markets. Our operations are located in North America, predominantly in Menomonee Falls, Wisconsin, our Company headquarters.
Our product offerings for material handling applications include innovative power control systems, radio remote controls, and braking, collision avoidance, and electrification subsystems, sold primarily to OEMs of overhead cranes and hoists. While we sell primarily to OEMs of overhead cranes and hoists, we spend a great deal of effort understanding the needs of end users to gain specification. We can combine our products with engineered services to provide complete customer-specific systems solutions. A primary driver of our growth in this market is our ability to improve our customers' operations and provide them with quantifiable and proven returns on invested capital.
Our product offerings for elevator applications are comprised of highly integrated subsystems and drives used to control motion primarily in high-rise, high-speed elevator applications. Our products are sold mainly to elevator OEMs and we have a significant share of the available market for DC drives and subsystems used in high-rise elevators. We believe we have opportunities for growth in available elevator markets by marketing the benefits of retaining and upgrading existing installed DC technology, introducing new energy-saving product offerings for both AC and DC applications, expanding the breadth of our product offerings for lower performance AC applications, and expanding geographically.
Our product offerings for mining applications include drives used mainly in the underground coal mining industry. We have been a leading supplier of AC and DC digital motion control systems to underground coal mining equipment manufacturers for nearly 30 years. We believe that global energy needs will continue to grow significantly for the foreseeable future, and part of that need will continue to be met by traditional coal-based sources. In response to the prolonged downturn in the coal market, we've reduced our costs, focused our efforts on new product developments, and expanded our sales into markets outside the U.S. In addition, we're currently undergoing qualification tests of newly developed traction drive systems for hard rock mining applications in an effort to reduce our reliance on the coal industry. We also intend to continue to support our installed base of wind inverters through spare part sales.
We intend to continue to build on our competitive strengths in established material handling, elevator, and mining markets and invest in research and development to expand our product portfolio aimed at penetrating growing markets for digital power-based systems. We are focused on increasing our sales and maximizing profitability primarily by prudently pursuing internal growth opportunities in our core product lines, seeking to increase our market share, enter new markets, and expand our current business model geographically.
Continuing Operations
We focus on a variety of key indicators to monitor our business performance. These indicators include order rates, sales growth, gross profit margin, operating profit margin, net income, earnings per share, and working capital and cash flow measures. These indicators are compared to our operating plans as well as to our prior year actual results, and are used to measure our success relative to our objectives. Our Company objectives are to grow sales at least 5% on a year-over-year basis, to achieve 35% gross margins and 10% operating profit margins, and to generate sufficient cash flow to fund our growth initiatives, our operations, and our obligations.
21
We experienced improving market conditions throughout fiscal 2014, as manufacturing activity in the U.S. accelerated at a moderate pace. End-market conditions in our largest served market, overhead material handling, as well as in the elevator market improved in 2014 from 2013 levels, which led to increasing demand and growing sales as the year progressed. In addition, our sales mix shifted in fiscal 2014 to include several larger scale projects as compared to fiscal 2013. These improved market conditions were reflected in our fiscal 2014 total company sales, which increased 6% to nearly $110 million from $103 million in fiscal 2013.
Fiscal 2014 gross profit increased to nearly $40.0 million, or 36.4% of sales, compared to fiscal 2013 gross profit of $35.3 million, or 34.2% of sales. The year-over-year increase in gross profit and gross margin as a percentage of sales was mainly due to higher sales volume, improved sales mix, cost containment actions, and selective pricing actions. We reported a pre-tax loss from operations of $25.7 million, mainly due to a pension settlement charge of $37.1 million, compared to fiscal 2013 pre-tax income from operations of $4.8 million, or 4.6% of sales. Excluding the pension settlement charge, our fiscal 2014 income from operations would have been $11.4 million, or 10.4% of sales.
The pension settlement charge related to a lump sum window program that we completed in fiscal 2014. We offered a lump sum payout to nearly 3,000 deferred vested participants in an effort to reduce the size, volatility, mortality risk, and administrative costs of our defined benefit pension plan. A total of 2,230 participants elected the lump sum option, with a total amount of $46.9 million paid out of pension plan assets to those participants. Our pension liability was reduced by a similar amount.
Upon completion of the lump sum window, we recorded a one-time, non-cash settlement charge of $37.1 million as a component of pension expense in the fourth quarter of fiscal 2014. The settlement charge represents accelerated amortization of actuarial pension losses that would otherwise have been amortized to our income statement over time as a component of future pension expense. The settlement charge had no impact on our cash flow or financial position and is expected to reduce our future pension expense.
We reported a loss from continuing operations of $26.4 million, or a loss of $7.89 per share, compared to income from continuing operations of $3.8 million, or $1.13 per share in fiscal 2013. On a non-GAAP basis, excluding the pension settlement charge, we would have reported income from continuing operations of $10.6 million in fiscal 2014, or $2.91 per share.
Our cash balances decreased $5.3 million during fiscal 2014, as we contributed $19.1 million in cash to our pension plan. In addition, in September 2014 we made a voluntary excess contribution to our pension plan of 250,000 shares of Company common stock, valued at $7.4 million at the time of the contribution. These contributions were the main reason for the reduction in our pension liability of $21 million during fiscal 2014, to $27 million at the end of the year, improving the funded status of the plan and strengthening our balance sheet. The improvement in our pension liability should also result in reduced pension expense and pension contributions in fiscal 2015 and beyond.
In summary, our financial performance was exceptional in fiscal 2014, as we grew our sales, controlled our costs well, prudently deployed our resources, and continued to make substantial progress in reducing our pension liability.
Looking ahead, our business had solid momentum entering 2015 and current forecasts indicate the U.S. economic recovery is projected to continue at a deliberate pace. The recent strengthening of the U.S. dollar and falling commodity prices demonstrate that macro-economic conditions remain dynamic and fragile. As a result, it remains challenging to predict the duration or the magnitude of the current economic recovery, whether in the U.S. overall or in the specific end markets we serve. However, barring a significant decline in demand in our served markets, we expect that we can grow our business profitably through a combination of new product introductions, market share gains, and entry into new markets. Throughout 2015, we intend to focus our development and marketing efforts on organic sales growth opportunities across all product lines, prudently expanding our reach into new end markets and geographical areas. We also plan to retain our discipline in resource allocation and cost control to optimize operating leverage and grow our income and cash flow.
Discontinued Operations
Certain expenses related to previously divested businesses have been classified as discontinued operations in the accompanying consolidated financial statements and footnotes for all periods presented (see Note 2 of Notes to Consolidated Financial Statements under Item 8). Expenses related to previously divested businesses have historically included certain environmental matters, asbestos claims, and product liability claims (see Note 10 of Notes to Consolidated Financial Statements under Item 8). All of these issues relate to businesses we no longer own and most relate to indemnification agreements that we entered into when we divested those businesses.
22
Going forward, our results of discontinued operations may include additional costs above those currently estimated and accrued related to previously divested businesses, mainly related to a power electronics business that we divested in October 2006 (see Note 10 of Notes to Consolidated Financial Statements under Item 8).
Critical Accounting Policies
Our accounting policies are more fully described in Note 1 of Notes to Consolidated Financial Statements under Item 8. As disclosed in Note 1, the preparation of financial statements in conformity with accounting principles generally accepted in the United States requires estimates and judgments by management that affect the reported amount of assets and liabilities, revenues, expenses, and related disclosures. Such estimates are based upon historical experience and other assumptions believed to be reasonable given known circumstances. Actual results could differ from those estimates. On an ongoing basis, we evaluate and update our estimates, and we believe the following discussion addresses our policies which are most critical to understanding our financial position and results of operations and which require our most complex judgments.
Accounts Receivable
Accounts receivable represent amounts due from customers in the ordinary course of business. We are subject to losses from uncollectable receivables in excess of our allowances. We maintain allowances for doubtful accounts for estimated losses from customers’ inability to make required payments. In order to estimate the appropriate level of these allowances, we analyze historical bad debts, customer concentrations, current customer creditworthiness, current economic trends, and changes in customer payment patterns. Our total allowance includes a specific allowance based on identification of customers where we feel full payment is in doubt, as well as a general allowance calculated based on our historical losses on accounts receivable as a percentage of historical sales. We believe that our methodology has been effective in accurately quantifying our allowance for doubtful accounts and do not anticipate changing our methodology in the future. However, if the financial condition of any of our customers was to deteriorate and impair their ability to make payments, additional allowances may be required in future periods. We believe that all appropriate allowances have been provided.
Inventories
Our inventories are stated at the lower of cost or market. Cost is determined by the first-in, first-out ("FIFO") method, including material, labor, and factory overhead. We identify potentially obsolete and excess inventory by evaluating overall inventory levels in relation to expected future requirements and market conditions, and provisions for excess and obsolete inventory and inventory valuation are recorded accordingly. Items with no usage for the past 12 months and no expected future usage are considered obsolete, and are disposed of or fully reserved. Reserves for excess inventory are determined based upon historical and anticipated usage as compared to quantities on hand. Excess inventory is defined as inventory items with on-hand quantities in excess of one year’s usage and specified percentages are applied to the excess inventory value in determining the reserve. We believe that our assumptions regarding inventory valuation have been accurate in the past and believe that all appropriate reserves for excess and obsolete inventory have been provided.
Long-Lived Assets and Goodwill
We periodically evaluate the recoverability of our long-lived assets, including property, plant and equipment. Impairment charges are recorded in operating results when the undiscounted future expected cash flows derived from an asset are less than the carrying value of the asset. In fiscal 2012, given diminished prospects for sales of wind and solar inverters, we recorded an impairment charge of $1.2 million. The impairment charge was comprised entirely of accelerated depreciation related to fixed assets used in the production and testing of inverters, and is included in cost of sales in the accompanying statement of operations for fiscal 2012 (see Note 8 of Notes to Consolidated Financial Statements under Item 8).
We are required to perform annual impairment tests of our goodwill, and may be required to test more frequently in certain circumstances. We have elected to perform our annual impairment test in the fourth quarter of our fiscal year. Per Accounting Standards Codification (“ASC”) Topic 350, Intangibles – Goodwill and Others, the best evidence of fair value is quoted prices in active markets. Accordingly, we believe that our market capitalization is the best indication of fair value. No impairments were recognized in goodwill or other intangible assets during fiscal years 2014, 2013, or 2012.
Pension Benefits
We sponsor a defined benefit plan ("pension plan") that was frozen in 2003 which covers primarily former employees in the U.S. The valuation of our pension plan requires the use of assumptions and estimates that attempt to anticipate future
23
events to develop actuarial valuations of pension expense, assets, and liabilities. These assumptions include expected rates of return on plan assets, discount rates, and mortality rates.
We determine the expected return on plan assets based upon an overall estimated long-term rate of return over the period that benefits are projected to be paid. This estimate considers the targeted allocation of pension plan assets among securities with various risk and return profiles. Our analysis incorporates historical and anticipated economic data and market conditions, analyzing future expectations of asset performance, past return results, and current and expected asset allocations. Based on the results of these periodic reviews, we established our long-term expected return on plan assets of 7.75% for cost recognition purposes for fiscal years 2014 and 2013, a decrease from the expected rate of return of 8.25% for cost recognition purposes in fiscal year 2012. We anticipate our long-term expected return on plan assets to remain at 7.75% for cost recognition purposes for fiscal year 2015.
The discount rate reflects the market for high-quality fixed income corporate debt instruments and is subject to change each year. As of December 28, 2014, the discount rate used to determine the benefit obligation was 3.55% as compared to 4.45% at December 29, 2013, reflecting the declining interest rate environment that prevailed throughout much of fiscal year 2014.
In October 2014, the Society of Actuaries recommended the use of an updated mortality table commonly referred to as the RP-2014 table that includes increased life expectancy assumptions. We adopted the RP-2014 table in measuring our pension plan as of the end of fiscal 2014, with a scale adjustment to the table to better reflect the actual mortality of our pension plan. The adoption of the RP-2014 table with scale adjustment increased our pension liability by approximately $5 million as of December 28, 2014.
We believe that the assumptions we used in valuing our pension plan are appropriate and reasonable, however, actual experience may differ from our assumptions. Actual results that differ from assumptions are accumulated as deferred actuarial gains or losses, and are recognized as increases or decreases in other comprehensive income or loss ("OCI"). The amount accumulated in OCI impacts future periodic pension expense through subsequent amortization of the gains and losses in accordance with the methods specified in ASC Topic 715, Employers’ Accounting for Pensions ("ASC 715"). As permitted under ASC 715, we use the corridor approach to determine the aggregate amount of actuarial gains or losses that must be recognized. We then amortize those gains or losses on a straight-line basis over the average future life expectancy of our plan participants, due to the fact that all of our plan participants are considered inactive since our plan has been frozen since 2003. Deferred actuarial losses which will be amortized into earnings in future accounting periods totaled $134 million at December 28, 2014.
We contributed $19.1 million in cash to our pension plan in fiscal 2014 and also made a voluntary excess contribution in September 2014 of 250,000 shares of Company common stock to the plan, valued at $7.4 million at that time. We are not required to make any mandatory minimum contributions to our pension plan in fiscal 2015. Given our current actuarial assumptions, pension expense for fiscal 2015 is expected to decrease to approximately $2.0 million (see Note 12 of Notes to Consolidated Financial Statements under Item 8).
Reserves for Contingencies
We periodically record the estimated impact of various conditions, situations, or circumstances involving uncertain outcomes. The accounting for such events is prescribed under ASC Topic 450, Contingencies ("ASC 450"). ASC 450 defines a contingency as an existing condition, situation, or set of circumstances involving uncertainty as to possible gain or loss to an entity that will ultimately be resolved when one or more future events occur or fail to occur.
ASC 450 does not permit the accrual of gain contingencies under any circumstances. For loss contingencies, the loss must be accrued if information is available that indicates it is probable that the loss has been incurred, given the likelihood of uncertain events, and the amount of the loss can be reasonably estimated.
The accrual of a contingency involves considerable judgment and we use our internal expertise and outside experts, as necessary, to help estimate the probability that a loss has been incurred and to assist in determining the amount or range of the loss.
Income Taxes
We operate in several taxing jurisdictions and are subject to a variety of income and related taxes. Judgment is required in determining our provision for income taxes and related tax assets and liabilities. We believe we have reasonably
24
estimated our tax positions for all jurisdictions for all open tax periods. However, it is possible that, upon closure of our tax periods, our final tax liabilities could differ from our estimates.
We record deferred income tax assets in tax jurisdictions where we generate losses for income tax purposes. We also record valuation allowances against these deferred tax assets in accordance with ASC Topic 740, Income Taxes, when in our judgment, the deferred income tax assets will likely not be realized in the foreseeable future.
Since fiscal 2002, we have provided valuation reserves against our U.S. deferred tax assets that result in a net deferred tax liability position. A portion of our deferred tax liability relates to tax-deductible amortization of goodwill that is no longer amortized for financial reporting purposes. Under applicable accounting rules, such deferred tax liabilities are considered to have an indefinite life and are therefore ineligible to be considered as a source of future taxable income in assessing the realization of deferred tax assets.
Results of Operations for the Twelve Months Ended December 28, 2014 (Fiscal Year 2014), Compared with the Twelve Months Ended December 29, 2013 (Fiscal Year 2013)
Net Sales and Gross Profit
Net sales increased 6% to $109.7 million for the twelve months ended December 28, 2014, from sales of $103.3 million for the twelve months ended December 29, 2013. The increase in net sales was due primarily to higher sales of products for material handling applications, which increased $4.2 million year-over-year, and higher sales of products for elevator applications, which increased $1.4 million. In addition, sales into renewable energy markets increased $0.9 million year-over-year to $1.7 million due to higher sales of spare parts in support of our installed base of inverters operating in wind turbines. Net sales by primary market were as follows, in millions:
Twelve Months Ended | December 28, 2014 | December 29, 2013 | ||||||||||||
Sales | % of Sales | Sales | % of Sales | |||||||||||
Material handling | $ | 80.8 | 74 | % | $ | 76.6 | 74 | % | ||||||
Elevator motion control | 23.6 | 21 | % | 22.2 | 22 | % | ||||||||
Energy systems (renewable energy and mining) | 5.3 | 5 | % | 4.5 | 4 | % | ||||||||
Total net sales | $ | 109.7 | 100 | % | $ | 103.3 | 100 | % | ||||||
Gross profit for the twelve months ended December 28, 2014, increased to $40.0 million (36.4% of sales) from $35.3 million (34.2% of sales) in the twelve months ended December 29, 2013. The increase in gross profit for the twelve months ended December 28, 2014, was primarily due to higher sales volumes into material handling and elevator markets, an improved sales mix with more large scale projects, cost reduction efforts enacted in the second half of fiscal 2013 and early fiscal 2014, and selective pricing actions on certain legacy products.
Operating Expenses
Operating expenses are comprised of R&D expense, pension expense, and sales, general and administrative (“SG&A”) expenses. R&D expense was $3.2 million for the twelve months ended December 28, 2014, or 2.9% of sales, comparable to R&D expense of $3.2 million, or 3.1% of sales, for the twelve months ended December 29, 2013.
Pension expense for the twelve months ended December 28, 2014, increased to $40.3 million from $6.4 million in the twelve months ended December 29, 2013 (see Note 12 of of Notes to Consolidated Financial Statements under Item 8). The significant increase in pension expense in fiscal 2014 was entirely due to a pension settlement charge of $37.1 million related to a lump sum window program we completed in fiscal 2014. Excluding this non-recurring, non-cash settlement charge, pension expense would have been $3.2 million.
SG&A expense was $22.2 million, or 20.2% of sales, for the twelve months ended December 28, 2014, compared to $20.9 million, or 20.3% of sales, for the twelve months ended December 29, 2013. Selling expenses decreased to $11.6 million, or 10.6% of sales, for the twelve months ended December 28, 2014, from $12.0 million, or 11.6% of sales, for the twelve months ended December 29, 2013, mainly due to lower payroll-related costs and lower discretionary spending, partially offset by increased variable selling expenses from higher sales volumes. General and administrative (“G&A”) expense
25
increased to $10.6 million for the twelve months ended December 28, 2014, from G&A expense of $8.9 million for the twelve months ended December 29, 2013, due mainly to higher incentive compensation provisions in fiscal 2014.
Income (Loss) from Operations
We reported a loss from operations of $25.7 million for the twelve months ended December 28, 2014, compared to income from operations of $4.8 million for the twelve months ended December 29, 2013. The loss from operations in fiscal 2014 was due to the pension settlement charge of $37.1 million.
Provision for Income Taxes
We recorded a tax provision of $0.7 million for the twelve months ended December 28, 2014, and $1.0 million for the twelve months ended December 29, 2013, mainly due to non-cash deferred tax provisions of $0.7 million and $0.9 million recorded in those periods respectively, related to changes in deferred tax liabilities from goodwill amortization. The remainder of our provision or benefit for income taxes is comprised of provisions or benefit for income taxes on our pretax operating results in Canada (see Note 9 of Notes to Consolidated Financial Statements under Item 8).
Income (Loss) from Continuing Operations
For the twelve months ended December 28, 2014, we recorded a loss from continuing operations of $26.4 million, or $7.89 per diluted share, compared to income from continuing operations of $3.8 million for the twelve months ended December 29, 2013, or $1.13 per share, on a diluted basis.
Income (Loss) from Discontinued Operations
We recorded a loss from discontinued operations for the twelve months ended December 28, 2014, of $0.8 million, or a $0.24 loss per share on a diluted basis, compared to a loss from discontinued operations of $0.6 million, or a $.19 loss per share on a diluted basis, for the twelve months ended December 29, 2013.
Our loss from discontinued operations in both periods related entirely to previously divested businesses, comprised mainly of legal and professional fees incurred in various matters (see Notes 2 and 10 of Notes to Consolidated Financial Statements under Item 8).
Net Income (Loss)
We recorded a net loss for the twelve months ended December 28, 2014, of $27.3 million, or a loss of $8.13 per share on a diluted basis, compared to net income of $3.1 million, or $.94 per share, on a diluted basis for the twelve months ended December 29, 2013.
Results of Operations for the Twelve Months Ended December 29, 2013 (Fiscal Year 2013), Compared with the Twelve Months Ended December 30, 2012 (Fiscal Year 2012)
Net Sales and Gross Profit
Net sales decreased 10% to $103.3 million for the twelve months ended December 29, 2013, from sales of $114.3 million for the twelve months ended December 30, 2012. The decrease in net sales was due primarily to lower sales of products for material handling applications, which decreased $4.4 million year-over-year, and lower sales of products for mining applications, which decreased $3.3 million. In addition, sales into renewable energy markets declined $2.9 million year-over-year following our decision late in fiscal 2012 to no longer pursue new business opportunities in those markets. Net sales by primary market were as follows, in millions:
26
Twelve Months Ended | December 29, 2013 | December 30, 2012 | ||||||||||||
Sales | % of Sales | Sales | % of Sales | |||||||||||
Material handling | $ | 76.6 | 74 | % | $ | 81.0 | 71 | % | ||||||
Elevator motion control | 22.2 | 22 | % | 22.6 | 20 | % | ||||||||
Energy systems (renewable energy and mining) | 4.5 | 4 | % | 10.7 | 9 | % | ||||||||
Total net sales | $ | 103.3 | 100 | % | $ | 114.3 | 100 | % | ||||||
Gross profit for the twelve months ended December 29, 2013, decreased to $35.3 million (34.2% of sales) from $39.8 million (34.9% of sales) in the twelve months ended December 30, 2012. The decrease in gross profit for the twelve months ended December 30, 2012, was primarily due to lower sales volumes into material handling and mining markets, partially offset by pricing actions and cost reduction efforts enacted in the second half of fiscal 2013. Gross profit for fiscal 2012 was impacted by asset impairment charges of $1.2 million recorded in fiscal 2012 related to our renewable energy fixed assets.
Operating Expenses
Operating expenses are comprised of R&D expense, pension expense, and sales, general and administrative (“SG&A”) expenses. R&D expense was $3.2 million for the twelve months ended December 29, 2013, or 3.1% of sales, compared to R&D expense of $3.8 million, or 3.4% of sales, for the twelve months ended December 30, 2012. The year-over-year decrease in R&D expense was mainly due to the lack of development projects related to products with renewable energy applications in fiscal 2013.
Pension expense for the twelve months ended December 29, 2013, decreased to $6.4 million from $6.9 million in the twelve months ended December 30, 2012 (see Note 12 of of Notes to Consolidated Financial Statements under Item 8).
SG&A expense was $20.9 million, or 20.3% of sales, for the twelve months ended December 29, 2013, compared to $21.1 million, or 18.4% of sales, for the twelve months ended December 30, 2012. Selling expenses were $12.0 million, or 11.6% of sales, for the twelve months ended December 29, 2013, comparable to $12.2 million, or 10.6% of sales, for the twelve months ended December 30, 2012. General and administrative (“G&A”) expense was $8.9 million for the twelve months ended December 29, 2013, comparable to G&A expense of $8.9 million for the twelve months ended December 30, 2012.
Income from Operations
Income from operations was $4.8 million for the twelve months ended December 29, 2013, compared to income from operations of $8.0 million for the twelve months ended December 30, 2012.
Provision for Income Taxes
We recorded a tax provision of $1.0 million for the twelve months ended December 29, 2013, and $1.1 million for the twelve months ended December 30, 2012, mainly due to non-cash deferred tax provisions of $0.9 million and $1.0 million recorded in those periods respectively, related to changes in deferred tax liabilities from goodwill amortization. The remainder of our provision or benefit for income taxes is comprised of provisions or benefit for income taxes on our pretax operating results in Canada (see Note 9 of Notes to Consolidated Financial Statements under Item 8).
Income from Continuing Operations
For the twelve months ended December 29, 2013, we recorded income from continuing operations of $3.8 million, or $1.13 per diluted share, compared to income from continuing operations of $6.9 million for the twelve months ended December 30, 2012, or $2.14 per share, on a diluted basis.
Income (Loss) from Discontinued Operations
We recorded a loss from discontinued operations for the twelve months ended December 29, 2013, of $0.6 million, or a $0.19 loss per share on a diluted basis, compared to income from discontinued operations of $5.7 million, or $1.76 per share on a diluted basis, for the twelve months ended December 30, 2012.
27
Our loss from discontinued operations for the twelve month period ended December 29, 2013, related entirely to previously divested businesses, comprised mainly of legal and professional fees incurred in various matters (see Notes 2 and 10 of Notes to Consolidated Financial Statements under Item 8).
Income from discontinued operations for the twelve months ended December 30, 2012, includes a gain of $5.0 million from a settlement agreement to resolve a legal matter, as well as income of $1.2 million from non-cash adjustments of liabilities related to previously owned businesses, partially offset by $0.5 million of legal fees and other costs related to previously divested businesses (see Notes 2 and 10 of Notes to Consolidated Financial Statements under Item 8).
Net Income
We recorded net income for the twelve months ended December 29, 2013, of $3.1 million, or $0.94 per share on a diluted basis, compared to net income of $12.6 million, or $3.90 per share, on a diluted basis for the twelve months ended December 30, 2012.
Liquidity and Capital Resources
Our unrestricted cash and cash equivalent balances decreased $5.3 million during fiscal 2014, from $15.0 million at December 29, 2013, to $9.7 million at December 28, 2014. Restricted cash balances remained unchanged during fiscal 2014 at $0.3 million. The primary source of cash during fiscal 2014 was adjusted earnings before non-cash charges for depreciation, amortization, pension, stock compensation and deferred income tax provisions of $16.0 million.
The primary uses of cash in fiscal 2014 were $19.1 million in contributions to our defined benefit pension plan, $1.0 million for capital expenditures, and $0.9 million of disbursements related to discontinued operations. There were no significant changes in our operating assets and liabilities in total, as increases in accounts receivable and, to a lesser extent, inventories were largely offset by increases in other accrued liabilities (see Note 14 of Notes to Consolidated Financial Statements). Our accounts receivable increased during fiscal 2014 by $1.9 million mainly due to higher volume in fiscal 2014. Current liabilities increased during fiscal 2014 by $1.8 million, mainly due to incentive compensation amounts accrued as of the end of fiscal 2014.
While we may make further investments to increase capacity and improve efficiency, we do not anticipate that capital expenditures during fiscal 2015 will exceed $1.5 million. The expected amount of capital expenditures could change depending upon changes in revenue levels, our financial condition, and the general economy.
In December 2007, we entered into an agreement with Associated Bank, N.A. ("Associated Bank") providing for a $10 million revolving credit facility (the “revolving facility”). Borrowings under the revolving facility bear interest at the London Interbank Offering Rate (“LIBOR”) plus 1.5%, with borrowing levels determined by a borrowing base formula as defined in the agreement, based on the level of eligible accounts receivable. The revolving facility also supports the issuance of letters of credit, places certain restrictions on our ability to pay dividends or make acquisitions, and includes covenants which required minimum operating profit levels and limited annual capital expenditures. Borrowings under the revolving facility at that time were collateralized by our accounts receivable and inventory.
We have subsequently entered into several amendments to the revolving facility, mainly to increase the commitment amount of Associated Bank to $12.5 million, extend the maturity date of the revolving facility, to broaden the security interest of Associated Bank to collateralize all of our assets, and to establish or modify certain covenants with which we must comply under the terms of the amended revolving facility.
On June 15, 2014, we entered into the seventh amendment to the revolving facility with Associated Bank, the purpose of which was to (i) extend the maturity date of the revolving facility to June 15, 2015; (ii) retain the commitment amount of Associated Bank at $12.5 million; (iii) establish minimum quarterly adjusted earnings before interest, taxes, depreciation and amortization requirements for the term of the agreement; and (iv) establish maximum quarterly cash amounts that can be contributed to our defined benefit pension plan for the term of the agreement.
On August 20, 2014, we entered into the eighth amendment to the revolving facility with Associated Bank, the purpose of which was to increase the maximum quarterly cash amounts that can be contributed to our defined benefit pension plan for the term of the agreement.
There were no amounts outstanding under the revolving facility as of December 28, 2014. We are currently in compliance with all covenants of the revolving credit facility, as amended.
28
Primarily as a result of the decline in interest rates over the past decade, the accumulated benefit obligation of our defined benefit pension plan currently exceeds plan assets. We contributed $30 million to our pension plan in December 2006 following the divestiture of our power electronics business, and subsequently have made cash contributions to the plan aggregating $94 million from April 2008 through December 2014, including cash contributions of $19 million during fiscal 2014. These contributions have been funded by cash generated from operations and existing cash on hand. Estimated future contributions to achieve 100% funded status, as measured using current actuarial assumptions, are projected to be approximately $25 million. We are not required to make any mandatory minimum contributions to our pension plan in fiscal 2015. Actual future contribution amounts will likely vary from current estimated future contributions, depending on future interest rate levels, values in equity and fixed income markets, and the level and timing of additional interim contributions we may make to plan assets.
Based upon current plans and business conditions, we believe that current cash balances and internally generated cash flows will be sufficient to fund anticipated operational needs, capital expenditures, and other commitments over the next 12 months.
Off-Balance Sheet Arrangements
We did not have any off-balance sheet arrangements or variable interest entities as of December 28, 2014.
Summary of Contractual Obligations and Commitments
Future payments due under contractual obligations of our continuing operations as of December 28, 2014, were as follows (in thousands):
Less than 1 Year | 1 to 3 Years | 3 to 5 Years | More than 5 Years | Total | ||||||||||||||||
Pension funding obligations | $ | — | $ | 5,600 | $ | 4,400 | $ | 15,000 | $ | 25,000 | ||||||||||
Operating lease obligations | 1,254 | 1,906 | 1,705 | 1,116 | 5,981 | |||||||||||||||
Purchase obligations | 14,654 | — | — | — | 14,654 | |||||||||||||||
Total | $ | 15,908 | $ | 7,506 | $ | 6,105 | $ | 16,116 | $ | 45,635 | ||||||||||
Pension funding amounts in the table above are based on current regulations and actuarial estimates as of December 28, 2014, and are not discounted. The net present value of our future pension funding obligations, discounted at a rate of 3.55% (the rate used to estimate our projected benefit obligation at December 2014), total approximately $21.2 million. Estimated pension funding obligation amounts could vary, depending on future interest rate levels, values in equity and fixed-income markets, changes in mortality rates, or changes in pension funding legislation that may be enacted in the future.
ITEM 7A. QUANTITATIVE AND QUALITATIVE DISCLOSURES ABOUT MARKET RISK
Interest Rates
The fair value of our debt was zero at December 28, 2014. However, we do have pension liabilities and funding obligations which vary as interest rates change. We used an average interest rate of 4.9% in determining our aggregate pension funding obligations of approximately $25 million as of December 28, 2014 (see “Summary of Contractual Obligations and Commitments” table under Item 7). A hypothetical increase of 100 basis points from the average interest rate used in the calculation would reduce our aggregate pension funding obligation to approximately $18 million at December 28, 2014. Similarly, a hypothetical decrease of 100 basis points would increase our aggregate pension funding obligation to approximately $37 million at December 28, 2014.
Foreign Currency Exchange Rates
We generally do not enter into foreign exchange contracts to protect against reductions in value and volatility of future cash flows caused by changes in exchange rates, but we may selectively enter into foreign exchange contracts to hedge certain exposures. Gains and losses on these non-U.S. currency investments would generally be offset by corresponding losses and gains on the related hedging instruments, resulting in negligible net exposure.
We did not have any foreign currency contracts, or hedge instruments or contracts outstanding at December 28, 2014, or December 29, 2013.
29
ITEM 8. FINANCIAL STATEMENTS AND SUPPLEMENTARY DATA
REPORT OF INDEPENDENT REGISTERED PUBLIC ACCOUNTING FIRM
The Board of Directors and Stockholders
Magnetek, Inc.
We have audited the accompanying consolidated balance sheets of Magnetek, Inc. as of December 28, 2014 and December 29, 2013, and the related consolidated statements of operations, comprehensive income, stockholders' equity (deficit), and cash flows for the years ended December 28, 2014, December 29, 2013 and December 30, 2012. These financial statements are the responsibility of the Company's management. Our responsibility is to express an opinion on these financial statements based on our audits.
We conducted our audits in accordance with the standards of the Public Company Accounting Oversight Board (United States). Those standards require that we plan and perform the audit to obtain reasonable assurance about whether the financial statements are free of material misstatement. We were not engaged to perform an audit of the Company's internal control over financial reporting. Our audits included consideration of internal control over financial reporting as a basis for designing audit procedures that are appropriate in the circumstances, but not for the purpose of expressing an opinion on the effectiveness of the Company's internal control over financial reporting. Accordingly, we express no such opinion. An audit also includes examining, on a test basis, evidence supporting the amounts and disclosures in the financial statements, assessing the accounting principles used and significant estimates made by management, and evaluating the overall financial statement presentation. We believe that our audits provide a reasonable basis for our opinion.
In our opinion, the financial statements referred to above present fairly, in all material respects, the consolidated financial position of Magnetek, Inc. as of December 28, 2014 and December 29, 2013, and the consolidated results of its operations and its cash flows for the years ended December 28, 2014, December 29, 2013 and December 30, 2012, in conformity with U.S. generally accepted accounting principles.
/s/ Ernst & Young LLP | |
Milwaukee, Wisconsin | |
March 20, 2015
30
CONSOLIDATED STATEMENTS OF OPERATIONS
Fiscal Year Ended | ||||||||||||
(Amounts in thousands, except per share data) | December 28, 2014 | December 29, 2013 | December 30, 2012 | |||||||||
Net sales | $ | 109,713 | $ | 103,316 | $ | 114,274 | ||||||
Cost of sales | 69,762 | 67,991 | 74,430 | |||||||||
Gross profit | 39,951 | 35,325 | 39,844 | |||||||||
Operating expenses: | ||||||||||||
Research and development | 3,174 | 3,246 | 3,834 | |||||||||
Pension expense | 40,349 | 6,365 | 6,936 | |||||||||
Sales, general and administrative | 22,158 | 20,939 | 21,052 | |||||||||
Income (loss) from operations | (25,730 | ) | 4,775 | 8,022 | ||||||||
Provision for income taxes | 715 | 1,016 | 1,096 | |||||||||
Income (loss) from continuing operations | (26,445 | ) | 3,759 | 6,926 | ||||||||
Income (loss) from discontinued operations, net of tax | (818 | ) | (627 | ) | 5,697 | |||||||
Net income (loss) | $ | (27,263 | ) | $ | 3,132 | $ | 12,623 | |||||
Earnings (loss) per common share - basic | ||||||||||||
Income (loss) from continuing operations | $ | (7.89 | ) | $ | 1.16 | $ | 2.18 | |||||
Income (loss) from discontinued operations | $ | (0.24 | ) | $ | (0.19 | ) | $ | 1.79 | ||||
Net income (loss) | $ | (8.13 | ) | $ | 0.97 | $ | 3.97 | |||||
Earnings (loss) per common share - diluted | ||||||||||||
Income (loss) from continuing operations | $ | (7.89 | ) | $ | 1.13 | $ | 2.14 | |||||
Income (loss) from discontinued operations | $ | (0.24 | ) | $ | (0.19 | ) | $ | 1.76 | ||||
Net income (loss) | $ | (8.13 | ) | $ | 0.94 | $ | 3.90 | |||||
Weighted average shares outstanding - basic | 3,350 | 3,231 | 3,174 | |||||||||
Weighted average shares outstanding - diluted | 3,350 | 3,339 | 3,238 | |||||||||
The accompanying notes are an integral part of these consolidated financial statements.
31
CONSOLIDATED STATEMENTS OF COMPREHENSIVE INCOME
Fiscal Year Ended | ||||||||||||
(Amounts in thousands) | December 28, 2014 | December 29, 2013 | December 30, 2012 | |||||||||
Net income (loss) | $ | (27,263 | ) | $ | 3,132 | $ | 12,623 | |||||
Change in unrecognized pension liability | 35,022 | 35,389 | (8,867 | ) | ||||||||
Change in currency translation adjustments | (421 | ) | (284 | ) | 132 | |||||||
Comprehensive income | $ | 7,338 | $ | 38,237 | $ | 3,888 | ||||||
The accompanying notes are an integral part of these consolidated financial statements.
32
CONSOLIDATED BALANCE SHEETS
As of (Amounts in thousands) | December 28, 2014 | December 29, 2013 | ||||||
Assets | ||||||||
Current assets: | ||||||||
Cash | $ | 9,702 | $ | 14,960 | ||||
Restricted cash | 262 | 262 | ||||||
Trade accounts receivable, less allowances for doubtful accounts | 16,975 | 15,100 | ||||||
Inventories | 13,626 | 13,322 | ||||||
Prepaid expenses and other current assets | 801 | 814 | ||||||
Total current assets | 41,366 | 44,458 | ||||||
Property, plant and equipment: | ||||||||
Buildings and improvements | 1,962 | 1,963 | ||||||
Machinery and equipment | 21,109 | 21,301 | ||||||
Less accumulated depreciation | 20,140 | 20,529 | ||||||
Net property, plant and equipment | 2,931 | 2,735 | ||||||
Goodwill | 30,364 | 30,427 | ||||||
Other assets | 4,039 | 4,349 | ||||||
Total assets | $ | 78,700 | $ | 81,969 | ||||
Liabilities and Stockholders' Equity | ||||||||
Current liabilities: | ||||||||
Accounts payable | $ | 10,375 | $ | 10,403 | ||||
Accrued liabilities | 6,703 | 4,833 | ||||||
Total current liabilities | 17,078 | 15,236 | ||||||
Long-term pension benefit obligations | 27,360 | 48,461 | ||||||
Other long-term obligations | 845 | 911 | ||||||
Deferred income taxes | 9,798 | 9,125 | ||||||
Commitments and contingencies | ||||||||
Stockholders' Equity: | ||||||||
Common stock, $0.01 par value, 15,000 shares authorized; 3,535 and 3,260 outstanding at December 28, 2014 and December 29, 2013, respectively | 35 | 33 | ||||||
Additional paid-in capital | 150,641 | 142,598 | ||||||
Retained earnings (accumulated deficit) | (10,175 | ) | 17,088 | |||||
Accumulated other comprehensive loss | (116,882 | ) | (151,483 | ) | ||||
Total stockholders' equity | 23,619 | 8,236 | ||||||
Total liabilities and stockholders' equity | $ | 78,700 | $ | 81,969 | ||||
The accompanying notes are an integral part of these consolidated financial statements.
33
CONSOLIDATED STATEMENTS OF STOCKHOLDERS' EQUITY (DEFICIT)
Retained | Accumulated | |||||||||||||||||||||
Additional | Earnings | Other | ||||||||||||||||||||
Common Stock | Paid-in | (Accumulated | Comprehensive | |||||||||||||||||||
(Amounts in thousands) | Shares | Amount | Capital | Deficit) | Loss | Total | ||||||||||||||||
Balance, January 1, 2012 | 3,158 | $ | 32 | $ | 140,743 | $ | 1,333 | $ | (177,853 | ) | $ | (35,745 | ) | |||||||||
Stock-based compensation expense | — | — | 824 | 824 | ||||||||||||||||||
Shares issued | 42 | — | — | |||||||||||||||||||
Shares purchased | (14 | ) | — | (151 | ) | (151 | ) | |||||||||||||||
Shares issued to trust | 23 | — | 309 | 309 | ||||||||||||||||||
Net income (loss) | 12,623 | 12,623 | ||||||||||||||||||||
Translation adjustments | 132 | 132 | ||||||||||||||||||||
Pension adjustments | (8,867 | ) | (8,867 | ) | ||||||||||||||||||
Comprehensive income (loss) | 3,888 | |||||||||||||||||||||
Balance, December 30, 2012 | 3,209 | $ | 32 | $ | 141,725 | $ | 13,956 | $ | (186,588 | ) | $ | (30,875 | ) | |||||||||
Exercise of stock options | 8 | — | 99 | 99 | ||||||||||||||||||
Stock-based compensation expense | — | — | 676 | 676 | ||||||||||||||||||
Shares issued | 37 | 1 | 1 | |||||||||||||||||||
Shares purchased | (13 | ) | — | (218 | ) | (218 | ) | |||||||||||||||
Shares issued to trust | 19 | — | 316 | 316 | ||||||||||||||||||
Net income (loss) | 3,132 | 3,132 | ||||||||||||||||||||
Translation adjustments | (284 | ) | (284 | ) | ||||||||||||||||||
Pension adjustments | 35,389 | 35,389 | ||||||||||||||||||||
Comprehensive income (loss) | 38,237 | |||||||||||||||||||||
Balance, December 29, 2013 | 3,260 | $ | 33 | $ | 142,598 | $ | 17,088 | $ | (151,483 | ) | $ | 8,236 | ||||||||||
Stock-based compensation expense | — | — | 599 | 599 | ||||||||||||||||||
Shares issued | 22 | — | — | — | ||||||||||||||||||
Shares purchased | (8 | ) | — | (211 | ) | (211 | ) | |||||||||||||||
Shares issued to trust | 11 | — | 285 | 285 | ||||||||||||||||||
Shares issued to pension plan | 250 | 2 | 7,370 | 7,372 | ||||||||||||||||||
Net income (loss) | (27,263 | ) | (27,263 | ) | ||||||||||||||||||
Translation adjustments | (421 | ) | (421 | ) | ||||||||||||||||||
Pension adjustments | 35,022 | 35,022 | ||||||||||||||||||||
Comprehensive income (loss) | 7,338 | |||||||||||||||||||||
Balance, December 28, 2014 | 3,535 | $ | 35 | $ | 150,641 | $ | (10,175 | ) | $ | (116,882 | ) | $ | 23,619 | |||||||||
The accompanying notes are an integral part of these consolidated financial statements.
34
CONSOLIDATED STATEMENTS OF CASH FLOWS
Fiscal Year Ended | ||||||||||||
(Amounts in thousands) | December 28, 2014 | December 29, 2013 | December 30, 2012 | |||||||||
Cash flows from operating activities: | ||||||||||||
Net income (loss) | $ | (27,263 | ) | $ | 3,132 | $ | 12,623 | |||||
Loss (income) from discontinued operations | 818 | 627 | (5,697 | ) | ||||||||
Adjustments to reconcile net income (loss) to net cash provided by (used) operating activities: | ||||||||||||
Depreciation | 760 | 663 | 2,082 | |||||||||
Amortization | 53 | 53 | 53 | |||||||||
Stock-based compensation expense | 599 | 676 | 824 | |||||||||
Pension expense | 40,349 | 6,365 | 6,936 | |||||||||
Deferred income tax provision | 673 | 929 | 950 | |||||||||
Changes in operating assets and liabilities | 13 | 448 | (1,465 | ) | ||||||||
Cash contribution to pension fund | (19,056 | ) | (24,856 | ) | (11,571 | ) | ||||||
Net cash provided by (used in) operating activities: | ||||||||||||
Continuing operations | (3,054 | ) | (11,963 | ) | 4,735 | |||||||
Discontinued operations | (907 | ) | (1,145 | ) | 4,079 | |||||||
Net cash provided by (used in) operating activities | (3,961 | ) | (13,108 | ) | 8,814 | |||||||
Cash flows from investing activities: | ||||||||||||
Capital expenditures | (962 | ) | (549 | ) | (869 | ) | ||||||
Net cash provided by (used in) investing activities: | ||||||||||||
Continuing operations | (962 | ) | (549 | ) | (869 | ) | ||||||
Discontinued operations | — | — | — | |||||||||
Net cash provided by (used in) investing activities | (962 | ) | (549 | ) | (869 | ) | ||||||
Cash flow from financing activities: | ||||||||||||
Proceeds from issuance of common stock | 285 | 416 | 309 | |||||||||
Purchase and retirement of treasury stock | (211 | ) | (218 | ) | (151 | ) | ||||||
Principal payments under capital lease obligations | — | (3 | ) | (3 | ) | |||||||
Net cash provided by (used in) financing activities: | ||||||||||||
Continuing operations | 74 | 195 | 155 | |||||||||
Discontinued operations | — | — | — | |||||||||
Net cash provided by (used in) financing activities | 74 | 195 | 155 | |||||||||
Effect of exchange rate changes on cash | (409 | ) | (284 | ) | 12 | |||||||
Net increase (decrease) in cash | (5,258 | ) | (13,746 | ) | 8,112 | |||||||
Cash at the beginning of the period | 14,960 | 28,706 | 20,594 | |||||||||
Cash at the end of the period | $ | 9,702 | $ | 14,960 | $ | 28,706 | ||||||
The accompanying notes are an integral part of these consolidated financial statements.
35
NOTES TO CONSOLIDATED FINANCIAL STATEMENTS
(All amounts in the notes to consolidated financial statements are expressed in thousands unless otherwise noted, except share and per share data)
1. Summary of Significant Accounting Policies
Profile
Magnetek, Inc. (the “Company” or “Magnetek”) is a global provider of digital power control systems that are used to control motion and power primarily in material handling, elevator, and mining applications. The Company’s products consist primarily of programmable motion control and power conditioning systems used on overhead cranes and hoists, elevators, and underground mining equipment.
Basis of Presentation
The consolidated financial statements include the accounts of Magnetek, Inc. and its subsidiaries. All significant intercompany accounts and transactions have been eliminated.
Fiscal Year
On August 4, 2011, the Company's Board of Directors approved a change in the Company's fiscal year-end from the Sunday nearest to June 30 of each calendar year to the Sunday nearest to December 31, with the change to a calendar year reporting cycle beginning January 2, 2012. The intent of the change was to align the reporting of financial results more closely with peers and to better align the Company's business cycle with suppliers and customers. Fiscal years 2014, 2013, and 2012 refer to the twelve-month periods ended December 28, 2014, December 29, 2013, and December 30, 2012, respectively, and each fiscal year contained 52 weeks.
Use of Estimates
The preparation of financial statements in accordance with accounting principles generally accepted in the United States requires management to make estimates and assumptions that affect the amounts reported in the financial statements and accompanying notes. Actual results could differ from those estimates.
Accounts Receivable
Accounts receivable represent amounts due from customers in the ordinary course of business. The Company is subject to losses from uncollectable receivables in excess of its allowances. The Company maintains allowances for doubtful accounts for estimated losses from customers’ inability to make required payments. In order to estimate the appropriate level of these allowances, the Company analyzes historical bad debts, customer concentrations, current customer creditworthiness, current economic trends, and changes in customer payment patterns. If the financial conditions of the Company’s customers were to deteriorate and impair their ability to make payments, additional allowances may be required in future periods.
Inventories
The Company’s inventories are stated at the lower of cost or market. Cost is determined by the first-in, first-out (“FIFO”) method, including material, labor and factory overhead. Existing inventory on hand may exceed future demand either because the product is obsolete, or the amount on hand is more than can be used to meet future needs. The Company identifies potentially obsolete and excess inventory by evaluating overall inventory levels in relation to past and anticipated usage levels. In assessing the ultimate realization of inventories, the Company is required to make judgments as to future demand requirements and compare those with the current or committed inventory levels. If future demand requirements are less favorable than those projected by management, additional inventory write-downs may be required.
Reserves for Litigation and Environmental Issues
The Company periodically records the estimated impacts of various conditions, situations, or circumstances involving uncertain outcomes. The accounting for such events is prescribed under ASC Topic 450, Contingencies. The Company does not record gain contingencies under any circumstances. For loss contingencies, the loss must be accrued if information is
36
available that indicates it is probable that the loss has been incurred, given the likelihood of uncertain events, and if the amount of the loss can be reasonably estimated.
The accrual of a contingency involves considerable judgment on the part of management. The Company uses its internal expertise and outside experts, as necessary, to help estimate the probability that a loss has been incurred and the amount or range of the loss.
Income Taxes
The Company uses the liability method to account for income taxes. The preparation of consolidated financial statements involves estimating the Company’s current tax exposure together with assessing temporary differences resulting from differing treatment of items for tax and accounting purposes. These differences result in deferred tax assets and liabilities, which are included in the consolidated balance sheets. An assessment of the recoverability of deferred tax assets is made, and a valuation allowance is established if necessary based upon this assessment.
Pension Benefits
The valuation of the Company’s pension plan requires the use of assumptions and estimates to develop actuarial valuations of pension expense, pension assets, and pension liabilities. These assumptions include discount rates, investment returns, and mortality rates. Changes in these assumptions could potentially have a material impact on the Company’s pension expense and related funding requirements.
Restricted Cash
At December 28, 2014, and December 29, 2013, the Company had $0.3 million of restricted cash related to minimum balance requirements associated with procurement of certain raw materials and supplies.
Revenue Recognition
The Company’s policy is to recognize revenue when the earnings process is complete. The criteria used in making this determination are persuasive evidence that an arrangement exists, delivery has occurred, the sales price is fixed or determinable, and collectability is reasonably assured. Sales are recorded net of returns and allowances, which are estimated using historical data, at the time of sale.
Terms of shipment are free on board shipping point, and payment is not contingent upon resale or any other matter other than passage of time. As a result, title to goods passes upon shipment. Amounts billed to customers for shipping costs are reflected in net sales; shipping costs are reflected in cost of sales.
Property, Plant and Equipment
Additions and improvements are capitalized at cost, whereas expenditures for maintenance and repairs are charged to expense as incurred. Depreciation is provided over the estimated useful lives of the respective assets principally on the straight-line method (machinery and equipment normally five to ten years; buildings and leasehold improvements over the shorter of the lease term or the economic life, estimated at ten to forty years).
Goodwill
In accordance with ASC Topic 350, Goodwill and Other Intangible Assets, the Company reviews the carrying value of goodwill at least annually and more frequently if indicators of potential impairment arise. Goodwill represents the excess of the amount paid to acquire the Company over the estimated fair value of the net tangible and intangible assets acquired as of the acquisition date. Conditions that would trigger an impairment assessment include, but are not limited to, a significant adverse change in legal factors or business climate that could affect the value of an asset.
The Company performed the required annual impairment tests for fiscal years 2014, 2013, and 2012, and found no impairment of goodwill. There can be no assurance that future goodwill impairment tests will not result in a charge to earnings.
37
Intangible Assets
Additions to intangible assets are capitalized at fair market value and the carrying value of indefinite-lived intangibles is reviewed for impairment if indicators of impairment arise. Intangible assets, which consist principally of patents, are included in other assets in the consolidated balance sheets, and are amortized over the estimated useful lives of the respective assets, principally on the straight-line method. In fiscal 2009 and fiscal 2010, the Company acquired several patents related to the design and manufacture of digital DC drives for material handling and mining applications. The cost of the patents, $533 as of December 28, 2014, and December 29, 2013, was capitalized and is included in other assets in the consolidated balance sheets. The estimated useful life of the patents is 10 years. Accumulated amortization of the patents as of December 28, 2014, and December 29, 2013, was $344 and $291, respectively, resulting in a net carrying value as of those dates of $189 and $242, respectively. The Company does not believe any indicators of impairment of the intangible assets occurred in fiscal years 2014, 2013, or 2012. There can be no assurance that future intangible asset impairment tests will not result in a charge to earnings.
Stock-Based Compensation
The Company records stock-based compensation expenses in accordance with ASC Topic 718, Stock Compensation. Compensation expense related to all stock-based awards for fiscal years 2014, 2013, and 2012 is included in sales, general and administrative expense in the consolidated statements of operations. No tax benefit was recorded on the stock compensation expense for fiscal years 2014, 2013, and 2012 due to deferred tax valuation allowances recorded by the Company in those years.
Research and Development
Expenditures for research and development are charged to expense as incurred and totaled $3,174 for fiscal 2014, $3,246 for fiscal 2013, and $3,834 for fiscal 2012.
Advertising
Expenditures for advertising are charged to expense as incurred and totaled $22 for fiscal year 2014, $58 for fiscal year 2013, and $88 for fiscal year 2012.
Foreign Currency Translation
The accounts of the Company’s foreign entities are measured using local currency as the functional currency. Assets and liabilities are translated to the reporting currency (U.S. Dollar) at the exchange rate in effect at year-end. Revenues and expenses are translated at the rates of exchange prevailing during the year. Unrealized translation gains and losses arising from differences in exchange rates from period to period are included as a component of accumulated other comprehensive gain or loss in stockholders’ equity.
Earnings Per Share
In accordance with ASC Topic 260, Earnings Per Share, basic earnings per share is computed using the weighted average number of common shares outstanding during the period. Diluted earnings per common share incorporate the incremental shares issuable upon the assumed vesting of restricted stock and the exercise of stock options as if all vesting and exercises had occurred at the beginning of the fiscal year, whereas diluted loss per common share does not incorporate these incremental shares.
Recent Accounting Pronouncements
In May 2014, the Financial Accounting Standards Board issued Accounting Standards Codification ("ASC") 606-10, Revenue for Contracts with Customers (issued under Accounting Standards Update No. 2014-09). ASC 606-10 will be effective for the year beginning on or around January 1, 2017, and will replace all existing revenue recognition guidance. The Company is in the process of determining whether the adoption of ASC 606-10 will have an impact on the Company's results of operations, financial position, or cash flows.
38
2. Discontinued Operations
Certain expenses incurred related to businesses the Company no longer owns, are classified as discontinued operations. The results of discontinued operations follow:
Fiscal Year Ended | ||||||||||||
December 28, 2014 | December 29, 2013 | December 30, 2012 | ||||||||||
Income (loss) from discontinued operations before interest and income taxes | $ | (818 | ) | $ | (627 | ) | $ | 703 | ||||
Income on sale of telecom power systems business | — | — | 32 | |||||||||
Gain from settlement agreement, net of fees | — | — | 4,962 | |||||||||
Income (loss) from discontinued operations | $ | (818 | ) | $ | (627 | ) | $ | 5,697 | ||||
The Company's loss from discontinued operations of $0.8 million in fiscal 2014 was comprised mainly of charges of $0.4 million for environmental matters and $0.2 million for legal fees related to asbestos matters from previously divested businesses (see Note 10 of Notes to Consolidated Financial Statements).
The Company's loss from discontinued operations of $0.6 million in fiscal 2013 was comprised mainly of charges of $0.3 million for environmental matters and $0.2 million for legal fees related to asbestos matters from previously divested businesses.
Income from discontinued operations of $5.7 million in fiscal 2012 includes a gain of $5.0 million from a settlement agreement entered into by the Company to resolve a legal matter, as well as income of $1.2 million from non-cash adjustments of liabilities related to previously owned businesses, partially offset by $0.5 million of legal fees and other costs related to previously divested businesses (see Note 10 of Notes to Consolidated Financial Statements).
3. Goodwill
The change in the carrying value of goodwill for the periods ended December 28, 2014, and December 29, 2013, is as follows:
December 28, 2014 | December 29, 2013 | |||||
Balance at beginning of period | $30,427 | $30,485 | ||||
Currency translation | (63 | ) | (58 | ) | ||
Balance at end of period | $30,364 | $30,427 | ||||
4. Inventories
Inventories consist of the following:
December 28, 2014 | December 29, 2013 | |||||||
Raw materials | $ | 8,710 | $ | 8,531 | ||||
Work in process | 1,252 | 1,344 | ||||||
Finished goods | 3,664 | 3,447 | ||||||
Total inventory | $ | 13,626 | $ | 13,322 | ||||
5. Bank Borrowing Arrangements
In November 2007, the Company entered into an agreement with Associated Bank, N.A. (“Associated Bank”) providing for a $10 million revolving credit facility (the “revolving facility”). Borrowings under the revolving facility bear interest at the London Interbank Offering Rate (“LIBOR”) plus 1.5%, with borrowing levels determined by a borrowing base
39
formula as defined in the agreement, which includes the level of eligible accounts receivable. The revolving facility also supports the issuance of letters of credit, places certain restrictions on the Company’s ability to pay dividends or make acquisitions, and includes covenants that require minimum operating profit levels and limit annual capital expenditures. Borrowings under the revolving facility were originally collateralized by the Company’s accounts receivable and inventory.
The Company has subsequently entered into several amendments to the revolving facility, mainly to increase the commitment amount to $12.5 million, to extend the maturity date of the revolving facility, to broaden the security interest of Associated Bank to collateralize all assets of the Company, and to establish or modify certain covenants with which the Company must comply under the terms of the amended revolving facility.
On June 15, 2014, the Company and Associated Bank entered into the seventh amendment to the revolving facility, the purpose of which was to (i) extend the maturity date of the revolving facility to June 15, 2015; (ii) retain the commitment amount of Associated Bank at $12.5 million; (iii) establish minimum quarterly adjusted earnings before interest, taxes, depreciation and amortization requirements for the term of the agreement; and (iv) establish maximum quarterly cash amounts that can be contributed to the Company's defined benefit pension plan for the term of the agreement.
On August 20, 2014, the Company and Associated Bank entered into the eighth amendment to the revolving facility, the purpose of which was to increase the maximum quarterly cash amounts that can be contributed to the Company's defined benefit pension plan for the term of the agreement.
There were no amounts outstanding on the amended revolving facility as of December 28, 2014. The Company is currently in compliance with all covenants of the revolving facility, as amended.
6. Earnings (Loss) Per Share
The following table sets forth the computation of basic and diluted earnings (loss) per share for the periods ended:
Fiscal Year Ended | ||||||||||||
December 28, 2014 | December 29, 2013 | December 30, 2012 | ||||||||||
Numerator: | ||||||||||||
Income (loss) from continuing operations | $ | (26,445 | ) | $ | 3,759 | $ | 6,926 | |||||
Income (loss) from discontinued operations | (818 | ) | (627 | ) | 5,697 | |||||||
Net income (loss) | $ | (27,263 | ) | $ | 3,132 | $ | 12,623 | |||||
Denominator: | ||||||||||||
Weighted average shares for basic income (loss) per share | 3,350 | 3,231 | 3,174 | |||||||||
Add dilutive effect of stock options outstanding | — | 108 | 64 | |||||||||
Weighted average shares for diluted income per share | 3,350 | 3,339 | 3,238 | |||||||||
Income (loss) per share - basic: | ||||||||||||
Income (loss) per share from continuing operations | $ | (7.89 | ) | $ | 1.16 | $ | 2.18 | |||||
Income (loss) per share from discontinued operations | $ | (0.24 | ) | $ | (0.19 | ) | $ | 1.79 | ||||
Net income (loss) per share - basic | $ | (8.13 | ) | $ | 0.97 | $ | 3.97 | |||||
Income (loss) per share - diluted: | ||||||||||||
Income (loss) per share from continuing operations | $ | (7.89 | ) | $ | 1.13 | $ | 2.14 | |||||
Income (loss) per share from discontinued operations | $ | (0.24 | ) | $ | (0.19 | ) | $ | 1.76 | ||||
Net income (loss) per share - diluted | $ | (8.13 | ) | $ | 0.94 | $ | 3.90 | |||||
The Company's computation of weighted average shares for diluted earnings per share for fiscal year 2014 excludes 116 thousand shares of unvested restricted stock and options outstanding to purchase 104 thousand shares of common stock because their inclusion would have had an anti-dilutive effect. Outstanding options to purchase 147 thousand and 174 thousand shares of common stock for fiscal years 2013 and 2012, respectively, have not been included in the Company’s computation of weighted average shares for diluted earnings per share because the effect would have been anti-dilutive.
40
7. Fair Values of Financial Instruments
The carrying amounts of certain financial instruments including cash, restricted cash, accounts receivable, and accounts payable approximate their fair values based on the short-term nature of these instruments. In addition, the Company’s investment in an annuity contract of $3.6 million at December 28, 2014, and $3.9 million at December 29, 2013, is recorded at fair value based upon the net asset value of the contract. The annuity contract is included in other assets in the accompanying consolidated balance sheet and is classified as a level 2 asset within the fair value hierarchy (refer to Note 12 of Notes to Consolidated Financial Statements for a definition of the fair value levels).
8. Asset Impairment Charges
During fiscal 2012, the Company committed to a plan to no longer pursue new business opportunities in renewable energy due to diminished expectations for future sales of inverters into renewable energy markets. As a result, the Company determined at that time that its fixed assets used in the manufacture and test of inverters were impaired. Accordingly, the Company recorded a non-cash, pre-tax impairment charge of $1.2 million. The charge is included in cost of sales in the accompanying consolidated statement of operations for the fiscal year ended December 30, 2012. The impairment charge reduced the net book value of the Company's renewable energy fixed assets to a negligible amount.
41
9. Income Taxes
The Company’s provision for income taxes, all of which relates to its continuing operations, consists of the following:
Fiscal Year Ended | ||||||||||||
For the period ended | December 28, 2014 | December 29, 2013 | December 30, 2012 | |||||||||
Current | ||||||||||||
Federal | $ | — | $ | — | $ | — | ||||||
State | — | — | 45 | |||||||||
Foreign | 22 | 87 | 101 | |||||||||
Deferred | ||||||||||||
Federal | 673 | 926 | 955 | |||||||||
State and foreign | 20 | 3 | (5 | ) | ||||||||
Provision for income taxes | $ | 715 | $ | 1,016 | $ | 1,096 | ||||||
The Company did not record any provision for income taxes related to its discontinued operations for fiscal years 2014, 2013, or 2012, as the Company has a full valuation allowance and available net operating losses.
A reconciliation of the Company's effective tax rate for continuing operations to the statutory Federal tax rate follows:
Fiscal Year Ended | |||||||||||||||||||||
December 28, 2014 | December 29, 2013 | December 30, 2012 | |||||||||||||||||||
Amount | % | Amount | % | Amount | % | ||||||||||||||||
Provision (benefit) computed at the statutory rate | $ | (9,005 | ) | 35.0 | $ | 1,670 | 35.0 | $ | 2,808 | 35.0 | |||||||||||
Valuation allowance | 9,082 | (35.2 | ) | (1,576 | ) | (33.0 | ) | (2,607 | ) | (32.1 | ) | ||||||||||
Intangible amortization | 673 | (2.6 | ) | 954 | 20.0 | 955 | 11.9 | ||||||||||||||
Foreign tax rate differential | (35 | ) | 0.1 | (32 | ) | (0.7 | ) | (60 | ) | (0.8 | ) | ||||||||||
Total provision for income taxes | $ | 715 | (2.7 | ) | $ | 1,016 | 21.3 | $ | 1,096 | 14.0 | |||||||||||
Income before provision for income taxes of the Company's foreign subsidiaries (located in Canada and the United Kingdom) included in continuing operations was approximately $221, $368, and $447 for fiscal years 2014, 2013, and 2012, respectively.
42
Deferred income taxes reflect the net tax effects of temporary differences between the carrying amounts of assets and liabilities for financial reporting purposes and the amounts used for income tax purposes. Significant components of the Company's deferred tax liabilities and assets as of December 28, 2014, and December 29, 2013, follow:
December 28, 2014 | December 29, 2013 | |||||||
Deferred tax liabilities | ||||||||
Depreciation and amortization (including differences in the basis of acquired assets) | $ | (9,798 | ) | $ | (9,125 | ) | ||
Total deferred tax liabilities | (9,798 | ) | (9,125 | ) | ||||
Deferred tax assets | ||||||||
Inventory and other reserves | 2,428 | 2,329 | ||||||
Pension benefit obligation | 63,466 | 85,533 | ||||||
Net operating loss and capital loss carryforwards | 93,953 | 88,784 | ||||||
Total gross deferred tax assets | 159,847 | 176,646 | ||||||
Less valuation allowance | (159,795 | ) | (176,568 | ) | ||||
Deferred tax assets less valuation allowance | 52 | 78 | ||||||
Net deferred tax liability | $ | (9,746 | ) | $ | (9,047 | ) | ||
The Company records valuation allowances against its deferred tax assets, when necessary, in accordance with ASC Topic 740, Income Taxes. Realization of deferred tax assets (such as net operating loss carryforwards) is dependent on future taxable earnings and may therefore be uncertain. To the extent the Company believes that recovery is unlikely, a valuation allowance is established against its deferred tax asset, which increases the Company’s income tax expense in the period such determination is made. Due to the uncertainty surrounding the timing of realizing the benefits of its deferred tax assets in future tax returns, the Company has recorded a valuation allowance against its otherwise recognizable deferred tax assets.
The Company had net operating loss (“NOL”) carryforwards for U.S. federal tax purposes of $242 million and $227 million as of December 28, 2014, and December 29, 2013, respectively. The potential tax benefit of all carryforwards has been fully reserved with a valuation allowance and therefore there is no net tax asset on the consolidated balance sheets related to this asset at December 28, 2014, or at December 29, 2013. The Company’s NOLs have a carryforward period of 20 years with expiration dates ranging from 2019 to 2034. As the balance sheet reflects no benefit of such NOLs, the Company anticipates that no federal tax liability, other than alternative minimum tax, would be recorded when U.S. taxable income is generated and such carryforwards are utilized.
The Company regularly completes internal evaluations as to whether ordinary transfers of the Company’s common stock between shareholders have resulted in an ownership change as defined in Section 382 of the Internal Revenue Code. Based on available information, the Company has determined that no such ownership change has occurred as of December 28, 2014. If such ownership change had occurred, utilization of the Company’s NOLs would be subject to annual limitation provisions per the Internal Revenue Code and similar state laws.
43
10. Commitments and Contingencies
Leases
The Company leases certain facilities and machinery and equipment primarily under operating lease arrangements, which generally provide renewal options. Future minimum rental payments under noncancellable operating leases as of December 28, 2014, follow:
Minimum | |||
Lease | |||
Fiscal Year | Payments | ||
2015 | 1,254 | ||
2016 | 1,044 | ||
2017 | 862 | ||
2018 | 850 | ||
2019 | 855 | ||
Thereafter | 1,116 | ||
Total lease payments | 5,981 | ||
Rent expense was $1.4 million, $1.3 million, and $1.1 million for fiscal years 2014, 2013, and 2012, respectively.
Litigation-Product Liability
The Company has been named, along with multiple other defendants, in asbestos-related lawsuits associated with business operations previously acquired by the Company, but which are no longer owned. During the Company's ownership, none of the businesses produced or sold asbestos-containing products. For such claims, the Company is either contractually indemnified against liability, or contractually obligated to defend and indemnify the purchaser of these former Magnetek business operations. With respect to these claims, the Company is uninsured, but management believes that it has no such liability and the Company aggressively seeks dismissal from these proceedings. Management does not believe the asbestos proceedings, individually or in the aggregate, will have a material adverse effect on its financial position or results of operations. Given the nature of the above issues, uncertainty of the ultimate outcome, and inability to estimate the potential loss, no amounts have been reserved for these matters.
Litigation-Patent Infringement and Related Proceedings
In August 2008, the Company filed a complaint in the Circuit Court of Cook County, Illinois, County Department, Law Division, against Kirkland & Ellis, LLP (“K&E”). The lawsuit involved a claim for breach of professional responsibility arising out of K&E’s representation of Magnetek in the patent infringement action, Ole K. Nilssen v. Magnetek, Inc. The Company alleged that, as a result of K&E’s negligent breach of professional duty in failing to discover or investigate the existence of prior art and prior misconduct which would have made Nilssen’s patent claim unenforceable or invalidated his patent, the Company suffered an arbitration award and judgment in the amount of $23.4 million, which judgment was ultimately settled by the payment to Nilssen of $18.75 million. The Company sought damages in the amount of $18.75 million. Following a December 2011 mediation, the Company entered into a settlement agreement with K&E. Under the terms of the settlement agreement all outstanding claims were settled and released with prejudice in consideration of K&E making a $5 million settlement payment to Magnetek, which the Company received in January 2012. The federal proceeding and the Illinois Supreme Court proceeding were subsequently dismissed, also in January 2012. The Company entered into the settlement agreement to eliminate the uncertainties, burden and expense of further litigation. The Company recorded the settlement payment as a gain in discontinued operations in fiscal 2012, as the initial patent infringement claim related to a business the Company divested in 2003.
Litigation-Other
In November 2007, a lawsuit was filed by Antonio Canova in Italy, in the Court of Arezzo, Labor Law Section, against the Company and Power-One Italy, S.p.A. Mr. Canova is a former Executive Vice President of the Company and was Deputy Chairman and Managing Director of the Company's former Italian subsidiary, Magnetek, S.p.A. Mr. Canova asserted claims for damages in the amount of Euro 3.5 million (approximately US$4.3 million) allegedly incurred in connection with the termination of his employment at the time of the sale of the Company's power electronics business to Power-One, Inc. ("Power
44
One") in October 2006. The claims against the Company relate to a change of control agreement and restricted stock grant. On March 8, 2012, the Court of Arezzo ruled in the Company's favor, dismissing Mr. Canova's claims against the Company as invalid. Mr. Canova appealed the ruling in September 2012. On October 16, 2013, the Labor Court of Appeals published its decision rejecting all claims of Mr. Canova against the Company and ordered Mr. Canova to pay a nominal amount to the Company toward its appellate legal expenses. Mr. Canoa did not appeal the ruling to the Supreme Court on or before October 16, 2014, and thereby relinquished any right to appeal. Accordingly the Company considers this matter closed.
In October 2010, the Company received a request for indemnification from Power-One for an Italian tax matter arising out of the sale of the Company's power electronics business to Power-One in October 2006. With a reservation of rights, the Company affirmed its obligation to indemnify Power-One for certain pre-closing taxes. The sale included an Italian company, Magnetek, S.p.A., and its wholly owned subsidiary, Magnetek Electronics (Shenzhen) Co. Ltd. (the “Power-One China Subsidiary”). The tax authority in Arezzo, Italy, issued a notice of audit report in September 2010 wherein it asserted that the Power-One China Subsidiary had its administrative headquarters in Italy with fiscal residence in Italy and, therefore, was subject to taxation in Italy. In November 2010, the tax authority issued a notice of tax assessment for the period of July 2003 to June 2004, alleging that taxes of approximately Euro 1.9 million (approximately US$2.3 million) were due in Italy on taxable income earned by the Power-One China Subsidiary during this period. In addition, the assessment alleged potential penalties calculated at 120% of the tax amount claimed together with interest in the amount of approximately Euro 2.6 million (or approximately US$3.2 million) for the alleged failure of the Power-One China Subsidiary to file its Italian tax return. A hearing before the Tax Court of Arezzo ("Tax Court") was held in July 2012 on the tax assessment for the period of July 2003 to June 2004. In September 2012, the Tax Court ruled in favor of the Power-One China Subsidiary dismissing the tax assessment for the period of July 2003 to June 2004. In February 2013, the tax authority filed an appeal of the Tax Court's September 2012 ruling. The Regional Tax Commission of Florence heard the appeal of the tax assessment dismissal for the period of July 2003 to June 2004 and on October 6, 2014 issued its ruling finding in favor of the tax authority. The Company believes the commission’s decision was based upon erroneous interpretation of the applicable law and intends to appeal the ruling to the Italian Supreme Court.
In August 2012, the tax authority in Arezzo, Italy issued additional notices of tax assessment for the periods July 2002 to June 2003 and July 2004 to December 2006, alleging that taxes of approximately Euro 9.5 million (approximately US$11.6 million) were due in Italy on taxable income earned by the Power-One China Subsidiary together with an allegation of potential penalties in the amount of approximately Euro 2.8 million (approximately US$3.4 million) for the alleged failure of the Power-One China Subsidiary to file its Italian tax returns for the reporting periods. The tax authority asserted that the Power-One China Subsidiary had its administrative headquarters in Italy with fiscal residence in Italy and, therefore, was subject to taxation in Italy. The Tax Court held a hearing on December 4, 2014 and thereafter scheduled another hearing for April 16, 2015. The Company believes the Italian tax claims are without merit and intends to vigorously defend against them.
Litigation-Environmental Matters
From time to time, Magnetek has taken action to bring certain facilities associated with previously owned businesses into compliance with applicable environmental laws and regulations. Upon the subsequent sale of certain businesses, the Company agreed to indemnify the buyers against environmental claims associated with the divested operations, subject to certain conditions and limitations. Remediation activities, including those related to the Company's indemnification obligations, did not involve material expenditures during fiscal years 2014, 2013, or 2012.
The Company has also been identified by the United States Environmental Protection Agency and certain state agencies as a potentially responsible party for clean-up costs associated with alleged past waste disposal practices at several previously utilized, owned or leased facilities and offsite locations. Its remediation activities as a potentially responsible party were not material in fiscal years 2014, 2013 or 2012. Although the materiality of future expenditures for environmental activities may be affected by the level and type of contamination, the extent and nature of clean-up activities required by governmental authorities, the nature of the Company's alleged connection to the contaminated sites, the number and financial resources of other potentially responsible parties, the availability of indemnification rights against third parties and the identification of additional contaminated sites, the Company's estimated share of liability, if any, for environmental remediation, including its indemnification obligations, is not expected to be material.
Bridgeport, Connecticut Facility
In 1986, the Company acquired the stock of Universal Manufacturing Company (“Universal”) from a predecessor of Fruit of the Loom (“FOL”), and the predecessor agreed to indemnify the Company against certain environmental liabilities arising from pre-acquisition activities at a facility in Bridgeport, Connecticut. Environmental liabilities covered by the indemnification agreement included completion of additional clean-up activities, if any, at the Bridgeport facility and defense
45
and indemnification against liability for potential response costs related to offsite disposal locations. The Company's leasehold interest in the Bridgeport facility was assigned to the buyer in connection with the sale of the Company's transformer business in June 2001. FOL, the successor to the indemnification obligation, filed a petition for Reorganization under Chapter 11 of the Bankruptcy Code in 1999 and the Company filed a proof of claim in the proceeding for obligations related to the environmental indemnification agreement. The Company believes that FOL had substantially completed the clean-up obligations required by the indemnification agreement prior to the bankruptcy filing. In November 2001, the Company and FOL entered into an agreement involving the allocation of certain potential tax benefits and Magnetek withdrew its claims in the bankruptcy proceeding. The Company further believes that FOL's obligation to the state of Connecticut was not discharged in the reorganization proceeding.
In January 2007, the Connecticut Department of Environmental Protection (“DEP”) requested parties, including the Company, to submit reports summarizing the investigations and remediation performed to date at the site and the proposed additional investigations and remediation necessary to complete those actions at the site. DEP requested additional information from the Company relating to site investigations and remediation. The Company retained an environmental consultant to review and prepare reports on historical operations and environmental activities at the Bridgeport facility. In November 2009, the Company submitted its site summary report and proposed work plan to the DEP and in October 2010 submitted a revised work plan to the DEP. The Company and the DEP agreed to the scope of the work plan in November 2010. The Company has recorded a liability of $0.4 million related to the Bridgeport facility, representing the Company's best estimate of future site investigation costs and remediation costs which are expected to be incurred in the future. The liability is included in accrued liabilities in the consolidated balance sheet as of December 28, 2014.
FOL's inability to satisfy its remaining obligations to the state of Connecticut related to the Bridgeport facility and any offsite disposal locations or the discovery of additional environmental contamination at the Bridgeport facility could have a material adverse effect on the Company's financial position, cash flows or results of operations.
Letters of Credit
The Company had approximately $0.8 million of outstanding letters of credit as of December 28, 2014.
46
11. Stock-Based Compensation Agreements
The Company has two stock option plans (the "Plans"), one of which provides for the issuance of both incentive stock options (under Section 422A of the Internal Revenue Code of 1986) and non-qualified stock options at exercise prices not less than the fair market value of the Company’s common stock at the date of grant, and one of which provides only for the issuance of non-qualified stock options at exercise prices not less than the fair market value of the Company’s common stock at the date of grant. One of the Plans also provides for the issuance of stock appreciation rights, restricted stock, incentive bonuses and incentive stock units. The total number of shares of the Company's common stock available for issuance of stock options and other stock rights under the Plans is approximately 236 thousand shares.
Under the provisions of the Plans, key employees and non-employee directors may be granted options to purchase shares of Magnetek common stock at a price not less than its fair market value on the date of grant. Options granted have a maximum term of 10 years. Vesting requirements are determined at the discretion of the Compensation Committee of the Company’s Board of Directors, with vesting periods generally ranging from two to four years. The Company uses the Black-Scholes option pricing model to calculate the fair value of stock options. The key assumptions for the Black-Scholes valuation method include the expected life of the option, stock price volatility, a risk-free interest rate, and dividend yield. Many of these assumptions are judgmental and highly sensitive. Following is a table of the weighted average fair value of the Company’s stock option grants for fiscal years 2014, 2013, and 2012 using the Black-Scholes valuation model, assuming no dividends, with the following assumptions:
Fiscal Year Ended | ||||||||||||
December 28, 2014 | December 29, 2013 | December 30, 2012 | ||||||||||
Expected life in years | 6.5 | 5.8 | 5.3 | |||||||||
Expected stock price volatility | 66.4 | % | 70.9 | % | 74.9 | % | ||||||
Risk-free interest rate | 2.0 | % | 2.0 | % | 0.8 | % | ||||||
Options granted (in thousands) | 3 | 6 | 15 | |||||||||
Weighted average fair value of options granted | $ | 23.94 | $ | 14.03 | $ | 6.47 | ||||||
Compensation expense related to stock option awards is recognized ratably over the vesting period.
The Company also awards restricted shares of the Company’s common stock to key employees under the provisions of one of the Plans. Restrictions on the shares expire either after completion of a service period, typically three years, or upon achievement of established performance objectives, as determined by the Compensation Committee of the Company’s Board of Directors. Shares are valued at the market price on the date of award. Compensation expense related to these awards is recognized ratably over the service period.
During fiscal 2014, 2013, and 2012, the Company recorded $0.6 million, $0.7 million, and $0.8 million, respectively, of stock-based compensation related to share-based awards. Stock-based compensation expense is included in sales, general and administrative expense in the accompanying consolidated statements of operations. As of December 28, 2014, there was $0.8 million of total unrecognized compensation cost related to all stock option and restricted share grants, to be expensed ratably over a weighted-average remaining period of 1.8 years.
47
A summary of certain information with respect to outstanding stock options under the Plans follows (options in thousands):
Options | Weighted- Average Exercise Price | Aggregate Intrinsic Value ($000's) | |||||||||
Options outstanding, January 1, 2012 | 179 | $ | 32.67 | $ | 1 | ||||||
Granted | 15 | $ | 10.41 | ||||||||
Exercised | — | $ | — | ||||||||
Canceled | (20 | ) | $ | 65.26 | |||||||
Options outstanding, December 30, 2012 | 174 | $ | 26.88 | $ | 18 | ||||||
Granted | 6 | $ | 22.23 | ||||||||
Exercised | (8 | ) | $ | 12.06 | |||||||
Canceled | (25 | ) | $ | 22.67 | |||||||
Options outstanding, December 29, 2013 | 147 | $ | 28.22 | $ | 624 | ||||||
Granted | 3 | $ | 38.00 | ||||||||
Exercised | — | $ | — | ||||||||
Canceled | (22 | ) | $ | 68.82 | |||||||
Options outstanding, December 28, 2014 | 128 | $ | 21.39 | $ | 2,209 | ||||||
Exercisable options, January 1, 2012 | 112 | $ | 43.42 | $ | — | ||||||
Exercisable options, December 30, 2012 | 115 | $ | 34.91 | $ | 9 | ||||||
Exercisable options, December 29, 2013 | 132 | $ | 29.87 | $ | 486 | ||||||
Exercisable options, December 28, 2014 | 119 | $ | 20.89 | $ | 2,119 | ||||||
The following table provides information regarding exercisable and outstanding options as of December 28, 2014 (options in thousands):
Exercisable | Outstanding | |||||||||||||||||
Range of exercise price per share | Options exercisable | Weighted average exercise price per share | Weighted average remaining contractual life (years) | Options outstanding | Weighted average exercise price per share | Weighted average remaining contractual life (years) | ||||||||||||
$8.48 - $10.00 | 8 | $ | 8.48 | 7.0 | 8 | $ | 8.48 | 7.0 | ||||||||||
$10.01 - $15.00 | 38 | 11.27 | 6.3 | 38 | 11.26 | 6.3 | ||||||||||||
$15.01 - $20.00 | 7 | 17.79 | 6.5 | 7 | 17.79 | 6.5 | ||||||||||||
$20.01 - $30.00 | 45 | 22.68 | 3.7 | 51 | 22.63 | 4.3 | ||||||||||||
$30.01 - $53.10 | 21 | 39.82 | 2.9 | 24 | 39.57 | 3.9 | ||||||||||||
Total | 119 | $ | 20.89 | 4.8 | 128 | $ | 21.39 | 5.1 | ||||||||||
48
The following table provides information regarding vested and unvested restricted stock activity for fiscal years 2012, 2013, and 2014 (shares in thousands):
Shares | Weighted average grant date fair value | Fair value of vested shares at vesting date | |||||||||
Unvested at January 1, 2012 | 112 | $ | 13.48 | ||||||||
Granted | 46 | $ | 16.66 | ||||||||
Vested | (42 | ) | $ | 14.85 | $ | 437 | |||||
Forfeited | (11 | ) | $ | 13.38 | |||||||
Unvested at December 30, 2012 | 105 | $ | 14.35 | ||||||||
Granted | 66 | $ | 12.60 | ||||||||
Vested | (37 | ) | $ | 12.28 | $ | 618 | |||||
Forfeited | (3 | ) | $ | 11.50 | |||||||
Unvested at December 29, 2013 | 131 | $ | 14.11 | ||||||||
Granted | 41 | $ | 19.09 | ||||||||
Vested | (21 | ) | $ | 13.66 | $ | 587 | |||||
Forfeited | — | — | |||||||||
Unvested at December 28, 2014 | 151 | $ | 15.54 | ||||||||
Included in the table above are 35 thousand performance-based awards granted in the period ended December 29, 2013, that are not expected to vest as the performance target is unlikely to be achieved.
12. Employee Benefit Plans
The Company maintains a defined benefit pension plan (the “pension plan”) for the benefit of eligible employees, former employees, and retirees in the U.S. The pension plan has been frozen since 2003, and since that time, participant accounts have not been credited with any additional years of service or additional compensation, but rather only with interest on accrued balances. The pension plan is managed in compliance with all provisions of the Employee Retirement Income Security Act of 1974, as amended ("ERISA"), the Investment Advisers Act of 1940, and other applicable laws. The Company funds the pension plan in accordance with applicable employee benefit and tax laws, primarily the Pension Protection Act of 2006, as amended ("PPA"). The primary purpose of the pension plan is to provide a source of retirement income for plan participants and beneficiaries.
Net pension expense for the Company’s pension plan follows:
Fiscal Year Ended | ||||||||||||
December 28, 2014 | December 29, 2013 | December 30, 2012 | ||||||||||
Interest cost | $ | 8,766 | $ | 7,854 | $ | 8,655 | ||||||
Expected return on plan assets | (12,435 | ) | (10,246 | ) | (9,741 | ) | ||||||
Recognized net actuarial loss | 44,018 | 8,757 | 8,022 | |||||||||
Net pension expense | $ | 40,349 | $ | 6,365 | $ | 6,936 | ||||||
During 2014, in an effort to reduce the size, volatility, mortality risk, and costs of the pension plan, the Company offered a lump sum payout of pension benefits (a “lump sum window”) to 2,970 eligible deferred vested participants. The program, which was funding-neutral, was completed in December 2014. A total of 2,230 participants, or 75%, elected the lump sum option, with a total amount of $46.9 million paid out of pension plan assets. The Company’s pension liability was reduced by a similar amount. Recognized net actuarial loss for fiscal 2014 in the table above includes a settlement charge of $37.1 million related to the lump sum window. The settlement charge represents accelerated amortization of actuarial pension losses which were recorded on the Company’s balance sheet in accumulated other comprehensive loss as a reduction in stockholders’ equity. These losses would otherwise have been amortized to the income statement over time as a component of future pension
49
expense. The settlement charge had no impact on the Company’s cash flow or financial position and is expected to reduce future pension expense. Excluding the impact of this settlement charge, fiscal 2014 pension expense would have been approximately $3.2 million.
Net pension expense for fiscal 2015 is estimated at $2.0 million. During that time, it is expected that $6.7 million of amounts included in accumulated other comprehensive loss will be recognized in net periodic benefit cost. The expected long-term rate of return on pension plan assets in determining fiscal 2015 pension expense is 7.75%.
Pension benefit obligations at year-end, the fair value of pension plan assets, and the pension plan funded status are as follows:
December 28, 2014 | December 29, 2013 | |||||||
Change in Benefit Obligation: | ||||||||
Benefit obligation at beginning of period | $ | 209,064 | $ | 230,257 | ||||
Interest cost | 8,766 | 7,854 | ||||||
Actuarial loss (gain) | 12,006 | (17,762 | ) | |||||
Settlements | (47,830 | ) | — | |||||
Benefits paid | (12,337 | ) | (11,285 | ) | ||||
Benefit obligation at end of period | $ | 169,669 | $ | 209,064 | ||||
Change in Plan Assets: | ||||||||
Fair value of plan assets at beginning of period | $ | 160,603 | $ | 127,917 | ||||
Actual return on plan assets | 14,563 | 19,115 | ||||||
Employer contributions | 26,428 | 24,856 | ||||||
Settlements | (46,948 | ) | — | |||||
Benefits paid | (12,337 | ) | (11,285 | ) | ||||
Fair value of plan assets at end of period | $ | 142,309 | $ | 160,603 | ||||
Funded status | $ | (27,360 | ) | $ | (48,461 | ) | ||
Unrecognized net actuarial loss | 134,048 | 169,070 | ||||||
Net amount recognized | $ | 106,688 | $ | 120,609 | ||||
Amounts Recognized in Statement of Financial Position: | ||||||||
Pension benefit obligations, net | $ | (27,360 | ) | $ | (48,461 | ) | ||
Accumulated other comprehensive loss | 134,048 | 169,070 | ||||||
Net amount recognized | $ | 106,688 | $ | 120,609 | ||||
The pension plan has been in a net under-funded position for the past several years, and as a result, the Company recognized an additional minimum pension liability on its balance sheet in accordance with ASC 715. The pension plan’s unrecognized losses of $134.0 million and $169.1 million (excluding tax benefits of $17 million) at December 28, 2014, and December 29, 2013, respectively, have been recorded as a reduction to equity in accumulated other comprehensive loss on the Company’s consolidated balance sheets.
During fiscal years 2014 and 2013, the Company made contributions totaling $26.4 million and $24.9 million to the pension plan. Contributions for fiscal 2014 included minimum required contributions of $19.1 million in cash and a voluntary excess contribution in September 2014 of 250,000 shares of Company common stock valued at $7.4 million at the time of the contribution. Based upon current actuarial projections and pension funding regulations, future minimum required contributions to the pension plan to achieve fully funded status are estimated at $25.0 million. There are no minimum required contributions for fiscal 2015. The net present value of the future minimum required contributions, discounted at 4.9%, is estimated at $19.9 million. Required contributions after fiscal 2015 are subject to change and will depend on future interest rate levels, values in equity and fixed income markets, and the level and timing of interim contributions we may make to the pension plan.
50
Weighted average assumptions used to determine benefit cost and benefit obligation for the pension plan follow:
Fiscal Year Ended | ||||||
December 28, 2014 | December 29, 2013 | December 30, 2012 | ||||
Discount rate used to determine benefit obligation | 3.55% | 4.45% | 3.50% | |||
Discount rate used to determine benefit cost | 4.45% | 3.50% | 4.05% | |||
Expected return on plan assets | 7.75% | 7.75% | 8.25% | |||
Measurement date for pension benefit obligations | December 28, 2014 | December 29, 2013 | December 30, 2012 | |||
The Company's expected rate of return on plan assets is determined in part by reviewing past actual investment returns of plan assets and historical returns of the Company's asset allocation targets. In addition, management reviews assessments of the current market environment based on a variety of data sources by asset class, including correlations between economic growth, volatility, risk, return rates, interest rates, and inflation, applied to a number of different time periods, seeking time periods that are most representative of current markets. In reviewing these assessments, management relies in part on input
from the Company's independent investment manager and actuaries, who provide asset-liability modeling and other advice services which simulate how pension assets and liabilities will respond under different investment and interest rate scenarios. These models incorporate the Company's specific liability and cash flow information as well as other factors that influence the pension plan liability and corresponding assets. In addition, management periodically evaluates actual returns against appropriate benchmarks to determine if actual return rates were commensurate with expectations. Based on the Company's analysis of past actual return rates, current and expected asset allocations, and future expectations of asset performance, the long-term expected rate of return on assets remained unchanged at 7.75% for cost recognition purposes for fiscal 2014.
The Company has adopted an investment policy which is periodically reviewed and updated. The primary objective of the investment policy is to maximize the funded status of the pension plan based on a long-term investment horizon. The Company's long-term strategic investment objectives take into consideration a number of factors, including the funded status of the plan, the plan's projected liquidity needs, the demographics of the plan's participants, and a consideration of the probability and duration of investment losses weighted against the potential for long-term appreciation of assets.
The Company's investment policy also establishes asset allocation targets (guidelines) for each primary asset class. The asset allocation targets per the Company's most recently adopted investment policy statement are as follows:
Asset Class | Target Allocation |
Equity | 40% to 70% |
Fixed income | 15% to 50% |
Alternative investments | 0% to 10% |
Cash | 0% to 10% |
Rapid unanticipated market shifts or changes in economic conditions may cause the asset mix to fall outside the target allocations. Generally these divergences should be of a short-term nature, and rebalancing may be necessary. Investments are diversified within asset classes with the intent of minimizing risk of large losses to the pension plan while maintaining liquidity sufficient to fund current benefit payments.
The strategy for equity holdings is to provide opportunities to earn higher rates of return than with fixed income investments, while minimizing concentrations of risk by investing in a diversified mix of companies and industries worldwide, with varying market capitalization levels, growth and value profiles, fund types, and fund managers. The U.S equity holdings portion of the portfolio consists primarily of equity securities or mutual funds of companies listed on registered exchanges or actively traded in the over-the-counter markets. International equity holdings consist primarily of equity securities of non-U.S. issuers purchased in foreign markets, on U.S. or foreign exchanges, or the over-the-counter markets.
The fixed income investment strategy includes longer term maturities which match longer duration pension liabilities, and also includes the higher yield alternatives which are shorter in duration and allow for higher potential returns. Fixed income holdings include core fixed income securities rated investment grade or better, such as bonds and debentures issued by
51
domestic and foreign private and governmental issuers, as well as high-yield fixed income securities rated below investment grade. The emerging market debt portion of the portfolio consists primarily of debt securities rated below investment grade of government and corporate issuers in emerging market countries and of entities organized to restructure outstanding debt of such issuers. The primary strategy for investing in emerging market debt is to provide opportunities to earn higher returns than core fixed income.
Limited partnership holdings consist primarily of investments in hedge funds and private investment funds. The portfolio may be allocated across several hedge fund styles and strategies, and may include equity securities, debt securities, asset-backed securities, exchange-traded funds, and derivatives. Investments in limited partnerships provide opportunities to earn above market returns.
The fair values of pension plan assets as of December 28, 2014, follows:
Balance as of | Quoted Prices in Active Markets for Identical Assets | Significant Other Observable Inputs | Significant Unobservable Inputs | |||||||||||||
Pension Plan Assets | December 28, 2014 | (Level 1) | (Level 2) | (Level 3) | ||||||||||||
Cash and cash equivalents | $ | 387 | $ | 387 | $ | — | $ | — | ||||||||
Equity holdings: | ||||||||||||||||
U.S. large cap | 19,210 | 19,210 | — | — | ||||||||||||
U.S. small cap | 12,461 | 12,461 | — | — | ||||||||||||
U.S. blended cap | 22,946 | 22,946 | — | — | ||||||||||||
International equity | 27,604 | 27,604 | — | — | ||||||||||||
Total equity holdings | 82,221 | 82,221 | — | — | ||||||||||||
Fixed income holdings: | ||||||||||||||||
Core fixed income | 26,851 | — | 26,851 | — | ||||||||||||
Diversified short term debt | 3,535 | — | 3,535 | — | ||||||||||||
Emerging market debt | 4,795 | — | 4,795 | — | ||||||||||||
High yield debt | 3,626 | — | 3,626 | — | ||||||||||||
Total fixed income holdings | 38,807 | — | 38,807 | — | ||||||||||||
Multi asset class holdings | 4,521 | — | 4,521 | — | ||||||||||||
Limited partnership holdings | 16,373 | — | 16,373 | — | ||||||||||||
Total pension plan assets | $ | 142,309 | $ | 82,608 | $ | 59,701 | $ | — | ||||||||
Pension plan assets invested in U.S. small cap equity in the table above include 201,550 shares of Company common stock valued at $7,659.
Subsequent to the end of fiscal 2014, the Company liquidated all of the pension plan's limited partnership holdings, except for a required 10% retention amount expected to be liquidated within six months. The proceeds from the limited partnership holding were invested into equity and fixed income holdings. As a result, the pension plan's asset allocation as of February 2015 was approximately 59% in equity holdings and 42% in fixed income holdings, with 1% retained in limited partnership holdings.
52
The fair values of pension plan assets as of December 29, 2013, follows:
Balance as of | Quoted Prices in Active Markets for Identical Assets | Significant Other Observable Inputs | Significant Unobservable Inputs | |||||||||||||
Pension Plan Assets | December 29, 2013 | (Level 1) | (Level 2) | (Level 3) | ||||||||||||
Cash and cash equivalents | $ | 3 | $ | 3 | $ | — | $ | — | ||||||||
Equity holdings: | ||||||||||||||||
U.S. large cap | 21,273 | 21,273 | — | — | ||||||||||||
U.S. small cap | 7,216 | 7,216 | — | — | ||||||||||||
U.S. blended cap | 27,794 | 27,794 | — | — | ||||||||||||
International equity | 34,503 | 34,503 | — | — | ||||||||||||
Total equity holdings | 90,786 | 90,786 | — | — | ||||||||||||
Fixed income holdings: | ||||||||||||||||
Core fixed income | 13,654 | — | 13,654 | — | ||||||||||||
Diversified short term debt | 9,732 | — | 9,732 | — | ||||||||||||
Emerging market debt | 7,942 | — | 7,942 | — | ||||||||||||
High yield debt | 2,517 | — | 2,517 | — | ||||||||||||
Total fixed income holdings | 33,845 | — | 33,845 | — | ||||||||||||
Multi asset class holdings | 15,032 | — | 15,032 | — | ||||||||||||
Limited partnership holdings | 20,937 | — | 20,937 | — | ||||||||||||
Total pension plan assets | $ | 160,603 | $ | 90,789 | $ | 69,814 | $ | — | ||||||||
Pension plan assets do not include any shares of Company common stock as of December 29, 2013.
The Company uses the market approach in determining the fair value of pension assets, which uses observable prices and other information generated by market transactions involving identical or comparable assets. Cash is valued at cost, which approximates fair value.
The valuation of level 1 assets reflects quoted closing market prices from the exchanges where the securities are actively traded.
Level 2 assets are valued using observable inputs for similar assets in active markets, or identical assets in inactive markets. Debt securities categorized as level 2 assets are generally valued based on independent broker/dealer bids, or by comparison to other debt securities having similar durations, yields, and credit ratings. The fair value of the Company's pension plan investments in limited partnership holdings have been estimated using the net asset value per share of the investment as a practical expedient.
Level 3 assets are fund investments in private companies, and are typically valued using entity-specific inputs, including discounted cash flow analysis, earnings multiple approaches, recent transactions, volatilities, and other factors.
Expected future benefit payments under the pension plan by fiscal year are as follows:
Fiscal | Benefit | |||
Year | Payment | |||
2015 | $ | 12,557 | ||
2016 | 12,372 | |||
2017 | 12,237 | |||
2018 | 12,001 | |||
2019 | 11,817 | |||
2020-2024 | 55,101 | |||
53
In addition to the pension plan, the Company maintains a defined contribution savings plan (“401k plan”) for eligible employees. Contributions made by the Company to the 401k plan during fiscal 2014, 2013, and 2012 were $453, $444, and $449, respectively.
13. Warranties
The Company offers warranties for certain products that it manufactures, with the warranty term generally ranging from one to two years. Warranty reserves are established for costs expected to be incurred after the sale and delivery of products under warranty, based mainly on known product failures and historical experience, and are included in accrued liabilities in the accompanying consolidated balance sheets.
Changes in the warranty reserve for fiscal years 2014 and 2013 follow:
December 28, 2014 | December 29, 2013 | |||||||
Balance at beginning of period | $ | 379 | $ | 370 | ||||
Amounts charged to earnings, net | 377 | 603 | ||||||
Use of reserve for warranty obligations | (401 | ) | (594 | ) | ||||
Balance at end of period | $ | 355 | $ | 379 | ||||
14. Supplemental Cash Flow Information
Changes in operating assets and liabilities of continuing operations follow:
Fiscal Year Ended | ||||||||||||
Fiscal period ended | December 28, 2014 | December 29, 2013 | December 30, 2012 | |||||||||
(Increase) decrease in accounts receivable | $ | (1,875 | ) | $ | 733 | $ | 906 | |||||
(Increase) decrease in inventories | (304 | ) | 1,546 | (1,163 | ) | |||||||
(Increase) decrease in prepaid expenses and other current assets | 13 | (104 | ) | 222 | ||||||||
(Increase) decrease in other assets | 310 | 747 | 226 | |||||||||
Increase (decrease) in accounts payable | (28 | ) | (1,559 | ) | (1,339 | ) | ||||||
Increase (decrease) in accrued liabilities | 1,897 | (915 | ) | (317 | ) | |||||||
Increase (decrease) in operating assets and liabilities | $ | 13 | $ | 448 | $ | (1,465 | ) | |||||
Cash paid for interest and income taxes : | ||||||||||||
Interest | $ | — | $ | — | $ | — | ||||||
Income taxes | $ | 18 | $ | 57 | $ | 210 | ||||||
54
15. Accrued Liabilities
Accrued liabilities consist of the following:
December 28, 2014 | December 29, 2013 | |||||||
Salaries, wages, and incentive compensation | $ | 2,679 | $ | 598 | ||||
Commissions | 771 | 612 | ||||||
Customer deposits | 725 | 758 | ||||||
Environmental | 706 | 708 | ||||||
Warranty | 355 | 379 | ||||||
All other | 1,467 | 1,778 | ||||||
Total accrued liabilities | $ | 6,703 | $ | 4,833 | ||||
16. Accumulated Other Comprehensive Income (Loss)
Accumulated other comprehensive income (loss) is comprised primarily of the cumulative balance of adjustments related to the Company's defined benefit pension plan ("pension plan", see Note 12 of Notes to Consolidated Financial Statements). Changes in accumulated other comprehensive income (loss) are shown by component in the table below. The pension plan's unrecognized losses are net of a $17.0 million income tax benefit at the end of each fiscal year. Amounts reclassified to net income in the table below represent the amortization of actuarial losses related to the Company's pension plan and are included in pension expense in the accompanying consolidated statements of operations.
Accumulated | |||||||||
Defined | Foreign | Other | |||||||
Benefit | Currency | Comprehensive | |||||||
Pension | Translation | Income | |||||||
Plan | Adjustments | (Loss) | |||||||
Balance, January 1, 2012 | $ | (178,592 | ) | $ | 739 | $ | (177,853 | ) | |
Other comprehensive income (loss): | |||||||||
Income (loss) before reclassifications | (16,889 | ) | 132 | (16,757 | ) | ||||
Amounts reclassified to net income | 8,022 | — | 8,022 | ||||||
Total other comprehensive income (loss) | (8,867 | ) | 132 | (8,735 | ) | ||||
Balance, December 30, 2012 | (187,459 | ) | 871 | (186,588 | ) | ||||
Other comprehensive income (loss): | |||||||||
Income (loss) before reclassifications | 26,632 | (284 | ) | 26,348 | |||||
Amounts reclassified to net income | 8,757 | — | 8,757 | ||||||
Total other comprehensive income (loss) | 35,389 | (284 | ) | 35,105 | |||||
Balance, December 29, 2013 | (152,070 | ) | 587 | (151,483 | ) | ||||
Other comprehensive income (loss): | |||||||||
Income (loss) before reclassifications | (8,996 | ) | (421 | ) | (9,417 | ) | |||
Amounts reclassified to net income | 44,018 | — | 44,018 | ||||||
Total other comprehensive income (loss) | 35,022 | (421 | ) | 34,601 | |||||
Balance, December 28, 2014 | $ | (117,048 | ) | $ | 166 | $ | (116,882 | ) | |
55
17. Business Segment and Geographic Information
The Company currently operates within a single business segment, digital power control systems, and sells its products primarily to large original equipment manufacturers. The Company performs ongoing credit evaluations of its customers' financial conditions and generally requires no collateral. The Company does not have any single customer whose purchases represented 10% or more of the Company’s total revenue in fiscal year 2014, 2013, or 2012.
Information with respect to the Company's foreign subsidiaries follows:
Fiscal Year Ended | ||||||||||||
December 28, 2014 | December 29, 2013 | December 30, 2012 | ||||||||||
Sales | $ | 6,490 | $ | 6,694 | $ | 7,164 | ||||||
Income from operations | 205 | 368 | 447 | |||||||||
Identifiable assets | 6,455 | 7,882 | 6,553 | |||||||||
Capital expenditures | 20 | 36 | — | |||||||||
Depreciation and amortization | 19 | 31 | 26 | |||||||||
Sales by foreign subsidiaries include sales of products to customers within the U.S.
Export sales from the United States were $5,279 during fiscal 2014, $4,625 during fiscal 2013, and $6,698 during fiscal 2012.
18. Quarterly Results (unaudited)
The supplementary financial information presented below provides quarterly financial data for fiscal year 2014 and for fiscal year 2013.
Fiscal 2014 quarter ended | March 30, 2014 | June 29, 2014 | September 28, 2014 | December 28, 2014 | ||||||||||||
Net sales | $ | 24,113 | $ | 27,009 | $ | 29,576 | $ | 29,015 | ||||||||
Gross profit | 8,152 | 9,715 | 10,927 | 11,157 | ||||||||||||
Income (loss) from operations | 1,438 | 2,750 | 3,340 | (33,258 | ) | |||||||||||
Income (loss) from continuing operations before income taxes | 1,438 | 2,750 | 3,340 | (33,258 | ) | |||||||||||
Provision for income taxes | 240 | 240 | 131 | 104 | ||||||||||||
Income (loss) from continuing operations | 1,198 | 2,510 | 3,209 | (33,362 | ) | |||||||||||
Income (loss) from discontinued operations | (144 | ) | (213 | ) | — | (461 | ) | |||||||||
Net income (loss) | $ | 1,054 | $ | 2,297 | $ | 3,209 | $ | (33,823 | ) | |||||||
Earnings per common share - basic: | ||||||||||||||||
Income (loss) from continuing operations | $ | 0.37 | $ | 0.77 | $ | 0.96 | $ | (9.44 | ) | |||||||
Income (loss) from discontinued operations | $ | (0.05 | ) | $ | (0.07 | ) | $ | — | $ | (0.13 | ) | |||||
Net income (loss) | $ | 0.32 | $ | 0.70 | $ | 0.96 | $ | (9.57 | ) | |||||||
Earnings per common share - diluted: | ||||||||||||||||
Income (loss) from continuing operations | $ | 0.35 | $ | 0.74 | $ | 0.88 | $ | (9.44 | ) | |||||||
Income (loss) from discontinued operations | $ | (0.04 | ) | $ | (0.06 | ) | $ | — | $ | (0.13 | ) | |||||
Net income (loss) | $ | 0.31 | $ | 0.68 | $ | 0.88 | $ | (9.57 | ) | |||||||
56
Fiscal 2013 quarter ended | March 31, 2013 | June 30, 2013 | September 29, 2013 | December 29, 2013 | ||||||||||||
Net sales | $ | 25,059 | $ | 27,006 | $ | 26,011 | $ | 25,240 | ||||||||
Gross profit | 8,142 | 9,343 | 9,175 | 8,665 | ||||||||||||
Income (loss) from operations | 806 | 1,473 | 1,545 | 951 | ||||||||||||
Income (loss) from continuing operations before income taxes | 806 | 1,473 | 1,545 | 951 | ||||||||||||
Provision for income taxes | 261 | 280 | 262 | 213 | ||||||||||||
Income (loss) from continuing operations | 545 | 1,193 | 1,283 | 738 | ||||||||||||
Income (loss) from discontinued operations | (73 | ) | (28 | ) | (161 | ) | (365 | ) | ||||||||
Net income (loss) | $ | 472 | $ | 1,165 | $ | 1,122 | $ | 373 | ||||||||
Earnings per common share - basic: | ||||||||||||||||
Income (loss) from continuing operations | $ | 0.17 | $ | 0.37 | $ | 0.40 | $ | 0.23 | ||||||||
Income (loss) from discontinued operations | $ | (0.02 | ) | $ | (0.01 | ) | $ | (0.05 | ) | $ | (0.11 | ) | ||||
Net income (loss) | $ | 0.15 | $ | 0.36 | $ | 0.35 | $ | 0.12 | ||||||||
Earnings per common share - diluted: | ||||||||||||||||
Income (loss) from continuing operations | $ | 0.16 | $ | 0.36 | $ | 0.38 | $ | 0.22 | ||||||||
Income (loss) from discontinued operations | $ | (0.02 | ) | $ | (0.01 | ) | $ | (0.04 | ) | $ | (0.11 | ) | ||||
Net income (loss) | $ | 0.14 | $ | 0.35 | $ | 0.34 | $ | 0.11 | ||||||||
57
ITEM 9. CHANGES IN AND DISAGREEMENTS WITH ACCOUNTANTS ON ACCOUNTING AND FINANCIAL DISCLOSURE
Magnetek had no disagreements with its independent accountants in fiscal year 2014 with respect to accounting and financial disclosure, and has not changed its independent accountants during the three most recent fiscal periods.
ITEM 9A. CONTROLS AND PROCEDURES
(a) Evaluation of Disclosure Controls and Procedures
Our management, under the supervision of and with the participation of our Chief Executive Officer and Chief Financial Officer, has evaluated the effectiveness of our disclosure controls and procedures, as such term is defined in Rules 13a-15(e) under the Securities Exchange Act of 1934, as amended (the “Exchange Act”), as of the end of the period covered by
this Annual Report on Form 10-K. Based on such evaluation, our Chief Executive Officer and Chief Financial Officer have concluded that our disclosure controls and procedures were effective as of December 28, 2014.
(b) Management’s Report on Internal Control Over Financial Reporting
Our management is responsible for establishing and maintaining adequate internal control over financial reporting (as defined in Rules 13a-15(f) and 15d-15(f) of the Exchange Act) to provide reasonable assurance regarding the reliability of our financial reporting and the preparation of financial statements for external purposes in accordance with U.S. generally accepted accounting principles.
Internal control over financial reporting is a process designed to provide reasonable assurance regarding the reliability of financial reporting and the preparation of financial statements for external purposes in accordance with generally accepted accounting principles. Our internal control over financial reporting includes those policies and procedures that (i) pertain to the maintenance of records that, in reasonable detail, accurately and fairly reflect the transactions and dispositions of the assets of the Company; (ii) provide reasonable assurance that transactions are recorded as necessary to permit preparation of financial statements in accordance with generally accepted accounting principles, and that receipts and expenditures of the Company are being made only in accordance with authorizations of management and directors of the Company; and (iii) provide reasonable assurance regarding prevention or timely detection of unauthorized acquisition, use, or disposition of the Company’s assets that could have a material effect on the Company’s financial statements.
Our management assessed the effectiveness of our internal control over financial reporting as of December 28, 2014, the end of our 2014 fiscal year. Our management’s assessment was based on the criteria set forth in Internal Control-Integrated Framework 2013 issued by the Committee of Sponsoring Organizations of the Treadway Commission.
Based on the assessment, our management has concluded that our internal control over financial reporting was effective as of December 28, 2014, the end of our fiscal year. This Annual Report does not include an attestation report of the Company’s registered public accounting firm regarding internal control over financial reporting. Management’s report was not subject to attestation by the Company’s registered public accounting firm pursuant to rules of the Securities and Exchange Commission that permit the Company to provide only management’s report in this Annual Report.
Because of inherent limitations, internal control over financial reporting, no matter how well designed, may not prevent or detect misstatements. Therefore, even effective internal control over financial reporting can only provide reasonable assurance with respect to the reliability of financial reporting and the preparation and presentation of financial statements. Also, projections of any evaluation about the effectiveness of internal control over financial reporting to future periods are subject to the risk that controls may become inadequate due to changes in conditions, or that the degree of compliance with the policies or procedures may deteriorate.
(c) Changes in Controls and Procedures
No change in internal control over financial reporting occurred during the period ended December 28, 2014, that has materially affected, or is reasonably likely to materially affect, such internal control over financial reporting.
ITEM 9B. OTHER INFORMATION
No other information is required to be reported for matters not disclosed on Form 8-K during the fiscal year ended December 28, 2014.
58
PART III
ITEM 10. DIRECTORS, EXECUTIVE OFFICERS AND CORPORATE GOVERNANCE
The information called for by this Item 10 is hereby incorporated by reference to the sections of the Company’s 2015 Proxy Statement entitled “Proposal No. 1 – Election of Directors,” “Section 16(a) Beneficial Ownership Reporting Compliance,” “Corporate Governance Principles,” “Standing Committees of the Board” and by reference to Part I of this Annual Report on Form 10-K under the heading “Supplemental Information-Executive Officers of the Company.”
Supplemental Information - Code of Business Conduct and Ethics
We have adopted a Code of Business Conduct and Ethics (“Code of Ethics”) for all of our directors and employees that contains portions specifically applicable to executives and officers of the Company, including the Chief Executive Officer, the Chief Financial Officer, the Controller and employees performing financial functions for the Company. The Code of Ethics is posted on Magnetek’s website at www.magnetek.com. A copy of the Code of Ethics is available, without charge, to any shareholder who sends a written request to our Corporate Secretary at N49 W13650 Campbell Drive, Menomonee Falls, Wisconsin, 53051. We intend to satisfy the disclosure requirements of Form 8-K regarding any amendment to, or waiver of, a provision of the Code of Ethics by posting such information on our website, at the web address and location specified above.
ITEM 11. EXECUTIVE COMPENSATION
The information called for by this Item 11 is hereby incorporated by reference to the section of the Company’s 2015 Proxy Statement entitled “Compensation Discussion and Analysis” and the tables, narrative and notes relating to Executive and Director compensation, “Summary Compensation Table,” “All Other Compensation Table,” “Grants of Plan-Based Awards in Fiscal Year Table,” “Outstanding Equity Awards at Fiscal Year-End Table,” “Option Exercises and Stock Vested for Fiscal Year Table,” “Pension Benefits for Fiscal Year Table,” “Employment, Severance and Change in Control Agreements and Other Arrangements Table,” “Director Compensation for Fiscal Year Table,” “Compensation Committee Interlocks and Insider Participation” and “Compensation Committee Report.”
ITEM 12. SECURITY OWNERSHIP OF CERTAIN BENEFICIAL OWNERS AND MANAGEMENT AND RELATED STOCKHOLDER MATTERS
The information called for by this Item 12 is hereby incorporated by reference to the sections of the Company’s 2015 Proxy Statement entitled “Equity Compensation Plan Information Table” and “Beneficial Ownership of Magnetek, Inc. Common Stock by Directors, Officers and Certain Other Owners.”
ITEM 13. CERTAIN RELATIONSHIPS AND RELATED TRANSACTIONS, AND DIRECTOR INDEPENDENCE
The information required by this Item 13 is hereby incorporated by reference to the sections of the Company’s 2015 Proxy Statement entitled “Proposal 1 – Election of Directors,” “Relationships and Related Transactions,” and “Corporate Governance Principles.”
ITEM 14. PRINCIPAL ACCOUNTANT FEES AND SERVICES
The information called for by this Item 14 is hereby incorporated by reference to the section of the Company’s 2015 Proxy Statement entitled “Proposal No. 2 – Ratification of the Appointment of Independent Registered Public Accounting Firm.”
59
PART IV
ITEM 15. EXHIBITS AND FINANCIAL STATEMENT SCHEDULES
(a) Documents filed as part of this report:
1. | Financial statements - see Part II, Item 8 |
2. | Financial statement Schedule II - Valuation and Qualifying Accounts. Schedules not included have been omitted because they are not applicable. |
3. | Exhibits - see exhibit index below |
The following exhibits are filed as part of this Annual Report Form 10-K, or are incorporated herein by reference. Where an exhibit is incorporated by reference, the number which precedes the description of the exhibit indicates the documents to which the cross-reference is made.
Exhibit No. | Note | Description of Exhibit | |
3.1(a) | (1) | Restated Certificate of Incorporation of the Company, effective as of March 12, 2012. | |
3.1(b) | (2) | Certificate of Elimination. | |
3.1(c) | ** | Certificate of Amendment to the Restated Certificate of Incorporation. | |
3.2 | (3) | Magnetek, Inc. Amended and Restated By-Laws. | |
4.1 | (31) | Registration Rights Agreement dated September 5, 2014, by and between the Company and Evercore Trust Company, N.A. | |
10.1 | (6) | Agreement for the Sale of Magnetek, Inc. Power Electronics Group, dated as of September 28, 2006, by and between the Company and Power-One, Inc. | |
10.2 | (7) | Asset Purchase Agreement dated February 4, 2008 by and among Magnetek, Inc., Enrange LLC, W. Christopher Dulin, William Gibson and David Ashburn. | |
10.3 | (8) | Settlement Agreement and Release, dated as of April 27, 2007, by and between the Company and Samsung Electro-Mechanics Co., Ltd. | |
10.4 | (9) | Settlement Agreement, dated as of May 24, 2007, by and among the Company, Magnetek Controls, Inc., Magnetek National Electric Coil, Inc., Federal-Mogul Corporation, Federal-Mogul Products, Inc., and certain other parties thereto. | |
10.5 | (10) | Settlement Agreement, dated as of June 12, 2008, by and among Magnetek, Inc., Ole K. Nilssen and Geo Foundation, Ltd. | |
10.6 | (11) | Lease of Menomonee Falls, Wisconsin facility, dated as of July 23, 1999. | |
10.7 | (12) | Industrial Building Lease (Net) dated as of November 26, 2006, and Amendment of Industrial Building Lease (Net) dated as of April 5, 2007, by and between the Company and W.C. Bradley Co. | |
10.8(a) | (13) | Revolving Credit Agreement dated as of November 6, 2007, by and between the Company and Associated Bank, N.A. | |
10.8(b) | (14) | First Amendment to Credit Agreement dated as of December 15, 2008 by and between the Company and Associated Bank, N.A. | |
10.8(c) | (15) | Second Amendment to Credit Agreement dated effective as of February 19, 2010 by and between the Company and Associated Bank, N.A. | |
10.8(d) | (16) | Third Amendment to Credit Agreement dated effective as of December 9, 2010, by and between the Company and Associated Bank, N.A. | |
10.8(e) | (17) | Fourth Amendment to Credit Agreement dated effective as of December 15, 2011, by and between the Company and Associated Bank, N.A. | |
10.8(f) | (18) | Fifth Amendment to Credit Agreement dated as of June 7, 2013, by and between the Company and Associated Bank, N.A. | |
10.8(g) | (19) | Sixth Amendment to Credit Agreement dated as of December 19, 2013, by and between the Company and Associated Bank, N.A. | |
10.8(h) | (32) | Seventh Amendment to Credit Agreement dated as of June 15, 2014, by and between the Company and Associated Bank, N.A. | |
10.8(i) | (33) | Eighth Amendment to Credit Agreement dated as of August 20, 2014, by and between the Company and Associated Bank, N.A. | |
60
10.9* | (20) | Change of Control Agreement, dated as of December 11, 2002, by and between Peter McCormick and the Company. | |
10.10* | (4) | Change of Control Agreement, dated as of July 29, 2003, by and between Marty Schwenner and the Company. | |
10.11* | (21) | Form of Change of Control Agreement for named executive officers Peter M. McCormick and Marty J. Schwenner effective as of December 21, 2010. | |
10.12* | (5) | Form of Retention Agreement for named executive officer Hungsun S. Hui effective as of February 24, 2009. | |
10.13* | (5) | Form of Retention Agreement for named executive officer Scott S. Cramer effective as of March 1, 2010. | |
10.14* | (21) | Form of Retention Agreement for named executive officer Michael J. Stauber effective as of February 28, 2011. | |
10.15* | . | Reserved. | |
10.16(a)* | (23) | Second Amended and Restated 2004 Stock Incentive Plan of Magnetek, Inc. (the “2004 Plan”). | |
10.16(b)* | (24) | First Amendment to the 2004 Plan. | |
10.16(c)* | (25) | Form of Restricted Stock Award Agreement Pursuant to the 2004 Plan. | |
10.16(d)* | (26) | Form of Non-Qualified Stock Option Agreement Pursuant to the 2004 Plan. | |
10.16(e)* | (26) | Form of Non-Qualified Stock Option Agreement (Performance Based) Pursuant to the 2004 Plan. | |
10.16(f)* | (26) | Form of Non-Qualified Stock Option Agreement (Retention Based) Pursuant to the 2004 Plan. | |
10.16(g)* | (26) | Form of Restricted Stock Award Agreement (Performance Based) Pursuant to the 2004 Plan. | |
10.16(h)* | (26) | Form of Restricted Stock Award Agreement (Retention Based) Pursuant to the 2004 Plan. | |
10.16(i)* | (27) | Standard Terms and Conditions Relating to Non-Qualified Options for the 2004 Plan. | |
10.17* | (28) | Amended and Restated 2010 Non-Employee Director Stock Option Plan of Magnetek, Inc. | |
10.18* | (24) | Magnetek, Inc. Director Compensation and Deferral Investment Plan. | |
10.19 | (29) | Security Agreement dated September 14, 2012 between Magnetek, Inc. and the Pension Benefit Guaranty Corporation. | |
10.20 | (34) | 2014 Stock Incentive Plan of Magnetek, Inc. | |
10.21 | (31) | Contribution Agreement, dated September 5, 2014, by and between the Company and Evercore Trust Company, N.A. | |
21.1 | ** | Subsidiaries of the Registrant as of December 28, 2014. | |
23.1 | ** | Consent of Independent Registered Public Accounting Firm. | |
31.1 | ** | Certification Pursuant to 15 U.S.C. Section 7241. | |
31.2 | ** | Certification Pursuant to 15 U.S.C. Section 7241. | |
32.1 | ** | Certifications Pursuant to 18 U.S.C. Section 1350. | |
* | Indicates a management contract or compensatory plan or arrangement. | ||
** | Filed with this Form 10-K. | ||
(1) | Previously filed with Form 10-K for the Transition Period ended January 1, 2012, and incorporated herein by this reference. | ||
(2) | Previously filed with Form 8‑K filed May 14, 2013, and incorporated herein by this reference. | ||
(3) | Previously filed with Form 8-K filed August 8, 2014, and incorporated herein by this reference. | ||
(4) | Previously filed with Form 10-Q for quarter ended September 30, 2003, and incorporated herein by this reference. | ||
(5) | Previously filed with Form 8-K filed February 9, 2009, and incorporated herein by this reference. | ||
(6) | Previously filed with Form 10-K for Fiscal Year ended July 2, 2006, and incorporated herein by this reference. | ||
(7) | Previously filed with Form 8-K filed February 5, 2008, and incorporated herein by this reference. | ||
(8) | Previously filed with Form 8-K filed May 1, 2007, and incorporated herein by this reference. | ||
(9) | Previously filed with Form 8-K filed June 4, 2007, and incorporated herein by this reference. | ||
(10) | Previously filed with Form 8-K filed June 13, 2008, and incorporated herein by this reference. | ||
(11) | Previously filed with Form 10-K for Fiscal Year ended June 27, 1999, and incorporated herein by this reference. | ||
61
(12) | Previously filed with Form 8-K filed August 23, 2007, and incorporated herein by this reference. | ||
(13) | Previously filed with Form 8-K filed November 7, 2007, and incorporated herein by this reference. | ||
(14) | Previously filed with Form 8-K filed December 18, 2008, and incorporated herein by this reference. | ||
(15) | Previously filed with Form 8-K filed February 22, 2010, and incorporated herein by this reference. | ||
(16) | Previously filed with Form 8-K filed December 13, 2010, and incorporated herein by this reference. | ||
(17) | Previously filed with Form 8-K filed December 19, 2011, and incorporated herein by this reference. | ||
(18) | Previously filed with Form 8-K filed June 7, 2013, and incorporated herein by reference. | ||
(19) | Previously filed with Form 8-K filed December 20, 2013 and incorporated herein by reference. | ||
(20) | Previously filed with Form 10-Q for quarter ended December 31, 2002, and incorporated herein by this reference. | ||
(21) | Previously filed with Form 10-Q for quarter ended April 3, 2011, and incorporated herein by this reference. | ||
(22) | Previously filed with Form 8-K filed March 3, 2010, and incorporated herein by this reference. | ||
(23) | Previously filed with Company's Proxy Statement dated September 16, 2009, for the 2009 Annual Meeting of the Shareholders, and incorporated herein by this reference. | ||
(24) | Previously filed with Company's Proxy Statement dated September 19, 2011, and incorporated herein by this reference. | ||
(25) | Previously filed with Form 10-Q for quarter ended December 27, 2009, and incorporated herein by this reference. | ||
(26) | Previously filed with Form 10-Q for quarter ended October 3, 2010, and incorporated herein by this reference. | ||
(27) | Previously filed with Form 10-K for Fiscal Year ended June 27, 2010, and incorporated herein by this reference. | ||
(28) | Previously filed with Company's Proxy Statement dated September 20, 2010, for the 2010 Annual Meeting of the Shareholders, and incorporated herein by this reference. | ||
(29) | Previously filed with Form 8-K filed September 19, 2012 and incorporated herein by this reference. | ||
(30) | Previously filed with Form 8-K filed June 7, 2013, and incorporated herein by reference. | ||
(31) | Previously filed with Form 8-K filed September 8, 2014, and incorporated herein by reference. | ||
(32) | Previously filed with Form 8-K filed June 16, 2014, and incorporated herein by reference. | ||
(33) | Previously filed with Form 8-K filed August 20, 2014, and incorporated herein by reference. | ||
(34) | Previously filed with the Company's Proxy Statement dated April 1, 2014, and incorporated herein by reference. | ||
62
Chief Executive Officer and Chief Financial Officer Certifications
The certifications of Magnetek’s Chief Executive Officer and Chief Financial Officer required under Section 302 and 906 of the Sarbanes-Oxley Act of 2002 have been filed with the Securities and Exchange Commission as Exhibits 31.1, 31.2, and 32.1 to the Company’s Annual Report on Form 10-K for the fiscal year ended December 28, 2014.
______________________________________________________________________________________________________
SIGNATURES
Pursuant to the requirements of Section 13 or 15(d) of the Securities Exchange Act of 1934, the registrant has duly caused this report to be signed on its behalf by the undersigned, thereunto duly authorized in the Village of Menomonee Falls, State of Wisconsin, on the 20th day of March, 2015.
MAGNETEK, INC.
By: | /s/ MARTY J. SCHWENNER | Vice President and Chief Financial Officer | March 20, 2015 |
Marty J. Schwenner | (Principal Financial Officer) | ||
Pursuant to the requirements of the Securities Exchange Act of 1934, this report has been signed below by the following persons on behalf of the registrant and in the capacities and on the dates indicated:
Signature | Title | Date |
/s/ MITCHELL I. QUAIN | Chairman of the Board of Directors | March 20, 2015 |
Mitchell I. Quain | ||
/s/ DAVID A. BLOSS, SR. | Director | March 20, 2015 |
David A. Bloss, Sr. | ||
/s/ ALAN B. LEVINE | Director | March 20, 2015 |
Alan B. Levine | ||
/s/ DAVID P. REILAND | Director | March 20, 2015 |
David P. Reiland | ||
/s/ PETER M. MCCORMICK | Director, President and Chief Executive Officer | March 20, 2015 |
Peter M. McCormick | ||
/s/ MARTY J. SCHWENNER | Vice President and Chief Financial Officer | March 20, 2015 |
Marty J. Schwenner | (Principal Financial Officer) | |
/s/ MICHAEL J. STAUBER | Vice President and Corporate Controller | March 20, 2015 |
Michael J. Stauber | (Principal Accounting Officer) | |
63
SCHEDULE II
MAGNETEK, INC.
VALUATION AND QUALIFYING ACCOUNTS
FISCAL YEARS ENDED DECEMBER 30, 2012, DECEMBER 29, 2013, AND DECEMBER 28, 2014
(amounts in thousands)
Balance at beginning of year | Additions charged (recoveries added) to earnings | Deductions from allowance | Other | Balance at end of year | ||||||||||||||||
December 30, 2012 | ||||||||||||||||||||
Allowance for doubtful accounts | $ | 206 | $ | 13 | $ | — | $ | — | $ | 219 | ||||||||||
December 29, 2013 | ||||||||||||||||||||
Allowance for doubtful accounts | $ | 219 | $ | 13 | $ | (16 | ) | $ | (1 | ) | $ | 215 | ||||||||
December 28, 2014 | ||||||||||||||||||||
Allowance for doubtful accounts | $ | 215 | $ | 39 | $ | (48 | ) | $ | — | $ | 206 | |||||||||
64
REPORT OF INDEPENDENT REGISTERED PUBLIC ACCOUNTING FIRM
The Board of Directors and Stockholders
Magnetek, Inc.
We have audited the consolidated financial statements of Magnetek, Inc. as of December 28, 2014, and December 29, 2013, and for the years ended December 28, 2014, December 29, 2013 and December 30, 2012, and have issued our report thereon dated March 20, 2015 (included elsewhere in this Annual Report on Form 10-K). Our audits also included the financial statement schedule listed in Item 15(a) of this Annual Report on Form 10-K. This schedule is the responsibility of the Company's management. Our responsibility is to express an opinion on this schedule based on our audits.
In our opinion, the financial statement schedule referred to above, when considered in relation to the basic financial statements taken as a whole, presents fairly in all material respects the information set forth therein.
/s/ Ernst & Young LLP | |
Milwaukee, Wisconsin | |
March 20, 2015
65