Attached files
| file | filename |
|---|---|
| EXCEL - IDEA: XBRL DOCUMENT - First Guaranty Bancshares, Inc. | Financial_Report.xls |
| EX-31.2 - CFO 302 CERTIFICATION - First Guaranty Bancshares, Inc. | cfo302cert.htm |
| EX-32.1 - CEO 906 CERTIFICATION - First Guaranty Bancshares, Inc. | ceo906cert.htm |
| EX-32.2 - CFO 906 CERTIFICATION - First Guaranty Bancshares, Inc. | cfo906cert.htm |
| EX-31.1 - CEO 302 CERTIFICATION - First Guaranty Bancshares, Inc. | ceo302cert.htm |
| EX-14.4 - CODE OF ETHICS FOR SENIOR FINANCIAL OFFICERS - First Guaranty Bancshares, Inc. | codeofethicsforsenior.htm |
| EX-14.3 - CODE OF CONDUCT AND ETHICS - First Guaranty Bancshares, Inc. | codeofconductandethics.htm |
| EX-3.4 - ARTICLES OF AMENDMENT ESTABLISHING SERIES C PREFERRED STOCK - First Guaranty Bancshares, Inc. | articlesofamendment.htm |
UNITED STATES
SECURITIES AND EXCHANGE COMMISSION
Washington, D.C. 20549
Form 10-K
xANNUAL REPORT PURSUANT TO SECTION 13 OR 15(d) OF THE SECURITIES EXCHANGE ACT OF 1934
For the fiscal year ended December 31, 2014
or
o TRANSITION REPORT PURSUANT TO SECTION 13 OR 15(d) OF THE SECURITIES EXCHANGE ACT OF 1934
For the transition period from ______________ to ______________.
Commission file number: 000-52748

FIRST GUARANTY BANCSHARES, INC.
(Exact name of registrant as specified in its charter)
|
Louisiana
|
26-0513559
|
|
(State or other jurisdiction incorporation or organization)
|
(I.R.S. Employer Identification Number)
|
|
400 East Thomas Street
|
|
|
Hammond, Louisiana
|
70401
|
|
(Address of principal executive offices)
|
(Zip Code)
|
|
(985) 345-7685
|
|
|
(Registrant’s telephone number, including area code)
|
|
|
Not Applicable
|
|
|
(Former name or former address, if changed since last report)
|
|
|
Securities registered pursuant to Section 12(b) of the Act: None
|
|
|
Securities registered pursuant to Section 12(g) of the Act:
|
|
|
Title of each class
|
|
|
Common Stock, $1 par value per share
|
|
Indicate by check mark if the registrant is a well-known seasoned issuer, as defined in Rule 405 of the Securities Act.
YES o NO x
Indicate by check mark if the registrant is not required to file reports pursuant to Section 13 or Section 15(d) of the Act.
YES o NO x
Indicate by check mark whether the Registrant (1) has filed all reports required to be filed by Section 13 or 15(d) of the Securities Exchange Act of 1934 during the preceding 12 months (or for such shorter period that the registrant was required to file such reports), and (2) has been subject to such filing requirements for the past 90 days.
YES x NO o
Indicate by check mark whether the registrant has submitted electronically and posted on its corporate website, if any, every Interactive Data File required to be submitted and posted pursuant to Rule 405 of Regulation S-T during the preceding 12 months.
YES x NO o
Indicate by check mark if disclosure of delinquent filers pursuant to Item 405 of Regulation S-K (§229.405 of this chapter) is not contained herein, and will not be contained, to the best of registrant’s knowledge, in definitive proxy or information statements incorporated by reference in Part III of this Form 10-K or any amendment to this Form 10-K.T x
Indicate by check mark whether the registrant is a large accelerated filer, an accelerated filer, a non-accelerated filer, or a smaller reporting company. See definitions of “large accelerated filer,” “accelerated filer” and “smaller reporting company” in Rule 12b-2 of the Exchange Act. (Check one):
Large accelerated filer o Accelerated filer o Non-accelerated filer o Smaller reporting company x
Indicate by check mark whether the registrant is a shell company (as defined in Rule 12b-2 of the Act).
YES o NO x
The aggregate market value of the voting common stock held by non-affiliates of the registrant as of June 30, 2014 was $63,187,779 based upon the price from the last trade of $19.81.
As of March 17, 2015, there were issued 6,294,227 and outstanding 6,291,332 shares of the Registrant’s Common Stock.
DOCUMENTS INCORPORATED BY REFERENCE:
(1) Proxy Statement for the 2015 Annual Meeting of Shareholders of the Registrant (Part III).
2
TABLE OF CONTENTS
|
Page
|
||
|
Part I.
|
||
|
Item 1
|
4
|
|
|
Item 1A
|
13
|
|
|
Item 1B
|
21
|
|
|
Item 2
|
22
|
|
|
Item 3
|
22
|
|
|
Item 4
|
22
|
|
|
Part II.
|
||
|
Item 5
|
23 | |
|
Item 6
|
25
|
|
|
Item 7
|
28 | |
|
Item 7A
|
50
|
|
|
Item 8
|
53
|
|
| Notes to the Financial Statements | 58 | |
|
Item 9
|
88 | |
|
Item 9A
|
88
|
|
|
Item 9B
|
88
|
|
|
Part III.
|
||
|
Item 10
|
89
|
|
|
Item 11
|
89
|
|
|
Item 12
|
89
|
|
|
Item 13
|
89
|
|
|
Item 14
|
89
|
|
|
Part IV.
|
||
|
Item 15
|
90
|
3
Our Company
First Guaranty Bancshares, Inc. (the “Company”) is a Louisiana-chartered bank holding company headquartered in Hammond, Louisiana. Our wholly owned subsidiary, First Guaranty Bank (the “Bank”), a Louisiana-chartered commercial bank, provides personalized commercial banking services mainly to Louisiana customers through 21 banking facilities primarily located in the Market Services Areas (MSAs), of Hammond, Baton Rouge, Lafayette and Shreveport-Bossier City. Our principal business consists of attracting deposits from the general public and local municipalities in our market areas and investing those deposits, together with funds generated from operations and borrowings in securities and in lending activities to serve the credit needs of our customer base, including commercial real estate loans, commercial and industrial loans, one- to four-family residential real estate loans, construction and land development loans, agricultural and farmland loans, and to a lesser extent, consumer and multifamily loans. We also participate in certain syndicated loans, including shared national credits, with other financial institutions. We offer a variety of deposit accounts to consumers and small businesses, including personal and business checking and savings accounts, time deposits, money market accounts and demand accounts. We invest a portion of our assets in securities issued by the United States Government and its agencies, state and municipal obligations, corporate debt securities, mutual funds, and equity securities. We also invest in mortgage-backed securities primarily issued or guaranteed by United States Government agencies. In addition, we offer a broad range of consumer services, including personal and commercial credit cards, remote deposit capture, safe deposit boxes, official checks, internet banking, automated teller machines, online bill pay, mobile banking and lockbox services.
At December 31, 2014, we had consolidated total assets of $1.5 billion, total deposits of $1.4 billion and total shareholders’ equity of $139.6 million.
Our market areas present a significant opportunity for growth and expansion, both organically and through strategic acquisitions. The growing economies of our market areas, together with our wide-range banking products, provide us with opportunities for long-term and sustainable growth.
Our History and Growth
First Guaranty Bank was founded in Amite, Louisiana on March 12, 1934. While the origins of First Guaranty Bank go back over 80 years, we began our modern history in 1993 when an investor group, led by Marshall T. Reynolds, our Chairman, invested $3.6 million in First Guaranty Bank as part of a recapitalization plan with the objective of building a community-focused commercial bank in our Louisiana markets. Since the implementation of that recapitalization plan, we have grown from six branches and $159 million in assets at the end of 1993 to 21 branches and $1.5 billion in assets at December 31, 2014. We have also paid a quarterly dividend for 86 consecutive quarters at December 31, 2014. On July 27, 2007, we formed First Guaranty Bancshares and completed a one-for-one share exchange that resulted in First Guaranty Bank becoming the wholly-owned subsidiary of First Guaranty Bancshares (the “Share Exchange”) and First Guaranty Bancshares becoming an SEC reporting public company.
Since our Share Exchange, we have supplemented our organic growth with two acquisitions, which added stable deposits that provided funding for our lending business and extended our geographic footprint in the Baton Rouge and Hammond MSAs.
The following table summarizes the two acquisitions:
|
Acquired Institution/Market
|
Date of Acquisition
|
Deal Value
(dollars in thousands)
|
Fair Value of Total
Assets Acquired
(dollars in thousands)
|
||||||
|
Greensburg Bancshares, Inc.
|
July 1, 2011
|
$ | 5,308 | $ | 89,386 | ||||
|
Baton Rouge MSA
|
|||||||||
|
Homestead Bancorp, Inc.
|
July 30, 2007
|
12,140 | 129,606 | ||||||
|
Hammond MSA
|
|||||||||
In addition, our participation in the Small Business Lending Fund (the “SBLF”) has enabled us to leverage $39.4 million in capital received from the United States Department of the Treasury (the “U.S. Treasury”) to grow our lending business. As a result of the SBLF capital, we have been able to grow our qualified small business lending by $54.4 million since 2011. The majority of this loan growth has been concentrated in owner-occupied commercial real estate and commercial and industrial loans.
Our Markets
A key factor contributing to our ability to achieve our business goals and to create shareholder value is the attractiveness of the Louisiana market, including the favorable demographic and economic characteristics of our target markets in Louisiana. Our primary market areas include the Louisiana MSAs of Hammond, Baton Rouge, Lafayette, and Shreveport-Bossier City. Most of our branches are located along the major Louisiana interstates of I-12, I-55, I-10 and I-20.
Hammond MSA. We are headquartered in Hammond, Louisiana and approximately 50% of our deposits are in the Hammond MSA, our largest deposit concentration market. We had a deposit market share of 37.9% (at June 30, 2014) in the Hammond MSA, placing us first overall. Hammond is the principal city of the Hammond MSA, which includes all of Tangipahoa Parish, and is located approximately 50 miles north of New Orleans and 30 miles east of Baton Rouge. The Hammond MSA has a population of approximately 125,000. Hammond is intersected by I-55 and I-12, which are two heavily travelled interstate highways. As a result of Hammond’s close proximity to New Orleans and Baton Rouge, Hammond and Tangipahoa Parish are among the fastest growing cities and Parishes in Louisiana. Hammond is also the home of the main campus of Southeastern Louisiana University, with an enrollment of approximately 15,000 students.
Baton Rouge MSA. Baton Rouge is the capital of Louisiana and the MSA has a population of approximately 824,000. As the capital city, Baton Rouge is the political hub for Louisiana. The state government is the largest employer in Baton Rouge. Baton Rouge is the farthest inland port on the Mississippi River that can accommodate ocean-going tankers and cargo carriers. As a result, Baton Rouge’s largest industry is petrochemical production and manufacturing. The main campus of Louisiana State University, with an enrollment of approximately 30,000 students, and Southern University, with an enrollment of approximately 7,000 students, are located in Baton Rouge.
Our market areas in the Baton Rouge MSA also include the Livingston and St. Helena Parishes. Livingston Parish is a region surrounded by natural waterways and pine forests, which are the primary drivers of its economic growth. The economy for St. Helena Parish is comprised primarily of forestry operations, construction, manufacturing, educational services, health care, and social assistance.
4
Lafayette MSA. Lafayette is Louisiana’s third largest city and deposit market, and is located in the Lafayette-Acadiana region. The Lafayette MSA has a population of approximately 479,000. Its major industries include oil and gas, healthcare, construction, manufacturing and agriculture. With respect to agriculture, sugarcane and rice are the leaders among the plant producers within the area, with approximately 30,000 acres of sugarcane and 51,000 acres of rice plantings. We finance agricultural loans, predominantly out of our Abbeville and Jennings branches, in Southwest Louisiana. Lafayette is home to the University of Louisiana at Lafayette, with an enrollment of approximately 17,000 students.
Shreveport-Bossier City MSA. Our primary market areas in northwest Louisiana are the Bossier and Caddo Parishes, which are a part of the Shreveport-Bossier City MSA. The Shreveport and Bossier City MSA has a population of approximately 451,000. Shreveport and Bossier City are located in northern Louisiana on I-20, approximately 15 miles from the Texas state border and 185 miles east of Dallas, Texas.
Our Strategy
Our mission is to increase shareholder value while providing services for and contributing to the growth and welfare of the communities that we serve. As “The Relationship Bank,” our mission is to become the bank of choice for small business and consumer customers who are located in the metropolitan and rural markets. We desire to grow our market share along Louisiana’s key interstate corridors of major interstates I-12, I-55, I-10 and I-20 both organically and through strategic acquisitions.
Lending Activities
We offer a broad range of loan products with a variety of rates and terms throughout our market areas, including business loans to primarily small to medium-sized businesses and professionals, as well as loans to individuals. Our lending operations consist of the following major segments: non-farm, non-residential loans secured by real estate, commercial and industrial loans, one- to four-family residential loans, construction and land development loans, agricultural loans, farmland loans, consumer and other loans, and multifamily loans.
Non-Farm Non-Residential Loans. Non-farm non-residential loans are an integral part of our operating strategy. We expect to continue to emphasize this business line in the future with a target loan size of $1.0 million to $10.0 million to small businesses and real estate projects in our market area. At December 31, 2014 loans secured by non-farm non-residential properties totaled $328.4 million, or 41.5% of our total loan portfolio. Our non-farm non-residential loans are secured by commercial real estate generally located in our primary market area, which may be owner-occupied or non-owner occupied. Our non-farm non-residential loans are diversified by borrower and industry group, and generally secured by improved property such as hotels, office buildings, retail stores, gaming facilities, warehouses, church buildings and other non-residential buildings. Following receipt of the SBLF capital, we have increased our owner-occupied commercial real estate loans by $56.6 million since December 31, 2011. Our owner-occupied commercial real estate loans totaled $154.9 million, or 47.2% of total non-farm non-residential loans at December 31, 2014. In addition, at December 31, 2014, $9.5 million of our non-farm non-residential loans were syndicated loans secured by commercial real estate. Please see “—Commercial and Industrial Loans” below for further information.
Commercial and Industrial Loans. Commercial and industrial loans totaled $196.3 million, or 24.8% of our total loan portfolio at December 31, 2014. Commercial and industrial loans (excluding syndicated loans) are generally made to small and mid-sized companies located within the State of Louisiana. We also participate in government programs which guarantee portions of commercial and industrial loans such as the SBA and USDA. In most cases, we require collateral of equipment, accounts receivable, inventory, chattel or other assets before making a commercial business loan.
Over the last seven years, we have pursued a focused program to participate in syndicated loans (loans made by a group of lenders, including us, who share or participate in a specific loan) with a larger regional financial institution as the lead lender. Syndicated loans are typically made to large businesses (which are referred to as shared national credits) or middle market companies (which do not meet the regulatory definition of shared national credits), both of which are secured by business assets or equipment, and also commercial real estate. The syndicate group for both types of loans usually consists of two to three other financial institutions. These loans are adjustable-rate loans generally tied to LIBOR. Our participation amounts generally range between $1.0 million and $10.0 million. We have grown this portfolio to diversify our balance sheet, increase our yield and mitigate interest rate risk due to the variable rate pricing structure of the loans. We have a defined set of credit guidelines that we use when evaluating these credits. Our credit department does its own independent review of these types of loans. All syndicated loan credits were performing in accordance with their contractual terms as of December 31, 2014. The Company has not had any credit losses associated with its syndicated loan portfolio during the last seven years. Our board of directors has created a special committee to oversee the underwriting of these loans. At December 31, 2014, syndicated loans secured by assets other than commercial real estate totaled $113.8 million, or 58.0% of the commercial and industrial loan portfolio.
One- to Four-Family Residential Real Estate Loans. At December 31, 2014, our one- to four-family residential real estate loans totaled $118.2 million, or 14.9% of our total loan portfolio. We originate one- to four-family residential real estate loans that are secured primarily by residential property in Louisiana. We currently offer one- to four-family residential real estate loans with terms up to 30 years that are generally underwritten according to Fannie Mae guidelines, and we refer to loans that conform to such guidelines as “conforming loans.” At December 31, 2014, we held $4.6 million in jumbo loans that are greater than the conforming loan limit. We generally hold our one- to four-family residential real estate loans in our portfolio.
We have diversified our one- to four-family residential real estate loans with the select purchase of conforming mortgage loans that are located outside Louisiana. Our purchased loans are generally serviced by other financial institutions. At December 31, 2014, $29.5 million of our one- to four-family residential real estate loans, or 25.0% of our one- to four-family residential real estate loans, were purchased loans secured by property located outside our market area. The majority of our out of state purchased one- to four-family residential real estate loans are located in West Virginia, Virginia, Pennsylvania and the District of Columbia. Our purchased one- to four-family residential real estate loans must meet our internal underwriting criteria. At December 31, 2014, we had no purchased one- to four-family residential real estate loans that were classified as non-accruing. While we intend to continue to purchase one- to four-family residential real estate loans from time-to-time, our strategic emphasis for future periods is to increase the volume of our internal originations of such loans.
Our one- to four-family loans also include home equity lines of credit that have second mortgages. At December 31, 2014, we had $8.0 million in home equity lines of credit, which represented 6.8% of our one- to four-family residential real estate loans. Our home equity products are originated in amounts, that when combined with the existing first mortgage loan, do not generally exceed 80% of the loan-to-value ratio of the subject property.
Construction and Land Development Loans. We offer loans to finance the construction of various types of commercial and residential property. At December 31, 2014, $52.1 million, or 6.6% of our total loan portfolio consisted of construction and land development loans. In addition, at December 31, 2014, $5.7 million of construction and land development loans were syndicated loans.
5
Agricultural Loans. We are the leading lender for agricultural loans in our Southwest Louisiana market. Our agricultural lending includes loans to farmers for the purpose of cultivating rice, sugarcane, soybeans, timber, poultry and cattle. Agricultural loans are generally secured by crops, but may include additional collateral such as farm equipment or vehicles. Substantially all of our originated agricultural loans are guaranteed by the U.S. Farm Service Agency. We generally obtain personal guarantees from the borrower or a third party as a condition to originating its agricultural loans. Agricultural loans totaled $26.3 million, or 3.3% of our total loan portfolio at December 31, 2014.
Farmland Loans. We originate first mortgage loans secured by farmland. At December 31, 2014, farmland loans totaled $13.5 million, or 1.7% of our total loan portfolio.
Consumer and Other Loans. We make various types of secured consumer loans that are collateralized by deposits, boats and automobiles as well as unsecured consumer loans. Such loans totaled $43.0 million, or 5.4% of our total loan portfolio at December 31, 2014. Included in other loans are $22.5 million in purchased commercial leases that are serviced by the Bank. At December 31, 2014, $7.0 million of our consumer loans were unsecured.
Multi-Family Loans. On occasion we will originate loans secured by multifamily real estate. At December 31, 2014, we had $14.3 million or 1.8% of our total loan portfolio in multifamily loans.
Loan Originations, Sales and Participations. Loan originations are derived from a number of sources such as referrals from our board of directors, existing customers, borrowers, builders, attorneys and walk-in customers. We generally retain the loans that we originate in our loan portfolio and only sell loans infrequently. We had $15.7 million at December 31, 2014 in purchased loan participations that were not syndicated loans. We had $22.5 million in purchased commercial leases that are serviced by the Bank. At December 31, 2014, we had $129 million in syndicated loans, of which $76.9 million were shared national credits. Syndicated loans are described above under “—Commercial and Industrial Loans.”
Underwriting and Credit Review
The Company’s credit policy has specific loan-to-value and debt service coverage requirements. Personal guarantees of borrowers are required as well as applicable insurance. Additional real estate or non-real estate collateral may be taken when deemed appropriate to secure a loan.
Loans on non-farm non-residential properties are generally originated in amounts up to 85% of the appraised value of the property for owner-occupied commercial real estate properties and up to 80% of the appraised value of the property for non- owner-occupied commercial real estate properties. Non-farm non-residential loans are generally made at rates that adjust above the prime rate as reported in the Wall Street Journal, that mature in three to five years and with principal amortization for a period of up to 20 years. We will also originate fixed-rate, non-farm non-residential loans that mature in three to five years with principal amortization of up to 20 years. We consider a number of factors in originating non-farm non-residential loans. We evaluate the qualifications and financial condition of the borrower (including credit history), profitability and expertise, as well as the value and condition of the mortgaged property securing the loan. We consider the financial resources of the borrower, the borrower’s experience in owning or managing similar property and the borrower’s payment history with us and other financial institutions. In evaluating the property securing the loan, the factors we consider include the net operating income of the mortgaged property before debt service and depreciation, the debt service coverage ratio (the ratio of net operating income to debt service) to ensure that the borrower’s net operating income together with the borrower’s other sources of income is at least 125% of the annual debt service and the ratio of the loan amount to the appraised value of the mortgaged property. We generally obtain personal guarantees from the principals or a third party as a condition to originating commercial real estate loans. Non-farm non-residential loans are generally appraised by outside independent appraisers approved by the board of directors. The Bank has an appraisal review department that manages all appraisals.
Commercial term loans are generally fixed interest rate loans, or loans indexed to the prime rate, with terms of up to five years, depending on the needs of the borrower and the useful life of the underlying collateral. Our commercial and industrial maximum loan to value limit is 80%. Typically, our commercial lines of credit are adjustable rate lines, indexed to the prime interest rate, which generally mature yearly. Our underwriting standards for commercial and industrial loans include a review of the applicant’s tax returns, financial statements, credit history, the underlying collateral and an assessment of the applicant’s ability to meet existing obligations and payments on the proposed loan based on cash flow generated by the applicant’s business. We generally obtain personal guarantees from the borrower or a third party as a condition to originating commercial and industrial loans.
We generally originate one-to-four family loans in amounts up to 95% of the lesser of the appraised value or purchase price of the mortgaged property. We generally originate fixed-rate mortgage loans in amounts up to the maximum conforming loan limits as established by the Federal Housing Finance Agency, which at December 31, 2014 was $417,000 for single-family homes in our market area. Our fixed-rate one- to four-family residential real estate loans include loans that generally amortize on a monthly basis over periods between 10 to 30 years with maturities that range from eight to 30 years. We do not offer one- to four-family residential real estate loans specifically designed for borrowers with sub-prime credit scores, including interest-only, negative amortization or payment option adjustable-rate mortgage loans.
Our one- to four-family loans also include home equity lines of credit that have second mortgages. Our home equity products are originated in amounts, that when combined with the existing first mortgage loan, do not generally exceed 80% of the loan-to-value ratio of the subject property.
Property appraisals on real estate securing our single-family residential loans are made by state certified and licensed independent appraisers approved by the board of directors. Appraisals are performed in accordance with applicable regulations and policies. At our discretion, we obtain either title insurance policies or attorneys’ certificates of title, on all first mortgage real estate loans originated. We also require fire and casualty insurance on all properties securing our one- to four-family residential loans. We also require the borrower to obtain flood insurance where appropriate. In some instances, we charge a fee equal to a percentage of the loan amount, commonly referred to as points.
We offer loans to finance the construction of various types of commercial and residential property. Construction loans to builders generally are offered with terms of up to 18 months and interest rates are tied to the prime lending rate. These loans generally are offered as fixed or adjustable-rate loans. We will originate residential construction loans for individual borrowers and builders, provided all necessary plans and permits have been obtained. Construction loan funds are disbursed as the project progresses. We will originate construction loans up to 80% of the estimated completed value of the project and we will originate land development loans in amounts up to 75% of the value of the property as developed. We will originate owner occupied one-to-four family residential construction loans up to 90% of the estimated completed value of the property.
The underwriting standards used for agricultural loans include a determination of the borrower’s ability to meet existing obligations and payments on the proposed loan from normal cash flows generated in the borrower’s business. The financial strength of each applicant also is assessed through review of financial statements and tax returns provided by the applicant. Such loans are generally offered with fixed rates at a margin above prime rate for a term of generally one year. Underwriting standards for agricultural loans are different for each type of loan depending on the financial strength of the borrower and the value of collateral offered as security.
Loans secured by farmland may be made in amounts up to 80% of the value of the farm. However, we will originate farmland loans in amounts up to 100% of the value of the farm if the borrower is able to secure a guarantee from the U.S. Farm Service Agency. Such loans are generally fixed-rate loans at a margin over the prime rate with terms up to five years and amortization schedules of up to 20 years (40 years if secured by a guarantee from the U.S. Farm Service Agency). Generally, we obtain personal guarantees of the borrower on all loans secured by farmland.
6
We will originate multifamily loans in amounts up to 80% of the value of the multi-family property. Nearly all of our multifamily loans are secured by properties in Louisiana. . Such loans may be either fixed- or adjustable-rate loans tied to the prime rate with terms to maturity up to five years and amortization schedules of up to 20 years. The underwriting of multi-family loans follows the general guidelines for our non-farm non-residential loans.
We establish various lending limits for executive management and also maintain a loan committee comprised of our directors and management. Generally, loan officers have authority to approve secured loan relationships in amounts up to $100,000 and unsecured loan relationships in amounts up to $25,000. For loans exceeding a loan officer’s approval authority, we utilize two methods for approvals: (1) credit officers and (2) the Bank’s loan committee. Loan relationships between $100,000 and $500,000 are approved by a combination of credit officers and executive management. The loan committee approves loan relationships of between $500,000 and up to $10.0 million. Any loan relationship exceeding $10.0 million requires the approval of the board of directors. Syndicated loans are approved by the Bank’s syndicate loan committee.
Our lending activities are also subject to Louisiana statutes and internal guidelines limiting the amount we can lend to any one borrower. Subject to certain exceptions, under Louisiana law the Bank may not lend on an unsecured basis to any single borrower (i.e., any one individual or business entity and his or its affiliates) an amount in excess of 20% of the sum of the Bank’s capital stock and surplus, or on a secured basis an amount in excess of 50% of the sum of the Bank’s capital stock and surplus. At December 31, 2014, our secured legal lending limit was approximately $47.4 million and our unsecured legal lending limit was approximately $19.0 million.
Deposit Products
Consumer and commercial deposits are attracted principally from within our primary market area through the offering of a selection of deposit instruments including noninterest-bearing and interest-bearing demand, savings accounts and time accounts. Deposit account terms vary according to the minimum balance required, the time period the funds must remain on deposit, and the interest rate. At December 31, 2014, we held $1.4 billion in deposits.
We also actively seek to obtain public funds deposits. At December 31, 2014, public funds deposits totaled $601.5 million. We have developed a program for the retention and management of public funds deposits. These deposits are from local government entities such as school districts, hospital districts, sheriff departments and other municipalities. We solicit their operating, saving, and time deposits and we are often the fiscal agent for the municipality. The majority of the deposits are under contractual terms of up to three years. Public funds deposit accounts are collateralized by FHLB letters of credit and by eligible government and government agency securities such as those issued by the FHLB, FFCB, Fannie Mae, and Freddie Mac. Public funds provide a low cost and stable source of funding. The public funds deposit portfolio has been key a driver of earnings for our Company as we have profitability deployed these funds into investment securities and loans.
Investments
Our investment policy is to provide a source of liquidity, to provide an appropriate return on funds invested, to manage interest rate risk and to meet pledging requirements for our public funds and other borrowings. Our investment securities consist of: (1) U.S. Treasury obligations; (2) U.S. government agency obligations; (3) mortgage-backed securities; (4) corporate and other debt securities; (5) mutual funds and other equity securities and (6) municipal bonds. Our U.S. government agency securities, primarily consisting of government-sponsored enterprises, comprise the largest share of our investment securities, having a fair value of $374.0 million, of which $291.5 million were classified as available-for-sale and $82.5 million as held-to-maturity, at December 31, 2014.
The Bank’s management asset liability committee and board investment committee are responsible for regular review of our investment activities and the review and approval of our investment policy. These committees monitor our investment securities portfolio and direct our overall acquisition and allocation of funds, with the goal of structuring our portfolio such that our investment securities provide us with a stable source of income but without exposing us to an excessive degree of market risk. During the last five years, our securities portfolio has generated $94 million of pre-tax income. As of December 31, 2014, none of the securities in our investment portfolio were other than temporarily impaired.
Competition
We face intense competition both in making loans and attracting deposits. Our market areas in Louisiana have a high concentration of financial institutions, many of which are branches of large money center, super-regional and regional banks that have resulted from consolidation of the banking industry in Louisiana. Many of these competitors have greater resources than we do and may offer services that we do not provide, including more attractive pricing than we offer and more extensive branch networks for which they can offer their financial products.
Our larger competitors have a greater ability to finance wide-ranging advertising campaigns through their greater capital resources. Our marketing efforts depend heavily upon referrals from officers, directors and shareholders, selective advertising in local media and direct mail solicitations. We compete for business principally on the basis of personal service to customers, customer access to our officers and directors and competitive interest rates and fees.
In the financial services industry in recent years, intense market demands, technological and regulatory changes and economic pressures have eroded industry classifications that were once clearly defined. Financial institutions have been forced to diversify their services, increase rates paid on deposits and become more cost effective as a result of competition with one another and with new types of financial services companies, including non-banking competitors. Some of the results of these market dynamics in the financial services industry have been a number of new bank and non-bank competitors, increased merger activity, and increased customer awareness of product and service differences among competitors. These factors could affect our business prospects.
Employees
At December 31, 2014, we had 260 full-time and 12 part-time employees. We had 271 full time equivalent employees. None of our employees is represented by a collective bargaining group or are parties to a collective bargaining agreement.
Subsidiaries
Other than our wholly-owned bank subsidiary, First Guaranty Bank, we have no subsidiaries.
7
Supervision and Regulation
General
First Guaranty Bank is a Louisiana-chartered commercial bank and is the wholly-owned subsidiary of First Guaranty Bancshares, a Louisiana-chartered banking holding company. First Guaranty Bank’s deposits are insured up to applicable limits by the FDIC. First Guaranty Bank is subject to extensive regulation by the OFI, as its chartering agency, and by the FDIC, its primary federal regulator and deposit insurer. First Guaranty Bank is required to file reports with, and is periodically examined by, the FDIC and the Louisiana Office of Financial Institutions (the “OFI”) concerning its activities and financial condition and must obtain regulatory approvals prior to entering into certain transactions, including, but not limited to, mergers with or acquisitions of other financial institutions. As a registered bank holding company, First Guaranty Bancshares is regulated by the Federal Reserve Board.
The regulatory and supervisory structure establishes a comprehensive framework of activities in which an institution can engage and is intended primarily for the protection of depositors and the deposit insurance funds, rather than for the protection of shareholders and creditors. The regulatory structure also gives the regulatory authorities extensive discretion in connection with their supervisory and enforcement activities and examination policies, including policies concerning the establishment of deposit insurance assessment fees, classification of assets and establishment of adequate loan loss reserves for regulatory purposes. Any change in such regulatory requirements and policies, whether by the Louisiana legislature, the OFI, the FDIC, the Federal Reserve Board or the United States Congress, could have a material adverse impact on the financial condition and results of operations of First Guaranty Bancshares and First Guaranty Bank. As is further described below, the Dodd-Frank Act has significantly changed the bank regulatory structure and may affect the lending, investment and general operating activities of depository institutions and their holding companies.
Set forth below is a summary of certain material statutory and regulatory requirements applicable to First Guaranty Bancshares and First Guaranty Bank. The summary is not intended to be a complete description of such statutes and regulations and their effects on First Guaranty Bancshares and First Guaranty Bank.
The Dodd-Frank Act
The Dodd-Frank Act significantly changed bank regulation and has affected the lending, investment, trading and operating activities of depository institutions and their holding companies. The Dodd-Frank Act also created the Consumer Financial Protection Bureau (CFPB) with extensive powers to supervise and enforce consumer protection laws. The CFPB has broad rule-making authority for a wide range of consumer protection laws that apply to all banks and savings institutions, including the authority to prohibit “unfair, deceptive or abusive” acts and practices. The CFPB also has examination and enforcement authority over all banks and savings institutions with more than $10 billion in assets. Banks and savings institutions with $10 billion or less in assets, such as First Guaranty Bank, will continue to be examined by their applicable federal bank regulators. The Dodd-Frank Act also gave state attorneys general the ability to enforce applicable federal consumer protection laws.
The Dodd-Frank Act broadened the base for FDIC assessments for deposit insurance, permanently increasing the maximum amount of deposit insurance to $250,000 per depositor. The Dodd-Frank Act also, among other things, requires originators of certain securitized loans to retain a portion of the credit risk, stipulates regulatory rate-setting for certain debit card interchange fees, repeals restrictions on the payment of interest on commercial demand deposits and contains a number of reforms related to mortgage originations. The Dodd-Frank Act increased the ability of shareholders to influence boards of directors by requiring companies to give shareholders a non-binding vote on executive compensation and so-called “golden parachute” payments. The Dodd-Frank Act also directed the Federal Reserve Board to promulgate rules prohibiting excessive compensation paid to company executives, regardless of whether the company is publicly traded or not.
Many of the provisions of the Dodd-Frank Act are subject to delayed effective dates or require the implementing regulations and, therefore, their impact on our operations cannot be fully determined at this time. However, it is likely that the Dodd-Frank Act will increase the regulatory burden, operating costs, compliance costs and interest expense for First Guaranty Bank and First Guaranty Bancshares.
SBLF Participation
On September 22, 2011, we entered into a Securities Purchase Agreement with the U.S. Treasury pursuant to which the we sold to the U.S. Treasury 39,435 shares of our Series C Preferred Stock, having a liquidation amount of $1,000 per share for aggregate proceeds of $39.4 million. This transaction was entered into as part of the Small Business Lending Fund (SBLF).
The Series C Preferred Stock is entitled to receive non-cumulative dividends payable quarterly, on each January 1, April 1, July 1 and October 1, beginning October 1, 2011. The dividend rate, which is calculated on the aggregate liquidation amount, was initially set at 4.2% per annum based upon the level of “Qualified Small Business Lending”, or “QSBL” (as defined in the Securities Purchase Agreement) by First Guaranty Bank. The dividend rate for dividend periods subsequent to the initial period is set based upon the “Percentage Change in Qualified Lending” (as defined in the Securities Purchase Agreement) between each dividend period and the “Baseline” QSBL level. Such dividend rate may vary from 1% per annum to 5% per annum for the second through tenth dividend periods, and from 1% per annum to 7% per annum for the eleventh through the first half of the nineteenth dividend periods. If the Series C Preferred Stock remains outstanding for more than four-and-one-half years, the dividend rate will be fixed at 9.0% annually. Prior to that time, in general, the dividend rate decreases as the level of First Guaranty Bank’s QSBL increases. Our dividend rate at December 31, 2014 was 1.0%. Such dividends are not cumulative, but we may only declare and pay dividends on our common stock (or any other equity securities junior to the Series C Preferred Stock) if we have declared and paid dividends for the current dividend period on the Series C Preferred Stock. We also are subject to other restrictions on our ability to repurchase or redeem other securities.
We may redeem the shares of Series C Preferred Stock, in whole or in part, at any time at a redemption price equal to the sum of the liquidation amount per share and the per-share amount of any unpaid dividends for the then-current period, subject to any required prior approval by the FDIC. The SBLF requires us to file quarterly reports on QSBL lending, which must be audited annually. We must also make outreach efforts and advertise the availability of QSBL to organizations and individuals who represent minorities, women and veterans. We must annually certify that no business loans are made to principals of businesses who have been convicted of a sex crime against a minor. Finally, the SBLF requires us to file quarterly, annual and other reports provided to shareholders concurrently with the U.S. Treasury.
Simultaneously with the closing of the SBLF transaction on September 22, 2011, we exited our participation in the Troubled Asset Relief Program (“TARP”). Pursuant to our exit, we redeemed (repurchased) from the U.S. Treasury, largely using proceeds received from the issuance of the Series C Preferred Stock, all 2,069.9 shares of our Series A Preferred Stock and 103 shares of our Series B Preferred Stock, each having a liquidation amount per share equal to $10,000. The total redemption price of our TARP Series A Preferred Stock and Series B Preferred Stock, including all dividends paid to the U.S. Treasury, was approximately $21.1 million.
8
Louisiana Bank Regulation
As a Louisiana-chartered bank, First Guaranty Bank is subject to the regulation and supervision of the OFI. Under Louisiana law, First Guaranty Bank may establish additional branch offices within Louisiana, subject to the approval of OFI. After the Dodd-Frank Act, we can also establish additional branch offices outside of Louisiana, subject to prior regulatory approval, as long as the laws of the state where the branch is to be located would permit such expansion. In addition, First Guaranty Bank is the primary source of our dividend payments, and our ability to pay dividends will be subject to any restrictions applicable to the Bank. Under Louisiana law, a Louisiana bank may not pay cash dividends unless the bank has unimpaired surplus equal to 50% of its outstanding capital stock, both before and after giving effect to the dividend payment. Subject to satisfying such requirement, First Guaranty Bank may pay dividends to us without the approval of the OFI so long as the amount of the dividend does not exceed its net profits earned during the current year combined with its retained earnings for the immediately preceding year. The OFI must approve any proposed dividend in excess of this threshold.
Federal Regulations
Capital Requirements. Under the FDIC’s regulations, federally insured state-chartered banks that are not members of the Federal Reserve System (“state non-member banks”), such as First Guaranty Bank, are required to comply with minimum leverage capital requirements. For an institution not anticipating or experiencing significant growth and deemed by the FDIC to be, in general, a strong banking organization rated composite 1 under Uniform Financial Institutions Ranking System, the minimum capital leverage requirement in 2014 was a ratio of Tier 1 capital to total assets of 3.0%. For all other institutions, the minimum leverage capital ratio was not less than 4.0%. Tier 1 capital is the sum of common shareholders’ equity, noncumulative perpetual preferred stock (including any related surplus) and minority investments in certain subsidiaries, less intangible assets (except for certain servicing rights and credit card relationships) and certain other specified items.
FDIC regulations also require state non-member banks to maintain certain ratios of regulatory capital to regulatory risk-weighted assets, or “risk-based capital ratios.” Risk-based capital ratios are determined by allocating assets and specified off-balance sheet items to four risk-weighted categories ranging from 0.0% to 200.0%. During 2014, state non-member banks were required to maintain a minimum ratio of total capital to risk-weighted assets of at least 8.0%, of which at least one-half must have been Tier 1 capital. Total capital consists of Tier 1 capital plus Tier 2 or supplementary capital items, which include allowances for loan losses in an amount of up to 1.25% of risk-weighted assets, cumulative preferred stock, subordinated debentures and certain other capital instruments, and a portion of the net unrealized gain on equity securities.
In July, 2013, the FDIC and the other federal bank regulatory agencies issued a final rule to revise their risk-based and leverage capital requirements and their method for calculating risk-weighted assets, to make them consistent with the agreements that were reached by the Basel Committee on Banking Supervision and certain provisions of the Dodd-Frank Act. The final rule applies to all depository institutions, top-tier bank holding companies with total consolidated assets of $500 million or more, and top-tier savings and loan holding companies (“banking organizations”). Among other things, the rule establishes a new common equity Tier 1 minimum capital requirement (4.5% of risk-weighted assets) sets a uniform minimum Tier 1 leverage ratio of 4.0%, and a uniform leverage capital ratio of 4%, increases the minimum Tier 1 capital to risk-based assets requirement (from 4% to 6% of risk-weighted assets) and assigns a higher risk weight (150%) to exposures that are more than 90 days past due or are on nonaccrual status and to certain commercial real estate facilities that finance the acquisition, development or construction of real property. The final rule also limits a banking organization’s capital distributions and certain discretionary bonus payments if the banking organization does not hold a “capital conservation buffer” consisting of 2.5% of common equity Tier 1 capital to risk-weighted assets. The final rule became effective for us on January 1, 2015. The capital conservation buffer requirement is being phased in beginning January 1, 2016 and ending January 1, 2019, when the full capital conservation buffer requirement will be effective.
At December 31, 2014, First Guaranty Bank was well-capitalized based on FDIC guidelines.
Standards for Safety and Soundness. As required by statute, the federal banking agencies have adopted final regulations and Interagency Guidelines Establishing Standards for Safety and Soundness to implement safety and soundness standards. The guidelines set forth the safety and soundness standards that the federal banking agencies use to identify and address problems at insured depository institutions before capital becomes impaired. The guidelines address internal controls and information systems, internal audit system, credit underwriting, loan documentation, interest rate exposure, asset growth, asset quality, earnings, compensation, fees and benefits and, more recently, safeguarding customer information. If the appropriate federal banking agency determines that an institution fails to meet any standard prescribed by the guidelines, the agency may require the institution to submit to the agency an acceptable plan to achieve compliance with the standard.
Business and Investment Activities. Under federal law, all state-chartered FDIC-insured banks have been limited in their activities as principal and in their equity investments to the type and the amount authorized for national banks, notwithstanding state law. Federal law permits exceptions to these limitations. For example, certain state-chartered banks may, with FDIC approval, continue to exercise state authority to invest in common or preferred stocks listed on a national securities exchange and in the shares of an investment company registered under the Investment Company Act of 1940, as amended. The maximum permissible investment is the lesser of 100.0% of Tier 1 capital or the maximum amount permitted by Louisiana law.
The FDIC is also authorized to permit state banks to engage in state authorized activities or investments not permissible for national banks (other than non-subsidiary equity investments) if they meet all applicable capital requirements and it is determined that such activities or investments do not pose a significant risk to the FDIC insurance fund. The FDIC has adopted regulations governing the procedures for institutions seeking approval to engage in such activities or investments. The Gramm-Leach-Bliley Act of 1999 specified that a state bank may control a subsidiary that engages in activities as principal that would only be permitted for a national bank to conduct in a “financial subsidiary,” if a bank meets specified conditions and deducts its investment in the subsidiary for regulatory capital purposes.
Prompt Corrective Regulatory Action. Federal law requires, among other things, that federal bank regulatory authorities take “prompt corrective action” with respect to banks that do not meet minimum capital requirements. For these purposes, the law establishes five capital categories: well capitalized, adequately capitalized, undercapitalized, significantly undercapitalized and critically undercapitalized.
The FDIC has adopted regulations to implement the prompt corrective action legislation. In 2014, an institution was deemed to be “well capitalized” if it had a total risk-based capital ratio of 10.0% or greater, a Tier 1 risk-based capital ratio of 6.0% or greater and a leverage ratio of 5.0% or greater. An institution was “adequately capitalized” if it had a total risk-based capital ratio of 8.0% or greater, a Tier 1 risk-based capital ratio of 4.0% or greater, and generally a leverage ratio of 4.0% or greater. An institution was “undercapitalized” if it had a total risk-based capital ratio of less than 8.0%, a Tier 1 risk-based capital ratio of less than 4.0%, or generally a leverage ratio of less than 4.0%. An institution was deemed to be “significantly undercapitalized” if it had a total risk-based capital ratio of less than 6.0%, a Tier 1 risk-based capital ratio of less than 3.0%, or a leverage ratio of less than 3.0%. An institution was considered to be “critically undercapitalized” if it had a ratio of tangible equity (as defined in the regulations) to total assets that is equal to or less than 2.0%.
9
“Undercapitalized” banks must adhere to growth, capital distribution (including dividend) and other limitations and are required to submit a capital restoration plan. A bank’s compliance with such a plan must be guaranteed by any company that controls the undercapitalized institution in an amount equal to the lesser of 5% of the institution’s total assets when deemed undercapitalized or the amount necessary to achieve the status of adequately capitalized. If an “undercapitalized” bank fails to submit an acceptable plan, it is treated as if it is “significantly undercapitalized.” “Significantly undercapitalized” banks must comply with one or more of a number of additional measures, including, but not limited to, a required sale of sufficient voting stock to become adequately capitalized, a requirement to reduce total assets, cessation of taking deposits from correspondent banks, the dismissal of directors or officers and restrictions on interest rates paid on deposits, compensation of executive officers and capital distributions by the parent holding company. “Critically undercapitalized” institutions are subject to additional measures including, subject to a narrow exception, the appointment of a receiver or conservator within 270 days after it obtains such status.
The previously mentioned final regulatory capital rule that increases regulatory capital requirements adjusted the prompt corrective action categories accordingly effective January 1, 2015. Under the revised requirements, an institution must meet the following in order to be classified as “well capitalized”: (1) a common equity Tier 1 risk-based ratio of 6.5% (new standard); (2) a Tier 1 risk-based capital ratio of 8% (increased from 6%); (3) a total risk-based ratio of 10% (unchanged) and (4) a Tier 1 leverage ratio of 5% (unchanged).
Transactions with Related Parties. Transactions between a bank (and, generally, its subsidiaries) and its related parties or affiliates are limited by Sections 23A and 23B of the Federal Reserve Act. An affiliate of a bank is any company or entity that controls, is controlled by or is under common control with the bank. In a holding company context, the parent bank holding company and any companies which are controlled by such parent holding company are affiliates of the bank. Generally, Sections 23A and 23B of the Federal Reserve Act limit the extent to which the bank or its subsidiaries may engage in “covered transactions” with any one affiliate to 10% of such institution’s capital stock and surplus and contain an aggregate limit on all such transactions with all affiliates to an amount equal to 20% of such institution’s capital stock and surplus. The term “covered transaction” includes the making of loans, purchase of assets, issuance of a guarantee and similar transactions. In addition, loans or other extensions of credit by the institution to the affiliate are required to be collateralized in accordance with specified requirements. The law also requires that affiliate transactions be on terms and conditions that are substantially the same, or at least as favorable to the institution, as those provided to non-affiliates.
First Guaranty Bank’s authority to extend credit to its directors, executive officers and 10% shareholders, as well as to entities controlled by such persons, is currently governed by the requirements of Sections 22(g) and 22(h) of the Federal Reserve Act and Regulation O of the Federal Reserve Board. Among other things, these provisions generally require that extensions of credit to insiders:
|
|
●
|
be made on terms that are substantially the same as, and follow credit underwriting procedures that are not less stringent than, those prevailing for comparable transactions with unaffiliated persons and that do not involve more than the normal risk of repayment or present other unfavorable features; and
|
|
|
●
|
not exceed certain limitations on the amount of credit extended to such persons, individually and in the aggregate, which limits are based, in part, on the amount of First Guaranty Bank’s capital.
|
In addition, extensions of credit in excess of certain limits must be approved by First Guaranty Bank’s board of directors. Extensions of credit to executive officers are subject to additional limits based on the type of extension involved.
Enforcement. The FDIC has extensive enforcement authority over insured state banks, including First Guaranty Bank. That enforcement authority includes, among other things, the ability to assess civil money penalties, issue cease and desist orders and remove directors and officers. In general, enforcement actions may be initiated in response to violations of laws and regulations and unsafe or unsound practices. The FDIC also has authority under federal law to appoint a conservator or receiver for an insured bank under certain circumstances. The FDIC is required, with certain exceptions, to appoint a receiver or conservator for an insured state non-member bank if that bank was “critically undercapitalized” on average during the calendar quarter beginning 270 days after the date on which the institution became “critically undercapitalized.”
Federal Insurance of Deposit Accounts. The Dodd-Frank Act permanently increased the maximum amount of deposit insurance for banks, savings institutions and credit unions to $250,000 per depositor.
Under the FDIC’s risk-based assessment system, insured institutions are assigned to one of four risk categories based on supervisory evaluations, regulatory capital levels and certain other risk factors. Rates are based on each institution’s risk category and certain specified risk adjustments. Stronger institutions pay lower rates while riskier institutions pay higher rates.
The FDIC published a final rule under the Dodd-Frank Act to reform the deposit insurance assessment system. The rule redefined the assessment base used for calculating deposit insurance assessments effective April 1, 2011. Under the rule, assessments are based on an institution’s average consolidated total assets minus average tangible equity instead of total deposits. The rule revised the assessment rate schedule to establish assessments ranging from 2.5 to 45 basis points.
In addition to the FDIC assessments, the Financing Corporation (“FICO”) is authorized to impose and collect, with the approval of the FDIC, assessments for anticipated payments, issuance costs and custodial fees on bonds issued by the FICO in the 1980s to recapitalize the former Federal Savings and Loan Insurance Corporation. The bonds issued by the FICO are due to mature in 2017 through 2019. For the quarter ended December 31, 2014, the annualized Financing Corporation assessment was equal to 0.62 of a basis point of total assets less tangible capital.
The Dodd-Frank Act increased the minimum target Deposit Insurance Fund ratio from 1.15% of estimated insured deposits to 1.35% of estimated insured deposits. The FDIC must seek to achieve the 1.35% ratio by September 30, 2020. It is intended that insured institutions with assets of $10 billion or more will fund the increase. The Dodd-Frank Act eliminated the 1.5% maximum fund ratio, instead leaving it to the discretion of the FDIC and the FDIC has exercised that discretion by establishing a long-term fund ratio of 2%.
The FDIC has authority to increase insurance assessments. Any significant increases would have an adverse effect on the operating expenses and results of operations of First Guaranty Bank. Management cannot predict what assessment rates will be in the future.
Insurance of deposits may be terminated by the FDIC upon a finding that an institution has engaged in unsafe or unsound practices, is in an unsafe or unsound condition to continue operations or has violated any applicable law, regulation, rule, order or condition imposed by the FDIC. We do not currently know of any practice, condition or violation that may lead to termination of our deposit insurance.
10
Community Reinvestment Act. Under the CRA, a bank has a continuing and affirmative obligation, consistent with its safe and sound operation, to help meet the credit needs of its entire community, including low and moderate income neighborhoods. The CRA does not establish specific lending requirements or programs for financial institutions nor does it limit an institution’s discretion to develop the types of products and services that it believes are best suited to its particular community. The CRA does require the FDIC, in connection with its examination of a bank, to assess the institution’s record of meeting the credit needs of its community and to take such record into account in its evaluation of certain applications by such institution, including applications to establish or acquire branches and merger with other depository institutions. The CRA requires the FDIC to provide a written evaluation of an institution’s CRA performance utilizing a four-tiered descriptive rating system. First Guaranty Bank’s latest FDIC CRA rating, dated June 28, 2013, was “satisfactory.”
Federal Reserve System. The Federal Reserve Board regulations require savings institutions to maintain non interest-earning reserves against their transaction accounts (primarily negotiable order of withdrawal (NOW) and regular checking accounts). For 2014, the regulations generally provide that reserves be maintained against aggregate transaction accounts as follows: a 3% reserve ratio is assessed on net transaction accounts up to and including $89.0 million; a 10% reserve ratio is applied above $89.0 million. The first $13.3 million of otherwise reservable balances are exempted from the reserve requirements. The amounts are adjusted annually. First Guaranty Bank complies with the foregoing requirements.
FHLB System. First Guaranty Bank is a member of the FHLB System, which consists of twelve regional FHLBs. The FHLB System provides a central credit facility primarily for member institutions as well as other entities involved in home mortgage lending. As a member of the FHLB, First Guaranty Bank is required to acquire and hold a specified amount of shares of capital stock in the FHLB. As of December 31, 2014, First Guaranty Bank complies with this requirement.
Other Regulations
Interest and other charges collected or contracted for by First Guaranty Bank are subject to state usury laws and federal laws concerning interest rates. First Guaranty Bank’s operations are also subject to federal laws applicable to credit transactions, such as the:
|
|
●
|
Truth-In-Lending Act, governing disclosures of credit terms to consumer borrowers;
|
|
|
●
|
Real Estate Settlement Procedures Act, requiring that borrowers for mortgage loans for one- to four-family residential real estate receive various disclosures, including good faith estimates of settlement costs, lender servicing and escrow account practices, and prohibiting certain practices that increase the cost of settlement services;
|
|
|
●
|
Home Mortgage Disclosure Act, requiring financial institutions to provide information to enable the public and public officials to determine whether a financial institution is fulfilling its obligation to help meet the housing needs of the community it serves;
|
|
|
●
|
Equal Credit Opportunity Act, prohibiting discrimination on the basis of race, creed or other prohibited factors in extending credit;
|
|
|
●
|
Fair Credit Reporting Act, governing the use and provision of information to credit reporting agencies;
|
|
|
●
|
Fair Debt Collection Act, governing the manner in which consumer debts may be collected by collection agencies;
|
|
|
●
|
Truth in Savings Act; and
|
|
|
●
|
Rules and regulations of the various federal agencies charged with the responsibility of implementing such federal laws.
|
The operations of First Guaranty Bank also are subject to the:
|
|
●
|
Right to Financial Privacy Act, which imposes a duty to maintain confidentiality of consumer financial records and prescribes procedures for complying with administrative subpoenas of financial records;
|
|
|
●
|
Electronic Funds Transfer Act and Regulation E promulgated thereunder, which govern automatic deposits to and withdrawals from deposit accounts and customers’ rights and liabilities arising from the use of automated teller machines and other electronic banking services;
|
|
|
●
|
Check Clearing for the 21st Century Act (also known as “Check 21”), which gives “substitute checks,” such as digital check images and copies made from that image, the same legal standing as the original paper check;
|
|
|
●
|
USA PATRIOT Act, which requires banks operating to, among other things, establish broadened anti-money laundering compliance programs, due diligence policies and controls to ensure the detection and reporting of money laundering. Such required compliance programs are intended to supplement existing compliance requirements, also applicable to financial institutions, under the Bank Secrecy Act and the Office of Foreign Assets Control regulations; and
|
|
|
●
|
Gramm-Leach-Bliley Act, which places limitations on the sharing of consumer financial information by financial institutions with unaffiliated third parties. Specifically, the Gramm-Leach-Bliley Act requires all financial institutions offering financial products or services to retail customers to provide such customers with the financial institution’s privacy policy and provide such customers the opportunity to “opt out” of the sharing of certain personal financial information with unaffiliated third parties.
|
11
Holding Company Regulation
As a bank holding company, the Company is subject to examination, regulation, and periodic reporting under the Bank Holding Company Act of 1956, as amended, as administered by the Federal Reserve Board. We are required to obtain the prior approval of the Federal Reserve Board to acquire all, or substantially all, of the assets of any bank or bank holding company. Prior Federal Reserve Board approval would be required for us to acquire direct or indirect ownership or control of any voting securities of any bank or bank holding company if it would, directly or indirectly, own or control more than 5% of any class of voting shares of the bank or bank holding company.
A bank holding company is generally prohibited from engaging in, or acquiring, direct or indirect control of more than 5% of the voting securities of any company engaged in non-banking activities. One of the principal exceptions to this prohibition is for activities found by the Federal Reserve Board to be so closely related to banking or managing or controlling banks as to be a proper incident thereto. Some of the principal activities that the Federal Reserve Board has determined by regulation to be closely related to banking are: (1) making or servicing loans; (2) performing certain data processing services; (3) providing securities brokerage services; (4) acting as fiduciary, investment or financial advisor; (5) leasing personal or real property under certain conditions; (6) making investments in corporations or projects designed primarily to promote community welfare; and (7) acquiring a savings association.
The Gramm-Leach-Bliley Act of 1999 authorizes a bank holding company that meets specified conditions, including depository institutions subsidiaries that are “well capitalized” and “well managed,” to opt to become a “financial holding company.” A “financial holding company” may engage in a broader array of financial activities than permitted a typical bank holding company. Such activities can include insurance underwriting and investment banking. We have not elected “financial holding company” status.
The Dodd-Frank Act required the Federal Reserve Board to revise its consolidated capital requirements for holding companies so that they are no less stringent, both quantitatively and in terms of components of capital, than those applicable to the subsidiary banks. This eliminated certain instruments from tier 1 capital, such as trust preferred securities that were previously includable for bank holding companies. The previously mentioned final capital rule implements these requirements effective January 1, 2015.
We are subject to the Federal Reserve Board’s consolidated capital adequacy guidelines for bank holding companies as we have more than $500 million in total assets (which limit is expected to increase to $1.0 billion in 2015), subject to certain grandfathered rules.
A bank holding company is generally required to give the Federal Reserve Board prior written notice of any purchase or redemption of then outstanding equity securities if the gross consideration for the purchase or redemption, when combined with the net consideration paid for all such purchases or redemptions during the preceding 12 months, is equal to 10% or more of the company’s consolidated net worth. The Federal Reserve Board may disapprove such a purchase or redemption if it determines that the proposal would constitute an unsafe and unsound practice, or would violate any law, regulation, Federal Reserve Board order or directive, or any condition imposed by, or written agreement with, the Federal Reserve Board. The Federal Reserve Board has adopted an exception to that approval requirement for well-capitalized bank holding companies that meet certain other conditions.
The Federal Reserve Board has issued a policy statement regarding the payment of dividends by bank holding companies. In general, the Federal Reserve Board’s policies provide that dividends should be paid only out of current earnings and only if the prospective rate of earnings retention by the bank holding company appears consistent with the organization’s capital needs, asset quality and overall financial condition. The Federal Reserve Board’s policies also require that a bank holding company serve as a source of financial strength to its subsidiary banks by using available resources to provide capital funds during periods of financial stress or adversity and by maintaining the financial flexibility and capital-raising capacity to obtain additional resources for assisting its subsidiary banks where necessary. The Dodd-Frank Act codified the source of strength policy and requires the promulgation of implementing regulations. Under the prompt corrective action laws, the ability of a bank holding company to pay dividends may be restricted if a subsidiary bank becomes undercapitalized. These regulatory policies could affect our ability to pay dividends or otherwise engage in capital distributions.
The Federal Deposit Insurance Act makes depository institutions liable to the FDIC for losses suffered or anticipated by the insurance fund in connection with the default of a commonly controlled depository institution or any assistance provided by the FDIC to such an institution in danger of default. That law would have potential applicability if we ever held as a separate subsidiary a depository institution in addition to the Bank.
We are affected by the monetary and fiscal policies of various agencies of the United States Government, including the Federal Reserve System. In view of changing conditions in the national economy and in the money markets, it is impossible for management to accurately predict future changes in monetary policy or the effect of such changes on our business or financial condition.
Federal Securities Laws
The Company’s common stock is registered with the Securities and Exchange Commission under the Securities Exchange Act of 1934. The Company is subject to the information, proxy solicitation, insider trading restrictions and other requirements under the Securities Exchange Act of 1934.
Sarbanes-Oxley Act
The Sarbanes-Oxley Act addresses, among other issues, corporate governance, auditing and accounting, executive compensation, and enhanced and timely disclosure of corporate information. As directed by the Sarbanes-Oxley Act, our Chief Executive Officer and Chief Financial Officer will be required to certify that our quarterly and annual reports do not contain any untrue statement of a material fact. The rules adopted by the Securities and Exchange Commission under the Sarbanes-Oxley Act have several requirements, including having these officers certify that: they are responsible for establishing, maintaining and regularly evaluating the effectiveness of our internal control over financial reporting; they have made certain disclosures to our auditors and the audit committee of the board of directors about our internal control over financial reporting; and they have included information in our quarterly and annual reports about their evaluation and whether there have been changes in our internal control over financial reporting or in other factors that could materially affect internal control over financial reporting. We have prepared policies, procedures and systems designed to ensure compliance with these regulations.
Concentrated Commercial Real Estate Lending Regulations.
The FRB and FDIC have promulgated guidance governing financial institutions with concentrations in commercial real estate lending. The guidance provides that a company has a concentration in commercial real estate lending if (i) total reported loans for construction, land development, and other land represent 100% or more of total capital or (ii) total reported loans secured by multifamily and non-farm residential properties and loans for construction, land development, and other land represent 300% or more of total capital and the outstanding balance of such loans has increased 50% or more during the prior 36 months. If a concentration is present, Management must employ heightened risk management practices including board and Management oversight and strategic planning, development of underwriting standards, risk assessment and monitoring through market analysis and stress testing, and increasing capital requirements. The Company is subject to these regulations.
12
An investment in shares of our common stock involves substantial risks. You should carefully consider, among other matters, the factors set forth below as well as the other information included in this Annual Report on Form 10-K before deciding whether an investment in shares of our common stock is suitable for you. If any of the risks described herein develop into actual events, our business, financial condition, liquidity, results of operations and prospects could be materially and adversely affected, the market price of our common stock could decline and you may lose all or part of your investment.
Risks Related to Our Business and Operations
Adverse events in Louisiana, where our business is concentrated, could adversely affect our results of operations and future growth.
Our business, the location of our branches and the real estate used as collateral on our real estate loans are primarily concentrated in Louisiana. At December 31, 2014, approximately 75.6% of the secured loans in our loan portfolio were secured by real estate and other collateral located in Louisiana. As a result, we are exposed to risks associated with a lack of geographic diversification. The occurrence of an economic downturn in Louisiana, or adverse changes in laws or regulations in Louisiana could impact the credit quality of our assets, the businesses of our customers and our ability to expand our business. Our success significantly depends upon the growth in population, income levels, deposits and housing in our market area. If the communities in which we operate do not grow or if prevailing economic conditions locally or nationally are unfavorable, our business may be negatively affected.
Material fluctuations in the price of oil and gas could adversely affect our business. At December 31, 2014, approximately $21.3 million, or 2.7% of our total loan portfolio was comprised of loans to businesses engaged in support or service activities for oil and gas operations. We had $12.1 million in unfunded commitments related to these businesses. In addition, the market value of the real estate securing loans as collateral could be adversely affected by unfavorable changes in market and economic conditions. Adverse developments affecting commerce or real estate values in the local economies in our primary market areas could increase the credit risk associated with our loan portfolio. In addition, substantially all of our loans are to individuals and businesses in Louisiana. Our business customers may not have customer bases that are as diverse as businesses serving regional or national markets. Consequently, any decline in the economy of our market area could have an adverse impact on our revenues and financial condition. In particular, we may experience increased loan delinquencies, which could result in a higher provision for loan losses and increased charge-offs. Any sustained period of increased non-payment, delinquencies, foreclosures or losses caused by adverse market or economic conditions in our market area could adversely affect the value of our assets, revenues, results of operations and financial condition.
We have a significant number of loans secured by real estate, and a downturn in the local real estate market could negatively impact our profitability.
At December 31, 2014, approximately 66.5% of our total loan portfolio was secured by real estate, almost all of which is located in Louisiana. As a result of the severe recession in 2008 and 2009, real estate values nationally and in our Louisiana markets declined. Recently, real estate values both nationally and in our market areas have shown improvement. Future declines in the real estate values in our Louisiana markets could significantly impair the value of the particular collateral securing our loans and our ability to sell the collateral upon foreclosure for an amount necessary to satisfy the borrower’s obligations to us. This could require increasing our allowance for loan losses to address the decrease in the value of the real estate securing our loans which could have a material adverse effect on our business, financial condition, results of operations and growth prospects.
Our loan portfolio consists of a high percentage of loans secured by non-farm non-residential real estate. These loans carry a greater credit risk than loans secured by one- to four-family properties.
Our loan portfolio includes non-farm non-residential real estate loans, primarily loans secured by commercial real estate such as office buildings, hotels and retail facilities. At December 31, 2014, our non-farm non-residential loans totaled $328.4 million, or 41.5% of our total loan portfolio. Our non-farm non-residential real estate loans expose us to greater risk of nonpayment and loss than one- to four-family family residential mortgage loans because repayment of the loans often depends on the successful operation and income stream of the borrowers. If we foreclose on these loans, our holding period for the collateral typically is longer than for a one- to four-family residential property because there are fewer potential purchasers of the collateral. In addition, non-farm non-residential real estate loans typically involve larger loan balances to single borrowers or groups of related borrowers compared to one- to four-family residential loans. Accordingly, charge-offs on non-farm non-residential loans may be larger on a per loan basis than those incurred with our residential or consumer loan portfolios. An unexpected adverse development on one or more of these types of loans can expose us to a significantly greater risk of loss compared to an adverse development with respect to a one- to four-family residential mortgage loan.
13
A large portion of our loan portfolio is comprised of commercial and industrial loans secured by receivables, inventory, equipment or other commercial collateral, the deterioration in value of which could increase the potential for future losses.
At December 31, 2014, $196.3 million, or 24.8% of our total loans, was comprised of commercial and industrial loans to businesses collateralized by general business assets including, among other things, accounts receivable, inventory and equipment and generally backed by a personal guaranty of the borrower or principal. These commercial and industrial loans are typically larger in amount than loans to individuals and, therefore, have the potential for larger losses on a single loan basis. Additionally, the repayment of commercial and industrial loans is subject to the ongoing business operations of the borrower. The collateral securing such loans generally includes moveable property such as equipment and inventory, which may decline in value more rapidly than we anticipate, or may be difficult to market and sell, exposing us to increased credit risk. Significant adverse changes in the economy or local market conditions in which our commercial lending customers operate could cause rapid declines in loan collectability and the values associated with general business assets, resulting in inadequate collateral coverage that may expose us to credit losses and could adversely affect our business, financial condition and results of operations.
A portion of our loan portfolio consists of syndicated loans, including syndicated loans known as shared national credits, secured by assets located generally outside of our market area. Syndicated loans may have a higher risk of loss than other loans we originate because we are not the lead lender and we have limited control over credit monitoring.
Over the last seven years, we have pursued a focused program to participate in select syndicated loans (loans made by a group of lenders, including us, who share or participate in a specific loan) with a larger regional financial institution as the lead lender. Syndicated loans are typically made to large businesses (which are referred to as shared national credits) or middle market companies (which do not meet the regulatory definition of shared national credits), both of which are secured by business assets or equipment, and commercial real estate located generally outside of our market area. The syndicate group for both types of loans usually consists of two to three other financial institutions. At December 31, 2014, we had $129.0 million in syndicated loans, or 16.3% of our total loan portfolio with our largest individual syndicated loan totaling $8.8 million. At December 31, 2014, shared national credit loans totaled $76.9 million, or 9.7% of our total loan portfolio. In addition at December 31, 2014, we had $52.1 million in syndicated loans that were not shared national credits. Syndicated loans may have a higher risk of loss than other loans we originate because we rely on the lead lender to monitor the performance of the loan. Moreover, our decision regarding the classification of a syndicated loan and loan loss provisions associated with a syndicated loan are made in part based upon information provided by the lead lender. A lead lender also may not monitor a syndicated loan in the same manner as we would for other loans that we originate. If our underwriting of these syndicated loans is not sufficient, our non-performing loans may increase and our earnings may decrease.
Curtailment of government guaranteed loan programs could affect a segment of our business, and government agencies may not honor their guarantees if we do not originate loans in compliance with their guidelines.
As of December 31, 2014, $27.0 million, or 3.4% of our total loan portfolio, were comprised of loans where all or some portion of the loans were guaranteed through the SBA, USDA or Farm Security Administration (“FSA”) lending programs, and we intend to grow this segment of our portfolio in the future. From time to time, the government agencies that guarantee these loans reach their internal limits and cease to guarantee loans. In addition, these agencies may change their rules for loans or Congress may adopt legislation that would have the effect of discontinuing or changing the loan programs. Non-governmental programs could replace government programs for some borrowers, but the terms might not be equally acceptable. Therefore, if these changes occur, the volume of loans to small business, industrial and agricultural borrowers of the types that now qualify for government guaranteed loans could decline. Also, the profitability of these loans could decline.
In addition, while we follow the SBA’s, USDA’s and FSA’s underwriting guidelines, our ability to do so depends on the knowledge and diligence of our employees and the effectiveness of controls we have established. If our employees do not follow the SBA, USDA or FSA guidelines in originating loans and if our loan review and audit programs fail to identify and rectify such failures, the government agencies that guarantee these loans may refuse to honor their guarantee obligations and we may incur losses as a result.
Interest rate shifts may reduce net interest income and otherwise negatively impact our financial condition and results of operations.
The majority of our banking assets are monetary in nature and subject to risk from changes in interest rates. Like most financial institutions, our earnings and cash flows depend to a great extent upon the level of our net interest income, or the difference between the interest income we earn on loans, investments and other interest-earning assets, and the interest we pay on interest-bearing liabilities, such as deposits and borrowings. Changes in interest rates can increase or decrease our net interest income, because different types of assets and liabilities may react differently, and at different times, to market interest rate changes.
When interest-bearing liabilities mature or reprice more quickly, or to a greater degree than interest-earning assets in a period, an increase in interest rates could reduce net interest income. Similarly, when interest-earning assets mature or reprice more quickly, or to a greater degree than interest-bearing liabilities, falling interest rates could reduce net interest income. Additionally, an increase in interest rates may, among other things, reduce the demand for loans and our ability to originate loans and decrease loan repayment rates. A decrease in the general level of interest rates may affect us through, among other things, increased prepayments on our loan portfolio and increased competition for deposits. Accordingly, changes in the level of market interest rates affect our net yield on interest-earning assets, loan origination volume and our overall results. Although our asset-liability management strategy is designed to control and mitigate exposure to the risks related to changes in market interest rates, those rates are affected by many factors outside of our control, including governmental monetary policies, inflation, deflation, recession, changes in unemployment, the money supply, international disorder and instability in domestic and foreign financial markets.
We could recognize losses on securities held in our securities portfolio, particularly if interest rates increase or economic and market conditions deteriorate.
While we attempt to invest a significant percentage of our assets in loans (our loan to deposit ratio was 57.6% at December 31, 2014), we invest a large portion of our total assets (42.2% at December 31, 2014) in investment securities with the primary objectives of providing a source of liquidity, generating an appropriate return on funds invested, managing interest rate risk, meeting pledging requirements of our public funds deposits and meeting regulatory capital requirements. At December 31, 2014, the book value of our securities portfolio was $641.6 million. Factors beyond our control can significantly influence the fair value of securities in our portfolio and can cause potential adverse changes to the fair value of these securities. For example, fixed-rate securities are generally subject to decreases in market value when interest rates rise. Additional factors include, but are not limited to, rating agency downgrades of the securities, defaults by the issuer or individual borrowers with respect to the underlying securities, and continued instability in the credit markets. Any of the foregoing factors could cause an other-than-temporary impairment in future periods and result in realized losses. The process for determining whether impairment is other-than-temporary usually requires difficult, subjective judgments about the future financial performance of the issuer and any collateral underlying the security in order to assess the probability of receiving all contractual principal and interest payments on the security. Because of changing economic and market conditions affecting interest rates, the financial condition of issuers of the securities and the performance of the underlying collateral, we may recognize realized and/or unrealized losses in future periods, which could have an adverse effect on our business, financial condition and results of operations.
14
Public funds deposits are an important source of funds for us and a reduced level of those deposits may hurt our profits.
Public funds deposits are a significant source of funds for our lending and investment activities. At December 31, 2014, $601.5 million, or 43.9% of our total deposits, consisted of public funds deposits from local government entities such as school districts, hospital districts, sheriff departments and other municipalities, which are collateralized by letters of credit from the Federal Home Loan Bank (“FHLB”) and investment securities. Given our dependence on high-average balance public funds deposits as a source of funds, our inability to retain such funds could significantly and adversely affect our liquidity. Further, our public funds deposits are primarily demand deposit accounts or short-term time deposits and are therefore more sensitive to interest rate risks. If we are forced to pay higher rates on our public funds accounts to retain those funds, or if we are unable to retain such funds and we are forced to resort to other sources of funds for our lending and investment activities, such as borrowings from the FHLB, the interest expense associated with these other funding sources may be higher than the rates we are currently paying on our public funds deposits, which would adversely affect our net income.
Our strategy of pursuing acquisitions exposes us to financial, execution and operational risks that could have a material adverse effect on our business, financial condition, results of operations and growth prospects.
We have selectively acquired financial institutions over the past ten years, and we intend to continue pursuing a strategy that includes acquisitions. An acquisition strategy involves significant risks, including the following:
|
|
●
|
finding suitable candidates for acquisition;
|
|
|
●
|
attracting funding to support additional growth within acceptable risk tolerances;
|
|
|
●
|
maintaining asset quality;
|
|
|
●
|
retaining customers and key personnel;
|
|
|
●
|
obtaining necessary regulatory approvals;
|
|
|
●
|
conducting adequate due diligence and managing known and unknown risks and uncertainties;
|
|
|
●
|
integrating acquired businesses; and
|
|
|
●
|
maintaining adequate regulatory capital.
|
The market for acquisition targets is highly competitive, which may adversely affect our ability to find acquisition candidates that fit our strategy and standards. To the extent that we are unable to find suitable acquisition targets, an important component of our growth strategy may not be realized. Acquisitions will be subject to regulatory approvals, and we may be unable to obtain such approvals. Acquisitions of financial institutions also involve operational risks and uncertainties, and acquired companies may have unknown or contingent liabilities with no available manner of recourse, exposure to unexpected problems such as asset quality, the retention of key employees and customers and other issues that could negatively affect our business. We may not be able to complete future acquisitions or, if completed, we may not be able to successfully integrate the operations, technology platforms, management, products and services of the entities that we acquire and to realize our attempts to eliminate redundancies. The integration process may also require significant time and attention from our management that they would otherwise be able to direct toward servicing existing business and developing new business. Acquisitions typically involve the payment of a premium over book and market trading values and, therefore, some dilution of our tangible book value and net income per common share may occur in connection with any future acquisition of a financial institution or service company, and the carrying amount of any goodwill that we acquire may be subject to impairment in future periods. Failure to successfully integrate the entities we acquire into our existing operations may increase our operating costs significantly and adversely affect our business, financial condition and results of operations.
We may not be able to successfully maintain and manage our growth.
Continued growth depends, in part, upon the ability to expand market presence, to successfully attract core deposits, and to identify attractive commercial lending opportunities. Management may not be able to successfully manage increased levels of assets and liabilities. We may be required to make additional investments in equipment and personnel to manage higher asset levels and loan balances, which may adversely impact our efficiency, earnings and shareholder returns. In addition, franchise growth may increase through acquisitions and de novo branching. The ability to successfully integrate such acquisitions into our consolidated operations will have a direct impact on our financial condition and results of operations.
We depend primarily on net interest income for our earnings rather than noninterest income.
Net interest income is the most significant component of our operating income. For the year ended December 31, 2014, our net interest income totaled $44.1 million in comparison to our total non-interest income of $6.2 million earned during the same year. We do not rely on nontraditional sources of fee income utilized by some community banks, such as fees from sales of insurance, securities or investment advisory products or services. The amount of our net interest income is influenced by the overall interest rate environment, competition, and the amount of interest-earning assets relative to the amount of interest-bearing liabilities. In the event that one or more of these factors were to result in a decrease in our net interest income, we have limited sources of non-interest income to offset any decrease in our net interest income.
If our nonperforming assets increase, our earnings will be adversely affected.
At December 31, 2014, our non-performing assets, which consist of non-performing loans and other real estate owned, were $15.0 million, or 0.99% of total assets. Our non-performing assets adversely affect our net income in various ways:
|
|
●
|
we record interest income only on the cash basis or cost-recovery method for nonaccrual loans and we do not record interest income for other real estate owned;
|
|
|
●
|
we must provide for probable loan losses through a current period charge to the provision for loan losses;
|
|
|
●
|
non-interest expense increases when we write down the value of properties in our other real estate owned portfolio to reflect changing market values;
|
|
|
●
|
there are legal fees associated with the resolution of problem assets, as well as carrying costs, such as taxes, insurance, and maintenance fees; and
|
|
|
●
|
the resolution of non-performing assets requires the active involvement of management, which can distract them from more profitable activities.
|
If additional borrowers become delinquent and do not pay their loans and we are unable to successfully manage our non-performing assets, our losses and troubled assets could increase significantly, which could have a material adverse effect on our financial condition and results of operations.
15
If the allowance for loan losses is not sufficient to cover actual loan losses, earnings could decrease.
Loan customers may not repay their loans according to the terms of their loans, and the collateral securing the payment of their loans may be insufficient to assure repayment. We may experience significant credit losses, which could have a material adverse effect on our operating results. Various assumptions and judgments about the collectability of the loan portfolio are made, including the creditworthiness of borrowers and the value of the real estate and other assets serving as collateral for the repayment of many loans. In determining the amount of the allowance for loan losses, management reviews the loans and the loss and delinquency experience and evaluates economic conditions.
At December 31, 2014, our allowance for loan losses as a percentage of total loans, net of unearned income, was 1.15% and as a percentage of total non-performing loans was 71.2%. The determination of the appropriate level of allowance is subject to judgment and requires us to make significant estimates of current credit risks and future trends, all of which are subject to material changes. If assumptions prove to be incorrect, the allowance for loan losses may not cover inherent losses in the loan portfolio at the date of the financial statements. Significant additions to the allowance would materially decrease net income. Non-performing loans may increase and non-performing or delinquent loans may adversely affect future performance. In addition, federal and state regulators periodically review the allowance for loan losses and may require an increase in the allowance for loan losses or recognize further loan charge-offs. Any significant increase in our allowance for loan losses or loan charge-offs as required by these regulatory agencies could have a material adverse effect on our results of operations and financial condition.
Emphasis on the origination of short-term loans could expose us to increased lending risks.
At December 31, 2014, $639.9 million, or 81.0% of our total loans consisted of short-term loans, defined as loans whose payments are typically based on ten to 20-year amortization schedules but have maturities typically ranging from one to five years. This results in our borrowers having significantly higher final payments due at maturity, known as a “balloon payment.” In the event our borrowers are unable to make their balloon payments when they are due, we may incur significant losses in our loan portfolio. Moreover, while the shorter maturities of our loan portfolio help us to manage our interest rate risk, they also increase the reinvestment risk associated with new loan originations. During an economic slow-down, we might incur significant losses as our loan portfolio matures.
We rely on our management team and our board of directors for the successful implementation of our business strategy.
Our success depends significantly on the continued service and skills of our senior management team and our board of directors, particularly Marshall T. Reynolds, our Chairman, Alton B. Lewis, our President and Chief Executive Officer and Eric J. Dosch, our Chief Financial Officer. The implementation of our business and growth strategies also depends significantly on our ability to attract, motivate and retain highly qualified executives and directors. The loss of services of one or more of these individuals could have a negative impact on our business because of their skills, years of industry experience and difficulty of promptly finding qualified replacement personnel.
We obtain a significant portion of our noninterest revenue through service charges on core deposit accounts, and regulations impacting service charges could reduce our fee income.
A significant portion of our noninterest revenue is derived from service charge income. During the year ended December 31, 2014, service charges, commissions and fees represented $4.4 million, or 71.8% of our total noninterest income. The largest component of this service charge income is overdraft-related fees. Management believes that changes in banking regulations pertaining to rules on certain overdraft payments on consumer accounts have and will continue to have an adverse impact on our service charge income. Additionally, changes in customer behavior, as well as increased competition from other financial institutions, may result in declines in deposit accounts or in overdraft frequency resulting in a decline in service charge income. A reduction in deposit account fee income could have a material adverse effect on our earnings.
We may be unable to successfully compete with others for business.
The area in which we operate is considered attractive from an economic and demographic viewpoint, and is a highly competitive banking market. We compete for loans and deposits with numerous regional and national banks and other community banking institutions, as well as other kinds of financial institutions and enterprises, such as securities firms, insurance companies, savings associations, credit unions, mortgage brokers and private lenders. Many competitors have substantially greater resources than we do. The differences in resources may make it harder for us to compete profitably, reduce the rates that we can earn on loans and investments, increase the rates we must offer on deposits and other funds, and adversely affect our overall financial condition and earnings.
Hurricanes or other adverse weather conditions in Louisiana can have an adverse impact on our market area.
Our market area in Southeast Louisiana is close to New Orleans and the Gulf of Mexico, areas which are susceptible to hurricanes, tropical storms and other natural disasters and adverse weather conditions. For example, Hurricane Katrina hit the greater New Orleans area in August 2005 causing widespread damage. Similar future events could potentially cause widespread property damage, require the relocation of an unprecedented number of residents and business operations, and severely disrupt normal economic activity in our market areas, which may have an adverse effect on our operations, loan originations and deposit base. Moreover, our ability to compete effectively with financial institutions whose operations are not concentrated in areas affected by hurricanes or other adverse weather conditions or whose resources are greater than ours will depend primarily on our ability to continue normal business operations following such event. The severity and duration of the effects of hurricanes or other adverse weather conditions will depend on a variety of factors that are beyond our control, including the amount and timing of government, private and philanthropic investments including deposits in the region, the pace of rebuilding and economic recovery in the region and the extent to which a hurricane’s property damage is covered by insurance. The occurrence of any such event could have a material adverse effect on our business, financial condition and results of operations.
16
We face risks related to our operational, technological and organizational infrastructure.
Our ability to grow and compete is dependent on our ability to build or acquire the necessary operational and technological infrastructure and to manage the cost of that infrastructure as we expand. Similar to other large corporations, operational risk can manifest itself in many ways, such as errors related to failed or inadequate processes, faulty or disabled computer systems, fraud by employees or outside persons and exposure to external events. As discussed below, we are dependent on our operational infrastructure to help manage these risks. In addition, we are heavily dependent on the strength and capability of our technology systems which we use both to interface with our customers and to manage our internal financial and other systems. Our ability to develop and deliver new products that meet the needs of our existing customers and attract new ones depends on the functionality of our technology systems. Additionally, our ability to run our business in compliance with applicable laws and regulations is dependent on these infrastructures.
We continuously monitor our operational and technological capabilities and make modifications and improvements when we believe it will be cost effective to do so. In some instances, we may build and maintain these capabilities ourselves. We also outsource some of these functions to third parties. These third parties may experience errors or disruptions that could adversely impact us and over which we may have limited control. We also face risk from the integration of new infrastructure platforms and/or new third party providers of such platforms into its existing businesses.
A failure in our operational systems or infrastructure, or those of third parties, could impair our liquidity, disrupt our businesses, result in the unauthorized disclosure of confidential information, damage our reputation and cause financial losses.
Our businesses are dependent on their ability to process and monitor, on a daily basis, a large number of transactions, many of which are highly complex, across numerous and diverse markets. These transactions, as well as the information technology services we provide to clients, often must adhere to client-specific guidelines, as well as legal and regulatory standards. Due to the breadth of our client base and our geographical reach, developing and maintaining our operational systems and infrastructure is challenging, particularly as a result of rapidly evolving legal and regulatory requirements and technological shifts. Our financial, accounting, data processing or other operating systems and facilities may fail to operate properly or become disabled as a result of events that are wholly or partially beyond our control, such as a spike in transaction volume, cyber-attack or other unforeseen catastrophic events, which may adversely affect our ability to process these transactions or provide services.
In addition, our operations rely on the secure processing, storage and transmission of confidential and other information on our computer systems and networks. Although we take protective measures to maintain the confidentiality, integrity and availability of information across all geographic and product lines, and endeavor to modify these protective measures as circumstances warrant, the nature of the threats continues to evolve. As a result, our computer systems, software and networks may be vulnerable to unauthorized access, loss or destruction of data (including confidential client information), account takeovers, unavailability of service, computer viruses or other malicious code, cyber-attacks and other events that could have an adverse security impact. Despite the defensive measures we take to manage our internal technological and operational infrastructure, these threats may originate externally from third parties such as foreign governments, organized crime and other hackers, and outsource or infrastructure-support providers and application developers, or may originate internally from within our organization. Given the increasingly high volume of our transactions, certain errors may be repeated or compounded before they can be discovered and rectified.
Changes in accounting policies or in accounting standards could materially affect how we report our financial condition and results of operations.
Accounting policies are essential to understanding our financial condition and results of operations. Some of these policies require the use of estimates and assumptions that may affect the value of our assets or liabilities and financial results. Some of our accounting policies are critical because they require management to make difficult, subjective, and complex judgments about matters that are inherently uncertain, and because it is likely that materially different amounts would be reported under different conditions or using different assumptions. If such estimates or assumptions underlying our financial statements are incorrect, we may experience material losses.
From time to time, the Financial Accounting Standards Board and the Securities and Exchange Commission change the financial accounting and reporting standards or the interpretation of those standards that govern the preparation of our financial statements. These changes are beyond our control, can be difficult to predict and could materially affect how we report our financial condition and results of operations. We could also be required to apply a new or revised standard retroactively, which may result in our restating our prior period financial statements.
We hold certain intangible assets that could be classified as impaired in the future. If these assets are considered to be either partially or fully impaired in the future, our earnings and the book values of these assets would decrease.
We are required to test goodwill and core deposit intangible assets for impairment on a periodic basis. The impairment testing process considers a variety of factors, including macroeconomic conditions, industry and market considerations, cost factors, and financial performance. If an impairment determination is made in a future reporting period, our earnings and the book value of these intangible assets will be reduced by the amount of the impairment which would adversely affect our financial performance.
A lack of liquidity could adversely affect our operations and jeopardize our business, financial condition and results of operations.
Liquidity is essential to our business. We rely on our ability to generate deposits and effectively manage the repayment and maturity schedules of our loans and investment securities, respectively, to ensure that we have adequate liquidity to fund our operations. An inability to raise funds through deposits, borrowings, the sale of our investment securities, the sale of loans and other sources could have a substantial negative effect on our liquidity. Our most important source of funds is deposits. Deposit balances can decrease when customers perceive alternative investments as providing a better risk/return tradeoff. If customers move money out of bank deposits and into other investments such as money market funds, we would lose a relatively low-cost source of funds, increasing our funding costs and reducing our net interest income and net income. As stated above, public funds are a sizeable portion of our deposits. Loss of a large public funds depositor at the end of a contract would negatively impact liquidity.
Other primary sources of funds consist of cash flows from operations, maturities and sales of investment securities, and proceeds from the issuance and sale of our equity securities to investors. Additional liquidity is provided by the ability to borrow from the FHLB or the Federal Reserve Bank of Atlanta (“Federal Reserve Bank”). We also may borrow funds from third-party lenders, such as other financial institutions. Our access to funding sources in amounts adequate to finance or capitalize our activities, or on terms that are acceptable to us, could be impaired by factors that affect us directly or the financial services industry or economy in general, such as disruptions in the financial markets or negative views and expectations about the prospects for the financial services industry. Our access to funding sources could also be affected by a decrease in the level of our business activity as a result of a downturn in our target markets or by one or more adverse regulatory actions against us.
Any decline in available funding could adversely impact our ability to originate loans, invest in securities, meet our expenses, or to fulfill obligations such as repaying our borrowings or meeting deposit withdrawal demands, any of which could have a material adverse impact on our liquidity, business, financial condition and results of operations.
17
The redemption of the Series C Preferred Stock we issued to the U.S. Treasury in connection with the SBLF may be dilutive to your stock ownership in First Guaranty Bancshares.
The ownership interest of your common stock may be diluted to the extent we need to raise capital by issuing securities to redeem the 39,435 shares of Series C Preferred Stock we sold to the U.S. Treasury in connection with our participation in the SBLF. Because our decision to issue securities in any future offering will depend on market conditions and other factors beyond our control, we cannot predict or estimate the amount, timing or nature of any future offerings. Thus, our shareholders bear the risk of our future offerings related to redeeming the Series C Preferred Stock, including reducing the market price of our common stock and diluting shareholders’ holdings in our common stock. Holders of our common stock are not entitled to preemptive rights or other protections against dilution.
The dividend rate on our Series C Preferred Stock will increase to 9.0% if we have not redeemed the Series C Preferred Stock on or prior to March 22, 2016, which will impact net income available to holders of our common stock and earnings per share of our common stock.
The per annum dividend rate on the shares of our Series C Preferred Stock was 1.0% per annum at December 31, 2014. Beginning on March 22, 2016, the per annum dividend rate on the Series C Preferred Stock will increase to a fixed rate of 9.0% if any Series C Preferred Stock remains outstanding. At the current dividend rate of 1.0% per annum, the total dividend paid on our Series C Preferred Stock is $394,350. Assuming the increased dividend rate of 9.0% per annum and assuming we have not redeemed any of our Series C Preferred Stock, the annual dividend payable on our Series C Preferred Stock would be $3.5 million. Depending on our financial condition at the time, any such increase in the dividend rate could have a material negative effect on our financial condition, including reducing our net income available to holders of our common stock and our earnings per share.
Failure to pay dividends on our Series C Preferred Stock may have negative consequences, including limiting our ability to pay dividends in the future.
The Series C Preferred Stock issued in connection with our participation in the SBLF pays a non-cumulative quarterly dividend in arrears. Such dividends are not cumulative but we may only declare and pay dividends on our common stock (or any other equity securities junior to the Series C Preferred Stock) if we have declared and paid dividends on the Series C Preferred Stock for the current dividend period.
Moreover, our ability to pay dividends is always subject to legal and regulatory restrictions. Any payment of dividends in the future will depend, in large part, on our earnings, capital requirements, financial condition and other factors considered relevant by our board of directors. Although we have historically paid cash dividends on our common stock, we are not required to do so and our board of directors could further reduce or eliminate our common stock dividend in the future.
We are subject to environmental liability risk associated with lending activities.
A significant portion of our loan portfolio is secured by real property. During the ordinary course of business, we may foreclose on and take title to properties securing certain loans. In doing so, there is a risk that hazardous or toxic substances could be found on these properties. If hazardous or toxic substances are found, we may be liable for remediation costs, as well as for personal injury and property damage. Environmental laws may require us to incur substantial expenses to address unknown liabilities and may materially reduce the affected property’s value or limit our ability to use or sell the affected property. In addition, future laws or more stringent interpretations or enforcement policies with respect to existing laws may increase our exposure to environmental liability. Although we have policies and procedures to perform an environmental review before initiating any foreclosure action on nonresidential real property, these reviews may not be sufficient to detect all potential environmental hazards. The remediation costs and any other financial liabilities associated with an environmental hazard could have a material adverse effect on our financial condition and results of operations.
Risks Related to Our Industry
We operate in a highly regulated environment and may be adversely affected by changes in federal, state and local laws and regulations.
We are subject to extensive regulation, supervision and examination by federal and state banking authorities. Any change in applicable regulations or federal, state or local legislation could have a substantial impact on us and our operations. Additional legislation and regulations that could significantly affect our powers, authority and operations may be enacted or adopted in the future, which could have a material adverse effect on our financial condition and results of operations. Further, regulators have significant discretion and authority to prevent or remedy unsafe or unsound practices or violations of laws by banks and bank holding companies in the performance of their supervisory and enforcement duties. The exercise of regulatory authority may have a negative impact on our results of operations and financial condition. Like other bank holding companies and financial institutions, we must comply with significant anti-money laundering and anti-terrorism laws. Under these laws, we are required, among other things, to enforce a customer identification program and file currency transaction and suspicious activity reports with the federal government. Government agencies have substantial discretion to impose significant monetary penalties on institutions which fail to comply with these laws or make required reports.
18
Federal and state regulators periodically examine our business, and we may be required to remediate adverse examination findings.
The Board of Governors of the Federal Reserve System (“Federal Reserve Board”), the FDIC and the Louisiana Office of Financial Institutions (“OFI”), periodically examine our business, including our compliance with laws and regulations. If, as a result of an examination, a federal banking agency were to determine that our financial condition, capital resources, asset quality, earnings prospects, management, liquidity or other aspects of any of our operations had become unsatisfactory, or that we were in violation of any law or regulation, it may take a number of different remedial actions as it deems appropriate. These actions include the power to enjoin “unsafe or unsound” practices, to require affirmative action to correct any conditions resulting from any violation or practice, to issue an administrative order that can be judicially enforced, to direct an increase in our capital, to restrict our growth, to assess civil monetary penalties against our officers or directors, to remove officers and directors and, if it is concluded that such conditions cannot be corrected or there is an imminent risk of loss to depositors, to terminate our deposit insurance and place us into receivership or conservatorship. If we become subject to any regulatory actions, it could have a material adverse effect on our business, results of operations, financial condition and growth prospects.
Financial reform legislation enacted by Congress will, among other things, tighten capital standards and result in new laws and regulations that likely will increase our costs of operations.
The Dodd-Frank Wall Street Reform and Consumer Protection Act of 2010 (“Dodd-Frank Act”) was signed into law on July 21, 2010. This law significantly changed the then-existing bank regulatory structure and affected the lending, deposit, investment, trading and operating activities of financial institutions and their holding companies. The Dodd-Frank Act changed the regulatory structure to which we are subject in numerous ways, including, but not limited to, the following:
|
|
●
|
the base for FDIC insurance assessments has been changed to a bank’s average consolidated total assets minus average tangible equity, rather than upon its deposit base, while the FDIC’s authority to raise insurance premiums has been expanded;
|
|
|
●
|
the current standard deposit insurance limit has been permanently raised to $250,000;
|
|
|
●
|
the FDIC must raise the ratio of reserves to deposits from 1.15% to 1.35% for deposit insurance purposes by September 30, 2020 and to “offset the effect” of increased assessments on insured depository institutions with assets of less than $10.0 billion;
|
|
|
●
|
the interchange fees payable on debit card transactions have been limited;
|
|
|
●
|
there are multiple new provisions affecting corporate governance and executive compensation at all publicly traded companies; and
|
|
|
●
|
all federal prohibitions on the ability of financial institutions to pay interest on commercial demand deposit accounts have been repealed.
|
In addition to the foregoing, the Dodd-Frank Act established the Consumer Financial Protection Bureau (the “CFPB”) as an independent entity within the Federal Reserve System. The CFPB has broad rulemaking, supervisory and enforcement authority over consumer financial products and services, including deposit products, residential mortgages, home-equity loans and credit cards, as well as with respect to certain mortgage-related matters, such as steering incentives, determinations as to a borrower’s ability to repay and prepayment penalties.
Our management continues to assess the impact on our operations of the Dodd-Frank Act and its regulations, some of which have yet to be proposed or adopted or are to be phased-in over time. Because the full impact of many of the regulations adopted pursuant to the Dodd-Frank Act may not be known for some time, it is difficult to predict at this time what specific impact the Dodd-Frank Act will have on us. However, it is expected that at a minimum our operating and compliance costs will increase, and our interest expense could increase.
We will become subject to more stringent capital requirements, which may adversely impact our return on equity, require us to raise additional capital, or constrain us from paying dividends or repurchasing shares.
In July 2013, the FDIC and the Federal Reserve Board approved a new rule that will substantially amend the regulatory risk-based capital rules applicable to First Guaranty Bancshares, on a consolidated basis, and First Guaranty Bank, on a stand -alone basis. The final rule implements the “Basel III” regulatory capital reforms and changes required by the Dodd-Frank Act.
The final rule includes new minimum risk-based capital and leverage ratios, which were effective for First Guaranty Bancshares and First Guaranty Bank on January 1, 2015, and refines the definition of what constitutes “capital” for purposes of calculating these ratios. The new minimum capital requirements are: (i) a new common equity Tier 1 capital ratio of 4.5%; (ii) a Tier 1 to risk-based assets capital ratio of 6% (increased from 4%); (iii) a total capital ratio of 8% (unchanged from current rules); and (iv) a Tier 1 leverage ratio of 4%. The final rule also establishes a “capital conservation buffer” of 2.5%, and will result in the following minimum ratios: (i) a common equity Tier 1 capital ratio of 7.0%, (ii) a Tier 1 to risk-based assets capital ratio of 8.5%, and (iii) a total capital ratio of 10.5%. The new capital conservation buffer requirement would be phased in beginning in January 2016 at 0.625% of risk-weighted assets and would increase each year until fully implemented in January 2019. An institution will be subject to limitations on paying dividends, engaging in share repurchases, and paying discretionary bonuses if its capital level falls below the buffer amount. These limitations will establish a maximum percentage of eligible retained income that can be utilized for such actions.
The application of more stringent capital requirements for First Guaranty Bank and First Guaranty Bancshares could, among other things, result in lower returns on equity, require the raising of additional capital, and result in regulatory actions constraining us from paying dividends or repurchasing shares if we are unable to comply with such requirements.
We are subject to the CRA and fair lending laws, and failure to comply with these laws could lead to material penalties.
The Community Reinvestment Act (“CRA”), the Equal Credit Opportunity Act, the Fair Housing Act and other fair lending laws and regulations impose nondiscriminatory lending requirements on financial institutions. The CFPB, the United States Department of Justice and other federal agencies are responsible for enforcing these laws and regulations. A successful challenge to an institution’s performance under the CRA or fair lending laws and regulations could result in a wide variety of sanctions, including the required payment of damages and civil money penalties, injunctive relief, imposition of restrictions on mergers and acquisitions activity and restrictions on expansion activity. Private parties may also have the ability to challenge an institution’s performance under fair lending laws in private class action litigation.
19
Difficult market conditions have adversely affected the industry in which we operate.
If capital and credit markets experience volatility and disruption as they did during the recent financial crisis, we may face the following risks:
|
|
●
|
increased regulation of our industry;
|
|
|
●
|
compliance with such regulation may increase our costs and limit our ability to pursue business opportunities;
|
|
|
●
|
market developments and the resulting economic pressure on consumers may affect consumer confidence levels and may cause increases in delinquencies and default rates, which, among other effects, could affect our charge-offs and provision for loan losses. Competition in the industry could intensify as a result of the increasing consolidation of financial institutions in connection with the current market conditions;
|
|
|
●
|
market disruptions make valuation even more difficult and subjective, and our ability to measure the fair value of our assets could be adversely affected. If we determine that a significant portion of our assets have values significantly below their recorded carrying value, we could recognize a material charge to earnings in the quarter in which such determination was made, our capital ratios would be adversely affected and a rating agency might downgrade our credit rating or put us on credit watch; and
|
|
|
●
|
the downgrade of the United States government’s sovereign credit rating, any related rating agency action in the future, and the downgrade of the sovereign credit ratings for several European nations could negatively impact our business, financial condition and results of operations.
|
Changes in the policies of monetary authorities and other government action could adversely affect our profitability.
The results of operations are affected by credit policies of monetary authorities, particularly the policies of the Federal Reserve. The instruments of monetary policy employed by the Federal Reserve Board include open market operations in U.S. government securities, changes in the discount rate or the federal funds rate on bank borrowings and changes in reserve requirements against bank deposits. In view of changing conditions in the national economy and in the money markets, particularly in light of the continuing threat of terrorist attacks and the current military operations in the Middle East, we cannot predict possible future changes in interest rates, deposit levels, loan demand or our business and earnings. Furthermore, the actions of the United States government and other governments in responding to such terrorist attacks or the military operations in the Middle East may result in currency fluctuations, exchange controls, market disruption and other adverse effects.
Future legislative or regulatory actions responding to perceived financial and market problems could impair our rights against borrowers.
Future legislative or regulatory actions responding to perceived financial and market problems could impair our rights against borrowers in the event of their default on their outstanding loan obligations. There have been proposals made by members of Congress and others that would reduce the amount distressed borrowers are otherwise contractually obligated to pay under their mortgage loans and limit an institution’s ability to foreclose on mortgage collateral. If proposals such as these or other proposals limiting our rights as a creditor were to be implemented, we could experience increased credit losses or increased expense in pursuing its remedies as a creditor.
We may be required to pay significantly higher FDIC insurance premiums or special assessments that could adversely affect our earnings.
We may be required to pay significantly higher FDIC insurance premiums or additional special assessments that could adversely affect our earnings. A bank’s regular assessments are determined by its risk classification, which is based on its regulatory capital levels and the level of supervisory concern that it poses. Recent insured depository institution failures, as well as deterioration in banking and economic conditions generally, have significantly increased the losses of the FDIC, resulting in a decline in the designated reserve ratio of the FDIC to historical lows. To restore this reserve ratio and bolster its funding position, the FDIC imposed a special assessment on depository institutions and also increased deposit insurance assessment rates. In the event of bank or financial institution failures, we may be required to pay even higher FDIC insurance premiums. Any future increases or required prepayments in FDIC insurance premiums may materially adversely affect our results of operations.
20
Risk Associated with an Investment in our Common Stock
The market price of our common stock is established between a buyer and seller.
First Guaranty Bank acts as the transfer agent for First Guaranty Bancshares, Inc. The price for all shares traded are agreed upon by buyers and sellers. There is no active or liquid market for our common stock. First Guaranty Bancshares, Inc. is not traded on an exchange, therefore liquidation and/or purchases of stock may not be readily available.
Failure to maintain effective internal controls over financial reporting in the future could impair our ability to accurately and timely report our financial results or prevent fraud.
Effective internal controls over financial reporting are necessary to provide reliable financial reports and prevent fraud. As a bank holding company, we are subject to regulation that focuses on effective internal controls and procedures. Such controls and procedures are modified, supplemented, and changed from time-to-time as necessary in relation to our growth and in reaction to external events and developments. Any failure to maintain, in the future, an effective internal control environment could impact our ability to report our financial results on an accurate and timely basis, which could result in regulatory actions, loss of investor confidence, and adversely impact our business.
Our Management and Directors control a substantial percentage of our common stock and therefore has the ability to exercies substantial control over our affairs.
Because of the large percentage of common stock held by our directors and executive officers, such persons could significantly influence the outcome of any matter submitted to a vote of our shareholders even if other shareholders were in favor of a different result.
Our dividend policy may change without notice, and our future ability to pay dividends is also subject to regulatory restrictions.
Holders of our common stock are entitled to receive only such cash dividends as our board of directors may declare out of funds legally available for the payment of dividends.
Although First Guaranty Bancshares, and First Guaranty Bank prior to the Share Exchange, paid a quarterly dividend to our shareholders for 86 consecutive quarters at December 31, 2014, we have no obligation to continue paying dividends, and we may change our dividend policy at any time without prior notice to our shareholders. In addition, our ability to pay dividends will continue to be subject, among other things, to certain regulatory guidance and/or restrictions.
None.
The Company does not directly own any real estate, but it does own real estate indirectly through its subsidiary. The Bank operates 21 banking centers, including one drive-up facility. The following table sets forth certain information relating to each office. The net book value of premises at all branch locations, including the raw land of branches under development, at December 31, 2014 totaled $19.2 million. We believe that our properties are adequate for our business operations as they are currently being conducted.
|
Location
|
Use of Facilities
|
Year Facility Opened or Acquired
|
Owned/Leased
|
|||
|
First Guaranty Square
400 East Thomas Street
Hammond, LA 70401
|
First Guaranty Bank’s Main Office
|
1975
|
Owned
|
|||
|
2111 West Thomas Street
Hammond, LA 70401
|
Guaranty West Banking Center
|
1974
|
Owned
|
|||
|
100 East Oak Street
Amite, LA 70422
|
Amite Banking Center
|
1970
|
Owned
|
|||
|
455 West Railroad Avenue
Independence, LA 70443
|
Independence Banking Center
|
1979
|
Owned
|
|||
|
301 Avenue F
Kentwood, LA 70444
|
Kentwood Banking Center
|
1975
|
Owned
|
|||
|
189 Burt Blvd
Benton, LA 71006
|
Benton Banking Center
|
2010
|
Owned
|
|||
|
126 South Hwy. 1
Oil City, LA 71061
|
Oil City Banking Center
|
1999
|
Owned
|
|||
|
401 North 2nd Street
Homer, LA 71040
|
Homer Main Banking Center
|
1999
|
Owned
|
|||
|
10065 Hwy 79
Haynesville, LA 71038
|
Haynesville Banking Center
|
1999
|
Owned
|
|||
|
117 East Hico Street
Dubach, LA 71235
|
Dubach Banking Center
|
1999
|
Owned
|
|||
|
102 East Louisiana Avenue
Vivian, LA 71082
|
Vivian Banking Center
|
1999
|
Owned
|
|||
|
500 North Cary Ave
Jennings, LA 70546
|
Jennings Banking Center
|
1999
|
Owned
|
|||
|
799 West Summers Drive
Abbeville, LA 70510
|
Abbeville Banking Center
|
1999
|
Owned
|
|||
|
105 Berryland
Ponchatoula, LA 70454
|
Berryland Banking Center
|
2004
|
Leased
|
|||
|
2231 S. Range Avenue
Denham Springs, LA 70726
|
Denham Springs Banking Center
|
2005
|
Owned
|
|||
|
195 North 6th Street
Ponchatoula, LA 70454
|
Ponchatoula Banking Center(1)
|
2007
|
Owned
|
|||
|
29815 Walker Rd S
Walker, LA 70785
|
Walker Banking Center
|
2007
|
Owned
|
|||
|
6151 Hwy 10
Greensburg, LA 70441
|
Greensburg Banking Center | 2011 | Owned | |||
|
723 Avenue G
Kentwood, LA 70444
|
Kentwood West Banking Center | 2011 | Owned | |||
|
35651 Hwy 16
Montpelier, LA 70422
|
Montpelier Banking Center | 2011 | Owned | |||
|
33818 Hwy 16
Denham Springs, LA 70706
|
Watson Banking Center | 2011 | Owned |
(1) We intend to close this branch and open a new banking center on property that we own located on 500 West Pine Street, Ponchatoula, LA 70454, which is expected to occur in the first quarter of 2016.
The Company is subject to various legal proceedings in the normal course of its business. At December 31, 2014, we were not involved in any legal proceedings, the outcome of which would have a material adverse effect on the financial condition or results of operation of the Company.
Not applicable.
Item 5 - Market for Registrant’s Common Equity, Related Shareholder Matters and Issuer Purchases of Equity Securities
Shares of our common stock are quoted on the OTCQB Marketplace operated by the OTC Markets Group, Inc., or OTCQB, under the symbol “FGBI.” Although our shares have been quoted on the OTCQB, the prices at which such transactions occurred may not necessarily reflect the price that would be paid for our common stock in a more active market. As of December 31, 2014, there were approximately 1,440 holders of record of our common stock.
The following table sets forth the quarterly high and low reported sales prices for our common stock for the years ended December 31, 2014 and 2013. These reported sales prices represent trades that were either quoted on the OTCQB or reported to the Company’s stock transfer agent, and do not include retail markups, markdowns or commissions, and do not necessarily reflect actual transactions.
|
2014
|
2013
|
|||||||||||||||||
|
Quarter Ended:
|
High
|
Low
|
Dividend
|
High
|
Low
|
Dividend
|
||||||||||||
|
March 31,
|
$
|
19.60
|
$
|
13.77
|
$
|
0.16
|
$
|
18.75
|
$
|
12.85
|
$
|
0.16
|
||||||
|
June 30,
|
$ | 19.81 | $ |
13.50
|
$ |
0.16
|
$ |
19.60
|
$ |
12.85
|
$ |
0.16
|
||||||
|
September 30,
|
$ |
19.81
|
$ |
12.00
|
$ |
0.16
|
$ |
19.60
|
$ |
12.00
|
$ |
0.16
|
||||||
|
December 31,
|
$ |
20.50
|
$ | 15.50 | $ |
0.16
|
$ |
19.60
|
$ |
12.75
|
$ |
0.16
|
||||||
Our shareholders are entitled to receive dividends when, and if, declared by the Board of Directors, out of funds legally available for dividends. We have paid consecutive quarterly cash dividends on our common stock for each of the last 86 quarters dating back to the third quarter of 1993. The Board of Directors intends to continue to pay regular quarterly cash dividends. The ability to pay dividends in the future will depend on earnings and financial condition, liquidity and capital requirements, regulatory restrictions, the general economic and regulatory climate and ability to service any equity or debt obligations senior to common stock. There are legal restrictions on the ability of First Guaranty Bank to pay cash dividends to First Guaranty Bancshares, Inc. Under federal and state law, we are required to maintain certain surplus and capital levels and may not distribute dividends in cash or in kind, if after such distribution we would fall below such levels. Specifically, an insured depository institution is prohibited from making any capital distribution to its shareholders, including by way of dividend, if after making such distribution, the depository institution fails to meet the required minimum level for any relevant capital measure including the risk-based capital adequacy and leverage standards.
Additionally, under the Louisiana Business Corporation Act, First Guaranty Bancshares, Inc. is prohibited from paying any cash dividends to shareholders if, after the payment of such dividend, its total assets would be less than its total liabilities or where net assets are less than the liquidation value of shares that have a preferential right to participate in First Guaranty Bancshares, Inc.’s assets in the event First Guaranty Bancshares, Inc. were to be liquidated.
23
Stock Performance Graph
The line graph below compares the cumulative total return for the Company’s common stock with the cumulative total return of both the NASDAQ Stock Market Index for U.S. companies and the NASDAQ Index for bank stocks for the period December 31, 2009 through December 31, 2014. The total return assumes the reinvestment of all dividends and is based on a $100 investment on December 31, 2008. It also reflects the stock price on December 31st of each year shown, although this price reflects only a small number of transactions involving a small number of directors of the Company or affiliates or associates and cannot be taken as an accurate indicator of the market value of the Company’s common stock.
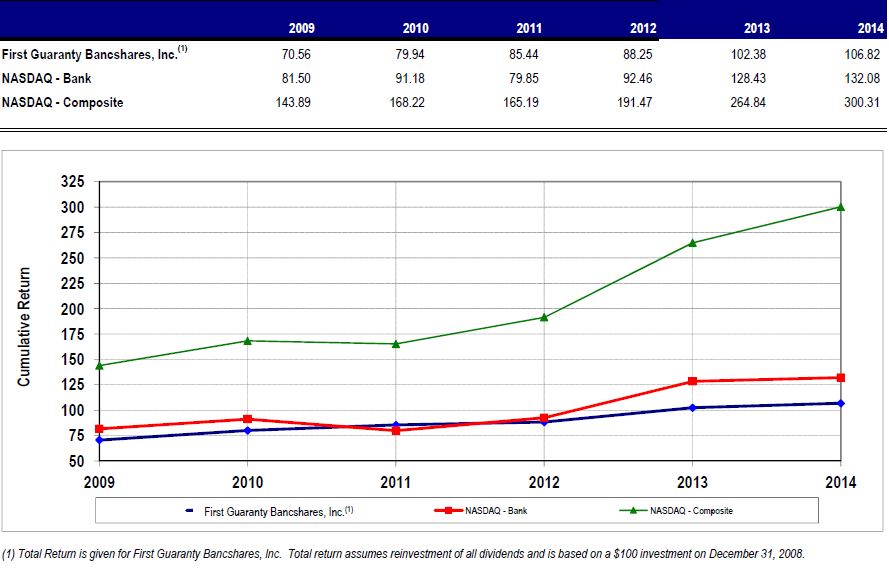
The following selected financial data should be read in conjunction with the financial statements, including the related notes, and “Management’s Discussion and Analysis of Financial Condition and Results of Operations,” which are included elsewhere in this Form 10-K. Except for the data under “Performance Ratios and Other Data,” “Capital Ratios” and “Asset Quality Ratios,” the income statement data and share and per share data for the years ended December 31, 2014, 2013 and 2012 and the balance sheet data as of December 31, 2014 and 2013 are derived from the audited financial statements and related notes which are included elsewhere in this Form 10-K, and the income statement data and share and per share data for the years ended December 31, 2011 and 2010 and the balance sheet data as of December 31, 2012, 2011 and 2010 are derived from the audited financial statements and related notes that are not included in this Form 10-K.
| At or For the Years Ended December 31, | |||||||||||||||
| (in thousands except for %) | 2014 | 2013 | 2012 |
2011
|
2010
|
||||||||||
|
Year End Balance Sheet Data:
|
|||||||||||||||
|
Investment securities
|
$ | 641,603 | $ | 634,504 | $ | 659,243 |
$
|
633,163
|
$
|
481,961
|
|||||
|
Federal funds sold
|
$ | 210 | $ | 665 | $ | 2,891 | $ |
68,630
|
$ |
9,129
|
|||||
|
Loans, net of unearned income
|
$ | 790,321 | $ | 703,166 | $ | 629,500 | $ |
573,100
|
$ |
575,640
|
|||||
|
Allowance for loan losses
|
$ | 9,105 | $ | 10,355 | $ | 10,342 | $ |
8,879
|
$ |
8,317
|
|||||
|
Total assets
|
$ | 1,518,876 | $ | 1,436,441 | $ | 1,407,303 | $ |
1,353,866
|
$ |
1,132,792
|
|||||
|
Total deposits
|
$ | 1,371,839 | $ | 1,303,099 | $ | 1,252,612 | $ |
1,207,302
|
$ |
1,007,383
|
|||||
|
Borrowings
|
$ | 3,255 | $ | 6,288 | $ | 15,846 | $ |
15,423
|
$ |
12,589
|
|||||
|
Shareholders' equity
|
$ | 139,583 | $ | 123,405 | $ | 134,181 | $ |
126,602
|
$ |
97,938
|
|||||
|
Common shareholders' equity
|
$ | 100,148 | $ | 83,970 | $ | 94,746 | $ |
87,167
|
$ |
76,963
|
|||||
|
Performance Ratios and Other Data:
|
|||||||||||||||
|
Return on average assets
|
0.77 | % | 0.65 | % | 0.89 | % |
0.65
|
%
|
0.99
|
%
|
|||||
|
Return on average common equity
|
11.40 | % | 9.31 | % |
10.90
|
% |
7.37
|
%
|
10.92
|
%
|
|||||
|
Return on average tangible assets
|
0.80 | % | 0.68 | % | 0.91 | % | 0.68 | % | 1.01 | % | |||||
|
Return on average tangible common equity
|
12.23 | % | 10.12 | % | 11.84 | % | 8.09 | % | 11.87 | % | |||||
|
Net interest margin
|
3.11 | % | 2.92 | % | 3.20 | % |
3.31
|
%
|
3.61
|
%
|
|||||
|
Average loans to average deposits
|
55.72 | % | 53.58 | % | 49.04 | % |
52.79
|
%
|
68.10
|
%
|
|||||
|
Efficiency ratio
|
62.85 | % | 65.61 | % | 58.56 | % |
56.77
|
%
|
56.20
|
%
|
|||||
|
Efficiency ratio (excluding amortization of intangibles and securities transactions)(1)
|
62.58 | % | 67.17 | % | 63.73 | % |
60.29
|
%
|
59.25
|
%
|
|||||
|
Full time equivalent employees (year end)
|
271 | 278 | 274 |
269
|
246
|
||||||||||
| (Footnotes follow on next page) | |||||||||||||||
| At or For the Years Ended December 31, | |||||||||||||||
| (in thousands except for % and share data) | 2014 | 2013 | 2012 |
2011
|
2010
|
||||||||||
|
Capital Ratios:
|
|||||||||||||||
|
Average shareholders' equity to average assets
|
9.24 | % | 9.28 | % | 9.72 | % |
8.80
|
%
|
9.88
|
%
|
|||||
|
Average tangible equity to average tangible assets
|
9.00 | % | 9.02 | % | 9.43 | % |
8.52
|
%
|
9.48
|
%
|
|||||
|
Common shareholders' equity to total assets
|
6.59
|
% | 5.85 | % |
6.73
|
% |
6.44
|
%
|
6.79
|
%
|
|||||
|
Tier 1 leverage capital consolidated
|
9.33 | % | 9.14 | % | 9.24 | % |
9.03
|
%
|
8.69
|
%
|
|||||
|
Tier 1 capital consolidated
|
13.16 | % | 13.61 | % | 14.13 | % |
13.71
|
%
|
11.98
|
%
|
|||||
|
Total risk-based capital consolidated
|
14.05 | % | 14.71 | % | 15.31 | % |
14.75
|
%
|
13.03
|
%
|
|||||
| Tangible common equity to tangible assets(2) | 6.37 | % | 5.59 | % | 6.45 | % | 6.12 | % | 6.50 | % | |||||
|
Income Data:
|
|||||||||||||||
|
Interest income
|
$ | 53,297 | $ | 50,886 | $ | 55,195 |
$
|
54,609
|
$
|
51,390
|
|||||
|
Interest expense
|
$ | 9,202 | $ | 11,134 | $ | 13,120 | $ |
15,118
|
$ |
13,223
|
|||||
|
Net interest income
|
$ | 44,095 | $ | 39,752 | $ | 42,075 | $ |
39,491
|
$ |
38,167
|
|||||
|
Provision for loan losses
|
$ | 1,962 | $ | 2,520 | $ | 4,134 | $ |
10,187
|
$ |
5,654
|
|||||
|
Noninterest income (excluding securities transactions)
|
$ | 5,882 | $ | 5,907 | $ | 6,272 | $ |
7,839
|
$ |
6,741
|
|||||
|
Securities gains
|
$ | 295 | $ | 1,571 | $ | 4,868 | $ |
3,531
|
$ |
2,824
|
|||||
|
Loss on securities impairment
|
$ | - | $ | - | $ | - | $ |
(97
|
) | $ |
-
|
|
|||
|
Noninterest expense
|
$ | 31,594 | $ | 30,987 | $ | 31,161 | $ |
28,821
|
$ |
26,827
|
|||||
|
Earnings before income taxes
|
$ | 16,716 | $ | 13,723 | $ | 17,920 | $ |
11,756
|
$ |
15,251
|
|||||
|
Net income
|
$ | 11,224 | $ | 9,146 | $ | 12,059 | $ |
8,033
|
$ |
10,025
|
|||||
|
Net income available to common shareholders
|
$ | 10,830 | $ | 8,433 | $ | 10,087 | $ |
6,057
|
$ |
8,692
|
|||||
|
Per Common Share Data:
|
|||||||||||||||
|
Net earnings
|
$ | 1.72 | $ | 1.34 | $ | 1.60 |
$
|
0.98
|
$
|
1.42
|
|||||
|
Cash dividends paid
|
$ | 0.64 | $ | 0.64 | $ | 0.64 | $ |
0.58
|
$ |
0.58
|
|||||
|
Book value
|
$ |
15.92
|
$ | 13.35 | $ | 15.06 | $ |
13.85
|
$ |
12.58
|
|||||
| Tangible book value (3) | $ | 15.34 | $ | 12.72 | $ | 14.38 | $ | 13.12 | $ | 12.01 | |||||
|
Dividend payout ratio
|
37.18 | % | 47.75 | % | 40.00 | % |
59.60
|
%
|
40.94
|
%
|
|||||
|
Weighted average number of shares outstanding
|
6,291,332 | 6,291,332 | 6,292,855 |
6,205,652
|
6,115,608
|
||||||||||
|
Number of shares outstanding
|
6,291,332 | 6,291,332 | 6,291,332 |
6,294,227
|
6,115,608
|
||||||||||
|
Asset Quality Ratios:
|
|||||||||||||||
|
Non-performing assets to total assets
|
0.99 | % | 1.27 | % | 1.67 | % |
2.13
|
%
|
2.73
|
%
|
|||||
|
Non-performing assets to total loans
|
1.90 | % | 2.60 | % | 3.74 | % |
5.04
|
%
|
5.38
|
%
|
|||||
| Non-performing loans to total loans | 1.62 | % | 2.12 | % | 3.36 | % | 4.05 | % | 5.28 | % | |||||
|
Loan loss reserve to non-performing assets
|
60.74 | % | 56.72 | % |
43.94
|
% |
30.73
|
%
|
26.86
|
%
|
|||||
|
Net charge-offs to average loans
|
0.45 | % | 0.38 | % | 0.45 | % |
1.65
|
%
|
0.89
|
%
|
|||||
|
Provision for loan loss to average loans
|
0.27 | % | 0.38 | % | 0.70 | % |
1.75
|
%
|
0.95
|
%
|
|||||
|
Allowance for loan loss to total loans
|
1.15 | % | 1.47 | % | 1.64 | % |
1.55
|
%
|
1.44
|
%
|
|||||
|
(1) Efficiency ratio represents noninterest expense divided by the sum of net interest income and noninterest income. We calculate both a GAAP and a non-GAAP efficiency ratio. The GAAP-based efficiency ratio is noninterest expenses divided by net interest income plus noninterest income. See below for our reconciliation of non-GAAP financial measures to their most directly comparable GAAP financial measures under the caption “Selected Financial Data—Non-GAAP Financial Measures.”
|
|||||||||||||||
|
(2) We calculate tangible common equity as total shareholders’ equity less preferred stock, goodwill and acquisition intangibles, principally core deposit intangibles, net of accumulated amortization, and we calculate tangible assets as total assets less goodwill and core deposit intangibles. Tangible common equity to tangible assets is a non-GAAP financial measure, and, as we calculate tangible common equity to tangible assets, the most directly comparable GAAP financial measure is total shareholders’ equity to total assets. See below for our reconciliation of non-GAAP financial measures to their most directly comparable GAAP financial measures under the caption “Selected Historical Consolidated Financial and Other Data—Non-GAAP Financial Measures.”
|
|||||||||||||||
|
(3) We calculate tangible book value per common share as total shareholders’ equity less preferred stock, goodwill and acquisition intangibles, principally core deposit intangibles, net of accumulated amortization at the end of the relevant period, divided by the outstanding number of shares of our common stock at the end of the relevant period. Tangible book value per common share is a non-GAAP financial measure, and, as we calculate tangible book value per common share, the most directly comparable GAAP financial measure is book value per common share. See below for our reconciliation of non-GAAP financial measures to their most directly comparable GAAP financial measures under the caption “Selected Financial Data—Non-GAAP Financial Measures.”
|
|||||||||||||||
26
Non-GAAP Financial Measures
Our accounting and reporting policies conform to accounting principles generally accepted in the United States, or GAAP, and the prevailing practices in the banking industry. However, we also evaluate our performance based on certain additional metrics. Tangible book value per share and the ratio of tangible equity to tangible assets are not financial measures recognized under GAAP and, therefore, are considered non-GAAP financial measures.
Our management, banking regulators, many financial analysts and other investors use these non-GAAP financial measures to compare the capital adequacy of banking organizations with significant amounts of preferred equity and/or goodwill or other intangible assets, which typically stem from the use of the purchase accounting method of accounting for mergers and acquisitions. Tangible equity, tangible assets, tangible book value per share or related measures should not be considered in isolation or as a substitute for total shareholders’ equity, total assets, book value per share or any other measure calculated in accordance with GAAP. Moreover, the manner in which we calculate tangible equity, tangible assets, tangible book value per share and any other related measures may differ from that of other companies reporting measures with similar names.
The following table reconciles, as of the dates set forth below, shareholders’ equity (on a GAAP basis) to tangible equity and total assets (on a GAAP basis) to tangible assets and calculates our tangible book value per share.
| At December 31, | |||||||||||||||
| (in thousands except for share data) | 2014 | 2013 | 2012 | 2011 | 2010 | ||||||||||
| Tangible Common Equity | |||||||||||||||
| Total shareholders' equity | $ | 139,583 | $ | 123,405 | $ | 134,181 | $ | 126,602 | $ | 97,938 | |||||
| Adjustments: | |||||||||||||||
| Preferred | 39,435 | 39,435 | 39,435 | 39,435 | 20,975 | ||||||||||
| Goodwill | 1,999 | 1,999 | 1,999 | 1,999 | 1,999 | ||||||||||
| Acqusition intangibles | 1,618 | 1,938 | 2,257 | 2,608 | 1,540 | ||||||||||
| Tangible common equity | $ | 96,531 | $ | 80,033 | $ | 90,490 | $ | 82,560 | $ | 73,424 | |||||
| Common shares outstanding | 6,291,332 | 6,291,332 | 6,291,332 | 6,294,227 | 6,115,608 | ||||||||||
| Book value per common share | $ | 15.92 | $ | 13.35 | $ | 15.06 | $ | 13.85 | $ | 12.58 | |||||
| Tangible book value per common share | $ | 15.34 | $ | 12.72 | $ | 14.38 | $ | 13.12 | $ | 12.01 | |||||
| Tangible Assets | |||||||||||||||
| Total Assets | $ | 1,518,876 | $ | 1,436,441 | $ | 1,407,303 | $ | 1,353,866 | $ | 1,132,792 | |||||
| Adjustments: | |||||||||||||||
| Goodwill | 1,999 | 1,999 | 1,999 | 1,999 | 1,999 | ||||||||||
| Acquisition intangibles | 1,618 | 1,938 | 2,257 | 2,608 | 1,540 | ||||||||||
| Tangible Assets | $ | 1,515,259 | $ | 1,432,504 | $ | 1,403,047 | $ | 1,349,259 | $ | 1,129,253 | |||||
| Tangible common equity to tangible assets | 6.37 | % | 5.59 | % | 6.45 | % | 6.12 | % | 6.50 | % | |||||
The efficiency ratio is a non-GAAP measure generally used by financial analysts and investment bankers to evaluate financial institutions. We calculate the efficiency ratio by dividing noninterest expense by the sum of net interest income and noninterest income, excluding amortizations of intangibles and securities transactions. The GAAP-based efficiency ratio is noninterest expenses divided by net interest income plus noninterest income.
The following table reconciles, as of the dates set forth below, our efficiency ratio to the GAAP-based efficiency ratio:
| For the Year Ended December 31, | |||||||||||||||
| (in thousands except for share data) | 2014 | 2013 | 2012 | 2011 | 2010 | ||||||||||
| GAAP-based efficiency ratio | 62.85 | % | 65.61 | % | 58.56 | % | 56.77 | % | 56.20 | % | |||||
| Noninterest expense | $ | 31,594 | $ | 30,987 | $ | 31,161 | $ | 28,821 | $ | 26,827 | |||||
| Amortization of intangibles | 320 | 320 | 350 | 286 | 218 | ||||||||||
| Noninterest expense, excluding amortization | 31,274 | 30,667 | 30,811 | 28,535 | 26,609 | ||||||||||
| Net interest income | 44,095 | 39,752 | 42,075 | 39,491 | 38,167 | ||||||||||
| Noninterest income | 6,177 | 7,478 | 11,140 | 11,273 | 9,565 | ||||||||||
| Adjustments: | |||||||||||||||
| Securities transactions | 295 | 1,571 | 4,868 | 3,434 | 2,824 | ||||||||||
| Noninterest income, excluding securities transactions | $ | 5,882 | $ | 5,907 | $ | 6,272 | $ | 7,839 | $ | 6,741 | |||||
| Efficiency ratio | 62.58 | % | 67.17 | % | 63.73 | % | 60.29 | % | 59.25 | % | |||||
The following discussion and analysis of our financial condition and results of operations should be read in conjunction with Item 6, “Selected Financial Data” and our consolidated financial statements and the accompanying notes included elsewhere in this Annual Report on Form 10-K. This discussion and analysis contains forward-looking statements that are subject to certain risks and uncertainties and are based on certain assumptions that we believe are reasonable but may prove to be inaccurate. Certain risks, uncertainties and other factors, including those set forth under “Forward-Looking Statements,” “Risk Factors” and elsewhere in this Annual Report on Form 10-K, may cause actual results to differ materially from those projected results discussed in the forward-looking statements appearing in this discussion and analysis. We assume no obligation to update any of these forward-looking statements.
Special Note Regarding Forward-Looking Statements
Congress passed the Private Securities Litigation Act of 1995 in an effort to encourage corporations to provide information about a Company's anticipated future financial performance. This act provides a safe harbor for such disclosure, which protects us from unwarranted litigation, if actual results are different from Management expectations. This discussion and analysis contains forward-looking statements and reflects Management’s current views and estimates of future economic circumstances, industry conditions, company performance and financial results. The words “may,” “should,” “expect,” “anticipate,” “intend,” “plan,” “continue,” “believe,” “seek,” “estimate” and similar expressions are intended to identify forward-looking statements. These forward-looking statements are subject to a number of factors and uncertainties, including, changes in general economic conditions, either nationally or in our market areas, that are worse than expected; competition among depository and other financial institutions; inflation and changes in the interest rate environment that reduce our margins or reduce the fair value of financial instruments; adverse changes in the securities markets; changes in laws or government regulations or policies affecting financial institutions, including changes in regulatory fees and capital requirements; our ability to enter new markets successfully and capitalize on growth opportunities; our ability to successfully integrate acquired entities, if any; changes in consumer spending, borrowing and savings habits; changes in accounting policies and practices, as may be adopted by the bank regulatory agencies, the Financial Accounting Standards Board, the Securities and Exchange Commission and the Public Company Accounting Oversight Board; changes in our organization, compensation and benefit plans; changes in our financial condition or results of operations that reduce capital available to pay dividends; and changes in the financial condition or future prospects of issuers of securities that we own, which could cause our actual results and experience to differ from the anticipated results and expectations, expressed in such forward-looking statements.
Overview
First Guaranty Bancshares is a Louisiana corporation and a bank holding company headquartered in Hammond, Louisiana. Our wholly-owned subsidiary, First Guaranty Bank, a Louisiana-chartered commercial bank, provides personalized commercial banking services primarily to Louisiana customers through 21 banking facilities primarily located in the MSAs of Hammond, Baton Rouge, Lafayette and Shreveport-Bossier City. We emphasize personal relationships and localized decision making to ensure that products and services are matched to customer needs. We compete for business principally on the basis of personal service to customers, customer access to officers and directors and competitive interest rates and fees.
Total assets were $1.5 billion at December 31, 2014 and $1.4 billion as of December 31, 2013. Total deposits were $1.4 billion at December 31, 2014 and $1.3 billion at December 31, 2013. Total loans were $790.3 million at December 31, 2014, an increase of $87.1 million, or 12.4%, compared with December 31, 2013. Common shareholders’ equity was $100.1 million and $84.0 million at December 31, 2014 and December 31, 2013, respectively.
Net income was $11.2 million, $9.1 million and $12.1 million for the years ended December 31, 2014, 2013 and 2012, respectively. We generate most of our revenues from interest income on loans, interest income on securities, sales of securities and service charges, commissions and fees. We incur interest expense on deposits and other borrowed funds and noninterest expense such as salaries and employee benefits and occupancy and equipment expenses. Net interest income is the difference between interest income earned on interest-earning assets such as loans and securities and interest expense paid on interest-bearing liabilities such as deposits and borrowings which are used to fund those assets. Net interest income is our largest source of revenue. To evaluate net interest income, we measure and monitor: (1) yields on our loans and other interest-earning assets; (2) the costs of our deposits and other funding sources; (3) our net interest spread and (4) our net interest margin. Net interest spread is the difference between rates earned on interest-earning assets and rates paid on interest-bearing liabilities. Net interest margin is calculated as net interest income divided by average interest-earning assets. Because noninterest-bearing sources of funds, such as noninterest-bearing deposits also fund interest-earning assets, net interest margin includes the benefit of these noninterest-bearing sources.
Changes in market interest rates and interest rates we earn on interest-earning assets or pay on interest-bearing liabilities, as well as the volume and types of interest-earning assets, interest-bearing and noninterest-bearing liabilities are usually the largest drivers of periodic changes in net interest spread, net interest margin and net interest income.
Fluctuations in market interest rates are driven by many factors, including governmental monetary policies, inflation, deflation, macroeconomic developments, changes in unemployment, the money supply, political and international conditions and conditions in domestic and foreign financial markets. Periodic changes in the volume and types of loans in our loan portfolio are affected by, among other factors, economic and competitive conditions in Louisiana and our other out-of-state market areas. During the extended period of historically low interest rates, we continue to evaluate our investments in interest-earning assets in relation to the impact such investments have on our financial condition, results of operations and shareholders’ equity if interest rates were to suddenly increase as they did in the second and third quarters of 2013.
28
Financial highlights for 2014 and 2013:
| ● |
Net income for the years ended December 31, 2014 and 2013 was $11.2 million and $9.1 million, respectively.
|
| ● |
Net income available to common shareholders after preferred stock dividends was $10.8 million and $8.4 million for the years ended December, 31 2014 and 2013, respectively. Dividends on preferred stock decreased $0.3 million to $0.4 million for 2014 when compared to $0.7 million for 2013. This decrease was the result of a lower dividend rate due to the increase in qualified small business loans as a part of the U.S. Treasury’s SBLF program.
|
| ● |
Earnings per common share were $1.72 and $1.34 for the years ended December 31, 2014 and 2013, respectively.
|
| ● |
Net interest income for 2014 was $44.1 million compared to $39.8 million for 2013.
|
| ● |
Total assets at December 31, 2014 increased $82.4 million, or 5.7%, to $1.5 billion when compared to $1.4 billion at December 31, 2013.
|
| ● |
Investment securities totaled $641.6 million at December 31, 2014, an increase of $7.1 million when compared to $634.5 million at December 31, 2013. At December 31, 2014, available for sale securities, at fair value, totaled $499.8 million; an increase of $15.6 million when compared to $484.2 million at December 31, 2013. At December 31, 2014, held to maturity securities, at amortized cost, totaled $141.8 million; a decrease of $8.5 million when compared to $150.3 million at December 31, 2013. Mortgage-backed securities, backed by U.S. Government agencies or enterprises, made up $57.3 million of the $141.8 million of the held to maturity securities at December 31, 2014.
|
| ● |
Average weighted life of investment securities at December 31, 2014 was 5.3 years a decline of 0.4 years when compared to the average life of 5.7 years at December 31, 2013. The Company has continued to reduce the average life of the securities portfolio as a part of its overall interest rate risk management process.
|
| ● |
The net loan portfolio at December 31, 2014 totaled $781.2 million, a net increase of $88.4 million from $692.8 million at December 31, 2013. Net loans are reduced by the allowance for loan losses which totaled $9.1 million at December 31, 2014 and $10.3 million at December 31, 2013. Total loans net of unearned income were $790.3 million at December 31, 2014 compared to $703.2 million at December 31, 2013.
|
| ● |
Total impaired loans decreased $0.4 million to $29.5 million at December 31, 2014 compared to $29.9 million at December 31, 2013.
|
| ● |
Nonaccrual loans decreased $2.3 million to $12.2 million at December 31, 2014 compared to $14.5 million at December 31, 2013.
|
| ● |
Retained earnings increased $6.8 million to $54.3 million at December 31, 2014 when compared to $47.5 million at December 31, 2013.
|
| ● |
Return on average assets for the year end December 31, 2014 and December 31, 2013 was 0.77% and 0.65%, respectively.
|
| ● |
Return on average common equity was 11.40% and 9.31% for 2014 and 2013, respectively.
|
| ● |
Book value per common share was $15.92 as of December 31, 2014 compared to $13.35 as of December 31, 2013. Tangible book value per common share was $15.34 as of December 31, 2014 compared to $12.72 as of December 31, 2013.
|
| ● | The increase in book value was principally due to a change in accumulated other comprehensive income from an unrealized loss on available-for-sale securities of $9.1 million at December 31, 2013 to an unrealized gain on available-for-sale securities of $0.2 million at December 31, 2014. Retained earnings increased $6.8 million to $54.3 million at December 31, 2014. |
| ● |
The Company's Board of Directors declared and the Company paid cash dividends of $0.64 per common share in 2014 and 2013.
|
29
Application of Critical Accounting Policies
Our accounting and reporting policies conform to generally accepted accounting principles in the United States and to predominant accounting practices within the banking industry. Certain critical accounting policies require judgment and estimates which are used in the preparation of the financial statements.
Allowance for Loan Losses. The allowance for loan losses is established through a provision for loan losses charged to expense. Loans are charged against the allowance for loan losses when management believes that the collectability of the principal is unlikely. The allowance, which is based on evaluation of the collectability of loans and prior loan loss experience, is an amount that, in the opinion of management, reflects the risks inherent in the existing loan portfolio and exists at the reporting date. The evaluations take into consideration a number of subjective factors including changes in the nature and volume of the loan portfolio, overall portfolio quality, review of specific problem loans, current economic conditions that may affect a borrower’s ability to pay, adequacy of loan collateral and other relevant factors. In addition, regulatory agencies, as an integral part of their examination process, periodically review the estimated losses on loans. Such agencies may require additional recognition of losses based on their judgments about information available to them at the time of their examination.
The following are general credit risk factors that affect our loan portfolio segments. These factors do not encompass all risks associated with each loan category. Construction and land development loans have risks associated with interim construction prior to permanent financing and repayment risks due to the future sale of developed property. Farmland and agricultural loans have risks such as weather, government agricultural policies, fuel and fertilizer costs, and market price volatility. One- to four-family residential, multi-family, and consumer credits are strongly influenced by employment levels, consumer debt loads and the general economy. Non-farm non-residential loans include both owner-occupied real estate and non-owner occupied real estate. Common risks associated with these properties is the ability to maintain tenant leases and keep lease income at a level able to service required debt and operating expenses. Commercial and industrial loans generally have non-real estate secured collateral which requires closer monitoring than real estate collateral.
Although management uses available information to recognize losses on loans, because of uncertainties associated with local economic conditions, collateral values and future cash flows on impaired loans, it is reasonably possible that a material change could occur in the allowance for loan losses in the near term. However, the amount of the change that is reasonably possible cannot be estimated. The evaluation of the adequacy of loan collateral is often based upon estimates and appraisals. Because of changing economic conditions, the valuations determined from such estimates and appraisals may also change. Accordingly, we may ultimately incur losses that vary from management’s current estimates. Adjustments to the allowance for loan losses will be reported in the period such adjustments become known or can be reasonably estimated. All loan losses are charged to the allowance for loan losses when the loss actually occurs or when the collectability of the principal is unlikely. Recoveries are credited to the allowance at the time of recovery.
The allowance consists of specific, general, and unallocated components. The specific component relates to loans that are classified as doubtful, substandard, and impaired. For such loans that are also classified as impaired, an allowance is established when the discounted cash flows (or collateral value or observable market price) of the impaired loan is lower than the carrying value of that loan. Also, a specific reserve is allocated for our syndicated loans. The general component covers non-classified loans and special mention loans and is based on historical loss experience adjusted for qualitative factors. An unallocated component is maintained to cover uncertainties that could affect the estimate of probable losses.
The allowance for loan losses is reviewed on a monthly basis. The monitoring of credit risk also extends to unfunded credit commitments, such as unused commercial credit lines and letters of credit. A reserve is established as needed for estimates of probable losses on such commitments.
Other-Than-Temporary Impairment of Investment Securities. Securities are evaluated periodically to determine whether a decline in their value is other-than-temporary. The term “other-than-temporary” is not intended to indicate a permanent decline in value. Rather, it means that the prospects for near-term recovery of value are not necessarily favorable, or that there is a lack of evidence to support fair values equal to, or greater than, the carrying value of the investment. Management reviews criteria such as the magnitude and duration of the decline, the reasons for the decline, and the performance and valuation of the underlying collateral, when applicable, to predict whether the loss in value is other-than-temporary. Once a decline in value is determined to be other-than-temporary, the carrying value of the security is reduced to its fair value and a corresponding charge to earnings is recognized.
Valuation of Goodwill, Intangible Assets and Other Purchase Accounting Adjustments. Intangible assets are comprised of goodwill, core deposit intangibles and mortgage servicing rights. Goodwill and intangible assets deemed to have indefinite lives are no longer amortized, but are subject to annual impairment tests. Our goodwill is tested for impairment on an annual basis, or more often if events or circumstances indicate impairment may exist. Adverse changes in the economic environment, declining operations, or other factors could result in a decline in the implied fair value of goodwill. If the implied fair value is less than the carrying amount, a loss would be recognized in other noninterest expense to reduce the carrying amount to implied fair value of goodwill. Our goodwill impairment test includes two steps that are preceded by a “step zero” qualitative test. The qualitative test allows management to assess whether qualitative factors indicate that it is more likely than not that impairment exists. If it is not more likely than not that impairment exists, then the two step quantitative test would not be necessary. These qualitative indicators include factors such as earnings, share price, market conditions, etc. If the qualitative factors indicate that it is more likely than not that impairment exists, then the two step quantitative test would be necessary. Step one is used to identify potential impairment and compares the estimated fair value of a reporting unit with its carrying amount, including goodwill. If the estimated fair value of a reporting unit exceeds its carrying amount, goodwill of the reporting unit is considered not impaired. If the carrying amount of a reporting unit exceeds its estimated fair value, the second step of the goodwill impairment test is performed to measure the amount of impairment loss, if any. Step two of the goodwill impairment test compares the implied estimated fair value of reporting unit goodwill with the carrying amount of that goodwill. If the carrying amount of goodwill for that reporting unit exceeds the implied fair value of that unit’s goodwill, an impairment loss is recognized in an amount equal to the excess.
Identifiable intangible assets are acquired assets that lack physical substance but can be distinguished from goodwill because of contractual or legal rights or because the assets are capable of being sold or exchanged either on their own or in combination with related contract, asset or liability. Our intangible assets primarily relate to core deposits. Management periodically evaluates whether events or circumstances have occurred that would result in impairment of value.
30
Financial Condition
Assets.
Our total assets were $1.5 billion at December 31, 2014, an increase of 5.7% from total assets of $1.4 billion at December 31, 2013, primarily due to growth of $87.1 million in our loan portfolio and $7.1 million in our investment securities portfolio, partially offset by a decrease of $16.9 million in our cash and cash equivalents.
Loans.
Net loans increased $88.4 million, or 12.8%, to $781.2 million at December 31, 2014 from $692.8 million at December 31, 2013. Net loans increased during 2014 primarily due to a $45.2 million increase in commercial and industrial loans, a $22.1 million increase in consumer and other loans, a $14.4 million increase in one- to four-family residential loans, a $4.5 million increase in agricultural loans and a $3.7 million increase in farmland loans. Commercial and industrial loans increased primarily due to an increase in syndicated loans (loans made by a group of lenders, including us, who share or participate in a specific loan) as a result of the origination of eleven new syndicated loans with a net increase of $37.8 million during the year ended December 31, 2014 and due to the increase in our small business lending as a result of our participation in the SBLF. The increase in our agricultural loans and farmland loans was primarily the result of the increase in the disbursement of our agricultural and farmland loan commitments due to the seasonality of farming operations during the year ended December 31, 2014. The increase in farmland loans was also due to the origination of timberland loans during the year ended December 31, 2014. The increase in consumer and other loans was principally due to the purchase of $22.5 million in commercial leases that the Bank services. One- to four-family residential loans increased due to an increase in our loan originations and the decision to retain one-to-four family residential loans in our portfolio rather than sell them in the secondary market. There are no significant concentrations of credit to any individual borrower.
As of December 31, 2014, 66.5% of our loan portfolio was secured primarily or secondarily by real estate. The largest portion of our loan portfolio, at 41.5% at December 31, 2014, was non-farm non-residential loans secured by real estate. Approximately 43.6% of the loan portfolio is based on a floating rate tied to the prime rate or London InterBank Offered Rate, or LIBOR, at December 31, 2014. Approximately 80.8% of the loan portfolio is scheduled to mature within 5 years from December 31, 2014.
Loan Portfolio Composition. The tables below sets forth the balance of loans, excluding loans held for sale, outstanding by loan type as of the dates presented, and the percentage of each loan type to total loans.
| At December 31, | |||||||||||||||||||||||||
| 2014 | 2013 | 2012 | 2011 | 2010 | |||||||||||||||||||||
| (in thousands except for %) | Amount |
Percent
|
Amount | Percent |
Amount
|
Percent
|
Amount
|
Percent
|
Amount | Percent | |||||||||||||||
|
Real Estate:
|
|||||||||||||||||||||||||
|
Construction & land development
|
$ | 52,094 | 6.6 | % | $ | 47,550 | 6.7 | % |
$
|
44,856
|
7.1
|
%
|
$
|
78,614
|
13.7
|
%
|
$ | 65,570 | 11.4 | % | |||||
|
Farmland
|
13,539 | 1.7 | % | 9,826 | 1.4 | % |
11,182
|
1.8
|
%
|
11,577
|
2.0
|
%
|
13,337 | 2.3 | % | ||||||||||
|
1- 4 Family
|
118,181 | 14.9 | % | 103,764 | 14.7 | % |
87,473
|
13.8
|
%
|
89,202
|
15.6
|
%
|
73,158 | 12.7 | % | ||||||||||
|
Multifamily
|
14,323 | 1.8 | % | 13,771 | 2.0 | % |
14,855
|
2.4
|
%
|
16,914
|
2.9
|
%
|
14,544 | 2.5 | % | ||||||||||
|
Non-farm non-residential
|
328,400 | 41.5 | % | 336,071 | 47.7 | % |
312,716
|
49.6
|
%
|
268,618
|
46.8
|
%
|
292,809 | 50.8 | % | ||||||||||
|
Total Real Estate
|
526,537 | 66.5 | % | 510,982 | 72.5 | % |
471,082
|
74.7
|
%
|
464,925
|
81.0
|
%
|
459,418 | 79.7 | % | ||||||||||
| Non-real Estate: | |||||||||||||||||||||||||
|
Agricultural
|
26,278 | 3.3 | % | 21,749 | 3.1 | % |
18,476
|
2.9
|
%
|
17,338
|
3.0
|
%
|
17,361 | 3.0 | % | ||||||||||
|
Commercial and industrial
|
196,339 | 24.8 | % | 151,087 | 21.4 | % |
117,425
|
18.6
|
%
|
68,025
|
11.9
|
%
|
76,590 | 13.3 | % | ||||||||||
|
Consumer and other
|
42,991 | 5.4 | % | 20,917 | 3.0 | % |
23,758
|
3.8
|
%
|
23,455
|
4.1
|
%
|
22,970 | 4.0 | % | ||||||||||
| Total Non-real Estate | 265,608 | 33.5 | % | 193,753 | 27.5 | % | 159,659 | 25.3 | % | 108,818 | 19.0 | % | 116,921 | 20.3 | % | ||||||||||
|
Total loans before unearned income
|
792,145 | 100.0 | % | 704,735 | 100.0 | % |
630,741
|
100.0
|
%
|
573,743
|
100.0
|
%
|
576,339 | 100.0 | % | ||||||||||
|
Less: Unearned income
|
(1,824 | ) | (1,569 | ) |
(1,241
|
)
|
(643
|
)
|
(699 | ) | |||||||||||||||
|
Total loans net of unearned income
|
$ | 790,321 | $ | 703,166 |
$
|
629,500
|
$
|
573,100
|
$ | 575,640 | |||||||||||||||
31
Loan Portfolio Maturities. The following table summarizes the scheduled repayments of our loan portfolio at December 31, 2014 and 2013. Demand loans, loans having no stated repayment schedule or maturity, and overdraft loans are reported as being due in one year or less. Maturities are based on the final contractual payment date and do not reflect the effect of prepayments and scheduled principal amortization.
| December 31, 2014 | ||||||||||||
|
(in thousands)
|
One Year or Less | More Than One Year Through Five Years | After Five Years | Total | ||||||||
|
Real Estate:
|
||||||||||||
|
Construction & land development
|
$
|
19,747
|
$ | 30,376 | $ | 1,971 | $ | 52,094 | ||||
|
Farmland
|
1,084
|
9,135 | 3,320 | 13,539 | ||||||||
|
1 - 4 family
|
20,869
|
32,048 | 65,264 | 118,181 | ||||||||
|
Multifamily
|
5,437
|
7,686 | 1,200 | 14,323 | ||||||||
|
Non-farm non-residential
|
69,575
|
222,648 | 36,177 | 328,400 | ||||||||
|
Total Real Estate
|
116,712
|
301,893 | 107,932 | 526,537 | ||||||||
| Non-real Estate: | ||||||||||||
|
Agricultural
|
12,190
|
3,214 | 10,874 | 26,278 | ||||||||
|
Commercial and industrial
|
32,140
|
147,005 | 17,194 | 196,339 | ||||||||
|
Consumer and other
|
6,642
|
30,660 | 5,689 | 42,991 | ||||||||
| Total Non-Real Estate | 50,972 | 180,879 | 33,757 | 265,608 | ||||||||
|
Total loans before unearned income
|
$
|
167,684
|
$ | 482,772 | $ |
141,689
|
792,145 | |||||
| Less: unearned income | (1,824 | ) | ||||||||||
| Total loans net of unearned income | $ | 790,321 | ||||||||||
|
|
December 31, 2013 | |||||||||||
|
(in thousands)
|
One Year or Less | More Than One Year Through Five Years | After Five Years | Total | ||||||||
|
Real Estate:
|
||||||||||||
|
Construction & land development
|
$
|
20,697
|
$ | 24,718 | $ | 2,135 | $ | 47,550 | ||||
|
Farmland
|
2,533
|
4,335 | 2,958 | 9,826 | ||||||||
|
1 - 4 family
|
12,931
|
43,526 | 47,307 | 103,764 | ||||||||
|
Multifamily
|
2,632
|
9,908 | 1,231 | 13,771 | ||||||||
|
Non-farm non-residential
|
40,205
|
248,011 | 47,855 | 336,071 | ||||||||
|
Total Real Estate
|
78,998
|
330,498 | 101,486 | 510,982 | ||||||||
| Non-real Estate: | ||||||||||||
|
Agricultural
|
7,903
|
3,688 | 10,158 | 21,749 | ||||||||
|
Commercial and industrial
|
47,795
|
90,985 | 12,307 | 151,087 | ||||||||
|
Consumer and other
|
6,627
|
7,383 | 6,907 | 20,917 | ||||||||
| Total Non-Real Estate | 62,325 | 102,056 | 29,372 | 193,753 | ||||||||
|
Total loans before unearned income
|
$
|
141,323
|
$ | 432,554 | $ |
130,858
|
704,735 | |||||
| Less: unearned income | (1,569 | ) | ||||||||||
| Total loans net of unearned income | $ | 703,166 | ||||||||||
The following table summarizes fixed and floating rate loans by contractual maturity, excluding nonaccrual loans, as of December 31, 2014 and December 31, 2013 unadjusted for scheduled principal amortization, prepayments, or repricing opportunities. The average life of the loan portfolio may be substantially less than the contractual terms when these adjustments are considered.
|
December 31, 2014
|
December 31, 2013 | |||||||||||||||||
| (in thousands) |
Fixed
|
Floating
|
Total
|
Fixed | Floating | Total | ||||||||||||
|
One year or less
|
$
|
88,686
|
$
|
72,250
|
$
|
160,936
|
$ | 60,642 | $ | 70,602 | $ | 131,244 | ||||||
|
One to five years
|
253,306
|
225,655
|
478,961
|
229,657 | 200,420 | 430,077 | ||||||||||||
|
Five to 15 years
|
67,012
|
39,634
|
106,646
|
71,655 | 26,076 | 97,731 | ||||||||||||
|
Over 15 years
|
25,304
|
8,104
|
33,408
|
8,503 | 22,695 | 31,198 | ||||||||||||
|
Subtotal
|
$
|
434,308
|
$ |
345,643
|
779,951
|
$ | 370,457 | $ | 319,793 | 690,250 | ||||||||
|
Nonaccrual loans
|
12,194
|
14,485 | ||||||||||||||||
|
Total loans before unearned income
|
792,145
|
704,735 | ||||||||||||||||
|
Less: Unearned income
|
(1,824
|
)
|
(1,569 | ) | ||||||||||||||
|
Total loans net of unearned income
|
$
|
790,321
|
$ | 703,166 | ||||||||||||||
As of December 31, 2014, $195.7 million of floating rate loans were at their interest rate floor. At December 31, 2013, $209.5 million of floating rate loans were at the floor rate. Nonaccrual loans have been excluded from these totals.
32
Non-performing Assets.
Non-performing assets consist of non-performing loans and other real-estate owned. Non-performing loans (including nonaccruing troubled debt restructurings described below) are those on which the accrual of interest has stopped or loans which are contractually 90 days past due on which interest continues to accrue. Loans are ordinarily placed on nonaccrual status when principal and interest is delinquent for 90 days or more. However, management may elect to continue the accrual when the estimated net available value of collateral is sufficient to cover the principal balance and accrued interest. It is our policy to discontinue the accrual of interest income on any loan for which we have reasonable doubt as to the payment of interest or principal. When a loan is placed on nonaccrual status, unpaid interest credited to income is reversed. Nonaccrual loans are returned to accrual status when the financial position of the borrower indicates there is no longer any reasonable doubt as to the payment of principal or interest. Other real estate owned consists of property acquired through formal foreclosure, in-substance foreclosure or by deed in lieu of foreclosure.
The following table shows the principal amounts and categories of our non-performing assets at December 31, 2014, 2013, 2012, 2011 and 2010.
| December 31, | |||||||||||||||
|
(in thousands)
|
2014 | 2013 |
2012
|
2011 | 2010 | ||||||||||
|
Nonaccrual loans:
|
|||||||||||||||
|
Real Estate:
|
|||||||||||||||
|
Construction and land development
|
$ | 486 |
$
|
73
|
$
|
854
|
$ | 1,520 | $ | 3,383 | |||||
|
Farmland
|
153 |
130
|
312
|
562 | - | ||||||||||
|
1 - 4 family residential
|
3,819 |
4,248
|
4,603
|
5,647 | 1,480 | ||||||||||
|
Multifamily
|
- |
-
|
-
|
- | 1,357 | ||||||||||
|
Non-farm non-residential
|
4,993 |
7,539
|
11,571
|
12,400 | 21,944 | ||||||||||
| Total Real Estate | 9,451 | 11,990 | 17,340 | 20,129 | 28,164 | ||||||||||
|
Non-Real Estate:
|
|||||||||||||||
|
Agricultural
|
832 |
526
|
512
|
315 | 446 | ||||||||||
|
Commercial and industrial
|
1,907 |
1,946
|
2,831
|
1,986 | 76 | ||||||||||
|
Consumer and other
|
4 |
23
|
5
|
20 | 32 | ||||||||||
| Total Non-Real Estate | 2,743 | 2,495 | 3,348 | 2,321 | 554 | ||||||||||
|
Total nonaccrual loans
|
12,194 |
14,485
|
20,688
|
22,450 | 28,718 | ||||||||||
|
Loans 90 days and greater delinquent & still accruing:
|
|||||||||||||||
|
Real Estate:
|
|||||||||||||||
|
Construction and land development
|
- |
-
|
-
|
- | - | ||||||||||
|
Farmland
|
- |
-
|
-
|
- | - | ||||||||||
|
1 - 4 family residential
|
599 |
414
|
455
|
309 | 1,663 | ||||||||||
|
Multifamily
|
- |
-
|
-
|
- | - | ||||||||||
|
Non-farm non-residential
|
- |
-
|
-
|
419 | - | ||||||||||
| Total Real Estate | 599 | 414 | 455 | 728 | 1,663 | ||||||||||
|
Non-Real Estate:
|
|||||||||||||||
|
Agricultural
|
- |
-
|
-
|
- | - | ||||||||||
|
Commercial and industrial
|
- |
-
|
-
|
- | - | ||||||||||
|
Consumer and other
|
- |
-
|
-
|
8 | 10 | ||||||||||
| Total Non-Real Estate | - | - | - | 8 | 10 | ||||||||||
|
Total loans 90 days and greater delinquent & still accruing
|
599 |
414
|
455
|
736 | 1,673 | ||||||||||
|
Total non-performing loans
|
$ | 12,793 | $ |
14,899
|
$ |
21,143
|
$ | 23,186 | $ | 30,391 | |||||
|
Other real estate owned and foreclosed assets:
|
|||||||||||||||
| Real Estate: | |||||||||||||||
|
Construction and land development
|
127 |
754
|
1,083
|
1,161 | 231 | ||||||||||
| Farmland | - | - | - | - | - | ||||||||||
|
1 - 4 family residential
|
1,121 |
1,803
|
1,186
|
1,342 | 232 | ||||||||||
| Multifamily | - | - | - | - | - | ||||||||||
|
Non-farm non-residential
|
950 |
800
|
125
|
3,206 | 114 | ||||||||||
| Total Real Estate | 2,198 | 3,357 | 2,394 | 5,709 | 577 | ||||||||||
| Non-Real Estate: | |||||||||||||||
| Agricultural | - | - | - | - | - | ||||||||||
| Commercial and industrial | - | - | - | - | - | ||||||||||
| Consumer and other | - | - | - | - | - | ||||||||||
| Total Non-Real estate | - | - | - | - | - | ||||||||||
| Total other real estate owned and foreclosed assets | 2,198 | 3,357 | 2,394 | 5,709 | 577 | ||||||||||
|
Total non-performing assets
|
$ | 14,991 |
$
|
18,256
|
$
|
23,537
|
$ | 28,895 | $ | 30,968 | |||||
| Non-performing assets to total loans | 1.90 | % | 2.60 | % | 3.74 | % | 5.04 | % | 5.38 | % | |||||
| Non-performing assets to total assets | 0.99 | % | 1.27 | % | 1.67 | % | 2.13 | % | 2.73 | % | |||||
| Non-performing loans to total loans | 1.62 | % | 2.12 | % | 3.36 | % | 4.05 | % | 5.28 | % | |||||
33
For the years ended December 31, 2014 and 2013, gross interest income which would have been recorded had the non-performing loans been current in accordance with their original terms amounted to $0.9 million and $1.0 million, respectively. We recognized $0.4 million and $0.2 million of interest income on such loans during the year ended December 31, 2014 and the year ended December 31, 2013, respectively. For the year ended December 31, 2014 and for the year ended December 31, 2013, gross interest income which would have been recorded had the troubled debt restructured loans been current in accordance with their original terms amounted to $0.2 million and $0.3 million, respectively. We recognized $0.1 million and $0.2 million of interest income on such loans during the year ended December 31, 2014 and the year ended December 31, 2013, respectively.
Non-performing assets were $15.0 million, or 0.99%, of total assets at December 31, 2014, compared to $18.3 million, or 1.27%, of total assets at December 31, 2013, which represented a decrease in non-performing assets of $3.3 million. The decrease in non-performing assets occurred primarily as a result of a decrease in non-accrual loans from $14.5 million at December 31, 2013 to $12.2 million at December 31, 2014, which was attributable mainly to foreclosures, charge-offs and some payoffs of non-accrual loans.
At December 31, 2014, our largest non-performing assets were comprised of the following nonaccrual loans: (1) a commercial real estate loan with a balance of $2.9 million secured by a hotel in Louisiana; (2) a commercial and industrial loan with a balance of $1.7 million secured by equipment, which has a USDA government guarantee for $1.7 million; and (3) a commercial real estate loan with a balance of $0.9 million secured by two non-owner occupied commercial properties.
Troubled Debt Restructuring. Another category of assets which contribute to our credit risk is troubled debt restructurings (“TDRs”). A TDR is a loan for which a concession has been granted to the borrower due to a deterioration of the borrower’s financial condition. Such concessions may include reduction in interest rates, deferral of interest or principal payments, principal forgiveness and other actions intended to minimize the economic loss and to avoid foreclosure or repossession of the collateral. We strive to identify borrowers in financial difficulty early and work with them to modify to more affordable terms before such loan reaches nonaccrual status. In evaluating whether to restructure a loan, management analyzes the long-term financial condition of the borrower, including guarantor and collateral support, to determine whether the proposed concessions will increase the likelihood of repayment of principal and interest. TDRs that are not performing in accordance with their restructured terms and are either contractually 90 days past due or placed on nonaccrual status are reported as non-performing loans. Our policy provides that nonaccrual TDRs are returned to accrual status after a period of satisfactory and reasonable future payment performance under the terms of the restructuring. Satisfactory payment performance is generally no less than six consecutive months of timely payments and demonstrated ability to continue to repay.
The following is a summary of loans restructured as TDRs at December 31, 2014, 2013 and 2012:
| At December 31, | |||||||||
| (in thousands) | 2014 |
2013
|
2012 | ||||||
| TDRs: | |||||||||
| In Compliance with Modified Terms |
$
|
2,998
|
$
|
3,006
|
$ | 14,656 | |||
| Past Due 30 through 89 days and still accruing | 2,204 | - | - | ||||||
| Past Due 90 days and greater and still accruing | - | - | - | ||||||
| Nonaccrual | - | - | 221 | ||||||
| Restructured Loans that subsequently defaulted | 230 | 230 | 1,753 | ||||||
| Total TDR | $ | 5,432 | $ | 3,236 | $ | 16,630 | |||
At December 31, 2014, the outstanding balance of our troubled debt restructuring, was $5.4 million as compared to $3.2 million at December 31, 2013. At December 31, 2014, we had three credit relationships that were restructured: (1) a $3.0 million non-farm non-residential loan secured by commercial real estate; (2) a $2.2 million relationship with four loans, three loans totaling $1.8 million secured by one-to-four family residential and one loan totaling $0.5 million secured by non-farm non-residential real estate; and (3) a $0.2 million non-farm non-residential loan secured primarily by commercial real estate. Relationship number two was a new troubled debt restructuring in 2014. The other two relationships were from prior years. The restructuring of these loans were related to interest rate or amortization concessions.
Classified Assets. Federal regulations provide for the classification of loans and other assets, such as debt and equity securities considered by the FDIC to be of lesser quality, as “substandard,” “doubtful” or “loss.” An asset is considered “substandard” if it is inadequately protected by the current net worth and paying capacity of the obligor or of the collateral pledged, if any. “Substandard” assets include those characterized by the “distinct possibility” that the insured institution will sustain “some loss” if the deficiencies are not corrected. Assets classified as “doubtful” have all of the weaknesses inherent in those classified as “substandard,” with the added characteristic that the weaknesses present make “collection or liquidation in full,” on the basis of currently existing facts, conditions, and values, “highly questionable and improbable.” Assets classified as “loss” are those considered “uncollectible” and of such little value that their continuance as assets without the establishment of a specific allowance for loan losses is not warranted. Assets that do not currently expose the insured institution to sufficient risk to warrant classification in one of the aforementioned categories but possess weaknesses are designated as “special mention” by our management.
When an insured institution classifies problem assets as either substandard or doubtful, it may establish general allowances in an amount deemed prudent by management to cover losses that were both probable and reasonable to estimate. General allowances represent allowances which have been established to cover accrued losses associated with lending activities that were both probable and reasonable to estimate, but which, unlike specific allowances, have not been allocated to particular problem assets. When an insured institution classifies problem assets as “loss,” it is required either to establish a specific allowance for losses equal to 100% of that portion of the asset so classified or to charge-off such amount. An institution’s determination as to the classification of its assets and the amount of its valuation allowances is subject to review by the regulatory authorities, which may require the establishment of additional general or specific allowances.
In connection with the filing of our periodic regulatory reports and in accordance with our classification of assets policy, we continuously assess the quality of our loan portfolio and we regularly review the problem loans in our loan portfolio to determine whether any loans require classification in accordance with applicable regulations. Loans are listed on the “watch list” initially because of emerging financial weaknesses even though the loan is currently performing as agreed, or delinquency status, or if the loan possesses weaknesses although currently performing. Management reviews the status of our loan portfolio delinquencies, by product types, with the full board of directors on a monthly basis. Individual classified loan relationships are discussed as warranted. If a loan deteriorates in asset quality, the classification is changed to “special mention,” “substandard,” “doubtful” or “loss” depending on the circumstances and the evaluation. Generally, loans 90 days or more past due are placed on nonaccrual status and classified “substandard.”
34
We also employ a risk grading system for our loans to help assure that we are not taking unnecessary and/or unmanageable risk. The primary objective of the loan risk grading system is to establish a method of assessing credit risk to further enable management to measure loan portfolio quality and the adequacy of the allowance for loan losses. Further, we contract with an external loan review firm to complete a credit risk assessment of the loan portfolio on a regular basis to help determine the current level and direction of our credit risk. The external loan review firm communicates the results of their findings to the Bank’s audit committee. Any material issues discovered in an external loan review are also communicated to us immediately.
The following table sets forth our amounts of classified loans and loans designated as special mention at December 31, 2014, 2013 and 2012. Classified assets totaled $40.4 million at December 31, 2014, and included $12.8 million of non-performing loans.
| At December 31, | |||||||||
| (in thousands) | 2014 | 2013 | 2012 | ||||||
| Classification of Loans: | |||||||||
| Substandard | $ | 43,865 | $ | 39,856 | $ | 58,781 | |||
| Doubtful | - | - | - | ||||||
| Total Classified Assets | $ | 43,865 | $ | 39,856 | $ | 58,781 | |||
| Special Mention | $ | 28,702 | $ | 21,327 | $ | 28,172 | |||
The increase in classified assets at December 31, 2014 as compared to December 31, 2013 was due to a $4.0 million increase in substandard loans. Substandard loans at December 31, 2014 consisted of $21.2 million in non-farm non-residential, $8.4 million in one- to four-family residential, $5.1 million in construction and land development, $4.3 million in multi-family and the remaining $4.9 million comprised of farm land, commercial and industrial and consumer and other loans.
Allowance for Loan Losses
The allowance for loan losses is maintained to absorb potential losses in the loan portfolio. The allowance is increased by the provision for loan losses offset by recoveries of previously charged-off loans and is decreased by loan charge-offs. The provision is a charge to current expense to provide for current loan losses and to maintain the allowance commensurate with management’s evaluation of the risks inherent in the loan portfolio. Various factors are taken into consideration when determining the amount of the provision and the adequacy of the allowance. These factors include but are not limited to:
|
●
|
past due and non-performing assets;
|
|
●
|
specific internal analysis of loans requiring special attention;
|
|
●
|
the current level of regulatory classified and criticized assets and the associated risk factors with each;
|
|
●
|
changes in underwriting standards or lending procedures and policies;
|
|
●
|
charge-off and recovery practices;
|
|
●
|
national and local economic and business conditions;
|
|
●
|
nature and volume of loans;
|
|
●
|
overall portfolio quality;
|
|
●
|
adequacy of loan collateral;
|
|
●
|
quality of loan review system and degree of oversight by our board of directors;
|
|
●
|
competition and legal and regulatory requirements on borrowers;
|
|
●
|
examinations of the loan portfolio by federal and state regulatory agencies and examinations; and
|
|
●
|
review by our internal loan review department and independent accountants.
|
The data collected from all sources in determining the adequacy of the allowance is evaluated on a regular basis by management with regard to current national and local economic trends, prior loss history, underlying collateral values, credit concentrations and industry risks. An estimate of potential loss on specific loans is developed in conjunction with an overall risk evaluation of the total loan portfolio. This evaluation is inherently subjective as it requires estimates that are susceptible to significant revision as new information becomes available.
The allowance consists of specific, general, and unallocated components. The specific component relates to loans that are classified as doubtful, substandard, and impaired. For such loans that are also classified as impaired, an allowance is established when the discounted cash flows (or collateral value or observable market price) of the impaired loan is lower than the carrying value of that loan. Also, a specific reserve is allocated for our syndicated loans, including shared national credits. The general component covers non-classified loans and special mention loans and is based on historical loss experience for the past three years adjusted for qualitative factors described above. An unallocated component is maintained to cover uncertainties that could affect the estimate of probable losses.
The allowance for losses was $9.1 million at December 31, 2014 compared to $10.4 million at December 31, 2013.
35
The balance in the allowance for loan losses is principally influenced by the provision for loan losses and by net loan loss experience. Additions to the allowance are charged to the provision for loan losses. Losses are charged to the allowance as incurred and recoveries on losses previously charged to the allowance are credited to the allowance at the time recovery is collected. The table below reflects the activity in the allowance for loan losses for the years indicated.
| At or For the Years Ended December 31, | |||||||||||||||
|
(in thousands)
|
2014 | 2013 | 2012 |
2011
|
2010
|
||||||||||
|
Balance at beginning of year
|
$ | 10,355 | $ | 10,342 | $ | 8,879 |
$
|
8,317
|
$
|
7,919
|
|||||
|
Charge-offs:
|
|||||||||||||||
|
Real Estate:
|
|||||||||||||||
|
Construction and land development
|
(1,032 | ) | (233 | ) | (65 | ) |
(1,093
|
)
|
(5
|
)
|
|||||
|
Farmland
|
- | (31 | ) | - |
(144
|
) |
-
|
|
|||||||
|
1 - 4 family residential
|
(589 | ) | (220 | ) | (1,409 | ) |
(1,613
|
)
|
(1,534
|
)
|
|||||
|
Multifamily
|
- | - | (187 | ) |
-
|
-
|
|||||||||
|
Non-farm non-residential
|
(1,515 | ) | (1,148 | ) | (459 | ) |
(5,193
|
)
|
(235
|
)
|
|||||
| Total Real Estate | (3,136 | ) | (1,632 | ) | (2,120 | ) | (8,043 | ) | (1,774 | ) | |||||
| Non-Real Estate: | |||||||||||||||
| Agricultural | (2 | ) | (41 | ) | (49 | ) | (23 | ) | - | ||||||
|
Commercial and industrial loans
|
(266 | ) | (1,098 | ) | (809 | ) |
(1,638
|
)
|
(3,395
|
)
|
|||||
|
Consumer and other
|
(289 | ) | (262 | ) | (473 | ) |
(653
|
)
|
(444
|
)
|
|||||
| Total Non-Real Estate | (557 | ) | (1,401 | ) | (1,331 | ) | (2,314 | ) | (3,839 | ) | |||||
|
Total charge-offs
|
(3,693 | ) | (3,033 | ) | (3,451 | ) |
(10,357
|
)
|
(5,613
|
)
|
|||||
|
Recoveries:
|
|||||||||||||||
|
Real Estate:
|
|||||||||||||||
|
Construction and land development
|
6 | 10 | 15 |
1
|
1
|
||||||||||
|
Farmland
|
- | 140 | 1 |
-
|
-
|
||||||||||
|
1 - 4 family residential
|
99 | 49 | 35 |
118
|
11
|
||||||||||
|
Multifamily
|
49 | - | - |
-
|
-
|
||||||||||
|
Non-farm non-residential
|
9 | 8 | 116 |
13
|
30
|
||||||||||
| Total Real Estate | 163 | 207 | 167 | 132 | 42 | ||||||||||
| Non-Real Estate: | |||||||||||||||
| Agricultural | 1 | 5 | 1 | 2 | - | ||||||||||
|
Commercial and industrial loans
|
118 | 71 | 329 |
371
|
164
|
||||||||||
|
Consumer and other
|
199 | 243 | 283 |
227
|
151
|
||||||||||
| Total Non-Real Estate | 318 | 319 | 613 | 600 | 315 | ||||||||||
|
Total recoveries
|
481 | 526 | 780 |
732
|
357
|
||||||||||
|
Net (charge-offs) recoveries
|
(3,212 | ) | (2,507 | ) | (2,671 | ) |
(9,625
|
)
|
(5,256
|
)
|
|||||
|
Provision for loan losses
|
1,962 | 2,520 | 4,134 |
10,187
|
5,654
|
||||||||||
|
Balance at end of year
|
$ | 9,105 | $ | 10,355 | $ | 10,342 |
$
|
8,879
|
$
|
8,317
|
|||||
|
Ratios:
|
|||||||||||||||
|
Net loan charge-offs to average loans
|
0.45 | % | 0.38 | % | 0.45 | % |
1.65
|
%
|
0.87
|
%
|
|||||
|
Net loan charge-offs to loans at end of year
|
0.41 | % | 0.36 | % | 0.42 | % |
1.68
|
%
|
0.91
|
%
|
|||||
|
Allowance for loan losses to loans at end of year
|
1.15 | % | 1.47 | % | 1.64 | % |
1.55
|
%
|
1.44
|
%
|
|||||
|
Net loan charge-offs to allowance for loan losses
|
35.28 | % | 24.21 | % | 25.83 | % |
108.40
|
%
|
63.20
|
%
|
|||||
|
Net loan charge-offs to provision charged to expense
|
163.71 | % | 99.48 | % | 64.61 | % |
94.48
|
%
|
92.96
|
%
|
|||||
A provision for loan losses of $2.0 million was made during the year ended December 31, 2014 as compared to $2.5 million for 2013. The provisions made in 2014 were taken to provide for current loan losses and to maintain the allowance proportionate to risks inherent in the loan portfolio.
Total charge-offs were $3.7 million during the year ended December 31, 2014 as compared to $3.0 million for 2013. Recoveries totaled $0.5 million for the year ended December 31, 2014 and $0.5 million during 2013. Comparing the year ended December 31, 2014 to the year ended December 31, 2013, the decline in the allowance was attributed to charge-offs related to impaired loans that had existing specific reserves, as well as improvement in the credit quality of the loan portfolio. The credit quality improvements were across most loan portfolio types with the largest improvement in non-farm non-residential loans, commercial and industrial loans, and construction and land development.
The charged-off loan balances for the year ended December 31, 2014 were concentrated in three loan relationships which totaled $2.4 million, or 64.9%, of the total charged-off amount. The details of the $3.7 million in charged-off loans were as follows:
|
|
●
|
We charged-off $1.0 million for a commercial and industrial loan that we reclassified as a non-farm non-residential loan as a result of the failure of a financial insurance business. The loan had a balance of $1.6 million with a specific reserve of $0.8 million at December 31, 2013. Analysis of the credit indicated that the loan balance should be charged down to the estimated collateral value of the commercial real estate. This loan was designated as a nonaccrual loan with a current principal balance of $0.3 million at December 31, 2014.
|
|
|
●
|
We charged-off $0.8 million on a non-farm non-residential loan secured by a hotel. The nonaccrual loan had further deterioration in collateral value which required the additional write down. We foreclosed on the loan and the collateral was designated as other real estate owned with a balance of $0.7 million at December 31, 2014.
|
|
|
●
|
We charged-off approximately $0.6 million on a second non-farm non-residential loan secured by a hotel, of which $0.4 million was an existing specific reserve. This loan is in nonaccrual status and has a balance of $2.9 million at December 31, 2014.
|
|
|
●
|
The remaining $1.3 million of charge-offs for 2014 were comprised of smaller loans and overdrawn deposit accounts.
|
36
Allocation of Allowance for Loan Losses. The following tables set forth the allowance for loan losses allocated by loan category and the percent of loans in each category to total loans at the dates indicated. The allowance for loan losses allocated to each category is not necessarily indicative of future losses in any particular category and does not restrict the use of the allowance for losses in other categories.
| At December 31, | |||||||||||||||||
| 2014 | 2013 | ||||||||||||||||
| (in thousands) | Allowance for Loan Losses | Percent of Allowance to Toal Allowance for Loan Losses | Percent of Loans in Each Category to Total Loans | Allowance for Loan Losses | Percent of Allowance to Toal Allowance for Loan Losses | Percent of Loans in Each Category to Total Loans | |||||||||||
| Real Estate: | |||||||||||||||||
| Construction and land development | $ | 702 | 7.7 | % | 6.6 | % | $ | 1,530 | 14.8 | % | 6.7 | % | |||||
| Farmland | 21 | 0.2 | % | 1.7 | % | 17 | 0.2 | % | 1.4 | % | |||||||
| 1-4 family residential | 2,131 | 23.4 | % | 14.9 | % | 1,974 | 19.1 | % | 14.7 | % | |||||||
| Multifamily | 813 | 8.9 | % | 1.8 | % | 376 | 3.6 | % |
2.0
|
% | |||||||
| Non-farm non-residential | 2,713 | 29.8 | % | 41.5 | % | 3,607 | 34.8 | % | 47.7 | % | |||||||
| Non-Real Estate: | |||||||||||||||||
| Agricultural | $ | 293 | 3.2 | % | 3.3 | % | $ | 46 | 0.4 | % | 3.1 | % | |||||
| Commerical and industrial | 1,797 | 19.8 | % | 24.8 | % | 2,176 | 21.0 | % | 21.4 | % | |||||||
| Consumer and other | 371 | 4.1 | % | 5.4 | % | 208 | 2.0 | % | 3.0 | % | |||||||
| Unallocated | 264 | 2.9 | % | - | % | 421 | 4.1 | % | - | % | |||||||
| Total Allowance | $ | 9,105 | 100.0 | % | 100.0 | % | $ | 10,355 | 100.0 | % | 100.0 | % | |||||
| At December 31, | |||||||||||||||||
| 2012 | 2011 | ||||||||||||||||
| (in thousands) | Allowance for Loan Losses | Percent of Allowance to Toal Allowance for Loan Losses | Percent of Loans in Each Category to Total Loans | Allowance for Loan Losses | Percent of Allowance to Toal Allowance for Loan Losses | Percent of Loans in Each Category to Total Loans | |||||||||||
| Real Estate: | |||||||||||||||||
| Construction and land development | $ | 1,098 | 10.6 | % | 7.1 | % | $ | 1,002 | 11.3 | % | 13.7 | % | |||||
| Farmland | 50 | 0.5 | % | 1.8 | % | 65 | 0.7 | % | 2.0 | % | |||||||
| 1-4 family residential | 2,239 | 21.7 | % | 13.8 | % | 1,917 | 21.6 | % | 15.6 | % | |||||||
| Multifamily | 284 | 2.7 | % | 2.4 | % | 780 | 8.8 | % | 2.9 | % | |||||||
| Non-farm non-residential | 3,666 | 35.4 | % | 49.6 | % | 2,980 | 33.6 | % | 46.8 | % | |||||||
| Non-Real Estate: | |||||||||||||||||
| Agricultural | $ | 64 | 0.6 | % | 2.9 | % | $ | 125 | 1.4 | % | 3.0 | % | |||||
| Commerical and industrial | 2,488 | 24.1 | % | 18.6 | % | 1,407 | 15.8 | % | 11.9 | % | |||||||
| Consumer and other | 233 | 2.3 | % | 3.8 | % | 314 | 3.5 | % | 4.1 | % | |||||||
| Unallocated | 220 | 2.1 | % | - | % | 289 | 3.3 | % | - | % | |||||||
| Total Allowance | $ | 10,342 | 100.0 | % | 100.0 | % | $ | 8,879 | 100.0 | % | 100.0 | % | |||||
| At December 31, | ||||||||
| 2010 | ||||||||
| (in thousands) | Allowance for Loan Losses | Percent of Allowance to Toal Allowance for Loan Losses | Percent of Loans in Each Category to Total Loans | |||||
| Real Estate: | ||||||||
| Construction and land development | $ | 977 | 11.7 | % | 11.4 | % | ||
| Farmland | 46 | 0.5 | % | 2.3 | % | |||
| 1-4 family residential | 1,891 | 22.7 | % | 12.7 | % | |||
| Multifamily | 487 | 5.9 | % | 2.5 | % | |||
| Non-farm non-residential | 3,423 | 41.2 | % | 50.8 | % | |||
| Non-Real Estate: | ||||||||
| Agricultural | $ | 80 | 1.0 | % | 3.0 | % | ||
| Commerical and industrial | 510 | 6.1 | % | 13.3 | % | |||
| Consumer and other | 390 | 4.7 | % | 4.0 | % | |||
| Unallocated | 513 | 6.2 | % | - | % | |||
| Total Allowance | $ | 8,317 | 100.0 | % | 100.0 | % | ||
37
Investment Securities.
Investment securities at December 31, 2014 totaled $641.6 million, an increase of $7.1 million, or 1.1%, compared to $634.5 million at December 31, 2013 due to the deployment of surplus cash into short term investments and the purchase of approximately $26.5 million in municipal securities.
Our investment securities portfolio is comprise of both available-for-sale securities and securities that we intend to hold to maturity. We purchase securities for our investment portfolio to provide a source of liquidity, to provide an appropriate return on funds invested, to manage interest rate risk and meet pledging requirements for public funds and borrowings. In particular, our held-to-maturity securities portfolio is used as collateral for our public funds deposits.
The securities portfolio consisted principally of U.S. Government and Government agency securities, agency mortgage-backed securities, corporate debt securities and municipal bonds. U.S. government agencies consist of FHLB, Federal Farm Credit Bank (“FFCB”), Freddie Mac and Fannie Mae obligations. Mortgage backed securities that we purchase are issued by Freddie Mac and Fannie Mae. Management monitors the securities portfolio for both credit and interest rate risk. We generally limit the purchase of corporate securities to individual issuers to manage concentration and credit risk. Corporate securities generally have a maturity of 10 years or less. U.S. Government securities consist of U.S. Treasury bills that have maturities of less than 30 days. Government agency securities generally have maturities of 15 years or less. Agency mortgage backed securities have stated final maturities of 15 to 20 years.
At December 31, 2014, the U.S Government and Government agency securities and municipal bonds qualified as securities available to collateralize public funds. Securities pledged totaled $516.5 million at December 31, 2014 and $503.1 million at December 31, 2013. Our public funds deposits have a seasonal increase due to tax collections at the end of the year and the first quarter. We typically collateralize the seasonal public fund increases with short term instruments such as U.S. Treasuries or other agency backed securities.
The following table sets forth the amortized cost and fair values of our securities portfolio at the dates indicated.
| At December 31, | |||||||||||||||||
| 2014 | 2013 | 2012 | |||||||||||||||
| (in thousands) |
Amortized Cost
|
Fair Value
|
Amortized Cost
|
Fair Value
|
Amortized Cost
|
Fair Value
|
|||||||||||
|
Available-for-sale:
|
|||||||||||||||||
| U.S Treasuries | $ | 36,000 | $ | 36,000 | $ | 36,000 | $ | 36,000 | $ | 20,000 | $ | 20,000 | |||||
|
U.S. Government Agencies
|
295,620 |
291,495
|
302,816
|
|
286,699
|
392,616
|
393,089
|
||||||||||
|
Corporate debt securities
|
126,654 |
130,063
|
142,580
|
|
144,481 |
159,488
|
167,111
|
||||||||||
|
Mutual funds or other equity securities
|
570 |
574
|
564
|
|
556
|
564
|
587
|
||||||||||
|
Municipal bonds
|
40,599 | 41,676 |
16,091
|
16,475
|
18,481
|
19,513
|
|||||||||||
|
Total available-for-sale securities
|
|
499,443
|
|
499,808
|
|
498,051
|
|
|
484,211
|
|
591,149
|
|
600,300
|
||||
|
Held to maturity:
|
|||||||||||||||||
|
U.S. Government Agencies
|
|
84,479
|
|
82,529
|
|
86,927
|
|
|
80,956
|
|
58,943
|
|
58,939
|
||||
| Mortgage-backed securities | 57,316 | 57,159 | 63,366 | 60,686 | - | - | |||||||||||
|
Total held to maturity securities
|
$
|
141,795
|
$
|
139,688
|
$
|
150,293
|
|
$
|
141,642
|
$
|
58,943
|
$
|
58,939
|
||||
Our available-for-sale securities portfolio totaled $499.8 million at December 31, 2014, an increase of $15.6 million, or 3.2%, compared to $484.2 million at December 31, 2013. The increase was primarily due to the purchase of $26.5 million in municipal bonds and the purchase of short-term obligations issued by U.S. Government Agencies to reduce our surplus of cash and increase the yield of our interest-earning assets. The reduction in the corporate bond portfolio was principally due to amortization of existing securities and the reinvestment of these cash flows into other securities and loans.
Our held-to-maturity securities portfolio had an amortized cost of $141.8 million at December 31, 2014, a decrease of $8.5 million, or 5.7%, compared to $150.3 million at December 31, 2013. The decrease was primarily due to the amortization of our mortgage-backed securities.
38
The following table sets forth the stated maturities and weighted average yields of our investment securities at December 31, 2014 and 2013.
|
At December 31, 2014
|
||||||||||||||||||||
| One Year or Less | More than One Year through Five Years | More than Five Years through Ten Years | More than Ten Years | |||||||||||||||||
| (in thousands except for %) |
Carrying Value
|
Weighted Average Yield
|
Carrying Value
|
Weighted Average Yield
|
Carrying Value
|
Weighted Average Yield
|
Carrying Value
|
Weighted Average Yield
|
||||||||||||
|
Available for sale:
|
||||||||||||||||||||
| U.S Treasuries | $ | 36,000 | 0.0 | % | $ | - | - | % | $ | - | - | % | $ | - | - | % | ||||
|
U.S. Government Agencies
|
|
15,029
|
0.3 | % |
|
160,611
|
1.0 | % |
|
94,787
|
1.9 | % |
|
21,068
|
3.0 | % | ||||
|
Corporate and other debt securities
|
18,834
|
1.7 | % |
53,797
|
3.8 | % |
53,748
|
3.9 | % |
3,684
|
4.7 | % | ||||||||
|
Mutual funds or other equity securities
|
-
|
- | % |
-
|
- | % |
-
|
- | % |
574
|
0.0 | % | ||||||||
|
Municipal bonds
|
1,802
|
2.0 | % |
5,377
|
1.9 | % |
8,996
|
3.2 | % |
25,501
|
3.0 | % | ||||||||
|
Total available for sale securities
|
71,665
|
0.6 | % |
219,785
|
1.7 | % |
157,531
|
2.7 | % |
50,827
|
3.1 | % | ||||||||
|
Held to maturity:
|
||||||||||||||||||||
| U.S. Government Agencies | - | - | % | 24,999 | 1.2 | % | 59,480 | 1.9 | % | - | - | % | ||||||||
| Mortgage-backed securities | - | - | % | - | - | % | - | - | % | 57,316 | 2.2 | % | ||||||||
| Corporate and other debt securities | - | - | % | - | - | % | - | - | % | - | - | % | ||||||||
|
Total held to maturity securities
|
$
|
-
|
- | % |
$
|
24,999
|
1.2 | % |
$
|
59,480
|
1.9 | % |
$
|
57,316
|
2.2 | % | ||||
|
December 31, 2013
|
||||||||||||||||||||
| One Year or Less | More than One Year through Five Years | More than Five Years through Ten Years | More than Ten Years | |||||||||||||||||
| (in thousands except for %) |
Carrying Value
|
Weighted Average Yield
|
Carrying Value
|
Weighted Average Yield
|
Carrying Value
|
Weighted Average Yield
|
Carrying Value
|
Weighted Average Yield
|
||||||||||||
|
Available for sale:
|
||||||||||||||||||||
| U.S Treasuries | $ | 36,000 | 0.0 | % | $ | - | - | % | $ | - | - | % | $ | - | - | % | ||||
|
U.S. Government Agencies
|
|
-
|
- | % |
|
124,514
|
1.0 | % |
|
135,088
|
1.8 | % |
|
27,097
|
2.6 | % | ||||
|
Corporate debt securities
|
8,852
|
3.6 | % |
60,367
|
3.3 | % |
70,417
|
3.9 | % |
4,845
|
4.5 | % | ||||||||
|
Mutual funds or other equity securities
|
-
|
- | % |
-
|
- | % |
-
|
- | % |
556
|
0.0 | % | ||||||||
|
Municipal bonds
|
885
|
0.8 | % |
4,357
|
1.7 | % |
6,219
|
2.9 | % |
5,014
|
4.5 | % | ||||||||
|
Total available for sale securities
|
45,737
|
0.7 | % |
189,238
|
1.7 | % |
211,724
|
2.5 | % |
37,512
|
3.0 | % | ||||||||
|
Held to maturity:
|
||||||||||||||||||||
| U.S. Government Agencies | - | - | % | - | - | % | 86,927 | 1.7 | % | - | - | % | ||||||||
| Mortgage-backed secuties | - | % | - | % | - | % | 63,366 | 2.3 | % | |||||||||||
| Corporate and other debt securities | - | % | - | % | - | % | - | % | ||||||||||||
|
Total held to maturity securities
|
$
|
-
|
- | % |
$
|
-
|
- | % |
$
|
86,927
|
1.7 | % |
$
|
63,366
|
2.3 | % | ||||
At December 31, 2014, $71.7 million, or 11.2%, of the securities portfolio was scheduled to mature in less than one year. Securities, not including mortgage-backed securities, with contractual maturity dates over 10 years totaled $50.8 million, or 7.9%, of the total portfolio. The weighted average contractual maturity of the securities portfolio was 5.3 years at December 31, 2014 compared to 5.7 years at December 31, 2013. We attribute the decrease in contractual maturity from December 31, 2013 to December 31, 2014 to our plan to continually shorten the maturity of the investment portfolio to reduce interest rate risk. We seek to profitability invest our public funds deposits in our investment portfolio and loan portfolio. We closely monitor the investment portfolio’s yield, duration, and maturity to ensure a satisfactory return. The average maturity of the securities portfolio is affected by call options that may be exercised by the issuer of the securities and are influenced by market interest rates. Prepayments of mortgages that collateralize mortgage-backed securities also affect the maturity of the securities portfolio. Based on internal forecasts at December 31, 2014, we believe that the securities portfolio has a forecasted weighted average life of approximately 4.5 years based on the current interest rate environment. A parallel interest rate shock of 400 basis points is forecasted to increase the weighted average life of the portfolio to approximately 4.9 years.
At December 31, 2014, the following table identifies the issuers, and the aggregate amortized cost and aggregate fair value of the securities of such issuers that exceeded 10% of our total shareholders’ equity:
| At December 31, 2014 | |||||
| (in thousands) | Amortized Cost | Fair Value | |||
| U.S. Treasuries | $ | 36,000 | $ | 36,000 | |
| FHLB | 129,610 | 127,006 | |||
| Freddie Mac | 75,647 | 75,004 | |||
| Fannie Mae | 109,817 | 108,374 | |||
| Federal Farm Credit Bank | 122,341 | 120,799 | |||
| Total | $ | 473,415 | $ | 467,183 | |
39
Deposits
Managing the mix and pricing the maturities of deposit liabilities is an important factor affecting our ability to maximize our net interest margin. The strategies used to manage interest-bearing deposit liabilities are designed to adjust as the interest rate environment changes. We regularly assess our funding needs, deposit pricing and interest rate outlooks. From December 31, 2013 to December 31, 2014, total deposits increased $68.7 million, or 5.3%, to $1.4 billion. Time deposits increased $15.0 million, or 2.3%, to $657.0 million at December 31, 2014 compared to $642.0 million at December 31, 2013. The majority of the increase in time deposits was associated with a new public funds deposit. Noninterest-bearing demand deposits increased $3.7 million from December 31, 2013 to December 31, 2014. Interest-bearing demand deposits increased $40.9 million from December 31, 2013 to December 31, 2014. At December 31, 2014, we had $27.3 million in brokered deposits.
As we seek to strengthen our net interest margin and improve our earnings, attracting core noninterest-bearing deposits will be a primary emphasis. Management will continue to evaluate and update our product mix in its efforts to attract additional core customers. We currently offer a number of noninterest-bearing deposit products that are competitively priced and designed to attract and retain customers with primary emphasis on core deposits.
The following table sets forth the distribution of deposit accounts, by account type, for the dates indicated.
| For the Years Ended December 31, | |||||||||||||||||||||||||||
| Total Deposits | 2014 | 2013 | 2012 | ||||||||||||||||||||||||
| (in thousands except for %) | Average Balance | Percent |
Weighted Average Rate
|
Average Balance | Percent |
Weighted Average Rate
|
Average Balance | Percent | Weighted Average Rate | ||||||||||||||||||
| Noninterest-bearing Demand | $ | 200,127 | 15.3 | % | 0.0 | % | $ | 196,589 | 15.8 | % | 0.0 | % | $ | 175,979 | 14.6 | % | 0.0 | % | |||||||||
| Interest-bearing Demand | 386,363 | 29.6 | % | 0.3 | % | 334,573 | 26.8 | % | 0.4 | % | 302,207 | 25.1 | % | 0.5 | % | ||||||||||||
| Savings | 69,719 | 5.4 | % | 0.0 | % | 64,639 | 5.2 | % | 0.1 | % | 59,899 | 5.0 | % | 0.1 | % | ||||||||||||
| Time | 649,166 | 49.7 | % | 1.2 | % | 650,540 | 52.2 | % | 1.5 | % | 664,529 | 55.3 | % | 1.7 | % | ||||||||||||
| Total Deposits | $ | 1,305,375 | 100.0 | % | 0.8 | % | $ | 1,246,341 | 100.0 | % | 0.9 | % | $ | 1,202,614 | 100.0 | % | 1.1 | % | |||||||||
| For the Years Ended December 31, | |||||||||||||||||||||||||||
| Individual and Business Deposits | 2014 | 2013 | 2012 | ||||||||||||||||||||||||
| (in thousands except for %) | Average Balance | Percent |
Weighted Average Rate
|
Average Balance | Percent |
Weighted Average Rate
|
Average Balance | Percent | Weighted Average Rate | ||||||||||||||||||
| Noninterest-bearing Demand | $ | 197,332 | 25.0 | % | 0.0 | % | $ | 193,773 | 24.5 | % | 0.0 | % | $ | 173,719 | 22.9 | % | 0.0 | % | |||||||||
| Interest-bearing Demand | 105,569 | 13.4 | % | 0.2 | % | 85,384 | 10.8 | % | 0.3 | % | 80,761 | 10.7 | % | 0.3 | % | ||||||||||||
| Savings | 61,288 | 7.7 | % | 0.0 | % | 57,819 | 7.3 | % | 0.1 | % | 55,408 | 7.3 | % | 0.1 | % | ||||||||||||
| Time | 426,107 | 53.9 | % | 1.4 | % | 453,055 | 57.4 | % | 1.8 | % | 448,417 | 59.1 | % | 2.1 | % | ||||||||||||
| Total Individual and Business Deposits | $ | 790,296 | 100.0 | % | 0.8 | % | $ | 790,031 | 100.0 | % | 1.1 | % | $ | 758,305 | 100.0 | % | 1.3 | % | |||||||||
| For the Years Ended December 31, | |||||||||||||||||||||||||||
| Public Fund Deposits | 2014 | 2013 | 2012 | ||||||||||||||||||||||||
| (in thousands except for %) | Average Balance | Percent |
Weighted Average Rate
|
Average Balance | Percent |
Weighted Average Rate
|
Average Balance | Percent | Weighted Average Rate | ||||||||||||||||||
| Noninterest-bearing Demand | $ | 2,795 | 0.5 | % | 0.0 | % | $ | 2,816 | 0.6 | % | 0.0 | % | $ | 2,260 | 0.5 | % | 0.0 | % | |||||||||
| Interest-bearing Demand | 280,794 | 54.5 | % | 0.4 | % | 249,189 | 54.6 | % | 0.4 | % | 221,446 | 49.9 | % | 0.5 | % | ||||||||||||
| Savings | 8,431 | 1.7 | % | 0.0 | % | 6,820 | 1.5 | % | 0.1 | % | 4,491 | 1.0 | % | 0.1 | % | ||||||||||||
| Time | 223,059 | 43.3 | % | 0.7 | % | 197,485 | 43.3 | % | 0.8 | % | 216,112 | 48.6 | % | 1.0 | % | ||||||||||||
| Total Public Funds | $ | 515,079 | 100.0 | % | 0.5 | % | $ | 456,310 | 100.0 | % | 0.6 | % | $ | 444,309 | 100.0 | % | 0.7 | % | |||||||||
At December 31, 2014, public funds deposits totaled $601.5 million compared to $515.6 million at December 31, 2013. We have developed a program for the retention and management of public funds deposits. Since the end of 2007, we have maintained public funds deposits in excess of $175.0 million. These deposits are from public entities such as school districts, hospital districts, sheriff departments and municipalities. $476.7 million of these accounts at December 31, 2014 are under contracts with terms of three years or less. Three of these relationships account for 46.7% of our contract public funds deposits, each of which is currently under contract with us. These deposits generally have stable balances as we maintain both operating accounts and time deposits for these entities. There is a seasonal component to public deposit levels associated with annual tax collections. Public funds deposits will increase at the end of the year and the first quarter. Public funds deposit accounts are collateralized by FHLB letters of credit, by Louisiana municipal bonds and eligible government and government agency securities such as those issued by the FHLB, FFCB, Fannie Mae, and Freddie Mac. We invest the majority of these public deposits in our investment portfolio.
The following table sets forth our public funds as a percent of total deposits.
| At December 31, | ||||||||||||
|
(in thousands except for %)
|
2014 |
2013
|
2012
|
2011
|
||||||||
|
Public Funds:
|
|
|
|
|
|
|||||||
| Noninterest-bearing Demand | $ | 3,241 | $ | 3,016 | $ | 3,735 | $ | 2,552 | ||||
| Interest-bearing Demand | 321,382 | 296,739 | 265,296 | 208,230 | ||||||||
| Savings | 10,142 | 7,209 | 6,415 | 3,918 | ||||||||
| Time | 266,743 | 208,614 | 195,052 | 217,205 | ||||||||
| Total Public Funds | $ | 601,508 | $ | 515,578 | $ | 470,498 | $ | 431,905 | ||||
|
Total Deposits
|
$ | 1,371,839 |
$
|
1,303,099
|
$
|
1,252,612
|
$
|
1,207,302
|
||||
|
Total Public Funds as a percent of Total Deposits
|
43.9 | % |
39.6
|
% |
37.6
|
% |
35.8
|
% | ||||
40
At December 31, 2014, the aggregate amount of outstanding certificates of deposit in amounts greater than or equal to $250,000 was approximately $323.7 million. At December 31, 2014, approximately $90.8 million of our certificates of deposit greater than or equal to $250,000 had a remaining term greater than one year.
The following table sets forth the maturity of the total certificates of deposit greater than or equal to $250,000 at December 31, 2014.
|
(in thousands)
|
December 31, 2014 | ||
|
Due in one year or less
|
$ | 232,960 | |
|
Due after one year through three years
|
86,773 | ||
|
Due after three years
|
4,015 | ||
|
Total certificates of deposit greater than or equal to $250,000
|
$ | 323,748 | |
Borrowings.
We maintain borrowing relationships with other financial institutions as well as the FHLB on a short and long-term basis to meet liquidity needs. At December 31, 2014, short-term borrowings totaled $1.8 million, a decrease of $4.0 million as compared to $5.8 million at December 31, 2013. The decrease in short-term borrowings was due to the elimination of overnight repurchase agreements. The short-term borrowings at December 31, 2014 were comprised of a line of credit of $2.5 million, with an outstanding balance of $1.8 million.
At December 31, 2014, we had $150.0 million in FHLB letters of credit outstanding obtained solely for collateralizing public deposits.
The following table sets forth information concerning balances and interest rates on our borrowings at the dates and for the years indicated.
| At or For the Years Ended December 31, | |||||||||
| (in thousands except for %) | 2014 |
2013
|
2012
|
||||||
|
Balance at end of year
|
$ | 1,800 |
$
|
5,788
|
$
|
14,746
|
|||
|
Maximum month-end outstanding
|
$ | 22,356 | $ |
57,302
|
$ |
31,850
|
|||
|
Average daily outstanding
|
$ | 6,960 | $ |
21,387
|
$ |
14,560
|
|||
|
Total Weighted average rate during the year
|
1.08 | % |
0.98
|
%
|
0.25
|
%
|
|||
|
Average rate during year
|
4.50 | % |
1.51
|
%
|
0.75
|
%
|
|||
First Guaranty Bancshares had long-term borrowings totaling $1.5 million at December 31, 2014 from Premier Bank, an increase of $1.0 million, as compared to $0.5 million at December 31, 2013. The increase in long-term borrowings was for the purchase of a preferred equity security.
Shareholders’ Equity
Total shareholders’ equity increased to $139.6 million at December 31, 2014 from $123.4 million at December 31, 2013. The increase in total shareholders’ equity was principally the result of a change in the balance of the accumulated other comprehensive income from $9.1 million loss at December 31, 2013 to $0.2 million gain at December 31, 2014. The reduction was due to a $9.4 million decrease in net unrealized mark to market losses on available for sale securities (after taxes) as a result of a decline in market interest rates. Total shareholders’ equity also increased due to net income of $11.2 million during the year ended December 31, 2014, partially offset by $4.0 million in cash dividends paid on our common stock and $0.4 million in dividends paid on our preferred stock issued to the U.S. Treasury in connection with our participation in the SBLF. We are at the contractual minimum dividend rate of 1.0% on our SBLF capital.
41
Results of Operations
Performance Summary
Year ended December 31, 2014 compared with year ended December 31, 2013. Net income for the year ended December 31, 2014 was $11.2 million, an increase of $2.1 million, or 23.1%, from $9.1 million for the year ended December 31, 2013. Net income available to common shareholders for the year ended December 31, 2014 was $10.8 million which was an increase of $2.4 million from $8.4 million for 2013. The increase in net income for the year ended December 31, 2014 was primarily the result of increased loan interest income, lower interest expense and lower provision expenses. Net gains on securities for the years ended December 31, 2014 and 2013 were $0.3 million and $1.6 million, respectively. Earnings per common share for the year ended December 31, 2014 was $1.72 per common share, an increase of 28.4% or $0.38 per common share from $1.34 per common share for the year ended December 31, 2013.
Year ended December 31, 2013 compared with year ended December 31, 2012. Net income for the year ended December 31, 2013 was $9.1 million, a decrease of $2.9 million or, 24.2%, from $12.1 million for the year ended December 31, 2012. In 2012, we began shortening the duration of our securities portfolio in order to mitigate risks associated with changes in market interest rates. However, shorter duration securities typically provide lower yields. As a result, interest income on the securities portfolio decreased $5.5 million for the year ended December 31, 2013 when compared to 2012. In addition, gains on securities during 2013 decreased $3.3 million to $1.6 million from $4.9 million of securities gains in 2012. The impact of these changes in our securities portfolio was mitigated by a combination of increased income on loans of $1.2 million as a result of loan growth as well as a reduction in funding costs totaling $2.0 million in 2013 when compared to 2012. In addition, the credit quality of the loan portfolio continued to improve and as a result the provision for loan losses was $2.5 million for 2013 compared to $4.1 million for 2012, a decrease of $1.6 million. Although net income for 2013 was down $2.9 million from 2012, income available to common shareholders for the year ended December 31, 2013 was $8.4 million, a decrease of only $1.7 million from 2012. This was the result of qualified loan growth that reduced the dividend rate paid on our Series C Preferred Stock to 1.0% per annum, which resulted in the payment of $0.7 million in dividends in 2013 compared to $2.0 million in 2012.
Net Interest Income
Our operating results depend primarily on our net interest income, which is the difference between interest income earned on interest-earning assets, including loans and securities, and interest expense incurred on interest-bearing liabilities, including deposits and other borrowed funds. Interest rate fluctuations, as well as changes in the amount and type of interest-earning assets and interest-bearing liabilities, combine to affect net interest income. Our net interest income is affected by changes in the amount and mix of interest-earning assets and interest-bearing liabilities. It is also affected by changes in yields earned on interest-earning assets and rates paid on interest-bearing deposits and other borrowed funds.
A financial institution’s asset and liability structure is substantially different from that of a non-financial company, in that virtually all assets and liabilities are monetary in nature. Accordingly, changes in interest rates may have a significant impact on a financial institution’s performance. The impact of interest rate changes depends on the sensitivity to the change of our interest-earning assets and interest-bearing liabilities. The effects of the low interest rate environment in recent years and our interest sensitivity position is discussed below.
Year ended December 31, 2014 compared with the year ended December 31, 2013. Net interest income for the year ended December 31, 2014 and 2013 was $44.1 million and $39.8 million, respectively. The increase in net interest income for the year ended December 31, 2014 was primarily due to the increase in the average balance of our total interest-earning assets and a decrease in the average rate of our total interest-bearing liabilities. The average balance of total interest-earning assets increased by $55.0 million to $1.4 billion for the year ended December 31, 2014 as compared to the year ended December 31, 2013. The average yield on our total interest-earning assets increased 3 basis points to 3.76% for the year ended December 31, 2014 compared to 3.73% for the year ended December 31, 2013. The average rate of our total interest-bearing liabilities decreased by 21 basis points to 0.83% for the year ended December 31, 2014 compared to 1.04% for the year ended December 31, 2013, which was partially offset by the increase in the average balance of total interest-bearing liabilities by $46.3 million to $1.1 billion for the year ended December 31, 2014 as compared to the year ended December 31, 2013. As a result, our net interest rate spread increased 24 basis points to 2.93% for the year ended December 31, 2014 from 2.69% for the year ended December 31, 2013, and our net interest margin increased 19 basis points to 3.11% for the year ended December 31, 2014 from 2.92% for the year ended December 31, 2013.
Year ended December 31, 2013 compared with the year ended December 31, 2012. Net interest income in 2013 was $39.8 million, a decrease of $2.3 million, or 5.5%, when compared to $42.1 million in 2012. The decrease in net interest income for 2013 was primarily due to the decrease in the average yield of our total interest-earning assets. For the year ended December 31, 2013, the average yield on our total interest-earning assets decreased by 47 basis points to 3.73% compared to 4.20% for the year ended December 31, 2012. The decrease in net interest income was partially offset by the decrease in the average rate paid on our total interest-bearing liabilities which decreased by 22 basis points to 1.04% for the year ended December 31, 2013 compared to 1.26% for the year ended December 31, 2012. As a result, our net interest rate spread decreased 25 basis points to 2.69% for the year ended December 31, 2013 from 2.94% for the year ended December 31, 2012, and our net interest margin decreased 28 basis points to 2.92% for the year ended December 31, 2013 from 3.20% for the year ended December 31, 2012.
Interest Income
Year ended December 31, 2014 compared with the year ended December 31, 2013. Interest income increased $2.4 million, or 4.7%, to $53.3 million for the year ended December 31, 2014 from $50.9 million for the year ended December 31, 2013 primarily as a result of a $2.5 million increase in interest income on loans. The increase in interest income resulted primarily from a $55.0 million increase in the average balance of our interest-earnings assets to $1.4 billion for the year ended December 31, 2014. The average yield on our interest-earning assets increased by 3 basis points to 3.76% for the year ended December 31, 2014 compared to 3.73% for the year ended December 31, 2013.
Interest income on loans increased $2.5 million, or 6.7%, to $39.8 million for the year ended December 31, 2014 as a result of an increase in the average balance of loans, partially offset by a decrease in the average yield on loans. The average balance of loans (excluding loans held for sale) increased by $59.6 million to $727.4 million for the year ended December 31, 2014 from $667.8 million for the year ended December 31, 2013 as a result of new loan originations, the majority of which were owner-occupied non-farm non-residential loans and commercial and industrial loans associated with syndicated loans, including shared national credits. Partially offsetting the increase in interest income on loans was a decrease in the average yield on loans (excluding loans held for sale), which decreased by 11 basis points to 5.47% for the year ended December 31, 2014 compared to 5.58% for the year ended December 31, 2013 due to pay-offs of higher-yielding existing loans in the current low interest rate environment.
Interest income on securities increased $44,000, or 0.3%, to $13.4 million for the year ended December 31, 2014 as a result of the increase in the average balance of securities, which was offset by a decrease in the average yield on securities. The average balance of securities increased $14.0 million to $644.6 million for the year ended December 31, 2014 from $630.6 million for the year ended December 31, 2013 due to the increase in the average balance of our municipal and short-term agency securities. The average yield on securities decreased by 5 basis points to 2.08% for the year ended December 31, 2014 compared to 2.13% for the year ended December 31, 2013 due to payoffs of higher yielding securities, which were reinvested in shorter duration lower yielding securities.
42
Year ended December 31, 2013 compared with the year ended December 31, 2012. Interest income decreased $4.3 million, or 7.8%, to $50.9 million for the year ended December 31, 2013 primarily as a result of a $5.5 million decrease in interest income on securities. The decrease in interest income resulted primarily from a 47 basis points decrease in the average yield on our interest-earning assets to 3.73% for the year ended December 31, 2013.
Interest income on securities decreased $5.5 million, or 29.1%, to $13.4 million for the year ended December 31, 2013 as a result of decreases in the average yield on securities and the average balance of securities. The average yield on securities decreased by 74 basis points to 2.13% for the year ended December 31, 2013 from 2.87% for the year ended December 31, 2012 due to payoffs of higher yielding securities which were reinvested in shorter duration lower yielding securities. The average balance of securities decreased $28.9 million to $630.6 million for the year ended December 31, 2013 from $659.4 million for the year ended December 31, 2012 due to securities sales, pay-downs and maturities during 2013.
Interest income on loans increased $1.2 million, or 3.2%, to $37.3 million for the year ended December 31, 2013 as a result of an increase in the average balance of loans, partially offset by a decrease in the average yield on loans. The average balance of loans (excluding loans held for sale) during the year ended December 31, 2013 increased by $78.1 million to $667.8 million from $589.7 million for the year ended December 31, 2012 as a result of new loan originations, which were primarily owner-occupied non-farm non-residential loans and commercial and industrial loans associated with syndicated loans. Partially offsetting the increase in interest income on loans was a decrease in the average yield on loans (excluding loans held for sale), which decreased by 55 basis points to 5.58% for the year ended December 31, 2013 from 6.13% for the year ended December 31, 2012 due to pay-offs of higher-yielding existing loans in the current low interest rate environment.
Interest Expense
Year ended December 31, 2014 compared with the year ended December 31, 2013. Interest expense decreased $1.9 million, or 17.4%, to $9.2 million for the year ended December 31, 2014 from $11.1 million for the year ended December 31, 2013 due primarily to a decrease in the average rate on time deposits. The average rate of time deposits decreased by 30 basis points during the year ended December 31, 2014 to 1.19%, reflecting downward repricing of our time deposits in the continued low interest rate environment. The average balance of interest-bearing deposits increased by $55.5 million during the year ended December 31, 2014 to $1.1 billion as a result of a $51.8 million increase in the average balance of interest- bearing demand deposits, which was partially offset by a $1.4 million decrease in the average balance of time deposits.
Year ended December 31, 2013 compared with the year ended December 31, 2012. Interest expense decreased $2.0 million, or 15.1%, to $11.1 million for the year ended December 31, 2013 from $13.1 million for the year ended December 31, 2012 due to a decrease in the average rate of deposits. The average rate of liabilities decreased by 22 basis points to 1.04% for the year ended December 31, 2013 from 1.26% for the year ended December 31, 2012 reflecting the lower interest rate environment. The average rate of time deposits decreased by 25 basis points during the year ended December 31, 2013 to 1.49%, reflecting downward repricing of our deposits, in the continued low interest rate environment. The average balance of interest-bearing deposits increased by $23.1 million during the year ended December 31, 2013 to $1.0 billion as a result of a $37.1 million increase in the average balance of core deposits, which was partially offset by a $14.0 million decrease in the average balance of time deposits.
During the year ended December 31, 2014 and the year ended December 31, 2013, the lower cost of our deposits and the change in the mix of our deposits were primarily due to the repricing of our time deposits that were offered to customers through our local marketing campaign in 2010 to diversify our deposit base. These time deposits primarily matured in 2012, which allowed us to lower the costs of our time deposits by repricing our time deposits to lower interest rates which continued in 2014.
43
Average Balances and Yields. The following table sets forth average balance sheet balances, average yields and costs, and certain other information for the years indicated. No tax-equivalent yield adjustments were made, as the effect thereof was not material. All average balances are daily average balances. Nonaccrual loans were included in the computation of average balances, but have been reflected in the table as loans carrying a zero yield. Loans, net of unearned income, include loans held for sale. The yields set forth below include the effect of deferred fees, discounts and premiums that are amortized or accreted to interest income or expense.
The net interest income yield presented below is calculated by dividing net interest income by average interest-earning assets and is a measure of the efficiency of the earnings from the balance sheet activities. It is affected by changes in the difference between interest on interest-earning assets and interest-bearing liabilities and the percentage of interest-earning assets funded by interest-bearing liabilities.
| December 31, 2014 | December 31, 2013 | December 31, 2012 | ||||||||||||||||||||||
|
(in thousands except for %)
|
Average Outstanding Balance | Interest |
Average
Yield/Rate
|
Average Outstanding Balance | Interest |
Average
Yield/Rate
|
Average Outstanding Balance | Interest | Average Yield/Rate | |||||||||||||||
|
Assets
|
||||||||||||||||||||||||
|
Interest-earning assets:
|
||||||||||||||||||||||||
|
Interest-earning deposits with banks(1)
|
$
|
46,455
|
$
|
115
|
0.25 | % |
$
|
63,417
|
$
|
157
|
0.25 | % | $ | 46,188 | $ | 92 | 0.20 | % | ||||||
|
Securities (including FHLB stock)
|
644,561
|
13,395
|
2.08 | % |
630,586
|
13,439
|
2.13 | % | 659,440 | 18,949 | 2.87 | % | ||||||||||||
|
Federal funds sold
|
304
|
-
|
- | % |
1,738
|
1
|
0.06 | % | 19,397 | 10 | 0.05 | % | ||||||||||||
| Loans held for sale | 10 | - | - | % | 119 | - | - | % | 209 | 8 | 3.83 | % | ||||||||||||
|
Loans, net of unearned income
|
727,385
|
39,787
|
5.47 | % |
667,814
|
37,289
|
5.58 | % | 589,735 | 36,136 | 6.13 | % | ||||||||||||
|
Total interest-earning assets
|
|
1,418,715
|
53,297
|
3.76 | % |
|
1,363,674
|
50,886
|
3.73 | % | 1,314,969 | 55,195 | 4.20 | % | ||||||||||
|
Noninterest-earning assets:
|
||||||||||||||||||||||||
|
Cash and due from banks
|
|
9,030
|
|
9,219
|
10,275 | |||||||||||||||||||
|
Premises and equipment, net
|
19,738
|
19,681
|
19,787 | |||||||||||||||||||||
|
Other assets
|
7,528
|
8,216
|
12,482 | |||||||||||||||||||||
|
Total Assets
|
$
|
1,455,011
|
$ |
1,400,790
|
$ | 1,357,513 | ||||||||||||||||||
|
Liabilities and Shareholders' Equity
|
||||||||||||||||||||||||
|
Interest-bearing liabilities:
|
||||||||||||||||||||||||
|
Demand deposits
|
$ |
386,363
|
1,312
|
0.34 | % | $ |
334,573
|
1,262
|
0.38 | % | $ | 302,207 | 1,383 | 0.46 | % | |||||||||
|
Savings deposits
|
69,719
|
33
|
0.05 | % |
64,639
|
41
|
0.06 | % | 59,899 | 55 | 0.09 | % | ||||||||||||
|
Time deposits
|
649,165
|
7,716
|
1.19 | % |
650,540
|
9,682
|
1.49 | % | 664,529 | 11,560 | 1.74 | % | ||||||||||||
|
Borrowings
|
10,083
|
141
|
1.40 | % |
19,286
|
149
|
0.77 | % | 16,508 | 122 | 0.74 | % | ||||||||||||
|
Total interest-bearing liabilities
|
|
1,115,330
|
9,202
|
0.83 | % |
1,069,038
|
11,134
|
1.04 | % | 1,043,143 | 13,120 | 1.26 | % | |||||||||||
|
Noninterest-bearing liabilities:
|
||||||||||||||||||||||||
|
Demand deposits
|
|
200,127
|
|
196,589
|
175,979 | |||||||||||||||||||
|
Other
|
5,157
|
5,110
|
6,400 | |||||||||||||||||||||
|
Total Liabilities
|
|
1,320,614
|
|
1,270,737
|
1,225,522 | |||||||||||||||||||
|
Shareholders' Equity
|
134,397
|
130,053
|
131,991 | |||||||||||||||||||||
|
Total Liabilities and Shareholders' Equity
|
$
|
1,455,011
|
$
|
1,400,790
|
$ | 1,357,513 | ||||||||||||||||||
|
Net interest income
|
$
|
44,095
|
$
|
39,752
|
$ | 42,075 | ||||||||||||||||||
|
Net interest rate spread(2)
|
2.93 | % | 2.69 | % | 2.94 | % | ||||||||||||||||||
|
Net interest-earning assets(3)
|
$
|
303,385
|
$
|
294,636
|
$ | 271,826 | ||||||||||||||||||
|
Net interest margin(4)(5)
|
3.11 | % | 2.92 | % | 3.20 | % | ||||||||||||||||||
|
Average interest-earning assets to interest-bearing liabilities
|
127.20 | % | 127.56 | % | 126.06 | % | ||||||||||||||||||
| (1) | Includes Federal Reserve balances reported in cash and due from banks on the consolidated balance sheets. |
| (2) | Net interest rate spread represents the difference between the yield on average interest-earning assets and the cost of average interest-bearing liabilities. |
| (3) | Net interest-earning assets represent total interest-earning assets less total interest-bearing liabilities. |
| (4) | Net interest margin represents net interest income divided by average total interest-earning assets. |
| (5) | The tax adjusted net interest margin was 3.13%, 2.93% and 3.22% for the years ended December 31, 2014, 2013 and 2012. A 35% tax rate was used to calculate the effect on securities income from tax exempt securities. |
44
Volume/Rate Analysis.
The following table presents the dollar amount of changes in interest income and interest expense for major components of interest-earning assets and interest-bearing liabilities for the years indicated. The table distinguishes between: (1) changes attributable to volume (changes in volume multiplied by the prior period’s rate); (2) changes attributable to rate (change in rate multiplied by the prior year’s volume) and (3) total increase (decrease) (the sum of the previous columns). Changes attributable to both volume and rate are allocated ratably between the volume and rate categories.
| For the Years Ended December 31, 2014 vs. 2013 | For the Years Ended December 31, 2013 vs. 2012 | |||||||||||||||||
| Increase (Decrease) Due To | Increase (Decrease) Due To | |||||||||||||||||
| (in thousands except for %) | Volume | Rate | Increase/Decrease | Volume | Rate | Increase/Decrease | ||||||||||||
|
Interest earned on:
|
||||||||||||||||||
|
Interest-earning deposits with banks
|
$ | (42 |
)
|
$ |
-
|
|
$ |
(42
|
)
|
$ |
39
|
$ |
26
|
|
$ |
65
|
||
|
Securities (including FHLB stock)
|
294 |
(338
|
)
|
(44
|
) |
(798
|
) |
(4,712
|
)
|
(5,510
|
) | |||||||
|
Federal funds sold
|
-
|
|
(1
|
)
|
(1
|
)
|
(10
|
) |
1
|
|
(9
|
)
|
||||||
| Loans held for sale | - | - | - | (2 | ) |
(6
|
) | (8 |
)
|
|||||||||
|
Loans, net of unearned income
|
3,271
|
(773
|
) |
2,498
|
4,530
|
(3,377
|
) |
1,153
|
|
|||||||||
|
Total interest income
|
3,523
|
(1,112
|
) |
2,411
|
3,759
|
(8,068
|
)
|
(4,309
|
) | |||||||||
|
Interest paid on:
|
||||||||||||||||||
|
Demand deposits
|
184
|
|
(134
|
)
|
50
|
|
138
|
(259
|
)
|
(121
|
)
|
|||||||
|
Savings deposits
|
3
|
(11
|
)
|
(8
|
)
|
4
|
|
(18
|
)
|
(14
|
)
|
|||||||
|
Time deposits
|
(20
|
) |
(1,946
|
)
|
(1,966
|
)
|
(239
|
) |
(1,639
|
)
|
(1,878
|
) | ||||||
|
Borrowings
|
(92
|
) |
84
|
|
(8
|
)
|
21
|
6
|
|
27
|
|
|||||||
|
Total interest expense
|
75
|
(2,007
|
)
|
(1,932 |
)
|
(76
|
) |
(1,910
|
)
|
(1,986
|
)
|
|||||||
|
Change in net interest income
|
$ |
3,448
|
$ |
895
|
$ |
4,343
|
$ |
3,835
|
$ |
(6,158
|
)
|
$ |
(2,323
|
) | ||||
Provision for Loan Losses
A provision for loan losses is a charge to income in an amount that management believes is necessary to maintain an adequate allowance for loan losses. The provision is based on management’s regular evaluation of current economic conditions in our specific markets as well as regionally and nationally, changes in the character and size of the loan portfolio, underlying collateral values securing loans, and other factors which deserve recognition in estimating loan losses. This evaluation is inherently subjective as it requires estimates that are susceptible to significant revision as more information becomes available or as future events change.
We recorded a $2.0 million provision for loan losses for the year ended December 31, 2014 compared to $2.5 million for 2013. The allowance for loan losses at December 31, 2014 was $9.1 million, compared to $10.4 million at December 31, 2013, and was 1.15% and 1.47% of total loans, respectively. The decline in the provision was attributed to charge-offs related to impaired loans that had existing specific reserves, as well as improvement in the credit quality of the loan portfolio. The impaired loan portfolio did not suffer additional declines in estimated fair value requiring further provisions. The decline was also due to an improvement in our historical charge-off trends. We believe that the allowance is adequate to cover potential losses in the loan portfolio given the current economic conditions, and current expected net charge-offs and non-performing asset levels.
For the year ended December 31, 2013, the provision for loan losses was $2.5 million, a decrease of $1.6 million from $4.1 million for 2012. The allowance for loan losses was $10.4 million and $10.3 million at December 31, 2013 and 2012, respectively. The decrease in the provision was due in part to a decrease of net charge-offs from $2.7 million in 2012 to $2.5 million in 2013. In addition, the decline in the provision was attributed to improvement in the credit quality of the loan portfolio and because net charge-offs during 2013 were primarily against loans for which we already recorded specific allowances in prior periods.
45
Noninterest Income.
Our primary sources of recurring noninterest income are customer service fees, loan fees, gains on the sale of loans and available-for-sale securities and other service fees. Noninterest income does not include loan origination fees which are recognized over the life of the related loan as an adjustment to yield using the interest method.
Noninterest income totaled $6.2 million for the year ended December 31, 2014, a decrease of $1.3 million when compared to $7.5 million for 2013. The majority of the decrease was due to lower gains on securities sales. Net securities gains were $0.3 million for the year ended December 31, 2014 and $1.6 million for 2013. Service charges, commissions and fees totaled $2.8 million for the year ended December 31, 2014 and $3.0 million for 2013. ATM and debit card fees totaled $1.7 million for the year ended December 31, 2014 and $1.6 million for 2013. Other noninterest income increased by $0.1 million to $1.5 million for the year ended December 31, 2014 compared to $1.4 million for 2013.
Noninterest income totaled $7.5 million in 2013 which was a decrease of $3.6 million compared to $11.1 million in 2012. The decrease in noninterest income was primarily due to a decrease in gains from the sale of investment securities of $3.3 million. Service charges, commissions and fees totaled $4.6 million for 2013 and $4.8 million for 2012. Other noninterest income decreased $0.4 million to $1.3 million in 2013 from $1.7 million in 2012.
Noninterest Expense
Noninterest expense includes salaries and employee benefits, occupancy and equipment expense and other types of expenses. Noninterest expense increased $0.6 million to $31.6 million for the year ended December 31, 2014 compared to 2013. For 2014 and 2013, salaries and benefits expense totaled $15.8 million and $14.4 million, respectively, due primarily to increased costs associated with our employee health insurance plan. The Company terminated the plan in 2014 and enrolled in a fully insured plan from a third party national provider of health insurance. Occupancy and equipment expense totaled $3.9 million for 2014 and 2013. Other noninterest expense decreased by $0.9 million to $11.8 million for the year ended December 31, 2014 from $12.7 million for the year ended December 31, 2013.
Noninterest expense totaled $31.0 million in 2013 and $31.2 million in 2012. Salaries and benefits expense increased $0.7 million to $14.4 million for 2013 compared to $13.7 million in 2012. The increase in salaries and benefits expense was due to the increase in the total number of full-time equivalent employees during 2013 as well as an increase in salaries of existing employees for tenure, experience and performance. Occupancy and equipment expense totaled $3.9 million and $3.7 million in 2013 and 2012, respectively. Other noninterest expense totaled $12.7 million in 2013, a decrease of $1.1 million, or 8.1%, when compared to $13.8 million in 2012.
The following table presents, for the years indicated, the major categories of other noninterest expense:
|
(in thousands)
|
December 31, 2014 |
December 31, 2013
|
December 31, 2012
|
||||||
|
Other noninterest expense:
|
|||||||||
|
Legal and professional fees
|
$ | 1,982 |
$
|
2,347
|
$
|
1,990
|
|||
|
Data processing
|
1,153 |
1,269
|
1,225
|
||||||
|
Marketing and public relations
|
700 |
638
|
697
|
||||||
|
Taxes - sales, capital, and franchise
|
605 |
584
|
661
|
||||||
|
Operating supplies
|
410 |
487
|
581
|
||||||
|
Travel and lodging
|
566 |
563
|
523
|
||||||
| Telephone | 242 | 206 | 220 | ||||||
| Amortization of core deposits | 320 | 320 | 350 | ||||||
| Donations | 150 | 294 | 195 | ||||||
|
Net costs from other real estate and repossessions
|
1,374 |
941
|
2,083
|
||||||
|
Regulatory assessment
|
1,181 |
1,784
|
1,471
|
||||||
|
Other
|
3,143 |
3,237
|
3,784 | ||||||
|
Total other expense
|
$ | 11,826 |
$
|
12,670
|
$
|
13,780
|
|||
Income Taxes.
The amount of income expense is influenced by the amount of pre-tax income, the amount of tax-exempt income and the amount of other non-deductible expenses. The provision for income taxes for the years ended December 31, 2014, 2013 and 2012 was $5.5 million, $4.6 million and $5.9 million, respectively. The provision for income taxes increased in 2014 as compared to 2013 due to the increase in income before taxes. Our statutory tax rate was 35.0% for 2014, 2013 and 2012.
Impact of Inflation
Our consolidated financial statements and related notes included elsewhere in this Annual Report on Form 10-K have been prepared in accordance with GAAP. These require the measurement of financial position and operating results in terms of historical dollars, without considering changes in the relative value of money over time due to inflation or recession.
Unlike many industrial companies, substantially all of our assets and liabilities are monetary in nature. As a result, interest rates have a more significant impact on our performance than the effects of general levels of inflation. Interest rates may not necessarily move in the same direction or in the same magnitude as the prices of goods and services. However, other operating expenses do reflect general levels of inflation.
46
Liquidity and Capital Resources
Liquidity
Liquidity refers to the ability or flexibility to manage future cash flows to meet the needs of depositors and borrowers and fund operations. Maintaining appropriate levels of liquidity allows us to have sufficient funds available to meet customer demand for loans, withdrawal of deposit balances and maturities of deposits and other liabilities. Liquid assets include cash and due from banks, interest-earning demand deposits with banks, federal funds sold and available for sale investment securities.
Loans maturing within one year or less at December 31, 2014 totaled $160.9 million. At December 31, 2014, time deposits maturing within one year or less totaled $392.7 million. Our held-to-maturity investment securities portfolio at December 31, 2014 was $141.8 million or 22.1% of the investment portfolio compared to $150.3 million or 23.7% at December 31, 2013. The securities in the held-to-maturity portfolio are used to collateralize public funds deposits and may also be used to secure borrowings with the FHLB or Federal Reserve Bank. The agency securities in the held-to-maturity portfolio have maturities of 10 years or less. The mortgage backed securities have stated final maturities of 15 to 20 years at December 31, 2014. The held-to-maturity portfolio had a forecasted weighted average life of approximately 5.1 years based on current interest rates at December 31, 2014. Management regularly monitors the size and composition of the held-to-maturity portfolio to evaluate its effect on our liquidity. Our available for sale portfolio was $499.8 million, or 77.9% of the investment portfolio at December 31, 2014 compared to $484.2 million, or 76.3% at December 31, 2013. The majority of the available for sale portfolio was comprised of U.S. Treasuries, U.S. Government Agencies, municipal bonds and investment grade corporate bonds. We believe these securities are readily marketable and enhance our liquidity.
We maintained a net borrowing capacity at the FHLB totaling $156.4 million and $109.6 million at December 31, 2014 and December 31, 2013, respectively with no borrowings outstanding at either date. At December 31, 2014, we have outstanding letters of credit from the FHLB in the amount of $150.0 million that were used to collateralize public funds deposits. We also have a discount window line with the Federal Reserve Bank. We also maintain federal funds lines of credit at various correspondent banks with borrowing capacity of $70.5 million at December 31, 2014. We have a revolving line of credit for $2.5 million, with an outstanding balance of $1.8 million at December 31, 2014. Management believes there is sufficient liquidity to satisfy current operating needs.
47
Capital Resources
Our capital position is reflected in total shareholders’ equity, subject to certain adjustments for regulatory purposes. Further, our capital base allows us to take advantage of business opportunities while maintaining the level of resources we deem appropriate to address business risks inherent in daily operations.
Total shareholders’ equity increased to $139.6 million at December 31, 2014 from $123.4 million at December 31, 2013. The increase in total shareholders’ equity was principally the result of a reduction in the balance of the accumulated other comprehensive income (loss) from a $9.1 million loss at December 31, 2013 to a $0.2 million gain at December 31, 2014. The reduction was primarily due to a $9.4 million decrease in net unrealized mark to market losses on available for sale securities (after taxes) as a result of a decline in market interest rates. Shareholders’ equity also increased due to net income of $11.2 million during the year ended December 31, 2014, partially offset by $4.0 million in cash dividends paid on our common stock and $0.4 million in dividends paid on our Series C Preferred Stock issued to the Treasury in connection with our participation in the SBLF. We are currently at the contractual minimum dividend rate of 1.0% on our SBLF capital. Beginning on March 22, 2016, the per annum dividend rate on the Series C Preferred Stock will increase to a fixed rate of 9.0% if any Series C Preferred Stock remains outstanding.
The Company filed a Form S-1 registration statement with the Securities and Exchange Commission on October 24, 2014 which was subsequently amended in order to facilitate a common stock offering. On December 18, 2014, the Company elected to defer the offering due to market conditions. The deferred costs associated with the common stock offering were $0.8 million at December 31, 2014.
Capital Management
We manage our capital to comply with our internal planning targets and regulatory capital standards administered by the Federal Reserve and the FDIC. We review capital levels on a monthly basis. We evaluate a number of capital ratios, including Tier 1 capital to total adjusted assets (the leverage ratio) and Tier 1 capital to risk-weighted assets. At December 31, 2014, First Guaranty Bancshares and First Guaranty Bank were classified as well-capitalized.
The following table presents our capital ratios as of the indicated dates.
| (in thousands except for %) | "Well Capitalized Minimums" |
At December 31, 2014
|
At December 31, 2013
|
|||
| December 31, 2014 | ||||||
|
Tier 1 Leverage Ratio:
|
||||||
|
Consolidated
|
5.00 |
%
|
9.33
|
% |
9.14
|
% |
|
Bank
|
5.00 |
%
|
9.26
|
% |
9.17
|
% |
|
Tier 1 Risk-based Capital Ratio:
|
||||||
|
Consolidated
|
6.00 |
%
|
13.16
|
% |
13.61
|
% |
|
Bank
|
6.00 |
%
|
13.08
|
% |
13.66
|
% |
|
Total Risk-based Capital Ratio:
|
||||||
|
Consolidated
|
10.00 |
%
|
14.05
|
% |
14.71
|
% |
|
Bank
|
10.00 |
%
|
13.96
|
% |
14.76
|
% |
48
Off-balance sheet commitments
We are a party to financial instruments with off-balance sheet risk in the normal course of business to meet the financing needs of its customers and to reduce its own exposure to fluctuations in interest rates. These financial instruments include commitments to extend credit and standby and commercial letters of credit. Those instruments involve, to varying degrees, elements of credit and interest rate risk in excess of the amount recognized in our consolidated balance sheets. The contract or notional amounts of those instruments reflect the extent of the involvement in particular classes of financial instruments.
The exposure to credit loss in the event of nonperformance by the other party to the financial instrument for commitments to extend credit and standby and commercial letters of credit is represented by the contractual notional amount of those instruments. The same credit policies are used in making commitments and conditional obligations as it does for on-balance sheet instruments. Unless otherwise noted, collateral or other security is not required to support financial instruments with credit risk.
The notional amounts of the financial instruments with off-balance sheet risk at December 31, 2014, 2013 and 2012 are as follows:
|
Contract Amount
|
|
(in thousands)
|
December 31, 2014 | December 31, 2013 | December 31, 2012 | |||||
| Commitments to Extend Credit | $ | 59,675 | $ | 30,516 | $ | 26,775 | ||
| Unfunded Commitments under lines of credit | $ | 111,247 | $ | 115,311 | $ | 71,423 | ||
| Commercial and Standby letters of credit | $ | 7,743 | $ | 7,695 | $ | 5,470 | ||
Commitments to extend credit are agreements to lend to a customer as long as there is no violation of any condition established in the contract. Commitments generally have fixed expiration dates or other termination clauses and may require payment of a fee. Since commitments may expire without being drawn upon, the total commitment amounts do not necessarily represent future cash requirements. Each customer’s creditworthiness is evaluated on a case-by-case basis. The amount of collateral obtained, if deemed necessary upon extension of credit, is based on our credit evaluation of the counterpart. Collateral requirements vary but may include accounts receivable, inventory, property, plant and equipment, residential real estate and commercial properties.
Unfunded commitments under lines of credit are contractually obligated by us as long as the borrower is in compliance with the terms of the loan relationship. Unfunded lines of credit are typically operating lines of credit that adjust on a regular basis as a customer requires funding. There may be seasonal variations to the usage of these lines. At December 31, 2014, the largest concentration of unfunded commitments were lines of credit associated with commercial and industrial loans.
Commercial and standby letters of credit are conditional commitments to guarantee the performance of a customer to a third party. These guarantees are primarily issued to support public and private borrowing arrangements, including commercial paper, bond financing and similar transactions. The majority of these guarantees are short-term (one year or less); however, some guarantees extend for up to three years. The credit risk involved in issuing letters of credit is essentially the same as that involved in extending loan facilities to customers. Collateral requirements are the same as on-balance sheet instruments and commitments to extend credit.
There were no losses incurred on any commitments during the years ended December 31, 2014, 2013 and 2012.
Contractual Obligations
The following table summarizes our fixed and determinable contractual obligations and other funding needs by payment date at December 31, 2014. The payment amounts represent those amounts due to the recipient and do not include any unamortized premiums or discounts or other similar carrying amount adjustments.
| Payments Due by Period: | December 31, 2014 | |||||||||||
| (in thousands) |
Less Than One Year
|
One to Three Years
|
Over Three Years
|
Total
|
||||||||
|
Operating leases
|
$
|
32
|
$
|
62
|
$
|
88
|
$
|
182
|
||||
|
Software contracts
|
1,391
|
1,987
|
1,415
|
4,793
|
||||||||
|
Time deposits
|
392,738
|
213,206
|
51,081
|
657,025
|
||||||||
|
Short-term borrowings
|
1,800
|
-
|
-
|
1,800
|
||||||||
|
Long-term borrowings
|
-
|
1,455
|
-
|
1,455
|
||||||||
|
Total contractual obligations
|
$
|
395,961
|
$
|
216,710
|
$
|
52,584
|
$
|
665,255
|
||||
49
Item 7A – Quantitative and Qualitative Disclosures about Market Risk
Asset/Liability Management and Market Risk
Asset/Liability Management.
Our asset/liability management process consists of quantifying, analyzing and controlling interest rate risk to maintain reasonably stable net interest income levels under various interest rate environments. The principal objective of asset/liability management is to maximize net interest income while operating within acceptable limits established for interest rate risk and to maintain adequate levels of liquidity.
The majority of our assets and liabilities are monetary in nature. Consequently, one of our most significant forms of market risk is interest rate risk, which is inherent in our lending and deposit-taking activities. Our assets, consisting primarily of loans secured by real estate and fixed rate securities in our investment portfolio, have longer maturities than our liabilities, consisting primarily of deposits. As a result, a principal part of our business strategy is to manage interest rate risk and reduce the exposure of our net interest income to changes in market interest rates. The board of directors of First Guaranty Bank has established two committees, the management asset liability committee and the board investment committee, to oversee the interest rate risk inherent in our assets and liabilities, for determining the level of risk that is appropriate given our business strategy, operating environment, capital, liquidity and performance objectives, and for managing this risk consistent with the guidelines approved by the board of directors. The management asset liability committee is comprised of senior officers of the Bank and meets as needed to review our asset liability policies and interest rate risk position. The board ALCO investment committee is comprised of certain members of the board of directors of the Bank and meets monthly. The management asset liability committee provides a monthly report to the board ALCO investment committee.
The need for interest sensitivity gap management is most critical in times of rapid changes in overall interest rates. We generally seek to limit our exposure to interest rate fluctuations by maintaining a relatively balanced mix of rate sensitive assets and liabilities on a one-year time horizon and greater than one-year time horizon. Because of the significant impact on net interest margin from mismatches in repricing opportunities, we monitor the asset-liability mix periodically depending upon the management asset liability committee’s assessment of current business conditions and the interest rate outlook. We maintain exposure to interest rate fluctuations within prudent levels using varying investment strategies. These strategies include, but are not limited to, frequent internal modeling of asset and liability values and behavior due to changes in interest rates. We monitor cash flow forecasts closely and evaluate the impact of both prepayments and extension risk.
The following interest sensitivity analysis is one measurement of interest rate risk. This analysis, which we prepare monthly, reflects the contractual maturity characteristics of assets and liabilities over various time periods. This analysis does not factor in prepayments or interest rate floors on loans which may significantly change the report. This table includes nonaccrual loans in their respective maturity periods. The gap indicates whether more assets or liabilities are subject to repricing over a given time period. The interest sensitivity analysis at December 31, 2014 illustrated below reflects a liability-sensitive position with a negative cumulative gap on a one-year basis.
|
December 31, 2014
|
|||||||||||||||
|
Interest Sensitivity Within
|
|||||||||||||||
|
(in thousands)
|
3 Months Or Less
|
Over 3 Months thru 12 Months
|
Total One Year
|
Over One Year
|
Total | ||||||||||
|
Earning Assets:
|
|||||||||||||||
| Loans (including loans held for sale) | $ |
208,543
|
$
|
82,237
|
$
|
290,780
|
$
|
499,541
|
$
|
790,321 | |||||
|
Securities (including FHLB stock)
|
41,105
|
32,181
|
73,286
|
569,938
|
643,224
|
||||||||||
|
Federal Funds Sold
|
210
|
-
|
210
|
-
|
210
|
||||||||||
|
Other earning assets
|
44,969
|
-
|
44,969
|
-
|
44,969 | ||||||||||
|
Total earning assets
|
$
|
294,827
|
$
|
114,418
|
$
|
409,245
|
$
|
1,069,479
|
$
|
1,478,724
|
|||||
|
Source of Funds:
|
|||||||||||||||
|
Interest-bearing accounts:
|
|||||||||||||||
|
Demand deposits
|
$
|
432,294
|
$
|
-
|
$
|
432,294
|
$
|
-
|
$
|
432,294
|
|||||
|
Savings deposits
|
74,550
|
-
|
74,550
|
-
|
74,550
|
||||||||||
|
Time deposits
|
153,340
|
239,398
|
392,738
|
264,288
|
657,026
|
||||||||||
|
Short-term borrowings
|
-
|
1,800
|
1,800
|
-
|
1,800
|
||||||||||
|
Long-term borrowings
|
-
|
-
|
-
|
1,455
|
1,455
|
||||||||||
|
Noninterest-bearing, net
|
-
|
-
|
-
|
311,599
|
311,599
|
||||||||||
|
Total source of funds
|
$
|
660,184
|
$
|
241,198
|
$
|
901,382
|
$
|
577,342
|
$
|
1,478,724
|
|||||
|
Period gap
|
$
|
(365,357
|
)
|
$
|
(126,780
|
)
|
$
|
(492,137
|
)
|
$
|
492,137
|
||||
|
Cumulative gap
|
$
|
(365,357
|
)
|
$
|
(492,137
|
)
|
$
|
(492,137
|
)
|
$
|
-
|
||||
|
Cumulative gap as a percent of earning assets
|
-24.7
|
%
|
-33.3
|
%
|
-33.33
|
%
|
|||||||||
50
Net Interest Income at Risk.
Net interest income at risk measures the risk of a decline in earnings due to changes in interest rates. The first table below presents an analysis of our interest rate risk as measured by the estimated changes in net interest income resulting from an instantaneous and sustained parallel shift in the yield curve over a 12-month horizon at December 31, 2014. The second table below presents an analysis of our interest rate risk as measured by the estimated changes in net interest income resulting from a gradual shift in the yield curve over a 12-month period. Shifts are measured in 100 basis point increments (+400 through -100 basis points) from base case. We do not present shifts less than 100 basis points because of the current low interest rate environment. The base case scenario encompasses key assumptions for asset/liability mix, loan and deposit growth, pricing, prepayment speeds, deposit decay rates, securities portfolio cash flows and reinvestment strategy and the market value of certain assets under the various interest rate scenarios. The base case scenario assumes that the current interest rate environment is held constant throughout the forecast period for a static balance sheet and the instantaneous and gradual shocks are performed against that yield curve.
| December 31, 2014 | |||
| Instantaneus Changes in Interest Rates (basis points) |
Percent Change in Net Interest Income
|
||
| +400 | -10.55 | % | |
| +300 | -5.06 | % | |
| +200 | -3.01 | % | |
| +100 | -1.00 | % | |
| Base | - | % | |
| -100 | -3.60 | % | |
| Gradual Changes in Interest Rates (basis points) |
Percent Change in Net Interest Income
|
||
| +400 | -2.25 | % | |
| +300 | -1.21 | % | |
| +200 | -0.61 | % | |
| +100 | -0.22 | % | |
| Base | - | % | |
| -100 | -0.70 | % | |
These scenarios above are both instantaneous and gradual shocks that assume balance sheet management will mirror the base case. Even if interest rates change in the designated amounts, there can be no assurance that our assets and liabilities would perform as anticipated. Additionally, a change in the U.S. Treasury rates in the designated amounts accompanied by a change in the shape of the U.S. Treasury yield curve would cause significantly different changes to net interest income than indicated above. Strategic management of our balance sheet would be adjusted to accommodate these movements. As with any method of measuring interest rate risk, certain shortcomings are inherent in the methods of analysis presented above. For example, although certain assets and liabilities may have similar maturities or periods to repricing, they may react in different degrees to changes in market interest rates. Also, the interest rates on certain types of assets and liabilities may fluctuate in advance of changes in market interest rates, while interest rates on other types may lag behind changes in market rates. Also, the ability of many borrowers to service their debt may decrease in the event of an interest rate increase. We consider all of these factors in monitoring exposure to interest rate risk.
We are pursuing a strategy that began in 2012 to reduce long-term interest rate risk. The contractual maturity of the investment portfolio was shortened and mortgage backed securities were purchased to enhance cash flow. We were able to grow our loan portfolio while reducing the size of the investment portfolio. New loans originated generally were either floating rate or were fixed rate with maturities that did not exceed five years. Securities as a percentage of average interest-earning assets decreased from 46.3% in 2013 to 45.4% in 2014. Deposit maturities were extended and generally priced lower. We believe that the addition of short-term securities and deploying our capital to grow our loan portfolio will help to lower interest rate risk.
51
Item 8 - Financial Statements and Supplementary Data
Report of Castaing, Hussey & Lolan, LLC
Independent Registered Accounting Firm
To the Shareholders and Board of Directors
First Guaranty Bancshares, Inc.
We have audited the accompanying consolidated balance sheets of First Guaranty Bancshares, Inc. as of December 31, 2014 and 2013, and the related consolidated statements of income, comprehensive income, changes in shareholders’ equity and cash flows for each of the years in the three-year period ended December 31, 2014. These financial statements are the responsibility of the Company's Management. Our responsibility is to express an opinion on these financial statements based on our audits.
We conducted our audits in accordance with the standards of the Public Company Accounting Oversight Board (United States). Those standards require that we plan and perform the audit to obtain reasonable assurance about whether the financial statements are free of material misstatement. An audit includes examining, on a test basis, evidence supporting the amounts and disclosures in the financial statements. An audit also includes assessing the accounting principles used and significant estimates made by Management, as well as evaluating the overall financial statement presentation. We believe that our audits provide a reasonable basis for our opinion.
In our opinion, the financial statements referred to above present fairly, in all material respects, the consolidated financial position of First Guaranty Bancshares, Inc. as of December 31, 2014 and 2013, and the consolidated results of its operations and its cash flows for each of the years in the three-year period ended December 31, 2014 in conformity with accounting principles generally accepted in the United States of America.
We also audited, in accordance with the standards of the American Institute of Certified Public Accountants, First Guaranty Bancshares, Inc.'s internal control over financial reporting as of December 31, 2014, based on criteria established in Internal Control-Integrated Framework issued by the Committee of Sponsoring Organizations of the Treadway Commission (1992) and our report dated March 17, 2015 expressed an unqualified opinion thereon.
/s/ Castaing, Hussey & Lolan, LLC
Castaing, Hussey & Lolan, LLC
New Iberia, Louisiana
March 17, 2015
52
|
CONSOLIDATED BALANCE SHEETS
|
||||||
| (in thousands, except share data) | December 31, 2014 |
December 31, 2013
|
||||
|
Assets
|
||||||
|
Cash and cash equivalents:
|
||||||
|
Cash and due from banks
|
$ | 44,365 |
$
|
60,819
|
||
|
Federal funds sold
|
210 |
665
|
||||
|
Cash and cash equivalents
|
44,575 |
61,484
|
||||
| Interest-earning time deposits with banks | 10,247 | 747 | ||||
|
Investment securities:
|
||||||
|
Available for sale, at fair value
|
499,808 |
484,211
|
||||
|
Held to maturity, at cost (estimated fair value of $139,688 and $141,642, respectively)
|
141,795 |
150,293
|
||||
|
Investment securities
|
641,603 |
634,504
|
||||
|
Federal Home Loan Bank stock, at cost
|
1,621 |
1,835
|
||||
| Loans held for sale | - | 88 | ||||
|
Loans, net of unearned income
|
790,321 |
703,166
|
||||
|
Less: allowance for loan losses
|
9,105 |
10,355
|
||||
|
Net loans
|
781,216 |
692,811
|
||||
|
Premises and equipment, net
|
19,211 |
19,612
|
||||
|
Goodwill
|
1,999 |
1,999
|
||||
|
Intangible assets, net
|
1,733 |
2,073
|
||||
|
Other real estate, net
|
2,198 |
3,357
|
||||
|
Accrued interest receivable
|
6,384 |
6,258
|
||||
|
Other assets
|
8,089 |
11,673
|
||||
|
Total Assets
|
$ | 1,518,876 |
$
|
1,436,441
|
||
|
Liabilities and Shareholders' Equity
|
||||||
|
Deposits:
|
||||||
|
Noninterest-bearing demand
|
$ | 207,969 |
$
|
204,291
|
||
|
Interest-bearing demand
|
432,294 |
391,350
|
||||
|
Savings
|
74,550 |
65,445
|
||||
|
Time
|
657,026 |
642,013
|
||||
|
Total deposits
|
1,371,839 |
1,303,099
|
||||
|
Short-term borrowings
|
1,800 |
5,788
|
||||
|
Accrued interest payable
|
1,997 |
2,364
|
||||
| Long-term borrowing | 1,455 | 500 | ||||
|
Other liabilities
|
2,202 |
1,285
|
||||
|
Total Liabilities
|
1,379,293 |
1,313,036
|
||||
|
Shareholders' Equity
|
||||||
|
Preferred stock:
|
||||||
| Series C - $1,000 par value - authorized 39,435 shares; issued and outstanding 39,435 | 39,435 | 39,435 | ||||
|
Common stock:
|
||||||
|
$1 par value - authorized 100,600,000 shares; issued 6,294,227 shares
|
6,294 |
6,294
|
||||
|
Surplus
|
39,387 |
39,387
|
||||
| Treasury stock, at cost, 2,895 shares | (54 | ) | (54 | ) | ||
|
Retained earnings
|
54,280 |
47,477
|
||||
|
Accumulated other comprehensive income (loss)
|
241 |
(9,134
|
)
|
|||
|
Total Shareholders' Equity
|
139,583 |
123,405
|
||||
|
Total Liabilities and Shareholders' Equity
|
$ | 1,518,876 |
$
|
1,436,441
|
||
| See Notes to the Consolidated Financial Statements. | ||||||
53
|
CONSOLIDATED STATEMENTS OF INCOME
|
|||||||||
| Years Ended December 31, | |||||||||
| (in thousands, except share data) | 2014 | 2013 |
2012
|
||||||
|
Interest Income:
|
|||||||||
|
Loans (including fees)
|
$ | 39,787 |
$
|
37,289 | $ |
36,136
|
|||
|
Loans held for sale
|
- | - |
8
|
||||||
|
Deposits with other banks
|
115 | 157 |
92
|
||||||
|
Securities (including FHLB stock)
|
13,395 | 13,439 |
18,949
|
||||||
|
Federal funds sold
|
- | 1 |
10
|
||||||
|
Total Interest Income
|
53,297 | 50,886 |
55,195
|
||||||
|
Interest Expense:
|
|||||||||
|
Demand deposits
|
1,312 | 1,262 |
1,383
|
||||||
|
Savings deposits
|
33 | 41 |
55
|
||||||
|
Time deposits
|
7,716 | 9,682 |
11,560
|
||||||
|
Borrowings
|
141 | 149 |
122
|
||||||
|
Total Interest Expense
|
9,202 | 11,134 |
13,120
|
||||||
|
Net Interest Income
|
44,095 | 39,752 |
42,075
|
||||||
|
Less: Provision for loan losses
|
1,962 | 2,520 |
4,134
|
||||||
|
Net Interest Income after Provision for Loan Losses
|
42,133 | 37,232 |
37,941
|
||||||
|
Noninterest Income:
|
|||||||||
|
Service charges, commissions and fees
|
2,767 | 3,006 |
3,201
|
||||||
| ATM and debit card fees | 1,671 | 1,634 | 1,569 | ||||||
|
Net gains on securities
|
295 | 1,571 |
4,868
|
||||||
|
Net loss on sale of loans
|
(12 | ) | (70 | ) |
(68
|
) | |||
| Loss on sale of fixed assets | - | - | (109 | ) | |||||
|
Other
|
1,456 | 1,337 |
1,679
|
||||||
|
Total Noninterest Income
|
6,177 | 7,478 |
11,140
|
||||||
|
Noninterest Expense:
|
|||||||||
|
Salaries and employee benefits
|
15,840 | 14,368 |
13,668
|
||||||
|
Occupancy and equipment expense
|
3,928 | 3,949 |
3,713
|
||||||
|
Other
|
11,826 | 12,670 |
13,780
|
||||||
|
Total Noninterest Expense
|
31,594 | 30,987 |
31,161
|
||||||
|
Income Before Income Taxes
|
16,716 | 13,723 |
17,920
|
||||||
|
Less: Provision for income taxes
|
5,492 | 4,577 |
5,861
|
||||||
|
Net Income
|
$ | 11,224 | $ | 9,146 | $ |
12,059
|
|||
|
Preferred stock dividends
|
(394 | ) | (713 | ) |
(1,972
|
) | |||
|
Income Available to Common Shareholders
|
$ | 10,830 |
$
|
8,433 | $ |
10,087
|
|||
|
Per Common Share:
|
|||||||||
|
Earnings
|
$ | 1.72 |
$
|
1.34 | $ |
1.60
|
|||
|
Cash dividends paid
|
$ | 0.64 |
$
|
0.64 | $ |
0.64
|
|||
|
Weighted Average Common Shares Outstanding
|
6,291,332 | 6,291,332 |
6,292,855
|
||||||
|
See Notes to Consolidated Financial Statements
|
|||||||||
54
| FIRST GUARANTY BANCSHARES, INC. AND SUBSIDIARY | |||||||||
|
CONSOLIDATED STATEMENTS OF COMPREHENSIVE INCOME (LOSS)
|
|||||||||
| Years Ended December 31, | |||||||||
| (in thousands) | 2014 | 2013 | 2012 | ||||||
| Net Income | $ | 11,224 | $ | 9,146 | $ | 12,059 | |||
| Other comprehensive income (loss): | |||||||||
| Unrealized gains (losses) on securities: | |||||||||
| Unrealized holding gains (losses) arising during the period | 14,499 | (21,432 | ) | 7,263 | |||||
| Reclassification adjustments for net gains included in net income | (295 | ) | (1,571 | ) | (4,868 | ) | |||
| Change in unrealized gains (losses) on securities | 14,204 | (23,003 | ) | 2,395 | |||||
| Tax impact | (4,829 | ) | 7,821 | (814 | ) | ||||
| Other comprehensive income (loss) | 9,375 | (15,182 | ) | 1,581 | |||||
| Comprehensive Income (loss) | $ | 20,599 | $ | (6,036 | ) | $ | 13,640 | ||
| See Notes to Consolidated Financial Statements | |||||||||
55
| FIRST GUARANTY BANCSHARES, INC. AND SUBSIDIARY | |||||||||||||||||||||
| CONSOLIDATED STATEMENTS OF CHANGES IN SHAREHOLDERS' EQUITY | |||||||||||||||||||||
| Series C | Accumulated | ||||||||||||||||||||
| Preferred | Common | Other | |||||||||||||||||||
| Stock | Stock | Treasury | Retained | Comprehensive | |||||||||||||||||
| (in thousands, except share data) | $1,000 Par | $1 Par | Surplus | Stock | Earnings | Income/(Loss) | Total | ||||||||||||||
|
Balance December 31, 2011
|
$ | 39,435 | $ |
6,294
|
|
$ |
39,387
|
|
$ | - | $ |
37,019
|
|
$ |
4,467
|
|
$ |
126,602
|
|||
|
Net income
|
- |
-
|
-
|
- |
12,059
|
-
|
12,059
|
||||||||||||||
|
Change in unrealized loss on AFS securities, net of reclassification adjustments and taxes
|
- |
-
|
-
|
- |
-
|
1,581
|
1,581
|
||||||||||||||
| Treasury shares purchased, at cost, 2,895 shares | - | - | - | (54 | ) | - | - | (54 | ) | ||||||||||||
| Cash dividends on common stock ($0.64 per share) | - | - | - | - | (4,035 | ) | - | (4,035 | ) | ||||||||||||
|
Preferred stock dividends
|
- |
-
|
-
|
- |
(1,972
|
)
|
-
|
(1,972
|
)
|
||||||||||||
|
Balance December 31, 2012
|
$ | 39,435 | $ |
6,294
|
|
$ |
39,387
|
|
$ | (54 | ) | $ |
43,071
|
|
$ |
6,048
|
|
$ |
134,181
|
||
| Net income | - | - | - | - | 9,146 | - | 9,146 | ||||||||||||||
|
Change in unrealized gain on AFS securities, net of reclassification adjustments and taxes
|
- |
-
|
-
|
- |
-
|
(15,182
|
)
|
(15,182
|
)
|
||||||||||||
| Cash dividends on common stock ($0.64 per share) | - | - | - | - | (4,027 | ) | - | (4,027 | ) | ||||||||||||
|
Preferred stock dividends
|
- |
-
|
-
|
- |
(713
|
)
|
-
|
(713
|
)
|
||||||||||||
|
Balance December 31, 2013
|
$ | 39,435 | $ | 6,294 | $ | 39,387 | $ | (54 | ) | $ | 47,477 | $ | (9,134 | ) | $ | 123,405 | |||||
|
Net income
|
- | - | - | - | 11,224 | - | 11,224 | ||||||||||||||
| Change in unrealized gain on AFS securities, net of reclassification adjustments and taxes | - | - | - | - | - | 9,375 | 9,375 | ||||||||||||||
|
Cash dividends on common stock ($0.64 per share)
|
- | - | - | - | (4,027 | ) | - | (4,027 | ) | ||||||||||||
| Preferred stock dividends | - | - | - | - | (394 | ) | - | (394 | ) | ||||||||||||
| Balance December 31, 2014 | $ | 39,435 | $ | 6,294 | $ | 39,387 | $ | (54 | ) | $ | 54,280 | $ | 241 | $ | 139,583 | ||||||
| See Notes to Consolidated Financial Statements | |||||||||||||||||||||
56
|
CONSOLIDATED STATEMENTS OF CASH FLOWS
|
|||||||||
| Years Ended December 31, | |||||||||
| (in thousands) | 2014 |
2013
|
2012
|
||||||
|
Cash Flows From Operating Activities:
|
|||||||||
|
Net income
|
$ | 11,224 |
$
|
9,146
|
$
|
12,059
|
|||
|
Adjustments to reconcile net income to net cash provided by operating activities:
|
|||||||||
|
Provision for loan losses
|
1,962 |
2,520
|
4,134
|
||||||
|
Depreciation and amortization
|
2,143 |
2,111
|
2,096
|
||||||
|
Amortization/Accretion of investments
|
2,164 |
2,141
|
1,962
|
||||||
|
Gain on sale/call of securities
|
(295 | ) |
(1,571
|
) |
(4,868
|
) | |||
|
Loss (gain) on sale of assets
|
(17 | ) |
61
|
259
|
|||||
|
ORE and repossessed property writedowns and loss on disposition
|
665 |
335
|
1,480
|
||||||
|
FHLB stock dividends
|
(4 | ) |
(4
|
) |
(4
|
) | |||
| Net decrease (increase) in loans held for sale | 88 | 469 | (557 | ) | |||||
|
Change in other assets and liabilities, net
|
(1,140 | ) |
1,958
|
338
|
|||||
|
Net cash provided by operating activities
|
16,790 |
17,166
|
16,899
|
||||||
|
Cash Flows From Investing Activities:
|
|||||||||
|
Proceeds from maturities and calls of HTM securities
|
8,279 |
16,184
|
144,640
|
||||||
|
Proceeds from maturities, calls and sales of AFS securities
|
535,167 |
626,433
|
782,706
|
||||||
|
Funds invested in HTM securities
|
- |
(107,616
|
) |
(65,873
|
) | ||||
|
Funds Invested in AFS securities
|
(538,209 | ) |
(533,320
|
)
|
(884,258
|
) | |||
| Proceeds from sale/redemption of Federal Home Loan Bank stock | 4,169 | 3,268 | 4,030 | ||||||
| Funds invested in Federal Home Loan Bank stock | (3,950 | ) | (3,825 | ) | (4,658 | ) | |||
| Funds invested in certificates of deposit | (10,000 | ) | - | (747 | ) | ||||
| Proceeds from maturities and calls of certificates of deposit | 500 | ||||||||
|
Net increase in loans
|
(92,697 | ) | (78,777 | ) |
(63,864
|
) | |||
|
Purchases of premises and equipment
|
(1,668 | ) |
(1,757
|
)
|
(1,566
|
) | |||
| Proceeds from sales of premises and equipment | 375 | - | 178 | ||||||
|
Proceeds from sales of other real estate owned
|
3,049 |
1,306
|
6,632
|
||||||
|
Net cash used in investing activities
|
(94,985 | ) |
(78,104
|
) |
(82,780
|
) | |||
|
Cash Flows From Financing Activities:
|
|||||||||
|
Net increase in deposits
|
68,740 |
50,487
|
45,310
|
||||||
|
Net (decrease) increase in federal funds purchased and short-term borrowings
|
(3,988 | ) |
(8,958
|
) | 2,523 | ||||
| Proceeds from long-term borrowings | 1,555 | - | - | ||||||
|
Repayment of long-term borrowings
|
(600 | ) |
(600
|
) |
(2,100
|
) | |||
| Repurchase of common stock | - | - | (54 | ) | |||||
|
Dividends paid
|
(4,421 | ) |
(4,740
|
)
|
(6,007
|
) | |||
|
Net cash provided by financing activities
|
61,286 |
36,189
|
39,672
|
||||||
|
Net decrease in cash and cash equivalents
|
(16,909 | ) |
(24,749
|
) |
(26,209
|
) | |||
|
Cash and cash equivalents at the beginning of the period
|
61,484 |
86,233
|
112,442
|
||||||
|
Cash and cash equivalents at the end of the period
|
$ | 44,575 |
$
|
61,484
|
$
|
86,233
|
|||
|
Noncash activities:
|
|||||||||
|
Loans transferred to foreclosed assets
|
$ | 2,330 |
$
|
2,604
|
$
|
4,793
|
|||
|
Cash paid during the period:
|
|||||||||
|
Interest on deposits and borrowed funds
|
$ | 9,569 |
$
|
11,610
|
$
|
13,789
|
|||
|
Income taxes
|
$ | 4,500 |
$
|
2,850
|
$
|
5,800
|
|||
| See Notes to the Consolidated Financial Statements. | |||||||||
Note 1. Business and Summary of Significant Accounting Policies
Business
First Guaranty Bancshares, Inc. (the “Company”) is a Louisiana corporation headquartered in Hammond, LA. The Company owns all of the outstanding shares of common stock of First Guaranty Bank. First Guaranty Bank (the “Bank”) is a Louisiana state-chartered commercial bank that provides a diversified range of financial services to consumers and businesses in the communities in which it operates. These services include consumer and commercial lending, mortgage loan origination, the issuance of credit cards and retail banking services. The Bank also maintains an investment portfolio comprised of government, government agency, corporate, and municipal securities. The Bank has twenty-one banking offices, including one drive-up banking facility, and twenty-seven automated teller machines (ATMs) in Southeast, Southwest and North Louisiana.
Summary of significant accounting policies
The accounting and reporting policies of the Company conform to generally accepted accounting principles and to predominant accounting practices within the banking industry. The more significant accounting and reporting policies are as follows:
Consolidation
The consolidated financial statements include the accounts of First Guaranty Bancshares, Inc., and its wholly owned subsidiary, First Guaranty Bank. All significant intercompany balances and transactions have been eliminated in consolidation.
Acquisition Accounting
Acquisitions are accounted for under the purchase method of accounting. Purchased assets, including identifiable intangibles, and assumed liabilities are recorded at their respective acquisition date fair values. If the fair value of net assets purchased exceeds the consideration given, a gain on acquisition is recognized. If the consideration given exceeds the fair value of the net assets received, goodwill is recognized. Fair values are subject to refinement for up to one year after the closing date of an acquisition as information relative to closing date fair values becomes available. Purchased loans acquired in a business combination are recorded at estimated fair value on their purchase date with no carryover of the related allowance for loan losses. See Acquired Loans section below for accounting policy regarding loans acquired in a business combination.
Use of estimates
The preparation of financial statements in conformity with generally accepted accounting principles requires Management to make estimates and assumptions that affect the reported amounts of assets and liabilities and disclosure of contingent assets and liabilities at the dates of the financial statements and the reported amounts of revenue and expense during the reporting periods. Actual results could differ from those estimates. Material estimates that are particularly susceptible to significant change in the near-term relate to the determination of the allowance for loan losses, the valuation of real estate acquired in connection with foreclosures or in satisfaction of loans, and the valuation of investment securities. In connection with the determination of the allowance for loan losses and real estate owned, the Company obtains independent appraisals for significant properties.
Cash and cash equivalents
For purposes of reporting cash flows, cash and cash equivalents are defined as cash, due from banks, interest-bearing demand deposits with banks and federal funds sold with maturities of three months or less.
Securities
The Company reviews its financial position, liquidity and future plans in evaluating the criteria for classifying investment securities. Debt securities that Management has the ability and intent to hold to maturity are classified as held to maturity and carried at cost, adjusted for amortization of premiums and accretion of discounts using methods approximating the interest method. Securities available for sale are stated at fair value. The unrealized difference, if any, between amortized cost and fair value of these AFS securities is excluded from income and is reported, net of deferred taxes, in accumulated other comprehensive income as a part of shareholders’ equity. Details of other comprehensive income are reported in the consolidated statements of comprehensive income. Realized gains and losses on securities are computed based on the specific identification method and are reported as a separate component of other income. Amortization of premiums and discounts is included in interest income. Discounts and premiums related to debt securities are amortized using the effective interest rate method.
Any security that has experienced a decline in value, which Management believes is deemed other than temporary, is reduced to its estimated fair value by a charge to operations. In estimating other-than-temporary impairment losses, Management considers (1) the length of time and the extent to which the fair value has been less than cost, (2) the financial condition and near-term prospects of the issuer, and (3) the intent and ability of the Company to retain its investment in the issuer for a period of time sufficient to allow for any anticipated recovery in fair value.
58
Loans held for sale
Mortgage loans originated and intended for sale in the secondary market are carried at the lower of cost or estimated fair value in the aggregate. Net unrealized losses, if any, are recognized through a valuation allowance by charges to income. Loans held for sale have primarily been fixed rate single-family residential mortgage loans under contract to be sold in the secondary market. In most cases, loans in this category are sold within thirty days. Buyers generally have recourse to return a purchased loan under limited circumstances. Recourse conditions may include early payment default, breach of representations or warranties and documentation deficiencies. Mortgage loans held for sale are generally sold with the mortgage servicing rights released. Gains or losses on sales of mortgage loans are recognized based on the differences between the selling price and the carrying value of the related mortgage loans sold.
Loans
Loans are stated at the principal amounts outstanding, net of unearned income and deferred loan fees. In addition to loans issued in the normal course of business, overdrafts on customer deposit accounts are considered to be loans and reclassified as such. Interest income on all classifications of loans is calculated using the simple interest method on daily balances of the principal amount outstanding.
Accrual of interest is discontinued on a loan when Management believes, after considering economic and business conditions and collection efforts, the borrower’s financial condition is such that reasonable doubt exists as to the full and timely collection of principal and interest. This evaluation is made for all loans that are 90 days or more contractually past due. When a loan is placed in nonaccrual status, all interest previously accrued but not collected is reversed against current period interest income. Income on such loans is then recognized only to the extent that cash is received and where the future collection of interest and principal is probable. Loans are returned to accrual status when, in the judgment of Management, all principal and interest amounts contractually due are reasonably assured to be collected within a reasonable time frame and when the borrower has demonstrated payment performance of cash or cash equivalents; generally for a period of six months. All loans, except mortgage loans, are considered past due if they are past due 30 days. Mortgage loans are considered past due when two consecutive payments have been missed. Loans that are past due 90-120 days and deemed uncollectible are charged-off. The loan charge off is a reduction of the allowance for loan losses.
Troubled Debt Restructurings (TDRs)
TDRs are loans in which the borrower is experiencing financial difficulty at the time of restructuring, and the Bank has granted a concession to the borrower. TDRs are undertaken in order to improve the likelihood of recovery on the loan and may take the form of modifications made with the stated interest rate lower than the current market rate for new debt with similar risk, other modifications to the structure of the loan that fall outside of normal underwriting policies and procedures, or in limited circumstances forgiveness of principal and / or interest. TDRs can involve loans remaining on non-accrual, moving to non-accrual, or continuing on accrual status, depending on the individual facts and circumstances of the borrower. TDRs are subject to policies governing accrual and non-accrual evaluation consistent with all other loans as discussed in the “Loans” section above. All loans with the TDR designation are considered to be impaired, even if they are accruing.
The Company’s policy is to evaluate TDRs that have subsequently been restructured and returned to market terms after 12 months of performance. The evaluation includes a review of the loan file and analysis of the credit to assess the loan terms, including interest rate to insure such terms are consistent with market terms. The loan terms are compared to a sampling of loans with similar terms and risk characteristics, including loans originated by the Company and loans lost to a competitor. The sample provides a guide to determine market terms pursuant to ASC 310-40-50-2. The loan is also evaluated at that time for impairment A loan determined to be restructured to market terms and not considered impaired will no longer be disclosed as a TDR in the years following the restructuring. These loans will continue to be individually evaluated for impairment. A loan determined to either be restructured to below market terms or to be impaired will remain a TDR.
Credit Quality
The Company’s credit quality indicators are pass, special mention, substandard, and doubtful.
Loans included in the pass category are performing loans with satisfactory debt coverage ratios, collateral, payment history, and documentation requirements.
Special mention loans have potential weaknesses that deserve close attention. If left uncorrected, these potential weaknesses may result in deterioration of the repayment prospects. Borrowers may be experiencing adverse operating trends (declining revenues or margins) or an ill proportioned balance sheet (e.g., increasing inventory without an increase in sales, high leverage, tight liquidity). Adverse economic or market conditions, such as interest rate increases or the entry of a new competitor, may also support a special mention rating. Nonfinancial reasons include management problems, pending litigation, an ineffective loan agreement or other material structural weakness, and any other significant deviation from prudent lending practices.
A substandard loan is inadequately protected by the paying capacity of the obligor or of the collateral pledged, if any. Loans classified as substandard have a well-defined weakness. They are characterized by the distinct possibility that the Company will sustain some loss if the deficiencies are not corrected. These loans require more intensive supervision. Substandard loans are generally characterized by current or expected unprofitable operations, inadequate debt service coverage, inadequate liquidity, or marginal capitalization. Repayment may depend on collateral or other credit risk mitigates. For some substandard loans, the likelihood of full collection of interest and principal may be in doubt and interest is no longer accrued. Consumer loans that are 90 days or more past due or that are nonaccrual are considered substandard.
Doubtful loans have the weaknesses of substandard loans with the additional characteristic that the weaknesses make collection or liquidation in full questionable and there is a high probability of loss based on currently existing facts, conditions and values.
A loan is considered impaired when, based on current information and events, it is probable that the Company will be unable to collect the scheduled payments of principal or interest when due according to the contractual terms of the loan agreement. Factors considered by Management in determining impairment include payment status, collateral value and the probability of collecting scheduled principal and interest payments when due. Loans that experience insignificant payment delays and payment shortfalls generally are not classified as impaired. Management determines the significance of payment delays and payment shortfalls on a case-by-case basis, taking into consideration all of the circumstances surrounding the loan and the borrower, including the length of the delay, the reasons for the delay, the borrower’s prior payment record and the amount of the shortfall in relation to the principal and interest owed. Impairment is measured on a loan-by-loan basis for commercial and construction loans by either the present value of expected future cash flows discounted at the loan’s effective interest rate, the loan’s obtainable market price or the fair value of the collateral if the loan is collateral dependent. This process is only applied to impaired loans or relationships in excess of $250,000. Large groups of smaller balance homogeneous loans are collectively evaluated for impairment. Accordingly, individual consumer and residential loans are not separately identified for impairment disclosures, unless such loans are the subject of a restructuring agreement. Loans that have been restructured in a troubled debt restructuring will continue to be evaluated individually for impairment, including those no longer requiring disclosure.
59
Acquired Loans
Loans are recorded at estimated fair value on their purchase date with no carryover of the related allowance for loan losses. Acquired loans are segregated between those with deteriorated credit quality at acquisition and those deemed as performing. To make this determination, Management considers such factors as past due status, nonaccrual status, credit risk ratings, interest rates and collateral position. The fair value of acquired loans deemed performing is determined by discounting cash flows, both principal and interest, for each pool at prevailing market interest rates as well as consideration of inherent potential losses. The difference between the fair value and principal balances due at acquisition date, the fair value discount, is accreted into income over the estimated life of each loan pool.
Loans acquired in a business combination are recorded at their estimated fair value on their purchase date with no carryover of the related allowance for loan losses. Performing acquired loans are subsequently evaluated for any required allowance at each reporting date. An allowance for loan losses is calculated using a similar methodology for originated loans.
Loan fees and costs
Nonrefundable loan origination and commitment fees and direct costs associated with originating loans are deferred and recognized over the lives of the related loans as an adjustment to the loans' yield using the level yield method.
Allowance for loan losses
The allowance for loan losses is established through a provision for loan losses charged to expense. Loans are charged against the allowance for loan losses when Management believes that the collectability of the principal is unlikely. The allowance, which is based on evaluation of the collectability of loans and prior loan loss experience, is an amount that, in the opinion of Management, reflects the risks inherent in the existing loan portfolio and exists at the reporting date. The evaluations take into consideration a number of subjective factors including changes in the nature and volume of the loan portfolio, overall portfolio quality, review of specific problem loans, current economic conditions that may affect a borrower’s ability to pay, adequacy of loan collateral and other relevant factors. In addition, regulatory agencies, as an integral part of their examination process, periodically review the estimated losses on loans. Such agencies may require additional recognition of losses based on their judgments about information available to them at the time of their examination.
The following are general credit risk factors that affect the Company's loan portfolio segments. These factors do not encompass all risks associated with each loan category. Construction and land development loans have risks associated with interim construction prior to permanent financing and repayment risks due to the future sale of developed property. Farmland and agricultural loans have risks such as weather, government agricultural policies, fuel and fertilizer costs, and market price volatility. 1-4 family, multi-family, and consumer credits are strongly influenced by employment levels, consumer debt loads and the general economy. Non-farm non-residential loans include both owner occupied real estate and non-owner occupied real estate. Common risks associated with these properties is the ability to maintain tenant leases and keep lease income at a level able to service required debt and operating expenses. Commercial and industrial loans generally have non-real estate secured collateral which requires closer monitoring than real estate collateral.
Although Management uses available information to recognize losses on loans, because of uncertainties associated with local economic conditions, collateral values and future cash flows on impaired loans, it is reasonably possible that a material change could occur in the allowance for loan losses in the near term. However, the amount of the change that is reasonably possible cannot be estimated. The evaluation of the adequacy of loan collateral is often based upon estimates and appraisals. Because of changing economic conditions, the valuations determined from such estimates and appraisals may also change. Accordingly, the Company may ultimately incur losses that vary from Management's current estimates. Adjustments to the allowance for loan losses will be reported in the period such adjustments become known or can be reasonably estimated. All loan losses are charged to the allowance for loan losses when the loss actually occurs or when the collectability of the principal is unlikely. Recoveries are credited to the allowance at the time of recovery.
The allowance consists of specific, general, and unallocated components. The specific component relates to loans that are classified as doubtful, substandard, and impaired. For such loans that are also classified as impaired, an allowance is established when the discounted cash flows (or collateral value or observable market price) of the impaired loan is lower than the carrying value of that loan. Also, a specific reserve is allocated for syndicated loans. The general component covers non-classified loans and special mention loans and is based on historical loss experience adjusted for qualitative factors. An unallocated component is maintained to cover uncertainties that could affect the estimate of probable losses.
The allowance for loan losses is reviewed on a monthly basis. The monitoring of credit risk also extends to unfunded credit commitments, such as unused commercial credit lines and letters of credit. A reserve is established as needed for estimates of probable losses on such commitments.
60
Goodwill and intangible assets
Goodwill and intangible assets deemed to have indefinite lives are subject to annual impairment tests. The Company’s goodwill is tested for impairment on an annual basis, or more often if events or circumstances indicate that there may be impairment. Adverse changes in the economic environment, declining operations, or other factors could result in a decline in the implied fair value of goodwill. If the implied fair value is less than the carrying amount, a loss would be recognized in other non-interest expense to reduce the carrying amount to implied fair value of goodwill. The goodwill impairment test includes two steps that are preceded by a, “step zero”, qualitative test. The qualitative test allows Management to assess whether qualitative factors indicate that it is more likely than not that impairment exists. If it is not more likely than not that impairment exists, then no impairment exists and the two step quantitative test would not be necessary. These qualitative indicators include factors such as earnings, share price, market conditions, etc. If the qualitative factors indicate that it is more likely than not that impairment exists, then the two step quantitative test would be necessary. Step one is used to identify potential impairment and compares the estimated fair value of a reporting unit with its carrying amount, including goodwill. If the estimated fair value of a reporting unit exceeds its carrying amount, goodwill of the reporting unit is not considered impaired. If the carrying amount of a reporting unit exceeds its estimated fair value, the second step of the goodwill impairment test is performed to measure the amount of impairment loss, if any. Step two of the goodwill impairment test compares the implied estimated fair value of reporting unit goodwill with the carrying amount of that goodwill. If the carrying amount of goodwill for that reporting unit exceeds the implied fair value of that unit’s goodwill, an impairment loss is recognized in an amount equal to that excess.
Identifiable intangible assets are acquired assets that lack physical substance but can be distinguished from goodwill because of contractual or legal rights or because the assets are capable of being sold or exchanged either on their own or in combination with the related contract, asset or liability. The Company’s intangible assets primarily relate to core deposits. These core deposit intangibles are amortized on a straight-line basis over terms ranging from seven to fifteen years. Management periodically evaluates whether events or circumstances have occurred that impair this deposit intangible.
Premises and equipment
Premises and equipment are stated at cost, less accumulated depreciation. Depreciation is computed for financial reporting purposes using the straight-line method over the estimated useful lives of the respective assets as follows:
Buildings and improvements 10-40 years
Equipment, fixtures and automobiles 3-10 years
Expenditures for renewals and betterments are capitalized and depreciated over their estimated useful lives. Repairs, maintenance and minor improvements are charged to operating expense as incurred. Gains or losses on disposition, if any, are recorded as a separate line item in noninterest income on the Statements of Income.
Other real estate
Other real estate includes properties acquired through foreclosure or acceptance of deeds in lieu of foreclosure. These properties are recorded at the lower of the recorded investment in the property or its fair value less the estimated cost of disposition. Any valuation adjustments required prior to foreclosure are charged to the allowance for loan losses. Subsequent to foreclosure, losses on the periodic revaluation of the property are charged to current period earnings as other real estate expense. Costs of operating and maintaining the properties are charged to other real estate expense as incurred. Any subsequent gains or losses on dispositions are credited or charged to income in the period of disposition.
Off-balance sheet financial instruments
In the ordinary course of business, the Company has entered into commitments to extend credit, including commitments under credit card arrangements, commitments to fund commercial real estate, construction and land development loans secured by real estate, and performance standby letters of credit. Such financial instruments are recorded when they are funded.
Income taxes
The Company and its subsidiary file a consolidated federal income tax return on a calendar year basis. In lieu of Louisiana state income tax, the Bank is subject to the Louisiana bank shares tax, which is included in noninterest expense in the Company’s consolidated financial statements. With few exceptions, the Company is no longer subject to U.S. federal, state or local income tax examinations for years before 2011. Deferred tax assets and liabilities are recognized for the future tax consequences attributable to differences between the financial statement carrying amounts of existing assets and liabilities and their respective tax basis. Deferred tax assets and liabilities are measured using enacted tax rates expected to apply to taxable income in the years in which the deferred tax assets or liabilities are expected to be settled or realized. Valuation allowances are established when necessary to reduce deferred tax assets to the amount expected to be utilized.
61
Comprehensive income
Accounting principles generally require that recognized revenue, expenses, gains and losses be included in net income. Although certain changes in assets and liabilities, such as unrealized gains and losses on available for sale securities, are reported as a separate component of the equity section of the balance sheet, such items along with net income, are components of comprehensive income. The components of other comprehensive income and related tax effects are presented in the Statements of Comprehensive Income.
Fair Value Measurements
The fair value of a financial instrument is the current amount that would be received to sell an asset or paid to transfer a liability in an orderly transaction between market participants. A fair value measurement assumes that the transaction to sell the asset or transfer the liability occurs in the principal market for the asset or liability or, in the absence of a principal market, the most advantageous market for the asset or liability. Valuation techniques use certain inputs to arrive at fair value. Inputs to valuation techniques are the assumptions that market participants would use in pricing the asset or liability. They may be observable or unobservable. The Company uses a fair value hierarchy for valuation inputs that gives the highest priority to quoted prices in active markets for identical assets or liabilities and the lowest priority to unobservable inputs. See Note 21 for a detailed description of fair value measurements.
Transfers of Financial Assets
Transfers of financial assets are accounted for as sales, when control over the assets has been surrendered. Control over transferred assets is deemed to be surrendered when (i) the assets have been isolated from the Company, (ii) the transferee obtains the right (free of conditions that constrain it from taking advantage of that right) to pledge or exchange the transferred assets, and (iii) the Company does not maintain effective control over the transferred assets through an agreement to repurchase them before their maturity.
Earnings per common share
Earnings per share represent income available to common shareholders divided by the weighted average number of common shares outstanding during the period. In February of 2012, the Company issued a pro rata, 10% common stock dividend. The shares issued for the stock dividend have been retrospectively factored into the calculation of earnings per share as well as cash dividends paid on common stock and represented on the face of the financial statements. No convertible shares of the Company’s stock are outstanding.
Operating Segments
All of the Company’s operations are considered by management to be aggregated into one reportable operating segment. While the chief decision-makers monitor the revenue streams of the various products and services, the identifiable segments are not material. Operations are managed and financial performance is evaluated on a Company-wide basis.
Reclassifications
Certain reclassifications have been made to prior year end financial statements in order to conform to the classification adopted for reporting in 2014.
Note 2. Recent Accounting Pronouncements
The FASB has issued Accounting Standards Update (ASU) No. 2014-04, Receivables-Troubled Debt Restructurings by Creditors (Subtopic 310-40) - Reclassification of Residential Real Estate Collateralized Consumer Mortgage Loans upon Foreclosure. The amendments are intended to clarify when a creditor should be considered to have received physical possession of residential real estate property collateralizing a consumer mortgage loan such that the loan should be derecognized and the real estate recognized.
These amendments clarify that an in substance repossession or foreclosure occurs, and a creditor is considered to have received physical possession of residential real estate property collateralizing a consumer mortgage loan, upon either: (a) the creditor obtaining legal title to the residential real estate property upon completion of a foreclosure; or (b) the borrower conveying all interest in the residential real estate property to the creditor to satisfy that loan through completion of a deed in lieu of foreclosure or through a similar legal agreement. Additional disclosures are required.
The amendments are effective for public business entities for annual periods and interim periods within those annual periods beginning after December 15, 2014. The adoption of this guidance is not expected to have a material impact upon the Company's financial statements.
Note 3. Cash and Due from Banks
Certain reserves are required to be maintained at the Federal Reserve Bank. The requirement as of December 31, 2014 and 2013 was $0.0 million and $32.0 million, respectively. The reduction in the required reserve was due to the Company’s regulatory reclassification of deposits in 2014. At December 31, 2014 the Company had only one account at correspondent banks, excluding the Federal Reserve Bank, that exceeded the FDIC insurable limit of $250,000. This account was over the insurable limit by $1,000. At December 31, 2013 the Company did not have accounts at correspondent banks, excluding the Federal Reserve Bank, that exceeded the FDIC insurable limit of $250,000.
62
Note 4. Securities
A summary comparison of securities by type at December 31, 2014 and 2013 is shown below.
|
December 31, 2014
|
December 31, 2013
|
|||||||||||||||||||||||
| (in thousands) |
Amortized Cost
|
Gross Unrealized Gains
|
Gross Unrealized Losses
|
Fair Value
|
Amortized Cost
|
Gross Unrealized Gains
|
Gross Unrealized Losses
|
Fair Value
|
||||||||||||||||
|
Available-for-sale:
|
||||||||||||||||||||||||
| U.S Treasuries | $ | 36,000 | $ | - | $ | - | $ | 36,000 | $ | 36,000 | $ | - | $ | - | $ | 36,000 | ||||||||
|
U.S. Government Agencies
|
295,620 |
|
30
|
|
(4,155
|
)
|
|
291,495
|
|
302,816
|
-
|
|
(16,117
|
)
|
286,699
|
|||||||||
|
Corporate debt securities
|
126,654 |
4,415
|
(1,006
|
)
|
130,063
|
142,580
|
3,729
|
(1,828
|
)
|
144,481
|
||||||||||||||
|
Mutual funds or other equity securities
|
570 |
4
|
-
|
|
574
|
564
|
-
|
(8
|
)
|
556
|
||||||||||||||
|
Municipal bonds
|
40,599 |
1,077
|
-
|
|
41,676
|
16,091
|
384
|
-
|
|
16,475
|
||||||||||||||
|
Total available-for-sale securities
|
|
499,443
|
|
5,526
|
|
(5,161
|
)
|
|
499,808
|
|
498,051
|
|
4,113
|
|
(17,953
|
)
|
|
484,211
|
||||||
|
Held to maturity:
|
||||||||||||||||||||||||
|
U.S. Government Agencies
|
|
84,479
|
|
-
|
|
(1,950
|
)
|
|
82,529
|
|
86,927
|
|
-
|
|
(5,971
|
)
|
|
80,956
|
||||||
| Mortgage-backed securities | 57,316 | 57 | (214 | ) | 57,159 | 63,366 | - | (2,680 | ) | 60,686 | ||||||||||||||
|
Total held to maturity securities
|
$
|
141,795 |
$
|
57
|
$
|
(2,164
|
)
|
$
|
139,688
|
$
|
150,293
|
$
|
-
|
$
|
(8,651
|
)
|
$
|
141,642
|
||||||
The scheduled maturities of securities at December 31, 2014, by contractual maturity, are shown below. Actual maturities may differ from contractual maturities due to call or prepayments. Mortgage-backed securities are not due at a single maturity because of amortization and potential prepayment of the underlying mortgages. For this reason they are presented separately in the maturity table below.
|
December 31, 2014
|
||||||
| (in thousands) |
Amortized Cost
|
Fair Value
|
||||
|
Available-for-sale:
|
||||||
|
Due in one year or less
|
$
|
71,547
|
$
|
71,665
|
||
|
Due after one year through five years
|
219,470
|
219,785
|
||||
|
Due after five years through 10 years
|
158,076
|
157,531
|
||||
|
Over 10 years
|
50,350
|
50,827
|
||||
|
Total available-for-sale securities
|
|
499,443
|
|
499,808
|
||
|
Held to maturity:
|
||||||
|
Due in one year or less
|
|
-
|
|
-
|
||
|
Due after one year through five years
|
24,999
|
24,609
|
||||
|
Due after five years through 10 years
|
59,480
|
57,920
|
||||
|
Over 10 years
|
-
|
-
|
||||
| Subtotal | 84,479 | 82,529 | ||||
| Mortgage-backed Securities | 57,316 | 57,159 | ||||
|
Total held to maturity securities
|
$
|
141,795
|
$
|
139,688 | ||
63
The following is a summary of the fair value of securities with gross unrealized losses and an aging of those gross unrealized losses as of the dates indicated:
| At December 31, 2014 | ||||||||||||||||||||||||
| Less Than 12 Months | 12 Months or More | Total | ||||||||||||||||||||||
| (in thousands) | Number of Securities |
Fair Value
|
Gross Unrealized Losses
|
Number of Securities |
Fair Value
|
Gross Unrealized Losses
|
Number of Securities |
Fair Value
|
Gross Unrealized Losses
|
|||||||||||||||
|
Available-for-sale:
|
||||||||||||||||||||||||
| U.S. Treasuries | 4 | $ | 24,000 | $ | - | - | $ | - | $ | - | 4 | $ | 24,000 | $ | - | |||||||||
|
U.S. Government agencies
|
4 |
43,983
|
(17
|
) | 66 |
232,482
|
|
(4,138
|
) | 70 |
276,465
|
(4,155
|
) | |||||||||||
|
Corporate debt securities
|
37 |
15,395
|
(238
|
) | 50 |
15,397
|
(768
|
) | 87 |
30,792
|
(1,006
|
) | ||||||||||||
|
Mutual funds or other equity securities
|
- | - | - | - | - | - | - | - | - | |||||||||||||||
| Municipal bonds | - | - | - | - | - | - | - | - | - | |||||||||||||||
|
Total available-for-sale securities
|
45 |
83,378
|
|
(255
|
) | 116 |
|
247,879
|
|
(4,906
|
) | 161 |
|
331,257
|
(5,161
|
) | ||||||||
|
Held to maturity:
|
||||||||||||||||||||||||
|
U.S. Government agencies
|
1 |
|
4,993
|
(7
|
) | 19 |
77,536
|
|
(1,943
|
) | 20 |
|
82,529
|
|
(1,950
|
) | ||||||||
| Mortgage-backed securities | 7 | 12,008 | (13 | ) | 12 | 29,415 | (201 | ) | 19 | 41,423 | (214 | ) | ||||||||||||
|
Total held to maturity securities
|
8 |
$
|
17,001
|
$
|
(20
|
) | 31 |
$
|
106,951
|
$
|
(2,144
|
) | 39 |
$
|
123,952
|
$
|
(2,164
|
) | ||||||
.
| At December 31, 2013 | ||||||||||||||||||||||||
| Less Than 12 Months | 12 Months or More | Total | ||||||||||||||||||||||
| (in thousands) | Number of Securities |
Fair Value
|
Gross Unrealized Losses
|
Number of Securities |
Fair Value
|
Gross Unrealized Losses
|
Number of Securities |
Fair Value
|
Gross Unrealized Losses
|
|||||||||||||||
|
Available-for-sale:
|
||||||||||||||||||||||||
| U.S. Treasuries | 3 | $ | 26,000 | $ | - | - | $ | - | $ | - | 3 | $ | 26,000 | $ | - | |||||||||
|
U.S. Government agencies
|
65 |
218,047
|
(11,110
|
) | 21 |
68,652
|
(5,007
|
) | 86 |
286,699
|
(16,117
|
) | ||||||||||||
|
Corporate debt securities
|
154 |
39,555
|
(1,378
|
) | 22 |
5,173
|
(450
|
) | 176 |
44,728
|
(1,828
|
) | ||||||||||||
| Mutal funds or other equity securities | 1 | 492 | (8 | ) | - | - | - | 1 | 492 | (8 | ) | |||||||||||||
|
Total available-for-sale securities
|
223 |
284,094
|
|
(12,496
|
) | 43 |
|
73,825
|
|
(5,457
|
) | 266 |
|
357,919
|
(17,953
|
) | ||||||||
|
Held to maturity:
|
||||||||||||||||||||||||
| U.S. Government agencies | 14 | 50,520 | (3,743 | ) | 7 | 30,436 | (2,228 | ) | 21 | 80,956 | (5,971 | ) | ||||||||||||
|
Mortgage-backed securities
|
26 |
|
60,686
|
(2,680
|
) | - |
-
|
|
-
|
26 |
|
60,686
|
|
(2,680
|
) | |||||||||
|
Total held to maturity securities
|
40 |
$
|
111,206
|
$
|
(6,423
|
) | 7 |
$
|
30,436
|
$
|
(2,228
|
) | 47 |
$
|
141,642
|
$
|
(8,651
|
) | ||||||
As of December 31, 2014, 200 of the Company’s debt securities had unrealized losses totaling 1.6% of the individual securities’ amortized cost basis and 1.1% of the Company’s total amortized cost basis of the investment securities portfolio. 147 of the 200 securities had been in a continuous loss position for over 12 months at such date. The 147 securities had an aggregate amortized cost basis of $361.9 million and an unrealized loss of $7.1 million at December 31, 2014. Management has the intent and ability to hold these debt securities until maturity or until anticipated recovery. No declines in these 200 securities were deemed to be other-than-temporary.
64
Securities are evaluated for other-than-temporary impairment at least quarterly and more frequently when economic or market conditions warrant. Consideration is given to (i) the length of time and the extent to which the fair value has been less than cost, (ii) the financial condition and near-term prospects of the issuer, (iii) the recovery of contractual principal and interest and (iv) the intent and ability of the Company to retain its investment in the issuer for a period of time sufficient to allow for any anticipated recovery in fair value.
Investment securities issued by the U.S. Government and Government sponsored agencies with unrealized losses and the amount of unrealized losses on those investment securities are the result of changes in market interest rates. The Company has the ability and intent to hold these securities until recovery, which may not be until maturity.
Corporate debt securities in a loss position consist primarily of corporate bonds issued by businesses in the financial, insurance, utility, manufacturing, industrial, consumer products and oil and gas industries. The Company believes that each of the issuers will be able to fulfill the obligations of these securities based on evaluations described above. The Company has the ability and intent to hold these securities until they recover, which could be at their maturity dates.
The Company believes that the securities with unrealized losses reflect impairment that is temporary and there are currently no securities with other-than-temporary impairment. There were no other-than-temporary impairment losses recognized on securities in 2014, 2013 or 2012.
At December 31, 2014 and 2013 the carrying value of pledged securities totaled $516.5 million and $503.1 million, respectively. Gross realized gains on sales of securities were $0.2 million, $1.4 million and $4.4 million for the years ended December 31, 2014, 2013 and 2012, respectively. Gross realized losses were $0.2 million, $0 and $7,000 for the years ended December 31, 2014, 2013 and 2012. The tax applicable to these transactions amounted to $0 million, $0.5 million, and $1.7 million for 2014, 2013 and 2012, respectively. Proceeds from sales of securities classified as available-for-sale amounted to $109.8 million, $18.6 million and $77.9 million for the years ended December 31, 2014, 2013 and 2012, respectively.
Net unrealized gains on available-for-sale securities included in accumulated other comprehensive income (loss) ("AOCI"), net of applicable income taxes, totaled $0.2 million at December 31, 2014. At December 31, 2013 net unrealized losses included in AOCI, net of applicable income taxes, totaled $9.1 million. During 2014 and 2013 gains, net of tax, reclassified out of AOCI into earnings totaled $0.2 million and $1.0 million, respectively.
|
At December 31, 2014
|
||||||
| (in thousands) |
Amortized Cost
|
Fair Value
|
||||
|
U.S. Treasuries
|
$
|
36,000
|
$
|
36,000
|
||
| Federal Home Loan Bank (FHLB) |
129,610
|
127,006
|
||||
|
Federal Home Loan Mortgage Corporation (Freddie Mac-FHLMC)
|
75,647
|
75,004
|
||||
|
Federal National Mortgage Association (Fannie Mae-FNMA)
|
109,817
|
108,374
|
||||
|
Federal Farm Credit Bank (FFCB)
|
122,341 | 120,799 | ||||
|
Total
|
$
|
473,415
|
$
|
467,183
|
||
65
Note 5. Loans
The following table summarizes the components of the Company's loan portfolio as of the dates indicated:
|
December 31, 2014
|
December 31, 2013
|
|||||||||
| (in thousands except for %) |
Balance
|
As % of Category
|
Balance
|
As % of Category
|
||||||
|
Real Estate:
|
||||||||||
|
Construction & land development
|
$
|
52,094
|
6.6
|
%
|
$
|
47,550
|
6.7
|
%
|
||
|
Farmland
|
13,539
|
1.7
|
%
|
9,826
|
1.4
|
%
|
||||
|
1- 4 Family
|
118,181
|
14.9
|
%
|
103,764
|
14.7
|
%
|
||||
|
Multifamily
|
14,323
|
1.8
|
%
|
13,771
|
2.0
|
%
|
||||
|
Non-farm non-residential
|
328,400
|
41.5
|
%
|
336,071
|
47.7
|
%
|
||||
|
Total Real Estate
|
526,537
|
66.5
|
%
|
510,982
|
72.5
|
%
|
||||
| Non-real Estate: | ||||||||||
|
Agricultural
|
26,278
|
3.3
|
%
|
21,749
|
3.1
|
%
|
||||
|
Commercial and industrial
|
196,339
|
24.8
|
%
|
151,087
|
21.4
|
%
|
||||
|
Consumer and other
|
42,991
|
5.4
|
%
|
20,917
|
3.0
|
%
|
||||
| Total Non-real Estate | 265,608 | 33.5 | % | 193,753 | 27.5 | % | ||||
|
Total loans before unearned income
|
792,145
|
100.0
|
%
|
704,735
|
100.0
|
%
|
||||
|
Unearned income
|
(1,824
|
)
|
(1,569
|
)
|
||||||
|
Total loans net of unearned income
|
$
|
790,321
|
$
|
703,166
|
||||||
The following table summarizes fixed and floating rate loans by contractual maturity, excluding nonaccrual loans, as of December 31, 2014 and December 31, 2013 unadjusted for scheduled principal payments, prepayments, or repricing opportunities. The average life of the loan portfolio may be substantially less than the contractual terms when these adjustments are considered.
|
December 31, 2014
|
December 31, 2013 | |||||||||||||||||
| (in thousands) |
Fixed
|
Floating
|
Total
|
Fixed | Floating | Total | ||||||||||||
|
One year or less
|
$
|
88,686
|
$
|
72,250
|
$
|
160,936
|
$ | 60,642 | $ | 70,602 | $ | 131,244 | ||||||
|
One to five years
|
253,306
|
225,655
|
478,961
|
229,657 | 200,420 | 430,077 | ||||||||||||
|
Five to 15 years
|
67,012
|
39,634
|
106,646
|
71,655 | 26,076 | 97,731 | ||||||||||||
|
Over 15 years
|
25,304
|
8,104
|
33,408
|
8,503 | 22,695 | 31,198 | ||||||||||||
|
Subtotal
|
$
|
434,308
|
$ |
345,643
|
779,951
|
$ | 370,457 | $ | 319,793 | 690,250 | ||||||||
|
Nonaccrual loans
|
12,194
|
14,485 | ||||||||||||||||
|
Total loans before unearned income
|
792,145
|
704,735 | ||||||||||||||||
|
Unearned income
|
(1,824
|
)
|
(1,569 | ) | ||||||||||||||
|
Total loans net of unearned income
|
$
|
790,321
|
$ | 703,166 | ||||||||||||||
As of December 31, 2014, $195.7 million of floating rate loans were at their interest rate floor. At December 31, 2013, $209.5 million of floating rate loans were at the floor rate. Nonaccrual loans have been excluded from these totals.
66
The following tables present the age analysis of past due loans for the periods indicated:
|
As of December 31, 2014
|
||||||||||||||||||
|
(in thousands)
|
30-89 Days Past Due
|
90 Days or Greater Past Due
|
Total Past Due
|
Current
|
Total Loans
|
Recorded Investment 90 Days Accruing
|
||||||||||||
|
Real Estate:
|
||||||||||||||||||
|
Construction & land development
|
$
|
338
|
$
|
486
|
$
|
824
|
$
|
51,270
|
$
|
52,094
|
$
|
- | ||||||
|
Farmland
|
10
|
153 |
163
|
13,376
|
13,539
|
- | ||||||||||||
|
1 - 4 family
|
2,924
|
4,418
|
7,342
|
110,839
|
118,181
|
599 | ||||||||||||
|
Multifamily
|
2,990
|
-
|
2,990
|
11,333
|
14,323
|
- | ||||||||||||
|
Non-farm non-residential
|
1,509
|
4,993
|
6,502
|
321,898
|
328,400
|
- | ||||||||||||
|
Total Real Estate
|
7,771
|
10,050
|
17,821
|
508,716
|
526,537
|
599 | ||||||||||||
| Non-Real Estate: | ||||||||||||||||||
|
Agricultural
|
-
|
832 |
832
|
25,446
|
26,278 | - | ||||||||||||
|
Commercial and industrial
|
1,241
|
1,907 |
3,148
|
193,191
|
196,339
|
- | ||||||||||||
|
Consumer and other
|
105
|
4
|
109
|
42,882
|
42,991
|
- | ||||||||||||
| Total Non-Real Estate | 1,346 | 2,743 | 4,089 | 261,519 | 265,608 | - | ||||||||||||
|
Total loans before unearned income
|
$
|
9,117
|
$
|
12,793
|
$
|
21,910
|
$
|
770,235
|
|
792,145
|
$
|
599 | ||||||
|
Unearned income
|
(1,824
|
)
|
||||||||||||||||
|
Total loans net of unearned income
|
$
|
790,321
|
||||||||||||||||
|
As of December 31, 2013
|
||||||||||||||||||
|
(in thousands)
|
30-89 Days Past Due
|
90 Days or Greater Past Due
|
Total Past Due
|
Current
|
Total Loans
|
Recorded Investment 90 Days Accruing
|
||||||||||||
|
Real Estate:
|
||||||||||||||||||
|
Construction & land development
|
$
|
100
|
$
|
73
|
$
|
173
|
$
|
47,377
|
$
|
47,550
|
$
|
- | ||||||
|
Farmland
|
-
|
130
|
130 |
9,696
|
9,826
|
- | ||||||||||||
|
1 - 4 family
|
3,534
|
4,662
|
8,196
|
95,568
|
103,764
|
414 | ||||||||||||
|
Multifamily
|
-
|
-
|
-
|
13,771
|
13,771
|
- | ||||||||||||
|
Non-farm non-residential
|
154
|
7,539
|
7,693
|
328,378
|
336,071
|
- | ||||||||||||
|
Total Real Estate
|
3,788
|
12,404
|
16,192
|
494,790
|
510,982
|
414 | ||||||||||||
| Non-Real Estate: | ||||||||||||||||||
|
Agricultural
|
-
|
526
|
526
|
21,223
|
21,749
|
- | ||||||||||||
|
Commercial and industrial
|
63
|
1,946
|
2,009
|
149,078
|
151,087
|
- | ||||||||||||
|
Consumer and other
|
123
|
23
|
146
|
20,771
|
20,917
|
- | ||||||||||||
| Total Non-Real Estate | 186 | 2,495 | 2,681 | 191,072 | 193,753 | - | ||||||||||||
|
Total loans before unearned income
|
$
|
3,974
|
$
|
14,899
|
$
|
18,873
|
$
|
685,862
|
704,735
|
$
|
414 | |||||||
|
Unearned income
|
(1,569
|
)
|
||||||||||||||||
|
Total loans net of unearned income
|
$
|
703,166
|
||||||||||||||||
The tables above include $12.2 million and $14.5 million of nonaccrual loans for December 31, 2014 and 2013, respectively. See the tables below for more detail on nonaccrual loans.
67
The following is a summary of nonaccrual loans by class for the periods indicated:
| As of December 31, | ||||||
|
(in thousands)
|
2014
|
2013 | ||||
|
Real Estate:
|
||||||
|
Construction & land development
|
$
|
486
|
$ | 73 | ||
|
Farmland
|
153 | 130 | ||||
|
1 - 4 family
|
3,819
|
4,248 | ||||
|
Multifamily
|
-
|
- | ||||
|
Non-farm non-residential
|
4,993
|
7,539 | ||||
|
Total Real Estate
|
9,451
|
11,990 | ||||
| Non-Real Estate: | ||||||
|
Agricultural
|
832
|
526 | ||||
|
Commercial and industrial
|
1,907
|
1,946 | ||||
|
Consumer and other
|
4
|
23 | ||||
| Total Non-Real Estate | 2,743 | 2,495 | ||||
|
Total Nonaccrual Loans
|
$
|
12,194
|
$ | 14,485 | ||
The following table identifies the credit exposure of the loan portfolio by specific credit ratings for the periods indicated:
|
As of December 31, 2014
|
As of December 31, 2013 | |||||||||||||||||||||||||||||
|
(in thousands)
|
Pass
|
Special Mention
|
Substandard
|
Doubtful |
Total
|
Pass | Special Mention | Substandard | Doubtful | Total | ||||||||||||||||||||
|
Real Estate:
|
||||||||||||||||||||||||||||||
|
Construction & land development
|
$
|
46,451
|
$
|
559
|
$
|
5,084
|
$ | - |
$
|
52,094
|
$ | 40,286 | $ | 1,330 | $ | 5,934 | $ | - | $ | 47,550 | ||||||||||
|
Farmland
|
13,384
|
87
|
68
|
- |
13,539
|
9,631 | 85 | 110 | - | 9,826 | ||||||||||||||||||||
|
1 - 4 family
|
103,628
|
6,113
|
8,440
|
- |
118,181
|
89,623 | 4,060 | 10,081 | - | 103,764 | ||||||||||||||||||||
|
Multifamily
|
3,581
|
6,414
|
4,328
|
- |
14,323
|
5,884 | 5,936 | 1,951 | - | 13,771 | ||||||||||||||||||||
|
Non-farm non-residential
|
300,430
|
6,788
|
21,182
|
- |
328,400
|
305,992 | 9,196 | 20,883 | - | 336,071 | ||||||||||||||||||||
|
Total Real Estate
|
467,474
|
19,961
|
39,102
|
- |
526,537
|
451,416 | 20,607 | 38,959 | - | 510,982 | ||||||||||||||||||||
| Non-Real Estate: | ||||||||||||||||||||||||||||||
|
Agricultural
|
23,434
|
7
|
2,837
|
- |
26,278
|
21,486 | 11 | 252 | - | 21,749 | ||||||||||||||||||||
|
Commercial and industrial
|
185,839
|
8,611
|
1,889
|
- | 196,339 | 149,930 | 592 | 565 | - | 151,087 | ||||||||||||||||||||
|
Consumer and other
|
42,831
|
123
|
37
|
- |
42,991
|
20,720 | 117 | 80 | - | 20,917 | ||||||||||||||||||||
| Total Non-Real Estate | 252,104 | 8,741 | 4,763 | - | 265,608 | 192,136 | 720 | 897 | - | 193,753 | ||||||||||||||||||||
|
Total loans before unearned income
|
$
|
719,578
|
$
|
28,702
|
$
|
43,865
|
$ | - |
|
792,145
|
$ | 643,552 | $ | 21,327 | $ | 39,856 | $ | - | 704,735 | |||||||||||
|
Unearned income
|
(1,824
|
)
|
(1,569 | ) | ||||||||||||||||||||||||||
|
Total loans net of unearned income
|
$
|
790,321
|
$ | 703,166 | ||||||||||||||||||||||||||
68
Note 6. Allowance for Loan Losses
A summary of changes in the allowance for loan losses, by loan type, for the years ended December 31, 2014, 2013 and 2012 are as follows:
| As of December 31, | ||||||||||||||||||||||||||||||
|
2014
|
2013 | |||||||||||||||||||||||||||||
|
(in thousands)
|
Beginning
Allowance (12/31/13)
|
Charge-offs
|
Recoveries
|
Provision |
Ending
Allowance (12/31/14)
|
Beginning
Allowance (12/31/12)
|
Charge-offs
|
Recoveries
|
Provision |
Ending Allowance(12/31/13)
|
||||||||||||||||||||
|
Real Estate:
|
||||||||||||||||||||||||||||||
|
Construction & land development
|
$
|
1,530
|
$
|
(1,032
|
) |
$
|
6
|
$ | 198 |
$
|
702
|
$ |
1,098
|
$ |
(233
|
) | $ |
10
|
$ | 655 | $ |
1,530
|
||||||||
|
Farmland
|
17
|
-
|
-
|
4 | 21 |
50
|
(31 | ) |
140
|
(142 | ) |
17
|
||||||||||||||||||
|
1 - 4 family
|
1,974
|
(589
|
) |
99
|
647 |
2,131
|
2,239
|
(220
|
) |
49
|
(94 | ) |
1,974
|
|||||||||||||||||
|
Multifamily
|
376
|
-
|
49
|
388 |
813
|
284
|
-
|
-
|
92 |
376
|
||||||||||||||||||||
|
Non-farm non-residential
|
3,607
|
(1,515
|
) | 9 | 612 |
2,713
|
3,666
|
(1,148
|
) |
8
|
1,081 |
3,607
|
||||||||||||||||||
|
Total Real Estate
|
7,504
|
(3,136
|
) |
163
|
1,849 |
6,380
|
7,337
|
(1,632
|
) |
207
|
1,592 |
7,504
|
||||||||||||||||||
| Non-Real Estate: | ||||||||||||||||||||||||||||||
|
Agricultural
|
46
|
(2
|
) | 1 | 248 |
293
|
64
|
(41
|
) |
5
|
18 |
46
|
||||||||||||||||||
|
Commercial and industrial
|
2,176
|
(266
|
) |
118
|
(231 | ) |
1,797
|
2,488
|
(1,098
|
) |
71
|
715 |
2,176
|
|||||||||||||||||
|
Consumer and other
|
208
|
(289
|
) |
199
|
253 |
371
|
233
|
(262
|
) |
243
|
(6 | ) |
208
|
|||||||||||||||||
| Unallocated | 421 |
-
|
- | (157 | ) | 264 | 220 | - | - | 201 | 421 | |||||||||||||||||||
| Total Non-Real Estate | 2,851 |
(557
|
) | 318 | 113 | 2,725 | 3,005 | (1,401 | ) | 319 | 928 | 2,851 | ||||||||||||||||||
|
Total
|
$
|
10,355
|
$
|
(3,693
|
) |
$
|
481 | $ | 1,962 |
$
|
9,105
|
$ |
10,342
|
$ |
(3,033
|
) | $ |
526
|
$ | 2,520 | $ |
10,355
|
||||||||
| As of December 31, | |||||||||||||||
| 2012 | |||||||||||||||
|
(in thousands)
|
Beginning
Allowance (12/31/11)
|
Charge-offs
|
Recoveries
|
Provision |
Ending Allowance(12/31/12)
|
||||||||||
|
Real Estate:
|
|||||||||||||||
|
Construction & land development
|
$ |
1,002
|
$ |
(65
|
) | $ |
15
|
$ | 146 | $ |
1,098
|
||||
|
Farmland
|
65
|
- |
1
|
(16 | ) |
50
|
|||||||||
|
1 - 4 family
|
1,917
|
(1,409
|
) |
35
|
1,696 |
2,239
|
|||||||||
|
Multifamily
|
780
|
(187
|
) |
-
|
(309 | ) |
284
|
||||||||
|
Non-farm non-residential
|
2,980
|
(459
|
) |
116
|
1,029 |
3,666
|
|||||||||
|
Total Real Estate
|
6,744
|
(2,120
|
) |
167
|
2,546 |
7,337
|
|||||||||
| Non-Real Estate: | |||||||||||||||
|
Agricultural
|
125
|
(49
|
) |
1
|
(13 | ) |
64
|
||||||||
|
Commercial and industrial
|
1,407
|
(809
|
) |
329
|
1,561 |
2,488
|
|||||||||
|
Consumer and other
|
314
|
(473
|
) |
283
|
109 |
233
|
|||||||||
| Unallocated | 289 | - | - | (69 | ) | 220 | |||||||||
| Total Non-Real Estate | 2,135 | (1,331 | ) | 613 | 1,588 | 3,005 | |||||||||
|
Total
|
$ |
8,879
|
$ |
(3,451
|
) | $ |
780
|
$ | 4,134 | $ |
10,342
|
||||
Negative provisions are caused by changes in the composition and credit quality of the loan portfolio. The result is an allocation of the loan loss reserve from one category to another.
69
A summary of the allowance and loans individually and collectively evaluated for impairment are as follows:
| As of December 31, 2014 | ||||||||||||||||||
|
(in thousands)
|
Allowance Individually Evaluated for Impairment
|
Allowance Collectively Evaluated for Impairment |
Total Allowance for Credit Losses
|
Loans
Individually Evaluated for Impairment
|
Loans
Collectively Evaluated for Impairment
|
Total Loans before Unearned Income
|
||||||||||||
|
Real Estate:
|
||||||||||||||||||
|
Construction & land development
|
$
|
126
|
$ | 576 |
$
|
702
|
$ |
4,150
|
$ | 47,944 | $ |
52,094
|
||||||
|
Farmland
|
-
|
21 |
21
|
-
|
13,539 |
13,539
|
||||||||||||
|
1 - 4 family
|
598
|
1,533 |
2,131
|
3,420
|
114,761 |
118,181
|
||||||||||||
|
Multifamily
|
437
|
376 |
813
|
7,201
|
7,122 |
14,323
|
||||||||||||
|
Non-farm non-residential
|
468
|
2,245 | 2,713 |
16,287
|
312,113 |
328,400
|
||||||||||||
|
Total Real Estate
|
1,629
|
4,751 |
6,380
|
31,058
|
495,479 |
526,537
|
||||||||||||
| Non-Real Estate: | ||||||||||||||||||
|
Agricultural
|
262
|
31 |
293
|
2,650
|
23,628 |
26,278
|
||||||||||||
|
Commercial and industrial
|
19
|
1,778 |
1,797
|
1,664
|
194,675 |
196,339
|
||||||||||||
|
Consumer and other
|
-
|
371 |
371
|
-
|
42,991 |
42,991
|
||||||||||||
| Unallocated | - | 264 | 264 | - | - | - | ||||||||||||
| Total Non-Real Estate | 281 | 2,444 | 2,725 | 4,314 | 261,294 | 265,608 | ||||||||||||
|
Total
|
$
|
1,910
|
$ | 7,195 |
$
|
9,105
|
$ | 35,372 | $ | 756,773 |
792,145
|
|||||||
| Unearned Income | (1,824 | ) | ||||||||||||||||
| Total loans net of unearned income | $ | 790,321 | ||||||||||||||||
| As of December 31, 2013 | ||||||||||||||||||
|
(in thousands)
|
Allowance Individually Evaluated for Impairment
|
Allowance Collectively Evaluated for Impairment |
Total Allowance for Credit Losses
|
Loans
Individually Evaluated for Impairment
|
Loans
Collectively Evaluated for Impairment
|
Total Loans before Unearned Income
|
||||||||||||
|
Real Estate:
|
||||||||||||||||||
|
Construction & land development
|
$
|
1,166
|
$ | 364 |
$
|
1,530
|
$ |
5,777
|
$ | 41,773 | $ |
47,550
|
||||||
|
Farmland
|
-
|
17 |
17
|
-
|
9,826 |
9,826
|
||||||||||||
|
1 - 4 family
|
25
|
1,949 |
1,974
|
2,868
|
100,896 |
103,764
|
||||||||||||
|
Multifamily
|
332
|
44 |
376
|
7,887
|
5,884 |
13,771
|
||||||||||||
|
Non-farm non-residential
|
1,053
|
2,554 |
3,607
|
19,279
|
316,792 |
336,071
|
||||||||||||
|
Total Real Estate
|
2,576
|
4,928
|
7,504
|
35,811
|
475,171 |
510,982
|
||||||||||||
| Non-Real Estate: | ||||||||||||||||||
|
Agricultural
|
-
|
46 |
46
|
-
|
21,749 |
21,749
|
||||||||||||
|
Commercial and industrial
|
-
|
2,176 |
2,176
|
-
|
151,087 |
151,087
|
||||||||||||
|
Consumer and other
|
-
|
208 |
208
|
-
|
20,917 |
20,917
|
||||||||||||
| Unallocated | - | 421 | 421 | |||||||||||||||
| Total Non-Real Estate | - | 2,851 | 2,851 | - | 193,753 | 193,753 | ||||||||||||
|
Total
|
$
|
2,576
|
$ | 7,779 |
$
|
10,355
|
$ |
35,811
|
$ | 668,924 |
704,735
|
|||||||
| Unearned Income | (1,569 | ) | ||||||||||||||||
| Total loans net of unearned income | $ | 703,166 | ||||||||||||||||
As of December 31, 2014, 2013 and 2012, the Company had loans totaling $12.2 million, $14.5 million and $20.7 million, respectively, not accruing interest. As of December 31, 2014, 2013 and 2012, the Company had loans past due 90 days or more and still accruing interest totaling $0.6 million, $0.4 million and $0.5 million, respectively. The average outstanding balance of nonaccrual loans in 2014 was $13.8 million compared to $17.3 million in 2013 and $22.1 million in 2012.
Included in the above table is a loan for $5.9 million and $5.9 million at December 31, 2014 and 2013, respectively, that is no longer considered impaired but is still individually evaluated for impairment since it was formally a restructured credit that subsequently return to market terms.
70
The following is a summary of impaired loans by class at December 31, 2014:
|
As of December 31, 2014
|
||||||||||||||||||
| (in thousands) |
Recorded Investment
|
Unpaid Principal Balance
|
Related Allowance
|
Average Recorded Investment
|
Interest Income Recognized
|
Interest Income Cash Basis | ||||||||||||
|
Impaired Loans with no related allowance:
|
||||||||||||||||||
|
Real Estate:
|
||||||||||||||||||
|
Construction & land development
|
$
|
3,308
|
$
|
4,359
|
$
|
-
|
$
|
3,479 |
$
|
217
|
$ | 224 | ||||||
|
Farmland
|
-
|
-
|
-
|
-
|
-
|
- | ||||||||||||
|
1 - 4 family
|
1,368
|
1,656
|
-
|
397
|
72
|
43 | ||||||||||||
|
Multifamily
|
-
|
- |
-
|
148
|
31
|
34 | ||||||||||||
|
Non-farm non-residential
|
7,439
|
9,008
|
-
|
8,694
|
422
|
275 | ||||||||||||
|
Total Real Estate
|
12,115
|
15,023
|
-
|
12,718
|
742 | 576 | ||||||||||||
| Non-Real Estate: | ||||||||||||||||||
|
Agricultural
|
-
|
-
|
-
|
-
|
-
|
- | ||||||||||||
|
Commercial and industrial
|
-
|
-
|
-
|
-
|
-
|
- | ||||||||||||
|
Consumer and other
|
-
|
-
|
-
|
-
|
-
|
- | ||||||||||||
| Total Non-Real Estate | - | - | - | - | - | - | ||||||||||||
| Total Impaired Loans with no related allowance | 12,115 | 15,023 | - | 12,718 | 742 | 576 | ||||||||||||
|
Impaired Loans with an allowance recorded:
|
||||||||||||||||||
|
Real estate:
|
||||||||||||||||||
|
Construction & land development
|
842
|
842
|
126
|
829
|
48
|
43 | ||||||||||||
|
Farmland
|
- |
-
|
-
|
-
|
-
|
- | ||||||||||||
|
1 - 4 family
|
2,052
|
2,068
|
598
|
2,062
|
97
|
87 | ||||||||||||
|
Multifamily
|
1,338
|
1,337
|
398
|
1,340
|
60 | 55 | ||||||||||||
|
Non-farm non-residential
|
8,848
|
8,913
|
468
|
8,948
|
317
|
327 | ||||||||||||
|
Total Real Estate
|
13,080
|
13,160
|
1,590
|
13,179
|
522
|
512 | ||||||||||||
| Non-Real Estate: | ||||||||||||||||||
|
Agricultural
|
2,650
|
2,650
|
262
|
-
|
-
|
- | ||||||||||||
|
Commercial and industrial
|
1,664
|
1,854
|
19
|
-
|
-
|
- | ||||||||||||
|
Consumer and other
|
-
|
-
|
-
|
-
|
-
|
- | ||||||||||||
| Total Non-Real Estate | 4,314 | 4,504 | 281 | - | - | - | ||||||||||||
| Total Impaired Loans with an allowance recorded | 17,394 | 17,664 | 1,871 | 13,179 | 522 | 512 | ||||||||||||
|
Total Impaired Loans
|
$
|
29,509
|
$
|
32,687
|
$
|
1,871
|
$
|
25,897
|
$
|
1,264
|
$ | 1,088 | ||||||
71
The following is a summary of impaired loans by class at December 31, 2013:
|
As of December 31, 2013
|
||||||||||||||||||
| (in thousands) |
Recorded Investment
|
Unpaid Principal Balance
|
Related Allowance
|
Average Recorded Investment
|
Interest Income Recognized
|
Interest Income Cash Basis | ||||||||||||
|
Impaired Loans with no related allowance:
|
||||||||||||||||||
|
Real Estate:
|
||||||||||||||||||
|
Construction & land development
|
$
|
-
|
$
|
-
|
$
|
-
|
$
|
599
|
$
|
35
|
$ | 36 | ||||||
|
Farmland
|
-
|
-
|
-
|
-
|
-
|
- | ||||||||||||
|
1 - 4 family
|
441
|
441
|
-
|
472
|
28
|
35 | ||||||||||||
|
Multifamily
|
607
|
607
|
-
|
5,890
|
359
|
382 | ||||||||||||
|
Non-farm non-residential
|
4,722
|
5,456
|
-
|
7,579
|
425
|
527 | ||||||||||||
|
Total Real Estate
|
5,770
|
6,504
|
-
|
14,540
|
847
|
980 | ||||||||||||
| Non-Real Estate: | ||||||||||||||||||
|
Agricultural
|
-
|
-
|
-
|
-
|
-
|
- | ||||||||||||
|
Commercial and industrial
|
-
|
-
|
-
|
1,472
|
134
|
162 | ||||||||||||
|
Consumer and other
|
-
|
-
|
-
|
-
|
-
|
- | ||||||||||||
| Total Non-Real Estate | - | - | - | 1,472 | 134 | 162 | ||||||||||||
| Total Impaired Loans with no related allowance | 5,770 | 6,504 | - | 16,012 | 981 | 1,142 | ||||||||||||
|
Impaired Loans with an allowance recorded:
|
||||||||||||||||||
|
Real Estate:
|
||||||||||||||||||
|
Construction & land development
|
5,777
|
5,777
|
1,166
|
6,345
|
383
|
360 | ||||||||||||
|
Farmland
|
-
|
-
|
-
|
-
|
-
|
- | ||||||||||||
|
1 - 4 family
|
2,427
|
2,620
|
25
|
1,643
|
121
|
107 | ||||||||||||
|
Multifamily
|
1,344
|
1,344
|
304
|
1,348
|
89
|
96 | ||||||||||||
|
Non-farm non-residential
|
14,557
|
17,469
|
1,053
|
14,868
|
775
|
573 | ||||||||||||
|
Total Real Estate
|
24,105
|
27,210
|
2,548
|
24,204
|
1,368
|
1,136 | ||||||||||||
| Non-Real Estate: | ||||||||||||||||||
|
Agricultural
|
-
|
-
|
-
|
-
|
-
|
- | ||||||||||||
|
Commercial and industrial
|
-
|
-
|
-
|
-
|
-
|
- | ||||||||||||
|
Consumer and other
|
-
|
-
|
-
|
-
|
-
|
- | ||||||||||||
| Total Non-Real Estate | - | - | - | - | - | - | ||||||||||||
| Total Impaired Loans with an allowance recorded | 24,105 | 27,210 | 2,548 | 24,204 | 1,368 | 1,136 | ||||||||||||
|
Total Impaired Loans
|
$
|
29,875
|
$
|
33,714
|
$
|
2,548
|
$
|
40,216
|
$
|
2,349
|
$ | 2,278 | ||||||
72
Troubled Debt Restructurings
A Troubled Debt Restructuring ("TDR") is a debt restructuring in which the creditor for economic or legal reasons related to the debtor's financial difficulties grants a concession to the debtor that it would not otherwise consider. The modifications to the Company's TDRs were concessions on the interest rate charged. The effect of the modifications to the Company was a reduction in interest income. These loans were evaluated in the Company's reserve for loan losses. In 2013, there were no loans restructured in a troubled debt restructuring. In 2014, there was one credit relationship in the amount of $2.2 million that was restructured in a troubled debt restructuring. The relationship was secured by 1-4 family real estate and a non-farm non-residential real estate property. The relationship was placed on interest only with a reduction in scheduled amortization
payments and contractual interest rate.
The following table is an age analysis of TDRs as of December 31, 2014 and December 31, 2013:
| Troubled Debt Restructurings | December 31, 2014 | December 31, 2013 | ||||||||||||||||||||||
| Accruing Loans | Accruing Loans | |||||||||||||||||||||||
| (in thousands) | Current | 30-89 Days Past Due | Nonaccrual | Total TDRs | Current | 30-89 Days Past Due | Nonaccrual | Total TDRs | ||||||||||||||||
| Real Estate: | ||||||||||||||||||||||||
| Construction & land development | $ | - | $ | - | $ | - | $ | - | $ | - | $ | - | $ | - | $ | - | ||||||||
| Farmland | - | - | - | - | - | - | - | - | ||||||||||||||||
| 1 - 4 Family | - | 1,752 | - | 1,752 | - | - | - | - | ||||||||||||||||
| Multifamily | - | - | - | - | - | - | - | - | ||||||||||||||||
| Non-farm non residential | 2,998 | 452 | 230 | 3,680 | 3,006 | - | 230 | 3,236 | ||||||||||||||||
| Total Real Estate | 2,998 | 2,204 | 230 | 5,432 | 3,006 | - | 230 | 3,236 | ||||||||||||||||
| Non-Real Estate: | ||||||||||||||||||||||||
| Agricultural | - | - | - | - | - | - | - | - | ||||||||||||||||
| Commercial and industrial | - | - | - | - | - | - | - | - | ||||||||||||||||
| Consumer and other | - | - | - | - | - | - | - | - | ||||||||||||||||
| Total Non-Real Estate | - | - | - | - | - | - | - | - | ||||||||||||||||
| Total | $ | 2,998 | $ | 2,204 | $ | 230 | $ | 5,432 | $ | 3,006 | $ | - | $ | 230 | $ | 3,236 | ||||||||
The following table discloses TDR activity for the twelve months ended December 31, 2014.
| Trouble Debt Restructured Loans Activity | ||||||||||||||||||||||||
|
Twelve Months Ended December 31, 2014
|
||||||||||||||||||||||||
| (in thousands) |
Beginning balance
(December 31, 2013)
|
New TDRs
|
Charge-offs post-modification
|
Transferred to ORE
|
Paydowns
|
Construction to permanent financing
|
Restructured to market terms |
Ending balance
(December 31, 2014)
|
||||||||||||||||
|
Real Estate:
|
||||||||||||||||||||||||
|
Construction & land development
|
$
|
-
|
$
|
-
|
$
|
-
|
$
|
-
|
$
|
-
|
$ | - | $ | - | $ | - | ||||||||
|
Farmland
|
-
|
-
|
-
|
-
|
-
|
- | - | - | ||||||||||||||||
|
1 - 4 family
|
-
|
1,752
|
-
|
-
|
-
|
- | - | 1,752 | ||||||||||||||||
|
Multifamily
|
-
|
-
|
-
|
-
|
-
|
- | - | - | ||||||||||||||||
|
Non-farm non-residential
|
3,236
|
452
|
-
|
-
|
(8
|
) | - | - | 3,680 | |||||||||||||||
|
Total Real Estate
|
3,236
|
2,204
|
-
|
-
|
(8
|
) | - | 5,432 | ||||||||||||||||
| Non-Real Estate: | ||||||||||||||||||||||||
|
Agricultural
|
-
|
-
|
-
|
-
|
-
|
- | - | - | ||||||||||||||||
|
Commercial and industrial
|
-
|
-
|
-
|
-
|
-
|
- | - | - | ||||||||||||||||
|
Consumer and other
|
-
|
-
|
-
|
-
|
-
|
- | - | - | ||||||||||||||||
| Total Non-Real Estate | - | - | - | - | - | - | - | - | ||||||||||||||||
| Total Impaired Loans with no related allowance | $ | 3,236 | $ | 2,204 | $ | - | $ | - | $ | (8 | ) | $ | - | $ | - | $ | 5,432 | |||||||
There were no commitments to lend additional funds to debtors whose terms have been modified in a troubled debt restructuring at December 31, 2014.
73
Note 7. Premises and Equipment
The components of premises and equipment at December 31, 2014 and 2013 are as follows:
| (in thousands) |
December 31, 2014
|
December 31, 2013
|
||||
|
Land
|
$
|
6,933
|
$
|
6,251
|
||
|
Bank premises
|
18,324
|
18,051
|
||||
|
Furniture and equipment
|
19,995
|
19,753
|
||||
|
Construction in progress
|
254
|
195
|
||||
|
Acquired value
|
45,506
|
44,250
|
||||
|
Less: accumulated depreciation
|
26,295
|
24,638
|
||||
|
Net book value
|
$
|
19,211
|
$
|
19,612
|
||
Depreciation expense amounted to $1.7 million, $1.7 million and $1.6 million for 2014, 2013 and 2012, respectively.
Note 8. Goodwill and Other Intangible Assets
Goodwill and intangible assets deemed to have indefinite lives are no longer amortized, but are subject to impairment testing. Other intangible assets continue to be amortized over their useful lives. Goodwill represents the purchase price over the fair value of net assets acquired from the Homestead Bancorp in 2007. No impairment charges have been recognized since acquisition. Goodwill totaled $2.0 million at December 31, 2014 and 2013.
| December 31, 2014 | December 31, 2013 | |||||||||||||||||
|
(in thousands)
|
Gross Carrying Amount | Accumulated Amortization | Net Carrying Amount | Gross Carrying Amount | Accumulated Amortization | Net Carrying Amount | ||||||||||||
| Core deposit intangibles | $ | 9,350 | $ | 7,732 | $ | 1,618 | $ | 9,350 | $ | 7,412 | $ | 1,938 | ||||||
| Mortgage servicing rights | 267 | 152 | 115 | 267 | 132 | 135 | ||||||||||||
| Total | $ | 9,617 | $ | 7,884 | $ | 1,733 | $ | 9,617 | $ | 7,544 | $ | 2,073 | ||||||
The core deposits intangible reflect the value of deposit relationships, including the beneficial rates, which arose from acquisitions. The weighted-average amortization period remaining for the core deposit intangibles is 5.4 years.
Amortization expense relating to purchase accounting intangibles totaled $0.3 million, $0.3 million, and $0.4 million for the year ended December 31, 2014, 2013, and 2012, respectively.
Amortization expense of the core deposit intangible assets for the next five years is as follows:
|
For the Years Ended
|
Estimated Amortization Expense (in thousands)
|
||
|
December 31, 2015
|
$
|
320
|
|
|
December 31, 2016
|
$
|
320
|
|
|
December 31, 2017
|
$
|
320
|
|
|
December 31, 2018
|
$
|
320
|
|
|
December 31, 2019
|
$
|
135
|
|
Note 9. Other Real Estate
Other real estate owned consists of the following:
|
(in thousands)
|
December 31, 2014 | December 31, 2013 | ||||
| Real Estate Owned Acquired by Foreclosure: | ||||||
| Residential | $ | 1,121 | $ | 1,803 | ||
| Construction & land development | 127 | 754 | ||||
| Non-farm non-residential | 950 | 800 | ||||
| Total Other Real Estate Owned and Foreclosed Property | $ | 2,198 | $ | 3,357 | ||
74
Note 10. Deposits
Time deposits maturing in the next five years are as follows:
|
(in thousands)
|
December 31, 2014 | ||
|
2015
|
$ | 392,738 | |
|
2016
|
145,628 | ||
|
2017
|
67,578 | ||
| 2018 | 12,107 | ||
| 2019 and thereafter | 38,975 | ||
|
Total
|
$ | 657,026 | |
The table above includes, for December 31, 2014, brokered deposits totaling $27.3 million. The aggregate amount of jumbo time deposits, each with a minimum denomination of $250,000 totaled $323.7 million and $270.3 million at December 31, 2014 and 2013, respectively.
Note 11. Borrowings
Short-term borrowings are summarized as follows:
| (in thousands) |
December 31, 2014
|
December 31, 2013
|
||||
|
Securities sold under agreements to repurchase
|
$
|
-
|
$
|
3,988
|
||
| Line of credit | 1,800 | 1,800 | ||||
|
Total short-term borrowings
|
$
|
1,800
|
$
|
5,788
|
||
Securities sold under agreements to repurchase, which are classified as secured borrowings, generally mature daily. Interest rates on repurchase agreements are set by Management and are generally based on the 91-day Treasury bill rate. The Company no longer offered repurchase agreements beginning in April 2014.
Available lines of credit totaled $266.7 million at December 31, 2014 and $210.6 million at December 31, 2013.
The following schedule provides certain information about the Company’s short-term borrowings for the periods indicated:
| December 31, | |||||||||
| (in thousands except for %) | 2014 |
2013
|
2012
|
||||||
|
Outstanding at year end
|
$ | 1,800 |
$
|
5,788
|
$
|
14,746
|
|||
|
Maximum month-end outstanding
|
$ | 22,356 | $ |
57,302
|
$ |
31,850
|
|||
|
Average daily outstanding
|
$ | 6,960 | $ |
21,387
|
$ |
14,560
|
|||
|
Weighted average rate during the year
|
1.08 | % |
0.98
|
%
|
0.25
|
%
|
|||
|
Average rate at year end
|
4.50 | % |
1.51
|
%
|
0.75
|
%
|
|||
The Company's senior long-term debt, priced at Wall Street Journal Prime plus 75 basis points (4.00%), totaled $1.5 million at December 31, 2014. The Company pays $50,000 principal plus interest monthly. This loan has a contractual maturity date of May 12, 2017. This long-term debt is secured by a pledge of 13.2% (735,745 shares) of the Company's interest in First Guaranty Bank (a wholly owned subsidiary) under a Commercial Pledge Agreement dated June 22, 2011.
The Company maintains a revolving line of credit for $2.5 million with an availability of $0.7 million at December 31, 2014. This line of credit is secured by the same collateral as the term loan and is priced at 4.50%.
At December 31, 2014, letters of credit issued by the FHLB totaling $150.0 million were outstanding and carried as off-balance sheet items, all of which expire in 2015. At December 31, 2013, letters of credit issued by the FHLB totaling $90.0 million were outstanding and carried as off-balance sheet items, all of which expired in 2014. The letters of credit are solely used for pledging towards public fund deposits. The FHLB has a blanket lien on substantially all of the loans in the Company’s portfolio which is used to secure borrowing availability from the FHLB. The Company has obtained a subordination agreement from the FHLB on the Company’s farmland, agricultural, and commercial and industrial loans. These loans are available to be pledged for additional reserve liquidity.
As of December 31, 2014 maturities on long-term debt were as follows:
| (in thousands) | Long-term debt | ||
|
2015
|
$ | - | |
|
2016
|
- | ||
|
2017
|
1,455 | ||
|
2018
|
- | ||
|
2019 and thereafter
|
- | ||
| Total | $ | 1,455 | |
75
Note 12. Preferred Stock
On September 22, 2011, the Company received $39.4 million in funds from the U.S. Treasury's Small Business Lending Fund program. $21.1 million of the funds were used to redeem the Company's Series A and B Preferred Stock issued to the U.S. Treasury under the Capital Purchase Program. The Preferred Series C shares will receive quarterly dividends and the initial dividend rate was 5.00%. The dividend rate is based on qualified loan growth two quarters in arrears. During 2014 the Company achieved the growth in qualified loans required to achieve the 1.0% dividend rate. The 1.0% rate is locked in until December 31, 2015. During 2014 the Company paid $0.4 million in preferred stock dividends compared to $0.7 million in 2013 and $2.0 million in 2012. After 4.5 years in the program, the dividend rate will increase to 9.00% if the Preferred Series C shares have not been repurchased by that time.
Note 13. Accumulated Other Comprehensive Income (Loss)
The following table details the changes in the single component of accumulated other comprehensive (loss) income for the twelve months ended December 31, 2014:
|
(in thousands)
|
Unrealized Gain (Loss) on Securities Available for Sale | ||
| Accumulated Other Comprehensive Income (Loss): | |||
|
Balance December 31, 2013
|
$ | (9,134 | ) |
| Reclassification adjustments to net income: | |||
| Realized gains on securities | (295 | ) | |
| Provision for income taxes | 100 | ||
| Decrease in unrealized losses arising during the period, net of tax | 9,570 | ||
| Balance December 31, 2014 | $ | 241 | |
The following table details the changes in the single component of accumulated other comprehensive income for the twelve months ended December 31, 2013:
|
(in thousands)
|
Unrealized Gain (Loss) on Securities Available for Sale | ||
| Accumulated Other Comprehensive Income (Loss): | |||
|
Balance December 31, 2012
|
$ | 6,048 | |
| Reclassification adjustments to net income: | |||
| Realized gains on securities | (1,571 | ) | |
| Provision for income taxes | 534 | ||
| Unrealized losses arising during the period, net of tax | (14,145 | ) | |
| Balance December 31, 2013 | $ | (9,134 | ) |
The following table details the changes in the single component of accumulated other comprehensive income for the twelve months ended December 31, 2012:
|
(in thousands)
|
Unrealized Gain (Loss) on Securities Available for Sale | ||
| Accumulated Other Comprehensive Income (Loss): | |||
|
Balance December 31, 2011
|
$ | 4,467 | |
| Reclassification adjustments to net income: | |||
| Realized gains on securities | (4,868 | ) | |
| Provision for income taxes | 1,655 | ||
| Unrealized gains arising during the period, net of tax | 4,794 | ||
| Balance December 31, 2012 | $ | 6,048 | |
76
Note 14. Capital Requirements
The Company and the Bank are subject to various regulatory capital requirements administered by federal and state banking agencies. Failure to meet minimum capital requirements can initiate certain mandatory and possibly additional discretionary actions that, if undertaken, could have a direct material effect on the Company’s financial statements. Under capital adequacy guidelines and the regulatory framework for prompt corrective action, the Company and the Bank must meet specific capital guidelines that involve quantitative measures of their assets, liabilities and certain off-balance sheet items as calculated under regulatory accounting practices. The capital amounts and classification are also subject to qualitative judgments by the regulators about components, risk weightings and other factors. Prompt corrective action provisions are not applicable to bank holding companies.
Quantitative measures established by regulation to ensure capital adequacy require the Company and the Bank to maintain minimum amounts and ratios of total and Tier 1 capital to risk-weighted assets and of Tier 1 capital to average assets. Management believes, as of December 31, 2014 and 2013, that the Company and the Bank met all capital adequacy requirements.
As of December 31, 2014, the most recent notification from the Federal Deposit Insurance Corporation categorized the Bank as well capitalized under the regulatory framework for prompt corrective action. To be categorized as well capitalized, an institution must maintain minimum total risk-based, Tier 1 risk-based and Tier 1 leverage ratios as set forth in the following table. There are no conditions or events since the notification that Management believes have changed the Bank’s category. The Company’s and the Bank’s actual capital amounts and ratios as of December 31, 2014 and 2013 are presented in the following table.
| Actual | Minimum Capital Requirements | Minimum to be Well Capitalized Under Action Provisions | ||||||||||
| (in thousands except for %) | Amount |
Ratio
|
Amount |
Ratio
|
Amount |
Ratio
|
||||||
| December 31, 2014 | ||||||||||||
|
Total Risk-based Capital:
|
||||||||||||
|
Consolidated
|
$ |
144,834
|
14.05
|
% | $ |
82,486
|
8.00
|
% |
N/A
|
N/A
|
||
|
Bank
|
$ |
143,426
|
13.96
|
% | $ |
82,170
|
8.00
|
% | $ |
102,712
|
10.00
|
% |
|
Tier 1 Capital:
|
||||||||||||
|
Consolidated
|
$ |
135,727
|
13.16
|
% | $ |
41,243
|
4.00
|
% |
N/A
|
N/A
|
||
|
Bank
|
$ |
134,319
|
13.08
|
% | $ |
41,085
|
4.00
|
% | $ |
61,627
|
6.00
|
% |
|
Tier 1 Leverage Capital:
|
||||||||||||
|
Consolidated
|
$ |
135,737
|
9.33
|
% | $ |
58,173
|
4.00
|
% |
N/A
|
N/A
|
||
|
Bank
|
$ |
134,319
|
9.26
|
% | $ |
58,025
|
4.00
|
% | $ |
72,532
|
5.00
|
% |
|
December 31, 2013
|
||||||||||||
|
Total Risk-based Capital:
|
||||||||||||
|
Consolidated
|
$ |
138,958
|
14.71
|
% | $ |
75,594
|
8.00
|
% |
N/A
|
N/A
|
||
|
Bank
|
$ |
139,234
|
14.76
|
% | $ |
75,462
|
8.00
|
% | $ |
94,328
|
10.00
|
% |
|
Tier 1 Capital:
|
||||||||||||
|
Consolidated
|
$ |
128,603
|
13.61
|
% | $ |
37,797
|
4.00
|
% |
N/A
|
N/A
|
||
|
Bank
|
$ |
128,879
|
13.66
|
% | $ |
37,731
|
4.00
|
% | $ |
56,597
|
6.00
|
% |
|
Tier 1 Leverage Capital:
|
||||||||||||
|
Consolidated
|
$ |
128,603
|
9.14
|
% | $ |
56,307
|
4.00
|
% |
N/A
|
N/A
|
||
|
Bank
|
$ |
128,879
|
9.17
|
% | $ |
56,236
|
4.00
|
% | $ |
70,295
|
5.00
|
% |
77
Note 15. Dividend Restrictions
The Federal Reserve Bank ("FRB") has stated that, generally, a bank holding company should not maintain a rate of distributions to shareholders unless its available net income has been sufficient to fully fund the distributions, and the prospective rate of earnings retention appears consistent with the bank holding company’s capital needs, asset quality and overall financial condition. As a Louisiana corporation, the Company is restricted under the Louisiana corporate law from paying dividends under certain conditions.
First Guaranty Bank may not pay dividends or distribute capital assets if it is in default on any assessment due to the FDIC. First Guaranty Bank is also subject to regulations that impose minimum regulatory capital and minimum state law earnings requirements that affect the amount of cash available for distribution. In addition, under the Louisiana Banking Law, dividends may not be paid if it would reduce the unimpaired surplus below 50% of outstanding capital stock in any year.
The Bank is restricted under applicable laws in the payment of dividends to an amount equal to current year earnings plus undistributed earnings for the immediately preceding year, unless prior permission is received from the Commissioner of Financial Institutions for the State of Louisiana. Dividends payable by the Bank in 2015 without permission will be limited to 2015 earnings plus the undistributed earnings of $5.1 million from 2014.
Accordingly, at January 1, 2015, $133.1 million of the Company’s equity in the net assets of the Bank was restricted. In addition, dividends paid by the Bank to the Company would be prohibited if the effect thereof would cause the Bank’s capital to be reduced below applicable minimum capital requirements.
Under the requirements of the United States Treasury’s Small Business Lending Fund, the Company is permitted to pay dividends on its common stock, provided that: (i) the Company’s Tier 1 capital would be at least 90% of the amount of Tier 1 capital existing immediately after receipt of SBLF funds; and (ii) the SBLF Dividends have been declared and paid to Treasury as of the most recent applicable dividend period. The Company has met each SBLF dividend obligation in a timely manner since receipt of SBLF funds. After two years from receipt, the 90% limitation will decrease by 10% for every 1% increase in qualified small business lending. See Note 12 for disclosure on the Company’s SBLF Preferred Stock Series C.
Note 16. Related Party Transactions
In the normal course of business, the Company and its subsidiary, First Guaranty Bank, have loans, deposits and other transactions with its executive officers, directors and certain business organizations and individuals with which such persons are associated. These transactions are completed with terms no less favorable than current market rates. An analysis of the activity of loans made to such borrowers during the year ended December 31, 2014 and 2013 follows:
| December 31, | ||||||
| (in thousands) |
2014
|
2013
|
||||
|
Balance, beginning of year
|
$
|
49,951
|
$
|
33,148
|
||
|
Net Increase
|
3,857
|
16,803
|
||||
|
Balance, end of year
|
$
|
53,808
|
$
|
49,951
|
||
Unfunded commitments to the Company and Bank directors and executive officers totaled $19.7 million and $17.9 million at December 31, 2014 and 2013, respectively. At December 31, 2014 the Company and the Bank had deposits from directors and executives totaling $20.3 million. There were no participations in loans purchased from affiliated financial institutions included in the Company’s loan portfolio in 2014 or 2013.
During the years ended 2014, 2013 and 2012, the Company paid approximately $0.2 million, $0.5 million and $0.6 million, respectively, for printing services and supplies and office furniture and equipment to Champion Industries, Inc., of which Mr. Marshall T. Reynolds, the Chairman of the Company’s Board of Directors, is President, Chief Executive Officer, Chairman of the Board of Directors and holder of 53.7% of Champion's common stock as of January 9, 2015.
The Company paid insurance expenses of $2.3 million, $2.4 million and $1.7 million for 2014, 2013 and 2012, respectively for participation in an employee medical benefit plan in which several entities under common ownership of the Company's Chairman participate. The Company terminated the plan in 2014 and enrolled in a fully insured plan from a third party national provider of health insurance.
The Company paid travel expenses to Sabre Transportation, Inc. of $0, $49,000 and $0.2 million for 2014, 2013 and 2012, respectively. These expenses include the utilization of an aircraft, fuel, air crew and ramp fees. The Harrah and Reynolds Corporation, of which Mr. Reynolds is President and Chief Executive Officer and sole shareholder, has controlling interest in Sabre Transportation, Inc.
78
Note 17. Employee Benefit Plans
The Company has an employee savings plan to which employees, who meet certain service requirements, may defer 1% to 20% of their base salaries, 6% of which may be matched up to 100%, at its sole discretion. Contributions to the savings plan were $87,000, $81,000 and $67,000 in 2014, 2013 and 2012, respectively. The Company has an Employee Stock Ownership Plan (“ESOP”) which was frozen in 2010. No contributions were made to the ESOP for the years 2014, 2013 or 2012. As of December 31, 2014, the ESOP held 16,420 shares. The Company does not plan to make future contributions to this plan.
Note 18. Other Expenses
The following is a summary of the significant components of other noninterest expense:
| December 31, | |||||||||
|
(in thousands)
|
2014 |
2013
|
2012 | ||||||
|
Other noninterest expense:
|
|||||||||
|
Legal and professional fees
|
$ | 1,982 |
$
|
2,347
|
$ | 1,990 | |||
|
Data processing
|
1,153 |
1,269
|
1,225 | ||||||
|
Marketing and public relations
|
700 |
638
|
697 | ||||||
|
Taxes - sales, capital and franchise
|
605 |
584
|
661 | ||||||
|
Operating supplies
|
410 |
487
|
581 | ||||||
|
Travel and lodging
|
566 |
563
|
523 | ||||||
| Telephone | 242 | 206 | 220 | ||||||
| Amortization of core deposits | 320 | 320 | 350 | ||||||
| Donations | 150 | 294 | 195 | ||||||
|
Net costs from other real estate and repossessions
|
1,374 |
941
|
2,083 | ||||||
|
Regulatory assessment
|
1,181 |
1,784
|
1,471 | ||||||
|
Other
|
3,143 |
3,237
|
3,784 | ||||||
|
Total other noninterest expense
|
$ | 11,826 |
$
|
12,670
|
$ | 13,780 | |||
The Company does not capitalize advertising costs. They are expensed as incurred and are included in other noninterest expense on the Consolidated Statements of Income. Advertising expense was $0.4 million, $0.4 million and $0.4 million for 2014, 2013 and 2012, respectively.
79
Note 19. Income Taxes
The following is a summary of the provision for income taxes included in the Statements of Income:
| December 31, | |||||||||
|
(in thousands)
|
2014
|
2013
|
2012
|
||||||
|
Current
|
$
|
4,898
|
$
|
4,748
|
$
|
6,366
|
|||
|
Deferred
|
594 |
(171
|
) |
(505
|
)
|
||||
|
Total
|
$
|
5,492
|
$
|
4,577
|
$
|
5,861
|
|||
The difference between income taxes computed by applying the statutory federal income tax rate and the provision for income taxes in the financial statements is reconciled as follows:
| December 31, | |||||||||
| (in thousands except for %) |
2014
|
2013
|
2012
|
||||||
|
Statutory tax rate
|
35.0
|
%
|
35.0
|
%
|
35.0
|
%
|
|||
|
Federal income taxes at statutory rate
|
$
|
5,851 |
$
|
4,803
|
$
|
6,272
|
|||
| Tax exempt municipal income | (284 | ) | (133 | ) | (156 | ) | |||
|
Other
|
(75 | ) |
(93
|
)
|
(255
|
)
|
|||
|
Total
|
$
|
5,492
|
$
|
4,577
|
$
|
5,861
|
|||
Deferred taxes are recorded based upon differences between the financial statement and tax basis of assets and liabilities, and available tax credit carry forwards. Temporary differences between the financial statement and tax values of assets and liabilities give rise to deferred taxes. The significant components of deferred taxes classified in the Company's Consolidated Balance Sheets at December 31, 2014 and 2013 are as follows:
| December 31, | ||||||
| (in thousands) |
2014
|
2013
|
||||
|
Deferred tax assets:
|
||||||
|
Allowance for loan losses
|
$
|
3,096
|
$
|
3,521
|
||
|
Other real estate owned
|
148 |
485
|
||||
|
Unrealized losses on available for sale securities
|
- | 4,706 | ||||
|
Other
|
407
|
425
|
||||
|
Gross deferred tax assets
|
3,651
|
9,137
|
||||
|
Deferred tax liabilities:
|
||||||
|
Depreciation and amortization
|
(1,779 |
)
|
(1,858
|
)
|
||
| Core deposit intangibles | (550 | ) | (659 | ) | ||
|
Unrealized gains on available for sale securities
|
(124
|
) |
-
|
|
||
|
Other
|
(359
|
)
|
(328
|
)
|
||
|
Gross deferred tax liabilities
|
(2,812
|
)
|
(2,845
|
)
|
||
|
Net deferred tax assets
|
$
|
839
|
$
|
6,292
|
||
As of December 31, 2014 and 2013, there were no net operating loss carryforwards for income tax purposes.
ASC 740-10, Income Taxes, clarifies the accounting for uncertainty in income taxes and prescribes a recognition threshold and measurement attribute for the consolidated financial statements recognition and measurement of a tax position taken or expected to be taken in a tax return. The Company does not believe it has any unrecognized tax benefits included in its consolidated financial statements. The Company has not had any settlements in the current period with taxing authorities, nor has it recognized tax benefits as a result of a lapse of the applicable statute of limitations. The Company recognizes interest and penalties accrued related to unrecognized tax benefits, if applicable, in noninterest expense. During the years ended December 31, 2014, 2013 and 2012, the Company did not recognize any interest or penalties in its consolidated financial statements, nor has it recorded an accrued liability for interest or penalty payments.
80
Note 20. Commitments and Contingencies
Off-balance sheet commitments
The Company is a party to financial instruments with off-balance sheet risk in the normal course of business to meet the financing needs of its customers and to reduce its own exposure to fluctuations in interest rates. These financial instruments include commitments to extend credit and standby and commercial letters of credit. Those instruments involve, to varying degrees, elements of credit and interest rate risk in excess of the amount recognized in the Consolidated Balance Sheets. The contract or notional amounts of those instruments reflect the extent of the involvement in particular classes of financial instruments.
The exposure to credit loss in the event of nonperformance by the other party to the financial instrument for commitments to extend credit and standby and commercial letters of credit is represented by the contractual notional amount of those instruments. Unless otherwise noted, collateral or other security is not required to support financial instruments with credit risk.
Set forth below is a summary of the notional amounts of the financial instruments with off-balance sheet risk at December 31, 2014 and December 31, 2013.
|
(in thousands)
|
December 31, 2014 | December 31, 2013 | ||||
| Contract Amount | ||||||
| Commitments to Extend Credit | $ | 59,675 | $ | 30,516 | ||
| Unfunded Commitments under lines of credit | $ | 111,247 | $ | 115,311 | ||
| Commercial and Standby letters of credit | $ | 7,743 | $ | 7,695 | ||
Commitments to extend credit are agreements to lend to a customer as long as there is no violation of any condition established in the contract. Commitments generally have fixed expiration dates or other termination clauses and may require payment of a fee. Since commitments may expire without being drawn upon, the total commitment amounts do not necessarily represent future cash requirements. Each customer's creditworthiness is evaluated on a case-by-case basis. The amount of collateral obtained, if deemed necessary upon extension of credit, is based on Management's credit evaluation of the counterpart. Collateral requirements vary but may include accounts receivable, inventory, property, plant and equipment, residential real estate and commercial properties.
Standby and commercial letters of credit are conditional commitments to guarantee the performance of a customer to a third party. These guarantees are primarily issued to support public and private borrowing arrangements, including commercial paper, bond financing and similar transactions. The majority of these guarantees are short-term, one year or less; however, some guarantees extend for up to three years. The credit risk involved in issuing letters of credit is essentially the same as that involved in extending loan facilities. Collateral requirements are the same as on-balance sheet instruments and commitments to extend credit.
There were no losses incurred on off-balance sheet commitments in 2014, 2013 or 2012.
81
Note 21. Fair Value Measurements
The fair value of a financial instrument is the current amount that would be received to sell an asset or paid to transfer a liability in an orderly transaction between market participants. A fair value measurement assumes that the transaction to sell the asset or transfer the liability occurs in the principal market for the asset or liability or, in the absence of a principal market, the most advantageous market for the asset or liability. Valuation techniques use certain inputs to arrive at fair value. Inputs to valuation techniques are the assumptions that market participants would use in pricing the asset or liability. They may be observable or unobservable. The Company uses a fair value hierarchy for valuation inputs that gives the highest priority to quoted prices in active markets for identical assets or liabilities and the lowest priority to unobservable inputs. The fair value hierarchy is as follows:
Level 1 Inputs – Unadjusted quoted market prices in active markets for identical assets or liabilities that the reporting entity has the ability to access at the measurement date.
Level 2 Inputs – Inputs other than quoted prices included in Level 1 that are observable for the asset or liability, either directly or indirectly. These might include quoted prices for similar assets or liabilities in active markets, quoted prices for identical or similar assets or liabilities in markets that are not active, inputs other than quoted prices that are observable for the asset or liability (such as interest rates, volatilities, prepayment speeds or credit risks) or inputs that are derived principally from or corroborated by market data by correlation or other means.
Level 3 Inputs – Unobservable inputs for determining the fair values of assets or liabilities that reflect an entity’s own assumptions about the assumptions that market participants would use in pricing the assets or liabilities.
A description of the valuation methodologies used for instruments measured at fair value follows, as well as the classification of such instruments within the valuation hierarchy.
Securities available for sale. Securities are classified within Level 1 where quoted market prices are available in an active market. Inputs include securities that have quoted prices in active markets for identical assets. If quoted market prices are unavailable, fair value is estimated using quoted prices of securities with similar characteristics, at which point the securities would be classified within Level 2 of the hierarchy. Securities classified Level 3 as of December 31, 2013 include municipal bonds and an equity security.
Impaired loans. Loans are measured for impairment using the methods permitted by ASC Topic 310. Fair value of impaired loans is measured by either the fair value of the collateral if the loan is collateral dependent (Level 2 or Level 3), or the present value of expected future cash flows, discounted at the loan's effective interest rate (Level 3). Fair value of the collateral is determined by appraisals or by independent valuation.
Other real estate owned. Properties are recorded at the balance of the loan or at estimated fair value less estimated selling costs, whichever is less, at the date acquired. Fair values of other real estate owned ("OREO") at December 31, 2014 and 2013 are determined by sales agreement or appraisal, and costs to sell are based on estimation per the terms and conditions of the sales agreement or amounts commonly used in real estate transactions. Inputs include appraisal values or recent sales activity for similar assets in the property’s market; thus OREO measured at fair value would be classified within either Level 2 or Level 3 of the hierarchy.
Certain non-financial assets and non-financial liabilities are measured at fair value on a non-recurring basis including assets and liabilities related to reporting units measured at fair value in the testing of goodwill impairment, as well as intangible assets and other non-financial long-lived assets measured at fair value for impairment assessment.
The following table summarizes financial assets measured at fair value on a recurring basis as of December 31, 2014 and 2013, segregated by the level of the valuation inputs within the fair value hierarchy utilized to measure fair value:
| (in thousands) | December 31, 2014 | December 31, 2013 | ||||
|
Available for Sale Securities Fair Value Measurements Using:
|
||||||
|
Level 1: Quoted Prices in Active Markets For Identical Assets
|
$
|
36,504
|
$
|
36,492
|
||
|
Level 2: Significant Other Observable Inputs
|
|
454,524
|
441,885
|
|||
|
Level 3: Significant Unobservable Inputs
|
|
8,780
|
5,834
|
|||
| Securities available for sale measured at fair value | $ | 499,808 | $ | 484,211 | ||
The Company's valuation methodologies may produce a fair value calculation that may not be indicative of net realizable value or reflective of future fair values. While Management believes the methodologies used are appropriate and consistent with other market participants, the use of different methodologies or assumptions to determine the fair value of certain financial instruments could result in a different estimate of fair value.
The change in Level 3 securities available for sale from December 31, 2013 was due to the purchase of $3.8 million of municipal bonds net of payments received on outstanding bonds.
82
The following table reconciles assets measured at fair value on a recurring basis using unobservable inputs (Level 3):
| Level 3 Changes | ||||||
| (in thousands) | December 31, 2014 | December 31, 2013 | ||||
|
Balance, beginning of year
|
$ | 5,834 |
$
|
6,707
|
||
|
Total gains or losses (realized/unrealized):
|
||||||
|
Included in earnings
|
- |
-
|
||||
|
Included in other comprehensive income
|
- |
-
|
||||
|
Purchases, sales, issuances and settlements, net
|
2,946 |
(873
|
)
|
|||
|
Transfers in and/or out of Level 3
|
- |
-
|
||||
|
Balance as of end of year
|
$ | 8,780 | $ |
5,834
|
||
There were no gains or losses for the period included in earnings attributable to the change in unrealized gains or losses relating to assets still held as of December 31, 2014.
The following table measures financial assets and financial liabilities measured at fair value on a non-recurring basis as of December 31, 2014, segregated by the level of valuation inputs within the fair value hierarchy utilized to measure fair value:
|
(in thousands)
|
At December 31, 2014
|
At December 31, 2013
|
||||
|
Fair Value Measurements Using: Impaired Loans
|
||||||
|
Level 1: Quoted Prices in Active Markets For Identical Assets
|
$
|
- |
$
|
- | ||
|
Level 2: Significant Other Observable Inputs
|
|
5,244 |
|
4,558 | ||
|
Level 3: Significant Unobservable Inputs
|
|
15,618 |
|
19,547 | ||
| Impaired loans measured at fair value | $ | 20,862 | $ | 24,105 | ||
|
Fair Value Measurements Using: Other Real Estate Owned
|
||||||
|
Level 1: Quoted Prices in Active Markets For Identical Assets
|
$
|
- |
$
|
- | ||
|
Level 2: Significant Other Observable Inputs
|
|
1,847 |
|
3,357 | ||
|
Level 3: Significant Unobservable Inputs
|
|
351 | - | |||
| Other real estate owned measured at fair value | $ | 2,198 | $ | 3,357 | ||
ASC 825-10 provides the Company with an option to report selected financial assets and liabilities at fair value. The fair value option established by this statement permits the Company to choose to measure eligible items at fair value at specified election dates and report unrealized gains and losses on items for which the fair value option has been elected in earnings at each reporting date subsequent to implementation.
The Company has chosen not to elect the fair value option for any items that are not already required to be measured at fair value in accordance with accounting principles generally accepted in the United States.
83
Note 22. Financial Instruments
Fair value estimates are generally subjective in nature and are dependent upon a number of significant assumptions associated with each instrument or group of similar instruments, including estimates of discount rates, risks associated with specific financial instruments, estimates of future cash flows and relevant available market information. Fair value information is intended to represent an estimate of an amount at which a financial instrument could be exchanged in a current transaction between a willing buyer and seller engaging in an exchange transaction. However, since there are no established trading markets for a significant portion of the Company’s financial instruments, the Company may not be able to immediately settle financial instruments; as such, the fair values are not necessarily indicative of the amounts that could be realized through immediate settlement. In addition, the majority of the financial instruments, such as loans and deposits, are held to maturity and are realized or paid according to the contractual agreement with the customer.
Quoted market prices are used to estimate fair values when available. However, due to the nature of the financial instruments, in many instances quoted market prices are not available. Accordingly, estimated fair values have been estimated based on other valuation techniques, such as discounting estimated future cash flows using a rate commensurate with the risks involved or other acceptable methods. Fair values are estimated without regard to any premium or discount that may result from concentrations of ownership of financial instruments, possible income tax ramifications or estimated transaction costs. The fair value estimates are subjective in nature and involve matters of significant judgment and, therefore, cannot be determined with precision. Fair values are also estimated at a specific point in time and are based on interest rates and other assumptions at that date. As events change the assumptions underlying these estimates, the fair values of financial instruments will change.
Disclosure of fair values is not required for certain items such as lease financing, investments accounted for under the equity method of accounting, obligations of pension and other postretirement benefits, premises and equipment, other real estate, prepaid expenses, the value of long-term relationships with depositors (core deposit intangibles) and other customer relationships, other intangible assets and income tax assets and liabilities. Fair value estimates are presented for existing on- and off-balance sheet financial instruments without attempting to estimate the value of anticipated future business and the value of assets and liabilities that are not considered financial instruments. In addition, the tax ramifications related to the realization of the unrealized gains and losses have not been considered in the estimates. Accordingly, the aggregate fair value amounts presented do not purport to represent and should not be considered representative of the underlying market or franchise value of the Company.
Because the standard permits many alternative calculation techniques and because numerous assumptions have been used to estimate the fair values, reasonable comparison of the fair value information with other financial institutions' fair value information cannot necessarily be made. The methods and assumptions used to estimate the fair values of financial instruments are as follows:
Cash and due from banks, interest-bearing deposits with banks, federal funds sold and federal funds purchased.
These items are generally short-term and the carrying amounts reported in the consolidated balance sheets are a reasonable estimation of the fair values.
Investment Securities.
Fair values are principally based on quoted market prices. If quoted market prices are not available, fair values are based on quoted market prices of comparable instruments or the use of discounted cash flow analyses.
Loans Held for Sale.
Fair values of mortgage loans held for sale are based on commitments on hand from investors or prevailing market prices. These loans are classified within level 3 of the fair value hierarchy.
Loans, net.
Market values are computed present values using net present value formulas. The present value is the sum of the present value of all projected cash flows on an item at a specified discount rate. The discount rate is set as an appropriate rate index, plus or minus an appropriate spread. These loans are classified within level 3 of the fair value hierarchy.
Accrued interest receivable.
The carrying amount of accrued interest receivable approximates its fair value.
Deposits.
Market values are actually computed present values using net present value formulas. The present value is the sum of the present value of all projected cash flows on an item at a specified discount rate. The discount rate is set as an appropriate rate index, plus or minus an appropriate spread. Deposits are classified within level 3 of the fair value hierarchy.
Accrued interest payable.
The carrying amount of accrued interest payable approximates its fair value.
84
Borrowings.
The carrying amount of federal funds purchased and other short-term borrowings approximate their fair values. The fair value of the Company’s long-term borrowings is computed using net present value formulas. The present value is the sum of the present value of all projected cash flows on an item at a specified discount rate. The discount rate is set as an appropriate rate index, plus or minus an appropriate spread. Borrowings are classified within level 3 of the fair value hierarchy.
Other Unrecognized Financial Instruments.
The fair value of commitments to extend credit is estimated using the fees charged to enter into similar legally binding agreements, taking into account the remaining terms of the agreements and customers' credit ratings. For fixed-rate loan commitments, fair value also considers the difference between current levels of interest rates and the committed rates. Noninterest-bearing deposits are held at cost. The fair values of letters of credit are based on fees charged for similar agreements or on estimated cost to terminate them or otherwise settle the obligations with the counterparties at the reporting date. At December 31, 2014 and 2013 the fair value of guarantees under commercial and standby letters of credit was not material.
The estimated fair values and carrying values of the financial instruments at December 31, 2014 and 2013 are presented in the following table:
| December 31, | ||||||||||||
|
2014
|
2013
|
|||||||||||
| (in thousands) |
Carrying Value
|
Estimated Fair Value
|
Carrying Value
|
Estimated Fair Value
|
||||||||
|
Assets
|
||||||||||||
|
Cash and cash equivalents
|
$
|
44,575
|
$
|
44,575
|
$
|
61,484
|
$
|
61,484
|
||||
|
Securities, available for sale
|
$ |
499,808
|
$ |
499,808
|
$ |
484,211
|
$ |
484,211
|
||||
|
Securities, held to maturity
|
$ |
141,795
|
$ |
139,688
|
$ |
150,293
|
$ |
141,642
|
||||
|
Federal Home Loan Bank stock
|
$ |
1,621
|
$ |
1,621
|
$ |
1,835
|
$ |
1,835
|
||||
|
Loans, net
|
$ |
790,321
|
$ |
789,575
|
$ |
703,166
|
$ |
703,025
|
||||
|
Accrued interest receivable
|
$ |
6,384
|
$ |
6,384
|
$ |
6,258
|
$ |
6,258
|
||||
|
Liabilities
|
||||||||||||
|
Deposits
|
$
|
1,371,839
|
$
|
1,339,574
|
$
|
1,303,099
|
$
|
1,265,898
|
||||
|
Borrowings
|
$ |
3,255
|
$ |
3,255
|
$ |
6,288
|
$ |
6,288
|
||||
|
Accrued interest payable
|
$ |
1,997
|
$ |
1,997
|
$ |
2,364
|
$ |
2,364
|
||||
There is no material difference between the contract amount and the estimated fair value of off-balance sheet items that are primarily comprised of short-term unfunded loan commitments that are generally at market prices.
Note 23. Concentrations of Credit and Other Risks
The Company monitors loan portfolio concentrations by region, collateral type, loan type, and industry on a monthly basis and has established maximum thresholds as a percentage of its capital to ensure that the desired mix and diversification of its loan portfolio is achieved. The Company is compliant with the established thresholds as of December 31, 2014. Personal, commercial and residential loans are granted to customers, most of who reside in northern and southern areas of Louisiana. Although the Company has a diversified loan portfolio, significant portions of the loans are collateralized by real estate located in Tangipahoa Parish and surrounding parishes in Southeast Louisiana. Declines in the Louisiana economy could result in lower real estate values which could, under certain circumstances, result in losses to the Company.
The distribution of commitments to extend credit approximates the distribution of loans outstanding. Commercial and standby letters of credit were granted primarily to commercial borrowers. Generally, credit is not extended in excess of $10.0 million to any single borrower or group of related borrowers.
Approximately 43.9% of the Company’s deposits are derived from local governmental agencies at December 31, 2014. These governmental depositing authorities are generally long-term customers. A number of the depositing authorities are under contractual obligation to maintain their operating funds exclusively with the Company. In most cases, the Company is required to pledge securities or letters of credit issued by the Federal Home Loan Bank to the depositing authorities to collateralize their deposits. Under certain circumstances, the withdrawal of all of, or a significant portion of, the deposits of one or more of the depositing authorities may result in a temporary reduction in liquidity, depending primarily on the maturities and/or classifications of the securities pledged against such deposits and the ability to replace such deposits with either new deposits or other borrowings. Public fund deposits totaled $601.5 million at December 31, 2014.
Note 24. Litigation
The Company is subject to various legal proceedings in the normal course of its business. It is Management’s belief that the ultimate resolution of such claims will not have a material adverse effect on the Company’s financial position or results of operations.
85
Note 25. Condensed Parent Company Information
The following condensed financial information reflects the accounts and transactions of First Guaranty Bancshares, Inc. for the dates indicated:
|
First Guaranty Bancshares, Inc.
|
||||||
|
Condensed Balance Sheets
|
||||||
| December 31, | ||||||
| (in thousands) | 2014 | 2013 | ||||
|
Assets
|
||||||
|
Cash
|
$
|
723
|
$
|
433
|
||
|
Investment in bank subsidiary
|
138,176
|
123,681
|
||||
| Investment Securities (available for sale, at fair value) | 70 | 64 | ||||
|
Other assets
|
5,129
|
1,748
|
||||
|
Total Assets
|
$
|
144,098
|
$
|
125,926
|
||
|
Liabilities and Shareholders' Equity
|
||||||
| Short-term debt | $ | 1,800 | $ | 1,800 | ||
| Long-term debt | 2,439 | 500 | ||||
|
Other liabilities
|
276
|
221
|
||||
| Total Liabilities | 4,515 | 2,521 | ||||
|
Shareholders' Equity
|
139,583 |
123,405
|
||||
|
Total Liabilities and Shareholders' Equity
|
$
|
144,098
|
$
|
125,926
|
||
|
First Guaranty Bancshares, Inc.
|
|||||||||
|
Condensed Statements of Income
|
|||||||||
| December 31, | |||||||||
| (in thousands) | 2014 | 2013 | 2012 | ||||||
| Operating Income | |||||||||
|
Dividends received from bank subsidiary
|
$
|
6,448
|
$
|
4,669
|
$
|
6,400
|
|||
|
Other income
|
162 |
90
|
1
|
||||||
|
Total operating income
|
6,610
|
4,759
|
6,401
|
||||||
|
Operating Expenses
|
|||||||||
|
Interest expense
|
130
|
115
|
91
|
||||||
|
Salaries & Benefits
|
140 |
88
|
101
|
||||||
|
Other expenses
|
464
|
449
|
667
|
||||||
|
Total operating expenses
|
734
|
652
|
859
|
||||||
|
Income before income tax benefit and increase in equity in undistributed earnings of subsidiary
|
5,876
|
4,107
|
5,542
|
||||||
|
Income tax benefit
|
229
|
212
|
373
|
||||||
|
Income before increase in equity in undistributed earnings of subsidiary
|
6,105
|
4,319
|
5,915
|
||||||
|
Increase in equity in undistributed earnings of subsidiary
|
5,119
|
4,827
|
6,144
|
|
|||||
|
Net Income
|
11,224 |
9,146
|
12,059
|
||||||
|
Less preferred stock dividends
|
(394
|
)
|
(713
|
)
|
(1,972
|
) | |||
|
Net income available to common shareholders
|
$
|
10,830
|
$
|
8,433
|
$
|
10,087
|
|||
86
|
First Guaranty Bancshares, Inc.
|
|||||||||
|
Condensed Statements of Cash Flow
|
|||||||||
| December 31, | |||||||||
| (in thousands) |
2014
|
2013
|
2012
|
||||||
|
Cash flows from operating activities:
|
|||||||||
|
Net income
|
$
|
11,224
|
$
|
9,146
|
$
|
12,059
|
|||
|
Adjustments to reconcile net income to net cash provided by operating activities:
|
|||||||||
|
Increase in equity in undistributed earnings of subsidiary
|
(5,119
|
)
|
(4,827
|
)
|
(6,144
|
) | |||
| Loss on sale of securities |
-
|
- | 2 | ||||||
|
Net change in other liabilities
|
55
|
2
|
|
32
|
|||||
|
Net change in other assets
|
(3,383
|
) |
161
|
(122
|
)
|
||||
|
Net cash provided by operating activities
|
2,777
|
4,482
|
5,827
|
||||||
|
Cash flows from investing activities:
|
|||||||||
|
Proceeds from maturities, calls and sales of AFS securities
|
- | - | 248 | ||||||
|
Funds Invested in AFS securities
|
(5 | ) | - | (41 | ) | ||||
|
Net cash (used in) provided by investing activities
|
(5
|
) |
-
|
|
207
|
||||
|
Cash flows from financing activities:
|
|||||||||
| Proceeds from short-term debt | - | - | 1,800 | ||||||
| Proceeds from long-term debt | 2,555 | - | - | ||||||
|
Repayment of long-term debt
|
(616
|
) |
(600
|
) |
(2,100
|
)
|
|||
| Repurchase of common stock | - | - | (54 | ) | |||||
|
Dividends paid
|
(4,421
|
)
|
(4,740
|
)
|
(6,007
|
)
|
|||
|
Net cash used in financing activities
|
(2,482
|
)
|
(5,340
|
) |
(6,361
|
)
|
|||
|
Net increase (decrease) in cash and cash equivalents
|
290
|
(858
|
) |
(327
|
) | ||||
|
Cash and cash equivalents at the beginning of the period
|
433
|
1,291
|
1,618
|
||||||
|
Cash and cash equivalents at the end of the period
|
$
|
723 |
$
|
433
|
$
|
1,291
|
|||
There were no changes in or disagreements with accountants on accounting and financial disclosures for the year ended December 31, 2014.
Evaluation of Disclosure Controls and Procedures
As of the end of the period covered by this report, an evaluation was carried out under the supervision and with the participation of the Company's management, including its Chief Executive Officer (Principal Executive Officer) and its Chief Financial Officer (Principal Financial Officer), of the effectiveness of its disclosure controls and procedures (as defined in Rule 13a-15(e) under the Securities Exchange Act of 1934). Based on that evaluation, the Chief Executive Officer and the Chief Financial Officer concluded that these disclosure controls and procedures were effective.
For further information, see “Management’s annual report on internal control over financial reporting” below. There was no change in the Company’s internal control over financial reporting (as defined in Rule 13a-15(f) under the Securities Exchange Act of 1934) that occurred during the quarter ended December 31, 2014, that has materially affected, or is reasonably likely to materially affect, the Company’s internal control over financial reporting.
Management’s Annual Report on Internal Control over Financial Reporting
The Management of First Guaranty Bancshares, Inc. has prepared the consolidated financial statements and other information in our Annual Report in accordance with accounting principles generally accepted in the United States of America and is responsible for its accuracy. The financial statements necessarily include amounts that are based on Management’s best estimates and judgments. In meeting its responsibility, Management relies on internal accounting and related control systems. The internal control systems are designed to ensure that transactions are properly authorized and recorded in our financial records and to safeguard our assets from material loss or misuse. Such assurance cannot be absolute because of inherent limitations in any internal control system.
Management is responsible for establishing and maintaining the adequate internal control over financial reporting, as such term is defined in the Exchange Act Rules 13 – 15(f). Under the supervision and with the participation of Management, including our principal executive officers and principal financial officer, we conducted an evaluation of the effectiveness of internal control over financial reporting based on the framework in Internal Control – Integrated Framework (1992) issued by the Committee of Sponsoring Organizations of the Treadway Commission. This section relates to Management’s evaluation of internal control over financial reporting including controls over the preparation of the schedules equivalent to the basic financial statements and compliance with laws and regulations. Our evaluation included a review of the documentation of controls, evaluations of the design of the internal control system and tests of the effectiveness of internal controls.
Based on our evaluation under the framework in Internal Control – Integrated Framework, Management concluded that internal control over financial reporting was effective as of December 31, 2014.
This annual report does not include an attestation report of the Company’s independent registered public accounting firm regarding internal control over financial reporting. Management’s report was not subject to attestation by the Company’s independent registered public accounting firm pursuant to the rules of the Securities and Exchange Commission that permit the Company to provide only management’s report in this annual report.
None
Item 10 – Directors, Executive Officers and Corporate Governance
Pursuant to General Instruction G (3), information on directors and executive officers of the Registrant will be incorporated by reference from the Company’s Definitive Proxy Statement.
Item 11 - Executive Compensation
Pursuant to General Instruction G (3), information on directors and executive officers of the Registrant will be incorporated by reference from the Company’s Definitive Proxy Statement.
Item 12 - Security Ownership of Certain Beneficial Owners, Management and Related Shareholder Matters
Pursuant to General Instruction G (3), information on directors and executive officers of the Registrant will be incorporated by reference from the Company’s Definitive Proxy Statement.
Item 13 - Certain Relationships and Related Transactions and Director Independence
Pursuant to General Instruction G (3), information on directors and executive officers of the Registrant will be incorporated by reference from the Company’s Definitive Proxy Statement.
Item 14 - Principal Accountant Fees and Services
Pursuant to General Instruction G (3), information on directors and executive officers of the Registrant will be incorporated by reference from the Company’s Definitive Proxy Statement.
89
Part IV
Item 15 - Exhibits and Financial Statement Schedules
|
(a) 1
|
Consolidated Financial Statements
|
|
|
Item
|
Page
|
|
|
First Guaranty Bancshares, Inc. and Subsidiary
|
||
|
Report of Independent Registered Accounting Firm
|
52
|
|
|
Consolidated Balance Sheets - December 31, 2014 and 2013
|
53
|
|
|
Consolidated Statements of Income – Years Ended December 31, 2014, 2013 and 2012
|
54
|
|
|
Consolidated Statements of Comprehensive Income – Years Ended December 31, 2014, 2013 and 2012
|
55 | |
|
Consolidated Statements of Changes in Shareholders’ Equity - Years Ended December 31, 2014, 2013 and 2012
|
56
|
|
|
Consolidated Statements of Cash Flows - Years Ended December 31, 2014, 2013 and 2012
|
57
|
|
|
Notes to Consolidated Financial Statements
|
58
|
|
| 2 |
Consolidated Financial Statement Schedules
|
|
|
All schedules to the consolidated financial statements of First Guaranty Bancshares, Inc. and its subsidiary have been omitted because they are not required under the related instructions or are inapplicable, or because the required information has been provided in the consolidated financial statements or the notes thereto.
|
||
| 3 |
Exhibits
|
|
|
The exhibits required by Regulation S-K are set forth in the following list and are filed either by incorporation by reference from previous filings with the Securities and Exchange Commission or by attachment to this Annual Report on Form 10-K as indicated below.
|
||
|
Exhibit Number
|
Exhibit
|
|
|
3.1
|
Restated Articles of Incorporation of First Guaranty Bancshares, Inc.(1)
|
|
|
3.2
|
Articles of Amendment to the Restated Articles of Incorporation of First Guaranty Bancshares, Inc.(2)
|
|
|
3.3
|
Bylaws of First Guaranty Bancshares, Inc.(3)
|
|
| 3.4 |
Amendment to Bylaws of First Guaranty Bancshares, Inc.(4)
|
|
| 4 |
Form of Common Stock Certificate of First Guaranty Bancshares, Inc.(5)
|
|
| 10.1 |
Small Business Lending Fund—Securities Purchase Agreement.(6)
|
|
|
14.3
|
First Guaranty Bancshares, Inc. and Subsidiary Code of Conduct and Ethics for Employees, Officers and Directors.
|
|
|
14.4
|
First Guaranty Bancshares, Inc. Code of Ethics for Senior Financial Officers.
|
|
|
21
|
Subsidiaries of the First Guaranty Bancshares, Inc. *
|
|
|
31.1
|
Certification of principal executive officer pursuant to Exchange Act Rule 13(a)-15(e) pursuant to Section 302 of the Sarbanes-Oxley Act of 2002.
|
|
|
31.2
|
Certification of principal financial officer pursuant to Exchange Act Rule 13(a)-15(e) pursuant to Section 302 of the Sarbanes-Oxley Act of 2002.
|
|
|
32.3
|
Certification of principal executive officer pursuant to 18 U.S.C. Section 1350, as adopted pursuant to Section 906 of the Sarbanes-Oxley Act of 2002.
|
|
|
32.4
|
Certification of principal financial officer pursuant to 18 U.S.C. Section 1350, as adopted pursuant to Section 906 of the Sarbanes-Oxley Act of 2002.
|
|
| 101.SCH | XBRL Taxonomy Extension Schema. | |
| 101.CAL | XBRL Taxonomy Extension Calculation Linkbase. | |
| 101.DEF | XBRL Taxonomy Extension Definition Linkbase. | |
| 101.PRE | XBRL Taxonomy Extension Presentation Linkbase. | |
| 101.LAB | XBRL Taxonomy Extension Label Linkbase. | |
| 101.INS | XBRL Instance Document | |
| * Previously filed. | ||
|
(1) Incorporated by reference to Exhibit 3.1 of the Current Report on Form 8-K12G3 filed by First Guaranty Bancshares, Inc. with the Securities and Exchange Commission on August 2, 2007.
|
||
|
(2) Incorporated by reference to Exhibit 3.1 of the Current Report on Form 8-K filed by First Guaranty Bancshares, Inc. with the Securities and Exchange Commission on September 23, 2011.
|
||
|
(3) Incorporated by reference to Exhibit 3.2 of the Current Report on Form 8-K12G3 filed by First Guaranty Bancshares, Inc. with the Securities and Exchange Commission on August 2, 2007.
|
||
|
(4) Incorporated by reference to Exhibit 3.3 of the Current Report on Form 8-K12G3 filed by First Guaranty Bancshares, Inc. with the Securities and Exchange Commission on August 2, 2007.
|
||
|
(5) Incorporated by reference to Exhibit 4 of the Current Report on Form 8-K12G3 filed by First Guaranty Bancshares, Inc. with the Securities and Exchange Commission on August 2, 2007.
|
||
|
(6) Incorporated by reference to Exhibit 10.1 of the Current Report on Form 8-K filed by First Guaranty Bancshares, Inc. with the Securities and Exchange Commission on September 23, 2011.
|
||
| (7) Incorporated by reference to Exhibit 21 of the Registration statement on Form S-1 filed by First Guaranty Bancshares, Inc. with the Securities and Exchange Commission on October 24, 2014. | ||
90
SIGNATURES
Pursuant to the requirements of Section 13 or 15(d) of the Securities Exchange Act of 1934, the Company has duly caused this report to be signed on its behalf by the undersigned, thereunto duly authorized.
FIRST GUARANTY BANCSHARES, INC.
Dated: March 17, 2015
Pursuant to the requirements of the Securities and Exchange Act of 1934, this report has been signed below by the following persons on behalf of the Company and in the capacities and on the dates indicated.
|
/s/ Alton B. Lewis
|
President,
Chief Executive Officer and
Director
(Principal Executive Officer)
|
March 17, 2015
|
|
/s/ Eric J. Dosch
|
Chief Financial Officer,
Secretary and Treasurer
(Principal Financial and Accounting Officer)
|
March 17, 2015
|
|
/s/ Marshall T. Reynolds
Marshall T. Reynolds
|
Chairman of the Board
|
March 17, 2015
|
|
/s/ William K. Hood
William K. Hood
|
Director
|
March 17, 2015
|
|
/s/ Glenda B. Glover
Glenda B. Glover
|
Director
|
March 17, 2015
|
|
/s/ Edgar R. Smith, III
Edgar R. Smith, III
|
Director | March 17, 2015 |
91